A comprehensive package for DNA sequence analysis in FORTRAN IV for the PDP11
16
Volume 14 Number 1 1986 Nucleic Acids Research A comprehensive package for DNA sequence an%iysis in FORTRAN IV for the PDP-I1 Jonathan Arnold, Virginia K.Eckenrodel, Klaus Lemke, Gregory J.Phillips and Stephen W.Schaeffer Department of Genetics, University of Georgia, Athens, GA 30602, USA Received 26 November 1984 ABSTRACT A computer package written in Fortran-IV for the PDP-11 minicomputer is described. The package's novel features are: (i) software for voice-entry of sequence data; (ii) a less memory intensive algorithm for optimal se- quence alignment; (iii) and programs that fit statistical models to nucleic acid and protein sequences. INTRODUCTION The widespread use of rapid methods for DNA sequence analysis (32, 41) and the availability of over five thousand published DNA sequences in computerized data bases, such as GENBANK (TM), has mandated the development of computer packages for the collection (36), organization, and statistical analysis of these nucleic acid sequences (44,45,46,58). We present one such package named DNASEQ developed at the University of Georgia. The package contains several novel features which include: (i) software for the voice- entry of nucleic acid or protein sequence data; (ii) a less memory-intensive version of the Needleman and Wunsch (34) algorithm for sequence alignment; and (iii) programs that fit statistical models to nucleic acid and protein sequences. SOFTWARE DESIGN AND HARDWARE REQUIREMENTS The programs listed below in the package DNASEQ are written in Digital Equipment Corporation's (DEC) FORTRAN-IV, Version 2.5, to run under DEC's RSX-11M (TM) operating system, Version 4.0, on a PDP-11/34A (TM) minicomput- er. Each program executes a single basic operation and can be used as a building block in a sequence of operations. Thus, the output of one program Source programs will be provided upon receipt of a self-addressed mailing label, a blank 9-track tape, and $60 check to cover processing. © I R L Press Limited, Oxford, England. 239
-
Upload
independent -
Category
Documents
-
view
1 -
download
0
Transcript of A comprehensive package for DNA sequence analysis in FORTRAN IV for the PDP11
Volume 14 Number 1 1986 Nucleic Acids Research
A comprehensive package for DNA sequence an%iysis in FORTRAN IV for the PDP-I1
Jonathan Arnold, Virginia K.Eckenrodel, Klaus Lemke, Gregory J.Phillips and Stephen W.Schaeffer
Department of Genetics, University of Georgia, Athens, GA 30602, USA
Received 26 November 1984
ABSTRACTA computer package written in Fortran-IV for the PDP-11 minicomputer is
described. The package's novel features are: (i) software for voice-entryof sequence data; (ii) a less memory intensive algorithm for optimal se-quence alignment; (iii) and programs that fit statistical models to nucleicacid and protein sequences.
INTRODUCTION
The widespread use of rapid methods for DNA sequence analysis (32, 41)
and the availability of over five thousand published DNA sequences in
computerized data bases, such as GENBANK (TM), has mandated the development
of computer packages for the collection (36), organization, and statistical
analysis of these nucleic acid sequences (44,45,46,58). We present one such
package named DNASEQ developed at the University of Georgia. The package
contains several novel features which include: (i) software for the voice-
entry of nucleic acid or protein sequence data; (ii) a less memory-intensive
version of the Needleman and Wunsch (34) algorithm for sequence alignment;
and (iii) programs that fit statistical models to nucleic acid and protein
sequences.
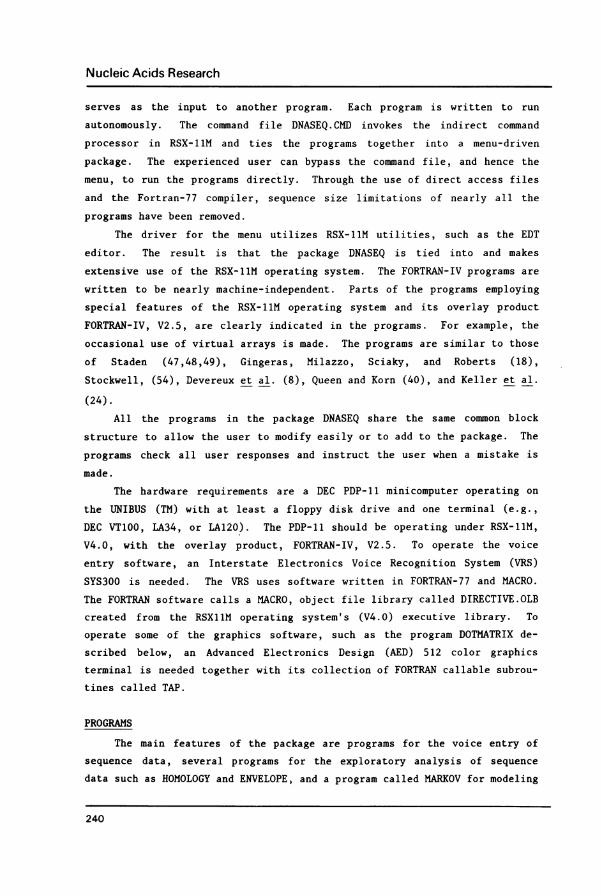
SOFTWARE DESIGN AND HARDWARE REQUIREMENTS
The programs listed below in the package DNASEQ are written in Digital
Equipment Corporation's (DEC) FORTRAN-IV, Version 2.5, to run under DEC's
RSX-11M (TM) operating system, Version 4.0, on a PDP-11/34A (TM) minicomput-
er. Each program executes a single basic operation and can be used as a
building block in a sequence of operations. Thus, the output of one program
Source programs will be provided upon receipt of a self-addressed mailinglabel, a blank 9-track tape, and $60 check to cover processing.
© I R L Press Limited, Oxford, England. 239
Nucleic Acids Research
serves as the input to another program. Each program is written to run
autonomously. The command file DNASEQ.CMD invokes the indirect command
processor in RSX-11M and ties the programs together into a menu-driven
package. The experienced user can bypass the command file, and hence the
menu, to run the programs directly. Through the use of direct access files
and the Fortran-77 compiler, sequence size limitations of nearly all the
programs have been removed.
The driver for the menu utilizes RSX-IIM utilities, such as the EDT
editor. The result is that the package DNASEQ is tied into and makes
extensive use of the RSX-11M operating system. The FORTRAN-IV programs are
written to be nearly machine-independent. Parts of the programs employing
special features of the RSX-11M operating system and its overlay product
FORTRAN-IV, V2.5, are clearly indicated in the programs. For example, the
occasional use of virtual arrays is made. The programs are similar to those
of Staden (47,48,49), Gingeras, Milazzo, Sciaky, and Roberts (18),
Stockwell, (54), Devereux et al. (8), Queen and Korn (40), and Keller et al.
(24).All the programs in the package DNASEQ share the same common block
structure to allow the user to modify easily or to add to the package. The
programs check all user responses and instruct the user when a mistake is
made.
The hardware requirements are a DEC PDP-11 minicomputer operating on
the UNIBUS (TM) with at least a floppy disk drive and one terminal (e.g.,DEC VT100, LA34, or LA120). The PDP-11 should be operating under RSX-11M,V4.0, with the overlay product, FORTRAN-IV, V2.5. To operate the voice
entry software, an Interstate Electronics Voice Recognition System (VRS)SYS300 is needed. The VRS uses software written in FORTRAN-77 and MACRO.
The FORTRAN software calls a MACRO, object file library called DIRECTIVE.OLB
created from the RSX1lM operating system's (V4.0) executive library. To
operate some of the graphics software, such as the program DOTMATRIX de-
scribed below, an Advanced Electronics Design (AED) 512 color graphics
terminal is needed together with its collection of FORTRAN callable subrou-
tines called TAP.
PROGRAMS
The main features of the package are programs for the voice entry of
sequence data, several programs for the exploratory analysis of sequence
data such as HOMOLOGY and ENVELOPE, and a program called MARKOV for modeling
240
Nucleic Acids Research
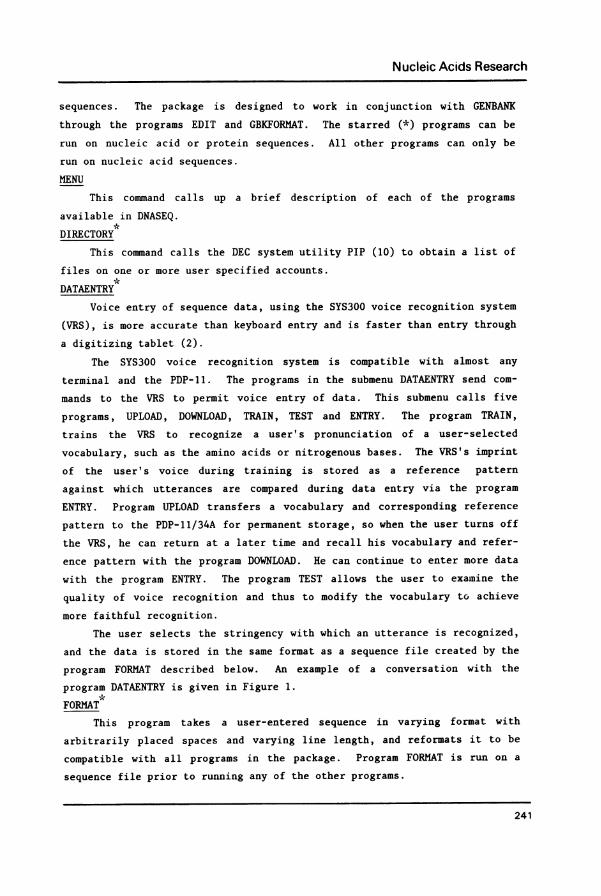
sequences. The package is designed to work in conjunction with GENBANK
through the programs EDIT and GBKFORMAT. The starred (*) programs can be
run on nucleic acid or protein sequences. All other programs can only be
run on nucleic acid sequences.
MENU
This command calls up a brief description of each of the programs
available in DNASEQ.
DIRECTORY
This command calls the DEC system utility PIP (10) to obtain a list of
files on one or more user specified accounts.'C
DATAENTRY
Voice entry of sequence data, using the SYS300 voice recognition system
(VRS), is more accurate than keyboard entry and is faster than entry through
a digitizing tablet (2).
The SYS300 voice recognition system is compatible with almost any
terminal and the PDP-11. The programs in the submenu DATAENTRY send com-
mands to the VRS to permit voice entry of data. This submenu calls five
programs, UPLOAD, DOWNLOAD, TRAIN, TEST and ENTRY. The program TRAIN,
trains the VRS to recognize a user's pronunciation of a user-selected
vocabulary, such as the amino acids or nitrogenous bases. The VRS's imprint
of the user's voice during training is stored as a reference pattern
against which utterances are compared during data entry via the program
ENTRY. Program UPLOAD transfers a vocabulary and corresponding reference
pattern to the PDP-11/34A for permanent storage, so when the user turns off
the VRS, he can return at a later time and recall his vocabulary and refer-
ence pattern with the program DOWNLOAD. He can continue to enter more data
with the program ENTRY. The program TEST allows the user to examine the
quality of voice recognition and thus to modify the vocabulary to achieve
more faithful recognition.
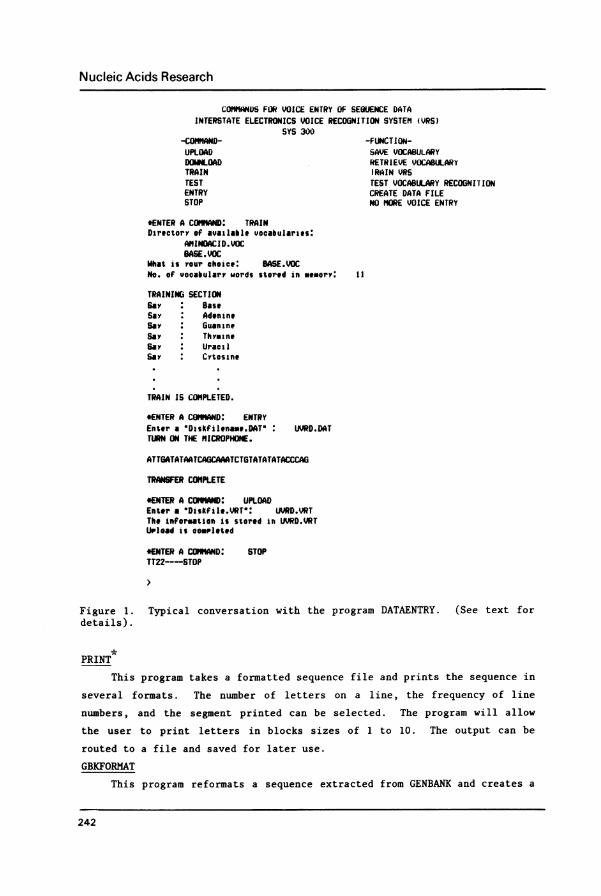
The user selects the stringency with which an utterance is recognized,
and the data is stored in the same format as a sequence file created by the
program FORMAT described below. An example of a conversation with the
program DATAENTRY is given in Figure 1.
FORMAT
This program takes a user-entered sequence in varying format with
arbitrarily placed spaces and varying line length, and reformats it to be
compatible with all programs in the package. Program FORMAT is run on a
sequence file prior to running any of the other programs.
241
Nucleic Acids Research
COMMOS FOR VOICE ENTRY OF SEGUENCE DATAINTERSTATE ELECTRONICS VOICE RECOGNITION SYSTEM (VRS)
SYS 300-COMMAND- -FUNCTION-UPLOAD SAVE VOCABULARYDOWNLOAD RETRIEVE VOCABULARYTRAIN IRAIN VRSTEST TEST VOCABULARY RECOGNITIONENTRY CREATE DATA FILESTOP NO MORE VOICE ENTRY
*ENTER A COMMAND: TRAINDirectory of available vocabularies:
AMINOACID.VOCBASE.VOC
What is Your choice: BASE.VOCNo. of vocabulary words stored in memory: 11
TRAINING SECTIONsay BaseSay Adeninesay GuanineSay Thyminesay UracilSay Cvtosine
TRAIN IS COMPLETED.
ENTER A COMMAND: ENTRYEnter a "Diskfilename.DATO UVRD.DATTURN ON THE MICROPHONE.
ATTGATATAATCAGCAAATCTGTATATATACCCAG
TRANSFER COMPLETE
*ENTER A COMMAND: UPLOADEnter a "Diskfile.VRT": UVRD.VRTThe information is stored in UVRD.JRTUpload is oomrleted
*ENTER A COMND: STOPTT22---STOP
Figure 1. Typical conversation with the program DATAENTRY. (See text fordetails).
This program takes a formatted sequence file and prints the sequence in
several formats. The number of letters on a line, the frequency of line
numbers, and the segment printed can be selected. The program will allow
the user to print letters in blocks sizes of 1 to 10. The output can be
routed to a file and saved for later use.
GBKFORMAT
This program reformats a sequence extracted from GENBANK and creates a
242
Nucleic Acids Research
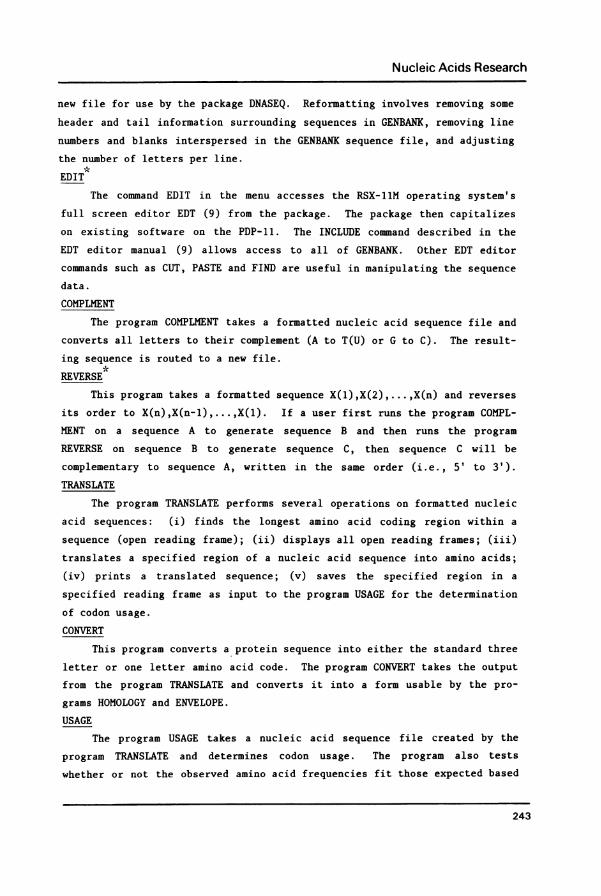
new file for use by the package DNASEQ. Reformatting involves removing some
header and tail information surrounding sequences in GENBANK, removing line
numbers and blanks interspersed in the GENBANK sequence file, and adjusting
the number of letters per line.
EDIT
The command EDIT in the menu accesses the RSX-11M operating system's
full screen editor EDT (9) from the package. The package then capitalizes
on existing software on the PDP-11. The INCLUDE command described in the
EDT editor manual (9) allows access to all of GENBANK. Other EDT editor
commands such as CUT, PASTE and FIND are useful in manipulating the sequence
data.
COMPLMENT
The program COMPLMENT takes a formatted nucleic acid sequence file and
converts all letters to their complement (A to T(U) or G to C). The result-
ing sequence is routed to a new file.
REVERSE
This program takes a formatted sequence X(l),X(2),...,X(n) and reverses
its order to X(n),X(n-l),...,X(1). If a user first runs the program COMPL-
MENT on a sequence A to generate sequence B and then runs the program
REVERSE on sequence B to generate sequence C, then sequence C will be
complementary to sequence A, written in the same order (i.e., 5' to 3').TRANSLATE
The program TRANSLATE performs several operations on formatted nucleic
acid sequences: (i) finds the longest amino acid coding region within a
sequence (open reading frame); (ii) displays all open reading frames; (iii)translates a specified region of a nucleic acid sequence into amino acids;
(iv) prints a translated sequence; (v) saves the specified region in a
specified reading frame as input to the program USAGE for the determination
of codon usage.
CONVERT
This program converts a protein sequence into either the standard three
letter or one letter amino acid code. The program CONVERT takes the output
from the program TRANSLATE and converts it into a form usable by the pro-
grams HOMOLOGY and ENVELOPE.
USAGE
The program USAGE takes a nucleic acid sequence file created by the
program TRANSLATE and determines codon usage. The program also tests
whether or not the observed amino acid frequencies fit those expected based
243
Nucleic Acids Research
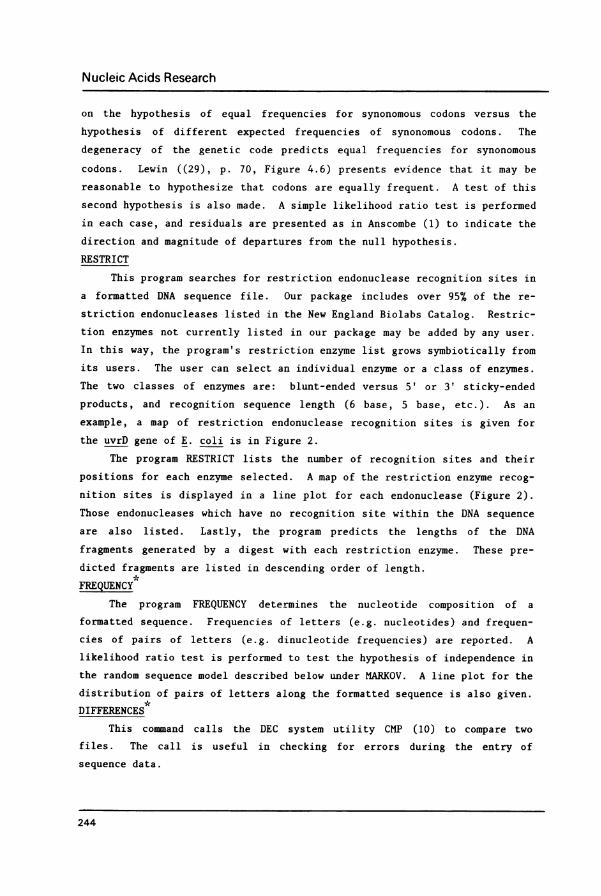
on the hypothesis of equal frequencies for synonomous codons versus the
hypothesis of different expected frequencies of synonomous codons. The
degeneracy of the genetic code predicts equal frequencies for synonomous
codons. Lewin ((29), p. 70, Figure 4.6) presents evidence that it may be
reasonable to hypothesize that codons are equally frequent. A test of this
second hypothesis is also made. A simple likelihood ratio test is performed
in each case, and residuals are presented as in Anscombe (1) to indicate the
direction and magnitude of departures from the null hypothesis.
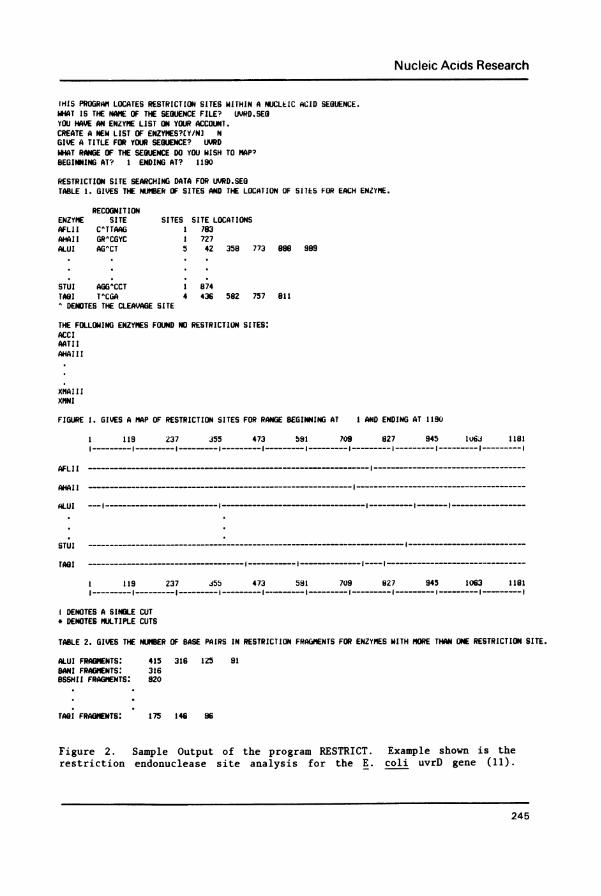
RESTRICT
This program searches for restriction endonuclease recognition sites in
a formatted DNA sequence file. Our package includes over 95% of the re-
striction endonucleases listed in the New England Biolabs Catalog. Restric-
tion enzymes not currently listed in our package may be added by any user.
In this way, the program's restriction enzyme list grows symbiotically from
its users. The user can select an individual enzyme or a class of enzymes.
The two classes of enzymes are: blunt-ended versus 5' or 3' sticky-ended
products, and recognition sequence length (6 base, 5 base, etc.). As an
example, a map of restriction endonuclease recognition sites is given for
the uvrD gene of E. coli is in Figure 2.
The program RESTRICT lists the number of recognition sites and their
positions for each enzyme selected. A map of the restriction enzyme recog-
nition sites is displayed in a line plot for each endonuclease (Figure 2).Those endonucleases which have no recognition site within the DNA sequence
are also listed. Lastly, the program predicts the lengths of the DNA
fragments generated by a digest with each restriction enzyme. These pre-
dicted fragments are listed in descending order of length.
FREQUENCY
The program FREQUENCY determines the nucleotide composition of a
formatted sequence. Frequencies of letters (e.g. nucleotides) and frequen-
cies of pairs of letters (e.g. dinucleotide frequencies) are reported. A
likelihood ratio test is performed to test the hypothesis of independence in
the random sequence model described below under MARKOV. A line plot for the
distribution of pairs of letters along the formatted sequence is also given.
DIFFERENCES
This command calls the DEC system utility CMP (10) to compare two
files. The call is useful in checking for errors during the entry of
sequence data.
244
Nucleic Acids Research
IHIS PROGRAM LOCATES RESTRICTION SITES WITHIN A NUCLEIC ACID SEQUENCE.WHAT IS THE NAME OF THE SEWENCE FILE? UVRD.SEQYOU HAVE AN ENZYME LIST ON YOUR ACCOUNT.CREATE A NEW LIST OF ENZYMES?(Y/N] NGIVE A TITLE FOR YOUR SEQUENCE? UVRDWHAT RANGE OF THE SEDUNCE DO YOU WISH TO MAP?BEGINNING AT? I ENDING AT? 1190
RESTRICTION SITE SEARCHING DATA FOR UVRD.SEUTABLE 1. GIVES THE NUMBER OF SITES AND THE LOCATION OF SIIES FOR EACH ENZY"E.
RECOGNITIONENZY"E SITE SITES SITE LOCATIONSAFLII C^TTAAG 1 783AHAII GR^CGYC 1 727ALUI AG^CT 5 42 358 773 98 989
STUI AGG.CCT 1 874TAGI T"CGA 4 436 582 757 811^ DENOTES THE CLEAVAGE SITE
THE FOLLOWING ENZYMES FOUND NO RESTRICTION SITES:ACCIAATI IAHAIII
XMI IIXMNI
FIGURE 1. GIVES A MAP OF RESTRICTION SITES FOR RANGE BEGINNING AT I AND ENDING AT 119
1 119 237 355 473 591 709 827 945 1063 181I- -- - I-----__ ---I_ --_ -----_ I- --------__ I- --------__I-_ -------___ - --------__ I- -------_-_I- -----_ --_ I-_________I
AFLII ------------------------I- ----------------------------------
AHAII----------------------------------i--------------------
ALUI --I ----- I--- ---- --- --- I------- -----------------
STUI ..
TAGI ------------------------------------,--- --, .I-----_,----- - -----
1 119 237 35b 473 581 709 827 945 1063 1181
DENOTES A SINGLE CUT* DENOTES MULTIPLE CUTS
TABLE 2. GIVES THE NLMER OF BASE PAIRS IN RESTRICTION FRAGMENTS FOR ENZYMES WITH MORE THAN ONE RESTRICTION SITE.
ALUI FRAGENTS: 415 316 125 91BANI FRAGMNTS: 3168SSHI5I FRAGENTS: 920
TAGI FRAGMENTS: 175 146 96
Figure 2. Sample Output of the program RESTRICT. Example shown is therestriction endonuclease site analysis for the E. coli uvrD gene (11).
245
Nucleic Acids Research
HOMOLOGY
This program finds the optimal alignment of two formatted sequence
files, using a dynamic programming algorithm proposed by Needleman and
Wunsch (34). Kruskal (28) gives a clear exposition of this algorithm, its
variations, and applications. Briefly, we have two sequences X = (X(1),
...,X(m)) and Y = (Y(l),...,Y(n)). We introduce a measure of evolutionary
distance d(X,Y) between two sequences. The distance d(X,Y) reflects the
number of 'mutational' steps needed to generate Y from X. Mutational steps
can be insertions, deletions, or substitutions.
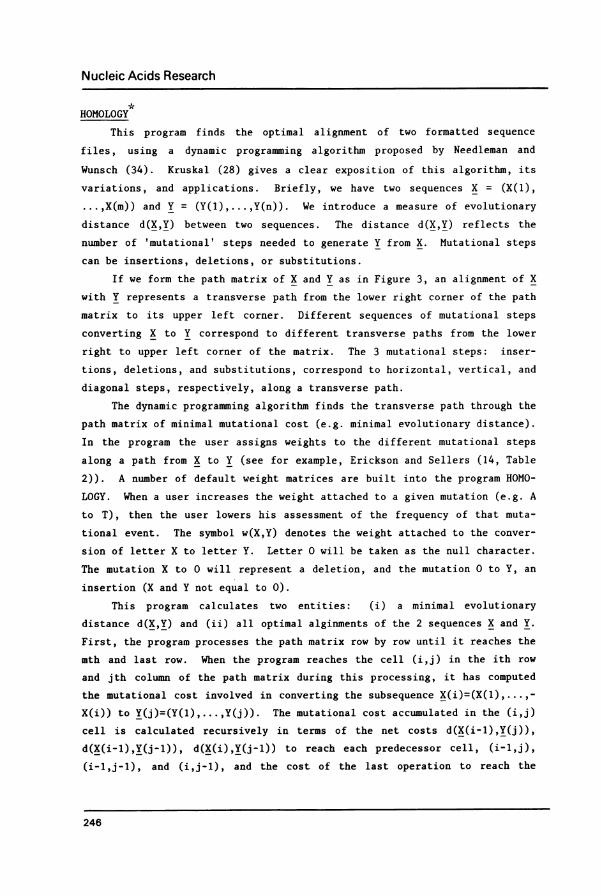
If we form the path matrix of X and Y as in Figure 3, an alignment of X
with Y represents a transverse path from the lower right corner of the path
matrix to its upper left corner. Different sequences of mutational steps
converting X to Y correspond to different transverse paths from the lower
right to upper left corner of the matrix. The 3 mutational steps: inser-
tions, deletions, and substitutions, correspond to horizontal, vertical, and
diagonal steps, respectively, along a transverse path.
The dynamic programming algorithm finds the transverse path through the
path matrix of minimal mutational cost (e.g. minimal evolutionary distance).
In the program the user assigns weights to the different mutational steps
along a path from X to Y (see for example, Erickson and Sellers (14, Table
2)). A number of default weight matrices are built into the program HOMO-
LOGY. When a user increases the weight attached to a given mutation (e.g. A
to T), then the user lowers his assessment of the frequency of that muta-
tional event. The symbol w(X,Y) denotes the weight attached to the conver-
sion of letter X to letter Y. Letter 0 will be taken as the null character.
The mutation X to 0 will represent a deletion, and the mutation 0 to Y, an
insertion (X and Y not equal to 0).This program calculates two entities: (i) a minimal evolutionary
distance d(X,Y) and (ii) all optimal alginments of the 2 sequences X and Y.
First, the program processes the path matrix row by row until it reaches the
mth and last row. When the program reaches the cell (i,j) in the ith row
and jth column of the path matrix during this processing, it has computed
the mutational cost involved in converting the subsequence X(i)=(X(1),...,-X(i)) to Y(j)=(Y(1),...,Y(j)). The mutational cost accumulated in the (i,j)cell is calculated recursively in terms of the net costs d(X(i-1),Y(j)),d(X(i-l),Y(j-1)), d(X(i),Y(j-1)) to reach each predecessor cell, (i-l,j),(i-1,j-1), and (i,j-1), and the cost of the last operation to reach the
246
Nucleic Acids Research
I A..... ..... ..... .....:...........:........................:........... I............:........... ........... !........ ... !........... I.....----- ----- ----- ........ ........ ........ ........ ........
III1- 21 1- J, 11 .. 1- 31 1- .. 1- ?. 1- S. I. 9, I.... 1-ti- .... I. Iji I'M 151 1-161 PM 1-10 191 I'M 1-211 I'ZWI I'iJI I-,41 1-n 112b, 1-27, 1-261 IIZVI 1-301 1-311 11321 1-331 11341 1-351-------------------------------------------------------- --- -------
to 0- 11 2:261: 01:'I 2. 1: I 1: 1:311: ..I: ..I. I..",0: !: f: 11: 1: .1; I: I.:I111 '71I. 2 1- I ':2; 0 1-24, 1-251---- ----- ----- ----- ---
':.Il 01:.'I: fl'...- -
k. 1- 11 1. ':2'41 t. 5. 21, 6, 7. I. I. I: 1: 1:".. ':.I PQ ':.I 2
A. 1. k- 11 1:.I: 11:..I: 2:2,1: 0 1: !:,,I 1: 1:,l 1:,I: 1:3.1: 0 1:------ ---------- -
21 1. 1: 21: 7: 11: I.: .1: 1. 11 1. I.: 11: 11: I: 11 .1 I., 111:1.1: I:.!: la 11: O.:..,: 11:111: 11:1.1: 11:1.1: 11 ------I :,-: _.. -
- --- __ __ --- __ __ __ __ __- __-__ __ __ __ __ __ - __ __ __ __- __- - - __ __ --- __--- --- __ __-- __ - __ __ __ __ __---_;____--------____ __---------- ---------__- __ ____ ____----__ __ __ __ __ - __ __ '_ -----------11 2, 1, 2 :,I: 2 1:.I: 1:.I: 1:.I: 2:
to :.O 1:1:. 111.1 1: 11:.. :211. o.:1.1, 00': 0 1: ':211: I 1. 1:1.110 1: 1:.4111 1: '1:. :2- %31 I I I' bl 111- 0: It I:.,
-------------- ------ -------- -------- ------ -------------------------------II,--- 1. 0- 1. 11 0- 11 I..I: 1:,.I: 2 2, 1: %1:1 '1:2
061 1- 5.1 .1 3: " 2- :2: '1:
-
Al- 11 '. 11 2: 1: .11: .1 V 1. 0 1: I:nl: 2:.I: 1:,,I: 0:.I:1:I1: 1): 1: 2: 1: 7:0 I':.6 0:2271 11 6. 51 I O.:I1:I 1: 1: 0 0:..---
2- 1. 1: 0: .1: 2: 13 N( 1.2 V31 O- 1. 1. 1,.1 2- II 2 2 0III I1- S. 1- 7. 1- S. 0 ': ':2. 2I :I3 I-224'":.O,,, 1:.11: 7:.",: 1:.11: :.I 1:.6 1:.7
--- -------- -------- --- ----------To--- If 11 2: 1: 0: 61: 2.. 1: 0: II 2. II I2; .,: ,Iz- A t, 2. 1- , :..I: %1: I.,l: %1: 2:.I: 1.,I: 2..1, 1:.I:
4, N 1. 4. 6- 1- 0
- --------------------------1: 2. 1. 1. 11 21 11V 0- I
211 2 1: 1:131: 2:,.I: 1:.,I: :..I: 2:.1 1: 2...1, 0 1. 1:.I: 0 1: 1: 2: 1:
1. 1:a 7: 2: !. ':11 51 1- 4- 1- 3- 1- 1- 3: 1- 7 21
-----------------
1: 2. .1. 0: JI: 11 .1: 1: 1: 1: 1: .1: 1: 1: 0 1: 1: .1: 0:.!: 1:.21: 2I: to 1:.11: I., '1:171 O.:.Ill I!2.7: ----- - - _.:.1-------------------------------------------------------------------2 21 2 1; 2 1; Z 1: 2: 1: 1. 61"------ :__ __:__ __:----- --------- 11 2- 11 2. 1- 22 ':23-10- 1- 9. 1. 6- 1. 1 1-11, '1:1;: 1:2---121 1-111 7, ,6, 1- 4- 1- 31 1- 61 INO 1- 61 1- 1711 I: .1: 1: I., 1:1.1: 1:111: 1:.': 7:131: P. 'r.": :.II
--------------------- -------- -2: 0 2-I 2- 1- 21 -. 21 11 21 11 0- 11 2:1:: e:,;: 2 0:.. I ': 0:21': ' ': 0 ': ':2.2...1): 1: 91 1: .1 I: 17: 11 .1 .l 11: 0. I: 1. 11 !II)$ 161- 1- bil 111 4111 1- S: 1: 1- 61 1. 71 1- 1111I 11 1-101 ':II 1:. I:U :23
1: I 1: 0 1; 2: .1: .1; 1. 1; 1: I 1: 2: 0 1: 1:0I: Z: 11 2- 1. .. 1. 0- 1: 1: 91,1 2:1.1: 11 1. 1. 11 O- 1. 2. 11 0. 1. %1: 1:,.I: 2:.I: ):.I::.I :.O 7: 4 11 II "7. .1.. 1.12..12': .11111 11.61- --------------------
- ----- ; IIN 1. 1. 2 1, 2: 91,A. P O- 11 31 1.0 ': ':I' ': ':I.'': ' ': 7:11111 7: ":.11 -201 '-2.-:10 1:1: '11 41- .1 1- .1 6. 7. 1,41 7, I- '1:.. P.11 ':0 1:.!: ':.5
I 1: I.. it 1: 'I, 0. .1: 2. 1, 1: e: 1, 0- 1, 1. 1- 2. 1, 2. 1, 2- 11 0- 11 I 11 0- 1.2 11 0. 11 !.16. 0g. 1. 91 illoo 1-11, 1-12- 11131 1-140 1-151 1:.7 1:1., 1:
P 7.------------------------2. 1, 1- 1- 11 II 2: II., 1: 2: $I , 1: 1: .1: .1: :.O,: 2:,21: 0:.31: 1:,41: 1:.,I: 1:161: 1:.71: 2:..1o 1:..Il 2: .1:2I: I:to to41 I I----------I--- ---- -----
11 0 1: .1: 1: .1: 0 2: I, 2: 1: 1: 1: .1: 11 2. 11 2- 11 11 I- 1-111: 1:1.1: 1:.,I: I:oo: 1:.,I: ll:..I: 2:.,I: 0 1: 0:.1 1: 2: .1:II 1. 9. I.I.. :.. 7:-----------
:..---- -------I-------- --
0:.,,: 1:1,1: 1:..I I'l 1:..I: 1:,I.111,1: 0 1. 1, II 2 If2 , 1: 1:.o, I'll, 1: 2. .1. 2, 1. 1...1.1 1: 9: 1:,.I: 2: .1, 2...I: 1.1: .1: I 1: 1:I 2:12 -1 I: to to1,
2:.:: I..,;1:1:.,l ---- - - __ VG-. 1- 0- 11 1. .1, 2: .1: 1:..I: 1:.;: 2:.31: 2:..I: 2:,51.1 2:..I: 1:117: 1"..I: 1:..I:1119, 1-18, I'll,I 1. :,0
------------ ----
11 2- 11 I: 1:".: 1:.,.: 2:,..: 1:".: 1:...: 2:.,.: 2:1"4'1:10 Pool '1421 -.11 ':.. -------------------------- - - ----- -------1. 11 0- 11 11 11 1. 11 11 11 1. 11 2 11 T 11 .1: 1:,01: I,:.I 1:.,I: 2:..Il 0 1:02I 1: f4i, 11 IOPM '42 Pool O.:I;l 21-11- Ilioi I. 9:,--'121 1-211 '1201 1-19, P ool. 1-17, 11161 1:15, .I:I-I '1:13 I'll, 11101 'P oll 7.121 'I 11 'I 2
%i., ,:.I: 2:.31: 1;..I: 0 1: 1: .1: 1:,21: 0 2:1.11 0 2. .1 2: 1. 1: I: 2:,01: 1:.1 1: 2:,:: 1;.,I: 1:1.1:1: 046 2:.I: 1:.,': 141I I':W 2120 -410------------ ---
ll:..I: 1:..I: 2:.;: 1:.o: 2: 1: 01 II 21 11 11 Zo 11 0- 10 2- 11 0 1: 2 1: 21 1: 2:.41: 11 1:02 ",O1: 11: I., :1411: 1411: 1:111: 11:1:: 1:.1: 042 1:1;: '14311 .43 P 11. I. So IP 11I I. of Iltoo 1:11: ':.:D :.Z :2. .4.
: 11 21 0- 11 21 I: 10 Z' 11 2- 11 21 2- 11 2- It 2- 1: Z:141:2;..I: 2:.,I: I...1: 01.31--: 1:.31, 1:..I: I1: 2:.21 0
- ----- ---- ---- ----------- ----- ----- ---- -------:25 2-11 'I . 1.
2:1-17-0 T: 1:,.I: :,31: 1.1:.21 1:.311 1:..I. 2:.I. 2.0 2 'I 0- I- 2 01Z: Ill 112 if 0- 11 21 11 2- II 2:1.191 .18. 1.141 1.15 .1 :I,21.zll '1174, 'I'M '1122, '1121- ... 1.11, 111-14, 1-15, 'I go it 91 1-101 1-111-1 1 -13
1.--. - ------ 2 201; 01: '1': 24 1: ': ':.I 1:1. It .1-271 -281I':25 123 1:2;; '1:211 0.:.l '1:1111I '116 -.1 I7- .1. '441 Poll :.- .43 V.- 141 -1 -1 ---; ; 1:..,: 2:..Il 0 11:.,I: 0 11 2:,01: 1:I If 20 If 21 ti of 1:A, II 2:101:.I. IIIto I' 9:1: 2 12 1: 0 II 0:2.I 1): 16 1: 1:1.1 I':.': 10:111411i 11251 10:241' 1-23 II22. ':2.1 '1:..: ZI:.. -.1120, P271I
I._ 1, 2:211 11 2:n1.1 1:,1.1 2:.I:2 2:ZI, 0 2 1:0 01'.1; 1:.I: 2:..I:0 11;..I: 21.11. 1:..I: 1:..I. 21 I: 2:..,., 1:.,I: 11,41: 1:.,I: 2:.,I: 2:"I: 1:,.I: 0 12 1.11 2:,,I::. I:.. to :.I. I.,111I__ .29, 19. '1:21 V :22 7 71 1- 7 1,
if 2- it 2. 11 2- 2. .1. 0:..I: 1:.41: I 1: 1:,91: 2:..I: 01.81: 2:.911 21 0-..,: Z:',':.30: 1.291 1,2.1 1,27, .261 '1:24 1 .11L - ----
:"I: .1.1 1:2.1: 1:.I: 1:.,: .:.I: 2:.I: Z:2.1: 2:2,1.1 0:2,1: 2:..I: 1:.91: 0:..I: 1:.I: 2,1.1: 01.01: 2:.I: 1:1.1.1 1:,.,: 11.1,: 011.1.1 1:.,I: Z:..Il 2:.Io 1:..I: 2:"I: 2:1.1: 1:.,I.I 1%,I: 1.1; ..I:Zo 1. 7 :2:,. III :,I.1,101
of 1. 1. 2:.I: 1:,Il2 11 1: 11:'.1: 2:'I to 11 11. 11 11 to0 0 to '1:.7. '1:111111 01:0. "I'llI IO'..,." 2: 1::30 ':. ':21 11 10.:2-1 to-32- 1-31, -2. 7 ':11111.
Figure 3. Path matrix which represents calculation of the optimal align-ment, and relatedness of two sequences. Upper X-axis represents the source
sequence (E. coli uvrD gene, 5-prime region), and the Y-axis represents thetarget sequence (E. coli lexA gene, 5-prime region). The transverse pathtraced between tEe corners represent the mutational steps requires toconvert the source sequence to the target sequence. Separations of thetransverse lines represent different "paths" used to achieve optimal align-ment. See text for full explanation.
current cell (ij):d(X(i-1),Y(j + w(X(i),O), (delete XM )
d(X(i),Y(j) = min d(X(i-1),Y(j-1)) + w(X(i),Y(j)), (substitution) (1)d(X(i),Y(j-1 )) + w(O,Y(j)), (insert Y(j))
247
Nucleic Acids Research
The program HOMOLOGY calculates all the accumulated evolutionary distances,
d(X(i),Y(j)), until the net evolutionary distance d(X,Y) is reached. This
distance is calculated without reference to the specific mutational path
taken to convert X into Y. These calculations are shown graphically in
Figure 3.
The net evolutionary distance d(X,Y) is then used in a second pass
through the path matrix, to find the optimal alignment(s). The evolutionary
distance d(X,Y) is used to excise unneccessary cells from the path matrix as
in Fickett (15). For example, if on the second pass through the path matrix
a cell (i,j) is reached whose net evolutionary distance d(X(i),Y(j)) is
greater than the minimal evolutionary distance d(X,Y), the program ignores
all remaining entries in row i. The remaining cells in row i are dead and
trimmed out. As the program HOMOLOGY traverses the path matrix a second
time, the program sets up pointers on each cell visited:
(i-l,j ), (delete X(i)),
pointer(i,j) = (i-1,j-1), (substitute X(j) for X(i)) (2)(i,j-1 ), (insert Y(j)).
When we reach the last row of the path matrix, we can then 'backtrack' along
the pointers in (2) to find the optimal alignment(s) (See Figure 3).In backtracking, we can take a "high road" (an optimal alignment with a
maximum number of deletions among optimal alignments) called the upper
envelope, or we can take a "low road" (an optimal alignment with a maximum
number of insertions among optimal alignments) called the lower envelope.
As shown in Figure 3, these two envelopes represent two extreme forms of an
optimal alignment. When substantial similarity exists between two sequenc-
es, the upper and lower envelopes agree substantially along the two enve-
lopes. The process of trimming dead cells can be thought of as
approximating the upper and lower envelopes. The approximations to the
envelopes from knowing d(X,Y) can be improved.
The homology program first computes the evolutionary distance between
two protein or nucleic acid sequences and then computes the homology, if
requested. This distance value is useful for localizing regions of homology
between two larger sequences, and in testing hypotheses of evolutionary
relationships (see 12).*
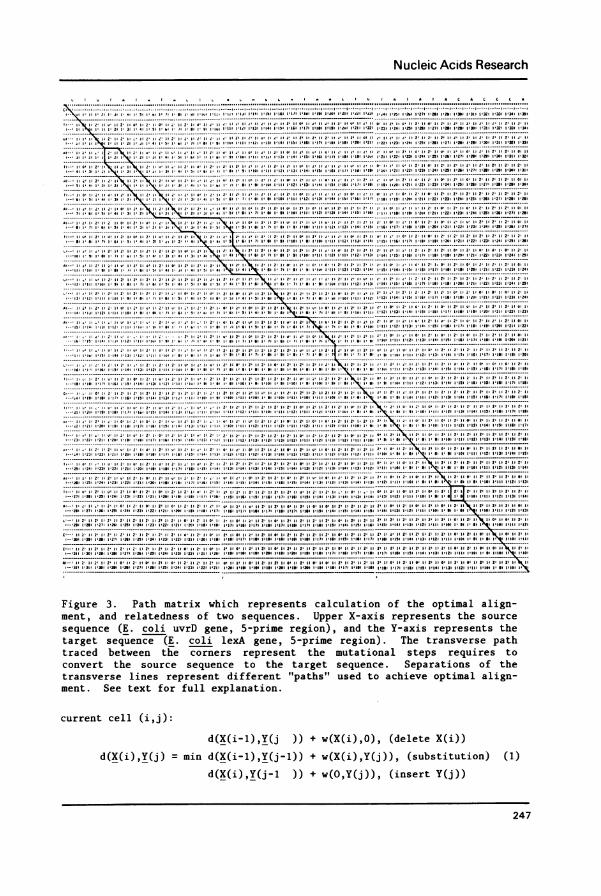
ENVELOPE
After running the program HOMOLOGY, the program ENVELOPE automatically
248
Nucleic Acids Research
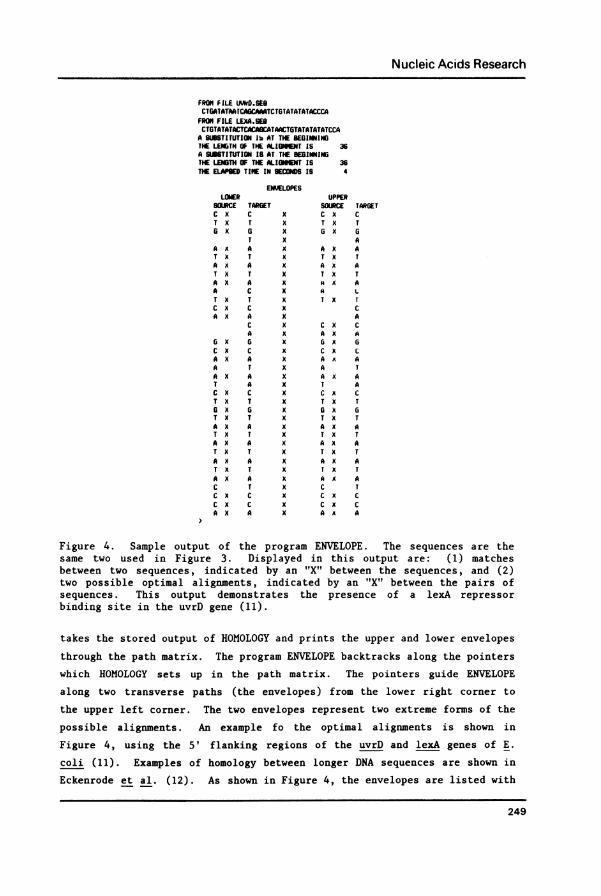
FROM FILE UJVO.SEBCTGATATAA[CAGrCAAATCTGTATATATACCCA
FROM FILE LEXA.SEBCTGTATATACTCACAGCATAACTGTATATATATCCA
A tSSiTtUTION lb AT THE BEGINNINGTHE LENGTH OF THE LGNNT IS 36A SUMTITUTION 18 AT THE BEGINNINGTHE LEN3TH OF THE ALIONNET IS 36TIE ELAPE TIME IN SECONDS IS 4
ENVELOPESLOWER UPPER
SOURCE TARGET SOURCE TARGETC x C x C x cT X T x T X T6 X a X G X G
T x AA X A X A X AT x T x T X TA X A X A X AT X T x T X TA X A X A X AA C X A LT X T x T X Tc x C x cA X A X A
C X C X CA X A X A
O X G X O X 0C X C x C X CA X A X A X AA T X A TA X A X A X AT A X T AC X C X C X CT X T x T X TG X G X 6 k GT x T x T X TA X A x A X AT X T X T X TA X A X A X AT X T x T X TA X A X A X AT X T x T X TA X A X A X AC T x C TC x C x c x cC x c x C x CA X A x AX A
Figure 4. Sample output of the program ENVELOPE. The sequences are thesame two used in Figure 3. Displayed in this output are: (1) matchesbetween two sequences, indicated by an "X" between the sequences, and (2)two possible optimal alignments, indicated by an "X" between the pairs ofsequences. This output demonstrates the presence of a lexA repressorbinding site in the uvrD gene (11).
takes the stored output of HOMOLOGY and prints the upper and lower envelopes
through the path matrix. The program ENVELOPE backtracks along the pointerswhich HOMOLOGY sets up in the path matrix. The pointers guide ENVELOPE
along two transverse paths (the envelopes) from the lower right corner to
the upper left corner. The two envelopes represent two extreme forms of the
possible alignments. An example fo the optimal alignments is shown in
Figure 4, using the 5' flanking regions of the uvrD and lexA genes of E.
coli (11). Examples of homology between longer DNA sequences are shown in
Eckenrode et al. (12). As shown in Figure 4, the envelopes are listed with
249
Nucleic Acids Research
I
U.EIUUmE asEU mmmumm on mUm.nwXu * umE
U*:.U Ua m m .
;-U
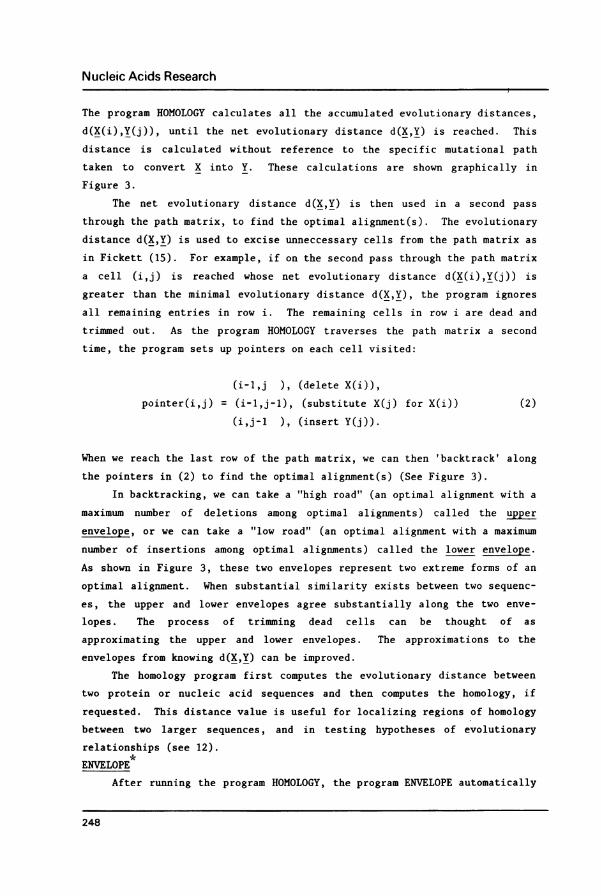
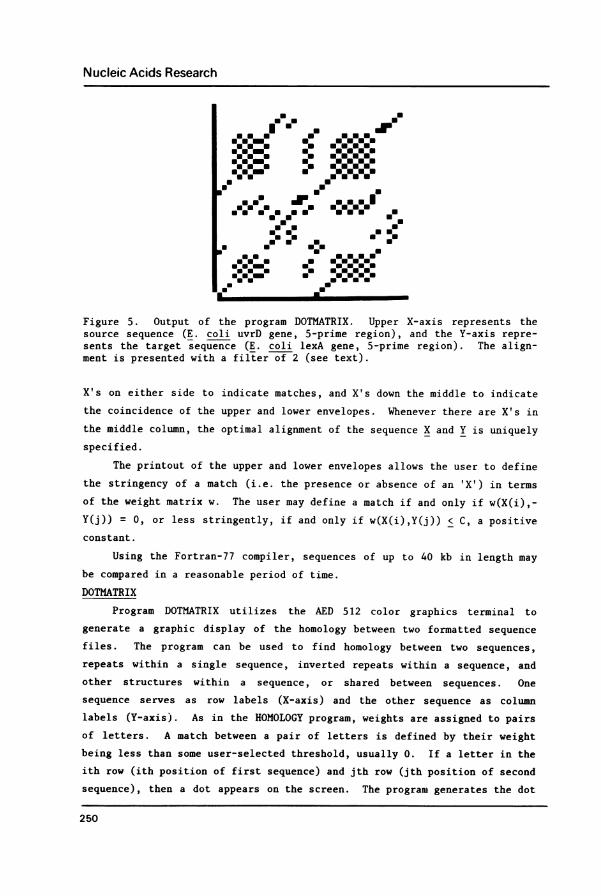
Figure 5. Output of the program DOTMATRIX. Upper X-axis represents thesource sequence (E. coli uvrD gene, 5-prime region), and the Y-axis repre-sents the target sequence (E. coli lexA gene, 5-prime region). The align-ment is presented with a fil-ter of 2 (see text).
X's on either side to indicate matches, and X's down the middle to indicatethe coincidence of the upper and lower envelopes. Whenever there are X's in
the middle column, the optimal alignment of the sequence X and Y is uniquelyspecified.
The printout of the upper and lower envelopes allows the user to definethe stringency of a match (i.e. the presence or absence of an 'X') in terms
of the weight matrix w. The user may define a match if and only if w(X(i),-Y(j)) = O, or less stringently, if and only if w(X(i),Y(j)) < C, a positiveconstant.
Using the Fortran-77 compiler, sequences of up to 40 kb in length maybe compared in a reasonable period of time.
DOTMATRIX
Program DOTMATRIX utilizes the AED 512 color graphics terminal to
generate a graphic display of the homology between two formatted sequencefiles. The program can be used to find homology between two sequences,
repeats within a single sequence, inverted repeats within a sequence, and
other structures within a sequence, or shared between sequences. One
sequence serves as row labels (X-axis) and the other sequence as columnlabels (Y-axisj. As in the HOMOLOGY program, weights are assigned to pairsof letters. A match between a pair of letters is defined by their weightbeing less than some user-selected threshold, usually 0. If a letter in theith row (ith position of first sequence) and jth row (jth position of second
sequence), then a dot appears on the screen. The program generates the dot
250
Nucleic Acids Research
matrix by comparing every letter in the first sequence with every letter in
the second sequence.
The program permits the user to "filter" the dot matrix by allowing
them to select the length of matches required for a dot to be placed on the
screen. The alignment of the 5' flanking sequences of the uvrD and lexA
genes, with a filter of 2 is shown in Figure 5.
MARKOV
The current data-base of DNA sequence information, representing diverse
phylogenetic origins and a variety of gene functions, is being explored by
statistical analyses (7,30,38,52,53,58). The program MARKOV fits a Markov
chain model (5) to a formatted sequence file. The symbol X(i) will denote a
letter in the ith position of the sequence X = (X(1),X(2),...).
A special case of the Markov Chain Model is the random sequence model,
a frequently used starting point for hypothesis tests of homology (13,14,
15,31,42,43). The random sequence hypothesis assumes: Ci) the bases
X(1),X(2),... at different positions 1,2,... are mutually independent and
(ii) the frequency of letters (e.g. base composition) along the sequence is
homogenous. This model has been demonstrated to frequently fail (unpub-
lished results using genes randomly chosen from GENBANK). An alternative
model, the Markov Chain Model, allows local dependencies along the sequence
(7,37).A first order Markov chain model makes two assumptions. First, the
conditional probability of a letter, X(n), at position n, given all letters
at previous positions n-1,n-2,..., written pr(X(n)iX(n-l),X(n-2),...), only
depends on the letter at position n-i:
pr(X(n)iX(n-1),X(n-2),...) = pr(X(n)iX(n-1)).
The parameters in the first order Markov Chain are the table of conditional
probabilities pr(X(n)IX(n-l)), which are referred to as the transition
frequencies or transition probabilities. Secondly, the Markov Chain model
assumes that the transition frequencies are homogeneous along the sequence.
Counting the frequency of overlapping pairs of letters (i.e. dinucleotides,within a nucleic acid sequence) and dividing by their total number yieldsestimates of the transition frequencies. The transition frequencies intro-
duce a local one step dependency between letters in sequence.
The program MARKOV first tests the random sequence model's homogeneityand independence assumptions. If the random sequence model fails, then the
program fits a first order Markov chain by the method of maximum likelihood.
251
Nucleic Acids Research
The program tests the homogeneity of the chain and the one step dependency
assumption. Other tests of the chaini, such as those based on runs of
letters, are made as well.
Sometimes there are more long range contextual constraints on a se-
quence due to codon preference and/or the amino acid composition of the
polypeptide being coded for (30,52,53). The program allows the possibility
of fitting a 2nd, 3rd, or 4th order Markov chain in which the current letter
X(n) depends on the previous 2, 3, or 4 letters, respectively. The range of
applicability and the uses of these models will be discussed elsewhere (38).
DISCUSSION
Gingeras (17) has suggested that there are two goals to most sequence
packages, relating different genetic data (restriction maps, other sequence
data, cytological maps of chromosomes) to the particular sequence data of
the user and the detection of biological signals in sequences (e.g. promoter
sequences, ribosome binding sites, etc.) Computers in molecular biology are
now being adapted to a broader class of applications (17,20): (i) experi-
mental design (3, 4, 16, 57); (ii) data collection (2, 19, 22, 25, 27, 50);
(iii) data cleaning (33); (iv) data base management (54, see also 44, 45,
46); (v) exploratory analysis (44, 46, 57); (vi) modeling (30, 31, 52, 53,
57). Three areas deserve particular attention. One major advance in the
organization of a sequence data base will be the creation of a system with
dynamic memory organization (26) to allow more rapid access to GENBANK. Two
such systems have already implemented for a library and in modeling human
memory (26). Two, graphics (55) should be an integral part of any analysis,
and the user should be able to invoke graphics primitives (35, 51, 23, 21)
without fear of disrupting an ongoing analysis. The graphics should be
directly modifiable. Three, much effort has been placed in the development
of good statistical packages (6, 39, 56), and this effort should be capital-
ized on in the development of statistical packages for modeling sequence
data.
ACKNOWLEDGEMENTS
We wish to thank R. Ivarie, R. Geever, B. Tyler, A. MacRae for comments
on the package. This work is supported by the U.S. Army Research Office
under Training Grant DAAG29-83-G-0111.
'Current address: Department of Genetics, North Carolina State University, Raleigh, North Carolina27695. USA
252
Nucleic Acids Research
REFERENCES1. Anscombe, F.J. (1982) Computing in Statistical Science through APL,
Springer-Verlag, New York.2. Arnold, J. and Kankel, D.R. (1983) in Computer Science and Statistics:
Proceedings of the 14th Symposium on the Interface, Heiner, K.W.,Sacher, R.S., Wilkinson, J.W. (eds.), Springer-Verlag, New York.
3. Bach, R., Friedland, P., Brutlag, D.L., and Kedes, L. (1982) Nucl.Acids Res. 10:295-304.
4. Bach, R, Iwasaki, Y., and Friedland, P. (1984) Nucl. Acids Res.12:11-29.
5. Basawa, I.V., and B.L.S. Prakasa Rao (1980) in Statistical Inferencefor Stochastic Processes. Ch. 4. Discrete Markov Chains. AcademicPress, New York.
6. Billard, L. (ed.) Computer Science and Statistics: Proceedings of the16th Symposium on the Interface, Elsevier, Amsterdam, Holland, inpress.
7. Blaisdell, B.E. (1983) J. Mol. Evol. 19:122-133.8. Devereux, J., Haeberli, P., and Smithies, 0. (1984) Nucl. Acids Res.
12:387-395.9. Digital Equipment Corporation EDT Editor Manual (1984), Document
AA-J726A-TC, Maynard, Mass.10. Digital Equipment Corporation Utilities Manual (1984), Document
AA-1681A-TC.11. Easton, A.M., S.R. Kushner (1983) Nucl. Acids Res. 11:8625-8640.12. Eckenrode, V.K., Meagher, R.B., and J. Arnold (1984) J. Mol. Evol.
21:259-269.13. Elleman, T.C. (1978) J. Mol. Evol. 11:143-161.14. Erickson, B.W. and P.H. Sellers in Ch. 2 of Time Warps, String Edits,
and Macromolecules: The Theory and Practice of Sequence Comparison,Addison-Wesley, Reading, Mass.
15. Fickett, J.W. (1984) Nucl. Acids Res. 12:175-192.16. Friedland, P., Kedes, L., Brutlag, D.L., Iwasaki, Y., Bach, R. (1982)
Nucl. Acids Res. 10:323-340.17. Gingeras, T.R. (1983) in Statistical Analysis of DNA Sequence Data,
B.S. Weir (ed.), Dekker, New York.18. Gingeras, T.R., Milazzo, J.P., Sciaky, D., and Roberts, R.J. (1979)
Nucl. Acids Res. 7:529-545.19. Gingeras, T.R., Rice, P., and Roberts, R.J. (1982) Nucl. Acids Res.
10:103-114.20. Gingeras, T.R. and R.J. Roberts (1980) Science 209, 1322-1328.21. Goad, W.B. and Kanehisa, M.I. (1982) Nucl Acids Res. 10:247-263.22. Gray, A.J., Beecher, D.E., and Olson, M.V. (1984) Nucl. Acids Res.
12:473-492.23. Hamon, E. and Ruskin, J. (1983) J. Biol. Chem. 258:1318-1327.24. Keller, C., Corcoran, M., and Roberts, R.J. (1984) Nucl. Acids Res.
12:379-286.25. Kieser, T. (1984) Nucl. Acids Res. 12:679-688.26. Kolodner, J. (1984) Retrieval and Organizational Strategies in Concep-
tual Memory, Earl Baum, New York.27. Komaromy, M. and Govan, H. (1984) Nucl. Acids Res. 12:675-678.28. Kruskal, J.B. (1983) in Ch. 1 of Time Warps, String Edits, and Macro-
molecules: The Theory and Practice of Sequence Comparison, Addison-Wesley, Reading, Mass.
29. Lewin, B. (1983) Genes, Wiley, New York.30. Lipman, D.J. and Wilbur, W.J. (1983) J. Mol. Biol. 163:363-376.31. Lipman, D.J., Wilbur, W.J., Smith, T.F., and Waterman, M.S. (1984)
Nucl. Acids Res. 12:215-226.
253
Nucleic Acids Research
32. Maxam, A.M. and W. Gilbert (1977) PNAS (USA) 74:560-564.33. Naus, J.I. (1975) Data Quality Control and Editing, Dekker, New York.34. Needleman, S.B. and C.D. Wunsch (1970) J. Mol. Biol. 48:443-453.35. Novotny, J. (1982) Nucl. Acids Res. 10:127-132.36. Nucleotide Sequences 1984 (1984) Parts 1 and 2,. IRL Press, Washington
D.C.37. Nussinov, R. (1981) J. Mol. Evol. 17:237-244.38. Phillips, G.J. and J. Arnold (1985), in preparation.39. Polhemus, N.W. (1983) in Computer Science and Statistics: Proceedings
of the 14th Symposium on the Interface, Heiner, K.W., Sacher, R.S.,Wilkinson, J.W. (eds.), Springer-Verlag, New York.
40. Queen, C.L., and Korn, L.J. (1980) Methods in Enzymol. 595-609.41. Sanger, F., Nicklen, S., and A.R. Coulson (1977) PNAS (USA)
74:5463-5467.42. Sankoff, D. and Cedergren, R.J. (1973) J. Mol. Biol. 77:159-164.43. Sege, R.D. and Saxberg, B.E.H. (1982) Nucl. Acids Res. 10:375-389.44. Soll, D. and Roberts, R.J., eds., (1982) The Applications of Computers
to Research on Nucleic Acids, IRL Press, Washington, D.C.46. Soll, D. and Roberts, R.J., eds., (1984) The Applications of Computers
tQ Research on Nucleic Acids Part 2, IRL Press, Washington, D.C.47. Staden, R. (1977) Nucl. Acids Res. 4:4037-4051.48. Staden, R. (1978) Nucl. Acids Res. 5:1013-1015.49. Staden, R. (1980) Nucl. Acids Res. 8:817-825.50. Staden, R. (1984) Nucl. Acids Res. 12:499-503.51. Staden, R. (1984) Nucl. Acids Res. 12:521-538.52. Staden, R. (1984) Nucl. Acids Res. 12:551-567.53. Staden, R., and Mclachlan, A.D. (1982) Nucl. Acids. Res. 10:141-156.54. Stockwell, P.A., Nucl. Acids Res. 10:115-125.55. Tufte, E.R. (1983) The Visual Display of Quantitative Information,
Graphics Press, Cheshire, CT.56. Tukey, J.W. (1983) in Computer Science and Statistics: Proceedings of
the 14th Symposium on the Interface, Heiner, K.W., Sacher, R.S.,Wilkinson, J.W. (eds.), Springer-Verlag, New York.
57. Weiner, P.K., Langridge, R., Blaney, J.M., Schaefer, R., and Kollman,P.A. (1982) Proc. Natl. Acad. Sci. (USA) 79:3754-3758.
58. Weir, B.S. (ed.) (1983) Statistical Analysis of DNA Sequence Data,Dekker, New York.
254