A comparison of the performance of different PV module types ...
10
A comparison of the performance of different PV module types in temperate climates A.J. Carr a, * ,1 , T.L. Pryor b a Australian Cooperative Research Centre for Renewable Energy, Murdoch University, Perth, WA, Australia b Murdoch University Energy Research Institute, Murdoch University, Perth, WA, Australia Received 17 February 2003; accepted 28 July 2003 Abstract The performances of five different types of photovoltaic modules have been measured for more than a year in the temperate climate of Perth, Western Australia. Perth averages over 5.4 peak sun hours (PSH) each day, from less than 3 in the winter months to over 8 at the height of summer. The average sun-up temperatures range between 16.5 °C and 28 °C. The types of modules examined in this study are: crystalline silicon (c-Si), laser grooved buried contact (LGBC) c-Si, polycrystalline silicon (p-Si), triple junction amorphous silicon (3j a-Si) and copper indium diselenide (CIS). Using a purpose built outdoor monitoring facility the energy production under actual operating conditions has been measured for each module. The annual and monthly performance ratios (PRs) have been calculated for the different modules and a comparison is presented here. The I –V characteristics and maximum power at standard test conditions have been measured for each module prior to, and at regular intervals, during outdoor exposure. These values are compared to the manufacturers’ values, and monitored over time for the modules operated in the field. Ó 2003 Elsevier Ltd. All rights reserved. Keywords: Performance ratio; Outdoor exposure tests; Maximum power point trackers; CIS; a-Si; p-Si 1. Introduction In designing any power generation system that in- corporates photovoltaics (PV) there is a basic require- ment to accurately estimate the output from the proposed PV array under operating conditions. PV modules are given a power rating at standard test conditions (STC) of 1000 W m 2 , AM1.5 and a module temperature of 25 °C, but these conditions do not represent what is typically experienced under outdoor operation. This paper sum- marises the monitored results of module operation over a year in Perth, Western Australia, at reasonably elevated module temperatures for different PV technologies. For six months of the year the average back of module tem- peratures during the daylight hours are over 30 °C peaking at 36.5 °C in February. However the maximum back of module temperatures are higher than 65 °C. It is well known that different PV technologies have different seasonal patterns of behaviour. These differ- ences are due to the variations in spectral response, the different temperature coefficients of voltage and current and, in the case of amorphous silicon (a-Si) modules, the extra effect of photo-degradation and thermal annealing. There is evidence that modules of differing technol- ogies could be more suited to certain specific climates. Mieke (1998) for example, has reported on the very different performance of two PV arrays installed in a hybrid power station in a remote community in northern Australia, 400 km south of Darwin. One array consists of poly-crystalline silicon (p-Si) modules and the other is made up of triple junction a-Si modules. His work has shown that in this tropical climate, with high ambient temperatures and high humidity during the wet season, the a-Si array produces up to 20% more energy than the * Corresponding author. Tel.: +8-9360-3601; fax: +8-9310- 6094. E-mail address: acarr@fizzy.murdoch.edu.au (A.J. Carr). 1 ISES member. 0038-092X/$ - see front matter Ó 2003 Elsevier Ltd. All rights reserved. doi:10.1016/j.solener.2003.07.026 Solar Energy 76 (2004) 285–294 www.elsevier.com/locate/solener
-
Upload
khangminh22 -
Category
Documents
-
view
4 -
download
0
Transcript of A comparison of the performance of different PV module types ...

Solar Energy 76 (2004) 285–294
www.elsevier.com/locate/solener
A comparison of the performance of different PV moduletypes in temperate climates
A.J. Carr a,*,1, T.L. Pryor b
a Australian Cooperative Research Centre for Renewable Energy, Murdoch University, Perth, WA, Australiab Murdoch University Energy Research Institute, Murdoch University, Perth, WA, Australia
Received 17 February 2003; accepted 28 July 2003
Abstract
The performances of five different types of photovoltaic modules have been measured for more than a year in the
temperate climate of Perth, Western Australia. Perth averages over 5.4 peak sun hours (PSH) each day, from less than 3
in the winter months to over 8 at the height of summer. The average sun-up temperatures range between 16.5 �C and 28
�C. The types of modules examined in this study are: crystalline silicon (c-Si), laser grooved buried contact (LGBC) c-Si,
polycrystalline silicon (p-Si), triple junction amorphous silicon (3j a-Si) and copper indium diselenide (CIS). Using a
purpose built outdoor monitoring facility the energy production under actual operating conditions has been measured
for each module. The annual and monthly performance ratios (PRs) have been calculated for the different modules and
a comparison is presented here. The I–V characteristics and maximum power at standard test conditions have been
measured for each module prior to, and at regular intervals, during outdoor exposure. These values are compared to the
manufacturers’ values, and monitored over time for the modules operated in the field.
� 2003 Elsevier Ltd. All rights reserved.
Keywords: Performance ratio; Outdoor exposure tests; Maximum power point trackers; CIS; a-Si; p-Si
1. Introduction
In designing any power generation system that in-
corporates photovoltaics (PV) there is a basic require-
ment to accurately estimate the output from the proposed
PV array under operating conditions. PV modules are
given a power rating at standard test conditions (STC) of
1000 Wm�2, AM1.5 and a module temperature of 25 �C,but these conditions do not represent what is typically
experienced under outdoor operation. This paper sum-
marises the monitored results of module operation over a
year in Perth, Western Australia, at reasonably elevated
module temperatures for different PV technologies. For
six months of the year the average back of module tem-
* Corresponding author. Tel.: +8-9360-3601; fax: +8-9310-
6094.
E-mail address: [email protected] (A.J. Carr).1 ISES member.
0038-092X/$ - see front matter � 2003 Elsevier Ltd. All rights reserv
doi:10.1016/j.solener.2003.07.026
peratures during the daylight hours are over 30 �Cpeaking at 36.5 �C in February. However the maximum
back of module temperatures are higher than 65 �C.It is well known that different PV technologies have
different seasonal patterns of behaviour. These differ-
ences are due to the variations in spectral response, the
different temperature coefficients of voltage and current
and, in the case of amorphous silicon (a-Si) modules, the
extra effect of photo-degradation and thermal annealing.
There is evidence that modules of differing technol-
ogies could be more suited to certain specific climates.
Mieke (1998) for example, has reported on the very
different performance of two PV arrays installed in a
hybrid power station in a remote community in northern
Australia, 400 km south of Darwin. One array consists
of poly-crystalline silicon (p-Si) modules and the other is
made up of triple junction a-Si modules. His work has
shown that in this tropical climate, with high ambient
temperatures and high humidity during the wet season,
the a-Si array produces up to 20% more energy than the
ed.

286 A.J. Carr, T.L. Pryor / Solar Energy 76 (2004) 285–294
p-Si array. Akhmad et al. (1997) have also indicated a-Si
modules may be more suited to tropical climates.
In this work the performance of PV modules based
on five different technologies has been compared. These
are: single crystal silicon (c-Si), p-Si, triple junction a-Si,
copper indium di-selenide (CIS) and the laser grooved
buried contact (LGBC) c-Si modules.
The results show marked differences in the behaviour
and output of the different module types. The observed
deterioration of the maximum power at STC of all the
modules supports the results of similar work performed
in both Switzerland by the Laboratory of Energy,
Ecology and Economy (LEEE), at TISO (Chianese
et al., 2000; LEEE, 2000), and in the Netherlands by
the Netherlands Energy Research Foundation ECN,
at Petten (Eikelboom and Jansen, 2000).
2. Testing procedures
The current–voltage and power–voltage characteris-
tics at STC were measured on site at the Murdoch
University Energy Research Institute (MUERI) with a
SPIRE 460 Solar Simulator, and using appropriate ref-
erence cells calibrated by the Japan Quality Assurance
Organisation (JQA). This measurement system has a
maximum error of ±3% (Nakano, 2001; Sutherland,
2000). The simulator is housed in a constant tempera-
ture room.
To confirm the stability of the STC test facility a
single crystalline Sensor Technologies module, with a
maximum power at STC of approximately 10 W, has
been used as a reference throughout the testing period.
This reference module is permanently housed in the
constant temperature room and was measured with each
of the simulator reference cells at the same time as all the
other modules were being measured. An analysis of the
results from the reference module measurements showed
excellent stability in the STC testing conditions, with a
standard deviation of less than 1% in all cases over the
entire test period.
The ongoing outdoor tests being conducted at MU-
ERI involve the measurement of the total energy gen-
erated by each module. By using individual maximum
power point trackers (mppt’s) for each module a direct
comparison can be made of the maximum possible en-
ergy production of different modules while they are
subjected to identical meteorological and operating
conditions. The maximum power point trackers were
especially designed and built for this work and have
undergone considerable testing to ensure they reliably
track maximum power. Real-time tests using a cali-
brated HP E4350B Solar Array Simulator have deter-
mined that these mppts have a tracking efficiency of
approximately 99%.
Most of the research groups performing outdoor
monitoring of individual PV modules are using regular
I–V scans to characterise module performance (Akhmad
et al., 1997; Ikisawa et al., 2000; King et al., 2000;
Rummel et al., 1998). By using mppt’s and recording the
energy output continuously the modules are subjected to
actual operating conditions. A survey of current litera-
ture has found only two other groups using continuously
measured energy output of individual modules. These
are LEEE in Switzerland and the Photovoltaics Re-
search Group in the Department of Physics at the
University of Port Elizabeth (UPE) in South Africa.
LEEE are also using mppt’s to monitor and compare all
the available energy from each module (Chianese et al.,
2000). The research group at UPE are monitoring the
performance of different modules under the operating
conditions of a battery charging system by operating the
modules at a regulated voltage of 13 V rather than at
mpp. The modules are connected to a load and battery
bank via a voltage regulator with the load designed so
the batteries always need charging (Meyer and van Dyk,
2000; van Dyk et al., 1997).
The modules under test in this study are mounted on
a north facing rack tilted at 32� (the latitude of Perth).
The parameters being monitored and recorded are:
module output power, both the plane of array (POA)
and the horizontal global irradiance, back of module
temperature, ambient temperature and wind speed. The
integrity of the data has been assured by regular cali-
bration checks of all sensors and system components.
The data acquisition system calculates module power
from the module voltage and module current measure-
ments that are made each second. All these parameters
are measured or calculated every second and then av-
eraged over 10-minute intervals.
3. Results
3.1. STC results
Table 1 gives the manufacturers’ rated Wp for each
module purchased for this project, the manufacturers’
initial guaranteed minimum (IGM) Wp or tolerance, the
initial Wp values measured prior to any outdoor expo-
sure and the final Wp value measured at the end of the
test period. Table 1 also presents the number of months
of outdoor exposure experienced by each module, the
percentage differences between the initial and final Wp
measurements and the difference between the final Wp
value and the rated output.
As the photovoltaics industry becomes more estab-
lished module warranty periods have steadily increased.
Some limited warranty periods are now up to 25 years.
Mostly, modules are guaranteed to perform to a per-

Table 1
STC results before and after outdoor exposure
Module make
model #
Cell type Wp, rated
(W)
Wp, IGM
(W)
Wp, initial
(W)
Wp final
(W)
Exposure
(months)
Diff. initial
to final (%)
Diff. final to
rated (%)
Solarex SX-75 p–Si 75 70 76.4 75.3 16 )1.4 0.4
BP BP275 c–Si 75 70 81.6 78.7 16 )3.6 4.9
Uni-Solar
US-64a3j, a-Si 64 57.6 75.3 56.4 16+
312 PSHa
)25.1 )11.9
BPBP585 c-Si, LGBC 85 80 86.7 86.1 13 )0.7 1.24
Siemens ST40 CIS 40 36 40.1 32.1 19 )20.0 )19.7Photowatt
PW750/70
p-Si 70 65 68.6 65.9 19 )3.9 )5.8
a Prior to being installed on the monitoring system, the Uni-Solar US-64 module underwent photo-degradation outdoors while
being left in the open circuit condition. The module was tested regularly and included in the monitoring system once it had degraded to
approximately 64 W. This occurred after an outdoor exposure of 312 peak sun hours.
A.J. Carr, T.L. Pryor / Solar Energy 76 (2004) 285–294 287
centage of the initial guaranteed minimum power and
occasionally to a percentage of the rated power. Table 2
provides a summary of the warranties for the modules
used in this work and, if they have changed, shows the
warranties currently available for these modules.
The initial (prior to outdoor exposure) STC mea-
surements of all the modules were within the IGM
values given by the manufacturers. Of the crystalline
silicon technologies (c-Si and p-Si) SX-75(p-Si) and
BP585(LGBC, c-Si) have initial Wp values that are
marginally above their ratings, 1.9% and 2.0%, respec-
tively. BP275(c-Si) is 8.8% over its rated value. The p-Si
module PW750/70 is approximately 2% below its rated
Table 2
Module warranties
Module make model # Warranty applicable to modules in this
Solarex SX-75 20 year limited warranty of 80% power
(IGM)
10 year limited warranty of 90% power
(IGM)
BP BP275 20 year limited warranty of 80% power
(IGM)
10 year limited warranty of 90% power
(IGM)
Uni-Solar US-64 20 year limited warranty of 80% power
(rated)
BP BP585 20 year limited warranty of 80% power
(IGM)
10 year limited warranty of 90% power
(IGM)
Siemens ST40 5 year limited warranty of 90% power o
(IGM)
Photowatt PW750/70 25 year limited warranty of 80% power
(IGM)
value. Only one out of four of the crystalline technolo-
gies tested had a Wp value below its rated value.
As expected the a-Si module, US-64, has an initial
measured un-degraded Wp value at STC that is nearly
18% over the rated 64 W. This is only a guide to the
module’s ultimate performance where an expected
photo-degradation of 15% is given by the manufacturers
(USSC, 1998).
Finally, ST40, the CISmodule, has an initialWp value
which is essentially equal to its rated value. However,
there are suggestions by LEEE, as well as Siemens Solar
Industries and NREL, that simulator testing using
pulsed light does not give reliable results when testing
study Warranty currently offered for new modules
(if different from previous column)
output
output
output
output
output
output 25 year limited warranty of 80% power output
(IGM)
output 12 year limited warranty of 90% power output
(IGM)
utput 10 year limited warranty of 90% power output
(IGM)
output

288 A.J. Carr, T.L. Pryor / Solar Energy 76 (2004) 285–294
copper indium diselenide (Cereghetti et al., 2001; Tarrant
and Gay, 1999). As very similar long-term results were
seen in this study, this is investigated in more detail later.
The results of these initial tests do not concur with
those obtained by LEEE: in three studies combined they
have reported that 26 out of 28 crystalline technology
modules were below their rated values. The two modules
above the rated values were less than 1.5% above and
the overall average for the measured peak powers was
9.4% below rated value. Some modules had initial
maximum power values below the guaranteed values
given by the manufactures (Cereghetti et al., 2000;
Cereghetti et al., 2001). van Dyk and Meyer (2000) have
also reported initial STC values below rated values: in a
report containing initial STC tests of seven crystalline
technology modules, all but one is below its rated value
with the overall average Wp measurement being 5.4%
below the rated value. As the tests reported here are of a
much smaller sample it is not unreasonable to conclude
that this could be the reason for the difference.
Fig. 1 presents all the STC measurements over the
course of this study. After the outdoor exposure the
modules’ Wp values are all still within the manufactur-
ers’ guaranteed values, due in part to the large tolerances
given in the warranties. All modules have experienced
some losses in the maximum power from the initial Wp
values measured prior to outdoor exposure. The gap in
STC data collection, between April and June, was due to
a breakdown of the air-conditioner in the simulator
room preventing the required temperature control for
STC testing.
30
40
50
60
70
80
90
Jun-
00
Jul-0
0
Aug
-00
Aug
-00
Oct
-00
Oct
-00
Dec
-00
Dec
-00
Jan-
01
Mar
-01
Apr
-01
Max
imum
Pow
er a
t STC
(W)
SX-75U BP-275 UN-2 US
Fig. 1. Module maximum power at STC, me
In the case of SX-75(p-Si), BP585(LGBC, c-Si) and
PW750/70(p-Si) the drops in Wp value in the first three
months of exposure are 1.5%, 1.7% and 0.8%, respec-
tively, which are all within the error limits of the Spire
solar simulator. However, BP275(c-Si) had a larger drop
when first exposed, which amounted to 4% in the first 3
months. Fig. 1 shows that, while BP275(c-Si) did expe-
rience this initial drop in power, it has been very stable
since, as have BP585(LGBC, c-Si) and SX-75(p-Si).
PW750/50 was very stable in the first year, but has
shown a slight decrease in the final 5 months. LEEE and
ECN (Cereghetti et al., 2001; Eikelboom and Jansen,
2000) have noted similar drops in STC maximum power
after initial outdoor exposure for crystalline technolo-
gies. LEEE have reported and investigated initial de-
grading of crystalline technologies and concluded this
occurs during the first few hours of exposure and is in
the region of 3% (Cereghetti et al., 2001).
The new a-Si module US-64 and the CIS module
ST40 have both experienced more sustained and unex-
pectedly large decreases in Wp value.
As mentioned earlier there is a question about the
reliability of testing CIS using a pulsed solar simulator,
and, while ST40(CIS) shows a drop in Wp value at STC
of 20% over the entire test period, this result was not
reflected in its outdoor performance. Extrapolation of
outdoor results to STC, using the method described by
Strand et al. (Strand et al., 1996), demonstrated a drop
of performance outdoors of only 8.5%, giving a final Wp
value of 36.6 W, rather than the 32 W measured in the
simulator. Tarrant and Gay reported greater stability of
May
-01
Jun-
01
Jul-0
1
Aug
-01
Sep-
01
Oct
-01
Nov
-01
Dec
-01
Jan-
02
Feb-
02
Mar
-02
-64 BP585 ST40 PW750/70
asured using Spire 40 Solar Simulator.

A.J. Carr, T.L. Pryor / Solar Energy 76 (2004) 285–294 289
CIS modules outdoors than when being tested using a
pulsed solar simulator. They have reported on tests
showing that both the voltage bias history and light bias
history of the modules can cause transient effects, which,
in turn, confound the results of measurements using
pulsed solar simulators (Tarrant and Gay, 1999).
The a-Si module US-64 dropped over 25% at STC.
At the end of the study the module had a maximum
power at STC 12% below its rated value. It continued to
degrade for more than a year, with the degradation
process turning around (due to thermal annealing) in the
warmer weather of December 2001. This prolonged de-
gradation was unexpected. It is usual for light-induced
degradation of a-Si modules to occur in the first weeks
or months of outdoor exposure, after which the modules
will become stable. This is confirmed by published re-
sults, for example (Akhmad et al., 1997; Lund et al.,
2001). The manufactures also state that the degradation
will occur in the initial 8–10 weeks of outdoor exposure
(USSC, 1998).
Fig. 1 also includes a module labelled UN-2. This is
another Uni-Solar US-64 triple junction a-Si module
purchased in 1997 for an earlier separate project and
included in this work until all the new modules had been
delivered. As expected from an older a-Si module, which
has been in the field for some time, UN-2(3j, a-Si) is no
longer experiencing any sharp photo-degradation. In-
stead, it is showing a fairly stable maximum power rat-
ing with some underlying cycling of maximum power
values as the photo-degradation and thermal annealing
takes place.
There is a very large difference in maximum power
for the two a-Si modules. After more than four years of
outdoor exposure UN-2 has a Wp value at STC of 67.8
W, 6% above Wp-rated, and as stated above, after 19
months US-64 is 12% below its rated value. These
modules have different dates of manufacture, 1997 and
1999. They are also very different in appearance, the
older module is a dull brown colour. The newer one is
quite reflective and blue. This colour difference could be
responsible for some differences in the output of the
modules, but further tests, such as spectral response and
reflection measurements would be needed to confirm
this.
This result is not unique. LEEE have experienced and
reported a similar result for two US-64(3j, a-Si) mod-
ules. The manufacturer requested the return of one of
the modules to determine the cause of the low Wp value.
The module was tested by the manufacturers and found
to have a Wp value of 52.1 W, or 18.6% below its rated
value. LEEE subsequently received another module
from the manufacturers and found that, when stabilised,
it produced 25% more energy than the earlier module
(Cereghetti et al., 2000).
The company that produced the module has been
asked for any additional information that may help to
explain this unexpected result, but, to date, nothing has
been received.
3.2. Outdoor test results
There are many ways to analyse the performance of
PV modules. The system used in this study and an in-
creasingly common measure of actual energy production
is the performance ratio (PR) (IEA, 2000; IEC, 1998). It
enables the comparison of modules of different power
ratings, by normalising the energy produced under ac-
tual operating conditions to the maximum power at STC
of the module and the incident solar radiation. Different
qualities can be examined by using either the rated Wp
value (Wp-rated) or the measured (at STC) Wp value
(Wp-measured) as the normalising factor. The latter
provides a direct comparison of different technologies.
The former enables an economic comparison of module
brands and models, a guide to what may be expected
from the different manufacturers. Most designers, in-
stallers and users of PV will not have the facilities to
perform STC measurements, and will be particularly
interested, therefore, in the performance with respect to
the rated maximum power. The general equation for PR
is given in Eq. (1).
Looking at the long-term module efficiencies is an-
other analysis method, either based on module area or
aperture area. This is important when users are re-
stricted by available space when installing a PV array. In
most remote area applications in sparsely populated
places, like Australia, this would not be an issue, but for
roof-mounted building-integrated PV in densely popu-
lated places, like Japan, this could be an important
consideration.
For the analysis in this study, the annual and
monthly PR for each module has been examined. The
total energy generated by the module under outdoor
operating conditions has been measured and then both
types of PR [Eq. (1)] have been calculated
PR ¼ EPMAXðSTCÞ
�H
GðSTCÞð1Þ
E energy produced (Wh) in the given time period
H total incident radiation (Whm�2) in the given
time period
PMAXðSTCÞ maximum power at STC measured during the
time period, or the rated Wp (W)
GðSTCÞ irradiance at STC (Wm�2)
3.2.1. Annual PR results
Fig. 2 presents the annual performance of the six
modules under test. This includes both the PR, calcu-
lated using the rated maximum power for each module,
and the PR calculated using the measured maximum

Fig. 2. Annual performance ratio for each module, based on both rated and measured Wp values. Taken from data for the year from
March 2001 to February 2002.
290 A.J. Carr, T.L. Pryor / Solar Energy 76 (2004) 285–294
power for each module. In the latter instance the mea-
sured value has been taken as the average of the Wp
values measured in the solar simulator at the beginning
and at the end of the test year (March 2001–February
2002).
The CIS module, ST40, result of 1.06 cannot be
taken as reliable. This quantity has been calculated using
the STC measurements and, as mentioned in the previ-
ous sections, there are known problems associated with
large area pulsed solar simulator (lapss) measurements
of CIS. Therefore a PR (Wp-outdoors) has been calcu-
lated using the appropriate outdoor Wp values (at close
to STC) which were discussed earlier. The result is a PR
of 0.94 and is included in Fig. 2.
Looking at the annual PR (Wp-rated) it is apparent
that SX-75(p-Si), BP275(c-Si), BP585(LGBC, c-Si) and
ST40(CIS) with values between 0.87 and 0.88 have
performed better than US64(3j, a-Si) and PW750/70(p-
Si) with values of 0.84. This lower value represents a
production of 4.5% less energy, compared to the other
four modules.
However, the technology comparison, PR (Wp-
measured), shows ST40(CIS) (Wp-outdoors) as the best
at 0.94, US64(3j, a-Si) next at 0.92, with the others being
between 0.84 and 0.89.
Both SX-75(p-Si) and BP585(LGBC, c-Si) have very
stable Wp values at STC; their STC values are the
closest to their rated Wp values, so there is no appre-
ciable difference between the two PR values.
BP275(c-Si) also has a stable measured Wp value.
However, it is about 5% higher than rated value, which
explains why the PR (Wp-rated) is higher than the PR
(Wp-measured). It can be concluded that, as a technol-
ogy, BP275(c-Si) produces approximately 5% less energy
than SX-75(p-Si) and BP585(LGBC, c-Si) for the given
site conditions.
PW750/70(p-Si) has a PR (Wp-measured) of 0.89,
and like BP275(c-Si) the difference in the two PRs is due
to the difference between Wp-measured and Wp-rated
values. However, in this case the PW750/70(p-Si) mod-
ule has an STC Wp value below its rated value. On a
technology basis this result shows PW750/70(p-Si) per-
forms better than the other technologies. However,
PW750/70(p-Si) has not been as stable at STC as the
three modules already discussed so a firm conclusion is
not possible.
This is also true of US-64(3j, a-Si); the technology
based PR (Wp-measured) clearly shows a much better
performance than the others, but, with an STC drop of
5.6% over the 12 month period, it is difficult to draw any
firm conclusions. A comparison on a shorter time base
will provide more information.
3.2.2. Monthly PR results
To help determine seasonal trends in this study the
monthly PR for each module has been examined. The
total energy generated by the module under outdoor
operating conditions has been measured then both types
of PR have been calculated. In the case of the PR (Wp-
measured), the Wp values used were those measured as
close as possible to the middle of the month in question.
As US-64(3j, a-Si) continued to degrade during the
months in which no STC data was obtainable, Wp
values were extrapolated from the available data to be
used in the calculation of the PRs.
Fig. 3 presents the average daily POA peak sun hours
and average daily ambient temperatures (sun-up) expe-
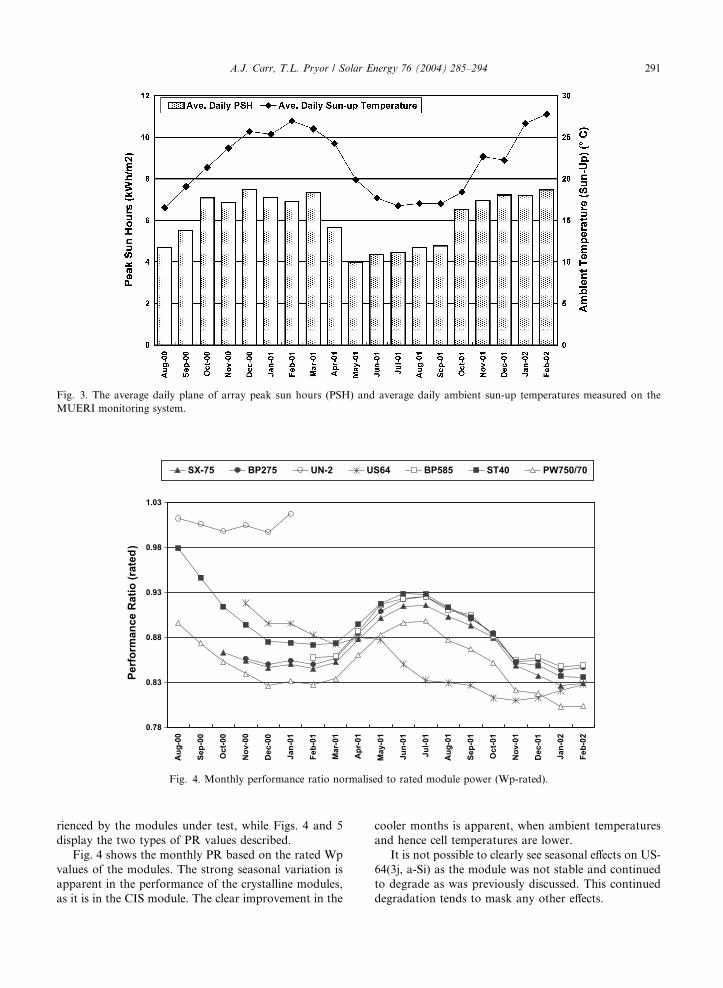
Fig. 3. The average daily plane of array peak sun hours (PSH) and average daily ambient sun-up temperatures measured on the
MUERI monitoring system.
0.78
0.83
0.88
0.93
0.98
1.03
Aug
-00
Sep-
00
Oct
-00
Nov
-00
Dec
-00
Jan-
01
Feb-
01
Mar
-01
Apr
-01
May
-01
Jun-
01
Jul-0
1
Aug
-01
Sep-
01
Oct
-01
Nov
-01
Dec
-01
Jan-
02
Feb-
02
Perf
orm
ance
Rat
io (r
ated
)
SX-75 BP275 UN-2 US64 BP585 ST40 PW750/70
Fig. 4. Monthly performance ratio normalised to rated module power (Wp-rated).
A.J. Carr, T.L. Pryor / Solar Energy 76 (2004) 285–294 291
rienced by the modules under test, while Figs. 4 and 5
display the two types of PR values described.
Fig. 4 shows the monthly PR based on the rated Wp
values of the modules. The strong seasonal variation is
apparent in the performance of the crystalline modules,
as it is in the CIS module. The clear improvement in the
cooler months is apparent, when ambient temperatures
and hence cell temperatures are lower.
It is not possible to clearly see seasonal effects on US-
64(3j, a-Si) as the module was not stable and continued
to degrade as was previously discussed. This continued
degradation tends to mask any other effects.

Hm � A
0.8
0.85
0.9
0.95
1
1.05
1.1
Aug
-00
Sep-
00
Oct
-00
Nov
-00
Dec
-00
Jan-
01
Feb-
01
Mar
-01
Apr
-01
May
-01
Jun-
01
Jul-0
1
Aug
-01
Sep-
01
Oct
-01
Nov
-01
Dec
-01
Jan-
02
Feb-
02
Perf
orm
ance
Rat
io (m
easu
red)
SX-75 BP275 UN-2US64 BP585 ST40ST40 (outdoor Wp) PW750/70
Fig. 5. Monthly performance ratio, normalised to regularly measured STC peak power (Wp-measured).
292 A.J. Carr, T.L. Pryor / Solar Energy 76 (2004) 285–294
However, what can be seen is that UN-2(3j, a-Si)
performs better than any other module in this compar-
ison, including its a-Si counterpart US-64(3j, a-Si). One
reason for this high PR is the higher than rated Wp
value of the module. For the six months that UN-2(3j,
a-Si) was on the system its PR has remained fairly
constant, which is in contrast to the falling PR seen in
US-64(3j, a-Si).
Fig. 4 shows that, when first installed, the CIS
module ST40 performed well above its 0.88 annual av-
erage seen in the final year. The plot makes it clear that,
while ST40(CIS) outperformed the crystalline silicon
modules in the first summer, it ended up with a PR
similar to BP275(c-Si), BP585(LGBC, c-Si) and SX-
75(p-Si) by late 2001.
While PW750/70(p-Si) followed the same trends as
the other crystalline based modules, it did have the
lowest PR. Like the annual energy production, this can
be explained by the fact that it has a lower Wp value
than its rated value.
Fig. 5 uses the PR based on the measured module
output at STC and provides a more direct comparison of
the different behaviour due to material properties. Again
the seasonal variation in performance of the crystalline
technologies is apparent. As in the annual energy com-
parison an extra set of data points has been included
for ST40(CIS). These have been calculated using the
monthly outdoor Wp values.
It is immediately apparent, when examining Fig. 5
that all four crystalline technology modules have PRs
lower than those of the thin film modules. BP275, a
standard c-Si module, has the lowest PR of all the
modules under test.
The other three crystalline silicon-based modules
perform between two and six percent above BP275(c-Si),
with PW750/70(p-Si) having the highest PR of all the
crystalline modules.
UN-2(3j, a-Si) has a performance ratio about 18%
higher than BP275(c–Si). US-64(3j, a-Si) has a PR that
compares far more favourably with UN-2(3j, a-Si) than
it did when the rated Wp was used to calculate the PR.
Removing the effect of photo-degradation by using these
measured values reveals that US-64(3j, a-Si)’s perfor-
mance varies very little seasonally.
The PR for ST40(CIS), calculated with the solar
simulator Wp values, is again an unreliable quantity.
The PR calculated using the maximum power values
measured outdoors is a better indicator of the technol-
ogy’s performance when compared to the other mod-
ules. It shows a seasonal variation, as do the crystalline
modules, but not as pronounced, and it has a perfor-
mance ratio very similar to US-64(3j, a-Si), with some
seasonal crossing over in which ST40(CIS) is better in
winter and worse in summer than the a-Si module; this
could be attributed to its higher temperature coefficient.
As a counter point to PRs, the values of monthly
efficiency have been calculated [Eq. (2)] as the ratio of
total energy output by the module to the total solar
energy incident on the module and presented in Fig. 6.
gm ¼ Em ð2Þ

5%
6%
7%
8%
9%
10%
11%
12%
13%
Aug
00
Sep
00
Oct
00
Nov
00
Dec
00
Jan
01
Feb
01
Mar
01
Apr
01
May
01
Jun
01
Jul 0
1
Aug
01
Sep
01
Oct
01
Nov
01
Dec
01
Jan
02
Feb
02
Effic
ienc
ySX-75 BP275 UN-2 US64 BP585 ST40 PW750/70
Fig. 6. Monthly module efficiency, based on total module area.
A.J. Carr, T.L. Pryor / Solar Energy 76 (2004) 285–294 293
gm monthly module efficiency
Em total energy produced (Wh) in the given month
Hm total incident radiation (Wh m�2) in the given
month
A module area (m2)
When space is a consideration this is a useful com-
parison. The superior module in this analysis is the
LGBC c-Si module BP585, with efficiency values be-
tween 11.5% and 12.5%. Next is the c-Si module BP275,
with values between 10% and 11%. The two p-Si and the
CIS modules have midrange efficiencies between 8% and
9.5% and the lowest efficiencies are seen in the a-Si
modules; UN-2 is better than US-64(3j, a-Si), but their
efficiencies are less than or equal to half that of
BP585(LGBC, c-Si).
4. Conclusions
These tests have shown that the STC values quoted
by manufacturers for their PV modules do not neces-
sarily match those observed in STC measurements. So
far the measured maximum power values have remained
within the values guaranteed by the manufacturers, de-
spite a very steep decline in maximum power after out-
door exposure for some modules. This result has been
aided by the large tolerances some manufacturers have
specified.
The conclusions that can be drawn from the energy
generation results are that, if all the modules had been
stable and had Wp values equal to their ratings, the thin
film modules would generate the most energy at this site.
The triple junction a-Si modules produce over 15% more
energy than BP275(c-Si) does in summer, and around
8% more in winter. The CIS module consistently pro-
duces between 9% and 13% more energy than BP275(c-
Si).
However, not all modules were stable or had Wp
values equal to their rated values. Despite being within
the tolerances set down by the manufacturers some of
the modules are far from their rated Wp values, and as
noted, when looking at their performance based on their
rated values, there is little to separate the crystalline and
CIS modules from each other. The two a-Si modules are
so different from each other that, based on these results,
it is not possible to make any prediction of what could
be expected from that type of module.
Acknowledgements
The authors wish to acknowledge the assistance of
Dr Adele Milne in providing feedback and comments
in the preparation of this manuscript.
The work described in this paper has been supported
by the Australian Co-operative Research Centre for
Renewable Energy (ACRE). ACRE’s activities are fun-
ded by the Commonwealth’s Co-operative Research
Centres Program. Anna Carr has been supported by an
ACRE Postgraduate Research Scholarship.

294 A.J. Carr, T.L. Pryor / Solar Energy 76 (2004) 285–294
References
Akhmad, K., Kitamura, A., Yamamoto, F., Okamoto, H.,
Takakura, H., Hamakawa, Y., 1997. Outdoor performance
of a-Si and p-Si modules. Solar Energy Materials and Solar
Cells 46, 209–218.
Cereghetti, N., Chianese, D., Rezzonico, S., Travaglini, G.,
2000. Behaviour of triple junction a-Si modules. In: Scheers,
H., (Eds.), Proceedings of 16th European Photovoltaic Solar
Energy Conference, Glasgow, UK, pp. 2414–2417.
Cereghetti, N., Realini, D., Chianese, D., Rezzonico, S., 2001.
Power and energy production of PV modules. In: Proceed-
ings of 17th European Photovoltaic Solar Energy Confer-
ence, Munich, Germany.
Chianese, D., Cereghetti, N., Rezzonico, S., Travaglini, G.,
2000. 18 Types of PV modules under the lens. In: Scheers,
H., (Eds.), Proceedings of 16th European Photovoltaic
Solar Energy Conference, Glasgow, UK, pp. 2418–2421.
Eikelboom, J.A., Jansen, M.J., 2000. Characterisation of PV
modules of new generations, results of tests and simulations.
Report code: ECN-C-00-067. ECN.
IEA, 2000. International Energy Agency––photovoltaics power
systems programme: analysis of photovoltaic systems.
Report code: IEA-PVPS T2-01:2000.
IEC, 1998. Photovoltaic system performance monitoring––
guidelines for measurement, data exchange and analysis.
IEC 61724:1998 (E), IEC, Geneva.
Ikisawa, M., Nakano, A., Ohshiro, T., 2000. Outdoor exposure
tests of photovoltaic modules in Japan and overseas. In:
Scheers, H., (Eds.), Proceedings of 16th European Photo-
voltaic Solar Energy Conference, Glasgow, UK. pp. 2276–
2279.
King, D.L., Kratochvil, J.A., Boyson, W.E., 2000. Stabilization
and performance characteristics of commercial amorphous-
silicon PV modules. In: Proceedings of 28th IEEE Photo-
voltaics Specialists Conference, Anchorage, Alaska, USA,
pp. 1446–1449.
LEEE, 2000. Module tests. LEEE NEWS––Newsletter of the
Laboratory of Energy, Ecology and Economy, p. 1.
Available from <http://leee.dct.supsi.ch/>.
Lund, C.P., Luczac, K., Pryor, T., Cornish, J.C.L., Jennings,
P.J., Knipe, P., Ahjum, F., 2001. Field and laboratory
studies of the stability of amorphous silicon solar cells and
modules. Renewable Energy 22, 287–294.
Meyer, E.L., van Dyk, E.E., 2000. Development of energy
model based on total daily irradiation and maximum
ambient temperature. Renewable Energy 21, 37–47.
Mieke, W., 1998. Hot climate performance comparison between
poly-crystalline and amorphous silicon cells connected to an
utility mini-grid. In: Proceedings of Solar 98, 36th Annual
Conference of the Australian and New Zealand Solar
Energy Society, Christchurch, New Zealand, pp. 464-
470.
Nakano, A., 2001. Personal communication. JQA––reference
cell and simulator error, 25 January 2001.
Rummel, S., Emery, K., Field, H., Moriarty, T., Anderberg, A.,
Dunlavy, D., Ottoson, L., 1998. PV cell and module
performance measurement capabilities at NREL. In: Al-
Jassim, M., Thornton, J.P., Gees, J.M., (Eds.), Proceedings
of National Centre for Photovoltaics Program Review
Meeting, Denver, Colorado, USA, pp. 553–558.
Strand, T.R., Kroposki, B.D., Hansen, R., Willett, D., 1996.
Siemens solar CIS photovoltaic module and system perfor-
mance at the National Renewable Energy Laboratory. In:
Proceedings of 25th IEEE Photovoltaic Specialists Confer-
ence, Washington, DC, USA, pp. 965–968.
Sutherland, J., 2000. Personal communication. Spire Corp––
460 Solar Simulator, 20 December 2000.
Tarrant, D.E., Gay, R.R., 1999. Thin-film photovoltaic part-
nership––CIS-based thin film PV technology, Final Techni-
cal Report. Report code: NREL/SR-520-27148. National
Renewable Energy Laboratory.
USSC, 1998. Uni-Solar US-64 Owner’s Manual United Solar
Systems Corporation Troy, MI, USA.
van Dyk, E.E., Meyer, E.L., 2000. Long-term monitoring of
photovoltaic modules in South Africa. In: Proceedings of
28th IEEE Photovoltaic Specialists Conference, Anchorage,
AL, USA, pp. 1525–1528.
van Dyk, E.E., Meyer, E.L., Scott, B.J., O’Connor, D.A.,
Wessels, J.B., 1997. Analysis of photovoltaic module
energy output under operating conditions in South
Africa. In: Proceedings of 26th IEEE Photovoltaic
Specialists Conference, Anaheim, CA, USA, pp. 1197–
1200.