A comparison of the contribution of zooplankton and nekton taxa to the near-surface acoustic...
16
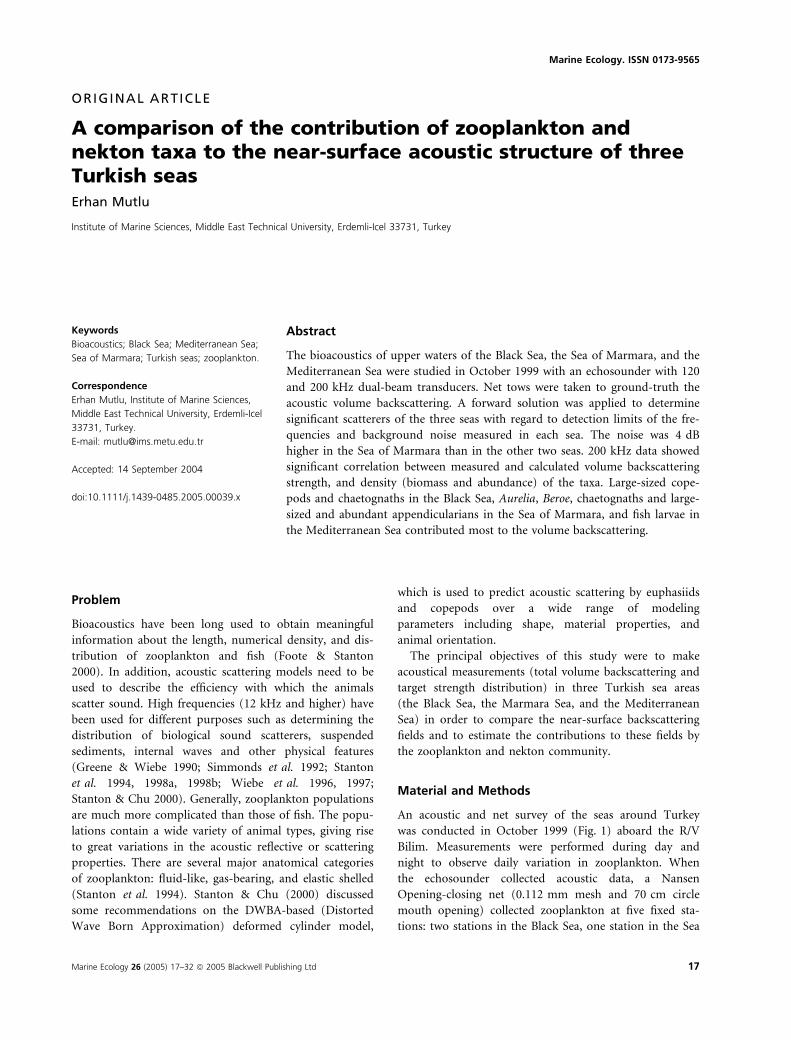
ORIGINAL ARTICLE A comparison of the contribution of zooplankton and nekton taxa to the near-surface acoustic structure of three Turkish seas Erhan Mutlu Institute of Marine Sciences, Middle East Technical University, Erdemli-Icel 33731, Turkey Problem Bioacoustics have been long used to obtain meaningful information about the length, numerical density, and dis- tribution of zooplankton and fish (Foote & Stanton 2000). In addition, acoustic scattering models need to be used to describe the efficiency with which the animals scatter sound. High frequencies (12 kHz and higher) have been used for different purposes such as determining the distribution of biological sound scatterers, suspended sediments, internal waves and other physical features (Greene & Wiebe 1990; Simmonds et al. 1992; Stanton et al. 1994, 1998a, 1998b; Wiebe et al. 1996, 1997; Stanton & Chu 2000). Generally, zooplankton populations are much more complicated than those of fish. The popu- lations contain a wide variety of animal types, giving rise to great variations in the acoustic reflective or scattering properties. There are several major anatomical categories of zooplankton: fluid-like, gas-bearing, and elastic shelled (Stanton et al. 1994). Stanton & Chu (2000) discussed some recommendations on the DWBA-based (Distorted Wave Born Approximation) deformed cylinder model, which is used to predict acoustic scattering by euphasiids and copepods over a wide range of modeling parameters including shape, material properties, and animal orientation. The principal objectives of this study were to make acoustical measurements (total volume backscattering and target strength distribution) in three Turkish sea areas (the Black Sea, the Marmara Sea, and the Mediterranean Sea) in order to compare the near-surface backscattering fields and to estimate the contributions to these fields by the zooplankton and nekton community. Material and Methods An acoustic and net survey of the seas around Turkey was conducted in October 1999 (Fig. 1) aboard the R/V Bilim. Measurements were performed during day and night to observe daily variation in zooplankton. When the echosounder collected acoustic data, a Nansen Opening-closing net (0.112 mm mesh and 70 cm circle mouth opening) collected zooplankton at five fixed sta- tions: two stations in the Black Sea, one station in the Sea Keywords Bioacoustics; Black Sea; Mediterranean Sea; Sea of Marmara; Turkish seas; zooplankton. Correspondence Erhan Mutlu, Institute of Marine Sciences, Middle East Technical University, Erdemli-Icel 33731, Turkey. E-mail: [email protected] Accepted: 14 September 2004 doi:10.1111/j.1439-0485.2005.00039.x Abstract The bioacoustics of upper waters of the Black Sea, the Sea of Marmara, and the Mediterranean Sea were studied in October 1999 with an echosounder with 120 and 200 kHz dual-beam transducers. Net tows were taken to ground-truth the acoustic volume backscattering. A forward solution was applied to determine significant scatterers of the three seas with regard to detection limits of the fre- quencies and background noise measured in each sea. The noise was 4 dB higher in the Sea of Marmara than in the other two seas. 200 kHz data showed significant correlation between measured and calculated volume backscattering strength, and density (biomass and abundance) of the taxa. Large-sized cope- pods and chaetognaths in the Black Sea, Aurelia, Beroe, chaetognaths and large- sized and abundant appendicularians in the Sea of Marmara, and fish larvae in the Mediterranean Sea contributed most to the volume backscattering. Marine Ecology. ISSN 0173-9565 Marine Ecology 26 (2005) 17–32 ª 2005 Blackwell Publishing Ltd 17
Transcript of A comparison of the contribution of zooplankton and nekton taxa to the near-surface acoustic...
ORIGINAL ARTICLE
A comparison of the contribution of zooplankton andnekton taxa to the near-surface acoustic structure of threeTurkish seasErhan Mutlu
Institute of Marine Sciences, Middle East Technical University, Erdemli-Icel 33731, Turkey
Problem
Bioacoustics have been long used to obtain meaningful
information about the length, numerical density, and dis-
tribution of zooplankton and fish (Foote & Stanton
2000). In addition, acoustic scattering models need to be
used to describe the efficiency with which the animals
scatter sound. High frequencies (12 kHz and higher) have
been used for different purposes such as determining the
distribution of biological sound scatterers, suspended
sediments, internal waves and other physical features
(Greene & Wiebe 1990; Simmonds et al. 1992; Stanton
et al. 1994, 1998a, 1998b; Wiebe et al. 1996, 1997;
Stanton & Chu 2000). Generally, zooplankton populations
are much more complicated than those of fish. The popu-
lations contain a wide variety of animal types, giving rise
to great variations in the acoustic reflective or scattering
properties. There are several major anatomical categories
of zooplankton: fluid-like, gas-bearing, and elastic shelled
(Stanton et al. 1994). Stanton & Chu (2000) discussed
some recommendations on the DWBA-based (Distorted
Wave Born Approximation) deformed cylinder model,
which is used to predict acoustic scattering by euphasiids
and copepods over a wide range of modeling
parameters including shape, material properties, and
animal orientation.
The principal objectives of this study were to make
acoustical measurements (total volume backscattering and
target strength distribution) in three Turkish sea areas
(the Black Sea, the Marmara Sea, and the Mediterranean
Sea) in order to compare the near-surface backscattering
fields and to estimate the contributions to these fields by
the zooplankton and nekton community.
Material and Methods
An acoustic and net survey of the seas around Turkey
was conducted in October 1999 (Fig. 1) aboard the R/V
Bilim. Measurements were performed during day and
night to observe daily variation in zooplankton. When
the echosounder collected acoustic data, a Nansen
Opening-closing net (0.112 mm mesh and 70 cm circle
mouth opening) collected zooplankton at five fixed sta-
tions: two stations in the Black Sea, one station in the Sea
Keywords
Bioacoustics; Black Sea; Mediterranean Sea;
Sea of Marmara; Turkish seas; zooplankton.
Correspondence
Erhan Mutlu, Institute of Marine Sciences,
Middle East Technical University, Erdemli-Icel
33731, Turkey.
E-mail: [email protected]
Accepted: 14 September 2004
doi:10.1111/j.1439-0485.2005.00039.x
Abstract
The bioacoustics of upper waters of the Black Sea, the Sea of Marmara, and the
Mediterranean Sea were studied in October 1999 with an echosounder with 120
and 200 kHz dual-beam transducers. Net tows were taken to ground-truth the
acoustic volume backscattering. A forward solution was applied to determine
significant scatterers of the three seas with regard to detection limits of the fre-
quencies and background noise measured in each sea. The noise was 4 dB
higher in the Sea of Marmara than in the other two seas. 200 kHz data showed
significant correlation between measured and calculated volume backscattering
strength, and density (biomass and abundance) of the taxa. Large-sized cope-
pods and chaetognaths in the Black Sea, Aurelia, Beroe, chaetognaths and large-
sized and abundant appendicularians in the Sea of Marmara, and fish larvae in
the Mediterranean Sea contributed most to the volume backscattering.
Marine Ecology. ISSN 0173-9565
Marine Ecology 26 (2005) 17–32 ª 2005 Blackwell Publishing Ltd 17

of Marmara, and two stations in the Mediterranean Sea
(Fig. 1). The net tows sampled layers between 15 and 5 m
in the Sea of Marmara, mostly between 30 and 10 m in
the Mediterranean Sea, and between 30 and 5 m and
between 10 and 5 m in the Black Sea (Fig. 2a). The samp-
ling depths were designed to cover only thermocline and
mixed layers (excluding the uppermost 5 m) for better
comparison of the different hydrographical properties of
the seas. These depth ranges were also those in which
acoustical background noise was very low. The net was
hauled vertically at 1.5 knots; depth was estimated by
wire out, and volume filtered by the distance the net
traveled and mouth area. Gelatinous macrozooplankton
was sized on board. The rest of samples were preserved in
4% formalin solution buffered with borax. Later, numbers
[indiv.Æm)3] and biomass [mgÆm)3] of taxa were deter-
mined using standard procedures in the laboratory.
Zooplankters were measured for total length and width.
The diameters of gastropods, bivalves, jellyfish, and a
ctenophore, Pleurobrachia pileus, were also measured. Bio-
masses were calculated from length-weight relationships
(Shmeleva 1965).
A dual-frequency (120 and 200 kHz), dual-beam echo-
sounder (Model 102), built by BioSonics Inc., was moun-
ted in a V-finned towed body and deployed so that the
towed body was 2 m below the surface. Parameters of the
acoustic system during the survey are given in Table 1.
The transmitter of the echosounder was disabled to
estimate the background noise that would be used to set
signal-to-noise threshold during post-processing of the
data. Volume backscattering strength, Sv [where Sv ¼10 · log10(sv) in units of decibelsÆm)1 and sv is the vol-
ume backscattering coefficient], is a measure of the effi-
ciency with which scatterers echo sound back to the
source in a cubic meter. These data were collected from 5
to 40 m in 0.1 m depth bins for both frequencies. The
data were averaged at 5 s intervals.
The backscattering data were ground-truthed with the
taxonomic data from microscopic analyses in order to
determine relative contributions of different functional
groups to backscattering intensity. The length and width
measurements for each individual were used in equa-
tions appropriate for the taxanomic groups developed by
Stanton et al. (1996, 1998a, 1998b), Monger et al. (1998),
47
46
45
44
43
42
41
40
39
38
37
36
35
3426 27
Mediterranean Sea
Sea of Marmara
The Black Sea
F15L00
G00K30
45C
M15L15
M15M15
28 29 30 31 32 33 34 35 36 37 38 39 40 41 42
Fig. 1. Stations where zooplankton was
collected with the net and acoustical records
were made. M15L15 and M15M15 were in
the Black Sea; 45C was in the Sea of
Marmara; G00K30 and F15L00 were in the
Mediterranean Sea.
Zooplankton, nekton taxa and near-surface acoustic structure Mutlu
18 Marine Ecology 26 (2005) 17–32 ª 2005 Blackwell Publishing Ltd

Mutlu (1996), and Love’s formula (Love 1971) to estimate
their contribution to the volume backscattering (Table 2).
Non-physonect siphonophores were modeled as weakly
scattering fluid targets. Assuming that gelatinous salp tissue
would approximate that of non-gas-bearing gelatinous
siphonophores as well, in these calculations R (reflection
coefficient) was set to 0.0041 to match the R used for salp
tissue in Stanton et al. (1994).
The fluid-like model was applied to Amphipoda,
Appendicularia, Chaetognatha, Cladocera, Copepoda,
copepod nauplii, decapod larvae, euphausiids, fish eggs,
Mysidacea, Ostracoda, Polychaeta, and salps; hard
0
10
20
30
dept
h [m
] de
pth
[m]
0
10
20
0
20
40
dept
h [m
]
M15L1520:07(1)
M15M15 11:10(2)
45C 22:16(8) 23:12(10) 23:18 00:42(5) 03:13(6) 05:05(7) 07:01(9) 09:05(3) 12:30(4)
G00K30 F15L00 F15L0002:20(12) 06:22 23:51(16) 02:48(13) 05:24(15) 07:09(14) 9:45(11)
(a)
(b)
(c)
Fig. 2. Enhanced echograms (200 kHz) of
sound scatterers of area to be purposed for
the models in the Black Sea (a), the Sea of
Marmara (b), the Mediterranean Sea (c)
(arrows show net sampling depth intervals).
Numbers in parentheses denote station
number used in Figs 6–11.
Table 1. Calibration data and processing
parameters for hydroacoustic system (PW,
pulse width).
sounder parameters
pulse width [ms] 0.4
trigger interval [s] 0.5
speed of sound [mÆs)1] 1500
receiving gain [dB] 0
transmit power [dB] 0
processing criteria
noise threshold [V] based on in situ measurements only listening
frequency [kHz] 120 200
source level [dB] 223.51 222.69
receive sensitivities narrow wide narrow wide
20 log(R) [dB] )154.53 )154.56 )149.59 )149.69
40 log(R) [dB] )184.21 )184.21 )179.23 )179.23
simultaneous [dB] )160.51 )149.55
wide beam dropoff [dB] 1.0678 1.1989
nominal angle [N/W beams] 7� 18� 6� 15�
Mutlu Zooplankton, nekton taxa and near-surface acoustic structure
Marine Ecology 26 (2005) 17–32 ª 2005 Blackwell Publishing Ltd 19

elastic-shell model to Gastropoda and bivalve larvae;
Monger et al.’s (1998) model to Pleurobrachia pileus,
Mnemiopsis leidyi and Beroe; Mutlu’s equations (Mutlu
1996) to jellyfish (Aurelia aurita) and Love’s formula to
fish larvae. Equivalent diameters of Mnemiopsis and Beroe
were converted to that of Pleurobrachia using the volume-
length relationships (Mutlu & Bingel 1999; Mutlu 1999;
Finenko et al. 2001).
Target strength was calculated first for each individual of
the taxa due to the significant differences found in the ratio
of body length/body width among individuals of the same
taxa. Expected volume backscattering (Sv) was estimated:
Sv ¼ TSþ 10� log10ðNÞ
where Sv is volume backscattering strength [dB], TS is
target strength [dB] calculated from the models, N is
abundance [number of individualsÆm)3].
Before calculating the expected volume backscattering,
two criteria are discussed: detection limit of the frequencies
and minimum Sv as threshold. ‘‘Detectable size of the tar-
get is actually a very complex subject and depends on many
things. The important factors include diameter of the
animal relative to the acoustic wavelength (hence wave
number, ‘ka’ value), orientation, material properties,
numbers of animals per unit volume, sensitivity of the
echosounder, and distance from the transducer. Also, note
that even if an animal is detectable while isolated, once it is
near another animal that has a greater target strength, the
latter animal is the one that is detected’’ (T. K. Stanton,
pers. comm.). Greene & Wiebe (1990) provided approxi-
mate relationships between minimum detectable size of the
target and the acoustical frequency such that: �10 mm
individuals can be detected at 120 kHz; 4 mm, at 420 kHz;
and 1.5 mm, at 720 kHz. David et al. (1999), however,
determined that planktonic objects detected at 120 and
38 kHz have size limits, i.e. 3 mm at 120 kHz and 10 mm
at 38 kHz, corresponding to one-quarter of the wavelength.
Accordingly, the minimum size would be about 2 mm at
200 kHz. Mutlu (2003) identified acoustically a concentra-
ted layer of the copepod Calanus euxinus (length <4 mm)
at 120 and 200 kHz. The Sv of the taxa was calculated
for individuals larger than a length corresponding to one-
quarter of the wavelength of the frequencies. Minimum
threshold in Sv was measured by switching the transmitter
of the echosounder off and measuring the received sound.
Background noise levels of 120 kHz were )78.5 ± 0.8
(SD), )75.5 ± 1.2 and )78.5 ± 0.8 dB in the Black Sea, the
Sea of Marmara, and the Mediterranean Sea, respectively.
The noise levels of 200 kHz were 4 dB lower than those of
120 kHz (Fig. 3a). However, the noises were 3–4 dB higher
in the Sea of Marmara than those in the other seas
(Fig. 3b). This might have been due to the presence of
Black Sea water overlying Mediterranean water (below
20 m depth) in the Sea of Marmara. The ambient noise
may have been enhanced by reflection occurring between
the surface and the interface of the two water types in
the Sea of Marmara. Individual calculated Sv less than the
noise was not incorporated into the comparison between
expected and measured Sv. Possible reasons for the high
ambient noise present in the Sea of Marmara are discussed
later.
Results
1. Biological characteristics of the three seas
The 16 individual net samples from the three seas yielded
21 taxa of meso- and macro-zooplankton. Eight taxa were
found in the Black Sea, namely, Copepoda (Calanus euxi-
nus, Pseudocalanus elongatus, Acartia sp., Oithona sp., and
Paracalanus parvus), copepod nauplii, Chaetognatha (Sag-
itta setosa), Gastropoda larvae, Appendicularia (Oikopleura
dioica), Cladocera (Pleopis polyphemoides, Podon sp.),
Scyphozoa (Aurelia aurita), and Ctenophora (Mnemiopsis
leidyi, Beroe ovata, and Pleurobrachia pileus). Eleven taxa
composed of Appendicularia (Oikopleura sp.), Chaetogna-
tha, Cladocera (Pleopis sp., Penilia sp.), Copepoda (Acartia
sp., Microsetella sp., Oncaea sp., Oithona sp., Paracalanus
sp., Centropages sp.), copepod nauplii, fish larvae, Poly-
chaeta, Gastropoda and Bivalvia larvae, Scyphozoa (Aurelia
aurita), and Ctenophora (Beroe ovata) were found in the
Sea of Marmara. The 19 Mediterranean taxa were Amphi-
poda (Hyperidae), Appendicularia (Oikopleura dioica,
Stegosoma magnum), Chaetognatha (Krohnitta subtitu),
Cladocera (Podon, Pleopis, Penilia sp.), Copepoda (well
diversified), copepod nauplii, Decapoda larvae, Euphausia-
cea (Stylocheiron suhmii), fish eggs, fish larvae, Mysidacea
(Loghogaster typicus), Ostracoda (Conchoecia spinirostris),
Polychaeta, Salpa (Salpa maxima), Gastropoda and
Bivalvia larvae, Siphonophora (Eudoxioides spiralis,
Table 2. Values for reflection coefficients (R) used in the models
(Ressler 2002).
organisms R model types
Salps non-physonect Siphonophora 0.0041 fluid-like
Copepoda (mixed) 0.0178 fluid-like
Euphausiacea 0.0341 fluid-like
Amphipoda 0.037 fluid-like
Beroe, Mnemiopsis, Pleurobrachia 0.056 Monger’s model
Appendicularia, Chaetognatha, Cladocera,
Decapoda larvae, fish eggs, Mysidacea,
nauplii, Ostracoda, Polychaeta
0.058 fluid-like
Gastropoda and Bivalvia larvae 0.5 elastic shell
jellyfish Mutlu’s equation
fish larvae Loves’ formula
Zooplankton, nekton taxa and near-surface acoustic structure Mutlu
20 Marine Ecology 26 (2005) 17–32 ª 2005 Blackwell Publishing Ltd

0 10 20 30 40
depth [m]
–84
–82
–80
–78
–76
Sv
as th
resh
old
[dB
]
120 kHz Black Sea
200 kHz Black Sea
120 KHz Sea of Marmara
200 kHz Sea of Marmara
120 kHz Mediterranean Sea
200 kHz Mediterranean Sea
–86 –84 –82 –80 –78 –76
Sv threshold at 200 kHz [dB]
–80
–78
–76
–74
Sv
thre
shol
d at
120
kH
z [d
B]
Black Sea
Sea of Marmara
Mediterranean Sea
(a)
(b)
Fig. 3. Background noise (minimum Sv as
threshold, dB) as function of depth (a), and
for comparison between 120 and 200 kHz
(b) in the three seas.
Mutlu Zooplankton, nekton taxa and near-surface acoustic structure
Marine Ecology 26 (2005) 17–32 ª 2005 Blackwell Publishing Ltd 21

Eudoxioides sp., Eudoxia sp., Sulculeolaria quadrivalvis),
squid (Todarodes sagittatus), and gelatinous organisms
(Turritopsis nutricula) (Fig. 4).
Lengths of Amphipoda species – Hyperidae and one
Caprellidae species – that were found only in the Medi-
terranean Sea varied between 1 and 3.5 mm, and between
0
4
8
12
16
size
[mm
]
0
2
4
6
maximum
minimum
mean
abundance
m15l152007
m15m
151110 s45c0905 s45c2318 s45c1230 s45c0046 s45c0313 s45c1238 s45c0505
s45c2216 s45c0701 s45c2312
f15l000945
g00k30 f15l00024
5 f15l00070
9 f15l00052
4 f15l0023542
0
1
2
3
4
5
size
[mm
]
0
200
400
600
m15l152007
m15m
151110 s45c0905 s45c2318 s45c1230 s45c0046 s45c0313 s45c1238 s45c0505 s45c2216 s45c0701 s45c2312
f15l000945 g00k30
f15l000245 f15l000709 f15l000524
f15l0023542
0.2
0.3
0.4
size
[mm
]
0
100
200
300
abun
danc
e [in
div.
·m–3
]ab
unda
nce
[indi
v.·m
–3]
abun
danc
e [in
div.
·m–3
]ab
unda
nce
[indi
v.·m
–3]
abun
danc
e [in
div.
·m–3
]ab
unda
nce
[indi
v.·m
–3]
abun
danc
e [in
div.
·m–3
]ab
unda
nce
[indi
v.·m
–3]
abun
danc
e [in
div.
·m–3
]ab
unda
nce
[indi
v.·m
–3]
abun
danc
e [in
div.
·m–3
]ab
unda
nce
[indi
v.·m
–3]
m15l152007
m15m
151110 s45c0905 s45c2318 s45c1230 s45c0046 s45c0313 s45c1238 s45c0505 s45c2216 s45c0701 s45c2312
f15l000945 g0
0k30 f15l000245 f15l000709 f15l000524 f15
l0023542
0
5
10
15
20
25
size
[mm
]
0
40
80
120
m15l152007
m15m
151110 s45c0905 s45c2318 s45c1230 s45c0046 s45c0313 s45c1238 s45c0505
s45c2216s45c0701s45c2312
f15l000945 g00k3
0f15l000245f15l000709f15l000524f15l0023542
0.2
0.4
0.6
0.8
1.0
1.2
size
[mm
]
0
200
400
600
m15l152007
m15m
151110 s45c0905 s45c2318 s45c1230 s45c0046 s45c0313 s45c1238 s45c0505 s45c2216 s45c0701 s45c2312
f15l000945 g0
0k30 f15l000245 f15l000709 f15l000524 f15
l0023542
0
2
4
6
size
[mm
]
0
1000
2000
3000
m15l152007
m15m
151110 s45c0905 s45c2318 s45c1230 s45c0046 s45c0313 s45c1238 s45c0505
s45c2216s45c0701s45c2312
f15l000945 g00k3
0f15l000245f15l000709f15l000524
f15l0023542
0.1
0.2
0.3
0.4
0.5
size
[mm
]
0
100
200
300
400
m15l152007
m15m
151110 s45c0905 s45c2318 s45c1230 s45c0046 s45c0313 s45c1238 s45c0505 s45c2216 s45c0701 s45c2312
f15l000945 g
00k30 f15l000245 f15l000709 f15l000524 f1
5l0023542
2.5
3.0
3.5
4.0
4.5
5.0
size
[mm
]
0.0
0.2
0.4
0.6
m15l152007
m15m
151110 s45c0905 s45c2318 s45c1230 s45c0046 s45c0313 s45c1238 s45c0505 s45c2216 s45c0701 s45c2312
f15l000945
g00k30 f15l00024
5 f15l00070
9 f15l00052
4 f15l0023542
0
4
8
12
size
[mm
]
0
1
2
3
4
5
m15l152007
m15m
151110 s45c0905 s45c2318 s45c1230 s45c0046 s45c0313 s45c1238 s45c0505 s45c2216 s45c0701 s45c2312
f15l000945
g00k30
f15l000245
f15l000709
f15l000524
f15l0023542
0.6
0.6
0.6
0.7
0.7
0.8
size
[mm
]
0.0
0.4
0.8
1.2
1.6
m15l152007
m15m
151110s45c0905s45c2318s45c1230s45c0046s45c0313s45c1238s45c0505
s45c2216 s45c0701 s45c2312f15l000945 g00k3
0f15l000245f15l000709f15l000524f15l0023542
2
4
6
8
10
12
size
[mm
]
0.0
0.2
0.4
0.6
m15l152007
m15m
151110 s45c0905 s45c2318 s45c1230 s45c0046 s45c0313 s45c1238 s45c0505 s45c2216 s45c0701 s45c2312
f15l000945 g00k30
f15l000245 f15l000709 f15l000524 f15l0023542
0.0
0.2
0.4
0.6
0.8
size
[mm
]
0
10
20
30
40
50
m15l152007
m15m
151110 s45c0905 s45c2318 s45c1230 s45c0046 s45c0313 s45c1238 s45c0505 s45c2216 s45c0701 s45c2312
f15l000945 g00k30
f15l000245 f15l000709 f15l000524 f15l0023542
Amphipoda
Appendicularia Bivalvia larvae
Chaetognatha
Cladocera
Copepoda
copepod nauplii Decapoda larvae euphausiids
fish eggs
Gastropoda
Marmara
Med
iter
rane
an
Bla
ck S
ea
fish larvae
Fig. 4. Minimum, maximum and mean lengths, and abundances (number of individualsÆm)3) of specimens (Station code: e.g. F15L000709 means
that F15L00 is station code and 0709 is sampling time at 07:09 h; see Figs 1 and 2).
Zooplankton, nekton taxa and near-surface acoustic structure Mutlu
22 Marine Ecology 26 (2005) 17–32 ª 2005 Blackwell Publishing Ltd

3.5 and 12 mm, respectively. Lengths of appendicularian
species measured between 0.4 and 1.5 mm, with an abun-
dance of 75 to 250 indiv.Æm)3 in the Black Sea, between
0.5 and 4 mm (abundance: 25–580 indiv.Æm)3) in the Sea
of Marmara, and between 1.75 and 4.5 mm (abundance:
1–10 indiv.Æm)3) in the Mediterranean Sea. Shell dia-
meters of bivalve larvae varied between 0.15
and 0.375 mm (abundance: 10–300 indiv.Æm)3) in the
Sea of Marmara, and between 0.225 and 0.25 mm
(abundance: 5 indiv.Æm)3) in the Mediterranean Sea,
while no bivalves were found in the Black Sea.
Chaetognath lengths varied between 2.4 and 10 mm
(38–40 indiv.Æm)3), 2.5 and 15 mm (10–100 indiv.Æm)3),
and 2.5 and 25 mm (0.1–2 indiv.Æm)3) in the three seas.
The corresponding values for cladocerans were 0.3–0.45 mm
(5–10 indiv.Æm)3), 0.3–1.25 mm (5–600 indiv.Æm)3), and
0.45–0.9 mm (5–10 indiv.Æm)3), for copepod specimens
0.25–3.2 mm (400–500 indiv.Æm)3), 0.25–3 mm (40–2750
indiv.Æm)3), and 0.25–3.25 mm (10–40 indiv.Æm)3) (Fig. 4).
2. Acoustic characteristics
The enhanced echograms were very different among the
three seas. Clear changes in the plankton composition and
hydrography in these seas caused the differences in the
acoustic levels. The regions that were acoustically tracked
in this study (Fig. 5) were biologically very productive and
were associated with divergence zones due to upwelling.
Biological scattering was vertically distributed between the
surface and suboxic zone (here 120 m) in the Black Sea
(Fig. 5a), whereas it was confined to a narrow layer in a
range from the surface to the interface at 20 m formed
between waters of the Black Sea and Mediterranean Sea in
the Sea of Marmara (Fig. 5b). The Mediterranean Sea was
very different in terms of the volume backscattering due
to the absence of the shallow interface (Fig. 5c).
Acoustic scattering was layered in and above the suboxic
zone during the daytime in offshore waters of the Black
Sea, while it was aggregated in the mixed layer at night
hours. As the bottom depth was shoaled, the volume back-
scattering strength became homogeneous (Fig. 5a). In the
Sea of Marmara, the scattering was much intensified and
layered just above the interface during the daytime, whereas
it was homogeneously distributed within the mixed water
characterizing the Black Sea above the interface. During
daytime, the layer between interface and transducer depth
was deserted by the plankton. Aggregations by the scatter-
ers were observed just underneath the transducers
0.0
0.4
0.8
1.2
1.6si
ze [m
m]
size
[mm
]
0
5
10
15
20
25
m15l152007
m15m
151110 s45c0905 s45c2318 s45c1230 s45c0046 s45c0313 s45c1238 s45c0505 s45c2216 s45c0701 s45c2312
f15l000945 g00k30
f15l000245 f15l000709 f15l000524 f15l0023542
8
10
12
14
16
size
[mm
]
0.0
0.2
0.4
0.6
0.8
m15l152007
m15m
151110 s45c0905 s45c2318 s45c1230 s45c0046 s45c0313 s45c1238 s45c0505
s45c2216s45c0701s45c2312
f15l000945 g00k30
f15l000245 f15l000709 f15l000524 f15l0023542
0
2
4
6
8
size
[mm
]
0
10
20
30
40
50
m15l152007
m15m
151110
s45c0905 s45c2318 s45c1230 s45c0046 s45c0313 s45c1238 s45c0505 s45c2216 s45c0701 s45c2312
f15l000945
g00k30 f15l00024
5 f15l00070
9 f15l00052
4 f15l0023542
0
5
10
15
20
25
0
4
8
12
16
20
m15l152007
m15m
151110 s45c0905 s45c2318 s45c1230 s45c0046 s45c0313 s45c1238 s45c0505 s45c2216 s45c0701 s45c2312
f15l000945 g00k30
f15l000245 f15l000709 f15l000524
f15l0023542
0
1
2
3
4
5si
ze [m
m]
0.0
0.4
0.8
1.2
1.6
2.0
abun
danc
e [in
div.
·m–3
]
abun
danc
e [in
div.
·m–3
]ab
unda
nce
[indi
v.·m
–3]
abun
danc
e [in
div.
·m–3
]
abun
danc
e [in
div.
·m–3
]
m15l152007
m15m
151110
s45c0905 s45c2318 s45c1230 s45c0046 s45c0313 s45c1238 s45c0505 s45c2216 s45c0701 s45c2312
f15l000945
g00k30 f15l00024
5 f15l00070
9 f15l00052
4 f15l0023542
Ostracoda Pleurobrachia
Polychaeta
Salp Siphonophora
Fig. 4. Continued.
Mutlu Zooplankton, nekton taxa and near-surface acoustic structure
Marine Ecology 26 (2005) 17–32 ª 2005 Blackwell Publishing Ltd 23

(Fig. 5b). Moderately high scattering was observed in the
upper 100 m in the Mediterranean Sea at night, while the
scattering observed in the upper 60 m layer during the day
was less intense because vertical migratory species deserted
the upper layers (Fig. 5c).
3. Characteristics of model outputs
Taking the minimum Sv (dependent on the threshold
and detection limits of the frequencies) into calculation
of expected Sv, six taxa contributed mainly to the acous-
4 8 12 16 20 24
0
40
80
120
160
200
dept
h [m
]
17 18 19 20 21 22
10 12 14 16 18
0.00 0.05 0.10 0.15 0.20 0.25
44 45 46 47 48
17:42 02:19/10:57 20:50/17:45 00:36hM15L15 M15M15
12 14 16 18 20 22
0
40
80
120
160
200
dept
h [m
]
20 24 28 32 36 40
12 16 20 24 28 32
0.00 0.05 0.10 0.15 0.20 0.25
40 42 44 46
20:53 45C 05:53 07:17 12:41h
14 16 18 20 22 24
0
40
80
120
160
200
dept
h [m
]
dept
h [m
]
39 39 39 39 40
27 28 28 28 29 29
0.00 0.02 0.04 0.06 0.08 0.10
38 40 42 44 46
23:16 11:31/ 22:08 F15L15 10:47h
temperature
salinity
density
fluorescence
light transmission
L
D
S
T
F
L
S
D
D
L
S
T
T
F
F
(a)
(b)
(c)
020406080
100120140160180200
dept
h [m
]
020406080
100120140160180200
dept
h [m
]
200
406080
100120140160180200
Fig. 5. Enhanced echograms of sound scatterers around the study areas at 200 kHz in the Black Sea (a), at 120 kHz in the Sea of Marmara (b),
at 200 kHz in the Mediterranean Sea (c), and vertical profiles of the hydrography. T: temperature in �C; S: salinity; D: density in sigmatheta; F: fluor-
escence in Volts; L: light transmission in %.
Zooplankton, nekton taxa and near-surface acoustic structure Mutlu
24 Marine Ecology 26 (2005) 17–32 ª 2005 Blackwell Publishing Ltd

tic volume backscattering (AVBS) at 200 kHz as well as
four taxa at 120 kHz (Figs 6 and 7). Individually, none of
the taxa showed significant correlations between model
estimated Sv (MESV) and AVBS, whereas there was signi-
ficant correlation between total MESV and AVBS at
P < 0.05 (Figs 6 and 7). MESV and AVBS were higher in
the Sea of Marmara than those in both the Mediterranean
and Black Sea. Main contributors to the total AVBS at
120 kHz were Beroe, Aurelia and Chaetognatha in the Sea
of Marmara, and fish larvae in the Mediterranean Sea. No
taxon, however, was found to be a significant 120 kHz-
scatterer in the Black Sea. Principal scatterers at 200 kHz
in the Black Sea were copepods and chaetognaths in addi-
tion to others that contributed at 120 kHz. However,
other macrozooplanktonic gelatinous organisms, Mnemi-
opsis leidyi and Pleurobrachia pileus, salps, and non-
physonect siphonophores were not significant scatterers at
either frequency (Figs 4, 6 and 7). Other taxa were not
significant because their MVBS were less than the mini-
mum Sv of the echosounder and their sizes were less than
one-quarter of the wavelengths at both the frequencies.
Among the potential correlations between AVBS and
density (abundance and biomass) of significant scatterers
at 120 and 200 kHz, only chaetognaths showed significant
correlations. Since MVBS of Beroe and Aurelia were in
good agreement with AVBS, 200 kHz might be considered
the lowest frequency to use in studying mesozooplankton
acoustically because there were significant correlations
between total density and AVBS only for 200 kHz (Figs 8–
11). Clearly, this statement could change depending mainly
on material properties, abundance, and size of targets and
ambient noises in the water, which is an issue related to
Rayleigh versus geometric scattering.
Discussion
Acoustic records revealed that the depth limit for the ver-
tical distribution of zooplankton was confined to 100 m
Fig. 6. A comparison of estimated acoustic volume backscattering based on the individual size and abundance of individual taxa and the meas-
ured volume backscattering at each net location at 120 kHz. AVBS: acoustic volume backscattering; MESV: model estimated Sv; see Fig. 2 for
denotation of numbers. r ¼ correlation coefficient and bold means significant at P < 0.05, and number below r is average percent contribution
of taxa to total measured acoustic volume backscattering strength.
Mutlu Zooplankton, nekton taxa and near-surface acoustic structure
Marine Ecology 26 (2005) 17–32 ª 2005 Blackwell Publishing Ltd 25

in the Black Sea (Fig. 5a). This depth corresponds to the
upper end of the suboxic zone characterized with a depth
of sigmatheta ¼ 16.2 (Tugrul et al. 1992). The vertical
distribution of zooplankton was restricted to the zone
above the oxygen minimum (<0.5 mg O2 l)1; Tugrul et al.
1992), which depends on season, species, stages, and the
oxygen concentration in the water column (Vinogradov
et al. 1985; Mutlu 1999, 2001, 2003; Mutlu & Bingel
1999; Besiktepe & Unsal 2000; Besiktepe 2001). The verti-
cal distribution of zooplankton in the Sea of Marmara
was characterized as belonging to two ecosystems
(Fig. 5b). The first ecosystem ranged from the surface to
the interface between the Black Sea and the Mediterra-
nean Sea water masses (here at 20 m) and the second
from the interface to the bottom. The two-layer exchange
flow characteristic of the straits permits material transport
between the Black Sea and the Mediterranean Sea while
creating an unusual marine ecosystem in the transition
Fig. 7. A comparison of estimated acoustic volume backscattering based on the individual size and abundance of individual taxa and the meas-
ured volume backscattering at each net location at 200 kHz (see Fig. 6 for explanation).
Zooplankton, nekton taxa and near-surface acoustic structure Mutlu
26 Marine Ecology 26 (2005) 17–32 ª 2005 Blackwell Publishing Ltd

between them (Polat et al. 2000). Acoustic records
showed that there was no significant difference in the day
and night vertical distribution of biological scatterers
below the interface in contrast to the layer above the
interface. During the present study, at 12:30 h the layered
samples taken by the net revealed dead specimens
between 80 and 150 m and between 20 and 80 m. The
specimens were all alive above the interface. The water
column below the interface has not, however, been well
studied biologically. There was only one striking scatter-
ing layer between 40 and 80 m, where the light transmis-
sion dropped to 44%. The physical parameters appeared
to be homogeneous beneath the interface. A high abun-
dance of dead chaetognaths (length > 1.5 cm) and larger
calanoid copepod (length > 2 mm) predominated in the
layer between 80 and 150 m. Low numbers of small-sized
copepods, polychaete larvae, and cladocerans were present
between 20 and 80 m.
The Mediterranean Sea exhibited rather different
acoustic scatterings than the other two seas. Two plank-
ton concentration levels existed daily in the epipelagic of
the Mediterranean Sea. Plankton that ascended from deep
layer towards the surface at nighttime tended to reside at
night in a layer between 40 and 80 m, where the fluores-
cence peaked. Non-migrating plankton was distributed in
the upper 40 m, corresponding to the depth of the
thermocline (Fig. 5c). Andersen et al. (2001) showed that
some species of zooplankton ascended from the deep
layer towards the surface at night while others stayed in
the epipelagic zone during the day.
Taxon-specific model equations (Love 1971; Stanton
et al. 1994; Mutlu 1996; Monger et al. 1998) were used to
estimate the relative contribution of the animals to the
total acoustic energy at 120 and 200 kHz, as done by
Wiebe et al. (1996). Solving this forward problem and
comparing the result to in situ acoustic scattering meas-
urements can be used to test the robustness of the scatter-
ing models and to verify their use in field application
(Wiebe et al. 1996; Stanton et al. 1997). Figures 6 and 7
clearly show that the estimated volume backscattering
showed better correlation with the measured Sv and a lar-
ger contribution to the total energy at 200 kHz than those
at 120 kHz. The acoustic process is a complex function of
animal size, shape, orientation, and material properties as
Fig. 8. The relationship between volume backscattering (120 kHz) and abundance of taxonomic categories (see Fig. 2 for denotation of num-
bers). r ¼ correlation coefficient and bold means significant at P < 0.05.
Mutlu Zooplankton, nekton taxa and near-surface acoustic structure
Marine Ecology 26 (2005) 17–32 ª 2005 Blackwell Publishing Ltd 27

well as acoustic frequency or wavelength (Stanton & Chu
2000). The principal acoustic scatterers changed between
the different seas, as did the taxonomic composition, size,
abundance of targets, and background noise. In the Black
Sea, significant contributors to total AVBS were Beroe,
Aurelia, and Sagitta. Other ctenophores, however, espe-
cially Pleurobrachia, which occurred below the thermocline
in high numbers remained below the background noise.
Mutlu (2003) showed that Pleurobrachia pileus was mostly
found below 30 m, where no scattering above the noise
thresholds was observed. Although a high concentration
layer of the copepod C. euxinus was acoustically
discriminated previously in the Black Sea (Mutlu 2003), in
the present study copepods were not significant scatterers
because the sampling depth ranges did not cover the layer
except for a few large-sized copepods at station 2 in the
Black Sea. Copepods were not important scatterers in the
Sea of Marmara, although they were concentrated within
Fig. 9. The relationship between volume backscattering (200 kHz) and abundance of taxonomic categories (see Fig. 2 for denotation of num-
bers). r ¼ correlation coefficient and bold means significant at P < 0.05.
Zooplankton, nekton taxa and near-surface acoustic structure Mutlu
28 Marine Ecology 26 (2005) 17–32 ª 2005 Blackwell Publishing Ltd

the upper 20 m. The background noise and minimum Sv
was, however, very high at 21:00 h in the Sea of Marmara.
Korneliussen (2000) showed that the noise is inherently
frequency dependent and also depends on bottom depth.
The water mass interface during nighttime reflected echo
energy as much as the bottom did. Daytime Sv from the
interface was very low compared to that of the nighttime
because the biological scatterers around the interface
changed with time (Fig. 2b). This could have changed the
‘hardness’ of the interface, and thus the noise increased
due to the biological variations as Korneliussen (2000)
suggested for the bottom variations. The hardness of the
interface could be associated with the density of the jelly-
fish Aurelia aurita. Although jellyfish avoid capture by
net, according to Mutlu (1996) the swimming rhythms of
the observed organisms showed that they could be jelly-
fish (Fig. 12). A variation of about 10–15 dB (dependent
on the disc diameter of the jellyfish) and the occurrence
of a peak every 25–30 s due to swimming jellyfish were
observed in individual scatterers rising from the interface
(stations 6 and 7; Figs 2b and 12). In addition, Aurelia
individuals with disc diameters varying between 10 and
24 cm (captured by a scoop net) were observed in the
surface waters of the Sea of Marmara during the daytime.
Bioacoustical properties depended on taxa composition,
material properties, size of the scatterers, and minimum
threshold of the echosounders, all related with the fre-
quencies and with the physical and biological density of
the water. Wiebe et al. (1997) suggested that size and/or
taxa distribution of the zooplankton, and not the quantity
of biomass, was the critical determinant for differences in
the volume backscattering. The orientation of the scatter-
ers is also a critical determinant. Data on orientation were
not available for the present study. Stanton & Chu (2000)
showed that some acoustic predictions were more sensi-
tive to animal shape and orientation than others. Thus,
for elongated animals, the pattern of backscattering versus
angle of orientation at a fixed frequency is strongly
dependent upon shape. Recently, Benfield et al. (2000)
reported that the orientation distribution of freely
swimming copepods peaked at about 90� (i.e. the animal
body axis was vertical with the head up), with a standard
deviation of 30�. There was a discrepancy between the
predicted and observed regression. This offset could be
Fig. 10. The relationship between volume backscattering (120 kHz) and Nansen biomass (see Fig. 2 for denotation of numbers). r ¼ correlation
coefficient and bold means significant at P < 0.05.
Mutlu Zooplankton, nekton taxa and near-surface acoustic structure
Marine Ecology 26 (2005) 17–32 ª 2005 Blackwell Publishing Ltd 29

due to a combination of factors including system calibra-
tion, net avoidance (particularly for the macrozoogelati-
nous organisms at stations 6 and 7; Fig. 2b), accuracy of
acoustic models, accuracy of input parameters into the
models, and the failure of the frequencies to detect meso-
zooplankton. Stanton & Chu (2000) concluded that the
scattering predictions showed a very strong dependence
upon shape, orientation, and frequency for the euphau-
siids and copepods.
Summary
The three seas exhibited significant differences in overall
levels of acoustic volume backscattering; the Sea of
Marmara and the Black Sea had higher values than
the Mediterranean Sea. The acoustic patchiness struc-
ture differed among the seas due to a clear difference
in hydrographic peculiarities. Large-sized meso- and
macrozooplankton (jellyfish, chaetognaths, ctenophores)
Fig. 11. The relationship between volume backscattering (200 kHz) and Nansen biomass (see Fig. 2 for denotation of numbers). r ¼ correlation
coefficient and bold means significant at P < 0.05.
Zooplankton, nekton taxa and near-surface acoustic structure Mutlu
30 Marine Ecology 26 (2005) 17–32 ª 2005 Blackwell Publishing Ltd

contributed most to the total volume backscattering
strength.
Acknowledgements
This work was carried out as part of the project ‘Bio-optics
and development of regional algorithm for SeaWifs in the
Black Sea, the Sea of Marmara, Aegean Sea, and Eastern
Mediterranean’ funded by METU-AFP-99-06-01-01 linked
with other projects ‘Dynamics of the lower trophic levels of
the Black Sea: biochemical processes and system modeling’
by TUBITAK/TURKEY and ‘The Black Sea ecosystem
processes, prediction and operational data managements’
by NATO-SfP. I am indebted to Dr. Peter H. Wiebe for
his valuable comments and English correction of the text.
I thank the crew of R/V Bilim for assistance at sea.
References
Andersen V., Gubanova A., Nival P., Ruellet T. (2001)
Zooplankton community during the transition from spring
bloom to oligotrophy in the open NW Mediterranean and
effects of wind events. 2. Vertical distributions and
migrations. Journal of Plankton Research, 23 (3), 243–261.
Benfield M.C., Davis C.S., Gallager S.M. (2000) Estimating the
in situ orientation of Calanus finmarchicus on Georges Bank
using the Video Plankton Recorder. Plankton Biology and
Ecology, 47 (1), 69–72.
Besiktepe S. (2001) Diel vertical distribution, and herbivory of
copepods in the south-western part of the Black Sea. Journal
of Marine Systems, 28, 281–301.
Besiktepe B., Unsal M. (2000) Population structure, vertical
distribution and diel migration of Sagitta setosa (Chaetogna-
tha) in the south-western part of the Black Sea. Journal of
Plankton Research, 22 (4), 669–683.
David P.M., Guerin-Ancey O., Van Cuyck J.P. (1999) Acoustic
discrimination of two zooplankton species (mysid) at 38
and 120 kHz. Deep-Sea Research I, 46, 319–333.
Finenko G.A., Anninsky B.E., Romanova Z.A., Abolmasova
G.I., Kideys A.E. (2001) Chemical composition, respiration
and feeding rates of the new alien ctenophore, Beroe ovata,
in the Black Sea. Hydrobiologia, 451 (1–3), 177–186.
Foote K.G., Stanton T.K. (2000). Acoustical methods. In: R.
Harris, P. Wiebe, J. Lenz, H.R. Skjoldal, M. Huntley (Eds),
ICES Zooplankton Methodology Manual. Academic Press,
New York, 223–258.
Greene C.H., Wiebe P.H. (1990) Bioacoustical oceanography:
new tools for zooplankton and micronekton research in the
1990s. Oceanography, 3, 12–17.
Korneliussen R.J. (2000) Measurement and removal of echo
integration noise. ICES Journal of Marine Science, 57 (4),
1204–1217.
Love R.H. (1971) Dorsal-aspect target strength of an individual
fish. The Journal of the Acoustical Society of America, 49,
816–823.
Monger B.C., Chinna-Chandy S., Meir E., Billings S., Greene
C.H., Wiebe P.H. (1998) Sound scattering gelatinous zoo-
plankters Aequorea victoria and Pleurobrachia bachei. Deep-
Sea Research II, 45, 1255–1271.
Mutlu E. (1996) Target strength of the common jellyfish
(Aurelia aurita): a preliminary experimental study with a
dual-beam acoustic system. ICES Journal of Marine Science,
53, 309–311.
Mutlu E. (1999) Distribution and abundance of ctenophores
and their zooplankton food in the Black Sea. II. Mnemiopsis
leidyi. Marine Biology, 135 (4), 603–613.
Mutlu E. (2001) Distribution and abundance of moon jellyfish
(Aurelia aurita) and its zooplankton food in the Black Sea.
Marine Biology, 138 (2), 329–339.
Mutlu E. (2003) Acoustical identification of the concentration
layer of a copepod species, Calanus euxinus. Marine Biology,
142, 517–523.
0 10 20 30 40 50 60
–50
–55
–60
–65
–70
–75
Sv
[dB
]
time [s]
(b)
(a)
–70
–68
–66
–64
–62
–60
–58
–56
–54
–52
–500 10 20 30 40 50 60 70 80 90 100
110
120
130
140
150
160
170
180
190
200
210
220
230
time [s]
TS
[d
B]
Fig. 12. Comparison of swimming rhythm of Aurelia aurita (Mutlu
1996) with that obtained from the scatterers arising from the inter-
face in the Sea of Marmara (a, b). Thin black line, variation of TS due
to the swimming behavior of A. aurita; thick black line, the variation
averaged over 5 s (Mutlu 1996); variation of Sv of the individual scat-
terers observed for long time (a; gray line, station 6; dashed black
line, station 7; see Fig. 2b) and short-time duration of individuals
below the transducers (b, each line denotes different individual at sta-
tion 6). All acoustical data were at 120 kHz.
Mutlu Zooplankton, nekton taxa and near-surface acoustic structure
Marine Ecology 26 (2005) 17–32 ª 2005 Blackwell Publishing Ltd 31

Mutlu E., Bingel F. (1999) Distribution and abundance of
ctenophores and their zooplankton food in the Black Sea. I.
Pleurobrachia pileus. Marine Biology, 135 (4), 589–601.
Polat S.C., Tugrul S., Basturk O., Salihoglu I. (2000) Oceano-
graphy of the Marmara Sea: biochemical features. Report of
International Conference on Oceanography of the Eastern
Mediterranean and Black Sea. Similarities and differences of
two interconnected basins. European Communities,
Belgium, EUR 19302, 126.
Ressler P.H. (2002) Acoustic backscatter measurements with a
153 kHz ADCP in the northeastern Gulf of Mexico:
determination of dominant zooplankton and micronekton
scatterers. Deep-Sea Research I, 49 (11), 2035–2051.
Shmeleva A.A. (1965) Weight characteristics of the zooplank-
ton of the Adriatic Sea. Bulletin Institut Oceanographique,
Monaco, 65 (1351), 24.
Simmonds E.J., Williamson N.J., Gerlotto G., Aglen S. (1992)
Acoustic Survey Design and Analysis Procedure: A Compre-
hensive Review of Current Practice. ICES, Copenhagen,
Denmark. ICES Cooperative Research Report 187, 127 pp.
Stanton T.K., Chu D. (2000) Review and recommendations for
the modeling of acoustic scattering by fluid-like elongated
zooplankton: euphausiids and copepods. ICES Journal of
Marine Science, 57, 793–807.
Stanton T.K., Chu D., Wiebe P.H. (1996) Acoustic scattering
characteristics of several zooplankton groups. ICES Journal
of Marine Science, 53, 289–295.
Stanton T.K., Chu D., Wiebe P.H. (1998a) Sound scattering by
several zooplankton. II. Scattering models. The Journal of the
Acoustical Society of America, 103, 236–253.
Stanton T.K., Chu D., Wiebe P.H., Martin L.V., Eastwood R.L.
(1998b) Sound scattering by several zooplankton. I.
Experimental determination of dominant scattering
mechanisms. The Journal of the Acoustical Society of America,
103, 225–235.
Stanton T.K., Nash R.D.M., Eastwood R.L., Nero R.W. (1997)
A field examination of acoustical scattering from marine
organisms at 70 kHz. IEEE Journal of Oceanic Engineering,
12, 339–348.
Stanton T.K., Wiebe P.H., Chu D., Benfield M.C., Scanlon L.,
Martin L., Eastwood R.L. (1994) On acoustic estimates of
zooplankton biomass. ICES Journal of Marine Science, 51,
505–512.
Tugrul D., Basturk O., Saydam C., Yilmaz A. (1992) Changes
in the hydrochemistry of the Black Sea inferred from the
water density profiles. Nature, 359, 137–139.
Vinogradov M.Ye., Flint M.V., Shushkina E.A. (1985) Vertical
distribution of mesoplankton in the open area of the Black
Sea. Marine Biology, 89, 95–107.
Wiebe P.H., Mountain D.G., Stanton T.K., Greene C.H.,
Lough G., Kaartvedt S., Dawson J., Copley N. (1996) Acous-
tical study of the spatial distribution of plankton on Georges
Bank and the relationship between volume backscattering
strength and the taxonomic composition of the plankton.
Deep-Sea Research II, 43, 1971–2001.
Wiebe P.H., Stanton T.K., Benfield M.C., Mountain D.G.,
Greene C.H. (1997) High frequency acoustic volume back-
scattering in the Georges Bank coastal region and its inter-
pretation using scattering models. IEEE Journal of Oceanic
Engineering, 22, 445–464.
Zooplankton, nekton taxa and near-surface acoustic structure Mutlu
32 Marine Ecology 26 (2005) 17–32 ª 2005 Blackwell Publishing Ltd