A Comparison of School Effectiveness Factors for Socially Advantaged and Disadvantaged Students in...
36
61 O ver the last decades, Educational Effectiveness Research (EER) has made considerable achievements in terms of identifying the school characteristics that are consistently associated with academic achievement (Murillo et al., 2007). Nowadays it is difficult to find public pol- icy aiming at improving the quality of education that is not impregnated by the knowledge generated by EER (Sandoval-Hernandez, 2010). However, EER has also received important criticisms that have fuelled a prolific debate about its boundaries and potentials. One of them concerns the implicit claim of the EER movement that implies a general applicability of its models. Critics have argued that, while purporting to be inclusive and comprehensive, EER models oſten exclude the needs of children from disad- vantaged backgrounds (Slee et al., 1998). As rupp (1999) puts it, dominant groups establish diagnostics about how schools should be according to their own cultural references, but these diagnoses might not apply to all societal groups. Students from socially disadvantaged families live and study in dif- ferent contexts, and therefore it can be assumed that they have specific and different educational needs than their more socially advantaged peers. In this sense, the use of EER models without explicitly taking into consideration the specific needs of socially disadvantaged children could lead to the reproduc- tion of educational inequalities. In order to contribute to this debate, we selected a recently developed EER theoretical model (the one proposed by Martin et al., 2013) and test- ed it with two samples: one of socially disadvantaged students, and one of non-disadvantaged students. We used data from the latest cycle of the IEA’s Trends in International Mathematics and Science Study (TIMSS 2011) to op- erationalize our selected EER model. en, we divided the TIMSS 2011 sam- A Comparison of School Effectiveness Factors for Socially Advantaged and Disadvantaged Students in ten European Countries in TIMSS 2011 Andrés Sandoval-Hernández, Alba Castejón and Parisa Aghakasiri
Transcript of A Comparison of School Effectiveness Factors for Socially Advantaged and Disadvantaged Students in...

61
Over the last decades, Educational Effectiveness Research (EER) has made considerable achievements in terms of identifying the school characteristics that are consistently associated with academic
achievement (Murillo et al., 2007). Nowadays it is difficult to find public pol-icy aiming at improving the quality of education that is not impregnated by the knowledge generated by EER (Sandoval-Hernandez, 2010).
However, EER has also received important criticisms that have fuelled a prolific debate about its boundaries and potentials. One of them concerns the implicit claim of the EER movement that implies a general applicability of its models. Critics have argued that, while purporting to be inclusive and comprehensive, EER models often exclude the needs of children from disad-vantaged backgrounds (Slee et al., 1998). As Thrupp (1999) puts it, dominant groups establish diagnostics about how schools should be according to their own cultural references, but these diagnoses might not apply to all societal groups. Students from socially disadvantaged families live and study in dif-ferent contexts, and therefore it can be assumed that they have specific and different educational needs than their more socially advantaged peers. In this sense, the use of EER models without explicitly taking into consideration the specific needs of socially disadvantaged children could lead to the reproduc-tion of educational inequalities.
In order to contribute to this debate, we selected a recently developed EER theoretical model (the one proposed by Martin et al., 2013) and test-ed it with two samples: one of socially disadvantaged students, and one of non-disadvantaged students. We used data from the latest cycle of the IEA’s Trends in International Mathematics and Science Study (TIMSS 2011) to op-erationalize our selected EER model. Then, we divided the TIMSS 2011 sam-
A Comparison of School Effectiveness Factors for Socially Advantaged and Disadvantaged
Students in ten European Countries in TIMSS 2011
Andrés Sandoval-Hernández, Alba Castejón and Parisa Aghakasiri

š ol s ko p olj e , l e t n i k x x v, š t e v i l k a 3 –4
62
ple of the analysed countries into disadvantaged and non-disadvantaged students, and finally, we used two-level regression models to test the mod-el with the two samples.
Along these lines, our main research question is: Does our selected EER theoretical model fit the sample of non-disadvantaged students bet-ter than the sample of disadvantaged ones? A positive answer to our re-search question would to provide evidence to support the claims that EER models often do not take into account the needs of children from disad-vantaged backgrounds (Slee et al., 1998). In turn, this would mean that such generic EER models should not be used to inform policies aimed at improving educational outcomes of all groups of students, particular-ly those of socially disadvantaged students. If, in contrast, we do not find differences in the fit of our selected model to the two samples, our results would provide evidence to support the general applicability of the mod-el we are testing.
In more specific terms, we have two objectives: First, to identify pos-sible differences in how well the model developed by Martin, et al. (2013) fits the data of the two groups of students (i.e., socially advantaged and so-cially disadvantaged); and second, to identify those school effectiveness factors that are more consistently associated with one group or the other.
The paper is organized in four main sections. In the first section, we present our theoretical framework, which in turn is divided into two sub-sections: a review of the main phases and findings of the EER in gen-eral; and a more detailed review focused on the findings of EER in so-cially disadvantaged contexts. Then, in the Methods section, we describe the data used for our analyses, the variables and procedures used to oper-ationalize our adopted EER model, and the specification of the multilev-el models we used for addressing our research question. The next section corresponds to the results that are presented first in a country-by-country fashion and then in a summarized way. Finally, we discuss the implication and limitations of our findings.
Theoretical FrameworkThe relationship between socioeconomic status (SES) and academic out-comes is well established in the literature. A wide range of international studies have analysed this relationship and its consequences. As early as 1966, the Coleman Report concluded that family SES, not the school’s, was the major determinant of student achievement (Coleman et al., 1966). Although a large amount of later studies have supported this finding (e.g. Blanden and Gregg, 2004; Caro, McDonald and Willms, 2009; Dupriez and Dumay, 2006; Gorard and Smith, 2004; Field, Kuczera and Pont,

a. sandoval-hernández, a. castejón and parisa aghakasiri ■ a comparison of school effectiveness .. .
63
2007; OECD, 2007; 2010; 2011; Sirin, 2005; Tieben and Wolbers, 2010), researchers have not been discouraged from providing evidence that schools matter too. Research aiming at identifying school factors that can explain differences in academic achievement (regardless of the socioeco-nomic background of the students) has been undertaken for nearly fif-ty years. During this time, the body of research currently known as Edu-cational Effectiveness Research (EER) has been dominant (Miles, 2005; Murillo, 2007).
Educational Efectiveness Research: Schools do MatterEducational effectiveness research has achieved much in terms of identi-fying a set of factors consistently associated with academic achievement (Murillo et al., 2007). According to a recently published state-of-the-art review, EER has been through several phases since its beginning (Reyn-olds et al., 2014). In this work we identify four of them.
The first phase developed as a reaction to the Coleman Report (Coleman et al., 1966) and the early works supporting its main conclu-sions (see for example Jencks et al., 1972). This phase was characterized by empirical studies providing lists of effective school factors. Some ex-amples of the most prominent works produced during this phase are the ones by Edmonds (1979), Rutter et al. (1979), and Mortimore et al. (1988). Although there is some variation from researcher to researcher, accord-ing to Marzano (2003), a list of five school level factors associated with the school effectiveness movement of the 1970’s is as follows:• strong administrative leadership,• an emphasis on basic skill acquisition,• high expectations for student achievement,• a safe and orderly atmosphere conducive to learning, and• frequent monitoring of student progress.
The second phase started in the mid 80’s and is marked by the emer-gence of multilevel models (Goldstein, 1987; Raudenbush and Bryk, 1986). The use of more sophisticated analytical techniques allowed for the study of the scientific properties of the identified school effects. As Newton and Llosa (2010) point out, some of the main advantages of these techniques are: • Improved estimation of effects. HLM provides correct stand-
ard errors of regression coefficients in the presence of cluster-ing (e.g., students nested into classrooms, classrooms nested into schools).
• Allows for testing cross-level effects. HLM allows a greater range of questions. For example how schools’ effects influence achievement
š ol s ko p olj e , l e t n i k x x v, š t e v i l k a 3 –4
64
in different groups of students (e.g., students with low and high so-cioeconomic background).
• Partitioning of variance components. HLM allows answering ques-tions like: How much of the variability in student achievement is at-tributable to school characteristics and how much to student char-acteristics?During the third phase (mid 90’s) the objective of most EER works
shifted from identifying effectiveness factors to explaining why these fac-tors made a difference. It is in this phase where the first integrated mod-els of educational effectiveness were developed, some examples are those by Creemers (1994), Stringfield & Slavin (1992), and Scheerens (1997). In these models, the relationships among the previously identified school and teacher effectiveness factors were made explicit. Furthermore, these models are characterized by having a multilevel structure, where schools are nested in contexts, classrooms are nested in schools, and students are nested in classrooms or teachers. Furthermore, these models discern be-tween levels in education; where higher levels are supposed to provide con-ditions for lower levels, and the educational outcomes are induced by the combined effects of levels (Creemers and Scheerens, 1994).
The fourth phase, which began between the late 90’s and ear-ly 2000’s, is marked by two main features: the focus on dynamic rather than static sets of relationships, and the internationalization of the field, which allowed bringing together not only research traditions from differ-ent countries but also from different fields (e.g. the merge of the school ef-fectiveness and school improvement traditions- see Reynolds et al., 1996). One prominent example of the current dynamic approach of EER is the work developed by Creemers & Kyriakides (2006; 2010; 2008; 2008). Re-garding the internationalization of the field, the arrival of comparative large-scale assessments (LSA) in education like the International Associ-ation for the Evaluation of Educational Achievement (IEA) Trends in In-ternational Mathematics and Science Study, and the OECD’s Programme for International Student Assessment, made it possible to apply the frame-works and methods developed by EER to a broad number of countries with little effort. The public access to this kind of data, contributed to in-creasing the number of studies. A broad array of information about the education systems of many countries around the world was reachable by only a few ‘clicks’.
The use of secondary sources of information has, however, some sig-nificant disadvantages. Although the information from LSA can be ac-cessed from any computer in the world, the variables included in their da-tasets do not always match the effectiveness factors contained in the EER

a. sandoval-hernández, a. castejón and parisa aghakasiri ■ a comparison of school effectiveness .. .
65
models. Therefore, operationalization of these models with proxy varia-bles became a common denominator of international comparative stud-ies. An early example of work developed in this area is the report written by Martin and his colleagues, in which they identify effective schools in 39 countries using data from TIMSS 1995 (Martin et al., 2000). In this work, the authors identified several groups of characteristics of high achieving schools, for example, school size and location, school social climate, and instructional activities in Science or Mathematics classes. The report pro-duced by the OECD using data from PISA 2000 can be another good ex-ample (OECD, 2005). Some of the factors identified as being strongly re-lated to student achievement in the PISA report were: the socio-economic composition of schools, early selection or tracking of students, school au-tonomy. After these first works, there have been many other attempts at operationalizing the models developed by EER with LSA data not only with TIMSS and PISA, but also with other regional LSA’s like the IEA’s Progress in International Reading Literacy Study (Kyriakides, 2006) and the International Civic and Citizenship Education Study (Isac et al., 2014), the UNESCO’s Second Regional Comparative and Explanatory Study in Latin America and the Caribbean (Cervini, 2012), or the study of the Southern and Eastern Africa Consortium for Monitoring Educa-tional Quality (Lee et al., 2005).
Our Analytical Model
Table 1. Analytical model
Variables
Scho
ol
Envi
ronm
ent School is Safe and Orderly
School Support for Academic Success
Adequate Physical Resources
Scho
ol
Inst
ruc-
tion
Early curricular emphasis on higher order reading processes
Students Engaged in Math Lessons
Hom
e Ba
ckgr
o-un
d
Home Resources for Learning
Could Accomplish Early Literacy/Numeracy Tasks When Entered School
Source: Adapted from Martin et al. (2013)
All the studies mentioned above have strengths and weaknesses, but after a careful evaluation of the different options, we decided to use the model

š ol s ko p olj e , l e t n i k x x v, š t e v i l k a 3 –4
66
developed by Martin and his colleagues (Martin et al., 2013) to frame the analysis of this paper. We selected this model because it is deeply rooted in both the literature of EER and the TIMSS 2011 and PIRLS 2011 Con-textual Frameworks (Mullis et al., 2009a; Mullis et al., 2009b). Further-more, the model has already been operationalized by its authors with var-iables from TIMSS and PIRLS 2011 and tested with data gathered from the 34 countries and 3 benchmarking entities that conducted both studies with the same fourth grade students (op. cit.). A summary of the model is presented in Table 1; the details of the variables used for its operationali-zation are presented in the Methods section of this paper.
Effectiveness Conditions in Challenging Contexts: Academic Success in Socioeconomically Disadvantaged SchoolsStudents from socially disadvantaged families tend to perform worse at school than their socially advantaged peers. Although the negative associ-ation between socioeconomic status and academic achievement has been extensively documented by educational research (e.g. Caro, McDonald and Willms, 2009; (Coleman et al., 1966); Sirin, 2005), there is also evi-dence against this strict deterministic conclusion: in some countries, the gap between students from disadvantaged families and their more advan-taged peers is lower than in other countries (e.g. Vandenberghe, Dupriez, and Zachary, 2001; OECD, 2011).
Within the literature of EER, some works have addressed the ques-tion of what conditions and school factors can improve the academic achievement of students living in socioeconomically disadvantaged con-texts. In this section, we review a set of school characteristics that have been identified by such studies. Many of the factors identified here are not incorporated in our analytical model; however, they will contribute to ex-pand the framework for discussing our results. Also, as can be noticed, many of these effectiveness factors are not exclusive to schools working in challenging conditions, but are rather similar to those identified by the general models of EER. This is one of the main criticisms posed against the EER focused on disadvantaged contexts, and it is also one of our main motivations to test the same model of school effectiveness in samples of disadvantaged and non-disadvantaged students.
Teaching and learning focus: According to Muijs et al. (2004) effec-tive schools in deprived areas have a clear focus on the curriculum, which is structured, integrated across grades and subjects, and connected to re-al-life experience. It is important to point out that some authors report that effective teaching in disadvantaged schools is especially demanding (Mor-timore, 1991). However, there is no consensus on whether the curriculum
a. sandoval-hernández, a. castejón and parisa aghakasiri ■ a comparison of school effectiveness .. .
67
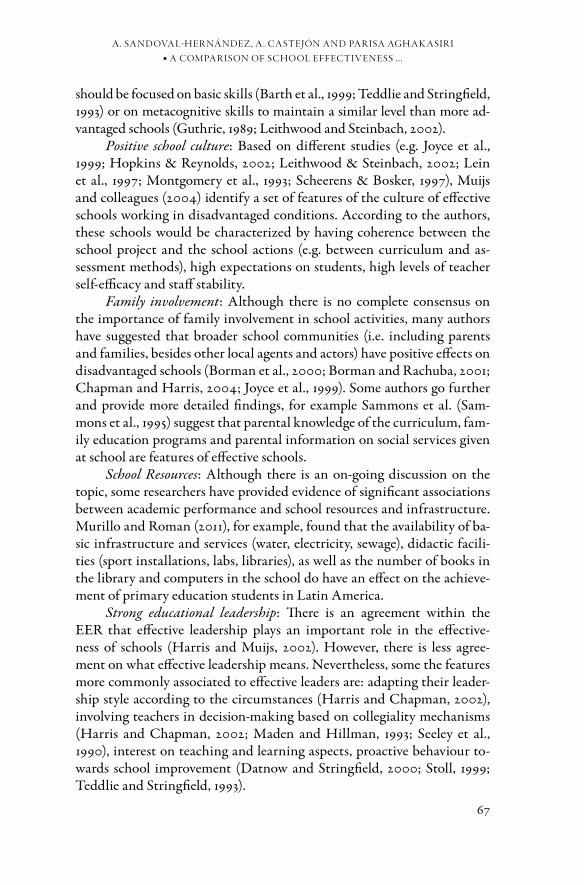
should be focused on basic skills (Barth et al., 1999; Teddlie and Stringfield, 1993) or on metacognitive skills to maintain a similar level than more ad-vantaged schools (Guthrie, 1989; Leithwood and Steinbach, 2002).
Positive school culture: Based on different studies (e.g. Joyce et al., 1999; Hopkins & Reynolds, 2002; Leithwood & Steinbach, 2002; Lein et al., 1997; Montgomery et al., 1993; Scheerens & Bosker, 1997), Muijs and colleagues (2004) identify a set of features of the culture of effective schools working in disadvantaged conditions. According to the authors, these schools would be characterized by having coherence between the school project and the school actions (e.g. between curriculum and as-sessment methods), high expectations on students, high levels of teacher self-efficacy and staff stability.
Family involvement: Although there is no complete consensus on the importance of family involvement in school activities, many authors have suggested that broader school communities (i.e. including parents and families, besides other local agents and actors) have positive effects on disadvantaged schools (Borman et al., 2000; Borman and Rachuba, 2001; Chapman and Harris, 2004; Joyce et al., 1999). Some authors go further and provide more detailed findings, for example Sammons et al. (Sam-mons et al., 1995) suggest that parental knowledge of the curriculum, fam-ily education programs and parental information on social services given at school are features of effective schools.
School Resources: Although there is an on-going discussion on the topic, some researchers have provided evidence of significant associations between academic performance and school resources and infrastructure. Murillo and Roman (2011), for example, found that the availability of ba-sic infrastructure and services (water, electricity, sewage), didactic facili-ties (sport installations, labs, libraries), as well as the number of books in the library and computers in the school do have an effect on the achieve-ment of primary education students in Latin America.
Strong educational leadership: There is an agreement within the EER that effective leadership plays an important role in the effective-ness of schools (Harris and Muijs, 2002). However, there is less agree-ment on what effective leadership means. Nevertheless, some the features more commonly associated to effective leaders are: adapting their leader-ship style according to the circumstances (Harris and Chapman, 2002), involving teachers in decision-making based on collegiality mechanisms (Harris and Chapman, 2002; Maden and Hillman, 1993; Seeley et al., 1990), interest on teaching and learning aspects, proactive behaviour to-wards school improvement (Datnow and Stringfield, 2000; Stoll, 1999; Teddlie and Stringfield, 1993).

š ol s ko p olj e , l e t n i k x x v, š t e v i l k a 3 –4
68
Collecting and using information on organizational and professional learning in schools: Authors like Chapman and Harris (2004) and Muijs et al. (2004) suggest that effective schools in disadvantaged environments seek to become learning communities, where professional development is a core pillar of the school culture. This learning is not thought of as some-thing in the short-term, but as a long-term improvement (Hopkins, 2001; Muijs et al., 2004).Other authors add that learning communities also fa-cilitate knowledge through the exchange of ideas by providing teachers with places to meet and talk to each other (Louis and Kruse, 1995). Gath-ering data and work through evidence-based decisions is also seen as an important feature of effective schools in disadvantaged contexts (Muijs et al., 2004).
External support: sharing experiences and good practices with other schools are considered to be an effective way to improve educational out-comes of disadvantaged schools. Chapman and Harris (2004), for exam-ple, consider that external support from education authorities is neces-sary to create the optimal conditions to enhance academic achievement in challenging contexts. Mourshed et al. conclude in the Mckinsey Report 2010 that “This mediating layer sustains improvement by providing three things of importance to the system: targeted hands-on support to schools, a buffer between the school and the centre, and a channel to share and in-tegrate improvements across schools” (2010, pp. 22).
MethodsDataThe data for this paper was sourced from the Trends in International Math-ematics and Science Study (TIMSS) 2011 conducted by the Internation-al Association for the Evaluation of Educational Achievement (IEA). TIMSS 2011 is the fifth in IEA’s series of international assessments of stu-dent achievement dedicated to improving teaching and learning in mathe-matics and science. The target population of TIMSS 2011 was the students at the end of 4th and 8th grades in 63 countries and 14 benchmarking en-tities (regional jurisdictions of countries such as states). In addition to as-sessing mathematics and science achievement, TIMSS also collects back-ground information from students, teachers and principals of participating schools (Mullis et al., 2012). For this study, we have limited our analysis to mathematics achievement of 4th grade students in 10 European countries, which participated in TIMSS&PIRLS 2011: Austria, Finland, Germany, Ireland, Italy, Norway, Portugal, Slovenia, Spain, and Sweden.
We split the sample of each country into two groups: disadvantaged and non-disadvantaged students. In order to do this, we used the scale

a. sandoval-hernández, a. castejón and parisa aghakasiri ■ a comparison of school effectiveness .. .
69
called Home Resources for Learning (HRL)1. Consistent with the liter-ature (see for example OECD, 2011), we categorized as “disadvantaged” those students who score at or below the 30th percentile of the HRL scale within each country, and as “non-disadvantaged” those who score above the 30th percentile. The rationale for using an internationally standard-ized measure as the HRL scale (as opposed to a measure that varies across countries) is that disadvantage can then be easily defined in a comparable fashion across countries.
It is also important to note that the starting assumption of our pa-per is that educational effectiveness models often are or have been built without considering the needs and circumstances of socially disadvan-taged students. Hence, we are interested in comparing the model fit for the group of disadvantaged students vs. the model fit for the rest of the students (i.e., non-disadvantaged). For this reason, one group (disadvan-taged students) includes 30%, and the other (non-disadvantaged students) 70% of the total sample.
All the subsequent analyses were carried out in both samples and for each country separately. Table 2 shows the sample size and the vari-ance decomposition for mathematics achievement for each group with-in each country.
Table 2. Sample Size
Country Students n
Schools n
AustriaDisadvantaged 652 121Non-disadvantaged 3,636 158
FinlandDisadvantaged 189 88Non-disadvantaged 4,126 145
GermanyDisadvantaged 398 152Non-disadvantaged 2,547 197
IrelandDisadvantaged 512 118Non-disadvantaged 3,593 150
ItalyDisadvantaged 1,166 192Non-disadvantaged 2,606 201
NorwayDisadvantaged 112 56Non-disadvantaged 2,647 118
PortugalDisadvantaged 1,033 134Non-disadvantaged 2,736 145
SloveniaDisadvantaged 581 174Non-disadvantaged 3,687 195
1 See the Measures section for more information on how scales were constructed.

š ol s ko p olj e , l e t n i k x x v, š t e v i l k a 3 –4
70
Country Students n
Schools n
SpainDisadvantaged 730 130Non-disadvantaged 2,980 150
SwedenDisadvantaged 301 88Non-disadvantaged 3,508 152
MeasuresThe independent variable is mathematics achievement in TIMSS 2011. Achievement results from TIMSS are reported on a scale constructed through Item Response Theory (IRT) methods; this scale has a mean of 500 and a standard deviation of 100. As the test booklet completed by each student contained only a subset of the items from the whole assess-ment item pool, five plausible mathematics scores based on responses of students to the corresponding booklet are included in the TIMSS data-base. The five plausible values are used simultaneously in all the analysis to account for imputation uncertainty.
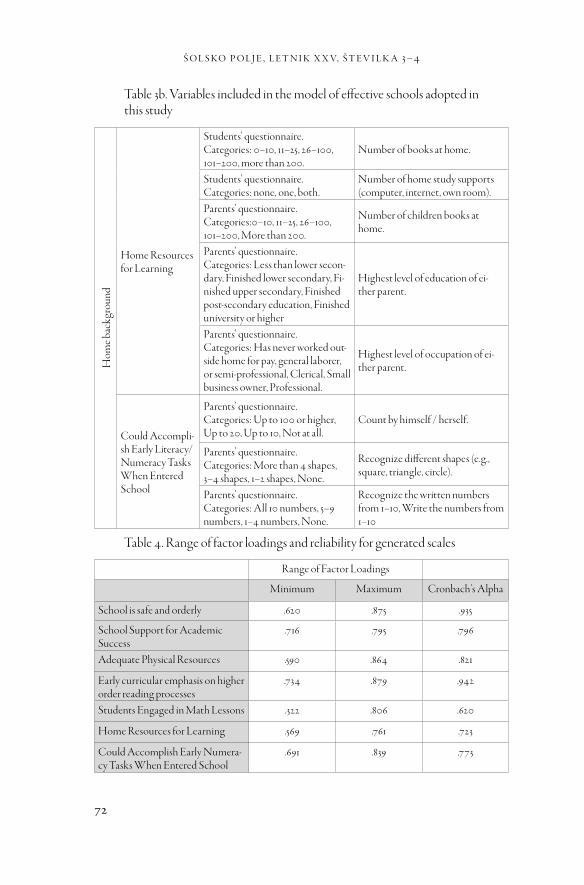
The explanatory variables used in the analysis reflect the conceptual model adopted for this work (i.e., Martin et al., 2013). We created a scale for each theoretical concept included in the model. Tables 3a and 3b show a brief description of the theoretical concepts (scales) of the model and the variables composing each of them.
Each of the scales was calculated through Principal Component Analysis (PCA), using the data of the 10 countries, each country contrib-uting the same. Put more formally, each scale score for each student is a weighted average of the items composing each theoretical concept. For ex-ample, the HRL score for each student is a weighted average of the HRL items:
HRLi = α 1 books_at_home + α 2 home_ posessions + α 3 children_books + α 4 parental_education + α 5 parental_occupation
We calculated item weights by applying PCA to the complete sample of countries. We then use the weights, α’s, in the equation above to calcu-late HRL scores for each student.
We used Cronbach’s alpha coefficient to examine the consistency of the items in the different scales. The Cronbach’s alpha coefficients and the respective range of factor loadings for each scale are presented in Table 4. Cronbach’s alpha values ranged from 0.62 (for the scale of students en-gaged in math) to 0.942 (for the scale of early curricular emphasis on high-er order reading process), which indicated fairly satisfactory reliability. We used the procedure proposed by Caro and Cortes (2012) for both, con-structing the scales and examining their consistency.

a. sandoval-hernández, a. castejón and parisa aghakasiri ■ a comparison of school effectiveness .. .
71
Table 3a. Variables included in the model of effective schools adopted in this study
Scale / Concept Source and response categories Items
Scho
ol E
nviro
nmen
t
School is Safe and Orderly
Principals’ questionnaire. Categori-es: hardly any problems, minor pro-blems, moderate problems.
Students arriving late at school, Student absenteeism, Classroom disturbances, Cheating, Profani-ty, Vandalism, Theft, Intimidati-on among students, Physical fights among students, Intimidation of te-achers or staff.
School Support for Academic Su-ccess
Principals’ questionnaire.Categories: Very high, High, Medi-um, Low, Very low.
Teachers’ understanding of the cur-ricular goals, Teachers’ degree of su-ccess in implementing the school’s curriculum, Teachers’ expectati-on for student achievement, Pa-rental support for student achieve-ment, Students’ desire to do well in school.
Adequate Physi-cal Resources
Principals’ questionnaire.Categories: Not at all, A little, Some, a lot.
School’s capacity to provide in-struction affected by a shortage of the following: Teachers with a spe-cialization in mathematics; softwa-re; Library materials; Audio-visual resources; calculators
Scho
ol In
stru
ctio
n
Early curricular emphasis on hig-her order reading processes
Principals’ questionnaire.Categories: First grade or earlier, Second grade, Third grade, Fourth grade, not in these grades.
At which grade do the following re-ading skills and strategies first rece-ive a major emphasis in instruction in your school?: Locating informa-tion, Identifying the main idea, Un-derstanding, Comparisons with personal experience, Comparing different texts, Making predictions about what will happen next, Ge-neralizing, Describing the style of a text, Determining the author’s per-spective.
Students Enga-ged in Math Les-sons
Students’ questionnaire.Categories: Agree a lot, Agree a lit-tle, Disagree a little. Disagree a lot.
I know what my teacher expects me to do, I think of things not related to the lesson, My teacher is easy to understand, I am interested in what my teacher says, My teacher gives me interesting things to do.
š ol s ko p olj e , l e t n i k x x v, š t e v i l k a 3 –4
72
Table 3b. Variables included in the model of effective schools adopted in this study
Hom
e bac
kgro
und
Home Resources for Learning
Students’ questionnaire.Categories: 0–10, 11–25, 26–100, 101–200, more than 200.
Number of books at home.
Students’ questionnaire.Categories: none, one, both.
Number of home study supports (computer, internet, own room).
Parents’ questionnaire.Categories:0–10, 11–25, 26–100, 101–200, More than 200.
Number of children books at home.
Parents’ questionnaire.Categories: Less than lower secon-dary, Finished lower secondary, Fi-nished upper secondary, Finished post-secondary education, Finished university or higher
Highest level of education of ei-ther parent.
Parents’ questionnaire.Categories: Has never worked out-side home for pay, general laborer, or semi-professional, Clerical, Small business owner, Professional.
Highest level of occupation of ei-ther parent.
Could Accompli-sh Early Literacy/Numeracy Tasks When Entered School
Parents’ questionnaire.Categories: Up to 100 or higher, Up to 20, Up to 10, Not at all.
Count by himself / herself.
Parents’ questionnaire.Categories: More than 4 shapes, 3–4 shapes, 1–2 shapes, None.
Recognize different shapes (e.g., square, triangle, circle).
Parents’ questionnaire.Categories: All 10 numbers, 5–9 numbers, 1–4 numbers, None.
Recognize the written numbers from 1–10, Write the numbers from 1–10
Table 4. Range of factor loadings and reliability for generated scales
Range of Factor Loadings
Minimum Maximum Cronbach's Alpha
School is safe and orderly .620 .875 .935
School Support for Academic Success
.716 .795 .796
Adequate Physical Resources .590 .864 .821
Early curricular emphasis on higher order reading processes
.734 .879 .942
Students Engaged in Math Lessons .322 .806 .620
Home Resources for Learning .569 .761 .723
Could Accomplish Early Numera-cy Tasks When Entered School
.691 .839 .773

a. sandoval-hernández, a. castejón and parisa aghakasiri ■ a comparison of school effectiveness .. .
73
ModelsIn order to take into account the nested structure of the data, we used two-level regression models (students nested in schools) to investigate the relationship between the school variables and student achievement while controlling for student characteristics. All analyses were carried out using MPlus (Muthén and Muthén, 2013).
Table 5. Variance decomposition
CountryVariance decomposition
School level (%) Student level (%)
AustriaDisadvantaged 8 92Non-disadvantaged 14 86
FinlandDisadvantaged 6 94Non-disadvantaged 10 90
GermanyDisadvantaged 35 65Non-disadvantaged 25 75
IrelandDisadvantaged 27 73Non-disadvantaged 13 87
ItalyDisadvantaged 31 69Non-disadvantaged 23 77
NorwayDisadvantaged 3 97Non-disadvantaged 12 88
PortugalDisadvantaged 39 61Non-disadvantaged 28 72
SloveniaDisadvantaged 14 86Non-disadvantaged 6 94
SpainDisadvantaged 11 89Non-disadvantaged 13 87
SwedenDisadvantaged 8 92Non-disadvantaged 9 91
We fitted three models separately for each analysed country and for each group of students (i.e., socially disadvantaged and non-disadvan-taged students). We decided to run separate analyses for each sample (as oppose to, for example, evaluating interaction effects with a dummy varia-ble indicating whether student are disadvantaged, or multi-group models) because we are interested in evaluating how well the whole model adjusts to each group of students and not on evaluating the effect of single predic-tors within each group of students.
First we fitted an unconditional model (Model 0) with no predic-tor variables on either the student or the school level. This model provides estimates for the student level and the school level variance components,

š ol s ko p olj e , l e t n i k x x v, š t e v i l k a 3 –4
74
which were used to determine how much of the total variance in mathe-matics achievement is accounted for by students and schools.
The results of the unconditional models are reported in Table 5. The results are reported separately for disadvantaged and non-disadvantaged students. As can be observed, in coincidence with the results of previous studies, in all countries and for both groups the student characteristics explain a greater proportion of the variance in mathematics achievement than the variance explained by school characteristics.
When comparing the disadvantaged and non-disadvantaged stu-dents within countries, it can be observed that in five countries (Ger-many, Ireland, Italy, Portugal, and Slovenia) the amount of variance ex-plained by school characteristics is larger for the group of disadvantaged students than for their non-disadvantaged peers. The opposite occurs in the remaining countries (Austria, Finland, Norway, Spain and Sweden).
Next, in Model 1, we included the student level predictor variables (i.e. Students Engaged in Math Lessons, Home Resources for Learning, and Early Numeracy Tasks), and no school level predictor variables. These results are reported in Tables 6 to 15.
Finally, in Model 2, we added the school level predictor variables (i.e. Safe and Orderly Environment, Support Academic Success, Physical En-vironment and Resources, Early Emphasis on Reading Skills, Home Re-sources - School Mean) to the Model 1. These results are also reported in Table 6 to 15.
Following the procedure suggested by Rutkowski et al. (2010), each level was weighted separately for all the models, so that the student lev-el uses a combination of the student and class weights included in the TIMSS data base and the school level uses the pure school weight.
For Models 1 and 2, student level variables were group-mean centred (i.e., student level variables we centred at the school mean) and school lev-el variables were left un-centred. We used this centering scheme because the focus of our analyses is on pure within-group and between-group ef-fects (Caro and Lenkeit, 2012). That is, one of the main objectives of the analysis is to separate the student and school level variance from the total variation. Also, when considering school explanatory variables, it is possi-ble to explore the association between school explanatory variables and in-dividual achievement after controlling for the student variables (Foy and O’Dwyer, 2013).
Model fitAs the main objective of the paper is to evaluate whether our selected EER theoretical model fits the sample of non-disadvantaged students bet-

a. sandoval-hernández, a. castejón and parisa aghakasiri ■ a comparison of school effectiveness .. .
75
ter than the sample of disadvantaged ones, we used three criteria to eval-uate model fit:• R squared. This is a statistical measure of how close the data are to
the fitted regression line. It can be interpreted as the proportion of variation in the dependent variable that is explained by the model. So, we consider that the model better fits the sample (disadvantaged or non-disadvantaged students) where it is statistically significant and explains a larger proportion of variance.
• An additional criterion in the number of school factors that show a significant regression coefficient. We consider that the model bet-ter fits the sample where more school level variables shows a signifi-cant coefficient.
• Finally, when school factors are significant for both samples, we consider that the model better fits the sample for which the coeffi-cient is larger.
ResultsTables 6 to 15 present the standardized regression coefficients for Models 1 and 2 for each country. In these country-by-country tables, we focused on how well the model fit the data of each country. In order to evaluate this, we used the r-squared coefficient reported for each level of analysis and for each country. For the non-disadvantaged group, the proportion of stu-dent level variance explained by the model ranged from 0.097 in Portu-gal, to 0.186 in Slovenia. For the same group, the proportion of school lev-el variance explained by the models ranged from 0.07 in Portugal to 0.793 in Sweden. For the disadvantaged group, the highest proportion of stu-dent level explained variance was found in Slovenia (0.116) and the lowest in Norway (0.018), while the proportion of school level variance was be-tween 0.066 in Portugal to 0.68 in Finland.
Table 16 presents a summary of the results of Model 2 across all coun-tries. Here we paid attention to the number of times each school variable showed significant regression coefficients for each group across the ana-lysed countries. By doing that we tried to identify if there were variables consistently associated with mathematics achievement, and if these asso-ciations were stronger for one of the groups.

š ol s ko p olj e , l e t n i k x x v, š t e v i l k a 3 –4
76
Country by Country ModelsAustria
Table 6. Model results for Austria
AUSTRIA
Model 1 Model 2
Non disadvanta-ged students
Disadvantaged students
Non disadvanta-ged students
Disadvantaged students
Coeffi-cient
S.E. Coeffi-cient
S.E. Coeffi-cient
S.E. Coeffi-cient
S.E.
Student Level
Students Enga-ged in Math Les-sons
-0.002 (0.019) 0.034 (0.042) 0.003 (0.021) 0.038 (0.051)
Home Resources 0.264* (0.017) 0.115* (0.039) 0.257* (0.019) 0.114* (0.04)
Early Numeracy Tasks 0.262* (0.020) 0.170* (0.039) 0.269* (0.023) 0.157* (0.042)
School Level
Safe and Orderly Environment 0.074 (0.092) -0.151 (0.347)
Support for Aca-demic Success 0.165 (0.146) -0.151 (0.219)
Physical Enviro-nment and Reso-urces
0.027 (0.109) 0.338 (0.235)
Early Emphasis on Reading Skills -0.171 (0.115) 0.189 (0.279)
Home Resources - School Mean 0.490* (0.094) 0.703* (0.231)
r-square within 0.156* (0.015) 0.047* (0.016) 0.155* (0.016) 0.044* (0.017)
r-square between 0.331* (0.095) 0.665 (0.383)
* Coefficient is significant at 5 percent level
In Austria (Table 6), as suggested by the r-squared coefficients, the mod-el fits better the non-disadvantaged group than the disadvantaged one. The mean of home resources for learning is the only significant predictor at the school level for both groups of students. However, the coefficient is larger for the disadvantaged group of students than for non-disadvan-taged students. Regarding the control variables, home resources for learn-ing and early numeracy and literacy tasks, are significant for both groups, although the coefficients are higher for the non-disadvantaged group.

a. sandoval-hernández, a. castejón and parisa aghakasiri ■ a comparison of school effectiveness .. .
77
FinlandTable 7. Model results for Finland
FINLAND
Model 1 Model 2
Non disadvanta-ged students
Disadvantaged students
Non disadvanta-ged students
Disadvantaged students
Coeffi-cient S.E. Coeffi-
cient S.E. Coeffi-cient S.E. Coeffi-
cient S.E.
Student Level
Students Enga-ged in Math Les-sons
0.065* (0.021) -0.138 (0.096) 0.059* (0.022) -0.191 (0.125)
Home Resources 0.191* (0.023) 0.120 (0.073) 0.194* (0.026) 0.108 (0.090)
Early Numeracy Tasks 0.392* (0.023) 0.189* (0.073) 0.399* (0.023) 0.191* (0.078)
School Level
Safe and Orderly Environment 0.252 (0.136) 0.328 (0.182)
Support for Aca-demic Success 0.102 (0.140) 0.138 (0.181)
Physical Enviro-nment and Reso-urces
-0.015 (0.138) 0.035 (0.200)
Early Emphasis on Reading Skills 0.142 (0.158) 0.243 (0.222)
Home Resources - School Mean 0.421* (0.138) -0.609* (0.242)
r-square within 0.228* (0.016) 0.079* (0.034) 0.233* (0.016) 0.088 (0.047)
r-square between 0.289* (0.132) 0.689* (0.278)
* Coefficient is significant at 5 percent level
As shown in Table 7, for Finland, the r-squared coefficients suggest a bet-ter fit of the model for the non-disadvantaged students. Again, the mean of home resources is the only school variable showing a significant asso-ciation with students’ achievement for both groups of students. The co-efficient is higher for disadvantaged students, with a negative association though. All control variables are significant for non-disadvantaged stu-dents, while for disadvantaged students only early numeracy skills shows a significant coefficient.
GermanyIn Germany, according to the r-square coefficients, the model shows a bet-ter fit for the non-disadvantaged group on both levels (Table 8). Early em-

š ol s ko p olj e , l e t n i k x x v, š t e v i l k a 3 –4
78
phasis on reading skills has significant coefficients in both advantaged and disadvantaged groups, although the relationship is stronger for the dis-advantaged students. The school average of home resources establishes a significant association with achievement in the non-disadvantaged group only. Regarding the control variables, early numeracy tasks are a signifi-cant predictor of achievement for both groups, with a stronger association for non-disadvantaged students. Home resources show a significant coef-ficient only for non-disadvantaged students.
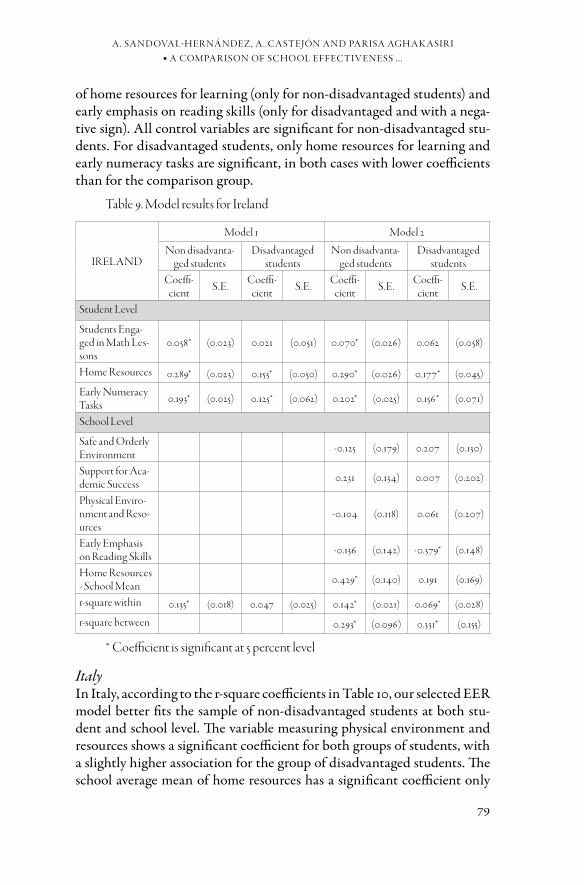
IrelandAs can be seen from Table 9, in Ireland the model better fits the sample of disadvantaged students at the school level than the sample of non-dis-advantaged students at the student level. The school variables that have a significant association with student achievement are the school average
Table 8. Model results for Germany
GERMANY
Model 1 Model 2
Non disadvanta-ged students
Disadvantaged students
Non disadvanta-ged students
Disadvantaged students
Coeffi-cient S.E. Coeffi-
cient S.E. Coeffi-cient S.E. Coeffi-
cient S.E.
Student Level
Students Enga-ged in Math Les-sons
0.048* (0.022) 0.048 (0.057) 0.042 (0.024) 0.029 (0.061)
Home Resources 0.270* (0.023) 0.094 (0.076) 0.289* (0.023) 0.114 (0.087)
Early Numeracy Tasks 0.240* (0.029) 0.167* (0.054) 0.224* (0.034) 0.177* (0.060)
School Level
Safe and Orderly Environment 0.188 (0.140) 0.227 (0.172)
Support for Aca-demic Success 0.164 (0.094) 0.056 (0.151)
Physical Enviro-nment and Reso-urces
0.069 (0.105) -0.052 (0.170)
Early Emphasis on Reading Skills 0.340* (0.103) 0.530* (0.136)
Home Resources - School Mean 0.483* (0.105) 0.155 (0.144)
r-square within 0.147* (0.019) 0.046* (0.023) 0.149* (0.021) 0.051 (0.028)
r-square between 0.672* (0.090) 0.518* (0.199)
* Coefficient is significant at 5 percent level
a. sandoval-hernández, a. castejón and parisa aghakasiri ■ a comparison of school effectiveness .. .
79
of home resources for learning (only for non-disadvantaged students) and early emphasis on reading skills (only for disadvantaged and with a nega-tive sign). All control variables are significant for non-disadvantaged stu-dents. For disadvantaged students, only home resources for learning and early numeracy tasks are significant, in both cases with lower coefficients than for the comparison group.
Table 9. Model results for Ireland
IRELAND
Model 1 Model 2
Non disadvanta-ged students
Disadvantaged students
Non disadvanta-ged students
Disadvantaged students
Coeffi-cient S.E. Coeffi-
cient S.E. Coeffi-cient S.E. Coeffi-
cient S.E.
Student Level
Students Enga-ged in Math Les-sons
0.058* (0.023) 0.021 (0.051) 0.070* (0.026) 0.062 (0.058)
Home Resources 0.289* (0.023) 0.153* (0.050) 0.290* (0.026) 0.177* (0.045)
Early Numeracy Tasks 0.193* (0.025) 0.125* (0.062) 0.202* (0.025) 0.156* (0.071)
School Level
Safe and Orderly Environment -0.125 (0.179) 0.207 (0.130)
Support for Aca-demic Success 0.231 (0.134) 0.007 (0.202)
Physical Enviro-nment and Reso-urces
-0.104 (0.118) 0.061 (0.207)
Early Emphasis on Reading Skills -0.136 (0.142) -0.379* (0.148)
Home Resources - School Mean 0.429* (0.140) 0.191 (0.169)
r-square within 0.135* (0.018) 0.047 (0.025) 0.142* (0.021) 0.069* (0.028)
r-square between 0.293* (0.096) 0.331* (0.155)
* Coefficient is significant at 5 percent level
ItalyIn Italy, according to the r-square coefficients in Table 10, our selected EER model better fits the sample of non-disadvantaged students at both stu-dent and school level. The variable measuring physical environment and resources shows a significant coefficient for both groups of students, with a slightly higher association for the group of disadvantaged students. The school average mean of home resources has a significant coefficient only

š ol s ko p olj e , l e t n i k x x v, š t e v i l k a 3 –4
80
for the non-disadvantaged sample. Regarding the student level variables, all of them establish a statistically significant association with achieve-ment in both groups. Students Engaged in Math Lessons and Home Re-sources have higher coefficients in the sample of disadvantaged students, and Early Numeracy Tasks in the sample of non-disadvantaged students.
Table 10. Model results for Italy
ITALY
Model 1 Model 2
Non disadvanta-ged students
Disadvantaged students
Non disadvanta-ged students
Disadvantaged students
Coeffi-cient S.E. Coeffi-
cient S.E. Coeffi-cient S.E. Coeffi-
cient S.E.
Student Level
Students Enga-ged in Math Les-sons
0.075* (0.026) 0.094* (0.037) 0.088* (0.027) 0.100* (0.043)
Home Resources 0.153* (0.037) 0.154* (0.036) 0.166* (0.04) 0.173* (0.043)
Early Numeracy Tasks 0.238* (0.026) 0.142* (0.039) 0.244* (0.029) 0.144* (0.042)
School Level
Safe and Orderly Environment -0.036 (0.078) -0.010 (0.110)
Support for Aca-demic Success -0.034 (0.134) 0.045 (0.125)
Physical Enviro-nment and Reso-urces
-0.257* (0.090) -0.289* (0.103)
Early Emphasis on Reading Skills -0.065 (0.093) 0.070 (0.100)
Home Resources - School Mean 0.322* (0.123) -0.130 (0.129)
r-square within 0.096* (0.017) 0.061* (0.018) 0.106* (0.020) 0.070* (0.023)
r-square between 0.176* (0.070) 0.120 (0.080)
* Coefficient is significant at 5 percent level
NorwayIn Norway (Table 11), the r-square coefficient was statistically significant only for non-disadvantaged students, and only at the student level. Fur-thermore, none of analysed variables are significant for disadvantaged students, neither control variables nor explanatory ones. Concerning the non-disadvantaged students, at the student level, Home Resources and Early Numeracy Tasks have a significant association with achievement,

a. sandoval-hernández, a. castejón and parisa aghakasiri ■ a comparison of school effectiveness .. .
81
while at the school level only the School Mean of Home Resources has a significant regression coefficient.
Table 11. Model results for Norway
NORWAY
Model 1 Model 2
Non disadvanta-ged students
Disadvantaged students
Non disadvanta-ged students
Disadvantaged students
Coeffi-cient S.E. Coeffi-
cient S.E. Coeffi-cient S.E. Coeffi-
cient S.E.
Student Level
Students Enga-ged in Math Les-sons
0.005 (0.026) -0.001 (0.119) -0.001 (0.028) -0.001 (0.123)
Home Resources 0.175* (0.026) 0.091 (0.122) 0.172* (0.028) 0.094 (0.129)
Early Numeracy Tasks 0.321* (0.022) 0.063 (0.101) 0.324* (0.025) 0.065 (0.106)
School Level
Safe and Orderly Environment -0.054 (0.123) -0.085 (2.767)
Support for Aca-demic Success 0.271 (0.140) 0.150 (2.476)
Physical Enviro-nment and Reso-urces
-0.030 (0.117) 0.494 (6.080)
Early Emphasis on Reading Skills 0.071 (0.167) 0.428 (5.730)
Home Resources - School Mean 0.363* (0.153) 0.307 (6.374)
r-square within 0.159* (0.016) 0.017 (0.025) 0.160* (0.018) 0.018 (0.029)
r-square between 0.231 (0.130) 0.626 (16.463)
* Coefficient is significant at 5 percent level
PortugalPortugal’s results (Table 12) show that, at the student level, the model fits better the sample of non-disadvantaged students. At the school level, how-ever, the r-square coefficient is not significant for any of the two groups, and therefore the comparison cannot be made. None of the school lev-el variables are significantly associated with math achievement in neither of the two groups. From the control variables, Students Engaged in Math Lessons and Home Resources are significant only for the non-disadvan-taged students. Early Numeracy Tasks has a significant coefficient with both groups, but a somewhat higher coefficient with the sample of disad-vantaged students.

š ol s ko p olj e , l e t n i k x x v, š t e v i l k a 3 –4
82
Table 12. Model results for Portugal
PORTUGAL
Model 1 Model 2
Non disadvanta-ged students
Disadvantaged students
Non disadvanta-ged students
Disadvantaged students
Coeffi-cient S.E. Coeffi-
cient S.E. Coeffi-cient S.E. Coeffi-
cient S.E.
Student Level
Students Enga-ged in Math Les-sons
0.097* (0.027) 0.076 (0.048) 0.087* (0.027) 0.077 (0.047)
Home Resources 0.187* (0.024) 0.082* (0.039) 0.177* (0.026) 0.075 (0.039)
Early Numeracy Tasks 0.205* (0.023) 0.224* (0.037) 0.203* (0.024) 0.226* (0.038)
School Level
Safe and Orderly Environment 0.037 (0.164) 0.172 (0.147)
Support for Aca-demic Success 0.089 (0.156) -0.015 (0.129)
Physical Enviro-nment and Reso-urces
0.062 (0.129) 0.087 (0.155)
Early Emphasis on Reading Skills -0.195 (0.104) -0.153 (0.133)
Home Resources - School Mean 0.160 (0.162) 0.087 (0.197)
r-square within 0.104* (0.014) 0.070* (0.018) 0.097* (0.014) 0.070* (0.019)
r-square between 0.070 (0.056) 0.066 (0.068)
* Coefficient is significant at 5 percent level
SloveniaIn Slovenia, according to the r-square coefficients reported in Table 13, the model fits the non-disadvantaged students better on both student and school level. For this group, only the School Average of Home Resources shows a significant association with achievement at the school level. From the control variables, Home Resources and Early Numeracy Tasks are sig-nificant for both samples with stronger associations for the non-disadvan-taged students.

a. sandoval-hernández, a. castejón and parisa aghakasiri ■ a comparison of school effectiveness .. .
83
Table 13. Model results for Slovenia
SLOVENIA
Model 1 Model 2
Non disadvanta-ged students
Disadvantaged students
Non disadvanta-ged students
Disadvantaged students
Coeffi-cient S.E. Coeffi-
cient S.E. Coeffi-cient S.E. Coeffi-
cient S.E.
Student Level
Students Enga-ged in Math Les-sons
0.029 (0.028) 0.031 (0.047) 0.027 (0.033) 0.036 (0.055)
Home Resources 0.303* (0.020) 0.245* (0.053) 0.305* (0.021) 0.271* (0.059)
Early Numeracy Tasks 0.263* (0.022) 0.191* (0.048) 0.264* (0.027) 0.191* (0.055)
School Level
Safe and Orderly Environment -0.175 (0.099) -0.158 (0.142)
Support for Aca-demic Success 0.050 (0.122) -0.150 (0.181)
Physical Enviro-nment and Reso-urces
-0.046 (0.106) -0.217 (0.134)
Early Emphasis on Reading Skills -0.059 (0.124) -0.331 (0.17)
Home Resources - School Mean 0.630* (0.114) -0.080 (0.152)
r-square within 0.183* (0.017) 0.102* (0.034) 0.186* (0.019) 0.116* (0.041)
r-square between 0.441* (0.109) 0.255 (0.162)
* Coefficient is significant at 5 percent level
SpainIn Spain (Table 14), the model shows a better fit for the non-disadvan-taged students at the student level and for the disadvantaged group at the school level. The School Mean of Home Resources has a significant asso-ciation with achievement in both samples, with a higher coefficient in the non-disadvantaged group. Support for Academic Success shows a signif-icant coefficient only for the disadvantaged students. All the control var-iables have a positive and significant coefficient for both disadvantaged and non-disadvantaged students. Students Engaged in Math Lessons have a stronger association with achievement for the disadvantaged students, while for Home Resources and Early Numeracy Tasks, the association is stronger for the non-disadvantaged group.

š ol s ko p olj e , l e t n i k x x v, š t e v i l k a 3 –4
84
Table 14. Model results for Spain
SPAIN
Model 1 Model 2
Non disadvanta-ged students
Disadvantaged students
Non disadvanta-ged students
Disadvantaged students
Coeffi-cient S.E. Coeffi-
cient S.E. Coeffi-cient S.E. Coeffi-
cient S.E.
Student Level
Students Enga-ged in Math Les-sons
0.125* (0.025) 0.129* (0.054) 0.116* (0.027) 0.136* (0.06)
Home Resources 0.189* (0.023) 0.143* (0.054) 0.200* (0.025) 0.156* (0.059)
Early Numeracy Tasks 0.222* (0.025) 0.143* (0.057) 0.221* (0.029) 0.128* (0.06)
School Level
Safe and Orderly Environment -0.044 (0.114) -0.086 (0.165)
Support for Aca-demic Success 0.205 (0.141) 0.396* (0.193)
Physical Enviro-nment and Reso-urces
0.047 (0.14) 0.123 (0.156)
Early Emphasis on Reading Skills 0.020 (0.115) -0.209 (0.159)
Home Resources - School Mean 0.554* (0.11) 0.432* (0.142)
r-square within 0.120* (0.014) 0.070* (0.029) 0.121* (0.015) 0.072* (0.031)
r-square between 0.398* (0.114) 0.468* (0.146)
* Coefficient is significant at 5 percent level
SwedenAs shown in Table 15, in Sweden the model better fits the non-disadvan-taged students at both levels. Support for Academic Success and the School Mean of Home Resources are significant predictors of achievement only for non-disadvantaged students. Regarding the control variables, Home Resources and Early Numeracy Tasks are significant for non-disadvan-taged students. Early Numeracy Tasks is also significantly associated with student math achievement for the disadvantaged group, although the as-sociation is weaker than for the comparison group.

a. sandoval-hernández, a. castejón and parisa aghakasiri ■ a comparison of school effectiveness .. .
85
Table 15. Model results for Sweden
SWEDEN
Model 1 Model 2
Non disadvanta-ged students
Disadvantaged students
Non disadvanta-ged students
Disadvantaged students
Coeffi-cient S.E. Coeffi-
cient S.E. Coeffi-cient S.E. Coeffi-
cient S.E.
Student Level
Students Enga-ged in Math Les-sons
0.018 (0.021) -0.054 (0.067) 0.003 (0.026) -0.012 (0.068)
Home Resources 0.236* (0.023) 0.102* (0.049) 0.231* (0.027) 0.099 (0.056)
Early Numeracy Tasks 0.308* (0.026) 0.212* (0.063) 0.300* (0.03) 0.215* (0.074)
School Level
Safe and Orderly Environment -0.047 (0.089) -0.241 (0.248)
Support for Aca-demic Success 0.262* (0.116) 0.135 (0.303)
Physical Enviro-nment and Reso-urces
0.114 (0.088) 0.094 (0.353)
Early Emphasis on Reading Skills 0.127 (0.1) -0.268 (0.32)
Home Resources - School Mean 0.847* (0.078) 0.350 (0.335)
r-square within 0.182* (0.018) 0.068* (0.027) 0.172* (0.022) 0.069* (0.034)
r-square between 0.793* (0.073) 0.203 (0.267)
* Coefficient is significant at 5 percent level
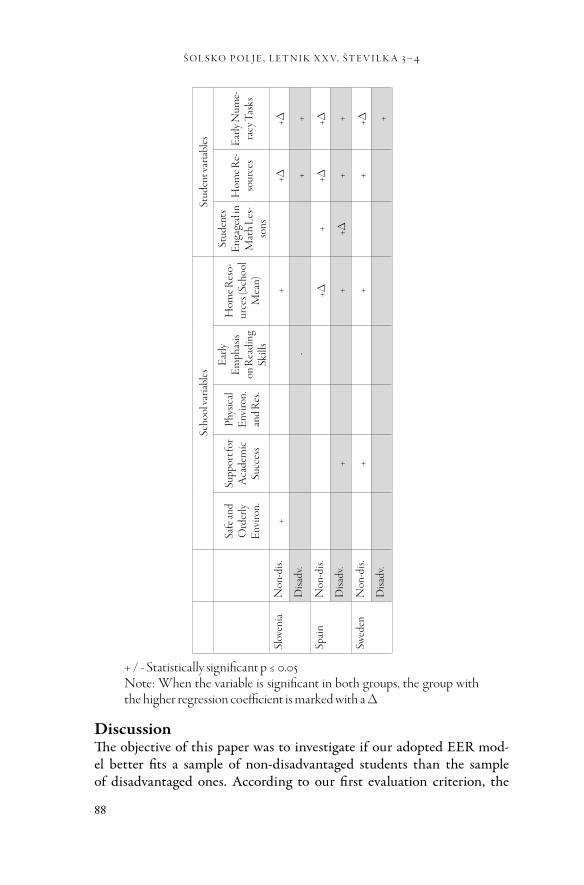
Summary of the Results of Model 2 Across all CountriesThe summary of the results of Model 2 across countries is presented in Ta-ble 16. The first six columns correspond to the school level variables or the variables of interest (i.e. those that are amenable to school or policy in-terventions). Columns six to eight show the results for the control or stu-dent level variables. Each country is presented with two rows, one for each analysis group (disadvantaged and non-disadvantaged students). Statisti-cally significant associations between the variables of interest and math-ematics achievement are marked with a “+” in the corresponding column (variable) and row (country / group). Next, we present a brief description of the results per each variable included in the model. When the variable is significant in both groups, the group with the higher regression coeffi-cient is marked with a ∆.

š ol s ko p olj e , l e t n i k x x v, š t e v i l k a 3 –4
86
Safe and Orderly Environment: this variable showed a significant as-sociation with mathematics achievement only for non-disadvantaged stu-dents in Slovenia.
School Support Academic Success: this variable is neither significant for disadvantaged nor for non-disadvantaged students in most countries, except for Spain and Sweden (for disadvantaged and non-disadvantaged students respectively).
Adequate Physical Environment and Resources: this variable showed a significant regression coefficient only in Italy, where it is significant for both disadvantaged and non-disadvantaged students. The association is stronger for the disadvantaged group.
Early Emphasis on Reading Skills: this variable is significant in four countries. In Germany it is positive and significant for both groups (with a higher coefficient for the disadvantaged group). In Ireland and Slovenia it is negative and significant for disadvantaged students; while in Portugal it is negative and significant for the non-disadvantaged group.
School Average of Home Resources: this variable is significant in most of the countries. For the non-disadvantaged sample, this variable is posi-tive and significantly associated with achievement in all countries except in Portugal. In Austria, Finland and Spain, it is significant for disadvan-taged students as well; in Finland, however, the association is negative. The variable is significant for both samples in three countries, in Austria and Finland the regression coefficient is higher for the disadvantaged stu-dents, and in Spain for the non-disadvantaged group.
Students Engaged in Math Lessons: this variable shows a significant coefficient for non-disadvantaged students in five countries (Finland, Ire-land, Italy, Portugal and Spain); and significant for both disadvantaged and non-disadvantaged students in two countries (Spain and Italy). In these two countries, the regression coefficients are higher for disadvan-taged students. In Austria, Norway, Slovenia and Sweden significant coef-ficients were not shown for any group.
Home Resources for Learning: this variable showed a significant co-efficient in all countries for the non-disadvantaged students, and for the disadvantaged students only in Austria, Ireland, Spain, Slovenia and Ita-ly. From these five countries, in the first four the association is stronger for the non-disadvantaged students, while in the last the association is strong-er for the disadvantaged group.
Early Numeracy and Literacy Tasks: this variable showed significant coefficients in most countries and for both groups. It is not significant for the disadvantaged students in only Norway. From the remaining coun-

a. sandoval-hernández, a. castejón and parisa aghakasiri ■ a comparison of school effectiveness .. .
87
tries, the association is stronger for the non-disadvantaged group in all countries except Portugal.
Table 16. Summary of Model 2 results for all countries.
Scho
ol va
riabl
esSt
uden
t var
iabl
es
Safe
and
Ord
erly
En
viro
n.
Supp
ort f
or
Aca
dem
ic
Succ
ess
Phys
ical
En
viro
n.
and
Res
.
Early
Em
phas
is on
Rea
ding
Sk
ills
Hom
e Res
o-ur
ces (
Scho
ol
Mea
n)
Stud
ents
En
gage
d in
M
ath
Les-
sons
Hom
e Re-
sour
ces
Early
Num
e-ra
cy T
asks
Aus
tria
Non
-dis.
+
+∆+∆
Disa
dv.
+∆
++
Finl
and
Non
-dis.
++
++∆
Disa
dv.
- ∆
+
Ger
man
yN
on-d
is.
++
+
+ ∆
Disa
dv.
+∆
+
Irel
and
Non
-dis.
++
+∆+∆
Disa
dv.
-
++
Ital
yN
on-d
is.
+
+
++
+∆
Disa
dv.
+∆
+∆
+∆+
Nor
way
Non
-dis.
+
++
Disa
dv.
Port
ugal
Non
-dis.
-
+
++
Disa
dv.
+∆
š ol s ko p olj e , l e t n i k x x v, š t e v i l k a 3 –4
88
DiscussionThe objective of this paper was to investigate if our adopted EER mod-el better fits a sample of non-disadvantaged students than the sample of disadvantaged ones. According to our first evaluation criterion, the
Scho
ol va
riabl
esSt
uden
t var
iabl
es
Safe
and
Ord
erly
En
viro
n.
Supp
ort f
or
Aca
dem
ic
Succ
ess
Phys
ical
En
viro
n.
and
Res
.
Early
Em
phas
is on
Rea
ding
Sk
ills
Hom
e Res
o-ur
ces (
Scho
ol
Mea
n)
Stud
ents
En
gage
d in
M
ath
Les-
sons
Hom
e Re-
sour
ces
Early
Num
e-ra
cy T
asks
Slov
enia
Non
-dis.
+
+
+∆+∆
Disa
dv.
-
++
Spai
nN
on-d
is.
+∆
++∆
+∆
Disa
dv.
+
++∆
++
Swed
enN
on-d
is.
+
+
+
+∆
Disa
dv.
+
+ / - Statistically significant p ≤ 0.05 Note: When the variable is significant in both groups, the group with the higher regression coefficient is marked with a ∆

a. sandoval-hernández, a. castejón and parisa aghakasiri ■ a comparison of school effectiveness .. .
89
r-squared coefficients (Tables 6 to 15), our theoretical model fits the data of the non-disadvantaged students in all countries at the student level bet-ter, and also in five out eight countries at the school level (Austria, Germa-ny, Italy, Slovenia, and Sweden).2
Regarding the second and the third criteria for the evaluation of the model fits (i.e., number of statistically significant variables and/or the size of the regression coefficient in each group of students), the school variables showed a significant regression coefficient in 22 cases. In 14 cases, the as-sociation was established only for the non-disadvantaged group or with a higher coefficient for this group than for the disadvantaged one.
The results described above provide evidence to support the claims of some critics (e.g., Slee et al., 1998) who have argued that EER models of-ten ignore children from disadvantaged backgrounds. Consequently, our findings call for the development of EER models that are more adequate for the context of disadvantaged students.
These findings also draw attention to the importance of explicitly considering the needs and contexts of disadvantaged groups when formu-lating educational policies. Currently, one of the main challenges of edu-cation systems around the world is related to the reproduction of social inequalities in schools and their outcomes. Education can play an impor-tant role in reproducing as well as in avoiding the reproduction of those inequalities.
Furthermore, regarding the identification of school effectiveness fac-tors that work better for either disadvantaged or non-disadvantaged stu-dents, our results do not show clear patterns across the analysed countries. However, it is important to point out some considerations.
The variable that seems to be most consistently associated with the mathematics achievement of non-disadvantaged students is the School Average of Home Resources. Due to the items that form it, this variable can be interpreted as a proxy of school composition (see Table 3). In this sense, at least two hypotheses can provide information to explain this pat-tern. The first one is linked to the methodological strategy used in our analyses. As we divided the sample based on the distribution of the var-iable Home Resources, the disadvantaged group had a considerable low-er variance in this variable than the non-disadvantaged group. Therefore, achieving statistical significance is more difficult for one group than for the other. The second hypothesis is related to the capacity of schools to ad-dress the heterogeneity of their students. That is, the more socially disad-vantaged students are, the more the difficulty for schools to address their
2 Note that in Norway and Portugal the r-square at the school level is not statistically signi-ficant for neither sample, therefore the comparison could not be made.

š ol s ko p olj e , l e t n i k x x v, š t e v i l k a 3 –4
90
needs in an effective way. Along these lines, schools would be able to in-tegrate some mildly disadvantaged students, but would struggle consider-ably more with the very disadvantaged students. The threshold could be close to the point where we divided the sample.
It is necessary to acknowledge some limitations in our analyses. A non-exhaustive list of these limitations and some proposals to address them is as follows. The first limitation comes from the analysis model: this paper aims to explore whether the model proposed by Martin et al (2013) works better for non-disadvantaged than for disadvantaged students, thus the variables used in the analysis are the same as the ones proposed in this model. As the literature review in this paper shows, there are other vari-ables –not included in our analysis– that have been identified as impor-tant factors for academic success, especially for disadvantaged students. Some of these variables are, for example, strong educational leadership, the schools’ staff development, and external support (Muijs et al., 2004). TIMSS database provides information that could be used to operation-alize some of these factors. This information can be used to improve the model used in this work. It can be also interesting to explore the construct “schools support for academic success” item by item (i.e. teachers’ under-standing the curricular goals, degree of success in implementing school’s curriculum, teachers’ expectations, parental support and students’ moti-vation). These analyses could help unveil the mechanisms underlying the patterns identified in this work, and therefore provide more detailed in-formation for the design of policy interventions aimed at reducing the achievement gaps between advantaged and disadvantaged students.
The second limitation is related to the methodology and the data used in this work. Quantitative analyses of large-scale aggregated data-sets enable researchers to have a broad perspective of the educational phe-nomena and to identify general patterns. However, regarding our research topic, it could be necessary to go beyond the surface to explain and under-stand the relationships identified, or to find out other factors not consid-ered before. In this sense, further research should be done using not only quantitative methods, but also qualitative ones to have an in-depth ap-proach to the topic.
The third limitation concerns the theoretical perspective and the limitations of EER itself. Educational Effectiveness Research has been criticized, amongst other things, due to its lack of a sound theoretical ba-sis. The critics claim that the selection and operationalization of variables are made based on empirical criteria rather than on theoretical grounds (Sandoval-Hernandez, 2008; Slee et al., 1998; Thrupp, 1999). Considering the relevance of the object of this article, that is, trying to address the dis-

a. sandoval-hernández, a. castejón and parisa aghakasiri ■ a comparison of school effectiveness .. .
91
advantaged students’ underachievement, it is worth exploring other theo-retical approaches to base further studies in this topic and look for alter-native explanations of the phenomenon.
NoteThis paper was produced within the project EXEDE “Success and Educa-tional Inequalities in Disadvantaged Schools” (Spanish Ministry of Eco-nomy 2012-2014, EDU 2011-23473).
ReferencesBarth, P. et al. (1999) Dispelling the Myth: High Poverty Schools Exceeding
Expectations. Washington DC: The Education Trust.Blanden, J., & Gregg, P. (2004). Family Income and Educational Attain-
ment: A Review of Approaches and Evidence for Britain. Oxford Review of Economic Policy, 20(2), 245–263.
Borman, G. D. et al. (2000) Four models of school improvement. Successes and challenges in reforming low performing, high poverty schools. Bal-timore: Johns Hopkins University, Center for Research into the Ed-ucation of Students Placed at Risk.
Borman, G. D., Rachuba, L. T. (2001) Academic Success among Poor and Minority Students: An Analysis of Competing Models of School Effects (Report No. 52). Baltimore: John Hopkins University Center for Re-search on the Education of Students Placed at Risk.
Caro, D. H., Cortes, D. (2012) Measuring family socioeconomic status: An illustration using data from PIRLS 2006. ERI Monogr. Ser. Issues Methodol. LargeScale Assess. 5, pp. 9–33.
Caro, D. H., Lenkeit, J. (2012) An analytical approach to study education-al inequalities: 10 hypothesis tests in PIRLS 2006. Int. J. Res. Method Educ. 35(1), pp. 3–30.
Caro, D. H., McDonald, J. T., & Willms, J. D. (2009). Socio-economic Status and Academic Achievement Trajectories from Childhood to Adolescence. Canadian Journal of Education, 32(3), 558–590.
Cervini, R. (2012) El “efecto escuela” en países de América Latina: Rea-nalizando los datos del SERCE. (Spanish). Sch. Eff. Some Lat. Am. Ctries. Reanalyzing SERCE Data Engl. 20, pp. 1–28.
Chapman, C., Harris, A.( 2004) Improving schools in difficult and chal-lenging contexts: strategies for improvement. Educ. Res. 46(3), pp. 219–228.
Coleman, J.S. et al. (1966) Equality of Educational Opportunity. Washing-ton, D.C: US Congressional Printing Office.
Creemers, B., Kyriakides, L. (2006) Critical analysis of the current ap-proaches to modelling educational effectiveness: The importance of

š ol s ko p olj e , l e t n i k x x v, š t e v i l k a 3 –4
92
establishing a dynamic model. Sch. Eff. Sch. Improv. 17(3), pp. 347– 366.
Creemers, B. P. M. (1994) The effective classroom. London: Cassell.Creemers, B. P. M., Kyriakides, L. (2008) A theoretical based approach
to educational improvement: Establishing links between educational effectiveness research and school improvement, in: Bos, W., Pfeiffer, H., Rolff, H.-G. (eds.), Yearbook on School Improvement. Weinhem / Munchen: Juventa Verlag, pp. 41–61.
Creemers, B. P. M., Kyriakides, L. (2010) Using the Dynamic Model to develop an evidence-based and theory-driven approach to school im-provement. Ir. Educ. Stud. 29(1), pp. 5–23.
Creemers, B. P. M., Scheerens, J. (1994) Developments in the education-al effectiveness research programme. Int. J. Educ. Res. 21(2), pp. 125– 140.
Datnow, A., Stringfield, S. (2000) Working Together for Reliable School Reform. J. Educ. Stud. Placed Risk. 5(1), pp. 183–183.
Dupriez, V., & Dumay, X. (2006). Inequalities in school systems: effect of school structure or of society structure? Comparative Education, 42(2), 243–260.
Edmonds, R. (1979) Effective Schools for the Urban Poor. Educ. Leadersh. 37, pp. 15–24.
Field, S., Kuczera, M., & Pont, B. (2007). No More Failures: Ten Steps to Equity in Education. Paris: OECD.
Foy, P., O’Dwyer, L. M. (2013) Technical Appendix B. School Effective-ness Models and Analyses, in: Martin, M. O., Mullis, I.V.S. (eds.), TIMSS and PIRLS 2011: Relationships Among Reading, Mathematics, and Science Achievement at the Fourth Grade. Chestnut Hill, MA: TIMSS & PIRLS International Study Center, Lynch School of Education, Boston College and International Association for the Evaluation of Educational Achievement (IEA).
Goldstein, H. (1987) Multilevel models in education and social research. New York: Oxford University Press.
Gorard, S., & Smith, E. (2004). An international comparison of equity in education systems. Comparative Education, 40(1), 15–28.
Guthrie, L. F. (1989) Principles of Successful Chapter 1 Programs: A Guidebook for Rural Educators. San Francisco CA: Far West Laboratory.
Harris, A., Chapman, C. (2002) Leadership in schools facing challenging circumstances. Manag. Educ. Educ. Publ. Worldw. Ltd 16, 10.
Harris, A., Muijs, D. (2002) Teacher leadership: A review of research. Lon-don / Coventry: University of Warwick Institute of Education – General Teaching Council.
a. sandoval-hernández, a. castejón and parisa aghakasiri ■ a comparison of school effectiveness .. .
93
Hopkins, D. (2001) Meeting the challenge. An improvement guide for schools facing challenging circumstances. London: Department for Ed-ucation and Skills.
Isac, M. M. et al. (2014) The contribution of schooling to secondary-school students’ citizenship outcomes across countries. Sch. Eff. Sch. Improv. 25, pp. 29–63.
Jencks, C. S. et al. (1972) Inequality: A Reassessment of the Effect of the Family and Schooling in America. New York: Basic Books.
Joyce, B., Calhoun, E., Hopkins, D. (1999) The New Structure of School Improvement: Inquiring Schools and Achieving Students. Buckingham: Open University Press.
Kyriakides, L. (2006) Using international comparative studies to devel-op the theoretical framework of educational effectiveness research: A secondary analysis of TIMSS 1999 data. Educ. Res. Eval. 12(6), pp. 513–534.
Kyriakides, L., Creemers, B. P. M. (2008) Using a multidimensional ap-proach to measure the impact of classroom-level factors upon stu-dent achievement: a study testing the validity of the dynamic model. Sch. Eff. Sch. Improv. 19, pp. 183–205.
Lee, V. E., Zuze, T. L., Ross, K. N. (2005) School effectiveness in 14 sub-Sa-haran African countries: Links with 6th Graders’ reading achieve-ment. Stud. Educ. Eval. 31, pp. 207–246.
Leithwood, K., Steinbach, R. (2002) Successful leadership for especially challenging schools. J. Leadersh. Educ. 79, pp. 73–82.
Louis, K. S., Kruse, S. D. (1995) Professionalism and community: perspectives on reforming urban schools. Thousand Oaks, Calif: Corwin Press.
Maden, M., Hillman, J. (1993) Success against the odds: Effective schools in disadvantaged areas. London: Routledge.
Martin, M. O. et al. (2013) Effective schools in reading, mathematics, and science at the fourth grade. In Martin, M. O., Mullis, I. V. S. (eds.), TIMSS and PIRLS 2011: Relationships Among Reading, Mathematics, and Science Achievement at the Fourth Grade Implications for Early Learning. Chestnut Hill, MA: International Study Center, Lynch School of Education, Boston College.
Martin, M. O. et al. (2000) Effective Schools in Science and Mathematics : IEA’s Third International Mathematics and Science Study. Chestnut Hill, MA: International Study Center, Lynch School of Education, Boston College.

š ol s ko p olj e , l e t n i k x x v, š t e v i l k a 3 –4
94
Martin, M. O., Mullis, I. V. S. (eds.) (2013) Methods and procedures in TIMSS and PIRLS 2011. Chestnut Hill, MA: TIMSS & PIRLS In-ternational Study Center, Boston College.
Marzano, R. J. (2003) What Works in Schools: Translating Research Into Action, 1ST edition. ed. Alexandria, Va: Association for Supervision & Curriculum Development.
Miles, M. B. (2005) Finding Keys to School Change: A 40-Year Odyssey, in: Lieberman, A. (ed.), The Roots of Educational Change. Springer Netherlands, pp. 25–57.
Mortimore, P. (1991) Effective schools from a British perspective. Research and practice. In Bliss, J. R., Firestone, W. A., Richards, C. E. (eds.), Rethinking Effective Schools. Pentice-Hall, Englewood-Cliffs, NJ, pp. 76–90.
Mortimore, P. et al. (1988) School Matters: the Junior Years. Wells: Open Books.
Mourshed, M., Chijioke, C., Barber, M. (2010) How the World’s Most Improved School Systems Keep Getting Better. McKinsey & Company.
Muijs, D. et al. (2004) Improving Schools in Socioeconomically Disad-vantaged Areas – A Review of Research Evidence. Sch. Eff. Sch. Improv. 15(2), pp. 149–175.
Mullis, I. V. S. et al. (2012) TIMSS 2011 International Results in Mathematics. Chestnut Hill, MA: Lynch School of Education, Boston Col-lege.
Mullis, I. V. S. et al. (2009a) PIRLS 2011 Assessment Framework. Chest-nut Hill, MA: PIRLS International Study Center, Boston College, Lynch School of Education.
Mullis, I. V. S. et al. (2009b) TIMSS 2011 Assessment Framework. Chest-nut Hill, MA: TIMSS & PIRLS International Study Center, Boston College, Lynch School of Education.
Murillo, F. J., Roman, M. (2011) School infrastructure and resources do matter: analysis of the incidence of school resources on the perfor-mance of Latin American students. Sch. Eff. Sch. Improv. 22, pp. 29– 50.
Murillo, J. (2007) School Effectiveness Research in Latin America. In Townsend, T. (ed.), International Handbook of School Effectiveness and Improvement, Springer International Handbooks of Education. Netherlands: Springer, pp. 75–92.
Murillo, J. et al. (2007) Investigación iberoamericana sobre eficacia escolar [Ibero American school effectiveness study]. Bogotá: Convenio An-drés Bello.

a. sandoval-hernández, a. castejón and parisa aghakasiri ■ a comparison of school effectiveness .. .
95
Muthén, B., Muthén, L. (2013) Mplus (Version 7.11) [Computer software]. Los Angeles, CA: Muthén & Muthén.
Newton, X. A., Llosa, L. (2010) Toward a More Nuanced Approach to Program Effectiveness Assessment: Hierarchical Linear Models in K–12 Program Evaluation. Am. J. Eval. 31, pp. 162–179.
OECD. (2005) School Factors Related to Quality and Equity. Paris: Organ-isation for Economic Co-operation and Development.
OECD. (2007). Understanding the Social Outcomes of Learning. Paris: OECD.
OECD. (2010). PISA 2009 Results Overcoming Social Background: Equity in Learning opportunities and Outcomes. Vol II. Paris: OECD.
OECD. (2011). Against the Odds: Disadvantaged Students Who Succeed in School. Paris: OECD Publishing.
Raudenbush, S., Bryk, A. S. (1986) A Hierarchical Model for Studying School Effects. Sociol. Educ. 59(1), pp. 1–17.
Reynolds, D. et al. (1996) Making Good Schools: Linking School Effectiveness and Improvement. London: Routledge.
Reynolds, D. et al. (2014) Educational effectiveness research (EER): a state-of-the-art review. Sch. Eff. Sch. Improv. 25, pp. 197–230.
Rutkowski, L. et al. (2010) International Large-Scale Assessment Data: Is-sues in Secondary Analysis and Reporting. Educ. Res. 39(2), pp. 142–151.
Rutter, M. et al. (1979) Fifteen Thousand Hours: Secondary Schools and Their Effects on Children. London: Open Books.
Sammons, P., Hillman, J., Mortimore, P. (1995) Key Characteristics of Effective Schools: A Review of School Effectiveness Research. London: In-stitute of Education.
Sandoval-Hernandez, A. (2008) School effectiveness research: a review of criticisms and some proposals to address them. Educate~ Special Is-sue, March 2008, pp 31-44.
Sandoval-Hernandez, A. (2010) Towards a Realist Methodology for School Effectiveness Research: A Case Study of Educational Inequality from Mexico (Unpublished PhD thesis). University of Bath.
Scheerens, J. (1997) Conceptual models and theory-embedded principles on effective schooling. Sch. Eff. Sch. Improv. 8(3), pp. 269–310.
Seeley, D. S., Niemeyer, J. S., Greenspan, R. (1990) Principals speak: Improving innercity elementary schools. Report on interviews with 25 New York City principals. New York: City University of New York.
Sirin, S. R. (2005). Socioeconomic Status and Academic Achievement : A Meta-Analytic Review of Research. Review of Educational Research, 75(3), 417–453.
š ol s ko p olj e , l e t n i k x x v, š t e v i l k a 3 –4
96
Slee, R., Weiner, G., Tomlinson, S. (1998) School Effectiveness for whom? Challenges to the school effectiveness and school improvement movements. London: Falmer Press.
Stoll, L. (1999) Realising Our Potential: Understanding and Developing Capacity for Lasting Improvement. Sch. Eff. Sch. Improv. 10(4), pp. 503–532.
Stringfield, S., Slavin, R. E. (1992) A hierarchical longitudinal model for elementary school effects. In Creemers, B. P. M., Reezigt, G. J. (eds.), Evaluation of Educational Effectiveness. Groningen: ICO, pp. 35–69.
Teddlie, C., Stringfield, S. (1993) Schools Make a Difference: Lessons Learned from a 10Year Study of School Effects. New York: Teachers College Press.
Thrupp, M. (1999) Schools Making a Difference: Let’s Be Realistic! London: Open University Press.
Tieben, N., & Wolbers, M. (2010). Success and failure in secondary edu-cation: socio-economic background effects on secondary school out-come in the Netherlands, 1927–1998. British Journal of Sociology of Education, 31(3), 277–290.
Vandenberghe, V., Dupriez, V., & Zachary, M. D. (2001). Is there an effec-tiveness-equity trade-off? A cross-country comparison using TIMSS test scores. In W. Hutmacher, D. Cochrane, & N. Bottani (Eds.), In pursuit of equity in education (pp. 243–252). Dordrecht: Kluwer Ac-ademic Publishers.