A Comparative Evaluation of Operational Efficiency of Wood ...
12
........... Kropivšek, Perić, Pirc Barčić, Grošelj, Motik, Jošt: A Comparative Evaluation... DRVNA INDUSTRIJA 69 (3) 287-298 (2019) 287 Jože Kropivšek 1 , Ivana Perić 2 , Andreja Pirc Barčić 2 , Petra Grošelj 3 , Darko Motik 2 , Matej Jošt 1 A Comparative Evaluation of Operational Efficiency of Wood Industry Using Data Envelopment Analysis and Malmquist Productivity Index: the Cases of Slovenia and Croatia Usporedna procjena operativne u č inkovitosti drvne industrije Slovenije i Hrvatske primjenom analize ome đivanja podataka i Malmquistova indeksa produktivnosti Original scientific paper • Izvorni znanstveni rad Received – prispjelo: 10. 6. 2019. Accepted – prihvaćeno: 4. 7. 2019. UDK: 630*79 https://doi.org/10.5552/drvind.2019.1937 ABSTRACT • The wood industry, as a traditional sector, represents a very important part of the economy in terms of ensuring a sustainable development of society and transition to a low-carbon society in both countries studied, Slovenia and Croatia. For its further development, it is crucial to know the current position of the industry. The best way to achieve this is an analysis of financial data and international comparative evaluation of its operational efficiency. The aim of the research is to compare the relative efficiency of the wood industry using Data Envelop- ment Analysis (DEA) and the Malmquist Productivity Index (MI), focusing on the Slovenian and Croatian wood industry sectors (C16 and C31) for a recent five-year period (from 2013-2017). With this purpose, the combined measure DEA/MI was applied. The analysis includes only the highest rated companies with more than five employ- ees, divided into 12 clusters regarding the company size. As a result, it was established that clusters CRO-C31- micro, CRO-C16-micro and SI-C16-larger have the highest operational efficiency, due to the effects of different financial indicators, especially activity and liquidity ratios. In general, within the grouped clusters regarding country and subsector, groups SI-C16 and CRO-C31 achieve the highest values for the average of weighted score of efficiency, while CRO-C16 achieves the lowest values. Keywords: financial analysis, financial ratio, wood industry, Slovenia, Croatia, DEA, Malmquist Index 1 Authors are assistant professor and teaching assistant at University of Ljubljana, Biotechnical Faculty, Department of Wood Science and Technology, Ljubljana, Slovenia. 2 The authors are a postdoctoral researcher, assistant professor and professor at University of Zagreb, Fac- ulty of Forestry, Wood Technology Department, Zagreb, Republic of Croatia 3 Author is assistant professor at University of Ljubljana, Bio- technical Faculty, Department of Forestry and Renewable Forest Resources, Ljubljana, Slovenia. 1 Autori su docent i asistent Sveučilišta u Ljubljani, Biotehnički fakultet, Zavod za znanost o drvu i tehnologiju, Ljubljana, Slovenija. 2 Autori su postdoktorand, docent i profesor Sveučilišta u Zagrebu, Šumarski fakultet, Drvnotehnološki odsjek, Zagreb, Hrvatska. 3 Autor je docent Sveučilišta u Ljubljani, Biotehnički fakultet, Zavod za šumarstvo i obnovljive šumske resurse, Ljubljana, Slovenija.
-
Upload
khangminh22 -
Category
Documents
-
view
1 -
download
0
Transcript of A Comparative Evaluation of Operational Efficiency of Wood ...
...........Kropivšek, Perić, Pirc Barčić, Grošelj, Motik, Jošt: A Comparative Evaluation...
DRVNA INDUSTRIJA 69 (3) 287-298 (2019) 287
Jože Kropivšek1, Ivana Perić2, Andreja Pirc Barčić2, Petra Grošelj3, Darko Motik2, Matej Jošt1
A Comparative Evaluation of Operational Efficiency of Wood Industry Using Data Envelopment Analysis and Malmquist Productivity Index: the Cases of Slovenia and CroatiaUsporedna procjena operativne učinkovitosti drvne industrije Slovenije i Hrvatske primjenom analize omeđivanja podataka i Malmquistova indeksa produktivnosti
Original scientifi c paper • Izvorni znanstveni radReceived – prispjelo: 10. 6. 2019.Accepted – prihvaćeno: 4. 7. 2019.UDK: 630*79https://doi.org/10.5552/drvind.2019.1937
ABSTRACT • The wood industry, as a traditional sector, represents a very important part of the economy in terms of ensuring a sustainable development of society and transition to a low-carbon society in both countries studied, Slovenia and Croatia. For its further development, it is crucial to know the current position of the industry. The best way to achieve this is an analysis of fi nancial data and international comparative evaluation of its operational effi ciency. The aim of the research is to compare the relative effi ciency of the wood industry using Data Envelop-ment Analysis (DEA) and the Malmquist Productivity Index (MI), focusing on the Slovenian and Croatian wood industry sectors (C16 and C31) for a recent fi ve-year period (from 2013-2017). With this purpose, the combined measure DEA/MI was applied. The analysis includes only the highest rated companies with more than fi ve employ-ees, divided into 12 clusters regarding the company size. As a result, it was established that clusters CRO-C31-micro, CRO-C16-micro and SI-C16-larger have the highest operational effi ciency, due to the effects of different fi nancial indicators, especially activity and liquidity ratios. In general, within the grouped clusters regarding country and subsector, groups SI-C16 and CRO-C31 achieve the highest values for the average of weighted score of effi ciency, while CRO-C16 achieves the lowest values.
Keywords: fi nancial analysis, fi nancial ratio, wood industry, Slovenia, Croatia, DEA, Malmquist Index
1 Authors are assistant professor and teaching assistant at University of Ljubljana, Biotechnical Faculty, Department of Wood Science and Technology, Ljubljana, Slovenia. 2 The authors are a postdoctoral researcher, assistant professor and professor at University of Zagreb, Fac-ulty of Forestry, Wood Technology Department, Zagreb, Republic of Croatia 3Author is assistant professor at University of Ljubljana, Bio-technical Faculty, Department of Forestry and Renewable Forest Resources, Ljubljana, Slovenia.
1 Autori su docent i asistent Sveučilišta u Ljubljani, Biotehnički fakultet, Zavod za znanost o drvu i tehnologiju, Ljubljana, Slovenija. 2Autori su postdoktorand, docent i profesor Sveučilišta u Zagrebu, Šumarski fakultet, Drvnotehnološki odsjek, Zagreb, Hrvatska. 3Autor je docent Sveučilišta u Ljubljani, Biotehnički fakultet, Zavod za šumarstvo i obnovljive šumske resurse, Ljubljana, Slovenija.
Kropivšek, Perić, Pirc Barčić, Grošelj, Motik, Jošt: A Comparative Evaluation... ...........
288 DRVNA INDUSTRIJA 69 (3) 287-298 (2019)
SAŽETAK • Drvna industrija Sloveniji i Hrvatskoj tradicionalan je gospodarski sektor tih zemalja i vrlo važan dio gospodarstva u smislu osiguranja održivog razvoja društva i prijelaza na društvo s niskim udjelom uglji-ka. Za daljnji razvoj drvnoga sektora bitno je poznavati trenutačni položaj industrije, a najbolji način za to je analiza fi nancijskih podataka i internacionalna usporedna procjena industrijske operativne učinkovitosti. Cilj istraživanja bio je usporediti relativnu učinkovitost drvne industrije uz pomoć analize omeđivanja podataka (DEA) i Malmquistova indeksa produktivnosti (MI), s naglaskom na slovenski i hrvatski drvnoindustrijski sektor (C16 I C 31) tijekom posljednjih pet godina (2013. – 2017.). Za tu je svrhu primijenjena kombinirana mjera DEA/MI. Anal-izom su obuhvaćene samo najbolje ocijenjene tvrtke s više od pet zaposlenih, koje su s obzirom na njihovu veličinu podijeljene na 12 klastera. Utvrđeno je da klasteri CRO-C31-mikro, CRO-C16-mikro i SI-C16-veliki zbog utjecaja različitih fi nancijskih pokazatelja, posebice omjera aktivnosti i likvidnosti, imaju najveću operativnu učinkovitost. Općenito, unutar klastera grupiranih prema zemlji i podsektoru istraživanja, skupine SI-C16 i CRO-C31 pokazale su najviše vrijednosti za prosjek ponderirane ocjene učinkovitosti, a CRO-C16 imao je najniže vrijednosti.
Ključne riječi: fi nancijska analiza, fi nancijski omjer, drvna industrija, Slovenija, Hrvatska, DEA, Malmquistov indeks
1 INTRODUCTION1. UVOD
The wood industry, as a traditional sector, repre-sents a very important part of the economy in terms of ensuring a sustainable development of society, ena-bling a circular economy and transition to a low-carbon society (Klarić et al., 2016; Perić et al., 2015; Perić et al., 2019; Šooš et al., 2017). The management of natu-ral resources must be effective and sustainable, and on the other hand, it must provide growth and develop-ment for the economy, in order to make it even more successful. Financial analysis is often used in order to see the current condition of individual companies, sec-tors and countries, and this is an important tool for as-sessing the fi nancial position and success of a company and/or sector, in terms of calculating fi scal indicators, while measuring current fi scal conditions and perfor-mance, and predicting trends (Friedlob and Schleifer, 2003; Helfert, 2001; Palepu et al., 2003; Vance, 2003).
However, knowing the fi scal position of a coun-try is rather limited in terms of understanding the broader situation and trends, and it is also not enough to provide data and fi nancial analysis for just one sec-tor (Kropivšek and Grošelj, 2019; Potkány and Giertl, 2014), as only a comparative analysis using data from companies in different sectors and different countries can provide comprehensive information. There is little information with regard to international comparative fi nancial analysis of the wood sector in the literature, and there is no such analysis for Slovenia and Croatia. The wood-industry sector in Slovenia and Croatia has already been analysed fi nancially (Kropivšek et al., 2017, 2011; Kropivšek and Jošt, 2013; Pirc Barčić et al., 2015; Tratnik et al., 2001), but such analysis has been done separately for each country. In addition, an international comparative evaluation of the operational effi ciency of the wood-industry sector has never been done. This comparison would be very interesting, as Slovenia has a long tradition in the wood sector with a relatively stable economic situation, while Croatia has experienced signifi cant economic growth in recent years (CBS, 2019).
So, the aim of the current research is to use Data Envelopment Analysis (DEA) and the Malmquist Pro-ductivity Index (MI) to compare the relative effi ciency of the Slovenian and Croatian wood industry sectors (C16 (manufacture of wood and of products of wood and cork, except furniture; manufacture of articles of straw and plaiting materials; in short: wood process-ing) and C31 (manufacture of furniture)) (Braunsberg-er et al., 2010) for a recent fi ve-year period (from 2013-2017). With this purpose, the combined measure DEA/MI was applied. DEA/MI enables us to measure the productivity of decision-making units (DMUs), which is a combination of relative effi ciency and the change in productivity between two time periods, and to rank the DMUs regarding their productivity. The analysis includes only the highest rated companies (with a grade A fi nancial rating with regard to credit appraisal in 2017) and with more than fi ve employees.
The DEA approach and MI are widely used for evaluating the effi ciency and productivity changes of sectors in addition to the use of fi nancial indicators (Bui et al., 2016; Fenyves et al., 2015; Fernández et al., 2018; Halkos and Tzeremes, 2012a, 2012b; Johnes et al., 2009; Li and Wu, 2016; Liu and Wang, 2008; Örkcü et al., 2016; Sueyoshi and Goto, 2013). The DEA method has also been applied several times in the wood industry. For example, Salehirad and Sowlati (2006) prepared a review of productivity and effi cien-cy assessments of the wood industry in Canada. An analysis of productive effi ciency has also been carried out for Spain’s wood-based industry (Diaz-Balteiro et al., 2006), the Iranian wood panels industry (Hemmasi et al., 2011), Canadian wood-product manufacturing subsectors (Sowlati and Vahid, 2006) and Slovenian wood industry (Kropivšek and Grošelj, 2019). The MI has been used for evaluating the changes in productiv-ity of manufacturing industries in Canada, with a focus on the wood manufacturing sector (Sowlati and Vahid, 2006) and on primary wood producers in British Co-lumbia (Salehirad and Sowlati, 2007). The combined DEA/MI measure was also applied for evaluating po-lice force effi ciency (Hadad et al., 2015) and public forest services in Slovenia (Zadnik Stirn et al., 2015).
...........Kropivšek, Perić, Pirc Barčić, Grošelj, Motik, Jošt: A Comparative Evaluation...
DRVNA INDUSTRIJA 69 (3) 287-298 (2019) 289
2 MATERIALS AND METHODS2. MATERIJALI I METODE
2.1 Sample2.1. Uzorak
In calculating the indicators, the fi nancial data for the highest rated companies and sole proprietors (with the grade A in the fi nancial rating for the credit apprais-al in 2017) and with more than fi ve employees in 2017 operating in sub-sectors C16 (wood processing) and C31 (manufacture of furniture) in Slovenia and Croatia were considered, according to the sub-sector level data in the classifi cation of economic activities NACE (No-menclature of Economic Activities) rev.2 classifi cation (NACE, 2019). The research was based on searching and preparing data from offi cial statistical databases (Ajpes JOLP, 2019; Analitika GZS, 2019; Bisnode, 2019) for the period from 2013 to 2017 (fi ve years).
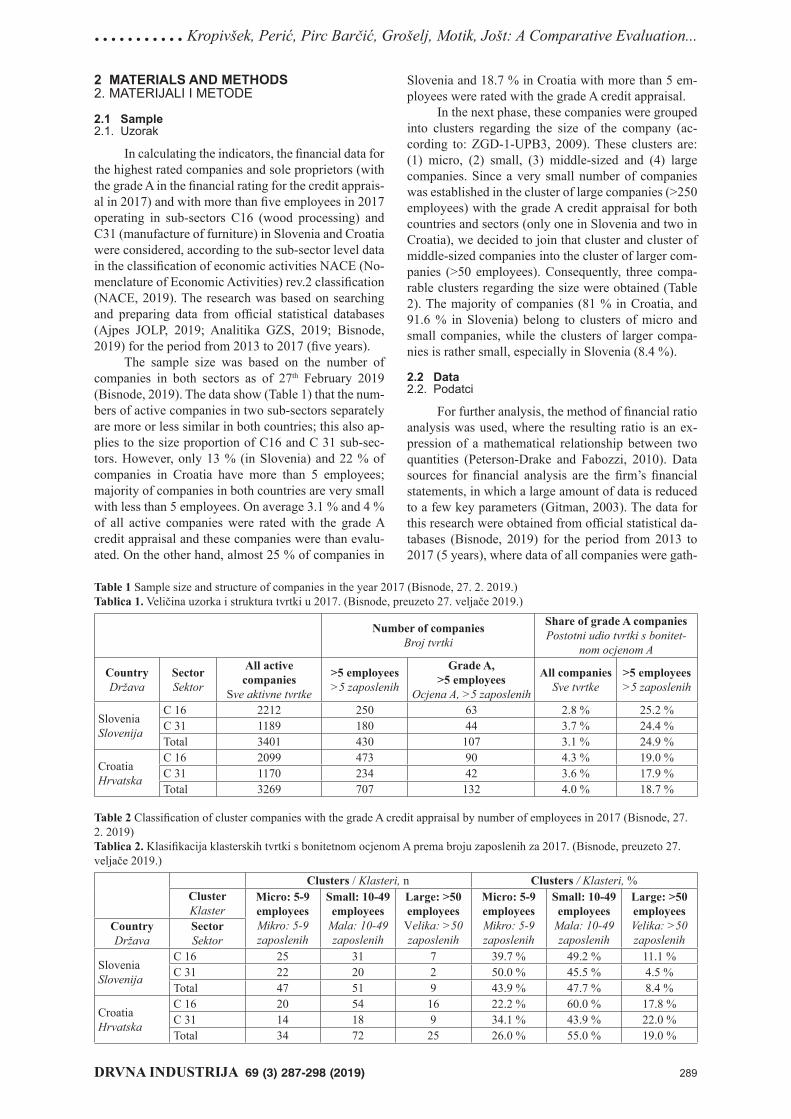
The sample size was based on the number of companies in both sectors as of 27th February 2019 (Bisnode, 2019). The data show (Table 1) that the num-bers of active companies in two sub-sectors separately are more or less similar in both countries; this also ap-plies to the size proportion of C16 and C 31 sub-sec-tors. However, only 13 % (in Slovenia) and 22 % of companies in Croatia have more than 5 employees; majority of companies in both countries are very small with less than 5 employees. On average 3.1 % and 4 % of all active companies were rated with the grade A credit appraisal and these companies were than evalu-ated. On the other hand, almost 25 % of companies in
Slovenia and 18.7 % in Croatia with more than 5 em-ployees were rated with the grade A credit appraisal.
In the next phase, these companies were grouped into clusters regarding the size of the company (ac-cording to: ZGD-1-UPB3, 2009). These clusters are: (1) micro, (2) small, (3) middle-sized and (4) large companies. Since a very small number of companies was established in the cluster of large companies (>250 employees) with the grade A credit appraisal for both countries and sectors (only one in Slovenia and two in Croatia), we decided to join that cluster and cluster of middle-sized companies into the cluster of larger com-panies (>50 employees). Consequently, three compa-rable clusters regarding the size were obtained (Table 2). The majority of companies (81 % in Croatia, and 91.6 % in Slovenia) belong to clusters of micro and small companies, while the clusters of larger compa-nies is rather small, especially in Slovenia (8.4 %).
2.2 Data2.2. Podatci
For further analysis, the method of fi nancial ratio analysis was used, where the resulting ratio is an ex-pression of a mathematical relationship between two quantities (Peterson-Drake and Fabozzi, 2010). Data sources for fi nancial analysis are the fi rm’s fi nancial statements, in which a large amount of data is reduced to a few key parameters (Gitman, 2003). The data for this research were obtained from offi cial statistical da-tabases (Bisnode, 2019) for the period from 2013 to 2017 (5 years), where data of all companies were gath-
Table 1 Sample size and structure of companies in the year 2017 (Bisnode, 27. 2. 2019.)Tablica 1. Veličina uzorka i struktura tvrtki u 2017. (Bisnode, preuzeto 27. veljače 2019.)
Number of companiesBroj tvrtki
Share of grade A companiesPostotni udio tvrtki s bonitet-
nom ocjenom A
CountryDržava
SectorSektor
All activecompanies
Sve aktivne tvrtke
>5 employees>5 zaposlenih
Grade A, >5 employees
Ocjena A, >5 zaposlenih
All companiesSve tvrtke
>5 employees>5 zaposlenih
SloveniaSlovenija
C 16 2212 250 63 2.8 % 25.2 %C 31 1189 180 44 3.7 % 24.4 %Total 3401 430 107 3.1 % 24.9 %
CroatiaHrvatska
C 16 2099 473 90 4.3 % 19.0 %C 31 1170 234 42 3.6 % 17.9 %Total 3269 707 132 4.0 % 18.7 %
Table 2 Classifi cation of cluster companies with the grade A credit appraisal by number of employees in 2017 (Bisnode, 27. 2. 2019)Tablica 2. Klasifi kacija klasterskih tvrtki s bonitetnom ocjenom A prema broju zaposlenih za 2017. (Bisnode, preuzeto 27. veljače 2019.)
Clusters / Klasteri, n Clusters / Klasteri, %ClusterKlaster
Micro: 5-9 employeesMikro: 5-9 zaposlenih
Small: 10-49employees
Mala: 10-49 zaposlenih
Large: >50employees
Velika: >50 zaposlenih
Micro: 5-9employeesMikro: 5-9 zaposlenih
Small: 10-49employees
Mala: 10-49 zaposlenih
Large: >50employeesVelika: >50 zaposlenih
CountryDržava
SectorSektor
SloveniaSlovenija
C 16 25 31 7 39.7 % 49.2 % 11.1 %C 31 22 20 2 50.0 % 45.5 % 4.5 %Total 47 51 9 43.9 % 47.7 % 8.4 %
CroatiaHrvatska
C 16 20 54 16 22.2 % 60.0 % 17.8 %C 31 14 18 9 34.1 % 43.9 % 22.0 %Total 34 72 25 26.0 % 55.0 % 19.0 %
Kropivšek, Perić, Pirc Barčić, Grošelj, Motik, Jošt: A Comparative Evaluation... ...........
290 DRVNA INDUSTRIJA 69 (3) 287-298 (2019)
ered and calculated in aggregate form within each clus-ter separately for both countries.
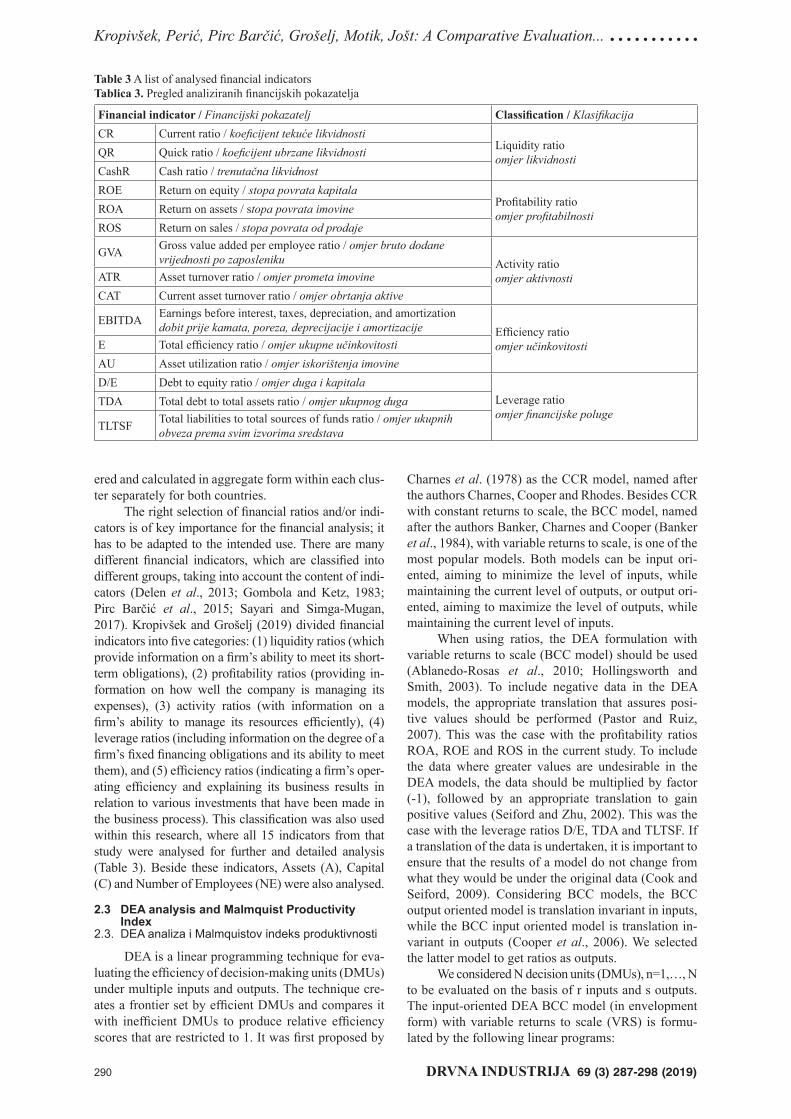
The right selection of fi nancial ratios and/or indi-cators is of key importance for the fi nancial analysis; it has to be adapted to the intended use. There are many different fi nancial indicators, which are classifi ed into different groups, taking into account the content of indi-cators (Delen et al., 2013; Gombola and Ketz, 1983; Pirc Barčić et al., 2015; Sayari and Simga-Mugan, 2017). Kropivšek and Grošelj (2019) divided fi nancial indicators into fi ve categories: (1) liquidity ratios (which provide information on a fi rm’s ability to meet its short-term obligations), (2) profi tability ratios (providing in-formation on how well the company is managing its expenses), (3) activity ratios (with information on a fi rm’s ability to manage its resources effi ciently), (4) leverage ratios (including information on the degree of a fi rm’s fi xed fi nancing obligations and its ability to meet them), and (5) effi ciency ratios (indicating a fi rm’s oper-ating effi ciency and explaining its business results in relation to various investments that have been made in the business process). This classifi cation was also used within this research, where all 15 indicators from that study were analysed for further and detailed analysis (Table 3). Beside these indicators, Assets (A), Capital (C) and Number of Employees (NE) were also analysed.
2.3 DEA analysis and Malmquist Productivity Index
2.3. DEA analiza i Malmquistov indeks produktivnosti
DEA is a linear programming technique for eva-luating the effi ciency of decision-making units (DMUs) under multiple inputs and outputs. The technique cre-ates a frontier set by effi cient DMUs and compares it with ineffi cient DMUs to produce relative effi ciency scores that are restricted to 1. It was fi rst proposed by
Charnes et al. (1978) as the CCR model, named after the authors Charnes, Cooper and Rhodes. Besides CCR with constant returns to scale, the BCC model, named after the authors Banker, Charnes and Cooper (Banker et al., 1984), with variable returns to scale, is one of the most popular models. Both models can be input ori-ented, aiming to minimize the level of inputs, while maintaining the current level of outputs, or output ori-ented, aiming to maximize the level of outputs, while maintaining the current level of inputs.
When using ratios, the DEA formulation with variable returns to scale (BCC model) should be used (Ablanedo-Rosas et al., 2010; Hollingsworth and Smith, 2003). To include negative data in the DEA models, the appropriate translation that assures posi-tive values should be performed (Pastor and Ruiz, 2007). This was the case with the profi tability ratios ROA, ROE and ROS in the current study. To include the data where greater values are undesirable in the DEA models, the data should be multiplied by factor (-1), followed by an appropriate translation to gain positive values (Seiford and Zhu, 2002). This was the case with the leverage ratios D/E, TDA and TLTSF. If a translation of the data is undertaken, it is important to ensure that the results of a model do not change from what they would be under the original data (Cook and Seiford, 2009). Considering BCC models, the BCC output oriented model is translation invariant in inputs, while the BCC input oriented model is translation in-variant in outputs (Cooper et al., 2006). We selected the latter model to get ratios as outputs.
We considered N decision units (DMUs), n=1,…, N to be evaluated on the basis of r inputs and s outputs. The input-oriented DEA BCC model (in envelopment form) with variable returns to scale (VRS) is formu-lated by the following linear programs:
Table 3 A list of analysed fi nancial indicatorsTablica 3. Pregled analiziranih fi nancijskih pokazatelja
Financial indicator / Financijski pokazatelj Classifi cation / Klasifi kacijaCR Current ratio / koefi cijent tekuće likvidnosti
Liquidity ratioomjer likvidnostiQR Quick ratio / koefi cijent ubrzane likvidnosti
CashR Cash ratio / trenutačna likvidnostROE Return on equity / stopa povrata kapitala
Profi tability ratioomjer profi tabilnostiROA Return on assets / stopa povrata imovine
ROS Return on sales / stopa povrata od prodaje
GVA Gross value added per employee ratio / omjer bruto dodane vrijednosti po zaposleniku Activity ratio
omjer aktivnostiATR Asset turnover ratio / omjer prometa imovineCAT Current asset turnover ratio / omjer obrtanja aktive
EBITDA Earnings before interest, taxes, depreciation, and amortizationdobit prije kamata, poreza, deprecijacije i amortizacije Effi ciency ratio
omjer učinkovitostiE Total effi ciency ratio / omjer ukupne učinkovitostiAU Asset utilization ratio / omjer iskorištenja imovineD/E Debt to equity ratio / omjer duga i kapitala
Leverage ratioomjer fi nancijske poluge
TDA Total debt to total assets ratio / omjer ukupnog duga
TLTSF Total liabilities to total sources of funds ratio / omjer ukupnihobveza prema svim izvorima sredstava
...........Kropivšek, Perić, Pirc Barčić, Grošelj, Motik, Jošt: A Comparative Evaluation...
DRVNA INDUSTRIJA 69 (3) 287-298 (2019) 291
(1)
w here Ei is the relative effi ciency of assessed DMU i, ε is a non-Archimedean infi nitesimal value designed to enforce strict positivity on the variables, xjn is the amount of input j used by DMU n, yknis the amount of output k produced by DMU n, sj
– and sj+ are vectors of
slack variables and λn are linear weights.The Malmquist Productivity Index MI was devel-
oped by Färe et al. (1994) to measure the total productiv-ity changes between time periods t (base period) and t+1
(2)
where y represents the output vector that can be pro-duced by the input vector x. Dt (xt, yt) is defi ned as the output distance function. DMU’s total productivity im-proves if MI>1, remains unchanged for MI=1 and de-clines for MI<1.
The combined DEA/MI score is calculated to rank the DMUs (Hadad et al., 2015; Zadnik Stirn et al., 2015). First, we calculate the average effi ciency of DMU i as the arithmetic mean of the relative effi cien-cies of DMU i over T time periods
(3)
where Ei, t is a relative effi ciency of DMU i in time pe-riod t derived by the VRS model. Then we calculate the average Malmquist productivity index of DMU i as the geometric mean of MI of DMU i over T time periods. As MI can be greater than 1, the average MI should be normalized:
(4)
where MIi, t–1, t is a MI of DMU i over time periods t and t+1 derived by model. The DEA/MI score for each model j=1,…,M is the weighted sum of the average effi ciency and the normalized average of MI:
(5)
where w1 and w2 are the weights of importance of the DEA and MI parts, respectively, with w1 + w2 = 1. The fi nal DEA / MIi score is the weighted sum of DEA/MIi(j) scores over all the models j=1,…,M:
(6)
where uj, j = 1,..., M are the weights of importance of
the DEA/MI models, with =1.
Different models have been created for detailed analysis of the effi ciency of sub-sectors in both coun-tries. Based on many studies (Bui et al., 2016; Fenyves et al., 2015; Halkos and Tzeremes, 2012a, 2012b; Li and Wu, 2016; Nikoomaram et al., 2010; Oberholzer and Westhuizen, 2004), where fi nancial ratios have been used for DEA models, we formed our models us-ing different ratios.
Five DEA models were considered with selected groups of ratios as outputs. Liquidity ratios were the outputs for Model 1, profi tability ratios for Model 2, activity ratios for Model 3, effi ciency ratios for Model 4 and leverage ratios for Model 5 (Table 3). Non-ratio data (Assets (A), Capital (C) and Number of Employ-ees (NE)) were used as inputs for all models.
For all inputs and outputs of Models 1-5, the time series within the period from 2013 to 2017 were ana-lysed using IBM SPSS Statistics V25. One-way ANOVA was used to test the differences in input and output val-ues between two sub-sectors and between Slovenia and Croatia. The Kolmogorov–Smirnov test was performed to check the normality of the data and Levene’s test was performed to check the differences between the variances of the groups. Post-hoc tests were used to detect the differences between pairs of compared groups, Bonferroni’s procedure when the data vari-ances were similar and Games-Howell procedure in case of doubt about the equality of data variances.
3 RESULTS AND DISCUSSION3. REZULTATI I RASPRAVA
3.1 Descriptive statistics and post-hoc tests3.1. Deskriptivna statistika i post-hoc testovi
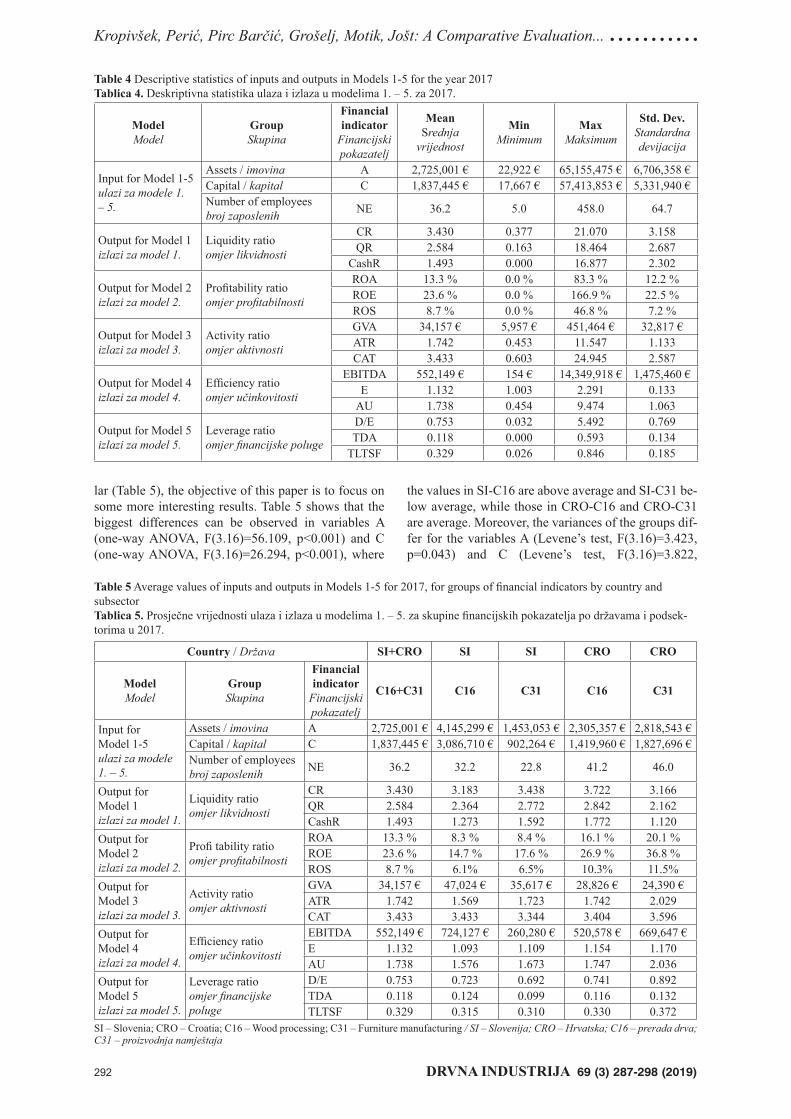
The descriptive statistics of inputs and outputs of Models 1-5 for the year 2017 are presented in Table 4. The sample for calculating descriptive statistics in-cludes companies with the grade A fi nancial rating for their credit appraisal and with more than fi ve employ-ees in 2017. It is shown that there were statistically sig-nifi cant differences between the values of variables A, C, NE and EBITDA among the observed companies, which was expected as the sample includes micro, small and larger companies. It is interesting, however, that the values of most other indicators are very differ-ent, although only companies with a credit appraisal rating A with at least fi ve employees were taken into account. It can be established that, on average, all com-panies showed excellent solvency (liquidity) and prof-itability ratios, with a very low share of debts, which shows their excellence.
We tested the differences between the values of indicators for Slovenia (SI) and Croatia (CRO) and sectors C16 and C31. The differences between the four groups were statistically signifi cant for the majority of the indicators. Although the comparison also shows that the average values of the indicators are quite simi-
Kropivšek, Perić, Pirc Barčić, Grošelj, Motik, Jošt: A Comparative Evaluation... ...........
292 DRVNA INDUSTRIJA 69 (3) 287-298 (2019)
lar (Table 5), the objective of this paper is to focus on some more interesting results. Table 5 shows that the biggest differences can be observed in variables A (one-way ANOVA, F(3.16)=56.109, p<0.001) and C (one-way ANOVA, F(3.16)=26.294, p<0.001), where
the values in SI-C16 are above average and SI-C31 be-low average, while those in CRO-C16 and CRO-C31 are average. Moreover, the variances of the groups dif-fer for the variables A (Levene’s test, F(3.16)=3.423, p=0.043) and C (Levene’s test, F(3.16)=3.822,
Table 4 Descriptive statistics of inputs and outputs in Models 1-5 for the year 2017Tablica 4. Deskriptivna statistika ulaza i izlaza u modelima 1. – 5. za 2017.
ModelModel
GroupSkupina
Financial indicator
Financijski pokazatelj
MeanSrednja
vrijednost
MinMinimum
MaxMaksimum
Std. Dev.Standardna devijacija
Input for Model 1-5ulazi za modele 1. – 5.
Assets / imovina A 2,725,001 € 22,922 € 65,155,475 € 6,706,358 €Capital / kapital C 1,837,445 € 17,667 € 57,413,853 € 5,331,940 €Number of employeesbroj zaposlenih NE 36.2 5.0 458.0 64.7
Output for Model 1izlazi za model 1.
Liquidity ratioomjer likvidnosti
CR 3.430 0.377 21.070 3.158QR 2.584 0.163 18.464 2.687
CashR 1.493 0.000 16.877 2.302
Output for Model 2izlazi za model 2.
Profi tability ratioomjer profi tabilnosti
ROA 13.3 % 0.0 % 83.3 % 12.2 %ROE 23.6 % 0.0 % 166.9 % 22.5 %ROS 8.7 % 0.0 % 46.8 % 7.2 %
Output for Model 3izlazi za model 3.
Activity ratioomjer aktivnosti
GVA 34,157 € 5,957 € 451,464 € 32,817 €ATR 1.742 0.453 11.547 1.133CAT 3.433 0.603 24.945 2.587
Output for Model 4izlazi za model 4.
Effi ciency ratioomjer učinkovitosti
EBITDA 552,149 € 154 € 14,349,918 € 1,475,460 €E 1.132 1.003 2.291 0.133
AU 1.738 0.454 9.474 1.063
Output for Model 5izlazi za model 5.
Leverage ratioomjer fi nancijske poluge
D/E 0.753 0.032 5.492 0.769TDA 0.118 0.000 0.593 0.134
TLTSF 0.329 0.026 0.846 0.185
Table 5 Average values of inputs and outputs in Models 1-5 for 2017, for groups of fi nancial indicators by country and subsectorTablica 5. Prosječne vrijednosti ulaza i izlaza u modelima 1. – 5. za skupine fi nancijskih pokazatelja po državama i podsek-torima u 2017.
Country / Država SI+CRO SI SI CRO CRO
ModelModel
GroupSkupina
Financial indicator
Financijski pokazatelj
C16+C31 C16 C31 C16 C31
Input for Model 1-5ulazi za modele 1. – 5.
Assets / imovina A 2,725,001 € 4,145,299 € 1,453,053 € 2,305,357 € 2,818,543 €Capital / kapital C 1,837,445 € 3,086,710 € 902,264 € 1,419,960 € 1,827,696 €Number of employeesbroj zaposlenih NE 36.2 32.2 22.8 41.2 46.0
Output forModel 1izlazi za model 1.
Liquidity ratioomjer likvidnosti
CR 3.430 3.183 3.438 3.722 3.166QR 2.584 2.364 2.772 2.842 2.162CashR 1.493 1.273 1.592 1.772 1.120
Output forModel 2izlazi za model 2.
Profi tability ratioomjer profi tabilnosti
ROA 13.3 % 8.3 % 8.4 % 16.1 % 20.1 %ROE 23.6 % 14.7 % 17.6 % 26.9 % 36.8 %ROS 8.7 % 6.1% 6.5% 10.3% 11.5%
Output forModel 3izlazi za model 3.
Activity ratioomjer aktivnosti
GVA 34,157 € 47,024 € 35,617 € 28,826 € 24,390 €ATR 1.742 1.569 1.723 1.742 2.029CAT 3.433 3.433 3.344 3.404 3.596
Output forModel 4izlazi za model 4.
Effi ciency ratioomjer učinkovitosti
EBITDA 552,149 € 724,127 € 260,280 € 520,578 € 669,647 €E 1.132 1.093 1.109 1.154 1.170AU 1.738 1.576 1.673 1.747 2.036
Output forModel 5izlazi za model 5.
Leverage ratioomjer fi nancijskepoluge
D/E 0.753 0.723 0.692 0.741 0.892TDA 0.118 0.124 0.099 0.116 0.132TLTSF 0.329 0.315 0.310 0.330 0.372
SI – Slovenia; CRO – Croatia; C16 – Wood processing; C31 – Furniture manufacturing / SI – Slovenija; CRO – Hrvatska; C16 – prerada drva; C31 – proizvodnja namještaja

...........Kropivšek, Perić, Pirc Barčić, Grošelj, Motik, Jošt: A Comparative Evaluation...
DRVNA INDUSTRIJA 69 (3) 287-298 (2019) 293
p=0.031). Further, the Games–Howell post hoc test re-vealed that the differences between all pairs of four groups, except the pair SI-C16 and CRO-C16 for vari-able A and for all pairs of four groups for variable C, are statistically signifi cant. The differences between the four groups for variable NE is also statistically sig-nifi cant (one-way ANOVA, F(3.16)=105.669, p<0.001). The Bonferroni post hoc test revealed that the differences between pairs of all groups except pair SI-C16 and CRO-C31 are statistically signifi cant. There are no statistically signifi cant differences be-tween the groups of the profi tability ratios ROE (one-way ANOVA, F(3.16)=1.172, p=0.351) and ROA (one-way ANOVA, F(3.16)=2.578, p=0.090), and the only statistically signifi cant difference for variable ROS is between SI-C16 and SI-C31 (one-way ANO-VA, F(3.16)=4.182, p=0.023, Games-Howell post hoc test p=0.024). However, the average values of the prof-itability ratios differ quite a lot, as do their variances. The differences between the four groups for variable
GVA are statistically signifi cant (one-way ANOVA, F(3.16)=66.963, p<0.001) as well as for variable EBITDA (one-way ANOVA, F(3.16)=15.660, p<0.001). GVA shows much higher values in SI groups that CRO groups, with the highest value for the group SI-C16. Regarding the variable EBITDA, both CRO groups have average values, while SI-C31 achieves the highest and SI-C16 the lowest values.
3.2 Results of DEA and Malmquist Productivity Index
3.2. Rezultati DEA analize i Malmquistova indeksa produktivnosti
The DEA effi ciency analysis using the models over the years did not give any specifi c trend based on which it could be concluded that the effi ciency is in-creasing or decreasing over time. By comparing the effi ciency of average values using the models (Figure 1), it can be concluded that for all of them the most effective clusters are SI-C16-larger, CRO-C16-micro and CRO-C31-micro, while the worst effi ciency is
SI-C
16-m
icro
SI-C
16-s
mal
l
SI-C
16-la
rger
SI-C
31-m
icro
SI-C
31-s
mal
l
SI-C
31-la
rger
CR
O-C
16-m
icro
CR
O-C
16-s
mal
l
CR
O-C
16-la
rger
CR
O-C
31-m
icro
CR
O-C
31-s
mal
l
CR
O-C
31-la
rger
DE
A e
ffici
ency
D
EA
Cluster /
Model 1 Model 2 Model 3 Model 4 Model 5
1.0
0.8
0.6
0.4
0.2
0.0
Figure 1 DEA effi ciency analysis - average by years of Models 1-5Slika 1. Analiza učinkovitosti DEA – prosjek po godinama za modele 1. – 5.
SI-C
16-m
icro
SI-C
16-s
mal
l
SI-C
16-la
rger
SI-C
31-m
icro
SI-C
31-s
mal
l
SI-C
31-la
rger
CR
O-C
16-m
icro
CR
O-C
16-s
mal
l
CR
O-C
16-la
rger
CR
O-C
31-m
icro
CR
O-C
31-s
mal
l
CR
O-C
31-la
rger
Mal
mqu
ist i
ndex
Mal
mqu
isto
v in
deks
Model 1 Model 2 Model 3 Model 4 Model 51.3
1.2
1.1
1.0
0.9
0.8
0.7
Cluster / klaster
Figure 2 Malmquist Index - average by year of models 1-5Slika 2. Malmquistov indeks – prosječne vrijednosti po godinama za modele 1. – 5.
Kropivšek, Perić, Pirc Barčić, Grošelj, Motik, Jošt: A Comparative Evaluation... ...........
294 DRVNA INDUSTRIJA 69 (3) 287-298 (2019)
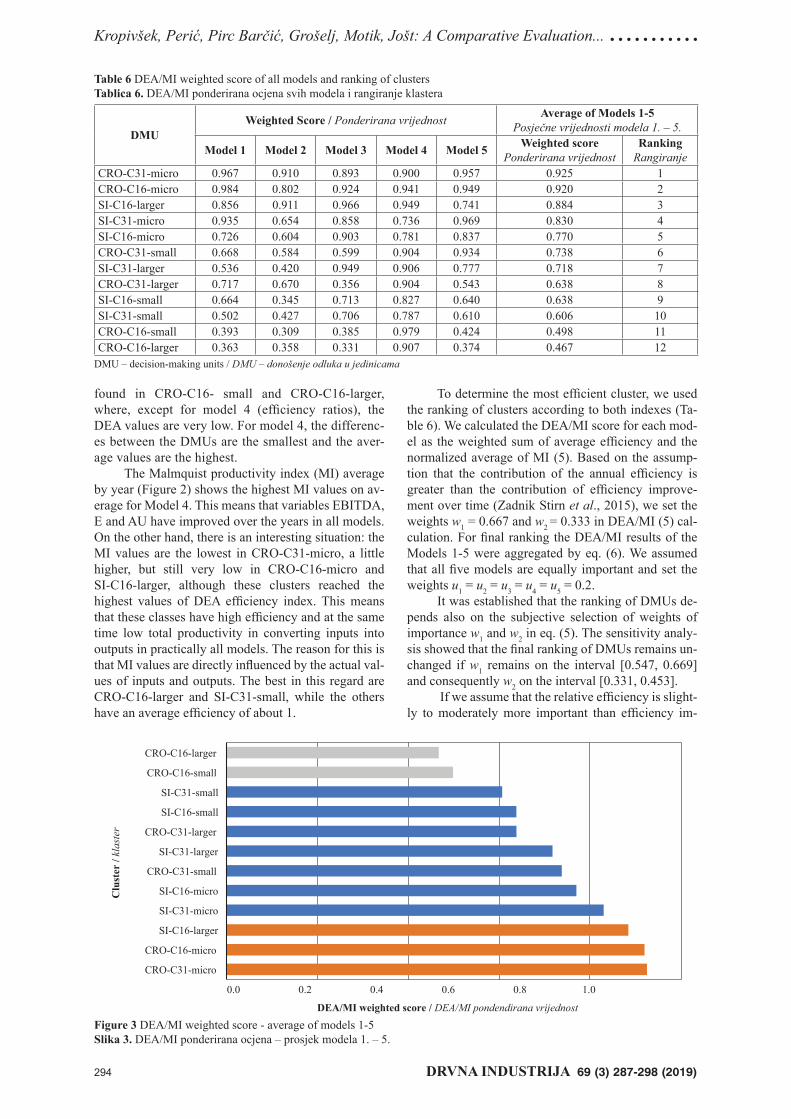
found in CRO-C16- small and CRO-C16-larger, where, except for model 4 (effi ciency ratios), the DEA values are very low. For model 4, the differenc-es between the DMUs are the smallest and the aver-age values are the highest.
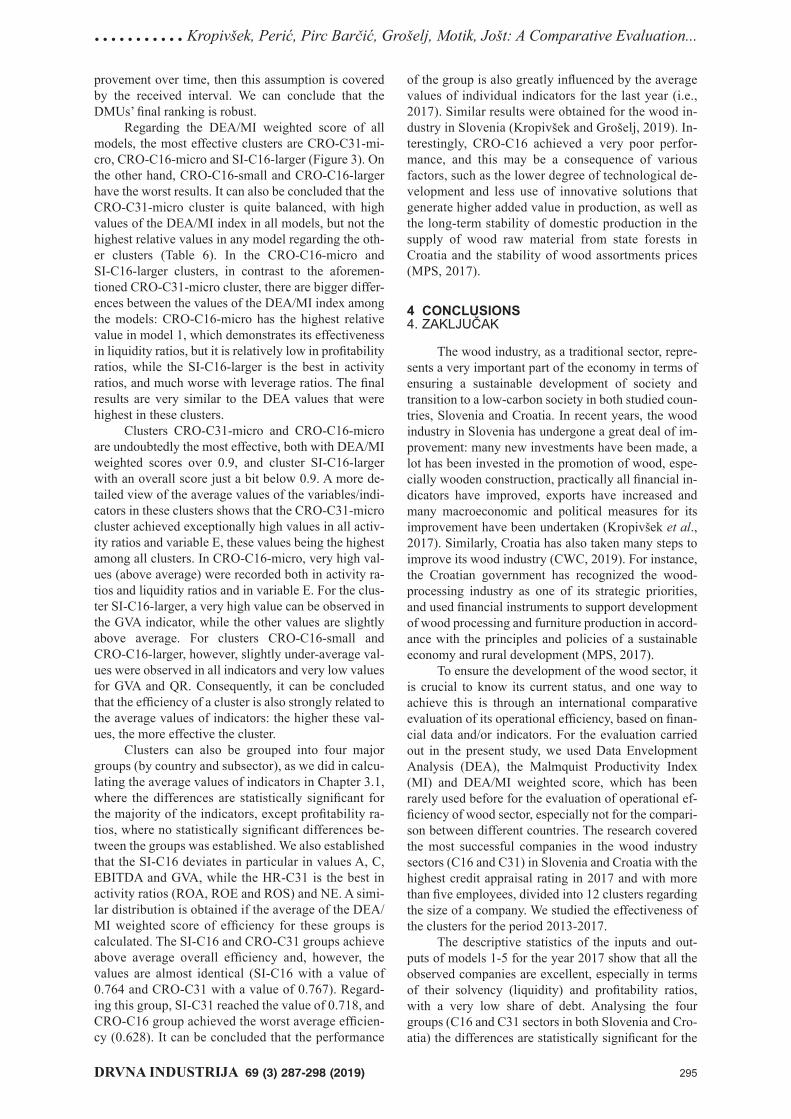
The Malmquist productivity index (MI) average by year (Figure 2) shows the highest MI values on av-erage for Model 4. This means that variables EBITDA, E and AU have improved over the years in all models. On the other hand, there is an interesting situation: the MI values are the lowest in CRO-C31-micro, a little higher, but still very low in CRO-C16-micro and SI-C16-larger, although these clusters reached the highest values of DEA effi ciency index. This means that these classes have high effi ciency and at the same time low total productivity in converting inputs into outputs in practically all models. The reason for this is that MI values are directly infl uenced by the actual val-ues of inputs and outputs. The best in this regard are CRO-C16-larger and SI-C31-small, while the others have an average effi ciency of about 1.
To determine the most effi cient cluster, we used the ranking of clusters according to both indexes (Ta-ble 6). We calculated the DEA/MI score for each mod-el as the weighted sum of average effi ciency and the normalized average of MI (5). Based on the assump-tion that the contribution of the annual effi ciency is greater than the contribution of effi ciency improve-ment over time (Zadnik Stirn et al., 2015), we set the weights w1 = 0.667 and w2 = 0.333 in DEA/MI (5) cal-culation. For fi nal ranking the DEA/MI results of the Models 1-5 were aggregated by eq. (6). We assumed that all fi ve models are equally important and set the weights u1 = u2 = u3 = u4 = u5 = 0.2.
It was established that the ranking of DMUs de-pends also on the subjective selection of weights of importance w1 and w2 in eq. (5). The sensitivity analy-sis showed that the fi nal ranking of DMUs remains un-changed if w1 remains on the interval [0.547, 0.669] and consequently w2 on the interval [0.331, 0.453].
If we assume that the relative effi ciency is slight-ly to moderately more important than effi ciency im-
Table 6 DEA/MI weighted score of all models and ranking of clustersTablica 6. DEA/MI ponderirana ocjena svih modela i rangiranje klastera
DMUWeighted Score / Ponderirana vrijednost Average of Models 1-5
Posječne vrijednosti modela 1. – 5.
Model 1 Model 2 Model 3 Model 4 Model 5 Weighted scorePonderirana vrijednost
RankingRangiranje
CRO-C31-micro 0.967 0.910 0.893 0.900 0.957 0.925 1CRO-C16-micro 0.984 0.802 0.924 0.941 0.949 0.920 2SI-C16-larger 0.856 0.911 0.966 0.949 0.741 0.884 3SI-C31-micro 0.935 0.654 0.858 0.736 0.969 0.830 4SI-C16-micro 0.726 0.604 0.903 0.781 0.837 0.770 5CRO-C31-small 0.668 0.584 0.599 0.904 0.934 0.738 6SI-C31-larger 0.536 0.420 0.949 0.906 0.777 0.718 7CRO-C31-larger 0.717 0.670 0.356 0.904 0.543 0.638 8SI-C16-small 0.664 0.345 0.713 0.827 0.640 0.638 9SI-C31-small 0.502 0.427 0.706 0.787 0.610 0.606 10CRO-C16-small 0.393 0.309 0.385 0.979 0.424 0.498 11CRO-C16-larger 0.363 0.358 0.331 0.907 0.374 0.467 12
DMU – decision-making units / DMU – donošenje odluka u jedinicama
CRO-C31-micro
CRO-C16-micro
SI-C16-larger
SI-C31-micro
SI-C16-micro
CRO-C31-small
SI-C31-larger
CRO-C31-larger
SI-C16-small
SI-C31-small
CRO-C16-small
CRO-C16-larger
DEA/MI weighted score / DEA/MI pondendirana vrijednost
0.0 0.2 0.4 0.6 0.8 1.0
Clu
ster
/ kl
aste
r
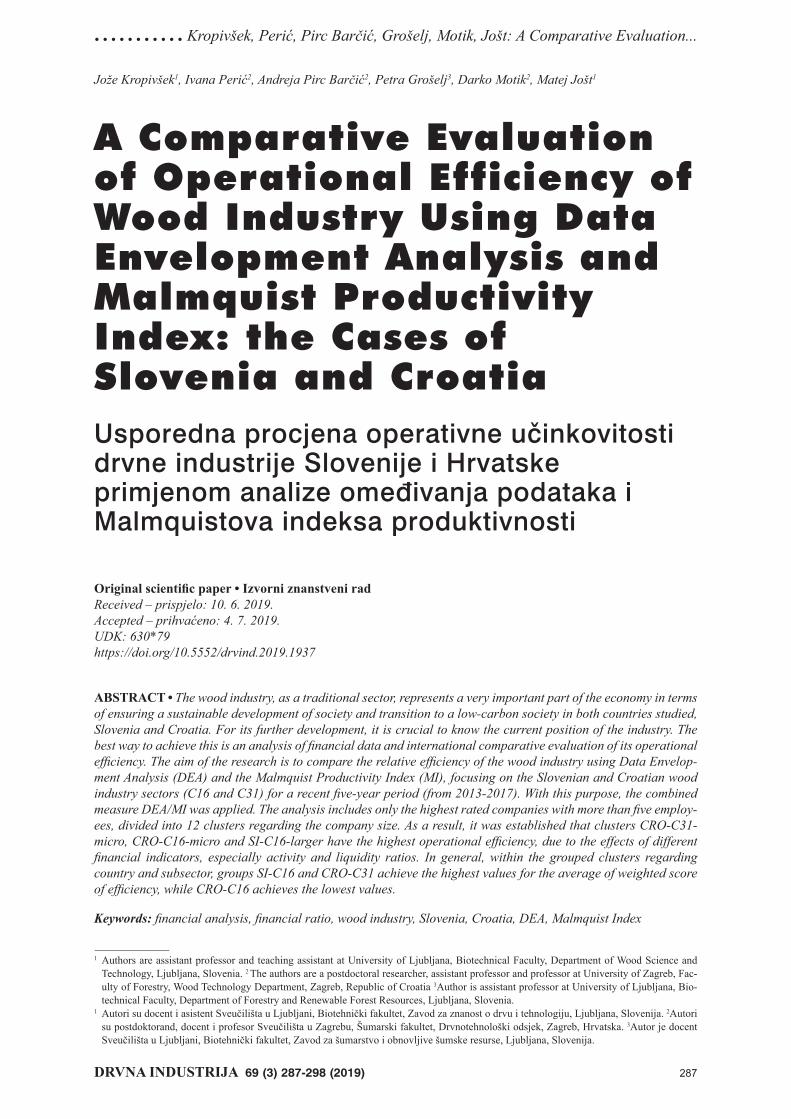
Figure 3 DEA/MI weighted score - average of models 1-5Slika 3. DEA/MI ponderirana ocjena – prosjek modela 1. – 5.
...........Kropivšek, Perić, Pirc Barčić, Grošelj, Motik, Jošt: A Comparative Evaluation...
DRVNA INDUSTRIJA 69 (3) 287-298 (2019) 295
provement over time, then this assumption is covered by the received interval. We can conclude that the DMUs’ fi nal ranking is robust.
Regarding the DEA/MI weighted score of all models, the most effective clusters are CRO-C31-mi-cro, CRO-C16-micro and SI-C16-larger (Figure 3). On the other hand, CRO-C16-small and CRO-C16-larger have the worst results. It can also be concluded that the CRO-C31-micro cluster is quite balanced, with high values of the DEA/MI index in all models, but not the highest relative values in any model regarding the oth-er clusters (Table 6). In the CRO-C16-micro and SI-C16-larger clusters, in contrast to the aforemen-tioned CRO-C31-micro cluster, there are bigger differ-ences between the values of the DEA/MI index among the models: CRO-C16-micro has the highest relative value in model 1, which demonstrates its effectiveness in liquidity ratios, but it is relatively low in profi tability ratios, while the SI-C16-larger is the best in activity ratios, and much worse with leverage ratios. The fi nal results are very similar to the DEA values that were highest in these clusters.
Clusters CRO-C31-micro and CRO-C16-micro are undoubtedly the most effective, both with DEA/MI weighted scores over 0.9, and cluster SI-C16-larger with an overall score just a bit below 0.9. A more de-tailed view of the average values of the variables/indi-cators in these clusters shows that the CRO-C31-micro cluster achieved exceptionally high values in all activ-ity ratios and variable E, these values being the highest among all clusters. In CRO-C16-micro, very high val-ues (above average) were recorded both in activity ra-tios and liquidity ratios and in variable E. For the clus-ter SI-C16-larger, a very high value can be observed in the GVA indicator, while the other values are slightly above average. For clusters CRO-C16-small and CRO-C16-larger, however, slightly under-average val-ues were observed in all indicators and very low values for GVA and QR. Consequently, it can be concluded that the effi ciency of a cluster is also strongly related to the average values of indicators: the higher these val-ues, the more effective the cluster.
Clusters can also be grouped into four major groups (by country and subsector), as we did in calcu-lating the average values of indicators in Chapter 3.1, where the differences are statistically signifi cant for the majority of the indicators, except profi tability ra-tios, where no statistically signifi cant differences be-tween the groups was established. We also established that the SI-C16 deviates in particular in values A, C, EBITDA and GVA, while the HR-C31 is the best in activity ratios (ROA, ROE and ROS) and NE. A simi-lar distribution is obtained if the average of the DEA/MI weighted score of effi ciency for these groups is calculated. The SI-C16 and CRO-C31 groups achieve above average overall effi ciency and, however, the values are almost identical (SI-C16 with a value of 0.764 and CRO-C31 with a value of 0.767). Regard-ing this group, SI-C31 reached the value of 0.718, and CRO-C16 group achieved the worst average effi cien-cy (0.628). It can be concluded that the performance
of the group is also greatly infl uenced by the average values of individual indicators for the last year (i.e., 2017). Similar results were obtained for the wood in-dustry in Slovenia (Kropivšek and Grošelj, 2019). In-terestingly, CRO-C16 achieved a very poor perfor-mance, and this may be a consequence of various factors, such as the lower degree of technological de-velopment and less use of innovative solutions that generate higher added value in production, as well as the long-term stability of domestic production in the supply of wood raw material from state forests in Croatia and the stability of wood assortments prices (MPS, 2017).
4 CONCLUSIONS4. ZAKLJUČAK
The wood industry, as a traditional sector, repre-sents a very important part of the economy in terms of ensuring a sustainable development of society and transition to a low-carbon society in both studied coun-tries, Slovenia and Croatia. In recent years, the wood industry in Slovenia has undergone a great deal of im-provement: many new investments have been made, a lot has been invested in the promotion of wood, espe-cially wooden construction, practically all fi nancial in-dicators have improved, exports have increased and many macroeconomic and political measures for its improvement have been undertaken (Kropivšek et al., 2017). Similarly, Croatia has also taken many steps to improve its wood industry (CWC, 2019). For instance, the Croatian government has recognized the wood-processing industry as one of its strategic priorities, and used fi nancial instruments to support development of wood processing and furniture production in accord-ance with the principles and policies of a sustainable economy and rural development (MPS, 2017).
To ensure the development of the wood sector, it is crucial to know its current status, and one way to achieve this is through an international comparative evaluation of its operational effi ciency, based on fi nan-cial data and/or indicators. For the evaluation carried out in the present study, we used Data Envelopment Analysis (DEA), the Malmquist Productivity Index (MI) and DEA/MI weighted score, which has been rarely used before for the evaluation of operational ef-fi ciency of wood sector, especially not for the compari-son between different countries. The research covered the most successful companies in the wood industry sectors (C16 and C31) in Slovenia and Croatia with the highest credit appraisal rating in 2017 and with more than fi ve employees, divided into 12 clusters regarding the size of a company. We studied the effectiveness of the clusters for the period 2013-2017.
The descriptive statistics of the inputs and out-puts of models 1-5 for the year 2017 show that all the observed companies are excellent, especially in terms of their solvency (liquidity) and profi tability ratios, with a very low share of debt. Analysing the four groups (C16 and C31 sectors in both Slovenia and Cro-atia) the differences are statistically signifi cant for the
Kropivšek, Perić, Pirc Barčić, Grošelj, Motik, Jošt: A Comparative Evaluation... ...........
296 DRVNA INDUSTRIJA 69 (3) 287-298 (2019)
majority of the indicators, except for the profi tability ratios, where no statistically signifi cant differences be-tween the groups were established.
Regarding the DEA/MI weighted score of all models (Models 1-5), the most effective clusters are CRO-C31-micro, CRO-C16-micro and SI-C16-larger, while CRO-C16-small and CRO-C16-larger have the worst results. Those clusters are most effective (with the highest DEA values), but have low total productiv-ity (low MI values). The average values of the indica-tors in these groups are also above average, especially in activity ratios, liquidity ratios, indicator E and/or GVA. Consequently, it can be concluded that the effi -ciency of the cluster is also strongly correlated with the average values of the indicators. In general, within grouped clusters regarding country and subsector, groups SI-C16 and CRO-C31 achieve the highest aver-age values for the weighted score of effi ciency, while CRO-C16 has the lowest values.
Important potential limitations of this study are the sample size, where only 3.1% of the related fi rms in Slovenia and 4.0 % in Croatia were analysed, and a short period of observation. However, the results are still meaningful as they cover the best and largest companies (those with more than fi ve employees and rated A in credit appraisal), and give a more compara-ble picture between the countries and industries with all input data from business reports. As an extension of this study, it may be of interest to observe all the companies in the related sectors to get a more com-plete picture. It would also be very interesting to ex-pand the sample to more countries and use a longer observation period.
Acknowledgements – ZahvalaThe authors acknowledge the fi nancial support
this study received from the Slovenian Research Agen-cy (research core funding No. P4-0015 and P4-0059).
5 REFERENCES5. LITERATURA
1. Ablanedo-Rosas, J. H.; Gao, H.; Zheng, X.; Alidaee, B.; Wang, H., 2010: A study of the relative effi ciency of Chi-nese ports: a fi nancial ratio-based data envelopment anal-ysis approach. Expert Systems, 27: 349-362. http://dx.doi.org/10.1111/j.1468-0394.2010.00552.x.
2. Banker, R. D.; Charnes, A.; Cooper, W. W., 1984: Some Models for Estimating Technical and Scale Ineffi ciencies in Data Envelopment Analysis. Management Science, 30: 1078-1092.
http://dx.doi.org/10.1287/mnsc.30.9.1078.3. Braunsberger, F.; Hlavaty, M.; Schlamberger, N.;
Stevanovič, S., 2010: Standardna klasifi kacija dejavnosti 2008. Ljubljana: Statistični urad Republike Slovenije.
4. Bui, Y. H.; Sarath, D.; Ahmed, A. D., 2016: Effi ciency of Australian superannuation funds: a comparative assess-ment. Journal of Economic Studies, 43: 1022-1038. http://dx.doi.org/10.1108/JES-05-2015-0088.
5. Charnes, A.; Cooper, W. W.; Rhodes, E., 1978: Measur-ing the effi ciency of decision making units. European Journal of Operational Research, 2: 429-444.
http://dx.doi.org/10.1016/0377-2217(78)90138-8.
6. Cook, W. D.; Seiford, L. M., 2009: Data envelopment analysis (DEA) – Thirty years on. European Journal of Operational Research, 192: 1-17.
http://dx.doi.org/10.1016/j.ejor.2008.01.032.7. Cooper, W. W.; Seiford, L. M.; Tone, K., 2006: Intro-
duction to Data Envelopment Analysis and Its Uses: With DEA-Solver Software and References. Springer US.
8. Delen, D.; Kuzey, C.; Uyar, A., 2013: Measuring fi rm performance using fi nancial ratios: A decision tree ap-proach. Expert Systems with Applications, 40: 3970-3983. http://dx.doi.org/10.1016/j.eswa.2013.01.012.
9. Diaz-Balteiro, L.; Casimiro Herruzo, A.; Martinez, M.; González-Pachón, J., 2006: An analysis of productive effi ciency and innovation activity using DEA: An ap-plication to Spain’s wood-based industry. Forest Policy and Economics, Innovation and entrepreneurship in the forest sector, 8: 762-773.
http://dx.doi.org/10.1016/j.forpol.2005.06.004.10. Färe, R.; Grosskopf, S.; Norris, M.; Zhang, Z., 1994:
Productivity Growth, Technical Progress, and Effi cien-cy Change in Industrialized Countries. The American Economic Review, 84: 66-83.
11. Fenyves, V.; Tarnóczi, T.; Zsidó, K., 2015: Financial Performance Evaluation of Agricultural Enterprises with DEA Method. Procedia Economics and Finance, Emerging Markets Queries in Finance and Business 2014, EMQFB 2014, 24-25 October 2014, Bucharest, Romania 32: 423-431.
http://dx.doi.org/10.1016/S2212-5671(15)01413-6.12. Fernández, D.; Pozo, C.; Folgado, R.; Jiménez, L.;
Guillén-Gosálbez, G., 2018: Productivity and energy effi ciency assessment of existing industrial gases facili-ties via data envelopment analysis and the Malmquist index. Applied Energy, 212: 1563-1577.
http://dx.doi.org/10.1016/j.apenergy.2017.12.008.13. Friedlob, G. T.; Schleifer, L. L. F., 2003: Essentials of
Financial Analysis. John Wiley & Sons.14. Gitman, L. J., 2003: Principles of Managerial Finance.
Person.15. Gombola, M. J.; Ketz, J. E., 1983: Financial Ratio Pat-
terns in Retail and Manufacturing Organizations. Fi-nancial Management, 12: 45-56.
http://dx.doi.org/10.2307/3665210.16. Hadad, Y.; Keren, B.; Hanani, M. Z., 2015: Combining
data envelopment analysis and Malmquist Index for evaluating police station effi ciency and effectiveness. Police Practice and Research, 16: 5-21.
http://dx.doi.org/10.1080/15614263.2013.845945.17. Halkos, G. E.; Tzeremes, N. G., 2012a: Industry perfor-
mance evaluation with the use of fi nancial ratios: An application of bootstrapped DEA. Expert Systems with Applications, 39: 5872-5880.
http://dx.doi.org/10.1016/j.eswa.2011.11.080.18. Halkos, G. E.; Tzeremes, N. G., 2012b: Analyzing the
Greek renewable energy sector: A Data Envelopment Analysis approach. Renewable & Sustainable Energy Reviews, 16: 2884-2893.
http://dx.doi.org/10.1016/j.rser.2012.02.003.19. Helfert, E. A., 2001: Financial Analysis Tools and Tech-
niques: A Guide for Managers. McGraw-Hill Educa-tion.
20. Hemmasi, A.; Talaeipour, M.; Khademi-Eslam, H.; Far-zipoor Sean, R.; Pourmousa S., H., 2011: Using DEA window analysis for performance evaluation of Iranian wood panels industry. African Journal of Agricultural Research, 6: 1802-1806.
http://dx.doi.org/10.5897/AJAR10.733.
...........Kropivšek, Perić, Pirc Barčić, Grošelj, Motik, Jošt: A Comparative Evaluation...
DRVNA INDUSTRIJA 69 (3) 287-298 (2019) 297
21. Hollingsworth, B.; Smith, P., 2003: Use of ratios in data envelopment analysis. Applied Economics Letters, 10: 733-735.
http://dx.doi.org/10.1080/1350485032000133381.22. Johnes, J.; Izzeldin, M.; Pappas, V., 2009: Effi ciency in
Islamic and conventional banks: A comparison based on fi nancial ratios and data envelopment analysis. Lancast-er: Economics Working Paper Series. The Economics Department, Lancaster University.
23. Klarić, K.; Greger, K.; Klarić, M.; Andrić, T.; Hitka, M.; Kropivšek, J., 2016: An Exploratory Assessment of FSC Chain of Custody Certifi cation Benefi ts in Croatian Wood Industry. Drvna industrija, 67 (3): 241-248.
24. Kropivšek, J.; Grošelj, P., 2019: Long-term Financial Analysis of the Slovenian Wood Industry Using DEA. Drvna industrija, 70 (1): 61-70.
http://dx.doi.org/10.5552/drvind.2019.1810.25. Kropivšek, J.; Grošelj, P.; Likar, B.; Jošt, M., 2011: Eco-
nomics of Slovenian wood-industry. Presented at the De-velopment trends in economics and management in wood processing and furniture manufacturing. Kozina, Slove-nia: WoodEMA, i.a, pp. 91-96.
26. Kropivšek, J.; Jošt, M., 2013: Financial analysis of Slo-venian wood industry. In: Markets for wood and wooden products. Jelačić, D. (ed.), WoodEMA, i.a., Zagreb, Cro-atia, pp. 57-74.
27. Kropivšek, J.; Milavec, I.; Likar, B., 2017: Analiza po-slovanja slovenske lesne panoge: Les/Wood, 66: 47-56. http://dx.doi.org/10.26614/les-wood.2017.v66n02a05.
28. Li, H.; Wu, L., 2016: Analysis of fi nancial support effi -ciency for China’s wind power industry. Energy Sources, part B: Economics, Planning, and Policy, 11: 1035-1041. http://dx.doi.org/10.1080/15567249.2016.1185480.
29. Liu, F.-H. F.; Wang, P., 2008: DEA Malmquist productiv-ity measure: Taiwanese semiconductor companies. Inter-national Journal of Production Economics, Special Sec-tion on Recent Developments in the Design, Control, Planning and Scheduling of Productive Systems, 112: 367-379. http://dx.doi.org/10.1016/j.ijpe.2007.03.015.
30. Nikoomaram, H.; Mohammadi, M.; Mahmoodi, M. R., 2010: Effi ciency Measurement of Enterprises Using the Financial Variables of Performance Assessment and Data Envelopment Analysis. Applied Mathematical Sciences, 4: 1843-1854.
31. Oberholzer, M.; Westhuizen, G. V. der, 2004: An empiri-cal study on measuring effi ciency and profi tability of bank regions. Meditari: Research Journal of the School of Accounting Sciences, 12: 165-178.
32. Örkcü, H. H.; Balıkçı, C.; Dogan, M. I.; Genç, A., 2016: An evaluation of the operational effi ciency of turkish air-ports using data envelopment analysis and the Malmquist productivity index: 2009 – 2014 case. Transport Policy, 48: 92-104.
http://dx.doi.org/10.1016/j.tranpol.2016.02.008.33. Palepu, K. G.; Healy, P. M.; Bernard, V. L., 2003: Busi-
ness Analysis and Valuation Using Financial Statements: Text and Cases, 3rd ed. ed. Manson, Ohio: Thomson South-Western.
34. Pastor, J. T.; Ruiz, J. L., 2007: Variables With Negative Values In Dea. In: Zhu, J., Cook, W. D. (eds.), Modeling Data Irregularities and Structural Complexities in Data Envelopment Analysis. Boston, MA: Springer US, pp. 63-84. http://dx.doi.org/10.1007/978-0-387-71607-7_4.
35. Perić, I.; Grladinović, T.; Greger, K.; Jože, K., 2015: Sourc-es of Competitiveness for Furniture Manufacturing Firms: A Review of Literature and Research Issues. In: Proceeding of the 26th International Conference on Wood Modifi cation
and Technology: Implementation of wood science in wood-working sector. Grbac, I. (ed.), Faculty of Forestry, Univer-sity of Zagreb, Zagreb, Croatia, pp. 179-185.
36. Perić, I.; Grošelj, P.; Sujova, A.; Kalem, M.; Greger, K.; Kropivšek, J., 2019: Analysis of Implementation of Inte-grated Information Systems in Croatian Wood Process-ing Industry. Drvna industrija, 70 (2): 129-139.
https://doi.org/10.5552/drvind.2019.1911.37. Peterson-Drake, P.; Fabozzi, F. J., 2010: The Basics of
Finance: An Introduction to Financial Markets, Business Finance, and Portfolio Management. John Wiley & Sons.
38. Pirc Barčić, A.; Liker, B.; Motik, D.; Moro, M., 2015: Financial Analysis of Croatian Furniture Industry. In: Proceeding of the 26th International Conference on Wood Modifi cation and Technology: Implementation of wood science in woodworking sector. Grbac, I. (ed.), Faculty of Forestry, University of Zagreb, Zagreb, Croatia, pp. 187-191.
39. Potkány, M.; Giertl, G., 2014: Comparison of selected performance indicators of woodworking industry in the Czech Republic and Slovakia. Presented at the Position and role of the forest based sector in the green economy, Zvolen, Slovakia: WoodEMA, i.a, pp. 131-138.
40. Salehirad, N.; Sowlati, T., 2006: Productivity and effi -ciency assessment of the wood industry: A review with a focus on Canada. Forest Products Journal 56.
41. Salehirad, N.; Sowlati, T., 2007: Dynamic effi ciency analysis of primary wood producers in British Columbia. Mathematical and Computer Modelling, 45: 1179-1188. http://dx.doi.org/10.1016/j.mcm.2006.10.003.
42. Sayari, N.; Simga-Mugan, C., 2017: Industry specifi c fi -nancial distress modeling. BRQ Business Research Quarterly, 20: 45-62.
http://dx.doi.org/10.1016/j.brq.2016.03.003.43. Seiford, L. M.; Zhu, J., 2002: Modeling undesirable fac-
tors in effi ciency evaluation. European Journal of Opera-tional Research, 142: 16-20.
http://dx.doi.org/10.1016/S0377-2217(01)00293-4.44. Šooš, T.; Lautar, K.; Urbančič, H.; Kobe Logonder, N.;
Kmet Zupančič, R.; Fajić, L.; Čokl, A.; Gantar, J.; Lenarčič, M.; Culpa, N., 2017: Strategija razvoja Slovenije 2030. Ljubljana: Služba Vlade Republike Slovenije za razvoj in evropsko kohezijsko politiko.
45. Sowlati, T.; Vahid, S., 2006: Malmquist productivity in-dex of the manufacturing sector in Canada from 1994 to 2002, with a focus on the wood manufacturing sector. Scandinavian journal of forest research, 21: 424-433. http://dx.doi.org/10.1080/02827580600917304.
46. Sueyoshi, T.; Goto, M., 2013: A use of DEA-DA to mea-sure importance of R&D expenditure in Japanese infor-mation technology industry. Decision Support Systems, 54: 941-952. http://dx.doi.org/10.1016/j.dss.2012.09.017.
47. Tratnik, M.; Zager, M.; Zupanec, J., 2001: Key factors of (non)competitiveness of Slovene wood industry. In: Ways for improving woodworking industry for transi-tional economics: proceedings. Preddvor, Slovenia: In-ternational Symposium, pp. 107-114.
48. Vance, D. E., 2003: Financial Analysis and Decision Making: Tools and Techniques to Solve Financial Prob-lems and Make Effective Business Decisions. New York: McGraw-Hill.
49. Zadnik Stirn, L.; Leban, V.; Grošelj, P.; Krč, J.; Pezdevšek Malovrh, Š., 2015: Public forest service in Slovenia over last decade – effi ciency assessment. In: Proceedings of Ex-tended Abstracts. Presented at the International IUFRO Symposium Cross-sectoral policy impacts on managerial economics and accounting in forestry, Sarajevo, pp. 25-30.
Kropivšek, Perić, Pirc Barčić, Grošelj, Motik, Jošt: A Comparative Evaluation... ...........
298 DRVNA INDUSTRIJA 69 (3) 287-298 (2019)
50. ***Ajpes JOLP, 2019: Public posting of annual reports [online]. https://www.ajpes.si/jolp (Accessed Mar. 1, 2019).
51. ***Analitika GZS, 2019: Analitika GZS [online]. https://analitika.gzs.si/ (Accessed Feb. 4, 2019).52. ***Bisnode, 2019: Bonitete.Si – bonitetne informacije
podjetij. https://bonitete.bisnode.si (Accessed Mar. 1, 2019).
53. ***CBS, 2019: Croatian Bureau of Statistics – Republic of Croatia. https://www.dzs.hr/default_e.htm (Accessed Apr. 8, 2019).
54. ***CWC, 2019: Croatian Wood Cluster. http://www.drvniklaster.hr/ (Accessed May. 6, 2019).55. ***MPS, 2017: Odluka o donošenju Strategije razvoja
prerade drva i proizvodnje namještaja Republike Hrvatske 2017. – 2020. s Akcijskim planom provedbe 2017. – 2020. https://narodne-novine.nn.hr/clanci/sluz-beni/2017_05_44_1001.html (Accessed Mar. 10, 2017).
56. ***NACE, 2019: Glossary:Statistical classifi cation of economic activities in the European Community (NACE)
– Statistics Explained. https://ec.europa.eu/eurostat/sta-tistics-explained/index.php/Glossary:Statistical_classifi -cation_of_economic_activities_in_the_European_Com-munity_(NACE) (Accessed Feb. 10, 2019).
57. ***ZGD-1-UPB3, 2009: Zakon o gospodarskih družbah. https://www.uradni-list.si/glasilo-uradni-list-rs/vsebina/2009-01-3036?sop=2009-01-3036 (Accessed Feb. 4, 2019).
Corresponding address:
IVANA PERIĆ, Ph.D.
University of ZagrebFaculty of ForestryWood Technology DepartmentSvetošimunska 25, 10000 Zagreb, CROATIAe-mail: [email protected]