A Comparative Analysis of the Nativity Wealth Gap
59
SEDAP A PROGRAM FOR RESEARCH ON SOCIAL AND ECONOMIC DIMENSIONS OF AN AGING POPULATION A Comparative Analysis of the Nativity Wealth Gap Thomas K. Bauer Deborah A. Cobb-Clark Vincent Hildebrand Mathias Sinning SEDAP Research Paper No. 184
-
Upload
independent -
Category
Documents
-
view
3 -
download
0
Transcript of A Comparative Analysis of the Nativity Wealth Gap

S E D A PA PROGRAM FOR RESEARCH ON
SOCIAL AND ECONOMICDIMENSIONS OF AN AGING
POPULATION
A Comparative Analysis of the Nativity Wealth Gap
Thomas K. BauerDeborah A. Cobb-Clark
Vincent HildebrandMathias Sinning
SEDAP Research Paper No. 184

For further information about SEDAP and other papers in this series, see our web site: http://socserv.mcmaster.ca/sedap
Requests for further information may be addressed to:Secretary, SEDAP Research Program
Kenneth Taylor Hall, Room 426McMaster University
Hamilton, Ontario, CanadaL8S 4M4
FAX: 905 521 8232e-mail: [email protected]
May 2007
The Program for Research on Social and Economic Dimensions of an Aging Population (SEDAP) is aninterdisciplinary research program centred at McMaster University with co-investigators at seventeen otheruniversities in Canada and abroad. The SEDAP Research Paper series provides a vehicle for distributingthe results of studies undertaken by those associated with the program. Authors take full responsibility forall expressions of opinion. SEDAP has been supported by the Social Sciences and Humanities ResearchCouncil since 1999, under the terms of its Major Collaborative Research Initiatives Program. Additionalfinancial or other support is provided by the Canadian Institute for Health Information, the CanadianInstitute of Actuaries, Citizenship and Immigration Canada, Indian and Northern Affairs Canada, ICES:Institute for Clinical Evaluative Sciences, IZA: Forschungsinstitut zur Zukunft der Arbeit GmbH (Institutefor the Study of Labour), SFI: The Danish National Institute of Social Research, Social DevelopmentCanada, Statistics Canada, and participating universities in Canada (McMaster, Calgary, Carleton,Memorial, Montréal, New Brunswick, Queen’s, Regina, Toronto, UBC, Victoria, Waterloo, Western, andYork) and abroad (Copenhagen, New South Wales, University College London).
A Comparative Analysis of the Nativity Wealth Gap
Thomas K. BauerDeborah A. Cobb-Clark
Vincent HildebrandMathias Sinning
SEDAP Research Paper No. 184

A Comparative Analysis of the Nativity WealthGap*, **
Thomas K. BauerRWI Essen, Ruhr-University Bochum and IZA Bonn
Deborah A. Cobb-ClarkAustralian National University and IZA Bonn
Vincent HildebrandGlendon College, York University and CEPS/INSTEAD
Mathias Sinning***RWI Essen and IZA Bonn
April 26, 2007
Abstract. This paper investigates the source of the gap in the relative wealth posi-tion of immigrant households residing in Australia, Germany and the United States.Our results indicate that in Germany and the United States wealth differentialsare largely the result of disparity in the educational attainment and demographiccomposition of the native and immigrant populations, while income differentialsare relatively unimportant in understanding the nativity wealth gap. In contrast,the relatively small wealth gap between Australian- and foreign-born householdsexists because immigrants to Australia do not translate their relative educationaland demographic advantage into a wealth advantage. On balance, our results pointto substantial cross-national disparity in the economic well-being of immigrant andnative families, which is largely consistent with domestic labor markets and theselection policies used to shape the nature of the immigration flow.
JEL-Classification: F22, D31
Keywords: International migration, wealth accumulation
* This paper uses confidentialised unit record file data from the Household, Income and LaborDynamics in Australia (HILDA) survey. The HILDA Project was initiated and is funded by theDepartment of Families, Community Services, and Indigenous Affairs (FaCSIA) and is managedby the Melbourne Institute of Applied Economic and Social Research (MIAESR). The findingsand views reported in this paper, however, are those of the authors and should not be attributedto FaCSIA or MIAESR. ** The authors are grateful for support from the Social and EconomicDimensions of an Aging Population (SEDAP) Research Program and funding from an AustralianResearch Council Discovery Grant (DP0666158). The authors would also like to thank Juan Baron,David Mare and the participants of the Immigration Workshop 2006 at the Australian NationalUniversity for very helpful comments. *** All correspondence to Mathias Sinning, Rheinisch-Westfalisches Institut fur Wirtschaftsforschung (RWI Essen), Hohenzollernstr. 1-3, 45128 Essen,Germany, Phone: +49-201-8149214, Fax: +49-201-8149284, Email: [email protected].

Résumé Cet article examine les facteurs potentiels expliquant les écarts de richesse entre les familles immigrantes et de souche en Australie, en Allemagne et aux États-Unis. Nos résultats indiquent qu'en l'Allemagne et aux États-Unis les différentiels de richesse sont en grande partie expliqués par les disparités existantes entre le niveau d’éducation et la composition démographique des familles immigrantes et de souche, alors que les différences de revenu semblent jouer un rôle peu important. En revanche, le faible écart de richesse entre les familles australiennes de souche et immigrantes s’explique par la difficulté des immigrants résidant en Australie à matérialiser sous forme de richesse additionnelle leurs avantages relatifs en termes d’éducation et de composition démographique. Tout bien pesé, nos résultats révèlent une disparité transnationale substantielle entre le bien-être économique des familles immigrantes et de souche, qui s’explique principalement par les spécificités des marchés du travail nationaux ainsi que par les politiques de sélection des immigrants qui façonnent la nature des flux migratoires.

INTRODUCTION
The economic and social consequences of population aging are being debated in
many countries worldwide. In the coming decades, many countries will experience a
dramatic expansion in the proportion of the population over the age of 65 along side a
constant, or in some countries even declining, workforce-age population (Gruber and
Wise 2001; Visco 2001). The anticipated fiscal pressure from the increased demand
for old-age pensions and health care – in the face of a more or less constant tax base –
have left governments contemplating their policy options, including the potential
role of increased immigration. While experts agree that immigration alone cannot
provide a long-term, permanent solution to the effects of population aging (Visco
2001; Holzmann 2005), even in the short term the power of large-scale immigration
to mitigate the fiscal effects of population aging is limited by the extent to which
immigrants accumulate wealth and achieve economic security in the same way as
natives.
In particular, immigrant populations also age. This aging process depends not
only on birth and death rates within the foreign-born population and the speed
with which these rates assimilate to the respective fertility and mortality rates of
natives, but also on past and future policy decisions regarding the size and compo-
sition of immigrant cohorts. In Australia, for example, the foreign-born population
is currently aging more rapidly than the native-born population, while in Germany
and the United States immigrants are as likely as the native-born to be over the
age of 55.1 Thus, like their native-born counterparts, substantial numbers of immi-
1Fully 14.6% of the foreign-born population is between the ages of 55-64 in com-
parison to 7.9% of the Australian-born population. In effect, 35.7% of Australians
aged 55-64 years old are foreign-born in comparison to 21.9% of the population over-
all (authors’ calculations based on ABS 2003). In Germany and the United States,
the age difference between the foreign born and natives is less severe. In Germany,
12.6% of the foreign-born population is between 55 and 64 years old, while 12.4%
of the German-born population is in this age range (authors’ calculations based on
data from the Mikrozensus 2004). In the United States, the proportion of individu-
als aged 55 and above is virtually identical in the foreign- (20.2%) and native-born
1

grants are also at (or near) retirement age. Unfortunately, we know very little about
immigrants’ capacity to provide for themselves in old age, although there are rea-
sons to believe that both wealth levels and portfolio allocations depend on nativity
(Amuedo-Dorantes and Pozo 2002; Cobb-Clark and Hildebrand 2006a, 2006b).
This paper contributes to filling this void by analyzing the wealth gap between
immigrant and native households in Australia, Germany and the United States. To
this end, we take advantage of recent data collections in each of these countries that
provide a unique opportunity to assess the wealth position of immigrant households.
Differences in survey design and coverage will prevent us from directly comparing
wealth levels across countries. However, following on studies of cross-national differ-
ences in the gender wage gap (Blau and Kahn 1992), we will assess how the nativity
wealth gap differs across countries. We are particularly interested in addressing the
following questions: First, how does household net worth vary by nativity status,
region of origin, and immigration cohort? Second, how important are factors such as
income differentials, disparities in educational attainment, and demographic char-
acteristics in producing these wealth gaps? Finally, what can we say about the role
that the institutional setting might play in generating any nativity wealth gap?
These are important questions given that wealth provides the resources necessary
to maintain living standards in retirement or in times of economic hardship. More-
over, wealth is a fundamental component of overall economic well-being that directly
influences immigrants’ ability to integrate into host-country society. Wealthier fam-
ilies have more political influence and live in neighborhoods with better schools,
enhanced health facilities, and less crime (Gittleman and Wolff 2000; Altonji and
Doraszelksi 2005). At the same time, immigrants’ economic well-being is almost
certainly linked to the institutional setting, making it difficult to generalize research
findings across national boundaries.
Australia, Germany and the United States provide an interesting case study
because they span the spectrum from a traditional immigration country accepting
mainly permanent, skilled immigrants (Australia) to a country with a long history of
(20.5%) populations (Schmidley 2001).
2

accepting only temporary, predominantly unskilled workers (Germany). The results
of our comparative analysis are necessarily inferential, but nonetheless provide some
important insights into the ways that the institutional framework might influence
the relative wealth position of immigrant families.
Our results indicate that in Germany and the United States wealth differentials
are largely the result of disparity in the educational attainment and demographic
composition of the native and immigrant populations, while income differentials are
relatively unimportant in understanding the nativity wealth gap. In contrast, the
relatively small wealth gap between Australian- and foreign-born households cannot
be explained by either the distribution of income or immigrants’ characteristics.
In particular, immigrants to Australia are older, have fewer children and are more
educated than their native-born counterparts, which serves to narrow rather than
widen the nativity wealth gap. We would expect immigrants to Australia to have
a wealth advantage if they accumulated wealth in the same way as the native-born
population. On balance, our results point to substantial cross-national disparity in
the economic well-being of immigrant and native families that is largely consistent
with domestic labor markets and the selection policies used to shape the nature of
the immigration flow.
THE NATIVITY WEALTH GAP
Conceptually, variation in household wealth stems from differences in inherited
wealth, rates of return, or savings behavior, which in turn is a function of both
income and consumption patterns. Thus, there are several ways in which both the
wealth levels and portfolio choices of immigrants may differ on average from those of
their native-born counterparts. Immigrants are usually non-representative of both
the sending and receiving country populations, because disparity in the social and
economic conditions in the home and the host countries leads to a self-selection
amongst those who decide to migrate Borjas (1987). Migration policy is designed
to select those individuals out of the population of potential migrants, who will be
3

allowed to enter a country. To the extent that these selection processes result in
differences between natives and immigrants in terms of observable and unobservable
characteristics, we would expect disparity in the wealth levels of these two popula-
tions. Moreover, given the nature of these selection processes it is likely that the
nativity wealth gap will differ across receiving countries.
However, wealth levels may differ even when comparing similar native and im-
migrants. First, social norms in the sending country are likely to influence not only
inter vivos transfers and inheritances, but also immigrants’ post-migration savings
behavior, asset allocation, and, consequently, rates of return. Chiteji and Stafford
(1999), for example, argue that portfolio choices are influenced by a “social learning
process” in which parents’ decisions to hold certain kinds of assets can influence
the financial choices of their children, while Dohmen et al. (2006) provide evidence
that children’s attitudes towards risk and trust are linked to those of their parents.
Moreover, immigrants to Germany are significantly more risk averse than native-
born Germans suggesting that attitudes towards risk may depend on nativity status
(Bonin et al. 2006).
Second, theoretical models suggest that relative economic conditions (including
labor market risk) in receiving and sending countries interact with expectations
regarding return migration to determine immigrants’ savings choices (Galor and
Stark 1990; Djajic and Melbourne 1988; Djajic 1989; Dustmann 1997). Dustmann
(1997), for example, shows that whether migrants save more or less than similar
natives is theoretically a function of the correlation in labor-market shocks in the
two countries. In related research, Amuedo-Dorantes and Pozo (2002) find that in
the U.S. increased income uncertainty has a larger positive effect on the wealth level
of natives, pointing to more precautionary savings amongst native-born families.
The ability to diversify portfolios across two labor markets (rather than one) may
reduce immigrants’ income risk leading to less need for precautionary savings.
Third, immigrants face earnings profiles that appear to differ in terms of both
levels and earnings risk. A large economics literature documents that immigrants
experience on average a relative earnings gap at arrival that diminishes with years
4

of residence in the receiving country. The pattern is remarkably consistent, though
the magnitude of the initial earnings gap and the speed of convergence continue to
be debated (Chiswick 1978; Borjas 1994). Almost nothing is known about the role
of earnings uncertainty, a lack of financial information, or variation in consumption
behavior in producing wealth outcomes though all would be expected to contribute
to producing a nativity wealth gap.
Empirical evidence suggests that Canadians accumulate more wealth than recent
immigrants to Canada, though the nativity gap disappears amongst more established
immigrants (Shamsuddin and DeVoretz 1998; Carroll, Rhee and Rhee 1994). Zhang
(2002) also concludes that recent immigrants to Canada are at a relative wealth
disadvantage, though he finds that the mean nativity wealth gap is not significantly
different from zero for couples and is in fact positive and significant for singles.
In contrast, the median net worth of U.S.-born households is approximately three
times the median net worth of foreign-born households. Moreover, the extensive
diversity in wealth position amongst immigrant households suggests that the process
of economic and social integration in the United States has historically been very
uneven (Cobb-Clark and Hildebrand 2006a).
Though the evidence is limited, nativity status is also likely to be linked to both
the retirement expectations as well as the eventual retirement behavior of immi-
grants. Cobb-Clark and Stillman (2006), for example, demonstrate that relative to
natives, middle-aged immigrants to Australia are more uncertain about the age at
which they will retire, more likely to expect to never retire, and less likely to be
formulating standard retirement plans. Some of this uncertainty may be generated
by the fact that many immigrants anticipate either returning to their home coun-
try or moving frequently between the home and receiving countries after retirement
(De Coulon and Wolff 2006). Thus, foreign-born status has large and direct effects
on individuals’ expectations regarding retirement. Whether these expectations re-
flect differences in the eventual retirement behavior of immigrant workers remains
a question for future research.
5

INSTITUTIONAL SETTING
The comparative nature of our analysis provides an opportunity to shed light on
the ways in which a country’s institutional setting might affect the nativity gap in
wealth levels and portfolios allocations. Australia, Germany, and the United States
provide an interesting case for studying this issue because, although each accepts
large numbers of immigrants, the substantial differences in each country’s domestic
policies and institutions are almost certainly related to the relative wealth position
of immigrants.
Immigration Policy
Australia, Germany and the United States are three countries with very different
immigration histories and migration policies. Australia and the U.S. are both tra-
ditional, immigrant-receiving countries and immigration has been a cornerstone of
economic, social, and cultural development. Historically, both countries favored im-
migration from Europe, leaving little scope for immigration from other continents.
While the U.S. distributed visas based on the national origin of the foreign-born
population enumerated in the 1920 U.S. census (Antecol, Cobb-Clark and Trejo
2004), Australia followed a “White Australia Policy” by first accepting mainly im-
migrants from Britain and only expanding the immigrant base to include migrants
from other European countries after World War II. The United States moved away
from selecting immigrants on the basis of national origin in 1965 (Briggs 1984);
Australia followed in 1973 (Antecol et al. 2004).
In recent decades, both countries have broadly differentiated between three types
of migrants: (i) immigrants accepted on humanitarian grounds (refugees and asylum
seekers); (ii) family migrants; and (iii) economic migrants. Despite the similarities
in this typology, however, migration policy in Australia and the United States differs
substantially in the way in which visas are allocated across these three types of mi-
grants. The United States places more weight on the reunification of families, with
relatively few visas reserved for immigrants selected on the basis of their labor mar-
6
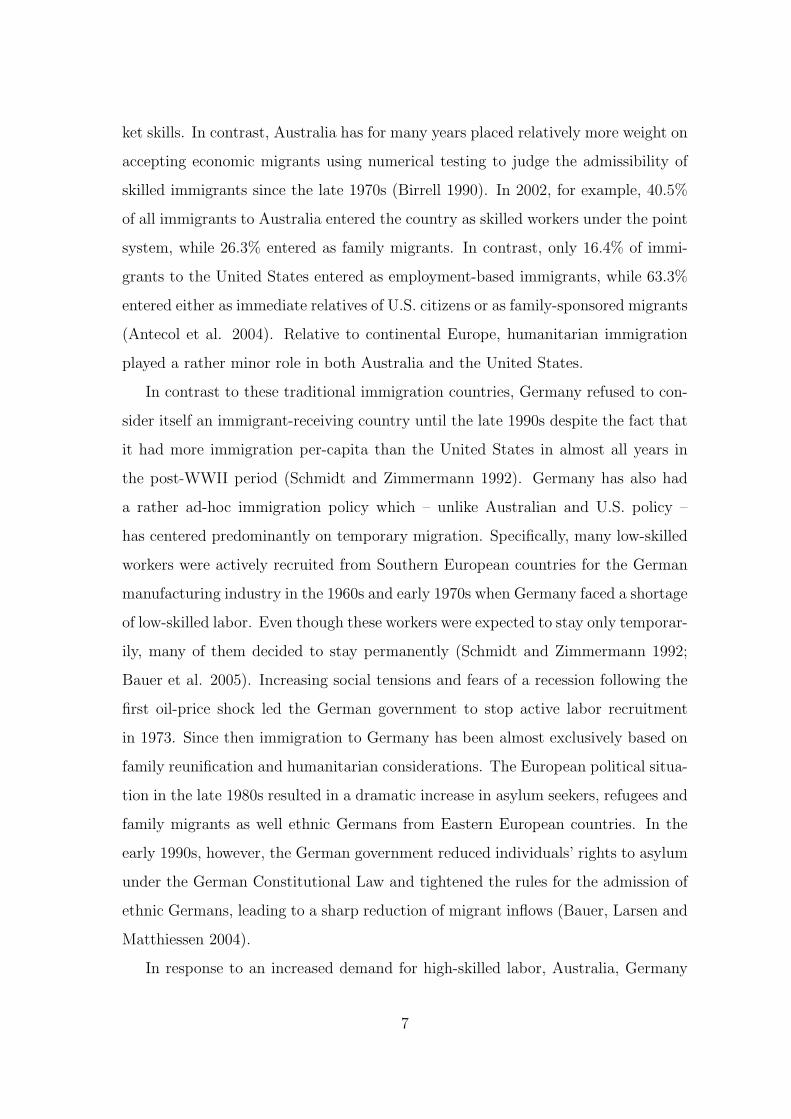
ket skills. In contrast, Australia has for many years placed relatively more weight on
accepting economic migrants using numerical testing to judge the admissibility of
skilled immigrants since the late 1970s (Birrell 1990). In 2002, for example, 40.5%
of all immigrants to Australia entered the country as skilled workers under the point
system, while 26.3% entered as family migrants. In contrast, only 16.4% of immi-
grants to the United States entered as employment-based immigrants, while 63.3%
entered either as immediate relatives of U.S. citizens or as family-sponsored migrants
(Antecol et al. 2004). Relative to continental Europe, humanitarian immigration
played a rather minor role in both Australia and the United States.
In contrast to these traditional immigration countries, Germany refused to con-
sider itself an immigrant-receiving country until the late 1990s despite the fact that
it had more immigration per-capita than the United States in almost all years in
the post-WWII period (Schmidt and Zimmermann 1992). Germany has also had
a rather ad-hoc immigration policy which – unlike Australian and U.S. policy –
has centered predominantly on temporary migration. Specifically, many low-skilled
workers were actively recruited from Southern European countries for the German
manufacturing industry in the 1960s and early 1970s when Germany faced a shortage
of low-skilled labor. Even though these workers were expected to stay only temporar-
ily, many of them decided to stay permanently (Schmidt and Zimmermann 1992;
Bauer et al. 2005). Increasing social tensions and fears of a recession following the
first oil-price shock led the German government to stop active labor recruitment
in 1973. Since then immigration to Germany has been almost exclusively based on
family reunification and humanitarian considerations. The European political situa-
tion in the late 1980s resulted in a dramatic increase in asylum seekers, refugees and
family migrants as well ethnic Germans from Eastern European countries. In the
early 1990s, however, the German government reduced individuals’ rights to asylum
under the German Constitutional Law and tightened the rules for the admission of
ethnic Germans, leading to a sharp reduction of migrant inflows (Bauer, Larsen and
Matthiessen 2004).
In response to an increased demand for high-skilled labor, Australia, Germany
7

and the United States have all recently adopted initiatives to expand the opportu-
nities for skilled workers to immigrate. Like Canada and New Zealand, Australia
has increased the number of visas for permanent migrants selected under the points
system leading the number of skills-based immigrants to Australia to triple between
1995 and 2005 (AGDIC 2006). In contrast, Germany and the United States are
focused in large part on the temporary inflow of highly-skilled workers. Specifically,
the U.S. has dramatically increased the number of H1-B visas issued (Lowell 2001),
whereas Germany passed a new immigration law relaxing the requirements for high-
skilled foreigners to obtain permission to stay and to work in Germany (Bauer et
al. 2004; Bauer and Kunze 2004).
This policy environment results in immigrant populations that are quite different
in terms of their skills and settlement intentions. Immigrants to Australia are by
and large relatively skilled and permanent. Immigrants to Germany, on the other
hand, are mainly unskilled and, at least notionally, temporary. These differences
are expected to contribute to producing a nativity wealth gap which is likely to be
larger in Germany than in Australia.
Labor Markets
There is a large literature assessing the relative earnings of immigrants and the role
of immigration policy in the economic integration of immigrants. This research indi-
cates that immigrants to Australia have a lower earnings disadvantage upon entry as
well as a slower rate of earnings assimilation than immigrants to the United States
(Chiswick and Miller 1985). Miller and Neo (2003) conclude that these differences
stem from institutional differences in labor markets in the two countries. In partic-
ular, the complex system of award rates of pay (minimum wages) at the state and
federal level provides immigrants with some degree of earnings protection when they
first enter the Australian labor market, while the greater flexibility of the U.S. labor
market speeds the earnings adjustment of new arrivals. At the same time, the Ger-
man labor market is considered to be quite rigid in comparison to that in Australia
or the United States. Both labor costs and unemployment in Germany are relatively
8

high and Germany follows a stronger redistribution policy through higher tax rates
(OECD 2006). Consequently, it is perhaps not surprising that similar studies for
Germany show that, upon arrival, immigrants face an even higher relative earnings
disadvantage and experience no significant earnings assimilation over time (Bauer
et al. 2005). These differences in the pattern of earnings assimilation are also in line
with the Roy model proposed by Borjas (1987), which predicts that – given exist-
ing labor market institutions – the United States should receive better immigrants
in terms of observed and unobserved characteristics compared to Australia and, in
particular, Germany.
The economic integration of immigrants is also linked to immigration policy.
Studies of the impact of selection policy on the earnings adjustment of immigrants
typically adopt one of two empirical strategies. Some studies compare migrants’
relative earnings trajectories across countries with different immigration policies,
such as, for example, Canada and the United States (see Antecol et al. 2004). Oth-
ers compare the earnings adjustment of immigrants entering in different admission
categories, for example, skilled versus family migrants in Australia. Overall, these
studies show that a policy of points testing can be effective in altering the skills
mix of the immigrant flow in comparison to policies that predominantly select im-
migrants on the basis of their family relationships (Borjas 1993; Duleep and Regets
1992; Antecol, Cobb-Clark and Trejo 2003). Moreover, skills-based immigrants have
a lower relative earnings disadvantage upon entry than comparable family migrants,
but a lower speed of earnings assimilation (Jasso and Rosenzweig 1995; Duleep and
Regets 1996).
Wealth accumulation is closely related to households’ long-run earnings potential.
To the extent that immigrants earn higher relative wages at entry in Australia and
enjoy faster earnings adjustment in the United States, we would expect that the
nativity wealth gap would be lower in these two countries than in Germany, where
immigrants remain at an earnings disadvantage.
9

Financial and Housing Markets
Institutional barriers associated with ethnicity, nativity, legal status, or language
skills may limit migrants’ access to financial markets and hinder the purchase of
certain assets like housing. Osili and Paulson (2004), for example, find that U.S.
immigrants are less likely to have savings or checking accounts than similar natives.
For some, opening a bank account may be difficult due to a general lack of docu-
mentation, while other new arrivals may simply find it difficult to establish a credit
rating.2 Interestingly, the propensity to own a bank account decreases as the ethnic
concentration of the metropolitan area increases suggesting that the social interac-
tions embodied in ethnic enclaves may affect the way in which immigrants conduct
their financial affairs (Osili and Paulson 2004). Consistent with this, Osili and Paul-
son (2005) also find that immigrants from countries with institutions that are more
effective in protecting individual property rights are more likely to participate in
U.S. financial markets.
Although evidence of a direct link is lacking, the inability – or unwillingness – to
fully participate in the host country’s financial markets is almost certainly related
to the common finding that immigrant households have significantly lower home-
ownership rates than comparable native households (Borjas 2002; Clark, Deurloo
and Dieleman 1997; Coulson 1999; Myers and Lee 1996; Painter, Yang and Yu
2003). At the same time, there are important international differences in home-
ownership rates among the domestic population more broadly. While the rate of
home-ownership is similar in Australia and the United States (approximately 70%),
it is much lower in Germany (approximately 40%) (Proxenos 2002). Proxenos (2002)
argues that legal systems and laws of land tenure, governmental housing and tax
policy, and lenders’ margins – all of which vary substantially between countries –
combine to produce an institutional setting which may be more or less favorable to
home-ownership. The United States and Australia, for example, have legal environ-
2Identity cards, known as matriculas consulares, issued by the Mexican govern-
ment have had the greatest impact in giving illegal immigrants access into the U.S.
banking system (Sheridan 2002).
10

ments in which the regulations regarding property ownership are transparent and
consistent, while the U.S. housing finance system is amongst the most efficient in
the world (Proxenos 2002).
These institutions almost certainly contribute to the relatively high home-owner-
ship rates in these countries. Nothing is known, however, about the ways in which
the broader institutional setting might lead to a nativity gap in home-ownership or
indeed wealth levels more broadly.
Welfare and Pension Systems
Limited access to social welfare programs and the potential for remigration may alter
the savings behavior of immigrants and affect wealth accumulation. Shamsuddin and
DeVoretz (1998), for example, find that the wealth levels of Canadian immigrants
dissipate faster and are more sensitive to social security wealth in a way that is
consistent with immigrants’ limited access to Canada’s old-age security pension.
Such limitations are becoming more common. In 1996, for example, the United
States passed the Personal Responsibility and Work Opportunity Reconciliation
Act restricting non-citizens’ access to the welfare system (Fix and Passel 2002).
Similarly, Australia has moved to extend the period that new immigrants must wait
before becoming eligible for income support (Chiswick and Miller 2006).
In Germany, access to the welfare system for foreigners is more complicated.
Conditional on receiving permission to stay in Germany, immigrants are subject
to the same eligibility rules as natives. Like natives, immigrants are only able to
claim unemployment benefits after some qualification period. In particular, as the
German unemployment system is an insurance-based system (like that in the United
States) and not a welfare-based system (like that in Australia), individuals need to
have a work history in order to claim unemployment benefits. Similarly, the social
assistance system does not differentiate between natives and immigrants. Special
rules do exist, however, for refugees and asylum seekers who are in the process
of having their asylum status recognized. Until they are recognized as an asylum
seeker, individuals receive lower benefits than in the regular social security scheme
11

(see Nielsen 2004).
Given our focus on overall wealth levels, cross-country differences in pension
systems are also of particular interest as these institutional differences affect the
incentives to accumulate wealth. The pension system in Australia has two com-
ponents: a means-tested, aged pension financed through general tax revenue, and
private pension plans financed by mandatory worker and employer contributions.
Currently, the standard retirement age is 65 for men and 62.5 for women (Gong,
Ryan and Whelan 2006). In the United States, the Social Security program is also
financed through general tax revenue. However, unlike the Australian Aged Pen-
sion, U.S. Social Security pays benefits to retirees (and their beneficiaries) under
uniform formulas based on individuals’ previous earnings histories without regard
to recipients’ wealth or non-wage income. Most U.S. workers also save for retire-
ment through employer-sponsored defined benefit or defined contribution pension
plans and through tax-deferred savings accounts called IRAs (individual retirement
accounts). Germany’s pay-as-you-go state pension system is similar to U.S. Social
Security in that it is not means-tested. Individuals earn points that are calculated
from their individual annual contributions to the pension system. For employed
individuals, these contributions amount to 19.5% of gross income; half of which is
paid by the employer and half of which is paid by the employee. There are other
possibilities to save for old-age, for example through employer-sponsored pensions or
life insurance plans. These savings vehicles are relatively unimportant in Germany
in comparison to the United States and Australia however.
The OECD (2005) reports that the mandatory pension systems in Australia and
the United States deliver a lower average pension than in Germany. In Germany,
the weighted average pension reaches about 42.6% of average earnings, whereas
the average pension in Australia (39.1%) and the United States (36.5%) is a much
smaller fraction of average earnings. Comparisons of average pension wealth , i.e. the
present value of the future stream of pension payments, are useful for taking account
of different features of specific pension systems – for example, the level at which
pensions are paid, the standard retirement age, life expectancy and the adjustment
12

of pensions to wage and price growth (OECD 2005). These calculations indicate that
the net pension wealth for individuals with average earnings is highest in Germany
($262,000) followed by Australia ($189,000) and the United States ($183,000).
We can only speculate about how these cross-country differences in welfare and
pension systems affect the nativity wealth gap. Restricted access to the welfare
system and the relatively low replacement rate of the U.S. pension system would be
expected to lead immigrants to accumulate wealth in order to cope with any financial
difficulties and provide for their own retirement. Thus, we might expect the nativity
wealth gap to be smaller in the United States than in Australia or Germany. At the
same time, these institutional differences may have a more direct effect on the way
in which wealth is held – liquid vs. non-liquid assets or pension vs. non-pension
wealth – rather than simply on the overall wealth level. Unfortunately, our data do
not permit the inclusion of pension or social security wealth in our measure of net
worth, preventing us from addressing these issues directly.
DATA AND DESCRIPTIVE ANALYSIS
Data Sources
This paper uses data from three nationally representative panels which all provide
information about migration histories and comparable measures of household wealth.
The Australian data come from the Household, Income and Labour Dynamics in
Australia (HILDA) Survey which is a longitudinal survey of Australian households
(see Wooden, Freidin and Watson 2002). Our analysis exploits the 2002 release of
HILDA (wave 2) encompassing approximately 13,000 individual respondents living
in more than 7,000 households. Wave 2 included a special module on household
wealth making the HILDA Survey the only Australian microdata source which allows
questions regarding nativity and the distribution of wealth to be examined.
The data used to study the nativity wealth gap in Germany have been extracted
from the German Socio-Economic Panel (GSOEP). The GSOEP is a representa-
tive longitudinal survey which started in 1984 and includes German and immigrant
13

households. In 2005, approximately 22,000 persons in nearly 12,000 households
were sampled. Here we use data from the 2002 wave.3 As less than 2% of the
foreign-born population lives in East Germany, our analysis focuses on households
residing in West Germany. Immigrants are defined as foreign-born individuals who
immigrated to Germany after 1948 (including foreign-born persons with German
citizenship).
Data for the United States are drawn from the 2001 panel of the Survey of
Income and Program Participation (SIPP). The SIPP is the only U.S. microdata set
containing information about migration histories and household wealth for a broad
cross-section of the immigrant population (see Cobb-Clark and Hildebrand 2006a).
The 2001 SIPP panel is a short rotating panel which is representative of the civilian,
non-institutionalized population living in the United States. Approximately 35,000
households were interviewed in the first wave of the 2001 panel. Each household in
the sample was interviewed at four month intervals over a period of roughly three
years beginning in February 2001. Information on immigrants is obtained from the
wave 2 migration history module and household wealth data are drawn from the
wave 3 module on assets and liabilities collected between October 2001 and January
2002.
To facilitate comparisons across the three countries, we restricted all three esti-
mation samples to include only native- and foreign-born, couple-headed households
in which the reference person is between 25 years and 75 years old. Native-born
households include all coupled-headed households in which both partners were born
in Australia, Germany or the United States, respectively. A couple-headed, foreign-
born household is defined as a household in which both partners were born outside of
3The data used in this paper were extracted from the GSOEP Database pro-
vided by the DIW Berlin (http://www.diw.de/GSOEP) using the Add-On package
PanelWhiz v1.0 (Oct 2006) for Stata(R). PanelWhiz was written by Dr. John P.
Haisken-DeNew ([email protected]). The PanelWhiz generated DO file to retrieve
the GSOEP data used here and any Panelwhiz Plugins are available upon request.
Any data or computational errors in this paper are our own. Haisken-DeNew and
Hahn (2006) describe PanelWhiz in detail.
14

the respective host country. In all three cases we have dropped “mixed households”
in which one partner is native-born and the other is foreign-born.4 Excluding all
observations with missing values on one or more of the variables of interest results
in samples of: 2,245 native- and 591 foreign-born households in Australia, 2,392
native- and 270 foreign-born households in Germany, and 10,296 native- and 1,057
foreign-born households in the United States.
The Level of Net Worth
Our measures of total household net worth are derived from wealth components that
are either estimated at the household level or directly measured at the individual
level and then aggregated to the household level. An overview of the specific com-
ponents of each country’s net worth measure is provided in Appendix Table A1. As
the scope of financial investments differs across countries, each survey asks about a
somewhat different range of asset types. Moreover, while information about many
detailed forms of country-specific financial investments was gathered in both Aus-
tralia and the United States, only a single broadly defined measure of the value of
financial assets is observed for Germany. Fortunately, the resulting measure of fi-
nancial wealth for Germany is comparable to those derived from both the Australian
and U.S. data. Unlike financial wealth, the remaining components of our net worth
measures (business equity, housing equity, vehicles equity and total value of debt)
are largely the same across all three countries.5
To assess the quality of HILDA’s wealth information, Heady (2003) compares
HILDA’s estimate of aggregate net worth to national statistics compiled by the
4In particular, we dropped 698 mixed households from the Australian sample and
1,684 households from the GSOEP. Moreover, 695 mixed households were dropped
from the U.S. sample.
5Marks, Heady and Wooden (2005) provide a comprehensive and detailed de-
scription of the household wealth module of HILDA. The components of net worth
in the GSOEP are described in Schafer and Schupp (2006). The Social Security
Administration (2003) provides a description of the way wealth is measured in the
SIPP.
15

Reserve Bank of Australia (RBA). This comparison of aggregate values suggests
that the overall household net worth derived from HILDA data is fairly accurate.
Although the aggregate value of total debt derived from HILDA is 20% lower than
the corresponding RBA figure, HILDA’s overall estimate of household net worth is
only 6.5% lower than the RBA estimate.
Schafer and Schupp (2006) compare the aggregate level of net worth derived from
the GSOEP to the aggregate wealth level obtained from the Income and Expenditure
Survey 2003 conducted by the Federal Statistical Office. They find that aggregate
net worth in the GSOEP is about 13% lower than the corresponding value in the
Income and Expenditure Survey, indicating that wealth levels in the GSOEP are
somewhat understated. An additional shortcoming of the GSOEP data is that a
large number of households (about 36%) report a net worth equal to zero and have
therefore been dropped from the GSOEP estimation sample. However, since the
proportion of native and immigrant households amongst all households reporting
zero net worth does not deviate substantially from the overall proportions of native
and immigrant households in the total sample, we believe that this does not cause
a serious selectivity bias in our estimation results.
In general, SIPP data are not usually thought of as the best source of information
for studying U.S. wealth. The Survey of Consumer Finance (SCF) provides a more
comprehensive measure of wealth than do alternative data sources that measure the
upper tail of the wealth distribution particularly poorly (Juster and Kuester 1991;
Wolff 1998; Juster, Smith and Stafford 1999). Unfortunately, SCF data do not iden-
tify immigrants making it unsuitable for our purposes. In an effort to understand the
limitations of SIPP data, the Social Security Administration (2003) compares SIPP
wealth data to wealth levels in the SCF and the Panel Study of Income Dynamics
(PSID). The results reveal that the SIPP estimate of median net worth is only about
two-thirds that of the SCF and 74% that of the PSID. As estimates of liabilities are
essentially the same across surveys, much of the underestimate of net worth results
from assets being underestimated. Underestimation of assets in the upper tail of the
wealth distribution accounts for about 72% of the difference in the SIPP and SCF
16

estimates of asset levels, while asset categories not measured in the SIPP account
for an additional 13%. Only a very small proportion (at most 15%) of the disparity
in assets is attributable to underestimation of assets among the non-elderly (Social
Security Administration 2003). Thus, we minimize the disadvantages of using SIPP
data to assess wealth holdings in the United States by eliminating very wealthy
households from our sample and focusing on median (rather than mean) wealth.
In addition to cross-national differences in the extent to which our data sources
measure overall net worth, there are also important differences in the way in which
pension wealth is measured in each survey. Information about pension entitlements
in the GSOEP is limited to the cash surrender value of life insurance policies, private
pensions plans and building savings accounts. These assets are included as a compo-
nent of financial wealth in our measure of net worth for Germany. However, in ad-
dition to private pension wealth, HILDA also collects data about employer-provided
pension wealth. In the United States, the total value of funds in Thrift/401K ac-
counts is available in the assets and liabilities module of the SIPP, while the value of
pension benefits in defined-contribution plans could in principle be extracted from
the SIPP’s pension module (wave 7). However, as in most wealth surveys, the value
of assets held in defined-benefit pensions and social security entitlements are not
available in SIPP. Consequently, in order to make our measures of net worth as
comparable as possible across countries, we do not include the available informa-
tion about employer-provided pensions (HILDA), Thrift/401K (SIPP) accounts or
defined-contribution pension wealth (SIPP) in our respective measures of net worth
for Australia and the United States.
Due to these cross-national differences in the components of net worth, a direct
comparison of our absolute measures of net worth across countries is not possible.
This is not particularly problematic given our research interests. More importantly,
we have no evidence that the merits of our net worth measure within a country
differ substantially between native- and foreign-born populations. Consequently,
following the literature on international comparisons of the gender earnings gap
(Blau and Kahn 1992), our analysis concentrates on relative rather than absolute
17

wealth measures. In particular, since wealth levels are not directly comparable across
countries, we focus instead on comparing the proportion of the nativity wealth gap
which is attributable to different (explained or unexplained) factors. In order to
facilitate such a comparison, we convert our measures of net worth into U.S. dollars
using purchasing power parity (PPPs) conversion factors provided by the OECD for
the year 2002.6
Information about the level of wealth held by native- and foreign-born households
in each country is presented in Tables 1-3. Overall, native-born households have
higher net worth than immigrant households, though the nativity wealth gap is
considerably smaller in Australia than in Germany or the United States. Specifically,
the net worth of immigrants to Australia is approximately 90% of the average wealth
level of their Australian-born counterparts, while immigrant households hold only
about 45% to 50% of the net worth of native households in Germany and the United
States. Moreover, there is very little difference in the proportion of Australian-
born (99%) and immigrant households (97%) with positive net worth. In contrast,
immigrant households in both Germany and the United States are much less likely to
report positive net worth than are native households.7 This lower propensity to hold
positive net worth is only a partial explanation for the overall nativity wealth gap in
these two countries however. Conditional on having positive net worth, immigrant
households still hold only about half the wealth of native households in Germany
(52%) and the United States (55%). In contrast, those immigrant households with
positive net worth hold approximately 90% of the wealth level of Australian-born
households.
Figures 1-3 show of the unconditional wealth gap between natives and immigrants
together with a 95% confidence interval over the entire wealth distribution for all
6The conversion factors are 1.340 for Australia, 0.959 for Germany and 1.000 for
the United States. See http:/www.oecd.org/std/ppp/.
7For Germany, this difference is attributable to the higher share of immigrants
reporting a negative net worth since households with zero wealth levels have been
dropped from the GSOEP sample.
18

three countries. These figures show that in all three countries native-born households
have a wealth advantage over immigrant households at almost all points of the wealth
distribution. In Australia, however, this wealth gap appears not to be statistically
significant in most parts of the wealth distribution. In contrast, the nativity wealth
gap appears to be increasing in wealth levels in Germany and the United States. At
the 25th-percentile, for example, the wealth gap is smallest in the United States with
immigrants holding $15,792 less than natives (see Figure 3), followed by Australia
with a nativity gap of $26,224 (see Figure 1) and Germany with a nativity gap of
$32,325 (see Figure 2). At higher wealth levels, however, the nativity wealth gap is
smallest in Australia (about $45,000 at the 75th percentile) compared to a gap of
about $105,000 in the United States and more than $200,000 in Germany.
Tables 1-3 further describe the relevant socioeconomic and demographic charac-
teristics of native and immigrant households.8 The cross-country disparities in the
characteristics of immigrants and natives are largely as expected given differences
in immigration policies and institutional settings. In all three countries immigrant
households have a lower income on average than native-born households. Again, this
disparity is smallest for Australia. Moreover, immigrant households in Australia also
have fewer children under the age of 18 and have older heads with more education
than native-born households. In Germany and the United States, these patterns are
reversed. There are also differences in the distribution of the immigrant population
across entry cohorts and sending regions. In Australia and Germany, the majority
of the immigrant population arrived either between 1965 and 1974 or after 1984,
whereas in the U.S. more than half of the immigrant population captured in the
SIPP arrived after 1984. Immigrants to Australia primarily stem from Europe and
Asia, while in Germany most immigrant households originate in Central/Eastern
Europe or Turkey and immigrants to the United States come predominantly from
Asia and Mexico.
8Variable definitions are given in the Appendix.
19

Determinants of Net Worth
In order to understand how wealth levels vary with household characteristics, it is
first useful to analyze the determinants of household net worth. As the distribution
of net worth is usually skewed to the right, linear regression models are typically
estimated using a log transformation of wealth in order to obtain a log-normally
distributed dependent variable (see e.g. Shamsuddin and DeVoretz 1998). A log
transformation is not appropriate for households with zero or negative net worth,
however. Consequently, we estimate a quantile regression model to analyze the
determinants of household net worth at the median of the distribution.9
Specifically, we estimate the following cross-sectional quantile regression model of
the determinants of net worth (Whc) for native and immigrant households h residing
in country c,
Whc = βq0c + Xhcβ
q1c + Ihc(β
q2c + Dhcβ
q3c + Rhcβ
q4c) + εq
hc, (1)
where q reflects a specific percentile of the distribution, Xhc contains information
about income (i.e. current household net income),10 education (in years for the
household head) and demographic characteristics (number of children younger than
18, age and age squared of the household head). Additionally, Ihc is an indicator
variable reflecting immigrant status, Dhc is a vector of indicator variables capturing
arrival cohorts, and Rhc is a vector of indicator variables reflecting immigrants’ re-
gions of origin. Finally, the vector βqc includes the model parameters to be estimated
and εqhc is an error term with the usual properties.
In order to facilitate interpretation of our results, the model includes the full set
9An alternative approach to the log transformation is the adoption of an inverse
hyperbolic sine transformation (Burbidge, Magee and Robb 1988; Cobb-Clark and
Hildebrand 2006a; Sinning 2006). However, due to the nonlinear nature of this
transformation, the calculation of the required marginal effects is computationally
demanding.
10We also estimated an alternative specification including a quadratic in household
net income. The quadratic term was insignificant in all cases and was dropped from
the model.
20

of entry cohorts and regions of origin. We achieve identification of the overall con-
stant by restricting the estimated coefficients on these variables to sum to zero, i.e.
we restrict∑
m βq3cm = 0 and
∑n βq
4cn = 0, where m and n are the numbers of immi-
gration cohorts and regions of origin respectively. Consequently, βq2c is interpreted
as the overall difference in the wealth level of native and immigrant households (i.e.,
the overall nativity wealth gap) conditional on characteristics, while βq3c and βq
4c cap-
ture the deviations of specific entry cohorts and regions of origin from this overall
wealth gap.
Estimation results from our median quantile regression (q = 50) are presented in
Table 4 for all three countries. These results indicate that – controlling for household
characteristics – the median net worth of immigrant households is significantly lower
than the median net worth of native-born households in Australia and Germany,
whereas the conditional nativity wealth gap is insignificant in the United States.
This indicates that while immigrants and natives with similar characteristics have
similar levels of net worth in the United States, this is not the case in Germany
and Australia, where immigrants remain at a wealth disadvantage. In fact, the
conditional wealth gap is larger than the unconditional wealth gap in Australia
indicating that the relatively small unconditional wealth gap stems in part from the
fact that immigrants to Australia are relatively advantaged in those characteristics
associated with having higher wealth. In most cases, the other wealth covariates
have the expected signs. Median net worth in all three countries is significantly
increasing in household net income as well as in the educational attainment and age
of the household head. We do find quite different patterns in the effect of age on
median net worth. Somewhat surprisingly, our estimates suggest that median net
worth is increasing with the number of children below age of 18 though this effect is
only significant for Germany and the United States. While this may indicate that
households with children accumulate more wealth, it may also indicate that only
wealthier households have children.
21

DECOMPOSITION OF THE WEALTH GAP
Decomposition Method
We investigate the source of the nativity wealth gap using the semi-parametric
decomposition method proposed by DiNardo, Fortin and Lemieux (1996). This
approach allows us to assess the relative impact of various sets of explanatory factors
on differences in the wealth distribution between native and immigrant households
(see Cobb-Clark and Hildebrand 2006c). In particular, we partition the determinants
of wealth into three main factors: (i) income (y); (ii) educational attainment (e);
and (iii) household demographic composition (z). We can then write the wealth
distribution of group j as follows:
f j(w) ≡ f(w|I = j) (2)
=
∫
y
∫
e
∫
z
f(w, y, e, z|I = j)dzdedy
=
∫
y
∫
e
∫
z
f(w|y, e, z, I = j)fy|e,z(y|e, z|I = j)×fe|z(e|z, I = j)fz(z|I = j)dzdedy.
where I is our indicator of immigrant status and j = (0, 1). Equation (2) comprises
four conditional densities: the conditional wealth distribution f given the full set
of wealth determinants and immigrant status I, the conditional income distribution
(fy|e,z) given education, household demographic composition and immigrant sta-
tus, the conditional education distribution fe|z given demographics and immigrant
status and finally the distribution fz of demographic characteristics conditional on
immigration status.
Following DiNardo et al. (1996), the wealth gap between immigrant and native
households can then be decomposed into three separate components explained by
disparities in conditional income distributions, educational backgrounds, and demo-
graphic characteristics respectively and a fourth “unexplained” component arising
from differences in the conditional (on y, e, and z) wealth distributions of im-
migrants and natives. This decomposition is achieved by constructing a series of
counterfactual wealth distributions in which the conditional income, education and
22

demographic distributions amongst native-born households (j = 0) are selectively
replaced with the distributions faced by their foreign-born counterparts (j = 1).11
These counterfactual distributions are then used to isolate the effect of various wealth
determinants on the nativity wealth gap.12
Decomposition Results
In order to understand the source of the disparity in the wealth levels of natives
and immigrants, we decompose the nativity wealth gap into three separate vectors
of wealth determinants: 1) a quartic in income; 2) educational attainment, which
includes years of education for the household head and the spouse; and 3) household
composition, which includes an indicator variable for children less than age 18 in
the household, as well as a cubic in the age of both partners.13
One advantage of the DiNardo et al. (1996) approach is that by estimating the
entire counterfactual wealth distribution it is possible to decompose differences in
summary statistics for these wealth distributions. In what follows, we consider two
11The net worth distribution of immigrants is considerably narrower than that of
natives in all three countries. Therefore, reweighting the immigrant wealth distri-
bution would involve extrapolating the immigrant conditional wealth distribution
beyond the income range actually observed in the data. For that reason, we have
chosen to create our counterfactual distributions by reweighting the wealth distri-
bution of native households (see Barsky et al. 2002).
12The proportion of the wealth gap attributable to each of the explanatory factors
will depend on the sequence (or order) in which we consider them (DiNardo et al.
1996). As we have no particular preference for one sequence over another, we will
calculate each in turn and present results based on the simple average across all
possible sequences (see Cobb-Clark and Hildebrand 2006c).
13To compare the decomposition results to the estimates of the quantile regression,
we also estimated a more parsimonious model including only household net income,
education of the household head, an indicator variable for children less than 18
and a quadratic function in age of the household head. The decomposition results
from this alternative pecification do not differ substantially from those presented in
Table 5 and are available upon request.
23

alternative statistics that are useful in describing the differences in the wealth hold-
ings of natives and immigrants: first, the nativity wealth gap at various percentiles
of the distribution and second, the disparity in wealth dispersion as reflected in the
gap between the 90-10, 90-50, and 50-10 percentiles of the wealth distribution. Our
results are obtained by calculating each of the relevant counterfactuals and then
taking the simple average of these statistics over all of the possible decomposition
sequences. Bootstrapping methods using a normal approximation with 1,000 repli-
cations are used to calculate standard errors. Results for the decomposition analysis
for all three countries are reported in Table 5.
We find that native-born households are wealthier than foreign-born households
(see Table 5) throughout the entire wealth distribution. At the same time, the mag-
nitude of the nativity wealth gap differs substantially across countries. Immigrants
to Australia have approximately $18,000 less wealth at the median than native-born
Australians – a gap which is not significantly different from zero. In the United
States the median nativity wealth gap is three times higher than that in Australia
(approximately $54,000), while in Germany the median wealth gap exceeds $128,000.
The nativity wealth gap is even larger at the top of the wealth distribution reaching
$200,000 in the United States and as much as $300,000 in Germany at the 90th
percentile. These results point to substantial disparity in the economic well-being of
immigrant and native families. Moreover, this disparity varies dramatically across
receiving countries and is consistent with cross-national differences in the policies
used to select immigrants. In particular, German selection policy has resulted in
an immigrant population that is largely unskilled and, at least notionally, tempo-
rary, while immigrants to Australia are both skilled and permanent. Given this, it
is not surprising that the nativity wealth gap is much larger in Germany than in
Australia.
Interestingly, income differentials explain relatively little of this nativity wealth
gap. In fact, conditional income functions have a statistically insignificant effect (at
the 5%-level) on the overall nativity wealth gap throughout the entire wealth distri-
bution in all three countries. Moreover, the income component of the decomposition
24

is small in magnitude. Specifically, income differentials explain only a modest frac-
tion – between −5% and 15% – of the very large nativity wealth gap at any point
in the German and U.S. wealth distributions. Relative to Germany and the United
States, income differentials appear to account for a much larger share of the wealth
gap between immigrant and native households in Australia. For example, at the me-
dian, more than $7,000 of the overall $18,000 nativity wealth gap in Australia (38%)
stems from the fact that foreign- and Australian-born households have different in-
comes. However, it is important to note that the wealth gap itself is much smaller in
Australia and, as already noted, the effect of this income differential on the wealth
gap is not statistically significant. Overall, these results suggest that – conditional
on the household’s educational attainment and demographic characteristics – income
disparities do not themselves lead to a significantly higher nativity wealth gap. This
result is particularly surprising in light of the empirical evidence demonstrating the
large nativity earnings gap and the often slow earnings assimilation of immigrants
in these countries. At the same time, economic theory suggests that it is permanent
rather than current income that is most closely related to consumption, savings de-
cisions, and ultimately wealth accumulation. Our data unfortunately do not provide
us with a sensible permanent income measure and our results are consistent with the
theoretically weaker relationship between current income and wealth.14 Any effects
of our inability to control for disparities in permanent income will be captured in
the unexplained component of the nativity wealth gap.
In all three countries, differences in educational attainment account for much
more of the nativity wealth gap than do the conditional income functions. This is
14More specifically, our analysis controls for current, after-tax household income
because none of our data sets provide a measure of permanent income. As a ro-
bustness check, we proxied permanent income using a measure of predicted income
following Blau and Graham (1990). We found that using predicted income did
not affect the results of the decomposition analysis substantially. However, using
predicted income makes identifying the effects of education and demographic char-
acteristics more challenging. Consequently, we report only results based on current
income.
25

particularly important as educational qualifications are often one of the key factors
underlying a nation’s immigration selection process. Again, Australia stands out rel-
ative to the United States and Germany, as immigrants have more education on av-
erage than native-born Australians. Our decomposition analysis indicates that this
educational advantage contributes to reducing the nativity wealth gap in Australia.
In other words, if immigrants to Australia had the same educational qualifications as
the native-born population we would expect that immigrants’ wealth disadvantage
at the median would be approximately $14,000 higher than we observe it to be. On
the other hand, the relative educational disadvantage of immigrant households in
the United States and Germany accounts for a substantial portion of their wealth
disadvantage. Specifically, educational differences account for about one quarter of
the nativity wealth gap in Germany. In the United States, disparities in conditional
education functions explain an increasingly large proportion of the nativity wealth
gap as one moves up the wealth distribution – leaving more than half of the nativity
wealth gap explained by educational differences at the 90th percentile. Thus, selec-
tion policies which ultimately shape the nature of the immigration flow are likely to
have a large effect on the relative wealth holdings of the immigrant population.
A household’s demographic characteristics – in particular partners’ ages and
numbers of children – also explain a large portion of the nativity wealth gap in
all three countries. In Australia, immigrant households are typically older and less
likely to have children than native-born households. Consequently, their relative
demographic characteristics, like their relative educational advantage, contribute to
reducing the overall nativity wealth gap by approximately $29,000. In the United
States, however, 26% of the median wealth gap is explained by households’ de-
mographic characteristics, while demographic composition explains between 13 and
48% of the observed wealth gap in Germany. To the extent that this simply reflects
differences in households’ position in the life cycle, the gap in wealth resulting from
demographic composition may not be particularly worrying. At the same time, im-
migrants’ fertility patterns can differ widely across regions of origin suggesting that
the national-origin mix of the immigrant population is likely to be related to the
26

magnitude of the nativity wealth gap.
Overall, these results indicate that wealth differentials are largely the result of
disparity in the education level and demographic composition of the native and im-
migrant populations, while income differentials play a role that is relatively minor.
Interestingly, Australia differs from the United States and Germany in that the edu-
cational and demographic differences serve to narrow rather than widen the nativity
wealth gap. If immigrants to Australia accumulated wealth in the same way as the
native-born population, we would expect that they would have a median wealth
advantage of approximately $36,000. Instead we observe a median wealth gap of
$18,000 implying that immigrant households to Australia accumulate substantially
less wealth given their characteristics than similar native-born households. Thus,
although we observe a very small wealth gap in Australia, this gap is completely
unexplained. In Germany, approximately half of the observed $128,000 median na-
tivity wealth gap is unexplained by immigrants’ income, education, and demographic
characteristics. Much less of the wealth gap in the United States is unexplained by
immigrants’ characteristics. Only about $15,000 of the overall $54,000 gap at the
U.S. median cannot be explained by the fact that immigrants to the United States
have lower income, less education, and are on average younger with larger families.
Thus, the relatively small wealth gap in Australia obscures the fact that immi-
grant households are relatively advantaged in their characteristics. Unfortunately,
they do not translate their educational and demographic advantage into higher
wealth levels. In Germany more than half of the wealth gap is unexplained, while
in the U.S. only one third of the gap cannot be explained by the relatively less
favorable educational and demographic structure of immigrant households.
CONCLUSIONS AND DIRECTIONS FOR FUTURE RE-
SEARCH
Given the increasing numbers of individuals worldwide living outside their country
of birth, it is imperative that researchers move beyond a narrow focus on the eco-
27

nomic assimilation of immigrant workers to also consider the economic well-being
of immigrant families and the economic integration of immigrant communities more
broadly. Many traditional immigrant-receiving countries are facing aging immi-
grant populations as large numbers of immigrants reach retirement age. The extent
to which these immigrants have accumulated sufficient wealth to provide for them-
selves in old-age is, however, largely unknown. This is problematic as there are
many reasons to believe that nativity status may affect wealth holdings and asset
portfolios. This paper uses recent data collections which link wealth holdings to
migration histories to analyze the relative wealth position of immigrant and native
households in Australia, Germany, and the United States.
Our results indicate that native-born households are wealthier than immigrants
households across the entire wealth distribution. At the median, immigrant house-
holds in Australia hold approximately $18,000 less wealth than native households.
This nativity wealth gap is substantially higher in both Germany and the United
States reaching approximately $54,000 in the United States and more than $128,000
in Germany at the median. Using the semi-parametric decomposition method pro-
posed by DiNardo et al. (1996) we demonstrate that income disparities between
native- and foreign-born households are not the primary explanation of these wealth
gaps. Rather wealth differentials are largely the result of differences in the educa-
tional attainment and household composition of native and immigrant households.
Once these differences are taken into account, the nativity wealth gap at the median
falls substantially in Germany and in fact becomes positive (though insignificant) in
the United States. In contrast, the relatively small wealth gap between Australian-
and foreign-born households becomes larger once differentials in household char-
acteristics are taken into account indicating that immigrants to Australia do not
translate their relative educational and demographic advantage into a wealth ad-
vantage. In particular, we would expect immigrant households to have a wealth
advantage if they accumulated wealth in the same way as the Australian-born.
On balance, the substantial cross-national disparity in the economic well-being
of immigrant and native families is largely consistent with the selection policies
28

used to shape the skills and settlement intentions of the immigration population.
These policies ensure, for example, that immigrants to Australia are generally both
permanent and relatively skilled, while immigrants to Germany, are mainly unskilled
and notionally temporary. It is not surprising then that we observe the nativity
wealth gap to be larger in Germany than in Australia. These wealth differentials
are most likely reinforced by labor market differences which lead immigrants to earn
higher relative wages at entry in Australia and enjoy faster earnings adjustment
in the United States, but remain at an earnings disadvantage in Germany. At the
same time, given the large empirical literature documenting these cross-national
differences in the relative labor market outcomes of immigrants, we might have
expected a larger role for income disparities in producing these nativity wealth
gaps.
A number of issues remain important topics for future research. Unfortunately,
given the nature of our data, we have been unable to directly assess how cross-
national differences in welfare and pension systems affect the nativity wealth gap.
Moreover, we can only speculate about how institutional barriers associated with
ethnicity, nativity, legal status, or language skills might limit immigrants’ ability
to access to accumulate financial or housing wealth. Making progress in these ar-
eas is likely to be largely dependent on the development of data sets which allow
detailed comparisons to be made across a number of institutional settings. At the
same time, a deeper understanding of the role of immigration policy in shaping the
nativity wealth gap is likely to come from a comparison of the wealth levels and
asset portfolios of immigrants selected on the basis of productive skills or family
relationships rather than out of humanitarian concerns. Such a comparison is likely
to be particularly important in the case of Australia as our results suggest that the
nativity wealth gap is largely driven by behavioral differences in the accumulation
of wealth. Expanding our focus on first-generation immigrants to also consider the
wealth holdings of second-generation immigrants is an important first step in under-
standing the extent to which the nativity wealth gaps we observe are driven by the
relatively higher investments that immigrants make in the human capital of their
29

children. Finally, future research should explore the extent to which nativity wealth
gaps arise out of differentials in the consumption and saving patterns of native-born
and immigrant households.
30

APPENDIX
Table A1: Components of Net Worth
HILDA GSOEP SIPP
Total interest earning assets in Value of financial assets Total interest earning assets inbanks banks
+ Total interest earning assets in + Total interest earnings inother institutions other institutions
+ Total stocks and mutual funds + Equity in stocks and mutualfunds
+ Total other investmentsa + Equity in other assetsb + Equity in other assetsc
+ Equity in IRA and KEOGHaccounts
– Total value of unsecured debt – Value of financial debts – Total value of unsecured debt
= A. Net Financial Wealth = A. Net Financial Wealth = A. Net Financial Wealth
Business equity Business equity Business equity
= B. Business Equity = B. Business Equity = B. Business Equity
Housing and real estate equity Housing and real estate Housing and real estate equityequity (incl. vehicles)
= C. Housing Equity = C. Housing Equity = C. Housing Equity
Total value of vehiclesd (see C.) Vehicles equity
= D. Vehicles Equity = D. Vehicles Equity = D. Vehicles Equity
A + B + C + D A + B + C + D A + B + C + D
= Net Worth = Net Worth = Net Worth
Note: a Life insurances + trust funds + collectibles. b Life insurances + equity in tangible assets.c Including mortgages held from sale of real estate. d Car loan is included in the total value ofunsecured debt (see A.) which also includes other loans, higher purchase and overdraft.
31

Table A2: Definition of Variables
Variable HILDA GSOEP SIPP DescriptionHousehold Net Income X X X Monthly household net income in $US purchasing power
parities.Age X X X Age in years.Kids<18 X X X Number of children below 18 years in household.Education X X X Education in years.New South Wales X 0/1-variable; 1 if region: New South Wales; 0 otherwise.Victoria X 0/1-variable; 1 if region: Victoria; 0 otherwise.Queensland X 0/1-variable; 1 if region: Queensland; 0 otherwise.South Australia X 0/1-variable; 1 if region: South Australia; 0 otherwise.Western Australia X 0/1-variable; 1 if region: Western Australia; 0 otherwise.Tasmania X 0/1-variable; 1 if region: Tasmania; 0 otherwise.Northern Territories X 0/1-variable; 1 if region: Northern Territories;
0 otherwise.Australian Capital X 0/1-variable; 1 if region: Australian Capital Territory;Territory 0 otherwise.Berlin X 0/1-variable; 1 if region: Berlin; 0 otherwise.Schleswig-Holstein X 0/1-variable; 1 if region: Schleswig-Holstein; 0 otherwise.Hamburg X 0/1-variable; 1 if region: Hamburg; 0 otherwise.Lower Saxony X 0/1-variable; 1 if region: Lower Saxony; 0 otherwise.Bremen X 0/1-variable; 1 if region: Bremen; 0 otherwise.North Rhine-Westphalia X 0/1-variable; 1 if region: North Rhine-Westphalia;
0 otherwise.Hesse X 0/1-variable; 1 if region: Hesse; 0 otherwise.Rhineland-Palatinate, X 0/1-variable; 1 if region: Rhineland-Palatinate,Saarland Saarland; 0 otherwise.Baden-Wuerttemberg X 0/1-variable; 1 if region: Baden-Wuerttemberg;
0 otherwise.Bavaria X 0/1-variable; 1 if region: Bavaria; 0 otherwise.New England X 0/1-variable; 1 if region: New England; 0 otherwise.Middle Atlantic X 0/1-variable; 1 if region: Middle Atlantic; 0 otherwise.East North Central X 0/1-variable; 1 if region: East North Central; 0 otherwise.West North Central X 0/1-variable; 1 if region: West North Central; 0 otherwise.South Atlantic X 0/1-variable; 1 if region: South Atlantic; 0 otherwise.East South Central X 0/1-variable; 1 if region: East South Central; 0 otherwise.West South Central X 0/1-variable; 1 if region: West South Central; 0 otherwise.Mountain X 0/1-variable; 1 if region: Mountain; 0 otherwise.Pacific X 0/1-variable; 1 if region: Pacific; 0 otherwise.<1965 X X X 0/1-variable; 1 if year of immigration before 1965;
0 otherwise.1965-1974 X X X 0/1-variable; 1 if year of immigration between 1965 and
1974; 0 otherwise.1975-1984 X X X 0/1-variable; 1 if year of immigration between 1975 and
1984; 0 otherwise.>1984 X X X 0/1-variable; 1 if year of immigration after 1984;
0 otherwise.
32

REFERENCES
Australian Bureau of Statistics (ABS) 2003. “Expanded Community Profile,
2001 Census Community Profile Series.” Commonwealth of Australia, Catalogue,
2005.0.
Australian Government Department of Immigration and Citizenship, Research and
Statistics Section (AGDIC) 2006. “Settler Arrivals 2005-2006.” Canberra: Aus-
tralian Government Printing Service.
Altonji, J. G. and Doraszelski, U. 2005. “The Role of Permanent Income and De-
mographics in Black/White Differences in Wealth.” Journal of Human Resources
40(1):1-30.
Amuedo-Dorantes, C. and Pozo, S. 2002. “Precautionary Savings by Young Immi-
grants and Young Natives.” Southern Economic Journal 69(1):48-71.
Antecol, H., Cobb-Clark, D. A. and Trejo, S. J. 2003. “Immigration Policy and the
Skills of Immigrants to Australia, Canada, and the United States.” Journal of
Human Resources 38(1):192-218.
Antecol, H., Cobb-Clark, D. A. and Trejo, S. J. 2004. “Selective Immigration Policy
in Australia, Canada and the United States.” Brussels Economic Review - Cahiers
Economiques de Bruxelles 47(1):45-56.
Barsky, R., Bound, J., Kerwin, K. C. and Lupton, J. P. 2002. “Accounting for the
Black-White Wealth Gap: a Nonparametric Approach.” Journal of the American
Statistical Association 97(459):663-673.
Bauer, T. K., Larsen, C. and Matthiessen, P. C. 2004. “Immigration Policy and Dan-
ish and German Immigration.” In Migrants, Work and the Welfare State, edited
by T. Tranaes and K. F. Zimmermann. Odense: University Press of Southern
Denmark.
33

Bauer, T. K., Dietz, B., Zimmermann, K. F. and Zwintz, E. 2005. “European
Migration: What Do We Know?” In Migration and Development, edited by K. F.
Zimmermann. Oxford: Oxford University Press.
Bauer, T. K. and Kunze, A. 2004. “The Demand for High-Skilled Workers and Im-
migration Policy.” Brussels Economic Review - Cahiers Economiques de Bruxelles
47(1):1-19.
Birrell, R. 1990. “The Chains that Bind: Family Reunion Migration to Australia
in the 1980s.” Canberra: Australian National Printing Service.
Blau, F. D. and Graham, J. W. 1990. “Black-White Differences in Wealth and Asset
Composition.” Quaterly Journal of Economics 105(2):321-339.
Blau, F. D. and Kahn, L. M. 1992. “The Gender Earnings Gap: Learning from
International Comparisons.” American Economic Review 82(2):533-538.
Bonin, H., Constant, A., Tatsiramos, K. and Zimmermann, K. F. 2006. “Native-
Migrant Differences in Risk Attitudes.” IZA Discussion Paper No. 1999.
Borjas, G. J. 1987. “Self-Selection and the Earnings of Immigrants.” American
Economic Review 77(4):531-553.
Borjas 1993. “Immigration Policy, National Origin, and Immigrant Skills: A Com-
parison of Canada and the United States.” Small Differences that Matter, edited
by D. Card and R. B. Freeman. Chicago: Chicago University Press.
Borjas, G. J. 1994. “The Economics of Immigration.” Journal of Economic Litera-
ture 32:1667-1717.
Borjas, G. J. 2002. “Homeownership in the Immigrant Population.” Journal of
Urban Economics 52(3):448-476.
Briggs, V. M. 1984. “Immigration Policy and the American Labor Force.” Baltimore:
The John Hopkins University Press.
34

Burbidge, J., Magee, L. and Robb, A. 1988. “Alternative Transformations to Handle
Extreme Values of the Dependent Variable.” Journal of the American Statistical
Association 83(401):123-127.
Carroll, C. D., Rhee, B. and Rhee, C. 1994. “Are There Cultural Effects on Saving?
Some Cross-Sectional Evidence.” Quaterly Journal of Economics 109(3):685-699.
Chiswick, B. R. 1978. “The Effect of Americanization on the Earnings of Foreign-
Born Men.” Journal of Political Economy 85(5):879-921.
Chiswick, B. R. and Miller, P. W. 1985. “Immigration Generation and Income in
Australia.” Economic Record 61(73):540-553.
Chiswick, B. R. and Miller, P. W. 2006. “Immigration to Australia During the
1990s: Institutional and Labor Market Influences.” Public Policy and Immigrant
Settlement, edited by D. A. Cobb-Clark and S. Khoo. Surrey: Edward Elgar
Publishing Ltd.
Chiteji, N. S. and Stafford, F. P. 1999. “Portfolio Choices of Parents and their
Children as Young Adults: Asset Accumulation by African-American Families.”
American Economic Review 89(2):377-380.
Clark, W. A. V. and Deurloo, M. C. and Dieleman, F. M. 1997. “Entry to Home-
ownership in Germany: Some Comparisons with the United States.” Urban Stud-
ies 34:7-19.
Cobb-Clark, D. A. and Hildebrand, V. A. 2006a. “The Wealth and Asset Holdings
of U.S.-Born and Foreign-Born Households: Evidence from SIPP Data.” Review
of Income and Wealth 52(1):17-42.
Cobb-Clark, D. A. and Hildebrand, V. A. 2006b. “The Portfolio Choices of Hispanic
Couples.” Social Science Quaterly, forthcoming.
Cobb-Clark, D. A. and Hildebrand, V. A. 2006c. “The Wealth of Mexican Ameri-
cans.” Journal of Human Resources, forthcoming.
35

Cobb-Clark, D. A. and Stillman, S. 2006. “The Retirement Expectations of Middle-
Aged Individuals.” Unpublished working paper.
Coulson, N. E. 1999. “Why are Hispanic- and Asian-American Homeownership
Rates so Low?: Immigration and Other Factors.” Journal of Urban Economics
45:209-227.
De Coulon, A. and Wolff, F. 2006. “The Location of Immigrants at Retirement:
Stay/Return or “Va-et-Vient”?” IZA Discussion Paper No. 2224.
DiNardo, J., Fortin, N. M. and Lemieux, T. 1996. “Labor Market Institutions and
the Distribution of Wages, 1973-1992: A Semiparametric Approach.” Economet-
rica 64:1001-1044.
Djajic, S. 1989. “Migrants in a Guest-worker System.” Journal of Development
Economics 31:327-339.
Djajic, S. and Melbourne, R. 1988. “A General Equilibrium Model of Guest-worker
Migration.” Journal of International Economics 25:335-351.
Dohmen, T., Falk, A., Huffmann, D. and Sunde, U. 2006. “The Intergenerational
Transmission of Risk and Trust Attitudes.” IZA Discussion Paper No. 2380.
Duleep, H. O. and Regets, M. C. 1992. “Country of Origin and Immigrant Quality.”
Urban Institute, Working Paper, PRIB-UI-28.
Duleep, H. O. and Regets, M. C. 1996. “Admission Criteria and Immigrant Earnings
Profiles.” International Migration Review 30(2):571-590.
Dustmann, C. 1997. “Return Migration, Uncertainty and Precautionary Savings.”
Journal of Development Economics 52:295-316.
Fix, M. and Passel, J. 2002. “The Scope and Impact of Welfare Reform’s Immigrant
Provisions.” Urban Institute, Discussion Paper.
Galor, O. and Stark, O. 1990. “Migrants’ Savings, the Probability of Return Migra-
tion and Migrants’ Performance.” International Economic Review 31(2):463-467.
36

Gittleman, M. and Wolff, E. N. 2000. “Racial Differences in Patterns of Wealth
Accumulation.” Working Paper No. 311.
Gong, X., Ryan, C. and Whelan, S. 2006. “Senior Australians in the Workforce.”
SPEAR Centre Report to the Department of Family, Communities Services, and
Indigenous Affairs.
Gruber, J. and Wise, D. A. 2001. “An International Perspective on Policies for an
Aging Society.” NBER Working Paper No. W8103.
Haisken-DeNew, J. P. and Hahn, M. 2006. “PanelWhiz: A Menu-Driven Stata/SE
Interface for Accessing Panel Data.” Mimeo, www.panelwhiz.eu.
Heady, B. 2003. “Income and Wealth - Facilitating Multiple Approaches to Measure-
ment and Permitting Different Levelsof Aggregation.” HILDA Project Discussion
Paper Series, 3/03.
Holzmann, R. 2005. “Demographic Alternatives for Aging Industrial Counties:
Increased Total Fertility Rate, Labor Force Participation, or Immigration.” IZA
Discussion Paper No. 1885.
Jasso, G. and Rosenzweig, M. R. 1995. “Do Immigrants Screened for Skills Do
Better than Family Reunification Immigrants?” International Migration Review
29:85-111.
Juster, F. T. and Kuester, K. A. 1991. “Differences in the Measurement of Wealth,
Wealth Inequality, and Wealth Composition Obtained from Alternative U.S. Sur-
veys.” Review of Income and Wealth 37(1):33-62.
Juster, F. T., Smith, J. P. and Stafford, F. 1999. “The Measurement and Structure
of Household Wealth.” Labour Economics 6:253-275.
Lowell, L. 2001. “The Foreign Temporary (H-1b) Workforce and Shortages in
Information Technology.” In The International Migration of the Highly Skilled:
Demand, Supply, and Development Consequences in Sending and Receiving Coun-
tries, edited by C. Wayne. San Diego, University of California.
37

Marks, G. N., Heady, B. and Wooden, M. 2005. “Household Wealth in Australia:
Its components, distribution and correlates.” Journal of Sociology 41(1):47-68.
Miller, P. and Neo, L. 2003. “Labour Market Flexibility and Immigrant Adjust-
ment.” Economic Record 79(246):336-356.
Myers, D. and Lee, S. W. 1996. “Immigration Cohorts and Residential Overcrowding
in Southern California.” Demography 33(1):51-65.
Nielsen, N. 2004. “Social Transfers to Immigrants in Germany and Denmark.” Mi-
grants, Work and the Welfare State, edited by T. Tranaes and K. F. Zimmermann.
Odense: University Press of Southern Denmark.
OECD 2005. “Pensions at a Glance: public Policies across OECD Countries.”
Organization for Economic Co-operation and Development (OECD), Paris.
OECD 2006. “International Migration Outlook, Annual Report.” Organization for
Economic Co-operation and Development (OECD). SOPEMI, Paris.
Osili, U. O. and Paulson, A. 2004. “Prospects for Immigrant-Native wealth Assim-
ilation: Evidence from Financial Market Participation.” Federal Reserve Bank of
Chicago, Working Paper, 04-18.
Osili, U. O. and Paulson, A. 2005. “Institutional Quality and Financial Market
Development: Evidence from International Migrants in the U.S.” Federal Reserve
Bank of Chicago, Working Paper, 04-19.
Painter, G., Yang, L. and Yu, Z. 2003. “Heterogeneity in Asian American Home-
ownership: The Impact of Household Endowments and Immigrant Status.” Urban
Studies 40:505-530.
Proxenos, S. 2002. “Homeownership Rates: A Global Perspective.” Housing Finance
International 17(2):3-7.
38

Schafer, A. and Schupp, J. 2006. “Zur Erfassung der Vermogensbestande im Sozio-
okonomischen Panel (SOEP) im Jahr 2002.” DIW Berlin, Data Documentation
11.
Schmidley, D. A. 2001. “Profile of the Foreign-Born Population in the United
States, 2000.” Current Population Reports, Series P23-206. U.S. Census Bureau,
Washington, DC: U.S. Government Printing Office.
Schmidt, C. M. and Zimmermann, K. F. 1992. “Migration Pressure in Germany:
Past and Future.” In Migration and Development, edited by K. F. Zimmermann.
Berlin: Springer.
Sinning, M. 2006. “Home-Ownership and Economic Performance of Immigrants in
Germany.” RWI Discussion Papers No. 45.
Shamsuddin, A. F. M. and DeVoretz, D. J. 1998. “Wealth Accumulation of Cana-
dian and Foreign-Born Households in Canada.” Review of Income and Wealth
44(4):515-533.
Sheridan, M. B. 2002. “An Entry Card for Immigrants; Illegal Residents Gain
Access to Services with Mexican ID.” Washington Post, 26 July 2002.
Social Security Administration 2003. “Survey Estimates of Wealth: A Comparative
Analysis and Review of the Survey of Income and Program Participation.” Social
Security Bulletin. 65(1):47-68.
Visco, I. 2001. “Economic Policy for Aging Societies.” OECD, Conference Presen-
tation, www.oecd.org/dataoecd/20/23/2431724.pdf.
Wolff, E. N. 1998. “Recent Trends in the Size Distribution of Household Wealth.”
Journal of Economic Perspectives. 12(3):131-150.
Wooden, M., Freidin, S. and Watson, N. 2002. “The Household, Income and Labour
Dynamics in Australia (HILDA) Survey: Wave 1.” Australian Economic Review
35(3):339-348.
39

Zhang, X. 2002. “The Wealth Position of Immigrant Families in Canada.” Statistics
Canada, unpublished working paper.
40

Table 1: Descriptive statistics, Australia*
Natives ImmigrantsMean Std.Dev. N Mean Std.Dev. N
Net WorthNet Worth 303224.92 9491.62 2245 270364.56 16469.61 586Median Net Worth 187661.94 5687.43 2245 163452.23 12069.60 586Net Worth if >0 314922.39 9752.36 2153 283954.98 16890.15 559% >0 0.985 0.003 2245 0.972 0.011 586Net Worth by Age Group25-34 154352.32 14765.99 522 128382.40 42870.77 6235-44 243860.32 17132.34 627 189925.13 22995.46 14045-54 350660.49 18251.76 506 335109.21 39368.59 17055-64 504535.58 34341.88 329 323100.47 34525.07 11065-75 339686.63 18938.60 261 293117.71 34385.96 104Components of Net WorthNet Financial Wealth 58920.34 3751.83 2245 45653.62 5973.97 586Business Equity 38860.77 4113.19 2245 27746.22 6722.70 586Housing Equity 185542.80 5791.37 2245 182319.18 10116.71 586Vehicles Equity 19901.01 672.79 2245 14645.54 1231.30 586Explanatory VariableHousehold Net Income 48142 973.09 2245 42465 1991.43 586Age 47 0.30 2245 51 0.58 586Kids<18 0.973 0.026 2245 0.765 0.045 586Education 11.91 0.05 2245 12.14 0.14 586Place of ResidenceNew South Wales 0.306 0.011 2245 0.373 0.024 586Victoria 0.249 0.010 2245 0.283 0.021 586Queensland 0.230 0.010 2245 0.112 0.014 586South Australia 0.079 0.006 2245 0.074 0.010 586Western Australia 0.087 0.006 2245 0.128 0.014 586Tasmania 0.032 0.004 2245 0.005 0.002 586Northern Territories 0.004 0.002 2245 0.007 0.004 586Australian Capital Territory 0.013 0.002 2245 0.018 0.005 586Immigration Cohort<1965 0.168 0.016 5861965-1974 0.227 0.019 5861975-1984 0.138 0.017 586>1984 0.467 0.024 586Place of OriginEnglish Speaking 0.321 0.021 586Europe 0.278 0.021 586Asia 0.278 0.023 586Other 0.123 0.016 586
Note: * Amounts in $US Purchasing Power Parities.
41

Table 2: Descriptive statistics, Germany*
Natives ImmigrantsMean Std.Dev. N Mean Std.Dev. N
Net WorthNet Worth 223349.55 8427.31 2392 101382.27 13998.67 270Median Net Worth 194851.92 6601.05 2392 26068.82 9375.52 270Net Worth if > 0 241333.02 8656.55 2254 125740.01 15267.20 232% > 0 0.935 0.009 2392 0.839 0.034 270Net Worth by Age Group25-34 93806.17 13146.352 223 38028.870 13635.20 4835-44 190495.28 11450.291 628 96401.651 34609.47 7745-54 250658.92 16524.554 601 125767.663 17972.43 7055-64 267542.46 19473.813 548 128424.120 45302.43 4765-75 256273.21 24876.566 392 100040.386 29976.37 28Components of Net WorthNet Financial Wealth 35893.16 2187.07 2392 17649.78 3139.11 270Business Equity 9338.67 1610.77 2392 3056.10 2419.63 270Housing Equity 87616.80 3856.87 2392 42170.67 5287.57 270Explanatory VariablesHousehold Net Income 35629.88 476.81 2392 30921.91 1212.16 270Age 51 0.40 2392 48 1.14 270Kids<18 0.705 0.028 2392 1.189 0.112 270Education 12.456 0.085 2392 11.333 0.204 270Place of ResidenceBerlin 0.026 0.006 2392 0.009 0.006 270Schleswig-Holstein 0.047 0.007 2392 0.022 0.012 270Hamburg 0.019 0.004 2392 0.001 0.001 270Lower Saxony 0.137 0.011 2392 0.162 0.034 270Bremen 0.013 0.003 2392 0.016 0.010 270North Rhine-Westphalia 0.255 0.014 2392 0.273 0.049 270Hesse 0.078 0.008 2392 0.086 0.021 270Rhineland-Palatinate, Saarland 0.084 0.009 2392 0.066 0.018 270Baden-Wuerttemberg 0.149 0.011 2392 0.250 0.041 270Bavaria 0.185 0.011 2392 0.116 0.024 270Immigration Cohort<1965 0.046 0.015 2701965-1974 0.349 0.050 2701975-1984 0.214 0.036 270>1984 0.390 0.044 270Region of OriginOECD Member Country 0.189 0.050 270Central and Eastern Europe 0.379 0.043 270Turkey 0.293 0.041 270Ex-Yugoslavia 0.086 0.025 270Other 0.053 0.020 270
Note: * Amounts in $US Purchasing Power Parities.
42

Table 3: Descriptive statistics, USA*
Natives ImmigrantsMean Std.Dev. N Mean Std.Dev. N
Net Worth 164540.14 2842.71 10296 83461.76 5756.68 1057Median Net Worth 74527.67 1365.35 10296 20223.23 2600.87 1057Net Worth if >0 188104.74 3104.15 9116 105300.46 6838.57 851% >0 0.887 0.003 10296 0.814 0.012 1057Net Worth by Age Group25-34 48110.96 2877.41 1745 32239.60 5724.63 27135-44 117174.07 4081.29 2786 78349.49 11717.96 32745-54 175079.07 5503.12 2577 85034.19 9078.37 25355-64 252345.96 8817.99 1768 126279.39 18702.38 13265-75 268793.09 9417.61 1420 224905.73 35261.45 74Components of Net WorthNet Financial Wealth 56518.75 1585.74 10296 15520.22 2361.47 1057Business Equity 14786.63 1105.28 10296 9281.11 2670.33 1057Housing Equity 87954.94 1419.09 10296 55365.65 3509.45 1057Vehicles Equity 5279.82 88.54 10296 3294.77 211.77 1057Explanatory VariableHousehold Net Incomea 17440 148.99 10296 13024 397.31 1057Age 48 0.13 10296 44 0.38 1057Kids<18 0.859 0.011 10296 1.359 0.041 1057Education 13.56 0.02 10296 12.11 0.13 1057Place of ResidenceNew England 0.048 0.002 10296 0.047 0.007 1057Middle Atlantic 0.133 0.004 10296 0.168 0.012 1057East North Central 0.173 0.004 10296 0.081 0.009 1057West North Central 0.080 0.003 10296 0.019 0.004 1057South Atlantic 0.191 0.004 10296 0.164 0.012 1057East South Central 0.069 0.003 10296 0.004 0.002 1057West South Central 0.114 0.003 10296 0.119 0.011 1057Mountain 0.050 0.002 10296 0.057 0.007 1057Pacific 0.115 0.003 10296 0.337 0.015 1057Immigration Cohort<1965 0.062 0.008 10571965-1974 0.112 0.010 10571975-1984 0.263 0.014 1057>1984 0.563 0.016 1057Place of OriginEuropeb 0.143 0.012 1057Asia 0.305 0.015 1057Mexico 0.305 0.015 1057Central/South America 0.173 0.012 1057Other 0.074 0.008 1057
Note: * Amounts in $US. a Quarterly income reported. b Includes also Canada and Australia.
43

Table 4: Median Quantile Regressions
Australia Germany United StatesCoef. Std. Err. Coef. Std. Err. Coef. Std. Err.
Household Net Income 2.38*** 0.11 4.19*** 0.19 3.50*** 0.06Education 20650.58*** 1826.69 7708.47*** 1496.99 8202.90*** 365.55Kids<18 6049.07 3876.88 20517.36*** 4342.53 4002.60*** 839.49Age 19310.05*** 2471.12 7956.52*** 2685.01 -731.80 494.64Age2 -105.85*** 25.43 -34.37 26.08 46.40*** 4.96Immigrant -53796.69*** 12192.24 -56215.74*** 17740.61 5179.19 4179.43
Immigration CohortsYear of Migration<1965 3831.95 20030.93 -3147.45 36598.12 31361.66*** 9041.61Year of Migration 1965-1974 7244.25 17142.15 -4811.77 22228.99 -13409.98** 6792.27Year of Migration 1975-1984 3276.68 20772.59 3151.13 24216.88 -691.53 5380.89Year of Migration >1984 2489.54 30585.28 4808.09 25702.41 -17260.14*** 4640.14
Regions of OriginEnglish Speaking -12497.31 15075.65Europe 18537.27 17441.70Asia -4129.83 17356.74Other -42783.16 55068.28OECD -5151.02 28596.07Central and Eastern Europe 16094.94 27021.08Ex-Yugoslavia -1848.85 33072.04Turkey -15575.61 23728.79Other 6480.54 44744.27Europe 6471.63 6688.56Asia -9372.72* 5036.50Mexico 34072.31*** 5101.39Central/South America -7087.35 5939.91Other -24083.88*** 8473.25Constant -748484.71*** 60235.44 -395370.20*** 68194.57 -160248.32*** 12765.05N 2,836 2,662 11,353
44

Table 5: DFL decomposition – Foreign-Born to Native-Born Households
Raw Gap Income Education Demography UnexplainedAustralia10th 8406.71 3201.99 -5998.38 -13285.69 24488.80
[3271.86] [1822.20] [2111.02] [3332.39] [5214.50](38) (-71) (-158) (291)
25th 24358.95 6981.46 -8195.39 -22188.30 47761.19[11172.24] [3596.68] [3157.14] [5211.24] [12097.16]
(28) (-33) (-91) (196)50th 18258.95 7069.77 -13958.95 -28583.20 53731.34
[13411.77] [8561.36] [4742.80] [5823.40] [14862.45](38) (-76) (-156) (294)
75th 42611.94 2118.53 -25169.90 -45157.58 110820.90[20422.06] [31848.92] [9147.20] [13445.70] [29826.16]
(4) (-59) (-105) (260)90th 47971.64 8975.62 -34494.52 -43300.49 116791.04
[61100.36] [69697.91] [15935.78] [20525.02] [81868.40](18) (-71) (-90) (243)
Germany10th 16214.80 563.95 2365.31 5464.89 7820.64
[2988.34] [595.79] [1421.54] [2200.65] [4058.24](3) (14) (33) (48)
25th 20855.05 702.81 4862.35 10076.12 5213.76[4373.83] [1022.94] [1519.60] [2600.25] [3369.02]
(3) (23) (48) (25)50th 128309.18 2013.90 31400.50 30213.85 64680.92
[16731.41] [4534.49] [8713.06] [12741.35] [21750.74](1) (24) (23) (50)
75th 163404.61 4193.78 31694.04 24849.40 102667.38[17588.14] [6033.80] [8815.23] [9739.70] [19162.90]
(2) (19) (15) (62)90th 290208.56 8662.15 59878.00 38675.71 182992.69
[51989.02] [15122.47] [19644.25] [17587.95] [43936.22](2) (20) (13) (63)
United States10th 1980.55 235.17 858.69 2471.01 -1584.32
[1002.31] [406.04] [276.14] [433.84] [1191.00](12) (43) (125) (-80)
25th 15792.23 2300.61 6330.20 5385.51 1775.92[843.46] [1691.97] [1189.68] [647.80] [940.01]
(15) (40) (34) (11)50th 54304.44 4261.18 20583.84 14282.74 15176.68
[3070.84] [12503.11] [8753.94] [2511.23] [6270.28](8) (38) (26) (28)
75th 105479.49 2310.24 53708.05 28424.52 21036.68[8497.99] [30542.10] [13452.16] [6514.46] [30635.88]
(2) (51) (27) (20)90th 195645.38 -10506.57 114300.30 47908.96 43942.69
[19098.54] [47451.95] [21711.34] [10526.87] [54541.00](-5) (58) (24) (22)
45

Table 5 Continued
Raw Gap Income Education Demography UnexplainedAustraliaP50-P10 9852.23 3867.78 -7960.57 -15297.51 29242.53
[12843.23] [7155.99] [3310.28] [4785.65] [14048.90]P75-P25 18252.98 -4862.93 -16974.50 -22969.27 63059.70
[19279.64] [28887.76] [6889.46] [12255.80] [26968.97]P90-P50 29712.68 1905.84 -20535.57 -14717.28 63059.70
[58122.60] [63121.00] [13126.89] [18971.63] [76404.09]GermanyP50-P10 112094.37 1449.94 29035.19 24748.95 56860.27
[16181.05] [4349.59] [8177.96] [12047.39] [20810.98]P75-P25 142549.55 3490.97 26831.68 14773.28 97453.61
[16557.07] [5372.75] [8337.29] [8522.17] [18190.84]P90-P50 161899.38 6648.25 28477.49 8461.86 118311.77
[49808.38] [12621.29] [18006.86] [14629.50] [44959.63]United StatesP50-P10 52323.89 4026.02 19725.15 11811.73 16761.01
[2885.75] [12190.67] [8661.20] [2329.58] [5991.53]P75-P25 89687.26 9.63 47377.85 23039.01 19260.76
[8345.93] [29006.83] [13050.21] [6278.24] [29958.23]P90-P50 141340.94 -14767.76 93716.47 33626.22 28766.01
[18409.38] [43039.32] [24026.03] [9654.78] [51815.23]
Note: Percentage of total variation explained in parenthesis. Standard errors of explainedvariation are reported in brackets.
46

−26224.65 −24209.71−44664.22
−35
0000
−15
0000
5000
025
0000
Unc
ondi
tiona
l Wea
lth G
ap
0 .25 .5 .75 1Quantile
Figure 1: Unconditional Nativity Wealth Gap, Quantile Regression Estimates,Australia
47

−32325.34
−168783.10−200270.10
−80
0000
−60
0000
−40
0000
−20
0000
0U
ncon
ditio
nal W
ealth
Gap
0 .25 .5 .75 1Quantile
Figure 2: Unconditional Nativity Wealth Gap, Quantile Regression Estimates,Germany
48

−15792.36
−54304.44
−105479.35
−45
0000
−30
0000
−15
0000
0U
ncon
ditio
nal W
ealth
Gap
0 .25 .5 .75 1Quantile
Figure 3: Unconditional Nativity Wealth Gap, Quantile Regression Estimates, USA
49

SEDAP RESEARCH PAPERS: Recent Releases
Number Title Author(s)
50
(2004)
No. 114: The Politics of Protest Avoidance: Policy Windows, LaborMobilization, and Pension Reform in France
D. BélandP. Marnier
No. 115: The Impact of Differential Cost Sharing of Non-SteroidalAnti-Inflammatory Agents on the Use and Costs of AnalgesicDrugs
P.V. GrootendorstJ.K. MarshallA.M. HolbrookL.R. DolovichB.J. O’BrienA.R. Levy
No. 116: The Wealth of Mexican Americans D.A. Cobb-ClarkV. Hildebrand
No. 117: Precautionary Wealth and Portfolio Allocation: Evidence fromCanadian Microdata
S. Alan
No. 118: Financial Planning for Later Life: Subjective Understandingsof Catalysts and Constraints
C.L. KempC.J. RosenthalM. Denton
No. 119: The Effect of Health Changes and Long-term Health on theWork Activity of Older Canadians
D. Wing Han AuT.F. CrossleyM. Schellhorn
No. 120: Pension Reform and Financial Investment in the United Statesand Canada
D. Béland
No. 121: Exploring the Returns to Scale in Food Preparation(Baking Penny Buns at Home)
T.F. CrossleyY. Lu
No. 122: Life-cycle Asset Accumulation andAllocation in Canada
K. Milligan
No. 123: Healthy Aging at Older Ages: Are Income and EducationImportant?
N.J. BuckleyF.T. DentonA.L. RobbB.G. Spencer
(2005)
No. 124: Exploring the Use of a Nonparametrically GeneratedInstrumental Variable in the Estimation of a Linear ParametricEquation
F.T. Denton
No. 125: Borrowing Constraints, The Cost of Precautionary Saving, andUnemployment Insurance
T.F. CrossleyH.W. Low

SEDAP RESEARCH PAPERS: Recent Releases
Number Title Author(s)
51
No. 126: Entry Costs and Stock Market Participation Over the LifeCycle
S. Alan
No. 127: Income Inequality and Self-Rated Health Status: Evidencefrom the European Community Household Panel
V. HildebrandP. Van Kerm
No. 128: Where Have All The Home Care Workers Gone? M. DentonI.U. ZeytinogluS. DaviesD. Hunter
No. 129: Survey Results of the New Health Care Worker Study: Implications of Changing Employment Patterns
I.U. ZeytinogluM. DentonS. DaviesA. BaumannJ. BlytheA. Higgins
No. 130: Does One Size Fit All? The CPI and Canadian Seniors M. Brzozowski
No. 131: Unexploited Connections Between Intra- and Inter-temporalAllocation
T.F. CrossleyH.W. Low
No. 132: Grandparents Raising Grandchildren in Canada: A Profile ofSkipped Generation Families
E. Fuller-Thomson
No. 133: Measurement Errors in Recall Food Expenditure Data N. AhmedM. BrzozowskiT.F. Crossley
No. 134: The Effect of Health Changes and Long-term Health on theWork Activity of Older Canadians
D.W.H. AuT. F. CrossleyM.. Schellhorn
No. 135: Population Aging and the Macroeconomy: Explorations in theUse of Immigration as an Instrument of Control
F. T. DentonB. G. Spencer
No. 136: Users and Suppliers of Physician Services: A Tale of TwoPopulations
F.T. DentonA. GafniB.G. Spencer
No. 137: MEDS-D USERS’ MANUAL F.T. Denton C.H. Feaver B.G.. Spencer

SEDAP RESEARCH PAPERS: Recent Releases
Number Title Author(s)
52
No. 138: MEDS-E USERS’ MANUAL F.T. Denton C.H. Feaver B.G. Spencer
No. 139: Socioeconomic Influences on the Health of Older Canadians: Estimates Based on Two Longitudinal Surveys(Revised Version of No. 112)
N.J. BuckleyF.T. DentonA.L. RobbB.G. Spencer
No. 140: Developing New Strategies to Support Future Caregivers ofthe Aged in Canada: Projections of Need and their PolicyImplications
J. KeefeJ. LégaréY. Carrière
No. 141: Les Premiers Baby-Boomers Québécois font-ils une MeilleurePréparation Financière à la Retraite que leurs Parents?Revenu, Patrimoine, Protection en Matière de Pensions etFacteurs Démographiques
L. MoJ. Légaré
No. 142: Welfare Restructuring without Partisan Cooperation:The Role of Party Collusion in Blame Avoidance
M. Hering
No. 143: Ethnicity and Health: An Analysis of Physical HealthDifferences across Twenty-one Ethnocultural Groups inCanada
S. PrusZ. Lin
No. 144: The Health Behaviours of Immigrants and Native-Born Peoplein Canada
J.T. McDonald
No. 145: Ethnicity, Immigration and Cancer Screening: Evidence forCanadian Women
J.T. McDonaldS. Kennedy
No. 146: Population Aging in Canada: Software for Exploring theImplications for the Labour Force and the Productive Capacityof the Economy
F.T. Denton C.H. Feaver B.G. Spencer
(2006)
No. 147: The Portfolio Choices of Hispanic Couples D.A. Cobb-ClarkV.A. Hildebrand
No. 148: Inter-provincial Migration of Income among Canada’s OlderPopulation:1996-2001
K.B. Newbold
No. 149: Joint Taxation and the Labour Supply of Married Women:Evidence from the Canadian Tax Reform of 1988
T.F. CrossleyS.H. Jeon
No. 150: What Ownership Society? Debating Housing and SocialSecurity Reform in the United States
D. Béland

SEDAP RESEARCH PAPERS: Recent Releases
Number Title Author(s)
53
No. 151: Home Cooking, Food Consumption and Food Productionamong the Unemployed and Retired Households
M. BrzozowskiY. Lu
No. 152: The Long-Run Cost of Job Loss as Measured by ConsumptionChanges
M. BrowningT.F. Crossley
No. 153: Do the Rich Save More in Canada? S. AlanK. AtalayT.F. Crossley
No. 154: Income Inequality over the Later-life Course: A ComparativeAnalysis of Seven OECD Countries
R.L. BrownS.G. Prus
No. 155: The Social Cost-of-Living: Welfare Foundations andEstimation
T.F. CrossleyK. Pendakur
No. 156: The Top Shares of Older Earners in Canada M.R. Veall
No. 157: Le soutien aux personnes âgées en perte d’autonomie: jusqu’où les baby-boomers pourront-ils compter sur leurfamille pour répondre à leurs besoins ?
J. LégaréC. AlixY. CarrièreJ. Keefe
No. 158: Les générations X et Y du Québec, vraiment différentes desprécédentes ?
J. LégaréP.O. Ménard
No. 159:French
La diversification et la privatisation des sources de revenu deretraite au Canada
L. MoJ. LégaréL. Stone
No. 159:English
The Diversification and the Privatization of the Sources ofRetirement Income in Canada
L. MoJ. LégaréL. Stone
No. 160: Evaluating Pension Portability Reforms: The Tax Reform Actof 1986 as a Natural Experiment
V. AndriettiV.A. Hildebrand
No. 161: Estimating a Collective Household Model with Survey Dataon Financial Satisfaction
R. AlessieT.F. CrossleyV.A. Hildebrand
No. 162: Physician Labour Supply in Canada: A Cohort Analysis T.F. CrossleyJ. HurleyS.H. Jeon
No. 163: Tax Incentives and Household Portfolios: A Panel DataAnalysis
S. AlanS. Leth-Petersen

SEDAP RESEARCH PAPERS: Recent Releases
Number Title Author(s)
54
No. 164: The Healthy Immigrant Effect and Immigrant Selection:Evidence from Four Countries
S. KennedyJ.T. McDonaldN. Biddle
No. 165: Well-Being Throughout the Senior Years: An Issues Paper onKey Events and Transitions in Later Life
M. DentonK. Kusch
No. 166: Satisfied Workers, Retained Workers: Effects of Work andWork Environment on Homecare Workers’ Job Satisfaction,Stress, Physical Health, and Retention
I.U. ZeytinogluM. Denton
No. 167: Contrasting Inequalities: Comparing Correlates of Health inCanada and the United States
H. ArmstrongW. ClementZ. LinS. Prus
(2007)
No. 168: Health human resources planning and the production of health:Development of an extended analytical framework for needs-based health human resources planning
S. BirchG. KephartG. Tomblin-MurphyL. O’Brien-PallasR. AlderA. MacKenzie
No. 169: Gender Inequality in the Wealth of Older Canadians M. DentonL. Boos
No. 170: The Evolution of Elderly Poverty in Canada K. Milligan
No. 171: Return and Onwards Migration among Older Canadians:Findings from the 2001 Census
K.B. Newbold
No. 172: Le système de retraite américain: entre fragmentation etlogique financière
D. Béland
No. 173: Entrepreneurship, Liquidity Constraints and Start-up Costs R. FonsecaP.-C. MichaudT. Sopraseuth
No. 174: How did the Elimination of the Earnings Test above theNormal Retirement Age affect Retirement Expectations?
P.-C. MichaudA. van Soest
No. 175: The SES Health Gradient on Both Sides of the Atlantic J. BanksM. MarmotZ. OldfieldJ.P. Smith

SEDAP RESEARCH PAPERS: Recent Releases
Number Title Author(s)
55
No. 176: Pension Provision and Retirement Saving: Lessons from theUnited Kingdom
R. DisneyC. EmmersonM. Wakefield
No. 177: Retirement Saving in Australia G. BarrettY.-P. Tseng
No. 178: The Health Services Use Among Older Canadians in Ruraland Urban Areas
H. CondeJ.T. McDonald
No. 179: Older Workers and On-the-Job Training in Canada:Evidence from the WES data
I.U. ZeytinogluG.B. CookeK. Harry
No. 180: Private Pensions and Income Security in Old Age:An Uncertain Future – Conference Report
M. HeringM. Kpessa
No. 181: Age, SES, and Health: A Population Level Analysis of HealthInequalitites over the Life Course
S. Prus
No. 182: Ethnic Inequality in Canada: Economic and HealthDimensions
E.M. GeeK.M. KobayashiS.G. Prus
No. 183: Home and Mortgage Ownership of the Dutch Elderly:Explaining Cohort, Time and Age Effects
A. van der SchorsR.J.M. AlessieM. Mastrogiacomo
No. 184: A Comparative Analysis of the Nativity Wealth Gap T.K. BauerD.A. Cobb-ClarkV. HildebrandM. Sinning