The Stability of the Czech Banking Sector Phenomenon in the ...
Upload
khangminh22Category
view
3download
0
Sustainability 2019, 11, 653; doi:10.3390/su11030653 www.mdpi.com/journal/sustainability
Article
Sustainability Performance: A Comparative Analysis in the Polish Banking Sector
Zbigniew Korzeb 1,* and Reyes Samaniego-Medina 2
1 Department of Finance and Accounting, Bialystok University of Technology, 15-351 Bialystok, Poland;
2 Department of Financial Economics and Accounting, Universidad Pablo de Olavide, 41013 Seville, Spain;
* Correspondence: [email protected]
Received: 25 November 2018; Accepted: 22 January 2019; Published: 26 January 2019
Abstract: This article analyses the Polish banking sector’s involvement with sustainable
development through a multidimensional evaluation applying the technique for order preference
by similarity ideal solution (TOPSIS) method with different weight vectors. Our results highlight
numerous shortcomings in the sustainability performance of commercial banking activities. In fact,
there was backsliding during the analysed period (2015–2017), which suggests that supporting
sustainability performance was not one of the priorities of the Polish banking sector. However, we
found a dichotomy between national and foreign banks. The government-owned banks and
national banks showed greater commitment to this issue than did the banks with foreign capital.
This finding suggests that banks with foreign capital were not fully interested in sponsoring
activities aimed at sustainable development.
Keywords: banking sector; commercial banks; sustainable development; sustainability
performance; multidimensional comparative analysis
1. Introduction
Humanity has the ability to make development sustainable to ensure that it meets the needs of
the present without compromising the ability of future generations to meet their own needs [1]. For
the financial sector, sustainable development is based on the concept of achieving the main aim of
banking activity, i.e., to create value for shareholders, whilst respecting the environment and social
development. According to the Agenda for Sustainable Development and the European Commission
[2,3], the most important elements of sustainable development are protecting the environment;
ensuring access to modern and sustainable energy; developing innovation; using new,
environmentally friendly technologies and production methods; improving conditions for enterprise
development; and raising consumer awareness.
Understanding the critical roles that banks play in the economy is fundamental to theoretical
economics and finance. Despite the financial crises, the importance of banks in modern economies
varies significantly. According to Allen and Carletti (2010) [4], cross-country comparisons, individual
country studies, and industry- and firm-level analyses reveal a positive link among the sophistication
of the banking system, economic growth and sustainable development. The connections between
sustainable development and banking activities date back to the 1990s [5], when banks increasingly
began to incorporate environmental requirements directly through their operational activities and
indirectly through the products and services they offered [6,7]. The direct environmental impact of
banks is measured by their consumption of utilities (electricity, water, heat, natural gas and others),
use of typical office supplies (paper, toner, etc.) and generation of municipal waste and air pollution.
The indirect environmental impact of banks results from services rendered to reduce environmental

Sustainability 2019, 11, 653 2 of 16
risks based on identified threats. The concept of sustainability in the banking industry has also been
considered to be a philanthropic act whereby banks—through their activities in culture, art, sport,
education or assisting local communities—support values that protect the well-being of the local
society [8]. A bank’s sponsorship of charitable activities aims to enhance its image as an open and
modern institution that is close to the customers and communities in which it operates. Educating
existing and potential clients and employers is another activity that, while not obligatory, fits
perfectly into the effort to provide security and accessibility of sustainable banking products and
services.
The fundamental question about the purpose of business activity—whether a bank should
maximise value for shareholders or instead focus on a broader spectrum of goals resulting from the
expectations of other stakeholders—grew in importance as a result of two serious global financial
crises. The first one was caused by subprime lending and the other by the debt problems of Eurozone
countries. The unprecedented scale of these crises highlighted the imperfections of business activity,
which was indiscriminately subordinated to maximising value for shareholders. Along with
revealing the weaknesses of banking activity (such as warning systems and risk management models,
inadequate ratings and the bad recommendations of specialist consultancy firms, among others), the
entire philosophy of modern banking suffered a defeat.
One should note, however, that the role of banks in contemporary economies imposes on them
responsibility for issues connected with the problems of sustainable development. Focusing banking
activity on a much broader range of goals and social responsibility does not compromise the bank’s
overriding aim of maximising value for its owners but instead draws attention to the fact that it may
be more difficult to create value for owners if the goals of other stakeholders are not taken into
account. As Kilroy and Schneider (2017) [9] emphasise, these doctrines are complementary. It is not
possible to maximise value for shareholders without respecting the interests of the other groups.
Conversely, other groups are more prosperous when the ultimate goal of business management is to
create value for shareholders.
This article analyses the Polish banking sector’s involvement with sustainable development
through a multidimensional comparative analysis. For this purpose, we analyse whether commercial
banks operating in Poland improved their positions in terms of sustainable development during the
period from 2015 to 2017. We also look for differences between national and foreign-owned banks.
The Polish banking sector was the largest among those of the ten countries joining the EU (EU
10) in 2004. At the end of October 2018, it was composed of 33 commercial banks, 30 foreign branches
of credit institutions and 550 cooperative banks [10]. The stability of the banking system, which
accounts for two-thirds of the Polish financial system’s assets, is critical to the financial system’s
stability. Banks are crucial for financing the economy and settling payments. A vast majority of
institutions achieved positive financial results. At the end of October 2018, the net result of the
banking sector totalled PLN 12.7 billion, higher by more than PLN 1.0 billion (by 8.7%) compared to
the same period in 2017. Banking sector assets grew to PLN 1.9 trillion, a 6.1% increase over 2017 (the
increase of PLN 108.5 billion) [10]. European Banking Authority (EBA) stress tests indicated Polish
banks would be highly resilient to a theoretical macroeconomic shock.
The impact of sustainability on competitiveness and a bank’s financial-economic success has
been strongly debated. One of the main observations is that the banking service lacks common
methodologies and standards to address sustainability, despite the existence of many general
standards [11]. Thus, we focus on evaluating commercial bank operations in the international
sustainability context, according to GRI G4 Sustainability Reporting Guidelines by the Global
Reporting Initiative (GRI) [12].
To complete our study, we applied the technique for order preference by similarity ideal solution
(TOPSIS) method [13] and analysed disclosures about financial sustainability, energy consumption
and savings, social sustainability and product responsibility. Furthermore, the impact of the different
weight vectors on the final results of the analysis was studied.
Our results show a general backsliding in banking activity concerning sustainable development
during the analysed period, which suggests that supporting sustainability performance is not a key

Sustainability 2019, 11, 653 3 of 16
priority for Polish banking. It is also symptomatic that all the banks whose main shareholder, directly
or indirectly, is the Government and most banks controlled by national shareholders showed a
greater commitment to this issue than did banks with foreign capital. This dichotomy between
national and foreign shareholders may suggest that banks with foreign capital are not fully interested
in activities aimed at sustainable development, such as sponsoring national culture and charities or
providing local communities with financial assistance. Studying such a recent period offers us a clear
vision of the current situation regarding Polish banking’s role in sustainable development.
This article contributes to the existing literature by providing a more extensive view of the
relationship between shareholder value creation and sustainability performance when used as a
proxy for the goals of other stakeholders. To the best of our knowledge, this is the first comprehensive
review of the Polish banking sector in the area of sustainable development. Our findings can be
applied broadly, both as a tool to support decision-making and to evaluate the banking sector.
The remainder of this article is structured as follows. Section 2 reviews the most significant
literature. Section 3 describes the data and methodology employed in the empirical research. Section
4 presents and discusses the results obtained. Section 5 summarises and presents the main
conclusions.
2. Literature Review
Integrating sustainability into banking activity is an increasingly necessary but extremely
challenging issue facing financial institutions [14]. This integration has essentially taken two forms:
(i) socially and environmentally responsible initiatives (e.g., support for cultural events, charitable
donations, recycling programmes and improvements in energy efficiency); and (ii) integration of
environmental and social considerations into product design, mission and business strategies (e.g.,
the integration of environmental criteria into investment and lending strategies) [15].
In this context, Carnevale and Mazzuca (2014) [16] test the direct effects of the sustainability
report on stock prices for a sample of European banks. Their results show that investors appreciate
the additional and complementary disclosure provided by the sustainability report and that this
disclosure has a positive effect on stock prices. Similar results are obtained by Weber (2016) [17], who
analyses the sustainability performance of Chinese banks and the connection between their
sustainability performance and financial indicators. His results suggest that the environmental and
social performance of Chinese banks increased significantly between 2009 and 2013. Furthermore,
Weber demonstrates that institutional pressure influences Chinese banks to integrate environmental
and social issues into their business strategies, products and services. Saxena and Kohli (2012) [18]
examine the impact of CSR on corporate sustainability (CS), defined in terms of an organisation’s
financial performance, in the Indian banking industry. They seek to establish a relationship between
an organisation’s CSR rating and its financial performance based on indicators such as profit after tax
(PAT) and earnings per share (EPS). The study tries to sensitise managers in the banking sector or
other organisations to probe further and gain a deeper understanding of the impact of CSR on
sustainability when making decisions about investing in CSR.
Some studies focus on the importance of disclosing sustainability reporting in its three
dimensions of environmental, social and corporate governance (ESG). Sobhani et al. (2012) [19] find
that disclosure of the social dimension is higher than that of the economic and environmental
dimensions. Disclosure of environmental issues is widely neglected by all listed banks. A similar
analysis was conducted by Nobanee and Ellili (2016) [20]. They measured corporate sustainability
disclosure using annual data for banks in the UAE financial markets. The results show that overall
sustainability disclosure based on sustainability reporting for banks in the UAE is low. Many studies
confirm that Islamic finance principles support socially inclusive, environmentally friendly and
development-promoting activities. However, in practice, the industry’s contribution to these
objectives has been below its potential [21–23]. In the Indian banking sector, adoption of the
international sustainability code of conduct is still nascent [24]. The research indicates that
sustainability issues of highest priority for the banks are those directly related to their business
operations: questions such as financial inclusion, financial literacy and energy efficiency. Banks are

Sustainability 2019, 11, 653 4 of 16
more focused on addressing the social dimension of sustainability than on important dimensions of
sustainable banking such as environmental management, development of green products and
services and sustainability reporting. Aras et al. (2018) [25] investigate multidimensional corporate
sustainability practices and establish a corporate sustainability performance evaluation model for
Turkish banks. They analyse 12 sustainability reports published by four Turkish deposit banks from
2012 to 2014 covering the dimensions of economic, environmental, social governance and financial
corporate sustainability. The performance scores reveal that each bank has different performance
scores each year. Aras et al. (2018) [25] conclude that improving performance in all dimensions
provides a more substantial contribution to the bank’s overall score and ranking than having the
highest score in one or more dimensions.
A completely different aspect is emphasised by Carè [26]. She evaluated the disclosure practices
of the six banks in Europe listed in the Global 100 Sustainable Companies Ranking. Carè specifies
that 50% of the sampled banks did not adopt (or cite) GRI in 2016. Sustainability reports are not easily
accessible and are often comprised of other documents that do not provide an immediate overview
of what banks do in terms of sustainability.
Despite empirical evidence that sustainability disclosures have a positive effect on stock prices,
most papers show low disclosure of environmental, social and corporate governance (ESG) factors
by banks. For that reason, we think that the Polish banking sector will have involvement similar to
that of banks in other European countries, e.g., Germany, France and Spain, but insufficient for
current European Union requirements. Therefore, we propose the following hypothesis:
Hypothesis 1. Polish banks do not have a relatively high level of involvement with sustainable
development.
Moreover, the nationality of the strategic investor influences the scope of sustainability-related
actions by the banks, but the nature of the effect is not clear. Thus, we formulate two opposing
hypotheses to be tested.
Hypothesis 2a. Banks with foreign capital are more interested in sustainability performance than are
national banks.
Hypothesis 2b. Banks with foreign capital are less interested in sustainability performance than are
national banks.
Finally, additional research on this subject includes Rebai et al. (2016) [27], who generate a new
performance evaluation model for banks, integrating a sustainability concept that measures the well-
being of multiple stakeholders. This model is based on a multi-attribute utility approach. It accounts
for the interests of a bank’s various stakeholders in a win-win paradigm. Raut et al. (2017) [28]
develop an integrated multi-criterion decision-making model (MCDM) to evaluate sustainability
practices in banking services from four perspectives: financial stability, customer relationship
management, internal business process and environment-friendly management system. Their model
integrates the balanced scorecard, fuzzy analytic hierarchy process (fuzzy AHP) and fuzzy TOPSIS.
The authors aimed to verify their model on a sample of banks from the Indian banking sector.
Following these authors, we have applied the TOPSIS method to analyse different attributes related
to sustainable development.
Our paper is closely connected with this research and contributes to the literature by using a
complex analysis of commercial banks’ sustainability performance in the Polish banking sector.

Sustainability 2019, 11, 653 5 of 16
3. Sample and Methodology
3.1. Sample
Our analysis was conducted on a sample of banks operating in the Polish banking sector from
2015 to 2017. For this purpose, the information presented by the banks in their annual reports and on
their websites was analysed. It allowed us to identify 17 commercial banks from a total of 35
commercial banks operating in Poland at the end of 2017. The other banks were excluded from the
analysis because they do not inform their stakeholders about their sustainability performance. This
means that less than 50% of Polish banks report on sustainable development. Three banks were
removed from the sample because they focus on sustainable development. For example, Bank
Ochrony Środowiska S.A. is the main bank in Poland financing environmental protection and
operates based on corporate social responsibility. Finally, 14 commercial banks were analysed and
we obtained a final dataset consisting of a balanced panel with 420 observations. Table 1 shows the
list of commercial banks analysed in the study.
Table 1. List of commercial banks analysed in the study
Name of the Bank (Alphabetical order)
Alior Bank S.A.
Bank Gospodarstwa Krajowego
Bank Handlowy w Warszawie S.A.
Bank Millennium S.A.
Bank Pocztowy S.A.
Bank Polska Kasa Opieki S.A.
Bank Zachodni WBK S.A.
BGŻ BNP Paribas S.A.
Getin Noble Bank S.A.
Idea Bank S.A.
ING Bank Śląski S.A.
mBank S.A.
Powszechna Kasa Oszczędności Bank Polski S.A.
Raiffeisen Bank Polska S.A.
Note: The list is presented in alphabetical order. A different order was applied in the analysis.
The banking sector’s commitment to sustainable development can be influenced by the
nationality of a bank's shareholders. Hence, we divided our sample according to the nationality of
major shareholders. Table 2 presents the Polish banking system and the banks studied according to
the nationality of major shareholders.
Table 2. Number of commercial banks in Poland as of 31/12/2017, according to the nationality of major
shareholders and number of banks analysed.
Specification Total banks Number of banks analysed
National banks with dominating share of Polish capital 14 7
National banks with dominating share of foreign capital 21 7
Note: Three banks were removed from the analysed sample because they focus on sustainable
development.
In the analysed period, the share of commercial banks controlled by Polish shareholders
increased by 13.5 percentage points. The key change in the structure of the Polish banking sector in
2017 was that Polish investors exceeded a 50% share of the assets. The change resulted from
Powszechny Zakład Ubezpieczeń SA and Polski Fundusz Rozwoju SA taking control of Bank Pekao
SA. For the first time since 1999, the share of Polish investors in sector assets became greater than the
share of foreign investors. At the end of 2017, local investors owned 54.5% of total assets and
controlled 14 commercial banks and all the cooperative banks whereas foreign investors controlled
21 commercial banks and all the foreign branches. Controlling interests were owned by investors
from 19 countries, with investors from Germany, Spain, France, Holland and Portugal playing a

Sustainability 2019, 11, 653 6 of 16
major role [29]. Table 3 presents the percentage of shares owned by main shareholders for foreign
banks in the analysed period.
Table 3. Percentage of shares owned by main shareholders of foreign banks in the analysed period.
Bank End of the year Foreign ownership National ownership Minority shareholders
Bank B 2015–2017 88.33% 11.70%
Bank C 2015–2017 75.00% 25.00%
Bank E
2015 50.10% 49.90%
2016 40.10% 59.90%
2017 32.80% 67.20%
Bank F 2015–2016 69.41% 30.59%
2017 69.34% 30.66%
Bank I 2015–2017 75.00% 25.00%
Bank J 2015 69.50% 30.50%
2016–2017 69.40% 30.60%
Bank K 2015–2017 50.10% 49.90%
Bank M 2015–2017 100.00% 0.00%
3.2. Methodology
The banks were analysed using the linear ordering method, which allows us to rank objects
according to the ordering criterion adopted. For this purpose, the TOPSIS method developed by
Hwang and Yoon in 1981 [13] was applied. This approach is employed for four reasons [30]: TOPSIS
logic is rational and understandable, the computation processes are straightforward, the concept
permits the pursuit of the best alternatives for each criterion depicted in a simple mathematical form
[31], and the importance weights are incorporated into the comparison procedures.
In spite of its many advantages, the TOPSIS method, like many multi-attribute decision-making
methods, can produce ‘‘rank reversal’’ outcomes, as several authors have described [32–34]. In this
phenomenon, the alternatives’ order of preference changes when an alternative is added to or
removed from the decision problem. In some cases, this may lead to what is called total rank reversal;
the order of preferences is totally inverted, whereby the alternative that is considered the best
becomes the worst with the inclusion or removal of an alternative from the process. To reduce this
problem, we considered a representative sample of banks operating in the Polish banking sector in
the analysed period with a large number of variables (10) and four possible weights. This gives
robustness to our results since it is very difficult or even impossible to find another combination of
attributes (banks) that could change our ranks in the analysed period.
Using this method, we assumed that in the decision matrix Xm×n the rows define the investigated
objects while the columns describe diagnostic variables, i.e., xij is a value of j-th variable (j = 1, …, n)
on i-th object (i = 1, …, m). The decision matrix is normalised according to the following formula:
��� =���
�∑ �����
���
(1)
where:
i = 1, 2, …, m,
j = 1, 2, …, n.
Then, the vector of weighting indicators is determined for individual diagnostic variables:
� = {��,��,… ,��}, where � �� = 1
�
���
(2)
Elements of the normalised decision are weighted:
��� = ��� × �� , for �= 1,2,… ,m and �= 1,2,… ,n.

Sustainability 2019, 11, 653 7 of 16
Next, the positive ideal point (PIS) and the negative ideal point (NIS) are found using:
���= �� = {���,��
�,… ,���}= �� max
����� � ∈ ��,� min
����� � ∈ ��� (3)
where j = 1, 2, …, n; and:
��� = �� = {���,��
�,… ,���}= � � min
����� � ∈ ��,� max
����� � ∈ ��� (4)
where j = 1, 2, …, n.
However: S denotes a set of variables that are stimulants, and D denotes the destimulants.
The next step is to calculate the separation of test objects from the PIS and the NIS. The separation
values can be measured using the Euclidean distance, which is given as:
��� = � � ���� − ��
� ��
�
���
, for �= 1,2,… ,m (5)
and
��� = � � ���� − ��
� ��
�
���
, for �= 1,2,… ,m (6)
Determination of relative similarity of each object to the ideal solution can be derived as:
�� =���
(��� + ��
� ) (7)
where:
�� ∈ [0,1] ∀�= 1,2,… ,m (8)
3.3. Diagnostic Variables and Weighting Indicators
At the first stage of the multidimensional comparative analysis, diagnostic features were chosen.
Following the GRI G4 Sustainability Reporting Guidelines and previous research in this field [35–37],
we selected ten indicators. These indicators were divided into those whose greater values imply a
better position of a bank in terms of the analysed phenomenon (stimulants—S) and those where a
lower level is desired (destimulants—D). The indicators were divided into three groups: financial
sustainability disclosures, energy consumption and saving disclosures, and product responsibility
disclosures. Table 4 shows the selected diagnostic variables.

Sustainability 2019, 11, 653 8 of 16
Table 4. Selected diagnostic variables.
Symbol Selected diagnostic
variables Description
Variable
profile
Financial Sustainability Disclosures
Z1 C/I The ratio of costs to income
Level of incurred operating costs
and depreciation to operating
income
D
Z2 C/A The ratio of costs to assets Level of incurred operating costs
and depreciation to asset value D
Z3 Donation/assets Amount of donations allocated to bank
assets in a given financial year Donation value to asset value S
Z4 Donation /net profit Amount of donations made in a given year
to net profit in a given financial year
Donation value to generated net
profit S
Energy Consumption and Saving Disclosures
Z5 Energy saving
policies
Bank environmental strategies, energy
saving results, annual sustainability report
Five assessment levels on a 1 to 5
scale, where level 5 is the highest
and level 1 is the lowest
S
Z6 Environmental
financing
Environmental credit risk assessment
procedures, initiatives to provide
sustainability products and services,
support of businesses adopting
environment-friendly practices
S
Social Sustainability Disclosure
Z7 Financial assistance
Number of social initiatives aiming to help
the poor, the disabled, the elderly, children
in children’s homes, charitable activities,
own foundation
Five assessment levels on a 1 to 5
scale, where level 5 is the highest
and level 1 is the lowest
S
Z8 Development
incentives
Creating job opportunities for unemployed
youth, loans for start-ups and fostering
development for women
S
Z9 Sponsorships
Initiatives in culture, sport, education and
science supported in a given year by the
bank
Ten assessment levels on a 1 to 10
scale, where level 10 is the
highest and level 1 is the lowest
S
Product Responsibility Disclosures
Z10
Responsibility for
banking products
and services
Non-compliant products and services
Number of penalties and
sanctions imposed by
supervisory bodies due to
unlawful activity
D
A higher weighting indicator corresponds to an indicator whose values have a higher mean
coefficient of variation. The variables were subjected to statistical verification based on the coefficient
of variation. Invariably, the coefficient of variation was above 10%, which indicates that the chosen
variables may be considered to be diagnostic. Table 5 shows the coefficient of variation.
Table 5. Value of variability coefficient for diagnostic indicators during the period analysed.
Specification Z1 Z2 Z3 Z4 Z5 Z6 Z7 Z8 Z9 Z10
2015
Arithmetic mean 0.575 0.021 0 0.085 1.500 1.000 2.429 0.714 12.286 0.214
Standard deviation 0.108 0.007 0 0.243 2.103 1.617 1.785 1.139 14.226 0.579
V(x) variability coeff. 0.188 0.308 0.856 2.852 1.402 1.617 0.735 1.594 1.158 2.702
2016
Arithmetic mean 0.528 0.019 0 0.017 2.143 0.714 2.214 0.571 11.429 0.786
Standard deviation 0.106 0.007 0 0.039 2.179 1.437 1.968 0.938 14.070 1.051
V(x) variability coeff. 0.200 0.363 1.139 2.226 1.017 2.012 0.889 1.641 1.231 1.338
2017
Arithmetic mean 0.504 0.019 0 0.077 4.143 1.214 2.857 1.286 11.429 0.786
Standard deviation 0.082 0.007 0 0.266 1.956 1.578 2.214 1.637 10.097 0.699
V(x) variability coeff. 0.163 0.347 1.221 3.469 0.472 1.299 0.775 1.274 0.884 0.890
TOPSIS is one numerical method of the multiple-criteria decision making (MCDM) technique.
These methods require definitions of quantitative weights for the attributes, but the definition of
weights is not precise [38–40]. Numerous methods have been suggested in the MCDM literature to

Sustainability 2019, 11, 653 9 of 16
determine the weights of attributes and can be grouped into three categories: subjective, objective
and integrated [41]. The subjective approaches determine the weights of attributes in terms of the
decision maker’s (DM’s) subjective preference information, including the direct rating (DR) method,
point allocation (PA) method, ranking ordering method of attributes, eigenvector method, Delphi
method, linguistic terms, interval numbers and others. The objective approaches determine the
weights of attributes using objective decision matrix information, including the entropy method,
standard deviation, coefficient of variation, the maximising deviation method, and the ideal point
method. The integrated approaches determine the weights of attributes using both DM’s subjective
information and objective decision matrix information [42].
Weighting indicators were determined both from the subjective method and from objective
methods based on statistical procedures, according to Olson (2004) [43] and Huang et al. (2012) [44]:
w1 system—identical weights were adopted for all variables, i.e.:
�� =1
� (9)
where:
k—indicator number (k = 1, 2, …, q).
w2 system—weights were determined using the expert method where the highest weights were
attached to the indicators that were in the least degree connected with creation of value for the
shareholders, such as the highest ratio of donations to generated net profits and charitable
activities. Moreover, relatively high weight was attached to the Z10 indicator, responsibility for
banking products and services, which is determined by the number of penalties and sanctions
imposed by supervisory bodies for a bank’s unlawful activities.
w3 system—weights were determined using coefficients of variation:
�� =∑ |���|����������
3 (10)
where:
��� =|���|
∑ |���|����
(11)
vkt—coefficient of variation of indicator (k = 1,2, …, q) in the year t = 2015, 2016, 2017.
w4 system—weights were determined using the correlation coefficient:
�� =∑ |���|����������
3 (12)
where:
��� =∑ |����|����
∑ ∑ |����|����
����
(13)
rikt—elements of the R correlation matrix between individual variables (k = 1,2, …, q) in year t =
2015, 2016, 2017 [45].
However, substantive assessment of the indicators obtained as a result of mutual correlation of
the features indicates that the weight system achieved in this way is not proper. Therefore, it was
omitted from further calculation procedures.
One should note that statistical approaches are based on information about features inherent
only in the data matrix itself and that they use the analysis of feature variability and the analysis of

Sustainability 2019, 11, 653 10 of 16
correlation between the features. K. Kukuła [46] (p. 70) notes that its specific feature is a mechanical
approach to the problem of weighting, while disregarding the real position of a given feature
determined by substantive premises.
Eventually, three weighting indicators were adopted in the calculation: w1, w2 and w3. Table 6
presents the values of weighting indicators for every selected variable.
Table 6. Values of weighting indicators.
Weights Z1 Z2 Z3 Z4 Z5 Z6 Z7 Z8 Z9 Z10
w1 0.100 0.100 0.100 0.100 0.100 0.100 0.100 0.100 0.100 0.100
w2 0.085 0.085 0.085 0.200 0.050 0.085 0.120 0.085 0.085 0.120
w3 0.015 0.028 0.090 0.240 0.078 0.136 0.067 0.124 0.090 0.132
4. Results
To analyse the banks’ sustainability performance scores, values of the relative similarity of each
bank to the ideal solution were determined along with bank rankings. For this purpose, we divided
the sample according to the nationality of major shareholders in the years 2015–2017 and took into
account three procedures according to different weighting indicator structures, i.e., w1, w2 and w3,
determined based on TOPSIS. Table 7 shows the results.
Table 7. Overall sustainability performance scores and ranks.
Weight W1 2015 2016 2017
Scores Rank Scores Rank Scores Rank
Polish shareholders
state-owned Bank A 0.133 14 0.147 14 0.215 11
state-owned Bank D 0.317 9 0.464 2 0.464 2
state-owned Bank E 0.224 10 0.277 9 Bank G 0.486 1 0.208 11 0.208 12 Bank H 0.214 13 0.239 9 0.239 10
state-owned Bank L 0.417 2 0.565 1 0.565 1
state-owned Bank N 0.385 5 0.351 4 0.351 3
Foreign shareholders
Bank B 0.385 6 0.408 3 0.304 6 Bank C 0.334 7 0.321 6 0.321 5 Bank E 0.324 8
Bank F 0.416 3 0.337 5 0.337 4 Bank I 0.254 11 0.183 13 0.183 14 Bank J 0.314 10 0.303 7 0.303 7 Bank K 0.397 4 0.286 8 0.286 8 Bank M 0.239 12 0.206 12 0.206 13
Weight W2 2015 2016 2017
Scores Rank Scores Rank Scores Rank
Polish shareholders
state-owned Bank A 0.083 14 0.105 14 0.155 10
state-owned Bank D 0.240 8 0.639 1 0.102 14
state-owned Bank E 0.224 7 0.219 4 Bank G 0.678 1 0.179 12 0.654 1 Bank H 0.184 13 0.198 9 0.152 11
state-owned Bank L 0.295 3 0.411 3 0.331 2
state-owned Bank N 0.277 4 0.273 4 0.290 3
Foreign shareholders
Bank B 0.356 2 0.466 2 0.188 5 Bank C 0.238 9 0.242 6 0.144 12 Bank E 0.262 6
Bank F 0.274 5 0.255 5 0.162 7 Bank I 0.209 11 0.155 13 0.159 8 Bank J 0.217 10 0.223 8 0.158 9 Bank K 0.261 7 0.193 10 0.139 13 Bank M 0.204 12 0.188 11 0.175 6
Weight W3 2015 2016 2017
Scores Rank Scores Rank Scores Rank
Polish shareholders
state-owned Bank A 0.079 11 0.092 10 0.103 9
state-owned Bank D 0.160 8 0.695 1 0.076 13
state-owned Bank E 0.150 7 0.145 7 Bank G 0.692 1 0.083 11 0.685 1

Sustainability 2019, 11, 653 11 of 16
Bank H 0.030 14 0.066 12 0.082 11
state-owned Bank L 0.227 4 0.332 3 0.306 2
state-owned Bank N 0.251 3 0.243 4 0.247 3
Foreign shareholders
Bank B 0.326 2 0.520 2 0.218 4 Bank C 0.200 7 0.213 5 0.155 5 Bank E 0.137 9
Bank F 0.206 6 0.168 6 0.152 6 Bank I 0.068 12 0.039 13 0.064 14 Bank J 0.132 10 0.140 8 0.077 12 Bank K 0.214 5 0.135 9 0.110 8 Bank M 0.061 13 0.031 14 0.090 10
Note: Bank E changed ownership in 2016, from foreign shareholders to national shareholders.
The data in Table 7 show that no bank decisively improved its position in terms of sustainability
performance during the period analysed. Although a certain systematic improvement is noted in the
operations of Bank A, because it is the only bank to improve across the years for the three weights,
we must consider that in the ranking prepared from w1 and w2 weights, it came last in 2015 and 2016.
Similarly, Bank L was the only bank that improved in 2017 with respect to 2015 for the three weights.
We confirm our first hypothesis: the Polish banks did not have a relatively high level of involvement
with sustainable development, a result in line with previous studies [20–26].
A substantial decline was clearly seen, on the other hand, in the operations of Bank F and Bank
K, whose synthetic measure values decreased during the period analysed; note that both banks had
foreign shareholders. In this regard, all banks with foreign shareholders had worse scores in 2017
than in 2015 for the three weights. This suggests that banks with foreign capital were not fully
interested in financing activities aimed at sustainable development. Our results corroborate this
hypothesis (H2b): the banks with foreign capital were less interested in sustainability performance
than are national banks.
The distance between individual banks and the model and anti-model of banks’ commitment to
the issues of sustainable development determined using the TOPSIS method, taking into account the
different weight systems, is presented in Figures 1–3.
Figure 1. Distance between banks and the model and anti-model of sustainable development in 2015
determined using the TOPSIS method, taking into account the different weight systems.
0.000
0.200
0.400
0.600
0.800Bank A
Bank B
Bank C
Bank D
Bank E
Bank F
Bank G
Bank H
Bank I
Bank J
Bank K
Bank L
Bank M
Bank N
2015
W1 W2 W3

Sustainability 2019, 11, 653 12 of 16
Figure 2. Distance between the banks and the model and anti-model of sustainable development in
2016 determined using the TOPSIS method, taking into account the different weight systems.
Figure 3. Distance between banks and the model and anti-model of sustainable development in 2017
determined using the TOPSIS method, taking into account the three different weight systems
Bank G was the top ranked in 2015 according to the calculation based on all weights, and again
in 2017 based on w2 and w3 weights. This is a result, first and foremost, of dedicating resources to
activities connected with sustainable development, despite generating a relatively low net profit. The
bank had a high score in the variable Z4 (donation/net profit), which had a very strong impact on the
ranking result. This leads us to think that Bank G had a high commitment to sustainable development.
Essentially, a certain regression is noted in the results obtained. Only four banks improved their
results at the end of the period analysed compared to the year 2015 according to the calculations that
used the w1 weighting. Three improved according to the w2 weighting, and five improved according
to the w3 weighting.
When analysing the data in Table 6, note that the results obtained using the TOPSIS method,
taking into account the different weighting indicators, were close to one another. The bank ranking
results obtained using the TOPSIS method with the w1–w3 weights was also compared using
Pearson’s correlation coefficient (Table 8).
0.000
0.200
0.400
0.600
0.800Bank A
Bank B
Bank C
Bank D
Bank E
Bank F
Bank G
Bank H
Bank I
Bank J
Bank K
Bank L
Bank M
Bank N
2016
W1 W2 W3
0.000
0.200
0.400
0.600
0.800Bank A
Bank B
Bank C
Bank D
Bank E
Bank F
Bank G
Bank H
Bank I
Bank J
Bank K
Bank L
Bank M
Bank N
2017
W1 W2 W3
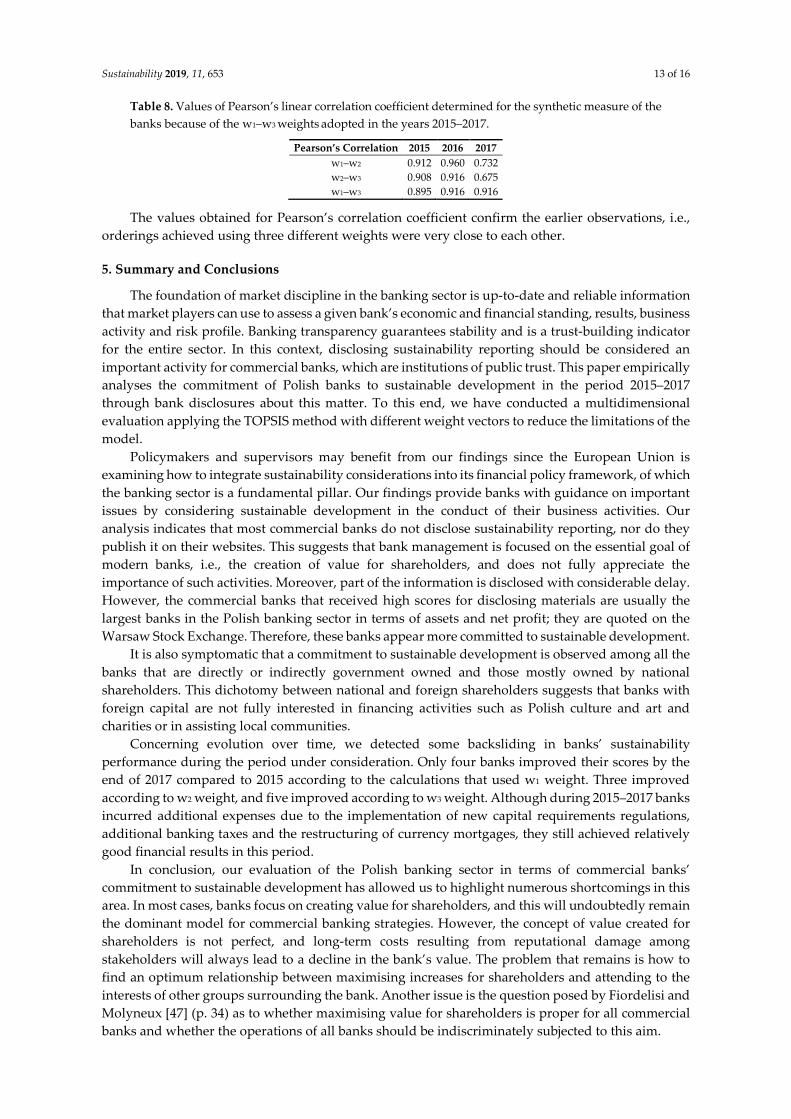
Sustainability 2019, 11, 653 13 of 16
Table 8. Values of Pearson’s linear correlation coefficient determined for the synthetic measure of the
banks because of the w1–w3 weights adopted in the years 2015–2017.
Pearson’s Correlation 2015 2016 2017
w1–w2 0.912 0.960 0.732
w2–w3 0.908 0.916 0.675
w1–w3 0.895 0.916 0.916
The values obtained for Pearson’s correlation coefficient confirm the earlier observations, i.e.,
orderings achieved using three different weights were very close to each other.
5. Summary and Conclusions
The foundation of market discipline in the banking sector is up-to-date and reliable information
that market players can use to assess a given bank’s economic and financial standing, results, business
activity and risk profile. Banking transparency guarantees stability and is a trust-building indicator
for the entire sector. In this context, disclosing sustainability reporting should be considered an
important activity for commercial banks, which are institutions of public trust. This paper empirically
analyses the commitment of Polish banks to sustainable development in the period 2015–2017
through bank disclosures about this matter. To this end, we have conducted a multidimensional
evaluation applying the TOPSIS method with different weight vectors to reduce the limitations of the
model.
Policymakers and supervisors may benefit from our findings since the European Union is
examining how to integrate sustainability considerations into its financial policy framework, of which
the banking sector is a fundamental pillar. Our findings provide banks with guidance on important
issues by considering sustainable development in the conduct of their business activities. Our
analysis indicates that most commercial banks do not disclose sustainability reporting, nor do they
publish it on their websites. This suggests that bank management is focused on the essential goal of
modern banks, i.e., the creation of value for shareholders, and does not fully appreciate the
importance of such activities. Moreover, part of the information is disclosed with considerable delay.
However, the commercial banks that received high scores for disclosing materials are usually the
largest banks in the Polish banking sector in terms of assets and net profit; they are quoted on the
Warsaw Stock Exchange. Therefore, these banks appear more committed to sustainable development.
It is also symptomatic that a commitment to sustainable development is observed among all the
banks that are directly or indirectly government owned and those mostly owned by national
shareholders. This dichotomy between national and foreign shareholders suggests that banks with
foreign capital are not fully interested in financing activities such as Polish culture and art and
charities or in assisting local communities.
Concerning evolution over time, we detected some backsliding in banks’ sustainability
performance during the period under consideration. Only four banks improved their scores by the
end of 2017 compared to 2015 according to the calculations that used w1 weight. Three improved
according to w2 weight, and five improved according to w3 weight. Although during 2015–2017 banks
incurred additional expenses due to the implementation of new capital requirements regulations,
additional banking taxes and the restructuring of currency mortgages, they still achieved relatively
good financial results in this period.
In conclusion, our evaluation of the Polish banking sector in terms of commercial banks’
commitment to sustainable development has allowed us to highlight numerous shortcomings in this
area. In most cases, banks focus on creating value for shareholders, and this will undoubtedly remain
the dominant model for commercial banking strategies. However, the concept of value created for
shareholders is not perfect, and long-term costs resulting from reputational damage among
stakeholders will always lead to a decline in the bank’s value. The problem that remains is how to
find an optimum relationship between maximising increases for shareholders and attending to the
interests of other groups surrounding the bank. Another issue is the question posed by Fiordelisi and
Molyneux [47] (p. 34) as to whether maximising value for shareholders is proper for all commercial
banks and whether the operations of all banks should be indiscriminately subjected to this aim.

Sustainability 2019, 11, 653 14 of 16
Supplementary Materials: The following are available online at www.mdpi.com/xxx/s1, Figure S1: title, Table
S1: title, Video S1: title.
Author Contributions: All of the authors contribute equally to this work.
Funding: This research received no external funding.
Acknowledgments: We wish to thank anonymous referees for valuable comments and suggestions.
Conflicts of Interest: The authors declare no conflicts of interest.
References
1. Report of the World Commission on Environment and Development: Our Common Future; United Nations: New
York, NY, USA, 2015.
2. Transforming Our World: the 2030 Agenda for Sustainable Development; United Nations: New York, NY, USA,
2015.
3. Communication from the commission to The European Parliament, The Council, The European economic and social
committee and the committee of the regions: Next steps for a sustainable European Future; European Commission:
Strasbourg, France, 2016.
4. Allen, F; Carletti, E. The Roles of Banks in Financial Systems. In The Oxford Handbook of Banking; Berger,
A.N., Molyneux, P., Wilson, J.O.S., Eds.; Oxford University Press Inc.: New York, NY, USA, 2010; pp. 37–
57, ISBN: 978-0-19-964093-5.
5. Jeucken, M. Sustainable Finance and Banking: the Financial Sector and the Future of the Planet. Routledge:
London, UK, 2010. ISBN: 9781136533341.
6. Macdonald, K. Re-thinking ‘Spheres of Responsibility’: Business Responsibility for Indirect Harm. J. Bus.
Ethics 2010, 99, 549–563. doi:10.1007/s10551-010-0668-x.
7. Scholtens, B. Corporate Social Responsibility in the International Banking Industry. J. Bus. Ethics 2008, 86,
159–175. doi: 10.1007/s10551-008-9841-x.
8. Igbudu, N.; Garanti, Z.; Popoola, T. Enhancing Bank Loyalty through Sustainable Banking Practices: The
Mediating Effect of Corporate Image. Sustainability 2018, 10, 4050. doi:10.3390/su10114050.
9. Kilroy, D.; Schneider, M. Customer Value, Shareholder Wealth, Community Wellbeing. A Roadmap for Companies
and Investors. Pallgrave Macmillan: Cham, Switzerland, 2017. ISBN: 978-3-319-54773-2.
10. KNF - Polish Financial Supervision Authority. 2018, Banking Sector – Monthly Data, Urząd Komisji
Nadzoru Finansowego: Warsaw, Available online:
https://www.knf.gov.pl/en/REPORTS_AND_ANALYSIS/Banking/Monthly_data (accessed on 21
December 2018).
11. Munzele Maimbo, S.; Zadek, S. Roadmap for a Sustainable Financial System. Available online:
https://sustainabledevelopment.un.org/index.php?page=view&type=400&nr=2451&menu=35 (accessed on
04 January 2019).
12. Global Reporting Initiative. G4 Sustainability Reporting Guidelines—Reporting Principles and Standards
Disclosures. Available online: https://www2.globalreporting.org/standards/g4/Pages/default.aspx
(accessed on 21 December 2018).
13. Hwang, Ch.-L.; Yoon, K. Multiple Attribute Decision Making: Methods and Applications. Springer-Verlag:
Berlin: Heidelberg, Germany, 1981. ISBN: 978-3-642-48318-9.
14. Carlucci, D.; Ferreira, F.A.F.; Schiuma, G.; Jalali, M.S.; António, N.J.S. A Holistic Conception of Sustainable
Banking: Adding Value with Fuzzy Cognitive Mapping. Technol. and Econ. Dev. Econ. 2018, 24, 1303–1322.
doi:10.3846/20294913.2016.1266412.
15. Jeucken, M.H.A.; Bouma, J.J. The Changing Environment of Banks. Greener Manag. Int. 1999, 27, 21–35.
doi:10.9774/GLEAF.3062.1999.au.00003.
16. Carnevale, C.; Mazzuca, M. Sustainability Report and Bank Valuation: Evidence from European Stock
Markets, Bus. Ethics 2014, 23, 69–90, doi:10.1111/beer.12038.
17. Weber, O. The Sustainability Performance of Chinese Banks: Institutional Impact. SSRN Electronic Journal
2016, 0, 1–29, doi:10.2139/ssrn.2752439.
18. Saxena, M.; Kohli, A.S. Impact of Corporate Social Responsibility on Corporate Sustainability: A Study of
the Indian Banking Industry. IUP J. Corp. Gov. 2012, 11, 39–54.
Sustainability 2019, 11, 653 15 of 16
19. Sobhani, F.A.; Amran, A.; Zainuddin, Y. Sustainability Disclosure in Annual Reports and Websites: A
Study of the Banking Industry in Bangladesh. J. Clean. Prod. 2012, 23, 75–85.
doi:10.1016/j.jclepro.2011.09.023.
20. Nobanee, H.; Ellili, N. Corporate Sustainability Disclosure in Annual Reports: Evidence from UAE banks:
Islamic versus Conventional. Renew. Sust. Energ. Rev. 2016, 55, 1336–1341. doi:10.1016/j.rser.2015.07.084.
21. Aliyu, S.; Hassan, M.K.; Yusof, R.M.; Naiimi, N. Islamic Banking Sustainability: A Review of Literature and
Directions for Future Research, Emerg. Mark. Financ. Tr. 2017, 53, 440–470.
doi:10.1080/1540496X.2016.1262761.
22. Ahmed, H.; Mohieldin, M.; Verbeek, J.; Aboulmagd, F. On the Sustainable Development Goals and the Role
of Islamic Finance. Available online:
http://documents.worldbank.org/curated/en/442091467999969424/pdf/WPS7266.pdf (accessed on 21
December 2018)
23. Akhtar, S. Islamic Finance: Sustainability and Challenges. NBR Anal. 2008, 18, 15–24.
24. Kumer, K.; Prakash, A. Developing a Framework for Assessing Sustainable Banking Performance of the
Indian Banking Sector. Soc. Responsib. J. 2018, 0, 1–21, doi:10.1108/SRJ-07-2018-0162.
25. Aras, G.; Tezcan, N.; Furtuna, O.K. Multidimensional Comprehensive Corporate Sustainability
Performance Evaluation Model: Evidence from an Emerging Market Banking Sector. J. Clean. Prod. 2018,
185, 600–609. doi:10.1016/j.jclepro.2018.01.175.
26. Carè, R. Sustainability in Banks: Emerging Trends. In Sustainable Banking, Carè, R., Ed.; Pallgrave
Macmillan: Cham, Switzerland, 2018, pp. 93–130, ISBN: 978-3-319-73388-3.
27. Rebai, S.; Azaizez, M.N.; Saidane, D. A Multi-Attribute Utility Model for Generating a Sustainability
Index in the Banking Sector. J. Clean. Prod. 2016, 113, 835–849. doi:10.1016/j.jclepro.2015.10.129.
28. Raut, R.; Cheikhrouhou, N.; Kharat, M. Sustainability in the Banking Industry: A Strategic Multi-Criterion
Analysis. Bus. Strat. Environ. 2017, 26, 550–568. doi:10.1002/bse.1946.
29. Raport o sytuacji banków w 2017 r.; KNF – Polish Financial Supervision Authority: Warsaw, Poland, 2018.
30. García-Cascales, S.; Lamata, T.M. On Rank Reversal and TOPSIS Method. Math. Comput. Model. 2012, 56,
123–132. doi:10.1016/j.mcm.2011.12.022.
31. Roszkowska, E. Multi-criteria Decision Making Models by Applying the Topsis Method to Crisp and
Interval Data. Mult. Criteria Decis. Mak. 2011, 6, 200–230.
32. de Farias Aires, R.F.; Ferreira, L. The Rank Reversal Problem in Multi-Criteria Decision Making: A
Literature Review. Pesqui. Oper. 2018, 38, 331–362. doi:10.1590/0101-7438.2018.038.02.0331.
33. Kong, F. Rank Reversal and Rank Preservation in TOPSIS. Adv. Mater. Res. 2011, 204–210, 36–41.
doi:10.4028/www.scientific.net/AMR.204-210.36.
34. Saaty, T.L.; Sagir, M. An Essay on Rank Preservation and Reversal. Math. Comput. Model. 2009, 46, 930–941.
doi:10.1016/j.mcm.2008.08.001.
35. Yip, A.W.H.; Bocken, N.M.P. Sustainable Business Model Archetypes for the Banking Industry. J. Clean.
Prod. 2018, 174, 150–169. doi:10.1016/j.jclepro.2017.10.190.
36. Street, P.; Monaghan, P.E. Assessing the Sustainability of Bank Service Channels: The Case of Co-operative
Bank. In Sustainable Banking: The Greening of Finance; Bouma, J.J.; Jeucken, M.; Klinkers, L., Eds.; Routledge:
Abingdon, United Kingdom, 2017, pp. 72–87. ISBN: 978-1-874719-38-0.
37. Weber, O. Sustainability Benchmarking of European Banks and Financial Service Organizations. Corp. Soc.
Responsib. Environ. Manag. 2005, 12, 73–87. doi:10.1002/csr.77.
38. Ma, J; Fan, Z.-P.; Huang, L.-H. A Subjective and Objective Integrated Approach to Determine Attribute
Weights. Eur. J. Oper. Res. 1999, 112, 397–404. doi:10.1016/S0377-2217(98)00141-6.
39. Choo, E.U.; Wedley, W.C. Optimal Criterion Weights in Repetitive Multicriteria Decision-Making. J. Oper.
Res. Soc. 1985, 36, 983–992. doi:10.2307/2582430.
40. Schoemaker, P.J.H.; Waid, C.C. An Experimental Comparison of Different Approaches to Determining
Weights in Additive Utility Models, Manage. Sci. 1982, 28, 182–196. doi:10.2307/2582430.
41. Łuczak; A. Wysocki, F. Ustalanie systemu wag dla cech w zagadnieniach porządkowania liniowego
obiektów. Res. Pap. Wrocław Univ. Econ. 2014, 327, 49–59.
42. Wang, Y.-M., Luo, Y. Integration of Correlations with Standard Deviations for Determining Attribute
Weights in Multiple Attribute Decision Making. Math. Compt. Model. 2010, 51, 1–12.
doi:10.1016/j.mcm.2009.07.016.

Sustainability 2019, 11, 653 16 of 16
43. Olson, D.L. Comparison of Weights in TOPSIS Models. Math. Comput. Model. 2004, 40, 721–727.
doi:10.1016/j.mcm.2004.10.003.
44. Huang, Y.-S.; Li, W.-H. A Study on Aggregation of TOPSIS Ideal Solutions for Group Decision-Making.
Group Decis. Negot. 2012, 21, 461–473, doi:10.1007/s10726-010-9218-2.
45. Roszkowska, E.; Filipowicz-Chomko, M. Ocena poziomu rozwoju instytucjonalnego województw Polski
w latach 2010-2014 w kontekście realizacji koncepcji zrównoważonego rozwoju. Ekon. Środowisko 2016, 3,
250–266.
46. Kukuła, K. Metoda unitaryzacji zerowej. Wydawnictwo PWN: Warszawa, Poland, 2000. ISBN: 8301130970.
47. Fiordelisi, F.; Molyneaux, P. Shareholder Value in Banking. Palgrave Macmillan: Basingstoke, England, UK,
2006, ISBN: 978-1-4039-9666-4.
© 2019 by the authors. Licensee MDPI, Basel, Switzerland. This article is an open access
article distributed under the terms and conditions of the Creative Commons Attribution
(CC BY) license (http://creativecommons.org/licenses/by/4.0/).
Copyright © 2022 FDOKUMEN