A Cluster Analysis of Managerial Humour Tendencies: Identifying the Workplace Consequences of the...
37
A Cluster Analysis of Managerial Humour Tendencies: Identifying the Workplace Consequences of the Aggressive Manager Thomas Rhys Evans [email protected] @ThomasRhysEvans Dr Gail Steptoe-Warren [email protected] @GailMSC
Transcript of A Cluster Analysis of Managerial Humour Tendencies: Identifying the Workplace Consequences of the...
A Cluster Analysis of Managerial Humour Tendencies:
Identifying the Workplace Consequences of the Aggressive
Manager
Thomas Rhys [email protected]
@ThomasRhysEvans
Dr Gail [email protected] @GailMSC


Humour…• A silly topic?
• There is a fine-line between humour or banter, and bullying (Mills & Carwile, 2009; Wright, 2013)
• Bullying costs UK employers upwards of £2 billion a year
• The most likely roles for those accused of bullying are line managers and peer colleagues
• 83% of UK employers have a policy on bullying/harassment (90% in the public sector)
Humour as a Communication Method
• Humour is not like any other communication type
• Humour can achieve positive and negative things– E.g. communicate prejudices (Evans, Goodman, & Jowett, 2014)
• Yet humour remains self-evidentially positive (ideologically positive) (Billig, 2005)
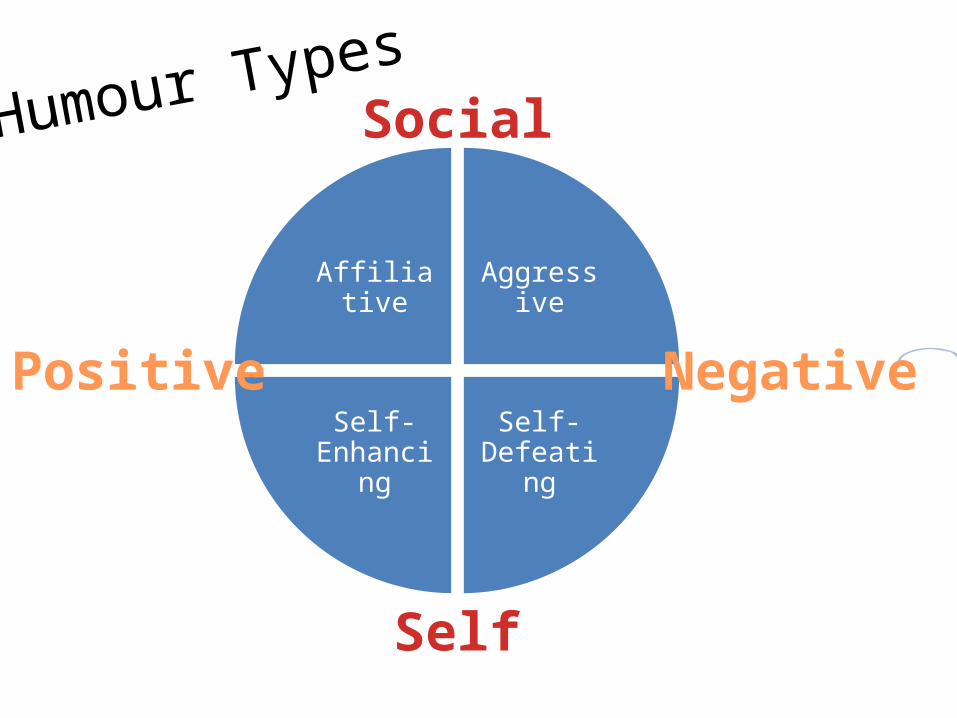
Humour Types
Affiliative
Aggressive
Self-Defeati
ng
Self-Enhanci
ng
Social
Self
NegativePositive
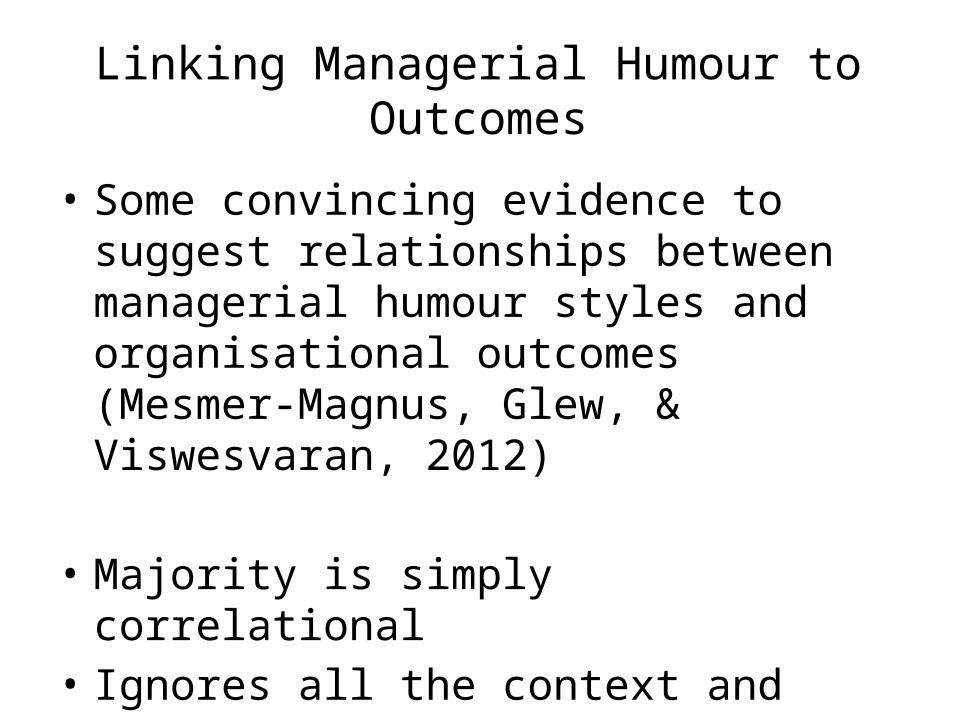
Linking Managerial Humour to Outcomes
• Some convincing evidence to suggest relationships between managerial humour styles and organisational outcomes (Mesmer-Magnus, Glew, & Viswesvaran, 2012)
• Majority is simply correlational
• Ignores all the context and interactions
• Simplified understanding

Humour Clusters• Using cluster analysis may be a way to develop a more nuanced understanding
• Acknowledges the interactions between, and complexities of, humour and the workplace
• Carried out to make groups of participants where the differences to other groups are maximised and differences within groups are minimised
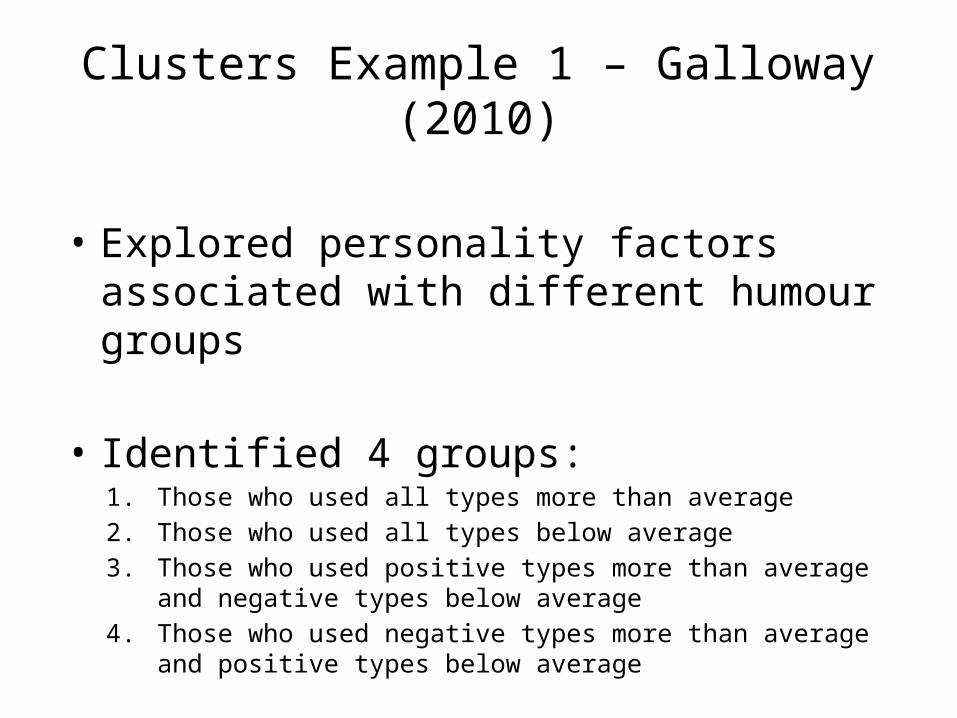
Clusters Example 1 – Galloway (2010)
• Explored personality factors associated with different humour groups
• Identified 4 groups:1. Those who used all types more than average2. Those who used all types below average3. Those who used positive types more than average
and negative types below average4. Those who used negative types more than average
and positive types below average

Clusters Example 2: Leist and Mueller 2012
• The same three clusters as above, entitled ‘humour endorsers’, ‘humour deniers’ and ‘self-enhancers’
• Explored differences in well-being factors between clusters…

Clusters Example 2: Leist and Mueller 2012
Self Esteem Life Satisfaction
-0.6
-0.4
-0.2
0
0.2
0.4
0.6
Humour EndorsersHumour DeniersSelf-Enhancers
In addition to this, cluster membership was a better predictor of well-being score than individual humour types in all except one example
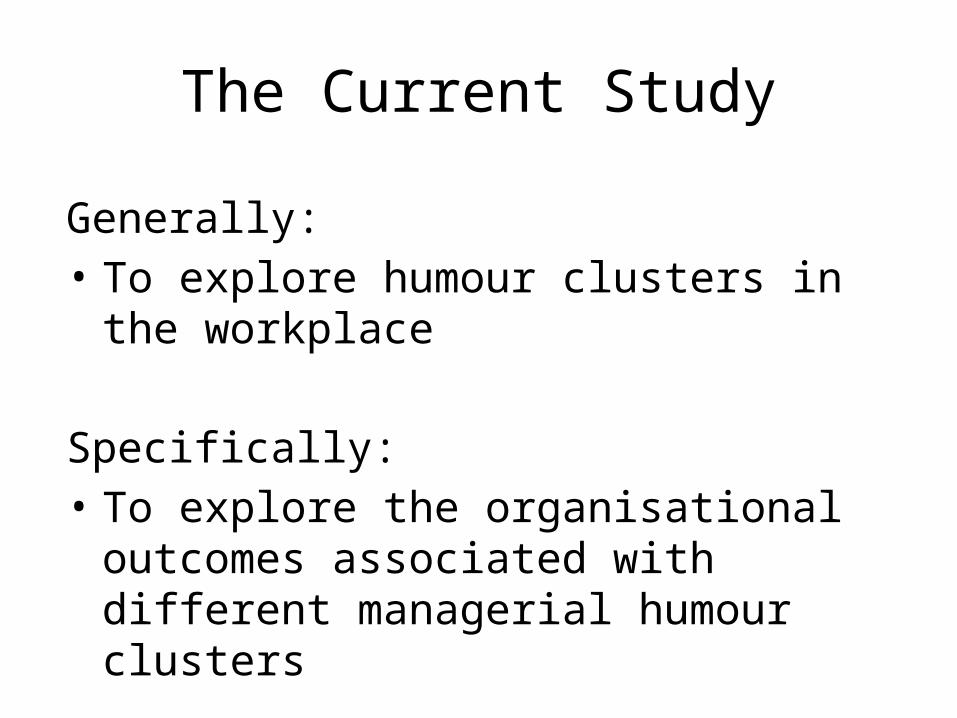
The Current Study
Generally:• To explore humour clusters in the workplace
Specifically: • To explore the organisational outcomes associated with different managerial humour clusters
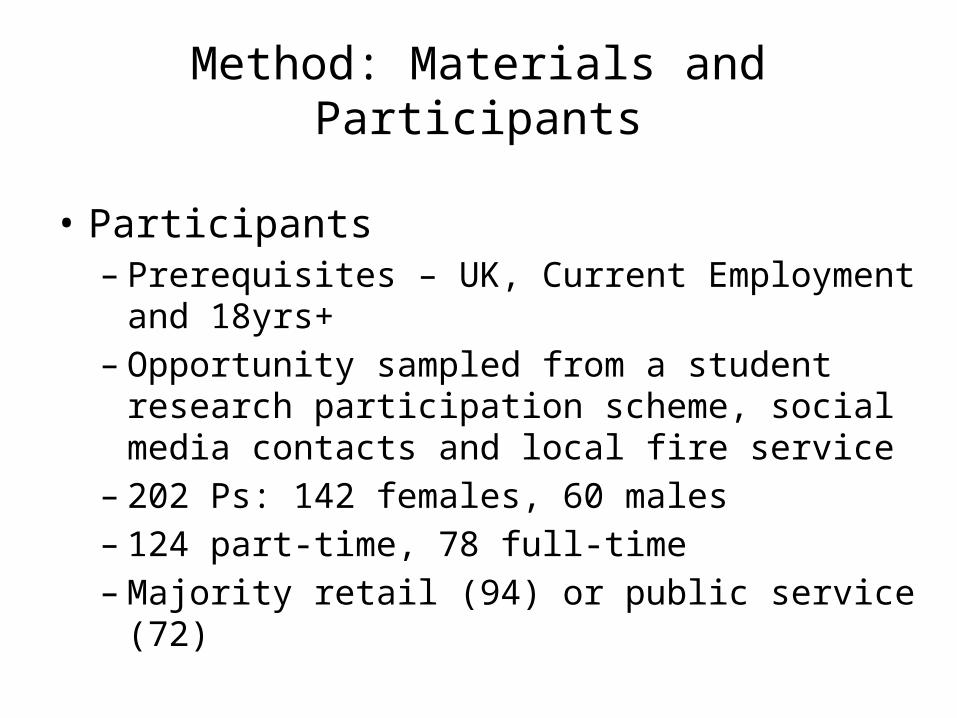
• Participants– Prerequisites – UK, Current Employment and 18yrs+
– Opportunity sampled from a student research participation scheme, social media contacts and local fire service
– 202 Ps: 142 females, 60 males– 124 part-time, 78 full-time– Majority retail (94) or public service (72)
Method: Materials and Participants

Method: Method & Materials
Validated Psychometric Materials• Humour Types = Peer Report Humour Styles Questionnaire (Martin et al. 2003)
• Communication = Communication subscale Job Satisfaction Survey (Spector 1985)
• Group Cohesion = Citizenship subscale of the Values in Action Scale (Peterson and Seligman 2004)
• Stress = Pressure subscale of Stress in General (Stanton et al. 2001)
• Creativity = Literature adapted questions (Brion, Mothe and Sabatier 2010)
• Power = Leadership subscale of the AB5C (Hofstee, de Raad and Goldberg 1992)
• Job Satisfaction = Job in General Scale (Ironson et al. 1989)

Results – Internal Reliability
Humour Scale Cronbachs Alpha
Organisational Outcome Cronbachs
AlphaAffiliative .87 Social
Distance1.0
Self-Enhancing
.90 Leader Power .77
Aggressive .74 Creativity .76Self-Defeating
.76 Group Cohesion
.47
Stress .82Communication
.83
Satisfaction .91

K-Means Clustering
Cluster 1 Cluster 2 Cluster 3
-1.5
-1
-0.5
0
0.5
1
AffiliativeAggressiveSelf-DefeatingCluster 1:
Self-Enhancer(62)
Cluster 3:
Humour Endorser(88)
Cluster 2:Aggressive
(52)

Differences between Clusters…
• No significant differences between clusters in:
• Participant Sex• Months working with manager• Manager Sex• Work Environment (Retail/Public Service etc.)
• Work Type (FT/PT)
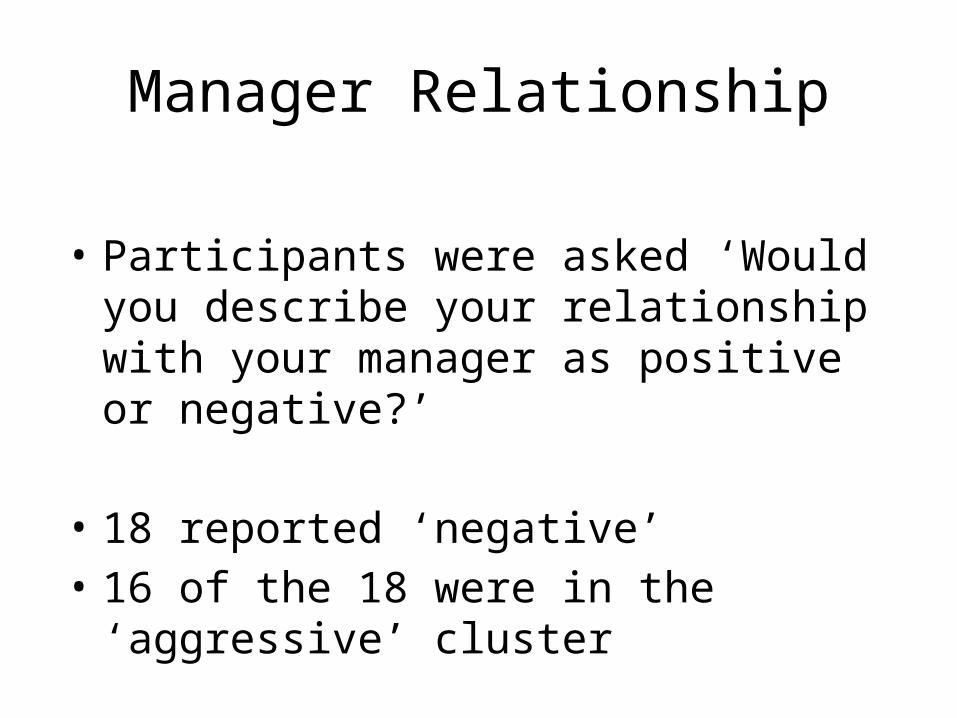
Manager Relationship
• Participants were asked ‘Would you describe your relationship with your manager as positive or negative?’
• 18 reported ‘negative’• 16 of the 18 were in the ‘aggressive’ cluster

Power
Group Cohesion
Creativity
Satisfaction
Communication
-1.2
-1
-0.8
-0.6
-0.4
-0.2
0
0.2
0.4
0.6
Cluster 1 (Self-Enhancer)Cluster 2 (Aggressive)Cluster 3 (Humour Endorser)

Stress Social Distance
-0.4
-0.3
-0.2
-0.1
0
0.1
0.2
0.3
0.4
Cluster 1 (Self-Enhancer)Series 2 (Aggressive)Series 3 (Humour Endorser)

RegressionOrganisational Outcome %
ExplainedPredictors
Stress 6% Affiliative (B = -.20) Aggressive (B = .16)
Leader Power 22% Affiliative (B = .47) Aggressive (B = -.11)
Group Cohesion
13% Affiliative (B = .35) Self-Defeating (B = -.19) Cluster (B = -.18) Aggressive (B = .15)
Creativity 31% Affiliative (B = .52) Aggressive (B = -.23)
Job Satisfaction
16% Aggressive (B = -.30) Affiliative (B = .28)
Communication 16% Affiliative (B = .38) Aggressive (B = -.16)
Social Distance
6% Self-Enhancing (B = -.23) Cluster (B = .16)

Summary of Findings
• Humour appears to be important in the workplace
• Some managers use an aggressive style of humour, and these managers appear to have the least positive organisational outcomes
• These aggressive managers are no more likely to be males than females
Summary of findings
• Previous papers argue that greater aggressive humour use is associated with poorer organisational outcome and thus managers should use less aggressive humour
• However….

Cluster 1 Cluster 2 Cluster 3
-1.5
-1
-0.5
0
0.5
1
AffiliativeAggressiveSelf-Defeating
.34.39
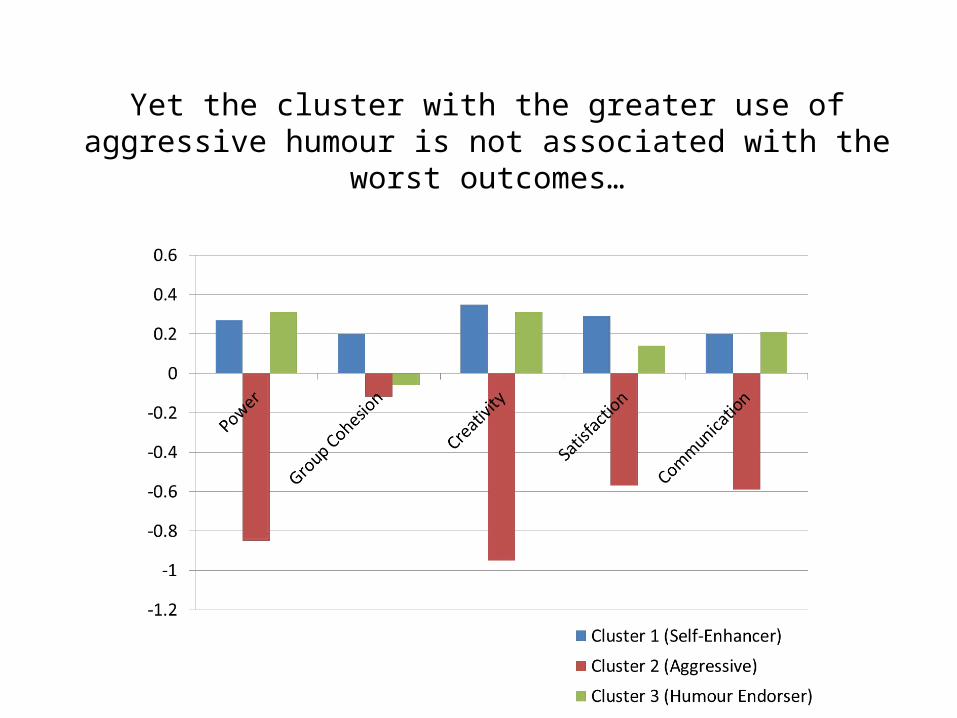
Yet the cluster with the greater use of aggressive humour is not associated with the
worst outcomes…
Results suggest…
• Use of positive humour may mitigate the effects of aggressive humour use…
• A general humour style is more important than the use of a single specific humour type

• Previous papers argue for the use of more affiliative humour or less aggressive humour use to better the workplace environment
• Our results suggest quantity doesn’t matter
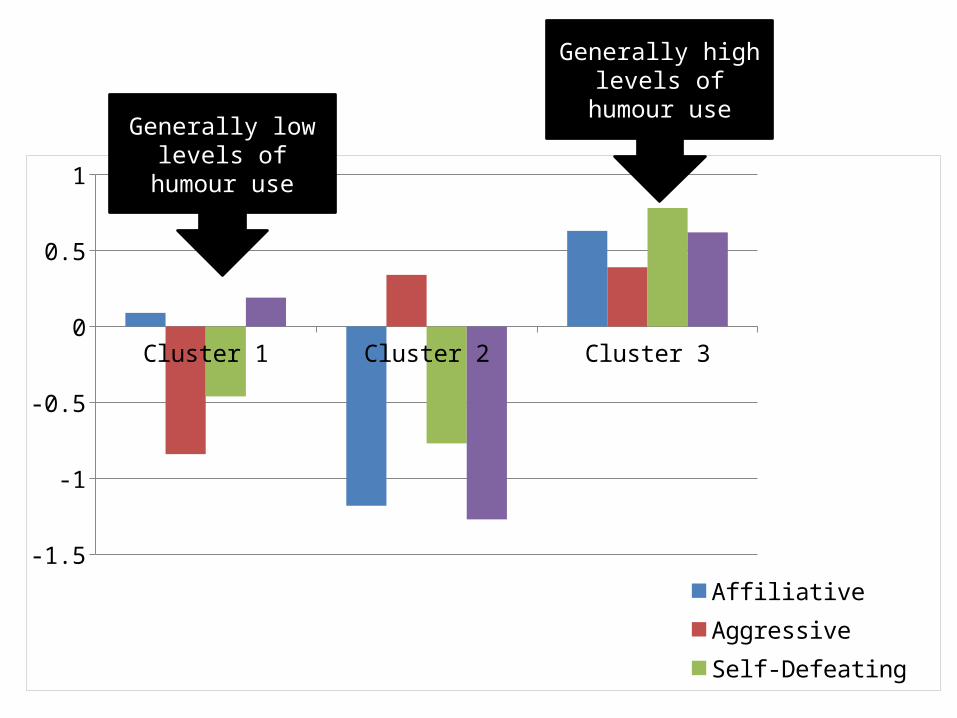
Cluster 1 Cluster 2 Cluster 3
-1.5
-1
-0.5
0
0.5
1
AffiliativeAggressiveSelf-Defeating
Generally low levels of humour use
Generally high levels of humour use

Yet results for clusters one and three are near-identical
Results suggest…
• It is not the quantity of any one humour type which is more important than a holistic view of humour use…
Based on the current findings, we would recommend:
• The most effective humour user uses more positive humour types than negative humour types
BUT…
• If you find yourself using aggressive humour frequently, ensuring you also use positive humour types too may mitigate their negative impacts

Summary
• It appears to be of significant personal and organisational benefit for managers to be aware the potential consequences of humour
• Small managerial efforts to be more sensitive to others e.g. humour and cake, can be of significant impact!

• Cross-sectional so causation not inferred
• Sample mostly female, retail/public workers
• Small impacts upon organisational outcomes (although still important!)
• How humour use could lead to effects is unclear
Weaknesses
A Cluster Analysis of Managerial Humour Tendencies:
Identifying the Workplace Consequences of the Aggressive
ManagerThomas Rhys Evans
[email protected]@ThomasRhysEvans
Dr Gail [email protected]
@GailMSC
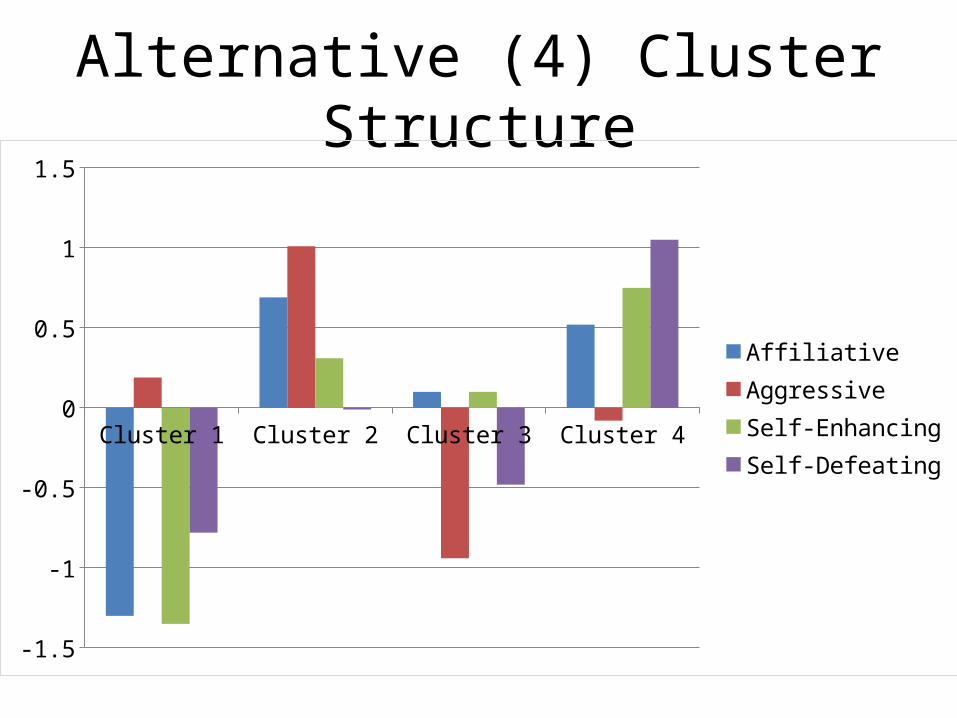
Alternative (4) Cluster Structure
Cluster 1 Cluster 2 Cluster 3 Cluster 4
-1.5
-1
-0.5
0
0.5
1
1.5
AffiliativeAggressiveSelf-EnhancingSelf-Defeating

Alternative (4) Cluster Outcomes
Cluster 1 Cluster 2 Cluster 3 Cluster 4
-1
-0.8
-0.6
-0.4
-0.2
0
0.2
0.4
0.6
PowerCohesionCreativitySatisfactionCommunication

Alternative (4) Cluster Outcomes
Cluster 1
Cluster 2
Cluster 3
Cluster 4
-0.3
-0.2
-0.1
0
0.1
0.2
0.3
0.4
Social DistanceStress

CorrelationsAggressive Self-
DefeatingSelf-Enhancing
Affiliative
.08 .37* .79*
Aggressive .20* -.08Self-Defeating
.48*Affiliative Aggressive Self-Defeating
Self-Enhancing
Stress -.17* .13 -.06 -.10Power .44* -.11 .07 .35*Cohesion .27* .03 -.10 .13Creativity .47* -.17* .24* .47*Satisfaction
.23* -.24* .01 .25*
Communication
.31* .08 -.12 .37*
Social Distance
-.07 .13 -.05 -.15*