a case study on elgi equipments pvt ltd, india - DiVA Portal
58
Department of Innovation, Design and Product development A STUDY ON IMPLEMENTATION AND IMPROVIZATION OF SUPPLY CHAIN - A CASE STUDY ON ELGI EQUIPMENTS PVT LTD, INDIA KPP 231 Master thesis work, Innovation Production 30 credits, D-level Master Program in Product and Process Development- Production and Logistics. ALFRED MARIA JOSEPH Report code: Commissioned by: Mälardalen University Tutor (company): Arul William David Tutor (university): Martin Kurdve Examiner: Sabah Audo
-
Upload
khangminh22 -
Category
Documents
-
view
0 -
download
0
Transcript of a case study on elgi equipments pvt ltd, india - DiVA Portal

Department of Innovation, Design and Product development
A STUDY ON IMPLEMENTATION AND IMPROVIZATION
OF SUPPLY CHAIN - A CASE STUDY ON ELGI
EQUIPMENTS PVT LTD, INDIA
KPP 231 Master thesis work, Innovation Production 30 credits, D-level
Master Program in Product and Process Development- Production and Logistics.
ALFRED MARIA JOSEPH
Report code: Commissioned by: Mälardalen University Tutor (company): Arul William David Tutor (university): Martin Kurdve Examiner: Sabah Audo

2(58)
Abstract
In today’s competitive world, the main intend for a manufacturing company is to increase their profit, growth of the organization, meet the market demand and satisfy the customers. One means to achieve this is by eliminating waste in their production division. Hence this thesis helps to identify the lean and environmental waste in the company by using FPC, VSM and EVSM in a supply chain context. At present, the manufacturing industries recently have increased attention on the environmental care. Companies located in India have generally less awareness and understanding about the impacts on the environment during the manufacturing phase than in Sweden/western Europe. Therefore, the purpose of this thesis is to demonstrate a
systematic and simple method for assessing the environmental performance and optimizing the production setup. The thesis focuses on subjects within the area “lean and green”. Value stream mapping is used to visualize the production process during the time of production; even it also helps in monitoring the environmental waste which could be remunerated for by using an environmental tool – Environmental Value Stream Mapping (EVSM). Therefore, the important tools like Value Stream Mapping (VSM) and Environmental Value Stream Mapping (EVSM) was taken for this thesis to demonstrate a simple and still useful method. A Case study in ELGI Equipment Pvt Ltd, India was taken to identify the wastes during the production process. The various tools like FPC, VSM and EVSM/ ENVSM are used in the current production assembly line to identify the lean and environmental waste. The EVSM tool has been established by the environmental issues like material usage and energy consumption. In this thesis, the analyzed data in the current production assembly line has been analyzed by using various metrics and they are categorized into three parts: Value adding, non-value adding and necessary but non-value adding. (Keywords): Lean, Value Stream Mapping (VSM), Environmental Value Stream MAPPING (EVSM), Flow Process Chart (FPC), Visualization, Supply chain.

3(58)
Acknowledgements
First and foremost I offer my sincere gratitude to my thesis supervisor Mr. Martin Kurdve, who has supported me throughout my thesis with his patience and knowledge, whilst allowing me the room to work in my own way. I attribute the level of my Masters degree to his encouragement and effort and without him this thesis, too, would not have been completed or written. I would like to thank professor Sabah Audo, program coordinator, Master Program in Product and process Development- Production and Logistics for giving me an opportunity and being a beacon of knowledge for me. I am also thankful to my supervisor at ELGI Equipments, Mr. Arul William David, General Manager, Supply Chain Department, who kindly accepted me to have a case study in the company and always being helpful during my study there and giving advices about my project and the information I needed during the project. It is a pleasure to show my gratitude to Mr. Magahara Deepen, Deputy Manager, Supply Chain Department ELGI Equipments, who share the insights about the project and give me a unique opportunity to engage in the valuable discussions. I also like to thank all the colleagues at ELGI Equipments who provided the best work atmosphere to do the thesis in right way. I need to thank my dearest parents and my dear brother for giving me strengths when I came up against difficulties during the thesis project. Lastly, I offer my regards and blessings to all the people who supported me in any respect during the completion of the project. I will always remember your encouraging words and knowing smiles!

4(58)
Contents
TableofContents
LIST OF FIGURES ................................................................................................................................................. 6
LIST OF TABLES ................................................................................................................................................... 7
LIST OF ABBREVIATIONS: ................................................................................................................................ 8
1. INTRODUCTION ................................................................................................................................................ 9
1.1 BACKGROUND: ............................................................................................................................................ 9
1.2 PROBLEM STATEMENT: ........................................................................................................................... 10
1.3 AIM OF PROJECT: ....................................................................................................................................... 10
1.4 RESEARCH QUESTIONS: .......................................................................................................................... 10
1.5 PROJECT LIMITATION: ............................................................................................................................. 10
2. RESEARCH METHODOLOGY...................................................................................................................... 11
2.1 RESEARCH DESIGN: .................................................................................................................................. 11
2.2 LITERATURE REVIEW: ............................................................................................................................. 12
2.3 CASES TUDY: .............................................................................................................................................. 12
2.4 INTERVIEW: ................................................................................................................................................ 12
2.5 OBSERVATIONS & VALIDITY: ................................................................................................................ 13
3. THEORY BACKGROUND: ............................................................................................................................. 14
3.1 THEORY BACKGROUND: ......................................................................................................................... 14
3.2 LEAN MANUFACTURING: ........................................................................................................................ 14
3.3 PROCESS FLOW CHART: .................................................................................................................................. 14
3.4 VALUE STREAM MAPPING: ..................................................................................................................... 15
3.4.1 STEPS INVOLVED IN VSM: ................................................................................................................. 16 3.4.2 NEED FOR VALUE STREAM MAPPING IN AN INDUSTRY: ............................................................ 17
3.5 MATERIAL HANDLING & SUPPLY: ........................................................................................................ 18
3.6 ENVIRONMENTAL/ENERGY VALUE STREAM MAPPING: ................................................................ 19
3.6.1 ENERGY VALUE STREAM MAPPING: ............................................................................................... 19 3.6.2 ENVIRONMENTAL VALUE STREAM MAPPING: .............................................................................. 21
3.7 ENVIRONMENTAL MEASURES FOR MANUFACTURING INDUSTRIES: ......................................... 23
3.8 NEED FOR ASSESSING ENVIRONMENTAL IMPACTS: ........................................................................ 24
3.9 OBSTACLES IN PRACTICING LEAN TECHNOLOGIES IN INDIA ....................................................... 26
4. CASE STUDY .................................................................................................................................................... 28
4.1 ABOUT THE COMPANY: ........................................................................................................................... 28
4.1.1 INVENTORY MANAGEMENT IN ELGI EQUIPMENTS: ..................................................................... 28 4.1.2 STANDARD AND NON-STANDARD ITEMS: ...................................................................................... 29 4.1.3 STEPS INVOLVED IN PROCUREMENT OF ITEMS BY ELGI EQUIPMENTS: ................................ 30 4.1.4 STORAGE FOR ELGI INVENTORY: .................................................................................................... 30
4.2 STUDIED PROCESS DESCRIPTION: ........................................................................................................ 31
4.2.1 VALUE STREAM MAPPING: ............................................................................................................... 32

5(58)
4.2.2 SUPPLIER VALUE STREAM MAPPING: ............................................................................................ 34 4.2.3 FLOW PROCESS CHART (FPC): ........................................................................................................ 37
5. ANALYSIS & SUGGESTED IMPROVEMENTS .......................................................................................... 42
5.1 ANALYSIS: .................................................................................................................................................. 42
5.1.1 ENERGY AND NOISE ANALYSIS ......................................................................................................... 42 5.1.2 PROCESS DESCRIPTION BY ENERGY AND NOISE POINT OF VIEW: ........................................... 42 5.1.3 ENVIRONMENTAL VALUE STREAM MAPPING: .............................................................................. 43 5.1.4 ENERGY FLOW PROCESS CHART (ENFPC): ................................................................................... 47
5.2 SUGGESTED IMPROVEMENTS: .............................................................................................................. 50
5.2.1 GENERAL IMPROVEMENT: ............................................................................................................... 50 5.2.2 STUDIED PROCESS IMPROVEMENTS: ............................................................................................. 50 5.2.3 LEVELLING INVENTORY: ................................................................................................................... 51
6. CONCLUSION .................................................................................................................................................. 54
7. RECOMMENDATIONS: .................................................................................................................................. 56
REFERENCES ....................................................................................................................................................... 57

6(58)
List of figures Figure 2.1: An outline of the main steps of qualitative research……………………....10
Figure 3.1: Steps involved in VSM…………………………………………………....15
Figure 3.2: Icons Used in VSM………………………………………………………..16
Figure 3.3: Total value stream…………………………………………………………17
Figure 3.4: Material handling and supply……………………………………………...17
Figure 3.5: Process data box with Energy usage data………………………………….18
Figure 3.6: Value stream mapping incorporating Environmental inputs and outputs....18
Figure 3.7: Value stream map with EHS ICONS and a materials line…………………21
Figure 4.1: Inventory management at ELGI Equipments……………………………...28
Figure 4.2: Current State Value Stream Mapping……………………………………...32
Figure 4.3: Supplier Value Stream Mapping………………………………………......34
Figure 4.4: Supplier Replenishment (RPL) vs. Actual Lead Time……………………..35
Figure 4.5: FPC………………………………………………………………………...37
Figure 5.1: Current State Environmental VSM………………………………………..43
Figure 5.2: Future State Environmental VSM…………………………………………45
Figure 5.3: ENFPC…………………………………………………………………….47
Figure 5.4: Suggested Two Bin System………………………………………………..51

7(58)
List of tables Table 3.1: Environmental measures …………………………………………………...23
Table 3.2: Environmental Impacts of Lean Wastes…………………………………….24
Table 4.1: Supplier Product delivery details…………………………………………...35
Table 4.2: FPC…………………………………………………………………………39
Table 5.1: ENFPC……………………………………………………………………...48

8(58)
List of Abbreviations: FPC Flow Process Chart
VSM Value Stream Mapping
EVSM Environmental Value Stream Mapping
ENVSM Energy Value Stream Mapping
EFPC Environmental Flow Process Chart
ENFPC Energy Process Chart
EPA Environmental Protection Agency

9(58)
1. INTRODUCTION
1.1 BACKGROUND:
The main purpose of the supply chain management is to reduce the cost and eliminating waste. Lot of companies is undergoing fundamental changes during material management activities. The companies want to reduce their supplier base and forming partnership with the key suppliers and implementing new manufacturing tools like Lean and Green. In the present world companies are facing problems with environmental wastage and their impacts. Manufacturing industries should concern about the impacts and start reducing the environmental wastages by using lean and green tools. (EPA, 2000) The determination and elimination of waste in various processes can be reduced by using a set of principles and practices mention in the lean production philosophy. The quality of the product depends upon by time, cost, efficiency, resources and waste reduction. Lean production guides to identify non-value added activities at different stages such as design and production. (APICS Dictionary, 12th Edition) Toyota production system introduced lean concept which integrates various tools to eliminate waste and increase the productivity. “ Lean manufacturing uses tools such as kaizen, one-piece flow, cellular-manufacturing, synchronous manufacturing, inventory management, poke-yoke, standardized work, work place organization and scrap reduction to reduce manufacturing waste” (Pavnaskar et al., 2002) A value stream map (VSM) is “the simple process directly observing the flows of information and materials as they now occur summarizing them visually and then envisioning a future state with much better performance”. (Jones and Womack, 2000) For identifying problems and to analyze them in the production management some methods are being used they are flow process chart (FPC) and value stream mapping (VSM). According to Seth & Gupta (2005), VSM are used as a pictorial representation of material flow and information flow such as cycle time, inventory, resources and takt time. By using VSM techniques the manufacturing companies improve their quality of the product, reducing cost and minimizing the wastages. Presently lots of companies are willing to link lean and environment, health and safety (EHS) professional world as well (Pojasek, 2008). The United Stated environmental protection agency (EPA) established a new web portal that links with the lean and the environment (http://www.epa.gov/lean/). The aim of the agency is to give awareness about to reduce environmental wastage and to minimize energy usage. The EPA is not only used for sustainability developments but also for a good business (Green manufacturing, 2008). The lean and environmental management are the two different streams for the manufacturing unit. ELGI Equipments is an Indian based company which manufactures compressors over five decades. The company focuses on adding value into everything they do from concept to design, development to manufacturing, marketing, delivery, service and knowledge sharing. The ELGI Equipments are planning to implement Lean and Green techniques in near future; for that purpose i am doing some basic research work on how to implement the lean techniques?
10(58)
1.2 PROBLEM STATEMENT:
In India the industries are often not very concerned about the environmental impacts and quality of products. The industries are polluting the environment in a large scale and they are not taking enough preventive measures. In the present scenario there are so many new techniques available in the manufacturing process to reduce an environmental waste and to reduce the inventory cost. ELGI Equipments have been using the same techniques for the past five decades and they are planning to shift towards to new techniques which widely used in other manufacturing industries like VOLVO, ABB, Toyota, etc
1.3 AIM OF PROJECT:
The objectives of this thesis are: 1. To identify the lean and environmental waste in the case company by using FPC, VSM
and EVSM.
2. To develop and demonstrate a systematic and easy method for assessing the environmental performance and optimizing the production setup.
1.4 RESEARCH QUESTIONS:
RQ 1: In what ways can the supply chain process in the case study company be improved by means of efficiency, reduced lead time, reduced resource use and reduced operating cost, using a “lean & green” approach? RQ 2: How does lean production system implementation helps the Indian manufacturing Industries? RQ 3: What are the possibilities to use EVSM in Indian industry where there is low availability of environmental data?
1.5 PROJECT LIMITATION: EVSM is a new concept to the industries and to the researchers, collecting data for EVSM is little bit hard and it needs more practical time to find the exact relevant data. There are limited no of journals and publications on EVSM. Since the environmental impacts are the major focus in this thesis, I am not going in detailed about the suppliers and production cycle. The quantitative data is missing in the environmental aspect, so we can’t predict the exact outcome. Due to lack of time, i carried only one case study in the assembly line during the visit to the company.

11(58)
2. RESEARCH METHODOLOGY 2.1 RESEARCH DESIGN: The main objective of this study is to determine the environmental impacts in a production line. For better manufacturing we came up with a research study on EVSM tool. By using this tool we can find and minimize the environmental impact on the production line and increase the performance and productivity to get economical benefit. Research methodology has two methods which are widely known as (i) Qualitative research method and (ii) Quantitative research method. According to this research work, we have chosen qualitative research method. According to Bryman & Bell (2003), in qualitative research method, we have to follow some basic steps for collecting the relevant data. The steps will as follows Figure (2.1): An outline of the main steps of qualitative research (Bryman & Bell, 2003)
Writing up finding/conclusion
Tighter specification of the research question
Conceptual and theoretical work
General research questions
Collection of further data
Seeking relevant sites and subjects
Collection of relevant data
Interpretation of data

12(58)
According to journal of business logistics, there are different types of research tools for gathering relevant data through the following methods. The methods are by conducting interviews, surveys, experiments, literature reviews, case studies, content analysis, observation and focus group. For this thesis report the methods used are mainly literature review, case studies, interviews, observations and focused groups.
2.2 LITERATURE REVIEW: The main objective of this literature review is to find the relevant data which will give better understandings about the focused topics in a detailed way and to get brief idea about the research work. According to Hart (1998), literature review is a collection of data from different journals or publications for a specified topic. For literature review we used different sources like science direct, university library reference books, emerald, proquest etc. The keywords and search results as follows: To get the brief idea about the production process in manufacturing industries, initially we have to do some research work for gathering the data flow by well established research techniques available in the present world. For my research work we pointed out two techniques in order to create a new tool for visualizing the production process. First one is lean and another one is green. By using both techniques we conclude that we can use parallel action research throughout my thesis work. Research in this thesis paper is based on theoretical background and a case study which is intended to apply the EVSM tool in the manufacturing world. The main aim is to implement and get the better results by using the above mentioned tool. (Coughlan & Coghlan: Voss et al: 2002)
2.3 CASES TUDY: I have chosen a company ELGI EQUIPMENTS in India, who manufacture compressors for the various fields. They are technological innovative company with five decades of expertise in manufacturing of compressors. The company focuses on adding value into everything they do from concept to design, development to manufacturing, marketing, delivery, service and knowledge sharing. I visited the company and conduct my research work on environmental impacts in the selected assembly line.
2.4 INTERVIEW: The main objective of this section is to prepare a questionnaire to conduct an interview with a person who is having an experienced in that field. During the research work i interviewed selected suppliers to ELGI and employee in assembly line in ELGI. Interviewed Local Suppliers are follows;
1. Sowmya Industries
2. Sri Raang Industries
3. Samraj Engineering Controls
4. Sri Bhavani Industries
5. Sky Industrial Components
6. Jaytek Engineering

13(58)
7. Sri Krishna Enterprises
In company i Interviewed Mr. Magahara Deepan, Dpty Manager, Supply Chain Department and Mr. Rajan, Buyer, Supply Chain Department, Elgi Equipments.
2.5 OBSERVATIONS & VALIDITY: According to Yin (2003), “Data analysis consists of examining, categorizing, tabulating, testing or otherwise recombining both quantitative and qualitative evidence to address the initial propositions of a case study”. There are some few techniques to analysis from the collected data by pattern matching, explanation building, time series analysis, logic models and cross case synthesis. Relaying on theoretical proposition, we used a time-series analysis would be a suitable one for this research work. According to yin (2003) validity and reliability are conducted through four types. They are construct validity, internal validity, external validity and reliability. As mentioned above, using time-series analysis we can determine the work flow of assembly line by gathering the time data and material flow and the inventory information. Once the data been collected it is framed into visualize form by using VSM, EVSM and FPC tool and started analyzing the lean wastes and different environmental impacts. Finally we end up with the conclusion part which carries answers for the research questions

14(58)
3. THEORY BACKGROUND: 3.1 THEORY BACKGROUND:
This chapter presents the available literature briefly regarding the lean techniques and environmental assessment methods which are used in the case study and in the analysis.
3.2 LEAN MANUFACTURING:
Lean manufacturing is accepted worldwide as the best practice to overcome; competition obstacles, operational cost and operational problems, among manufacturing companies. Lean manufacturing was founded and initially implemented by a Japanese company known as Toyota, to meet the demands, eliminate wastes and minimize the work load. The vital role of lean manufacturing includes inventory and quality control, better industrial relations, labor management, and supplier-manufacturer practices that differ from traditional American business practices. (Yen Chun Wu, 2003) A leading author who has studied Toyota Production system and written several books on this is Jeffery Liker. According to Liker, the lean method aims at eliminating eight types of waste that includes, (a) Over production, (b) Waiting, (c) Unnecessary transport, (d) Over processing, (e) Excess inventory, (f) Unnecessary movement, (g) Defects and (h) Unused employee creativity. These wastes if discovered during the production process are eliminated in order to attain an increased performance and quality. Some typical approaches to eliminate the non-value adding activities are: TPM (Total Productivity Maintenance), Cellular Manufacturing, Just-in-time Production, VSM (Value Stream Mapping), 5S etc. According to Womack and Jones (2003), lean production is categorized into five main objectives, which include defining value, identify the value stream of the product, work flow, pull the work and pursue to perfection. These objectives can be implemented at three stages namely demand, flow and leveling of the product. A VSM is used to visualize the flow and information of the product in lean production system.
3.3 Process Flow chart:
American society of Mechanical engineering (ASME) came up with a tool for visualization on the basis with Gilberth publications (1921) “Process chart – First step in finding the one best way” consists of symbols set. The chart includes every kind of work that is not based on nature of the process carried. The tool is famously known as “Operation and Process flow chart” showing a line of symbols visualizing the flow in any process. According to Graham (2004), the flow process chart is a simple and efficient way for tracking an item, a person, or material through the process.

15(58)
Some major symbols which are used from beginning and still in same versions,
Operation (Doing work): “An operation occurs when an object is arranged or prepared for another step, assembled or disassembled or intentionally changed.” (Graham 2004) “In practice, the operation symbol is filled in when representing a physical change to an object. This way, the value– added steps stand out.” (Graham 2004) Transportation (Moving work): “Transportation occurs when an object is moved from one work area to another.” (Graham 2004) Inspection (Checking work): “An inspection occurs when an object is verified for quality or quantity in any of its characteristics.” (Graham 2004) Storage/Delay (Nothing happening): “Storage occurs when an object is kept and protected against unauthorized removal.” (Graham 2004) Delay: “A delay occurs when an object waits for the next planned action. (A “D” symbol is sometimes used to distinguish a delay from storage.)” (Graham 2004)
3.4 VALUE STREAM MAPPING:
Value Stream Mapping (VSM) is a visualization tool that helps to map a process and to identify the main criticalities (Braglia et al., 2006). It is used to conceive streamlined processes using the tools and techniques of Lean Manufacturing. It is widely used in development and analysis of Lean manufacturing System. (Rother and Shook, 2003) According to Hines and Rich, the objective of Value Stream Mapping is to identify, exhibit and to reduce waste in the production system. It helps management, production engineers, production associates, production planners, suppliers and the customers to recognize the waste and their causes at the beginning stage of the production process. According to Monden (1993), all types of operations that are carried out in lean production system can be assigned into three different categories.
Value Adding ( VA)
Non-Value Adding (NVA)
Necessary but Non-Value Adding (NNVA)

16(58)
a) Value Adding (VA):
An activity that results in adding actual value to the end product is categorized into value adding. Manual operations add value to the product through conversation or processing of raw material or semi-finished products. It is the smallest part of operation that is unthinkable not to conduct in any future state scenario. For example: forging of raw materials, sub-assembly and painting of parts.
b) Non-Value Adding (NVA):
An activity that augments cost and creates no value to the end product, can be eliminated immediately is categorized into non-value adding. It is pure waste and should be eliminated immediately. For example: the waiting time and double handling of the process.
c) Necessary but Non-value Adding (NNVA):
Activities that are wasteful and add no value to the end product but it is unavoidable in the current operating procedures are known as necessary but non-value adding. For example: unavoidable walking distance to pick up a tool or product, and unpacking of delivered material.
3.4.1 STEPS INVOLVED IN VSM:
VSM is a vital tool that helps in the review process to reveal the significant opportunities to reduce cost, improve production flow and reducing non-value added time. According to Rother and Shook (2003), there are five steps that should be followed to carry out a VSM as shown in figure:
Figure (3.1): Steps involved in VSM
Production
Current State Mapping
Implementation
Work Plan
Future State Mapping

17(58)
Initially a product family is selected that are group of products that uses same steps and machineries in the production process. The selected product family is drawn as a current state map in the second step. The third step includes implementing the suggested changes in the future state map. The arrows between the both current and future state map goes both ways to indicate that the two procedures are overlapping efforts. The work plan is developed in the fourth step that suggests how to implement it. The implementation of future state value stream map is carried out in the final step. The icons which are widely used for VSM are as followed in the Figure (3.2) as explained by Rother and Shook, 2003.
Figure (3.2): Icons Used in VSM
3.4.2 NEED FOR VALUE STREAM MAPPING IN AN INDUSTRY:
According to Rother and shook (2003), a VSM identifies the requirements for reconstructing the Production line. It pictures the complete production line and visualizes the waste within the value stream. The information and material flow are the main improvement areas to be analyzed by this tool. For the implementation such as ideas, and the techniques of lean, these

18(58)
are performed based on the VSM analysis. This analysis couples the ideas, techniques and concepts of production flow from the schematic VSM. VSM tool emphasis on the affinity between material and information flows. When performing a value stream mapping, pursued from suppliers to production or all the way to final customer, it is called a supply chain value stream map. A representation of the relationship between an internal value stream map and a supply chain value stream map is shown in figure (3.3)
Figure (3.3): Total value stream
3.5 MATERIAL HANDLING & SUPPLY: As explained by Kurdve et al (2011 b) construction of a system for material handling is based on different parameters which include data from the area for retrieval and storing, paths for material flow, packaging, varieties of materials and also considers the space between the material movements. According to Jonsson (2008), to perform materials supply to the process, a variety of replenishment principles can be differentiated;
Figure (3.4): Material handling and supply
Material handling and Supply
Kitting Batching Continual Supply
Assembled all needed parts from store and Delivered as a Kit to
production
Identical parts are combined and delivered to production
Small packages of different items are
delivered to production and
replaced continually

19(58)
The material replenishments can be categorized into four different paths. As follows; Milk runs: The milk runs are supply or delivery trains following a specified route paths; this train runs in a schedule carrying out different picks and drops at the required locations, thus by avoiding a intensity of direct deliveries. Two Bin Systems: The replenishment is done by two bins, if one bin is finished, the next lot is used and the previous lot (empty) is used to signal for more parts. The next lot must always contain the need of parts till another lot arrives and thus the time from signal to delivery is crucial to decide the lot-size. The lot size which is used in 2bin system always is based upon the material need and the frequency in which it is filled. Sequencing: The sequencing process is based on the supply and delivery of materials and parts in an order which is sequential by matching the production carried out. The sequential order should be on the reliable information which based on production schedule and delivery which must be available. Kitting: This process is implemented by supplying the material and parts for the product to be produced at the next step in production. A requirement for this is also reliable information of the production plan with regards to which products to produce. This information should give the time requirements for combining the materials and delivering the parts kitted.
3.6 ENVIRONMENTAL/ENERGY VALUE STREAM MAPPING:
According to Kurdve et al (2011 a), resources consumed at a high rate have been one of the major problems for organizations which made them more conservative about resources. Researchers confirm that a highly inefficient consumption of resources has been carried out in factories, even though the resources are difficult to improve as there is a lack in a proper measurement tools. As the problem explained by Schmidt et al (2007) in the following way “If potentials for saving energy and materials are to be identified in manufacturing enterprises, both the quantity and the value framework of material movements in the company must be recorded.”
3.6.1 ENERGY VALUE STREAM MAPPING:
EPA (2007a) suggested an event in Value stream mapping in “lean-energy-toolkit” which describes VSM enables team measures and adds data from energy used in every process simultaneously they collect data from the current state process. The data collected in the current state process are cycle time; change over time and up time. The major objective of this process is to have both the data from process and energy usage or waste in the same chart. ENVSM provides the analysis team to work on future state and obtain efficiency in lean principle and energy-saving ways . As described by EPA the energy is used directly added to the process data box in VSM. This method enhances the VSM to add average energy usage or wastage for every process and also adds every process cycle time in the respective boxes. (2007a)

20(58)
Figure (3.5): Process data box with Energy usage data
In the data box the last line explains the average energy usage which has an output of one kilo watt-hour per pound. As explained by EPA (2011), it introduces another version of ENVSM in “Lean and chemicals toolkit” publication. After the timeline of VSM the energy usage or wastage which is followed by the output value of energy in the process as shown in FIG (3.6).
Figure (3.6): VALUE STREAM MAPPING INCORPORATING ENVIRONMENTAL INPUTS AND OUTPUTS (EPA 2011)

21(58)
3.6.2 ENVIRONMENTAL VALUE STREAM MAPPING:
Technically, the structure of EVSM has similar form and appearance to that of ENVSM. EPA recommends the VSM team to work with EHS professionals to gather the data of the work process in a manufacturing company. These gathered data can be depicted in VSM as environmental issues like hazardous material, raw material or water, thus known as EVSM. (Romvall et al, 2011)

22(58)
FIGURE (3.7): VALUE STREAM MAP WITH EHS ICONS AND A MATERIALS LINE (EPA 2007 b)

23(58)
The upper line shows the quantity of material which has been sent to the process is depicted as material line and the lower line depicts the amount of material is used during the process and considered as a value added activity from customer’s point of view. The waste of material can be identified from the difference between lower line and upper line.
3.7 ENVIRONMENTAL MEASURES FOR MANUFACTURING INDUSTRIES:
According to Qiu et al, there are certain procedures to maintain the environmental regulations and concepts. A standard environmental management system in accordance to ISO 14000 is used for maintain the environmental regulations and concepts. To implement this ISO standard, the organizations must follow the criterion and rules for continuous improvements and also enable environmental effectiveness. The measures, as mention by EPA (2006) and the green supplier network, chosen by most organizations are shown in the table below.
Table (3.1): Environmental measures (EPA, 2006)
Category Definition Metric UnitofmeasureInputMeasures
Energyuse Any source providing usable power or consuming electricity Transportation and non-transportation sources
Energy Used Specific to energy source such as BTUs or kilowatt source hours, % reduction, energy use/ unit of product
Landuse Land covered by buildings, parking lots, and other impervious surfaces land/habitat conservation
Land Converted, land Restored or Protected, Area of Impervious Surfaces
Square feet, acres.
Materialuse Materials used (total or specific), ex. Packaging materials Proportion of input materials that were recycled or recovered (vs. Virgin materials)
Materials Used, Percent utilization of materials Post-consumer Recycled Content.
Tons/year, pounds/unit or products, % materials utilization
Wateruse Incoming raw water, from outside sources, e.g., from municipal Water supply or wells, for operations, facility use, and grounds maintenance.
Volume of Water used, P2 to reduce Priority Chemicals/Quality Standards/Pretreat Standards
Gallon/year, % reduction, % recycled Pounds, Priority Chemicals/year, % reduced, % recycled.
Non‐ProductOutputMeasures
Airemissions The release of any of the following: Air toxics-CAA 112b HAPs Carbon Monoxide Lead Ozone and its precursors, including: VOC’s (volatile organic compounds) NO x (nitrogen oxides) Ozone-depleting substances PM10 (particular matter) Sulphur Dioxide Greenhouse gases, including Carbon Dioxide
Air emissions generated Pounds/year, tons/year, % reduction
WaterPollution Quantity of pollutant in wastewater that is discharged to water source. Should include any substance regulated in NPDES permit. May include: Heavy Metals-Cu, pb, Hexavalent Chromium, Cadmium, Zn, Ni, Hg, Organic Pollutants, e.g., oil and grease, BOD and suspended solids, and Nutrients-N,P Pathogens Sediment from runoff Wastewater
Mass or Concentration Regulated Pollutants Discharged
Pounds/year, mg/L or % reduction

24(58)
discharge SolidWastes Wastes (liquid or solid) other than
RCRA hazardous wastes. Solid (Non-Hazardous) Waste Generated
Gallons or pounds/year, % reduction, % recycled
Downstream/ProductMeasures
ProductImpacts Expected lifetime energy and water use Wastes (to air, water, & land) from product use and disposal or recovery
Energy-BTU, kWh, mWh water use gallons Wastes pounds, tons
OtherMeasures
MoneySaved Money saved in the reduction of materials or other changes in process
Dollars saved Dollars saved
QualitativeMeasures
Other environmental, improvements that cannot be directly or accurately quantified. For example: implementing an EMS
Savings and environmental benefits from leaning out of permits/ Design for Environment/ Clean Production/ EMS implementation/ Extended Product Responsibility
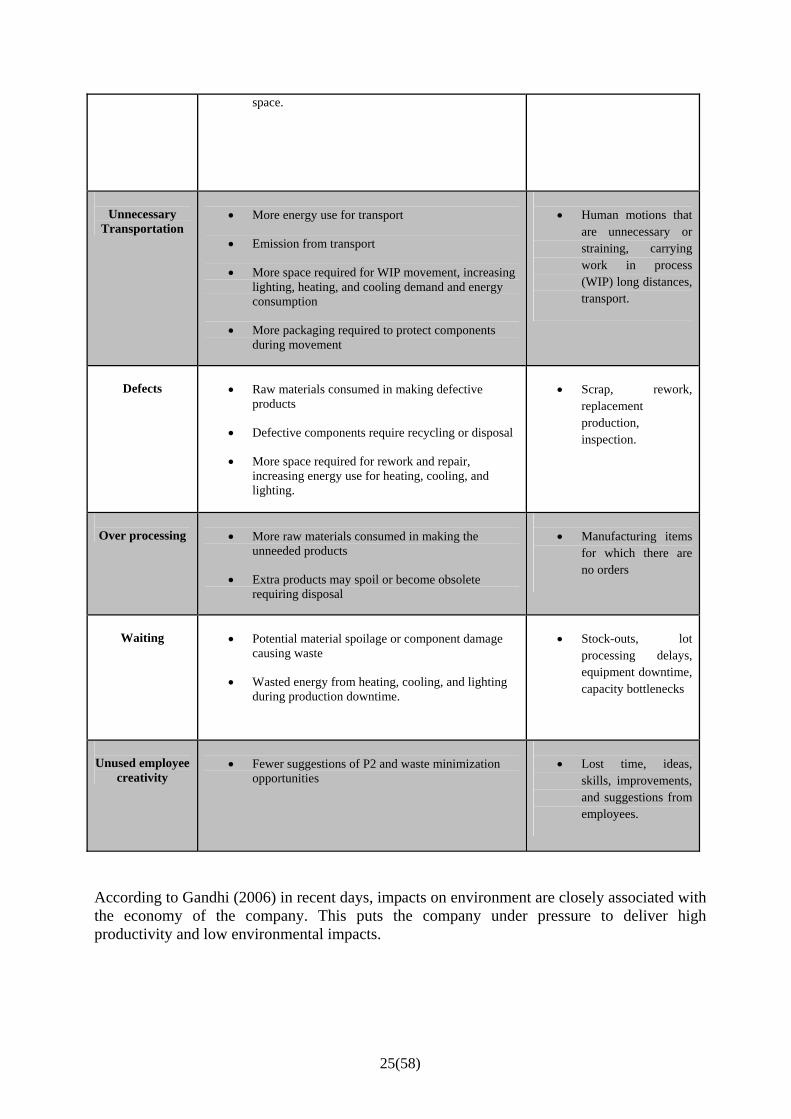
3.8 NEED FOR ASSESSING ENVIRONMENTAL IMPACTS: According to EPA (2006) the assessment for environmental impacts enables a company to identify and evaluate the major effects of the production process with regard to effects on the environment. The waste of environment also increases the cost in business which is due to the cost for disposing, over use of raw materials and pollution control costs. The products of companies that have low environmental impacts are sought to be bought by environmentally aware customers. An environmental assessment also provides a working method for employees to achieve a clean and safer environment. The operational efficiency and the effects on environment should have keen criteria in the production line. (EPA 2006) The impacts of lean waste on environment are shown in the table,
Table (3.2): Environmental Impacts of Lean Wastes (EPA, 2006)
Types of Waste
Environmental Impacts
Examples
Over production
More raw materials consumed in making the
unneeded products
Extra products may spoil or become obsolete requiring disposal
Manufacturing items
for which there are no ideas
Excess Inventory
More packaging to store work-in-process
Waste from deterioration or damage to store WIP
More materials needed to replace damaged WIP
More energy used to heat, cool, and light inventory
Excess raw materials,
WIP, or finished goods.
25(58)
space.
Unnecessary
Transportation
More energy use for transport
Emission from transport
More space required for WIP movement, increasing lighting, heating, and cooling demand and energy consumption
More packaging required to protect components during movement
Human motions that
are unnecessary or straining, carrying work in process (WIP) long distances, transport.
Defects
Raw materials consumed in making defective
products
Defective components require recycling or disposal
More space required for rework and repair, increasing energy use for heating, cooling, and lighting.
Scrap, rework,
replacement production, inspection.
Over processing
More raw materials consumed in making the
unneeded products
Extra products may spoil or become obsolete requiring disposal
Manufacturing items
for which there are no orders
Waiting
Potential material spoilage or component damage
causing waste
Wasted energy from heating, cooling, and lighting during production downtime.
Stock-outs, lot
processing delays, equipment downtime, capacity bottlenecks
Unused employee
creativity
Fewer suggestions of P2 and waste minimization
opportunities
Lost time, ideas,
skills, improvements, and suggestions from employees.
According to Gandhi (2006) in recent days, impacts on environment are closely associated with the economy of the company. This puts the company under pressure to deliver high productivity and low environmental impacts.
26(58)
3.9 OBSTACLES IN PRACTICING LEAN TECHNOLOGIES IN INDIA In Indian companies, there are some major factors that act as obstacles in implementing the lean technologies in Indian manufacturing industries. According to R.O.Mohanty et al (2007), the factors observed are,
1. Power policy between various functional departments. 2. Low investment in human resource development. 3. Short term interests of business leaders. 4. Quick fix expectations and shallow opinion of most managers.
But in recent days, multinational companies have stepped into Indian manufacturing sectors and have started to achieve the implementation of lean techniques in India. Some of the company’s achievements are;
1. Reducing cycle time and customer lead-time. 2. Reducing inventory. 3. Improving productivity. 4. Reducing material cost. 5. Improving performance of the supply chain. 6. Effective supplier and dealer networking. 7. Multi-skilled workforce.
R.O.Mohanty et al (2007) stated that many researchers have been carried out in Indian manufacturing industry to implement the lean practices. And in order to also deliver lean practices on a sustainable basis they need to look within and replenish the structure of the organisation itself. According to R.O.Mohanty et al (2007), the three main aspects for the lean approach are,
1. Culture: The mentality should permit the individual and teams to consider creatively and competitively to take practical risks to seek out and also to create a way and introduce lean projects.
2. Process: The engineering process and practices will set a way for people to enable to operate effectively and collaboratively towards a common goal as well as a healthy set of lean tools.
3. Structure: The important factor is about the creation of organisation structure. The organisational structure and supporting technologies that permits teamwork across the company.
The general guidelines for the Indian industry and employees for practicing lean techniques are,
1. Establish a clear sense of direction for lean manufacturing. 2. Open statement and systematic education. 3. Reduce bureaucracy. 4. Encourage a sense of rights. 5. A broad-mindedness of risk and failure.

27(58)
According to Sumila Gulyani, The lean practice will be followed and standard only by developing a combined sense of purpose and from unleashing the creativity of individuals throughout organisation. It is also important to teach each individual to distinguish exceptional opportunities. The optimism is the important factor to be considered for practicing lean. It is about an attitude of continually reaching for higher performance. But in the case of Indian industries, they have to be aware about the structural integration, process integration and external integration.

28(58)
4. CASE STUDY In order to obtain the assessment for leveled VSM, EVSM and the material handling, a case study on the assembly line at ELGI Equipments, Coimbatore, India was performed. The objective of the study was to answer the research questions (“how useful is EVSM...”) and to answer the company question of what are the improvement potentials in their supply chain.
4.1 ABOUT THE COMPANY: Elgi Equipments Pvt Ltd is a technologically innovative company with five decades of expertise in manufacturing of air compressors. Elgi is the market leader and Asia’s largest air compressor manufacturer. It employs best in class practices and provides total in-house capabilities to decide and manufacture products. The company focuses on adding value into everything they do from concept to design, development to manufacturing, marketing, delivery, services and knowledge sharing. Elgi’s products are used in a wide range of applications like transport, pharmaceutical, power oil, railways, chemicals, textiles, printing to ship building, electronics, telecommunications, medical, food & beverages and plastics. In general, the products are been used either in production, maintenance or usage. (www.elgi.com) In Elgi they manufacture different types of compressor and sell the product for both domestic and international markets. The International markets such as Europe, North America, Africa, Australia, Middle East, and Asian continents. In Elgi Equipments, the employees in the top management are professional but the employees who work in shop floor are moderate and uneducated. One decade ago, ELGI Equipment manufactured all type of components that are needed for the production of complete compressor by its own. At present they manufacture only the main core products like crank shaft, housing block, cylinder block and rotor forging rod. Remaining parts are given to the suppliers. In that the 50% of the products are procured locally, 30% are regional suppliers and 20% are overseas suppliers. The employees, who worked in ELGI Equipment for more than a decade, had started a new company and acting as one of the local suppliers.
4.1.1 INVENTORY MANAGEMENT IN ELGI EQUIPMENTS:
The Inventory management strategy at Elgi deals mainly with having sufficient products to avoid stock-out and at the same time maintaining optimal inventory. Good inventory management deals with factors like “what to purchase”, “how to purchase”, “from where to purchase” and “where to store”. The following are the inventories method used in ELGI Equipments.

29(58)
Figure (4.1): Inventory management at ELGI Equipments
Generally ELGI EQUIPMENTS has three types of inventories such as raw material for casting, Air-end assembly, purchased product for assembling. The major raw materials used for the manufacture of compressors are casting iron, aluminum blocks, and steel plate. The major finished and semi-finished components used are bearings, crankshafts, switches, gauges, rotors and housings. The major bought-out items are motors, starters, control panel, inter and after coolers, and filters. Further Elgi have classified these inventories into standard and non-standard items.
4.1.2 STANDARD AND NON-STANDARD ITEMS:
Standard or non-standard components are produced as per the ELGI design from and bought from the suppliers. Mostly the non-standard items are more no in compressor assembly because these are irregular or sporadic. Standard items are procured as a specific quantity like 1+2 month tentative schedule. Problem faced by ELGI EQUIPMENTS are among others: excess level of inventory which leads to carrying cost along with warehouse and insurance fees or shortage of particular non-standard components which will lead to bottle necks or disturbances in the assembly flow. Supply of materials may be uncertain due to reasons like lack of production facilities in suppliers’ base, delay in arrival of the purchase order raised material etc. Some of the other problems may be new components that have to be procured based on customer’s design, minimum quantity to be produced, which may give huge production cost, or component that are not being used in assembly line due to that they are unfit for usage or are connected with storage problems, e.g. non-standard items of huge size.
INVENTORIES (Raw Materials)
FINISHED SEMI-FINISHED
BEARINGS, CRANKSHAFTS,
SWITCHES, GUAGES, ROTORS AND
HOUSINGS
CASTING IRON, ALUMINIUM BLOCKS
AND STEEL PLATE
BOUGHT OUT PRODUCTS
CONTROL PANEL, INTER AND AFTER
COOLERS AND FITLERS.

30(58)
4.1.3 STEPS INVOLVED IN PROCUREMENT OF ITEMS BY ELGI EQUIPMENTS:
Mostly large numbers of non-standard components are procured for all types of compressor. 20% of the total components are comprised of non standard components. The steps involved in ordering such customized compressors are,
1. Marketing department receives order from the customer for a customized compressor.
2. They share the information with research and development, production, vendor management and purchase department.
3. Research and development creates Bill of Material (BOM) for a particular compressor.
4. They release the drawing and gets approval from the customer.
5. After getting approval from the customer, a technical part list is released.
6. Generally on the 15th of every month, next month’s firm order along with daily
requirement and 2 successive month’s tentative order is released.
7. Form-I for the new non-standard items are created (this form will have specification which include raw material specification, design specification and price).
8. If in case any new purchased components turns up in the technical part list, it is diverted to a new component development at the purchase department.
9. New component development (NCD) develops the prototype of the new variant of the components and price.
10. Based on the BOM, critical components which have long lead times will be finalized for delivery Elgi.
11. The material requirement will be circulated within the materials department (Purchase department) and for the purchased components which has long lead times, a purchase order is raised.
12. The purchase department has different buyers and each buyer will have a cluster of suppliers for follow-up.
13. After this non-standard component arrives in store, it will be issued for assembly purpose.
4.1.4 STORAGE FOR ELGI INVENTORY:
There are 5 stores in ELGI EQUIPMENT. They are
Large Electric Power Screw Air compressor.(LEPSAC)
Small Electric Power Screw Air compressor.(SEPSAC)
Railways assembly.

31(58)
Reciprocating compressor division.
Rotary Air compressor.
Each assembly line has an inward inventory section to store the standard and non-standard component from the supplier. They are visually measured for critical length, diameter of component. Then GRN (goods receipt note) is generated and the component goes to a predefined place in the store. If in-case, the components gets rejected, then the rejected component is send back to the supplier.
4.2 STUDIED PROCESS DESCRIPTION:
A process description has been prepared for the studied “SEPSAC” assembly line process. In this process all the stages are described as per their work flow from the stores to finished goods. There are five stages with three sub-stages and testing bay involved in the assembly line. In the first stage, the canopy is brought to the station by lift truck from the inventory. Then one operator disassembles the top and side covers of the canopy and they fix the control panel. The next stage involves one main stage and one sub-stage for the assembly of motor and crank shaft. The assembled motor and crank shaft is fitted in the canopy base. Then it moves to the next stage where the tank assembly takes place in a sub stage to the main stage where it is assembled in the canopy base. In the fourth stage, which contains a sub stage involving the cooler assembly, the cooler is fixed with the tank in the canopy base and then it is transferred to the final stage involving final assembly where wiring connections are done for the control panel and for the motor. Finally the unit is transferred to the testing bay and is inspected for about an hour. Once the testing is completed, the unit is transferred to the finished goods inventory storage place where it stays until a dispatch order is received. When a dispatch order is released for the unit, it is sent to the final packing which is done with a wooden block and carton box.
There are some general observations about the process: The assembly line is manually operated and in each stage there are two operators
involved.
Pneumatic air gun is used in the stations to fix the bolts and nuts.
There are two testing bays for one assembly line. In this two compressor units are tested at a time in one testing bay, because the takt time for one unit is 28 mins.
.

32(58)
4.2.1 VALUE STREAM MAPPING:
As mentioned earlier, this method is a first step for operations in the assembly lines to visualize the wastes involved and non value added activities. Initially, for this mapping, a product family is selected. The product family chosen for the study is “Small Electric Power Screw Air Compressor’ (SEPSAC), because this product has more no of local suppliers than the other products. So we decided to start work on this product family to achieve better results. In ELGI, the selected product family has to assemble eighteen, units/day, which is considered to be a product with a demand in the market. The VSM is carried out from the initial material inward from the local supplier end, all assembly stages, sub-stage, testing duration and final packing. In this block the value added times are the time for assembling process and NVA is the time which it waits from one stage to another stage. The total number of operators involved in the assembly line is 9 in assembly section and 3 in testing bay and available time is 10 hours/day, the actual throughput time is 252 mins. Let the schematic VSM for this SEPSAC model no E22-75 is shown below:

33(58)
Figure (4.2): Current State Value Stream Mapping

34(58)
4.2.2 SUPPLIER VALUE STREAM MAPPING:
Initially the production planning is done by the experts in planning department. The future planning for production is done for one + two months tentatively. The purchase order is prepared and it is given to the regular supplier. For this case study, I have chosen five local suppliers for the assembly of selected family products (SEPSAC). The five local suppliers are SAMRAJ, SRI KRISHNA ENTERPRISES, SRI BHAVANI, SKY INDUSTRIES and SRI RANG. Each Supplier has different RPL time. The finished products are delivered by the suppliers to the company as per RPL time. The products are received from all the local suppliers, regional suppliers and outward suppliers, then goods receipt note (GRN) is generated and the products are transferred to the inventory store. Finally the assembly of compressors is done and tested. The supplier value stream mapping is shown below,

35(58)
Figure (4.3): Supplier Value Stream Mapping
36(58)
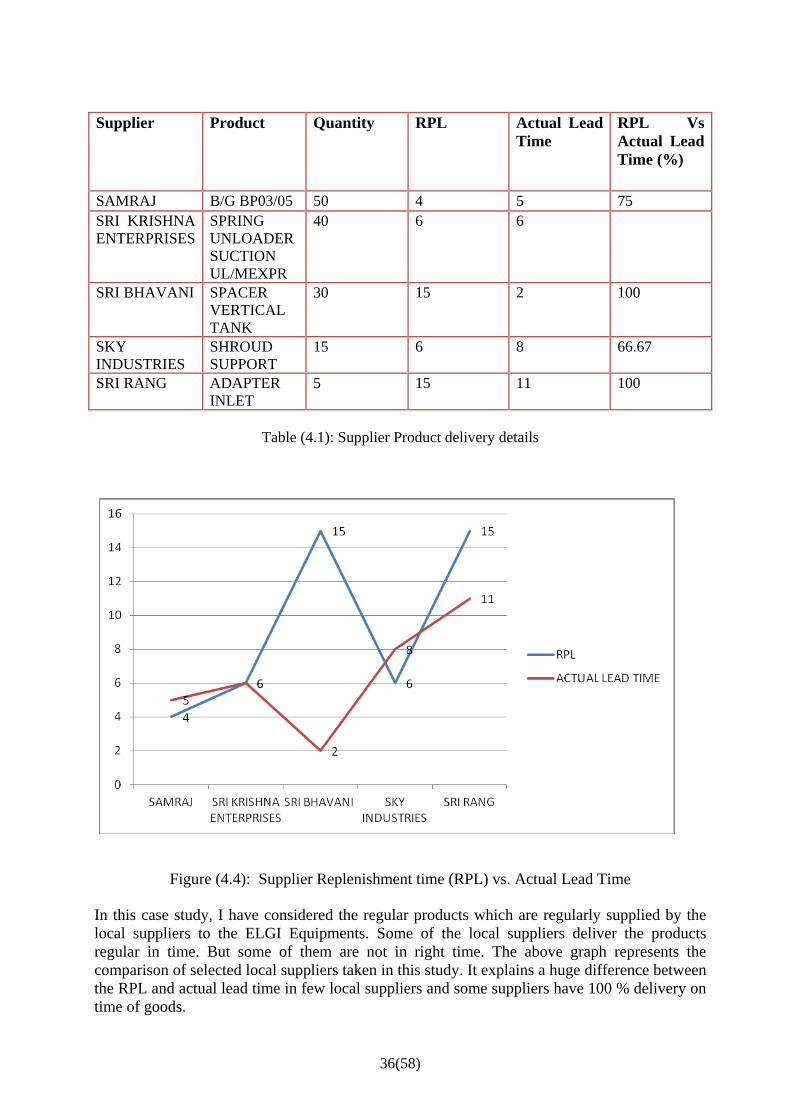
Supplier Product Quantity RPL Actual Lead
Time RPL Vs Actual Lead Time (%)
SAMRAJ B/G BP03/05 50 4 5 75 SRI KRISHNA ENTERPRISES
SPRING UNLOADER SUCTION UL/MEXPR
40 6 6
SRI BHAVANI SPACER VERTICAL TANK
30 15 2 100
SKY INDUSTRIES
SHROUD SUPPORT
15 6 8 66.67
SRI RANG ADAPTER INLET
5 15 11 100
Table (4.1): Supplier Product delivery details
Figure (4.4): Supplier Replenishment time (RPL) vs. Actual Lead Time
In this case study, I have considered the regular products which are regularly supplied by the local suppliers to the ELGI Equipments. Some of the local suppliers deliver the products regular in time. But some of them are not in right time. The above graph represents the comparison of selected local suppliers taken in this study. It explains a huge difference between the RPL and actual lead time in few local suppliers and some suppliers have 100 % delivery on time of goods.

37(58)
4.2.3 FLOW PROCESS CHART (FPC):
From the VSM we know the cycle time, value added time and non-value added time for visualize our process. Another way of visualizing the selected assembly line process is Flow process Chart (FPC). By using FPC chart we can make some more good improvements for the station and by this we can identify and change or eliminate the wastages, which are not added a value to the end product. By using FPC tool we can visualize more precisely and gather detailed information of the work process. The FPC for our current SEPSAC model according to the process description is:

38(58)
Figure (4.5): FPC

39(58)
From the above process flow chart figure 4.5, we have all the elements of the process duration and we can see which activity will take high time and which process take less time to finish the product assembly. By this tool we can freely study the reason of non value added time in our VSM and can come up with the solutions for them. In this chart all the delays through transportation and waiting time are mentioned as Non value added to our process and from this, we should try to eliminate these NVA’s from our assembly line for a better outcome and higher productivity. Another view of Flow Process Chart is the one shown in a table below in which we can have some extra information carried out for our assembly line process which helps to view better and analysis of our process. Here we can see the same process that involves in the FPC table in Table:

40(58)
Table (4.2): FPC
ID Activity Symbol Time(in minute)
Operator VA/NVA/NVABN
Note
1 Moving to stage1 through lift truck
NA 1 NVABN
2 Fitting control panel and dissembling fabrication unit(canopy)
22 2 VA
3 Waiting to go stage2
3 NVA
4 Moving to stage2
NVABN
5 Sub-station 1, assembling motor and crank shaft
1 VA
6 Moving to main assembly line
NVABN
7 Fitting assembled motor unit in canopy base
25 1 VA
8 Delay in assembling in stage2
10
NVA
9 Moving to stage 3 NVABN
10 Sub-station 2, tank assembly
1 VA
11 Moving to main assembly line
NVABN
12 Fitting assembled tank in canopy
35 1 VA
13 Waiting to go stage 4 20 NVA 14 Moving to stage 4 NVABN
15 Sub-station, cooler assembly
1 VA
16 Moving to main assembly line
NVABN
17 Fitting assembled cooler in canopy
45 1 VA
18 Waiting to go stage 5 NVA 19 Moving to stage 5 NVABN
20 Final assembly, fabrication unit
25 1 VA
21 Moving to testing, inventory
NVABN
22 Storing until the turns comes
NVA
23 Moving to testing bay NVABN
24 Testing/Inspection 60 3 VA
25 Moving to store the unit NVABN
26 Storing until the dispatch order release
NVABN
27 Moving & Packing the unit 60 VA 28 Waiting for dispatching NVABN 29 Dispatching to customer NVABN

41(58)
In this table next to the elements such as activity in the full process flow are, symbols for those job description, time duration, number of operators, from the concept of lean and finally notes. At this juncture we can divide jobs as Value Added (VA), Non Value Added (NVA) and Non Value Added but Necessary (NVABN). The last column Note is for the note given or taken from the experts and improvement team members during the project meeting hours. The improvement process usually will lead to eliminate the NVA and reduce the NVABN items by using successive lean tools to eliminate waste and reduce inventory storage.

42(58)
5. ANALYSIS & SUGGESTED IMPROVEMENTS 5.1 ANALYSIS:
5.1.1 ENERGY AND NOISE ANALYSIS
This chapter will discuss about the perspective of energy usage in the assembly line and noise level in testing bay. Here we will start the description process from the view of energy point and then we discuss the ENVSM and EFPC at the end. Before going through the process description we talk about the limitation and situation of the company where the energy analysis is prepared. The aim of our study is to analysis the energy consumption of each assembly stage and noise level in the testing bay. To achieve this kind of data’s we need to have the measurement tools like energy meter or electricity meter to find the energy consumption in each stage and sound level meter to identify noise level. But in ELGI these types of tools was not available and so they didn’t have any sufficient information about the energy consumption in each stage. In each stage they use a pneumatic air gun to tightened bolt and nut. In the testing bay they inspect the compressor unit for about an hour; there they check the efficiency of the compressor unit and wont check the noise level. There is not any information concerning total energy used in each stage and in the testing bay for a month or restricted time duration, they just have the full energy consumption of the firm, which was not useful for our analysis. Due to this we used variable “E” and the name of the stage instead of the amount of energy which is used in each stage and their activities in each process, for instance “Eair1” for energy used in pneumatic air gun in first stage.
5.1.2 PROCESS DESCRIPTION BY ENERGY AND NOISE POINT OF VIEW:
In the first phase, the canopy is brought through the lift truck to the stage 1 with a manually operated lift truck, energy calculation is not necessary for this phase. In the first stage, canopy top and bottom covers are removed and control panel is fixed with the pneumatic air gun “Eair1” Energy in KW. Then motor and crank shaft is connected in sub stage 2 and transfer through overhead crane to stage2 “Eair2” and “Ecrane1” KW energy respectively. In this, the assembled motor and crank shaft is fitted in canopy “Eair3” KW energy. After fixing the assembled motor and crank in canopy base, it manually transfer to the next stage where the tank is assembled with air gun in sub stage “Eair4” KW energy and transfer to main stage 3 with over head crane “Ecrane2” KW in energy. In stage 3 the tank is connected with crank in canopy base “Eair5” kW energy. Then it transfer manually to next stage, stage 4 have sub stage where the cooler is assembled “Eair6” kW energy and moved to main stage with crane “Ecrane3” kW energy. Cooler is fitted in canopy base with air gun “Eair7” kW energy.

43(58)
In stage 5, they give connection to motor and cooler from the control panel and assembled the top and side covers of canopy with air gun “Eair8” kW energy. The total energy consumed during testing is can be calculated as “E tot” kW energy and to calculate the noise level in testing bay “E noise” dB is used. Once testing is done and it moves to finished goods inventory store, where the energy is not necessary to calculate, because it transfers manually.
5.1.3 ENVIRONMENTAL VALUE STREAM MAPPING:
According to ENVSM introduction and description we tried to draw the energy value stream mapping for the SEPSAC assembly line process. The step up progress we made to the ENVSM is that used the up line for visualizing the amount of energy used during the assembling process and the bottom line used two variables, such as E1 and E2. E1 shows total value added energy during the complete assembly duration, which is highlighted in green color. E2 represents the total non value added energy which is used during the complete assembly duration, which is highlighted in red color. Mostly the time loss is because of more waiting time from one station to another station. VSM and EVSM visualize the wastages, more inventories and unwanted production. Here in the company, they face problem in fixing the component in right time, since there is no high productivity tool to make faster their job. To improve this Kaizen has to be implemented and there should be continuous process flow check. In support of this a detailed EVSM is shown in figure. In this EVSM, kaizen is approached where ever it required and a supermarket is added for leveled inventory storage. For leveling and reducing the inventories, a two bin system and milk is recommended in the EVSM. But for the energy and environmental calculation the company has not have sufficient data to project the unwanted energy loss. However in the EVSM, we map the energy value added and non value added in terms of E1 and E2 respectively. This improvement is applicable to other Environmental Value Mapping tools like packaging, chemical disposal and materials used.

44(58)
Figure (5.1): Current State Environmental VSM
45(58)
The above diagram represents the ELGI Equipment current state environmental value stream mapping. In all assembly stages and sub assembly stages, the company uses pneumatic pressurized air gun for tightening the bolt and nuts. Hence this acquires more usage of environment energy all over the day. At present, the assembled compressors are inspected in testing bay. Each compressor is tested for about one hour. Hence it consumes more electricity in this stage. Therefore the combination of these two stages makes more environmental wastage. We can observe more noise due to testing of compressors. Thus these all makes more harm to the environment.

46(58)
Figure (5.2): Future State Environmental VSM

47(58)
This tool helps us to visualize how much energy waste takes place during the entire process through comparing the value added and non value added activities. With the help of more value added activities, customers will get high satisfactory. Although the regular VSM we cannot find the full root cause for the wastages or just having the improved EVSM. Hence in the next phase we shown a schematic representation of Environmental Flow Process Chart (EFPC), which will give more detailed about the process involves in the assembly line. By this we can come out with some appropriate improvements.
5.1.4 ENERGY FLOW PROCESS CHART (ENFPC):
In this section we will use a new tool for visualizing the assembly line process in a way that the exact jobs which made waste to our process from energy consumption point of view become clear. Flowchart will describe the amount of energy used in each stage and in each process, the value added or non value added is calculated in terms of energy used. Improvements are carried out by changing or reducing the process activities, in a way that they can use less energy or if it is possible to remove those activities by implementing regular following lean system or changing the technology to improve the efficiency and try to reduce the inventories in all level. In the below figures, we can see the ENFPC chart and then the pertinent table to the chart.

48(58)
Figure (5.3): ENFPC

49(58)
Table (5.1); ENFPC
ID Activity Symbol Time(in minute)
Operator VA/NVA/NVABN Energy
1 Moving to stage1 through lift truck
NA 1 NVABN NA
2 Fitting control pannel and dissembling fabrication unit(canopy)
22 2 VA Eair1 kW
3 Waiting to go stage2
3 NVA
4 Moving to stage2
NVABN
5 Sub-station 1, assembling motor and crank shaft
1 VA Eair2 kW
6 Moving to main assembly line
NVABN Ecrane1 kW
7 Fitting assembled motor unit in canopy base
25 1 VA Eair3 kW
8 Delay in assembling in stage2
10
NVA
9 Moving to stage 3 NVABN
10 Sub-station 2, tank assembly
1 VA Eair4 kW
11 Moving to main assembly line
NVABN Ecrane2 kW
12 Fitting assembled tank in canopy
35 1 VA Eair5 kW
13 Waiting to go stage 4 20 NVA
14 Moving to stage 4 NVABN
15 Sub-station, cooler assembly
1 VA Eair6 kW
16 Moving to main assembly line
NVABN Ecrane3 kW
17 Fitting assembled cooler in canopy
45 1 VA Eair7 kW
18 Waiting to go stage 5
NVA 19 Moving to stage 5 NVABN
20 Final assembly, fabrication unit
25 1 VA Eair8 kW
21 Moving to testing, inventory
NVABN
22 Storing until the turns comes
NVA
23 Moving to testing bay NVABN
24 Testing/Inspection 60 3 VA Etot kW
25 Moving to store the unit NVABN
26 Storing until the dispatch order release
NVABN
27 Moving & Packing the unit 60 VA 28 Waiting for dispatching NVABN 29 Dispatching to customer NVABN NA

50(58)
Here we can see the time loss due to transportation delay and more waiting time. The non value added activity is shown is red and calculated as energy waste as their pertinent activities like waste of time and manpower as well. According to lean principle, it is used to eliminate unwanted waste, reduce manpower, and reduce non value added activities and last energy. By eliminating all these waste it should act as an eco friendly to human and as well environment. This is the main objective in Environment assessment.
According to the two visualization tools which shown above and the help of lean philosophy and having environment assessment data, we can show improvements to the company, by means of reducing time in assembly line, reduce inventories and maintaining leveled inventories in the shop floor, eco friendly packaging and finally the less energy consumption.
5.2 SUGGESTED IMPROVEMENTS:
5.2.1 GENERAL IMPROVEMENT:
The main general problem that company currently facing in material handling and large amount of inventories throughout the assembly line. For this reason, the area which is used to store the materials requires large no of lights and it consumes more energy and cost. There is less no of ventilator which gives high heat intensity to environment. To reduce this there should be a low consumption light facilities and place a ventilator where ever it required. On the other hand, as per the production in assembly line, material handling should be leveled. Once the material handling is leveled then the area it takes is less when compare to the older one. In this case, it consumes less no of lights and ventilation. Initially they should form a team and assign a project, to calculate the energy consumed in each stage and try to automate the assembly line to increase production rate to face the competitive market. In developed nations like Sweden, German and United States of America, they focusing their production in environmental friendly. They working on to find root cause for the pollution and inventing new technologies accordingly to the friendly nature. Like this in India as per my concern no one has started working for friendly nature. Company has to work on this and be a friendly to nature.
5.2.2 STUDIED PROCESS IMPROVEMENTS:
By using our FPC chart and table we can locate where the waste occur thro comparing lean techniques. According to Liker, in Toyota he mentioned about 7 wastes which can be avoided by using lean techniques and Kaizen, for continuous process improvements.
1. Excess inventory: in compressor assembly we have large no of components like standard and non-standard items procured, we have excess inventory.
2. Waiting: in FPC chart we can see the waiting time in assembly line, where it happens and why it happens. This is because of lack in advanced tools used in the assembly process. The time taken for the assembly process is not matched with takt time which calculated as per the daily requirement.

51(58)
3. Over processing: in each stage there are more no of activities taking place to complete the assembly process.
4. Transportation: any movement from one place to another is waste but some time it could be a necessary one. According to our FPC chart, the transportation from one stage to another is necessary but transferring often to inventory store is unwanted. For this we should forecast more accurate and improve flow of supply chain.
We can see the detailed energy consumption in FPC chart. In that the customer point of view, efficiency of energy won’t be a value added one, because they don’t know the advantage of eco friendly manufactured product. To achieve this some of the activities could be change or should be modifying in the assembly line. Before going to that, we see the activities which consume the most energy,
1. Energy used in overhead cranes to transport from sub stage to main stage.
2. Energy used in pneumatic air gun to tightened bolts and nuts.
3. Energy used in testing bay and the pollution discharge to air.
For above stated statements, the suggested improvements are.
1. The electric air gun can be used instead of pneumatic air gun; this saves more energy all over day.
2. In testing bay, the cold testing, random testing of compressors techniques can be implemented to reduce time and reduce environment wastage.
5.2.3 LEVELLING INVENTORY:
For this, a suitable technique is two bin system, milk run, sequencing and JIT. These tools will reduce more inventories and helps to cut the cost of the product.
5.2.3.1 TWO BIN SYSTEM:
Two bin system is modeled based on the current procurement system. As we mentioned supermarket in improved EVSM, is the starting point of two bin system. Where the one bin gets empty there should be a manual or automatic triggering system to generate a report to place an order for a new bin. The generated report should send to the suppliers through the buyers. Buyers will actively follow up with suppliers to get back the component in their calculated replenishment time. Once the inward store receives the material from the suppliers they should make a receipt of it and they have to re-fill the empty bin and send to the assembly line or to the supermarket.

52(58)
Figure (5.4): Suggested Two Bin System
5.2.3.2 MILK RUN AND JIT:
As we all know milk run is used for multiple pickups in a regular schedule and just in time is for transporting the amount of components needed for the shop floor and at the required time, it all happens in the shortest possible lead time. For this we frame the criteria and ordering pattern by adding certain terms and conditions which were discussed with the company supervisor.
5.2.3.2.1 CRITERIA FOR MILK RUN AND JIT:
The components which should add in the Milk Run system are Standard items
and large size components.
For this replenishment (RPL) time is set for the component not later than one week’s time. It should be calculated accordingly to the product and its size.
The company should know the exact supplier capacity, to order the correct amount and this should be applied on local suppliers.
An ISO certified supplier should be selected for component purchasing.

53(58)
5.2.3.2.2 ORDERING PATTERN FOR MILK RUN AND JIT
Milk Run and JIT should work on the accurate forecast and should be using a
trigger based collection.
There should be proper communication between stores, purchasing department and supplier.
The main person who deals ordering the component and following up is the buyer. The buyer will contact the supplier and if it needed he/she should visit the supplier end and check the quality of production.
The purchase order should be released as an open annual purchase order to the supplier end, because based on the annual purchase order the supplier will plan their production schedule. Basically in India the suppliers won’t purchase the raw materials from the month of mid February to April end due to year end and less availability of raw material.

54(58)
6. CONCLUSION
In the recent year’s lean and green production techniques has become a major important topic in the manufacturing field for getting better results. For future generations there is great need for economic, environmental and social sustainable society in the manufacturing industries. There is a need for visualizations tools for analyzing the supply chain and the manufacturing system. By implementing these visualization techniques like FPC, VSM and EVSM/ENVSM, we can reduce cost as well as identify and eliminate green and lean waste for a sustainable society. In this thesis i have chosen a case study to analyze the whole process using visualization techniques for a better outcome. In this case study FPC, VSM and EVSM/ENVSM tools have been used to identify the wastages which occur in the selected assembly line. By implementing these techniques the case company can reduce environmental waste, reduce energy consumption and material waste. RQ 1: In what ways can the supply chain process be improved by means of efficiency, reduced lead time, reduced resource use and reduced operating cost? By using lean tools such as 5S, JIT, and material handling tools like two bin, milk run, sequencing, and kitting we can improve the supply chain process and can reduce lead time. By implementing VSM as a visualization tool in the whole process i identified the problems faced in the each process or each assembly stage. After analyzing the identified problems in each stage they can be resolved by using lean techniques. In this case study for reducing lead time, the preferred solution is to implement JIT and a pull system in the assembly line. For reducing resource level, reduced operating cost and increasing the efficiency of the assembly line, the preferred method is JIT, Milk Run, Two bin systems. Also to improve resource use on the line, pneumatic air gun could be replaced by electric tools and cold testing and random full testing of compressors could be investigated for the future. RQ 2: How does lean production system implementation helps the Indian manufacturing Industries? At present in India, the main problems faced by the company are,
1. There is not much awareness regarding lean technologies. 2. Lot of small scale industries is mainly involved in manufacturing sector. 3. Lack of knowledge to the employees and organization about the latest tools available in
the present era. 4. The main problem is investing a lot of money for implementing these techniques for
small scale industries.
The Indian manufacturing industries can be developed by creating awareness about the implementation of lean production system. This helps to increase the productivity, quality, reduced inventory, cost reduction, reduction of wastage and recycling of waste makes better environmental to the society.

55(58)
RQ 3: What are the possibilities to use EVSM in Indian industry where there is low availability of environmental data? The developing countries like India, the manufacturing industries are facing many problems regarding energy resources. Due to high consumption of energy, release of toxic gases into atmosphere and releasing polluted water into water bodies like seas, rivers, lakes etc. The excess wastes from the industry are not properly recycled, and they don’t do the disposal in a right way. Hence, by implementing EVSM tool in Indian manufacturing industries, will provide a better solution towards environmental aspects. The manufacturing industry can reduce water pollution, air pollution, land pollution and apart from that, companies may reduce the consumption of power during manufacturing process.

56(58)
7. Recommendations: 1. In current situation, the companies are not using the measuring tools in the field of
energy, this makes a way for deficient in gathering of information about the energy used in the production process. The government could make necessary steps/ actions for implementing the monitoring system for energy consumption in each process; this would result in reduction of energy consumption of the organization. And also they could make an analysis of consumption of electricity for specific time interval.
2. The company management should take some initial steps to gain knowledge about the lean and green tools and also to create a better way for implement/ practicing these tools in the manufacturing sectors. The government should make join hand with the manufacturing industry to create a awareness, educate and provide proper training to the employees regarding the latest techniques/tools that are followed by the developed nations.
3. The government should provide fund/ support the Indian university and manufacturing companies to initiate research work on these latest techniques. This makes the Indian manufacturing sectors in a rapid growth towards the international values.

57(58)
References APICS (2007), APICS dictionary, 12. Bryman, A. and Bell, E., 2003. Business Research Methods, Oxford University Press. Coughlan, P. & Coghlan, D., 2002. International Journal of Operations & Production Management, 22(2), pp.220-240. EPA, 2011. The Lean and Chemicals Toolkit EPA, 2007a. The Lean and Energy Toolkit. Energy, p.56. EPA, 2007b. The Lean and Environment Toolkit, US EPA. EPA, 2006. Lean and Environmental toolkit EPA-100-K-06-003. European Commission Environment, (2011) Integrated Product Policy (IPP). Available at: http://ec.europa.eu/environment/ipp/ [Accessed April 28, 2012]. Xiaojin Qiu, Xiaoxia Chen (2009) Evaluate the environmental impacts of implementing lean in production process of Manufacturing industry, CHALMERS UNIVERSITY OF TECHNOLOGY Gandhi, N.M., Selladurai, & V.,m Santhi, P. (2006). Green productivity indexing. A practical step towards integrating environmental protection into corporate performance, International journal of productivity and performance management, 55, 594-606. Graham, B.B., 2004. Detail process charting: speaking the language of process. Hart, C., 1998. Doing a Literature Review: Releasing the Social Science Research Imagination, 1st ed. SAGE publications, London, UK. Hines, P & Rich, N. (1997). The Seven Value Stream mapping tools, International Journal of Operations & Production Management, Vol. 17, No.1. Jones, & Womack, J. (2000). Seeing the whole: Mapping the extended value stream, Lean enterprise institute. Jonsson, (2008) Logistics and Supply Chain Management, McGraw-Hill Education (UK) limited. Karin Romvall, Martin Kurdve, Monica Bellgran and Joacim Wictorsson, (2011), Green Performance Map – An Industrial Tool for Enhancing Environmental Improvements within a Production System, 18th CIRP International Conference on Life Cycle Engineering, 2011, Germany

58(58)
Liker, J.K., 2007. The Toyota way: 14 management principles from the world’s greatest manufacturer, McGraw-Hill Professional. Martin Kurdve, Per Hanarp, Xiaoxia Chen Xiaojin Qiu, Yan Zhang, Johan Stahre, Jonas Laring, 2011(a). “Use of environmental value stream mapping and environmental loss analysis in lean manufacturing work at Volvo.” In Proceedings of the 4th Swedish Production Symposium 2011. Lund, Sweden. Kurdve, Martin, Karin Romvall, Monica Bellgran, and Emma Torstensson. 2011(b). “A Systematic Approach for Identifying Material and Logistics Efficiency Potentials in Assembly.” In Proceedings of the 4th Swedish Production Symposium 2011. Lund, Sweden. Monden, Y. (1993). Toyota Production System: An integrated Approach to Just-in-Time, Industrial Engineering and Management, Norcross, GA. Pavnaskar, S.J., Gerhensony, J.K, & Jamvekarz, A.B (2003). Classification scheme for lean manufacturing tools, International Journal of production and research, 41, 3075-3090. Pojasek (2008), Quality toolbox, framing your lean-to Green Effort, Environmental Quality Management. Robert K. Yin, 2003. Case Study Research: Design and Methods. Applied Social Research Methods Series. Vol.5, 3rd Ed. New Delhi: Sage Publications Rother, M. & Shook, J. (2003). Learning to see: Value stream mapping to create value and eliminate muda, The Lean Enterprise Institute, Inc. Cambridge, United Kingdom. R.O.Mohanty, O.P.Yadav & R.Jain.(2007) Implementation of Lean Manufacturing Principles in Auto Industry. In proceedings of India in the Emerging Global Order at Xavier Institute of Management, Bhubaneswar. India. Schmidt, M. et al., 2007. Energy and material stream mapping. Recovery of Materials and Energy for Resource Efficiency. Davos, 7, p.3–5. Seth, D., & Gupta, V. (2005). Production planning and control, 15, 44-59. Sumila Gulyani. Effects of poor transportation on Lean Production and Industrial Clustering: Evidence from the Indian Auto Industry. The World Bank, Washington DC, USA. Womack, J.P. & Jones, D.T. (2003). Lean thinking, New York. Wu, Y.C. (2003). Lean manufacturing: a perspective of lean suppliers, International journal of operations and production management, 23, 1349-1376.