Gardens of Forking Paths: Notes on Architecture's Ingenious ...
Upload
khangminh22Category
view
1download
0
Article
Correlations between Spatial Attributes and Visitor Stayin Chinese Gardens: A Case Study of the Ningbo TianyigeMuseum Gardens
Jia Yu 1 , Takashi Yokota 1, Emiko Itami 1 and Jing Yang 2,*
�����������������
Citation: Yu, J.; Yokota, T.; Itami, E.;
Yang, J. Correlations between Spatial
Attributes and Visitor Stay in Chinese
Gardens: A Case Study of the Ningbo
Tianyige Museum Gardens. Urban Sci.
2021, 5, 74. https://doi.org/10.3390/
urbansci5040074
Academic Editor: Jesús
Manuel González Pérez
Received: 25 August 2021
Accepted: 23 September 2021
Published: 1 October 2021
Publisher’s Note: MDPI stays neutral
with regard to jurisdictional claims in
published maps and institutional affil-
iations.
Copyright: © 2021 by the authors.
Licensee MDPI, Basel, Switzerland.
This article is an open access article
distributed under the terms and
conditions of the Creative Commons
Attribution (CC BY) license (https://
creativecommons.org/licenses/by/
4.0/).
1 Laboratory of Architectural and Urban Ergonomics, Division of Global Architecture, Graduate School of Engineering,Osaka University, Suita 565-0871, Japan; [email protected] (J.Y.);[email protected] (T.Y.); [email protected] (E.I.)
2 Institution of Architectural History & Theory, School of Architecture, Tianjin University, Tianjin 300072, China* Correspondence: [email protected]
Abstract: Despite the growing popularity of Chinese gardens, few studies have explored Chinesegarden tourism and the relationship between garden space and visitor behavior. Addressing thisgap, this study examines the correlations between spatial attributes and visitor stay distributionin the Ningbo Tianyige Museum gardens. This study divided the garden space into twenty unitsacross four types—water, architecture, veranda, and rockery—and identified spatial attributes usingmeasurements and configurational calculations. Visitor stay data was comprised of 1061 cases witha stay interval of more than 30 s in three investigation periods. Results produced three primaryfindings. First, architecture and water spaces had the highest visitor stay density, followed by verandaspace and then rockery space. Second, there is a correlation between visitor stay density and sixspatial attributes: integration, choice, width, length, enclosure ratio, and seating. Third, althougheach type has distinctive attributes, they can be divided into two groups: (1) spacious and highlyaccessible open spaces (water and architecture types); (2) long narrow spaces with low accessibilityand abundant seating facilities (veranda and rockery types). By exploring the relationship betweenChinese gardens and modern tourism, this study provides valuable insights and suggestions for theplanning and management of Chinese garden tourism.
Keywords: Chinese garden; spatial attributes; visitor stay; correlation; Tianyige Museum; tourism
1. Introduction1.1. Background
There is a long tradition of visiting gardens in China. In ancient times, Chinesegardens satisfied people’s desire for natural landscapes while serving various recreationaland spiritual functions. While imperial and private gardens were built to entertain theelite [1], temple gardens [2] and suburban landscape gardens [3] were easily accessibleby the public. However, following the Taiping Rebellion in the mid-nineteenth century,many traditional Chinese gardens gradually declined and fell into disrepair [4]. Scholarsbegan mapping and documenting existing gardens from the first half of the twentiethcentury [5–8]. These gardens were gradually restored and opened to the public since thefoundation of the People’s Republic of China in 1949. Contemporary practices of Chinesegardens, such as people’s parks, began flourishing with the nationwide greening movementfrom 1956 [9–11] and the design of many public and cultural buildings incorporatedelements and features of Chinese gardens [12–14]. With the flourishing garden culture,Chinese gardens regained their popularity, recently emerging as a significant feature ofChinese tourism and urban life.
Urban Sci. 2021, 5, 74. https://doi.org/10.3390/urbansci5040074 https://www.mdpi.com/journal/urbansci

Urban Sci. 2021, 5, 74 2 of 30
1.2. Literature Review
Traditional Chinese gardens now face the dual challenge of opening to the public whileprotecting and conserving the garden and its history. In the realm of heritage conservation,some studies on Chinese gardens have traced the historical development of gardens andevaluated their current conservation status [15–17]. Studies on world garden heritagehave also paid attention to the development and utilization of garden heritage, such ascontemporary landscape and public space design [18–20]. Research on visiting gardens,parks, and green spaces can be divided into two categories: visitor experience or preference,and visitor behavior.
Chinese gardens offer a unique concept of the garden experience [21]. The finalchapter of Yuan Ye—the seventeenth-century treatise on Chinese garden design—whichdeals with “borrowed scenery,” provides the best description of visiting a Chinese gardenin great detail with imaginative and poetic language [22,23]. Modern scholars like TongJun and Chen Congzhou have examined various aspects of the garden experience. Tongemphasized the importance of the garden owner’s taste [5], and Chen juxtaposed the songlyrics with garden photography [24,25]. More broadly, research on garden experienceshas examined a variety of factors, including visual [26,27], auditory [28], walking andsensory [29,30], literary and associative [31], and other physiological and psychologicalresponses [32]. Some studies have also examined experiences in Japanese gardens [33,34].Recently, space syntax theory has been applied in the analysis of complex configurations ofgarden space and experience [30,35–37].
Research on visitor preference has been widely applied to evaluate landscapes, parks,and green spaces. Research on visual preference includes landscapes and spatial ele-ments [38,39], as well as the aesthetic preferences [40] and the physiological and psycho-logical responses of participants [41,42]. Scholars have also examined preferences for typesof vegetation [43,44] and trees [45,46] in urban parks and green spaces.
Research on visitor behavior in gardens and urban parks can be classified accordingto the research purpose, namely, visitor study and environmental behavior study. Visitorstudy focuses on recording and analyzing visitor behavior to understand and capture thepsychological activities and visiting habits of visitors to, in turn, improve the spatial com-position, display layout, and tour route design. Quantitative visitor studies have employedtiming and tracking methods [47], as well as automated sensor-based positioning and track-ing methods [48]. Visitor behavior studies have investigated a variety of factors, includingviewing [49], stopping [50], walking [51], photographing [52,53], facial expressions [54],and external influence factors [55]. Meanwhile, environmental behavior study mainlydeals with human behaviors, psychological motivations, and environmental influencingfactors in a particular environment to improve environmental and behavioral design [56].Several scholars have investigated the use of public spaces in cities [57–59], while othershave explored visitor distribution and utilization in forests and urban parks [60–62]. Re-searchers have also identified the correlations between visitor behavior and environmentalfactors [63,64], as well as the behaviors of certain groups, such as the elderly [65,66] andlow-income groups [67].
Current studies on Chinese gardens have primarily focused on tracing their histor-ical development, as well as the spatial composition and artistic conceptions of gardens.However, few studies have explored the utilization of Chinese gardens as public spacesfor tourism and recreation [68–70]. Moreover, as urban parks and green spaces becomemore popular for recreation [71,72], Chinese gardens may become the preferred spaces oftraditional Chinese society [18]. This preference has triggered the burgeoning developmentof Chinese garden research and construction practices, underscoring the value of this study.

Urban Sci. 2021, 5, 74 3 of 30
1.3. Research Aim and Objective
The overall aim of the study was to identify the openness of the garden space inNingbo Tianyige Museum and its attractiveness to visitors. The openness of gardenspace primarily depends on spatial attributes, such as dimension, form, scale, accessibility,visibility, functions, and facilities, and it can be assessed based on the way in whichvisitors utilize the garden space [20]. The analyses focused on the following three researchproblems:
1. What are the spatial characteristics of Tianyige Museum gardens with different spatial types?2. How are the visitor stays distributed in the Tianyige Museum gardens?3. Which spatial attributes have an impact on the visitor stay preferences?
Therefore, the main objectives of this study were to (1) analyze the spatial elementsand composition of Tianyige Museum gardens; (2) quantitatively analyze the distributioncharacteristics of visitor stay; and (3) examine the correlations between spatial attributesand visitor stay distribution. By exploring the new relationship between Chinese gardensand modern tourism, this study provides useful insights and suggestions for the planningand management of Chinese garden tourism. The findings of this study may also contributeto the utilization and development of both Chinese and East Asian gardens.
1.4. Research Structure
This paper is structured in five sections. Following this Section 1 introduction,Section 2 introduces the study area, identifies the spatial attributes based on measurementsand configurational calculations, and defines the methodology of the study, including thedata collection and data analysis methods. Section 3 presents the investigation results ofvisitor stay distribution and the analyses of correlations between spatial attributes andvisitor stay distribution in detail. Section 4 concludes the main findings and discusses thespatial characteristics of the Tianyige Museum gardens and influencing factors on visitorstay. Finally, the conclusions, suggestions, limitations and future research are presented inSection 5 (Figure 1).
Figure 1. Research structure and framework. Source: Own work.
Urban Sci. 2021, 5, 74 4 of 30
2. Materials and Methods2.1. Study Area: Ningbo Tianyige Museum Gardens
Tianyige Museum is located in Ningbo, Zhengjiang, China (Figure 2a–c). Featuringthe renowned Tianyige (Tianyi Pavilion), Tianyige Museum is dedicated to the art of bookcollecting and occupies an area of 34,000 m2. Originally built as the private library ofFan Qin during the Ming Dynasty (1368–1644), Tianyige is now the oldest private libraryin China.
Figure 2. The location of the study area: (a) Zhejiang province in China; (b) Ningbo city in northeastZhejiang province; (c) Tianyige Museum in Ningbo old town. Source: Own work.
Figure 3 presents the site plan of Tianyige Museum. The northern part of the museumis home to the former residence of the Fan family, the Tianyige group, and the new library;the central part of the museum contains the East Garden and the South Garden; while thesouthern part of the museum contains the Chen Ancestral Hall, the Qin Ancestral Hall, andthe Painting and Calligraphy Gallery. The garden area of the Tianyige Museum (hereinafter,Tianyige garden), which comprises both the East and South Garden, constitutes the researchobjects of this study. Although originally restored in 1959, the East Garden was redesignedseveral times and finally reconstructed between 1983 and 1986 under the supervision ofdesigner Chen Congzhou [73]. The South Garden was built west of East Garden in 1996,and it was designed as a courtyard with the ancient libraries of the Shuibei Pavilion andBaojing Hall relocated to South Garden for protection [74].

Urban Sci. 2021, 5, 74 5 of 30
Figure 3. The site plan of Ningbo Tianyige Museum is composed of eight architecture and gardengroups. The research object Tianyige garden includes East Garden (4) and South Garden (5). Source:Own work.
Chen Congzhou, the designer of East Garden, is a famous twentieth-century Chinesearchitecture and garden scholar [75,76]. Chen Congzhou began studying Chinese gardensin the 1950s and subsequently participated in the restoration of traditional gardens ofSuzhou, Yangzhou, and Shanghai in Southeast China. Over the next several decades, hedevoted himself to the investigation, research, restoration, and construction of Chinesegardens. Among his garden practices, the most famous are the restoration of Yu Garden inShanghai, the design of Nan Garden in Kunming, and the reconstruction of Shuihui Garden(Water Painting Garden) in Rugao, Jiangsu. Chen Congzhou had visited Tianyige Museummany times, and the East Garden was built under his careful guidance and supervisionfrom 1983 to 1986 (Figure 4). However, compared with his other garden practices, there arerelatively few studies on the East Garden.
Figure 4. Design manuscripts of East Garden by Lu Bingjie and Chen Congzhou of Tongji Universityin 1984. English version of the Chinese title: Overall Planning and Design of the Tianyige Museum.Source: Tianyige Museum. Adapted with permission from Ningbo Tianyige Museum (2021) Thedesigner of this picture is Chinese, and the original version is only in Chinese.

Urban Sci. 2021, 5, 74 6 of 30
Several factors influenced the selection of Tianyige garden as this study’s researchobject. First, Tianyige garden was designed following the classical style of the Tianyigegroup in the Ming Dynasty, and its scale is similar to that of other Jiangnan gardens—thatis, gardens in Southeast China. Compared with other Jiangnan gardens, there are fewstudies on Tianyige garden. Second, as it is not a historical heritage garden, Tianyigegarden is more open in terms of management and visitors can access the whole garden.Third, unlike the crowded visitor flow of famous gardens in Suzhou, the visitor flow ofTianyige garden is relatively moderate, which is in line with the garden capacity. Apartfrom ensuring a better visiting experience, a moderate visitor flow could provide reliableinvestigation data.
2.2. Spatial Analysis2.2.1. Spatial Elements of the Garden
In Figure 5, the main garden elements are marked with four different legends, and allbuildings and entrances are sequenced from 1 to 21. The triangle symbols mark the mainentrances of the two gardens. Regarding the four legends, the blue legend shows the pondor water, which occupies a large portion of the garden; the purple legend represents archi-tecture and pavilions; the green legend marks the rockery in the East Garden; and the redlegend marks the veranda, which protects and exhibits stone tablets in the courtyard wall.
Figure 5. Plan of Tianyige garden with garden elements. Sequence number from 1 to 21. Source: Own work.

Urban Sci. 2021, 5, 74 7 of 30
In regard to the numbers, Numbers 4, 5, 16, 17, and 18 are historical buildings, whichwere relocated to Tianyige Museum from other places in Ningbo for protection. Numbers4 and 17 are currently used to exhibit ancient inscriptions and local chronicles. Numbers 5and 18 are souvenir shops providing a space for short breaks. Number 16 is used as anacademic studio and is rarely open to the public. Numbers 2 and 9 are two larger stonestructures known as A Hundred Goose Pavilion and Eight Lion Pavilion, while Numbers10, 11, and 19 are three small pavilions. Numbers 3 and 21 are lavatories. Figure 6 showseight illustrations of the main elements in Tianyige garden.
Figure 6. Illustrations of main garden elements in Tianyige garden. Sequence numbers corresponding the elements inFigure 5. Source: Own work.
In terms of planting, camphor trees were planted on the original site of the EastGarden several decades before the garden was built and retained in the design of theEast Garden [73]. In addition to water and architectural features, the South Garden isalso decorated with trees. As the planting of trees was widely distributed across Tianyigegarden, they are not marked on the site plan.
Examination of the museum’s main tour route revealed the following. After enter-ing through the northwest museum gate—the main entrance—visitors pass through thenorthern part of the museum and enter the East Garden via entrance No. 1. Following thecompletion of their tour of the East Garden, visitors usually leave the garden via entranceNo. 12 or 13 and enter the southern part of the museum. Later, the visitors return to theSouth Garden via entrance No. 20 and pass through entrance No. 6 or No. 14 to enter thenorthern part of the museum, where their tour ends. Additionally, entrance No. 8 is animportant gate connecting the East Garden and South Garden.
2.2.2. Classification of Garden Space
According to the four main spatial elements presented in Figure 5—namely, water,architecture, veranda, and rockery [18,77]—accessible open space was classified into fourspace types per the influence of the nearest elements presented in Figure 7. Accessibleopen space mainly refers to the outdoor pavements and semi-open spaces, such as thatunder eaves and in verandas. Inaccessible space—such as water, vegetation, and rockeryhills—and the interior spaces of buildings are not included. The spatial diagrams of thefour types illustrate the relationship between the space and its nearest spatial elements.
Urban Sci. 2021, 5, 74 8 of 30
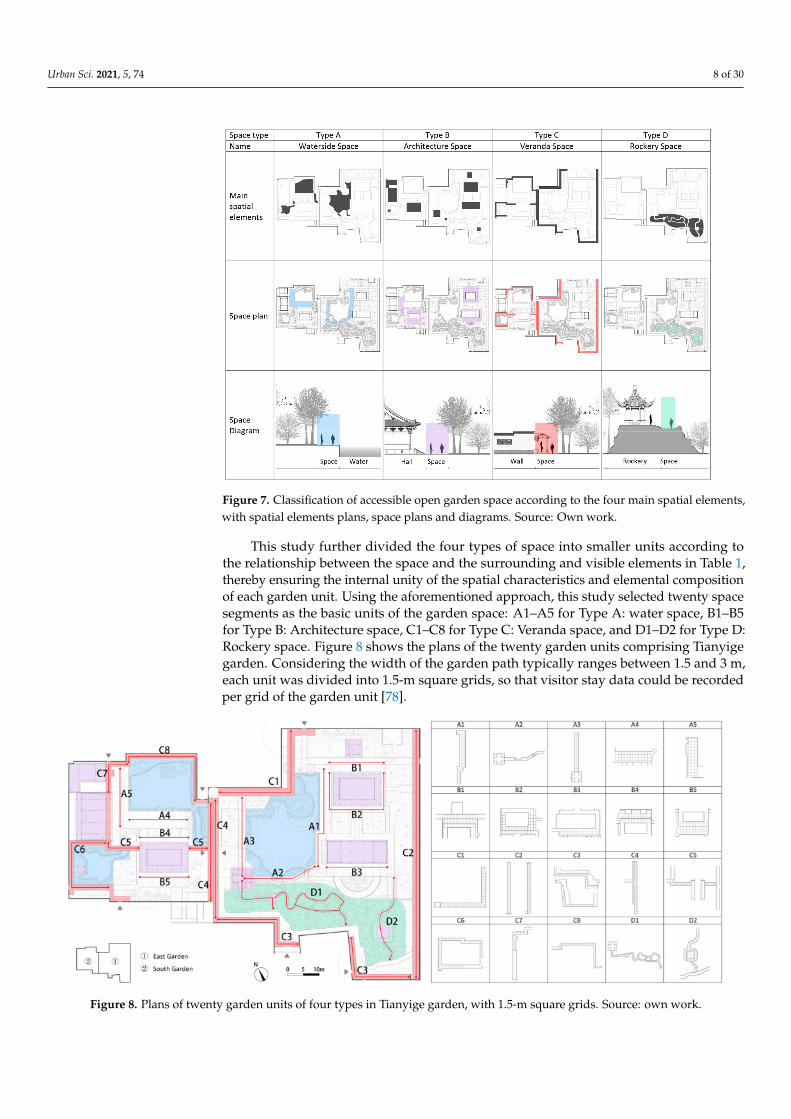
Figure 7. Classification of accessible open garden space according to the four main spatial elements,with spatial elements plans, space plans and diagrams. Source: Own work.
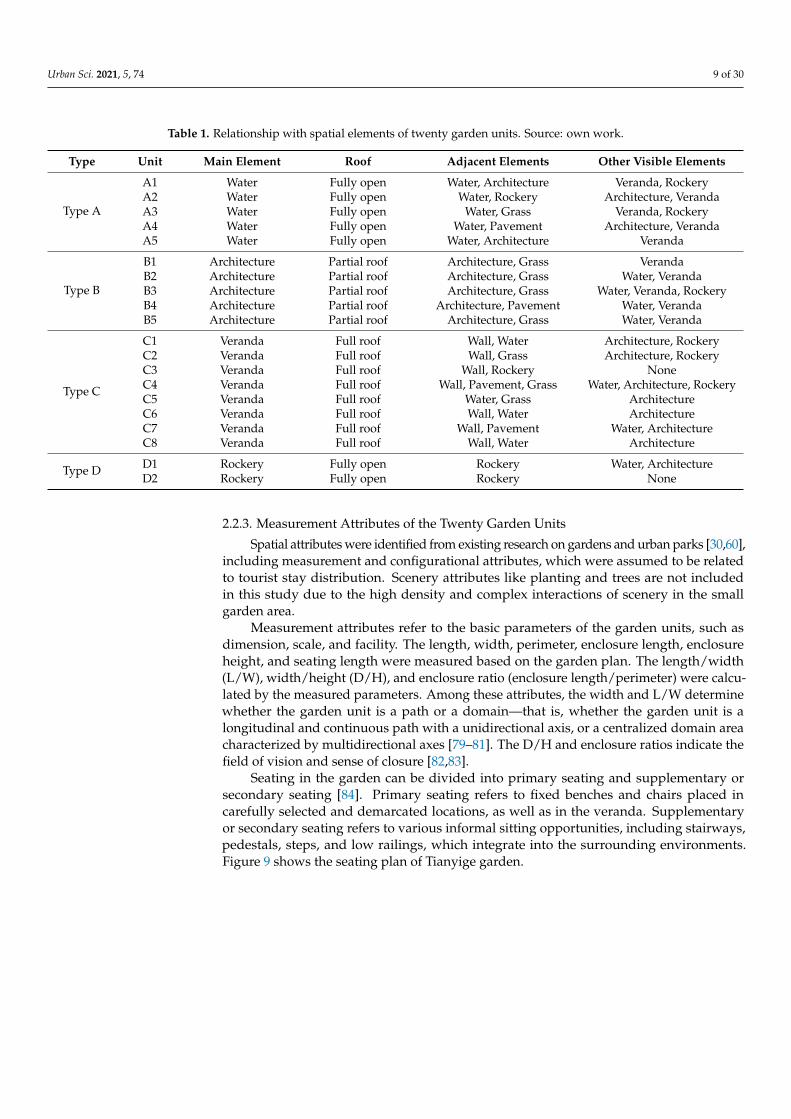
This study further divided the four types of space into smaller units according tothe relationship between the space and the surrounding and visible elements in Table 1,thereby ensuring the internal unity of the spatial characteristics and elemental compositionof each garden unit. Using the aforementioned approach, this study selected twenty spacesegments as the basic units of the garden space: A1–A5 for Type A: water space, B1–B5for Type B: Architecture space, C1–C8 for Type C: Veranda space, and D1–D2 for Type D:Rockery space. Figure 8 shows the plans of the twenty garden units comprising Tianyigegarden. Considering the width of the garden path typically ranges between 1.5 and 3 m,each unit was divided into 1.5-m square grids, so that visitor stay data could be recordedper grid of the garden unit [78].
Figure 8. Plans of twenty garden units of four types in Tianyige garden, with 1.5-m square grids. Source: own work.
Urban Sci. 2021, 5, 74 9 of 30
Table 1. Relationship with spatial elements of twenty garden units. Source: own work.
Type Unit Main Element Roof Adjacent Elements Other Visible Elements
Type A
A1 Water Fully open Water, Architecture Veranda, RockeryA2 Water Fully open Water, Rockery Architecture, VerandaA3 Water Fully open Water, Grass Veranda, RockeryA4 Water Fully open Water, Pavement Architecture, VerandaA5 Water Fully open Water, Architecture Veranda
Type B
B1 Architecture Partial roof Architecture, Grass VerandaB2 Architecture Partial roof Architecture, Grass Water, VerandaB3 Architecture Partial roof Architecture, Grass Water, Veranda, RockeryB4 Architecture Partial roof Architecture, Pavement Water, VerandaB5 Architecture Partial roof Architecture, Grass Water, Veranda
Type C
C1 Veranda Full roof Wall, Water Architecture, RockeryC2 Veranda Full roof Wall, Grass Architecture, RockeryC3 Veranda Full roof Wall, Rockery NoneC4 Veranda Full roof Wall, Pavement, Grass Water, Architecture, RockeryC5 Veranda Full roof Water, Grass ArchitectureC6 Veranda Full roof Wall, Water ArchitectureC7 Veranda Full roof Wall, Pavement Water, ArchitectureC8 Veranda Full roof Wall, Water Architecture
Type D D1 Rockery Fully open Rockery Water, ArchitectureD2 Rockery Fully open Rockery None
2.2.3. Measurement Attributes of the Twenty Garden Units
Spatial attributes were identified from existing research on gardens and urban parks [30,60],including measurement and configurational attributes, which were assumed to be relatedto tourist stay distribution. Scenery attributes like planting and trees are not includedin this study due to the high density and complex interactions of scenery in the smallgarden area.
Measurement attributes refer to the basic parameters of the garden units, such asdimension, scale, and facility. The length, width, perimeter, enclosure length, enclosureheight, and seating length were measured based on the garden plan. The length/width(L/W), width/height (D/H), and enclosure ratio (enclosure length/perimeter) were calcu-lated by the measured parameters. Among these attributes, the width and L/W determinewhether the garden unit is a path or a domain—that is, whether the garden unit is alongitudinal and continuous path with a unidirectional axis, or a centralized domain areacharacterized by multidirectional axes [79–81]. The D/H and enclosure ratios indicate thefield of vision and sense of closure [82,83].
Seating in the garden can be divided into primary seating and supplementary orsecondary seating [84]. Primary seating refers to fixed benches and chairs placed incarefully selected and demarcated locations, as well as in the veranda. Supplementaryor secondary seating refers to various informal sitting opportunities, including stairways,pedestals, steps, and low railings, which integrate into the surrounding environments.Figure 9 shows the seating plan of Tianyige garden.

Urban Sci. 2021, 5, 74 10 of 30
Figure 9. Seating plan of Tianyige garden, containing primary seating and supplementary orsecondary seating. Source: Own work.
Table 2 shows the measurement attributes of the twenty garden units. As the gardenunits in Types C and D appear to be paths, their L/W parameter was not calculated.Moreover, the D/H and enclosure ratio of Type D are estimated values due to the vegetationand rockeries.
Table 2. Measurement attributes of twenty garden units (in meters from length to seating). Source: own work.
Type Unit Length Width Perimeter Enclo. Length Enclo. Height Seating L/W D/H Enclos. Ratio
Type A
A1 30.9 3.5 68.8 14.3 5.0 30.0 6.657 0.700 20.8%A2 20.2 1.5 43.4 20.2 3.5 2.0 13.467 0.429 46.5%A3 22.3 2.3 49.2 0 3.0 3.0 9.696 2.867 0A4 18.8 5.5 48.6 0 4.0 18.8 3.418 2.625 0A5 19.4 5.5 49.8 24.5 5.0 10.4 3.804 1.100 50.0%
Type B
B1 17.1 6.4 47.0 11.1 4.5 19.6 2.672 1.422 23.6%B2 17.1 4.1 69.4 24.7 4.5 25.6 4.171 0.911 35.6%B3 21.3 4.3 51.2 24.0 3.6 4.0 4.953 1.194 46.9%B4 15.3 6.7 44.0 11.0 4.0 2.0 2.284 1.675 25.0%B5 15.3 6.8 44.2 11.0 4.0 4.0 2.250 1.700 24.9%
Type C
C1 42.8 1.9 89.4 44.7 3.0 60.2 NA 0.633 50.0%C2 78.5 1.9 160.8 80.4 3.0 34.8 NA 0.633 50.0%C3 63.6 1.3 129.8 97.4 3.0 29.5 NA 0.433 75.0%C4 68.6 1.4 142.8 71.4 3.0 49.9 NA 0.467 50.0%C5 17.9 1.5 38.8 9.7 4.0 13.1 NA 1.350 25.0%C6 38.0 1.3 78.6 45.8 3.0 40.1 NA 0.433 58.3%C7 14.8 1.5 32.6 16.3 3.0 18.9 NA 0.500 50.0%C8 37.8 1.3 78.2 67.0 3.0 20.3 NA 0.433 85.7%
Type D D1 67.0 0.9 135.8 NA 2 1.0 NA 0.500 80.0%D2 24.0 1.2 50.4 NA 2 1.0 NA 0.500 80.0%

Urban Sci. 2021, 5, 74 11 of 30
2.2.4. Configurational Attributes of the Twenty Garden Units
Configurational attributes refer to the relationship between one space and other spacesin the topological spatial structure of the system based on space syntax theory. A convexmap was utilized to analyze the configurational attributes of garden space. The integrationand choice measures capture the structural importance of a node in a system, indicatingthe space’s potential for to-movement and through-movement, respectively. Appendix Aexplains the calculation methods of the space syntax measures [85,86].
The convex space of the garden was divided using AutoCAD software. Spaces locatedseveral topological steps out of the garden in Tianyige Museum were included in the convexmap considering the connections between the garden area and other parts of the museum.Using DepthMapX 0.7.0 software, connection, choice, and integration with a radius of 3and 5 were calculated in the convex map presented in Figure 10a–d. In Figure 10, the twonodes directly connected by a solid line indicate that the topological distance between themis 1; in other words, they can access each other in one step. Different colors represent thedifferent ranges of the calculation values. The area of the Tianyige garden is demarcated bythe dotted line.
Table 3 presents the calculation values of connectivity, choice, and integration of thetwenty units based on the analysis of the convex map. When a garden unit is dividedinto multiple convex spaces, the average value of all the convex spaces is adopted as thecalculation result.
Figure 10. Convex map calculations of Tianyige garden: (a) Choice [Norm] with a radius of 3;(b) Choice [Norm] with a radius of 5; (c) Integration [HH] with a radius of 3; (d) Integration [HH]with a radius of 5. Source: Own work.

Urban Sci. 2021, 5, 74 12 of 30
Table 3. Configurational attributes of twenty garden units (calculation values of convex map). Source: own work.
Type Unit Connectivity Choice [Norm] R3 Choice [Norm] R5 Integration [HH] R3 Integration [HH] R5
Type A
A1 6 0.229 0.270 2.015 1.382A2 2 0.152 0.083 1.137 1.039A3 3 0.163 0.163 1.604 1.218A4 3 0.166 0.235 1.726 1.299A5 5 0.226 0.260 1.814 1.281
Type B
B1 7 0.447 0.333 2.195 1.328B2 6 0.216 0.183 1.896 1.311B3 5 0.456 0.287 1.924 1.242B4 6 0.340 0.316 1.917 1.350B5 5 0.397 0.258 1.793 1.206
Type C
C1 3 0.258 0.184 1.599 1.052C2 3 0.144 0.183 1.457 1.218C3 6 0.302 0.148 1.538 1.201C4 5 0.141 0.114 1.459 1.174C5 3 0.136 0.111 1.636 1.233C6 2 0.167 0.164 1.121 0.965C7 4 0.176 0.142 1.504 1.143C8 3 0.128 0.067 1.184 0.990
Type D D1 3 0.145 0.115 1.325 1.031D2 2 0.133 0.071 1.062 1.004
2.3. Data Collection
The investigation of visitor stay distribution in Tianyige garden was conducted overa ten-day period from 1 July to 10 July 2019. The investigation took place during thehigh season of tourism in Ningbo, which coincides with the school summer vacation. Theweather was typically overcast and rainy, with the temperature ranging between 22 ◦C and30 ◦C. The research methods were literature review and field observation.
2.3.1. Visitor Flow and Activities
By surveying the previous studies, a questionnaire survey report of visitors from 2017to 2020 conducted by Tianyige Museum and Ningbo University [87–90] is available onTianyige Museum’s official website. The report serves as supplemental material for thisstudy and is helpful for comprehensively grasping the visitor composition and generalinformation in Tianyige Museum in the last four years.
According to the findings of the questionnaire survey report of Tianyige Museumfrom 2017 to 2020, the number of annual visitors increased each year except for 2020,making for an average of approximately 570,000 visitors per year. The museum saw anequal amount of male and female visitors. Nearly 30 percent of visitors were part oftour groups, and about 70 percent were first-time visitors. The majority of visitors werestudents, followed by retirees. In terms of companion relationships, the majority visitedwith relatives, followed by clients and colleagues. Nearly 70 percent of visitors noted apreference to travel in summer and autumn. The main purposes of their visit were gainingcultural experience, children’s play, and family activities. In respect of visitor impressions,most visitors noted the museum’s cultural atmosphere and unique garden characteristics.Visitors also suggested increasing tourism interactions and providing more open space.
Visitor flow data for Tianyige Museum were collected on 6 July 2019 (Saturday) and10 July 2019 (Wednesday). This study selected one workday and one weekend day toconduct a comparison. On the two days of observation, the number of people in TianyigeMuseum was collected in real-time at half-hour intervals via mobile devices using themuseum’s official app [91]. Figure 11 shows the daily visitor flow on 6 July 2019, and10 July 2019. According to the collected data, visitor flow on the weekend (6 July) was

Urban Sci. 2021, 5, 74 13 of 30
almost double that on the workday (10 July). In terms of daily visitors, visitor flow washighest around 10:00–11:30 a.m. and 2:00–4:00 p.m., and lowest at 12:00–13:30 p.m.
Figure 11. Visitor flow in Tianyige Museum on 6 July (Saturday), and 10 July (Wednesday), 2019.Data source: Tianyige Museum, author’s drawing.
Based on field investigation and observation over the ten days, this study categorizesvisitors into three categories: individual guests, tour groups with guides, and primaryschool student groups with teachers. Visitor activities included sightseeing, watchingexhibitions, relaxing, socializing, photography, live-streaming, and picnicking. On someweekends and summer weekday mornings, primary school students and their teacherscould be seen in the garden enjoying outdoor activities like group visits, sketching, andpicnicking (Figure 12a–f).
Figure 12. Illustrations of visitors and activities in Tianyige garden: (a) Student groups resting underthe eaves of Ninghui Hall (B2) of the East Garden; (b) Student groups playing in verandas (C2) of theEast Garden; (c) Tour groups at Linquanya Hall (B3) of the East Garden; (d) Individual visitors atNinghui Hall (B2) of the East Garden; (e) Visitors staying in waterside space (A1) of the East Garden;(f) Visitors staying in waterside space (A4 and A5) of the South Garden. Source: Own work.

Urban Sci. 2021, 5, 74 14 of 30
2.3.2. Visitor Stay Record
Based on field observation, visitors preferred to stay at their favorite places to enjoythe scenery, take photographs, or rest. Accordingly, visitor stay was recorded to analyzehow attractive different spaces were to visitors. Three periods out of the dates in Figure 11were chosen to record visitor stay: namely, the morning of 6 July 2019 (Period 1); theafternoon of 6 July 2019 (Period 2); and the afternoon of 10 July 2019 (Period 3). The threeperiods included weekdays and weekends and differed in terms of visitor composition.Previous studies on visitor temporal-spatial behavior in Chinese gardens found that visitorsspent an average of 30–60 s in most areas of the garden [30]. Based on this study’s fieldobservation, most short stays in Tianyige garden lasted up to 30 s if the visitor wished totake a photograph or have a short rest. Therefore, 30 s was identified as a minimum validstay period in the recording of data.
To record visitor stay distribution in the whole garden, the garden was divided intofive observational areas: water, architecture, and rockery parts in the East Garden, andthe northern and southern yards of the South Garden (Figure 13). The area of each part issuitable for mobile observation by the recorder with high efficiency. Field observation andrecording of visitor stay were conducted one part at a time. During a period of ten minutesof observation in each part, visitors who stayed for more than 30 s were recorded on thegarden plan with their visitor numbers and locations manually. The final visitor stay datawas comprised of 1061 valid cases in the three periods.
Figure 13. Five observational areas in Tianyige garden: water, architecture, and rockery parts in theEast Garden, and the northern and southern yards of the South Garden. Source: Own work.
2.4. Data Analysis
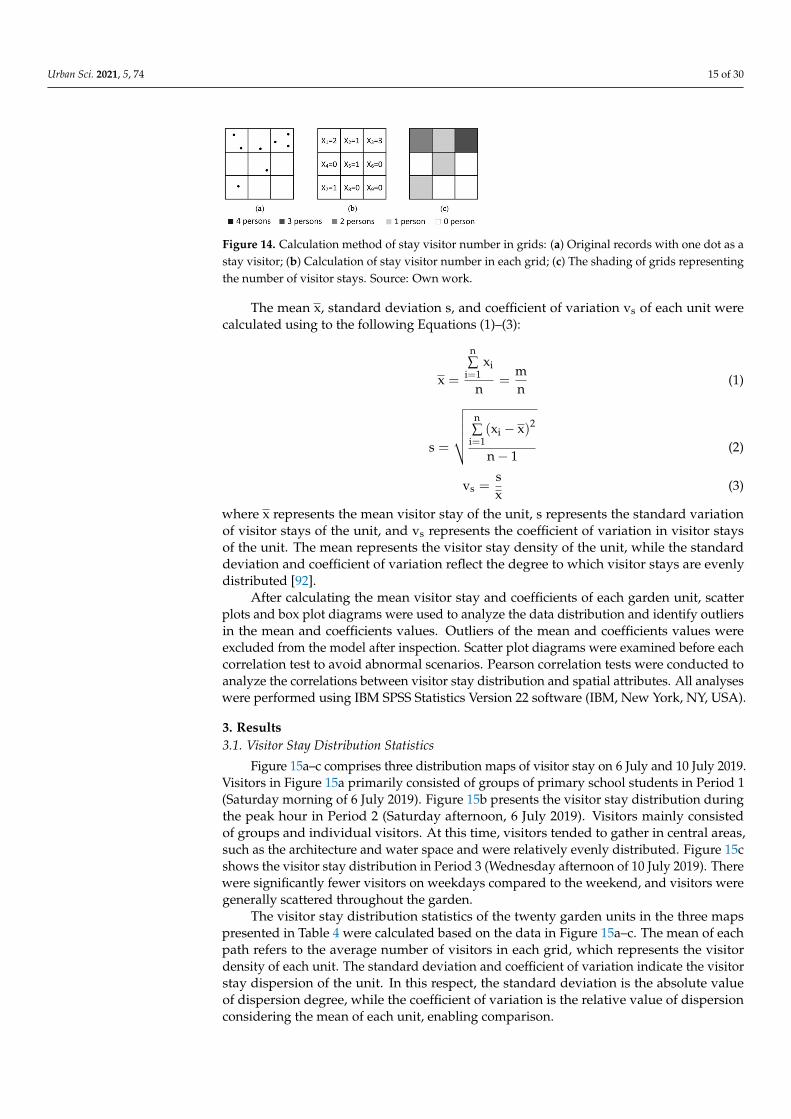
Figure 14a–c illustrates the process of dividing the visitor stay record data into eachgrid and the calculation methods. Figure 14a shows the original records of visitor stays,each dot representing one stay of a visitor. In Figure 14b, the number of visitor stays wascalculated in each grid. In Figure 14c, the shading of each grid represents the number ofvisitor stays in the observational periods.
This study then calculated the visitor numbers and grid numbers of the twenty gardenunits and analyzed the visitor stay density and dispersion of each unit. Visitor stay densityrefers to the average number of visitor stays in one grid of the garden unit, while visitorstay dispersion refers to the degree to which visitor stays were scattered in different gridsof the garden unit. Visitor stay density and dispersion in each garden unit were calculatedusing statistical methods. More specifically, the number of visitors in grid i was consideredas the variable xi, the total number of people in the garden unit was the sum of sample m,and the number of grids in the unit was sample size n.
Urban Sci. 2021, 5, 74 15 of 30
Figure 14. Calculation method of stay visitor number in grids: (a) Original records with one dot as astay visitor; (b) Calculation of stay visitor number in each grid; (c) The shading of grids representingthe number of visitor stays. Source: Own work.
The mean x, standard deviation s, and coefficient of variation vs of each unit werecalculated using to the following Equations (1)–(3):
x =
n∑
i=1xi
n=
mn
(1)
s =
√√√√√ n∑
i=1(xi − x)2
n− 1(2)
vs =sx
(3)
where x represents the mean visitor stay of the unit, s represents the standard variationof visitor stays of the unit, and vs represents the coefficient of variation in visitor staysof the unit. The mean represents the visitor stay density of the unit, while the standarddeviation and coefficient of variation reflect the degree to which visitor stays are evenlydistributed [92].
After calculating the mean visitor stay and coefficients of each garden unit, scatterplots and box plot diagrams were used to analyze the data distribution and identify outliersin the mean and coefficients values. Outliers of the mean and coefficients values wereexcluded from the model after inspection. Scatter plot diagrams were examined before eachcorrelation test to avoid abnormal scenarios. Pearson correlation tests were conducted toanalyze the correlations between visitor stay distribution and spatial attributes. All analyseswere performed using IBM SPSS Statistics Version 22 software (IBM, New York, NY, USA).
3. Results3.1. Visitor Stay Distribution Statistics
Figure 15a–c comprises three distribution maps of visitor stay on 6 July and 10 July 2019.Visitors in Figure 15a primarily consisted of groups of primary school students in Period 1(Saturday morning of 6 July 2019). Figure 15b presents the visitor stay distribution duringthe peak hour in Period 2 (Saturday afternoon, 6 July 2019). Visitors mainly consistedof groups and individual visitors. At this time, visitors tended to gather in central areas,such as the architecture and water space and were relatively evenly distributed. Figure 15cshows the visitor stay distribution in Period 3 (Wednesday afternoon of 10 July 2019). Therewere significantly fewer visitors on weekdays compared to the weekend, and visitors weregenerally scattered throughout the garden.
The visitor stay distribution statistics of the twenty garden units in the three mapspresented in Table 4 were calculated based on the data in Figure 15a–c. The mean of eachpath refers to the average number of visitors in each grid, which represents the visitordensity of each unit. The standard deviation and coefficient of variation indicate the visitorstay dispersion of the unit. In this respect, the standard deviation is the absolute valueof dispersion degree, while the coefficient of variation is the relative value of dispersionconsidering the mean of each unit, enabling comparison.

Urban Sci. 2021, 5, 74 16 of 30
Figure 15. Visitor stay distribution maps in three periods: (a) Map 1 in the Saturday morning of6 July 2019; (b) Map 2 in the Saturday afternoon of 6 July 2019; (c) Map 3 on the Wednesday afternoonof 10 July 2019. Source: Own work.

Urban Sci. 2021, 5, 74 17 of 30
Table 4. Visitor stay distribution statistics of twenty garden units in three periods. Source: Own work.
Type Unit GridVisitor Number Mean Standard Deviation Coefficient of Variation
Map 1 Map 2 Map 3 Map 1 Map 2 Map 3 Map 1 Map 2 Map 3 Map 1 Map 2 Map 3
Type A
A1 44 20 34 7 0.455 0.773 0.159 0.820 1.097 0.479 1.802 1.419 3.013A2 11 1 8 1 0.091 0.727 0.091 0.302 0.786 0.302 3.319 1.081 3.319A3 23 7 17 6 0.304 0.739 0.261 0.470 0.810 0.541 1.546 1.096 2.073A4 46 27 33 9 0.587 0.717 0.196 0.909 0.981 0.500 1.549 1.368 2.551A5 38 11 44 12 0.289 1.158 0.316 0.611 0.945 0.574 2.114 0.816 1.816
Sum 162 66 136 35 0.407 0.840 0.216 0.744 0.977 0.507 1.828 1.163 2.347
Type B
B1 49 50 43 14 1.020 0.878 0.286 1.331 1.130 0.645 1.305 1.287 2.255B2 49 78 29 13 1.592 0.592 0.265 1.485 0.888 0.605 0.933 1.500 2.283B3 38 47 38 17 1.237 1.000 0.447 1.125 1.139 0.760 0.909 1.139 1.700B4 45 8 25 6 0.178 0.556 0.133 0.490 0.867 0.457 2.753 1.559 3.436B5 46 20 22 7 0.435 0.478 0.152 0.886 0.781 0.420 2.037 1.634 2.763
Sum 227 203 157 57 0.894 0.692 0.251 1.236 0.979 0.590 1.383 1.415 2.351
Type C
C1 42 36 26 15 0.857 0.619 0.357 1.072 0.909 0.618 1.251 1.468 1.731C2 71 66 23 2 0.930 0.324 0.028 1.125 0.650 0.167 1.210 2.006 5.964C3 44 5 29 5 0.114 0.659 0.114 0.321 0.888 0.387 2.816 1.347 3.395C4 47 41 26 6 0.872 0.553 0.128 1.013 0.829 0.397 1.162 1.499 3.102C5 12 3 27 17 0.250 2.250 1.417 0.622 1.545 1.084 2.488 0.687 0.765C6 25 1 9 4 0.040 0.360 0.160 0.200 0.638 0.473 5.000 1.772 2.956C7 11 2 10 6 0.182 0.909 0.545 0.405 1.446 1.036 2.225 1.591 1.901C8 20 3 11 5 0.150 0.550 0.250 0.366 1.099 0.786 2.440 1.998 3.144
Sum 272 157 161 60 0.577 0.592 0.221 0.934 0.960 0.591 1.619 1.622 2.674
Type DD1 40 6 8 4 0.150 0.200 0.100 0.427 0.464 0.379 2.847 2.320 3.790D2 26 3 5 3 0.115 0.192 0.115 0.431 0.567 0.431 3.748 2.953 3.748
Sum 66 9 13 7 0.136 0.197 0.106 0.426 0.503 0.397 3.132 2.553 3.745
Sum 727 435 467 159 0.598 0.642 0.219 0.998 0.951 0.558 1.669 1.481 2.548
Figure 16a–b presents the box plots of mean visitor stay and coefficients of variation inthree periods. In Figure 16a, outlier C5 appears in Maps 2 and 3. In Figure 16b, outlier D2appears in Map 2, and outlier C2 appears in Map 3. Based on an evaluation of the outlierunits in the garden plan, C5 is the only veranda unit that is not adjacent to the garden walland opens on both sides, and it connects the main buildings and entrances in the SouthGarden with higher accessibility. D2 and C2 are the two longest units in the rockery andveranda space, resulting in uneven visitor stay distribution. Accordingly, these three valuescan be considered abnormal and are discarded from the entire series to prevent them frominfluencing further analysis.
Figure 16. Box plots of visitor stay mean and coefficient of variation in three periods: (a) Box plotsof visitor stay mean, with an outlier C5 in Map 2 and 3; (b) Box plots of visitor stay coefficient ofvariation, with outliers D2 in Map 2 and C2 in Map 3. Source: Own work.

Urban Sci. 2021, 5, 74 18 of 30
3.2. Correlations between Visitor Stay Density and Spatial Attributes
This study analyzed the correlations between visitor stay density and spatial attributesof the twenty garden units using a Pearson correlation test. The outlier C5 of the mean valuein Maps 2 and 3 was excluded from the test. As Table 5 shows, the results of the Pearsoncorrelation test indicate that the mean visitor stay is significantly positively related to choiceR5 in Map 2, r = 0.488, p < 0.05, integration R3 in Map 2, r = 0.580, p < 0.01, and integrationR5 in Map 2, r = 0.517, p < 0.05. It is significantly negatively associated with length inMap 2, r = −0.496, p < 0.05, as well as length in Map 3, r = −0.490, p < 0.05. It is also weaklypositively related to choice R3, width, and seating and negatively connected to enclosureratio. Results revealed no correlation between mean visitor stay and L/W or D/H.
Table 5. Pearson correlation test with visitor stay mean and spatial attributes. Source: Own work.
MeanPearson Correlation (r)
Choice [Norm] R3 Choice [Norm] R5 Integration [HH] R3 Integration [HH] R5
Map 1 (N = 20) 0.380 0.394 0.552 * 0.445 *Map 2 (N = 19) 0.413 0.488 * 0.580 ** 0.517 *Map 3 (N = 19) 0.302 0.229 0.331 0.104
MeanPearson Correlation (r)
Length Width L/W (N = 9) D/H Enclosure ratio Seating
Map 1 (N = 20) 0.018 0.326 −0.113 0.104 −0.271 0.329Map 2 (N = 19) −0.496 * 0.417 0.172 0.277 −0.398 −0.074Map 3 (N = 19) −0.490 * 0.140 0.192 0.112 −0.119 0.023
* Correlation is significant at the 0.05 level (2-tailed). ** Correlation is significant at the 0.01 level (2-tailed).
Considering the significant difference in the width and L/W attribute values of thetwenty units in Table 2, this study conducted further correlation analysis of two groups(Table 6). The first group comprised water and architecture spaces (Types A and B), wheremost of the units are spacious and more likely to be an area rather than a path. The secondgroup comprised veranda and rockery spaces (Types C and D), which are characterized bylong and narrow paths.
Table 6. Pearson correlation test with visitor stay mean and spatial attributes in two groups. Source: Own work.
MeanPearson Correlation (r)
Length Width L/W (N = 9) D/H Enclosure Ratio Seating
Type A&BMap 1 (N = 10) −0.128 0.113 −0.113 −0.154 0.163 0.474Map 2 (N = 10) 0.312 −0.108 0.172 −0.196 0.423 0.041Map 3 (N = 10) 0.023 0.072 0.192 0.069 0.268 0.022
Type C&DMap 1 (N = 10) 0.510 0.737 * NA 0.086 −0.444 0.681 *Map 2 (N = 9) −0.322 0.360 NA −0.090 −0.401 0.383Map 3 (N = 9) −0.718 * 0.245 NA 0.054 −0.311 0.121
* Correlation is significant at the 0.05 level (2-tailed).
Results show that the correlations in Types C and D are more significant than those inTypes A and B. The mean visitor stay of Types C and D is significantly positively relatedto the width in Map 1, r = 0.737, p < 0.05, and seating in Map 1, r = 0.681, p < 0.05, andnegatively associated with length in Map 3, r =−0.718, p < 0.05. It is also weakly negativelyconnected to the enclosure ratio. The mean visitor stay of Type A and B is weakly positivelyconnected to enclosure ratio in Map 2 and seating in Map 1.
3.3. Correlations between Visitor Stay Dispersion and Spatial Attributes
This study analyzed the correlations between the visitor stay dispersion and spatialattributes of the twenty garden units using a Pearson correlation test. Outliers C5, D2, and

Urban Sci. 2021, 5, 74 19 of 30
C2 in Maps 2 and 3 were excluded from the test. The coefficient of variation of visitor staywas assumed to be related to length and width attributes, causing uneven accessibility indifferent parts of the garden unit.
According to the Pearson correlation test results presented in Table 7, the coefficientof variation of visitor stay is significantly and negatively associated with mean of visitorstay in Map 1, r = −0.792, p < 0.01, Map 2, r = −0.845, p < 0.01, and Map 3, r = −0.856,p < 0.01. It is also weakly positively associated with length (significantly in Map 2, r = 0.545,p < 0.05) and negatively associated with width.
Table 7. Pearson correlation test with visitor stay coefficient of variation and spatial attributes. Source: Own work.
Map 1 (N = 20)
Pearson Correlation (r) Coefficient of Variation 1 Mean 1 Length Width
Coefficient of Variation 1 1 −0.792 ** −0.019 −0.358Mean 1 −0.792 ** 1 0.018 0.326Length −0.019 0.018 1 NAWidth −0.358 0.326 NA 1
Map 2 (N = 18)
Pearson Correlation (r) Coefficient of Variation 2 Mean 2 Length Width
Coefficient of Variation 2 1 −0.845 ** 0.545 * −0.377Mean 2 −0.845 ** 1 −0.597 ** 0.368Length 0.545 * −0.597 ** 1 NAWidth −0.377 0.368 NA 1
Map 3 (N = 18)
Pearson Correlation (r) Coefficient of Variation 3 Mean 3 Length Width
Coefficient of Variation 3 1 −0.856 ** 0.437 −0.318Mean 3 −0.856 ** 1 −0.387 0.099Length 0.437 −0.387 1 NAWidth −0.318 0.099 NA 1
* Correlation is significant at the 0.05 level (2-tailed). ** Correlation is significant at the 0.01 level (2-tailed).
Considering that the confounding mean visitor stay variable is related to both thecoefficient of variation and spatial attributes (length and width), this study employed apartial correlation test to mitigate misleading information from the confounding variable.The partial correlation coefficient between X and Y, controlling for Z, is written as ryx.z inEquation (4):
ryx.z =ryx −
(ryz)(rxz)√
1− r2yz√
1− r2xz
(4)
where ryx, ryz, and rxz are zero-order coefficients between all the variables (Y and X, Yand Z, X and Z) [92]. The mean visitor stay values, which are unrelated to the coefficientof variation or spatial attributes, were excluded from the partial correlation test andidentified as NA.
Table 8 presents the results of the partial correlation test, controlling for mean visitorstay. The significant correlation with length in Map 2 disappeared (r = 0.094), indicatingthat the correlation may be due to the controlling variable. Therefore, mean visitor staypartially explains the correlation between the coefficient of variation of visitor stay andspatial attributes of the twenty gardens units examined in this study.

Urban Sci. 2021, 5, 74 20 of 30
Table 8. Partial correlation test with visitor stay coefficient of variation and spatial attributes, controlling the visitor staymean. Source: Own work.
Coefficient of Variation ControlCorrelation (r)
Mean 1 Mean 2 Mean 3 Length Width
Map 1 (N = 20) None −0.792 ** −0.019 −0.358Mean 1 NA −0.174
Map 2 (N = 18) None −0.845 ** 0.545 * −0.377Mean 2 0.094 −0.132
Map 3 (N = 18) None −0.856 ** 0.437 −0.318Mean 3 0.222 NA
* Correlation is significant at the 0.05 level (2-tailed). ** Correlation is significant at the 0.01 level (2-tailed).
3.4. Characteristics of Visitor Stay Distribution and the Four Types of Garden Space
Figure 17a-c shows the characteristics of visitor stay distribution and the four types ofgarden space. Figure 17a presents a comparison of visitor stay density in the four typesof garden space in column charts. Figure 17b compares visitor stay dispersion in the fourtypes of garden space in column charts. Figure 17c presents the average values of theattributes of the four types of garden space and four typical garden units in radar charts. Sixspatial attributes related to the visitor stay density were taken as axis variables: integrationR3, choice R5, width, length, enclosure ratio, and seating. A unified scale was adoptedin the radar chart axis by calculating the percentages of variable values comparing themaximum. The dotted line represents the total average values.
Figure 17. Characteristics of visitor stay distribution and four types of garden space: (a) Visitorstay density of four types in column charts; (b) Visitor stay dispersion of four types in columncharts; (c) Characteristics of four types of garden space and four typical garden units in radar charts.Source: Own work.

Urban Sci. 2021, 5, 74 21 of 30
As Figure 17a,b show, water and architecture spaces (Types A and B) have the highestvisitor stay density and lowest visitor stay dispersion. The visitor stay density of verandaspace (Type C) is lower than that of the water and architecture spaces (Type A and B), fol-lowed by rockery space (Type D), which has the highest visitor stay dispersion. Meanwhile,Figure 17c shows that the four types of garden space have distinctive attributes. The fourtypical garden units (A5, B1, C6, D2) at the bottom of Figure 17c show the individual caseswhich can represent the four types. Among them, A5 and C6 are typical water and verandaspaces in the South Garden, while B1 and D2 are typical architecture and rockery spaces inthe East Garden.
4. Discussion4.1. Main Findings
The main findings of this study can be summarized in five points as follows. First, vis-itor flow on weekends was almost twice that on weekdays; peak hours are 10:00–11:30 a.m.and 2:00–4:00 p.m., while off-peak hours are 12:00–13:30 p.m. On weekends (Maps 1 and 2),architecture and water spaces enjoyed high visitor flow, while veranda space occasion-ally experiences high visitor flow from particular student groups. On weekdays (Map 3),visitors were relatively evenly distributed in the architecture, water, and veranda spaces.
Second, in respect of visitor groups, individual guests and tour groups preferredwater space, followed by architecture space and then veranda space. Primary schoolstudent groups preferred architecture spaces, followed by veranda space. Essentially, mostvisitors were more interested in the beautiful scenery of the garden, resulting in the waterspace being more popular among general visitors. As primary school students usuallyplayed in groups, they tended to prefer spacious open spaces with shelter and adequateseating facilities.
Third, there is a correlation between visitor stay density and six spatial attributes:integration, choice, width, length, enclosure ratio, and seating. The visitor stay density ofall types is significantly positively related to integration R3 and R5 and choice R5 in Map 2and negatively associated with length in Maps 2 and 3. The visitor stay density of verandaand rockery types is significantly positively related to width and seating in Map 1 andnegatively associated with length in Map 3.
Fourth, visitor stay dispersion is significantly negatively related to visitor stay density.A partial correlation test controlling for visitor stay density revealed no correlation betweenvisitor stay dispersion and length and width.
Fifth, the four types of garden space have distinctive attributes and can be dividedinto two groups: centralized, spacious, and highly accessible open space, like Types Aand B; and narrow, longitudinal paths with low accessibility and abundant seating facilitieslike Types C and D. The two groups reflect different patterns of visitor stay distribution.
4.2. Spatial Composition of Tianyige Garden4.2.1. Composition Elements of Tianyige Garden Space
Although the composition and style of Chinese gardens have varied across differ-ent historical periods, Chinese gardens have retained distinctive features referred to as“garden genes”. Tong Jun identifies the basic elements of a garden based on the Chinesecharacter “園” (garden). He says, “The outer circle (囗 Encircle) resembles a courtyardwall, and within the circle are buildings (土 Soil), ponds (口 Mouth), rockery and trees(衣 Clothes) [5]”. Liu Dunzhen similarly summarized the basic concept of a garden ascomprising a combination of rockery, ponds, trees, and houses, under the guiding principleof a poetic and artistic concept [7]. Quantitative studies comparing ancient and moderngardens have identified five basic elements of Chinese gardens: buildings, plants, rockery,water, and garden paths or squares [18,77]. This study identified four garden elements:water, architecture, veranda, and rockery. As most verandas in Tianyige garden are thecombination of the courtyard wall and veranda surrounding the entire garden, they were

Urban Sci. 2021, 5, 74 22 of 30
considered as an independent spatial element. Similarly, several other studies have focusedon the veranda space of Chinese gardens [93–95].
Regarding the proportion of each garden element comprising a Chinese garden,Wu [77] indicates that the area of buildings is typically much smaller than other gardenelements if the residential buildings outside the garden are excluded. Analyzing theproportion of elements from a three-dimensional perspective, Yang [18] found that plantsand water make up the largest proportion of the garden, followed by buildings. In aquantitative analysis of the elements of the Tianyige East Garden, Liu [96] similarly foundthat the total area occupied by buildings was smaller than both that of rockery space andgarden paths. However, the results of this study show that architecture space—that is,buildings—have the highest visitor stay density. This finding is due to the high accessibilityand functionality of architectural space, as well as the inaccessibility of water and rockeryspaces. As noted in the second chapter of Yuan Ye, “the first step to set up the foundationof a garden is to decide the location of the main building” [97]. Indeed, the buildings playthe most fundamental role in Chinese gardens.
4.2.2. Forms and Configurations of Tianyige Garden Space
The layout of Tianyige garden closely resembles that of Jiangnan gardens insofar as thelayout of the East Garden is centers on water. Similar examples include the northwesternpart of Zhan Garden in Nanjing, the central part of the Lingering Garden in Suzhou, thewestern part of Lion Grove Garden in Suzhou, the central part of Master-of-Nets Garden inSuzhou, and Yipu Garden in Suzhou [98]. However, the layout of the East Garden is slightlydifferent from the aforementioned examples in terms of the axial organization of gardenelements. In traditional gardens, the main building usually served as the living room whileproviding the best view of the garden. Accordingly, the main building is conventionallylocated in the central area in front of the main theme of the garden scenery, close to thewater and facing the main axis of the pond and rockery. Contrary to convention, the twobuildings in the East Garden do not face the main view of the garden (i.e., the water androckery scenery); rather, they are located parallel to the axis of the water and rockery. Onereason for this break with tradition is that the buildings in the East Garden have becomeexhibition spaces. Moreover, these buildings were relocated from elsewhere in Ningbo,their size too big to match the garden scale. Positioning the two buildings such that theyfaced the pond and rockery directly would have undermined the balance of the garden—the oversized building disrupting the broadness of the water and rockery [73]. Thisclever axial organization also provides an alternative tour route, enriching the traditionalcentralized layout.
The rockery in the Tianyige garden is buried in thick woods and huge buildings,rendering an overall view of the rockery impossible and emphasizing the depth of gardenspace. Camphor trees were planted in the East Garden, creating the atmosphere of awild mountain forest, similar to that of the Canglang Pavilion in Suzhou [98]. However,unlike the complicated verandas separating the garden space in the Suzhou gardens ofthe middle and later Qing Dynasty, the verandas in Tianyige garden are simple and linear,surrounding the garden with walls. The simple verandas, soil and stone rockery, andsquare pond embody the garden form and configuration of the Ming Dynasty [99].
4.2.3. Distinctive Characteristics of Tianyige Garden Space
Despite sharing several similarities with other traditional Jiangnan gardens, Tianyigegarden is unique in three ways. First, Tianyige garden is home to a collection of historicalitems, with a variety of ancient buildings, stone pavilions, stone tablets, and other historicalitems having been relocated from other parts of Ningbo to the garden for protection [74].Second, the intended function of Tianyige garden is unique compared to traditional gardensinsofar as it was originally designed to serve the museum and its visitors. In this respect,the garden is actually a subsidiary of the museum intended to reduce the potential over-whelming of the ancient Tianyige Library. Third, Tianyige garden follows the gardening

Urban Sci. 2021, 5, 74 23 of 30
ideology of adhering to local conditions. Rather than following the style of traditionalgardens, Tianyige garden has absorbed the local characteristics of Ningbo—for instance,it uses local stones in the rockery and retains the original camphor trees [73]. Therefore,Tianyige Garden is a valuable exploration of contemporary Chinese garden design.
4.3. Attractiveness and Openness of the Garden Space4.3.1. Attractiveness of the Four Types of Garden Space
In terms of the attractiveness of garden elements, previous studies [100,101] haveexamined the visitor stay points and attractiveness of garden elements in the Master-of-Nets Garden and Lingering Garden in Suzhou. These studies found that most visitorsto the Master-of-Nets Garden preferred to stay in the building areas (including indoorspace, external platforms, and spaces under the eaves) and that the water elements hadthe highest attractiveness. However, due to the small area and compact layout of theMaster-of-Nets Garden, several elements are likely to have multiple influences on visitors.As such, the attractiveness of the garden elements in the Lingering Garden appears similarto that of Tianyige garden, although the Lingering Garden has a much higher proportionof buildings. In other words, the buildings in the Tianyige garden attract the most visitorsdespite occupying a smaller area proportion than those of the Lingering Garden.
As most of the main scenery—the best viewpoints—in Tianyige garden can be foundaround the water area, visitor stay density is highest in the water space in Map 2 (Figure 17a).Architecture space also attracts a large number of visitors because it functions exhibitionspace, resulting in high visitor stay density in architecture space in all three maps. Verandaspace shows a moderate visitor stay density due to its provision of seating facilities andgood views of the scenery. However, visitor stay distribution was found to vary acrossdifferent parts of veranda space; for instance, the most popular veranda unit was C5, whichhas high accessibility and a wide vision. Rockery space had the fewest visitors, with visitorstay primarily concentrated in the pavilions. As such, rockery space was found to be theleast attractive space to most visitors.
The three time periods examined in this study reflect different visitor stay distributionsituations. Map 2 of the weekend period and Map 3 of the weekday period are most typical,while Map 1 is unique insofar as it shows how primary school student groups utilizedthe garden. In respect of the latter, architecture and veranda spaces provided studentswith spacious shelters and abundant seating facilities for a variety of activities, includingpicnics, painting, and socializing, reflecting the flexible utilization of the garden space forboth individuals and large groups.
4.3.2. Openness of the Garden Space Based on Six Spatial Attributes
According to the upper three attributes (choice R5, integration R3, and width) and thelower three attributes (length, enclosure ratio, and seating) in the radar charts of Figure 17c,the four types of space can be divided into two groups: Types A and B, in which the upperthree attribute values are larger than average and lower three attribute values are smallerthan average; and Types C and D, in which the upper three attribute values are smallerthan average and lower three attribute values are larger than average. Units in Types Aand B are centralized, spacious, and highly accessible open spaces, while units in TypesC and D units are longitudinal narrow paths with low accessibility and abundant seatingfacilities. The two groups thus reflect different patterns of visitor stay distribution.
Accessibility (integration and choice) was found to be significantly positively relatedto visitor stay density in all garden units. As accessibility can determine the proportionof first-time visits to a space, it serves as a basic factor in determining whether a space ispopular to visitors [30]. However, high visitor flow does not necessarily lead to high visitorstay density. Indeed, while veranda unit C3 is located on the main tour route and close tothe south entrance of the East Garden with high accessibility, it has low visitor stay densityand only serves as a pass space. Therefore, other influencing factors are also important invisitor stay distribution.

Urban Sci. 2021, 5, 74 24 of 30
While both length and width are related to visitor stay density, width is more inter-pretable and found to be particularly significant in Types C and D. The average widths ofwater space (3.7 m) and architecture space (5.7 m) are wider than the total average width(3.1 m) of garden space, as is the typical case of unit A5 (5.5 m) of water space and unitB1 (6.4 m) of architecture space. This may be another important reason for higher visitorstay density in Types A and B. Existing research on urban forest parks also indicates thatvisitors prefer paths wider than 3 m, and the relationship between path use and length isyet to be identified [60].
Enclosure ratio is related to visitor stay density insofar as it directly affects the visibilityof the surrounding environments and scenery, and the visual characteristics of a space playa decisive role in spatial attraction [30]. The correlation results of this study indicate thatthe enclosure ratio is weakly positively related to visitor stay density in Types A and B,which have enclosure ratios below 50 percent, and weakly negatively related to visitor staydensity in Types C and D, where most enclosure ratios are above 50 percent. This mayindicate that a moderate enclosure ratio is more conducive to visitor stay distribution.
Seating is also an important attribute related to visitor stay distribution, especiallyin veranda space. In this study, accessibility and width, which are supposed to promotevisitor stay behaviors, were found to be below average in the veranda space, except forseating. Existing studies suggest that visitors tend to stay on verandas that provide goodviews of the main scenery or water [102,103]. This may account for the high visitor staydensity of veranda space units C1, C5, and C7.
4.4. Visitors and Activities
Visitor flow is essential to the experience of a garden. Tianyige Museum saw almost739,000 visitors in 2019 [89]. In contrast, Shanghai’s commercial areas of Yu Garden—whichwas also restored by Chen Congzhou—saw some 40 million visitors in 2019 [104], makingthe garden overcrowded throughout the year. Evidently, each Chinese garden has anoptimal visitor capacity, which is essential to making it a high-quality green public openspace in the city rather than a tourist hotspot.
This study divided visitors into three categories: individual visitors, group visitors,and student groups. Another study of visitors in Tianyige Museum [105] classified usersmore comprehensively, including book borrowers, museum visitors, patriotic activityparticipants, exhibition visitors, and other academic and social activities participants. Thisreflects the fact of Tianyige Museum’s multiple identities, including a library, museum,historical archive, exhibition hall, tourist attraction, as well as a base for local primary andsecondary school excursions and activities. It also demonstrates how Chinese garden spacecan be adapted to serve multiple functions and activities.
Compared with visitor activities in urban parks [106], Tianyige garden is not usedfor exercise and is less popular for socializing, with most visitors immersed in the gardenenvironment. This finding indicates that the Tianyige garden environment aligns with theculture surrounding book collection and historical relics and that the garden also providesa green open space for rest and recreation in the museum.
5. Conclusions
Through examining the correlations between spatial attributes and visitor stay distri-bution in the gardens of Ningbo Tianyige Museum, this study revealed the openness of thisgarden space and its attractiveness to visitors. Results reveal that the garden’s architectureand water spaces enjoyed a highly dense and evenly distributed visitor stay. Veranda spacehad a lower stay density, followed by rockery space. Visitor stay density is significantlynegatively related to visitor stay dispersion, and there is a correlation between stay densityand six spatial attributes: integration, choice, width, length, enclosure ratio, and seating.The results of this study indicate that Tianyige garden is a classical-style garden withinnovations in terms of its spatial composition [73,74]. The distinctive attributes of the fourtypes of garden space reflect different patterns of visitor stay distribution. Tianyige garden

Urban Sci. 2021, 5, 74 25 of 30
can cater to diverse visitor groups and provide a space for a wide range of activities [20],demonstrating the openness of Chinese gardens as urban public spaces [107–109].
This study could contribute to the visitor studies as well as environmental behaviorstudies in Chinese gardens and other urban green spaces [64,65]. The findings of this studycould also provide useful insights for the planning and management of Chinese gardentourism [29,30]. Furthermore, this study is of great value with respect to the utilizationof green public open spaces in cities. With the proposal of constructing a high-quality“Park City” in China [110,111], Chinese gardens will play a critical role in creating a naturalatmosphere, humanized environment, a pleasant and picturesque urban life, and a healthyand ecological city.
Based on its findings, this study provides the following suggestions for improving thetraveling experience and utilization of Chinese gardens. First, visitors tend to find widerspaces more open and attractive; however, it is important that the scale matches the overalllayout and style of the garden. Concerning the narrow and winding garden paths, tourroutes with signposting can serve to reduce the accessibility to avoid heavy visitor traffic,thereby improving visitor experience. Second, architecture and water spaces are quitepopular among visitors, which means that these two types of space should be appropriatelyarranged and connected by verandas, thereby balancing the attractiveness of the entiregarden space. Third, better route design can improve the accessibility and visibility ofmarginal spaces like verandas. Other attractive elements like architecture and water can becombined with verandas or “borrowed scenery” to improve the visual experience of thelandscape from the veranda. Fourth, more functions and facilities—such as supplementaryor secondary seating—can be added to architecture and water spaces to improve visitoractivities and experience.
This study had three limitations. First, this study has a relatively small sample size,with only twenty garden units extracted from the garden as samples due to the overallgarden scale. Second, this study did not control for other unknown factors that mayinfluence the visitor stay behaviors; different seasons and climatic conditions were also notconsidered. Third, this study only conducted qualitative observation and analysis of visitoractivities. A more detailed behavioral study may better explain the communal nature andutilization of garden space at the Tianyige Museum. Future research should examine thecorrelations between the length of visitor stay and spatial attributes, thereby elucidatingthe spatial requirements of different lengths of visitor stay and facilitating the identificationof optimal rest stops in the garden. Researchers should also examine the unique attributesand advantages of Chinese classical garden space to propose strategies to improve thetraveling experience and utilization of gardens in China.
Author Contributions: Conceptualization, J.Y. (Jia Yu) and T.Y.; methodology, J.Y. (Jia Yu), T.Y., andE.I.; software, J.Y. (Jia Yu); investigation, J.Y. (Jia Yu) and J.Y. (Jing Yang); resources, J.Y. (Jia Yu) andJ.Y. (Jing Yang); writing—original draft preparation, J.Y. (Jia Yu); writing—review and editing, J.Y.(Jia Yu), T.Y., E.I., and J.Y. (Jing Yang); funding acquisition, J.Y. (Jing Yang). All authors have read andagreed to the published version of the manuscript.
Funding: This research was funded by NATIONAL NATURAL SCIENCE FOUNDATION OFCHINA, grant number 51978445 and 52038007.
Institutional Review Board Statement: Ethical review and approval were waived for this study, dueto it did not collect critical personal information.
Informed Consent Statement: Not applicable.
Data Availability Statement: Data supporting the findings of this study are available within thearticle and from the corresponding author J.Y. on request.
Acknowledgments: The authors wish to thank Zhang Liang of Ningbo Tianyige Museum for thesupport during the investigation, as well as The National Natural Science Foundation of China fortheir generous financial supports. The authors also wish to extend their gratitude to Aoki Takashi of

Urban Sci. 2021, 5, 74 26 of 30
Osaka University, Iida Tadasu of Kwansei Gakuin University, and Itami Koji of Mukogawa Women’sUniversity for their advice and help throughout this project.
Conflicts of Interest: The authors have no conflict of interest to declare.
Appendix A. Calculation Methods of Space Syntax Measures
In space syntax theory, connectivity is defined as the number of nodes that connectdirectly to a given node. Choice captures how likely a given node may be passed throughin journeys from all nodes to all other nodes in the system. Choice can be estimated asthe ratio between the number of shortest paths through node i and the total number of allshortest paths in the model, as shown in (A1):
Choicei ={#shortest paths through i}{#all shortest paths} (A1)
space i has a strong choice value when many of the shortest paths connecting all spaces ofa system, pass through it.
Integration examines the degree to which a given node is integrated or segregatedfrom the whole system (global integration) or a partial system comprising nodes a few stepsaway (local integration). The node with a high integration value means it is easier to accessfrom other nodes because it is located at a shallow level of the system. In contrast, thenode with a small integration value represents the segregation trend because it is difficultto reach. It is measured by the Real Relative Asymmetry (RRA) [86] as follows (A2)–(A5):
Integrationi =1
RRAi(A2)
RRAi = 2MDi − 1
DN(N− 2)(A3)
DN = 2Nlog 2
N+23
− 1+ 1
(N− 1)(N− 2)(A4)
MDi =Di
N− 1(A5)
where N is the total number of nodes, DN is the normalization parameter to counter thesize effect, and MD (mean depth) is the average number of syntactic steps from a givennode i to any other nodes (all nodes or nodes several steps away).
The depth is the basic concept of a topological distance between nodes. Two openspaces, i and j, are said to be at depth dij if the least number of syntactic steps needed toreach one node from the other is dij. The concept of depth can be extended to global depth,the sum of all depths from a given origin, as follows (A6):
Di =N
∑j=1
dij (A6)
Consistent with global depth, the local depth only summarizes the distance between thatparticular node and the nodes within a search radius.
References1. Wang, J.Y. On the earliest form of garden in China. Acta Hortic. Sin. 1965, 4, 101–106.2. Wang, J.Y. The historical development of Chinese landscape garden. Chin. Landsc. Archit. 1985, 1, 34–38.3. Meng, Z.Z. The artistic characteristics and public attribute of Chinese garden: A case of Yangzhou. China Anc. City 2015, 29, 4–7.4. Zhou, W.Q. History of Chinese Classical Gardens; Tsinghua University Press: Beijing, China, 1990; pp. 183–184.5. Tong, J. Records of Jiangnan Gardens, 2nd ed.; China Architecture & Building Press: Beijing, China, 1984; pp. 3–14.6. Tong, J. Glimpses of Gardens in Eastern China; China Architecture & Building Press: Beijing, China, 1997; pp. 1–38.7. Liu, D.Z. Suzhou Classical Gardens; China Architecture & Building Press: Beijing, China, 1979; pp. 3–50.

Urban Sci. 2021, 5, 74 27 of 30
8. Chen, C.Z. Suzhou Gardens, centenary ed.; Tongji University Press: Shanghai, China, 2018; pp. 10–71.9. Zhao, J.J.; Woudstra, J. ‘Making green the motherland’: Greening the Chinese socialist undertaking (1949–1978). Stud. Hist. Gard.
Des. L. 2012, 32, 312–330. [CrossRef]10. Zhao, J.J. Sixty years of landscape policies and development in China (1): ‘Chinese also new’. Landsc. Archit. 2009, 26, 102–105.
[CrossRef]11. Zhao, J.J. Sixty years of landscape policies and development in China (4): Garden revolution. Landsc. Archit. 2009, 26, 75–79.
[CrossRef]12. Lin, G.S. The development of the practice of contemporary Chinese landscape architecture—A critic based on five perspectives.
In Proceedings of the 2010 47th International Federation of Landscape Architects World Congress (47th IFLA 2010), Suzhou, China,28–30 March 2010; pp. 309–313.
13. Wang, D. The Outline Study on the Chinese Modern Landscape Design (1949–1978) Development Program. Master’s Thesis,Hainan University, Haikou, China, 2012.
14. Wang, N.N. The Historical Development of People’ Parks in New China (1949–1978). Master’s Thesis, Huazhong University ofScience and Technology, Wuhan, China, 2016.
15. Gao, L.; Woudstra, J. From landscape of gods to landscape of man: Imperial altars in Beijing. Stud. Hist. Gard. Des. L. 2011, 31, 231–268.[CrossRef]
16. Yue, Z. Chinese garden heritage reservation study based on the history of Zhuozheng Garden. In Proceedings of the InternationalSymposium on Prof. Chen Zhi’s Gardening Thought & Doctoral Forum of Landscape Architecture Theories and Practice,Nanjing, China, 14–15 November 2009; pp. 129–132.
17. Gu, G.C.; Cheng, Y.; Li, L.; Guo, L.; Deng, H. The research of changes of the Chinese historical private classical garden and theauthenticity of the protection. J. Hum. Settl. West China 2018, 33, 69–77. [CrossRef]
18. Yang, B.; Volkman, N. From traditional to contemporary: Revelations in Chinese garden and public space design. Urban Des. Int.2010, 15, 208–220. [CrossRef]
19. Öztürk, H. The Sadabad Park project in Istanbul—Balancing garden heritage conservation and contemporary park design.J. Landsc. Archit. 2009, 4, 70–81. [CrossRef]
20. Rostami, R.; Lamit, H.; Khoshnava, S.M.; Rostami, R. Successful public places: A case study of historical Persian gardens.Urban For. Urban Green. 2016, 15, 211–224. [CrossRef]
21. Fung, S.; Huang, J. Mutuality and the cultures of landscape architecture. New Archit. 2001, 19, 4–7.22. Fung, S.; Jackson, M. Four key terms in the history of Chinese gardens. In Proceedings of the International Conference on Chinese
Architectural History, Hong Kong, China, 7–10 August 1995; pp. 21–42.23. Fung, S. Self, scene and action: The final chapter of Yuan Ye. In Landscapes of Memory and Experience; Birksted, J., Ed.;
Spon Press: London, UK, 2000; pp. 129–136.24. Chen, C.Z. On Chinese Gardens; Tongji University Press: Shanghai, China, 1984; pp. 1–58.25. Fung, S. Longing and belonging in Chinese garden history. In Perspectives on Garden Histories; Conan, M., Ed.; Dumbarton Oaks:
Washington, DC, USA, 1999; pp. 205–219.26. Fung, S.; Liu, S.D.; Sun, Y. Aperspectival effects in the Liu Yuan, Suzhou. Archit. J. 2016, 56, 36–39.27. Yu, R.R.; Gu, N.; Ostwald, M. The mathematics of spatial transparency and mystery: Using syntactical data to visualise and
analyse the properties of the Yuyuan Garden. Vis. Eng. 2016, 4, 4. [CrossRef]28. Yuan, X.; Wu, S. Soundscape of classical Chinese garden. Front. Archit. Civ. Eng. China 2008, 2, 172–178. [CrossRef]29. Yu, R.R.; Ostwald, M. Spatio-visual experience of movement through the Yuyuan Garden: A computational analysis based on
isovists and visibility graphs. Front. Archit. Res. 2018, 7, 497–509. [CrossRef]30. Zhang, T.T.; Lian, Z.F.; Xu, Y.N. Combining GPS and space syntax analysis to improve understanding of visitor temporal–spatial
behaviour: A case study of the Lion Grove in China. Landsc. Res. 2020, 45, 534–546. [CrossRef]31. Mu, X.D. Image, word and Chinese gardens: Juxtaposition of photograph and lyric by Chen Congzhou. J. Tongji Univ. Soc. Sci. Sect.
2018, 29, 48–63.32. Elsadek, M.; Sun, M.; Sugiyama, R.; Fujii, E. Cross-cultural comparison of physiological and psychological responses to different
garden styles. Urban For. Urban Green. 2019, 38, 74–83. [CrossRef]33. Suthasupa, S. Kenrokuen’s six garden attributes and the understanding-and-exploration approach. Procedia Soc. Behav. Sci.
2012, 50, 657–666. [CrossRef]34. Tsumita, H.; Fukushima, K.; Shimazu, M. Study of the landscape composition and psychological evaluation in Japanese
Zakanshiki garden. J. Archit. Plann. AIJ 2016, 81, 2393–2399. [CrossRef]35. Sun, P. The Contrast Interpretation of Chinese Classical Gardens between Space Syntax Theory and Traditional Theories: The
Space Research of Chengde Mountain Resort. Ph.D. Thesis, Beijing Forestry University, Beijing, China, 2012.36. Chen, R. Research on Traditional Chinese Garden’s Space Syntax and Insights into Contemporary Regional Reconstruction.
Master’s Thesis, Tsinghua University, Beijing, China, 2012.37. Luo, J.C.; Hong, B. Analysis of the characteristics of Beijing Grand View Garden based on space syntax. South Archit. 2019, 190, 93–98.
[CrossRef]38. Polat, A.T.; Akay, A. Relationships between the visual preferences of urban recreation area users and various landscape design elements.
Urban For. Urban Green. 2015, 14, 573–582. [CrossRef]

Urban Sci. 2021, 5, 74 28 of 30
39. Lindemann-Matthies, P.; Köhler, K. Naturalized versus traditional school grounds: Which elements do students prefer and why?Urban For. Urban Green. 2019, 46, 126475. [CrossRef]
40. Wang, R.; Zhao, J.; Liu, Z. Consensus in visual preferences: The effects of aesthetic quality and landscape types.Urban For. Urban Green. 2016, 20, 210–217. [CrossRef]
41. Lin, W.; Chen, Q.B.; Jiang, M.Y.; Zhang, X.X.; Liu, Z.F.; Tao, J.Y.; Wu, L.J.; Xu, S.; Kang, Y.S.; Zeng, Q.Y. The effect of green spacebehaviour and per capita area in small urban green spaces on psychophysiological responses. Landsc. Urban. Plan. 2019, 192, 103637.[CrossRef]
42. Deng, L.; Li, X.; Luo, H.; Fu, E.K.; Ma, J.; Sun, L.X.; Huang, Z.; Cai, S.Z.; Jia, Y. Empirical study of landscape types, landscapeelements and landscape components of the urban park promoting physiological and psychological restoration. Urban For. UrbanGreen. 2020, 48, 126488. [CrossRef]
43. Harris, V.; Kendal, D.; Hahs, A.K.; Threlfall, C.G. Green space context and vegetation complexity shape people’s preferences forurban public parks and residential gardens. Landsc. Res. 2018, 43, 150–162. [CrossRef]
44. Rahnema, S.; Sedaghathoor, S.; Allahyari, M.S.; Damalas, C.A.; Bilali, H.E. Preferences and emotion perceptions of ornamentalplant species for green space designing among urban park users in Iran. Urban For. Urban Green. 2019, 39, 98–108. [CrossRef]
45. Zhao, J.W.; Xu, W.Y.; Li, R.J. Visual preference of trees: The effects of tree attributes and seasons. Urban For. Urban Green. 2017, 25, 19–25.[CrossRef]
46. Qiu, L.; Yu, N.; Gao, Y.; Zhang, T.; Gao, T. Public visual preference for dead wood in different types of landscape. Forests 2021, 12, 44.[CrossRef]
47. Yalowitz, S.S.; Bronnenkant, K. Timing and tracking: Unlocking visitor behavior. Visit. Stud. 2009, 12, 47–64. [CrossRef]48. Mygind, L.; Bentsen, P. Reviewing automated sensor-based visitor tracking studies: Beyond traditional observational methods?
Visit. Stud. 2017, 20, 202–217. [CrossRef]49. Zwinkels, J.; Oudegeest, T.; Laterveer, M. Using visitor observation to evaluate exhibits at the Rotterdam zoo aquarium. Visit.
Stud. 2009, 12, 65–77. [CrossRef]50. Kirchgessner, M.L.; Sewall, B.J. The impact of environmental, social, and animal factors on visitor stay times at big cat exhibits.
Visit. Stud. 2015, 18, 150–167. [CrossRef]51. Skov, M.; Lykke, M.; Jantzen, C. Introducing walk-alongs in visitor studies: A mobile method approach to studying user
experience. Visit. Stud. 2018, 21, 189–210. [CrossRef]52. Stylianou-Lambert, T. Photographing in the art museum: Visitor attitudes and motivations. Visit. Stud. 2017, 20, 114–137.
[CrossRef]53. Song, X.P.; Richards, D.R.; He, P.; Tan, P.Y. Does geo-located social media reflect the visit frequency of urban parks? A city-wide
analysis using the count and content of photographs. Landsc. Urban. Plan. 2020, 203, 103908. [CrossRef]54. Wei, H.X.; Ma, B.Q.; Hauer, R.J.; Liu, C.Y.; Chen, X.; He, X.Y. Relationship between environmental factors and facial expressions of
visitors during the urban forest experience. Urban For. Urban Green. 2020, 53, 126699. [CrossRef]55. Fox, D. External agents of change: A 10-year trend study of garden visitor behaviour in England. Tour. Recreat. Res. 2017, 42, 446–456.
[CrossRef]56. Li, D.Z. Introduction to Environmental Ethology; Tsinghua University Press: Beijing, China, 1999; pp. 1–11.57. Do, D.T.; Cheng, Y.; Shojai, A.; Chen, Y. Public park behaviour in Da Nang: An investigation into how open space is used.
Front. Archit. Res. 2019, 8, 454–470. [CrossRef]58. Sharif, A.A. User activities and the heterogeneity of urban space: The case of Dahiyat Al Hussein park. Front. Archit. Res.
2020, 9, 837–857. [CrossRef]59. Sonti, N.F.; Campbell, L.K.; Svendsen, E.S.; Johnson, M.L.; Novem Auyeung, D.S. Fear and fascination: Use and perceptions of
New York City’s forests, wetlands, and landscaped park areas. Urban For. Urban Green. 2020, 49, 126601. [CrossRef]60. Zhai, Y.J.; Baran, P.K.; Wu, C.Z. Can trail spatial attributes predict trail use level in urban forest park? An examination integrating
GPS data and space syntax theory. Urban For. Urban Green. 2018, 29, 171–182. [CrossRef]61. Zhai, Y.J.; Baran, P.K.; Wu, C.Z. Spatial distributions and use patterns of user groups in urban forest parks: An examination
utilizing GPS tracker. Urban For. Urban Green. 2018, 35, 32–44. [CrossRef]62. Hu, X.Y.; Shen, P.Y.; Shi, Y.; Zhang, Z.H. Using Wi-Fi probe and location data to analyze the human distribution characteristics of
green spaces: A case study of the Yanfu Greenland Park, China. Urban For. Urban Green. 2020, 54, 126733. [CrossRef]63. Guan, P.; Xu, X.D.; Xu, N.; Wang, W. Analyses of the impact of built environment factors of small public green spaces on public
health—A case study on the old city center of Nanjing, Jiangsu Province. Landsc. Archit. Front. 2020, 8, 76–92. [CrossRef]64. Jiang, J.Y.; Chen, M.; Zhang, J.H. Analyses of elderly visitors’ behaviors to community parks in Shanghai and the impact factors.
Landsc. Archit. Front. 2020, 8, 94–109. [CrossRef]65. Zhai, Y.J.; Baran, P.K. Urban park pathway design characteristics and senior walking behavior. Urban For. Urban Green.
2017, 21, 60–73. [CrossRef]66. Zhai, Y.J.; Li, D.Y.; Wu, C.Z.; Wu, H.B. Urban park facility use and intensity of seniors’ physical activity—An examination
combining accelerometer and GPS tracking. Landsc. Urban. Plan. 2021, 205, 103950. [CrossRef]67. Cohen, D.A.; Han, B.; Derose, K.P.; Williamson, S.; Marsh, T.; Raaen, L.; McKenzie, T.L. The paradox of parks in low-income areas:
Park use and perceived threats. Environ. Behav. 2016, 48, 230–245. [CrossRef] [PubMed]68. Chen, F.F. The Summary Reviews of Chinese Garden History Studies. Master’s Thesis, Tianjin University, Tianjin, China, 2007.

Urban Sci. 2021, 5, 74 29 of 30
69. Zhang, T.T. The Summary Reviews of Chinese Garden History Studies (2006–2011). Master’s Thesis, Tianjin University,Tianjin, China, 2012.
70. Gu, Z.X.; Zhang, Q.P. Research status and future trends of domestic studies on Suzhou classical gardens in the past two decades:Bibliometric analysis based on CNKI. Chin. Landsc. Archit. 2018, 34, 73–77.
71. Jim, C.Y.; Chen, W.Y. Recreation–amenity use and contingent valuation of urban greenspaces in Guangzhou, China.Landsc. Urban. Plan. 2006, 75, 81–96. [CrossRef]
72. Jim, C.Y.; Chen, W.Y. Leisure participation pattern of residents in a new Chinese city. Ann. Assoc. Am. Geogr. 2009, 99, 657–673.[CrossRef]
73. Lin, Q.Q.; Zhang, L.; Wu, G.L. Study on Chen Congzhou’s gardening theory from construction process of East Garden in TianyigeMuseum. Landsc. Archit. 2019, 36, 42–46. [CrossRef]
74. Shi, Z.Q. A preliminary study on Tianyige garden. In Tianyi Pavilion Series, 10th ed.; Tianyige, M., Ed.; Zhejiang Ancient BooksPublishing House: Hangzhou, China, 2012; pp. 224–228.
75. Lai, D.L. 20th century aesthetic studies of the Chinese garden and the contributions of Chen Congzhou. Architect 2018, 16, 15–22.76. Gu, K. Tentative study on historiographical context of Chen Congzhou’s Chinese garden research: Correlation and comparison
with Liu Dunzhen and Tong Jun. Architect 2019, 17, 66–72.77. Wu, X.Y. Comparison of differences between ancient and modern gardens. Chin. Landsc. Archit. 1999, 15, 64–65.78. Zhang, Y.Z.; Zhao, S.C. Spatial composition and pedestrian behavior characteristics in the traditional commercial streets of Lhasa,
Tibet. J. Archit. Plann. AIJ 2018, 83, 45–54. [CrossRef]79. Lynch, K. The Image of the City; The MIT Press: Cambridge, MA, USA, 1960; pp. 46–72.80. Norberg-Schulz, C. Existence, Space & Architecture; Praeger: New York, NY, USA, 1971; pp. 17–27.81. Norberg-Schulz, C. Architecture: Presence, Language and Place; Skira: Milan, Italy, 2000; pp. 131–158.82. Ashihara, Y. Exterior Design in Architecture; Van Nostrand Reinhold Company: New York, NY, USA, 1981; pp. 42–50.83. Li, X. Research on the Contemporary Open Space of Zhongguancun West Zone of Beijing. Master’s Thesis, Tsinghua University,
Beijing, China, 2011.84. Gehl, J. Life between Buildings: Using Public Space; Van Nostrand Reinhold Company: New York, NY, USA, 1987; pp. 155–162.85. Hillier, B.; Burdett, R.; Peponis, J.; Penn, A. Creating life: Or, does architecture determine anything? Archit. Comport./Archit. Behav.
1987, 3, 233–250.86. Kruger, M.J.T. On node and axial grid maps: Distance measures and related topics. In Proceedings of the European Conference
on the Representation and Management of Urban Change, Cambridge, UK, 28–29 September 1989; pp. 1–34.87. Tianyige Museum. 2017 Visitor Survey Report of Tianyige Museum. Available online: http://www.tianyige.com.cn/news/
notice/67a39924fefaa3326a8583ebc0b6cea3 (accessed on 24 August 2021).88. Tianyige Museum. 2018 Visitor Survey Report of Tianyige Museum. Available online: http://www.tianyige.com.cn/news/
notice/22c6d704c499ca3bee2ce2112c9c2634 (accessed on 24 August 2021).89. Tianyige Museum. 2019 Visitor Survey Report of Tianyige Museum. Available online: http://www.tianyige.com.cn/news/
notice/3bc241182db59f8cc323c1dc7eca83a3 (accessed on 24 August 2021).90. Tianyige Museum. 2020 Visitor Survey Report of Tianyige Museum. Available online: http://www.tianyige.com.cn/news/
notice/8a59b3e992f1a824e231f6ee08480b22 (accessed on 24 August 2021).91. Tianyige Museum. Official App of Tianyige Museum: Version 1.9 for Android and version 2.9 for iOS. Available online:
https://m.tyg.youwandao.com/download/ (accessed on 24 August 2021).92. Jia, J.P.; He, X.Q.; Jin, Y.J. Statistics, 7th ed.; China Renmin University Press: Beijing, China, 2018; pp. 67–88.93. Wen, Y.X. An Elementary Study on the Design of the Space of Verandas. Master’s Thesis, Southeast University, Nanjing, China, 2004.94. Zhang, X.Y. A Study on Design Theories of Traditional Chinese Garden-Passageway. Ph.D. Thesis, Beijing Forestry University,
Beijing, China, 2007.95. Tang, Z. Research on Passageway Space Quantization Characteristic in Jiangnan Private Gardens. Master’s Thesis, Nanjing
Agricultural University, Nanjing, China, 2009.96. Liu, J.H.; Yu, Y.F. Quantification study on space elements of Tianyige garden. J. Mt. Agric. Biol. 1999, 18, 167–170. [CrossRef]97. Ji, C. The Explanation of Yuan Ye, 2nd ed.; Chen, Z., Ed.; China Architecture & Building Press: Beijing, China, 1988; pp. 71–72.98. Pan, G.X. The problems of the layout of Suzhou gardens. J. Southeast Univ. 1963, 5, 45–65.99. Gu, K. Study on Gardens of Jiangnan Area in Ming Dynasty: Garden Ideas and Gardening Practices. Ph.D. Thesis, Southeast
University, Nanjing, China, 2008.100. Ding, S.G.; Lu, P.; Liu, Y.Y.; Cheng, S. Stationary point method applied in spatial analysis on Chinese gardens: Taking an example
of the Master of Nets Garden. J. Nanjing Agric. Univ. 2017, 40, 998–1006. [CrossRef]101. Ding, S.G.; Yang, Y.; Liu, Y.Y.; Niu, Y.; Lu, P. Study on regularities of stationary points distribution in Liu Garden based on visitors’
tour behaviors. Chin. Landsc. Archit. 2018, 34, 116–122.102. Senda, M.; Takagi, M.; Ogawa, K. Ro-space in the Chinese classical garden: Focused on the users’ understanding and their actions.
J. Archit. Plan. Environ. Eng. Trans. AIJ 2001, 66, 261–267. [CrossRef]103. Ren, L.D.; Takagi, M.; Senda, M. Ro-space in the Chinese imperial garden analyzed by the users’ stay. J. Jpn. Inst. Landsc. Archit.
2005, 68, 421–424. [CrossRef]

Urban Sci. 2021, 5, 74 30 of 30
104. Shanghai Yuyuan Tourist Mart (Group) Co., Ltd. Annual Report of Yuyuan Inc. 2019. Available online: https://www.yuyuantm.com.cn/uploads/20200326161127/f.pdf (accessed on 24 August 2021).
105. Yuan, F.F. Composition and Analysis of ‘Users’ of Tianyige. In Tianyi Pavilion Series, 11th ed.; Tianyige, M., Ed.; Zhejiang AncientBooks Publishing House: Hangzhou, China, 2013; pp. 165–167.
106. Lv, H. Research on the Relationship between Recreation Activity and Space of the City Park. Ph.D. Thesis, Shandong AgriculturalUniversity, Taian, China, 2013.
107. Su, M.M.; Wall, G. Residents’ use and perceptions of the Summer Palace world heritage site in Beijing, China. Int. J. Tour.Anthropol. 2014, 3, 357–369. [CrossRef]
108. Su, M.M.; Wall, G. Exploring the shared use of world heritage sites: Residents and domestic tourists’ use and perceptions of theSummer Palace in Beijing. Int. J. Tourism Res. 2015, 17, 591–601. [CrossRef]
109. Gu, X.S. Harmony between cultural heritage site and community: Taking the Mountain Resort in Chengde as an example.J. Hebei Norm. Univ. Natl. 2012, 32, 33–35. [CrossRef]
110. Sun, Z.; Sun, S.W.; Li, C.C. Exploration of Park City: Connotation, concept and development. Chin. Landsc. Archit. 2021, 37, 14–17.[CrossRef]
111. Ye, J.N.; Zhang, Y.; Wang, H. The new mode of the construction and development of Park City from the perspective of humanismin the new era. Chin. Landsc. Archit. 2021, 37, 24–28. [CrossRef]
Copyright © 2022 FDOKUMEN