A Case of Andhra Pradesh - krishi icar
327
See discussions, stats, and author profiles for this publication at: https://www.researchgate.net/publication/312529681 Drought Impacts and Mitigation Measures: A Case of Andhra Pradesh Article · December 2016 CITATIONS 0 READS 3,080 1 author: Some of the authors of this publication are also working on these related projects: 4. Spatio-temporal variation of groundwater resources and its impact on socio-economic conditions in rain fed areas: A Study of Trends in Groundwater Depletion in Andhra Pradesh, Jointly with Prof. V.Ratna Reddy, Director LNRMI, Hyderabad, Funded by RULNR, JTT. View project Panchayats and Watershed Development: An Assessment of Institutional Capacity View project Srinivasa Reddy Mandala Centre for Economic and Social Studies 49 PUBLICATIONS 48 CITATIONS SEE PROFILE All content following this page was uploaded by Srinivasa Reddy Mandala on 21 January 2017. The user has requested enhancement of the downloaded file.
-
Upload
khangminh22 -
Category
Documents
-
view
0 -
download
0
Transcript of A Case of Andhra Pradesh - krishi icar

See discussions, stats, and author profiles for this publication at: https://www.researchgate.net/publication/312529681
Drought Impacts and Mitigation Measures: A Case of Andhra Pradesh
Article · December 2016
CITATIONS
0READS
3,080
1 author:
Some of the authors of this publication are also working on these related projects:
4. Spatio-temporal variation of groundwater resources and its impact on socio-economic conditions in rain fed areas: A Study of Trends in Groundwater Depletion in
Andhra Pradesh, Jointly with Prof. V.Ratna Reddy, Director LNRMI, Hyderabad, Funded by RULNR, JTT. View project
Panchayats and Watershed Development: An Assessment of Institutional Capacity View project
Srinivasa Reddy Mandala
Centre for Economic and Social Studies
49 PUBLICATIONS 48 CITATIONS
SEE PROFILE
All content following this page was uploaded by Srinivasa Reddy Mandala on 21 January 2017.
The user has requested enhancement of the downloaded file.

THE ECONOMY OF ANDHRA PRADESH


EDITORS’ NOTE
The Indian Economic Journal (IEJ) is the prestigious Journal of the Indian Economic
Association (IEA)—the premier national level Association of the Indian Economic
Professionals. The Indian Economic Association has a long standing of 99 years in the
literary world. The literary contributions of the professionals, academicians and policy makers
from economics are published in The Indian Economic Journal, which also has 65 years of
existence. Both, IEJ and IEA have made a lasting contribution in fostering teaching and
research of high standards in India and abroad. The contemporary issues debated in IEA’s
conferences and seminars have topical relevance not only to the field of economics but also
to allied disciplines, which is commendable.
This special issue pertains to the theme of Economy of Andhra Pradesh. An overwhelming
response was received from members and the papers have been classified in six sub themes
as Impact of Bifurcation on the Finances of Andhra Pradesh and Post-Bifurcation Challenges;
Issues related to the Structural Change in the Economy of Andhra Pradesh; Performance of
Agriculture and allied Sectors in Andhra Pradesh; Issues related to Industrial Development;
Special Economic Zones and Environmental Issues in Andhra Pradesh; Issues related to the
Development of Services Sector in Andhra Pradesh; and Performance of Social Security
Programmes in Andhra Pradesh. The papers received were carefully scrutinized and categorized
for publication in full or as abstract each theme wise.
We are thankful to IEA for providing this opportunity for members to discuss and
articulate their views on the economy of Andhra Pradesh, especially after its bifurcation from
the state of Telangana. We would also like to express our thanks to IEA for publishing these
papers in a refereed ISSN numbered journal of repute.
Prof. B. Nagaraja
Convener
and
Prof. C. Gangaiah
Co-convener
Special Session on the Economy of Andhra Pradesh
Dept. of Economics
SV University, Tirupati


Theme - I
IMPACT OF BIFURCATION ON THE FINANCES OF ANDHRA PRADESH
AND POST-BIFURCATION CHALLENGES
1. New State Scaling Higher Growth Trajectory and Finance Ladder — Andhra Pradesh :
A Critique
K. MUNIRATHNAM NAIDU, K. SREENIVASULU NAIDU & M. DEVARAJULU . . . . . . . . . . . . . . . . . . . 3
2. Financial Doldrums in A.P. : A Post Bifurcation Challenge
K. SANTHA KUMARI . . . . . . . . . . . . . . . . . . . . . . . . . . . . . . . . . . . . . . . . . . . . . . . . . . . . . . . . . . . . . . . . . . . 19
3. Implications of Bifurcation on Economy of Andhra Pradesh : A Growth Perspective
S.B. YADAV . . . . . . . . . . . . . . . . . . . . . . . . . . . . . . . . . . . . . . . . . . . . . . . . . . . . . . . . . . . . . . . . . . . . . . . . . . . 28
4. Recent Trends and Targets of Andhra Pradesh Economy : Challenges and Opportunities
A. VENKATA PRASAD . . . . . . . . . . . . . . . . . . . . . . . . . . . . . . . . . . . . . . . . . . . . . . . . . . . . . . . . . . . . . . . . . . 35
5. Performance of Sect Oral Contribution in India’s Surise State Andhra Pradesh –
A Comparative Study of Pre-Bifurcation and Post-Bifurcation
P. JAYALAKSHMI . . . . . . . . . . . . . . . . . . . . . . . . . . . . . . . . . . . . . . . . . . . . . . . . . . . . . . . . . . . . . . . . . . . . . . 36
6. Implications of State Division on Andhra Pradesh State Finances
K. SIVARAM . . . . . . . . . . . . . . . . . . . . . . . . . . . . . . . . . . . . . . . . . . . . . . . . . . . . . . . . . . . . . . . . . . . . . . . . . . . 37
Theme - II
ISSUES RELATED TO STRUCTURAL CHANGES
IN THE ECONOMY OF ANDHRA PRADESH
7. Structure and Development in the Residuary State of Andhra Pradesh : 1960-2015
T. KOTI REDDY . . . . . . . . . . . . . . . . . . . . . . . . . . . . . . . . . . . . . . . . . . . . . . . . . . . . . . . . . . . . . . . . . . . . . . . . 41
8. Household Level Poverty in Two Economies of Andhra Pradesh & Telengana and Comparison
with Uttar Pradesh & All India
ALOK KUMAR PANDEY & A.K. GAUR . . . . . . . . . . . . . . . . . . . . . . . . . . . . . . . . . . . . . . . . . . . . . . . . . . . 52
9. Urban Development in Andhra Pradesh State : A Comparative Picture with Telangana State
MANSOOR RAHAMAN & N.T. NAIK . . . . . . . . . . . . . . . . . . . . . . . . . . . . . . . . . . . . . . . . . . . . . . . . . . . . . 65
10. Economic Scenario of Andhra Pradesh : Achieving Double Digit Inclusive Growth
BALLA APPA RAO & D. NAGAYYA . . . . . . . . . . . . . . . . . . . . . . . . . . . . . . . . . . . . . . . . . . . . . . . . . . . . . . 66
11. Prospectus for Urban Growth in Andhra Pradesh
M. KOTESWARA RAO . . . . . . . . . . . . . . . . . . . . . . . . . . . . . . . . . . . . . . . . . . . . . . . . . . . . . . . . . . . . . . . . . . 81
C O N T E N T S

THEME - III
PERFORMANCE OF AGRICULTURE
AND ALLIED SECTORS IN ANDHRA PRADESH
12. Performance of Agriculture in Andhra Pradesh
GITA G. PANDYA . . . . . . . . . . . . . . . . . . . . . . . . . . . . . . . . . . . . . . . . . . . . . . . . . . . . . . . . . . . . . . . . . . . . . . . 85
13. Agrarian Distress and Farmers Suicides in Andhra Pradesh : A Socio-Economic Analysis
G. SARITHA & K. MADHU BABU . . . . . . . . . . . . . . . . . . . . . . . . . . . . . . . . . . . . . . . . . . . . . . . . . . . . . . . . 90
14. Factors Responsible for Agrarian Crisis in Andhra Pradesh
SK. ASHA BEGUM . . . . . . . . . . . . . . . . . . . . . . . . . . . . . . . . . . . . . . . . . . . . . . . . . . . . . . . . . . . . . . . . . . . . . 98
15. Performance of Agricultural Sector in Andhra Pradesh
P. KOTHANDARAMI REDDY & KOTI REDDY TAMMA . . . . . . . . . . . . . . . . . . . . . . . . . . . . . . . . . . . . . 99
16. Performance of Agriculture with Special Reference to Undivided Andhra Pradesh
Y. VENKATA RAO . . . . . . . . . . . . . . . . . . . . . . . . . . . . . . . . . . . . . . . . . . . . . . . . . . . . . . . . . . . . . . . . . . . . . 108
17. Organic Farming in Andhra Pradesh
G. SAVARAIAH . . . . . . . . . . . . . . . . . . . . . . . . . . . . . . . . . . . . . . . . . . . . . . . . . . . . . . . . . . . . . . . . . . . . . . . . 109
18. Navyandhra Marching Towards Blue Revolution
G. SAVARAIAH . . . . . . . . . . . . . . . . . . . . . . . . . . . . . . . . . . . . . . . . . . . . . . . . . . . . . . . . . . . . . . . . . . . . . . . . 111
19. Export Potential of Agriculture of Andhra Pradesh – An Analysis
I. NARENDRA KUMAR & K. SUNEETHA . . . . . . . . . . . . . . . . . . . . . . . . . . . . . . . . . . . . . . . . . . . . . . . . 121
20. Development of Horticulture Sector in A.P. : An Analysis
G. SAVARAIAH & K. PRIYANKA . . . . . . . . . . . . . . . . . . . . . . . . . . . . . . . . . . . . . . . . . . . . . . . . . . . . . . . . 127
21. Agricultural Labour and Wage Rates in Andhra Pradesh : An Inter-District Analysis
SIVASANKAR, V & HEMANATHAN, S . . . . . . . . . . . . . . . . . . . . . . . . . . . . . . . . . . . . . . . . . . . . . . . . . . . 128
22. Role of Millets in Food Security and Nutritional Status in Andhra Pradesh
B. GUNA SEKHAR & E. LOKANADHA REDDY . . . . . . . . . . . . . . . . . . . . . . . . . . . . . . . . . . . . . . . . . . . 129
23. Agriculture Credit Flow in Andhra Pradesh : Action Plan and Strategies
SUBHENDU DUTTA & C.S. SHYLAJAN . . . . . . . . . . . . . . . . . . . . . . . . . . . . . . . . . . . . . . . . . . . . . . . . . . 136
24. Dairy Development in Andhra Pradesh : A Study of the Milk Cooperative Societies in
Nellore District
D. KRISHNAMOORTHY & A. MALLAPPA . . . . . . . . . . . . . . . . . . . . . . . . . . . . . . . . . . . . . . . . . . . . . . . . 148
25. Cooperative Banks for the Development of Agriculture Sector in Andhra Pradesh
M. USHARANI, K. SWAROOPPA RANI, V. SREEVANI & G. SAVARAIAH . . . . . . . . . . . . . . . . . . . . . . 156
26. Drought Impacts and Mitigation Measures : A Case of Andhra Pradesh
M. SRINIVASA REDDY . . . . . . . . . . . . . . . . . . . . . . . . . . . . . . . . . . . . . . . . . . . . . . . . . . . . . . . . . . . . . . . . 165
The Economy of Andhra Pradesh(iv)

THEME - IV
ISSUES RELATED TO INDUSTRIAL DEVELOPMENT,
SPECIAL ECONOMIC ZONES AND ENVIRONMENTAL ISSUES
IN ANDHRA PRADESH
27. Performance of Granite Industry in Chittoor District of Andhra Pradesh
VASU JALARI & M. DEVARAJULU . . . . . . . . . . . . . . . . . . . . . . . . . . . . . . . . . . . . . . . . . . . . . . . . . . . . . . 195
28. Industrial Air Pollution and its Effects on Health — A Case Study of Chittoor District
of Andhra Pradesh
C. GANGAIAH, M. RAMANJANEYULU & M. PRABHU . . . . . . . . . . . . . . . . . . . . . . . . . . . . . . . . . . . . 206
29. Special Economic Zones in Andhra Pradesh : An Empirical Study
SADU RAJESH . . . . . . . . . . . . . . . . . . . . . . . . . . . . . . . . . . . . . . . . . . . . . . . . . . . . . . . . . . . . . . . . . . . . . . . . 212
30. Industrial Development of Andhra Pradesh
D. NAGAYYA & BALLA APPA RAO . . . . . . . . . . . . . . . . . . . . . . . . . . . . . . . . . . . . . . . . . . . . . . . . . . . . . 219
31. Performance of Small Enterprises During the Reforms ERA — A Case Study in Chittoor
District of Andhra Pradesh
M. CHINNASWAMY NAIDU . . . . . . . . . . . . . . . . . . . . . . . . . . . . . . . . . . . . . . . . . . . . . . . . . . . . . . . . . . . . 230
32. The New Green Way to True Harita Andhra Pradesh
B. SRINIVASA RAO . . . . . . . . . . . . . . . . . . . . . . . . . . . . . . . . . . . . . . . . . . . . . . . . . . . . . . . . . . . . . . . . . . . . 240
33. A Study of Foreign Director Investment (FDI) Inflows Across States in India with
Special Reference to the State of Andhra Pradesh (AP)
LAILA MEMDANI . . . . . . . . . . . . . . . . . . . . . . . . . . . . . . . . . . . . . . . . . . . . . . . . . . . . . . . . . . . . . . . . . . . . . 242
THEME - V
ISSUES RELATED TO THE DEVELOPMENT OF SERVICE SECTOR
IN ANDHRA PRADESH
34. The Economics of Intellectual Property in Developing Andhra Pradesh
DVG KRISHNA, DUVVURI & V N PRADEEP . . . . . . . . . . . . . . . . . . . . . . . . . . . . . . . . . . . . . . . . . . . . . 245
35. Institutional Finance for the Development of SC/STs in Andhra Pradesh
G. SAVARAIAH, D. UDAYA SANTHI, P. KOTESWARI & V. SREEVANI . . . . . . . . . . . . . . . . . . . . . . . . 252
36. Does Banking Sector Help the Rural Poor? A Study on Micro Credit Through
Commercial Banks in Andhra Pradesh
M. MURALIMOHAN & M. DEVARAJULU . . . . . . . . . . . . . . . . . . . . . . . . . . . . . . . . . . . . . . . . . . . . . . . . 261
37. Implementation of Annual Credit Plans for Farm Finance : An Analysis
G. SAVARAIAH, S. SRAVANI & D. UDAYA SANTHI . . . . . . . . . . . . . . . . . . . . . . . . . . . . . . . . . . . . . . . . 270
Contents (v)

38. Analysis of the Links Between Public Expenditure on Education and Educational Sector
Performance in Andhra Pradesh
NASIR KHAN, B.M. VARADARAJA S, VASYANAIK B. . . . . . . . . . . . . . . . . . . . . . . . . . . . . . . . . . . . . . 278
39. Economic Status of Construction Workers : A Case Study in Tirpati Town of Chittor
District
K. RADHIKA . . . . . . . . . . . . . . . . . . . . . . . . . . . . . . . . . . . . . . . . . . . . . . . . . . . . . . . . . . . . . . . . . . . . . . . . . 279
THEME - VI
PERFORMANCE OF SOCIAL SECURITY PROGRAMMES IN
ANDHRA PRADESH
40. Public Private Partnership in School Education : Role of the Akshaya Patra in Mid Day
Meal Scheme in Visakhapatanam City
K. MANJUSREE NAIDU, M. SUDHA & G. RAGHAVAIAH . . . . . . . . . . . . . . . . . . . . . . . . . . . . . . . . . . . 283
41. Mahatma Gandhi National Rural Employment Guarantee Act in Andhra Pradesh
SHAIK AMEER . . . . . . . . . . . . . . . . . . . . . . . . . . . . . . . . . . . . . . . . . . . . . . . . . . . . . . . . . . . . . . . . . . . . . . . . 292
42. Public Distribution System and Food Security in Andhra Pradesh
G. SAVARAIAH & M. KUMAR RAJU . . . . . . . . . . . . . . . . . . . . . . . . . . . . . . . . . . . . . . . . . . . . . . . . . . . . . 293
43. A Comparative Study of the Performance of MGNREGA in Andhra Pradesh and
Telangana States
PUTTA MADHAVI & G SANDHYA RANI . . . . . . . . . . . . . . . . . . . . . . . . . . . . . . . . . . . . . . . . . . . . . . . . . 301
44. Food Security—Role of PDS in Undivided Andhra Pradesh
G. VENKATESWARLU . . . . . . . . . . . . . . . . . . . . . . . . . . . . . . . . . . . . . . . . . . . . . . . . . . . . . . . . . . . . . . . . . . 307
45. Impact of MGNREGS on Utilisation of Labour Force in Andhra Pradesh—
With Special Reference to Anantapur District
DHAKSHAYANI M. DONGRE & DHANJAYA K.B. . . . . . . . . . . . . . . . . . . . . . . . . . . . . . . . . . . . . . . . . . . 320
The Economy of Andhra Pradesh(vi)

THEME - I
IMPACT OF BIFURCATION ON THEFINANCES OF ANDHRA PRADESH AND
POST-BIFURCATION CHALLENGES


ARTICLE / 1
NEW STATE SCALING HIGHER GROWTHTRAJECTORY AND FINANCE LADDER—
ANDHRA PRADESH : A CRITIQUE
K. Munirathnam Naidu, K. Sreenivasulu Naidu & M. Devarajulu
The newly formed State of Andhra Pradesh with reduced area and population is the
result of bifurcation of comprehensive and combined State of Andhra Pradesh which continued
its existence for more than 60 years since 1 st November 1956 based on the recommendation
of the States’ Reorganisation Commission, Government of India. The first linguistic State of
Andhra was formed in April 1953, separating from former Madras State and the present Tamil
Nadu. Andhra State and Hyderabad State were united, as both are Telugu speaking States, on
1st November 1956, and named as Andhra Pradesh. The combined state grew on sound lines
but bifurcated, irrationally, hurriedly, by passing A.P. Reorganisation Act, 2014, following
unsound, whimsical policies without providing for basic capital city, institutions and
infrastructure. The new State of Andhra Pradesh came into being from 2 nd June 2014, with
governing facility for ten years from Hyderabad city. However, the dynamic and visionary
Chief Minister shifted the government to the newly constructed temporary buildings in
Amaravathi on 2nd November 2016 with moving all the departments into Secretariat at
Amaravathi, leaving skeleton staff at Hyderabad to meet the requirements of legal and
Governance activities.
Daringly meeting all the difficulties, with minimum support from Central Government,
the State Government of Andhra Pradesh made sincere and genuine efforts to overcome the
difficulties, converting the crisis into an opportunity to grow and develop on sound lines.
With this braveness the government laid solid foundation for “Sunrise Andhra Pradesh”. The
reconstruction is planned to promote inclusive growth and balanced development, taking into
confidence of and cooperation with all the stakeholders in the development process, of high
magnitude.
The Chief Minister of Andhra Pradesh rightly observed that “the new State of Andhra
Pradesh is currently placed at a defining moment in history. We are now charting our future
Full-Time Member, IV State Finance Commission, Government of Andhra Pradesh, HYDERBADFull-Time Member, Andhra Pradesh State Planning Board, Government of Andhra Pradesh, VIJAYAWADARegistrar, Sri Venkateswara University, TIRUPATI- Andhra Pradesh

4 The Economy of Andhra Pradesh
course of action to spin the wheels of development”¹. The article makes a critical appraisal
of growth path adopted and action being made by the newly created state. The first section
covers growth achieved, followed by the strategy pattern followed to achieve the targets in
Section-II; comparative growth picture and place reached among States in India is analysed
in Section-III, the present financial position of the State in delineated in Section IV, suggestions
for the development way forward in growth and development is included in Section V.
SECTION – I : GROWTH ACHIEVED
It is natural that State of Andhra Pradesh is primarily driven by Agriculture, compared
to the nation though services sector occupies higher first position in the composition of both
GSDP and NSDP. The composition also indicates the actual structural changes taking place
in the economy, entailing the Government to help formulation of plans for overall economic
development. They also throw light on the standard of living of the people. The composition
of shares of GDP and NSDP is given below:
Table – 1
The Sectoral Contribution in 2015-16 (AE) at Current Basic Prices (in percentage)
Sector Andhra Pradesh GSDP India NSDP
Agriculture 27% 17%
Industry 24% 30%
Services 47% 53%
Source: Socio Economic Survey, 2015-16, Planning Department, Govt. of Andhra Pradesh (GoAP), pp: 21-22
The shares of different sectors between 2005-06 and 2015-16 for Andhra Pradesh are
presented below in Table No. 2.
Table – 2
Sector Shares of Andhra Pradesh between 2005 and 2016 (in percentage)
Sector 2005-06 2010-11 2014-15 AE 2015-16 AE
Agriculture 28.00% 27.40% 27.60% 27.40%
Industry 22.50% 23.40% 20.60% 20.10%
Services 49.50% 49.20% 51.80% 52.50%
Source: Achieving Double Digit Inclusive Growth – A Rolling Plan 2015-16, Planning Dept., Go. AP, 2015 p: 19
It is very clear from the Table, that the shares of agriculture and industry in the State
GSDP have declined from 28% to 27.4% and 22.5% to 20.1% respectively from 2005-06 to
2015-16, but the share of service sector have shown hike by 3% in the same period. The trend
also indicates the future growth pattern of more dependence on service sector, followed by

5
industry and agriculture; however these three sectors have to be integrated by the State
Government with appropriate policy frame work and strategy as they would be the future
growth engines for attaining the vision targets fixed for 2029-30, through 2018-19 and 2022-
23 to achieve double digit inclusive growth in Andhra Pradesh.
GDP ANNUAL GROWTH RATES
Growth rates achieved in Andhra Pradesh and India is given in Table-3 below:
Table – 3
Annual Growth Rates between 2012-13 and 2014-15 in percentage at constant prices
Year Andhra Pradesh India
2012-13 4.05% 5.30%
2013-14 7.16% 6.60%
2014-15 7.21% 7.30%
2015-16 (AE) 10.99% 7.50%
Source: 1. Socio Economic Survey, 2015-16, Planning Department, Govt. of Andhra Pradesh (GoAP), p: 17
2. Achieving Double Digit Inclusive Growth – A Rolling Plan 2015-16, G O AP, 2015 p: 21
3. Economic Survey 2015-16, Govt. of India, PA4
The growth in Andhra Pradesh has moved to higher levels since 2013-14 at 7.16% to
double digit growth of 1099% in 2015-16 compared to India at 6.6% and 7.5% during the
same period. As per new series (base year 2011-12 prices) the pattern of higher growth is
posted for Andhra Pradesh (see Table-4)
Table – 4
GSDP of Andhra Pradesh and GDP of India between 2011-12 and 2015-16 in Percentage
Year Andhra Pradesh All India
Current Prices Constant Prices Current Prices Constant Prices
(2011-12) (2011-12)
2011-12 — — — —
2012-13 8.37% 0.10% 13.90% 5.60%
2013-14 14.00% 8.50% 13.30% 6.60%
2014-15 (FRE) 13.75% 7.98% 10.80% 7.20%
2015-16 (Adv) 13.22% 10.99% 8.60% 7.60%
Source : GOAP: (2016) Socio Economic Survey, 2015-16, Planning Department, p: 21
New State Scaling Higher Growth Trajectory • K.M. NAIDU, K.S. NAIDU & M. DEVARAJULU

6 The Economy of Andhra Pradesh
The State of Andhra Pradesh is zooming to higher levels of growth both in terms of
constant and current prices compared to All India Growth Rates. This trend also indicates the
potentiality to grow at double digit growth since 2013-14 in current prices (14%) and since
2015-16 in constant prices (10.99%).
SECTION – II : STRATEGY PATTERN FOLLOWED TO ACHIEVE THE GROWTH
TARGET
Andhra Pradesh is at the present defining moment with new state having formed on
irrational and hurried way without giving due rational and legal consideration to the needs
and requirements of people thrown out into open space without appropriate and adequate,
legal financial support. The new government charted its future course to run efficiently the
wheels of development. The course of the ship of the State is on troubled waters with no
assurance of sound financial help until recently from the Centre. Though the Centre announced
special package and released funds slowly, the Chief Minister strongly demanded on 30 th
October 2016 at Vijayawada at the foundation laying stone for core capital buildings at
Amaravathi, new capital of Andhra Pradesh. The Finance Minister Sri ArunJaitley assured the
State Government that special package will be given legal protection by approving the grant
of special package at the Central Cabinet Meeting of the Government of India.
Andhra Pradesh at the defining moment has named it to become the Sunrise State, is
moving with a new strategy to attain a big structural transformation, both in economic and
social terms having well-being of people at the central stage. From modest start in 2015-16,
the State broadly aims to achieve the status of high performing State amongst the three in the
Country by 2022-23; the government wants to make it the best State by 2029-30. For this
purpose, the State adopted a vision to make it the Sunrise State of Andhra Pradesh. To
achieve this goal, the State has to be transformed as leading investment destination in the
world by 2050 with the strategy of “swift growth in double digit, better infrastructure,
participatory planning and better governance through effective service delivery marked with
improved marked happiness index”. These comprehensive steps will be the key milestones
for realizing the vision in 2029
The Government aims to achieve the target of one of the top three states in India by
2022, in socio-economic development and ease of doing business; aspires to reach the status
of developed state in India by 2029 - the broad vision being to lay a strong foundation of the
Sunrise State of Andhra Pradesh. To achieve this vision the state has to move fast faced with
continuous double digit growth; the state must ensure delivery with the assured programme
based and Project investments, focusing on sustainable and inclusive development ² and growth
with a broad aim to spread or share the growth to all areas (regions), sectors and people
particularly marginalized sections to eliminate poverty, hunger, through provision of houses
for all downtrodden and neglected persons with required facilities like water, electricity,
transport, education, health, skills etc. for happy living. It means that the State should ensure

7
full employment to all job-seekers by integrated growth of agriculture, industry and service
sectors, in particular development of IT facilities in rural areas for its all-round growth like
urban areas. Following PURA (Providing Urban Facilities in Rural Areas) Policy and
implementing the same through high vision by government, is highly desirable and deserving
to help poor people, areas, sections etc. in the Andhra Pradesh.
STRATEGIC FRAMEWORK
No Doubt Andhra Pradesh unveiled a significant development through economic
efficiency, but the growth is not sufficient enough to overcome difficulties thrown on the
State by irrational and hurried division without adequate thought and reason for such important
issue of State division without sufficient legal protection on social, economic matters and
establishment of New Capital and institutions needed for its continuous growth with justice.
Moreover, the state fulfilled Minimum Development Goal (MDGS), they are not equivalent
with states like Kerala and Tamil Nadu in South and Maharashtra, Madhya Pradesh, Gujarat,
Haryana in the North India. MDGS Completed its period, in its place new reformative and
global Sustainable Development Goals (SDGS) have been adopted. These new goals proposes
to end poverty and deprivation in all forms, covering all people; further it wants development
economically, socially and environmentally useful and helpful continuously. Thus SDGS,
made Andhra Pradesh to take its goals seriously and transform the difficulties into opportunities
and challenges to achieve sustainable higher growth to meet its sudden bifurcation deprivations,
inadequate support from the Central Government.
With the above background the State has envisaged long term growth agenda of
participatory approach of all stake holders. Its strong strategic foundation for accelerated
growth momentum includes seven omissions, five grids, five campaigns, Janmabhumi
Programme and Smart Village Programme. This strategic approach is detailed below:
The Economic Development Board under the Chairmanship of Chief Minister will
oversee the operation of the missions, grids and campaigns for achieving accelerated economic
growth to see that Andhra Pradesh reaches amongst three high performing states in India by
2022-23, best State in India by 2029-30 and leading investment destination in the world by
2050-51. The State adopted for this purpose Rolling Plan model with “a systematic planning
that enables regular assessment and appraisal of overall policy targets with all inbuilt flexibility
ofupdation and revision of targets based on ground conditions”. The State also identified
growth engines of three (3) types to achieve double digit growth in 2015-16 at 2011-12
prices³ GVA growth rate of 10.5% compared³ - Economic Survey 2015-16, GoAPop.cit p.15
to 7.3% for India. Sectoral growth rates in Andhra Pradesh: Agriculture 8.40%, Industry
11.13%, Services 11.39%, Per Capita Income Rs.107532.
1. Seven Missions: Primary Sector Mission, Industry Sector Mission, Service Sector
Mission, Knowledge and Skill Development Mission, Social Empowerment Mission,
Urban Development Mission, and Infrastructure Mission.
New State Scaling Higher Growth Trajectory • K.M. NAIDU, K.S. NAIDU & M. DEVARAJULU

8 The Economy of Andhra Pradesh
2. The Five Grids: Water Grid, Power Grid, Roads Grid, Gas Grid and Optic Grid.
3. Five Campaigns: School is calling; Victory over Poverty, Health and Sanitation,
Water and Trees, Revival of Agriculture.
THREE TYPE OF GROWTH ENGINES
1. Components of GSDP which contribute more than 80% to their respective sector,
with potential for future growth
2. Subsectors delivery a sustained double digit growth over the last 5years
3. Sectors of GSDP allied with National Thirst Sectors with the promise of a large
future potential
The department in the state identified growth engines by following bottom – up approach,
with a focus on availability of low hanging fruits in 2015-16 for stimulating growth of the
economy. The same approach is likely to be adopted in future with suitable modifications
where necessary based on data availability and the target achieved.
SECTION – III : COMPARATIVE GROWTH PICTURE AMONG STATES
COMPARISON WITH OTHER STATES IN INDIA
In GSDP growth rates and in rankings, Andhra Pradesh has shown improvement compared
to other states in India as well as All India GDP rates with 2004-05 as base. The table below
presents this picture.
Table – 5
GSDP of Major States and All India at 2004-05 - Base Prices in percentage: 2014-15
State GSDP Growth Rates at Rank on GSDP PCI at PCI Rank
Constant Prices Growth Rates Current Prices
2012-13 2013-14 2014-15 2012-13 2013-14 2014-15 2013-14 2014-15
1 2 3 4 5 6 7 8 9
Maharashtra 7.80 7.30 5.70 3 5 12 129235 2
Uttar Pradesh 5.78 4.95 6.00 9 13 10 40373 13
Tamil Nadu 3.39 7.29 7.25 16 6 5 112664 3
Gujarat 6.15 8.76 NA 6 3 NA NA NA
West Bengal 7.53 6.91 7.15 4 10 7 78903 8
Karnataka 6.10 7.20 7.00 7 7 8 101594 5
Rajasthan 6.41 4.79 5.75 5 14 11 72156 9
Andhra Pradesh 4.05 7.16 7.21 14 8 6 90517 7
Madhya Pradesh 8.70 9.48 10.19 2 1 1 59770 10

9
1 2 3 4 5 6 7 8 9
Kerala 5.92 6.27 NA 8 11 NA NA NA
Telangana 4.11 4.76 5.30 13 15 14 103889 4
Haryana 5.50 6.97 7.76 10 9 4 147076 1
Bihar 10.69 9.12 9.45 1 2 3 36143 14
Punjab 4.63 5.73 5.32 12 12 13 99578 6
Odisha 3.76 1.82 8.08 15 16 3 59229 11
Assam 5.15 7.50 6.14 11 4 9 49480 12
All India GDP 4.47 4.74 NA NA NA
2004-05 Base
Source: Achieving Double Digit Growth – A Rolling Plan 2015-16, Govt. of Andhra Pradesh p.21
It is to be inferred from the Table that Andhra Pradesh improved its position extraordinarily
with hikes in Growth Rates from 4.05% in 2012-13 to 7.16% (3.11%) in 2013-14 period and
7.2% (0.5%) in 2014-15 and in rankings rose from 14 to 8 and 6 during the same period.
However, in Per Capita Income (PCI) at 2014-15 current prices, the State occupied 7 th Rank
in 2014-15.
SECTION – IV - FINANCIAL STATUS OF ANDHRA PRADESH
Nearly two and of years of state bifurcation made by Central Government, not providing
financial security and protection legally and failed to provide legal guarantee to special status
(social, financial, institutional, infrastructure etc.) announced by including in A.P. Bifurcation
Act,2014 passed in Parliament Houses, combinations of complex problems, including
construction of New Capital, Assembly High Court with sufficient infrastructural facilities,
etc, have multiplied with heavy financial impact, persist and continue to be a challenge for
the government. However, the government converted problems into challenges and opportunities
to innovatively and strategically face them with efficient policy implementation in the
appropriate, Planned direction and fully committed attitude and action with Rolling Plan
strategy with several missions, grids and campaigns under the able, dynamic and efficient
leadership of Chief Minister Sri. N. Chandra Babu Naidu garu, is finding solutions to overcome
compounded multifaced problems. On 29 th October, 2016, Central Finance Minister Sri Arun
Jaitley, it while laying foundation stone for Core Capital buildings at Amaravathi, new capital
city of Andhra Pradesh, gave assurance that Central Government would extend legal protection
to the special package (instead of special status) announced by the present Central Government
by passing it in the Cabinet meeting of Central Government.
Despite the severe problems forced on the new State, Government made the required
genuine efforts to register appreciable progress in fulfilling the targeted inclusive growth with
outstanding performance in the development of State economy covering all welfare sectors.
New State Scaling Higher Growth Trajectory • K.M. NAIDU, K.S. NAIDU & M. DEVARAJULU

10 The Economy of Andhra Pradesh
In this sincere effort for achieving higher growth rates (double digit rates) and make new
State reach amongst three highly developed (performing) states in India by 2022-23 by
promoting inclusive growth model, the present Government is sincerely and actively committed
to realise its aim within the period fixed.
STATE FINANCES
The bifurcation of Andhra Pradesh (A.P) on 2 nd June 2014 as per the enacted Andhra
Pradesh Reorganization Act (No.6 of 2014 ) was hasty and reckless, irrational and unreasonable
as many relevant issues relating to the State were ignored without visiting them in a legal way
and resolving in favour of new State to be build up from the scratch. This negligence pushed
the residuary state into extreme adverse financial situation. Moreover unscientific methodology
followed while allocating revenue receipts and expenditure at the time of bifurcation, the
residuary state of A.P was pushed into gigantic fiscal problems also besides other basic and
central problems. In the central taxes devolutions, may be the grants and market borrowings
allocated are similar to A.P and Telangana, but A.P lost major portion of her resource base
after division, making it in-competitive and ill-equipped with the revue supplies Telangana
State. This unfavourable situation in revenue side, and higher expenditure side, in terms of
allocation of debt, salaries, pensions and subsidies (based on population ration), pushed AP
into insurmountable financial difficulties as their new state has to bear higher expenditure
towards salaries and pensions forming 73% if its own resources, compared to low 58% in the
combined State. Naturally the un-favourable financial balance provide meagre scope for
development or capital assets creation expenditure in A.P. Thus many combined difficulties
all of a sudden to be faced by the new State pushed into heavy revenue deficit and also fiscal
defect of unprecedented magnitude. This could be well understood compared to the situation
that the combined state has never faced revenue deficit for nearly a decade before bifurcation
and fiscal deficit had never went beyond 3% of GSDP.
Facing the above adverse difficulties and unfavourable conditions, government of Andhra
Pradesh taking them as a challenge and an opportunity to grow, with a committed attitude and
innovative mind and better management technique and inclusive methodology is making all-
out efforts to improve the health of State Financial Position and status. The visionary leadership
from the State Cabinet led by daring and dynamic Chief Minister Sri N. Chandra Babu Naidu
garu with efficient management techniques helped by equally committed and efficient executive
team and officers and staff has been making all-out sustained efforts with a grand vision of
transforming the state into Swarna Andhra Pradesh through the strategy of inclusive, equitable
and sustainable development of double digit growth to attain the goal of placing Andhra
Pradesh amongst the three high performing States in India by 2022-23, best State in India by
2029-30 and leading investment destination in the world by 2050-51.

11
REVENUE OF THE STATE IN 2015-16
The state own tax revenue, own non-tax revenue and flow from the Centre for 2014-
15 and 2015-16 are given below in table 6.
Table – 6
State’s own revenue in Rs . Crores (Financial Year)
S. No. Tax / Revenue 2014-15 (02.6.14 to 31.03.16 ) 2015-16 (RE)
1 Sales Tax 21672 32840
2 State Excise 3642 4680
3 Taxes on Motor Vehicles 1423 1977
4 Stamps and Registration 2561 3500
5 Land Revenue 28 632
6 Professional Tax 185 302
7 Electricity duty 118 190
8 NALA 130 175
9 Other Taxes and duties 97 127
Total 29857 44423
Table No. 7
State’s Non Tax Revenue in Rs. Crores
S.No Tax / Revenue 2014-15 (02.6.14 to 31.03.16 ) 2015-16 (RE)
1 Mines and Minerals 811 1359
2 Forests 414 1072
3 Interest Receipts 371 154
4 Education 1087 1136
5 Medical and Health 72 95
6 Others 1200 1525
Total 3955 5341
The State’s own tax revenues, non tax revenues and flows from Central Government to
Andhra Pradesh as found in the Tables (6,7 and 8) improved substantially; own tax revenues
rose by 49% from on Rs.29857 Crores in 2014-15 to Rs.44423 Crores in 2015-16; Non Taxes
revenues by 35% from Rs.3955 Crores to Rs.5341 Crores and flows from Central Government
by 40% from Rs.28569 Crores to Rs.40104 Crores during the same period. In the composition
of revenues, among own taxes sales tax occupied 74% highest share, followed by State excise
11% stamps and registration 8%, taxes on motor vehicles 4%, other taxes and duties 2% and
New State Scaling Higher Growth Trajectory • K.M. NAIDU, K.S. NAIDU & M. DEVARAJULU

12 The Economy of Andhra Pradesh
hand revenue 1% the lowest and least share in 2015-16 and more or less the same importance
is to be seen in 2014-15; in non tax revenues highest share of 25 % is from mines and
minerals Rs.1359 Crores followed by others Rs.1523 Crores, education Rs.1136 Crores
(20%),forest Rs.1072 Crores (21%), interest receipts Rs.154 Crores and medical and health
Rs 95 Crores, the lowest share in 2015-16and the same importance is to be observed in 2014-
15. In the flows from Central Government, highest share is from Tax share devolution
Rs.21894 crores followed by plan Assistance and EAP Rs.9760 Crores, normal plan assistance
Rs.8500 Crores and Non plan grants Rs.1000 Crores the least share, and loans received
amounted to Rs.1260 Crores in 2015-16 and Rs.446 crores in 2014-15. In the Central transfers,
highest is from Finance Commission, followed by planning commission, Non-Plan grants and
non plan loans both in 2014-15 and 2015-16.
Table – 8
Flows from the Centre to Andhra Pradesh (Rs.in Crores)
Sl. No. Item 2014-15 (02.6.14 to 31.03.16 ) 2015-16
I Finance Commission 15557 30116
a Tax Share Devolution 11446 21894
b Grants 4071 8222
II Plan Assistance and EAP 11998 9760
a Normal Plan Assistance 11542 8500
1 Grants 11542 8500
2 Loans
b Externally Aided Projects 456 1260
1 Grants 10
2 Loans 446 1260
III Non-Plan Grants 588 1000
IV Non-Plan Loans 466 -772
a Small Savings (net) 466 -772
b Others
TOTAL 28569 40104
Source: For Table Nos. 6, 7 and 8 – Socio Economic Survey 2015-16, Govt. of AP, P-256
STATE’S TOTAL EXPENDITURE
The new state total expenditure was quite high both in 2014-15 and 2015-16 as shown
in Table.

13
Table – 9
Composition of Total expenditure in RsCrores
Item 2014-15 2015-16(RE)
Revenue Expenditure 75246 93521
Capital Outlay 6520 12559
Net Lending(loans and advances) 914 306
Total Expenditure 86906 106425
Source: Socio–Economic Survey 2015-16, GoAP P.257
It is clear, that out of total expenditure, revenue expenditure share is highest both in
2014-15 and 2015-16 Rs.75246 Crores out of Rs.86906 Crores and Rs.93521 Crores in
Rs.106425 Crores. As a new state is building everything from scratch and in particular to
build a developed Andhra Pradesh, the Government spent Rs.6520 Crores on Capital
Expenditure in 2014-125 which got nearly doubled to Rs.12559 Crores in 2015-16, to mainly
construct capital assets like irrigation, roads, infrastructure and revenue expenditure for welfare
schemes like subsidy rice, power subsidy, pavalavaddi, old age pensions, housing programmes
etc. Hence Capital expenditure and revenue expenditure zoomed to very high levels in the
initial two years and may have to be continued in next five to 10 years to build best modern
capital city with all essential institutes for extending good governance to people of the state.
It has also to purchase land nearly 30,000 acres from farmers in the villages by paying three
times present market price as per agreement entered into with farmers by Government in the
area around new Capital city area decided by the Government.
DEBT POSITION IN THE STATE
Facing both heavy revenue and capital expenditure and unable to meet fully from own
revenues and flow from Central government, the government secured loans by different
sources in the two years – 2014-15 and 2015-16 as detailed below.
Table – 10
Composition of total debt in crores
Item 2014-15 (02.06.2014 to 31.03.2015) 2015-16 (RE)
Central loans 16858 14210 (8%)
Market Loans 78440 95453 (56%)
Small saving loans 15178 14405 (9%)
PF 14822 15770 (9%)
Others 31175 30277 (18%)
Total Expenditure 156472 170115
Debt Outstanding as Percentage of GSDP 29.36 28.19
Source: Socio Economic Survey 2015-16, GoAP P.257
New State Scaling Higher Growth Trajectory • K.M. NAIDU, K.S. NAIDU & M. DEVARAJULU
14 The Economy of Andhra Pradesh
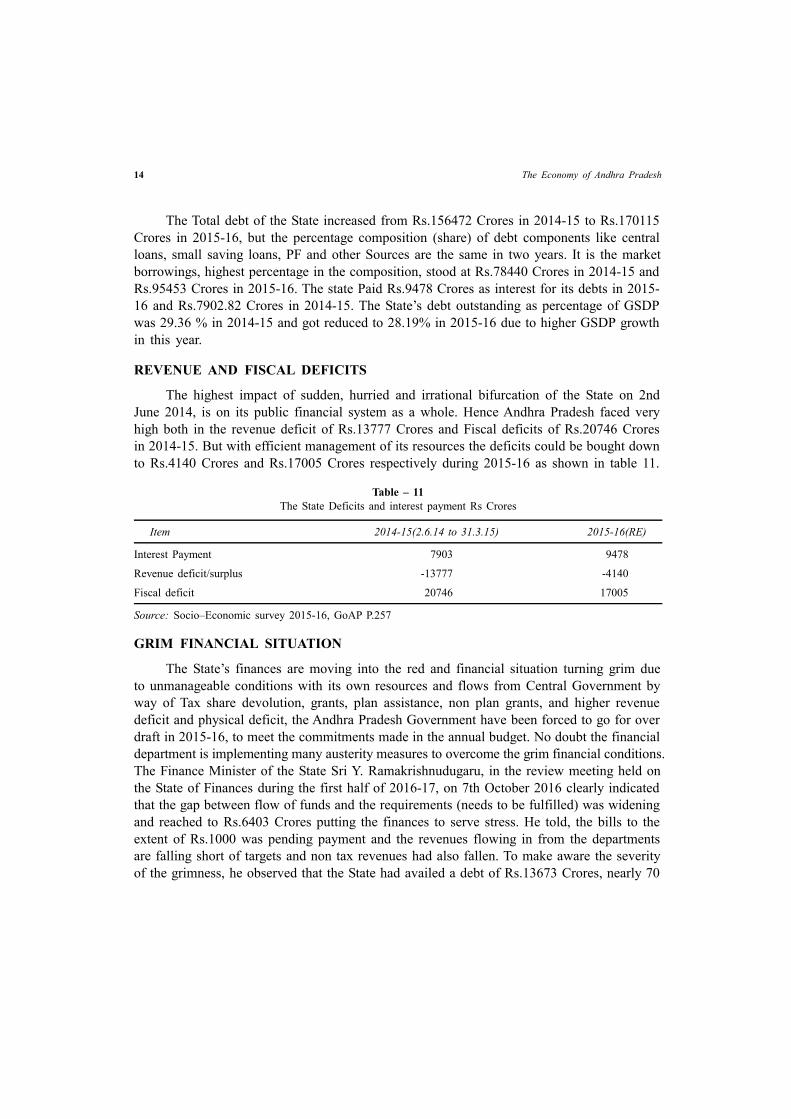
The Total debt of the State increased from Rs.156472 Crores in 2014-15 to Rs.170115
Crores in 2015-16, but the percentage composition (share) of debt components like central
loans, small saving loans, PF and other Sources are the same in two years. It is the market
borrowings, highest percentage in the composition, stood at Rs.78440 Crores in 2014-15 and
Rs.95453 Crores in 2015-16. The state Paid Rs.9478 Crores as interest for its debts in 2015-
16 and Rs.7902.82 Crores in 2014-15. The State’s debt outstanding as percentage of GSDP
was 29.36 % in 2014-15 and got reduced to 28.19% in 2015-16 due to higher GSDP growth
in this year.
REVENUE AND FISCAL DEFICITS
The highest impact of sudden, hurried and irrational bifurcation of the State on 2nd
June 2014, is on its public financial system as a whole. Hence Andhra Pradesh faced very
high both in the revenue deficit of Rs.13777 Crores and Fiscal deficits of Rs.20746 Crores
in 2014-15. But with efficient management of its resources the deficits could be bought down
to Rs.4140 Crores and Rs.17005 Crores respectively during 2015-16 as shown in table 11.
Table – 11
The State Deficits and interest payment Rs Crores
Item 2014-15(2.6.14 to 31.3.15) 2015-16(RE)
Interest Payment 7903 9478
Revenue deficit/surplus -13777 -4140
Fiscal deficit 20746 17005
Source: Socio–Economic survey 2015-16, GoAP P.257
GRIM FINANCIAL SITUATION
The State’s finances are moving into the red and financial situation turning grim due
to unmanageable conditions with its own resources and flows from Central Government by
way of Tax share devolution, grants, plan assistance, non plan grants, and higher revenue
deficit and physical deficit, the Andhra Pradesh Government have been forced to go for over
draft in 2015-16, to meet the commitments made in the annual budget. No doubt the financial
department is implementing many austerity measures to overcome the grim financial conditions.
The Finance Minister of the State Sri Y. Ramakrishnudugaru, in the review meeting held on
the State of Finances during the first half of 2016-17, on 7th October 2016 clearly indicated
that the gap between flow of funds and the requirements (needs to be fulfilled) was widening
and reached to Rs.6403 Crores putting the finances to serve stress. He told, the bills to the
extent of Rs.1000 was pending payment and the revenues flowing in from the departments
are falling short of targets and non tax revenues had also fallen. To make aware the severity
of the grimness, he observed that the State had availed a debt of Rs.13673 Crores, nearly 70

15
%, out of the estimated to borrow Rs.20097 Crores during 2016-17. The Government estimated
that the annual deficit would be Rs.4868 Crores but all by September 2016 (seven months)
unusually reached to Rs 6641 Crores, an excess of Rs.1773 Crores (40%). The overnment
departments are therefore, advised to spend judiciously by avoiding unproductive expenditure
during the next five months of year 2016-17. Even facing the severe financial constraints, the
Government is committed to keep its promises and would pay the second instalment of
Rs.3000 Crores for DWCRA groups to help female oriented organisations as advised by the
Chief Minister. The Government, more over already made payments to the farmers also for
this financial year (2015-16).5
The Government announced (by Finance Minister) that it would follow new system
from 2017-18 financial year.
According to Dr Arvind Panagaria, Vice Chairman, NITI Ayog, Andhra Pradeshv is
doing well in granting licences to industries very quickly, attracting investments from foreign
countries and also domestically, and connecting rivers in the State stand at first place in the
Country. Even in best practices in governance, Andhra Pradesh stand at high position in India.
The vision of Chief Minister in arranging Dash Board is wonderful idea in efficient
administrative practices; the idea of protecting withering crops with rain guns is learnt for the
first time by him only in this visit to Andhra Pradesh. All these positive visionary ideas of
Chief Minister of Andhra Pradesh with actual implementations have helped the State to
achieve double digit growth in 2015-16 and may continue in subsequent years to reach (the
goal of) amongst the three High Performing States in India by 2022-23, best State in the
Country by 2029-30 and leading investment destination in the world by 2050-51.
SECTION – V : SUGGESTIONS FOR WAY FORWARD FOR STATE DEVELOPMENT
The hasty and irrational bifurcation of Andhra Pradesh pushed the state into multifaceted
difficulties. The first solution to meet such unprecedented situation is to make the State
achieve sustainable double digit growth upto 2022-23 to occupy a position amongst the three
high performing states in India. This requires to significantly increase the growth rate and
share of agriculture, as Andhra Pradesh is mostly an agriculture oriented State now, besides
improving the industry sector to achieve higher growth rates. Agriculture should grow at 8
% rate and industry at 12 to 13% growth rates every year for which the State has potential
both in resources and entrepreneurial ability.
The strategy selected and implemented to grow into sunrise state is to adopt structural
transformation in social and economic terms focusing mainly on wellbeing of the people. The
long term target is to reach amongst the three high performing states in India by 2022-23, best
State in the country by 2029-30 and leading investment destination in the world by 2050-51.
The framework of implementation of new strategy is to implement through seven missions,
five campaigns and five grids. It requires effective management of resources, and utilisation
of best technology by experts with entrepreneurial ability to secure the time bound targeted
New State Scaling Higher Growth Trajectory • K.M. NAIDU, K.S. NAIDU & M. DEVARAJULU

16 The Economy of Andhra Pradesh
results with the inclusive growth model involving all the stake holders departments, sectors,
regions, administrators’ led by dynamic Chief Minister involving all Ministers.
The Financial status of the State Government is highly precarious and grim. The main
reason being sudden irrational and unscientific bifurcation of the State without legal assurance
to protect the new State in the development on sound lines. The special status promised was
not implemented and in its place special package is announced and amounts are being
released to the government.
This package has to be legally protected through approval by Cabinet of Central
Government as promised by Finance Minister, Central Government in October 2016.
The Central government has to liberally allocate funds for the construction of new
capital with the necessary institutions like Assembly buildings, High Court buildings,
infrastructure facilities like roads, railway lines, irrigation dams, educational and health
institutions of national and international importance.
The state requires exemptions through subsidies, waivers of taxes for the promotion of
industries in the State by attracting enterprises from other states in India, and other countries
in the world as, according to the World Bank and Government of India, Andhra Pradesh stood
first in case of doing business in India with a score of 98.8. The state has necessary resource,
skilled employees, best governance practices, liberal burearocracy, growth promotion policies
and efficient administrators etc. to help the State reach highest position in India by attracting
highest flow of foreign investments to promote industries in the State. It has also been
delivering on the promise of growth in annual GSDP growth with 7.2% in 2014-15 and
10.99% in 2015-16, and quarterly GSDP growth with 9.72% in 1 st Quarter of 2015-16 and
12.26% in 1st Quarter of 2016-177.
Andhra Pradesh is suffering from highest impact on its public financial system on
account of sudden, hurried and irrational bifurcation of the Sate on 2nd June 2014. It is facing
severe heavy strains both from revenue and fiscal deficits both in 2014-15 and 2015-16 and
may continue to suffer from such deficits for a long time. The Central Government, therefore,
must extend helping hand fully, more than hand holding, to overcome such deficits in future.
Then only new State can reach the position of three high performing states in India try 2022-
23, best state in the country by 2029-30 and leading investment destination in the world by
2050-51.
Most of its revenue is being spent for salaries, pensions of employees like subsides, old
age pensions etc and hence nearly 70% is spent on these items, leaving low amounts for
Capital outlay(Rs 6520 Crore in 2014-15 and Rs 12559 Crore in 2015-16). To meet the
deficits, the State is depending heavily on market loans (56%), Central loans(8 %) b, small
saving loans (9%) and other loans (18%). To meet the heavy loan burden of 28.19% in the
total GSDP, it is allotting substantial amount towards interest charges. Here also Central
Government should extend its help to the maximum extent to the new state of Andhra
Pradesh.

17
In the review meeting held for the State Finances during first half of 2016, by the State
Finance Minister on 7th October 2016, it was found that gap between flow of funds and
requirements was widening and reached to Rs.6403 Crore putting the finances to severe
stress. To meet this heavy burden the State had already availed debt of Rs.13673 Crore nearly
70 % out of the amount estimated to borrow Rs.20097 Crore during 2016-17. No doubt the
government is following severe austerity measures by limiting the expenditure only to essential
needs. Here also Central Government should be magnanimous in treating the grim financial
situation of A.P by liberal attitude to reduce the burden of borrowing amounts, by releasing
sufficient required funds from the Special Package granted to Andhra Pradesh.
The Severe austerity measures taken to control unnecessary expenditure by the A.P
Government, to avoid heavy borrowing must be matched by liberal financial help by the
Central Government through special package announced to Andhra Pradesh and timely release
of the amounts from this package to help definitely make the State reach as the best state in
India by 2029-30 and leading investment destination in the world by 2050-51.
CONCLUSION
The sudden hurried, irrational and unreasonable bifurcation of combined Andhra Pradesh
into Andhra Pradesh (a residuary State) and Telangana by passing Andhra Pradesh
Reorganisation Act, 2014, in Parliament and creation of new Andhra Pradesh on 2 nd June
2014 has impacted the State severely on social, economic and financial position of the State.
The Special status expected to be announced by the Central Government has not materialised
into action, further throwing the fiscal position of the State into unprecedented severe, painful
financial situation. Despite such unfavourable conditions, the challenges to be faced were
taken as opportunities to grow and develop a new State as a Sunrise Sate and best State in
India. For transformation of Andhra Pradesh, the government of Andhra Pradesh headed by
daring innovative and dynamic Chief Minister Sri N. Chandra Babu Naidu Garu patterned the
growth based on new strategies to realise grand vision. The Vision is to make the state reach
amongst the three high performing states in India by 2022-23, best State in the Country by
2029-30, leading investment destination in the world by 2050-51. The model followed is
inclusive growth covering all the stakeholders -people, administration, experts, organisations,
association, etc., in full involvement with participating mechanism in all actions and activates.
His strategy framework for achieving double digit inclusive growth of Andhra Pradesh during
2015-29 are seven missions, five campaigns and five grids.
During 2014-15 and 2015-16, Andhra Pradesh achieved higher growth rates reaching
to GVA growth rate of 10.5% in 2015-16 compared to 7.3% in India. The sectoral growth
rates achieved are 8.40% in Agriculture, 11.3% in industry and 11.39% in services sector.
Some Capital assets also have been created like Polavaram Project, IITs, IIMs, National
Health Institute etc. However the severe financial pains are persisting like heavy revenue
deficits and fiscal deficits; debt outstanding as percentage of GOP stood at 28.19% in 2015-
New State Scaling Higher Growth Trajectory • K.M. NAIDU, K.S. NAIDU & M. DEVARAJULU

18 The Economy of Andhra Pradesh
16. To meet the severe financial stress, the state contracted heavy market borrowings, loans
from Centre (8%), small saving loans (9%), PF Loans (9%) other loans (56%) – reaching to
Rs.170115 Crores. Moreover the state to meet the widening gap between flow of funds and
requirements for 2016-17 availed already debt of Rs.13673 nearly 70% out of the estimated
amount to borrow Rs.20097 (2016-17). The State is adopting severe austerity measures to
meet the excessive borrowings. Hence the Central Government with magnanimity, noble and
rational thinking must transform the assurances of special package to State in Cabinet meeting
into reality and provide legal status to allocate liberal funds to the new sunrise of Andhra
Pradesh to attain the best state status by 2029-30 and leading investment destination by 2050-
51. This is possible only when the state adopts progressive policies to integrate agriculture,
industry with service sector, in particular, internet and information Technology with the
support of the required infrastructure facilities and interlink rural areas with urban areas
providing urban facilities in rural areas for reaching the goal of Swarna Andhra Pradesh - the
present visionary idea of the Andhra Pradesh Government.
The World Bank ranked Andhra Pradesh Number One in the ease of business in India
with scope of 99.88 and State is delivering on the promises of growth both in annual GSDP
growth in 2014-15 and 2015-16 and quarterly GSDP growth @9.72% in 1 st quarter of 2015-
16 and @12.26% in 1st quarter of 2016-17, showing its potentiality to move forward with
greater accelerated growth rates to achieve the desired goals to make Andhra Pradesh as the
best State in India, and leading investment destination in the World.
REFERENCES
1. Sri N. Chandrababu Naidu, Chief Minister, Government of Andhra Pradesh; Foreword in “Achieving
Double Digit Inclusive Growth – A Rolling Plan 2015-16”.
2. Achieving Double Digital Inclusive Growth - A Rolling Plan 2015-16, op.cit. PP 10-11
3. Economic Survey 2015-16, GoAP op.cit p.15
4. The Hindu, Friday, 29thOctober 2016 Hyderabad Edition P. 6
5. The Hindu, Saturday, October 8, 2016, Hyderabad edition P.5
6. Andhra Jyothy, Telugu language daily, Wednesday 9th November 2016, Andhra Pradesh, Hyderabad
Edition P.5.
7. The Hindu, Friday, November 11, 2016, City Edition, Hyderabad p.1.

19
ARTICLE / 2
FINANCIAL DOLDRUMS IN A.P. :A POST BIFURCATION CHALLENGE
K. Santhakumari
INTRODUCTION
Andhra Pradesh has been one of the frontrunners among the progressive States of India.
The bifurcation of the State had significant implications of resource flow to the two new
States – Telangana and residual Andhra Pradesh and their economic development. Especially
A.P. is facing considerable complications in working out both revenue and expenditure and
fiscal transfers. The loss of urban growth Centre Hyderabad to Telangana, which is the Centre
of economic activities and a major source of government finance, is critically affecting the
fiscal prospects of the State.
The announcement of a special financial package by the central government for the
development of Andhra Pradesh in lieu of the Special Category Status has put several questions
in its implications on AP economy. An attempt is made in this paper, to highlight the key
aspects that have a bearing on the resource/finance flow and economic development of A.P.
It also analyzes the division of assets and liabilities and debt burden of A.P.
THE FISCAL CHALLENGE
Due to the variance in methodology adopted for allocation of revenue receipts and
expenditure, the residuary State of A.P. is facing tremendous fiscal challenges. The total
receipts of revenue including State’s own revenue, Central taxes devolution, grants and
market borrowings are going to be the same for both Telangana and residuary State of Andhra
Pradesh – with entire Hyderabad revenue going to Telangana. However, on the expenditure
side due to the allocation of debt, salaries, pensions and subsidies based on population ratio,
the residuary State of A.P. will have more i.e., 58 per cent of share, while Telangana will have
only 42 percent. The result is high revenue deficit and fiscal deficit for residuary State of
Andhra Pradesh – unprecedented and like never before.
TRENDS IN REVENUE RECEIPTS
The strength in the finances of any government is revealed through receipts i.e., the
Professor, Department of Economics, S.V.University, Tirupati, A.P.

20 The Economy of Andhra Pradesh
income generating capacity of the State. The surprising fact is that the new government is
projecting almost the same volume of receipts under this account even after bifurcation.
While the total revenue receipts of the combined State stood at Rs.80,996crore for 2010-11,
the same was projected to be Re.1,09,300 crore for 2016-17 a quantum jump in the revenue
generating capacity of the State. However, in relative terms, the share of own tax revenue has
fallen sharply from the undivided position of 55.73 percent to 47.87 percent.
The Share of Stateexcise also gone down substantially from 10.20 percent to 5.27
percent in spite of the all out effort of the government to increase revenue from Abkari and
liberal licensing to Bar and Restaurants. As ‘the share of taxes from the divisible pool to the
Central Government by virtue of significant rise from 32 to 42 percent and reduction of
member of centrally sponsored schemes, it is highly precarious to depend on the central
assistance by way of grants-in-aid any longer.
TRENDS IN REVENUE EXPENDITURE
An analysis of the trends in the revenue expenditure of the Stateof Andhra Pradesh
would reveal many interesting aspects. First, there was no revenue deficit in the undivided
State of Andhra Pradesh (than expected) or due to cut in the allocated expenditure to various
departments, the erstwhile government appears to have taken adequate care to see the finances
of the State did not land in deficit. It is only after the new government (after bifurcation)
assuming Office in June 2014, could find a large volume of a deficit of Rs.24,315crore,
which is the contentious issue between the central Government and the State Government.
Second, there was huge social expenditure towards social services covering education,
health, family welfare, water supply, sanitation, housing, urban development and nutrition had
been significant at above 40 percent always. The revenue expenditure has fallen down by
Rs.20,000crore over the previous, resulting in huge deficit.
This was followed by expenditure on general services including the maintenance of
State departments, fiscal services and pensions. The most significant of this is the servicing
of the debt and interest payments, which were projected to be highest at Rs.12,853Crore
during 2016-17. The expenditure towards economic services consisting of agriculture and
allied activities, Rural Development, Irrigation and Flood control energy, Industry, Minerals,
Transport, Science & Technology and Environment. The State of A.P. would suffer from
revenue deficit of Rs.1,92,798 crore.
The details of the fiscal situation in Andhra Pradesh are furnished in Table 1. It is
evident from Table-1 that the revenue receipts increased from Rs.840661 crore in 2014-15 to
Rs.90125.0 crore in 2015-16. Shared taxes revenue rose from Rs.16838.8 to Rs.22638.0 and
the tax revenue from Rs.38475.1 to Rs.44423.4 crore in the same period. The Capital receipts
recorded a fall from Rs.26289.0 crore to Rs.22727.5 crore. Loans from the Centre increased
from Rs.978.3 crore to Rs.1260 crore. Thus, total receipts recorded a marginal increase only
from Rs.110355.1 crore in 2014-15 to Rs.112852.5 crore during 2015-16 (BE).

21
Table – 1
Fiscal Situation in Andhra Pradesh-Composition of Total Receipts
2014-15RE As % of Sub- 2015-16 As % of Sub BE Over
(Rs. Cr) Total com- BE Total compo- RE (%)
Receipt position (Rs. Cr) Receipts sition
REVENUE RECEIPTS 84066.1 76.2 100.0 90125.0 79.9 100.0 7.2
1 Shared Taxes 16838.8 15.3 20.0 22638.0 20.1 25.1 34.4
2 Tax Revenue 38475.1 34.9 45.8 44423.4 39.4 49.3 15.5
3 Non Tax Revenue 8921.4 8.1 10.6 5341.3 4.7 5.9 -40.1
4 Grants in Aid 19830.8 18.0 23.6 17722.3 15.7 19.7 -10.6
CAPITAL RECEIPTS 26289.0 23.8 100.0 22727.5 20.1 100.0 -13.5
5 Open Market Loans 18532.9 16.8 70.5 18577.1 16.5 81.7 0.2
6 Floating Debt (Gross) 1000.0 0.9 3.8 1260.0 0.9 4.4 0.0
7 Loans from the centre 978.3 0.9 3.7 1260.0 1.1 5.5 28.8
8 Other Loans 2994.0 2.7 11.4 889.4 0.8 3.9 -70.3
9 Deposits Transactions (Net) 862.2 0.8 3.3 748.4 0.7 3.3 -13.2
10 Loans and Advances 1921.6 1.7 7.3 252.6 0.2 1.1 -86.9
TOTAL RECEIPTS (I+II) 110355.1 100.0 112852.5 100.0 2.3
Source: Volume VI, Budget-in Brief, 2015 of Andhra Pradesh
Table – 2
Composition of Tax and Non-Tax Revenue of A.P.
2014-15RE Relative Sub 2015-16 BE Sub Relative BE over
(Rs. Cr) (Rs. Cr) Compo- (Rs. Cr) Compo- Share (%) RE (%)
sition sition
1 2 3 4 5 6 7
State Own Tax Revenue 38208.92 81.07 100.00 44121.27 89.20 100.00 15.47
Land Revenue 65.78 0.14 0.17 631.56 1.28 1.43 860.11
Of which Sale Proceeds of
Waste Lands & Redemption
of Land Tax 54.99 0.12 0.14 528.00 1.07 1.20 860.11
Stamp Duty &
Registration Fee 2900.0 6.15 7.59 35000.0 7.08 7.93 20.69
Tax on Immovable Property
other than Agricultural
Land 116.53 0.25 0.30 174.80 0.35 0.40 50.00
Financial Doldrums in A.P. : A Post Bifurcation Challenge • K. SANTHAKUMARI

22 The Economy of Andhra Pradesh
1 2 3 4 5 6 7
State Excise 4229.57 8.97 11.07 4680.00 9.46 10.61 10.65
Tax on Sales Trade 28749.15 61.00 75.24 32840.00 66.39 74.43 14.23
Tax on Vehicles &
Goods and Passengers 1824.57 3.87 4.78 1992.87 4.03 4.52 9.22
Taxes & Duties on Electricity 189.22 0.40 0.50 190.14 0.38 0.43 0.49
Other Taxes & Duties 134.10 0.28 0.35 111.90 0.23 0.25 -16.55
State Own Non-Tax
Revenue 8921.39 18.93 100.00 5341.34 10.80 100.00 -40.13
Interest Receipts 4848.23 10.29 54.34 187.81 0.38 3.52 -96.13
General Services 581.09 1.23 6.51 423.10 0.86 7.92 -27.19
Social Services 230.79 0.49 2.59 1256.38 2.54 23.52 444.38
Of which Education,
Sports, Art And Culture 89.57 0.19 1.00 1135.91 2.30 21.27 1168.18
Economic Services 3261.28 6.92 36.56 3474.05 7.02 65.04 6.52
State Own Revenue 47130.31 100.0 49462.61 100.00 4.95
Source: Volume VI, Budget-in Brief, 2015 of Andhra Pradesh
Table – 3
Composition of Total Expenditure of A.P
2014-15 Sub 2015-16 Sub BE over
RE(Rs. Cr) RE(Rs. Cr)BE(Rs. Cr) Composition RE(%)
I PLAN EXPENDITURE 22748.9 20.30 34412.5 30.44 51.27
a Revenue Account 15164.6 13.53 24201.1 21.41 59.59
b Capital Account 7146.5 6.38 9818.7 8.69 37.39
c Loans And Advanes 437.8 0.39 392.7 0.35 -10.30
II NON-PLAN EXPENDITURE 89318.5 79.70 78636.5 69.56 -11.96
a Revenue Account 83144.0 74.19 73223.7 64.77 -11.93
Of which Interest payments 9676.2 8.63 11198.2 9.91 15.73
b Loans And Advances 414.8 0.37 325.7 0.29 -21.48
III TOTAL EXPENDITURE (I+II)/(A TO D) 112067.5 100.00 113049.0 100.00 0.88
A REVENUE EXPENDITURE 98308.6 87.72 97424.8 86.18 -0.90
B CAPITAL EXPENDITURE 7146.5 6.38 9818.7 8.69 37.39
C LOANS AND ADVANCES 852.5 0.76 718.4 0.64 -15.74
D CAPITAL DISBURSEMENTS 5759.8 5.14 5087.1 4.50 -11.68
Source: Volume VI, Budget-in Brief, 2015 of Andhra Pradesh

23
TABLE – 4
Deficit Situation of Andhra Pradesh
2014-15 RE % 2015-16 BE %
FISCAL DEFICIT 2032009.87 100.00 1758424.40 100.00
REVENUE DEFICIT 1424257.31 70.09 729978.67 41.51
CAPITALEXPENDITURE 714653.57 35.17 981871.15 55.84
NET LENDING -106901.01 -5.26 46574.58 2.65
Source: Volume VI, Budget-in-Brief, 2015 of Andhra Pradesh
The composition of total receipts of Andhra Pradesh is provided in Table-2. The
composition of total expenditure is furnished in Table-3 and the deficit situation of Andhra
Pradesh is shown in table-4.
From Table-2 it is evident that State of Andhra Pradesh is doing better in fiscal matters,
as from 2014-15 to 2015-16 an increase of Rs. 5912.35 crore was recorded in the State own
tax revenue. In this, the share of tax on sales trade stood on top with Rs.28749.15 crore in
2014-15 and Rs. 32840.00 crore in 2015-16. The share of State excise occupies next place.
However, the State own non-tax revenue recorded a fall from Rs.8921.39 crore to Rs.5341.34
crore during the above period. Thus, the State own revenue has recorded a small increase
from Rs. 47130.31 crore to Rs. 49462.61 crore in above Period.
As far as the Expenditure account is concerned, it is evident from Table-3, that plan
expenditure has recorded an increase from Rs. 22748.9 crore in 2014-15 to Rs. 34412.5 crore
in 2015-16. A steep fall was witnessed in the case of non-plan expenditure from Rs.89318.5
crore to Rs.78368.5 croreduring the above said period. Thus, a marginal increase in total
expenditure was recorded during the period.
It is a good indication that the State of Andhra Pradesh is doing better as is evident from
a decreasing fiscal deficit from Rs.2032009.87 in 2014-15 to Rs.1758424.40 crore in 2015-
16 (Table-4). Same is the case with revenue deficit, but, capital expenditure has recorded a
steep rise from Rs.714653.57 crore to Rs. 981871.15 crore during the same period.
HUGE DEBT BURDEN
The public debt in Andhra Pradesh has reached to an alarming level with the total debt
incurred by the Statewas expected to cross Rs.1.7 lakh crore by the end of Financial year
2016-17. The burden has been increasing with every passing month in addition to the
Rs.73,856crore it inherited as its share after bifurcation. The debt run up by the combined
State of Andhra Pradesh is bequeathed to Telangana and Andhra Pradesh on the basis of
population ratio of 58:42. So, of the Rs.1.26 lakh crore raised by the market in united Andhra
Pradesh during the last 10 years, the share of residual Andhra Pradesh stood at Rs.73,856
crore, while Telanganaat Rs.52.144 crore.
Financial Doldrums in A.P. : A Post Bifurcation Challenge • K. SANTHAKUMARI

24 The Economy of Andhra Pradesh
During the financial year 2015-16, the State raised Rs.6,000 crore by way of government
bonds. This reflects the tight financial position of the State, which has beenalready reeling
under a huge revenue deficit as a consequence of bifurcation. Added to this Rs.6000 crore
loans raised during the year 2015-16, total burden of the Statehas gone up to Rs.80,000 crore.
MARKET BORROWINGS
Market Borrowings, which stood at Rs.78,440 crore in financial year 2014-15, went up
to Rs.95,453 crore at the end of the current financial year. The State paid Rs.9,478crore as
interest towards its debt and debt outstanding as percentage of the GSDP was 28.19 per cent
during the same year. However, the State could bring down the debt as percentage of GSDP
from 29.36 per cent in 2015-16 because of its greater GSDP growth during the year. Market
borrowings consisted a major chunk of 56 per cent of the total loan outstanding while loans
from other sources accounted to 18 per cent. To Service the debt outstanding Rs.80,000crore,
the service would have to shell over Rs.60,000 crore towards interest alone over a ten year
period.
SERVICE RESOURCE CRUNCH
The State finances are in the red with negative cash balance of Rs.490 crore in 2015.
It was inevitable for the State to go overdraft facility with a higher interest rate of 14 per cent
and more for short term credit. The “Sankranti gift” to the poor to the tune of Rs.325 crore
and release of Rs.1,500 crore pending industrial incentives of last five years, Rs.5000 crore
for debt relief of farmers, apart from pensions and scholarships the expenditure has overshooted
its revenue by about 30 per cent reflecting a dismal situation of the economy.
PROBLEMS OF RESOURCE ALLOCATION
The bifurcation of A.P. into two new States has significant implications on resource
flow, economic development and the levels of publicly provided services for the two new
States. At the centre of this bifurcation is the capital city of Hyderabad, which was declared
as the common capital of the two States for 10 Years. However its revenues were allocated
toTelangana. Being the hub of economic activities and the source of government finance,
Hyderabad has become the deciding factor for fiscal prospects of two new States. Further, the
trade of some goods and services within the united A.P. became cross-State in the new
Andhra Pradesh. Non-Tax revenues following mainly the principle of location, was differentially
affected. The division of mineral resources including coal and oil and gas have affected their
royalties. Only, off-shore resources were given to new A.P.
PRIVILEGES OF SPECIAL CATEGORY STATUS
Under Section 95 of the Reorganization Act, the Central Government should take
appropriate fiscal measures, to the success of States to promote industrialization and economic

25
growth in both States. The Central Government has to support the programs for the development
of back word areas of new A.P. especially the Rayalaseema and north coastal region including
expansion of physical and social infrastructure. The Central Government should provide
special financial support for the creation of essential facilities in the new capital of A.P
including the Raj Bhavan, High Court, Government Secretariat, Legislative assembly, legislative
council and such other essential infrastructure.
The new A.P. is aspired for the award of special category status in plan assistance. This
move helps to compensate for the eventual loss of Hyderabad, as well as facilitates for the
development of a new capital for new State. The planning commission providesStates plan
assistance under ‘normal’ plan assistance and ‘special’ plan assistance. In case of normal plan
assistance, 30% of the budget is earmarked for special category States, and assistance is
provided in the form of 90% of grants and 10% of loans. The special plan assistance includes
externally aided projects. The terms and conditions differ as per project for general category
States. Assistance is granted on the same terms and conditions as the original terms and
conditions. In addition States have to bear the exchange rate risk. For special category States,
it is given 90 percent grant and 10 percent loan. Independent of the original terms and
conditions in addition, the central government provides the assistance, which may be loan or
grant or some combination of both, based on the original terms and conditions. The central
government, thus, also bears the exchange rate risk for special category States. The volume
of assistance under special category assistance for State plans entirely depends on the planning
commission. Other incentives for the promotion of new industries and the substantial expansion
of existing units may also be granted. These include 100% excise duty exemption for 10
years. 15% investment subsidy for plant and machinery and 100% income tax exemption to
all new units for an initial period of 5 years. Most of the new infrastructure and construction
related activities will take place in and around the area identified as the capital city of new
A.P.
However, following the recommendations of the 14 th Finance Commission, the class of
Special Category States ceases to exist. Hence, keeping aside the aspirations of the people
of Andhra Pradesh for Special Category Status, the Central Government announced a Special
Financial Package for five years towards the development of the State. The Centre also
announced that it will 100% finance the Polavaram Irrigation Project. The execution of the
Project also entrusted to the State of Andhra Pradesh. It also announced the financial incentives
and accelerated depreciation. While Several Educational Institutions were established already,
some more Institutions like Petroleum University, Central University and Tribal University
among others will be established soon. The Centre will also fund the cost of important
Government Building in the new Capital Amaravati. There are several other features in the
package which are aimed at the allround development of the State. However, The bifurcation
of A.P. will have significant implications on the transfer of returns from the centre to the two
new State governments. These transfers shall take place under the aegis of three main channels,
The finance commission, The Planning Commission and the Central Ministers.
Financial Doldrums in A.P. : A Post Bifurcation Challenge • K. SANTHAKUMARI

26 The Economy of Andhra Pradesh
CONCLUSION
The following conclusions emerge from the preceding analysis of the finances of residuary
State of A.P. with reference to post-bifurcation. The residuary State of A.P. is at significant
disadvantage vis-a-visTelangana State. First the GSDP of the A.P. State is only 55.7 percent
of the combined States’s GSDP, and the per capita income of the residuary A.P. State is much
below than the TelanganaState. More significantly the A.P. State’s own revenues are for be
lower than that of Telangana. A.P. with 58.32 percent of the population earns only 46.6
percent of the total revenues of the combined State.
A.P. has much higher Debt burden compared to Telangana, as compared to population
ratio was the sole criterion for apportionment of Debt between two States. In the residuary
State of A.P. there is a resource crunch for revenue which translate to about 4.84 percent
revenue deficit and 7.18 fiscal deficit. This has positioned A.P. in a fiscally precarious
position.
A.P. desperately requires central assistance magnanimously not withstanding construction
of new capital city i.e., Amaravati, as the trend is leading to fiscal imbalances. It will also
cause irreparable damage to the economy and adversely affect the State of A.P. is in the
borrowing end, predominantly waiting for the central government to bail out by any means
as such by granting special status or by granting special grants, allocation of funds and
special incentives. To compete with the developed cities like Bangalore, Chennai and Hyderabad
of the neighbouring States, the Centre should give financial assistance for a level playing
field. Despite A.P. being in a dismal State as far as the economy is concerned, but the State
has a silver lining as such it possess lengthiest coastal corridor second next to Gujarat. The
people of A.P. are entrepreneurial and intellectual.
The Coastal areas possess fertile lands where crop yield is three times a year, the State
is endowed with abundant natural resources. The State is looking for big financial support
from the central government. The major challenge is to face the fund flow to meet various
schemes announced by government along with regular recurring expenditure. While nominal
maintenance of revenue surplus situation may not finance capital expenditures. On the economic
or social services cap on fiscal deficit and Debt stock, as per the finance commission, restrict
the scope of State borrowings ultimately attaching the resource flow, expenditure outflow
towards the activities of the State. Hence fiscal discipline is need of the hour. Irregularities
need to be minimized for revenue augmentation.
It is therefore can be concluded that the financial problems of Andhra Pradesh should
be solved with a wise and constructive plan of action from State government and financial
assistance or announcement of special category status by the central government. All these
issues would go a long way in changing the economic profile of the residual State of Andhra
Pradesh.

27
REFERENCES
1. GOI, White paper on State Finances.
2. GOI, Budget document 2015-16.
3. Patlola Varun Reddy &SudarshanReddy.T, An analysis of public finance of Andhra Pradesh and
Telangana State pre-Bifurcation and post-Bifurcation, a case study from 1980 to 2016, International
Journal of Scientific Research and Management (IJSRM), Vol. 4, Issue J, 2016.
4. A.P. ruling under huge debt burden, http://w.w.w.the hansindia.com/posts/index/ news-analysis/2016-
04 1st Oct Sat, Hyderabad, India.
5. Revenue deficit, infrastructure challenges for new Andhra Pradesh post bifurcation, http://
economictimes. India times.com/ news/politics-and nation/revenue.
6. Andhra Pradesh bifurcation: A perspective, The Gazette of India, No 06, Notification Dated 1 March
2014.
7. A brazen betrayal of A.P. People, The Hans India, 10 Sept 2016.
8. What centre has offered to Andhra Pradesh, The Hans India 9 Sept, 2016.
9. Andhra Pradesh still awaiting center’s help post bifurcation: GovernerNarasimhan, http://www/andhra/
pradesh-new/andhra-pradesh-still-await.
10. One year after bifurcation, how have Telangana and Andhra fared, http://www.the news minute.com/
article/one-year-after-bifurcation.
11. E. Kumarsharma, TelanganaVs. Andhra: A comparison of their fiscal situation and more, Business
Today.
12. M.L. Melly Maitreyi A.P. finances in doldrums, The Hindu, 21 January, 2015.
13. Imbalances in Finances or Andhra Pradesh, The Hans India, 30 July, 2016.
Financial Doldrums in A.P. : A Post Bifurcation Challenge • K. SANTHAKUMARI

28 The Economy of Andhra Pradesh
ARTICLE / 3
IMPLICATIONS OF BIFURCATION ON ECONOMY OFANDHRA PRADESH : A GROWTH PERSPECTIVE
S.B. Yadav
GENERAL PROFILE
The earlier State of Andhra Pradesh (AP) has been bifurcated into two States as Andhra
Pradesh and Telangana. The current State of Andhra Pradesh came into being on June 02,
2014 under Andhra Pradesh Reorganisation Act, 2014. Andhra Pradesh (AP) covers an area
of 160,205 sq. km. The State is divided into 13 administrative districts and has a population
of 4.95 crore and is growing at a decadal growth rate of 9.21 per cent. The State has a literacy
rate of 67.4 per cent, and sex ratio of 997 females per 1,000 males.
ECONOMIC PROFILE
The Andhra Pradesh has been blessed with rich natural resources by the nature. Amongst
all States, Andhra Pradesh tops in various socio-economic indicators. As far as the Gross
State Domestic Product (GSDP) of Andhra Pradesh is concerned, at constant (2004-05) prices
was INR 2.65 lakh crore in 2014-15, which reflects a growth of 7.21 per cent over the
previous corresponding period. The economy of the State is mainly driven by the service
sector which contributes 51.79 per cent to the State Gross Domestic Production - followed
by the agriculture sector, (27.59 per cent) and industries (20.62 per cent).
AP State has well-developed social, economic, physical and industrial infrastructures
and virtual connectivity across all regions. State is good in power and electricity generation,
roads, airports, IT and port infrastructures. As per proposal, Government of India is planning
to set up petroleum, chemicals and petrochemicals Investment region (PCPIR) at
Vishakhapatnam and Kakinada which are expected to boost investment and employment
opportunities in the State. Vizag Chennai Industrial Corridor is also being taken up, which
is expected to boost investment and industrial base.
As on July 2014, the State of AP had 32 Special Economic Zones (SEZs) across
diversified sectors, which include textiles and apparel, electronics, food processing, footwear
and leather products, multi-product, pharma, IT SEZs, etc. Andhra Pradesh had a total installed
power generation capacity of nearly 10,628.22 MW. The State has nine hydro power projects
Faculty in Economics, BSR Government Arts College (Matsya University), Alwar (Rajasthan).

29
under operation and one under pipeline. After the New Industrial Policy, 1991, AP has
become the first State in the country to have enacted the Industrial Single Window Clearance.
The Act made it compulsory for new industries to register with the single-window system to
obtain clearances quickly. It also simplified procedures for getting industrial clearances. It
eliminated a large number of Government-induced entry restrictions, licensing requirements
and controls on corporate behaviour.
INFRASTRUCTURE PROFILE
Infrastructure-wise, AP scores high among all States in India. It is generally said that
AP can be a role model for other Indian States in some areas, especially IT, power generation
and high way transport. In this section, attempt has been made to present an overview of
available physical and social infrastructure in Andhra Pradesh.The Act made it compulsory
for new industries to register with the single-window to obtain clearances quickly. It also
simplified procedures for getting industrial clearances. The State also has separate Acts for
development in sectors such as solar power, electronic hardware and food processing.
ROADS
The State is well connected with inter-State and intra-State road network. The State has
a total road network of 45,831 km. Transport Roads & Buildings department is responsible
for the construction and maintenance of roads, bridges, and National Highways in the State.
MRTS (MASS RAPID TRANSIT SYSTEM)
Andhra Pradesh has proposed Metro Rail projects in the cities of Visakhapatnam,
Vijayawada and Tirupathi. Therefore, Government has prepared a detailed project report(DPR)
in order to avail this transport facility to the general public of these cities.
At present, the Government of India has selected three cities of Andhra Pradesh such
as, Kakinada, Tirupati and Visakhapatnam as part of smart cities scheme of very ambitious
plan of central government. These shall be developed in the days to come under Clean India
Mission. This initiative will boost developmental activities such as housing, transportation,
sanitation, drainage, pollution, investment etc.
RAILWAYS
Among all the transport systems of the country, Railways occupy the most important
position as it carry nearly 80% of the total goods traffic and 70% of the passenger traffic. As
Andhra Pradesh is well connected to Railways network and it has rail accessibility to nine
out of thirteen district headquarters in the new State. The Government of India is also
planning to form a separate railway zone, namely South Coast Railway, with Vizag as its
headquarter. The new zone will consist of Waltair Division of the East Coast Railway (ECoR)
Implications of Bifurcation on Economy of Andhra Pradesh : A Growth Perspective • S.B. YADAV

30 The Economy of Andhra Pradesh
as well as Vijayawada, Guntur and Guntakal divisions of South Central Railway. Apart from
the above, a feasibility study has also been undertaken on the four freight corridors in India
out of which one in Andhra Pradesh. This East-Coast Corridor(Kharagpur-Vijaywada) will
improve the quality of train services in terms of its speed.
AIRPORTS
Air connectivity in Andhra Pradesh is quite good. It has 7 operational Airports/air strips
at Visakhapatnam, Tirupathi, Rajahmundry, Vijayawada, Kadapa, Tadepalligudem and
Puttaparthy. State Government is extending support to Airport Authority of India for expansion
or modernisation of existing Airports at Vijayawada, Rajahmundry and Tirupathi. There has
been a proposal for development of Greenfield airport at Bhogapuram, Vizianagaram District.
It has been proposed to develop No-frills airports at Nagarjunasagar, Guntur District
and Donakonda, Prakasam district and to develop Regional airports at Kuppam, Chittor
district, Dagadarthi, Nellore district and Orvakallu, Kurnool district.
PORTS
There is one major Port at Visakhapatnam managed by the Government of India, and
14 Non-Major Ports managed by the State Government. The Government is developing the
Machilipatnam port under PPP mode. In addition to the existing Non Major ports, the
Government has also decided to develop 14 Minor Ports under the PPP mode, which include
Bhavanapadu and Kalingapatnam in Srikakulam District, and Narsapur in West Godavari
District. There has been a proposal from the Government of India to establish a Second Major
Port in the State at Duggirajapatanam; for which, the Government of AP has conveyed its
consent and has agreed to provide available government land as equity. Apart from this,
another commercial, private sector port is expected to come up at Kakinada.
EDUCATION AND HEALTH INFRASTRUCTURE
As per the Census 2011, the literacy rate of the State is 67.35 percent in 2011 as against
62.07 percent in 2001. The literacy rate of the State is lower than the all India literacy rate
at 72.98% percent. Literacy in Andhra Pradesh increased over 37 percentage points from
29.94 percent in 1981 to 67.35 percent in 2011. Female literacy rate has gone up from 52.72
percent in 2001 to 59.96 percent in 2011.
INDUSTRIAL DEVELOPMENT
In India, industrial sector has achieved a significant role in its economy. In Andhra
Pradesh, as many as 1,742 large and mega projects with an investment of INR 78,860 crore
have gone into production, creating employment for 4,21,222 persons until November, 2014.
During 2014-15, 15 large and mega industrial projects have been established with an investment
of INR 1,875 crore and employment generation for 6,814 persons. As many as 1,06,504

31
micro, small and medium enterprises were established, providing employment to 11,65,102
persons, and involving an investment of INR 1,69,121 crore up to March, 2014.A substantial
increase in employment has also been achieved. About 1,990 Micro, Small and Medium
Enterprises were established providing employment to 25,175 persons, and involving an
investment of INR 2,263 crore up to September, 2014. Government of India has accorded in-
principle approval for setting up of 2 National Investment and Manufacturing Zones (NIMZ);
one each in Chittoor and Prakasam Districts, over an expanse of 5,000 to 6,000 hectares of
land. The volume of industrial production in physical terms has also been multiplied. Apart
from Visakhapatnam, cities such as Vijayawada, Tirupati, Kakinada and Anantapur have been
proposed to be developed into IT hubs.
TOURISM
Andhra Pradesh is recognised for its legendary dynasties, it has most revered temples,
lacquer toys and beautiful weaves, rich literature and vibrant arts of Kuchipudi dance. The
State is a home to a number of holy pilgrim centres, attractive palaces, museums, ports, rivers,
beaches and hill stations. Andhra Pradesh, with more than 300 tourist locations, attracts the
largest number of tourists in India. More than 7.5 million visitors visit the State every year.
Most of the tourist destinations in the State are concentrated in Visakhapatnam, Simhachalam,
Araku, and the beaches of East coast line. Tirupati is major temple destination attracting a
large chunk of pilgrims. The Tourism Corporation is working towards the development of a
beach corridor from Visakhapatnam to Bhimili, which will include the RK Beach and
Rishikonda.
PROVISION OF NEW INFRASTRUCTURE THROUGH AP REORGANISATION
ACT, 2014
After bifurcation, the Government of India has assured to new Andhra Pradesh to
provide the following infrastructure through Andhra Pradesh Reorganisation Act, 2014.It has
assured to:
• development of new capital city;
• fund for new major port at Duggirajapatnam;
• establish a new integrated steel plant by SAIL;
• to establish a greenfield crude oil refinery and petrochemical complex by IOC or HPCL;
• establishment of the Vizag-Chennai industrial corridor;
• to make the existing Visakhapatnam, Vijayawada and Tirupati airports to international
standards;
• establish of a new railway zone;
• funding for rapid rail and road connectivity from the new capital of the successor
State of Andhra Pradesh to Hyderabad and other important cities of Telangana;
Implications of Bifurcation on Economy of Andhra Pradesh : A Growth Perspective • S.B. YADAV

32 The Economy of Andhra Pradesh
• establishment of Metro Rail facility in Vishakhapatnam, and Vijayawada-Guntur-
Tenali Metropolitan Urban Development Authority, and
• Establishment of several educational institutions like IIT, NIT, IIM, IISER, IIIT,
AIIMS, Central University, Petroleum University, Agricultural University, Tribal
University and National Institute of Disaster Management etc.
POLICY INITIATIVES
Major policy initiatives have been taken by the government of Andhra Pradesh in order
to promote industrial and infrastructure development in the new State. Some of the prominent
policy initiatives have been listed below:
• Andhra Infrastructure Development Enabling Act, 2011
• Andhra Pradesh Single Window Clearance Act, 2014
• AP IT Policy 2014-2020
• AP Innovation & Start-up Policy 2014-2020
• AP Electronics Policy 2014-2020
• Andhra Pradesh Solar Power Policy -2015
• The Biotech policy 2001
• Andhra Pradesh Tourism Policy 2010
• New Industrial Policy, Andhra Pradesh
• Industrial Investment Promotion Policy, 2005-2010, Andhra Pradesh
• Food Processing Policy 2010-2015 of Andhra Pradesh State.
Public-Private Partnership (PPP) has been successful instrument in Andhra Pradesh.The
PPP cell is the nodal agency for processing all the PPP mode projects in the State. It plays
an advisory role to the relevant departments. As on March, 2015, a total of 115 projects worth
INR 41,976 stand at various stages of implementation.
PHYSICAL BIFURCATION : GROWTH IMPLICATIONS
On the basis of the above analysis, now it has become very relevant to discuss the
possible implications of the bifurcation of the erstwhile Andhra Pradesh State. It will have
significant implications on resource flow to the two new States – Telangana and new Andhra
Pradesh – and on their economic development. In the long run, both of the regions are likely
to benefit, but both of them will face considerable uncertainty in the immediate future. It has
been decided that Hyderabad will be the common capital of new Andhra Pradesh and Telangana
for an initial period of 10 years, after which it will be the capital of Telangana. However,
things are uncertain after bifurcation. But the special position of Hyderabad gives rise to
considerable complications in working out both revenues and fiscal transfers for both of the

33
new States. Hyderabad is known as hub of IT, electronics goods, software and other business
activities. Being the centre of economic activities and a source of Government finance, it will
critically define the fiscal prospects of the two States. The bifurcation will impact a wide
range of relevant aspects, including the division of assets and liabilities, water resources, land
resources, and the division of pensioners and existing government employees and public
sector enterprises. Here are the following possible implications in this regard:
The bifurcation of the State is also expected to delay execution of National Investment
Manufacturing Zones (NIMZs). Recently, the State government has received in-
principle approval for three (NIMZs) in Chittoor, Medak and Prakasam districts. The
land acquisition for Chittoor and Prakasam NIMZs is underway and it is completed
in Medak. The State government is now preparing to sanction special staff to APIIC
to oversee NIMZ activities, which might get delayed now.
One of the real contentious issue arises that people of AP always felt that it was their
investments and human capital that created all the wealth in and around Hyderabad,
while Telangana people were free riders. They have always been very upset that
many of the coastal cities like Vishakhapatnam, Vijayawada, Tirupati, etc., were
neglected because all the investment was flowing in to Hyderabad for far too long.
Hyderabad by the end of 2005 was like a huge black hole that gobbled up all the
foreign direct investment in the State.
The people of AP were also worried about the sharing of Krishna and Godavari river
waters with Telangana. The leader of Telangana movement tried their best to mislead
people of Telangana that people from AP have stolen all the fruits of development
from the people of Telangana. That sensitizes issues very much. Now people of the
two States are looking their future very uncertain.
There are three major regional dialects of Telugu- each spoken by the people of
Telangana, Coastal Andhra and Rayalaseema. People of Telangana always felt that
their dialect was being considered inferior by the speakers of the other dialects. Also,
the mass media (like Telugu movies and Television) have always used the Coastal
Andhra dialect. He claimed that the Telangana culture and dialect were being
considered inferior by the people of AP and the only way the Telangana people could
get back their self-respect is by demanding a separate State. People of the two States
felt that they would now receive their due which was pending since years.
The Telangana movement was result of people’s anger and so called discrimination
over certain issues. It was very successful because of the involvement of the students.
KCR has promised government jobs to all these people. Now the real question is how
would he create all those government jobs? On the other hand, a great amount of job
creation would happen in AP because they would need brand new infrastructure and
need to build their new capital. This will enhance migration from one State to other
State.
Implications of Bifurcation on Economy of Andhra Pradesh : A Growth Perspective • S.B. YADAV

The high castes from AP were the entrepreneurial classes who have been creating a
lot of wealth over the last few decades (including Hyderabad). Think GMR, GVK,
LANCO, Dr. Reddy’s, Satyam, Redbus, media conglomerates, and the whole of
Tollywood, etc. Telangana would lose out on these capitalist classes and their
entrepreneurial spirits. On the contrary, the elites in Telangana have always been
feudal but never entrepreneurial and these are the capitalists the State of Telangana
would be left with. This will impact their economy over the long run. On the other
hand, AP would have a huge amount of these entrepreneurial classes- close to 31%
of the population.
Andhra Pradesh would be a power-surplus State while Telangana would be a power
deficit State.
AP would have an infrastructure surplus, while Telangana would become a landlocked
State by losing out on major ports, coastline, and golden quadrilateral and major
railway freight corridors. It would also lose its share of revenues from the KG gas
basin.
CONCLUSION
It remains to be seen that how both the States would settle their issues relating to
resource distribution, water sharing, infrastructure, power generation, investment proposals,
trade, tourism, cultural migration etc. However, efforts are to be made to resolve all issues
amicably with dignity and respect to each other. The aim of bifurcation should be fulfilled
in order to make the people happy of both States. They must have competition for growth
and development, poverty eradication, employment generation and power generation. The
welfare of the common man should be their ultimate goal.
REFERENCES
1. Ahluwalia, M.S., (1996). New economic policy and agriculture: Some reflections, Indian Journal of
Agricultural Economics, 51 (3).
2. Ali, Mubaraik and Derek Byerlee, (2002). Productivity growth and resource degradation in Pakistan’s
Punjab: A decomposition analysis, Economic Development and Cultural Change, 50 (4): 840-863.
3. Bandyopadhyay D., (2001). Andhra Pradesh: Looking beyond Vision 2020, Economic and Political
Weekly, 36 (11).
4. Bhatia, M.S., (1999). Rural infrastructure and growth in agriculture, Economic and Political Weekly,
34 (13).
5. Desai, B.M., (1994). Contributions of institutional credit, self-finance and technological change to
agricultural growth in India, Indian Journal of Agricultural Economics, 49 (3) : 457-475.
6. Desai, B.M., (2002). Policy framework for reorienting agricultural development, Indian Journal of
Agricultural Economics, 57 (1).

ARTICLE / 4
RECENT TRENDS AND TARGETS OFANDHRA PRADESH ECONOMY :
CHALLENGES AND OPPORTUNITIES
A. Venkata Prasad
ABSTRACT
With the geographical area of 1, 62,760 sq km Andhra Pradesh ranks as the 8th largest
State in the country. Situated in a tropical region, the State has the 2nd longest coastline in
the country with a length of 972 km. The State has a forest area of 34,572 Sq.Kms as per
the forest records, which accounts for 21.58% the total geographical area. Andhra Pradesh
is the tenth largest State in the Country, in terms of population. As per 2011 Census, the State
accounts for 4.10% of the total population of the country. Andhra Pradesh is in the process
of transformation as Sunrise State and growth targets are being set to achieve them in defined
timeframe under Vision 2029. The seven missions, five grids and five campaign modes put
in place are the growth vehicles and the State marching ahead with a mission based approach,
targeting double digit growth on a sustainable basis. Sustaining double digit growth for the
next 14 years is imperative to ensure that Andhra Pradesh will be one among the top three
performing States by 2022, the best in the country by 2029 and the best global destination
by 2050. This paper examines the recent structural changes and targets of Andhra Pradesh
economy after bifurcation and also presents the unique advantages and obstacles to achieve
sustainable double digit growth.
Key words: Double Digit Growth, Inclusive Growth, Happiness Index and GSDP
Lecturer, Dept. of Economics, PRR & VS Govt. Degree College, Vidavalur, SPSR Nellore Dt. AndhraPradesh.

ARTICLE / 5
PERFORMANCE OF SECTORAL CONTRIBUTION ININDIA’S SUNRISE STATE ANDHRA PRADESH –
A COMPARATIVE STUDY OF PRE-BIFURCATIONAND POST-BIFURCATION
P. Jayalakshmi
ABSTRACT
This paper aims at studying the trends in sect oral contribution to Gross State Domestic
Product of Andhra Pradesh, the sunrise State of India. Andhra Pradesh is one of the major
States in India endowed with rich natural resources having large potential for economic
growth and development. Both economic and political factors influenced the sect oral
performance. Pre-bifurcation Andhra Pradesh witnessed and benefited from economic reforms
which the State implemented. Bifurcation of United Andhra Pradesh into Andhra Pradesh and
Telangana is historical and challenging to economic performance of both bifurcated States.
However, Telangana started its life journey with revenue surplus and Andhra Pradesh its new
life journey with revenue deficit. Andhra Pradesh economy faced advantages and disadvantages
in its new journey. The growth in the State of Andhra Pradesh was mainly driven by agriculture,
industry and services sectors. All three sectors are shows increasing trend even in post-
bifurcation. In spite of bifurcation pangs, Andhra Pradesh recorded a growth rate of 13.94
percent in the second quarter, registering an average half yearly growth of 11.77 percent. The
State government is currently working on the comprehensive Double digit growth plan to
achieve a per-capita income over Rs 10 lakh by 2029-30. The growth target for 2015-16 at
constant prices stands at there is a swift upward surge in the Agriculture and Allied sectors
which have registered a phenomenal growth rate at 47 percent at constant prices. The sect
oral contribution of the economy may increase in future with the achieving of targets and
through facing challenges.
Key Words: Gross State Domestic Product, Natural resources, Economic growth, Economic
reforms.
Reader in Economics, St. Joseph’s College for Women (A), Visakhapatnam, Andhra Pradesh, INDIA

ARTICLE / 6
IMPLICATIONS OF STATE DIVISION ONANDHRA PRADESH STATE FINANCES
K. Sivaram
ABSTRACT
This paper is mainly intended to inform the public about the factual position of State
finances so as to generate an informed debate on various aspects of the State’s fiscal health
and also to educate the public on the adverse consequences of inaction and the necessity for
adopting hard and difficult measures to restore the fiscal health. The numerous problems
affecting the State economy have to be analysed scrupulously and the required corrective
actions need to be implemented dispassionately. The Government invites constructive
suggestions and valuable advice from different groups in the society and political parties in
the State. This would help the Government in its endeavour to adopt proper corrective action
in a timely manner so that it can quickly bring fiscal discipline and financial stability.
The Government is committed to rectify the fiscal imbalances that have emerged in the
past few years. The task ahead is very arduous. Government may be left with difficult and
painful options. Government seeks the cooperation and support of the people in its endeavour
to move towards the course of fiscal correction.
Government will necessarily have to play a major role in implementing reforms with
greater thrust in parallel - so as to attract private initiative since it is equally vital for
supplementing government’s efforts. Collectively, it should be possible to shift Andhra Pradesh
to a higher growth trajectory - whereby it not only surpasses the national averages in economic
performance but also achieves the goals enshrined in the Vision 2020.
Lecturer in Economics, Govt. College (M) Autonomous, Anantapuramu, AP.

THEME - II
ISSUES RELATED TO STRUCTURAL CHANGESIN THE ECONOMY OF ANDHRA PRADESH


ARTICLE / 7
STRUCTURE AND DEVELOPMENT IN THERESIDUARY STATE OF ANDHRA PRADESH :
1960-2015
T. Koti Reddy
INTRODUCTION
The Residuary State of Andhra Pradesh has three distinct regions which are at different
stages of socio-economic development, viz. South Coastal Andhra, North Coastal Andhra and
Rayalaseema. The state has a total of 13 districts, the Anantapur District is the largest and
Srikakulam District is the smallest district. The districts are divided into three regions of the
state, i.e., North Coastal Andhra, South Coastal Andhra and Rayalaseema. North Coastal
Andhra comprises 3 districts (Srikakulam,Vizianagaram and Visakhapatnam), South Coastal
Andhra 6 districts (East Godavari, West Godavari, Krishna, Guntur, Prakasam and Sri Potti
Sri Ramulu Nellore) and Rayalaseema region comprises the remaining four districts (YSR,
Kurnool, Chittoor, and Anantapur).
South Coastal Andhra region is located in between the river Godavari in the north and
river Krishna in the south, there are natural factors that have offered extensive possibilities
of expanding irrigation through canal system, mostly due to the advantage of delta and the
natural gradient which can be exploited very well by canal irrigation. North Coastal Andhra
has high-potential rivers like the Vamsadhara and the Nagavali. On the other hand, Rayalaseema
region is not able to access river water due to lack of gradient. But the natural advantage of
‘tank’ irrigation was even less in Rayalaseema. Thus Rayalaseema is the most disadvantaged
in terms of access to irrigation of any type in the state of AP (Sri Krishna Committee 2010).
The per centage of people below the poverty line in Andhra State in 2011-12 has been
estimated as 14.7 per cent in rural areas and 20.6 per cent in urban areas and 16.3 per cent
for the state as a whole (Rangarajan Committee).
GROWTH PERFORMANCE OF THE STATE : A REVIEW
The Gross State Domestic Product at factor cost of Andhra state was Rs.8778 crore in
1960-61.Since then it rose to Rs.35697 crore in 1993-94.In 2012-13 the Gross State Domestic
Professor in Economics, IBS, Hyderabad.

42 The Economy of Andhra Pradesh
Product at current prices was estimated at Rs.410961 crore as against Rs. 379230 crore for
2011-12 indicating a growth of 8.37 per cent. Since 2012-13 the growth performance of
Andhra Pradesh has been on a higher scale. In 2015-16 (Advanced estimates), the GSDP of
Andhra Pradesh at current prices stood at Rs.603376 crore. It recorded 13.22 per cent of
growth compared to previous fiscal which was Rs.532922 crore in 2014-15. The GSDP of
Andhra Pradesh at constant prices (2011-12) also increased from Rs.379230 crore in 2011-
12 to Rs.493641 crore in 2015-16 (Advanced estimates). It recorded 10.99 per cent of growth
compared to previous fiscal which was Rs.493641 crore in 2014-15.
The Advanced estimates of 2015-16 indicate that the Per Capita Income (NSDP) of
Andhra Pradesh at current prices increased to Rs.1,07,532 from Rs. 95,689 in 2014-15
registering a growth of 12.38 per cent. The Per Capita income (NSDP) at constant prices
(2011-12) has also gone up from Rs.79,441 in 2014-15 to Rs.87,487 in 2015-16 registering
a growth rate of 10.13 per cent (Socio Economic Survey 2015-16, AP). Though overall
development is quite good in terms of almost all indicators, but extreme disparities exist
among the three regions and districts. The average value of the composite index is 0.648 for
Andhra. Lower rank reflects higher socio-economic development and vice-versa. In terms of
socio-economic development all the 13 districts districts in Andhra Pradesh are relatively
more backward than the other districts of India (Indian Institute of population studies).
OBJECTIVES OF THE STUDY
1. To study the relative shares of Districts in the Gross State Domestic Product and per
capita income of residuary state of Andhra Pradesh.
2. To study the sectoral contribution to Gross State Domestic Products in Andhra Pradesh.
3. To identify the factors responsible for growing regional imbalances between the
regions in Andhra Pradesh.
4. To suggest measures for accelerating growth in Andhra Pradesh.
METHODOLOGY
The objective of this research is to examine the inter-district disparity or inequality
among various sectors in the state of Andhra Pradesh. The analysis of the above objectives
is based on the some selected variables like District Domestic Product, District per capita
income, Sectoral contribution to GDDP and Occupational structure. All 13 districts of Andhra
Pradesh are considered for the study. The secondary data were collected from the various
sources like Economic Survey of Andhra Padesh, District census handbook and Statistical
abstract of Andhra Pradesh. The statistical techniques like Mean,Standard Deviation and Co-
efficient of Variations were used for measuring significant differences across the districts in
each sub region as well as across the sub regions in the state.
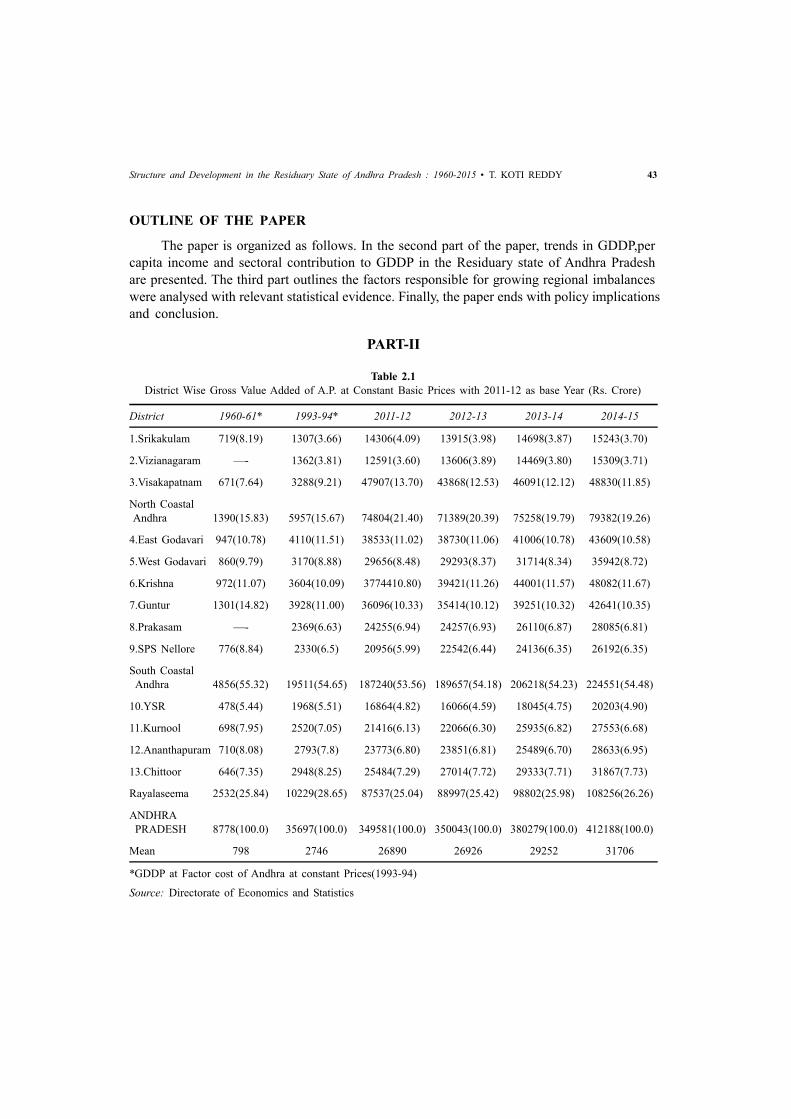
43
OUTLINE OF THE PAPER
The paper is organized as follows. In the second part of the paper, trends in GDDP,per
capita income and sectoral contribution to GDDP in the Residuary state of Andhra Pradesh
are presented. The third part outlines the factors responsible for growing regional imbalances
were analysed with relevant statistical evidence. Finally, the paper ends with policy implications
and conclusion.
PART-II
Table 2.1
District Wise Gross Value Added of A.P. at Constant Basic Prices with 2011-12 as base Year (Rs. Crore)
District 1960-61* 1993-94* 2011-12 2012-13 2013-14 2014-15
1.Srikakulam 719(8.19) 1307(3.66) 14306(4.09) 13915(3.98) 14698(3.87) 15243(3.70)
2.Vizianagaram —- 1362(3.81) 12591(3.60) 13606(3.89) 14469(3.80) 15309(3.71)
3.Visakapatnam 671(7.64) 3288(9.21) 47907(13.70) 43868(12.53) 46091(12.12) 48830(11.85)
North Coastal
Andhra 1390(15.83) 5957(15.67) 74804(21.40) 71389(20.39) 75258(19.79) 79382(19.26)
4.East Godavari 947(10.78) 4110(11.51) 38533(11.02) 38730(11.06) 41006(10.78) 43609(10.58)
5.West Godavari 860(9.79) 3170(8.88) 29656(8.48) 29293(8.37) 31714(8.34) 35942(8.72)
6.Krishna 972(11.07) 3604(10.09) 3774410.80) 39421(11.26) 44001(11.57) 48082(11.67)
7.Guntur 1301(14.82) 3928(11.00) 36096(10.33) 35414(10.12) 39251(10.32) 42641(10.35)
8.Prakasam —- 2369(6.63) 24255(6.94) 24257(6.93) 26110(6.87) 28085(6.81)
9.SPS Nellore 776(8.84) 2330(6.5) 20956(5.99) 22542(6.44) 24136(6.35) 26192(6.35)
South Coastal
Andhra 4856(55.32) 19511(54.65) 187240(53.56) 189657(54.18) 206218(54.23) 224551(54.48)
10.YSR 478(5.44) 1968(5.51) 16864(4.82) 16066(4.59) 18045(4.75) 20203(4.90)
11.Kurnool 698(7.95) 2520(7.05) 21416(6.13) 22066(6.30) 25935(6.82) 27553(6.68)
12.Ananthapuram 710(8.08) 2793(7.8) 23773(6.80) 23851(6.81) 25489(6.70) 28633(6.95)
13.Chittoor 646(7.35) 2948(8.25) 25484(7.29) 27014(7.72) 29333(7.71) 31867(7.73)
Rayalaseema 2532(25.84) 10229(28.65) 87537(25.04) 88997(25.42) 98802(25.98) 108256(26.26)
ANDHRA
PRADESH 8778(100.0) 35697(100.0) 349581(100.0) 350043(100.0) 380279(100.0) 412188(100.0)
Mean 798 2746 26890 26926 29252 31706
*GDDP at Factor cost of Andhra at constant Prices(1993-94)
Source: Directorate of Economics and Statistics
Structure and Development in the Residuary State of Andhra Pradesh : 1960-2015 • T. KOTI REDDY

44 The Economy of Andhra Pradesh
The table 2.1 provides information about District wise Gross Value added at constant
basic prices. It is clear from the table that in 2014-15, the contribution of South Coastal
Andhra region to state’s Gross Value Added accounted for 54.48 per cent followed by
Rayalaseema region (26.26 per cent) and North Coastal Andhra region (19.26 per cent). Six
districts namely Visakhapatnam, Krishna, East Godavari, Guntur, West Godavari and Chittoor
had higher GVA than region average in 2014-15.In terms of percentage share of GVA to
state’s GVA Visakhapatnam contributed maximum to the state’s GVA with 11.85 per cent
share followed by Krishna (11.67 per cent), East Godavari(10.58 per cent),Guntur(10.35 per
cent),West Godavari(8.72 per cent) and Chittoor (7.73 per cent) in 2014-15. Srikakulam(3.70
per cent), Vijayanagaram districts (3.71 per cent) in North coastal Andhra and YSR district
(4.90 per cent) in Rayalaseema have contributed less to GVA of Andhra region in 2014-15.
The per capita income at constant prices for all the districts for the period 1960-61 to
2014-15 is provided in table 2.2. It is observed that South coastal Andhra region stands first
interms of per capita income followed by Rayalaseema and North Coastal Andhra region
during the study period. Five districts namely West Godavari, Krishna, Guntur, Nellore and
Ananthapuram have per capita income higher than Andhra region with Krishna reporting the
highest per capita income followed by West Godavari and Guntur in 1960-61. The per capita
income in these districts was recorded at high due to bumper crop production. A variation in
per capita income among the districts and regions clearly reflects difference in the sectoral
development. Visakhapatnam, West Godavari, Krishna, Guntur, Prakasam and Nellore districts
have per capita income higher than the region average in 2014-15. It can be observed that

45
highest per capita income was recorded in Visakhapatnam district (Rs.105174) followed by
Krishna (Rs. 101003), West Godavari and Nellore districts. District disparity in terms of per
capita income in the residuary state of Andhra Pradesh during 1990-91 (C.V. 0.15) which has
increased drastically in 2014-15 (C.V. 0.20). It is observed from the table that Inter-district
disparity within the districts is higher in North Coastal Region (CV raised from 0.03 in 1960-
61 to 0.37 in 2014-15) when compared with other regions of Andhra Pradesh during the study
period. Inter-district disparities in terms of per capita income were reduced in both the regions
of South Coastal (CV reduced from 0.10 in 1960-61 to 0.09 in 2014-15) and Rayalaseema
(CV reduced from 0.07 in 1960-61 to 0.04 in 2014-15).
Table 2.2
District wise per capita income based on NDDP at constant basic prices with 2011-12 as base year
(In Rupees)
District 1960-61* 1993-94* 2011-12 2012-13 2013-14 2014-15
1.Srikakulam 3070 5491 51645 50321 52762 54139
2.Vizianagaram — 6334 52865 56474 59477 62194
3.Visakapatnam 2929 9594 105362 96337 100104 105174
North Coastal Andhra(Mean) 2999 7139 209872 203132 212343 221507
CV** 0.03 0.30 0.44 0.37 0.36 0.37
4.East Godavari 3631 8862 71120 71139 74677 78826
5.West Godavari 4349 8809 72811 72003 77479 86981
6.Krishna 4682 9372 81851 85092 93645 101003
7.Guntur 4321 9367 72760 70808 77930 83692
8.Prakasam — 8330 70792 70673 75662 80516
9.SPS Nellore 3817 9436 73132.33 74196 78888 84650
South Coastal Andhra(Mean) 4160 9029 442466.3 443911 478281 515668
CV** 0.10 0.05 0.06 0.08 0.09 0.09
10.YSR 3563 8360 57317 54450 60670 67283
11.Kurnool 3654 8069 52324 53806 62941 66080
12.Ananthapuram 4016 8430 56869 57257 60744 67491
13.Chittoor 3376 8682 60032 62939 67851 72797
Rayalaseema(Mean) 3652 8385 226542 228452 252206 273651
CV** 0.07 0.03 0.06 0.07 0.05 0.04
ANDHRA PRADESH (Mean) 3764 8540 68866 68730 74063 79442
CV** 0.15 0.15 0.23 0.20 0.19 0.20
Source: Directorate of Economics and Statistics
*1960-61&1993-94 Figures are at Per capita GDDP of Andhra at factor cost (1993-94 Price)
** CV: Authors Own Calculation
Structure and Development in the Residuary State of Andhra Pradesh : 1960-2015 • T. KOTI REDDY

46 The Economy of Andhra Pradesh
Table 2.3
Sectoral Contribution to GDDP of Andhra region
1993-94 2010-11** 2014-15
District Agri- Industry Service Agri- Industry Service Agri- Industry Service
culture culture culture
1.Srikakulam 36.0 14.6 49.4 19.6 24.3 56.1 21.72 23.15 55.12
2.Vijayanagaram 33.8 17.8 48.4 27.1 21.1 51.8 24.80 24.21 50.97
3.Visakhapatnam 16.5 31.8 51.7 10.1 36.6 53.3 10.21 41.18 48.59
4.East Godavari 35.5 24.9 39.6 27.6 25.3 47.1 25.72 31.56 42.70
5.West Godavari 48.1 14.3 37.6 43.7 13.5 42.8 42.20 14.86 42.92
6.Krishna 41.4 17.5 41.1 28.5 18.8 52.7 28.33 23.32 48.34
7.Guntur 46.7 13.4 39.9 31.0 20.9 48.1 31.04 23.98 44.96
8.Prakasam 43.7 17.1 39.2 35.2 24.3 40.5 36.70 24.3 38.91
9.Nellore 43.8 18.0 38.2 29.5 23.2 47.3 29.02 24.56 46.41
10.YSR 40.4 19.6 40.0 27.6 26.4 46.0 24.44 27.76 47.78
11.Kurnool 44.7 15.3 40.0 30.8 22.7 46.5 33.98 19.72 46.28
12.Anantapur 41.3 20.8 37.9 23.3 28.5 48.2 27.65 25.19 47.12
13.Chittoor 38.5 21.7 39.8 25.8 25.2 49.0 21.92 30.12 47.94
Andhra 39.5 19.9 40.7 27.3 24.7 48.5 27.28 26.45 46.25
Source: GDDP,AP,2008&Socio-Economic Survey 2011-12,AP &Economic survey 2015-16
Note: *Old series ** New series
The data revealed that in 2010-11 the share of services in GSDP was as high as 48.5
per cent while the share of agriculture and allied activities slipped to only 27.3 per cent. It
was also noticed that the contribution of services to GDDP was more in all the districts of
Andhra Pradesh except in west Godavari and Prakasam. The expansion of services accelerated
further in the years after 2011-12 propelled by high rate of growth in Trade&Repair services,
Hotel & Restaurants, Real estate, Professional services and other services etc. By 2014-15
agriculture and allied activities accounted for 27.28 per cent of the GSDP of Andhra Pradesh.
The share of industry was registered at 26.45 per cent while the share of services was 46.25
per cent. It was also observed that the share of services in GDDP of all the districts in Andhra
Pradesh was more in 2014-15. The above analysis clearly brings out the services-led pattern
of economic growth in Andhra Pradesh.
As shown in Table 2.4.occupations were grouped under 4 categories.Under “Others”
head is included services, registered manufacturing etc.In 1961 the relative share of cultivators
in total workers was higher at 39 per cent, but its share as percentage of total workers
declined to 36 per cent in 2001 and then to 16 per cent in 2011. The share of agricultural

47
labourers increased from 29 per cent in 1961 to 44 per cent in 2011. It was observed that the
relative share of workers in household industries was at 10 per cent in 1961, but declined to
5 per cent in 2001 and then to 3 per cent in 2011. The relative share of others increased from
22 per cent in 1961 to 30 per cent in 2001 andthen to 37 per cent in 2011.Total main workers
have graduallyincreased from 119 lakhs in 1961 to 172 lakhs in 2001 and then to 192.32
lakhs in 2011.
Table 2.4
Occupational Structure of Andhra Region (%)
Occupations 1961 2001 2011
1.Cultivators 39 36 16
2.Agricultural labour 29 29 44
3.Household Industries 10 05 03
4.Others 22 30 37
5.Total Main workers 100(119) 100(172) 100(192.32)
Source: Four decades of development, Government of AP, 1997 and Statistical Abstracts, AP
Note: Figures in round brackets are total main workers in Lakhs
REASONS FOR GROWING DISPARITIES ACROSS REGIONS IN
ANDHRA PRADESH
Source-Wise, District Wise Net Area Irrigated
Increase in agricultural production and productivity depends, to a large extent, on the
availability of water. However, the availability of irrigation facilities is highly inadequate in
Andhra Pradesh. In 1956-57, gross irrigated area as percentage of gross cropped area was
only 12.52 per cent. Despite massive investments on irrigation projects during the past 60
years gross irrigated area as percentage of gross cropped area was increased to 45.88 per cent
A wide variation in the availability of irrigation facilities has contributed not only for growing
regional inequalities but also for income inequalities among the farmers of the 3 regions in
the state.
The above table 3.1 provides information about Source-wise Net area irrigated across
the districts of Andhra region.It was observed from the table that canal irrigation is the main
source of irrigation in Andhra Region. Area irrigated under wells has been increasing due to
availability of plenty of ground water partly due to percolation impact of canal irrigation. The
total net irrigated area in Andhra Pradesh during 2014-15 was 29.27 lakh Hectares and out
of which area under canals accounted for 14.29 lakh hectares, and wells accounted 10.8 lakh
hectares. A close observation of the table reveals that canal irrigation was more prominent in
Structure and Development in the Residuary State of Andhra Pradesh : 1960-2015 • T. KOTI REDDY

48 The Economy of Andhra Pradesh
South Coastal region of Andhra Pradesh when compared with North Coastal and Rayalaseema.
South coastal Andhra alone accounted for 75.02 per cent of the total land under canal
irrigation in the entire Andhra Pradesh followed by North Coastal Andhra (14 per cent ) and
Rayalaseema (10.99 percent).In terms of well irrigation in per centage terms, out of the total
land under under this source was more in South Coastal Andhra (53.52 per cent)followed by
Rayalaseema (40.74 per cent) and North Coastal Andhra Pradesh (5.74 per cent). It indicates
a wide regional variation in the development of irrigation facilities.
Table 3.1
Source-wise, District wise net area irrigated 2014-15 (area in lakh hectares)
District Canals (%) tanks (%) wells (%) others (%) total (%)
1.Srikakulam 1.14 7.98 0.59 20.21 0.08 0.74 0.06 4.76 1.87 6.39
2.Vizianagaram 0.4 2.80 0.76 26.03 0.35 3.24 0.04 3.17 1.55 5.30
3.Visakapatnam 0.46 3.22 0.26 8.90 0.19 1.76 0.23 18.25 1.14 3.89
North Coastal Andhra 2 14.00 1.61 55.14 0.62 5.74 0.33 26.19 4.56 15.58
4.East Godavari 1.78 12.46 0.21 7.19 0.63 5.83 0.18 14.29 2.8 9.57
5.West Godavari 1.68 11.76 0.13 4.45 1.73 16.02 0.08 6.35 3.62 12.37
6.Krishna 2.05 14.35 0.14 4.79 0.64 5.93 0.11 8.73 2.94 10.04
7.Guntur 3.29 23.02 0.09 3.08 0.8 7.41 0.19 15.08 4.37 14.93
8.Prakasam 0.95 6.65 0.04 1.37 1.16 10.74 0.09 7.14 2.24 7.65
9.SPS Nellore 0.97 6.79 0.48 16.44 0.82 7.59 0.07 5.56 2.34 7.99
South Coastal Andhra)10.72 75.02 1.09 37.33 5.78 53.52 0.72 57.14 18.31 62.56
10.YSR 0.22 1.54 N 1.14 10.56 0.02 1.59 1.38 4.71
11.Kurnool 1.1 7.70 0.09 3.08 1.09 10.09 0.18 14.29 2.46 8.40
12.Ananthapuram 0.22 1.54 0.01 0.34 1.02 9.44 0.01 0.79 1.26 4.30
13.Chittoor 0.03 0.21 0.12 4.11 1.15 10.65 0 0.00 1.3 4.44
Rayalaseema 1.57 10.99 0.22 7.53 4.4 40.74 0.21 16.67 6.4 21.87
ANDHRA
PRADESH 14.29 2.92 10.8 1.26 29.27
Source: Directorate of Economics and Statistics
The above table 3.2. provides information about Large and Mega Industrial projects
gone into production upto March 2015 in Andhra region. As many as 1762 large and mega
projects are operating in Andhra Pradesh upto March 2015 with a total investment of Rs.77292
crore. These industries have created employment for 426278 persons. District wise distribution
of Large and Mega projects in respect of the number of units, Guntur District stands first
followed by East Godavari and Visakhapatnam in the state. While in terms of Investment

49
Visakhapatnam stands first followed by East Godavari. In terms of employees Visakhapatnam
stands first in the state followed by East Godavari and Guntur districts. It could be inferred
that YSR, Prakasam, Vizayanagaram, Srikakulam and Vijayanagaram districts were
comparatively low in the state in terms of number of units, investment and employees. A wide
variation in industrial development across the districts contributed for growing regional
inequalities in Andhra Pradesh.
Table 3.2
Large and Mega Industrial Projects Gone Into Production Upto March 2015
District Units(No.) Investment (Rs.crore) Employment(No.)
1.Srikakulam 99 1341 14563
2.Vizianagaram 62 3142 33848
3.Visakhapatnam 192 15574 67967
4.East Godavari 217 13855 49893
5.West Godavari 160 1977 26592
6.Krishna 169 5285 32515
7.Guntur 204 6180 44303
8.Prakasam 84 1717 16436
9.SPS Nellore 144 5085 39058
10.YSR 43 5960 17189
11.Kurnool 138 6644 21417
12.Ananthapuram 92 5782 26619
13.Chittoor 158 4750 35878
ANDHRAPRADESH 1762 77292 426278
Source: Industries department,Govt of AP
SPREAD OF BANK BALANCES AND DEPOSITS
There is a close relation between distribution of bank branches and financial
intermediation which facilitates easy access to financial resources. The details are presented
in Table 3.3.
The above table 3.3 provides information about district wise number of branches,
deposits and advances of commercial banks. It is observed from the table that there are wider
variations in terms of number of branches, deposits mobilized and advances provided for
various purposes by the commercial banks among the districts. In terms of number of branches
Krishna district stands first followed by Guntur, East Godavari and Visakhapatnam. The
number of branches, deposit mobilization and advances provided by the banks was registered
at lowest in the districts like Srikakulam, Vijayanagaram and YSR Districts. In terms of
Structure and Development in the Residuary State of Andhra Pradesh : 1960-2015 • T. KOTI REDDY
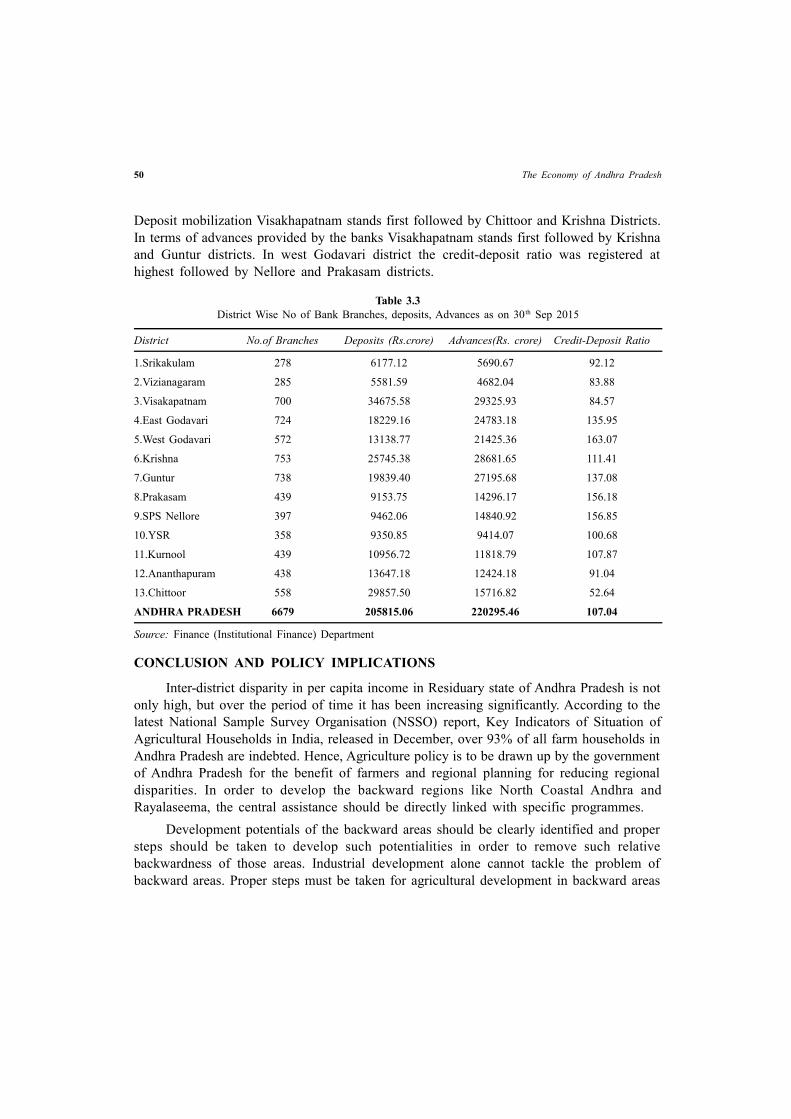
50 The Economy of Andhra Pradesh
Deposit mobilization Visakhapatnam stands first followed by Chittoor and Krishna Districts.
In terms of advances provided by the banks Visakhapatnam stands first followed by Krishna
and Guntur districts. In west Godavari district the credit-deposit ratio was registered at
highest followed by Nellore and Prakasam districts.
Table 3.3
District Wise No of Bank Branches, deposits, Advances as on 30 th Sep 2015
District No.of Branches Deposits (Rs.crore) Advances(Rs. crore) Credit-Deposit Ratio
1.Srikakulam 278 6177.12 5690.67 92.12
2.Vizianagaram 285 5581.59 4682.04 83.88
3.Visakapatnam 700 34675.58 29325.93 84.57
4.East Godavari 724 18229.16 24783.18 135.95
5.West Godavari 572 13138.77 21425.36 163.07
6.Krishna 753 25745.38 28681.65 111.41
7.Guntur 738 19839.40 27195.68 137.08
8.Prakasam 439 9153.75 14296.17 156.18
9.SPS Nellore 397 9462.06 14840.92 156.85
10.YSR 358 9350.85 9414.07 100.68
11.Kurnool 439 10956.72 11818.79 107.87
12.Ananthapuram 438 13647.18 12424.18 91.04
13.Chittoor 558 29857.50 15716.82 52.64
ANDHRA PRADESH 6679 205815.06 220295.46 107.04
Source: Finance (Institutional Finance) Department
CONCLUSION AND POLICY IMPLICATIONS
Inter-district disparity in per capita income in Residuary state of Andhra Pradesh is not
only high, but over the period of time it has been increasing significantly. According to the
latest National Sample Survey Organisation (NSSO) report, Key Indicators of Situation of
Agricultural Households in India, released in December, over 93% of all farm households in
Andhra Pradesh are indebted. Hence, Agriculture policy is to be drawn up by the government
of Andhra Pradesh for the benefit of farmers and regional planning for reducing regional
disparities. In order to develop the backward regions like North Coastal Andhra and
Rayalaseema, the central assistance should be directly linked with specific programmes.
Development potentials of the backward areas should be clearly identified and proper
steps should be taken to develop such potentialities in order to remove such relative
backwardness of those areas. Industrial development alone cannot tackle the problem of
backward areas. Proper steps must be taken for agricultural development in backward areas

51
and for that adequate infrastructural facilities in the form of irrigation facilities, command
area development, land reclamation measures, development of dry land farming etc., must be
taken along with the growth of agro-based industries.There is a need to speed up the completion
of ongoing irrigation projects by allocating sufficient funds. Thus necessary co-ordination
must be made between the agricultural and industrial development of these backward areas
so that benefit of such development can percolate to the appropriate level and the people of
those backward areas can reap the direct and indirect benefits of such development. social
and economic infrastructure, efficiency of administration and the quality of governance
including law and order situation are important factors in attracting private investment.
REFERENCES
1. Agarwala, A.K and P.L. Hazarika (2002) “Regional Disparities in Economic Development of Assam:
A District Level Study” Indian Journal of Regional Science Vol. XXXIV, No. 2
2. Basavaraj, S. Benni (2008): Infrastructure Development and Regional Disparities – A Comparative
District Level Analysis in Karnataka, The Journal of Indian Management & Strategy, Vol.13,
Issue I
3. B.N.Srikrishna Committee (2010): “Committee for Consultations on the Situation in Andhra Pradesh”,
Dec 2010.
4. Government of Andhra Pradesh (2015-16) “Socio-Economic Survey, Planning Department.”
5. Gulati, S.C. (1977): Dimensions of Inter-District Disparities, Indian Journal of Regional Science,
Vol. 9, No. 2.
6. Indian Institute of Population Studies (2006): “Socio-Economic and Demographic Indicators”,Mumbai
7. Ray Chaudhuri, Ajitava and Sushil Kr. Halder (2009): An Investigation into the Inter-District Disparity
in West Bengal, 1991-2005, EPW June 27, Vol. XLIV Nos.26 & 27
8. Sarkar S.(2009) “Disparities in Infrastructural development-An inter-district analysis of West Bengal”,
The IUP Journal of Infrastructure, Vol.VII, Nos 3&4, Sep-Dec, P.56-78.
9. S. Kishan Rao & Rahul A. Shastri (2014): Structure and Development of the Economies of telangana
and AP States (1956-2014),National Akademi of Development
10. Suryanarayana, M.H., (2009): ‘Intra-State Economic Disparities:Karnataka and Maharashtra’, Economic
and Political Weekly, June 27, Mumbai
11. V.K.Puri & S.K.Misra (2014) “Indian Economy”, Himalaya Publishing House
Structure and Development in the Residuary State of Andhra Pradesh : 1960-2015 • T. KOTI REDDY

52 The Economy of Andhra Pradesh
ARTICLE / 8
HOUSEHOLD LEVEL POVERTY IN TWO ECONOMIESOF ANDHRA PRADESH & TELENGANA AND
COMPARISON WITH UTTAR PRADESH & ALL INDIA
Alok Kumar Pandey & A.K. Gaur
INTRODUCTION
The issue of Poverty has attracted much attention from researchers since long time. As
far back as 1776, Adam Smith recognized the relativity of absolute measures by defining
“necessaries” as “not only the commodities which are indispensably necessary for the support
of life, but whatever the custom of the country renders it indecent for credible people, even
of the lowest order, to be without”. The conventional measures of poverty relate household
per capita income or expenditure estimates to a poverty line derived from a nutrition-based
estimate of minimum income or expenditure. There is widespread criticism of this approach
on the grounds that it fails to capture important dimensions of poverty and that it often fails
to reflect subjective perceptions of well-being. Greeley (1994) argues that the polemic on
method is misdirected and it confuses measures of poverty with measure of well-being and
counting problems with concept problems. In underdeveloped countries, the poverty line is
commonly set at subsistence level, but what is the level of subsistence for each dimension
of poverty and vulnerability? In developed countries, poverty is often considered as a relative
concept. The level of the poverty line is there often expressed as a percentage of the central
tendency. Such ambiguous choices often induce controversy, especially because the incidence
of poverty can be very sensitive to the level of the poverty line.
Finally, the poverty line is recognized generally as being conceptually flawed. It is
specified by a discreet income level and the poor are defined as those with incomes at or
below the poverty line. The nonpoor are defined as those whose incomes are above the
poverty line. Still, about one third of the population lives under the International Poverty line
of $1.08 per person per day, and out of them three in four poor people live in rural areas.
Thus poverty in India is mainly a rural problem.It is against this backdrop, the present study
has been undertaken, which is broadly divided in to five sub sections. Section I present
Assistant Professor, Centre for Integrated Rural Development, Faculty of Social Sciences, Banaras HinduUniversity, VaranasiProfessor, Department of Economics, Faculty of Social Sciences, Banaras Hindu University, Varanasi.

53
introduction while section II presents review of literature in detail. Data and research
methodology have been presented in section III while results and discussions are presented
in section IV. Section V presents suggestion and conclusion of the present study.
DATA AND METHODOLOGY
The National Sample Survey Organization (NSSO) conducts regular consumer
expenditure surveys (CES) as part of its “rounds”, each round being normally of a year’s
duration and covering more than one subject of study. The surveys are conducted through
household interviews, using a random sample of households covering practically the entire
geographical area of the country. Every 5 years or so, a larger-than-usual-scale CES is
conducted as the main enquiry of a round. This gives rise to a “quinquennial series” of CES’s.
In the present study 66th quinquennial series has been taken for the data analysis. Poverty
prevents people from advancing in economic and social spheres of life. For comparing
poverty indices based on average monthly per capita consumption expenditure, households
source of income in rural and urban region of Andhra Pradesh, Telengana, Uttar Pradesh and
All India have been taken in this study (see notes).
All the indices have been calculated by using STATA 11.0 and “poverty”, “povdeco”
and “apoverty” programme developed by Kerm (1999) and further Azevedo (2006) Jenkins
(2006). In the present paper we have used “apoverty”. Grpah like Kernal Density, Pen’s
Parade, Lorenze and Inequality curve, generalized Lorenz curve for rural and urban based on
AMPCE MRP for the three states and all India has been drawn for the graphical presentation
of poverty. Poverty indices (see notes) has been calculated for households level consumption
expenditure in rural and urban region of Andhra Pradesh, Telegana, Uttar Pradesh and all
India.
RESULTS AND DISCUSSION
The average family size has been 3.8 persons per family for Andhra Pradesh and 4.0
persons for Telengana. Average family size has been 5.6 persons per family for all India and
6.7 persons for Uttar Pradesh. As for as annual expenditure of per family is concerned Rs.
77939 (based on URP) and Rs. 80457 (based on MRP) for all India and Rs. 75303 (based
on URP) and Rs. 77909 (based on MRP) for Uttar Pradesh has been found for NSSO 66 th
rounds of unit level survey.
Table 1 presents Andhra Pradesh, Telegana, Uttar Pradesh and all India distribution of
rural urban households in the year based on 66 th round of socio economic survey of NSSO.
In this round of survey total 100855 households were covered for all India level, 3992
household were covered in Andhra Pradesh, 2900 household were covered in Telegana and
8993 households were covered for Uttar Pradesh. From rural India the total HH number was
59119 (58.62 %) and from urban India it was 41736 (41.38 %) and from rural Uttar Pradesh
the total number was 5906 (65.67 %) and from urban Uttar Pradesh it was 3087 (34.33%)
Household Level Poverty • ALOK KUMAR PANDEY & A.K. GAUR

54 The Economy of Andhra Pradesh
reported in survey. From rural Andhra Pradesh the total HH was 2424 (60.72%) and from
urban Andhra Pradesh it was 1568 (39.28%) and from rural Telengana the total number was
1504 (51.86 %) and from urban Telengana it was 1396 (48.14%) reported in survey.
Table 2 contains general characteristics of the Head of Household and average monthly
per capita expenditure of the households for Andhra Pradesh, Telegana, Uttar Pradesh and all
India. In this round AMPCE has been 1099 (URP) and 1150 (MRP) for rural Andhra Pradesh
and for urban Andhra Pradesh it has been1150 (URP) and 1862 (MRP). While AMPCE has
been 898 (URP) and 997 (MRP) for rural Telegana and for urban Telegana it has been 1990
(URP) and 2197 (MRP). This reveals the fact that rural Andhra Pradesh is having hire
AMPCE than all India, rural Uttar Pradesh and rural Telengana while in urban region Telegana
is having hire AMPCE than all India, Uttar Pradesh and Andhra Pradesh (see table 2). In
Uttar Pradesh, 65.67 percent households were covered from rural areas and their AMPCE
was Rs. 828.68 and 832.18 based on URP and MRP respectively while 34.33 percent
households were covered in urban areas and their AMPCE was Rs. 1364.99 and Rs. 1512.16
based on URP and MRP respectively. For all India level, 58.62 percent households were
covered from rural areas and their AMPCE was Rs. 927.70 and 953.05 based on URP and
MRP respectively while 41.38 percent households were covered in urban areas and their
AMPCE was Rs. 1785.82 and Rs. 1856.01 based on URP and MRP respectively.
Distribution of households and their AMPCE for the various sources of income in rural
and urban region of Andhra Pradesh, Telegana, Uttar Pradesh and all India are presented in
Table 2. The source of income for the households in the rural region of Andhra Pradesh,
Telegana, Uttar Pradesh and all India is Self-employed in non-agriculture, Agricultural labour,
Other labour in rural areas, Self-employed in agriculture, Others activities in rural areas and
for urban region of Andhra Pradesh, Telegana, Uttar Pradesh and all India are Self-employed
in urban areas, Regular wage/salary earning in urban areas, Casual labour in urban areas,
Others activities in urban areas. Table 2 also presents religion and social group wise percentage
distribution and average monthly per capita expenditure of the households for the 66 th round.
Excluding Hindu and Muslims, other religions are having less percentage while their AMPCE
is higher than Hindu and Muslims in Andhra Pradesh, Telegana, Uttar Pradesh as well as All
India. Among social groups, Other Backward Class is having higher percentage in Andhra
Pradesh, Telegana, Uttar Pradesh as well as All India. While average monthly per capita
consumption expenditure is higher for other social groups in state and All India level.
Graph 1 to 4 represents kernal density curve for rural urban based on AMPCE MRP for
Telengana, Andhra Pradesh, Uttar Pradesh and All India. Graph 5 to 8 represents Pen,s
Parade curve for rural urban based on AMPCE MRP for Telengana, Andhra Pradesh, Uttar
Pradesh and All India. Graph 9 to 12 represents Lorenz and Inequality curve for rural urban
based on AMPCE MRP for Telengana, Andhra Pradesh, Uttar Pradesh and All India. Graph
13 to 16 represents Generalized Lorenz curve for rural urban based on AMPCE MRP for
Telengana, Andhra Pradesh, Uttar Pradesh and All India.

55Household Level Poverty • ALOK KUMAR PANDEY & A.K. GAUR

56 The Economy of Andhra Pradesh
Table 3 represent Mean AMPCE among poor, mean of poverty gaps (poverty line –
AMPCE) for the three states i.e. Andhra Pradesh, Telengana, Uttar Pradesh, and all India. All
the three states are having higher mean of AMPCE among poor than rural all India. Andhra
Pradesh and Uttar Pradesh is having lower value of mean of poverty gaps among poor than
Telengana and all India in Rural areas. For urban areas only Uttar Pradesh is having lower
value of Mean of poverty gaps among poor.
Based on average monthly per capita consumption expenditure the poverty line declared
by planning commission for state and all India level various poverty related ratios (index)
have been calculated. These are Headcount ratio, Extreme Poverty Headcount ratio, Aggregate

57
poverty gap, Per capita poverty gap, Poverty gap ratio, Income gap ratio, Watts index, Foster–
Greer–Thorbecke class index (at 0.5, 1.5, 2.0, 2.5, 3.0, 3.5, 4.0, 4.5 and 5.0 ), Clark–
Hemming–Ulph class index (0.10, 0.25, 0.50, 0.75 and 0.90), Sen index. Rural and urban
poverty indices have been calculated for Andhra Pradesh, Telegana, Uttar Pradesh and all
India level (for URP and for MRP) based household level AMPCE for the 66th rounds of
survey and presented in table 4.
In general, incidence of poverty is much higher in rural areas compared to urban areas.
HCR reported 34.44 (for URP) and 26.97 (for MRP) rural region and 17.50 (for URP) and
11.26 (for MRP) in Urban Region of Telegana respectively. HCR reported 26.30 (for URP)
and 19.94 (for MRP) rural region and 25.49 (for URP) and 23.09 (for MRP) in Urban Region
of Andhra Pradesh respectively. HCR reported 45.04 (for URP) and 39.349 (for MRP) rural
region and 34.402 (for URP) and 31.665 (for MRP) in Urban Region of Uttar Pradesh
respectively. HCR for rural All India is 38.280 (for URP) and 33.813 (for MRP) and for
urban all India 24.293 (for URP) and 20.881 (for MRP) respectively. In rural region of
Telegana, Andhra Pradesh, Uttar Pradesh and all India, poverty related indices are higher than
the Telegana, Andhra Pradesh, Uttar Pradesh and urban all India (Except AMPCE at MRP
for Andhra Pradesh).
Extreme Poverty Headcount ratio, Aggregate poverty gap, Income gap ratio, Watts
index, Foster–Greer–Thorbecke class index (at 2.5, 3.0, 3.5, 4.0, 4.5 and 5.0) and Sen index
reported lower values for rural Andhra Pradesh, Telengana, All India than rural Uttar Pradesh
(for both URP and MRP) respectively based on consumption expenditure at household level
for the 66th round.
CONCLUSION AND SUGGESTION
The study focused on poverty in Andhra Pradesh, Telengana, Uttar Pradesh and All
India at household level. The data for the study has been taken from the NSSO 66 th rounds
survey. Various poverty indices have been calculated consumption expenditure. These are
Headcount ratio, Extreme Poverty Headcount ratio, Aggregate poverty gap, Per capita poverty
gap, Poverty gap ratio, Income gap ratio, Watts index, Foster–Greer–Thorbecke class index
(at 0.5, 1.5, 2.0, 2.5, 3.0, 3.5, 4.0, 4.5 and 5.0 ), Clark–Hemming–Ulph class index (0.10,
0.25, 0.50, 0.75 and 0.90), and Sen index.
All the poverty indices used in the present paper for measuring poverty (excluding
extreme poverty, head count ratio) reported the highest value for the household whose source
of income is other labour in rural areas. For rural all India, poverty indices show that households
whose source of income is from agricultural labour are having maximum value than any other
activities. The result shows that the state government must focus sincerely on those households
who are engaged in other labour in rural areas and agricultural labour. The central government
should again work out for those household who are engaged in Agricultural labour to reduce
Household Level Poverty • ALOK KUMAR PANDEY & A.K. GAUR

58 The Economy of Andhra Pradesh
or remove poverty at household level. But the need of the hour is to identify poor and make
them self dependent by developing technical skills and entrepreneurial ability, so that the
society could progress without poverty and hunger.
NOTES:
MEASURES OF POVERTY
There are various indices for the measures of poverty. The very common is head count
index. Head count index measures the proportion of the population that is poor.
Head count index H = q/n
Where q is number of poor and n is the total population. The range of head count index
is from 0 to 1 i.e. nobody poor to everybody poor. This index does not differentiate between
extremely low incomes and income just below the poverty line.
Poverty gap index measures the extent to which individuals fall below the poverty line
as a proportion of the poverty line.
The Income Gap Ratio(I) is the mean distance of the incomes of the poor from the
poverty line, expressed as a proportion of the poverty line.
The income gap gi of any individual i is the difference between the poverty line z and
his income yi. gi= z - y
i
Obviously, gi is nonnegative for the poor and negative for others.
In 1968 Watts proposed the first distribution sensitive poverty measures. The Watts
poverty index is defined as
The Foster Greer Thorbacke (FGT) index is
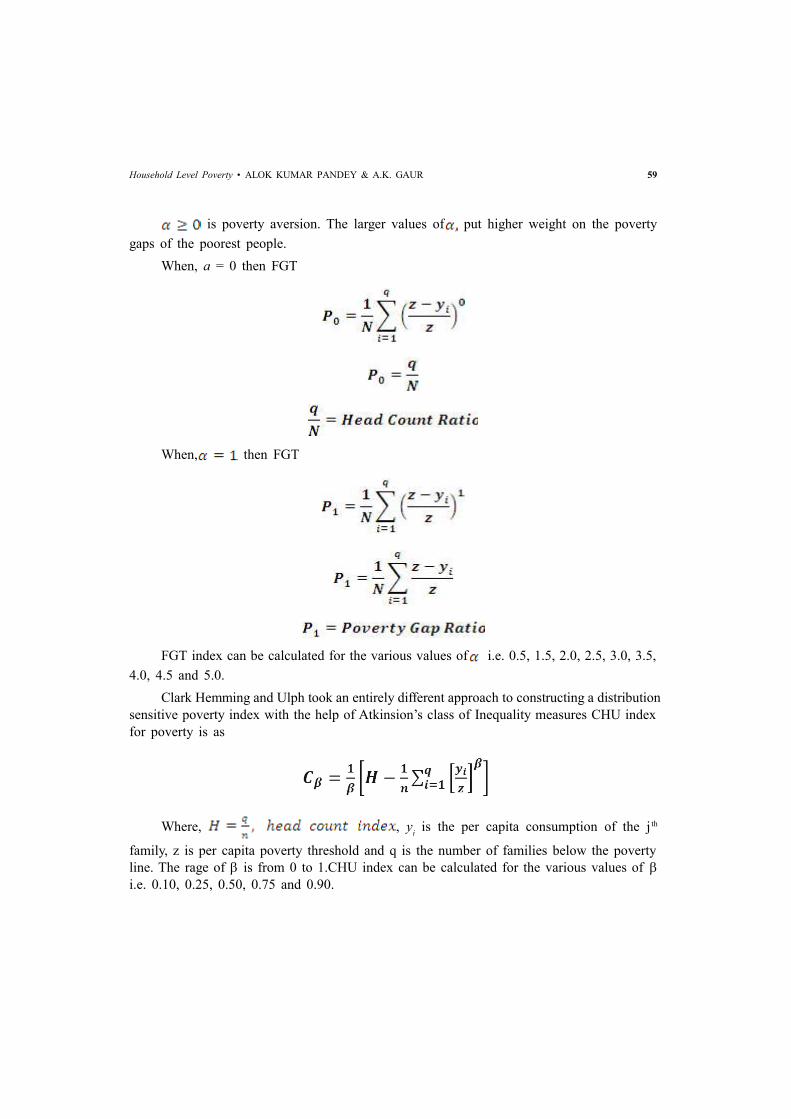
59
is poverty aversion. The larger values of put higher weight on the poverty
gaps of the poorest people.
When, a = 0 then FGT
When, then FGT
FGT index can be calculated for the various values of i.e. 0.5, 1.5, 2.0, 2.5, 3.0, 3.5,
4.0, 4.5 and 5.0.
Clark Hemming and Ulph took an entirely different approach to constructing a distribution
sensitive poverty index with the help of Atkinsion’s class of Inequality measures CHU index
for poverty is as
Where, , yi is the per capita consumption of the j th
family, z is per capita poverty threshold and q is the number of families below the poverty
line. The rage of is from 0 to 1.CHU index can be calculated for the various values of
i.e. 0.10, 0.25, 0.50, 0.75 and 0.90.
Household Level Poverty • ALOK KUMAR PANDEY & A.K. GAUR

60 The Economy of Andhra Pradesh
The Sen Index of poverty
is the Gini index of inequality among the poor, H and I are head count and income
gap.
Sen Index can be written as
Where q is number of poor, n is number of person in the population and z is poverty
line.
REFERENCES
1. Brandon Roberts, Deborah Povich and Mark Mather, (2012), “Low-Income Working Families: The
Growing Economic Gap” Working Poor Families Project, POLICY BRIEF,
www.workingpoorfamilies.org
2. D Jayaraj, and S Subramanian (2012), “On the Interpersonal Inclusiveness of India’s Consumption
Expenditure Growth” Economic & Political Weekly, vol XLVII, no 45, pp 56-66.
3. Jayaraj, D and S Subramanian (2012), “On the Interpersonal Inclusiveness of India’s Consumption
Expenditure Growth” Economic & Political Weekly vol XLVII no 45, pp 56-66.
4. Jayati Ghosh, (2011), “Cash Transfers as the Silver Bullet for Poverty Reduction: A Sceptical Note”
Economic & Political Weekly, vol XLVI no 21, pp 67-71.
5. Kumar Mukul, (2012), “Invoking Everydayness in Poverty Studies in IndiaA Note on Approach and
Method” Economic & Political Weekly, vol XLVII no 38, pp 71-81.
6. Manna G C, (2012), “On Some Contentious Issues of the New Poverty Line”, Economic & Political
Weekly, vol XLVII no 15, pp 11-14
7. Manna G C, (2012), “On Some Contentious Issues of the New Poverty Line”, Economic & Political
Weekly, vol XLVII no 15, pp 11-14
8. N Krishnaji, (2012), “Abolish the Poverty Line” Economic & Political Weekly, vol XLVII no 10, pp
10-11.
9. NSSO, (2011), “Level and Patterns of Consumer expenditure 2009-10”, National Sample Survey
Organization, Ministry of Statistics and Program Implementation, Govt. of India.
10. NSSO, (2012), “Household Consumer Expenditure Across Socio-Economic Groups” National Sample
Survey Organization, Ministry of Statistics and Program Implementation, Govt. of India.
11. Pandey A. K., (2013), “Inequality in consumption expenditure at household level in Uttar Pradesh:
Regression Based Inequality Decomposition (RBID)”, Journal of Global Economy (ISSN Print-0975-
3931, Online -2278-1277), Volume 9 No 2, pp 134-152.
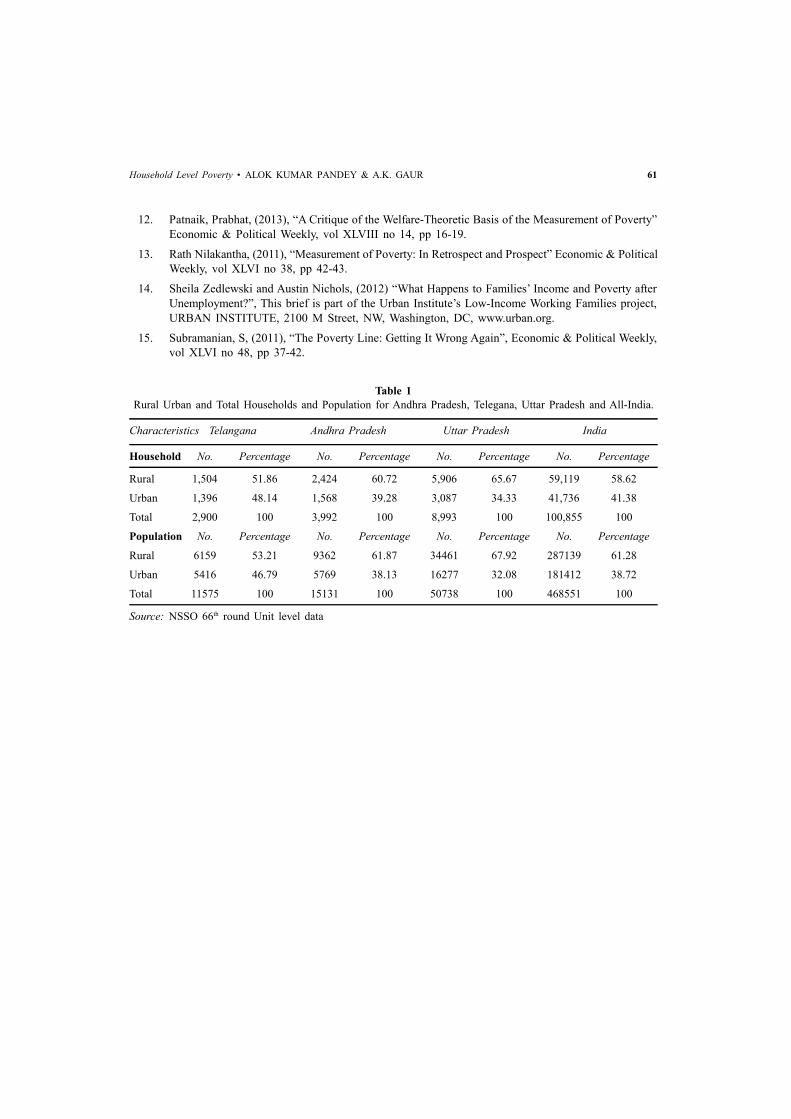
61
12. Patnaik, Prabhat, (2013), “A Critique of the Welfare-Theoretic Basis of the Measurement of Poverty”
Economic & Political Weekly, vol XLVIII no 14, pp 16-19.
13. Rath Nilakantha, (2011), “Measurement of Poverty: In Retrospect and Prospect” Economic & Political
Weekly, vol XLVI no 38, pp 42-43.
14. Sheila Zedlewski and Austin Nichols, (2012) “What Happens to Families’ Income and Poverty after
Unemployment?”, This brief is part of the Urban Institute’s Low-Income Working Families project,
URBAN INSTITUTE, 2100 M Street, NW, Washington, DC, www.urban.org.
15. Subramanian, S, (2011), “The Poverty Line: Getting It Wrong Again”, Economic & Political Weekly,
vol XLVI no 48, pp 37-42.
Table 1
Rural Urban and Total Households and Population for Andhra Pradesh, Telegana, Uttar Pradesh and All-India.
Characteristics Telangana Andhra Pradesh Uttar Pradesh India
Household No. Percentage No. Percentage No. Percentage No. Percentage
Rural 1,504 51.86 2,424 60.72 5,906 65.67 59,119 58.62
Urban 1,396 48.14 1,568 39.28 3,087 34.33 41,736 41.38
Total 2,900 100 3,992 100 8,993 100 100,855 100
Population No. Percentage No. Percentage No. Percentage No. Percentage
Rural 6159 53.21 9362 61.87 34461 67.92 287139 61.28
Urban 5416 46.79 5769 38.13 16277 32.08 181412 38.72
Total 11575 100 15131 100 50738 100 468551 100
Source: NSSO 66th round Unit level data
Household Level Poverty • ALOK KUMAR PANDEY & A.K. GAUR

62 The Economy of Andhra Pradesh
Ta
ble
2
Gen
eral
Ch
arac
teri
stic
s of
the
Hea
d o
f th
e H
ouse
ho
ld a
nd
AM
PC
E o
f th
e H
ou
seh
old
s fo
r A
ndh
ra P
rad
esh,
Tel
egan
a, U
ttar
Pra
des
h
and
All
In
dia
.
Chara
cter
isti
csTe
leng
ana
An
dh
ra P
rad
esh
Utt
ar
Pra
des
hIn
dia
%A
vera
ge
%A
vera
ge
%A
vera
ge
%A
vera
ge
MP
CE
(‘)
MP
CE
(‘)
MP
CE
(‘)
MP
CE
(‘)
UR
PU
RP
MR
PU
RP
MR
PU
RP
MR
P
12
34
56
78
91
011
12
13
Sec
tor
Ru
ral
51.8
68
98
997
60.7
21
09
911
50
65.6
78
29
83
25
8.6
29
28
95
3
Urb
an
48.1
41
99
02
19
73
9.2
81
97
51
86
23
4.3
31
36
51
51
24
1.3
81
78
61
85
6
Sou
rce
of
Inco
me
of
ho
use
ho
ld b
y d
iffe
ren
t act
ivit
ies:
Ru
ral
Sel
f-em
plo
yed
in
non
-ag
ricu
ltu
re3
0.5
21
00
911
36
26.5
71
09
511
43
22.7
18
59
84
22
4.6
49
85
99
5
Agri
cult
ura
l la
bou
r1
6.4
97
58
816
19.1
905
964
7.0
66
73
67
811
.08
71
87
35
Oth
er l
ab
ou
r in
ru
ral
are
as
16.3
69
33
103
21
7.9
107
91
09
41
8.6
16
62
68
11
7.3
78
50
87
2
Sel
f-em
plo
yed
in
agri
cult
ure
24.9
39
70
11
09
18.6
51
04
31
08
43
9.3
28
71
87
62
8.1
09
71
10
01
Oth
ers
act
ivit
ies
in r
ura
l are
as
11
.70
11
95
130
31
7.7
81
88
01
97
61
2.3
11
07
51
07
61
8.8
11
38
21
44
6
Sou
rce
of
Inco
me
of
ho
use
ho
ld b
y d
iffe
ren
t act
ivit
ies:
Urb
an
Sel
f-em
plo
yed
in
urb
an
are
as
28.8
01
76
81
95
63
3.4
81
53
61
57
45
1.3
411
51
11
62
37
.39
16
38
17
18
Reg
ula
r w
age/
sala
ry e
arn
ing
in
urb
an
are
as
48.6
42
28
52
51
03
5.8
42
75
22
33
22
6.5
18
18
18
92
37
.79
21
53
21
70
Casu
al
lab
ou
r in
urb
an
are
as
11
.25
11
53
126
81
6.7
79
73
994
12.5
71
67
43
13
.35
99
31
00
7
Oth
ers
act
ivit
ies
in u
rba
n a
reas
11
.32
263
22
99
41
3.9
254
42
90
79
.65
21
80
37
51
11
.47
99
32
77
4
Rel
igio
n
Hin
du
84.4
81
24
71
38
58
6.9
21
28
71
33
18
0.4
49
58
99
47
6.1
711
50
11
91
Isla
m1
2.5
911
66
126
28
.94
165
51
30
71
8.9
78
16
83
31
2.3
41
02
01
03
2

63
12
34
56
78
91
011
12
13
Oth
ers
2.9
31
40
81
58
04
.13
147
01
44
40
.58
15
28
15
23
11
.49
16
56
16
92
Soci
al
Gro
up
s
Sch
edu
led
Tri
be
6.4
58
88
992
5.0
49
08
888
0.8
51
60
32
32
91
3.0
48
54
88
2
Sch
edu
led
Cast
e1
7.8
61
06
011
46
16.0
811
28
11
61
22.9
75
07
76
16
.25
88
79
23
Oth
er B
ack
ward
Cla
ss4
5.6
61
07
711
91
48.7
511
96
121
64
9.3
28
82
90
33
7.5
71
06
411
00
Oth
ers
30.0
31
80
12
01
73
0.1
41
74
01
71
92
6.9
41
22
91
26
63
3.1
41
57
16
22
Note
: C
alcu
late
d o
n t
he
bas
is o
f U
nit
lev
el d
ata
NS
SO
dat
a fo
r th
e 6
6th r
ou
nd
s.
Ta
ble
3
Var
ious
Mea
sure
s re
late
d w
ith h
ou
seh
old
bel
ow
po
ver
ty l
ine
at H
ou
seho
ld l
evel
co
nsu
mpti
on E
xp
end
iture
in
An
dh
ra P
rad
esh,
Tel
egan
a,
Utt
ar P
rades
h a
nd
All
In
dia
.
Chara
cter
isti
csTe
leng
ana
An
dh
ra P
rad
esh
Utt
ar
Pra
des
hA
ll I
nd
ia
Ru
ral
Urb
an
Ru
ral
Urb
an
Rura
lU
rba
nR
ura
lU
rba
n
Tota
l n
um
ber
of
ob
serv
ati
on
s1
50
41
39
62
42
41
56
85
90
63
08
75
911
94
17
36
Nu
mb
er o
f ob
serv
ati
on
s p
oor
251
161
403
350
17
69
95
711
88
68
41
7
Mea
n o
f m
pce
_m
rp a
mo
ng
st t
he
poo
r5
46
730
553
724
53
66
15
52
96
68
Mea
n o
f p
over
ty g
ap
s (p
over
ty
lin
e -
mp
ce_m
rp)
am
on
gst
th
e p
oo
r1
47
196
140
202
12
81
85
14
41
91
Pov
erty
Lin
e (A
MP
C_M
RP
)6
94
926
694
926
66
48
00
67
38
60
So
urc
e:
NS
SO
66
th r
oun
d U
nit
lev
el d
ata
Household Level Poverty • ALOK KUMAR PANDEY & A.K. GAUR

64 The Economy of Andhra Pradesh
Ta
ble
s 4
Pover
ty M
easu
re a
t H
ouse
ho
ld l
evel
co
nsu
mp
tion
Exp
end
itu
re i
n A
nd
hra
Pra
des
h,
Tel
egan
a, U
ttar
Pra
des
h a
nd
All
In
dia
.
Pove
rty m
easu
res
Tela
ngan
Andh
ra P
rade
shUt
tar
Prad
esh
All I
ndia
Rura
lUr
ban
Rura
lUr
ban
Rura
lUr
ban
Rura
lUr
ban
URP
MRP
URP
MRP
URP
MRP
URP
MRP
URP
MRP
URP
MRP
URP
MRP
URP
MRP
Head
coun
t rat
io34
.442
26.9
6917
.502
11.2
6026
.296
19.9
3525
.494
23.0
8845
.040
39.3
4934
.402
31.6
6538
.280
33.8
1324
.293
20.8
81
Extre
me P
over
tyHe
adco
unt r
atio
0.75
40.
753
0.45
80.
721
1.20
81.
425
0.48
70.
711
1.54
10.
616
2.10
01.
453
2.26
01.
473
1.57
11.
075
Aggr
egate
pov
erty
gap
1.13
80.
829
0.28
80.
211
1.26
20.
907
0.63
00.
526
8.66
36.
738
2.28
51.
968
43.3
7235
.433
13.2
5610
.802
Per c
apita
pov
erty
gap
54.5
1439
.731
30.1
7322
.124
38.9
4927
.983
55.8
7046
.664
64.8
1950
.420
67.8
6858
.432
59.4
5248
.570
49.0
1039
.939
Pove
rty g
ap r
atio
7.85
75.
727
3.25
72.
388
5.61
44.
033
6.03
15.
037
9.76
67.
597
8.48
57.
305
8.83
67.
219
5.70
14.
646
Incom
e ga
p ra
tio22
.813
21.2
3418
.609
21.2
1121
.349
20.2
3223
.656
21.8
1721
.683
19.3
0624
.663
23.0
6923
.084
21.3
5023
.469
22.2
51
Watt
s ind
ex9.
576
6.88
43.
905
2.93
56.
990
5.05
57.
350
6.13
011
.821
9.01
310
.572
8.98
010
.951
8.80
67.
093
5.72
1
FGT(
0.5)
15.3
3411
.629
6.95
84.
814
11.2
228.
227
11.6
7110
.036
19.6
0716
.078
15.9
7614
.247
17.1
3514
.511
10.9
669.
151
FGT
(1.5)
4.33
03.
056
1.68
91.
306
3.10
42.
234
3.34
12.
753
5.27
53.
911
4.85
34.
058
4.96
33.
925
3.23
02.
579
FGT(
2.0)
2.51
01.
722
0.94
40.
767
1.84
81.
352
1.93
81.
592
3.01
22.
137
2.92
22.
384
2.95
72.
271
1.94
11.
521
FGT(
2.5)
1.51
01.
010
0.55
80.
475
1.16
70.
874
1.16
20.
959
1.79
31.
220
1.83
01.
463
1.84
21.
377
1.21
80.
939
FGT(
3.0)
0.93
50.
610
0.34
40.
307
0.77
30.
593
0.71
50.
596
1.10
30.
722
1.18
30.
929
1.18
90.
867
0.79
00.
600
FGT(
3.5)
0.59
30.
378
0.22
00.
205
0.53
40.
418
0.44
90.
380
0.69
70.
441
0.78
60.
608
0.79
00.
564
0.52
70.
395
FGT(
4.0)
0.38
30.
239
0.14
50.
140
0.38
20.
302
0.28
70.
247
0.45
10.
276
0.53
40.
407
0.53
90.
377
0.36
00.
266
FGT(
4.5)
0.25
20.
154
0.09
70.
098
0.28
10.
224
0.18
60.
163
0.29
80.
176
0.37
10.
279
0.37
60.
258
0.25
10.
183
FGT(
5.0)
0.16
80.
101
0.06
70.
069
0.21
20.
169
0.12
20.
109
0.20
00.
115
0.26
20.
195
0.26
70.
180
0.17
80.
128
CHU
(0.10
)9.
377
6.75
13.
829
2.87
06.
822
4.93
07.
198
6.00
311
.584
8.85
210
.325
8.78
410
.700
8.62
06.
928
5.59
4
CHU
(0.25
)9.
091
6.56
03.
721
2.77
86.
585
4.75
46.
979
5.82
211
.242
8.61
89.
973
8.50
210
.343
8.35
46.
693
5.41
4
CHU
(0.50
)8.
646
6.26
13.
554
2.63
66.
226
4.48
76.
638
5.53
810
.710
8.25
39.
430
8.06
79.
792
7.94
26.
331
5.13
4
CHU
(0.75
)8.
236
5.98
43.
399
2.50
65.
904
4.24
86.
322
5.27
810
.219
7.91
38.
936
7.66
99.
292
7.56
56.
001
4.87
9
CHU
(0.90
)8.
005
5.82
73.
313
2.43
45.
727
4.11
66.
145
5.13
19.
943
7.72
18.
660
7.44
79.
014
7.35
45.
818
4.73
7
Sen
index
7.98
35.
824
3.28
52.
409
5.76
24.
146
6.08
75.
085
9.97
17.
742
8.51
97.
333
9.56
67.
771
5.83
54.
742
Note
: Ca
lculat
ed o
n the
bas
is of
Unit
level
data
NSSO
data
for t
he 6
6th roun
ds a
nd “a
pove
rty” S
TATA
com
mand
.

65
ARTICLE / 9
URBAN DEVELOPMENT IN ANDHRA PRADESHSTATE : A COMPARATIVE PICTURE
WITH TELANGANA STATE
S. Mansoor Rahman & N.T.K. Naik
ABSTRACT
The imminent formation of the new state of Telangana over 35 million people, the
merger of the former Hyderabad state with the Indian union in 1948 marked the end of
feudalism and opened up a vista of opportunities for development for the people of Telangana.
But not much time was a-llowed for socio-economic change and transformation in Telangana
before it was merged with the Andhra region to constitute the state of Andhra Pradesh in
1956. Telangana’s merger with the more resourceful, educated, skilled people Seemandhra
took new dimensions in the development of Telangana especially in Hyderabad.
The total population of Telangana is 3,51, million of the total 8,46,million people in
Andhra Pradesh.. In 2001, the population of Telangana was 3,09,87,271 and had a 14.59%
growth rate. However, in 2011, the growth rate dipped to 11.49%. Except Rangareddy district,
which registered a 48.15% growth in 2011 as against 40% in 2001, all the other districts
showed a decline. The other exception being Mahbubnagar district which maintained the
growth rate of 15%.Telangana has more people living in urban areas than Andhra Pradesh.
While TS has 38.7 per cent urban population, AP has 33.5 per cent
The population of the State is predominantly rural with 61.33% of people residing in
rural areas and the remaining 38.67% of people residing in urban areas. While the growth of
total population in the State has moderated to 13.58% in the decade 2001 to 2011 from
18.77% in the preceding decade, the growth of the urban population has been witnessing a
signifi cant increase. Urban population in the State grew by 38.12% in the decade 2001 to
2011 as compared with 25.13% in the preceding decade. In sharp contrast, rural population
in the State grew by a modest 2.13% as per the 2011 census. The growth of urban population
is mainly on account of migration from Seemandhra region of the erstwhile State of Andhra
Pradesh and partly on account of migration from within the State and other parts of the
country.
Associate Professor, Osmania College (Autonomous)Kurnool, (A.P)Department of Economics, Rayalaseema University, Kurnool, (A.P)

66 The Economy of Andhra Pradesh
ARTICLE / 10
ECONOMIC SCENARIO OF ANDHRA PRADESH :ACHIEVING DOUBLE DIGIT INCLUSIVE GROWTH
Balla Appa Rao & D. Nagayya
Andhra Pradesh is envisaging a big structural transformation – both in terms of economic
progress and well-being of people as well. From a modest beginning in 2015-16, the State
aspires to achieve the status of a developed state in the country by 2029 in between navigating
through one among the best three states by 2022 with a vision to lay foundation of the sunrise
State of Andhra Pradesh. Eventually, Andhra Pradesh is to become a leading investment
destination in the World by 2050. Swift growth in double digit, better infrastructure,
participatory planning, and better governance through effective service delivery marked with
improved Happiness Index are going to be the key milestones for realization of Vision 2029
formulated by the State..
Andhra Pradesh, in the present form, in the post-bifurcation period from June 2, 2014,
when the division of the State into Telangana and residuary Andhra Pradesh took place,
consists of 13 districts with two regions – Coastal Andhra (9 districts) and Rayalaseema (4
districts). The State’s population in 2015 has crossed the 5 crore mark. This is one of the
progressive major states in the country pursuing development strategies with sufficient attention
paid to sustainable development goals (SDGs) on the social and human development scenario.
The state is the 7th largest in area, and 10 th largest in population among the 16 major states
of the country. In social indicators, it has a long way to go to be on a par with the other
southern and western states as revealed from Table 1. The state has many advantages for
sustainable growth of the economy. It has the second longest coastline of 974 kms., next only
to Gujarat. Visakhapatnam is the largest city and a commercial hub of the state, followed by
Vijayawada. Both are million cities as per 2011 population Census. The other commercial and
industrial centres include: Guntur, Kakinada, Rajamahendravaram, Kurnool, and Tirupati.
Hyderabad is currently the joint capital for a period not exceeding ten years from 2014. The
State is building a river-front, world class capital city, Amaravati, covering parts of Krishna
and Guntur districts, in the area declared as capital region.The state is endowed with a variety
of physio-geographic features ranging from Eastern ghats, Nallamala forests, Coastal plains
UGC Emeritus Professor, Ex-Dean and Head, Dept. Commerce and Management Studies, Andhra University,Visakhapatnam. (Andhra Pradesh).Consultant on Small and Medium Enterprises, Guntur; and Former Director (Industrial Development),National Institute for Micro, Small and Medium Enterprises (NI-MSME), Hyderabad.

67
to deltas of major rivers of Krishna and Godavari. The state pioneered in green revolution
in the 1970s with focus on paddy cultivation. It is known as the rice bowl of India.
At the end of September 2015, large and mega industries in the state number 1,784
enterprises, with 81,261 crore fixed investment, and employment of 4.36 lakhs. At the end
of March 2015, micro, small and medium enterprises (MSMEs) number 1,09,399, with fixed
investment of 19,000 crore, and employment of 12.09 lakhs. There are 272 industrial estates
and industrial development areas in the state promoted from early 1960s, with a few developed
in the recent two decades. These are now known as industrial parks, covering an area of over
36,000 acres. Of the 29 Special Economic Zones (SEZs) formally approved for the state, 19
have become operational in seven districts, of which 8 are in Visakhapatnam district. There
are four Software Technology Parks at Visakhapatnam, Kakinada, Vijayawada, and Tirupati.
Among the 13 districts, seven are categorised as less developed for which special attention
needs to be paid for accelerating industrialisation. These are four districts of Rayalaseema and
three of North Coastal Andhra (Srikakulam, Vizianagaram and Visakhapatnam).
It can be observed from Table 2 that GVA of Andhra Pradesh at constant prices for
2015-16 (AE) is estimated at Rs. 4,55,484 crore as against Rs. 4,12,188 crore during 2014-
15 (FRE), and registered growth of 10.5% (India 7.3%). The sectoral growth rates are 8.40%
for agriculture (India 1.12%), 11.13% for industry (India 7.35%), and 11.39% for services
(India 9.19%). A targeted approach encompassing all the sectors, has been quite helpful for
analysing the past trends sector-wise, and identifying the growth engines, and weak aspects.
GSDP growth rate at constant prices for the State in 2015-16 is 10.99% (India 7.6%). Sector-
wise percentage shares at current prices in GVA for the State and India for 2015-16 are:
agriculture 29.4 (India 18.25), industry 23.6 (India 31.7), services 47.0 (India 50.02). Annual
GSDP growth rate at constant prices for the State was 5.6% in 9 th Plan, 8.2% in 10th and 11th
Plans, and 10.2% envisaged in the 12th Plan.
VISION 2029 – SUNRISE STATE OF ANDHRA PRADESH
Andhra Pradesh has set for itself a target of becoming one of the top three states in India
by 2022,in-terms of socio-economic development and ease of doing business. The State
aspires to achieve the status of a developed state in the country by 2029, and the vision is
to lay the foundation for the Sunrise State of Andhra Pradesh. Achievement of this vision is
incumbent upon a fast paced and sustainable double digit growth, delivered through a
combination of programmatic and project interventions with focus on sustainable and inclusive
development.
Andhra Pradesh is poised at an interesting juncture in history as it tries to balance the
varied challenges that bifurcation has created for the residuary state, including managing
budget fiscal deficit and establishing improved governance system. Under the leadership of
the Hon’ble Chief Minister Sri Nara Chandra Babu Naidu, the Government of Andhra Pradesh
has evolved a comprehensive long term vision for bringing about the State’s socio-economic
Economic Scenario of Andhra Pradesh • BALLA APPA RAO & D. NAGAYYA

68 The Economy of Andhra Pradesh
development in an accelerated and sustainable manner. The state is set to transform from the
routine, business as usual (BAU) status to a dynamic and thriving Andhra Pradesh where the
fulcrum of development is the people. The key milestones of the long term vision for the State
are as follows:
2015-16 2022-23 2029-30 2050-51
On completion of 75 years of our Best State in Leading Investment
Independence, to be amongst the the Country Destination in the World
Three High Performing States
in India
The State of Andhra Pradesh will be the best state in India by 2029-30 in achieving
inclusive growth and ranking better on happiness index; and a leading investment
destination in the World by 2050-2051
To achieve the level of development envisioned in Vision 2029, the State will have to
move from the current growth rate of 7% GSDP to a double digital growth rate of more than
10% for each upcoming year, beginning from 2015-16 (constant prices).
The Andhra Pradesh Vision 2029 envisages increasing the GSDP from the current level
of ¹ 5.33 lakh crore (2015) to approximately ¹ 41.53 lakh crore by 2029 estimated at an
achievable scenario of 16% growth rate. The Double Digit Growth Rate Strategy will enable
the economy to attain the status of a developed economy with per capita income likely to
touch ¹ 6.62 lakh by 2029-30 if the annual growth rate is consistently above 10% level, and
in the event of its crossing this threshold, the per capita income may even touch ¹ 8.00 lakh
mark. The State has the potential to reach this level through the Framework of Double Digit
Growth envisaged. The State will be pursuing a robust online monitoring and evaluation
framework in respect of key performance indicators.
The Government is conscious of the challenges ahead. And towards realizing its
vision, the Government has charted out a multi-pronged strategy. There is a need for structural
shift towards high growth trajectory and deeper and radical reforms to achieve the development
envisioned in Vision 2029. During the transition period, the government will unveil a ‘rolling
planning process’ to provide necessary momentum to the economy and a double digit growth
rate.
DOUBLE DIGIT GROWTH IN INDIA’S GDP – A FEW SNAPSHOTS
Arresting the pace of diminishing rate of productivity is identified as one of the key
components to sustain double digit growth at the National level. Economic trends underline

69
that output of the Nation could be increased annually by 7%, without risking inflation, of
which 3.5% is accountable by greater capital absorption, 2% attributable to the growing
workforce while the balance 1.5% through efficiency improvements. Making power available
to small manufacturers at affordable prices boosts competitiveness of pharmaceutical, textiles,
auto-parts makers, etc. Government reforms in these industries could push the potential
GDP’s growth to 7.8%. Stronger property rights, superior regulatory institutions and better
fiscal management are expected to push the growth by 1%. While all these measures (7.8%+1%)
in place still do not assure the 9% mark, the huge reform process of arresting the pace of
diminishing rate of productivity remains to be the key for placing the growth pedestal on the
double digit mark, and sustaining it thereafter.
ACHIEVING INCLUSIVE GROWTH – ANDHRA PRADESH
Currently the poverty level (2011-12) in Andhra Pradesh stands at 9.2%, and has witnessed
a noteworthy reduction from 45% in 1993-94. The poverty ratio for rural and urban areas of
Andhra Pradesh was 10.9% and 5%, respectively. The corresponding figures for all India
were 25.7% and 13.7%. The performance of the state in reducing the poverty has been
remarkable. The absolute number of the poor in the state declined from 19 million in 1993-
94 to 5 million in 2011-12. As per one estimate, the elasticity of poverty with respect to
GSDP for the State is 1.50 as against 0.86 for all India. Hence achieving double digit growth
will accelerate substantial reduction in poverty.
While the State of Andhra Pradesh has displayed remarkable economic performance
and succeeded in reducing the absolute poverty, inclusive and equitable growth has not been
commensurate. Further, Andhra Pradesh though faring comparatively well in many indicators
under the Millennium Development Goals (MDGs), the gains are smaller in comparison with
other southern States like Kerala and Tamil Nadu. With the MDGs reaching their deadline,
a new transformative and universal Sustainable Development Goals (SDGs) will be adopted
in the state as envisaged at the national level. Building on the MDGs, the SDGs propose to
end poverty and deprivation in all forms, leaving no one behind, while making development
economically, socially and environmentally sustainable. This presents a challenge and an
opportunity for the Government of Andhra Pradesh.
The AP State in its long term growth agenda envisages ensuring participation of all
stakeholders: and laying foundation for a rapid growth momentum through the seven missions,
five grids, five campaigns, Janmabhoomi programme and the Smart Village and Smart Ward
Programme, with measurable targets and strategies.. These are three pillars the state is building.
Figure 1 presents the details in a diagrammatic form.
The seven missions are Primary Sector Mission, Industry Sector Mission, Service
Sector Mission, Knowledge and Skill Development Mission, Social Empowerment
Mission, Urban Infrastructure Mission, and Infrastructure Mission.
Economic Scenario of Andhra Pradesh • BALLA APPA RAO & D. NAGAYYA

70 The Economy of Andhra Pradesh
The five grids, namely, Water Grid, Power Grid, Roads Grid, Gas Grid, and Optic
Fiber Grid will ensure proper service connectivity.
Five campaigns are taken up for improving sanitation, health, education, and financial
inclusion.The State departments have identified growth engines by adopting a bottom
up approach, with a focus on leveraging the lagging sectors in 2015-16 towards
stimulating growth of the economy.
Establishing the Single Desk System and various reforms introduced in the State have
facilitated the State being considered a favoured investment destination. The Department of
Industrial Policy and Promotion, Government of India, and the World Bank have ranked
Andhra Pradesh as number 2 state in the country in the Ease of Doing Business in a study
carried out by them in September 2015. In this context, it is heartening to learn that out of
the total Foreign Direct Investment inflow into the country during 2015-16, of ¹ 1,39,000
crore, Andhra Pradesh accounted for ¹ 22,000 crore (15.8%), and was ranked number one
state.
SPECIAL FINANCIAL PACKAGE ANNOUNCED BY THE CENTRE FOR ANDHRA
PRADESH ON SEPTEMBER 7, 2016
Government of India announced on September 7, 2016, a Special Financial Package i n
lieu of Special Category Status (SCS) promised for the state under the Andhra Pradesh State
Reorganisation Act 2014. This took shape after prolonged discussions between the Centre
and the State over a period of two years and three months. Following the recommendations
of the 14th Finance Commission, the class of Special Category Status ceases to exist. In view
of its inability to consider granting SCS for Andhra Pradesh, the Centre offered the Special
Package to the state which is considered equivalent if not higher in comparison to the SCS.
Government of Andhra Pradesh after extensive deliberations accepted the package, and
requested the Centre to give a statutory backing to the provisions contained in the package
through individual notifications. Details of the notification issued by the Central Board of
Direct Taxes (CBDT) under the Union Ministry of Finance are presented later. The handholding
support being extended by the Centre to Andhra Pradesh on various programmes by treating
it as a special state, is summarised here through the main areas spelt out in the announcement
and subsequent discussions.
1. Centre advancing funds through externally aided projects, which would be totally
repaid by the Centre. The externally aided projects refer to loans to be obtained from
institutions like the World Bank, Asian Development Bank, and individual governments
of a few countries.
2. Centre bearing the total cost of Polavaram multi-purpose project on river Godavari
in West Godavari district. The Centre is committed to ensuring its completion in the
fast track. The Centre declared Polavaram as a national project, and has asked the

71
state government to continue to take up works on the project as it had come forward
to execute it setting definite timelines to it.
3. The Centre has agreed to bridge the entire revenue deficit of the state that remains
after enhanced devolution of central taxes for the term of the 14 th Finance Commission
of 42% compared to 32% earlier. This provision is applicable for three states –
Andhra Pradesh, Odisha, and West Bengal.
4. Entire cost of establishing premier educational, healthcare, and other institutions in
the state as central projects will be borne by the Centre.
5. Centre will bear the entire cost of construction of the world class new capital city
for Andhra Pradesh, known as Amaravati, falling in the capital region of the state.
6. Substantial hike in the Centre’s contribution to centrally–sponsored schemes to be
implemented in the state.
7. Smart cities programme at present covers three cities in the state, namely,
Visakhapatnam, Kakinada, and Tirupati. It is planned to cover the new city of
Amaravati, when it becomes operational.
8. Special package to backward areas in identified districts- namely, seven districts, four
of Rayalaseema and three of North Coastal Andhra. This facility is being extended
to designated backward districts of Telangana also. ¹ 1,050 crore per year for seven
districts of AP, at ¹ 150 crore per district as annual grant from the Centre. Special
fiscal concessions will also be extended in these districts for accelerating
industrialisation in less developed regions.
9. Greater support for infrastructure development in the state, covering airports, sea
ports, railways, national highways, and waterways.
NOTIFICATION OF CBDT ON FISCAL INCENTIVES FOR AP IN DESIGNATED
DISTRICTS
The notification issued by the Central Board of Direct Taxes (CBDT) on 30 th September
2016 is applicable for seven less developed districts of AP – namely, four districts of
Rayalaseema – Anantapuram, Chittoor, YSR Kadapa, and Kurnool, and three North Coastal
districts – Srikakulam, Vizianagaram, and Visakhapatnam. This is a follow up of the special
financial package announced by the Centre on 7 th September 2016 for Andhra Pradesh.
Entrepreneurs can avail tax incentives under Section 32(1)(iia) and Section 32AD of the
Income Tax Act.
Any manufacturing undertaking set up between April 1, 2015 and March 31, 2020 – for
a period of five years - in the designated districts would be eligible for 15 per cent higher
additional depreciation, and 15 per cent investment allowance on the cost of plant and
machinery acquired by it. These incentives will be in addition to other tax benefits applicable
under the Income tax Act.
Economic Scenario of Andhra Pradesh • BALLA APPA RAO & D. NAGAYYA

72 The Economy of Andhra Pradesh
CONCLUSION
The progress of Andhra Pradesh in terms of growth rates of GSDP and related indicators
has been modest, and a lot more remains to be done to improve the performance in social
indicators. The current GSDP growth rate level at constant prices of 11% needs to be improved
at a faster pace to reach the level of 16% in the next few years, and further improved upon
in the subsequent years. The structural shift in labour deployment from farm to non-farm
sectors is to be accelerated, with improvement in productivity and efficiency on all fronts.
The state’s performance in reducing poverty levels over years has been remarkable. Achieving
double digit inclusive growth is to be further accelerated for improving the happiness index
of the people of the region.
The Vision 2029 for Andhra Pradesh envisages creating a conducive ecosystem on all
fronts. Priority areas are e-governance where we leverage the power of Information Technology
to lead and transform citizen services; a social empowerment that encourages rural
entrepreneurship; and fostering entrepreneurship, innovation, incubation, and inclusiveness in
all sectors of the economy. Innovativeness and technology orientation have to be given
greater encouragement.

73Economic Scenario of Andhra Pradesh • BALLA APPA RAO & D. NAGAYYA

74 The Economy of Andhra Pradesh
Ta
ble
1
Are
a, P
opu
lati
on,
GS
DP
an
d P
CI
(NS
DP
) at
Cu
rren
t P
rice
s of
And
hra
Pra
des
h &
a f
ew M
ajo
r S
tate
s, a
nd
All
In
dia
, al
on
g w
ith
Ran
ks
amo
ng M
ajo
r S
tate
s
Sta
teA
rea
Ra
nk
Po
pu
la-
Ra
nk
Urb
an
i-L
itera
cy
Siz
e o
f G
SD
PG
SD
PR
ank
of
GSD
PP
CI
at
(00
0’s
qti
on
sati
on
(%)
(la
kh c
rore
)g
row
thgro
wth
ra
tes
curr
ent
pri
ces(
in)
kms)
(in
cro
re)
(%)
(2011
)ra
tes
at
(2011
)(2
011
)co
nst
an
t
pri
ces
(%)
20
14
-2
01
5-
20
13
-2
01
4-
20
15
-2
01
3-
20
14
-2
01
5-
20
14
-R
an
k2
01
5-1
6
15
16
14
15
16
14
15
16
15
12
34
56
78
91
011
12
13
14
15
16
17
18
An
dh
ra
Pra
des
h1
63
74
.96
10
29
.56
7.4
5.3
36
.03
8.5
7.9
81
0.9
92
41
95
,68
99
10
7,5
32
Tel
an
gan
a11
2.1
10
3.5
12
39
66
.35
.22
5.8
36
.43
8.8
29
.24
62
41
29
,18
26
14
3,0
23
Tam
il N
adu
13
0.1
97
.21
64
88
0.3
311
.21
Na
9.9
28
.65
na
81
31
35
,80
63
na
Kar
nat
ak
a1
91
.86
6.1
18
39
75
.89
.08
10
.23
6.9
7.7
96
.23
56
61
30
,89
75
14
5,7
99
Ker
ala
38
.91
63
.34
13
48
93
.91
5.2
Na
4.5
46
.67
na
14
9N
a1
38
,39
02
na
Mah
ara
shtr
a3
07
.73
11
.24
24
58
2.9
11
7.9
21
9.6
96
.24
5.7
68
.08
13
51
34
,08
14
na
Gu
jara
t1
96
.25
6.0
49
43
79
.31
8.9
5N
a8
.31
7.7
Na
37
Na
12
4,3
58
7n
a
All
In
dia
32
87
.51
21
.09
31
.27
3.0
12
4.8
81
35
.76
.64
7.2
47
.57
86
,87
99
3,2
31
No
tes:
1.
Ran
ks
giv
en i
n t
he
tab
le f
or
seven
sta
tes
are
in r
elat
ion
to
16
maj
or
stat
es o
f th
e co
un
try,
wit
h o
ne
cro
re a
nd
ab
ove
popu
lati
on
2.
GS
DP
: G
ross
Sta
te d
om
esti
c P
rod
uct
; G
DD
P:
Gro
ss D
istr
ict
Do
mes
tic
Pro
du
ct;
GV
A:
Gro
ss V
alue
Ad
ded
; P
CI:
Pper
cap
ita
Inco
me;
NS
DP
: N
et S
tate
Do
mes
tic
Pro
du
ct
3.G
SD
P/G
DD
P
gro
wth
ra
tes
are
calc
ula
ted
at
con
stan
t (2
011
-12
) p
rice
s;
Co
ntr
ibu
tio
n
(sh
are)
o
f se
cto
rs/
sub
-sec
tors
to
G
VA
, G
SD
P,
and
G
DD
P
is
calc
ula
ted
at
curr
ent
pri
ces
(New
bas
e 2
011
-12
). P
CI
is c
alcu
late
d a
t cu
rren
t p
rice
s.
So
urc
e fo
r ta
ble
s 1
to
7:
Go
ver
nm
ent
of
An
dh
ra P
rad
esh
, P
lan
nin
g D
epar
tmen
t, D
irec
tora
te o
f E
con
om
ics
and
Sta
tist
ics
(2016
), P
erfo
rman
ce A
pp
rais
al
and
Dis
tric
t
Eco
no
mic
S
cen
ari
o
20
15
-16
, H
yder
abad
.

75
Ta
ble
2
GV
A/G
SD
P E
stim
ates
Sec
tor-
wis
e at
Co
nst
ant
(2011
-12)
Pri
ces
for
20
13
-16
(Va
lue
in R
s. c
rore
)
An
dh
ra P
rades
hA
ll I
ndia
Sec
tor
20
13-1
4(S
RE
)2
01
4-1
5 (
FR
E)
201
5-1
6(A
E)
20
14-1
5(F
RE
)2
01
5-1
6 (
AE
)
12
34
56
Agri
cult
ure
10
920
4(1
0.7
9)
11
246
5(2
.99
)1
21
915
(8.4
0)
15
842
93
( -0
.24
)1
60
20
36
(1.1
2)
Ind
ust
ry10
0131
(3.9
1)
109
045
(8.9
0)
12117
8(1
1.1
3)
30
350
03
(5.8
8)
32
580
41
(7.3
5)
Ser
vic
es17
094
4(1
0.2
1)
190
678
(11.5
4)
212
391
(11.3
9)
51
081
95
(10
.34
)5
57
75
02
(9.1
9)
GV
A38
0280
(8.6
4)
412
188
(8.3
9)
455
484
(10
.50
)9
72
74
90
(7.1
0)
10
437
57
9(7
.30
)
Net
of
PT
– P
S316
06
325
64
381
57
82
466
09
13
38
4
GS
DP
411
886
(8.5
0)
444
752
(7.9
8)
493
641
(10
.99
)1
05
52
15
0(7
.24
)11
35
09
63
(7.5
7)
Note
s:1.
Fig
ure
s giv
en i
n p
aren
thes
es i
ndic
ate
per
cen
tag
e var
iati
on
over
th
e pre
vio
us
yea
r.
2.
Sta
ges
of
fin
alis
ing
GV
A/G
SD
P e
stim
ates
: A
E: A
dvan
ced
est
imat
es;
FR
E:
Fir
st r
evis
ed e
stim
ates
; S
RE
: se
con
d r
evis
ed e
stim
ates
; T
RE
;
Thir
d r
evis
ed e
stim
ates
3.
GV
A p
lus
Net
of
PT
min
us
PS
res
ult
s in
GS
DP.
PT
: P
roduct
tax
es,
PS
: P
rod
uct
sub
sid
ies.
4.
GS
DP
of
And
hra
Pra
des
h a
t co
nst
ant
(2011
-12)
pri
ces
in 2
01
5-1
6 (
AE
) is
est
imat
ed a
t ¹
49
3,6
41
cro
re a
s ag
ain
st 4
44
,752
cro
re o
f
20
14-1
5,
resu
ltin
g i
n a
gro
wth
of
10
.99
% (
all
Ind
ia 7
.6%
).
Economic Scenario of Andhra Pradesh • BALLA APPA RAO & D. NAGAYYA

76 The Economy of Andhra Pradesh
Ta
ble
3
GV
A a
nd G
SD
P S
ecto
r-w
ise
of
An
dh
raP
rades
h &
In
dia
at
Curr
ent
Pri
ces
(2011-1
2 b
ase
yea
r) f
or
20
11
-16
(V
alu
e in
cro
re)
An
dh
ra P
rad
esh
Ind
ia (
% s
hare
)
Sl.
No.
Sec
tor
2011
-12
201
2-1
32
01
3-1
42
01
4-1
5 (
FR
E)
20
15-1
6 (
AE
)2
01
4-1
52
01
5-1
6
12
34
56
78
1A
gri
cult
ure
947
51(2
7.1
)11
260
5(2
9.7
)1
29
633
(30.0
)1
46
803
(29.7
)1
64
08
69
(29
.4)
17
.41
7.0
2In
dust
ry111
86
7(3
2.0
)1
00
859
(26
.6)
107
715
(24.9
)1
21
506
(24.6
)1
31
64
3(2
3.6
)3
0.0
29
.7
3S
ervic
es142
963
(40
.9)
165
570
(43
.7)
194
725
(45.1
)2
25
587
(45.7
)2
61
91
7(4
7.0
)5
2.6
53
.3
4G
VA
349
581
(10
0)
379
034
(100
)4
32
073
(100
)4
93
896
(100
)5
57
64
6(1
00
)1
00
.01
00
.0
5P
rod
uct
Tax
es4
24
39
465
65
514
14
542
78
61
245
--
6P
rod
uct
sub
sidie
s1
27
90
146
38
149
93
152
52
15
515
--
7G
SD
P3
79
230
410
961
468
494
532
922
60
337
6-
-
8P
CI(
NS
DP
) (¹
)6
88
66
746
39
845
79
956
89
10
753
2-
-
Note
: F
igu
res
giv
en i
n p
aren
thes
es i
nd
icat
e p
erce
nta
ge
shar
e to
GV
A.

77
Ta
ble
4
Are
a, P
opu
lati
on,
GV
A a
t C
urr
ent
Pri
ces,
an
d i
ts g
row
th a
t co
nst
ant
Pri
ces,
an
d P
CI
at C
urr
ent
Pri
ces
of
Dis
tric
ts o
f A
nd
hra
Pra
des
h
(New
Bas
e Y
ear
20
11
-12
) fo
r 2
01
4-1
6,
alon
g w
ith
Ran
ks
SI.
No
D
istr
ict
Are
aR
ank
Po
pu
lati
on
Ra
nk
Siz
e o
fR
ank
Dis
tric
tR
an
k o
nP
CI
at
Ran
k
(in
000
’(i
n L
akh
s)G
VA
GV
A G
row
thD
ist.
GV
AC
urr
ent
Pri
ces
sq.K
ms)
(Pro
j.)
(201
5-1
6)
Ra
tes
at
Gro
wth
Ra
tes
(in)
(201
5)
(000
’Cr.
)C
on
sta
nt
Pri
ces
201
4-1
52
01
5-1
62
01
4-1
52
01
5-1
62
01
4-1
52
01
5-1
6
12
34
56
78
91
011
12
13
14
15
1K
rish
na
8.7
10
45.9
73
66.7
51
9.2
51
2.8
84
11
22
77
31
40
59
32
2V
isak
hap
atn
am11
.29
43.6
64
65.1
32
5.9
21
2.3
311
21
24
71
71
40
62
81
3E
ast
Godav
ari
12.8
75
3.7
81
57.6
63
6.3
31
0.2
19
79
24
51
10
433
67
4G
un
tur
11
.48
49.7
32
55.8
74
8.6
18
.74
61
09
91
62
10
955
65
5W
est
God
avar
i8
.511
40.6
68
50.3
25
13.3
111
.75
13
10
760
61
21
78
43
6C
hit
toor
15.2
54
2.4
75
43.8
76
8.6
211
.25
56
87
355
10
044
38
7A
nan
tapu
ram
19.1
14
1.5
36
37.9
77
12.3
27
.71
21
38
17
42
89
084
10
8P
rakas
am1
7.6
33
4.5
79
37.6
48
7.5
59
.13
89
97
104
10
770
66
9K
urn
ool
17.7
24
1.2
57
36.8
59
6.2
18
.47
10
11
79
781
88
308
11
10
SP
S N
ello
re1
3.1
63
0.1
51
03
5.8
51
08
.49
11
.77
41
03
14
011
59
28
4
11
YS
R K
adap
a1
5.4
42
9.3
311
27.5
711
11
.94
8.3
73
12
82
734
91
888
9
12
Viz
ianag
arm
6.5
12
23.8
61
32
1.1
91
25
.79
9.9
91
28
76
623
86
223
12
13
Sri
kak
ula
m5
.81
32
7.5
12
20.9
91
33
.68
11
.47
13
56
49
71
74
638
13
An
dh
ra P
rad
esh
163
504
.46
557
.65
8.3
71
0.5
95
689
10
753
2
D
istr
icts
are
arr
ang
ed i
n t
he
des
cen
din
g o
rder
of
GV
A i
n 2
015-1
6 (
AE
).
D
istr
icts
wit
h G
VA
gro
wth
rat
e ab
ove
that
of
the
Sta
te i
n 2
01
5-1
6 (
AE
) (1
0.5
0%
): K
rish
na
(12
.88
%),
Vis
akh
apat
nam
(1
2.2
3%
), W
.
God
avar
i (1
1.7
5%
), S
PS
Nel
lore
(11
.70
%),
Sri
kak
ula
m (
11
.47%
), a
nd
Ch
itto
or
(11
.25
%).
Economic Scenario of Andhra Pradesh • BALLA APPA RAO & D. NAGAYYA

78 The Economy of Andhra Pradesh
Ta
ble
5
Pop
ula
tio
n,
GD
DP,
GV
A,
and
PC
I fo
r D
istr
icts
of
An
dhra
Pra
des
h S
ecto
r-w
ise
at C
urr
ent
Pri
ces
(New
bas
e 2
011
-12
) w
ith
Ran
ks
for
20
15-1
6 (
AE
)
(in
cro
re)
SI.
No D
istr
ict
Po
pu
lati
on
Ra
nk
GD
DP
Ra
nk
GV
AA
gri
cult
ure
Indu
stri
esS
ervi
ces
Per
Ca
pit
a
(la
khs)
of
GD
DP
Sec
tor
Sec
tor
Sec
tor
Inco
me
(in 2
01
5 p
roj)
Sec
tor
Ra
nk
Sec
tor
Ran
kS
ecto
rR
an
kP
CI
inR
an
k
GV
AG
VA
GV
A
12
34
56
78
91
011
12
13
14
15
1K
rish
na
45.9
73
722
19
16
67
46
213
26
21
34
60
33
19
60
21
40
59
32
2V
isak
hap
atn
am4
3.6
64
704
70
26
51
29
800
31
02
45
32
13
25
93
11
40
62
81
3E
.Godav
ari
53.7
81
623
83
35
76
55
171
74
31
50
04
22
54
77
41
04
33
67
4G
un
tur
49.7
32
604
53
45
58
71
171
68
41
24
25
42
62
79
31
09
55
65
5W
.Godav
ari
40.6
68
544
43
55
03
17
226
97
16
47
511
2114
55
12
178
43
6C
hit
toor
42.4
75
474
64
64
38
67
109
78
811
871
52
10
18
61
00
44
38
7A
nan
thap
ura
m4
1.5
36
410
85
73
79
71
105
22
98
87
67
18
574
78
90
84
10
8P
rakas
am3
4.5
79
407
32
83
76
45
136
71
58
91
36
15
061
10
10
770
66
9K
urn
ool
41.2
57
398
76
93
68
54
125
05
66
78
69
17
563
88
83
08
11
10
SP
S N
ello
re3
0.1
51
03
87
93
10
358
53
11
521
77
75
48
16
579
911
59
28
4
11
YS
R K
adap
a2
9.3
311
298
26
11
275
66
761
311
665
51
01
32
98
11
91
888
9
12
Viz
ianag
aram
23.8
61
32
29
24
12
211
86
589
41
24
49
31
21
08
00
13
86
223
12
13
Sri
kak
ula
m2
7.5
12
227
07
13
209
86
501
51
34
40
01
311
57
11
27
46
38
13
Andh
ra P
rades
h5
04
.66
03
376
557
646
164
086
131
643
26
191
71
07
53
2
Sec
tor
% s
hare
in
rela
tio
n t
o S
tate
GV
A1
00
29.4
23.6
47
.0
Note
s :
1.
Dis
tric
ts a
re a
rran
ged
in t
he
des
cen
din
g o
rder
of
GD
DP
fo
r 20
15
-16
(A
E).
2.
Dis
tric
ts w
ith
GV
A g
row
th r
ate
abo
ve
that
of
the
stat
e in
20
15
-16 (
AE
) (1
0.5
0%
): K
rish
na
(12
.88
%),
Vis
akh
apat
nam
(1
2.2
3%
), W
.
God
avar
i (1
1.7
5%
), S
PS
Nel
lore
(11
.7%
), S
rik
akula
m (
11.4
7%
), a
nd
Ch
itto
or
(11.2
5%
).

79
Ta
ble
6
Gro
upin
g o
f D
istr
icts
of
An
dh
ra P
rad
esh
in t
erm
s o
f G
VA
Gro
wth
at
Co
nst
ant
Pri
ces,
and
its
Co
ntr
ibuti
on
to t
he
Sta
te (
Sh
are)
at
Cu
rren
t pri
ces,
Mat
rix
for
201
5-1
6 (
AE
) (N
ew b
ase
20
11
-12
)
Hig
h G
row
th &
Hig
h C
on
trib
uti
on
(>
10
%)
Hig
h G
row
th (
>1
0%
) &
Lo
w C
on
trib
uti
on
(<
10
%)
Kri
shna
G:1
2.8
8,
C :
11
.92
Wes
t G
od
avar
iG
:11
.75
, C
:8
.82
Vis
akhap
atn
amG
:12
.23
, C
:12
.03
SP
S N
ello
reG
:11
.70
, C
:6
.42
Eas
t G
odav
ari
G:1
0.2
1,
C :
10
.55
Sri
kak
ula
mG
:11
.47
, C
:3
.73
Ch
itto
or
G:1
1.2
5,
C :
7.7
8
Low
Gro
wth
(<
10
%)
& H
igh C
on
trib
uti
on (
>10
%)
Lo
w G
row
th (
<1
0%
) &
Lo
w C
on
trib
uti
on
(<
10
%)
Gun
tur
G:8
.74,
C :
10
.18
Viz
ian
agar
amG
:9.9
9,
C :
3.7
0
Pra
kas
amG
:9.1
3,
C :
6.7
3
Ku
rnoo
lG
:8.4
7,
C :
6.5
6
YS
R K
adap
aG
:8.3
7,
C :
4.8
1
An
anth
apu
ram
G:7
.71
, C
:6.7
7
G
-Gro
wth
rat
e of
dis
tric
t G
VA
(20
15
-16
(A
E)
at C
onst
ant
(20
11
-12)
Pri
ces,
C -
% C
on
trib
uti
on
(sh
are
of
GV
A o
f +
the
dis
tric
t to
th
e
Sta
te)
G
row
th r
ate
rang
es f
rom
7.7
1%
to 1
2.8
8%
am
on
g t
he
13
dis
tric
ts
C
ontr
ibuti
on r
ang
es f
rom
3.7
0%
to
12
.03%
am
ong
the
13
dis
tric
ts
K
rish
na,
Vis
akhap
atnam
, an
d E
ast
God
avar
i ar
e h
ighly
pote
nti
al d
istr
icts
.
G
un
tur
& W
est
Go
dav
ari
dis
tric
ts a
re w
ell
equip
ped
to
jo
in t
he
top 3
dis
tric
ts.
Y
SR
Kad
apa,
Anan
thap
ura
m,
Ku
rnoo
l, S
rikak
ula
m a
nd P
rakas
am d
istr
icts
are
yet
to r
eali
se t
he
full
po
ten
tial
.
Economic Scenario of Andhra Pradesh • BALLA APPA RAO & D. NAGAYYA
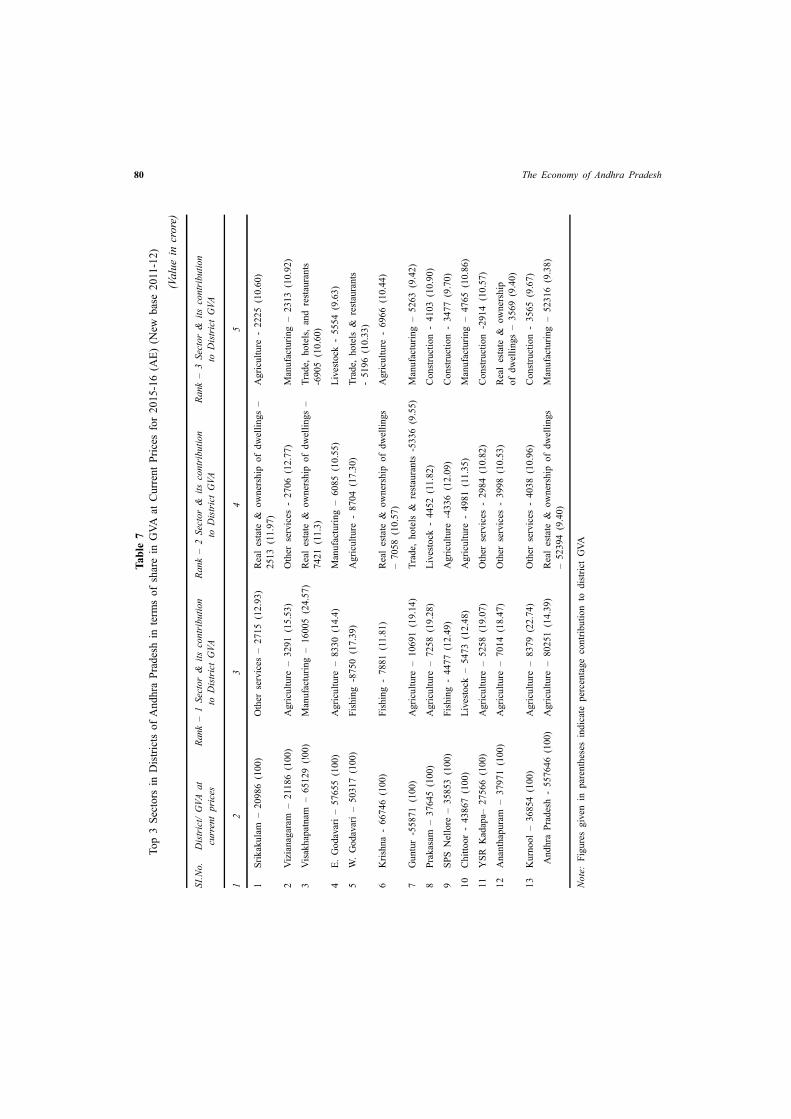
80 The Economy of Andhra Pradesh
Ta
ble
7
Top 3
Sec
tors
in
Dis
tric
ts o
f A
ndh
ra P
rad
esh i
n t
erm
s of
shar
e in
GV
A a
t C
urr
ent
Pri
ces
for
20
15
-16
(A
E)
(New
bas
e 2
011
-12)
(V
alu
e in
cro
re)
SI.
No
.D
istr
ict/
GV
A a
tR
an
k –
1 S
ecto
r &
its
con
trib
uti
on
Ra
nk
– 2
Sec
tor
& i
ts c
on
trib
uti
on
Ra
nk
– 3
Sec
tor
& i
ts c
on
trib
uti
on
curr
ent
pri
ces
to D
istr
ict
GV
Ato
Dis
tric
t G
VA
to D
istr
ict
GV
A
12
34
5
1S
rik
aku
lam
– 2
098
6 (
10
0)
Oth
er s
ervic
es –
2
71
5 (
12
.93)
Rea
l es
tate
& o
wn
ersh
ip o
f d
wel
lin
gs
–A
gri
cult
ure
-
22
25
(1
0.6
0)
25
13
(1
1.9
7)
2V
izia
nag
aram
– 2
11
86
(1
00
)A
gri
cult
ure
–
3
29
1 (1
5.5
3)
Oth
er s
ervic
es -
27
06
(1
2.7
7)
Man
ufa
ctu
ring
–
23
13
(1
0.9
2)
3V
isak
hap
atn
am –
65
12
9 (!
00
)M
anu
fact
uri
ng
–
1
60
05
(2
4.5
7)
Rea
l es
tate
& o
wn
ersh
ip o
f d
wel
lin
gs
–T
rade,
h
ote
ls,
and re
stau
rants
74
21
(1
1.3
)-6
905
(1
0.6
0)
4E
. G
od
avar
i –
576
55
(1
00
)A
gri
cult
ure
–
83
30
(1
4.4
)M
anu
fact
uri
ng
–
6
08
5 (1
0.5
5)
Liv
esto
ck -
55
54
(9.6
3)
5W
. G
odav
ari
– 5
03
17
(1
00
)F
ish
ing
-8
75
0
(17
.39
)A
gri
cult
ure
-
87
04
(1
7.3
0)
Tra
de,
hote
ls &
res
tau
rants
- 5
19
6 (
10.3
3)
6K
rish
na
- 6
67
46
(1
00
)F
ish
ing
- 7
88
1 (
11
.81)
Rea
l es
tate
& o
wn
ersh
ip o
f d
wel
ling
sA
gri
cult
ure
-
69
66
(1
0.4
4)
– 7
05
8 (1
0.5
7)
7G
un
tur
-55
87
1
(10
0)
Ag
ricu
ltu
re –
1
06
91
(1
9.1
4)
Tra
de,
ho
tels
& r
esta
ura
nts
-5
33
6 (
9.5
5)
Man
ufa
ctu
ring
–
526
3 (9
.42
)
8P
rakas
am –
37
64
5 (
100
)A
gri
cult
ure
–
7
25
8 (1
9.2
8)
Liv
esto
ck -
4
45
2 (
11
.82)
Co
nst
ruct
ion
-
410
3 (1
0.9
0)
9S
PS
Nel
lore
– 3
58
53
(1
00
)F
ish
ing
- 4
47
7 (
12
.49
)A
gri
cult
ure
-4
33
6
(12.0
9)
Co
nst
ruct
ion
-
34
77
(9
.70
)
10
Ch
itto
or
- 4
38
67 (
10
0)
Liv
esto
ck –
5
47
3 (1
2.4
8)
Ag
ricu
ltu
re -
4
98
1 (
11
.35)
Man
ufa
ctu
ring
–
47
65
(1
0.8
6)
11
YS
R K
adap
a– 2
75
66
(1
00
)A
gri
cult
ure
–
5
25
8 (1
9.0
7)
Oth
er s
ervic
es -
29
84
(1
0.8
2)
Co
nst
ruct
ion
-2
91
4
(10.5
7)
12
An
anth
apu
ram
–
3
79
71 (1
00)
Ag
ricu
ltu
re –
7
01
4 (1
8.4
7)
Oth
er s
ervic
es -
39
98
(1
0.5
3)
Rea
l es
tate
& o
wn
ersh
ip
of
dw
elli
ng
s – 3
569
(9.4
0)
13
Ku
rnoo
l –
36
854
(10
0)
Ag
ricu
ltu
re –
8
37
9 (2
2.7
4)
Oth
er s
ervic
es -
40
38
(1
0.9
6)
Co
nst
ruct
ion
-
35
65
(9
.67
)
An
dh
ra P
rad
esh
- 5
57
64
6 (
10
0)
Ag
ricu
ltu
re –
8
02
51
(1
4.3
9)
Rea
l es
tate
& o
wn
ersh
ip o
f d
wel
ling
sM
anu
fact
uri
ng
–
52
31
6 (9
.38)
– 5
23
94
(9
.40
)
No
te:
Fig
ure
s g
iven
in
p
aren
thes
es in
dic
ate
per
centa
ge
con
trib
uti
on
to
d
istr
ict
GV
A

81
ARTICLE / 11
PROSPECTUS FOR URBAN GROWTH INANDHRA PRADESH
M. Koteswara Rao
ABSTRACT
The Asian region has been very dynamic as revealed by the rapid and diversified levels
of urbanisation. According to the Provisional Population Results of 2011 Census, the State
of Andhra Pradesh contains 28.34 millions of urban population in 260 towns of different size-
classes, which accounts for 33.49 per cent to the total population.
The data according to 2011 Census show that the urban population is unevenly distributed
among different size-classes of towns and cities. More than 75 per cent of urban population
is concentrated in about 22 per cent of cities. In contrast to this, 26 per cent of small towns
together account for only 22.4 per cent of the total population. These results do indicate that
the distribution of urban population in Andhra Pradesh, according to 2011 Census, is high.
Therefore, it is interesting to examine the pattern of urbanisation and urban growth for the
period 1901-2011. The number of towns has almost increased three fold during this period.
In 1901, there were 115 towns and the number rose to 353 by 2011. There was only one city
till 1941, namely Hyderabad. Since, 1951, the number of cities increased and by 2011 the
number rose to 132. The group of medium towns increased by about twenty four times during
the period 1901-2011 i.e., from 11 in 1901 to 262 by 2011.
It is evident from the data that three out of 13 districts stand out prominently as highly
urbanised when compared with other districts for the period under consideration. These are
the districts of Visakhapatnam, Krishna and Guntur. The data for the earlier decades i.e.,
1961, 1971, 1981, 1991 and 2001 also confirm that these three districts have registered higher
proportions of urban population. The most important and surprising features, that is observed
in 2011 Census is that the relatively backward districts such as Chittoor, Kadapa, Kurnool an
Anantapur have highest proportion of urban population. These trends have to be studied with
detailed enquiry.
Increasing urbanisation and concentration of population are bound to be associated with
an escalation of problems in cities and towns in terms of high population density, traffic
congestion, pollution, shortage of housing, civic services and infrastructure, slums, rise in
Professor, Department of Economics, Acharya Nagarjuna University, Guntur.

82 The Economy of Andhra Pradesh
urban poverty, environmental degradation etc. However, urbanisation is considered inevitable
and the problem of urbanisation can be viewed as one emanating from poor city planning,
management and finances. Comprehensive and holistic urban planning through city
development plan that mainstream sustainable habitat should be a key component. It is
important to focus attention on integrated development of urban infrastructure and services
with emphasis on provision of basic services to the urban poor including housing, water
supply, sanitation, slum improvement, community toilets etc.

THEME - III
PERFORMANCE OF AGRICULTUREAND ALLIED SECTORS IN ANDHRA PRADESH


ARTICLE / 12
PERFORMANCE OF AGRICULTURE INANDHRA PRADESH
Gita G. Pandya
ANDHRA PRADESH AGRICULTURE AT A GLANCE
Andhra Pradesh is ranked eighth among the states both in terms of share of agriculture
GDP (24.7 %) and employment generation (58.55%)as per the 61st round of National Sample
Survey (Dev, 2007). Of the total geographical area of 27 million ha in the state, 39 per cent
is net sown area with a cropping intensity of 124 per cent. The net irrigated area of the state
is 4.4 million ha, while the area under rainfed agriculture is 6.4 million ha. The state receives
an average rainfall of 940 mm. Out of the state’s 11.5 million landholdings, 61 per cent are
marginal and another 22 per cent are small.
During 2005-06 Andhra Pradesh accounted for 12.24 per cent of the country’s rice
production and stood third among the rice producing states. The state’s share in groundnut
production is to the tune of 17.32 per cent and is next only to Gujarat and Tamil Nadu. In
the production of sunflower and cotton, Andhra Pradesh stands second with shares of 30 and
18.5 per cent, respectively in the country’s production (MoA, 2007). The state ranks highest
in the country in the production of mango, chillies and turmeric. It is also ranked first in
productivity of coarse cereals like sorghum, maize and also in chickpea. Compared to the pre-
emptive position of the state in terms of contributions to the nation’s granary and in respect
of production from other agricultural crops, the growth rates of the economy are less impressive
and are in fact less than the country’s average rates. However, there are problems in the basic
elements (agricultural growth, poverty reduction, health and education, and regional disparities)
of inclusive growth. Growth of agriculture, particularly crop sector, has been very low.
CROP SECTOR
The area under rice was stagnant, except for decline during the period 2001-05. While
the area under millets (sorghum, maize, pearl millet and finger millet) declined all through
the period of study with the exception of maize, which had a significant positive growth
especially during 1990s and 2001-05. This was in tune with the national trend as reported by
Bhalla and Singh (2001) and Kubo (2006). Among the pulses, chickpea showed a significant
Principal, Govt. Arts College, KK Shatri Educational Campus, Khokhara, Mani Nagar East, Ahamadabad.

86 The Economy of Andhra Pradesh
gain in area, while in oilseeds sunflower area grew significantly in the 1980s and during
2001-05. Groundnut, an important oilseed crop gained area during the 1980s, due to the fillip
provided by the Technology Mission on Oilseeds but lost area in the 1990s and 2001-05. This
was probably due to cheaper import of edible oils, as the government eased restriction on
imports.
The growth rates of yields were negative in respect of blackgram, chickpea, groundnut
and sunflower, during 1991-05. Among the commercial crops, the gain in growth rate was
the highest in chillies. There was a slowdown in yield growth during the period after 1990
in case of rice. Sorghum productivity increased at a rate of 3.94% during 2001-05 reversing
the trend in the earlier decade.
The production of rice, which is the staple crop in the state, grew at a rate of 2.5 per
cent per annum during the 1980s against the long-term growth rate of 1.56 per cent. This
growth in production was driven by the growth in productivity (1.97%). During the 1990s,
the production fell to 1.69 per cent and the productivity to 1.14 per cent. However, during
2001-05, the production trends in rice are more discouraging. The production of rice in the
state outgrew the population growth, which was about 2.17 for the 1980s, and 1.30 per cent
for the 1990s. The rate of decline in production of sorghum, pearl millet and finger millet was
highest during the 1990s. This was predominantly due to fall in the area sown to these crops.
Rapidly changing food habits in favour of fine cereals like rice and wheat (Kumar et. al,
2007) and non-inclusion of coarse cereals in the PDS are quoted as major reasons for this
drastic trend.
GROWTH BEHAVIOUR – CEREALS AND MILLETS
The growth rate of rice was negative though not significant in the state and in most of
the major growing districts. The crop lost area rapidly in Karimnagar, Krishna, Warangal and
Mahabubnagar districts during 2001-05, probably due to expansion of area under maize and
unfavourable weather during 2001-02 and 2002-03. Yield has declined to in six districts.
Production was also declining during this period in all the districts except in East Godavari
and Vizianagaram districts. The area sown to rice was either declining or stagnating in
majority of the districts. There was also a slowdown in yield growth, which was reflected the
decline in the production decline, especially during 2001-05. This had serious implications
to food security at the state level and to the PDS, as the expected levels of supply was
critically affected. A significant part of area sown to rice was under groundwater irrigation.
Two major reasons for shrinkage of area under rice are slow down or decline in the net
irrigated area and occurrence of frequent droughts. Except in the case of area under tube
wells, the growth in irrigation was negative and significant. There was a negative trend in the
net irrigated area in all the districts. The trend was significant in Anantapur, Chittoor,
Nizamabad, Medak, Mahabubnagar, Karimnagar and Rangareddy.
87
PLUSES
Chickpea, blackgram, pigeonpea and greengram are the important pulse crops in the
state. Kurnool, Prakasam and Anantapur are the major chickpea growing districts accounting
for 70 per cent of production. Prakasam district leads in productivity (1.5 t/ha). Yield declined
in all the districts especially during 2001-05. The growth rate of production was higher in
Prakasam, Kurnool and Medak, mainly driven by expansion of area. The situation with
respect to chickpea was not satisfactory during 2001-05. The yield growth in most of the
districts was either non significant or negative. The expansion in area under chickpea was
happening at the cost of rabi rice.Krishna and Guntur are the major producers of blackgram.
Area under blackgram declined since 1990. It appears that chickpea, maize and sunflower are
replacing this crop. Area sown under pigeonpea in major districts was either stagnated or
wasdeclining. Prakasam and Mahabubnagar, the two major districts, lost both on account of
area and production. Medak, East Godavari, was the leading producer of greengram. At the
state level, there was an increase in area after 2000. Productivity levels were fluctuating
around 350 kg ha -1 much below the potential. Blackgram and green gram are traditionally
grown in rice fallows in the rice growing districts. However, these pulses are not gaining in
terms of area at the state level since 1990. Recently, the area under greengram is showing the
signs of stagnation. The failure of monsoons in recent years has badly affected the canal
irrigation in districts like Nalgonda, Khammam and Guntur as a result of which the area
under green gram increased at the cost of rice. The high prices prevailing for green gram is
another reason for arresting a further declining trend. In both the cases, some districts are
growing more and more of these pulses during 2001-05 (Krishna and Srikakulam in the case
of blackgram and Guntur in the case of greengram). Increasing incidence of insect pests such
as Maruca sp. is affecting the yields of black gram and green gram. However, the situation
with respect to yield growth was not encouraging.
OILSEEDS
Groundnut is a major crop in Rayalaseema region accounting for 85 per cent of the total
area. Both the area and production tended to decline over the last 15 years though at a slower
pace with stagnation of productivity around 700 kg ha-1. The unfavorable terms of trade
especially after the 1990s due to liberalization seem to have significantly affected the crop.
Recurrentmonsoon failures and incidence of bud necrosis and stem necrosis badly affected
groundnut yields in Anantapur and other districts. Technology Mission on Oilseeds triggered
sunflower cultivation in Andhra Pradesh. The crop is confined to Kurnool, Kadapa and
Anantapur. The area and production grew in the 1980s, and then started to decline during
1990s showing increasing trends during 2001-05 despite decreasing yields. The performance
of castor crop has not been that well during the last 15 years with both area and production
declining.
Performance of Agriculture in Andhra Pradesh • GITA G. PANDYA

88 The Economy of Andhra Pradesh
COMMERCIAL CROPS
The growth in area under cotton in major growing districts like Guntur was slowing
down. In rest of the districts, yield declined. The area under chillies seems to have stagnated
except in Kurnool. There was productivity gain in Guntur and Kurnooldistricts leading to
production growth. The performance of sugarcane was much better during the 1990s as there
was production growth driven by increased yield gains in most of the districts.
SUMMARY AND POLICY IMPLICATIONS
As is evident from the findings presented, the crisis in Andhra Pradesh agriculture is
wide spread across crops and districts. The situation is alarming especially with respect to
food grains. The average annual index of total factor productivity during 1995-2000 period
was five per cent less than that during the 1980s in the state. Similarly, there was absolute
decline in the contribution non-food crops during the post reform period (Rao, 2005). Significant
growth in area was observed in crops like sunflower, maize and chickpea, while productivity
gains were limited to castor and chillies. Overall production growth was seen in maize, cotton
and chillies. At the disaggregate level, chickpea performed better in Prakasam and Kurnool;
and sunflower in Kurnool and Kadapa districts. Rice is the leading food crop of the state.
However, the area under rice in Andhra Pradesh is being gradually replaced by less water
intensive crops such as chickpea, maize and sunflower as reflected in the acreage under these
crops, probably due to shrinking water resources. Though such a shift is desirable as far as
the conservation of groundwater is concerned, the large-scale transfer of area from rice
deserves more critical analysis with respect to implications to food security. System of Rice
Intensification (SRI), which is picking up of late in response to the precarious water resource
situation can be one of the alternatives to retain the primacy of the crop in the state. Pulse
crops in the state are predominantly rainfed. Besides recurrent mid-season droughts, one of
the other reasons for falling productivity levels of pulses is the non-availability of quality
seeds. Further, in pulses like chickpea, farmers in this state do not prefer to cultivate Kabuli
type varieties that have high yield potential. Another important issue that affects profitability
of chickpea is that the consumption demand within the state is relatively low compared to
pigeon pea. Therefore, appropriate and proactive marketing facilities should be developed lest
the prices fall in the season of abundance. These two pulse crops play an important role in
building up soil fertility as well as a source of protein in human diet. It is therefore necessary
to take up appropriate measures in terms of research, extension and price support for increasing
the area under pulses. It is to be noted here that the per capita availability of pulses did not
improve significantly over time. A stagnant productivity level in pulses is an area of national
concern. It is well known that the yield barriers in pulses are difficult to break when compared
to cereals. However, it is amply demonstrated that one critical irrigation besides following
measures like IPM and INM could substantially boost yields (AICRPDA, 2005). Public
investment and institutional arrangements to create infrastructure to enable these measures

89
could help increase pulse outputs and bring down imports.Among the oilseeds, performance
of groundnuts was not encouraging while sunflower was gaining ground mainly due to yield
gains coupled with profitability. Castor can gain prominence in the state if promoted with
better industry linkages.
REFERENCES
1. Ahluwalia D 1991 Growth performance in Indian agriculture. Journal of Indian School of Political
Economy 3: 605 - 632.
2. AICRPDA. 2005. District-wise Promising Technologies for Rainfed Chickpea Based Production
System in India. A Compendium by NARS, State Departments of Agriculture and Agro-Industries.
All India Coordinated Research Project for Dryland Agriculture. CRIDA, Hyderabad. P.119
3. Bhalla, G.S. and Gurmail Singh. 2001. Indian Agriculture: Four Decades of Development. Sage
Publications, New Delhi.
4. Chand, Ramesh, S.S.Raju and L.M.Pandey.2007. Growth Crisis in Agriculture: Severity and Options
at National and State Levels. Economic and Political Weekly. June, 30:pp2528-33.
5. Dayakar Rao and Shahid Parwez. 2005. Dynamics of Cropping Pattern in Sorghum Growing States
of India.Indian Journal of Agricultural Economics. 60 (4): 644-659.
6. Department of Economics and statistics 2007. Statistical abstract 2007. Government of Andhra Pradesh,
Hyderabad.
7. Fan Shenngen, Peter Hazell, T. Haque.2000. Targeting public investments by agro-ecological zone
to achieve growth and poverty alleviation goals in rural India Food Policy 25 : 411–428 413.
8. Kumar, P Mruthyunjaya, and Dey, Madan M., 2007. Long term Changes in Inidan Food Basket and
Nutrition.Economic and Political Weekly. Sep 1.:3567- 3572.
9. Narayanamoorthy, A. 2007. Deceleration in Agricultural Growth Technology Fatigue or Policy Fatigue?
Economic and Political Weekly. June 23, pp 2375-79.
10. Rao, N.C. 2004. Aggregate agricultural supply response in Andhra Pradesh. Indian Journal of
Agricultural Economics. 59(1): 91-104.
Performance of Agriculture in Andhra Pradesh • GITA G. PANDYA

90 The Economy of Andhra Pradesh
ARTICLE / 13
AGRARIAN DISTRESS AND FARMERS SUICIDES INANDHRA PRADESH : A SOCIO-ECONOMIC ANALYSIS
G. Saritha & K. Madhu Babu
INTRODUCTION
Andhra Pradesh is predominantly an Agricultural economy as agriculture is the main
source of livelihood for nearly 70 percent of the population. Therefore agriculture is the most
vital and sensitive sector of the state. The changes that are occurring in this sector since the
eighties are often causing great distress to the farmers. The state agricultural sector performed
well in the eighties by recording a growth rate of 2.67 percent annum.but in the nineties the
growth rate of decelerated to 1.16 percent per annum. The declaration is caused mainly by
the slow growth of crop yields. The yields of important crops like rice, groundnut, cotton and
sugar cane were lower in the state compared to other states. The contribution of agriculture
to NSOP in the state has declined from about 40 percent in the early eighties to 31 percent
in 1999-2000. This downturn in the performance of agriculture in the state might be due to
the decline in public investments in irrigation, rural infrastructure and agricultural research.
Investment in public irrigation sources such as canals declined with nineties. As such, the
increases in the irrigated area in the nineties, at the rate of five percent per annum, is due to
well irrigation, which has become highly erratic in most areas on account of steep fall in the
water table. The occurrence of frequent droughts is compounding the problem. The decline
in the public investment has an impact on the private investment in agriculture which also
recorded a steep decline in this decade.
The factors like lower yields, rising cost of alleviation, declining prices of sever crops,
widening disparities between agricultural and non-agricultural sectors, conspicuous expenditure
on ceremonies, a mounting debt burden and dipping incomes of the cultivators are responsible
for plunging the small and marginal farmer into crises which have no other alternative expect
driven them to take the extreme steps of suicides.
The government of India identified 31 districts in the four states viz., Andhra Pradesh,
Karnataka, Kerala and Maharashtra where the incidence of farmer’s suicides were very high.
Among the identified suicide states, Andhra Pradesh (including Telengana) ranks first with.61%.
Research Scholar, Dept. of Economics, Acharya Nagarjua University, Guntur, Andhra Pradesh.Assistant Professor, Dept. of Economics, Acharya Nagarjua University, Guntur, Andhra Pradesh.
91
Suicides districts followed by Karnataka (6 Districts) Maharashtra (6 Districts) and Kerala (3
Districts). It shows the gravity of the situation prevailing in Andhra Pradesh when compared
to other parts of the country. Maximum number of suicides was reported from Ananthapur
district followed by Guntur district and there were also young farmers around 25years of age.
The main reasons as reported in the news papers were crop loss and debt burden. But to make
a comprehensive analysis of this serious problem and suggest policy measures a study of the
agrarian conditions in the affected areas and the household land information is also necessary.
Hence, the present paper has been made to examine the market imperfections and farmer’s
distress in Andhra Pradesh was taken up to following specific objectives.
OBJECTIVES
1. To make an in-depth study of the stress leading to the extreme stage in distress and
locate socio-economic components responsible for this. and
2. To offer remedial measures for the farming community and match these with the
present institutional arrangements to alleviate distress.
METHODOLOGY
The study is based on the both primary and secondary data. Secondary data drawn from
the statistical abstracts of Andhra Pradesh and season and crop reports. The identification of
the problem of farmers’ suicide in the state is also based on the secondary data, which is
compiled from newspapers and the information gathered by the A.P. Rythusangam. The
analysis of the agro-economic and social causes leading to farmer’s distress based on the
household level data was also collected. To identify the specific factors that lead the farmers
to commit suicide, a comparison was made between victims (farmers who committed suicide)
and non-victims (control basis). For collecting the primary data in Ananthapur district was
purposively selected for the study. The selection of the district is based on the highest number
of reported suicide cases. The reference period for collecting the information is the agricultural
year 2014-15.
CHANGES IN THE AGRARIAN ECONOMY OF ANDHRA PRADESH
The state of Andhra Pradesh is spread over an area of 1, 60, 20,400 sq km and it
accounts for 4.87 percent the total area of the country. It is classified into two regions viz.,
costal Andhra and Rayalaseema. Costal Andhra region is endowed with fertile alluvial soils
formed by deltas under the three rivers-Godavari, Krishna and Penna. It is served by the
southwest and northwest monsoons and enjoys highest rainfall in the state normally it receives
about 1000 mm of rain. The soils in Rayalaseema are rocky and this region suffers from
uncertain and scanty rainfall. Normally it is less than 700 mm but it has rich mineral source
and a potential for forest wealth. During the last five years period the net sown area in the
state increased only marginally i.e. from 38.23 percent to 40.96 percent in 2009-10 to 2014-
Agrarian Distress and Farmers Suicides • G. SARITHA & K. MADHU BABU

92 The Economy of Andhra Pradesh
15. The forest area remained more or less the same at 22 percent, well short of the recommended
33 percent for maintaining ecological balance. There was a marginal decline in the barren and
uncultivable land, cultivable wastes permanent pastinres and other was an increase in the land
put to non agricultural uses and other follow lands including cultivable wastes. Permanent
pastries and land under miscellaneous trees and grows are used for non-agricultural purposes
rather than bringing the land under plough.
ECONOMIC AND SOCIAL REASONS FOR FARMERS’ SUICIDES
The study of the socio-economic characteristics as caste, literacy, type of family, size
of family and structure, ownership of land and other assets.etc, provide insights into the living
conditions of the farmers and help in further analysis of the determinants of distress of the
farmer’s. a farm household’s economy is generally more dependent on the crop economy.
Factor like cropping pattern, input use, production, yields, marketing infrastructure, price etc,
have substantial influence on the income of the household.
Table – 2
Socio-Economic Profile of Sample Farmers in the Selected District
S.no Sample details and characteristics Victims households Control households
1 Number of house holds 50 52
2 Forward castes (%) 30.0 34.62
3 backward castes(%) 48.0 44.62
4 Sc&ST”s (%) 20.00 21.15
5 Illiterates 26.00 25.00
6 Land details of sample house holds
a. Own land (in acres) 162.10 241.15
b. Leased-inland (in acres) 52.50 106.55
c. Leased – out (in acres) - 3.00
d. Operated land (in acres) 214.60 344.70
7 Age group 30-60 69.23 48.08
8 Family type
a. Nuclear family (percent) 74.00 59.62
b. Joint families (per cent) 26.00 40.38
c. Average family size (No of persons) 4.92 5.73
Source: Primary data
The Table-2 shows the sample households are distributed by forward castes (FCs),
Backward Castes (BCs) and Scheduled Castes and Tribes (SC, ST’s). The caste distribution

93
of the households indicates that 30 percent of the Victim’s households belong to FCs, 48.00
percent to BCs and SC&ST’s from 20.00 percent. The control households also exhibit more
or less similar distribution with 34.62 percent of FC’s, 44.62 and 21.15 percent of BC’s and
SC, ST’s respectively. We found that the suicides of farmers were not isolated to any particular
caste groups but they were found in all the caste groups. From the analysis of the type of
family it is observed that emotional and practical support from within the family might be
lower for the victims as most of them are living in nuclear families, while joint family system
was more prevalent in the control households. The levels of literacy of the farmers and their
family members are very low which act as independent for adopting following modern
methods of farming.
CROP ECONOMY : CROPPING PATTERN-PRODUCTION AND YIELDS
A farm household’s economy is generally more dependent on the crop economy. The
cropping pattern and other agricultural characteristics of the sample farmers are presented in
Table 4.
Table – 4
Agricultural Characteristics of the Sample Farmers in the Study Area
Descriptions of characteristics of the sample farmers Victims households Control households
in the study area
Cropping pattern
(%) area under paddy crop to gross cropped area 15.46 18.37
(%) area under / groundnut to area under non food crops 28.9 32.42
(%) area under / cotton to area under non food crops 7.06 5.44
(%) Total crop area 219.60 316.30
(%) net sown area 191.75 314.30
Irrigated area (%) 41.96 50.52
I. Yields of major crops
(i) Rice (kgs/ha) 2439 2464
(ii) Ground nut (kgs/ha) 317 435
(iii) Cotton 435 700
II. Cost of cultivation (Rs per hectare) 14936 15825
i. Ground nut (Rs) 9089 8633
ii. Cotton (Rs) 24747 23944
Source: Primary data
Groundnut is recorded as the major crop occupying 28.9 percent of area of the victims
and 32.42 percent of area of the control households. Ground nut is followed somewhat
Agrarian Distress and Farmers Suicides • G. SARITHA & K. MADHU BABU

94 The Economy of Andhra Pradesh
closely by paddy (15.46) for the victims for the control farmers (18.37) stands in a distant
second place.
The production and yield levels of the sample farmers indicate the poor state of agriculture
as the yields are considerably lower than the district and the state average yields. Between
the suicide and control farmers, there is not much difference in the yields (groundnut (kgs/
ha) victim group 317 kgs/ha for control households is 435 kg/ha).
On the whole the cost of cultivation reported by the sample farmers is high and within
the sample farmers the victim’s households are slightly compared to control households for
ground nut, cotton, but for paddy it is higher for the control farmers.
ECONOMIC REASONS FOR FARMER’S SUICIDES
The household economy factors like household income, expenditure, assets and
outstanding loans are presented in Table-5. The table 5 reveals that per household annual
income from all sources is Rs.9922 for the victims and Rs.16928 for the control households.
Table – 5
Income & Expenditure
Item Victims Control group
I. Income from agriculture
a. Total value of output (Rs) 20408 21463
b. Total costs (Rs) 16381 16058
c. Net income (Rs) 4027 5405
II. Annual income various sources
a. Agricultures (Rs) 6177 13150
b. Dairy (Rs) 943 307
c. Other sources (Rs) 2802 3471
Total income (Rs) 9922 16928
III. Annual consumption expenditure
a. Food (Rs) 8657 10171
b. Non food (Rs) 5294 6184
c. Total (Rs) 13951 16355
IV. Outstanding Loans
a. Institutional (Rs) 15410 22765
b. Non-Institutional (Rs) 85793 61931
c. Total (Rs) 101203 84696
Source: Primary data

95
With an average family size of about five for the victims and about six for the control, the
income seems very meager. The consumption expenditure for the victims is over and above
the income for the victims. For the control farmer’s consumption expenditure is within the
limits of income. With such meager income the farmers are forced to borrow money for
various household needs and for investing in agriculture. The total value of assets owned by
the victim’s amount the Rs. 64,814 per household as against Rs. 1,06.976 of the control
households.
The farmers are investing heavily in digging wells for irrigation. With frequent crop
failures farmers were found facing problems in meeting even consumption expenditure. Non-
farm income generating activities being poor, almost all the farm households reported borrowing
money for various purposes like investing in crops, digging wells, household consumption,
health expenditure, and children’s marriage expenses especially dowries for daughters. The
socio-cultural reasons as reported by the family members indicate that many victims had
problems in the family. Addiction to alcohol is common feature for most of the victims.
Marriage of daughters also is found to be an important aspect causing distress to the individuals.
Crop loss, debt burden were reported as the major reasons for suicides by the victims.
FINDINGS OF THE STUDY
The following are the major findings of the study
Majority of the farmers committing suicides are small and marginal farmers.
Most of the victims have neglected families while the control households have more
joint families, which indicate that the emotional and practical support within the
family was found to be lower for the victims.
Wells are major source of irrigation, which are probate sources, and the farmers are
investing heavily to dig and deepen the wells. Many times the efforts of the farmers
fail leaving the farmers with the loan but not water.
Except price, the yields of ground nut, cotton and other crops are very low compared
to the average yields.
The marketing facilities as reported by the sample farmers are poor and they are
subjected to exploitation in the market.
The cost of cultivation is also found to be high particularly huge amounts spent on
pesticides in the case of cotton crop.
Crop loss, debt burden and failure of crop wells were reported as the major reasons
for suicide by the victims’ relatives.
POLICY SUGGESTIONS
The cropping pattern should be regulated based on the resource availability of the
region, especially the irrigation.
Agrarian Distress and Farmers Suicides • G. SARITHA & K. MADHU BABU

96 The Economy of Andhra Pradesh
There is a need to regulate the unscrupulous activities of the private traders in the
seed market. Regulatory steps are to be strictly implemented.
It may be difficult but not impossible to ensure reasonable prices for output because
the local markets are linked to the global markets.
The state should ensure provision of cheaper credit through institutional sources and
regulate the activities of private moneylenders. The practice of input- credit tie-up
should be discouraged.
Promotion of watershed development activities through public investments through
people’s participation is necessary for capital formation.
REFERENCES
1. “White paper on Agriculture, Horticulture, Sericulture, Animal husbandry, Dairy, Fisheries and
Agricultural marketing” Government of Andhra Pradesh, Department of Agriculture, 23 July-2014.
PP. 1-46.
2. Parthasarathy & Shameen (1998), “Suicides of Cotton Famers in Andhra Pradesh: An Exploratory
study, Economic Political Weekly, 33 (13) May 28, 1998. PP-720-726.
3. Assadi, Muzaffar (1998): “Farmers Suicides: Signs of Distress in Rural Economy”. Economic &
Political Weekly, April-4-1998.
4. Revathi. E (1998): ‘Farmers Suicides: Missing Issues; Economic & political Weekly, May-1998.
5. Boss, Ashish (2000): ‘From Population to Rests in Punjab’. American Boll Worm and Suicides in
Cotton Belt; EPW, 35 (35) September-16, 2000-P-3375-3378.
6. Deshpomde R.S (2002) ‘Suicides by farmers in Karnataka: Agrarian Distress and Possible Alleviatory
Steps’. EPW, 37 (26), June 29, 2002 pp-2601-2610.
7. Annie Nirmala.K.(2003) “Market Imperfections and Farmers Distress in Andhra Pradesh” Agro-
Economic Research Centre, Andhra University. Visakhapatnam.AP.
8. Revathi. E (2009): ‘Farmers Suicides in Andhra Pradesh: Issues and Policy Concerns. “Human
Development in A.P. Experiences, Issues and Challenges”. Edited. Dev. et. al Centre for Economic
and social studies. Hyderabad.

97
AP
PE
ND
IX
DIS
TR
ICT
WIS
E D
IST
RIB
UT
ION
OF
FA
RM
ER
S S
UC
IDE
S-1
99
7-2
01
5
Sl.
No D
istr
ict
199
71
99
81
99
92
00
02
00
12
00
22
00
32
00
42
00
52
00
62
00
72
00
82
00
92
01
02
011
20
12
20
13
20
14
20
15
Gra
nd
Tota
l
1S
rikak
ula
m-
-1
--
--
41
00
01
21
NA
NA
3-
13
2V
izay
anag
aram
--
--
--
-1
00
01
01
0N
AN
A3
-6
3V
isak
hap
atn
am-
--
-4
2-
95
21
12
30
NA
NA
-3
32
4E
ast
Godav
ari
-1
-1
21
-4
23
21
08
2N
AN
A3
62
66
5W
est
God
avar
i-
3-
16
1-
80
01
11
00
NA
NA
84
43
4
6K
rish
na
-8
-2
35
12
31
36
42
46
2N
AN
A3
47
12
3
7G
un
tur
-4
34
-8
34
69
24
31
22
36
32
01
9N
AN
A8
07
04
38
8P
rakas
am-
63
33
10
44
98
10
80
96
NA
NA
46
91
65
9S
PS
Nel
lore
--
--
11
76
71
22
30
0N
AN
A5
17
52
10
YS
R k
adap
a-
3-
11
33
18
17
92
62
11
04
1N
AN
A1
6-
13
3
11
Kurn
ool
21
53
26
13
77
64
72
68
66
59
22
9N
AN
A5
94
35
71
12
Anan
thap
ur
--
-1
41
93
31
35
97
06
59
02
54
04
11
9N
AN
A7
91
66
80
3
13
Chit
tor
-2
-2
27
33
21
26
24
17
90
0N
AN
A2
04
02
03
A P
28
11
02
45
55
33
83
55
236
223
250
181
13
211
65
9N
AN
A3
89
40
12
60
5
So
urc
e: D
aily
New
s P
aper
s, S
aksh
i, E
nad
u,
Pra
jasa
kth
i, A
nd
hra
Jyoth
i.G
ran
d T
ota
l=26
39
Agrarian Distress and Farmers Suicides • G. SARITHA & K. MADHU BABU

ARTICLE / 14
FACTORS RESPONSIBLE FOR AGRARIAN CRISISIN ANDHRA PRADESH
SK. Asha Begum
ABSTRACT
The existing literature on the agricultural crisis provided several factors that are directly
and indirectly responsible for the distress and disillusionment among farmers. While
Indebtedness of the farmers seems to be the major reported cause, the reasons that prompt
the farmers to borrow money from individuals rather than from institutions are varied and
differ from place to place. In this context, many studies are conducted on the livelihood and
mitigation of poverty and the consequences of dependence on agriculture with a focus on
socio-economic aspects. Area specific and in-depth studies on survival or suicides are a few
in number and time has come for researchers and academicians to conduct detailed analysis
of factors behind suicides committed by farmers in India. The farmers are greatly affected by
income vulnerability and poverty. Thus people living in agriculture on an average lag far
behind the rest of the world inhuman well-being and development indicators. A large number
of people depending on agriculture are characterized as most deprived lot. An unfortunate
consequence of the pattern of hardships faced by farm families is the growing number of
suicides among farmers in thousands, which is not prevalent in any other profession. Farmers
in many regions in the country are under the grip of economic shock. Though the economic
shock has affected entire population depending on the agriculture, its intensity is very high
in some agricultural regions. The intensity of economic crisis among farm families found to
be varied with the socio economic settings of the people depending on agriculture. Andhra
Pradesh is one of the few states where the intensity of economic crisis in agriculture is found
to be reflecting in growing number of suicides among farm families. Andhra Pradesh agriculture
is Prone to all types of disasters.
Key Words: Controlled Agro-climatic regions, Factors Responsible, agrarian economy, Agrarian
Crisis.
Research Scholar, Department of Economics, Acharya Nagarjuna University.

ARTICLE / 15
PERFORMANCE OF AGRICULTURAL SECTORIN ANDHRA PRADESH
P. Kothandarami Reddy & Koti Reddy Tamma
INTRODUCTION
Agriculture is considered as backbone of the Andhra Pradesh Economy. More than
60per cent of our total population earn their livelihood from agriculture and contributing a
major portion to Gross State Domestic Product (GSDP). In order to make agriculture viable
and profitable and to improve incomes in agriculture and allied sectors, the state has given
top priority for agriculture. In 1993-94 agriculture and allied activities contributed about 39.5
per cent to GSDP of Andhra Region. Even though the crop sector witnessed high volatility
during 1990s due to consecutive droughts and decelerating crop yields, the transformation
continued towards high value commodities such as fruits, vegetables, milk, meat, poultry and
fish. In terms of absorbing labour force and generating incomes, it has a strategic role even
in 2010s. It contributes more to distribution of workforce (of workforce & GSDP) and less
to the aggregate growth of the economy. The government is getting substantial income from
raising land revenue. Agriculture and allied sector’s contribution to Gross Value Added
(GVA) at current prices for the year 2015-16 (AE) is about 29 percent. Agriculture and allied
sector during 2015-16, is likely to record to a growth 11.77 percent at current prices (Socio
Economic Survey- 2015-16, Govt of AP).The government has launched the Primary sector
Mission to address the farm related issues like enhancing value addition from horticulture,
livestock and fisheries and shortages in storage space including cold storages. The state is
committed to transform the primary sector with an inspirational goal of making Andhra
Pradesh as one of the three top leading states in India by 2029.
The area under food grains is estimated at 41.30 lakh hectares in 2015-16 as against
39.63 lakh hectares in 2014-15 showing an increase of 4.21 per cent. The total production
of food grains in 2015-16 is estimated at 137.56 lakh tonnes while it was 160.03 lakh tonnes
in 2014-15 showing a decrease of 14.04 per cent. Wide range of agro-climatic conditions of
the state is conducive for growing a large variety of Horticultural crops, including root and
tuber crops, ornamental crops, plantation crops like coconut, cashew and cocoa etc., it
Associate Professor, UGC-Human Resource Development Centre, S.V. University, Tirupati.Professor of Economics, IBS (A Constituent of ICFAI Foundation for Higher Education) Hyderabad.

100 The Economy of Andhra Pradesh
contributes about 5.6 per cent of the state GDP and is moving towards value enhancement
in addition to focus on production. The state has been divided into 736 watersheds for
estimation of ground water resources. The net ground water irrigational potential created
during 2014-15 was 11.09 lakh hectares. The state of Andhra Pradesh is allocated 512.040
TMC of Krishna waters under the existing projects and also given liberty to utilize remaining
water to the extent feasible. Andhra Pradesh has taken up 4 projects such as Telugu ganga
Project, Handri Niva Sujala Sravanthi, Galeru Nagari Sujala Srvanthi and Veligonda based
on the surplus water as per Krishna Water Dispute Tribunal and are in advanced stage of
completion.
Above all, the instability in crop production varies significantly across crops and sub-
regions in the state. In essence, the state has more heterogeneity in crop production than
homogeneity arising from its varied agro-climatic conditions.
OBJECTIVES OF THE STUDY
The major objectives of the study are:
1. To study the trends in the contribution of Agriculture to GSDP and shares of districts
in Gross Value added of Agricultural sector in the residuary state of Andhra Pradesh
2. To study the relationship between net irrigated area and food& non-food crops
3. To identify the issues confronted and provide policy implications for the development
of Agricultural sector.
METHODOLOGY
The entire study is backed by secondary data only. The data is collected from the
Statistical Abstracts published by the Directorate of Economics and Statistics, Publications of
National Sample Survey Organization, Reserve Bank of India, Centre for Economic and
Social Studies and Indian Institute of Population Studies etc. Simple statistical techniques are
extensively used such as percentages, averages, index numbers and co-efficient of variation.
To study the relationship between net irrigated area and area under food and non-food crops,
Pearson’s correlation co-efficient is used.
PROGRESS OF AGRICULTURAL SECTOR IN ANDHRA PRADESH
The data in table 1 provides information about contribution of agricultural sector to
GDDP of Andhra Pradesh. Agricultural sector accounted for 39.5 per cent to the GDDP of
Andhra Pradesh in 1993-94. Since then, its contribution to GDDP declined to 27.10 per cent
in 2011-12. It clearly indicates the failure of agriculture to contribute its due share to the
GDDP as a result of unfavourable weather conditions. In the subsequent two years the
contribution of agriculture to GDDP increased slightly and again fell to 27.28 per cent in
2014-15 and 26.76 per cent in 2015-16.

101
Table – 1
Contribution of Agricultural Sector to GDDP of Andhra Pradesh
Year GDDP (Rs.crore) Contribution of
Agriculture to GDDP
1993-94** 35697 39.50
2010-11** 317599 27.30
2011-12* 349581 27.10
2012-13* 350043 28.15
2013-14* 380280 28.71
2014-15* 412188 27.28
2015-16* 455484 26.76
Source: (1) GDDP Old Series**(Economic Survey 1994-95 and 2011-12)
(2) GDDP new series*(Economic Survey 2015-16)
Table – 2
Gross Value Added of Agriculture Sector at Constant Basic Prices with 2011-12 as Base Year (Rs.Crore)
District 1993-94* 2011-12 2012-13 2013-14 2014-15
1. Srikakulam 470.52 3433 3763 3659 3311
2. Vizianagaram 460.35 3528 3868 3783 3797
3. Visakapatnam 542.52 4643 4557 4901 4986
4. East Godavari 1459.05 9697 10262 10688 11220
5. West Godavari 1524.77 12022 12903 13873 15171
6. Krishna 1492.05 11937 12673 13608 13622
7. Guntur 1834.37 12213 11297 13004 13240
8. Prakasam 1035.25 8148 8660 9909 10310
9. SPS Nellore 1020.54 6301 6406 7488 7601
10. YSR 795.07 4142 3622 4414 4938
11. Kurnool 1126.44 5879 6665 9008 9364
12. Ananthapuram 1153.50 6435 7497 7918 7919
13. Chittoor 1134.98 6374 6400 6952 6986
Andhra Pradesh 35697.00 94751 98572 109204 112465
Sources: GDDP, AP 2008 & Socio-Economic Survey 2011-1 and 2015-16, AP, *Old Series
The above table 2 provides information about Gross Vale added of Agricultural sector
at constant basic prices with 2011-12 as base year. As per Agricultural GDDP in 1993-94 at
Performance of Agricultural Sector in A.P. • P. KOTHANDARAMI REDDY & KOTI REDDY TAMMA
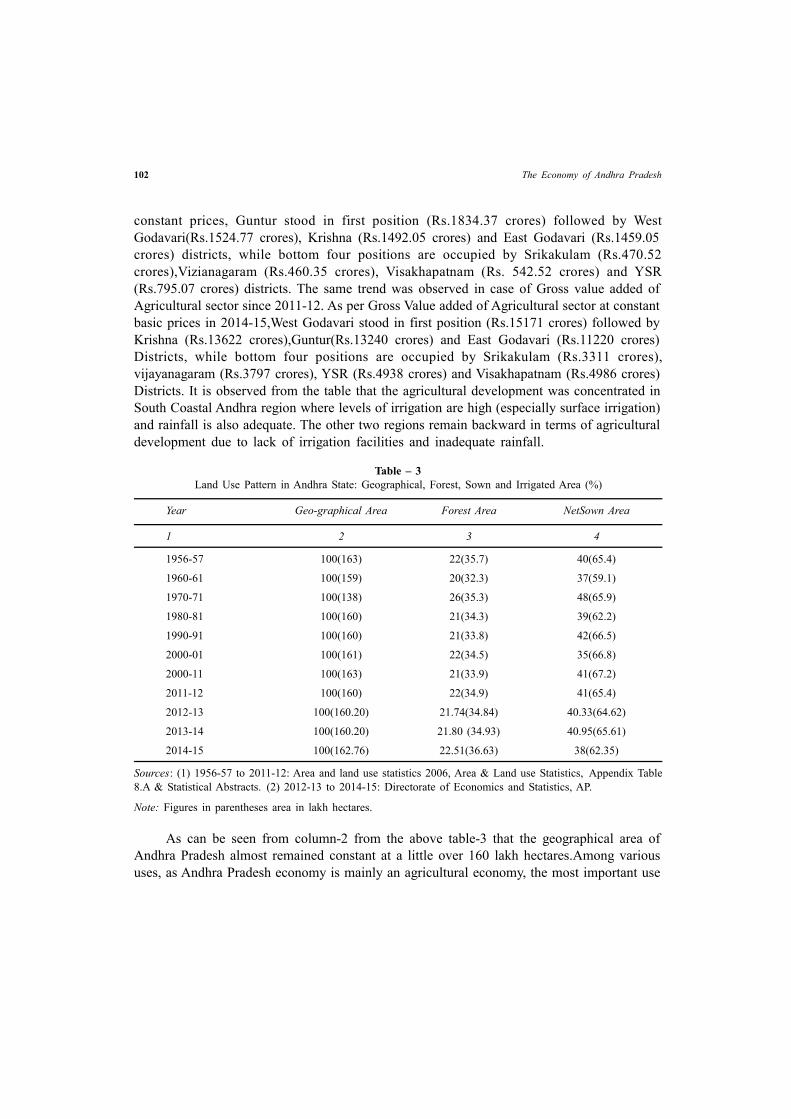
102 The Economy of Andhra Pradesh
constant prices, Guntur stood in first position (Rs.1834.37 crores) followed by West
Godavari(Rs.1524.77 crores), Krishna (Rs.1492.05 crores) and East Godavari (Rs.1459.05
crores) districts, while bottom four positions are occupied by Srikakulam (Rs.470.52
crores),Vizianagaram (Rs.460.35 crores), Visakhapatnam (Rs. 542.52 crores) and YSR
(Rs.795.07 crores) districts. The same trend was observed in case of Gross value added of
Agricultural sector since 2011-12. As per Gross Value added of Agricultural sector at constant
basic prices in 2014-15,West Godavari stood in first position (Rs.15171 crores) followed by
Krishna (Rs.13622 crores),Guntur(Rs.13240 crores) and East Godavari (Rs.11220 crores)
Districts, while bottom four positions are occupied by Srikakulam (Rs.3311 crores),
vijayanagaram (Rs.3797 crores), YSR (Rs.4938 crores) and Visakhapatnam (Rs.4986 crores)
Districts. It is observed from the table that the agricultural development was concentrated in
South Coastal Andhra region where levels of irrigation are high (especially surface irrigation)
and rainfall is also adequate. The other two regions remain backward in terms of agricultural
development due to lack of irrigation facilities and inadequate rainfall.
Table – 3
Land Use Pattern in Andhra State: Geographical, Forest, Sown and Irrigated Area (%)
Year Geo-graphical Area Forest Area NetSown Area
1 2 3 4
1956-57 100(163) 22(35.7) 40(65.4)
1960-61 100(159) 20(32.3) 37(59.1)
1970-71 100(138) 26(35.3) 48(65.9)
1980-81 100(160) 21(34.3) 39(62.2)
1990-91 100(160) 21(33.8) 42(66.5)
2000-01 100(161) 22(34.5) 35(66.8)
2000-11 100(163) 21(33.9) 41(67.2)
2011-12 100(160) 22(34.9) 41(65.4)
2012-13 100(160.20) 21.74(34.84) 40.33(64.62)
2013-14 100(160.20) 21.80 (34.93) 40.95(65.61)
2014-15 100(162.76) 22.51(36.63) 38(62.35)
Sources: (1) 1956-57 to 2011-12: Area and land use statistics 2006, Area & Land use Statistics, Appendix Table
8.A & Statistical Abstracts. (2) 2012-13 to 2014-15: Directorate of Economics and Statistics, AP.
Note: Figures in parentheses area in lakh hectares.
As can be seen from column-2 from the above table-3 that the geographical area of
Andhra Pradesh almost remained constant at a little over 160 lakh hectares.Among various
uses, as Andhra Pradesh economy is mainly an agricultural economy, the most important use

103
of land is for cultivation i.e., Sown area. It is observed from the table that the share of sown
area remains the same during the study period. The net sown and forest area in Andhra
Pradesh show no long term trend, indicating that there is stability of land use in that state,
no land is being lost in the long run to forests or to urbanization, the gross cropped area has
grown steadily at 0.23 per cent per annum.
ISSUES CONFRONTED TO AGRICULTURAL SECTOR
SIZE OF AGRICULTURAL HOLDINGS IN ANDHRA PRADESH
In Andhra Pradesh, the size of agricultural holding is quite uneconomic, small and
fragmented. With the growth of the size of families, the agricultural holdings are gradually
being sub-divided among the heirs, in this way generation after generation the land is being
subdivided and fragmented as well. The growing sub-division and fragmentation of holding
make the adoption of modernized method in agricultural operation quite difficult. Application
of new technology, use of fertilizers and making provision for irrigation facilities will be
difficult in uneconomic holding, this results in low productivity. The following table 4 shows
the size and number of operational holding and area operated upon by these various sizes.
Table – 4
Distribution of Landholdings by Size Classes: 2010-11
Size Group No. of Percentage to Area Percentage Average size of
Holdings (Lakhs) Total (Lakh hect) (Lakh hect) holdings (hect)
Marginal 49.84 65.40 21.60 26.68 0.43
Small 15.91 20.88 22.51 27.80 1.41
Semi-medium 7.96 10.44 21.00 25.94 2.64
Medium 2.30 3.02 12.82 15.83 5.57
Large 0.20 0.26 3.04 3.75 15.20
Total 76.21 100.00 80.97 100.00 1.06
Source: Directorate of Economics and Statistics, A.P
Table 4 reveals that out of the total number of 76.21 lakh holdings, 65.40 per cent was
of marginal category, and the remaining category of holding include small category-20.88 per
cent,semi-medium-10.44 per cent, medium-3.02 per cent and large-0.20 per cent. If we take
those holding less than one hectare as uneconomic, then 65.40 per cent of holdings are to be
considered as uneconomic and the remaining 34.60 per cent of the total holding are economic.
The total area operated under marginal category was estimated at 21.60 lakh hectares (26.68
per cent) of the total area operated. The table also reveals that the average size of holding
in Andhra Pradesh was only 1.06 hectares as an 2010-11. Due to continuous sub-division and
fragmentation of holdings, average area operated per holding has been declining gradually in
the state.
Performance of Agricultural Sector in A.P. • P. KOTHANDARAMI REDDY & KOTI REDDY TAMMA

104 The Economy of Andhra Pradesh
RAINFALL
Agricultural productivity and thereby agricultural Gross Value Added are vulnerable to
vagaries of climate. Direct correlation between rainfall and crop yields is possible in the case
of both food and non-food crops. Agricultural productivity is vulnerable to the vagaries of
temperature and rainfall. Data related to average rainfall in Andhra region is presented in the
following table 5.
Table – 5
Annual Average Rainfall In Andhra Region (mms.)
Year Andhra Year Andhra
1956-57 1149 2005-06 744.0
1960-61 906 2008-09 1155.0
1965-66 606 2009-10 893.0
1970-71 921 2010-11 686.0
1980-81 915 2011-12 646.0
1990-91 972 2014-15 606.1
2000-01 908 2015-16 815.5
Source: Directorate of Economics and Statistics
Table 5 shows average annual rainfall in Andhra region (consists of 13 districts) from
1956-57 to 2015-16. The data reveals that there is a large deviation in the amount of rainfall
recorded during the study period. During the years1965-66 and 2014-15 rainfall recoded was
lowest and while the year 2008-09 shows the highest average rainfall of 1155.0 mm over the
study period.
CROPPING INTENSITY
Cropping intensity is defined as the ratio be-tween net sown area (NSA) and gross
cropped area (GCA). The cropping intensity has direct correla-tion with assured irrigation
which enables farmers to go for multiple cropping and use higher dose of fertilizers and HYV
seeds. Hence, besides irrigation fertilisers, early maturing high yielding variety of seeds,
selective mechanization such as the use of tractors, pumping sets and seed drills, etc., plant,
protection measures through the use of insecticides, pesticides etc. do have role in affecting
the intensity of cropping.
In table 6 cropping intensity in Andhra Region for the period 1956-57 to 2014-15 is
presented. It can be observed from the table that the crop intensity is affected by changes in
net sown and gross cropped area. Both the net sown area and Gross cropped area are affected
since 1956-57 mainly by rainfall and irrigation facilities. It is also observed from the table
that the crop intensity has increased consistently from 1.14 in 1956-57 to1.31 by 2011-12.
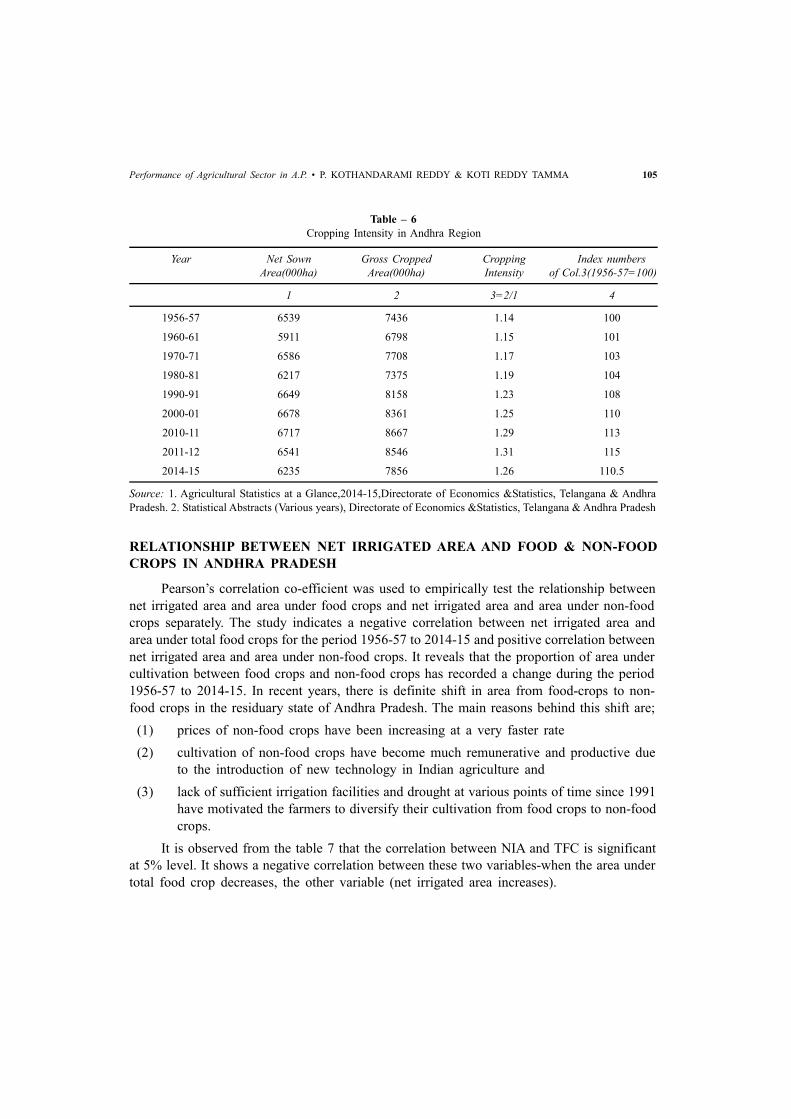
105
Table – 6
Cropping Intensity in Andhra Region
Year Net Sown Gross Cropped Cropping Index numbers
Area(000ha) Area(000ha) Intensity of Col.3(1956-57=100)
1 2 3=2/1 4
1956-57 6539 7436 1.14 100
1960-61 5911 6798 1.15 101
1970-71 6586 7708 1.17 103
1980-81 6217 7375 1.19 104
1990-91 6649 8158 1.23 108
2000-01 6678 8361 1.25 110
2010-11 6717 8667 1.29 113
2011-12 6541 8546 1.31 115
2014-15 6235 7856 1.26 110.5
Source: 1. Agricultural Statistics at a Glance,2014-15,Directorate of Economics &Statistics, Telangana & Andhra
Pradesh. 2. Statistical Abstracts (Various years), Directorate of Economics &Statistics, Telangana & Andhra Pradesh
RELATIONSHIP BETWEEN NET IRRIGATED AREA AND FOOD & NON-FOOD
CROPS IN ANDHRA PRADESH
Pearson’s correlation co-efficient was used to empirically test the relationship between
net irrigated area and area under food crops and net irrigated area and area under non-food
crops separately. The study indicates a negative correlation between net irrigated area and
area under total food crops for the period 1956-57 to 2014-15 and positive correlation between
net irrigated area and area under non-food crops. It reveals that the proportion of area under
cultivation between food crops and non-food crops has recorded a change during the period
1956-57 to 2014-15. In recent years, there is definite shift in area from food-crops to non-
food crops in the residuary state of Andhra Pradesh. The main reasons behind this shift are;
(1) prices of non-food crops have been increasing at a very faster rate
(2) cultivation of non-food crops have become much remunerative and productive due
to the introduction of new technology in Indian agriculture and
(3) lack of sufficient irrigation facilities and drought at various points of time since 1991
have motivated the farmers to diversify their cultivation from food crops to non-food
crops.
It is observed from the table 7 that the correlation between NIA and TFC is significant
at 5% level. It shows a negative correlation between these two variables-when the area under
total food crop decreases, the other variable (net irrigated area increases).
Performance of Agricultural Sector in A.P. • P. KOTHANDARAMI REDDY & KOTI REDDY TAMMA

106 The Economy of Andhra Pradesh
Table – 7
Correlation between Net Irrigated Area And Area Under Total Food and Non- Food Crops from
1956-57 to 2014-15
Details of Correlation Food Crops Non-food Crops
Net Area Area under Net Area Area under
Irrigated Total Food crops Irrigated Total Food crops
NIA Pearson Correlation 1 -.317 1 .0812**
Sig. (2 tailed) *.015 .000
N 59 59 59 56
TFC Pearson Correlation -317 1 .812** 1
Sig (2-tailed) .015 .000
N 59 59 56 56
**Correlation is significant at the 0.01 level (2-tailed)
It is observed from the table 7 that the correlation between NIA and TNFC is significant
at 5% level of significance. It shows a positive and high correlation between these two
variables-as the net irrigated area is increased, the total area under non food crops production
also increased.
POLICY IMPLICATIONS & CONCLUSIONS
It was concluded that the agricultural development was concentrated in South Coastal
Andhra region where levels of irrigation are high (especially surface irrigation) and rainfall
is also adequate. To bridge the existing inequities, the immediate priority in new irrigation
schemes must be to provide resources for irrigation-deficient and low-rainfall areas which
have been neglected in the past. The study indicates a negative correlation between net
irrigated area and area under total food crops for the period 1956-57 to 2014-15 and positive
correlation between net irrigated area and area under non-food crops. There is a need to raise
farm productivity especially in the vast rain fed areas. Improved seeds can play an important
role in increasing productivity. Use of improved seeds and fertilizers requires proper irrigation
facilities. Farmers should be educated in the methods of sowing, manuring, and irrigating the
new high yielding varieties of seeds. Government has to take steps for modernizing irrigation
systems in a phased manner, efficient water management, adequate maintenance of canals and
distribution systems, surveys and investigations for preparation of new projects, developing
National Grid system to ensure water supply from water surplus areas to water-deficit areas
etc.
REFERENCES
1. Agricultural Statistics at a Glance, 2014-15, Directorate of Economics & Statistics (Telangana &
Andhra Pradesh )

107
2. B.N.Srikrishna Committee (2010): “Committee for Consultations on the Situation in Andhra Pradesh”,
Dec 2010.
3. Dholakia Bakul H and Dholakia, Ravindra H(1992): “Technical Progress in Indian Agriculture:
Temporal Analysis”, Vikalpa, Vol 17, No. 2, Apr-June, 1992.
4. Government of Andhra Pradesh (2015-16): Socio-Economic Survey, (Planning Dept.)
5. Government of Andhra Pradesh: Statistical Abstracts, various issues
6. Government of Telangana (2015): Reinventing Telangana-Socio-Economic Outlook, (Planning
Department)
7. Government of Telangana : Statistical Abstracts, various issues
8. Mohan, R. (2006), “Agricultural Credit in India: Status, Issues and Future Agenda”, Economics and
Political Weekly, March (18-24), Vol. XLI No.11, pp. 1013-1040.
9. Pandhy, K.C., Commercial Banks and Rural Development,New Delhi,Asian Publication, 1980.
10. S. Kishan Rao & Rahul A. Shastri (2014): Structure and Development of the Economies of Telangana
and AP States (1956-2014), National Akademi of Development.
Performance of Agricultural Sector in A.P. • P. KOTHANDARAMI REDDY & KOTI REDDY TAMMA
108 The Economy of Andhra Pradesh
ARTICLE / 16
PERFORMANCE OF AGRICULTURE WITH SPECIALREFERENCE TO UNDIVIDED ANDHRA PRADESH
Y. Venkata Rao
ABSTRACT
This paper examines Inter-regional variations in Andhra Pradesh in the growth rates of
agricultural Area, Production and the Yield changes from pre- and post- reform periods in
each region and differences between the regions etc, with a view to link them to the suicide
deaths in the State of Andhra Pradesh. The study used secondary data covering the period
before the adoption of the liberalization policy (1970-71 to 1989-90) and the period after the
adoption of the liberalization policy (1991/92 to 2008/09). The crops concerned in the study
were Rice, Maize, and Pulses. Cereals, Food grains, Cotton and Groundnuts, Oilseeds. The
study estimated the growth rates in Area, Productivity, and Production before and after the
adoption of the liberalization policy for the nine crops. Further, the study conducted a
decomposition analysis to determine the contribution of different components to the growth
rate. The results of the study showed that there were variations in growth rates of area,
production and productivity for the crops before the adoption of the liberalization policy
(1970/71 to 1989/90) as compared with after the adoption of the liberalization policy (1991/
92 to 2008/09).
Research Scholar, School of Economics, University of Hyderabad

109
ARTICLE / 17
ORGANIC FARMING IN ANDHRA PRADESH
G. Savaraiah
ABSTRACT
Organic farming is natural farming. In fact, it is the oldest form of agricultural practice.
In India, the traditional knowledge of agriculture which was essentially organic was nurtured
and groomed by millions of farmers over several hundreds of years and continued to grow
systematically without any adverse impact on soil environment. The farming till the green
revolution period was mostly without the use of modern or chemical fertilizers and pesticides.
The organic farming aim at human welfare harming the environment and follows the principles
of health, ecology, fairness and care for all including soil.
The modern concept of organic farming combines the tradition, innovation and science.
The modern farm products are more harmful to the human beings. Moreover the modern
agricultural practices lead to soil erosion and water pollution, depletion of natural resources
and destruction of delicate ecosystems and curtailing human longevity. All these things forced
the Indian farmers to adopt the natural farming i.e organic farming which provides us with
the very essence of life without any health hazards. Organic farming is gaining movement all
over the world as it offers viable alternative to the ill effects of modern agriculture. Organic
farming is practiced in more than 100 countries, and more than 31 billion hectares of area
is under organic farming in the world and the market of organic food touched $31 billion by
2005. In India, majority of the states have been promoting the e organic farming activities.
We shall discuss to emphasise the need for the organic farming, status of organic farming and
the training to be imparted to the farmers to adopt organic farming in Andhra Pradesh.
Organic farming is the need of the hour. By switching over to organic farming, the
budgetary burden to the government for providing subsidy to the chemical fertilizers will be
lessened. Besides, foreign exchange incurred on imports of chemical fertilizers etc will be
conserved and the additional financial resources can be made use for the promotion of social
welfare schemes. Further public health will be promoted and quality of life will be enhanced.
It is heartening to note that the Government of Andhra Pradesh has taken initiative and
stepping up all efforts to popularize and promote organic farming.
Professor, Department of Economics, S.V.U.College of Arts, Tirupati

110 The Economy of Andhra Pradesh
The government should taken supportive measures for the local production of inputs
required for encouraging organic farming. The Government of India has been providing
subsidy for organic farming. Government of AP has been conducting training camps for
farmers and creating awareness about the organic farming methods and its benefits. Promotion
of organic farming under RKVY from 2013-14 will it is hoped to achieve good results with
proposed 130 clusters covering 725 villages and 75,000 farmers with 50,600 hectares during
2015-16.

111
ARTICLE / 18
NAVYANDHRA MARCHING TOWARDSBLUE REVOLUTION
G. Savaraiah
India is a major supplier of fish in the World. In 2006 the Country extend over 6,00,000
metric tonnes of fish to some 90 countries, earning over $51.8 billion. Shrimps are one of
the major varieties exported. Shrimp production from coastal aquaculture during 2004 stood
at approximately 1,20,000 tonnes. Farmed shrimp accounted for about 60 percent of shrimp
exported from the Country. Marine and fish water catch fishing combined with aquaculture
fish farming is a rapidly growing industry in India. In 2008, India were the sixth largest
producer of marine and fish water capture fisheries, and the second largest aquaculture
farmed fish producer in the World. Fish as food-both from fish farms and catch fisheries-
offers India one of the easiest and fastest way to address malnutrition and food security.
Andhra Pradesh stands first in total fish and prawns/shrimp production in India since
2013-14 both in terms of production and value. The state is fourth in marine fish production.
42 percent of marine exports of India registered during 2014-15. Andhra Pradesh has fertile
river basins, extensive canal system and conductive agro-climatic conditions for fishery
promotion. The state has 974 km of coastline and is one of the largest producers of marine
products. An attempt is made in this article to evaluate the performance of fisheries development
in the state of Andhra Pradesh and make the fisheries sector as one of the growth engines
for socio-economic development of the new state i.e Navyadra Pradesh.
CONTRIBUTION OF FISHERIES
Fisheries are one of the most promising subsectors of the agriculture sector. this subsector
occupies a predominant place in the socio-economic development of the state as it contributes
substantially to economic growth and income generation to lakhs of people. Sustainable
development of fisheries can only be achieved through improvement of the quality, technical
skills and management of human resource in the sector. it is a significant employment generator
and a source of nutritious food and foreign exchange earner for the state. about 1.4 million
people are directly or indirectly employed in the state in this sector with it recording faster
growth than crop and livestock sectors. Andhra Pradesh ranks first in brackish water shrimp
production, first in fresh water prawn production, second in fresh water fish production,
Professor, Department of Economics, S.V.U.College of Arts, Tirupati

112 The Economy of Andhra Pradesh
second in total value of fresh water fish and produced and fourth in marine fish production.
the state contributed nearly rs.3,000 crore by way of marine exports, which is nearly 50
percent of the country’s marine exports.
DISTRICT-WISE FISHERMAN ACTIVITIES
In Andhra Pradesh the traditional fisher community people are considered as indigenous
people who are the most marginalized and disadvantaged groups. In fact, they are the vulnerable
sections. The government of Andhra Pradesh has introduced many programmes related to
capture fisheries and aquaculture and their sustainable development with particular emphasis
on improving human well-being, food security and poverty reduction Higher Productivity
knowledge transfer for sustainable fishing continued growth in fish in fish production with
increase in fish exports have the potential for increasing the living standards of Indian
fisherman. Fishing activities are attracting large number of fisherman, women and other
people. The employment potential of the fisheries reveals that lakhs of people are engaged
in fishing industry and depend on fisheries for their livelihood in various ways. Besides those
who directly catch the fish for marketing, there are equal large number of people engaged in
subsidiary industries like refrigeration, preservation, canning and in the manufacture of fish
products and by products. The particulars relating to the districts -wise fishermen activities
are shown in table-1.
The table-1 shows that large number (3.35 lakhs) of fishermen are engaged in fishing
activities followed by the marketing of fish (1.41 lakhs) and repairing/ mending of nets (0.49
lakhs). The higher number of fishermen (21.10 percent) engaged in fishing activity is found
in East Godavari district followed by S.P.S Nellore district (19.30 percent), Srikakulam
(12.45 percent) Krishna (11.03 percent) and Prakasam districts (9.41 percent) whereas the
lowest number of fishermen engaged in fishing activity is noticed in Chittoor district (0.80
percent) followed by Y.S.R district (0.48 percent), west Godavari (2.05 percent) and Kurnool
(2.09 percent). In case of fishermen engaged in marketing of fish, the highest number is
found in East Godavari (34.3 percent) followed by Srikakulam (18.6 percent) Prakasam (9.7
percent) and PSR Nellore (9.2 percent) but the lowest number is reported in Chittoor(0.05
percent) followed by (0.51 percent), Guntur (0.91 percent) Kurnool (2.45 percent) and west
Godavari (1.60 percent). The above analysis shows that generally the lowest number of
people engaged in fishing and marketing activities appeared very low incase non-coastal
districts but they found in the coastal districts like West Godavari, Guntur and Vijayanagaram
districts. The majority of the fishermen engaged in repairing/ mending the fishing nets is
found in East Godavari district (44.9 percent) followed by Guntur (18.83 percent) and PSR
Nellore district (13.66 percent) whereas the lowest number is available in Kurnool (0.33
percent) followed by YSR (0.41 percent) Srikakulam (0.46 percent) Chittoor (0.73 percent)
and Visakhapatnam (1.19 percent).

113
Table – 1
District-wise Fishermen Activities in Andhra Pradesh, 2014-15
Sl.No District No. of Fishermen engaged in Members in Type of Fishing Activity
Fishing Marketing Repairing/ Fishing Inland Marine
Activity of Fish Mending Community
of nets
(1) (2) (3) (4) (5) (6) (7) (8)
1 Srikakulam 42115 26,112 226 50,228 14,944 35,264
2 Vizianagaram 16,980 5,685 2,350 25,015 13,015 12,000
3 Visakhapatnam 26,357 9,357 582 10,823 9,803 28,779
4 East Godavari 70,316 48,281 22,035 70,316 22,500 47,816
5 West Godavari 6,863 2,254 755 27,452 22,092 1,042
6 Krishna 36,750 8,400 4,200 49,350 23,100 26,250
7 Guntur 20,119 1,282 9,234 30,635 14,874 5,245
8 Prakasam 31,370 13,600 2,240 98,400 7,170 24,200
9 S.P.S Nellore 64,323 12,950 6,700 47,972 17,819 47,972
10 Y.S.R 1,612 360 200 1,912 1,912 —-
11 Kurnool 6,978 3,450 162 10,590 10,590 —-
12 Ananthapuram 8,162 8,162 - 8,162 8,162 —-
13 Chittoor 2,663 720 360 1,320 1,320 —-
ANDHRA PRADESH 3,34,608 1,40,613 49,044 4,32,175 1,67,301 2,28,568
Source: Commissioner of Fisheries, Andhra Pradesh, Hyderabad.
The total number of population in fishing community is 6.05 lakhs in 2015 as against
4.29 lakh in 2014 engaged in fishing activities and marketing of fish in the state of Andhra
Pradesh. This analysis reveals that the large number of members in the fishing community
from the East Godavari district have involved in fishing activities and largely benefitted. The
highest number of fishermen engaged in inland fishing is found in Krishna district (13.81
percent) followed by East Godavari (13.96 percent) and West Godavari district (13.45 percent).
In case of fishermen engaged in marine fishing activities, the highest number is found in PSR
Nellore district (21.0 percent) followed by East Godavari (20.92 percent) and Srikakulam
district (15.45 percent). On the whole, the large number of fisher men has benefitted more
from the fishing sector the east Godavari, PSR Nellore and Krishna districts.
FISH PRODUCTION
Fishing industry has been showing an impressive growth during the last two decades.
Blessed with abundant marine resources spread across the coast line of coasted Andhra
Navyandhra Marching Towards Blue Revolution • G. SAVARAIAH

114 The Economy of Andhra Pradesh
Pradesh is heading for a blue revolution. The fisheries of India broadly and consist of two
types- (1) marine fisheries (2) inland fisheries which include freshwater, estuarine and backwater
fisheries. Inland fisheries resources consist of two types of water- brackish and fresh. The fish
production has gone up from 3.08 lakh tones in 1995-96 to 19.79 lakh tones in 2014-15,
showing more than six-fold increase during the last two decades in Andhra Pradesh. The
details relating to the fish and prawn production in the state are shown in table-2
Table – 2
Fish Production in Andhra Pradesh 1995-96 to 2014-15
(Production in Tonnes)
Sl. No. Year Marine Fish Marine Brackish Inland Fresh Water Total
Shrimp Water Shrimp Fish Prawn
1 1995-96 130782 21208 27140 112305 16560 307995
2 1996-97 130403 21644 30377 113661 17214 313299
3 1997-98 129043 17504 31320 122495 20075 320437
4 1998-99 130123 19877 44858 139568 23103 357529
5 1999-2000 142754 23728 32269 206865 34375 439991
6 2000-01 157159 25343 37844 238781 40566 499693
7 2001-02 180761 24179 36604 289557 42906 574007
8 2002-03 211533 36762 38501 438827 49572 775195
9 2003-04 229963 33963 33339 510037 53417 860719
10 2004-05 181581 29151 32973 491625 33874 769204
11 2005-06 192067 26769 41973 517824 35554 814187
12 2006-07 207112 33599 37811 513706 49849 842078
13 2007-08 218815 36077 46885 571296 64596 937669
14 2008-09 244924 46236 26341 716864 67121 1101486
15 2009-10 246544 46606 30659 782508 51917 1158235
16 2010-11 251826 38727 43379 1055750 34130 1423812
17 2011-12 326472 52945 56179 888309 78781 1402686
19 2012-13 351585 62764 69871 1022497 81733 1588450
20 2013-14 373338 64908 88036 1139708 102793 1768783
21 2014-15 406249 69152 105162 1276817 121198 1978578
Source: Commissioner of Fisheries, Andhra Pradesh, Hyderabad
The table-2 shows that production of fish/ prawn in the state has increased constantly
from 1995-96 and registering an average annual growth rate of 9.92 percent. The marine fish
production has risen by 2.76 lakh tones in 2014-15 over 1995-96 registering more than two-

115
fold increase. But the share of marine fish production to the total fish production in A.P has
significantly declined from 42.46 percent in 1995-96 to 20.53 percent in 2014-15. Similarly
the marine shrimp production has increased more than three times but its share has been
declined to 3.50 percent in 2014-15 as against 6.89 percent in 1995-96. There is a fourfold
increase in the production of brackish water shrimp between 1995-2015. Its share has come
down from 8.81 percent to 5.32 percent during the same period. Though there is a steady and
continuous growth in the production of marine fish and shrimp, their share in the total fish
and pawn production has been considerably declined due to mechanized and organized fishing
by the foreigners and frequent storms/ cyclones. Moreover, the fisheries and aquaculture
development programmes have been taken up by the governments with a view to optimization
of production and productivity, augment of exports, generation of employment and welfare
of fisher folk communities and their socio-economic status. So that there is nineteen-fold
increase in the last twenty one years. The share of inland fish has tremendously increased
from 36.46 percent in 1995-96 to 64.53 percent in 2014-15. In case of fresh water prawn, its
share has marginally increased from 5.38 to 6.13 percent during the same period. This is
because of the large scale involvement of farmers who are driven by robust market especially
in Kolkata and North-Eastern States took up intensive pisciculture in the delta areas of the
state.
DISTRICT-WISE FISH PRODUCTION
Marine fishing is one of the oldest occupations of the villagers who are residing near
sea coasts. In fact the marine fishing provides main substance to the large number of backward
and economically weaker sections of the people. The rights of the traditional fishing
communities have been in focus in recent years in the wake of increasing commercialization
and consequent un-sustainability of marine. The particulars relating to the district-wise marine
fish and prawns production are shown in table-3.
The table-3 shows that the marine fish and prawns production has increased to 4.75 lakh
tones in 2014-15 as against 3.79 lakh tones registering an increase of 15.51 percent. The rate
o growth in the marine fish and prawns production is found in East Godavari followed by
PSR Nellore district and Visakhapatnam between 2011-12 and 2013-14. In case of percentage
increase in the production levels between 2011-12 and 2013-14, West Godavari district shows
higher growth followed Vijayanagaram, Krishna and West Godavari districts whereas the
Guntur district shows low level increase followed by Visakhapatnam and Prakasam. The
analysis reveals that though the highest production of marine fish and prawns was achieved
by East Godavari and Visakhapatnam districts they did not show higher increase between
2011-12 and 2013-14.
The state government has been encouraging inland fish and prawns production by way
of providing financial incentives. 24673 hectares of area covered with fresh water aquaculture
in the state. In Nellore district alone aqua-farmers cultivated In 14,000 hectares. The inland
Navyandhra Marching Towards Blue Revolution • G. SAVARAIAH

116 The Economy of Andhra Pradesh
Table – 3
District- Wise Marine Fish and Prawns Production
Sl.No District 2011-12 2014-15 Growth Rate (percentage)
(1) (2) (3) (4) (5)
1 Srikakulam 41,402 56,963 37.59
2 Vizianagaram 13,591 16,507 21.46
3 Visakhapatnam 79,274 97,320 22.76
4 East Godavari 81,128 1,01,729 25.39
5 West Godavari 8,190 11,805 44.14
6 Krishna 31,207 39,943 27.99
7 Guntur 30,387 38,914 28.06
8 Prakasam 22,904 29,609 29.27
9 S.P.S Nellore 71,334 82,611 15.81
ANDHRA PRADESH 3,79,417 4,75,401 25.30
Source: Commissioner of Fisheries, Andhra Pradesh, Hyderabad
Table – 4
District Wise Inland Fish and Prawns Production from 2011-12to2014-15
Sl.No District 2011-12 2014-15 Growth Rate (%)
1 Srikakulam 9,919 11,912 20.09
2 Vizianagaram 9,075 11,510 26.83
3 Visakhapatnam 14,095 15,591 10.61
4 East Godavari 41,021 46,299 12.87
5 West Godavari 3,80,836 5,69,261 49.48
6 Krishna 4,15,955 5,60,127 34.66
7 Guntur 31,009 33,707 8.70
8 Prakasam 16,627 24,974 50.20
9 S.P.S Nellore 75,612 86,340 14.19
10 Y.S.R 4,034 3,269 18.96
11 Kurnool 20,580 24,253 17.85
12 Ananthapuram 2,891 6,647 129.92
13 Chittoor 1,615 4,125 155.42
ANDHRA PRADESH 10,23,269 13,98,015 36.62
Source: Commissioner of Fisheries, Andhra Pradesh, Hyderabad.

117
fish and prawns production accounted for 70.25 percent in the total fish and prawns production
if the state. The particulars relating to the district-wise inland fish and prawns production are
shown in table-4.
The table-4 shows that the highest quantity of inland fish and prawns production is
found in Krishna district followed by west Godavari (39.38 percent) and SPS Nellore district.
A sizeable quantity of production of fish and prawn is available in East Godavari district
(3.13 percent) and Guntur district (2.49 percent). In case of Rayalaseema districts except
Kurnool (1.98 percent) the production of inland fish and prawns did not even touch 0.50
percent due to the shortage of water. There is a considerable increase in the production of
fish and prawns in 2014-15 when compared with 2011-12, is found in West Godavari,
Krishna Vijayanagaram and Ananthapur districts. It is disheartening to note that there is a
drastic decline in YSR district and marginal decline in case of Visakhapatnam, West Godavari
and Guntur district during the same period.
There is a good demand for brackish water prawn in India. It has also a large export
potential through which India is earning lot of foreign exchange. The brackish water prawn
production has increased from 56179 tonnes in 2011-12 to 88,036 tonnes in 2013-14, registering
a growth of 56.71 percent growth. The particulars relating to the district-wise brackish water
prawn production are shown in table-5
Table – 5
District Wise Brackish Water Fish and Prawns Production from 2011-12to2014-15 (in Tonnes)
Sl.No District 2011-12 2014-15 Growth Rate (%)
1 Srikakulam 481 821 70.69
2 Vizianagaram 74 138 86.49
3 Visakhapatnam 1,001 3,265 226.17
4 East Godavari 6,254 11,373 81.85
5 West Godavari 18,187 31,550 73.48
6 Krishna 9,001 13,801 53.33
7 Guntur 4,056 7,594 87.23
8 Prakasam 4,785 10,301 115.28
9 S.P.S Nellore 12,340 26,319 113.28
ANDHRA PRADESH 56,179 1,05,162 87.19
Source: Commissioner of Fisheries, Andhra Pradesh, Hyderabad.
The table-5 clearly reveals that the highest prawn production is found in West Godavari
and SPS Nellore districts. 12.0 percent and more than 10.00 percent of the brackish water
prawn production is available in Krishna and East Godavari districts respectively. 7 to 8
Navyandhra Marching Towards Blue Revolution • G. SAVARAIAH
118 The Economy of Andhra Pradesh
percent is achieved by the Guntur and Prakasam districts. But there is a significant increase
in the production of prawns in Guntur, Prakasam, Srikakulam, and East Godavari,
Vijayanagaram, Visakhapatnam and West Godavari districts during 2014-15 when compared
with that of 2011-12
MOVING TOWARDS BLUE REVOLUTION
The Government of Andhra Pradesh has set an ambitious target of achieving a production
of 22.67 lakh tones for 2015-16 and 26.40 lakh tones for the year 2016-17 as against the
actual production of fish and prawn of 19.79 lakh tones during the 2014-15.
The government has set a target of achieving 22.67 lakh tones valued at Rs.30,000 crore
for 2015-16 including marine, inland and brackish water cultures and by October 2015, the
production is achieved to 12.64 lakh tones, and by November 2015, the production is pegged
at 14.13 lakh tonnes worth Rs. 16,269 crore registering a growth of 26.47 percent compared
to the previous year. The report shows that 42percent of targets for marine fish production
and about 57 percent of targets for both production and earnings for fresh water fish were
achieved. The production of prawns and shrimps reached to 3.03 lakhs tones valued at
Rs.9963 crore up to October 2015. It shows that about 66 percent and 53 percent of targets
for production and earnings of prawns have achieved so far.
The industry continues to pin its hopes on fish production and set a target of achieving
a production of 26.40 lakh tones valued at Rs. 37638 crore for 2016-17. Marine fish production
accounts for 4.50 lakh tones valued at Rs.4.059 crore.The industry has a strong desire and
put a hope on inland fish production and set a target of achieving 16.00 lakh tones worth Rs.
11,808 crore. This can be achieved through encouraging fish farmers by way of proving
financial and non-financial incentives which are stated in the new fish policy. Fresh water
prawn is the emerging area which is attracted by more entrepreneur farmers. The industry set
a target of 5.90 lakh tones of production of brackish water shrimp and fresh water prawns
valued at Rs. 21,771 crore for 2016-17.
PROPOSED EARNINGS AND INVESTMENTS
The aqua industry, already a biggest revenue grosser with an estimated Rs.20,000 crore
annual earnings, is gearing up for a major leap. The New fisheries policy for Aquaculture
development aims to increase the aquaculture production in the state from Rs.22, 000 crore
in 2014-15 to Rs.35,000 by 2018-19. The Government of AP get a target raise the total
earning of Rs.37,638 crore from the fisheries sector for the year 2016-17. It is expected and
estimated to get the income of Rs.376 crore from the industry as tax at the rate 10 percent.
In order to achieve these targets, the government has to invest Rs.3671 crore. Out of this, the
share of the state government will be of Rs.1382 crore, the funds from the Central Government
will be of Rs.915 crore and the rest of the amount of RS.1326 crore will be secured from
the private sector.
119
PROMOTING THE STATE AS THE AQUA-HUB OF INDIA
The government of Andhra Pradesh has formulated plan to promote the state as the
Aqua Hub in the South Asia. The fishing industry should be developed by utilizing available
resources, providing basic inputs for the fishermen and aqua farmers and creating infrastructure
with a view to heading for a blue revolution. The planning department has put forth the
following activities to be undertaken
1. Fisheries sector identified and considered as one of the Growth Engines forsocio-
economic development of the New State.
2. The extension of fisheries cultivation in 14 thousand hectares in fresh water.
3. New fish ponds should be created in 15 thousand hectares and water supply to these
new ponds should be arranged from the reservoir/ projects on par with the irrigation
to the agriculture sector
4. Reorganization of the department of fisheries
5. Policies should be changed to bring the D.K.T patta lands, government lands under
the fish and prawn cultivation
6. Liberalize the policies in providing sanctions to make the fish ponds
7. Loan and insurance facilities should be provided to the fishermen and aqua farmers
8. Electricity supply should be given on subsidy to the fish ponds
9. Fish rearing should be encouraged in the reservoirs and small irrigated projects/
sources
10. Marketing and storage facilities should be created to the SHGs and Matsya Mitra
Groups (MMGs)
CONCLUSION
The traditional marine fishermen considered fishing activity as are of the more
remunerative occupation. The fishing activity becomes a risky and non-remunerative occupation
as the middlemen/ commission agents and moneylenders exploited the fishermen. The
intermediaries, on whom traditional fishers bank a lot to sell their catch, should be kept at
bay from them by providing an acceptable marketing mechanism. Many marine fishermen are
in debt trap due their consumption habit of alcoholic drinks proper financing mechanism
should be evolved through banks or thrift credit cooperative societies to lend loans to traditional
fishers at low/ concessional interest. The government can create confidence in the minds of
fisheries community by way of issuance of identity cards to fishers, venders and those
involved in trading. The fisheries department should develop infrastructure for landing bats
on the shore and at the markets, steps to reduce fatigue of fishers and improve the livelihood
by conducting skill development programmes and strengthen social security net. The operations
Navyandhra Marching Towards Blue Revolution • G. SAVARAIAH

120 The Economy of Andhra Pradesh
of foreign trawlers in India waters, destructive methods of fishing and encroachment of
coastal areas for non-fishing activities have not been adequately tackled by the government.
Under these conditions, the fishers could not able to get more production of fish.
REFERENCES
1. Wikipedia
2. The Hindu, 22nd, December 2015
3. Govt of AP. Social-Economic Survey- 2016-15. Planning Department P.68
4. Hans India, 13th December, 2015
5. The Hindu, 22nd, December 2015, Chennai, Edition.
6. Economic Times, 29 June 2015
7. Sakshi 2 December 2015
8. Eenadu, 29th, November 2015
9. Sakshi 2 December 2015
10. The Hindu, 9, December 2015
11. The Hindu, 29th, December 2015
121
ARTICLE / 19
EXPORT POTENTIAL OF AGRICULTURE OFANDHRA PRADESH – AN ANALYSIS
I. Narendra Kumar & K. Suneetha
In India, the agricultural development is essential to achieve overall economic progress.
Because India has a population of over one billion to feed. Over two-thirds of its national
work force directly or indirectly depends on agriculture. Agricultural sector generates 14.6
per cent of total GDP in the India economy and exports US1.14 billion in 2014-2015. The
economy is dependent on sustained agricultural growth. The agricultural sector has been
successful over the past six decades in keeping pace with rising demand for food. The country
entered into globalization and economic liberalization, which has great impact on future land
use and production patterns. This shift towards globalization may also be environmentally
desirable, as the producers will concentrate more on quality of production through cost
effectiveness. These changes have profound influence on future agricultural research and
technology dissemination to the farmers in the country.
The present day ills of agriculture and crashing prices are being attributed to World
Trade Agreement. This is due to the fact that implications and consequences of WTA are not
fully understood by many. The developed and developing countries do not have same level
field for operations. They felt that, compulsory market access and patenting of plant seeds
provisions adversely affect the food security of the people of the country. Even today, the
agricultural sector in the country is more subsistence oriented i.e., production for self-
consumption and adversely affected by vagaries of monsoons. The export potential of
agricultural output from the country should be studied from time to time, which is a dire need
because export led agricultural growth paves the way in the coming future. This facilitates
the establishment of requisite infrastructure in the country. Since Andhra Pradesh state is
endowed with diverse agro-climatic conditions and occupies a prominent place in India, the
same is considered for following the management approach to evaluate the existing situation,
exploring the export opportunities and preparation of action plans for any threats which
would ensure food security on one hand and profitability of the business on the other.
Academic Cosultant, Department of Econometrics, S.V.University, Tirupati.Assistant Professor, Department of Econometrics, S.V.University, Tirupati.

122 The Economy of Andhra Pradesh
IMPORTANCE OF AGRICULTURE IN ANDHRA PRADESH
The State of Andhra Pradesh is broadly divided into two agro-climatic zones. The
Rayalseema zone, which is semi-arid and drought prone and receives around 700 mm rainfall.
The net sown area is only 38 per cent in this zone and the irrigation infrastructure is poor.
The Coastal zone has more than 1000 mm rainfall and the climate is sub-humid. The soil
salinity and floods are the limiting factors. The area under cultivation is higher, which also
has better irrigation facilities and higher productivity. Frequent cyclones, floods, drainage and
salinity are the limiting factors. The zone has 60 per cent of area under irrigation with
reasonably high cropping intensity. The salient features relating to the importance of agriculture
in the state are;
Nearly 30 per cent of the state’s GDP is from the agriculture and allied sectors.
It provides employment to 64.55 per cent of the state’s population.
The state ranks first in the production of various agricultural products in the country
in Agricultural and Agro-based industries account for 39 per cent of the total exports
from Andhra Pradesh.
The excessive dependence of food production on small sized holdings has adversely
curbed the potentialities of large scale commercialization of this sector. The agricultural
extension programmes implemented earlier laid more emphasis to cereals, rather than on
farming systems approach. The state is blessed with diverse agro-climatic zones, soils, cropping
pattern, food habits, culture and distribution of asset. However, the actual potentials have not
been fully exploited. This is mainly due to several inherent weaknesses and constraints such
as short comings in the pre and post-harvest operations and management, low productivity
of crops, lack of adequate and updated knowledge on developments taking place in the
potential and existing overseas markets, infrastructural constraints etc. Hence an effective
policy for the amelioration of the above constraints in agriculture and efficient utilization of
states own resources are essential for boosting the agricultural exports from the state. The
Government of Andhra Pradesh should restructure the existing pattern of agricultural production
and marketing so as to realize the benefits of foreign trade. It helps in estimating the marketable
surplus for different commodities, studying the possible constraints in marketing, utilization
of technology, identification of potential buyers, exporting the commodities based on price
trends in the international market etc. In the short-run, it will be useful for understanding the
market demand pattern and possibilities of meeting such demands for the available resources.
In the long run, it will form the basis for restructuring the supplies to cater to the international
demand and thereby vibrate the agro-economy of the state. These factors are,
POSITIVE POTENTIALITIES FOR EXPORTS OF AGRICULTURE PRODUCTS
Andhra Pradesh is among the top five Indian states in terms of cultivated land. Large
population mostly living in rural areas and deriving their livelihood from agriculture
and allied activities.

123
Diverse soil types which facilitate cultivation of large number of crops round the year
and climate is fairly congenial for a variety of agriculture and allied activities.
Second largest coast line in the country providing several gateways for International
trade, rich natural resources, rich livestock and good scope for marine cultivation.
Rich bio-diversity with respect to agriculture and horticultural crops and support
from the several ICAR institutes and, ICRISAT in the areas of education, extension,
research and training for the welfare of farming community.
Andhra Pradesh is one of the top five states in India in food grains production,
ranking fourth after U.P., Punjab and M.P.
Andhra Pradesh ranks third amongst the Indian states with respect to production of
Rice (12.87 million tons) contributing 13.3 per cent of India total rice production and
2.8 per cent of world rice production. In terms of rice productivity, Andhra Pradesh
ranks third in India after Tamilnadu and Punjab.
Andhra Pradesh ranks second with respect to production of Maize contributing to
13.6 per cent of India’s total production and top in terms of productivity.
Andhra Pradesh produces about 0.8 million tons of assorted pulses, Red gram, Green
gram, Black gram, Horse gram, etc.
Andhra Pradesh produces total 3.26 million tons of oilseeds ranking fourth in the
country.
Andhra Pradesh ranks third in India with respect to production of Groundnut and
accounts of 21 per cent of country’s total Groundnut production and about 6.3 per
cent of world’s production.
Andhra Pradesh ranks third with respect to production of Sunflower and accounts for
28 per cent of country’s Sunflower production.
Andhra Pradesh produces 2.5 million tonnes of Cotton, constituting 18.3 per cent of
India’s total cotton production. It is the largest producer of Tobacco in the country.
Andhra Pradesh produces 7.6 per cent of the country’s Sugarcane ranking 5 th amongst
the Indian states.
One of the largest producers of fruits and vegetables in the country.
Andhra Pradesh produces an estimated over 12 million tonnes of horticultural crops.
Andhra Pradesh occupies 1 st rank in the country, both in production and productivity
in respect of mango orange, lime and in productivity of papaya, grapes and oil palm.
The other products are banana, tomato, guava, onion, okra, sapota and cashew.
Andhra Pradesh takes top rank in the country in area under chilly production and
also large production of turmeric and coriander.
Export Potential of Agriculture • I. NARENDRA KUMAR & K. SUNEETHA

124 The Economy of Andhra Pradesh
Andhra Pradesh is the 7 th largest milk producer in the country, producing about 6.8
million tonnes of milk per year, growing at 5-6 per cent per annum.
Andhra Pradesh stands second in the country in Mulberry cultivation and also Andhra
Pradesh stands second in the country in Cocoon production.
CONSTRAINTS FOR THE EXPORT OF AGRICULTURE PRODUCTS
Long coast line often results in cyclones and storms.
Relatively high percentage of illiteracy of 66 per cent compared to national average
of 48.0 of the country. And about 60 per cent of the Gross Cropped Area is under
rain fed farming.
Low irrigation infrastructure and low investment capacity of the farmers.
Lack of adequate technical manpower and infrastructure to study the implications of
WTA on the agricultural exports.
Low marketable surplus due to high domestic consumption.
Maintenance of Rural roads is poor.
Lack of proper marketing infrastructure like cold storage facilities, processing facilities,
grading facilities, market information network, advertisement etc.
PROSPECTS OF EXPORT POTENTIALITIES OF AGRICULTURE
The existing diversified agro-climatic conditions, soils and cropping pattern offers
great opportunities for producing diverse crops both for the international as well as
to domestic market.
Conducive environment for direct foreign investment in the state to build requisite
infrastructure.
The spread of Information Technology sector in the state offers great opportunities
to export the commodities by studying the price trends in the international markets.
The establishment of bio-technology industries in the state provides a greater scope
for releasing pest and disease resistant varieties and promoting quality of production
through cost effectiveness.
Location of several ICAR institutions, agricultural universities, and other institutions
facilitate exchange of expertise and materials to study the implications of WTA
relevant to the state.
Large extension network system facilitates the farmers to shift their cropping pattern
towards more profitable crops.

125
THREATS TO EXPORT POTENTIALITIES OF AGRICULTURE PRODUCTS
Erratic distribution of rainfall may adversely affect the production, droughts, floods
and cyclones of high frequency and intensity and limited scope for expansion of area
under agriculture.
Threats of extremism, absentee landlordism leads to ineffective utilization of land
and other resources.
CONCLUSIONS AND SUGGESTIONS
From the above facts, it is clear that the farmers should be motivated to take up the
agricultural and allied activities as a profit making business and to concentrate on profitability
of crops. It implies that the farmers should produce and market their produce through cost
effective technologies. To achieve this, the following suggestions are made;
Trained and skilled manpower should be provided in the fields of agricultural research,
extension and marketing.
Networking of different scientific organizations located in the state should be improved
so as to expand application of modern technology in the fields of production and
marketing.
The state is having an easy access to all parts of the country and has the 2 nd largest
coast line in the country, there is a greater opportunity to promote exports by developing
both air-cargo and ship-cargo facilities with requisite infrastructure.
The Agriculture department should conduct an extensive research for generating cost
effective technologies for agricultural production.
There is a greater need to educate the farmers to adopt new practices with more
emphasis on adopting biological control and bio-fertilizers so as to reduce the cost
and improve the quality of the agricultural production.
Bio-technology should be given special attention regarding development of high
yielding varieties with drought tolerance, pest and disease resistance and with higher
quality.
There is a greater need to invest substantially for infrastructure development such as
cold storages, grading facilities, processing facilities, market information network
etc., which will have a positive impact on export marketing.
Information should be provided on international trade, production, prices, quality
standards, seasonality, marketable surplus etc., for analyzing and disseminating
information among the producers and exporters. The export competitiveness of
agricultural commodities should also be studied from time to time so as to encourage
their exports which have more comparative advantage in the international market.
Export Potential of Agriculture • I. NARENDRA KUMAR & K. SUNEETHA

126 The Economy of Andhra Pradesh
This facilitates full exploitation of market access opportunities provided by the WTA.
The expenditure incurred on export promotion activities does not go against the spirit
of WTA, because they come under the Green Box provisions.
A long term policy is essential to promote the agricultural exports on a sustainable
basis. The policy should aim at proper selection of commodities for exports based on
the needs of other countries rather than on surplus oriented commodities. The above
facts reiterate the need for adequate attention paying to overcome the possible threats
and mitigating the weaknesses for a proper and planned development of export
oriented agriculture in Andhra Pradesh. These should be carried out both from the
short-term and long-term perspective so as to carve out the states due share in the
world trade.
REFERENCES
1. Agricultural Reports, Department of Agriculture and co-operation, Ministry of Agricultural statistics,
Government of Andhra Pradesh, Hyderabad, 2014.
2. Dutt, Ruddar, Indian Economy, Chand & Company, New Delhi, 2012.
3. Naik, G. and Jain, S. K. Indian agricultural commodity futures markets: A Performance survey,
Economic and Political Weekly, 2002.
4. Qamar Hasan, Subsistence to Market economy - Possibilities of Agricultural Transformation through
Agro Export, Mittal Publications, New Delhi, 2014.
5. Shah, A. and Thomas, S. David and Goliath, Displacing a Primary Market, Journal of Global Financial
Markets, 2012.
6. Statistical Abstract of Andhra Pradesh, Government of Andhra Pradesh, Hyderabad, 2014.
7. Season and Crop Reports, Government of Andhra Pradesh, Hyderabad, 2014.
8. Economic Survey 2014, Ministry of Finance, Government of India, New Delhi.
9. United Nations Report, The Millennium Development Goals Report 2010, United Nations, New
York, 2010.

127
ARTICLE / 20
DEVELOPMENT OF HORTICULTURE SECTOR IN A.P.:AN ANALYSIS
G. Savaraiah & K. Priyanka
ABSTRACT
Over the years, horticulture has emerged as one of the potential agricultural enterprises
in accelerating security, poverty alleviation and employment generation. It offers not only a
wide range of options to the farmers for crop diversification, but also provides ample scope
for sustaining large number of agro-industries which generate huge employment opportunities.
The horticulture sector has contributed significantly to GDP in agriculture (28.5 per cent from
8.5 per cent of the area). With the increasing focus on research and development in the area
of horticulture, the production of horticulture crops has significantly increased across the
country. A golden revolution is in the offing and India has emerged as a leading player in the
global scenario.
Horticulture is the fastest growing sector within agriculture and its economic prosperity
has provoked marked changes in the life styles and consumption habits of the people.
Horticulture development was at very low ebb till the third five year plan and received
meagre attention even thereafter. Though India is the leading product and exporter of species
particularly those of chillies and turmeric, mango citrus, banana and pomegranate. Pickles
and mango pulp are the main prolapsed products that. Andhra Pradesh is one of the leading
states in producing and exporting horticultural products that are exported. The share of High
Value Commodities (HVC) in total value of agricultural output (at constant 1992-93 prices)
has increased from 29.1 per cent in Triennium ending (TE) 1982-83 to 33.1 per cent in TE
ending 2002-03 in Andhra Pradesh. An attempt is made here to review the progress made in
the horticultural development in the state of Andhra Pradesh. Horticulture is an important
segment of agriculture sector started gaining ground in the recent past and is evident from
its consistently growing contribution to the G.S.D.P. Over the years, by offering a wide range
of choices to the farmers for crop diversification and providing opportunities for sustaining
large number of agro-industries, there by promoting ample employment opportunities to semi-
skilled and unskilled labour force, horticulture has emerged as an indispensable part of
agriculture. Horticulture as a sub-sector of agriculture is showing remarkable signs of progress
in Andhra Pradesh.
Professor, Department of Economics, SVU College of Arts, TirupatiResearch Scholar, Department of Economics, SVU College of Arts, Tirupati

128 The Economy of Andhra Pradesh
ARTICLE / 21
AGRICULTURAL LABOUR AND WAGE RATES INANDHRA PRADESH : AN INTER-DISTRICT ANALYSIS
Sivasankar, V & Hemanathan, S
ABSTRACT
The undivided Andhra Pradesh occupied first rank in the proportion of agricultural
labour. The Census of India reported that the proportion of cultivators had declined and the
proportion of agricultural labour had increased. According to 2011 Census, the total workforce
in bifurcated Andhra Pradesh accounted for 46.51 per cent of the total population. Among
total workers, main workers constituted 83.72 per cent while marginal workers accounted for
16.27 per cent of the total workers. The non-workers were 53.49 per cent (2, 64, 16,893).
Among the main workers, cultivators were 15.97 per cent (30, 70,723), agricultural labourer
were 44.50 per cent (85, 57,567), worked in household industry were 2.74 per cent (527857),
and other workers were 36.79 per cent(70,75,020). The present study attempts to analyse the
proportion of agricultural labour in the total inter-district workers with and also the wage rate
of these workers. The study explores wage rates of different agricultural occupations. This
paper is divided into five sections. The second section deals with the sources of data and
methodology. Third section provides an account of the proportion of agricultural labours at
district level. Fourth section presents agricultural wage rates likes’ field labour wage rate,
other agricultural labour wage rate and heads man wage rate. The final section presents
conclusion.
The proportion of agricultural workers in Andhra Pradesh was 60.47 per cent and 39.5
per cent of workers were non-agricultural workers. In the total agricultural workers 15.91 per
cent was for males and females of cultivators and 44.50 per cent was agricultural labours. The
real wage rates of agricultural workers have increased for both in all the districts. The money
wage rates have to a great extent were higher than real wage rate in all operations for both
male and female workers. In the inter-district analysis reveals that the wage disparities have
sustained and gender difference have extended in all operation and all districts of Andhra
Pradesh.
Assistant Professor, Muthurangam Government Arts College (Autonomous), Vellore, Tamil Nadu.Ph.D Research Scholar, Muthurangam Government Arts College (Autonomous), Vellore, Tamil Nadu.

129
ARTICLE / 22
ROLE OF MILLETS IN FOOD SECURITY ANDNUTRITIONAL STATUS IN ANDHRA PRADESH
B. Guna Sekhar & E. Lokanadha Reddy
INTRODUCTION
Food insecurity has been the major concern of food policy in India. The hunger and
food insecurity is the most atrocious form of deprivation in the way of fulfilment of most
basic need of every human being. Every individual has a fundamental right to be free from
hunger and have access to sufficient, safe and nutritious food and its effective utilisation for
an active and healthy life. There should be no place for hunger and food insecurity in a
democratic society. Several policies were initiated by the government from time to time to
increase food security. Public Distribution System is one of the major state policies to eradicate
food insecurity. The Public Distribution System (PDS) is a large-scale food rationing
programme, meant to increase food security at both the national and the household levels.
In Andhra Pradesh, the Public Distribution System occupied a predominant role in
distribution of essential commodities, thorough fair price shops to the public in general and
the vulnerable sections of society in particular. With this scheme PDS became rice centric
since the rice is the predominant commodity under PDS in Andhra Pradesh. Though, other
items like sugar and wheat distributed from the fair price shops, but the share of sugar and
wheat distribution is very nominal and negligible (Chapter, III).
Minor millets are nutritionally comparable or even superior to staple cereals such as rice
and wheat (Gopalan et al., 2004; Geervani and Eggum, 1989). Compared with rice, 100 g of
cooked grain of foxtail millet contains almost twice the amount of protein, finger millet over
38 times the amount of calcium, and little millet more than nine times the amount of iron
(Gopalan et al., 2004). Millets are rich in vitamins, minerals (calcium and iron in particular),
sulphur-containing amino acids and phytochemicals, and hence are often described as ‘nutritious
millets’ (Bala Ravi, 2004) or ‘nutricereals’ (Choudhury, 2009). They also contain high
proportions of non-starchy polysaccharides and dietary fibre. Their slow release of sugar on
Assistant Professor, Department of MBA, Sri Venkateswara College of Engineering and Technology(Autonomous), Andhra Pradesh.Professor of Economics, Department of MBA, Sri Venkateswara College of Engineering and Technology(Autonomous), Andhra Pradesh.

130 The Economy of Andhra Pradesh
ingestion makes them ideal food for diabetic patients, whereas the lack of gluten in their
grains makes them good food for coeliac-affected people (Kang et al., 2008).
Despite their nutritional benefits, tolerance for difficult growing conditions, and ease of
storage, small millets have consistently been neglected. In this paper an attempt has made to
reveal the status of food security and nutrition status in Andhra Pradesh.
IMPLEMENTATION OF NATIONAL FOOD SECURITY ACT (NFSA), 2013
As passed by the Parliament, Government has notified the National Food Security Act,
2013 on 10th September, 2013 with the objective to provide for food and nutritional security
in human life cycle approach, by ensuring access to adequate quantity of quality food at
affordable prices to people to live a life with dignity. The Act provides for coverage of up
to 75 per cent of the rural population and up to 50% of the urban population for receiving
subsidized food grains under Targeted Public Distribution System (TPDS), thus covering
about two-thirds of the population. The eligible persons will be entitled to receive 5 Kgs of
food grains per person per month at subsidized prices of Rs. 3/2/1 per Kg for rice/wheat/
coarse grains. The existing Antyodaya Anna Yojana (AAY) households, which constitute the
poorest of the poor, will continue to receive 35 Kgs. of food grains per household per month.
The Act also has a special focus on the nutritional support to women and children.
Besides meal to pregnant women and lactating mothers during pregnancy and six months
after the child birth, such women will also be entitled to receive maternity benefit of not less
than Rs. 6,000. Children up to 14 years of age will be entitled to nutritious meals as per the
prescribed nutritional standards. In case of non-supply of entitled food grains or meals, the
beneficiaries will receive food security allowance. The Act also contains provisions for setting
up of grievance reddressal mechanism at the District and State levels. Separate provisions
have also been made in the Act for ensuring transparency and accountability.
There is a direct link between nutrition and food diversity. Malnutrition, with its two
constituents of macronutrient (protein energy malnutrition) and micronutrient deficiencies
(also known as hidden hunger), continues to be a major health burden in India. Nationally,
food price increases have affected food consumption trends. For example, the poorest
households have changed the type of cereals consumed of rice and wheat as staple cereals
due to the availability through the Public Distribution System, rather than coarse cereals such
as bajra, ragi, maize and jowar which are rich in micronutrients and minerals (Ramachandran,
2007).
NUTRITIONAL STATUS OF ANDHRA PRADESH
CHILDREN’S NUTRITIONAL STATUS
Forty-three percent of children under age five are stunted, or too short for their age,
which indicates that they have been undernourished for some time. Twelve percent are wasted,

131
or too thin for their height, which may result from inadequate recent food intake or a recent
illness. One third are underweight, which takes into account both chronic and acute under
nutrition.
Even during the first six months of life, when most babies are being breastfed, 21
percent of children are stunted, 18 percent are wasted, and 29 percent are underweight
(Stunted means low height for age, Wasted means low weight for height and Underweight
means low weight for age). Children in rural areas are somewhat more likely to be
undernourished, but even in urban areas, more than one-third (37%) of children suffer from
chronic under-nutrition. Even in the wealthiest households, 28 percent of children are stunted,
7 percent are wasted, and 16 percent are underweight. Girls and boys are about equally likely
to be undernourished.
Children’s nutritional status in Andhra Pradesh has improved slightly since NFHS-2 by
some measures but not by all measures. Children under age three years (the age group for
which nutritional status data are available in NFHS-2) are less likely to be too short for their
age today than they were seven years ago (which means that chronic under-nutrition is less
widespread).They are also less likely to be underweight, but they are slightly more likely to
be too thin for their height, which means that acute under-nutrition is still a major problem
in Andhra Pradesh.
ADULTS’ NUTRITIONAL STATUS
Adults in Andhra Pradesh suffer from a dual burden of malnutrition. In all, 34 percent
of women and 31 percent of men are too thin, but 16 percent of women and 14 percent of
men are overweight or obese. Only 51 percent of women and 56 percent of men are at a
healthy weight for their height. Under-nutrition is particularly serious among the young
(particularly those in the age group 15-19), those in the lower wealth quintiles, and scheduled
tribes.
Sixty-three percent of women in Andhra Pradesh have anaemia, including 39 percent
with mild anaemia, 21 percent with moderate anaemia, and 3 percent that have severe anaemia.
Fifty-nine percent of pregnant women and 73 percent of women who are breastfeeding are
anaemic. The prevalence of anaemia is lower among more educated women and among those
who are in the higher wealth quintiles. However, except for women in Hyderabad, at least
56 percent of women in all of the groups are anaemic (Andhra Pradesh, NFHS-3, 2008).
The National Family Health Survey 2015-16 (NFHS-4), the fourth in the NFHS series,
provides information on population, health and nutrition for India and each State / Union
territory. NFHS-4, for the first time, provides district-level estimates for many important
indicators. The anaemic condition of each district in Andhra Pradesh has shown in the
Table 3.1.
Role of Millets in Food Security • B. GUNA SEKHAR & E. LOKANADHA REDDY

132 The Economy of Andhra Pradesh
Table – 3.1
District-wise Status of Anaemia among Children and Adults (in percentages) in Andhra Pradesh
Sr. No. District Anaemia among Children and Adults (in percentages)
Children Non-pregnant Pregnant All Men age
age 6 -59 age 6-59 women women 15-49
months who months who age 15-49 age 15-49 years years
are anaemic are anaemic years who who are who are
(<11.0 g/dl) (<11.0 g/dl) are anaemic anaemic anaemic
(<11.0 g/dl) (<13.0 g/dl)
Rayalaseema Districts
1. Anantapur 53.0 52.8 * 52.7 22.6
2. Chittoor 46.6 48.4 (58.8) 48.8 20.3
3. Kurnool 54.5 54.6 (51.8) 54.5 26.6
4. Y.S.R. Cuddapah 55.8 57.6 (59.4) 57.7 18.6
Coastal Andhra Pradesh Districts
5. East Godavari 63.1 64.9 (56.2) 64.6 34.3
6. Guntur 68.1 59.0 (33.6) 57.9 24.9
7. Krishna 58.1 59.7 * 59.4 22.6
8. Prakasam 56.3 57.7 (57.9) 57.7 23.4
9. Sri Potti Sriramulu Nellore 50.4 59.1 (59.2) 59.1 41.3
10. Srikakulam 70.6 72.1 * 71.8 29.3
11. Visakhapatnam 64.5 66.6 * 66.4 28.2
12. Vijianagaram 78.7 75.7 * 75.5 44.3
13. West Godavari 55.1 60.3 * 59.9 19.2
Andhra Pradesh 58.6 60.2 52.9 60.0 26.9
Source:Districts and State Fact Sheets, NFHS – 4, 2015-16
Note: ( ) Based on 25-49 unweighted cases
* Percentage not shown; based on fewer than 25 unweighted cases
NUTRITIONAL STATUS AND HEALTH BENEFITS OF MILLETS
“Millets are one of the oldest foods known to humans and possibly the first cereal grain
to be used for domestic purposes”. Millets are small-seeded grasses that are hardy and grow
well in dry zones as rain-fed crops, under marginal conditions of soil fertility and moisture.
Millets are also unique due to their short growing season. They can develop from planted
seeds to mature, ready to harvest plants in as little as 65 days. This is important in heavily
populated areas. When properly stored, whole millets will keep for two or more years
(Michaelraj and Shanmugam, 2013).

133
In the recent years concern for millets has been on the rise within Indian society and
this has, together with substantive work done in the past, yielded a considerable body of
evidence consisting of field experiences and academic literature from non-governmental and
other sources showing the existence of valid linkages between millets, poverty reduction,
malnutrition alleviation and rural development. These linkages are discussed below
MILLETS : ‘MIRACLE GRAINS’
Millets share certain common characteristics which make them socially important crops:
Millets are drought resistant and require few external inputs. They can be grown
under harsh circumstances in arid and semi-arid environments requiring less water
than many other cereals and are often able to cope with poor soils. For this they are
sometimes called ‘miracle grains’ or ‘crops of the future’.
Millets provide food and livelihood security to millions of households, in particular,
to small and marginal farmers and inhabitants of rain fed areas, especially in remote
tribal areas.
Millets are usually cultivated as dual-purpose crops providing both food grain for
human consumption and straw for animals, contributing to economic efficiency in
mixed farming systems. Millets are the staple crops in some rain fed regions.
Numerous varieties of millets exist with differentiated cultivation and taste
characteristics, including hybrids, improved varieties, and local ones. This especially
applies to local varieties which are predominantly conserved on-farm. Millets are
frequently cultivated with other millet varieties, pulses, beans, oilseeds, etc. as part
of the mixed farming system. The rich crop and varietal diversity of millet based
cropping systems foster and enrich agro-biodiversity of their ecosystems.
Millets are C4 carbon sequestrating crops contributing to the reduction of CO2 in
the atmosphere, besides being water efficient. For this they deserve to be cherished.
They may also become entitled for benefits under (international) climate change
mitigation mechanisms like Payment for Environmental Services (PES) schemes.
Paddy, on the contrary, is one of the major contributors to climate change through
methane emissions17 and wheat, a thermally sensitive crop, is vulnerable for reduction
in its cultivation range if average temperatures increase as part of climate change.
Millets have been cultivated for around 3,000 years making them an integral part of
the culture and history of India. References to millets can be found in mythology,
poetry, religious practices, ayurvedic recipes, and in numerous dishes. Millets are not
only food grains; they are still intricately interwoven in the socio-cultural fabric of
numerous regions.
Lignans, an essential phytonutrient present in millet, is very beneficial to the human
body, which act against different types of hormone-dependent cancers, like breast cancer and
Role of Millets in Food Security • B. GUNA SEKHAR & E. LOKANADHA REDDY

134 The Economy of Andhra Pradesh
also help reduce the risk of heart disease. Regular consumption of millet is very beneficial
for postmenopausal women suffering from signs of cardiovascular disease, like high blood
pressure and high cholesterol levels.
A high source of fibre, millet is very beneficial against breast cancer in postmenopausal
women. According to research and recent studies, consumption of millet can help women
combat the occurrence of gallstones, as they are a very high source of insoluble fibre.
This form of cereal grain is very high in phosphorus content, which plays a vital role
in maintaining the cell structure of the human body. The key role of this mineral is that it
helps in the formation of the mineral matrix of the bone and is also an essential component
of ATP (adenosine tri-phosphate), which is the energy currency of the body.
A single cup of millet provides around 24.0% of the body’s daily phosphorus requirement.
This mineral is a very important constituent of nucleic acids, which are the building blocks
of genetic code.
Recent research has indicated that the regular consumption of millet is associated with
reduced risk of type 2 diabetes mellitus. This is mainly due to the fact that whole grains like
millet are a rich source of magnesium, which acts as a co-factor in a number of enzymatic
reactions in the body, regulating the secretion of glucose and insulin.
Magnesium is also beneficial in reducing the frequency of migraine attacks. It is even
very useful for people who are suffering from atherosclerosis and diabetic heart disease. The
nutrition statues has compared with rice in the Table - 4.1.
Table – 4.1
Comparison Chart of Nutrition Levels in Millets with Rice
Millet Type Ca Fe Thiamin Ribo- Niacin Protein Fat (g) Ash (g) Crude Carbs (g) Energy
(mg) (mg) (mg) flavin (mg) (g) fibre (kcal)
(mg) (vitamin (NX (g)
B3) 6.25)
Finger Millet (or)Ragi 350 3.9 0.42 0.19 1.1 7.7 1.5 2.6 3.6 72.6 336
Pearl Millet (or) Bajra 42 11 0.38 0.21 2.8 11.8 4.8 2.2 2.3 67 363
Sorghum (or) Jowar 25 5.4 0.38 0.21 2.8 10.4 3.1 1.6 2 70.7 329
Maize 26 2.7 0.38 0.2 3.6 9.2 4.6 1.2 2.8 73 358
Rice (brown) 33 1.8 0.41 0.04 4.3 7.9 2.7 1.3 1 76 362
Source: Das Pranati, 2008.
CONCLUSION
The most of the Rayalaseema districts have shown better condition in anaemia among
children and adults with that of coastal districts of Andhra Pradesh. Both Vijianagaram and

135
Srikakulam districts are high anaemia among children, women and adults. To overcome the
anaemia conditions, the government and non-government organizations can encourage the
people to consume more finger and pearl millets which account 350 mg of calcium and 11mg
of iron respectively. Comparing with rice, millets are rich in nutrients and micronutrients.
Hence, usage of millets may arrest the malnutrition condition in Andhra Pradesh.
REFERENCES
1. Andhra Pradesh NFHS-3 (2008), National Family Health Survey (NFHS-3), India, 2005-06, Andhra
Pradesh.
2. Das Pranati (2008), ‘Millets for Scientific Research and Food’, Principal Scientist, Department of
Food & Nutrition, Assam Agricultural University, Jorhat.
3. DHAN Foundation (2012), ‘Supporting Millets in India: Policy Review and Suggestions for Action’,
Revalorising Small Millets in Rainfed Regions of South Asia (RESMISA).
4. Districts and State Fact Sheets, NFHS – 4 (2015-16), Ministry of Health and Family Welfare,
Government of India.
5. Michaelraj Stanly Joseph P. and Shanmugam A. (2013), ‘A Study on Millets based Cultivation and
Consumption in India’, International Journal of Marketing, Financial Services & Management Research,
Vol.2, No. 4.
6. Ramachandran P (2007) Nutrition Transition in India 1947-2007, New Delhi: Nutrition Foundation
of India.
Role of Millets in Food Security • B. GUNA SEKHAR & E. LOKANADHA REDDY

136 The Economy of Andhra Pradesh
ARTICLE / 23
AGRICULTURAL CREDIT FLOW IN ANDHRAPRADESH : ACTION PLAN AND STRATEGIES
Subhendu Dutta & C.S. Shylajan
INTRODUCTION
Credit is a catalyst that helps to accelerate the farm and non-farm sector development
of an economy. Investments in farm can generate farm income sustainably when credit is
adequately supported by backward and forward linkages, viz. inputs of production, technology
and services.
“Credit is often a key element in the modernization of agriculture. Not only can
credit remove financial constraint but it also accelerates the adoption of new
technology. Credit facilities are also an integral part of the process of
commercialization of the rural economy. However, no amount of credit even at the
most reasonable rates can guarantee higher productivity or income among the rural
poor, as the success depends upon many factors including the availability of inputs
and services, sound credit policies, well-managed institutions and appropriate delivery
channels” (The World Bank, 1975).
The credit flow to agriculture, more importantly after introduction of financial sector
reforms in early-nineties, increased from Rs. 2,85,146 crore during the 9th Plan [1997-2002]
to Rs.6,91,739 crore [243%] during the 10th Plan [2002-07]. Credit disbursement during the
11th Plan [2007-12] further increased to Rs.19, 20,400 crore [277%]. As against annual
average disbursement of Rs. 57,029 crore, Rs.1,38,348 crore and Rs.3,84,080 crore during
previous three plans the disbursement during 2012-13 alone was Rs. 6,07,375 crore, exhibiting
significantly high growth of credit year after year. However, studies have brought up some
issues related to flow of agricultural credit in India. First, improvement of crop productivity
and output has been not so satisfactory; second, there has been a significant disparity in the
flow of credit among States; third, there are significant imbalance between short-term and
term loans and also between credit disbursed to agriculture and allied activities; and fourth,
institutional credit is not easy to access by small, marginal and tenant farmers.
IBS, Hyderabad, IFHE (Deemed to be University), Hyderabad.IBS, Hyderabad, IFHE (Deemed to be University), Hyderabad

137
The present paper evaluates the status relating to agricultural credit flow in Andhra
Pradesh. Next section deals with an overview of credit flow in India. Section 3 deals with
the present.
AGRICULTURAL CREDIT FLOW : STATUS AND ACTION PLAN BY THE
GOVERNMENT IN ANDHRA PRADESH
The Annual Credit Plan 2013-14 and 2015-16 for the State was Rs.47016.95 crore and
Rs. 65,272 crore respectively towards Agriculture Credit. In 2013-14, Rs.49974.46 crore
(105%) was disbursed whereas in 2015-16, it was Rs.40, 258.45 crore (62%) under Agricultural
credit which is lower by 43%. In 2013-14, an amount of Rs. 37058.08 crore was disbursed
under crop loans as against the target of Rs. 35548.65 crore (104.25%) and an amount of Rs.
12716.38 crore disbursed as against the target of Rs.11468.30 crore (110.88%) under Agriculture
Term Loans including Allied activities. And in 2015-16, an amount of Rs.31,978.82 crore
(67%) was disbursed under crop loans (short term loans) as against the target of Rs. 48,066
crore and an amount of Rs.8279.63 (48%) crore was disbursed as against the target of
Rs.17205 crore under Agriculture term loans including allied activities. Interest free Crop
loans to all farmers up to Rs.1.00 lakh and Pavala Vaddi for crop loans ranging from Rs. 1.00
lakh to 3.00 Lakh, if repaid in time. Beginning with Rabi season of 2011 in Nov, 2011. an
amount of Rs. 280 crores was released under the Vaddi Leni Runalu and an amount of Rs.
222.90 crores was settled with 22.50 lakh farmers. The Annual Credit Plan 2014-15 for the
State was Rs.56019 crore towards Agriculture Credit. Rs.39938 crore (71%) was disbursed
under Agricultural credit. An amount of Rs. 29658 crore (71%) was disbursed under crop
loans as against the target of Rs. 41977 crore and an amount of Rs.10280 (73%) crore
disbursed as against the target of Rs.14041 crore under agriculture term loans including allied
activities (see Table 2).
To facilitate financing land licensed cultivators (tenant farmers), the Government passed
an act- “Andhra Pradesh land licensed cultivators Act No 18 of 2011’’ so that land licensed
cultivators (tenant farmers) get loan and other benefits. During 2014-15, Loan Eligibility
Cards (LECs) were issued to 3, 39,214 (Fresh & Renewal) Land licensed cultivators by the
Revenue department. Amounts of Rs. 85.39 crore have been issued under Crop loans 39,403
LEC holders. During 2015-16, the Revenue Department has issued Loan Eligibility Cards
(LECs) to 4, 55,914 (Fresh: 1, 88,318 and Renewal: 2, 67,596) Land Licensed cultivators
(Tenant farmers) in the state. An amount of Rs.146.88 crore has been given to 70,013 LEC
holders so far. District-wise details of loan eligibility cards and sanctioned amounts are given
in Table 3.
To mitigate the financial burden of the farmers, the Government has announced “Rythu
Sri” (vaddileni panta runalu/pavala vaddi) scheme and has announced the Interest free crop
loans to all the farmers up to Rs. 1.00 lakh and pavala vaddi for crop loans from Rs.1.00 lakh
to Rs. 3.00 lakhs if repaid in time (maximum period of one year). During 2014-15, an amount
Agriculture Credit Flow in Andhra Pradesh • SUBHENDU DUTTA & C.S. SHYLAJAN

138 The Economy of Andhra Pradesh
of Rs.44.31 crore was settled under vaddileni runalu and Rs. 1.02 crore was settled under
pavala vaddi. During 2015-16, an amount of Rs.156.80 crore was released under the vaddileni
runalu as against the allocation of Rs.172.00 crore. An amount of Rs.9.50 crore was released
under the pavala vaddi as against the allocation of Rs.10.00 crore. An amount of Rs.527.65
crore have been settled to 0.74 lakh farmers accounts (as on Sept. 2015) under vaddi leni
runalu and Rs.10.40 lakh have been settled to 0.02 lakh farmers’ accounts under pavala vaddi,
and the settlement of claims is under progress.
Table – 2
Disbursement of Agriculture Credit as on 30th September 2015
(Amount in Rs Crore.)
Sl.No District Short term Agricultural term Total Agriculture % of
production loans loans including loans Achievement
Infrastructure and disbursed
Ancillary Activities
1 Srikakulam 1171.22 329.89 1501.11 49.96
2 Vizianagaram 973.97 176.96 1150.93 56.03
3 Visakhapatanm 1293.04 643.01 1936.05 88.41
4 East Godavari 3855.86 1089.48 4945.34 56.44
5 West Godavari 4222.03 1116.48 5338.51 61.54
6 Krishna 2230.27 788.98 3019.25 49.68
7 Guntur 4740.06 923.76 5663.82 62.73
8 Prakasam 2232.12 692.93 2925.05 64.57
9 SPS Nellore 1498.58 634.05 2132.63 55.46
10 Y.S.R 1844.60 502.02 2346.62 62.86
11 Kurnool 2246.38 416.82 2663.20 58.83
12 Ananthapuramu 3386.10 499.74 3885.84 89.13
13 Chittoor 2284.59 465.51 2750.10 61.32
Total 31978.82 8279.63 40258.45 61.68
Source: Finance (Institutional Finance) Department
Under ‘Agricultural Debt Redemption Scheme’, an amount of Rs.7,433 crores has been
released in all the districts in 3 phases and the number of accounts redeemed is 54.06 lakh
accounts. A total no. of 35.15 lakh farmer families were benefitted under this programme. To
facilitate the reddressal of the grievances of the farmers who have not received the benefit
due to errors, mistakes committed by the Banks, data entry errors etc., the grievance reddressal
cells have been constituted at State/ District/Revenue division level. In the month of September
2015, “Rythukosam Chandranna” programmes were conducted successfully in all the

139
districts.During the programme wide publicity was given on Debt Redemption and exhibited
stalls of agriculture and allied sectors to impart knowledge of advanced technology to the
farmers. The farmer interaction programmes with the resource persons were also organized.
The details of agricultural credit disbursed are presented in Table-2.
The data in Table-2 show that the government could disburse 62.0 per cent of the total
amount allocated to finance the farmers as on September-2015. The percentage of achievement
was found highest in drought-prone mandal – Ananthapuramu – which was at 89.13 per cent,
followed by Visakhapatnam (88.41 per cent) and Prakasam (64.6 per cent) districts.
The Government has been showing special interest to finance the licensed cultivators
also. The Government has issued loan eligibility cards to licensed cultivators so as to finance
the needy licensed cultivators. The number of cards issued and crops loans sanctioned are
presented in Table-3.
Table – 3
Loan and Other Eligibility Cards issued and credit extended to licensed cultivators during 2015-16
(up to Sep, 2015)
Sl.No District No. of LECs issued No. of licensed cultivators
sanctioned crop loans
Renewal of New LECs Total Cultivators Amount
old LECs (Rs in Cr)
1 Srikakulam 7846 7644 15490 670 2.01
2 Vizianagaram 10830 4997 15827 707 0.82
3 Visakhapatanm 5043 9921 14964 1498 2.91
4 East Godavari 84288 16833 101121 39887 81.84
5 West Godavari 110650 112603 223253 23067 43.93
6 Krishna 6037 9369 15406 1024 2.94
7 Guntur 3210 7630 10840 653 3.26
8 Prakasam 13996 0 13996 689 2.28
9 Nellore 6364 1971 8335 202 1.05
10 Kurnool 12282 10179 22461 10 0.07
11 Ananthapuramu 417 3024 3441 650 1.99
12 Kadapa 4158 1186 5344 715 2.12
13 Chittoor 2475 2961 5436 241 1.66
Total 267596 188318 455914 70013 146.88
Source: Agriculture Department
Agriculture Credit Flow in Andhra Pradesh • SUBHENDU DUTTA & C.S. SHYLAJAN

140 The Economy of Andhra Pradesh
The Government of Andhra Pradesh has issued 4.6 lakh loan and other eligibility cards
to licensed cultivators which comprise the renewal of 2.7 lakh cards. Similarly 70013 licensed
cultivators were sanctioned the crop loans to the turn of Rs. 146.88 crore as on September,
2015. The issue of eligibility cards was highest in West and East Godavari districts and the
amount of crop loans was also highest in these districts.
The comprehensive Credit Plan of the government prepared for each district for the year
2015-16 to facilitate pragmatic resource-based credit planning process at micro level has the
following features. The objective of the Plan is to provide timely Agricultural credit to
farmers at lesser interest rate.
It is proposed to issue Rs. 69548.83 crore towards agriculture credit for the year 2015-
16. For Crop loans, both Kharif and Rabi, the target was Rs. 50979.32 crore (73%); and for
Agriculture Term Loans including Allied to Agriculture, the target was Rs. 18569.51 crore
(27%).
The Andhra Pradesh government promulgated an Act in 2011 to provide loan and other
facilities eligibility card to the farmers, who raise crops with express or implied permission
of the owners, enabling them to access credit from the financial institutions and to claim
benefits of input subsidy, crop Insurance, compensation for damage of Crops etc. During
2015-16, it was proposed to facilitate institutional credit to 3, 39,214 land licensed cultivators
who have been issued Loan Eligibility Cards (LEC) by the Revenue Department.
During 2015-16, it is proposed to enrol and facilitate bank credit to new non- loaner
farmers @150 per each bank branch. It is proposed to facilitate institutional credit to the
about 16302 functional Rythu Mithra Groups in the Andhra Pradesh.
THE KISAN CREDIT CARD
The Kisan Credit Card has emerged as an innovative credit delivery mechanism to meet
the production credit requirements of the farmers in a timely and hassle free manner. The
banks should adopt the scheme by the vast institutional credit frame work. Term loans should
be sanctioned to farmers on Farm Machinery, to overcome the labour problem.
Another step the government has taken is the ‘Agricultural Debt Redemption scheme’
to Farmers, in order to give life support to the distressed farmers. The Crop Loans and
Agriculture gold loans disbursed for crop purposes only including the loans converted to
MTL due to calamities, up to 31.12.2013 and outstanding (including interest) as on 31-12-
2013, will be covered under the scheme. Loans which were outstanding as on 31.12.2013
would be eligible for redemption even if they were subsequently repaid to the bank/cooperative.
The government has released an amount of Rs. 7069.67 crores during 2014-15. For the year
2015-16, an amount of Rs. 4300.00 crores is allocated under Non Plan to benefit approximately
40.07 lakh farmers in the state.

141
The Government has announced the Pavala Vaddi scheme to the farmers who have
availed crop loans from Rs. 1.00 lakh to Rs. 3.00 lakhs and repaid within due date (maximum
up to 1 year). The farmer has to repay 3% interest amount on crop loans to the banks. During
2015-16, an amount of Rs. 1000.00 lakhs is allocated under Normal State Plan towards
Pavala Vaddi scheme on crop loans from Rs. 1.00 lakh to Rs. 3.00 lakhs.
The Government has also announced the Interest free Crop loans called Vaddi Leni
Runalu scheme to all the farmers up to Rs. 1.00 lakh and Pavala Vaddi for crop loans from
Rs. 1.00 lakh to 3.00 lakhs, if repaid in time from Rabi 2011. The interest subsidy will be
calculated on the crop loan amount from the date of its disbursement/drawl up to the date of
actual repayment by the farmer or up to the due date of the loan as fixed by the banks,
whichever is earlier, subject to a maximum period of one year. During 2015-16, an amount
of Rs. 17200.00 lakhs is allocated under Non Plan towards this scheme. The Annexure Tables
provides district wise details of agriculture credit for 2015-16, allocation for debt redemption
scheme etc.
STRATEGIES TO BE ADOPTED TO ACHIEVE THE TARGETS
The important strategies that followed to achieve the targets are given as under:
1. Banks may sanction crop loans on top priority before commencement of the cropping
season.
2. Banks may issue crop loans strictly adhering to the scale of finance fixed by the
District level Technical Committee (DLTC), and to prominently display scales of
finance in their notice boards.
3. LEC card holders should also be covered under loaning on par with regular farmers
on production of Loan and other Eligibility Card, either single or in a group mode
of Joint Liability Group (JLG).
4. Banks may extend finance to LEC holders under Joint Liability Group model financing
for the purposes other than crop loans, wherever the owners have already availed
crop loans to the full eligible extent of their eligibility.
5. Revenue Department may renew the Loan and Other Eligibility cards already issued
and issue fresh LECs to the Land Licensed cultivators.
6. Bankers should participate in Farmers meets and Conduct of credit camps in the
villages to create awareness among farmers regarding institutional finance.
7. Agriculture Department will identify the new non- loaner farmers and tenant farmers
and mobilize them to banks during “Polam Pilusthondi” programme.
8. Creating awareness among the farmers about the advantages of timely repayment of
loans by the farmers to be eligible for 0% interest and Pavala Vaddi on crop loans.
Wide publicity is also to be given among farmers about sanction for crop loans, Scale
of Finance, the cutoff date fixed and Consumption loans etc.
Agriculture Credit Flow in Andhra Pradesh • SUBHENDU DUTTA & C.S. SHYLAJAN

142 The Economy of Andhra Pradesh
9. Banks should take up financing LECs /RMGs/JLGs in a big way to cater to the needs
of Small and Marginal farmers, Tenant farmers and oral lessees.
CONCLUSIONS
Besides the action plan and strategies the government of Andhra Pradesh has planned,
policy should address to create enabling environment that can significantly enhance CREDIT
ABSORPTION CAPACITY OF THE GEOGRAPHICAL AREAS AND FARMERS IN
EACH VILLAGE. INVESTMENT SHOULD GO INTO THE CREATION OF rural
infrastructure to improve farm fuel/energy, transport, communication, storage, processing and
marketing facilities in rural areas; expanding irrigation and reclamation of wastelands;
integration of agricultural education, research and extension services and strengthening of
capacity-building of farmers to bridge the huge yield gap between the potential yields and
actual yields at field level in rain-fed and irrigated farming systems; development and use of
genetically engineered seeds, micro-irrigation system, greenhouse technology, integrated nutrient
and pest management technique, computer-based modelling to track disease and pest incidence;
expanding farm mechanization program.
Steps should be taken to transform a negative SUBSIDY REGIME into a ‘CAPITAL-
INTENSIVE POSITIVE AGRICULTURAL MARKETING SERVICE REGIME’ and stimulate
production to generate marketable surplus. Attractive schemes and incentives should be provided
to make agriculture activity a remunerative enterprise. Solutions to minimize problems of
floods, drought and cyclones should be taken. Bank’s lending to indirect agriculture exceeding
4.5% of its net bank credit should be allowed for financing entrepreneurs who can provide
contractual services to farmers, more particularly small & medium ones in respect of facilities/
services. Banks need to design loan & other financial products to match farmers’ needs. There
is no evidence of a link between the growth of agricultural credit and the credit subsidy
introduced in 2006-07 in the country. Generalized loan waivers constitute a moral hazard and
impair the system as far as agricultural credit is concerned. So such steps are to be taken very
cautiously.
REFERENCES
1. Agricultural Statistics at a Glance 2014, Government of India, Ministry of Agriculture, Oxford
University Press, 2015.
2. Dar, Javid Ahmad (2015). Trend and Growth of Flow of Credit to Agriculture after 1991 in India,
IOSR Journal Of Humanities And Social Science (IOSR-JHSS) Volume 20, Issue 1, Ver. IV), PP 51-
61.
3. Godara, Ratan Lal; Singh, Partap &Singla, Sanjay (2014).Agriculture Credit in India: An Analytical
Study, International Journal of Latest Trends in Engineering and Technology, Vol. 3 Issue 3 January
2014.

143
4. Kumar, Anjani, Singh, K.M. and Sinha, Shradhajali (2010). Institutional Credit to Agriculture Sector
in India: Status, Performance and Determinants, Agricultural Economics Research Review, Vol. 23
July-December 2010 pp 253-264.
5. Narayanan, Sudha (2015). The Productivity of Agricultural Credit in India, WP-2015-01, http://
www.igidr.ac.in/pdf/publication/WP-2015-01.pdf.
6. Pal, Debdatta (2015). Linking Credit with other Markets: A Review of the Issues in Rural Economies,
Forum for Development Studies, Vol. 42, No. 1, 159–178, http://dx.doi.org/10.1080/08039410.
2014.974666.
7. Raithu Kosam Primary Sector Development: Status, Strategy and Action Plan (2015), Government
of Andhra Pradesh.
8. Socio-Economic Survey-2015-16, Planning Department, Government of Andhra Pradesh
Agriculture Credit Flow in Andhra Pradesh • SUBHENDU DUTTA & C.S. SHYLAJAN

144 The Economy of Andhra Pradesh
ANNEXURE TABLES
District wise targets proposed for sanction of loans to LEC holders for the year 2015

145Agriculture Credit Flow in Andhra Pradesh • SUBHENDU DUTTA & C.S. SHYLAJAN

146 The Economy of Andhra Pradesh

147Agriculture Credit Flow in Andhra Pradesh • SUBHENDU DUTTA & C.S. SHYLAJAN

148 The Economy of Andhra Pradesh
ARTICLE / 24
DAIRY DEVELOPMENT IN ANDHRA PRADESH:A STUDY OF THE MILK COOPERATIVE SOCIETIES
IN NELLORE DISTRICT
D. Krishnamoorthy & A. Mallappa
Indian economy is basically an agricultural economy. About 69 per cent of India’s
population is living in rural India. For those who are living in rural India, agriculture is the
main occupation. Among the allied activities of agriculture, dairying has assumed greater
importance in India, due to its simple nature in generating additional employment and income
to millions of rural households. Dairying has been practiced as an allied activity since time
immemorial. India accounts for one-sixth of cattle and half-of buffalo population of the
world. The art of rearing of cows and buffaloes for milk is known as dairying. Milk is an
important contributor to India’s agricultural output. Today, it is India’s largest ‘crop’ in terms
of its output value, surpassing even major cereals like rice and wheat. India is the largest
producer of milk in the world. According to Economic Survey 2015-16, the production of
milk was estimated at 146.3 million tonnes in 2014-15 as compared to 137.69 million tonnes
during 2013-14 registering a growth of 6.26 per cent. The per capita availability of milk in
India has increased from 176 grams per day in 1990-91 to 322 grams per day by 2014-15.
It is more than the world average of 294 grams per day during 2013. The country has now
achieved self reliance in milk production and is geared for the export of substantial value
added milk products beyond its seashores. It has not only conserved the valuable foreign
exchange by almost eliminating the import of milk and milk products but also has started
exporting these products to African and Middle-East countries. The success of dairy industry
in India could, mainly, be attributed to the integrated cooperative system of milk collection,
transportation, processing and distribution under AMUL pattern. It should be noted that in
December 1946, Tribhuvandas Patel and Vallabhai Patel and others have formed Anand Milk
Union Limited (AMUL) in Gujarat for doing milk business from the collected milk of that
area. Dr. Varghese Kurien, the founder Chairman of the Gujarat Milk Marketing Federation
for more than 30 years is credited with the success of Amul. The Anand pattern is a system
that is collectively owned, operated and controlled by farmers. It ensures a fair price to the
Professor, Dept. of Economics, SV University, Tirupati.Professor, Dept. of MBA, Sri Venkateswara College of Engineering, Vidyanagar, Bengaluru, Karnataka.

149
farmers and high quality milk and dairy products to the consumers. It has been transplanted
with success in some Asian countries such as Bangladesh, Sri Lanka, China and in other
countries. Also the experience of Anand pattern village milk producers’ cooperatives has been
replicated by many states in India to suit their needs and priorities. The National Dairy
Development Board (NDDB) sphere heads the task of facilitating the formation of milk
cooperatives in India. In India, milk is processed and marketed by 170 Milk Producers’ Co-
operative Unions and 15 State Cooperative Milk Marketing Federations. Over the years,
brands created by cooperatives have become synonymous with quality and value. Gujarat
state tops high in milk procurement followed by Karnataka, Maharastra, Tamil Nadu and
Andhra Pradesh. One of the successful milk cooperative societies in India is Nellore District
Milk Producers’ Cooperative Limited. In this paper, an attempt is made to analyse the
functioning of the milk cooperative societies under Nellore District Milk Producers’ Cooperative
Limited in the three revenue divisions, viz., Kavali, Nellore and Gudur in terms of various
indicators.
OBJECTIVES AND METHODOLOGY OF THE STUDY
The following are the specific objectives of the study:
i. To study the growth and the functioning of the village level milk producers Cooperative
Societies in Nellore district of Andhra Pradesh;
ii. To analyze the problems that these societies are now facing; and
iii. To offer feasible suggestions for improving the performance of these societies.
The study is based on multi-stage random sampling technique. In the first stage all the
three revenue divisions in Nellore district viz., Nellore, Gudur and Kavali were taken up for
the study. From each revenue division, two mandals were selected using Simple Random
Sampling without Replacement. From each selected mandal, all the villages having Cooperative
Milk Societies were listed out and from out of them three villages having Cooperative Milk
Societies were selected using probability proportional to size (PPS) sampling technique. From
each village one milk cooperative society was selected. On the whole, in Nellore district,
from the three revenue divisions (3 x 2 mandals = 6 mandals) from 6 mandals (6 x 3 villages
=) 18 villages and 18 x 1 = 18 milk cooperative societies were selected for the study. The
period data collection related to the year 2014. The collected data were analysed using simple
two-way tables, descriptive statistical measures like mean, standard deviation, coefficient of
variation and compound growth rate that employs the semi-log function.
GROWTH OF MILK SOCIETIES
Table-1 furnishes the growth of total members of the village level milk societies in the
three revenue divisions of Nellore district. The relevant statistical data has been collected
from the year 2004 to 2013. A cursory glance at the table indicates that in Kavali revenue
Dairy Development in Andhra Pradesh • D. KRISHNAMOORTHY & A. MALLAPPA

150 The Economy of Andhra Pradesh
division, there has been a deceleration in the growth of members from 610 in the year 2004
to 240 in the year 2013. The largest decline of -34.25 per cent seemed to have occurred in
the year 2013 as compared to the previous year 2012. The annual mean (average) level of
membership in Kavali division was 442.90 with a standard deviation value of 114.05. The
variation in the annual membership as indicated by the coefficient of variation (CV) was
considerably high at 25.75 per cent in Kavali revenue division. On the whole, the membership
in the milk cooperative societies in Kavali revenue division registered an annual negative
compound growth of -8.00 per cent which is statistically significant at one per cent probability
level as could be seen from the computed t-value of 10.98.
Table – 1
Growth of Cooperative Milk Societies in the three Revenue Divisions of Nellore District
Years No. of Members Year-on-year annual change (%)
Kavali Nellore Gudur Col 2 Col 3 Col 4
Division Division Division
2004 610 485 300 - - -
2005 586 538 335 -3.93 10.93 11.67
2006 553 560 375 -5.63 4.09 11.94
2007 465 485 399 -15.91 -13.39 6.40
2008 441 523 423 -5.16 7.84 6.02
2009 404 555 409 -8.39 6.12 -3.31
2010 385 459 519 -4.70 -17.30 26.89
2011 380 650 588 -1.30 41.61 13.29
2012 365 695 665 -3.95 6.92 13.10
2013 240 573 770 -34.25 -17.55 15.79
Mean 442.90 552.30 478.30
SD 114.05 73.96 153.04
CV 25.75 13.39 32.00
CGR -8.00 2.30 9.80
t-value 10.976** 1.959@ 8.932**
Note : **significant at 1 per cent level; @-Not significant
Source: Filed Survey
In Nellore Revenue division, the total number of members in milk cooperative societies
seemed to have increased moderately from 485 in the year 2004 to 573 in the year 2013. The
average number of members per year during the ten year period from 2004 to 2013 in Nellore
revenue division was 552.30 that were relatively higher as compared to the other two revenue

151
divisions of Kavali (442.90) and Gudur (478.30). At the same time, the fluctuations in the
annual membership in the cooperative milk societies in Nellore division both in absolute
terms (in terms of Standard Deviation at 73.96) and in relative terms (in terms of coefficient
of variation-CV at 13.39 per cent) were very low as compared to the other two revenue
divisions in Nellore district. On the whole, the membership in the village level milk societies
in Nellore division registered a moderate positive growth of 2.30 per cent per annum. The
growth, however, is not statistically significant as could be observed from the computed t-
value of 1.96.
As compared to Kavali and Nellore revenue divisions, the growth of membership in
cooperative milk societies of Gudur revenue division is highly impressive and statistically
significant. As could be observed from the table, the number of members in milk societies
in Gudur revenue division soared from a low base of 300 in the year 2004 to a staggeringly
high level of 770 in the year 2013. The average (mean) level of yearly membership in the
milk societies of Gudur revenue division has been registered at 478.30 for the period from
2004 to 2013. But the fluctuations in the average level of membership as indicated by
standard deviation (153.04) and Coefficient of variation (32 per cent) were higher in Gudur
revenue division as compared to the other two revenue divisions (25.75 per cent in Kavali
and 13.39 per cent in Nellore Nellore divisions).
In short, the growth of membership in the milk cooperative societies in the Gudur
revenue division (in terms of compound growth rate) has been positive and very high at 9.80
per cent per annum. The growth rate is also statistically significant at one per cent probability
level as could be observed from the t-values.
MILK PROCUREMENT
Milk procurement depends upon several factors. Firstly, the milk procurement depends
upon the seasons. During the rainy and winter seasons when the plenty of green fodder is
available for the cattle, milk will be available in large quantities and hence milk procurement
will also be high. This season is called flesh season. On the other hand, during summer
season, there will be shortage of green fodder and hence, milk availability will also be less.
Consequently, the milk procurement from the farmers will also be less. This season is called
‘lean’ season. The farmers respondents have given average milk procurement from them
taking into account both the flesh and lean seasons. Table – 2 incorporates the milk society
wise milk procurement in Nellore district. A cursory glance at the table indicates that the total
milk procurement per day by all the 18 Milk societies aggregated to 4932 liters in Nellore
District. The average milk procurement per society amounted to 274 liters per day. Among
the three revenue divisions in Nellore district, the total milk procurement seemed to have
been very high at 2230 liters per day in Gudur revenue division followed by Kavali revenue
division at 1370 liters and Nellore revenue division at 1332 liters per day. The average milk
procurement per day also varied in the same order in the three revenue divisions of Nellore
Dairy Development in Andhra Pradesh • D. KRISHNAMOORTHY & A. MALLAPPA
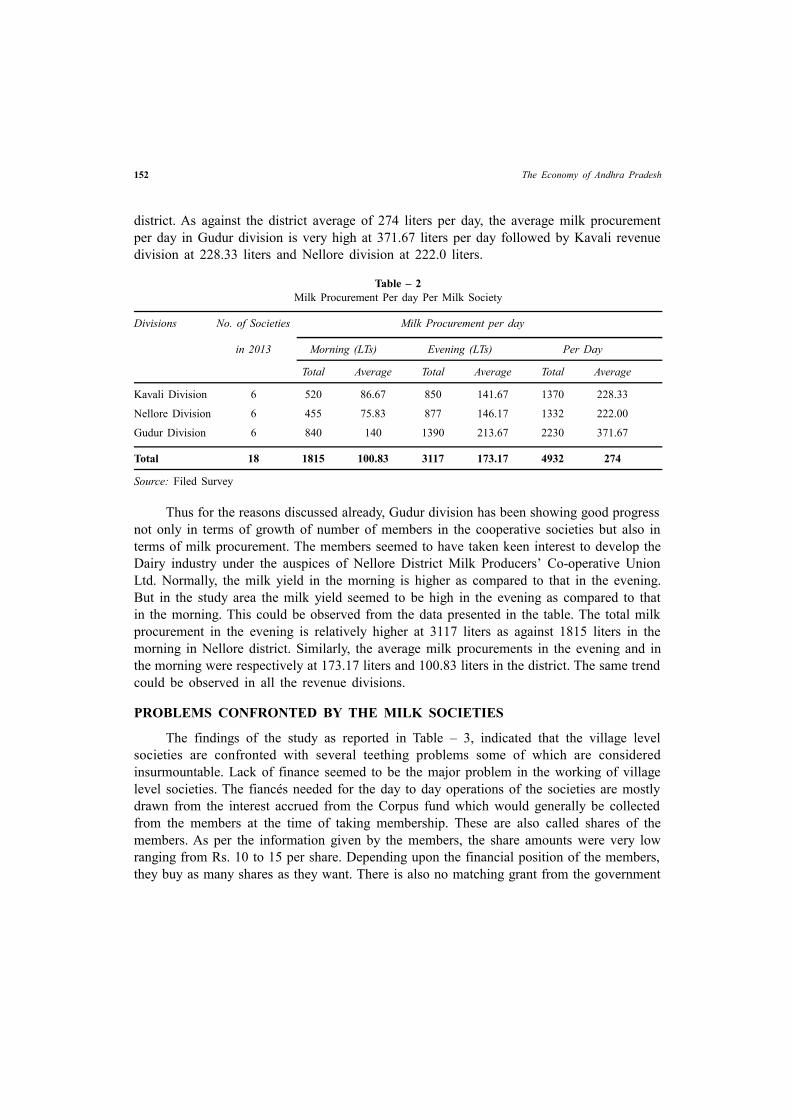
152 The Economy of Andhra Pradesh
district. As against the district average of 274 liters per day, the average milk procurement
per day in Gudur division is very high at 371.67 liters per day followed by Kavali revenue
division at 228.33 liters and Nellore division at 222.0 liters.
Table – 2
Milk Procurement Per day Per Milk Society
Divisions No. of Societies Milk Procurement per day
in 2013 Morning (LTs) Evening (LTs) Per Day
Total Average Total Average Total Average
Kavali Division 6 520 86.67 850 141.67 1370 228.33
Nellore Division 6 455 75.83 877 146.17 1332 222.00
Gudur Division 6 840 140 1390 213.67 2230 371.67
Total 18 1815 100.83 3117 173.17 4932 274
Source: Filed Survey
Thus for the reasons discussed already, Gudur division has been showing good progress
not only in terms of growth of number of members in the cooperative societies but also in
terms of milk procurement. The members seemed to have taken keen interest to develop the
Dairy industry under the auspices of Nellore District Milk Producers’ Co-operative Union
Ltd. Normally, the milk yield in the morning is higher as compared to that in the evening.
But in the study area the milk yield seemed to be high in the evening as compared to that
in the morning. This could be observed from the data presented in the table. The total milk
procurement in the evening is relatively higher at 3117 liters as against 1815 liters in the
morning in Nellore district. Similarly, the average milk procurements in the evening and in
the morning were respectively at 173.17 liters and 100.83 liters in the district. The same trend
could be observed in all the revenue divisions.
PROBLEMS CONFRONTED BY THE MILK SOCIETIES
The findings of the study as reported in Table – 3, indicated that the village level
societies are confronted with several teething problems some of which are considered
insurmountable. Lack of finance seemed to be the major problem in the working of village
level societies. The fiancés needed for the day to day operations of the societies are mostly
drawn from the interest accrued from the Corpus fund which would generally be collected
from the members at the time of taking membership. These are also called shares of the
members. As per the information given by the members, the share amounts were very low
ranging from Rs. 10 to 15 per share. Depending upon the financial position of the members,
they buy as many shares as they want. There is also no matching grant from the government

153
to strengthen the financial position of the societies. Hence, all the 18 sample societies seemed
to have been confronted with the problem of lack of finance.
Another important problem confronted by the members is irregular supply of inputs to
the members. As noted already, the societies supply feed and ground nut cake to the members.
Due to inadequate finances, some of the Societies are not in a position to procure the inputs
and supply the same to the members.
Another important problem emanated from the analysis is lack of support from the
district organization. Three societies from Kavali revenue division, four societies from Nellore
revenue division and 3 societies from Gudur revenue division expressed dissatisfaction over
the inadequate support received from the district level organization viz., Nellore District Milk
Producers’ Cooperative Union Ltd. The major areas of concern were inadequate and untimely
supply of inputs, absence of financial support to extend loans to the needy members, delays
in providing technical and veterinary services to the members etc.
It was also brought to the notice of the researcher that there was no cooperation among
the members on several aspects. In some villages, group politics and domination by a handful
of members seemed to have been affecting the proper functioning of the milk cooperative
societies in the district. As could be observed from the table, the problem seemed to be very
high in Kavali revenue division where four out of six unions were confronted with this
problem. While two societies seemed to have been affected with the problem of lack of
cooperation among the members in Nellore division, one society is stated to have been
affected with this problem in Gudur revenue division.
The members also do not supply the prescribed quantities of milk regularly. Occasionally
on some pre-text such as ill health, out of station, arrival of guests etc., the members reduce
the quantity of milk supplied or do not supply the milk altogether. Sometimes, the private
milk dairies lure the milk suppliers by providing advance to them in needy times and get the
milk supply diverted to them. As a result, there are fluctuations in the quantity of milk
procured and supplied to the chilling centers.
Several private Dairies in the district have sprung up in the district putting cut throat
competition to the Nellore Dairy. These include Dodla Dairy, Sangam Dairy, Heritage Dairy,
Mother’s Dairy, Arogya Milk etc. These private dairies offer several concessions and liberal
financial facilities to the members and lure the members to supply milk to these dairies.
Consequently, the Nellore Cooperative Dairy has been facing several problems. Out of six
sample societies in each of the three revenue divisions, 5 societies in Kavali Revenue division,
4 societies in Nellore Revenue division and 3 societies in Gudur Revenue division were
facing stiff competition from the private dairy units.
Political interference, particularly the local political leaders, in the affairs of the
management of the milk cooperative society is also hindering the harmonious functioning of
the village level Milk Cooperative Societies in Nellore district. The political interference
Dairy Development in Andhra Pradesh • D. KRISHNAMOORTHY & A. MALLAPPA

154 The Economy of Andhra Pradesh
seemed to be very high in the case of distribution of inputs to the members, in the case of
allotment of shares of the society, in the case of election of the president, secretaries and other
executive members of the society. While four societies in Nellore revenue division have been
affected by undue interference by the political leaders, three societies in Kavali revenue
division and two societies in Gudur revenue division have been affected by the political
interference.
Table – 3
Problems in the Management of Village-level Societies
S. No. Problems Kavali Division Nellore Division Gudur Division
1. Lack of Finance 6 6 6
2. Irregular supply of Inputs 2 3 2
3. Lack of Support from district Organization 3 4 3
4. Lack of Co-operation among the members 4 2 1
5. Irregular supplies of milk 3 2 2
6. Non availability of loans from the banks 4 3 3
7. Competition from private Dairies 5 4 3
8. Political interference 3 4 2
9. Delay in taking decisions 2 3 3
10 Delay in the transfer of assets from APCS to MACS 4 5 4
Source: Filed Survey
Due to undue political interference, inordinate delay seemed to have been taking place
in taking several decisions relating to the supply of inputs, recommending loans to the
members, payment of money to the members etc. Two societies in Kavali revenue division,
three societies each in Nellore and Gudur revenue divisions seemed to have been suffering
from the problem of inordinate delay in taking right decisions.
Another important problem being faced by the cooperative milk societies in Nellore
district is the delay in the transfer of assets from the earlier organization to the present
organization. Earlier the Cooperative milk societies in Nellore district were functioning under
the Andhra Pradesh Cooperative Societies Act of 1964. However, in the year 1995 the Andhra
Pradesh Mutually Aided Cooperative Societies Act came into existence. Nearly 3120 societies
in the undivided Andhra Pradesh were converted from the A.P.C.S Act 1964 to APMACS Act
1995 and 26, 958 were new registrations under the APMACS Act 1995. Nellore Milk Union
was one among the societies which were converted from the old Act to the new Act. However,
the assets of the old societies were not transferred to the new society in several villages. As
could be observed from the table out of the total 18 societies in Nellore district, assets have
not been transferred in the case of 5 societies in Nellore revenue division, 4 revenue divisions
from each of Kavali and Gudur revenue divisions.
155
CONCLUDING OBSERVATIONS AND SUGGESTIONS
Dairying is an important allied activity of agriculture, which provides the needed support
to the small and marginal farmers to augment their employment and income levels. Since, the
cooperative structure provides the much-needed impetus to them to undertake the activity on
profitable line, the institution of milk cooperative societies should be strengthened. The
needed finances should be extended to the members based on collective security. The political
interference should be kept at the low ebb. The members should resolve their differences with
mutual understanding and give and take policy. For the sake of short-term gains from the
private vendors, the members should not ransack and destroy the institution of the cooperative
societies, which provide eternal benefits to the members as well as to the consumers. The
government should take earnest efforts to transfer the assets from the societies under A.P.C.S
Act 1964 to societies under APMACS Act 1995 so that the administration would run on
smooth lines.
SELECT REFERENCES
1. Government of India (2014), Report of the National Commission on Agriculture and Animal
Husbandry, New Delhi: Ministry of Agriculture and Irrigation.
2. Bhasin, N.R. (2012), ‘Regional Cooperation and Indian Dairy Industry’, Indian Dairy Man, Vol. 78,
p.12.
3. Government of India (2016), Economic Survey: 2015-16, Vo. I & II, New Delhi: Oxford University
Press.
4. Chahal, S. (1998), “Performance of co-operative in marketing of milk in Punjab”, Indian Co-
operatives Review.
Dairy Development in Andhra Pradesh • D. KRISHNAMOORTHY & A. MALLAPPA

156 The Economy of Andhra Pradesh
ARTICLE / 25
COOPERATIVE BANKS FOR THE DEVELOPMENT OFAGRICULTURE SECTOR IN ANDHRA PRADESH
M. Usharani, K. Swarooppa Rani, V. Sreevani & G. Savaraiah
INTRODUCTION
The role of credit in agricultural economy is crucial and it helps in enhancing productivity
and promoting standard of living of the farmers. In India, the co-operative banking sector
plays an important role in providing credit to agriculture sector. In this study, an attempt has
been made to examined the role of Cooperative banks in agriculture credit from 2007-2008
to 2014-15 in India and particularly in Andhra Pradesh. Thus, this study examines the structure,
trend and progress of cooperative banking institutions and challenges faced by Cooperatives
in agricultural development as they provide basic credit which lubricates the wheel of
agriculture.
Agricultural Cooperatives in India are the backbone of the cooperative system and
involved in variety of functions and serving the rural masses by providing credit, Agro-
Chemicals, Agriculture Implements, fertilizers, seeds, etc. Their role has been commendable
in making essential inputs available to the rural masses for the development of the agriculture
and allied activities. Andhra Pradesh is basically an agrarian economy and is known as
“Granary of the South” by producing one-tenth of India’s total output of food grains. As
Andhra Pradesh is predominantly agricultural in character around 70 percent of the population
depends on it for their livelihood. In Andhra Pradesh the Co-operative credit societies play
an important role in serving the needy farmers by providing short term, medium term and
long term loans at lower rates of interest. Andhra Pradesh is the first state which implemented
the Single Window Credit Delivery System (SWCCDS) in 1987.It is an innovative programme
in which PACS are expected to provide multi-farm credit and multi-functional services at a
single contact point to help the poor farmer.
Agriculture scenario in Andhra Pradesh has witnessed fast transformation since 1991.
In this process, farmers have become more capital intensive as they are shifted to raise the
commercial crops which involves huge investments. The farming community mostly small
and marginal farmers is not able to invest such huge investments on farms on its own as it
Ph.D Research scholars, Dept. of Economics, S.V.U.College of Arts, Tirupati.Ph.D Research scholars, Dept. of Economics, S.V.U.College of Arts, Tirupati.Ph.D Research scholars, Dept. of Economics, S.V.U.College of Arts, Tirupati.Professor, Dept. of Economics, SV University, Tirupati, Tirupati, Andhra Pradesh.

157
do not have any assets or money. Thus their dependence on credit has increased for meeting
their agricultural requirements. The three- tier short-term and two-tier long- term cooperative
credit structures are merged under Single Window Cooperative Credit System (SWCCDS) in
the undivided state of Andhra Pradesh. The basic objective of the cooperatives was to eliminate
exploitation of the farmers by the money-lenders, by providing timely cheap credit at low rate
of interest to the farmers for agricultural development. Cooperative Banks are playing an
important role for the diversification of agriculture loan by providing loans to the farmers for
the various allied agricultural activities like Dairy, Poultry and Fishery etc. under the SWCCDS.
OBJECTIVES OF CREDIT CO-OPERATIVES
The following are the objectives of cooperatives:
1. To ensure timely and increased flow of credit to the farming sector
2. To reduce and gradually eliminate the money lenders
3. To reduce regional disparities throughout the country
4. To provide longer credit support to various rural development programmes
5. To provide cheap credit with or without any security.
OBJECTIVES OF THE STUDY
The very purpose of the present study is to examine the growth and performance of
Cooperative Banks in respect to agriculture credit in India and with particular reference to
Andhra Pradesh. The paper aims at an analysis of analyses the flow of the co-operative credit
for agricultural development in Andhra Pradesh.
PRIMARY COOPERATIVE AGRICULTURAL CREDIT SOCIETIES (PACS)
PACS, as the foundation of the Co-operative system are meeting the development needs
of the farmers by providing credit, inputs and storage and processing and marketing facilities.
The business of the Primary Societies has to be diversified under the Single Window
Cooperative Credit Delivery System in the undivided State of Andhra Pradesh. In fact, Primary
Agricultural Credit Society (PACS) is the kingpin of the entire cooperative credit movement
in A.P or elsewhere in the country. Loans are given for short-term period, normally for the
harvest season, for carrying on agricultural operations, and the rate of interest is fixed. The
primary agricultural credit society was expected to attract deposits from among the members
and non-members of the village and thus promote saving and self-help. But in actual practice
PACS did not involve in the deposit mobilization. It encourages the people in the villages to
deposit their money in the District Central Cooperative Bank as it has safe locker facilities
and the rate of interest on deposits is higher than that of the commercial banks. It provides
short-term, medium-term and long-term loans and advances to needy members under the
Cooperative Banks • M. USHARANI, K. SWAROOPPA RANI, V. SREEVANI & G. SAVARAIAH

158 The Economy of Andhra Pradesh
Single Window Cooperative Credit Delivery System (SWCCDS). The Government of Andhra
Pradesh has taken many reforms in order to strengthen the PACS in the State. The loss
making PACS were merged with the viable PACS as recommended by the Vaidyanadhan
Committee. The particulars relating to the number of PACS and their membership in Andhra
Pradesh and Indian are presented in table-1
Table – 1
Number of PACS and Membership with PACS
Year No. of PACS India Membership In Thousand (in’000)
Andhra Pradesh Andhra Pradesh India
2007-08 4064 94950 22000.83 131530.00
2008-09 2748 95633 13122.79 132349.90
2009-10 2721 94647 12405.35 126419.14
2010-11 2792 93413 12146.15 121224.88
2011-12 2807 92432 12056.37 113595.62
2012-13 2807 93488 12056.37 127467.79
2013-14 2807 93042 7997.47 130119.64
2014-15 2807 92789 12056.37 121087.81
Source: NAFSCOB
The Table-1 above shows that the number of primary agricultural credit societies (PACS)
has drastically declined from 4064 is 2007-08 to 2721 in 2009-10 shows 30.8 percent decline
due to reorganization of PACS in the undivided Andhra Pradesh State. Later on, it has
gradually increased to 2807 in 2011-12, registering an increase of 2.2 percent. The similar
trend is also seen number of PACS has continued even today in the Navyandhra Pradesh. The
same trends have appeared in case of the number of PACS in India where it shows the
number of PACS has declined by 2161 PACS in 2015 over 2007, registering a decline of 2.28
percent during that period.
The members of the PACS are the pillars of the cooperative credit movement in Andhra
Pradesh or elsewhere in the world. All the farmers are generally become the members of
PACS. But in case of PACS under Single Window Cooperative Credit Delivery System
(SWCCDS) all the farmers and non-farmers in the area of operation of PACS will join as
members since the PACS has providing long term finance. Hence, the membership per PACS
was very much higher in the initial period when SWCCDS was introduced. The membership
of PACS in A.P has declined from 22001 thousands in 2007-08 to 12056 thousands in 2014-
15, indicating a two-fold decrease whereas in case of India, there is one- fold decrease in the
membership of PACS from 131530 in 2007-08 to 121088 thousands in 2014-15. The
membership per society has also declined from 5414 in 2007-08 to 4295 during 2014-15 in
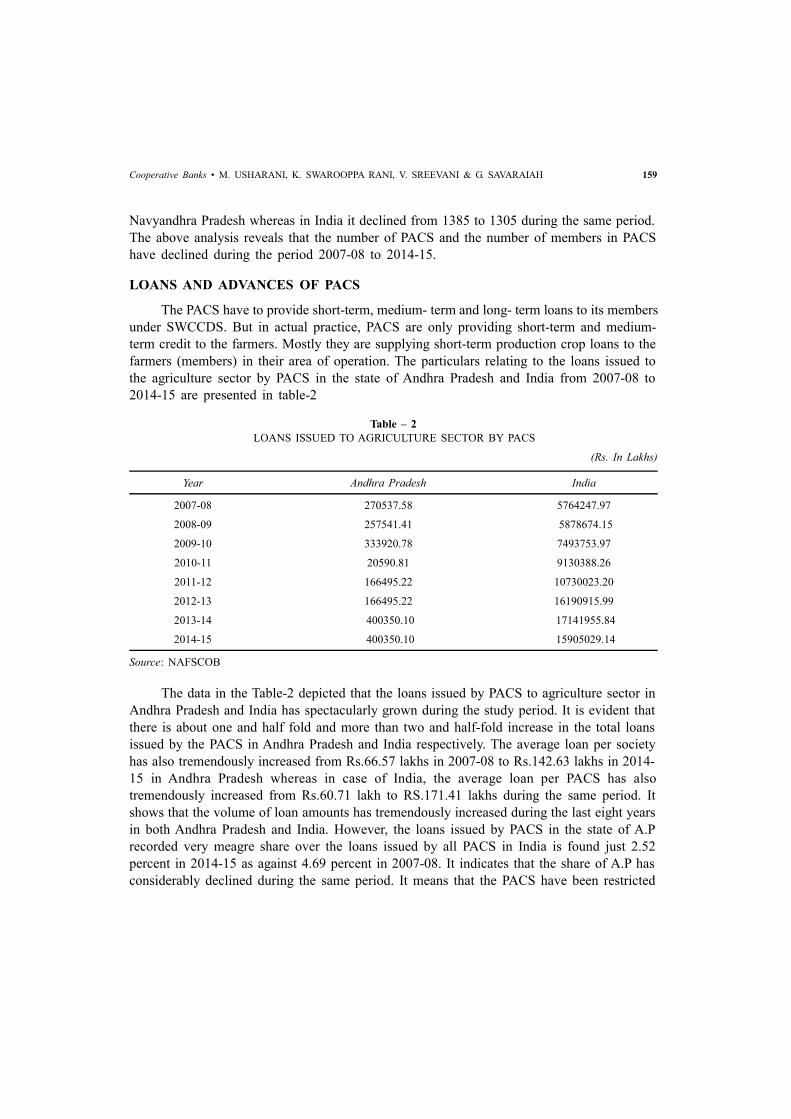
159
Navyandhra Pradesh whereas in India it declined from 1385 to 1305 during the same period.
The above analysis reveals that the number of PACS and the number of members in PACS
have declined during the period 2007-08 to 2014-15.
LOANS AND ADVANCES OF PACS
The PACS have to provide short-term, medium- term and long- term loans to its members
under SWCCDS. But in actual practice, PACS are only providing short-term and medium-
term credit to the farmers. Mostly they are supplying short-term production crop loans to the
farmers (members) in their area of operation. The particulars relating to the loans issued to
the agriculture sector by PACS in the state of Andhra Pradesh and India from 2007-08 to
2014-15 are presented in table-2
Table – 2
LOANS ISSUED TO AGRICULTURE SECTOR BY PACS
(Rs. In Lakhs)
Year Andhra Pradesh India
2007-08 270537.58 5764247.97
2008-09 257541.41 5878674.15
2009-10 333920.78 7493753.97
2010-11 20590.81 9130388.26
2011-12 166495.22 10730023.20
2012-13 166495.22 16190915.99
2013-14 400350.10 17141955.84
2014-15 400350.10 15905029.14
Source: NAFSCOB
The data in the Table-2 depicted that the loans issued by PACS to agriculture sector in
Andhra Pradesh and India has spectacularly grown during the study period. It is evident that
there is about one and half fold and more than two and half-fold increase in the total loans
issued by the PACS in Andhra Pradesh and India respectively. The average loan per society
has also tremendously increased from Rs.66.57 lakhs in 2007-08 to Rs.142.63 lakhs in 2014-
15 in Andhra Pradesh whereas in case of India, the average loan per PACS has also
tremendously increased from Rs.60.71 lakh to RS.171.41 lakhs during the same period. It
shows that the volume of loan amounts has tremendously increased during the last eight years
in both Andhra Pradesh and India. However, the loans issued by PACS in the state of A.P
recorded very meagre share over the loans issued by all PACS in India is found just 2.52
percent in 2014-15 as against 4.69 percent in 2007-08. It indicates that the share of A.P has
considerably declined during the same period. It means that the PACS have been restricted
Cooperative Banks • M. USHARANI, K. SWAROOPPA RANI, V. SREEVANI & G. SAVARAIAH

160 The Economy of Andhra Pradesh
their lending operations to low levels when compared with that of the lending activities of
PACS in India.
DISTRICT CENTRAL COOPERATIVE BANKS (DCCBS):
The District Central Co-operative Bank (DCCB) occupies and forms an important
position in the Co-operative credit structure. The success of the Co-operative credit movement
largely depends upon the role and financial strength of the DCCB. The finance granted by
the DCCB is given to the cultivators through PACS. The Central Cooperative Banks located
at the district headquarters or some prominent town of the district. Their main function is to
lend to primary credit society and undertake normal commercial banking business also, such
as attracting deposits from the general public and lending to the needy against proper securities.
The particulars relating to the number of offices and the membership of district central
cooperative banks in the state of AP and India are furnished in table 3.
TABLE – 3
No. of Offices and Membership of District Central Cooperative Banks
Year No. of offices with H.O. Membership
Andhra Pradesh India % Share Andhra India % Share of A.P.
of A.P. Pradesh
2007-08 573 13151 4.36 1774465 3396881 52.2
2008-09 565 13233 4.26 246920 3528802 57.06
2009-10 562 13181 4.27 295305 3975660 61.77
2010-11 562 13327 4.24 299253 3146070 26.99
2011-12 567 13495 4.20 286426 3659385 29.47
2012-13 577 13656 4.23 322770 3915657 38.59
2013-14 585 13811 4.24 972174 3563497 27.28
2014-15 611 14060 4.35 1097430 3347203 32.78
Source: NAFSCOB
The Table-3 shows that the number of offices i.e branch network of DCCBS has grown
in the state of Andhra Pradesh and India. But in case of membership of DCCBs has increased
from 573 and 13151 in 2007-08 to 611 in AP and 14060 in 2014-15 in India registering an
increase of 6.63 percent and 6.91 percent in AP and India respectively. There is a considerable
decline in the membership of DCCBs in AP (38.15 percent) and India (1.46 percent). However,
the share of offices of DCCBs in AP to the total offices of DCCBs in India has marginally
declined from 4.36 percent in 2007-08 to 4.36 percent in 2014-15. The share of membership
of AP has gradually declined from 52.2 percent to 32.78 percent during the same period. The
above analysis reveals that there is a decrease in the membership and also the number of

161
offices due to the changes in the operations of DCCBs as suggested by the Vaidyanathan
Committee Report.
LOANS ISSUED TO AGRICULTURE SECTOR BY DCCBS
The Central Cooperative Banks have provided short-term and medium- term loans to
the members of DCCBs.The DCCBs have to supply the required credit to the PACS for
agricultural development. The DCCB provides guidance for the improvement of the financial
soundness of the PACS in its area of operations. The particulars relating to the short-term and
medium term loans provided by the DCCBs for agriculture sector are furnished in Table-4.
TABLE – 4
LOANS ISSUED TO AGRICULTURE SECTOR BY DCCBs
(Rs. In lakhs)
Year Short term Loans Medium term Loans
Andhra Pradesh India % Share Andhra Pradesh India % Share
2007-08 254453 4113718 8199 239844 3.42
2008-09 215512 3974546 6.19 14037 255891 5.49
2009-10 395392 5168183 5.42 10814 302545 3.57
2010-11 535052 6460688 7.65 28726 368434 7.79
2011-12 610119 7631374 8.29 30785 362917 8.49
2012-13 1221412 10141581 7.99 23734 366994 6.46
2013-14 1210747 11349254 12.04 51096 415732 12.30
2014-15 846683 12135621 10.67 40846 613446 6.65
Source: NAFSCOB
The Table-4 reveals that the short-term production credit supplied to the farmers through
DCCBs has increased from Rs.2545 crore in 2007-08 to Rs. 8467 crores in 2014-15, shows
more than three-fold increase in Andhra Pradesh whereas it has grown by about threefold
increase in India during this period. Medium term loans in AP has tremendously increased
from Rs.82 crores in 2007-08 to Rs.408.5 crores in 2014-15 registering about five-fold
increase whereas these loans in India has risen by Rs.3736 crores in 2014-15 over 2007-08,
and its share in medium term loans issued by DCCBs in Andhra Pradesh over total medium
term loans issued by all DCBs in India considerably increased from 3.42 percent in 2007-08
to 12.30 percent in 2013-14 and further declined to 6.65 percent in 2014-15. The short-term
production loans issued by DCCBs to the PACS constitute about 95 percent of the total loans
and advances made by DCCBs in AP and India. The data reveals that most of the DCCBs
have concentrated more on the crops loans which are payable within a year or after the
Cooperative Banks • M. USHARANI, K. SWAROOPPA RANI, V. SREEVANI & G. SAVARAIAH

162 The Economy of Andhra Pradesh
harvest but in case of medium-term loans, the repayment may be more than 3 years. There
is a problem of recycling of funds at DCCA level it PACS delayed to repay the medium-term
loans.
STATE COOPERATIVE BANKS (SCBS)
The State Cooperative Banks have to finance, co-ordinate and control the working of
the Central Cooperative Banks in each state. They serve as the link between the Reserve bank
and the general money market on the one side and the Central Cooperative Bank and Primary
Credit Societies on the other. They obtain their funds mainly from the general public by way
of deposits, loans and advances from the Reserve Bank and they can also improve their own
share capital and reserves. The members of the state cooperative banks generally consist of
the individuals, government, central cooperative banks and other cooperative societies. The
particulars relating to the number of offices of the state cooperative banks and their membership
are shown in the following Table-5.
Table – 5
No. of Offices and Membership by State Cooperative Banks
Year No. of Offices inclusive H.O Membership
Andhra India % Share Andhra India % Share
Pradesh of AP Pradesh of AP
2007-08 26 994 2.62 23 200768 —
2008-09 26 992 2.62 23 200772 —
2009-10 26 1015 2.56 23 330808 —
2010-11 26 1028 2.52 22 234827 —
2011-12 26 1036 2.50 22 254358 —
2012-13 37 1081 3.42 22 339896 —
2013-14 37 1096 3.32 23 338455 —
2014-15 37 1131 3.32 23 555479 —
Source: NAFSCOB
The state cooperative banks have opened their offices in the important towns and cities
in their respective States with a view to provide finance to the DCCBs and monitor their
activities for smooth function of the cooperative banks. The total number of offices of State
Cooperative Bank (SCB) in AP has shown only 26 throughout the period from 2007 to 2012,
there after it considerably increased to 37 which continued up to 2014-15 whereas in India,
the number of offices has significantly increased from 994 in 2007-08 to 1131 in 2014-15,
registering an increase of 13.78 percent. The percentage share of number of offices of SCBs
in Andhra Pradesh over total SCBs in India has considerably increased from 2.62 percent to

163
3.37 percent during the same period. The membership of AP SCB is only 23 throughout the
period except 2011 to 2013 whereas the membership of all SCBs in India has increased from
2001-08 in 2007-08 to 555479 in 2014-15, shows more than two and half-fold increase. The
share of membership of SCB in A.P when compared with all SCBs in India is negligible.
AGRICULTURAL LOANS ISSUED BY SCBS
The loans and advances of State Cooperative Banks issued to their members particularly
DCCBs in Andhra Pradesh and India have shown in the following Table-5.
Table – 6
Agricultural Loans Issued by SCBs
(Rs. In lakhs)
Year Short term Loans Medium term Loans
Andhra Pradesh India % Share Andhra Pradesh India % Share
2007-08 231129 2255415 10.25 9166.00 91014 10.07
2008-09 157118 2647386 — 10225.00 85182 12.03
2009-10 225551 2485266 9.08 -0- 65574 —
2010-11 410437 3727114 11.02 -0- 165055 —
2011-12 441188 4789779 9.30 -0- 111436 —
2012-13 611496 5407632 8.40 -0- 152639 —
2013-14 639636 7613699 7.32 -0- 144932 —
2014-15 548703 7493708 30.09 35266 239572 14.72
Source: NAFSCOB
Table-6 reveals the short-term and medium term agriculture loan issued by the State
Cooperative Banks in Andhra Pradesh and all over India during 2007-08 to 2014-15. The
short-term loans issued to the DCCBs by the SCB has risen by Rs.3176 crore in 2014-15 over
2007-08, in Andhra Pradesh registering about two and half-fold increase whereas the Short-
term loans issued by all SCBs in India have shown three-fold increase during the same
period. It shows that there is an impressive growth in the short-term lending by the SCBs in
AP and India.
It is disheartening to note that the SCB in AP has not given medium- term loans to the
DCCBs from 2009-10 to 2012-13.However, the medium-term loans issued by SCB in AP is
of Rs.353 crore in 2014-15 as against Rs.92 crore in 207-08 whereas the medium-term loans
issued by the SCBs at all India level has increased from Rs.910 crore in 2007-08 to Rs.2396
crore in 2014-15, registering an increase of 163.3 percent. The share of short-term loans of
SCB in AP over all India level has declined from 10.25 percent to 7.32 percent during the
Cooperative Banks • M. USHARANI, K. SWAROOPPA RANI, V. SREEVANI & G. SAVARAIAH

164 The Economy of Andhra Pradesh
same period 2007-08 to 2013-14. This analysis reveals that the SCB in A.P has not able to
provide sufficient short-term loans to the farmers in the state through DCCBs and PACs
because of low level of refinancing facilities.
CONCLUSION
In the context of trade liberalization and globalization, the cooperative approach is one
of the best means of self-protection for small farmers mainly due to its self-help concept and
member’s participation. It is therefore vital for agricultural cooperatives to strengthen
cooperative credit, improve the efficiency of agricultural credit supply, and enhance capital
market flexibility to overcome the weakness of the banking business of agricultural cooperatives.
Especially, members’ participation in the agricultural cooperative approach and effective
supervised credit system must be emphasized for the improvement of the agricultural financing
system. It is also urged that the banking sector of agricultural cooperatives must take measures
to reform themselves into a universal banking system by which both farm credit as well as
nonfarm credit will be efficiently supplied.
165
ARTICLE / 26
DROUGHT IMPACTS AND MITIGATION MEASURES :A CASE OF ANDHRA PRADESH
M. Srinivasa Reddy
Drought emerges as a major environmental and socio-economic problem with negative
effects on the livelihood of populations in many developing countries. Although, drought may
happen virtually in all climatic zones, yet, its characteristics differ considerably from one area
to another. Rainfall, groundwater availability, reservoir levels and crop conditions determine
the nature and extent of drought in a specified geographical area. Drought induced poverty
leads to gross abuse of environmental resources, thereby generating land degradation that
leads to desertification, which in turn accentuates poverty. Heavy dependence of the poor on
the natural resources for livelihood that puts a disproportionate pressure on the land, thereby
accelerating environmental degradation is also a problem of drought recurrent.
Literature categorizes drought in four categories (Nagarajan 2003): meteorological,
hydrological, agricultural and socio-economic:
(a) Meteorological drought refers to the deficiency of rainfall compared to the long-term
amounts on monthly, or seasonal, or annual tile scales. For instance, Indian
Meteorological Department (IMD) defines drought on the basis of rainfall deficiency
which is applicable to whole of India. According to this definition, when seasonal
rainfall received over an area is less than 75 per cent of its long-term average value
is considered as drought; moderate drought if the rainfall deficit is less 26-50 per
cent ; and severe drought if deficit exceeds 50 per cent of the normal. When an area
affected by drought is more than 20 per cent of the total area of the country, a year
is considered as drought year;
(b) Hydrological Drought is associated with the effects of periods of precipitation short
falls on surface/subsurface water supply and its frequency and severity of hydrological
drought is often defined on a watershed or river basin scale;
(c) Agricultural drought on the other hand related to precipitation shortages, differences
between actual and potential evapo-transpitation, soil water deficits, etc. The physical
and biological properties of the soil, weather conditions, biological characteristics of
the specific plant, and its stages of growth influences plant water requirements.
Assistant Professor, Centre for Economic and Social Studies (CESS), N.O.Campus, Begumpet, Hyderabad.

166 The Economy of Andhra Pradesh
Agricultural drought accounts the variable susceptibility of crops during different
stages of crop development starting from emergence to maturity; deficient topsoil
moisture thus hinder germination, leads to low plant populations per hectare, and
reduction of final yield; and
(d) Socio-economic drought is a situation when the demand for economic goods (such
as water, forage, food grains, fish, hydroelectric power, etc.,) exceeds supply as a
result of water-related shortfall in water supply.
About 500 million people are living in drought prone areas of the world and more than
30 per cent of the continental surface is affected by drought or desertification process. Due
to its nonstructural nature, it is spreading to more and more geographical regions. Some of
the perennial drought-prone regions of the world are located in South Asia. Countries like
India, Afghanistan, Sri Lanka, and Pakistan are experiencing drought in every three consecutive
years. Of all the South Asian counties, India is most affected by drought due its high dependency
on monsoon rains to annually replenish water resources. India experiences 39 droughts during
1876-2009 (Indian Council of Agricultural Research), out of which 3 years (1918, 1877 and
1899) are categorized as calamitous (more than 60 per cent area of the country affected); 5
years (1972, 1987, 1992, 2002 and 2009) falls under severe category (more than 40 and less
than 60 per cent of the area affected); and remaining 32 years are categorized as moderate
(16 years) and slight (16 years).(See Annexure-1).
Declaration of drought is the domain of the State Government. Basically two criteria’s
are adopted for declaration of drought in India: rainfall deficit and reasonable irrigation
facility. It is observed that, “Areas where the frequency or probability of failure of annual
rainfall by more than 25 per cent from the normal was found to be 20 per cent or more for
the observed years, were considered as drought-prone (Irrigation Commission of India 1972).
Areas where the frequency exceeded 40 per cent were considered as chronically drought-
prone” (Nadkarni, 1985).
About one-third of India’s geographical area receives very low level of rainfall (less
than 1000 mm). About 77.6 per cent of its geographical area experienced drought once or
twice in each five year due to poor monsoon. About 11 per cent of countries population and
16 per cent of counties geographical area are severely affected by drought. There are a total
of 40 drought years since 1801; drought occurs in each 5 year; 9 occasions when drought
occurred in each alternate year; 4 occasions having drought occurred in each consecutive year
(Table-1).
AP is the third most drought prone State in India after Rajasthan & Karnataka and has
8 chronically drought prone Districts (out of 23 Districts) viz., Anantapur, Chittoor, YSR
Kadapa, Hyderabad, Kurnool, Mahaboobnagar, Nalgonda and Prakasham. (Manual for Drought
Management, 2009, MoA, GoI Page.22). The total drought prone areas, according to the
agro-climatic zone, constitute 30 to 40 per cent of the geographical area of the state. These

167
districts are called “rain-shadow” districts with annual average rainfall below the state average.
They are home to the 35 per cent of the total population in AP (30 million) where agriculture
is the principal livelihood activity. They account 43 per cent of the cultivators and 36 per cent
of agricultural labour of the state. However, the impact of water scarcity spreads over the
boundary of the drought region. Thus subsequent notifications considered 11 districts as
drought-prone (DPAP) and one district as desert-prone.
Table – 1
History of Droughts in India
Period Drought Years No. of Drought
1801-1830 1801, 1804, 1806, 1812, 1819, 1825 6
1831-1860 1832, 1833, 1837, 1853, 1860 5
1861-1890 1862, 1866, 1868, 1873, 1877, 1883 6
1891-1920 1891, 1897, 1899, 1901, 1904, 1905, 1907, 1911, 1918, 1920 10
1921-1950 1939, 1941 2
1951-1980 1951, 1965, 1966, 1971, 1972, 1974, 1979 7
1981-2010 1982, 1987, 2002, 2009 4
GoI, data compiled and analysed in different years, Indian Meteorological Department, New Delhi
As per the Guidelines contained in Manual for “Drought Management, 2009” Published
by Ministry of Agriculture, Government of India (GoI), the State for the first time has also
sought the assistance from National Remote Sensing Centre (NRSC) and Acharya N.G.Ranga
Agriculture University (ANGRAU) and obtained data on scientific and satellite data based
indices like Normalised Difference Vegetation Index (NDVI) and Moisture Adequacy Index
(MAI) for each and every Mandal of the State. NRSC basing on satellite and ground data
computed NDVI and NDWI anomalies and reported 562 Mandals under Moderate to Severe
Category and 164 Mandals under Mild Category. Similarly as per MAI values 710 Mandals
are categorized as Drought affected (381 Mandals under Mild drought, 292 under Moderate
drought and 37 Mandals under severe drought).
As far as the frequency of drought in AP is concerned, it is increasing in the state,
especially, after 1995. By the year 2011-12, the state experienced 12 drought years out of the
17 years. Even non-DPAP districts were also severely affected as far as percentages of
Mandals were affected by the drought, especially, during 1997-98, 2001-02, 2002-03, 2004-
05, 2009-10 when 68 %, 80%, 94%, 58%, and 92% of the Mandals in the respective years
were declared as drought Mandals. In the year (2011-12), 55 per cent of the Mandals of the
Non-DPAP districts were also declared as drought affected (Annexure-2). The droughts
experienced during the years 1997-98, 1999-2000, 2001-02, 2002-03,2004-05, 2009-10 and
2011-12 are considered to be severe in terms of the number of Mandals affected (Table-2).
Drought Impacts and Mitigation Measures • M. SRINIVASA REDDY

168 The Economy of Andhra PradeshT
ab
le 2
Reg
ion/Y
ear-
Wis
e N
o.
of
Man
dal
s D
ecla
red a
s D
rough
t A
ffec
ted f
rom
19
95-9
6 t
o 2
011
-12 i
n A
P
Reg
ion
To
tal
95-9
696
-97
97-9
898
-99
99-0
020
0020
012
2002
2003
2004
2005
2006
2007
2008
2009
2010
2011
Man
dals
-01
-0-0
3-0
4-0
5-0
6-0
7-0
8-0
9-1
0-1
1-1
2
Coas
tal
An
dh
ra4
30
95
13
28
80
21
262
35
840
813
520
40
32
00
39
70
24
1
%1
00
22
367
049
14
83
95
31
47
07
00
92
05
6
Ray
alas
eem
a2
34
10
30
19
90
23
250
23
123
316
720
40
16
30
02
29
02
17
%1
00
44
085
099
21
99
10
071
87
07
00
09
80
93
Tel
angan
a4
64
15
17
43
30
24
530
40
644
615
139
90
10
30
04
42
64
18
%1
00
34
93
053
688
96
33
86
02
20
09
51
90
AP
112
821
330
92
00
68
914
299
510
87
45
381
30
29
80
01
06
86
87
6
%1
00
19
382
061
13
88
96
40
72
02
60
09
51
78
Sou
rce:
Go
AP,
dat
a co
mp
iled
and
anal
yse
d i
n d
iffe
ren
t yea
rs,
Dis
aste
r M
anag
emen
t D
epar
tmen
t, H
yder
abad
.

169Drought Impacts and Mitigation Measures • M. SRINIVASA REDDY

170 The Economy of Andhra Pradesh

171
However, assessing the economic impact of drought is more complex than that of rapid
onset disasters because the impact of deficiency of rainfall on agricultural assets (e.g., crops)
is a complex hydrologic and agronomic phenomenon, and drought normally lacks the highly
visible direct impacts associated with rapid onset disasters, making indirect economic losses
difficult to quantify. Moreover, their impacts are generally nonstructural and spread out over
large areas, and thus, making them less understood as compared to other natural forces.
The South Asia Environment and Social Development Department (SAESD) of the
World Bank had looked into the long term impacts of drought and the consequent adaptation
strategies in AP during the year 2005. For this purpose eight (out of total 23) districts in AP,
which are particularly vulnerable to drought: Anantapur, Chittoor, Cuddapah and Kurnool in
Rayalaseema region; Rangareddi, Mahbubnagar and Nalgonda in Teleangana region; and
Prakasam in coastal Andhra regions were selected. The basic objective of the study was to
complement the existing state and central government programs by enhancing state’s capacity
to assess the long-term impacts of drought and raise resilience at different levels to drought
risks. While the approach adopted by this study broadly follows a general catastrophe risk
modeling framework used for assessing the impacts of rapid onset disasters (such as cyclones,
floods and earthquakes), it also customized the framework to a different risk assessment
paradigm – the one that can be applied to slow onset disaster, such as drought. To estimate
indirect losses which might have been generated as a result of drought, macro-econometric
model and input-output models were used.
The study has examined the impact of drought on AP economy in terms of changes in
the gross value added (GVA) in various sectors of the economy and interrelations between
them over the period of 1980-2003. Each of these years were compared with the preceding
normal/drought year to assess the impacts on the overall economy and across the three
aggregate sectors – primary, secondary and tertiary. Sector-wise, the macro-econometric model
shows a significant negative impact of drought on the agricultural sector, a much more
limited impact on the livestock sector and the secondary sector, and an even positive impact
on the tertiary sector.
The 2002 drought year saw a decrease in the contribution of agriculture to state GDP
as compared to the preceding year 2000-01, which was a normal year. While agriculture
contributed to about 21 per cent of Gross State Domestic Product (GSDP) during the 2000-
01, it decreased to about 15 per cent the following year. In particular, the contribution of
water intensive crops like paddy decreased from about 7 per cent in 2000-01 to about 4 per
cent in 2002-2003. The production of paddy has decreased to such an extent that the state
needed to import paddy. Similarly, decline in output of other food grains and food crops also
resulted in imports from other states. The intermediate consumption of paddy and other food
crops has declined by 24 and 2 per cent respectively. The private final consumption expenditure
on paddy has also declined by 2 per cent for the year 2002-03 in absolute terms in spite of
about 8 per cent increase in population. Contrary to agriculture, the livestock sector experienced
Drought Impacts and Mitigation Measures • M. SRINIVASA REDDY

172 The Economy of Andhra Pradesh
a rise of 77 per cent in the production despite drought. Drought years 1997-1998 and 2002-
03 clearly affected the agriculture sector, with a loss in Gross Value Added (GVA) higher than
20 per cent, while these drought events did not significantly impact the livestock sector.
Indeed, during the drought of 2002, the primary sector as a whole experienced a rise (+7%)
despite a drop in agricultural sector performance.
While the GVA related to agriculture was observed to be lower in every drought year
as compared to the previous year, the two droughts (1999-2000 and 2002-2003) did not cause
an absolute reduction in the overall state GVA. The share of agriculture in the overall
economy gradually decreased while the share of the secondary sector, and particularly, that
of the tertiary sector, increased significantly. This trend suggests that the impact of drought
on the overall economic performance of the state economy is diminishing over time as the
impact on agriculture will be under check by other sectors of economy. As this trend is most
likely to continue, the study predicts further decline in the macro-economic impact of drought.
Accelerating an observed structural shift in the AP economy from the agriculture sector
towards the secondary and particularly tertiary sectors can be interpreted as a powerful
macro-economic drought adaptation strategy. As the study found livestock sector to be less
affected by drought than the secondary sector (due to it’s inter-dependence with the agriculture
sector), therefore, the future impact of drought on the rural economy can be also moderated
due to an increasing role of the livestock sector.
The findings of this study highlight the importance of intensifying efforts to support
economic and social development of drought-prone areas that is sustainable and resilient to
water-scarce conditions in the long-term. In addition to large variations across time series, the
study also finds the impacts of the drought to be highly variable and localized. The impacts
of measures that can be adopted by farmers are also highly location –specific. Moreover, the
study observes that in the situation of acute water deficit caused by a major drought, farmers
often “rationalize” the use of available water by reducing an area under water-intensive paddy
in favor of less water intensive irrigable dry (ID) crops. The longer-term impact of human-
induced climate change reinforces the case for shifting to less water intensive crops in the
drought-prone districts. However, at present, these practices are adopted as temporary measure
with the area of rice typically restored once the drought is over. One of the striking findings
of the analysis was a degree of variation in drought impacts on different crops in different
locations, clearly suggesting that there is a significant scope for increasing the effectiveness
of advice to farmers about undertaking drought coping measures, such as switching to
alternative crops in a response to poor monsoon. Better water conservation practices alone
(such as a change in tillage practice), without changing the cropping pattern, do not appear
to have a significant long-term effect on a large scale.
Apart from comparing the impact of drought on different sectors of the economy in AP,
this study also tries to compare the state-wide economic impact of drought with that of
cyclones and floods6. The annual average loss caused by droughts on the AP economy was

173
found to be lower than that due to cyclones or floods. However, comparison like this has to
be made with caution because losses are not measured in the same unit (loss in GVA for
droughts, and loss in public infrastructure and housing for cyclones and floods).
DROUGHT DURING 2011-12
The state experienced severe drought in 2011-12 due to erratic, uneven andnnon-receipt
of sufficient rainfall during South-West Monsoon. Due to deficiency of rainfall (-38%) in the
month of June, sowing of rainfed crops was delayed by nearly 15 to 30 days. As a result of
which in Kharif 2011, agricultural operations were badly affected (crop growth was affected
due to insufficient rainfall in the month of September (-43%) leading to low yields in many
parts of the State, affecting several rainfed crops like Cotton, Groundnut, Jowar, Maize, etc).
During North-East Monsoon also (09.10.2011 to 26.12.2011), the State has received
105.1 mm of rainfall as against the normal rainfall of 223.3 mm with a deficit of -53 per cent.
In addition net fall in ground water levels in the State has been 1.57 meters from October
2010 to October 2011. An extent of 34.24 Lakh Ha of crop area has been damaged by 50
per cent and above against the sown area of 77.9 Lakh Ha. In view of such adverse seasonal
conditions 876 Mandals (covering 22 out of 23 Districts) have been declared as drought
affected.
As per the Memorandum on Drought in Andhra Pradesh, 2011, prepared by the Revenue
(Disaster Management) Department of Government of AP, the total production loss of
agriculture crops is 3.01 million tons valued at Rs.5746.78 crores.
To summarize, droughts had and continue to have a negative impact on the economy
of AP, particularly on the performance of the agriculture sector and on the lives of the
millions of the rural poor. However, the impact of drought on the overall economic indicators
has lately been declining due to structural changes, such as the rise of the secondary and
tertiary sectors. Furthermore, the impact of drought on the rural economy is showing, on
average, some signs of moderation due to an increasing role of the less vulnerable livestock
sector. It is therefore important to build on these encouraging signs in average macro-level
indicators in order to more effectively provide targeted assistance to those whose life and
wellbeing are devastated by drought.
IMPACT OF DROUGHT ON GROUNDWATER
The discussion about impact of drought so far revolves around the question of food
needs as research on drought are, generally, conducted from meteorological, agricultural, and
food security perspectives. However, the impact of drought on water security, particularly on
ground water has received less attention as policy responses in this regard mostly concentrated
on food needs. On the other hand, food and water security are inter-related and ground water
plays a vital role in buffering the effects of rainfall variability, water shortages and difficulties
Drought Impacts and Mitigation Measures • M. SRINIVASA REDDY

174 The Economy of Andhra Pradesh
in accessing water that is available can affect domestic and productive water uses, with
knock-on effects on food consumption and production. Water insecurity can therefore affect-
directly and indirectly - wider household production and income earning opportunities, as
well as the quality and quantity of water consumption. Considering the vital role of groundwater
in the context of drought in this section an attempt has been made to study the impact of
drought on groundwater.
Table – 4
Groundwater Estimates for DPAP and Non-DPAP Districts in AP
Scheme/ Year SGD (%)
DPAP C NC Total
1985 6 39 27
1993 22 25 24
2002 13 58 48
2004 25 64 54
2007 24 60 49
2009 27 58 51
Non-DPAP
1985 10 56 29
1993 20 26 23
2002 17 59 37
2004 21 67 38
2007 20 58 33
2009 32 53 41
AP
1985 8 46 28
1993 21 26 24
2002 16 58 42
2004 22 65 45
2007 21 59 41
2009 30 57 46
Source: Reddy and Reddy (2016), pp.58-59.
Note: C=Command (ayacut); NC=Non-Command (non-ayacut); Total=Overall (both command and non- command
areas together).
The study by Reddy et.al., (2016) which covers the 1985 to 2009 observes a secular
trend in groundwater development over these years and this trend is only broken due to severe

175
Ta
ble
– 5
Reg
ion
-wis
e D
istr
ibu
tio
n o
f O
ver
Ex
plo
ited
(O
E)
Vil
lages
in
OE
Bas
ins
Dis
tric
t/ R
egio
n20
0220
0520
0820
09%
of
Ass
essm
ent%
of
Ass
essm
ent
Uni
ts R
epor
ting
Unit
s
Rep
eate
dR
eport
ing
Dep
leti
onR
epea
ted
up t
oD
eple
tion
up
GE
C 2
007
to G
EC
200
9
No.
of
No.
of
No.
of
No.
of
No.
of
No.
of
No.
of
No.
of
OE
Vil
lage
sF
aile
d W
ells
OE
Vil
lage
sF
aile
d W
ells
OE
Vil
lage
sF
aile
d W
ells
OE
Vil
lage
sF
aile
d W
ells
Coas
tal
Andhra
18
33
92
82(6
37
9)
52
83
92
82(6
37
9)
40
64
28
66(9
40
1)
14
842
866(9
40
1)
9.6
2.6
Ray
alas
eem
a72
67
27
90(3
80
1)
14
05
727
90(3
80
1)
14
46
100
320
(90
34)
911
10
0320(9
03
4)
50
23
.5
Tel
angan
a57
21
47
991
(11
057
)2
25
71
47
991
(11
057
)1
59
79
08
01(2
11
62)
10
64
90
801
(211
62)
39
.813
.2
Andhra
Pra
des
h14
81
260
063
(21
237
)4
19
02
60
063
(21
237
)3
44
92
33
987
(39
597
)2
12
323
398
7 (
39
597)
30
.311
.3
So
urc
e: R
edd
y a
nd R
eddy (
20
16),
p.7
0.
Drought Impacts and Mitigation Measures • M. SRINIVASA REDDY

176 The Economy of Andhra Pradesh
droughts or very good monsoons. The estimates provided by GoAP (Dept of Groundwater)
show that the overall Stage of Groundwater Development (SGD) in AP has gone up from 28
per cent in 1985 to 46 per cent in 2009, except during the year 1993, when it declined to 24
per cent. Groundwater development was relatively at the higher side during 2004 and 2009
(45 and 46% respectively) due to the prevailing unprecedented drought conditions. When
command and non-command areas are considered, opposite trends are observed in the case
of command and non-command areas between 1985 and 2002 % while the command areas
experienced an increasing trend, the non-command areas experienced a declining trend.
However, both command and non-command areas showed an increasing trend between 2002
and 2004, which is due to the consecutive droughts during that period. Between 2004 and
2007, there was a decline in the level of development, reverting to 2002 levels and again it
increases during 2009. The severe drought conditions during 2004 and 2009 led to groundwater
over exploitation (increased availability), especially in the non-DPAP districts and hence
2004 and 2009 are showing higher groundwater balance despite increase in use (Table-4).
In AP, the number of over exploited villages increased from 1481 in 2002 to 3449 in
2008.This number rose to 4190 during 2004 due to the severe drought conditions (Table 5).
At the state level, the number has more than doubled over a period of six years. Across the
regions, the increase almost doubled in Coastal and Rayalaseema Regions % the number of
over exploited villages went up by almost three times in Telangana. Though these figures are
based on the sample wells, they reflect the severity of groundwater depletion at the micro-
level.
As far as number of service connections are concerned, the Coastal Andhra Region
recorded only a marginal increase during 2004-05. This could be due to the severe drought
conditions prevailing between 2001 and 2004. The impact is severe in the rain-fed regions
of Telangana and Rayalaseema. Though there was substantial improvement in the number of
service connections during 2006-07, the number was much below the 2000-01 peak. Moreover,
the increase was mainly due to better groundwater situation during the post-2004 period and
cannot be attributed to the free power policy of the state (Table-6).
Table – 6
Year-wise Growth in Agricultural Service Connections across Regions
Region No. of Agricultural Service Connections during the Reference Years
1984-85 1993-94 2000-01 2004-05 2006-07
Coastal Andhra 8430 20085 22239 22586 25015
Rayalaseema 4632 23109 26001 15656 17624
Telangana 31182 58983 70053 26518 44338
Andhra Pradesh 44244 102177 118293 64760 86977
Source: Reddy and Reddy (2016), p.78

177
MITIGATION MEASURES
The mitigation of the impacts of drought has been a key area of focus of the Governments
both at Central and State level in India. The systematic Government intervention to tackle
drought started as early as during the second Five Year Plan (1956-61) when the dry farming
projects were initiated. During 1970-71, the Rural Works Programme (RWP) was formulated
with the object of creating assets designed to reduce the severity of drought, wherever it
occurred and to provide employment in the drought affected areas. Later, the RWP was re-
designated as Drought Prone Area Programme (DPAP) in 1973-74 and taken up as a centrally
sponsored scheme. Afterwards, various programmes were introduced to tackle the drought.
This is evident through programs such as the Desert Development Programme (DDP), National
Watershed Management Porgramme for Rain-fed Areas (NWDPRA), Calamity Relief Fund
(CRF) (provision of 75 per cent share of the centre and 25 per cent of the concerned state),
National Calamity Contingency Fund, National Disaster Response Fund (NDRF), State Disaster
Relief Fund (SDRF) (provision of 75 per cent share of the centre and 25 per cent of the
concerned state) and the National Agricultural Crop Insurance Scheme (NACIS), Input-
Subsidies Scheme, Debt/Loan Waiver, Accelerated Irrigation Benefit Programme (AIBP,
Jalayagnam. Apart from these centrally sponsored programmes, a large number of drought-
related initiatives have also been undertaken by the Government of AP with support by GoI
and several donors (Table-7). Examples of major programs include irrigation schemes by the
Irrigation Department, the Calamity Relief Fund, and the Food for Work Programme (FFWP)
by the Revenue Department and the Department of Agriculture. Other important initiatives
include the crop seed program of the Department of Agriculture and ground water monitoring
undertaken by the Groundwater Department. The Department of Planning, with the technical
help of Central Research Institute for Dryland Agriculture (CRIDA), has also developed, as
part of preparing a drought management plan, a real-time decision support system to forecast,
and warn the farmers about, the likely upcoming drought and suggest actions such as cropping
patterns, to mitigate these impacts. In 2004, GoAP created a new Department for Rain-
Shadow Areas Development to support the economic and social development in the most
drought affected communities.
Table 7: Government Programs and Initiatives Addressing Drought in AP
Type Programme/Scheme
Risk financing •Crop Insurance•Calamity Relief Fund•National Calamity Contingency Fund
Drought proofing • Irrigation schemes • Drought Prone Areas Programme (DPAP)• Joint Forest
Management/ Community Forest Management/FRA• Water Harvesting schemes•
Micro-irrigation projects (APMIP)• State-wide irrigation development• Watershed
Development Programme• Integrated Wastelands Development Program (IWDP)•
Andhra Pradesh Rural Livelihood Project (APRLP)• Rural Infrastructure Development
Programme• Jawahar Gram Samridhi Yojna (JGSY)• Sampoorna Grameen Rozgar
Yojana (SGRY)
Drought Impacts and Mitigation Measures • M. SRINIVASA REDDY

178 The Economy of Andhra Pradesh
Employmentgeneration • Self-employment programs on income generation• Employment Generation Mission•
Women Self Help Groups• Food for Work Programs (FFW)• Chief Minister’s
Empowerment of Youth (CMEY) program• Employment Assurance Scheme
(EAS)•Swarnajayanti Shahari Rozgar Yojana (SJSRY)•Sampoorna Grameen Rozgar
Yojana (SGRY)•Mahatma Gandhi National Rural Employment Guarantee Act
(MGNREGA)•Prime Minister’s Employment Generation Programme (PMEGP)
SOME FACTS ABOUT DROUGHT MITIGATION MEASURES IN AP
As far as state wise allocation of funds under CRF is concerned, (from the years 2005-
06 onwards) AP happens to be the 2nd highest recipient after Rajasthan attracting 9 per cent
of the total funds earmarked for all the states (Annexure-3).Similarly in case of SDRF also
it is the 2nd highest recipient after Rajasthan with a share of 8 per cent of the total funds that
are earmarked for all the states during the years 2010-12 and also projected the same for the
period 2012-15 (Annexure-4). District-wise Releases by GoAP from CRF / SDRF and NCCF/
NDRF on account of Drought during the years from 1998-99 to 20010-11 is provided in
Annexure-5.
Table – 6
Releases by GoI & GoAP from CRF / SDRF and NCCF / NDRF on account of Drought during the years
1995-96 to 2010-11 (Rs. in Crore)
Year Amount 75% of Amount released Total Amount released Additional
sought GOI’s share by GOI from by GOAP amount incurred
from GOI to CRF / NCCF / by GOAP
SDRF NDRF
1995-96 87.91 0 87.91 34.01
1996-97 93.14 0 93.14 2.84
1997-98 98.29 0 98.29 140.3 42.01
1998-99 103.3 0 103.3 97.62
1999-00 720.36 107.69 75.36 183.05 174.98
2000-01 148.54 0 148.54 240.66 92.12
2001-02 155.97 0 155.97 148.54
2002-03 674.02 163.77 59.94 223.71 588.15 364.44
2003-04 953.83 171.96 116.75 288.71 275.47
2004-05 180.56 0 180.56 479.97 299.41
2005-06 258.06 0 258.06 276.96 18.9
2006-07 536.06 270.96 56.56 327.52 104.96
2007-08 284.51 0 284.51 173.28
2008-09 298.73 0 298.73 74.31
2009-10 9747.42 313.67 365.58 679.25 627.68
2010-11 381.63 0 381.63 443.03 61.4
Source: GoAP, Disaster Management Department.

179
Though, AP is the 2nd highest recipient in the country with respect to CRF/SDRF, in
many instances the central government did not oblige to the demands of the state governments
as is evident in the table-8.
GoAP has sought assistance from GoI during 1999-00, 2002-03, 2003-04, 2006-07 and
2009-10.However, it eceived only 25,33,30,61 and 7 per cent of the requested amount
respectively during those years.
Droughts substantially increase the incidence of suicide among rural populations,
particularly among male farmers and their families. Like Karnataka, Kerala and Maharashtra,
a large number of farmer’s suicide cases were also reported from several districts of AP (2 nd
in Farmer’s suicide in India during 2006 and 3 rd in 2007) during 2006-07 (Annexure-6). Prime
Minister announced a relief package (Rs.4509.42 crore) for agrarian distressed districts of
these areas which also included financial assistance to 65 selected major/medium projects
under AIBP. Central assistance of Rs.977.68 crore released during 2009-10 up to December
2009.
TACKLING THE DROUGHT OF 2011-12
As the socio-economic impacts of drought are prolonged, magnitude of the area affected
by drought being large (with maximum number of affected people being Marginal and Small
Farmers (SMF) and Landless agricultural labourers), the State requested for Central Assistance
from National Disaster Response Fund (NDRF) amounting to Rs.2584.42 Crores. The state
is proposed to carry out the following activities with the help of this fund (a sum of Rs.148.5
Crore already incurred by the GoAP during 2010-11 towards relief expenditure):
An area of 34.24 Lakh Ha belonging to SMF (29.75 Lakh Ha belonging to SMF and
4.49 Lakh Ha Other Farmers) Other Farmers has been affected requiring an input
subsidy of Rs.735.46 Crores i.e., Rs.673.57 Cr for SMF and Rs.61.89 Cr for Other
Farmers as per SDRF Norms
Towards Horticulture crops which have been damaged by more than 50 per cent in
45,912.3 Ha belonging to SMF & Other Farmers an input subsidy requirement of
Rs.18.33 Crores is proposed. (SMF Rs.17.54 Crores and Other Farmers Rs.0.79
Crores).
The State has proposed a contingency plan to mitigate drinking water problem for
the period November, 2011 to May 2012, for which an amount of Rs.63.73 Crores
is required for Rural Water Supply (RWS) for temporary water schemes as well as
transportation of water through tankers and hiring of private source. Similarly for
Urban Water Supply (UWS) also Rs. 54.59 Crores are proposed for transportation of
water through tankers and hiring of private source.
Considering that most of the labourers already exhausted their 100 mandays of Cap
under MGNREGS, the State has proposed enhancement of the cap on mandays to
Drought Impacts and Mitigation Measures • M. SRINIVASA REDDY

180 The Economy of Andhra Pradesh
200 days for providing relief employment in the drought affected areas. A total
amount of Rs.801.3 Crores has been requested to generate additional mandays for
about six lakh households.
Animal Husbandry Department was provided any funds for mitigating drought and
therefore, Rs.211.9 Crores is proposed for implementation of contingency plan which
includes production of adequate fodder, organisation of cattle camps cattle health
care, etc.
Drought affects are severe in most vulnerable like old disabled and destitute (who are
above 60 years of age and not covered under any social security), pregnant women,
adolescent girls who are not covered under any ICDS Scheme / Anganwadi Centers;
and other destitute who are not able bodied, and therefore, cannot be provided any
work under Rural Employment Scheme. To mitigate the distress of these vulnerable
sections, who are otherwise not covered under any relief schemes gratuitous relief of
Rs.514 Cr is proposed.
In view of the increase in cost of cultivation and the scale of relief provided under
GoI being inadequate, the State Government has been extending a higher scale of
relief to various crops (agriculture & horticulture crops) towards input subsidy. As
per these State input subsidy norms a total amount of Rs.1886.26 Crores is required
as input subsidy towards agriculture crops (SMF Rs.1636.63 Crores) and Other
Farmers Rs.249.63 Crores and Rs.26.99 Crores (SMF Rs.25.25 Cr + 1.14 Cr Other
Farmers) towards damages of horticulture crops. The total requirement of assistance
as per State norms is Rs.3743.98 Crores.
The State undertakes a number of initiatives in promoting transparency in relief operations
and ensuring that the input subsidy and other relief measures reach the eligible beneficiaries.
Towards this end, joint teams are constituted for enumeration of crop damages i.e., farmer
wise and list of eligible beneficiaries is displayed on the village Panchayats and supervisory
checks on such reports is conducted by District Level Officers. The State has also taken steps
for ‘on-line transfer of input subsidy’ directly to the accounts of eligible beneficiaries as a
pilot project in districts like Anantapur.
OTHER MEASURES UNDERTAKEN TO TACKLE THE DROUGHT
Apart from the Central assistance as discussed above, the State has also initiated a
number of Drought relief Measures. Some of these include provision of drinking water by
transportation through tankers; hiring of private sources in affected urban and rural Areas;
opening of works in all drought affected Gram Panchayats under MGNREGS; enhancing the
cap on man-days under MGNREGS from 100 to 200 days; special steps to produce fodder
seed and transport of fodder from surplus areas to deficit areas; maintenance of water for
cattle in water troughs; implementation of Crop Contingency Plans in all affected districts,
181
stabilization of prices of edible oils and pulses through Public Distribution System (PDS) and
appointment of Senior I.A.S., officers for each district to monitor the drought situation from
time to time, etc.
DROUGHT MANAGEMENT STRATEGIES
While drought management programmes have been in existence for a long time, they
have not been effective due to many reasons. As per the current system, the expenditure on
relief measures takes precedence over mitigation, placing enormous burden on the State
budget and relegating the development plans. An emphasis on mitigation measures would
reduce the incidence and severity of drought, improve crop production and save resources
spent recurrently on relief.
As far as drought mitigation policy is concerned, it should have both short-term and
long-term perceptions. In this context, emphasis should be given to work out ways and means
of looking at the long-term interventions while planning short term relief measures. The
approach adopted prior to 1970s did not prove effective in mitigating the drought conditions
as the relief measures were basically temporary and ad hoc in nature. However, with the
launch of DPAP, and subsequent watershed development projects, a long-term view was
taken for evolving technological, socio-economic, institutional and organisational innovations,
which were accepted as the strategy for integrated development of drought-prone areas. This
policy improvement has paid rich dividends while dealing with the infamous droughts of
1987, 1999-2000 and 2009.
As far as implementation of drought management programmes are concerned, there is
a need to revise the strategy for implementing them in an integrated manner on a mission
basis, which can be implemented in the identified areas with active participation of the
people. At present, individual departments with a narrow focus usually run most of these
programmes in isolation, with allocations thinly scattered over a large area. There is no
sustained dialogue with the people about the benefits of these programmes and the need for
their participation and ownership. As these programmes are fragmented in their implementation,
the accountability mechanisms are very weak and all programmes experience serious lacunae.
Therefore, the existing response programmes for drought-prone areas still tend to be
limited in scope and depth. They typically focus on immediate needs such as drinking water,
food, crop and livestock loss prevention, and short-term employment. The assistance given
is generally inadequate and understandably, limited to accessible people and areas. New
approaches, strategies and methods to protect farming systems, resources and livelihood in
drought-prone areas are urged.
RECOMMENDATIONS
There is a need to establish of task forces/partnerships/consortia of all public and
Drought Impacts and Mitigation Measures • M. SRINIVASA REDDY
182 The Economy of Andhra Pradesh
private stakeholders who are involved in drought mitigation measures as their efforts are
often irregular and fragmented.
Government and concerned institutions must accord high priority to Research and
Development (R&D) of drought-resistant technologies and practices.
R&D, while being wherever appropriate systems-focused and strongly interdisciplinary,
should use participative processes to take advantage of the wisdom of farmers and their
traditional practices. Research should also focus on the integration of the technical and socio-
economic aspects.
As drought is a slow-onset disaster, strengthening of early warning, and continuous
monitoring and decision support systems are central to drought management to protect farmers’
livelihoods. Drought preparedness and mitigation measures follow these initial steps in drought
management.
Only if these components are effective, farming adjustments and corrections be made
in time; and optimal decisions taken to maximize returns/minimize losses, especially with
mid-season and terminal droughts. Drought management and a decision support system based
on RS & GIS inputs, crop growth models, drought mitigation technologies, market forecasts
and resource information are to be evolved.
A comprehensive resource analysis and study of land use in drought-prone areas may
be undertaken with consideration of water resources, potential productivity of crops,
environmental problems, land use patterns, cropping systems, water and forest resources,
livestock and fodder resources. Climate-soil-production systems need to be critically evaluated
from a sustainable resource management context in drought-prone environments.
From the economic perspective, integrated watershed management coupled with enterprise
diversification based on carrying capacity and product value addition should be the main
thrust. This line of action would ensure optimum resource use, sustainability and income
maximization.
Drought-tolerant breeds of livestock and varieties of crops must be explored to help
build drought tolerance and resilience of farming systems.
Measures to enhance perennial component of vegetation in arid and semi-arid farm
lands including agro-forestry, agri-horticulture, etc., must be incorporated.
Establishment of water (especially for human and livestock), seed, fodder and feed bank
for meeting immediate demand assumes higher priority in drought prone areas. Seeds of all
annual and perennial crops, shrubs, trees and other industrial crops as per contingency plan
of each State/region should be available in sufficient quantity in these banks. These seed
banks may be updated periodically since they may be used occasionally and private sector
may not be interested in such a risky business.

183
Coarse cereals may be included in PDS and procurement at the Minimum Support Price
(MSP) should be ensured to promote cultivation of traditional rain-fed crops in these areas.
Conservation agriculture and rain-fed farming systems need to be prioritized, encouraged
and incentivized in developing rain-fed areas. Mechanization is highly essential due to exigency
of completion of farming operations within limited period in drought affected areas. In view
of predominance of small and marginal poor farmers, renting or custom hiring services may
be created.
It may be made mandatory that harvested rain water and augmented ground water
resources should be used through micro-irrigation and other efficient water saving techniques
for enhancing productivity of scarce water.
Need for evolving scientific but practical crop zoning concept suitably linked with
marketability to adjust demand of water to the availability for its efficient utilization. Cultivation
of high water demanding crops should be discouraged in water scarce areas and some regulatory
measures may be evolved for rational use of water in such areas.
Policies at all levels should encourage the uptake of more water efficient technologies
such as drip irrigation and rehabilitation of traditional water storages.
The forest management policy need to be re-visited for the fringe forests located within
a radius of 3 km from the village boundaries to ensure synergy between the conservation of
forest and livelihood needs of the local people. Special efforts are needed to re-orient the
management of these forests for recharging and rain water harvesting for drinking, agriculture
and other local needs which will benefit the forests to regenerate and create a win-win
situation.
There is a need to ensure smooth flow of information for drought preparedness and
response (eg, new climate research findings, new land and water management practices, new
drought tolerant breeds and varieties, social and community processes to help communities
prepare for drought, what to do when drought is forecast, and ways to purify drinking water).
At the national level, policies may be enacted to support a National Drought Mitigation
Plan (NDMP), involving all the Ministries and concerned Organizations such as NGOs. As
a focal point, a central nodal agency will coordinate and maintain the NDMP.
Drought support policies, appropriate in the particular circumstances, should encourage
self-reliance by farmers. In other words, drought preparedness including safety nets, insurance,
etc. should be factored into their normal farm management plans and activities.
Authorities may be encouraged to develop/improve drought declaration/revocation
processes and to share the information on these processes, recognizing that although they are
commonly based on threshold criteria for rainfall deficits and other relevant factors, they may
be location-specific and operate differently at different levels, and wherever possible they
have local community involvement through processes that help maintain morale in the face
of drought.
Drought Impacts and Mitigation Measures • M. SRINIVASA REDDY
184 The Economy of Andhra Pradesh
Financial support must be provided for strategically planning and implementing water
conservation programmes as a part of ongoing budgetary arrangements for drought mitigation
programmes.
Creating public awareness about the drought and educating on efficient use of water
through information media is necessary.
REFERENCES
GoAP (2011), Memorandum on Drought in Andhra Pradesh , Revenue Disaster Management Department,
Hyderabad, December.
GoI (2009), Manual for Drought Management, 2009, Ministry of Agriculture, Page.22, November.
Nadkarni M.V. (1985), Socio-Economic Condition in Drought Prone Areas: A Benchmark Study of Drought
Districts in Andhra Pradesh, Karnataka and Tamil Nadu. Concept Publication. New Delhi.
Nagarajan, R. (2003), Drought-Assessment, Monitoring, Management and Resource Conservation. Capital
Publishing Company, New Delhi.
PACS (2008), Drought in India: Challenges & Initiatives, Poorest Areas Civil Society Programme (PACS)
2001-2008, PACS Programme, New Delhi.
Reddy M Srinivasa, Sanjit Kumar Rout and E.B. Uday Bhaskar Reddy (2008), The Asian Economic Review,
Journal of the Indian Institute of Economics, Vol.50, No.3, December.
Reddy M Srinivasa, Sanjit Kumar Rout and V Ratna Reddy (2016), Groundwater Governance, Development,
Degradation & Management (A Study of Andhra Pradesh), Rawat Publications, Jaipur.
World Bank (2005), Drought in Andhra Pradesh: Long term impacts and adaptation strategies Findings and
observations from the quantitative analysis, South Asia Environment and Social Development Department,
September.

185
ANNEXURE
Table – 1
Area Affected by Drought in India from 1876 to 2009
Year Area Affected % Area of the Category Ranking
(Million sq. km.) Country Affected
1876 0.49 15.8 Slight 34
1877 2.03 64.7 Calamitous 2
1883 1.03 32.8 Moderate 13
1884 0.7 22.2 Slight 26
1885 0.48 15.4 Slight 35
1891 1.15 36.7 Moderate 9
1896 0.68 21.7 Slight 27
1899 1.99 63.4 Calamitous 3
1901 0.89 28.5 Moderate 20
1902 0.54 17.1 Slight 33
1904 0.98 31.1 Moderate 16
1905 1.09 34.7 Moderate 10
1907 0.85 27.2 Slight 22
1911 0.97 30.8 Moderate 17
1913 0.7 22.3 Slight 25
1915 0.63 20.2 Slight 30
1918 2.16 68.7 Calamitous 1
1920 1.22 38.8 Moderate 8
1925 0.8 25.5 Slight 24
1928 0.67 21.4 Slight 28
1936 0.86 27.6 Slight 21
1941 1.01 32.3 Moderate 15
1951 1.04 33.2 Moderate 11
1952 0.81 25.8 Slight 23
1965 1.35 42.9 Moderate 6
1966 1.01 32.3 Moderate 14
1968 0.45 20.6 Slight 29
1969 0.62 19.9 Slight 31
1971 0.42 13.3 Slight 36
1972 1.39 44.4 Severe 5
Drought Impacts and Mitigation Measures • M. SRINIVASA REDDY
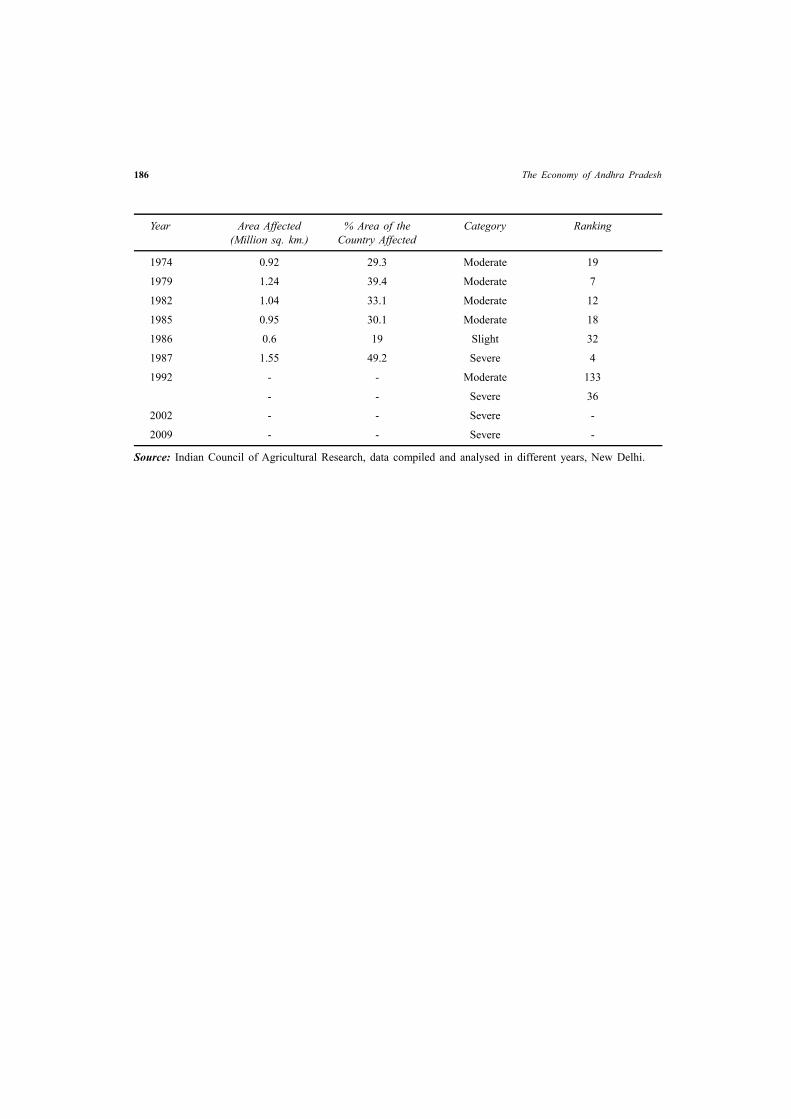
186 The Economy of Andhra Pradesh
Year Area Affected % Area of the Category Ranking
(Million sq. km.) Country Affected
1974 0.92 29.3 Moderate 19
1979 1.24 39.4 Moderate 7
1982 1.04 33.1 Moderate 12
1985 0.95 30.1 Moderate 18
1986 0.6 19 Slight 32
1987 1.55 49.2 Severe 4
1992 - - Moderate 133
- - Severe 36
2002 - - Severe -
2009 - - Severe -
Source: Indian Council of Agricultural Research, data compiled and analysed in different years, New Delhi.
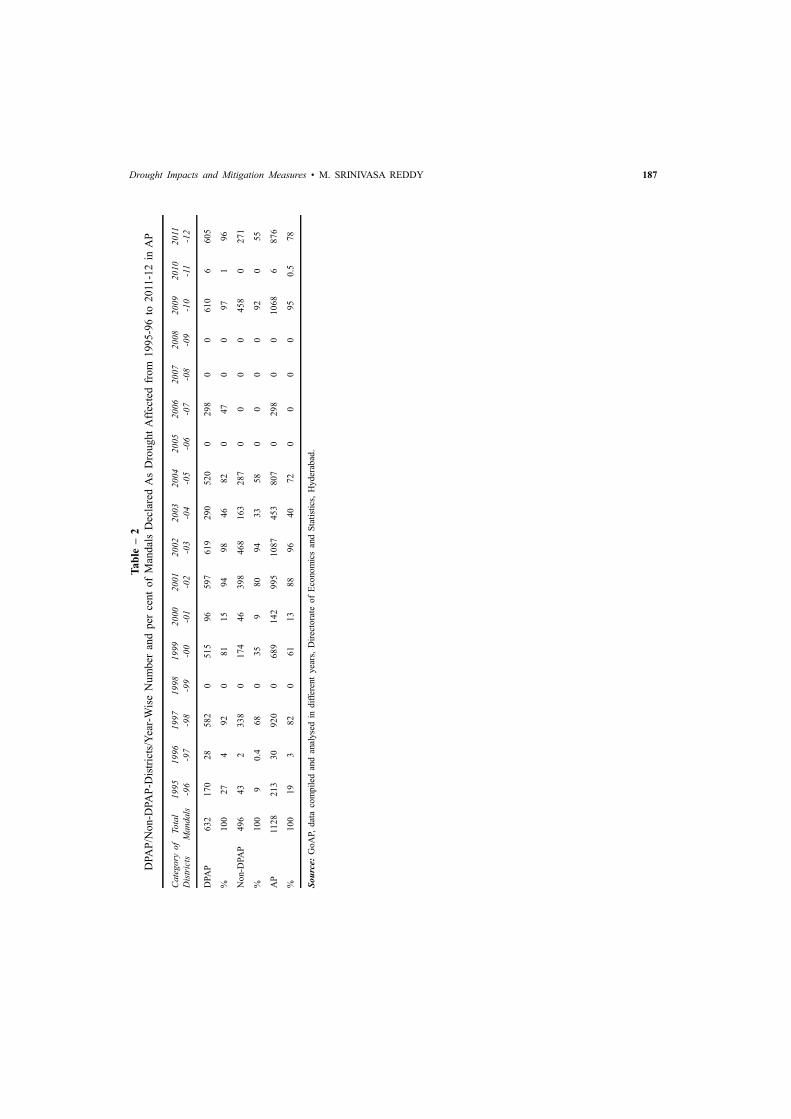
187
Ta
ble
– 2
DPA
P/N
on
-DPA
P-D
istr
icts
/Yea
r-W
ise
Nu
mb
er a
nd
per
cen
t o
f M
and
als
Dec
lare
d A
s D
rou
gh
t A
ffec
ted
fro
m 1
99
5-9
6 t
o 2
011
-12
in
AP
Cate
gory
of
Tota
l19
95
19
96
19
97
19
98
19
99
20
00
20
01
20
02
20
03
20
04
20
05
20
06
20
07
20
08
20
09
20
10
20
11
Dis
tric
tsM
anda
ls-9
6-9
7-9
8-9
9-0
0-0
1-0
2-0
3-0
4-0
5-0
6-0
7-0
8-0
9-1
0-1
1-1
2
DPA
P63
217
02
85
82
05
15
96
59
76
19
29
05
20
029
80
061
06
60
5
%10
027
49
20
81
15
94
98
46
82
047
00
97
196
No
n-D
PA
P49
643
23
38
01
74
46
39
84
68
16
32
87
00
00
45
80
27
1
%10
09
0.4
68
03
59
80
94
33
58
00
00
92
055
AP
11
28
21
33
09
20
06
89
14
29
95
10
87
45
38
07
029
80
010
68
687
6
%10
019
38
20
61
13
88
96
40
72
00
00
95
0.5
78
Sou
rce:
GoA
P, d
ata
com
pil
ed a
nd a
nal
yse
d i
n d
iffe
rent
yea
rs,
Dir
ecto
rate
of
Eco
nom
ics
and
Sta
tist
ics,
Hyd
erab
ad.
Drought Impacts and Mitigation Measures • M. SRINIVASA REDDY

188 The Economy of Andhra Pradesh
Table – 3
State wise allocations to CRF during the years 2005 to 10 (Rs. in Crore)
Sl.No Name of the State 2005-06 2006-07 2007-08 2008-09 2009-2010 Total
1 Rajasthasn 415.64 436.42 458.25 481.16 505.21 2296.68
2 Andhra Pradesh 344.08 361.28 379.35 398.31 418.22 1901.24
3 Orissa 301.54 310.24 319.38 328.97 339.03 1599.16
4 Uttar Pradesh 295.94 304.48 313.45 322.87 332.75 1569.49
5 Gujarat 246 258.3 271.22 284.78 299 1359.3
6 Madhya Prradesh 254.23 261.58 269.29 277.39 285.88 1348.37
7 West Bengal 234.73 241.5 248.62 256.09 263.92 1244.86
8 Maharashtra 222.9 234.05 245.75 258.04 270.94 1231.68
9 Tamil Nadu 209.08 219.53 230.51 242.03 254.13 1155.28
10 Assam 193.06 198.62 204.48 210.62 217.06 1023.84
11 Punjab 146.03 153.33 160.99 169.04 177.49 806.88
12 Bihar 148.93 153.23 157.74 162.48 167.45 789.83
13 Haryana 124.38 130.6 137.13 143.99 151.18 687.28
14 Jharkhand 126.07 129.71 133.53 137.55 141.75 668.59
15 Karnataka 114.66 120.39 126.41 132.73 139.36 633.55
16 Chhattisgarh 111.75 114.98 118.35 121.9 125.62 592.6
17 Himachal Pradesh 100.69 103.6 106.65 109.86 113.21 534.01
18 Uttaranchal 94.69 96.59 98.58 100.67 101.85 492.38
19 Kerala 85.5 89.77 94.26 98.98 103.91 472.42
20 Jammu & Kashmir 86.46 88.96 91.58 94.33 97.21 458.54
21 Arunachal Pradesh 28.3 29.12 29.97 30.87 31.81 150.07
22 Sikkim 17.53 18.04 18.57 19.13 19.7 92.97
23 Tripura 12.85 13.22 13.61 14.02 14.44 68.14
24 Meghalaya 11.29 11.61 11.95 12.31 12.68 59.84
25 Mizoram 6.58 6.77 6.97 7.18 7.4 34.9
26 Manipur 5.56 5.72 5.89 6.06 6.25 29.48
27 Nagaland 3.83 3.94 4.05 4.17 4.3 20.29
28 Goa 2.11 2.21 2.32 2.44 2.56 11.64
India 3944.41 4097.79 4258.83 4427.97 4604.31 21333.31
Source: GoAP, data compiled in different years, Disaster Management Department; Note: Central share @75% and
State’s share @25%.

189
Table – 4
State wise allocations SDRF 2010-15 (Rs. in Crore)
Sl.No State 2010-11 2011-12 2012-13 2013-14 2014-15 Total 2010-15
1 Rajasthan 600.66 630.69 662.22 695.33 730.10 3319.00
2 Andhra Pradesh 508.84 534.28 560.99 589.04 618.49 2811.64
3 Gujarat 502.12 527.23 553.59 581.27 610.33 2774.54
4 Maharashtra 442.69 464.82 488.06 512.46 538.08 2446.11
5 Madhya Pradesh 392.75 412.39 433.01 454.66 477.39 2170.20
6 Orissa 391.58 411.16 431.72 453.31 475.98 2163.75
7 Uttar Pradesh 385.39 404.66 424.89 446.13 468.44 2129.51
8 Bihar 334.49 351.21 368.77 387.21 406.57 1848.25
9 West Bengal 304.83 320.07 336.07 352.87 370.51 1684.35
10 Tamil Nadu 293.52 308.20 323.61 339.79 356.78 1621.90
11 Assam 263.77 276.96 290.81 305.35 320.62 1457.51
12 Jharkhand 259.45 272.42 286.04 300.34 315.36 1433.61
13 Punjab 222.92 234.07 245.77 258.06 270.96 1231.78
14 Haryana 192.90 202.55 212.68 223.31 234.48 1065.92
15 Jammu & Kashmir 172.46 181.08 190.13 199.64 209.62 952.93
16 Karnataka 160.96 169.01 177.46 186.33 195.65 889.41
17 Chhattisgarh 151.32 158.89 166.83 175.17 183.93 836.14
18 Kerala 131.08 137.63 144.51 151.74 159.33 724.29
19 Himachal Pradesh 130.76 137.30 144.17 151.38 158.95 722.56
20 Uttarakhand 117.66 123.54 129.72 136.21 143.02 650.15
21 Arunachal pradesh 36.74 38.58 40.51 42.54 44.67 203.04
22 Sikkim 22.75 23.89 25.08 26.33 27.65 125.70
23 Tripura 19.31 20.28 21.29 22.35 23.47 106.70
24 Meghalaya 14.65 15.38 16.15 16.96 17.81 80.95
25 Mizoram 8.55 8.98 9.43 9.90 10.40 47.26
26 Manipur 7.22 7.58 7.96 8.36 8.78 39.90
27 Nagaland 4.97 5.22 5.48 5.75 6.04 27.46
28 Goa 2.96 3.11 3.27 3.43 3.60 16.37
Total 6077.30 6381.18 6700.22 7035.22 7387.01 33580.93
Source: GoAP, data compiled in different years, Disaster Management Department, Hyderabad.
Note: Central Share @75% and State share 25%
Drought Impacts and Mitigation Measures • M. SRINIVASA REDDY

190 The Economy of Andhra Pradesh
Ta
ble
– 5
Dis
tric
t-w
ise
Rel
ease
s b
y G
oA
P f
rom
CR
F /
SD
RF
an
d N
CC
F /
ND
RF
on
acc
oun
t of
Dro
ug
ht
du
rin
g t
he
yea
rs f
rom
19
98-9
9 t
o 2
00
10
-11
(Rs.
Lak
hs)
Sl.
No D
istr
ict/
199
81
99
9 2
00
02
00
1 2
00
2 2
00
3 2
00
4 2
00
52
00
6 2
00
7 2
00
8 2
00
92
01
0
Dep
art
men
t-9
9-9
9-0
1-0
2-0
3-0
4-0
5-0
6-0
7-0
8-0
9-1
0-1
1
1S
rikak
ula
m7
02
18
415
476
11
84
102
289
25
10
10
74
00
82
82
2V
isak
hap
atn
am5
33
01
403
449
139
72
09
255
50
10
71
02
69
64
20
60
3E
ast-
Go
dav
ari
83
229
325
410
131
82
08
273
10
29
31
24
01
06
10
6
4W
est-
Godav
ari
45
188
160
373
11
70
11
93
43
70
01
00
36
22
82
28
5K
rish
na
61
181
187
416
11
64
133
344
45
40
15
50
32
23
22
6G
un
tur
76
354
349
435
148
42
15
350
95
50
35
80
23
02
30
7P
rakas
am1
34
122
211
06
631
203
16
22
105
61
96
24
14
19
02
17
21
2
8N
ello
re2
23
692
703
643
144
82
53
888
137
65
72
30
12
01
25
12
5
9K
urn
ool
103
108
31
92
36
24
171
56
90
104
92
19
21
12
50
99
99
10
Anan
tapu
r3
69
31
71
35
72
38
37
220
01
42
71
39
84
00
37
49
61
10
08
88
8
11
Chit
toor
92
230
22
75
29
04
200
61
26
81
38
75
48
21
84
77
81
05
12
03
51
4
12
Kad
apa
273
123
91
31
36
09
160
69
06
901
63
70
13
22
00
14
31
43
13
Adil
abad
181
71
57
315
534
140
94
34
51
250
40
81
07
25
28
48
4
14
Ran
ga
Red
dy
68
613
350
482
180
53
05
570
160
10
511
40
21
22
12
15
Kar
imnag
ar1
74
277
272
425
133
69
03
11
96
449
79
64
27
10
90
30
26
04
16
Kham
mam
72
269
239
394
124
93
15
125
56
52
10
02
22
42
33
34
57
17
Mah
boob
nag
ar1
34
132
72
55
86
53
183
65
04
925
366
11
47
13
21
00
41
53
93
18
Med
ak5
39
544
867
584
189
47
55
999
328
59
38
31
86
33
94
39
4
19
Nal
gon
da
11
88
12
823
593
176
77
69
945
325
32
91
23
07
61
65
20
Niz
amab
ad9
41
63
150
496
134
82
22
634
212
94
51
00
02
94
29
4
21
War
ang
al4
37
568
492
469
1411
379
698
238
20
92
57
02
17
43
4
22
Viz
ainag
aram
152
342
899
634
138
02
02
381
23
01
00
03
63
6
23
Hyder
abad
70
00
01
00
00
00
00
00
A
-TO
TA
L8
58
21
47
93
223
21
120
70
342
59
105
50
154
54
4211
92
30
58
82
51
30
85
27
82
83
Sou
rce:
Go
AP,
dat
a co
mp
iled
in d
iffe
ren
t yea
rs,
Dis
aste
r M
anag
emen
t D
epar
tmen
t,,
Hyd
erab
ad.

191
Ta
ble
– 6
Sta
te-w
ise
and
Yea
r-w
ise
Far
mer
s’ S
uic
ides
in
In
dia
fro
m 1
99
5 t
o 1
0
SL
No
Sta
te/U
T2
01
02
00
92
00
82
00
72
00
62
00
52
00
42
00
32
00
22
00
12
000
19
99
19
98
19
97
19
96
19
95
To
tals
1A
ndhra
Pra
des
h2
52
52
41
42
10
51
79
72
60
72
49
02
66
61
80
01
89
61
50
91
525
19
74
18
13
10
97
17
06
11
96
311
20
2A
runac
hal
Pra
des
h1
81
21
21
54
25
20
11
27
17
96
012
00
18
8
3A
ssam
36
93
41
19
72
78
32
22
99
33
11
87
27
11
67
12
682
16
022
376
13
735
66
4B
ihar
95
11
26
78
64
63
92
34
68
06
13
212
712
794
83
11
712
35
5C
hhat
tisg
arh
11
26
18
02
17
73
15
93
14
83
14
12
13
95
10
66
12
38
14
52
14
340
6G
oa
15
46
05
11
81
811
18
15
55
726
16
17
0
7G
uja
rat
52
35
88
52
63
17
48
76
15
52
35
81
57
05
94
66
150
065
356
554
653
487
83
8H
aryan
a2
97
23
01
50
17
91
90
14
01
60
20
71
90
14
52
38
20
518
545
85
17
428
20
9H
imac
hal
Pra
des
h6
12
41
88
15
22
20
52
34
25
22
35
39
26
23
30
15
63
1
10
Jam
mu &
Kas
hm
ir1
88
63
33
42
18
16
15
38
32
30
018
7
11
Jhar
khan
d1
73
16
47
111
31
03
12
42
12
12
12
783
8
12
Kar
nat
aka
25
85
22
82
17
37
21
35
17
20
18
83
19
63
26
78
23
40
25
05
26
30
23
79
18
83
18
32
20
11
24
90
35
053
13
Ker
ala
89
58
96
82
01
23
211
24
111
89
03
15
83
15
33
10
35
12
95
14
31
15
14
12
04
10
25
12
99
18
907
14
Mad
hya
Pra
des
h1
23
71
39
51
37
91
26
31
37
51
24
81
63
81
44
51
34
01
37
22
660
26
54
22
78
23
90
18
09
12
39
26
722
15
Mah
aras
htr
a3
14
12
87
23
80
24
23
84
45
33
92
64
14
73
83
63
69
53
53
63
022
24
23
24
09
19
17
19
81
10
83
50
481
16
Man
ipur
41
20
02
24
30
10
00
01
20
17
Meg
hal
aya
16
21
91
83
411
48
42
56
113
913
4
18
Miz
ora
m5
38
00
10
20
30
30
05
00
57
19
Nag
alan
d0
12
02
00
00
00
10
85
423
20
Od
isha
16
21
54
26
02
40
28
32
54
37
93
65
34
52
56
19
926
541
825
126
436
544
60
21
Punja
b8
09
76
68
88
54
77
42
64
04
57
387
10
8111
13
610
012
63
22
Raj
asth
an3
90
85
17
96
61
83
95
46
17
49
63
65
87
50
57
36
72
470
565
945
30
92
65
23
Sik
kim
19
23
60
21
35
41
49
31
81
81
017
15
22
80
37
7
24
Tam
il N
adu
54
11
06
05
12
48
44
26
12
55
15
99
10
52
14
55
98
58
82
80
410
89
93
279
9N
A13
875
25
Tri
pura
58
45
50
07
29
15
44
14
11
497
24
118
23
623
91135
26
Utt
ar P
rades
h5
48
65
67
45
48
64
11
52
24
96
38
75
25
68
87
35
84
572
756
864
638
593
70
27
Utt
arak
han
d3
93
02
82
85
12
42
24
13
42
131
8
28
Wes
t B
engal
99
31
05
47
59
11
02
11
89
96
58
22
10
36
15
18
12
46
13
77
12
40
14
57
15
39
17
38
12
96
19
331
Tota
l (S
tate
s)1
59
33
171
75
161
28
163
79
168
63
169
56
180
71
171
07
178
20
162
84
163
18
15
913
15
821
13
526
13
676
10
699
25
4669
Drought Impacts and Mitigation Measures • M. SRINIVASA REDDY

192 The Economy of Andhra PradeshSL
No
Sta
te/U
T2
01
02
00
92
00
82
00
72
00
62
00
52
00
42
00
32
00
22
00
12
00
019
99
19
98
19
97
19
96
19
95
To
tals
UN
ION
TE
RR
ITO
RIE
S
29
A &
N I
slan
ds
81
92
31
66
83
17
31
69
11
12
80
15
0
30
Chan
dig
arh
00
00
10
02
00
00
00
02
5
31
D &
N H
avel
i1
01
51
21
71
21
37
23
21
19
21
818
28
18
524
7
32
Dam
an &
Diu
00
00
00
20
20
10
00
01
6
33
Del
hi
(Ut)
95
16
23
37
13
83
31
81
719
37
10
27
13
25
8
34
Lak
shad
wee
p0
00
00
00
00
00
00
00
00
35
Puduch
erry
41
54
17
19
71
75
14
71
45
23
88
91
23
013
312
846
00
15
78
Tota
l(U
Ts)
31
19
36
82
53
19
71
75
17
05
71
51
13
12
85
16
919
496
53
21
22
44
Tota
l (A
ll I
nd
ia)
159
64
173
68
161
96
166
32
170
60
171
31
182
41
171
64
179
71
164
15
166
03
16
082
16
015
13
622
13
729
10
720
25
6913
Sou
rce:
India
n A
gra
rian
Cri
sis,
dat
a co
mp
iled
in d
iffe
rent
yea
rs,
Foo
d.
Liv
elih
oo
ds.
Envir
onm
ent,
htt
p:/
/agra
rian
cris
is.i
n

THEME - IV
ISSUES RELATED TO INDUSTRIALDEVELOPMENT, SPECIAL ECONOMIC ZONES
AND ENVIRONMENTAL ISSUES INANDHRA PRADESH


ARTICLE / 27
PERFORMANCE OF GRANITE INDUSTRY IN
CHITTOOR DISTRICT OF ANDHRA PRADESH
Vasu Jalari & M. Devarajulu
INTRODUCTION
Andhra Pradesh is one of the major producers of granite in India and handful of quarry
owners, skilled workers and artisans from Kuppam in Chittoor district controlled the art of
chiselling, making monuments of granite products and exports, until some form of demand
and international market was developed in the late 1970’s. Financial institutions gave finance
liberally to the granite entrepreneurs, who ever had approached them with a plan to establish
granite processing unit within the state. The change in approach in tune with the policy
change has resulted in increasing grant of funds to granite firms.
The Government of India through the Granite Development Council, brought in, “Granite
Conservation and Development Rules-1999” effective from 1-6-1999 for sustainable growth
and development of granite industry in the country as well as in state. The State of Andhra
Pradesh intends to modify its APMMC Rules in tune with Granite Conservation and
Development Rules-1999 to stabilize the initial advantage gained by the state with popular
orientation and encouragement. The Andhra Pradesh government has recognized granite as
one of the four focused minerals in its Vision-2020 and envisages a growth rate of 10 to 15
per cent.
GRANITES IN ANDHRA PRADESH
Several occurrences of commercially known granites of acceptable quality are found in
different igneous and metamorphic terrain of Andhra Pradesh. Seventeen out of twenty three
districts are known for the occurrence of different varieties of granites, which shows the vast
and inexhaustible potential of granite resources in the state. Different types of rocks suitable
for the use as decorative and dimensional stones are found in Chittoor, Prakasam, Ananthapur,
Guntur, Srikakulam, Vijayanagaram and Kurnool districts of Andhra Pradesh.
The Black granite varieties are available predominantly in the district of Prakasam and
to some extent in Anantapur, Kurnool and Chittoor districts, while the coloured like Pink,
Post-Doctoral fellow, Dept. of Economics, Sri Venkateswara University, Tirupati.Professor, Dept. of Economics, Sri Venkateswara University, Tirupati.
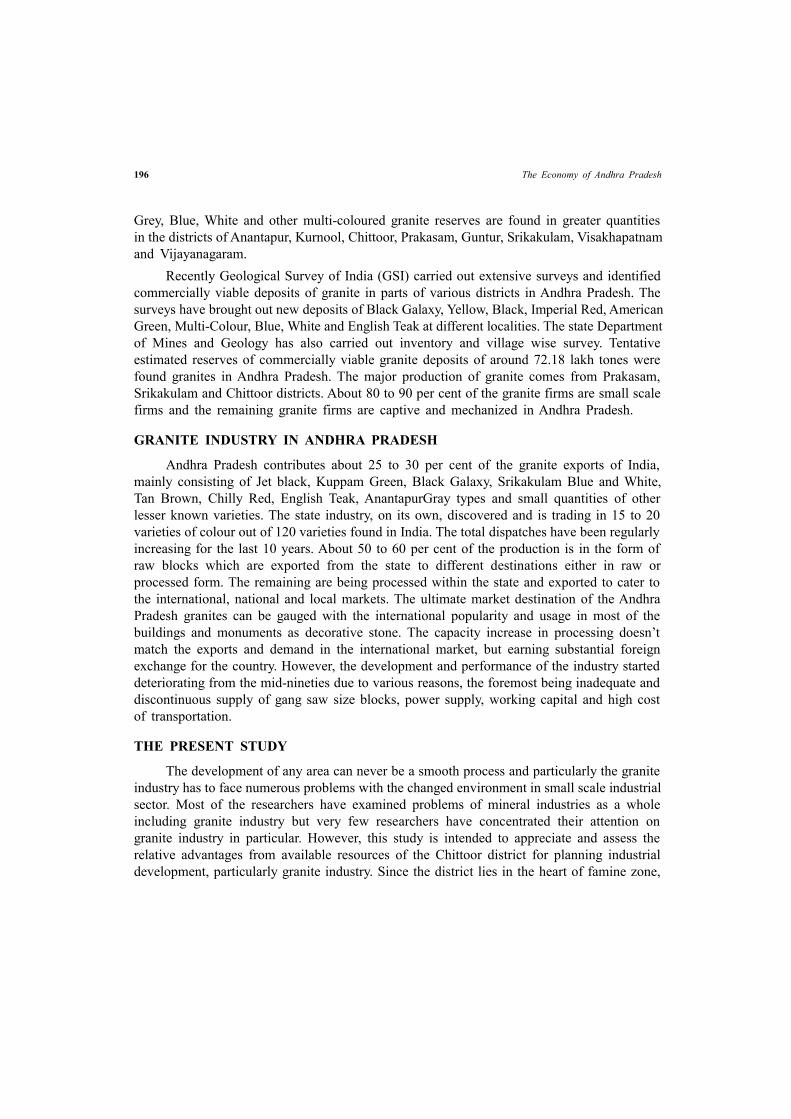
196 The Economy of Andhra Pradesh
Grey, Blue, White and other multi-coloured granite reserves are found in greater quantities
in the districts of Anantapur, Kurnool, Chittoor, Prakasam, Guntur, Srikakulam, Visakhapatnam
and Vijayanagaram.
Recently Geological Survey of India (GSI) carried out extensive surveys and identified
commercially viable deposits of granite in parts of various districts in Andhra Pradesh. The
surveys have brought out new deposits of Black Galaxy, Yellow, Black, Imperial Red, American
Green, Multi-Colour, Blue, White and English Teak at different localities. The state Department
of Mines and Geology has also carried out inventory and village wise survey. Tentative
estimated reserves of commercially viable granite deposits of around 72.18 lakh tones were
found granites in Andhra Pradesh. The major production of granite comes from Prakasam,
Srikakulam and Chittoor districts. About 80 to 90 per cent of the granite firms are small scale
firms and the remaining granite firms are captive and mechanized in Andhra Pradesh.
GRANITE INDUSTRY IN ANDHRA PRADESH
Andhra Pradesh contributes about 25 to 30 per cent of the granite exports of India,
mainly consisting of Jet black, Kuppam Green, Black Galaxy, Srikakulam Blue and White,
Tan Brown, Chilly Red, English Teak, AnantapurGray types and small quantities of other
lesser known varieties. The state industry, on its own, discovered and is trading in 15 to 20
varieties of colour out of 120 varieties found in India. The total dispatches have been regularly
increasing for the last 10 years. About 50 to 60 per cent of the production is in the form of
raw blocks which are exported from the state to different destinations either in raw or
processed form. The remaining are being processed within the state and exported to cater to
the international, national and local markets. The ultimate market destination of the Andhra
Pradesh granites can be gauged with the international popularity and usage in most of the
buildings and monuments as decorative stone. The capacity increase in processing doesn’t
match the exports and demand in the international market, but earning substantial foreign
exchange for the country. However, the development and performance of the industry started
deteriorating from the mid-nineties due to various reasons, the foremost being inadequate and
discontinuous supply of gang saw size blocks, power supply, working capital and high cost
of transportation.
THE PRESENT STUDY
The development of any area can never be a smooth process and particularly the granite
industry has to face numerous problems with the changed environment in small scale industrial
sector. Most of the researchers have examined problems of mineral industries as a whole
including granite industry but very few researchers have concentrated their attention on
granite industry in particular. However, this study is intended to appreciate and assess the
relative advantages from available resources of the Chittoor district for planning industrial
development, particularly granite industry. Since the district lies in the heart of famine zone,

197
the granite industry is very suitable for achieving faster industrial development in Chittoor
district. Though the government is offering some incentives and adopting favorable mineral
policies and programs for the development of granite industry, the growth and progress of the
granite industries in Chittoor district or elsewhere in the State has been relatively slow and
not very encouraging.
Most of the granite units are operating under certain technical and economic handicaps.
Though the granite industries facing a number of problems in the district, it is income and
employment generating industry in the study area. The study is mainly designed to analyze
the growth pattern, location aspects, entrepreneurial evolution, structure of manpower and
capital, the operational conditions and problems of granite industrial units in Chittoor district.
These aspects have been studied with a view to find solutions to the problems and at the same
time to offer strategies to be adopted and followed for achieving higher growth rate of granite
units with desirable growth in employment opportunities.
OBJECTIVES
The present paper aims at the following objectives:
1. To analyse the performance of granite industry in Chittoor district
2. To study the ownership and employment pattern of granite industry in Chittoor
district
METHODOLOGY
Chittoor district in Andhra Pradesh is taken as the study area as it is one of the districts
in Andhra Pradesh having the highest number of granite units. Granite industry has brought
some significant improvement in Chittoor district due to conducive atmosphere, availability
of capital, suitable entrepreneurship, cheap labour, transport facilities, and being able to
procure raw material getting from neighbouring states like Tamil Nadu and Karnataka.
While designing the study, it was decided to study only the information those units
which have already been established under the definition of small scale industry in Chittoor
district.
The study is mainly based on the secondary data collected from different sources.
Secondary data was collected from the Directorate of Industries, District Industries Centre
(DIC) of Chittoor district, Ministry of Mines and Indian Bureau of Mines (IBM).
REFERENCE PERIOD
The study has a reference period from 2000-01 and2010-11 relating to the coverage of
secondary data information related to granite industry in Chittoor district.
Performance of Granite Industry in Chittoor District • VASU JALARI & M. DEVARAJULU
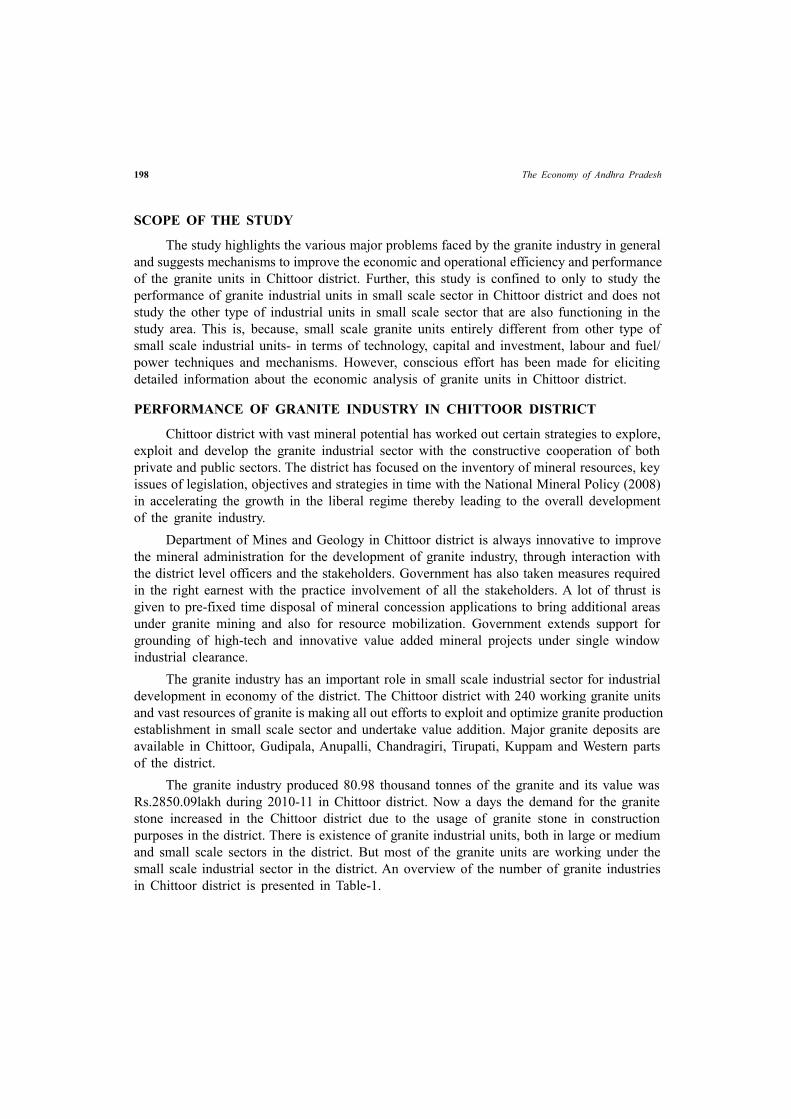
198 The Economy of Andhra Pradesh
SCOPE OF THE STUDY
The study highlights the various major problems faced by the granite industry in general
and suggests mechanisms to improve the economic and operational efficiency and performance
of the granite units in Chittoor district. Further, this study is confined to only to study the
performance of granite industrial units in small scale sector in Chittoor district and does not
study the other type of industrial units in small scale sector that are also functioning in the
study area. This is, because, small scale granite units entirely different from other type of
small scale industrial units- in terms of technology, capital and investment, labour and fuel/
power techniques and mechanisms. However, conscious effort has been made for eliciting
detailed information about the economic analysis of granite units in Chittoor district.
PERFORMANCE OF GRANITE INDUSTRY IN CHITTOOR DISTRICT
Chittoor district with vast mineral potential has worked out certain strategies to explore,
exploit and develop the granite industrial sector with the constructive cooperation of both
private and public sectors. The district has focused on the inventory of mineral resources, key
issues of legislation, objectives and strategies in time with the National Mineral Policy (2008)
in accelerating the growth in the liberal regime thereby leading to the overall development
of the granite industry.
Department of Mines and Geology in Chittoor district is always innovative to improve
the mineral administration for the development of granite industry, through interaction with
the district level officers and the stakeholders. Government has also taken measures required
in the right earnest with the practice involvement of all the stakeholders. A lot of thrust is
given to pre-fixed time disposal of mineral concession applications to bring additional areas
under granite mining and also for resource mobilization. Government extends support for
grounding of high-tech and innovative value added mineral projects under single window
industrial clearance.
The granite industry has an important role in small scale industrial sector for industrial
development in economy of the district. The Chittoor district with 240 working granite units
and vast resources of granite is making all out efforts to exploit and optimize granite production
establishment in small scale sector and undertake value addition. Major granite deposits are
available in Chittoor, Gudipala, Anupalli, Chandragiri, Tirupati, Kuppam and Western parts
of the district.
The granite industry produced 80.98 thousand tonnes of the granite and its value was
Rs.2850.09lakh during 2010-11 in Chittoor district. Now a days the demand for the granite
stone increased in the Chittoor district due to the usage of granite stone in construction
purposes in the district. There is existence of granite industrial units, both in large or medium
and small scale sectors in the district. But most of the granite units are working under the
small scale industrial sector in the district. An overview of the number of granite industries
in Chittoor district is presented in Table-1.

199
Table-1
Year-wise Working and Non-working Granite Industries in Chittoor District
Sl. No.(1) Years(2) Working(3) Non-working(4) Total(5) Column 3 Column 4 as
as a % of a % column
column 5(6) 6(7)
1 2000-01 153 17 170 90.00 10.00
2 2001-02 161 25 186 86.56 13.44
3 2002-03 164 31 195 84.10 15.90
4 2003-04 169 21 190 88.95 11.05
5 2004-05 180 27 207 86.96 13.04
6 2005-06 193 14 207 93.24 6.76
7 2006-07 210 24 234 89.74 10.26
8 2007-08 224 29 253 88.54 11.46
9 2008-09 222 30 252 88.10 11.90
10 2009-10 231 20 251 92.03 7.97
11 2010-11 240 25 265 90.57 9.43
Source: Dept. of Mines and Geology, Chittoor
The Table-1points out that there are working and non-working granite units in Chittoor
district. The data reveals that the total number of working units has increased from 153 units
in 2000-01 to 240 units in 2010-11. On the other hand, the total number of non-working units
increased from 17 units in 2000-01 to 25 units in 2010-11. Therefore, the total number of
working and non-working units has increased from 170 in 2000-01 to 265 units by 2010-11.
Hence it is observed that development of granite units in Chittoor district is slow during the
period 2000-01 to 2010-11.
Most of the granite units are owned and operated by forward and backward social
groups in the district as shown in Table-2
Table – 2
Social category-wise Distribution of Working Granite Units in Chittoor District 2010-11
S. No Social Category Number of Units Percentage to Total
1. Open Category 211 87.92
2. Backward Castes 24 10.00
3. Scheduled Caste 5 2.08
4. Scheduled Tribes Nil Nil
Total 240 100.00
Source: Dept. of Mines and Geology, Chittoor
Performance of Granite Industry in Chittoor District • VASU JALARI & M. DEVARAJULU

200 The Economy of Andhra Pradesh
Out of the total 240 Granite units, 87.92 per cent of the units belong to the persons
belonging to open category castes. The units owned by persons of backward classes account
for 10 per cent and only 2.08 per cent of the units are owned by the scheduled castes. The
Schedule Tribes, do not own granite units in the study area. This shows that majority of the
Granite units are owned and managed by forward castes and some by the backward castes.
The distribution of granite units by social category-wise is very disappointing in Chittoordistrict.
PATTERN OF OWNERSHIP
Table – 3
Distribution of Granite Units by the Type Organization in Study Area by 2010-11
Sl. No Type of Organization No. of Units Percentage to Total
1. Proprietary 114 47.50
2. Partnership 118 49.17
3. Private Limited 8 3.33
Total 240 100.00
Source: Asst. Geologist, Dept. of Mines and Geology, Chittoor
The Table-3 shows that out of 240units, 47.50 per cent are proprietary concerns, 49.17
per cent are partnership firms and the remaining 3.33 per cent are private limited companies.
The data reveals that most of the granite industrial units are partnership concerns, proprietary
units and are capital – intensive in nature.
LOCATION OF GRANITE UNITS
Table – 4
Geographical Distribution of Granite Units in Chittoor District - 2010-11
Sl. No Name of the Mandal No. of Units Percentage to Total
1. Bangarpalyam 13 5.42
2. Chittoor (Rural & Urban) 104 43.33
3. G. D. Nellore 14 5.83
4. Gudipala 31 12.92
5. Irala 2 0.83
6. Penumur 2 0.83
7. Yadamari 19 7.92
8. Tirupati (Rural& Urban) 9 3.75
9. Renigunta 7 2.92
10. B. N. Kandriga 2 0.83

201
Sl. No Name of the Mandal No. of Units Percentage to Total
11. Nagari 1 0.42
12 Madanapalle 4 1.67
13 Palamaner 11 4.58
14 Kuppam 21 8.75
Total 240 100.00
Source: General Manager, District Industries Centre, Chittoor
Among the revenue mandals in Chittoor district, granite industry is located in 14 mandals
as shown in Table-4.
The Table-4 shows that there were 240 Granite units functioning in different mandals
of Chittoor district as on 2010-2011. Among the mandals, Chittoor stands first place with
43.33 per cent of granite units and Nagari occupies the last position with the 0.42 per cent.
Gudipala Mandal is in second position. It has 12.92 per cent of granite units.8.75 per cent
of the units are located in Kuppam and remaining 11 mandals have 35.0 per cent of units
located in Chittoor district.
TRENDS IN FIXED INVESTMENT IN GRANITE INDUSTRY
Table-5 gives the details of trends in fixed investment that granite industries have in
Chittoor district.
Table – 5
Fixed Investment on Granite Units in Chittoor District 2001 - 2011
Sl. No Year Fixed Investment (Rs. In. Crore)
1. 2000-01 36.10
2. 2001-02 39.15
3. 2002-03 43.02
4. 2003-04 47.12
5. 2004-05 50.55
6. 2005-06 56.64
7. 2006-07 61.05
8. 2007-08 68.00
9. 2008-09 79.47
10 2009-10 91.97
11 2010-11 96.06
Source: 1. Dept. of Mines and Geology, Chittoor
2. District Industrial Centre, Chittoor
Performance of Granite Industry in Chittoor District • VASU JALARI & M. DEVARAJULU

202 The Economy of Andhra Pradesh
The fixed investment of granite industrial units (in. crore) in Chittoor district is shown
in Table-5. The investment in granite industrial units has increased from Rs.36.10Crore in
2000-01 to Rs.96.06Crore by 2010-11. Therefore, the granite industrial units in Chittoor
district have registered considerable growth in terms of fixed investment over the years.
EMPLOYMENT GENERATION IN GRANITE UNITS
The Table-6 presents the employment provided by the granite units in the study area.
Table – 6
Employment Generated by Granite Units in Chittoor District from 2001 to 2011
Sl. No Year Employment (In. Persons)
1 2000-01 840
2 2001-02 905
3 2002-03 978
4 2003-04 1024
5 2004-05 1065
6 2005-06 1040
7 2006-07 1065
8 2007-08 1154
9 2008-09 1427
10 2009-10 1764
11 2010-11 2034
Source: Dept. of Mines and Geology, Chittoor
The employment provided by the granite industrial units has increased from 840 persons
in 2000-01 to 2034 persons by 2010-11. Hence the employment opportunities are increasing
significantly in the granite industrial units over the years. Therefore, the granite industry and
its development certainly led to more employment opportunities in the district.
PRODUCTION OF GRANITE
Table-7 presents the production of granite and its value of in Chittoor district.
The Table-7 reveals the details of production of granite in Chittoor district and the data
reveals that in physical terms, the granite industry could produce highest quantity at 81.25
thousand tonnes during the year 2005-06 and in terms of value of granite, it was highest
during the year 2008-09. However, during the years 2009-10 and 2010-11, the production and
value of granite did not touch the production and value of granite that was recorded during
the previous years (2005-06 and 2008-09).
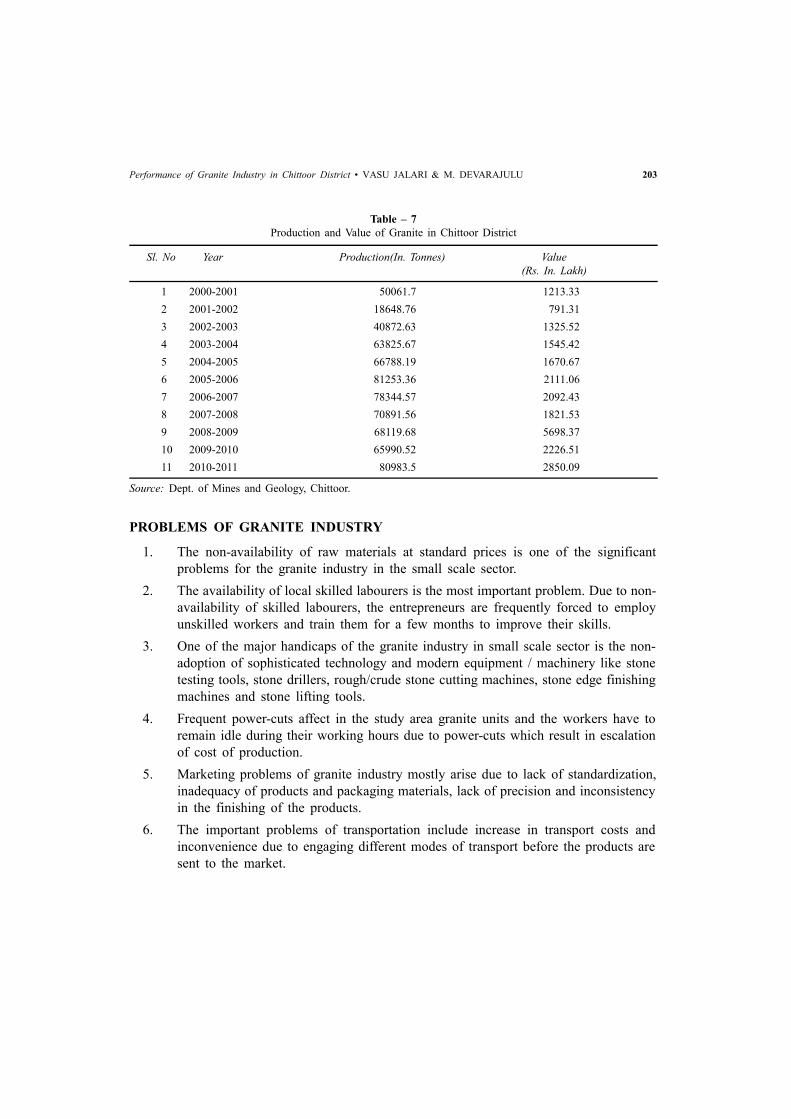
203
Table – 7
Production and Value of Granite in Chittoor District
Sl. No Year Production(In. Tonnes) Value
(Rs. In. Lakh)
1 2000-2001 50061.7 1213.33
2 2001-2002 18648.76 791.31
3 2002-2003 40872.63 1325.52
4 2003-2004 63825.67 1545.42
5 2004-2005 66788.19 1670.67
6 2005-2006 81253.36 2111.06
7 2006-2007 78344.57 2092.43
8 2007-2008 70891.56 1821.53
9 2008-2009 68119.68 5698.37
10 2009-2010 65990.52 2226.51
11 2010-2011 80983.5 2850.09
Source: Dept. of Mines and Geology, Chittoor.
PROBLEMS OF GRANITE INDUSTRY
1. The non-availability of raw materials at standard prices is one of the significant
problems for the granite industry in the small scale sector.
2. The availability of local skilled labourers is the most important problem. Due to non-
availability of skilled labourers, the entrepreneurs are frequently forced to employ
unskilled workers and train them for a few months to improve their skills.
3. One of the major handicaps of the granite industry in small scale sector is the non-
adoption of sophisticated technology and modern equipment / machinery like stone
testing tools, stone drillers, rough/crude stone cutting machines, stone edge finishing
machines and stone lifting tools.
4. Frequent power-cuts affect in the study area granite units and the workers have to
remain idle during their working hours due to power-cuts which result in escalation
of cost of production.
5. Marketing problems of granite industry mostly arise due to lack of standardization,
inadequacy of products and packaging materials, lack of precision and inconsistency
in the finishing of the products.
6. The important problems of transportation include increase in transport costs and
inconvenience due to engaging different modes of transport before the products are
sent to the market.
Performance of Granite Industry in Chittoor District • VASU JALARI & M. DEVARAJULU

204 The Economy of Andhra Pradesh
SUGGESTIONS
On the basis of analysis made in the paper, a few suggestions are put forward for the
accelerated growth of granite industry in Chittoor district.
Efforts are needed from the government agencies to overcome the problems of lack
of skilled labour, power and competition by providing necessary mechanism.
Attempt should be made to provide easy, cheap and adequate finance and transportation
facilities to granite units. Providing transportation subsidy to granite industry is very
essential.
Special care should be taken by the government to equip the disadvantaged groups
with enough aid and liberal finances with concessional rates to undertake the starting
of granite industrial units in the district.
The government should take action to ensure that liberal financial assistance through
financial institutions to meet the working capital needs.
It is necessary to establish manpower training centers for skilling the unskilled labourers
working in granite industries.
The suggestions given above, if implemented sincerely, certainly eases out the problems
of granite industry in the small scale sector and help for its development and better performance
to a large extent in Chittoor district of Andhra Pradesh.
CONCLUSIONS
The study highlights the suitability and relevance of granite industrial units in Chittoor
district’s economic development in the context of resource constraints, particularly capital
resources. The granite industrial units are less capital intensive and labour absorbing. The
findings of the study reveal that the performance and development of granite industry in terms
of generation of employment, increase in production and profitability was not up to the
optimum level. It was because of several problems faced by the granite industry which require
attention of the policy makers. Suitable strategy has to be evolved to develop granite industry,
make them technologically strong and to help them to compete with other types of units in
SSI sector in the context of globalisation.
REFERENCES
1. Ministry of Mines and Minerals (development and Regulation) Act 1957. “Granite Reserves in India”
2. T.E. Raja Simhan - “Granite Industry Seeks Fiscal Relief to Survive Recession”– Businessline (Dated:
13.03.2009)
3. Recession Hits Granite Exports from Srikakulam –www.Businessline.com (Dated: 16-03-2009)
4. T.E. Raja Simhan-Draft Granite Policy Fails to Address Key Issues, Says Industry,
www.businessline.com (Dated: 17-07-2009)

205
5. N.V. Bhagavantha Reddy (Assistant Director Mines and Geology,) 2009,The Global Recession had
AffectedtheirRevenue Collections
6. K.M. Dayashankar, “Recession affects granite industry”. The Hindu-23-january-2009
7. VenugopalKarva”Global Economic Crisis had affected the Granite Business in Karimnagar District”–
(2009), www.hindubusinessline.com
8. Andhra Pradesh Minor Mineral Concession Rules, 1966
9. Granite Conservation and Development rules, 1999
10. Department of Mines and Geology, Government of Andhra Pradesh
11. Commissioner of Industries, Government of Andhra Pradesh
12. District Industry Centre, Chittoor
13. Statistical Abstract - 2011, Chief Planning Officer (CPO), Chittoor
14. Various Annual Reports, Department of Mines and Geology, Chittoor
Performance of Granite Industry in Chittoor District • VASU JALARI & M. DEVARAJULU

206 The Economy of Andhra Pradesh
ARTICLE / 28
INDUSTRIAL AIR POLLUTION AND ITS EFFECTS
ON HEALTH – A CASE STUDY OF CHITTOOR
DISTRICT OF ANDHRA PRADESH
C. Gangaiah, M. Ramanjaneyulu & M. Prabhu
INTRODUCTION
Clean and pure air is very essential for human health and survival. The air we breathe
is an essential ingredient for our wellbeing and a healthy life. Unfortunately polluted air is
common throughout the world (EPHA, 2009). Air is one of the most important constituents
of man’s environment. An average human being requires about 12kg of air each day, which
is nearly 12 to 15 times greater than the amount of food the consumers, Polluted air contains
one, or more, hazardous substance, pollutant, or contaminated that creates a hazards to
general health. Air pollution in cities causes a shorter lifespan for city dwellers.
According to Mishra (2003) rapid growth in urban population, increasing industrialization,
and rising demand for energy and motor vehicle are the worsening air pollution levels. He
added other factors, such as poor environmental regulation, less efficient technology of
production, congested roads, and age and poor maintenance of vehicles, also add to the
problems.
Air pollution has acquired critical dimensions and the air quality in most Indian cities
that monitor outdoor air pollution fail to meet WHO guidelines for safe levels. The levels of
PM 2.5 and PM10 (Airborne particles smaller than 2.5 micrometers in diameter and 10
micrometers in diameter) as well as concentration of dangerous carcinogenic Substances such
as Sulphur Dioxide (SO2) and Nitrogen Dioxide (NO
2) have reached to the alarming proportions
in most Indian cities, putting people at additional risk of respiratory diseases and other health
hazards.
According to Prakash Jawadekar, Minister of Environment and Forest, Govt. of India
(2015) every year 2 crore people are affected by respiratory problems and diseases such as
Suffocation, Asthma, lung infection, Cancer, Allergy and Skin diseases) and 2006 to 2015
35,616 lives were lost due to the air pollution and most of the cases were from West Bengal,
Professor, Department of Economics, S.V.University, TirupatiProfessor, Department of Economics, Banguluru University, Banguluru.Post Doctoral Fellow, Department of Economics, S.V.University

207
and newly bifurcate states Andhra Pradesh and Telangana occupied second place. Thus air
pollution is generally a disequilibrium condition of air caused due to the introduction of
foreign elements from natural and man-made sources to the air so that it becomes injurious
to biological communities.
CONSTITUTIONAL PROVISION AND ENVIRONMENT
Very few countries in the world have incorporated specific provisions relating to
environment protection in their Constitutions. India is one among them. Prior to 42 nd
Amendment in the year 1976 there was no direct provision relating to environment in the
Constitution of India, the principal of Stockholm Declaration, which was held in the year
1972, were incorporated in the Constitution of India through 42 nd Amendment. Article 48-A
and Article 51-A were the result of 42nd Amendment. Article 48-A was introduced in the IV
Chapter, which deals with the Directive Principles of State Policy. “The State shall endeavor
to protect and improve the environment and to safeguard the forests and wildlife of the
country”. “It shall be the duty of every citizen of India to protect and improve the natural
environment including forests, lakes, river and wildlife, and to have compassion for living
creatures “.
OBJECTIVE OF THE STUDY
1. to identify the sources of air pollution.
2. to identify the impact of air pollution on health of the people; and
3. to analyze the effects (diseases) of air pollution on the family members of the
respondents households.
METHODOLOGY
Purposive sampling method has been adopted in the present study and according to the
information provided by the office of Andhra Pradesh Pollution Control Board, Tirupati
branch in Chittoor District; there are seven types of polluting industrial units in Chittoor
District. Depending upon the level of pollution caused by effluents discharged by these units,
they are classified into three categories, viz. Red, Orange and Green units. The Red category
units are highly polluted units, the Orange category units are relatively less (moderate) polluted
units and Green category units are pollution free units. For the purpose of present study,
Chittoor district, which falls under the Red category of industrial pollution was purposely
selected for the investigation. From each of the 7 types of Red category units, one unit has
been purposively selected for the study. The village and households residing in and around
these units were listed out carefully. From each category about 40 households were selected
using Simple Random Sampling method without Replacement (SRSWR). The sample size of
the study is 280 households. The questionnaire was designed and pre-tested and data was
collected by personal interview method.
Industrial Air Pollution and its Effects on Health • C. GANGAIAH, M. RAMANJANEYULU & M. PRABHU

208 The Economy of Andhra Pradesh
SOURCES OF AIR POLLUTION
The different industrial units which are causing air pollution are presented in the
Table 1.
Table – 1
Sources of Air Pollution in the Study Area
S.No. Sources of Category of Industries
Air Pollution
Agro Forest Textile Mineral Engineering Animal Chemical Total
Based Based Based Based Based Based Based
1 Industrial Smoke, dust 37 36 39 40 28 38 38 256
(14.45) (14.06) (15.23) (15.62) (10.93) (14.84) (14.84) (91.42)
2 Domestic Smoke, dust 3 4 1 - 12 2 2 24
(12) (16.66) (4.16) (50.00) (8.33) (8.33) (8.57)
3 Total 40 40 40 40 40 40 40 280
(100.00 )
Note : Figures in parentheses indicate the Percentage to total
Source: Field survey data
The table 1 reveals that there are two major sources of air pollution – industrial and
domestic sources. The seven industrial activities are the major sources of air pollution in the
study area, besides domestic smoke and dust. It was observed that among 280 sample
households, 256 households (91.4 per cent) were found suffering from industrial smoke and
dust and 24 households from domestic smoke and dust. Different industries, textiles, mineral
animal based and chemical based units are the major sources of air pollution.
IMPACT OF AIR POLLUTION (PROBLEMS)
The impact of air pollution caused by the different industrial units is presented in the
Table 2.
The table 2 portrays that 954 household members of the 1388 members (68.73) were
found affected by industrial pollutants located in and around of the units. Majority of the
sample population (31.97%) were found suffering from suffocation, nearly 238 respondents
(24.94 %) were suffering from Allergy, about 179 respondents (18.76 %) were suffering from
common cold and cough, 156 respondents (16.35 %) were suffering from Eye irritation and
about 76 respondents (7.56) were suffering from hair fall. Moreover, majority of the respondents
in Mineral and chemical based industry were suffering a lot due to the Industrial pollutants.
The data indicate that majority of the members of the sample households 56.9 per cent) were
found affected by suffocation and allergy in the study area.
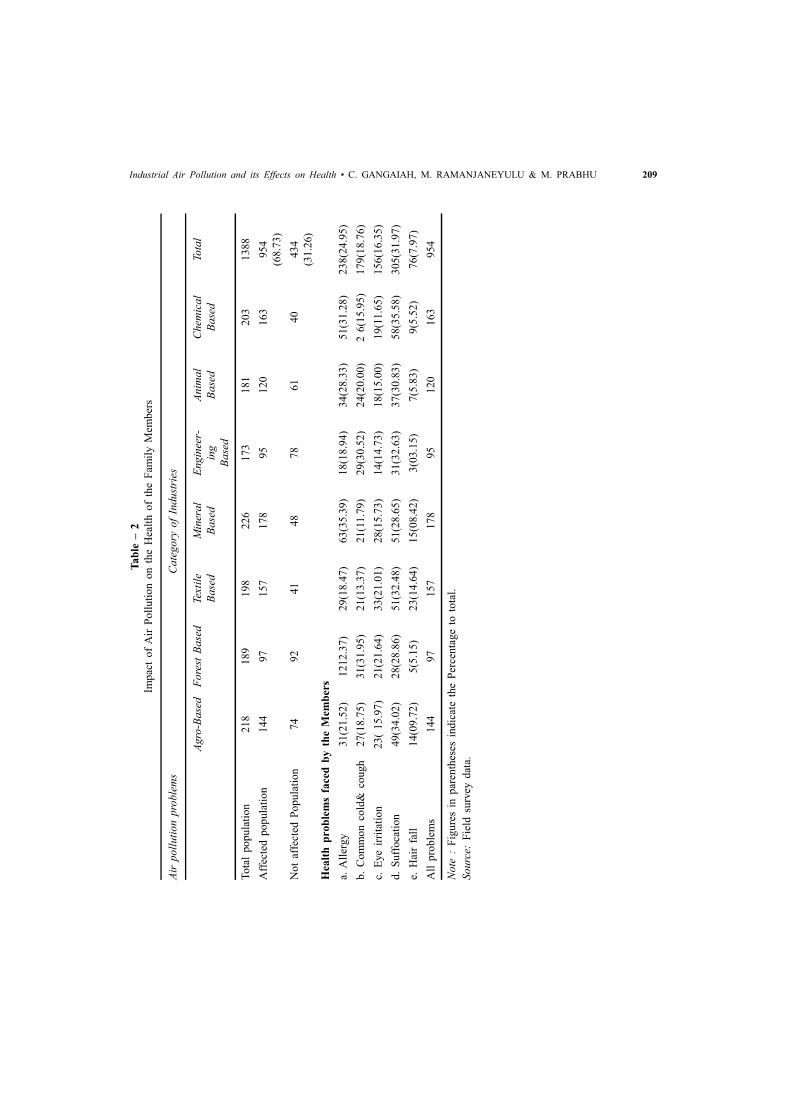
209
Ta
ble
– 2
Impac
t o
f A
ir P
oll
uti
on
on t
he
Hea
lth o
f th
e F
amil
y M
emb
ers
Air
po
lluti
on
pro
ble
ms
Ca
teg
ory
of
Indu
stri
es
Ag
ro-B
ase
dF
ore
st B
ase
dTe
xtil
eM
iner
al
En
gin
eer-
Anim
al
Chem
ical
Tota
l
Ba
sed
Ba
sed
ing
Base
dB
ase
d
Ba
sed
Tota
l po
pu
lati
on
218
189
198
226
173
18
12
03
13
88
Aff
ecte
d p
opula
tio
n1
44
97
157
178
95
12
01
63
95
4
(68
.73
)
Not
affe
cted
Popu
lati
on
74
92
41
48
78
61
40
43
4
(31
.26
)
Hea
lth
pro
ble
ms
face
d b
y t
he
Mem
ber
s
a. A
ller
gy
31(2
1.5
2)
121
2.3
7)
29(1
8.4
7)
63(3
5.3
9)
18(1
8.9
4)
34
(28.3
3)
51
(31.2
8)
23
8(2
4.9
5)
b.
Com
mon
cold
& c
ou
gh
27(1
8.7
5)
31(3
1.9
5)
21(1
3.3
7)
21(1
1.7
9)
29(3
0.5
2)
24
(20.0
0)
2 6
(15
.95)
17
9(1
8.7
6)
c. E
ye
irri
tati
on
23(
15
.97
)2
1(2
1.6
4)
33(2
1.0
1)
28(1
5.7
3)
14(1
4.7
3)
18
(15.0
0)
19
(11
.65
)1
56
(16
.35
)
d.
Su
ffoca
tion
49(3
4.0
2)
28(2
8.8
6)
51(3
2.4
8)
51(2
8.6
5)
31(3
2.6
3)
37
(30.8
3)
58
(35.5
8)
30
5(3
1.9
7)
e. H
air
fall
14(0
9.7
2)
5(5
.15
)2
3(1
4.6
4)
15(0
8.4
2)
3(0
3.1
5)
7(5
.83
)9
(5.5
2)
76
(7.9
7)
All
pro
ble
ms
144
97
157
178
95
12
01
63
95
4
Note
: F
igu
res
in p
aren
thes
es i
nd
icat
e th
e P
erce
nta
ge
to t
ota
l.
So
urc
e: F
ield
surv
ey d
ata.
Industrial Air Pollution and its Effects on Health • C. GANGAIAH, M. RAMANJANEYULU & M. PRABHU

210 The Economy of Andhra Pradesh
Ta
ble
– 3
Dis
ease
s ca
use
d b
y A
ir p
oll
uti
on
Nam
e of
Dis
ease
Ca
teg
ory
of
Indu
stri
es
Ag
ro-B
ase
dF
ore
st B
ase
dTe
xtil
eM
iner
al
En
gin
eer-
Anim
al
Chem
ical
Tota
l
Ba
sed
Ba
sed
ing
Base
dB
ase
d
Ba
sed
Tota
l po
pu
lati
on
218
189
198
226
173
18
12
03
13
88
Aff
ecte
d d
isea
ses
135
88
11
31
94
73
95
17
18
69
(62
.60
)
Non
aff
ecte
d8
31
01
85
32
100
86
32
51
9(3
7.3
9)
Dis
ease
s
a. S
kin
dis
ease
s3
6(2
6.6
6)
18(2
0.4
5)
16(1
4.1
5)
51(2
6.2
8)
13(1
7.8
0)
34
(35.7
8)
54
(31.5
7)
22
2(2
5.5
4)
b.
Lu
ng C
ance
r4
(2.9
6)
1(1
.13
)6
(5.3
0)
9(4
.63
)-
-8
(4.6
7)
28
(3.2
2)
c. P
neu
mon
ia3
(2.2
2)
6(6
.81
)-
11
(5.6
7)
6(8
.21
)4
(4.2
1)
17
(30.3
5)
47
(5.4
0)
d.
TB
11
(8.1
4)
9(1
0.2
2)
13(1
1.5
0)
16(8
.24)
2(2
.73
)7
(7.3
6)
13
(7.6
0)
71
(8.1
7)
e. C
hes
t A
ller
gy
9(6
.66
)4
(4.5
4)
8(7
.07
)1
4(7
.21)
5(6
.84
)6
(6.3
1)
14
(8.1
8)
60
(6.9
0)
f. U
lcer
23(1
7.0
3)
16(1
8.1
8)
19(1
6.8
1)
26(1
3.4
0)
19(2
6.0
2)
15
(15.7
8)
9(5
.26
)1
27
(14
.61
)
g.
Ast
hm
a4
9(3
6.2
9)
34(3
8.6
3)
51(4
5.1
3)
67(3
4.5
3)
28(3
8.3
5)
29
(30.5
2)
56
(32.7
4)
31
4(3
6.1
3)
Tota
l1
35
88
11
31
94
73
95
17
18
69
Note
: F
igure
s in
par
enth
eses
ind
icat
e th
e P
erce
nta
ge
to t
ota
l
So
urc
e: F
ield
surv
ey d
ata
211
DISEASES CAUSED BY AIR POLLUTION
The effect of Air Pollution caused some chronic disease in the study area and the details
are presented in the Table-3.
The table 3 depicts that 869 family members of the sample households were found
affected by diseases (62.60%) due to the air pollution in and around of the households located
around the units. Majority of the sample (36.13%) were suffering from Asthma, while 222
members (25.54%) were suffering from Skin diseases. Nearly 127 respondents (14.61 %)
were suffering from ulcers, 71 members (8.17 %) were suffering from TB, while 60 members
(6.90 %) were suffering from Chest Allergy. Nearly 47 members (5.40%) were suffering from
Pneumonia and 28 (3.22%) members were suffering from Lung Cancer. It indicates that
majority of the respondents’ family members suffering from skin diseases and asthma.
CONCLUSION
Environmental economists believe that environmental quality is a normal good and
citizens of poorer countries may demand a lower level of environment quality.The industrial
air pollution causes to be polluted and in turn becomes human health hazard. Majority of the
family members were facing different problems and getting different types of diseases like
skin, lung cancer, pneumonia, TB, allergy, ulcer, asthma etc. Andhra Pradesh Pollution Control
Board should implement stringiest pollution control measures and take initiation to make
sound environmental policies for well being of the people in the study area.
REFERENCES
1. Prakash Nalleti, Industrial Growth and Environmental Degradation: a case study of Tiruppur Textile
cluster, working paper, Madras school of Economics, June 2007. p.5-10
2. Hemadri Barman “Industrialization and Environmental pollution” document available in internet
2013.p.1-2.
3. http:// www.wced.org.in
4. N. Hanley and Colin R. Roberts, Issues in Environmental Economics, 2002.p.23.
5. www.worldbank.com
6. Charles D Kolstad, “Environmental Economics”, Oxford Université Press, 2000.p.14.
7. Report of the UN Conference on Environment and Development (UNCED) held at Rio de Janerio
in 1992.
8. U. Sankar “Environmental Economics”, Oxford University Press, 2001.
9. (http://lifeofearth.org)
10. (http//www.moef.gov.in)
Industrial Air Pollution and its Effects on Health • C. GANGAIAH, M. RAMANJANEYULU & M. PRABHU

212 The Economy of Andhra Pradesh
ARTICLE / 29
SPECIAL ECONOMIC ZONES IN
ANDHRA PRADESH : AN EMPIRICAL STUDY
Sadu Rajesh
INTRODUCTION
The UNDP Human Development Reports since 1994 initiated new paradigm of
development. This new paradigm had put people at the centre of development. This paradigm
proposed to judge development not only on the basis of economic growth but most importantly
its contribution to basic human capabilities-health, education and adjusted real GDP per
capita. Development is judged on the basis of its contribution to the creation of HDI-Human
Development Index. Further, renowned economist Amartya Sen (1999) viewed Development
as a process of expanding the real freedoms that people enjoy. So any economic development
activity is required to be evaluated in terms of its contribution, at least, to HDI and expansion
of real freedom of the people in general and the people of the geographical area where the
activity is undertaken.
The Indian economy was liberalized under the stewardship of Dr. Manmohan Singh the
then Finance Minister of India in 1991. In the name of integrating Indian economy with the
world and inviting FDI in to India Manmohan Singh brought in structural adjustments and
the Indian state slowly began to transform itself, under the influence of Capital. In this
abnegation process Special Economic Zones (SEZs) was the new development paradigm in
India.
THE PRESENT STUDY
A field study was conducted in United Andhra Pradesh selecting 4 SEZs and Primary
data was collected from 220 households, who are having under the geographical jurisdiction
of these selected SEZs with the following objectives :
OBJECTIVES
(i) To elucidate the emergence of the SEZ formation in India as well as in United
Andhra Pradesh.
(ii) To study the socio-economic conditions of the selected respondents.
Assistant Professor, Dept. of Economics, Kakatiya University, Warangal-Telangana State.

213
(iii) To examine the land acquisition and compensations, and the problem of employment
generation due to the establishment of SEZs in Andhra Pradesh.
METHODOLOGY
The data was collected from the primary and secondary sources. The primary data was
collected based on a survey 220 households. The survey was conducted Polepally SEZ
(Mahabubnagar), Kakinada SEZ (East Godavari), Apache SEZ (Nellore), Sricity SEZ (Chitoor)
in United Andhra Pradesh. The secondary data was collected from various research journals
and opinion of eminent scholars, Commerce Ministry, Govt. of India, APIIC etc.
A structured questionnaire was canvassed among the respondents living under the
jurisdiction of the SEZ area for eliciting their views on the issues that have cropped up one
to the land acquisition programs by the SEZ authorities as well as the opportunities.
SOCIO-ECONOMIC CONDITIONS
An attempt is made to present the social status, occupations and ownership of land
holdings of the sample respondents. The following tables present these details;
Table – 1
Social Status of the Respondents
S.No Name of the SEZ B.C S.C S.T OTHERS TOTAL
1 SRICITY SEZ 22(40.0) 27(49.1) 4(7.3) 2(3.6) 55(100.0)
2 KAKINADA SEZ 31(56.4) 24(43.6) - - 55(100.0)
3 POLEPALLY SEZ 25(45.5) 10(18.2) 14(25.5) 6(10.9) 55(100.0)
4 APACHE SEZ 15(27.3) 30(54.5) 9(16.4) 1(1.8) 55(100.0)
All Sample SEZs 93(42.3) 91(41.3) 27(12.3) 9(4.1) 220(100.0)
Source: Field study
Note: Figures in brackets indicate parentages.
The caste configuration of the respondents shows that almost an equal number belong
to B.Cs and S.Cs whose per cent in the total sample are 42.3 and 41.4 respectively, while S.Ts
have 12.3 per cent in the whole sample. Others account for 4.1 per cent. In each sub sample
representation of ST and others can be found except at Kakinada SEZ. In Polepally SEZ area,
we find a sizeable number of S.Ts, who form one fourth of the sub-sample and their number
is greater than S.Cs in that SEZ area. On the other hand in APCHE SEZ area, S.Cs are greater
in number than the other three categories.
The details of occupation of the sample respondents are presented in Table-2.
The occupation particulars of the respondents as shown in Table- 2 indicates that of the
total number of respondents, 33.6 per cent are engaged in agriculture, 34.5 per cent in
Special Economic Zones in Andhra Pradesh • SADU RAJESH

214 The Economy of Andhra Pradesh
agricultural labour and the remaining, 18.29 per cent are employees. While other occupations
have lesser percentages such as 2.3 per cent in the case of weavers, 0.5per cent each from
business and fishing. The remaining 10.5per cent belongs to other work. Majority of the
respondents are engaging in agriculture at Kakinada SEZ area accounting for 87.3 per cent,
while it is almost insignificant at 1.8% in Apache SEZ area. But agricultural labourers have
a considerable presence in the sub-sample of Apache SEZ area with 61.8 per cent followed
by employees with 23.6 per cent. But employees account for relatively high percentage at
Polepally SEZ area, while those who belong to other work have also a considerable percent
at Polepally SEZ. In the SRICITY SEZ, agricultural labour and agriculture put together have
two –thirds of the total sub-sample, whole employees have the next higher percent in this
SEZ area. Thus the peculiarity of Kakinada SEZ area is that all the respondents were found
exclusively dependent on agriculture.
Table – 2
Occupation Particulars of the Respondents of Selected SEZs
Name of Agricul- Agricultural Busi- Employee Fishing Handloom Other work Total
the SEZ area ture Labour ness
SRICITY SEZ 15(27.3) 22(40.0) - 13(23.6) 1(1.8) - 4(7.3) 55(100.0)
KAKINADA SEZ 48(87.3) 7(12.7) - - - - - 55(100.0)
POLEPALLY SEZ 10(18.2) 13(23.6) 1(1.8) 14(25.5) - 4(7.3) 13(23.6) 55(100.0)
APCHE SEZ 1(1.8) 34(61.8) - 13(23.6) - 1(1.8) 6(10.6) 55(100.0)
TOTAL 74(33.6) 76(34.5) 1(0.5) 40(18.2) 1(0.5) 5(2.3) 23(10.5) 220(100.0)
Source: Field Study
LAND OWNED
Information was collected from the respondents on the extent of land that they owned.
The details are presented in Table-3.
Table – 3
Extent of Land Particulars of the Selected SEZs
Name of the SEZ 0-2.5 Acres 2.5-5 Acres 5-10 Acres 10-25Acres No Land Total
SRI CITY SEZ 45(81.8) 6(10.9) 2(3.6) - 2(3.6) 55(100.0)
KAKINADASEZ 33(60.0) 15(27.3) 7(12.7) - - 55(100.0)
POLEPALLYSEZ 32(58.2) 12(21.8 ) 2(3.6) 2(3.6) 7(12.7) 55(100.0)
APCHE SEZ 21(38.2) 6(10.9) 2(3.6) - 26(47.3) 55(100.0)
TOTAL 131(59.5) 39(17.70) 13(5.9) 2(1.0) 35(15.9) 220(100.0)
Source: Field Study
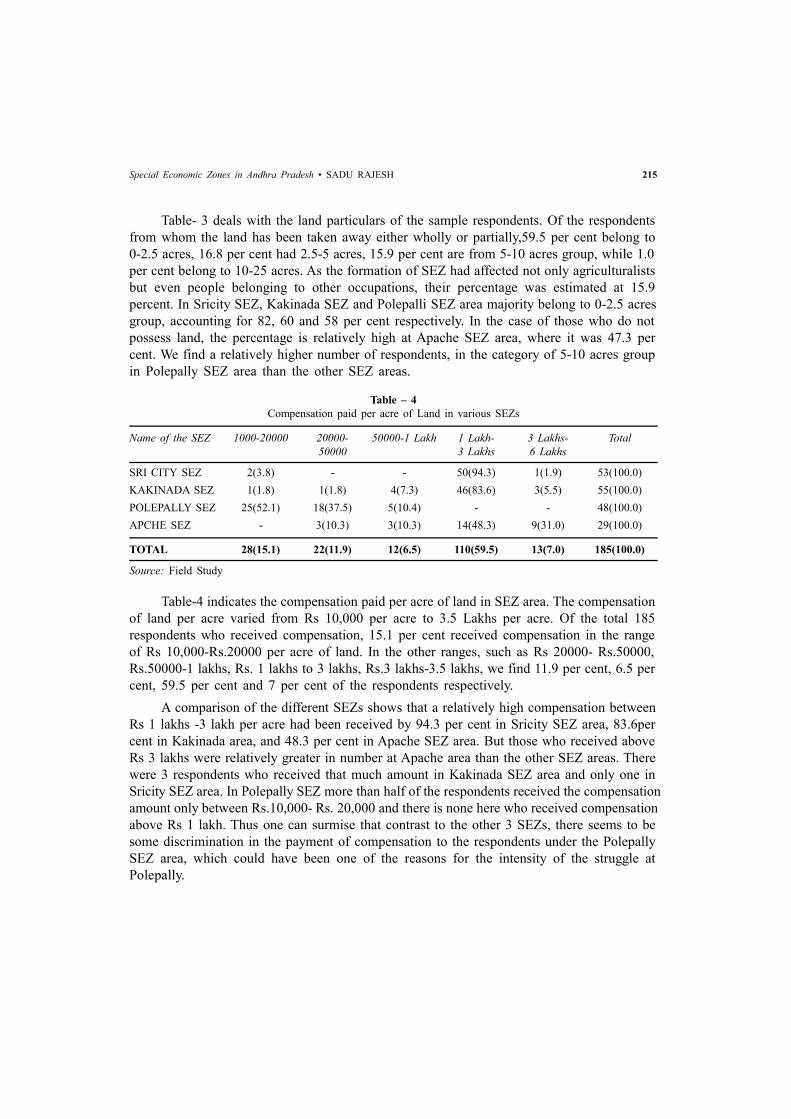
215
Table- 3 deals with the land particulars of the sample respondents. Of the respondents
from whom the land has been taken away either wholly or partially,59.5 per cent belong to
0-2.5 acres, 16.8 per cent had 2.5-5 acres, 15.9 per cent are from 5-10 acres group, while 1.0
per cent belong to 10-25 acres. As the formation of SEZ had affected not only agriculturalists
but even people belonging to other occupations, their percentage was estimated at 15.9
percent. In Sricity SEZ, Kakinada SEZ and Polepalli SEZ area majority belong to 0-2.5 acres
group, accounting for 82, 60 and 58 per cent respectively. In the case of those who do not
possess land, the percentage is relatively high at Apache SEZ area, where it was 47.3 per
cent. We find a relatively higher number of respondents, in the category of 5-10 acres group
in Polepally SEZ area than the other SEZ areas.
Table – 4
Compensation paid per acre of Land in various SEZs
Name of the SEZ 1000-20000 20000- 50000-1 Lakh 1 Lakh- 3 Lakhs- Total
50000 3 Lakhs 6 Lakhs
SRI CITY SEZ 2(3.8) - - 50(94.3) 1(1.9) 53(100.0)
KAKINADA SEZ 1(1.8) 1(1.8) 4(7.3) 46(83.6) 3(5.5) 55(100.0)
POLEPALLY SEZ 25(52.1) 18(37.5) 5(10.4) - - 48(100.0)
APCHE SEZ - 3(10.3) 3(10.3) 14(48.3) 9(31.0) 29(100.0)
TOTAL 28(15.1) 22(11.9) 12(6.5) 110(59.5) 13(7.0) 185(100.0)
Source: Field Study
Table-4 indicates the compensation paid per acre of land in SEZ area. The compensation
of land per acre varied from Rs 10,000 per acre to 3.5 Lakhs per acre. Of the total 185
respondents who received compensation, 15.1 per cent received compensation in the range
of Rs 10,000-Rs.20000 per acre of land. In the other ranges, such as Rs 20000- Rs.50000,
Rs.50000-1 lakhs, Rs. 1 lakhs to 3 lakhs, Rs.3 lakhs-3.5 lakhs, we find 11.9 per cent, 6.5 per
cent, 59.5 per cent and 7 per cent of the respondents respectively.
A comparison of the different SEZs shows that a relatively high compensation between
Rs 1 lakhs -3 lakh per acre had been received by 94.3 per cent in Sricity SEZ area, 83.6per
cent in Kakinada area, and 48.3 per cent in Apache SEZ area. But those who received above
Rs 3 lakhs were relatively greater in number at Apache area than the other SEZ areas. There
were 3 respondents who received that much amount in Kakinada SEZ area and only one in
Sricity SEZ area. In Polepally SEZ more than half of the respondents received the compensation
amount only between Rs.10,000- Rs. 20,000 and there is none here who received compensation
above Rs 1 lakh. Thus one can surmise that contrast to the other 3 SEZs, there seems to be
some discrimination in the payment of compensation to the respondents under the Polepally
SEZ area, which could have been one of the reasons for the intensity of the struggle at
Polepally.
Special Economic Zones in Andhra Pradesh • SADU RAJESH

216 The Economy of Andhra Pradesh
Table – 5
Number of Workers from Locals in selected SEZs
Name of the 1-2 members 3-4 members 5-6 members No workers Total
SEZ Area
SRI CITY SEZ 24(43.6) - - 31(56.4) 55(100.0)
POLEPALLYSEZ 28(50.9) - - 27(49.1) 55(100.0)
APCHE SEZ 34(61.8) 1(1.8) - 20(36.4) 55(100.0)
TOTAL 86(52.1) 1(0.6) - 78(47.3) 165(100.0)
As the SEZs are expected to provide employment to local people, some of the family
members of displaced farmers could get employment. Table-5 shows that their percentage is
above 50 per cent in Sri City SEZ, Polepally and Apache SEZ. As no factory is established
at Kakinada SEZ none were provided any employment. Only in the case of one respondent
at Apache SEZ, 3-4 members in their family were provided employment. But in all other
cases it was only 1-2 members (52.1 percent) who got employment in the SEZ that is
established in their village. Though promise was made to each household that they would get
employment, still 56.4 per cent, 49.1 per cent, and 36.4 per cent of the household members
of the respondents did not get any employment at Sricity SEZ, Polepally SEZ, and Apache
SEZ respectively.
Table – 6
Nature of the Employment in the SEZs
Name of the SEZ Area Security Technical Manager Daily wage Labour Total
SRI CITY SEZ 10(41.7) 3(12.5) 0(0.0) 11(45.8) 24(100.0)
POLEPALLYSEZ 3(10.7) 5(17.9) 1(3.6) 19(67.9) 28(100.0)
APACHESEZ - 23(65.7) - 12(34.3) 35(100.0)
TOTAL 13(14.9) 31(35.6) 1(1.1) 42(48.3) 87(100.0)
Source: Field Study
The type of employment provided for the members of respondents’ households (see
Table-6) shows that managerial job had been provided for one respondent at Polepally SEZ,
while 41.7per cent, of the respondents from the Sricity SEZ and 10.7 per cent of the respondents
in Polepally SEZ are working in the security wing. In the case of technical jobs 12.5 per cent,
17.9 per cent, and 65.7 per cent of the respondents were working at Sricity SEZ, Polepally
SEZ, and Apache SEZ respectively. Daily wage labour had been provided to 45.8 per cent,
67.9 per cent and 34.33 per cent of the respondent house hold members in Sri City SEZ,
Polepally SEZ, and Apache SEZ respectively. Thus, in a relative sense members of the
respondents’ households are mostly working as daily wage labourer than in the other categories
of employments, accounting for more than 63.0 per cent in low paid jobs.

217
Table – 7
Suicidal Cases Registered in Selected SEZs
Name of the SEZ 1 2 No Total
SRI CITY SEZ - - 55(100.0) 55(100.0)
KAKINADASEZ - - 55(100.0) 55(100.0)
POLEPALLYSEZ 32(58.2) 4(7.3) 19(34.5) 55(100.0)
APACHE SEZ - - 55(100.0) 55(100.0)
TOTAL 32(14.5) 4(1.8) 184(83.6) 220(100.0)
Source: Field Study
Table-7 highlights the registered suicidal cases in various SEZ areas. A further probe
about the consequences of the formation of SEZ indicated that in Polepally SEZ alone there
were one suicide each from 32 households and 2 suicides per household from 4 households,
showing the deleterious effects of the SEZ establishment on the respondents’ families. All
those who had witnessed suicides in Polepally SEZ have said that no compensation had been
paid to them.
CONCLUSION
Policies designed by the governments for the development of the nation probably affect
the people. SEZ policy is for the development of the country. These developmental policies
have economic, political and social impact on our society. Land needed for the establishment
of the SEZs also affected the economic crises of the country. New type of employment of
generation also affects the economy of the nation (Aseem Shrivastava, 2007). The
macroeconomic changes driven by SEZs push the country down the path of increasing socio-
economic, political crisis.
One of the main issues is related with SEZ is land accumulated for SEZs. Many state
governments are in the process of establishing SEZs. The issue of displacement, compensation
or land price, rehabilitation, residential property development and land speculation, the threat
of possible relocation of units from other parts of the state to SEZs and the consequent loss
of revenue must achieve due attention . Farmers are protesting against the forced acquisition
of their lands (Bijoiny Mohanthy, 1997 & S.C Hazary). The development of SEZs would lead
to the destruction of employment of peasants whose land is acquired and creates very little
employment for high skilled persons and total net employment generated might well be
negative. Handing over thousands of hectares of land cheaply to promoters of industry and
relaxing the laws of the land, including those that relate to the welfare of the industrial
workers, protection of the environment, taxation, are assumed to promote industrialization
and solve the nagging unemployment problem of the country overnight.
Special Economic Zones in Andhra Pradesh • SADU RAJESH

218 The Economy of Andhra Pradesh
The people affected by SEZs have a special connotation as it unveils in economic
process that is likely to emerge in near future, if the SEZs can create a belief that the lives
of the people can be improved by them. But not even a single family living these SEZs area
holds a positive opinion about the SEZ, though they did not experience economic progress
in the past. After the forceful seizure of their land with their further loss of their animal
husbandry and a meagre compensation, the basic question raised by them was how to lead
their lives as they have lost their land which was a basic source of their livelihood. This raises
a fundamental question and being for whose sake this type of development is intended where
the government used measures for setting up of such SEZs. Can such a sub-model of industrial
development like SEZ would lead to sustainable development?
REFERENCES
1. UNDP [1994]: Human Development Report.
2. Amartya Sen [1999]: Development as Freedom, Oxford University Press.
3. Aseem Shrivastava [2007]: SEZs: A Catalogue of questions, Info change analysis, http://
ww.infochangeindia.org/analysis167.jsp.
4. Bijoiny Mohanthy and S.C Hazary (Ed) [1997]: Political Economy of India. Retrospect and Prospects
(New Delhi: APH Publications).

219
ARTICLE / 30
INDUSTRIAL DEVELOPMENT OF
ANDHRA PRADESH
D. Nagayya & Balla Appa Rao
INTRODUCTION
Andhra Pradesh, the tenth largest State in India in terms of population, and seventh in
terms of area, is endowed with rich natural resources & mineral wealth, and boasts of the
second longest coastline in the country. With visionary political leadership, strong government
mandate, and proactive administrators, the State is poised to capitalize on its business friendly
policies, and robust physical, social and industrial infrastructure. Andhra Pradesh is poised to
be among India’s three best states by 2022, and a developed State by 2029.
The State has accorded top priority to industrial and infrastructure growth, and intends
to position the State as the most preferred destination for investors by providing favorable
business climate, excellent infrastructure, good law and order, and cordial industrial relations.
The Government has introduced various investor-friendly policies for different sectors to
facilitate availability of resources, provide conducive industrial environment, develop state-
of-the art infrastructure, foster innovation and create employment opportunities. Andhra Pradesh
has already made an impact through its investor-friendly initiative by being ranked as the 2 nd
best state in the country on Ease of Doing Business as per a report by the World Bank. The
State has put in place a Single Desk portal to provide clearances/approvals within 21 working
days to set up an industry in the state.
Andhra Pradesh is strategically located on the South-eastern coast of India, and is a
natural gate way to East and South East Asia. The state has a population of 4.96 crore (as
per Population Census 2011), accounting for 4 per cent of the country’s population residing
in 4.9 per cent of the country’s geographical area. The State is blessed with abundant natural
resources, fertile land and river basins, water resources, extensive canal system, and conducive
agro-climatic conditions. The State has the second longest coastline in the country (974 km),
next only to Gujarat, and is also one of the largest producers of marine products.
Consultant on Small and Medium Enterprises at Guntur, and former Director (Industrial Development),National Institute for Micro, Small and Medium Enterprises (ni-msme), Yousufguda, Hyderabad.UGC Emeritus Professor, Department of Commerce and Management Studies, Andhra University,Visakhapatnam (Andhra Pradesh).

220 The Economy of Andhra Pradesh
The state registered Gross Value Added (GVA) at constant 2011-12 prices for 2015-16
(AE – Advance estimates) at Rs.4,55,484 crore as against Rs. 4,12,188 crore during 2014-
15 (FRE – first revised estimate), and registered growth of 10.50% (India 6.8%). The
corresponding sectoral growth rates are 8.4% for agriculture (India 1.12%), 11.13% for
industry (India 7.35%), and 11.39% in services sector (India 9.19%). The GSDP for the state
at constant 2011-12 prices for 2015-16 (AE), is estimated at Rs. 4,93,641 crore as against Rs.
4,44,752 crore of 2014-15 (FRE), and registered growth of 10.99% whereas all India
corresponding growth rate was 7.6%. During 2015-16, out of eight major states which have
released GSDP estimates, AP stood first with 10.99% GSDP growth rate at constant prices,
followed by Bihar (10.27%), MP (10.16%), Telangana (9.24%), Maharashtra (8%), Karnataka
(6.2%), Odisha (6.16%), and Punjab (5.96%).
The State has focused on setting an enabling platform through quality power, developing
industrial land banks and skilled resource base across the state. Andhra Padesh is the 1 st state
in South India to offer 24X7 power to industry, and is heading towards achieving a total
installed capacity of about 29,000 MW by 2019 (the present installed capacity is around
10,222 MW). The State has also created one of the largest industrial land banks in the
country. Currently, over 300,000 acres of industrial land bank is available, and the focus is
on further adding 700,000 acres, resulting in a total planned land bank of 1 million acres.
Andhra Pradesh plays host to two large industrial corridors - Visakhapatnam–Chennai Industrial
Corridor, and Chennai-Bengaluru Industrial Corridor, which is expected to bring in US$ 2
billion investments. A third Industrial Corridor from Bengaluru to Kurnool is planned, thereby
ensuring that all the 13 districts in the State are covered.
The State is also developing a Greenfield capital city in Amaravati covering 217 sq km
of capital city area, and 7420 sq km of Capital region area. Amaravati is planned to be
developed as a “futuristic” world-class city with expected population of 13 million by 2050.
Andhra Pradesh is India’s Sunrise State, and is on the path of immense growth. The Partnership
Summit of CII (Confederation of Indian Industry) organized at Visakhapatnam, and the focus
Andhra Pradesh presentations at the Davos World Economic Forum in Switzerland, both
during January 2016, have conveyed the keenness of the State to march ahead in a planned
way at a fast pace.
OVERVIEW OF INDUSTRIAL AND IT SECTOR SCENARIO
Visakhapatnam has emerged as a major industrial centre and has major public and
private sector establishments producing industrial goods ranging from steel, metals, petroleum,
polymers, fertilizers, heavy engineering equipment, and also facilitates ship building, ports &
fishing. Kakinada has multiple fertilizer refineries and produces natural gas from the offshore
of Krishna-Godavari (KG) basin. Kakinada also exports seafood and related products, and
produces agricultural products like rice and corn, edible oils, oil meals, processed food
products, chemicals, biofuel, etc.

221
Vijayawada is famous for processing of agricultural products, automobile body building,
hardware, textiles, consumer goods, and small scale industries. Andhra Pradesh has one major
port at Visakhapatnam and several medium sized ports like Gangavaram, Kakinada &
Krishnapatnam; which account for large export of cargo traffic. There are several large power
plants and major ones are established at Visakhapatnam, Vijayawada, Kakinada, Krishnapatnam,
and Kadapa. The state is also emerging in – information technology and biotechnology.
Visakhapatnam has emerged as the main hub of industrialization and IT Sector. The IT/ITES
revenues of the city alone is at Rs.14.45 billion (US $230 million) in 2012-13. The development
of IT in Tier –II and Tier –III cities like Vijayawada, Kakinada and Tirupati is also improving.
In the fiscal year 2012 -13, Vijayawada’s IT/ITES revenues were Rs. 1152.6 million (US $19
million), while Tirupati with Rs. 693 million (US $11 million), and Kakinada with Rs. 615.4
million (US $ 10 million) are showing signs of progress. Other key sectors such as Pharma,
Power, banking & financial, automobile, tourism, textiles, retail, leather and tourism also
contribute significantly to the economy of the state.
FINDINGS OF WORLD BANK SURVEY ON EASE OF DOING BUSINESS IN INDIA
AND RANKING OF STATES
Survey on Ease of Doing Business in India 2015 carried out by the World Bank is
revealed in the overall assessment with eight indicators, Gujarat was adjudged the first State
with a score of 71.14% of reforms, followed by Andhra Pradesh second (70.12%), and the
largest recipients of foreign direct investments, Maharashtra and Tamil Nadu are ranked
eighth and twelfth, respectively, with less than 50% score. The ranks reflect the ease of doing
business in these States by small and medium enterprises rather than foreign investors. The
report places Andhra Pradesh in the league of ‘Aspiring Leaders,’ alongside six others –
Chhattisgarh, Gujarat, Jharkhand, Madhya Pradesh, Odisha, and Rajasthan with an overall
implementation score of business reforms of 50-75 per cent.
INDICATOR AND THE FIRST FIVE STATES FOR EIGHT ITEMS
(a) Setting up of a Business: 1. Punjab, 2. Andhra Pradesh, 3. Chhattisgarh, 4. Odisha,
5. Rajasthan.
(b) Allotment of land and obtaining construction permits: 1. Madhya Pradesh, 2. Gujarat,
3. Maharashtra, 4. Rajasthan, 5. Andhra Pradesh.
(c) Obtaining Infrastructure related utilities: 1. Maharashtra, 2. Gujarat, 3. Madhya
Pradesh, 4. Delhi, 5. Andhra Pradesh.
(d) Registering and Complying with tax procedures: 1. Karnataka, 2. Andhra Pradesh, 3.
Rajasthan, 4. Odisha, 5. Madhya Pradesh.
(e) Complying with Environmental clearance procedures: 1. Gujarat, 2. Andhra Pradesh,
3. Rajasthan, 4. Punjab, 5. Madhya Pradesh.
Industrial Development of Andhra Pradesh • D. NAGAYYA & BALLA APPA RAO

222 The Economy of Andhra Pradesh
(f) Complying with labour regulations: 1. Jharkhand, 2. Gujarat, 3. Chhattisgarh, 4.
Andhra Pradesh, 5. Uttar Pradesh.
(g) Carrying out inspections: 1. Jharkhand, 2. Gujarat, 3. Andhra Pradesh, 4. Chhattisgarh,
5. Rajasthan.
(h) Enforcing Contracts: Andhra Pradesh did not figure in the list of top five States.
The Director of Industries, Andhra Pradesh highlighted the major contribution of the
State to be ranked as second in this survey. Online single window / desk clearance system
made a breakthrough for the State. 24 clearances related to 16 departments are given at one
location through the single desk portal.
The Business Reforms Report of the World Bank commended Andhra Pradesh for the
hassle–free nature of its Single Desk Portal, which provides a robust foundation for a conducive
business environment in the State. The State was appreciated for providing clarity on application
approval timelines, which helps entrepreneurs in better planning of investment. The Report
gave prominence to the following healthy practices of the State. The Single Desk Policy
2015-20 of the State was formulated to create a facilitative ecosystem to provide all clearances
/ approvals within 21 working days to set up an industry. It is planned to bring it down to
14 days. All relevant competent authorities are mandated to receive applications and process
the same only via the Single Desk Mechanism. This mechanism provides for State clearances
required for starting an industry across pre-establishment and pre-operation phases. A Chief
Minister’s dash board has been designed as a tool for effective monitoring of the applications
received.
The Single Desk Policy aims to create a conducive ecosystem to provide all clearances
required to set up the industry within the specified time. Various institutional mechanisms at
state and district level have been put in place to simplify processes and procedures. A Single
Desk Portal is also implemented for ensuring real time monitoring and course correction. To
simplify the regulatory framework, the government introduced the Ease of doing Business
wherein an MSME unit has to fill in a single one page self-declaration online form called
Udyog Aadhaar. Online filing on this portal can be done in just three minutes to get registration
without spending any money.
PATTERN OF DISPERSAL AND GROWTH OF MSMES
Table 1 presents the dispersal pattern of large industries and MSMEs at the end of
March 2015 district-wise and region-wise. The thirteen districts of the State are grouped into
three regions for purposes of analysis. Coastal Andhra region is presented in North Coastal
Andhra (4 districts), and South Coastal Andhra (5 districts) sub-regions. Rayalaseema with
4 districts is the other region. Table 2 presents growth of MSMEs in the state – district-wise
and region-wise for the periods ending March 2006 and 2015, along with compound annual
growth for this period.

223
At end-March 2015, the share and status of large industries scenario district-wise (Tables
1&2) reveal as follows: Total enterprises for the State number 1762, with fixed investment
of Rs. 77,292 crore, and employment of 4.26 lakh persons. Among the regions, in terms of
fixed investment and employment, North Coastal Andhra stands first, with Visakhapatnam
and East Govadavari as the leading districts. North Coastal Andhra accounts for 32.3% of
enterprises, 43.9% of fixed investment, and 39.0% of employment. Coastal Andhra region
accounts for 75.5% of enterprises, 70.1% of fixed investment, and 76.3% of employment.
Rayalaseema region accounts for 24.5% of enterprises, 29.9% of fixed investment, and 23.7%
of employment. Among the South Coastal districts, Guntur stands first with 8.0% of fixed
investment and 10.4% of employment, Krishna stands next with 6.8% of fixed investment,
and 7.6% of employment. Among the Rayalaseema districts, in respect of fixed investment,
Kurnool stands first (8.6%), followed by YSR Kadapa (7.7%), Ananthapur (7.5%), and Chittoor
(6.1%). In terms of employment, Chittoor stands first (8.4%), followed by Ananthapur (6.3%),
Kurnool (5%), and YSR Kadapa (4.0%). At the end of September 2015, the position of large
and mega industries is as follows: 1,784 enterprises, Rs. 81,261 crore fixed investment,
employment of 4.36 lakhs. Out of 22 enterprises added during April- September 2015, the
major addition in investment and employment was in the districts of Visakhapatnam, Chittoor,
Krishna, SPSR Nellore, and Srikakulam.
At end-March 2015, the share, status, and growth of the MSME scenario district-wise
reveal as follows (Tables A & 2). Total MSMEs for the State number 1,09,399, with fixed
investment of Rs. 19,000 crore, and employment of 12.09 lakhs. Among the three regions,
South Coastal region stands number one with greater dispersal – 44.7% of enterprises, 42.5%
of fixed investment, and 44.3% of employment. Among the districts of this region, Prakasam
tops the list in all the three indicators – 21.6% of enterprises, 22.4% of fixed investment, and
21.8% of employment. Other districts stand at a distance, with Guntur and Krishna as next
in prominence in all the indicators. Dispersal is thus greater in South Coastal region, compared
to North coastal region. Coastal region accounts for 82.1% of fixed investment, 74.8% of
employment, and 70.7% of number of enterprises. Rayalaseema region accounts for 29.3%
of enterprises, 17.9% of fixed investment, and 25.2% of employment. Here again, dispersal
is illustrated with YSR Kadapa and Chittoor standing as first and second in share of fixed
investment, employment, and number of enterprises. In respect of large enterprises, Chittoor
stands first in employment, whereas Kurnool stands first in fixed investment. Ananthapur
stands second in fixed investment and employment.
Growth trend in MSME sector district-wise for 2006-15 period reveals as follows: In
respect of fixed investment, North Coastal Andhra stands first (29.3%), followed by
Rayalaseema (24.0%), and South Coastal Andhra (23.9%), with the state position as 25.8%.
In respect of employment, as against the state position of 6.2%, Rayalaseema stands first
(8.1%), and the other regions record around 5.6%. In respect of number of units also
Rayalaseema records 7.3%, compared to South Coastal of 4.1%, and North Coastal of 0.8%.
Increase in number of enterprises in North Coastal is low, the state position being 3.9%. The
Industrial Development of Andhra Pradesh • D. NAGAYYA & BALLA APPA RAO

224 The Economy of Andhra Pradesh
districts where growth in fixed investment is higher than the state average (25.8%) are:
Visakhapatnam (35.1%), and Prakasam (42.9%). Though dispersal and growth are reasonably
good, in respect of MSMEs, the districts lagging behind are North Coastal districts of
Srikakulam and Vizianagaram, and all the four Rayalaseema districts. These districts need
special attention to enable them to catch up with the developed districts of the State. The
same pattern is noticed in respect of the share of large industries in these six districts. In
accelerating industrialization, including MSMEs, one of the programmes which contributed
significantly is the growth centre approach of the Centre, implemented from 1990s in three
districts – Hindupur in Ananthapur district, Ongole in Prakasam district, and Bobbili
inVizianagaram district.
Table – 1
Status of Large and Mega Industries in Andhra Pradesh -District-wise and Region-wise (end-March 2015)
District / Region Number of Enterprises Fixed investment (Rs.crore) Employment (Persons)
1 2 3 4
Andhra Pradesh 1762 (100) 77292.1 (100) 426355 (100)
Srikakulam 99 (5.6) 1341.2 (1.7) 14563 (3.4)
Vizianagaram 62 (3.5) 3141.7 (4.1) 33848 (7.9)
Visakhapatnam 192 (10.9) 15573.8 (20.2) 67967 (16.0)
East Godavari 217 (12.3) 13855.0 (17.9) 49893 (11.7)
North Coastal Andhra 570 (32.3) 33911.7 (43.9) 166271 (39.0)
West Godavari 160 (9.1) 1976.8 (2.6) 26807 (6.3)
Krishna 169 (9.6) 5285.1 (6.8) 32515 (7.6)
Guntur 204 (11.6) 6180.3 (8.0) 44303 (10.4)
Prakasam 84 (4.7) 1717.4 (2.2) 16436 (3.9)
SPSR Nellore 144 (8.2) 5084.9 (6.6) 39058 (9.1)
South Coastal Andhra 761 (43.2) 20244.5 (26.2) 159119 (37.3)
Coastal Andhra 1331 (75.5) 54156.2 (70.1) 325390 (76.3)
YSR Kadapa 43 (2.5) 5960.3 (7.7) 17189 (4.0)
Kurnool 138 (7.8) 6643.7 (8.6) 21279 (5.0)
Ananthapur 92 (5.2) 5782.1 (7.5) 26619 (6.3)
Chittoor 158 (9.0) 4749.8 (6.1) 35878 (8.4)
Rayalaseema 431 (24.5) 231353.9 (29.9) 100965 (23.7)
Notes: 1. The data covers medium industries registered up to 2005-06, and from 2006-07, this category is included
in the MSME sector. 2. Figures given in parentheses indicate percentage to the State total.
Source: Commissioner of Industries, Andhra Pradesh, Hyderabad.

225
Table – 2
Growth of MSMEs in Andhra Pradesh–District-wise and Region-wise (2006 and 2015)
(Cumulative picture for the year ending March)
District / Region No. of enterprises Fixed investment(Rs.crore) Employment(persons)
2006 2015 CAGR (%) 2006 2015 CAGR (%) 2006 2015 CAGR (%)
1 2 3 4 5 6 7 8 9 10
Andhra Pradesh 77612 109399 3.9 2414.9 18999.6 25.8 702553 1208642 6.2
Srikakulam 4731 4879 0.3 104.7 464.5 18.0 40751 50773 2.5
Vizianagaram 3490 4019 1.6 80.9 552.3 23.8 30868 42834 3.7
Visakhapatnam 10231 8530 -2.0 295.6 4445.4 35.1 81163 152471 7.3
East Godavari 8151 11030 3.4 266.2 2070.7 25.6 73315 122760 5.9
North Coastal Andhra 26603 28458 0.8 747.4 7532.9 29.3 226097 368838 5.6
West Godavari 6897 7262 0.6 247.0 928.7 15.9 61471 77150 2.6
Krishna 8583 5752 -4.3 336.9 1114.9 14.2 80458 62038 -2.9
Guntur 7168 6914 -0.4 314.2 1160.2 15.6 71882 77734 0.9
Prakasam 5290 23658 18.1 171.2 4256.5 42.9 51652 263603 19.9
SPSR Nellore 6130 5323 -1.6 106.8 610.3 21.4 60042 54210 -1.1
South Coastal Andhra 34068 48909 4.1 1176.0 8070.6 23.9 325505 534735 5.7
Coastal Andhra 60671 77367 2.7 1923.4 15603.5 26.2 551602 903573 5.6
YSR Kadapa 3829 12237 13.8 77.7 1329.5 37.1 33629 115702 14.7
Kurnool 4337 4216 -0.3 133.4 502.3 15.9 38026 40480 0.7
Ananthapur 4696 7142 4.8 122.5 548.9 18.1 40281 59186 4.4
Chittoor 4079 8437 8.4 157.9 1015.4 23.0 39015 89701 9.7
Rayalaseema 16941 32032 7.3 491.5 3396.1 24.0 150951 305069 8.1
Note: The data covers medium industries registered from 2006-07 and those of earlier years are covered in the
large and mega industries category.
Source: Commissioner of Industries, Andhra Pradesh, Hyderabad.
EXPORT PROMOTION INDUSTRIAL PARKS (EPIPS), SOFTWARE TECHNOLOGY
PARKS (STPS), AND SPECIAL ECONOMIC ZONES (SEZS) IN THE STATE
Among the programmes of infrastructure development, initiated by the Union Government
with focus on exports, Special Economic Zones (SEZs) is a recent programme, with its earlier
programmes known as Export- processing Zones (EPZs), and Export Promotion Industrial
Parks (EPIPs), and 100 percent Export Oriented Units (EOUs). All infrastructure Programmes
implemented with export orientation are known as Export Promotion Industrial Parks.
Programmes other than SEZ are recalled first stating the position at the end of December
2015. This is followed by presentation of SEZs with district –wise and product group-wise
details of number and area covered in each district.
Industrial Development of Andhra Pradesh • D. NAGAYYA & BALLA APPA RAO

226 The Economy of Andhra Pradesh
Software Technology Parks (STPs) under the Software Technology Parks of India (STPI)
in the Union Department of Information Technology (DIT) were promoted in Tier I, Tier II
and Tier III cities. In Andhra Pradesh, these are in four locations – Visakhapatnam, Kakinada,
Vijayawada and Tirupati. Agricultural Export Zones (AEZs) under the Agricultural and
Processed Foods Export Development Authority (APEDA) have developed zones for
horticulture and floriculture. In Andhra Pradesh, there are three AEZs, Nuzvid (Krishna
District) for mangoes, Chittoor for fruits including mango, and Ananthapur for zherkins
(processed cucumbers). Under Spices Board, spices parks were promoted. In Guntur district
(Edlapadu mandal near Chilakaluripet), one spices park is in operation in an area of 125 acres
of land. Under the Ministry of Food Processing, food parks and mega food parks are being
promoted. At Kuppam and Chittoor in Chittoor district, food parks are in operation. A few
more are under consideration. Integerated Textile Parks are promoted by the Ministry of
Textiles. Apparel park is another name for it. Brandix India Apparel city has become operational
in Visakhapatnam district. A few others are at various stages of implementation. Under
various Ministries of the Union Government, apart from the specialized parks, a few 100%
export oriented units (EOUs) have also been promoted. In the new categories of Special
Economic Zones and Software Technology Parks (STPs), a variety of incentives and facilities
are provided by the Centre and State governments.
An Export Processing Zone (EPZ) is functioning at Duvvada, near Visakhapatnam. It
is converted into a Special Economic Zone. The biggest advantage for VEPZ is the
Visakhapatnam port which lies within 25 km from it. Visakhapatnam port trust is promoting
a port EXIM park in 800 acres of land, for allotment to port based industries with an
objective to promote industrialization of the hinterland, and to attract trade for the port.
Marine bio-tech park is being developed on 218 acres of land in Visakhapatnam. The State
Government proposes to develop 72 mini leather parks in various districts.
Government of Andhra Pradesh has proposed to set up integrated food parks in all the
districts. The categories of parks planned are: (a) integrated food park, (b) mega food park,
(c) ultra mega food park. Facilities available from the concerned national level organization
would be utilized, and private sector enterprises would be encouraged to develop enterprises,
availing facilities needed for food processing enterprises on the public – private participation
(PPP) mode. Commodity based cluster development was planned to enable a focused and
planned approach to developing the food processing industry based on the food production
strengths. Particularly for fruits, and vegetables and flowers.
Forty Special Economic Zones were formally approved for Andhra Pradesh during the
period 2006 to 2015 –comprising 28 in Coastal Andhra, and 12 in Rayalaseema. All the 13
districts are covered by the programme. Table 3 presents the district-wise distribution,
employment provided, value of production and exports and imports from the SEZs.
Visakhapatnam accounts for 12 SEZs and Anantapur for 7, Nellore stands next with 5, and
East Godavari 3. Multi – product SEZs are seven-one in Visakhapatnam, one in Kakinada

227
(East Godavari district) - sea port-based, and three in Nellore, one in Chittoor, and one in
Anantapur. Anantapur SEZ is of multi-services. Anantapur also has one Free Trade Ware
housing zone. IT sector is represented by nine zones, one each in Visakhapatnam, East
Godavari, Chittoor, YSR Kadapa, and Kurnool. Krishna and Guntur have 2 SEZs each in the
IT sector. Pharma zones are three in Visakhapatnam and one in Srikakulam. Bio-technology
is found in 3 zones in Anantapur. Textiles and Apparel parks are three - one each in
Visakhapatnam, Nellore, and Anantapur.
The other parks are engaged in the following product lines. Aluminium refining in
Visakhapatnam, alumina in Vizianagaram, food processing in East Godavari, writing and
printing paper in West Godvari, building materials in Prakasam, leather at Tada in Nellore,
bordering Tamil Nadu and close to Chennai, and aviation in Anantapur. Among the zones that
have gone into production, the prominent ones are Sri city in Chittoor district (multi-product),
and Tada for leather (Nellore district).
Table – 3
District-wise functioning SEZs in Andhra Pradesh
(value in Rs.crore) (end-September 2015)
S.No. District No.of Employ- Value of Investment Physical Physical
SEZs SEZs Production Incl. Exports Imports
(April – FDI (April- (April-Sept.
Sept. 2015) Sept. 2015) 2015)
1 Andhra Pradesh 40 62,895 4,295.31 17,185.64 3,354.94 2,556.31
2 Visakhapatnam 12 43,891 3,145.35 12,867.76 2,393.38 2,011.98
3 Vizianagaram 1 - - - - -
4 Srikakulam 1 1,684 53.76 796.20 47.33 168.2
5 East Godavari 3 1,401 159.04 464.58 156.08 0.23
6 West Godavari 1 - - - - -
7 Krishna 2 397 12.64 79.81 12.64 0.16
8 Guntur 2 - - - - -
9 Prakasam 1 1,577 278.74 363.18 248.84 53.03
10 SPSR Nellore 5 11,554 340.20 891.44 269.99 219.09
11 YSR Kadapa 2 - - - - -
12 Kurnool 1 - - - - -
13 Ananthapuram 7 - - - - -
14 Chittoor 2 2,391 305.58 1,722.67 226.68 103.62
Note: One SEZ at Duvvada in Visakhapatnam district was converted into SEZ in 2003 from an Export Processing
Zone. Hence it is much older than all other new SEZs. Office of Development Commissioner (SEZs) under the
Union Ministry of Commerce and Industry, for Andhra Pradesh and Telangana is located in this SEZ.
Source: Government of AP, Planning Department (2016), Socio-economic Survey of Andhra Pradesh 2015-16 ,
Hyderabad; Original source: Andhra Pradesh Industrial Infrastructure Corporation, Hyderabad.
Industrial Development of Andhra Pradesh • D. NAGAYYA & BALLA APPA RAO

228 The Economy of Andhra Pradesh
In Andhra Pradesh, 29 SEZs were formally approved, 4 in-principle approvals, and 24
notified SEZs. Among the notified ones, 19 were stated as operational in seven districts, with
Visakhapatnam as prominent. The number includes Visakhapatnam SEZ at Duvvada which
was converted from an Export Processing Zone in 2003. District-wise position of operating
SEZs in Andhra Pradesh is given in Table 3.
Progress of operating SEZs in the districts of Visakhapatnam, SPSR Nellore, and East
Godavari has been noteworthy. In relation to the state, contribution of Visakhapatnam district
is as follows: 71.3% in exports, 78.7% in imports, 74.9% in investment, 73.2% in production,
and 69.8% in employment. Nineteen SEZs account for 63,000 employment, Rs. 17,200 crore
investment, production of Rs. 4,300 crore, exports of Rs. 3,400 crore, and imports of Rs.
2,600 crore. Production, exports and imports are for half year (April- September 2015).
Categorisation of 19 operating SEZs product-group-wise is as follows: 4 IT/ITeS, 4 multi-
product, 4 pharmaceuticals, 2 textile and apparel, 1 building products, 1 leather, 1 footwear,
1 alumina & aluminium refining, and 1 food processing.
INDUSTRIAL INFRASTRUCTURE
Integrated development of Coastal Economic Zones as manufacturing hubs were planned
in the state. The programme covers Investment and Manufacturing Zones, and Industrial
Corridors. Major industrial corridors planned are: Visakhapatnam – Chennai Industrial Corridor
(VCIC), Chennai-Bengaluru Industrial Corridor (CBIC), and Kurnool- Bengaluru Industrial
Corridor (KBIC). The dedicated Rail Freight Corridors sanctioned in 2016-17 Railway Budget,
from Vijayawada to Kharagpur, and Delhi to Chennai will significantly boost the prospects
of these industrial corridors. In addition, it is proposed to develop the Peninsular Region
Industrial Development Corridor (PRIDC) project in Donakonda spanning 5,779 acres with
an investment potential of Rs. 23,000 crore, and employment potential of 1.33 lakhs. It is
proposed to take up Orvakallu Mega Industrial Hub spanning over 27,788 acres with an
investment potential of Rs. 40,000 crore, and employment potential of 70,000.
These corridors will not only promote industries but also create substantial urban
infrastructure, and contribute to the overall economic development of the state. Four industrial
nodes – Visakhapatnam, Kakinada, Srikalahasti – Yerpedu, and Gannavaram – Kankipadu
were identified as potential nodes for VCIC. Similarly, three nodes – Krishnapatnam, Kalikiri,
and Hindupur were identified as nodes for CBIC and KBIC. To boost industrial progress,
National Investment and Manufacturing Zones (NIMZs) are planned to cover Prakasam and
Chittoor districts in the state. Prakasam zone spread over an area of 14,231 acres, will attract
investment of Rs. 43,700 crore, and create 5 lakh jobs over ten years. The Chittoor zone
spread over 5,000 acres will be an integrated township with state-of- the-art industrial and
social infrastructure. It is estimated to bring in investment of Rs. 30,000 crore, and create
around 3 lakh jobs over the next decade. (Source: Government of Andhra Pradesh, Budget
Speech 2016-17 of the Finance Minister, Yanamala Ramakrishnudu)

229
CONCLUSION
Among the strategies to be pursued for accelerating growth of SMEs, a few prominent
ones are presented in this paper. Cluster development, export potential, and promoting
complementarity between small, and medium and large units can be the directions for fostering
speedy growth. Another dimension is focusing on emerging and high value added product
lines to create wealth. Cluster approach for modernisation, and overall planning for a group
of enterprises in product lines which have potential for development is being practised in
many locations in the State, on the pattern being followed in other parts of the country. This
will also result in greater degree of dispersal of industries in smaller towns, apart from growth
centres which are reasonably well developed in earlier years. A few product lines in this
category for cluster approach in the State are: cashew processing, mango jelly, fruit canning,
biscuits and confectionery, marine foods, brass metal works, cast brass hardware, aluminium
utensils, steel furniture, automobile industry, agricultural implements, ceiling fans, distribution
transformers, wooden toys, steel rolling mills, wooden furniture, etc.
WAY FORWARDED
The key challenge in future years for the SME sector is remaining competitive while
continuing to ensure employment intensity of operations. While there is need to devise
appropriate strategies for the sector as a whole, there is greater recognition of the need for
sector-specific policies and interventions. Innovation, research and development, quality
assurance, aggressive marketing strategies, and export-led growth in labour-intensive product
lines, reflect the demands of future periods.
Industrial Development of Andhra Pradesh • D. NAGAYYA & BALLA APPA RAO

230 The Economy of Andhra Pradesh
ARTICLE / 31
PERFORMANCE OF SMALL ENTERPRISES
DURING THE REFORMS ERA – A CASE STUDY IN
CHITTOOR DISTRICT OF ANDHRA PRADESH
M. Chinnaswamy Naidu
INTRODUCTION
Small enterprises play a pivotal role in the economic development of India. Small
enterprises have the advantages of generating gainful employment with low investment,
diversifying the industrial base, reducing regional disparities through dispersal of industries
into rural, semi-urban and backward areas. Small enterprises covering small, tiny, village and
cottage enterprises play a catalytic role in achieving the national objectives of increase in
industrial production, generation of additional employment, more equitable distribution of
income and means of production and reducing regional disparities. Recognizing the suitability
of small enterprises the small scale sector has been accorded due priority in the Five Year
Plans of India.
Even after six and half decades of planned development through ten five year plans and
annual plans, industrial sector could not achieve the targeted growth and contribute substantially
to GDP as expected due to several bottlenecks. Instead, services sector could achieve an
impressive growth providing major share of GDP and agricultural sector was related to the
last position next industrial sector contributing lower share of GDP. Due to inadequate growth
of the industrial sector, agriculture sector is overburdened with an excessive manpower resulting
in widespread unemployment and underemployment and proletarianisation of asset less
unemployed in the rural areas adding to widespread poverty 1. In spite of the rigorous efforts
made to develop the industrial sector and improve the performance of the large and medium
industries, their progress has been hampered due to inadequate capital resource technological
and other bottlenecks. Keeping the capital resources constraint and growing incidence of
unemployment and regional disparities, small enterprises are considered to be quite suitable
which can provide gainful employment to the rural unemployed.
The basic objectives of small enterprises are generation of employment at a relatively
low cost, to meet substantial part of the increased demand for consumer goods and simple
producer goods, mobilization of resources of capital and skill which might otherwise remain
Professor, Dept. of Economics, S.V. University, Tirupati.

231
inadequately utilized and integration of these industries with the rural economy on one hand
and large scale industry on the other. In addition, these small units are assumed to ensure
more equitable distribution of income and wealth.
Thus the development of small enterprises has assumed immense importance in the task
of planned development of the Indian economy in the context of rapid growth of population,
growing incidence of poverty and unemployment, low capital resources and widespread
regional inequalities.
INDUSTRIAL POLICY FOR SMALL ENTERPRISES
The primary objectives of the development of small enterprises are the increase in the
supply of manufacturing goods, capital formation, entrepreneurship development, generation
of employment, decentralization, dispersal of industries, reduction of regional imbalances and
diffusion of entrepreneurial abilities and technology. Small enterprises constitute a key link
in the process of socio-economic transformation of the developing economy. The developmental
of small enterprises has been an important element in India’s development strategy since they
generate substantial employment because they are mostly labour-intensive, requiring less
capital and less gestation period. Not long ago, the small enterprises in India have registered
a high rate of growth in terms of increase in their number, employment generated and in the
range of items manufactured. The industrial policies constitute the framework of guidelines
for appropriate decision-making at various levels. They generally consist of policy statements
that direct the development of the sector in the economy. For a developing country like India,
the growth of small enterprises is of utmost significance.
OBJECTIVES OF THE STUDY
The study has been the following objectives
1. To study the performance of small enterprises in Andhra Pradesh.
2. To examine the changing pattern of definition of the small enterprises in India.
3. To study the socio-economic conditions of the sample enterprises in Chittoor District,
4. To assess the performance of a small enterprises in the study area.
SAMPLE DESIGN
A sample of 50 small enterprises in Chittoor district is drawn for the study with probability
proportional to the size (PPS) sampling method. The units in each category of enterprises are
selected by simple random sampling. Some sample small enterprises have been in existence
for 10 years and some in less than 10 years.
As on 31st March 2014-15, there were 2514 tiny and small enterprises in Chittoor
district, of which, 103 units come under the purview of small enterprises. Small enterprises
Performance of Small Enterprises • M. CHINNASWAMY NAIDU

232 The Economy of Andhra Pradesh
are one with an investment in plant and machinery in between Rs.26 lakhs and Rs.1.00 crore
of the 103 small enterprises, 28 had been closed, and 25 industrialists declined to provide
information. Leaving them out, the data was collected from the remaining 50 units for the
present investigation as shown in Table-1.
Table-1 shows that Mineral industry ranks higher accounting for 32 per cent of the total
sample units, followed by Agro industry 20 per cent, Animal husbandry 12 per cent, Forest
industry 4 per cent, Textile industry 6 per cent, Engineering industry 4 per cent, Chemical
industry 8 per cent, and other enterprises 14 per cent.
Table – 1
Small enterprises wise distribution of the units surveyed
Category Number of sample enterprises selected Per cent
Agro enterprises 10 20
Mineral enterprises 16 32
Animal enterprises 6 12
Forest enterprises 2 4
Textile enterprises 3 6
Engineering enterprises 2 4
Chemical enterprises 4 8
Others enterprises 7 14
Total 50 100
Source: Compiled from the records of District Enterprises Centre, Chittoor, 2012.
SOURCE OF INFORMATION
The present study is based on both primary and secondary sources. The primary
information covering all the aspects of the small Enterprises was collected with the help of
a structured questionnaire specially designed. The secondary data was collected from the
relevant publications of government and non-governmental sectors, reports and publications
of Planning Commission, published and unpublished literature of various institutions,
organizations, the annual reports and published information available with the directorate and
small scale enterprises, books, journals, newspapers and browse internet.
Table-2 presents the classification of the sample enterprises by type of organization. It
shows that 23 of the units (46 per cent) are classified as under sole-proprietorship, followed
by 14 (28 per cent) partnership units. Private limited companies own 12 units (24 per cent)
and only one unit (2 per cent) is in the co-operative sector. Therefore, it is clear that the sole
proprietorship type of organization dominates among the units selected.

233
Ta
ble
– 2
Fo
rm o
f O
rgan
izat
ion o
f S
amp
le E
nte
rpri
ses
Sl.
No.
Form
of
org
anis
ati
ons
Indu
stry
Ca
teg
ory
Tota
l
Ag
roM
iner
al
An
ima
lF
ore
stTe
xtil
eE
ngin
eeri
ng
Chem
ical
Oth
ers
1S
ole
pro
pri
eto
rship
6(6
0.0
)7
(43
.75)
4(6
6.6
7)
1(5
0.0
0)
1(3
3.3
3)
1(5
0.0
0)
2(5
0.0
0)
1(1
4.2
9)
23
(46.0
0)
2P
artn
ersh
ip2
(20
.00)
4(2
5.0
0)
1(1
6.6
7)
1(5
0.0
0)
1(3
3.3
3)
1(5
0.0
)-
4(5
7.1
4)
14
(28.0
0)
3P
vt.
Lim
ited
2(2
0.0
0)
4(2
5.0
0)
1(1
6.6
7)
-1
(33
.33)
-2
(50
.0)
2(2
8.5
7)
12
(24.0
0)
4C
o-o
per
ativ
e-
1(6
.25
)-
--
--
-1
(2.0
0)
Tota
l1
0(1
00)
16(1
00)
6(1
00
)2
(10
0)
3(1
00
)2
(10
0)
4(1
00)
7(1
00)
50
(100
)
Note
: F
igure
s in
bra
cket
s sh
ow
per
cen
tag
e
So
urc
e: F
ield
dat
a.
Ta
ble
– 3
Nat
ivit
y o
r L
oca
tio
n o
f th
e E
nte
rpri
se o
f S
amp
le E
nte
rpri
ses
Sl.
No.
Loca
tio
nIn
du
stry
Ca
teg
ory
Tota
l
Ag
roM
iner
al
An
ima
lF
ore
stTe
xtil
eE
ngin
eeri
ng
Chem
ical
Oth
ers
1R
ura
l6
(60
.0)
6(3
7.5
0)
3(5
0.0
0)
1(5
0.0
0)
--
-4
(57
.14
)2
0(4
0.0
0)
2S
emi
Urb
an2
(20
.00)
5(3
1.2
5)
1(1
6.6
7)
1(5
0.0
0)
2(6
6.6
7)
1(5
0.0
0)
3(7
5.6
5)
2(2
8.5
7)
17
(34.0
0)
3U
rban
2(2
0.0
0)
5(3
1.2
5)
2(3
3.3
3)
-1
(33
.33)
1(5
0.0
0)
1(2
5.0
0)
1(1
4.2
9)
13
(26.0
0)
Tota
l1
0(1
00)
16(1
00)
6(1
00
)2
(10
0)
3(1
00
)2
(10
0)
4(1
00)
7(1
00)
50
(100
)
Note
: F
igure
s in
bra
cket
s sh
ow
per
cen
tag
e.
So
urc
e: F
ield
dat
a.
Performance of Small Enterprises • M. CHINNASWAMY NAIDU
234 The Economy of Andhra Pradesh
The nativity of the sample enterprises is presented in Table-3 which shows that 40 per
cent of the sample enterprises (20) are in the rural sector, 34 per cent (17) are in the semi-
urban sector and 26 per cent (13) are in the urban sector. The analysis shows that more
sample enterprises are located in the rural sector than in the others. The reasons for it might
be the incentives offered by the Central and State Governments to start units in the rural
sector.
CLASSIFICATION OF SAMPLE ENTERPRISES
The age wise sample enterprises reveals that 12 per cent of the selected units (6) is
below 3 years age, 20 per cent (10) between 3 and 6 years, 34 per cent (17) between 6 and
9 years, 20 per cent (10) between 9 and 12 years and 14 per cent (7) above 12 years in age.
The mean age of the sample enterprises is 6.42 years. It can be concluded that age-wise the
enterprises between 6 and 9 years (17 in all) take the first place among the sample enterprises.
An important aspect that should be considered while explaining the background of the
sample enterprises is the amount of fixed capital invested by them. It is observed that 32 per
cent (16) of sample enterprises invested between Rs. 25 and 40 lakhs of fixed capital, 24 per
cent (12) between Rs. 40 and 55 lakhs, 10 per cent (5) between Rs. 55 and 70 lakhs, 6 per
cent (3) between Rs. 70 and 85 lakhs, and 28 per cent (14) invested above Rs. 85 lakhs. The
fixed capital invested in plant and machinery is taken as capital investment for the purpose
of the present study. It is clear that the majority of the units invested between Rs. 25 and 40
lakhs.
The working capital invested by the sample enterprises reveals that 54 per cent (27) of
the enterprises invested below Rs. 20 lakhs as working capital, 26 per cent (13) between Rs.
20 and 40 lakhs, 8 per cent (4) between Rs. 40 and 60 lakhs and 12 per cent (6) invested
Rs. 60 lakhs and above. It is clear that majority of the sample enterprises invested as working
capital less than Rs. 20 lakhs. Working capital is needed to meet the day-to-day business
operations.
The distribution of skilled labour employed in the different sample enterprises is presented
in Table-4. The table shows that 74 per cent (37) of sample enterprises employed less than
20 skilled persons, 18 per cent (9) between 20 and 40 persons, and 8 per cent (4) between
40 and 60 persons. None of the units employed more than 60 skilled persons. Majority of the
sample enterprises employed below 20 skilled persons. The table also shows that nearly
threefourths of the units have less than 20 skilled employees.
The details of semi-skilled labour employed in the sample enterprises are presented in
Table-5. The table reveals that 68 per cent (34) of sample enterprises have employed less than
20 semi-skilled persons, 30 per cent (15) between 20 and 40 persons, and 2 per cent (1) above
60 persons. None of the sample enterprises employed between 40 and 60 persons.

235
Ta
ble
– 4
Sk
ille
d L
abo
ur
Em
plo
ym
ent
of
Sam
ple
En
terp
rise
s
Sl.
No.
Lab
our
Em
plo
ymen
tIn
du
stry
Ca
teg
ory
Tota
l
Ag
roM
iner
al
An
ima
lF
ore
stTe
xtil
eE
ngin
eeri
ng
Chem
ical
Oth
ers
1B
elo
w 2
0 p
erso
ns
10(1
00.0
0)
12(7
5.0
0)
2(3
3.3
3)
2(1
00
.00
)1
(33
.33)
2(1
00.0
0)
3(7
5.0
0)
5(7
1.4
3)
37
(74.0
0)
220
-40
per
sons
-3
(18
.75)
3(5
0.0
0)
-1
(33
.33)
-1
(25
.00
)1
(14
.29
)9
(18
.00
)
340
-60
per
sons
-1
(6.2
5)
1(1
6.6
7)
-1
(33
.33)
--
1(1
4.2
9)
4(8
.00
)
4A
bo
ve
60 p
erso
ns
--
--
--
--
-
Tota
l1
0(1
00)
16(1
00)
6(1
00
)2
(10
0)
3(1
00
)2
(10
0)
4(1
00)
7(1
00)
50
(100
)
Skil
led E
mp
loym
ent
mea
n o
f in
du
stry
= 1
6.8
0 p
erso
ns
Note
: F
igure
s in
bra
cket
s sh
ow
per
cen
tag
e
So
urc
e: F
ield
dat
a.
Ta
ble
-5
Sem
i-S
kil
led
lab
ou
r E
mp
loym
ent
of
Sam
ple
En
terp
rise
s
Sl.
No.
Lab
our
Em
plo
ymen
tIn
du
stry
Ca
teg
ory
Tota
l
Ag
roM
iner
al
An
ima
lF
ore
stTe
xtil
eE
ngin
eeri
ng
Chem
ical
Oth
ers
1B
elo
w 2
0 p
erso
ns
7(7
0.0
0)
13(8
1.2
5)
1(1
6.6
7)
2(1
00
.00
)3
(10
0.0
0)
1(5
0.0
0)
3(7
5.0
0)
4(5
7.1
4)
34
(68.0
0)
220
-40
per
sons
3(3
0.0
0)
2(1
2.5
0)
5(8
3.3
3)
--
1(5
0.0
0)
1(2
5.0
0)
3(4
2.8
6)
15
(30.0
0)
340
-60
per
sons
--
--
--
--
-
4A
bo
ve
60 p
erso
ns
-1
(6.2
5)
--
--
--
1(2
.00
)
Tota
l1
0(1
00)
16(1
00)
6(1
00
)2
(10
0)
3(1
00
)2
(10
0)
4(1
00)
7(1
00)
50
(100
)
Sem
i-S
kil
led
Em
plo
ym
ent
mea
n o
f in
dust
ry =
17
.20
per
son
s
Note
: F
igure
s in
bra
cket
s sh
ow
per
cen
tag
e
So
urc
e: F
ield
dat
a.
Performance of Small Enterprises • M. CHINNASWAMY NAIDU

236 The Economy of Andhra Pradesh
EMPIRICAL RESULTS OF PRODUCTION FUNCTIONS
Table-6 exhibits the production function of different categories of sample small
enterprises. Numbers in parentheses indicate corresponding ‘t’ values. The sign (*) indicates
the level of significance and thus single (*) indicates 5 per cent and double (**) indicate 1
per cent level of significance
For agro based units the coefficient of determination (R 2) indicated that 0.8249 per cent
of the variations in output is explained by independent variables. Among the variables capital
and raw material are statistically significant at 1 per cent level. The sum of elasticity of
output, of different units is 1.3150. This indicates that increasing returns to operate this group
of small enterprises. In other words this shows that an increase in the input by 1 per cent leads
to increase in the output by 1.32 per cent. Among the different inputs, the elasticity output
is highest for raw material at 0.8405 followed by capital with 0.2936 and power and fuel with
0.1765. This indicates that increase in the capital and raw material has a positive impact on
the increase on the production. Both capital and raw material are significant at 1 per cent
level.
The coefficient of determination (R2) in forest based enterprises indicated that 0.7835
per cent of variations in the output is explained by independent variables. Among the different
inputs the raw material statistically significant. The sum of elasticity of output of different
inputs is 1.07. It shows the decreasing returns in forest based enterprises.
In the case of textile based enterprises the coefficient of determination (R 2) indicates
that 0.9062 per cent of variation in the output is explained by independent variables. Among
the different variables the regression coefficient of raw material is statistically significant at
0.1 per cent and capital is also statistically significant at 5 per cent level. The sum of elasticity
i.e., 1.01 per cent indicates the decreasing returns to scale operate in textile enterprises.
Among the different inputs the elasticity of output is highest for raw material at 0.71 followed
by capital (0.31 per cent). It shows that increase in the raw material and capital has a positive
impact on the increase of the production.
The coefficient of determination (R2) in mineral based enterprises is 0.7835 per cent.
Among the different variables the regression coefficient of raw material and power / fuel is
statistically significant. The sum of elasticity of output of different inputs aggregates to 1.06.
This indicates that increasing returns to scale are working in this unit. This shows that
increase of the inputs by 1 per cent leads to increase in the out by 1.06 per cent. Among the
different inputs, the elasticity of output is highest for raw material at 0.71 and for power /
fuel it is 0.44.
In engineering based industry the coefficient of determination (R 2) indicates that 0.8619
per cent of the variation in output is explained by independent variables. Among the different
inputs the regression coefficient of other inputs is statistically significant. The sum of elasticity
of output of different inputs is 1.12. This indicates that increasing returns to scale are operating

237
Ta
ble
-6
Pro
du
ctio
n F
un
ctio
n f
or
Dif
fere
nt
Cat
ego
ries
of
Sam
ple
Sm
all
ente
rpri
ses
S.N
o.
Ca
teg
ory
Co
nst
an
tC
ap
ita
lR
aw
m
ate
ria
lL
ab
or
Po
wer/
Oth
ers
Su
m o
f th
eR
2F
- V
alu
e
(lo
g A
)(l
og
X1
)(l
og
X2
)(l
og
X3
)F
uel
(lo
g X
4)
(lo
g X
4)
ela
stic
itie
s
1A
gro
b
ased
in
du
stry
1.3
24
90
.29
36
**
0.8
40
5**
-0.0
88
30
.17
65
0.0
92
71
.31
50
0.8
24
93
3.9
2**
(4.1
58
2)
(12
.64
89
)(0
.07
40
)(1
.21
35
)(0
.06
73
)
2F
ore
st
bas
edin
du
stry
3.8
04
1-0
.37
48
1.0
94
7**
-0.0
56
1-0
.12
64
0.5
28
01
.06
54
0.7
83
56
.51
*
(1.0
53
6)
(4.4
28
0)
(1.1
24
8)
(1.5
90
0)
(1.3
946
)
3T
exti
le
bas
ed
ind
ust
ry1
0.7
19
40
.31
46
*0
.79
05
**
0.1
26
9-0
.20
83
-0.0
16
71
.00
70
0.9
06
21
7.3
9**
(2.2
41
7)
(7.5
53
0)
(0.7
84
0)
(0.0
92
6)
(1.5
839
)
4M
iner
al
bas
ed
ind
ust
ry2
.56
23
-0.1
37
00
.71
43
**
0.3
42
60
.43
95
*-0
.30
04
1.0
59
00
.78
35
16
.65
**
(0.8
42
6)
(5.9
42
1)
(1.9
80
5)
(2.0
16
3)
(0.8
820
)
5E
ng
inee
rin
g
bas
ed
ind
ust
ry7
.38
72
0.1
97
20
.20
58
0.0
39
10
.26
17
0.4
11
3*
1.1
15
10
.86
19
29
.96
**
(1.4
67
9)
(1.8
21
5)
(0.0
50
8)
(1.0
04
7)
(2.8
956
)
6A
nim
al
bas
ed
ind
ust
ry-1
.03
41
-0.1
26
40
.58
30
**
0.2
67
7-0
.09
83
0.3
61
90
.98
79
0.7
93
26
.91
*
(1.5
34
1)
(2.1
60
2)
(1.6
03
4)
(1.2
15
9)
(1.7
301
)
7C
hem
ical
bas
ed
ind
ust
ry1
4.2
94
0-0
.20
46
0.7
13
5**
0.2
49
10
.18
50
*0
.226
5**
1.1
69
50
.94
60
31
.53
**
(3.5
89
2)
(8.9
67
4)
(4.2
75
1)
(3.0
16
4)
(6.8
219
)
8O
ther
en
terp
rise
s4
.90
71
0.0
42
70
.50
39
**
0.1
14
70
.27
39
*0
.21
60
1.1
52
20
.79
38
16
.17
**
(1.2
69
0)
(5.2
72
8)
(1.6
83
5)
(2.1
14
3)
(1.8
926
)
All
en
terp
rise
s6
.28
43
-0.5
72
10
.96
08
**
0.3
16
20
.18
64
0.3
99
6*
1.2
90
90
.86
35
23
2.7
9
(1.8
65
4)
(3.4
21
9)
(1.5
94
2)
(1.7
35
6)
(2.0
318
)
** S
ign
ific
ant
at 1
per
cen
t le
vel
; * S
ign
ific
ant
at 5
per
cen
t le
vel
No
te:
The
val
ues
giv
en i
n p
aren
thes
es a
re t
-val
ues
Performance of Small Enterprises • M. CHINNASWAMY NAIDU

238 The Economy of Andhra Pradesh
in the engineering industry. In other words this shows increase of the inputs by 1 per cent
leads to increase in the output by 1.12 per cent. Among the different inputs the elasticity of
output is highest for other inputs at 0.41 followed by power / fuel at 0.262 and 0.206 for raw
material.
For animal based units the coefficient of determination (R 2) indicates that 0.7932 per
cent of the variation in output is explained by independent variables. Among the different
variables, raw material regression coefficient is statistically significant. The sum of elasticity
of output of different inputs has been worked out to 1.17. This indicates that increasing
returns to scale operate in this category of small enterprises. In other words, it shows that
increase of the inputs by 1 per cent leads to increase in the output by 1.12 per cent. Among
the different inputs, the elasticity of output is highest for raw material at 0.58 followed by
others at 0.36. This indicates that increase in the raw material has a positive impact on the
increase in the production.
For chemical based industry the coefficient of determination (R 2) indicates that 0.9460
per cent of variation in output is explained by different inputs. Output of different variables,
regression coefficient of raw material, power / fuel and capital are statistically significant.
The sum of elasticity of output of different inputs is 1.17 which shows that increasing returns
to scale are operating in the group of small enterprises. Other words this shows increase the
inputs by 1 per cent leads to an increase in output by 1.17. Among the different inputs, the
elasticity of the output’s highest for raw material at 0.71 followed by others at 0.23.In other
enterprises the coefficient of determination (R2) indicates that 0.7938 per cent of variation
of the output is explained by inputs. The sum of elasticity of output of different inputs adds
up to 1.15. This indicates that there exists increasing returns to scale in these units.
CONCLUSION
From the above analysis, it is concluded that nearly 50 per cent of the enterprises are
sole-proprietorship concerns, 40 per cent of the sample enterprises are located in the rural
sector, 34 per cent belongs to 6 and 9 years age-group, 32 per cent of units were established
due to the availability of raw materials, 32 per cent of the fixed capital investment of the
sample enterprises ranges between Rs. 25 lakhs and 40 lakhs, and the working capital of 50
per cent of the sample enterprises is below Rs. 20 lakhs. Almost three fourths of the sample
enterprises, (74 per cent) have skilled employees, and employ less than 20 persons in their
business concerns. A little more than two-three (68 per cent) of the sample enterprises have
less than 20 semi-skilled persons in their employment, 38 per cent of the sample enterprises
have employed un-skilled employees between 20 and 40 persons. A little more than half (54
per cent) of the sample enterprises utilizes 75 per cent of their installed capacity. The turnover
of very nearly half (48 per cent) of the sample enterprises was above Rs. 85 lakhs. Majority
of them have not diversified their business activity.

239
REFERENCES
1. Government of India, Report of the Village and Small Enterprises Industries (Second Five Year Plan)
Committee, Planning Commission, New Delhi, 1955.
2. Government of India, National Committee on the Development of Backward Areas, Planning
Commission, New Delhi, 1980.
3. P.D. Malgawakar, Problems of Small Industry, A Study of Andhra Pradesh, SIET, Hyderabad, 1973.
4. Ramakrishna Sarma, Industrial Development of Andhra Pradesh, Himalaya Publishing House, Mumbai,
1982.
5. Vasanth Desai, Problems and Prospects of Small Enterprises Industries in India, Bombay, Himalaya
Publishing House, 1983.
6. Taranand Singh Tarun, Small Enterprises Industries and India’s Economic Development, Deep and
Deep Publications, New Delhi, 1986.
7. Ram K. Vepa, Modern Small Industry in India - Problems and Prospects, Sage Publications, New
Delhi, 1988.
8. A.U. Khan and Zaqaullah Shaikh, Financing of Small Enterprises Industries in Maharastra, Southern
Economist, Vol.40, No.01, May 2001.
9. Valsamma Antony, The Prospects and Growth of Small Enterprises Industries in India: An Overview,
Southern Economist, Vol.43, No.6, May 2002.
10. M. Jaya Krishna, World Trade Organisation and its Implications on Small enterprises Industries in
Karnataka, SEDME Journal, Vol.31, June 2004.
Performance of Small Enterprises • M. CHINNASWAMY NAIDU

240 The Economy of Andhra Pradesh
ARTICLE / 32
THE NEW GREEN WAY TO TRUE HARITA
ANDHRA PRADESH
B. Srinivasa Rao
ABSTRACT
As Andhra Pradesh has emerged as a new state, it has to smack between economic
growth and environmental concerns. As we are all aware of the fact that, though we can’t stop
the development process at once, we can only drag and change the direction now, till we find
proper alternatives. Therefore, the sunrise state has to be very cautious in identifying the
limits of the natural resources and policy formulation in utilising in the best interests of the
state.
Eastern ghats are one of the important natural resources in AP having large amount of
economic and environmental implications. It is a known fact that bio diversity is a non
renewable resource and the deforestation due to stone mining, opencast mining leads to
reduction in forest cover. Moreover, it involves displacement of people. Therefore, a proper
study on fixing the Royalty on quarry lease and other administration, law and order, technical,
environmental issues will not only boost up the revenue for the newly formed state, but also
leads to Green A.P by preserving the Eastern Ghats forever.
End of the pipe solutions or operational efficiency is alone seems ensured by the
prevailing environmental acts and tribunals, APSEIAA etc., . But front of the pipe solutions,
baseline data on existing resources, channelling the proper alternatives seems absent and
adoption of economic instruments is inadequate. AP is no exception earlier. But now, a bit
of focus on Mission Haritandhrapradesh, Palekar natural farming iniative (despite severe
criticism by the govt. officials recently), Neeru Chettu-Cheruvu schemes, red sandal smuggling
control issues, formation of APSEIAA, continuous plantation activities etc., raise hope in the
sunrise state. But the state has to perform more pragmatically instead of simple rhetoric and
symbolic token actions to get more finance commission funding as many criticise and
camouflaging inherent lacunae in policies. Therefore prudent resource utilization by limiting
the exploitation and finding alternatives is the need of the hour.
Increase and proper, timely collection of Royalty rates, Green Taxes, Eco.Penalties are
highly useful in mitigating the disaster in the Easternghats environmental front now a days.
Lecturer in Economics, P.R.Govt. College(a), Kakinada.

241
These instruments require some backward linkages like adoption of Green Accounting
Standards, Baseline surveys of existing resources, economic valuation of bio diversity/natural
resources and forward linkages like assessing the financial implications of these economic/
environmental costs (royalty, taxes, penalties etc., ) on demand and supply of the goods and
services from the mining sector and indirect linkages to the speedy and sustainable growth
of AP economy amidst UN mission of Sustainable Development Goals and targets.
Key words: Harita andhra Pradesh, Eastern Ghats, Green Accounting
The New Green Way to True Harita Andhra Pradesh • B. SRINIVASA RAO

ARTICLE / 33
A STUDY ON FOREIGN DIRECT INVESTMENT
(FDI) INFLOWS ACROSS STATES IN INDIA WITH
SPECIAL REFERENCE TO THE STATE OF
ANDHRA PRADESH (AP)
Laila Memdani
ABSTRACT
FDI inflows are considered as wonder pill for all ails of economic development. The
Government of India is taking large number of steps to increase FDI in the country. State
governments are also not lagging behind. The state of AP is struggling with two issues
simultaneously; they are development of the state and formation of its capital city. One of the
way in which states are trying to solve their problem is by attracting more and more FDI in
the state. The article studies the FDI inflows in states in India in general and AP in particular.
The data used is collected from Reserve Bank of India’s (RBI) and Department of Industrial
Policy and Promotion (DIPP) over a period from 2008-09 to 2015-16 for all the states in
India. The article also studies the relationship between the Gross State Domestic Product
(GSDP) and FDI using panel data fixed effects and random effects model and then Hausman
test is also conducted. The analysis facilitates to infer that FDI doesn’t significantly contributed
to GSDP during period of study.
Assistant Professor, Department of Economics, IBS Hyderabad (A Constituent of IFHE University)

THEME - V
ISSUES RELATED TO THE DEVELOPMENT OFSERVICE SECTOR IN ANDHRA PRADESH


ARTICLE / 34
THE ECONOMICS OF INTELLECTUAL PROPERTY
IN DEVELOPING ANDHRA PRADESH
D V G Krishna, Duvvuri & V N Pradeep
INTRODUCTION
The increasing importance of intangible assets has made the intellectual property (IP)
system increasingly attractive and, in many cases, indispensable for all economic agents.
Intellectual property (IP) is a key consideration in day-to-day business decisions. New products,
brands and creative designs appear almost daily in the market and are the result of continuous
human innovation and creativity. While Indian industry has been increasingly realizing the
importance and benefits of IP creation and protection, the Indian Government has been doing
their best in creating conducive environment by upgrading infrastructure and bringing in
policy level initiatives in the country which has resulted in sweeping changes in IP culture
and administration in the Country. CII, realizing the importance of IPR as the key differentiator
for industrial competitiveness institutionalized a dedicated department manned by domain
experts & professionals more than a decade back. CII’s IPR division informs, analyses, match
makes, facilitates and implements IPR related requirements of Industry, Government, Institutions
and Society. The overall objective of CII’s initiatives in IPR is to facilitate Indian Industry
to attain global leadership by harnessing and leveraging IP as the development of stringent
and staunch IPR system towards creating a strong IP ecosystem is an urgent need for all over
the World. The primary focus of the initiative is to, take policy initiatives, awareness creation,
Capacity Development, IPR Services, international networking and also combating the menace
of counterfeiting & piracy. CII in partnership with Technology Information forecasting and
Assessment Council (TIFAC) (under the aegis of the Department of Science & Technology,
Govt. India and Govt. of Andhra Pradesh) had established in the year 2000 an autonomous
organization named Andhra Pradesh Technology Development & Promotion Centre(APTDC)
in Hyderabad, it acts a one stop shop for IPR facilitation services for MSMEs, Academia and
Entrepreneurs and nodal agency on GIs in the state of AP and Telangana. CII also in association
with the Ministry of Micro Small & Medium Enterprise, (MoMSME) Govt. of India has
established an Intellectual Property Rights Facilitation Centre (IPFC) at Mysore, Indore and
Gandhi nagar The primary objective of these IPFCs is to “Boost IP Culture” which would
Professor & Director, M S S Educational Institutions, Hyderabad.Research Student, CESS, Asst Prof M S S Law College, Hyderabad.Research Student, CESS, Asst Prof M S S Law College, Hyderabad.
246 The Economy of Andhra Pradesh
enhance the intellectual capital that is vital for the economic development of the state. These
IPFCs are also the pioneer institution in the country in providing various IPR services towards
Training, Information & Advisory services and IP Protection facilitation. In 2015 CII started
the CII Industrial Intellectual Property Award for the Indian industries get national and
international recognition for excellence in intellectual property protection. The purpose of this
award is to encourage organizations to foster a culture of intellectual property management
and commercialization and recognize IP excellence across industry segments.
IPR REGIME AND ECONOMIC DEVELOPMENT
One of the most interesting findings of the literature on IPR and economic development
(Maskus (2000) and Chen and Puttitanun (2005)) showed that there was a U-shaped relationship
between the strength of a state IPR regime and the state per capita GDP using a cross-section
sample of countries. If one is willing to give the result a temporal interpretation, it suggests
that a states IPR regime is not independent of its level of economic development. As state
develops, their IPR regime will weaken before it is strengthened. Since the Agreement on
Trade-Related Aspects on Intellectual Property Rights (the TRIPS Agreement) placed IPR
protection front and centre in trade liberalization negotiations, reform of a developing country’s
IPR regime and its expanded engagement with the global economy are likely to be driven by
the same pressures from developed countries to strengthen IPR protection.
ANDHRA PRADESH – SHAPING UP AN INNOVATION ECOSYSTEM
Make in India’, ‘Create in India’ and ‘Innovate in India’ are all key slogans that are part
of the vision set down by the Indian government. ‘Make in Andhra Pradesh’, ‘Create in
Andhra Pradesh’, and ‘Innovate in Andhra Pradesh’. And, why not? India has clearly established
its name in the services industry. It is now time for the Indian corporate world to graduate
to the next level of innovation in several sectors including manufacturing, technology,
automotive, pharmaceuticals, biotech, financial services and retail, to name a few.
Innovation has been one of the key drivers of growth of several developed economies
around the world. India, with its 1.2 billion populations, needs innovation not only to scale
up to the next level of economic growth but also to address several social, political and
economic issues facing the state today. The percolation of information and communication
technology has, to a certain extent, facilitated the expansion of horizons. But, innovation, and
protection of the innovation are still in the nascent stages, needing an ecosystem that encourages
high- technology, protects it, and facilitates the conversion of the innovative thought to a
physical product and most importantly, monetize it.
Andhra Pradesh is a start-up hub for several industries, including automotive, IT services,
pharmaceuticals, textiles, education, healthcare and manufacturing. It rates high on the human
resource development index, has a high literacy rate, Keeping this in mind, the state
government’s ‘Vision’ suggests that it aspires to become the foremost innovation and knowledge
hub in the country.

247
How prepared is the state to make this vision a reality? What is the awareness level
about Intellectual Property and Rights in such Intellectual Property across the state, across
industry segments, across IP types? What more needs to be done to strengthen the IP ecosystem
in the state?
ACHIEVEMENTS OF APTDC
APTDC (Andhra Pradesh Technology development Center) Confederation of Indian
Industry (CII), Andhra Pradesh Technology Development and Promotion Center (APTDC)
and Govt. of Andhra Pradesh have taken a unique initiative to establish IPR facilitation Cell
in the Andhra Pradesh state primarily to create a strong IPR base, to enhance the quality of
Invention, innovation and fine tune the institutional & policy issues and to increase the
number of patents filed from the state. The idea is to boost investors’ confidence in the long
run through better innovative corporate Culture. The initiative addresses the IPR issues of the
Industry, Research and development institutes of AP at large.
APTDC in collaboration with the Andhra Pradesh Handicrafts Development Corporation
Govt. of AP facilitated the registration of various products originating from Andhra Pradesh.
In 2013, GI certificate was issued to Narayanpet Handloom Sarees and MangalagiriSarees&
Fabrics. Also, APTDC received an approval to file an application for Etikoppaka Crafts
&Durgi Stone Carving. The Consultative Group Meeting for Banaganapalle Mango was
organized in Hyderabad. GI APTDC is also the member of state level GI committee and has
given its recommendations on Post GI implications and its enforcement for the registered
products of AP. In first of its kind, APTDC facilitated towards successfully enforcing GI
Rights for TirupatiLaddu.
IP Filed (2014-15) in Andhra Pradesh
Patent: 13 Trademark: 35
Design: 7 GI: 4
Copyright: 1 Total Fillings: 60
Source: CII & APTDC IPR ANNUAL REPORT -2014-15
The Economics of Intellectual Property • DVG KRISHNA, DUVVURI & V N PRADEEP

248 The Economy of Andhra Pradesh
ECONOMIC REFORMS : AN APPRAISAL
After gaining independence in 1947, India had the unenviable task of starting the
process of development from scratch. Although independent India had inherited a wonderful
railway system, a few industries and a good administrative service at the grassroots level,
there was little by way of entrepreneurship.
In the 1990s, the then government, realizing it was time to move to the next level of
development, liberalized the economy, eased regulations and encouraged individuals to set up
industries. Around this time, the proliferation of information technology also gave a boost to
the economy and the service industry gained a strong foothold, especially in the area of
technology services.
STATUS UPDATE
In spite of a deep focus on innovation in Andhra Pradesh and the number of industrial
hubs spread across the state, it must be mentioned that we’re still in the nascent stages of
setting up an ecosystem with more focus on IP creation, IP monetization and IP protection.
Even in the MSME segment, a large number of industrial organizations are yet to take
advantage of their potential to create IP. And there sure is a need to increase IP awareness
in the state of Andhra Pradesh. But, it must be noted that this awareness is increasing, across
all types of organizations, be it industries, educational institutions, chambers of commerce
and even the world of entertainment.
NEED FOR IP POLICY
State takes pride in the fact that it had high levels of scientific, philosophic, medical,
engineering knowledge, as evident in many of the surviving traditions and monuments. A
characteristic of such knowledge is that whatever was created was available to the public. The
purpose of knowledge, discoveries and creations was not monetization but the betterment of
society. However, the world we live in has changed over the last several decades. The global
landscape recommends strongly protected IPR, and hence the need to create awareness and
encourage IP and transforming knowledge into IP assets.
Policy documents states: “Many IP holders are unaware of the benefits of IP rights or
of their own capabilities to create IP assets or the value of their ideas. They are often
discouraged by the complexities of the process of creating defendable IP rights. The Central
Government on its part has taken steps through relevant authorities to curb any violations in
this area. The Intellectual Property Rights (Imported Goods) Enforcement Rules 2007 have
been framed to implement border control measures. The Ministry of Human Resources
Development has set up a Copyright Enforcement Advisory Council (CEAC) with
representatives from concerned Ministries/Departments, industry bodies and the police
department to advise the Government on measures to improve enforcement of copyright and
review the progress made. Some state governments have also created IP cells in police

249
departments under the Economic Offences Wings. The states of Tamil Nadu, Kerala, and
Maharashtra have included video piracy as an offence in their laws to deal with prevention
of such activities.
GOVERNANCE OF INTELLECTUAL PROPERTY RIGHTS
These legal instruments are just one of the pieces that form a national system of
intellectual property protection. Also crucial to the system’s overall effectiveness are the
institutions administering these instruments, the mechanisms available for enforcing IPRs,
and the rules regarding the treatment of non-nationals. The administration of IPRs is most
significant in the area of patents, industrial designs, trademarks, and plant breeders’ rights.
To obtain protection for these types of intellectual property, applicants have to submit their
intellectual creations to a national IPRs office, which examines their eligibility for protection.
Copyright and neighboring rights protection typically applies automatically upon creation of
the intellectual work, although for evidentiary purposes authors may choose to register their
works at copyright offices. The enforcement of intellectual property rights relies on a country’s
judicial system.
INTELLECTUAL PROPERTY RIGHTS AND ECONOMIC ACTIVITY
This section evaluates the importance of IPRs in economic activity and highlights some
emerging trends in the IPRs field. The first part relates IPRs protection to the structure of
developed and developing economies and attempts to analyze how important IPRs are in the
creation of intellectual assets as well as in the use of proprietary knowledge and information.
The second part examines the role of IPRs in international transactions in goods and services.
This notwithstanding, that the main IPRs still do not appear as a top policy priority for
developing countries, they have become more relevant in selected sectors particularly in
agriculture and have gained importance in international transactions of goods and services.
These patterns are reflected in an increasing global demand for IPRs protection.
THE IMPORTANCE OF INTELLECTUAL PROPERTY RIGHTS IN ECONOMIC
ACTIVITY
The significance of intellectual property rights in economic activity differs across countries
and depends (1) on the amount of resources countries devote to creating intellectual assets
as well as (2) the amount of protected knowledge and information used in production and
consumption. One useful indicator for the magnitude of resources devoted to the creation of
new knowledge and information is a country’s expenditure on research and development
(R&D). In 1992, developed countries spent $372 billion, 7 or a little more than 2 per cent
of GDP, on R&D. The United States had by far the greatest expenditure on R&D—around
$167 billion, or 2.8 per cent of GDP. Developing countries spent much less money on R&D
(in total around $57 billion) and in most developing countries the portion of GDP devoted
The Economics of Intellectual Property • DVG KRISHNA, DUVVURI & V N PRADEEP

250 The Economy of Andhra Pradesh
to R&D was below 1 per cent. The major R&D spenders among developing countries include
China, Brazil, India and the Asian new industrial countries.
THE ECONOMICS OF INTELLECTUAL PROPERTY RIGHTS PROTECTION
The protection of intellectual property rights is widely considered to be part of economic
policymaking, although economic theories of growth and development have so far ignored,
or only peripherally considered, the role of IPRs policy. Available economic models and
empirical evidence are inconclusive about the role of IPRs in the development process. The
most analysts conclude that the impact of IPRs protection in a given country depends on
circumstances such as educational attainment, openness to trade and investment, and related
business regulations.
• Its effect as an incentive for creating new knowledge and information,
• Its implications for the diffusion of knowledge and information within and across
economies,
• Its effect on market structure and prices and its distributive consequences.
The discussion highlights the many gaps still remaining in our understanding of the
economic implications of IPRs protection, but also points to some emerging evidence albeit
mostly from developed countries that can be useful in evaluating some of the economic
effects of IPRs protection.
DIFFUSION OF KNOWLEDGE AND INFORMATION WITHIN AND BETWEEN
ECONOMIES
By granting exclusive rights, IPRs restrict in many ways the diffusion of knowledge and
information. Patents, for example, prevent others (at least temporarily) from using proprietary
knowledge. Monopolistic or oligopolistic behaviour among intellectual property title holders
(i.e., relatively smaller output and higher prices) can lead to less than (statically) optimal
dissemination of new knowledge and information. As explained above, this should be
considered as part of the trade-off related to IPRs protection: enhanced market power allows
intellectual property owners to recover their initial information- and knowledge-generating
investments.
At the same time, IPRs can play a positive role in diffusion. Patents are granted in
exchange for the publication of the patent claim. In exchange for temporary exclusive rights,
inventors have an incentive to disclose knowledge to the public that might otherwise remain
secret. Although other agents may not directly copy the original claim until the patent expires,
they can use the information in the patent to further develop innovations and to apply for
patents on their own.
Moreover, an IPRs title defines a legal tool on which the trade and licensing of a
technology can be based. Protection can facilitate technology disclosure in anticipation of

251
outsourcing, licensing, and joint-venture arrangements. The IPRs system thus plays a role in
the creation of markets for information and knowledge by providing buyers and sellers of
technology with more information. Similar to rights on tangible property, IPRs can make
markets for intangible property more efficient and reduce transaction costs.
REFERENCES
Make in India: Reason & Vision for the Initiative - Make In India
Vision Development in Andhra Pradesh 2029 submitted by Ernst & Young LLP (EY)
India 1900 to 1947 - History Learning Site
National IPR policy - Department Of Industrial Policy & Promotion
www.aptdc.in
The economics of intellectual property – WIPO
The knowledge-based economy – OECD
Intellectual Property: Powerhouse for Innovation and Economic Growth – ICC
Publicly funded IP support service for entrepreneurs – WIPO
Technology and IPR Facilitation Services – CII
Intellectual Property Law - International Governanceý - www.cigionline.in
Indian Estates – Economy and Business – IBEF Repo
The Economics of Intellectual Property • DVG KRISHNA, DUVVURI & V N PRADEEP

252 The Economy of Andhra Pradesh
ARTICLE / 35
INSTITUTIONAL FINANCE FOR THE
DEVELOPMENT OF SC/STS IN ANDHRA PRADESH
G. Savaraiah, D. Udaya Santhi, P. Koteswari & V. Sreevani
INSTITUTIONAL ARRANGEMENTS FOR RURAL CREDIT
Institutional credit agencies are fairly developed in Andhra Pradesh. These institutions
are meeting the short, medium and long-term credit requirements of agriculture and allied
sectors, rural industrial sector and services sector of the economy. These institutional credit
agencies are providing credit for poverty alleviation and employment generation programmes
meant for the weaker sections in general and scheduled castes (SCs) and scheduled tribes
(STs) in particular.
Institutional credit is distributed through multi agency net work consisting of Commercial
Banks (CBs) Regional Rural Banks (RRBs), and cooperatives as on 31 st march 2015. There
are about 91000 village level Primary Agriculture Credit Societies (PACS), 367 District
Central Cooperative Banks (DCCBs) and 28 State Cooperative Banks (SCBs) are providing
primary short term and medium term agriculture credit. The long-term cooperative credit
structure consists of 19 State Land Development Banks (SLDBs)/ Agricultural and Rural
Development Banks (ARDBs) with 2585 operational units which are catering to the requirement
of investment credit. Besides, there are 46690 rural and semi- urban branches of commercial
banks and 14190 branches of 82 RRBs. It was found that agriculture credit supplied by the
agricultural money lenders and professional money lenders accounted for 16.1 per cent of the
rural credit in 1998-2002. The government and commercial banks have accounted for 3.3 per
cent and 32.81 per cent respectively. The setting up or the National Bank for Agriculture and
Rural Development (NABARD) in 1982 as an apex financial institution for promoting and
refinancing the rural financial system was another significant milestone for strengthening
credit flow to the rural economy of India. the cooperative sector become the back bone of
the small and marginal farmers, rural artisans and small business of interest especially to the
farming sector.
Professor, Dept. of Economics, S.V. University, TirupatiResearch Scholars, Dept. of Economics, S.V. University, TirupatiResearch Scholars, Dept. of Economics, S.V. University, TirupatiResearch Scholars, Dept. of Economics, S.V. University, Tirupati

253
BANKING NETWORK IN A.P
The banking system in Andhra Pradesh has attained spectacular growth in terms of bank
branch network, mobilization of the deposits and disbursement of the loans and advances and
coverage of the poor and marginalized sections. The total number of bank branches has
increased from 5051 in 2012 to 6679 in 2015, registering an increase of 32 percent. The rural
branches constitute 38.97 percent in 2015 as against 38.59 percent in 2012. The public sector
banks have expanded their financial services to the poor and marginalized sections in the
rural areas through their branches. The regional rural banks along with private scheduled
commercial banks are also provided financial assistance to the rural poor. The cooperative
banks have moving to the rural areas through their branches network. The particulars of the
bank branch network of different banks are shown in table-1
Table – 1
Bank Branch Network, Deposits and Advances of different banks in Andhra Pradesh
(as on 30th September, 2015)
Category Public sector Pvt. sector RRBs Co-op. Banks Others
banks banks (APSFC)
2014 2015 2014 2015 2014 2015 2014 2015 2014 2015
Rural 1382 1509 124 132 701 776 147 186 0 0
Semi Urban 1324 1402 237 269 190 172 126 108 0 0
Urban 1189 1257 284 324 104 131 104 93 13 13
Metro 236 250 39 57 0 0 0 0 0 0
Total 4131 4418 684 782 995 1079 377 387 13 13
Branches 66.63 66.15 11.03 11.71 16.05 16.16 5.79
Deposits 134525 157549 21085 24215 13323 17763 4412 6281 4 6
Advances 153846 159211 27262 34435 16131 15998 9156 8941 1613 1710
Source: Reports of SLBC for A.P
The data table-1 reveals that the public sector banks constituted more than 66 percent
of the total bank branch network in 2015 as against 67 percent in 2014. The regional rural
banks are the next largest banks after the public sector banks which spread throughout the
State of Andhra Pradesh. More than 16 percent of the branches of RRBs working in the state
followed by Private Sector banks (12 percent) and cooperative banks (6 percent) during 2015.
DEPOSITS AND LOANS OF BANKING SECTOR
The total deposits of all the banks have considerably increased from Rs.173379 crore
as on 30th September 2014 to Rs.205815 crore as on 30 th September 2015 registering an
increase of 18.71 percent. The amounts of loans provided have also increased from Rs.208008
to Rs.220295 showing an increase of 5.91 percent during the same period. But the rate of
Institutional Finance • G. SAVARAIAH, D. UDAYA SANTHI, P. KOTESWARI & V. SREEVANI
254 The Economy of Andhra Pradesh
growth of loans and advances of all banks has not increased on par with the growth of
deposits. It indicates that the loaning activities of all banks were sluggish during the same
period due to mounting of the loans dues particularly the agricultural loans. The deposits per
branch of public sector banks show higher (Rs.35.66 crore) than that of the branch of private
sector banks (Rs.30.97 crore) and RRBs (Rs.16.46 crore) and cooperative banks (Rs.16.23).
The advances per branch of public sector banks is lower (Rs.36.04 crore) than that of the
private sector banks (Rs.44.03 crore) whereas the advances per branch of cooperative banks
is higher (Rs.23.10 crore) than the RRBs (Rs.14.83 crore)
PRIORITY SECTOR ADVANCES OF INSTITUTIONAL CREDIT AGENCIES
Before 1969, commercial banks had largely neglected agriculture small industrial concerns
and business units. Soon after nationalization, commercial banks were asked to be especially
concerned with the financing of priority sector of agriculture, small industry and business and
small transport operations. In course of time, other priority sectors were also added such as
retrial trade, professional and self-employed persons, education, housing loans for weaker
sections and consumption loans.”The concept of priority sector lending is mainly included to
ensure that assistance from the banking sector flows in an increasing manner to those sector
of the economy which, though accounting for a significant proportion of the national product,
have not received adequate support of institutional finance in the past”.(Dr.Krishnaswami)
The commercial banking system and particularly the public sector banks took to priority
lending enthusiastically. The total credit by the banking sector to agricultures, micro, small
and medium enterprise and other priority sectors went up from Rs.1, 49,363 crore as on
March 2014 to Rs. 169122 crores in March 2016. The details are presented in Table-2.
Table – 2
Priority Sector Advances (as on March 2016)
(Amount in Crore)
Details of Priority Sectors 2014 2015 2016
Total Priority Sector Advances 149363 156180 169122
% of Priority Sector Advances to ANBC (RBI Norm 40%)of which 74.24% 72.37% 78.37%
Agricultural Advances % of Agrl. Adv. to ANBC 97915 91415 99923
(RBI norm - 18%) 48.67% 42.36% (46.30%)
Of which
Small & Marginal Farmers(RBI norm – 7% of ANBC) —- 52520 51659
24.34% (23.94%)
Micro & Small Enterprises (% to ANBC) 28663 33885 36218
14.25% 15.70% (16.78%)
Out of which Micro Enterprises(RBI norm – 7% of ANBC) —- 16208 18701
7.51% (8.67%)

255
Details of Priority Sectors 2014 2015 2016
Medium Enterprises —- 4149 4765
Total MSME(% to ANBC) 32276 38034 40983
16.04% 17.62% (18.99%)
Export Credit —- 904 961
Education 2963 3309 3650
Housing 15882 17986 18820
Social Infrastructure —- 122 103
Renewable Energy —- 56 44
Others —- 4354 4638
Out of Total Priority Sector Advances, finance to:
SHGs 15861.25
Advances to Weaker Sections 55687
(RBI norm - 10% of ANBC) (25.81%)
Advances to Women 39058
(RBI norm -5% on NBC) (18.10%)
Advances to SC/ST 9989
Advances to Minorities 13150
(Norm 15% on priority sector) (7.78%)
Source: Reports of SLBC for A.P
As a result, the advances to priority sectors as a per centage of agricultural advances
to the total priority advances has declined from 65.56 percent in 1 March 2014 to 59.80
percent in March 2016. It shows that the relative share of agricultural advances has declined
because of the reluctance of the bankers to provide loans to the farmers as the overdue level
increased at gross root level. Out of the total agricultural advances the small and marginal
farmers have received Rs. 51659 crore in March 2016, registering a decline of 1.64 percent
from Rs.52520 crore in March 2015. However the share of the priority advances to the small
and marginal farmers to the total priority sector advances has increased from 19 percent in
March 2015 to 36 percent in March 2016. The percentage of priority sector advances to small
and marginal farmers to ANBC is 24 percent in 2016 which is higher than that of the RBI
norms 27 percent of ANBC. On the whole, the proportionate there of small and marginal
farmers in the total priority sector advances has been declined due to poor financial base and
lack of political influence. The government has been encouraged the micro and small enterprises
through providing bank credit in the state. The total priority advances to the micro and small
enterprises have increased from Rs.28663 crore in March 2014 to Rs.36218 crore in March
2016, indicating more than one-fold increase. But the percentage of priority sector advances
to micro enterprises to ANBC was 7.51 percent in 2015 and 8.67 percent in 206 as against
the RBI norms of 7 percent. On the whole, the loans to the MSMOs have risen by Rs.8707
crore in 2016 over 2014, registering an increase of 26.98 percent. Among the other priority
sector advances, Housing loans were given top priority of the government and also banks
Institutional Finance • G. SAVARAIAH, D. UDAYA SANTHI, P. KOTESWARI & V. SREEVANI

256 The Economy of Andhra Pradesh
which provided Rs.18820 crore in 2016 as against Rs.15882 crore in 2014 showing an
increase of 18.49 percent Educational loans have risen by only Rs.341 crore during the same
period.
CREDIT POLICY TO UPLIFT THE WEAKER SECTIONS
Easing credit constraints for the poorest and the weaker sections must be a priority to
reinforce and sustain their health status. The Government is ostensibly, ensuring that credit
priority, as spelt out and implemented by Reserve Bank of India (RBI) is aimed at precisely
that credit is a key input for agriculture and allied activities and for many small and micro
enterprises run by the section that forms the Country’s 30 crore un organized sector.
Ensuring that access to constraint free and timely credit is widespread and functioning
efficiently in the rural areas becomes urgent against the new economic policies that destabilize
their existing modes of livelihood, including widespread acquisition of available land for
SEZs and liberalization of the retail sector in food processing.
The Report on National Commission for Enterprises in the Unorganized Sector (NCEUS)7 has delivered a scathing attack of the RBI’s priority sector lending (PSLP) and commitment
to the weaker section credit. Here is an unwittingly state-sponsored, kid gloves-off critique
of deliberately lopsided policy which has been designed not by branch managers and loan
officials but by the decision makers at the top of the RBI to benefit what could be a travesty
of the phrase “weaker sections”.
A tawdry application of the mind is evident in RBI’s own Public Sector Lending Policy
which has set a target of 40 percent of the adjusted net banking credit (ANBC) for priority
sector lending by banks. Of the 40 percent, 18 percent target was set for agriculture and
another 10 percent was set for weaker sections. The emphasis on agriculture and priority
sector credit led to the introduction of penalties for non-achievement of priority sector targets
by banks. The fault, NCBUS, has charged, lies with RBI credit policy makers who refused
to reduce the 40 percent (of ANBC) target set for top priority sector lending despite the
difficulties of banks in achieving it. Role of formal institutions in rural banking especially by
the commercial banks was conceived and emphasized on the improvement in the priority
sector lending. But growth was manifested in other priority sectors and only marginal growth
took place in agriculture. The target set for weaker sections (mainstream microfinance) was
achieved by a small margin in public sector banks. The achievement of private sector banks
was nowhere near the target. What the authorities did, instead, was to “nullify, through the
backdoor the operational relevance of the priority sector target by including many items
which can be conceived of as belonging to the weaker section borrowers of small loans who
would not possess other bankable projects.
The Banks, the panel reports, are not interested in making advances to unorganized
sector borrowers mostly the weaker sections like SC/ST, small and marginal farmers, agricultural
labourers and women in the absence of collateral, irrespective of what RBI guidelines say.
257
They openly subvert and ignore the guidelines that say no collateral for loans up to Rs.5
lakhs. But majority of the public sector banks and regional rural banks insisted the collateral
security even for the deployment of the small loan to the weaker sections.
FLOW OF INSTITUTIONAL CREDIT TO WEAKER SECTIONS
Traditionally rural India is capital-starved. Only a meagre proportion of the rural people
have surplus funds to be ploughed back into their respective avocations. At the beginning of
the twentieth century, there was nothing like rural banking for the villagers. In the absence
of institutional credit agencies, the rural economy was bedevilled by a number of unscrupulous
agencies including the proverbial money lender”.
India has wide range of rural financial service providers including the formal sector
financial institutions. In 2000, about one-thirds of the SC rural households were landless and
near landless compared to one-third among the non- SCs/STs .About 60 percent of the SC
households still had to depend on wage labour compared to one- fourth of the non-SCs/STs
which is indicative of a much higher level of dependence on wage employment 12.Hence, they
need the support of the institutional credit agencies for their development. The institutional
credit for the weaker sections and scheduled castes/scheduled tribes in Andhra Pradesh has
shown in table-3.
Table – 3
CREDIT FLOW TO MINORITY COMMUNITIES, WEAKER SECTIONS, WOMEN AND SCs/STs
(Outstanding Rs. in Crore)
Sl. No. Year ended Minority Weaker sections Women SC/ST Percent
communities
1 March, 2012 — 33,368 — 7114 21.32
1 March, 2013 7,066 40,554 30,116 7,774 19.17
2 March, 2014 8,372 47,074 34,736 9,365 19.89
3 March, 2015 11,069 48,495 35,994 8,710 19.96
4 March, 2016 13,150 55,687 39,058 9,989 17.94
RBI stipulation1 5% on priority 10% of ANBC 5%on NBC No stipulation -
sector
Achievement for 7.78% 25.81% 18.10% - -
March, 2016
Source: Reports of SLBC for A.P
The total outstanding credit deployed by the banking sector i.e commercial banks,
RRBs and cooperatives to the weaker sections increased from Rs.33368 crore as at the end
of March 2012 to Rs. 55687 crore as on 31 st March 2016, registering an increase of 66.89
percent. The total credit flow from the institutional credit agencies to the development of
Institutional Finance • G. SAVARAIAH, D. UDAYA SANTHI, P. KOTESWARI & V. SREEVANI
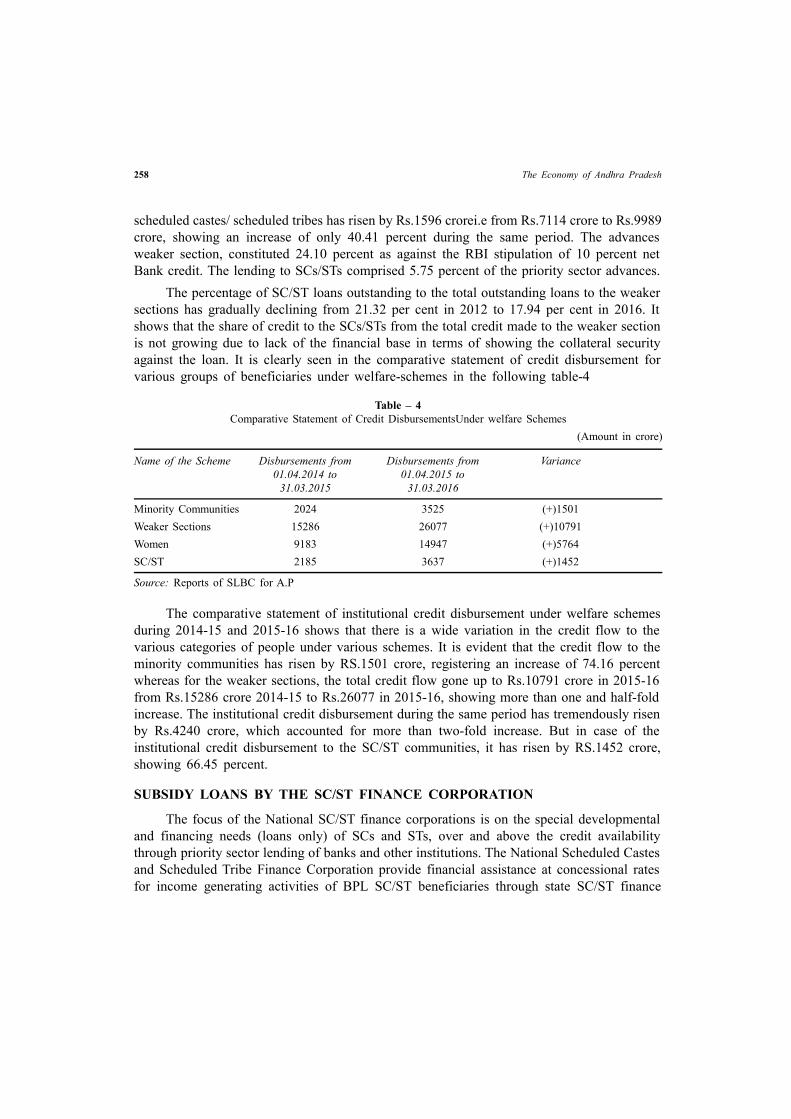
258 The Economy of Andhra Pradesh
scheduled castes/ scheduled tribes has risen by Rs.1596 crorei.e from Rs.7114 crore to Rs.9989
crore, showing an increase of only 40.41 percent during the same period. The advances
weaker section, constituted 24.10 percent as against the RBI stipulation of 10 percent net
Bank credit. The lending to SCs/STs comprised 5.75 percent of the priority sector advances.
The percentage of SC/ST loans outstanding to the total outstanding loans to the weaker
sections has gradually declining from 21.32 per cent in 2012 to 17.94 per cent in 2016. It
shows that the share of credit to the SCs/STs from the total credit made to the weaker section
is not growing due to lack of the financial base in terms of showing the collateral security
against the loan. It is clearly seen in the comparative statement of credit disbursement for
various groups of beneficiaries under welfare-schemes in the following table-4
Table – 4
Comparative Statement of Credit DisbursementsUnder welfare Schemes
(Amount in crore)
Name of the Scheme Disbursements from Disbursements from Variance
01.04.2014 to 01.04.2015 to
31.03.2015 31.03.2016
Minority Communities 2024 3525 (+)1501
Weaker Sections 15286 26077 (+)10791
Women 9183 14947 (+)5764
SC/ST 2185 3637 (+)1452
Source: Reports of SLBC for A.P
The comparative statement of institutional credit disbursement under welfare schemes
during 2014-15 and 2015-16 shows that there is a wide variation in the credit flow to the
various categories of people under various schemes. It is evident that the credit flow to the
minority communities has risen by RS.1501 crore, registering an increase of 74.16 percent
whereas for the weaker sections, the total credit flow gone up to Rs.10791 crore in 2015-16
from Rs.15286 crore 2014-15 to Rs.26077 in 2015-16, showing more than one and half-fold
increase. The institutional credit disbursement during the same period has tremendously risen
by Rs.4240 crore, which accounted for more than two-fold increase. But in case of the
institutional credit disbursement to the SC/ST communities, it has risen by RS.1452 crore,
showing 66.45 percent.
SUBSIDY LOANS BY THE SC/ST FINANCE CORPORATION
The focus of the National SC/ST finance corporations is on the special developmental
and financing needs (loans only) of SCs and STs, over and above the credit availability
through priority sector lending of banks and other institutions. The National Scheduled Castes
and Scheduled Tribe Finance Corporation provide financial assistance at concessional rates
for income generating activities of BPL SC/ST beneficiaries through state SC/ST finance

259
corporations. The State SC/ST finance corporations have been providing subsidy and marginal
money to the SC/ST educated unemployed persons and poor people. There are many schemes
implemented by the SC/ST finance corporations for development of the marginalized sections
of the people. The SC Finance Corporation has set the target of 23,285 SCs who should be
given Rs.72.97 crore as target for the year 2008-09. But the corporation disbursed Rs.18.45
crore to 5,444 SC beneficiaries. In this case, only 23.38 percent of targets for beneficiaries
and 25.28 percent of the targets for loans have achieved during 2008-09. In 2015-16, the SC
Corporation targeted to provide Rs.230 crore to 53,158 SC beneficiaries but it has given
Rs.191.11 crore to 27,886 SC beneficiaries. Only 83.09 percent of the target was achieved
up to January 2016.
With regard to the development of STs, the ST Finance Corporation has targeted to give
subsidy loans of Rs.176.63 crore to 23,285 ST beneficiaries but it has given only 13.36 crore
to 74,102 ST beneficiaries during 2008-09. The targets set for the number beneficiaries
(78.51 percent) and the amount of loans (7.56 percent) is not achieved during 2008-09. The
ST Corporation has given Rs.48.92 crore in 2015-16 as against its target of Rs.78.78 crore,
thus only 62.10 percent of the target is achieved. The corporation has given loans to 8558
ST beneficiaries as against its target of 20,302 ST persons. In this case, only 42.15 percent
of the targets achieved during 2015-16.
“STAND UP INDIA” YET TO GAIN PACE IN STATE
The much-hyped ‘Stand up India’ scheme is yet to enable Scheduled Castes (SCs),
Scheduled Tribes (STs) and women entrepreneurs to access loans in the State. The banks have
sanctioned mere 37 loans to SCs/STs and 226 loans to women in the State ever since the
scheme was launched on April 5, 2016.
The scheme ensures that women and SC/ST entrepreneurs have a fair chance of initiating
their own business. Under the scheme, the banks have to sanction loans of Rs.10 lakh to Rs.1
crore for setting up new enterprise, which is termed as green field enterprise.
There are 6,929 bank branches across 13 districts, and the bankers have to finance
13,858 people in a year. After continual nudging by the government, the banks could find
only 263 eligible candidates, including women, under the scheme during first quarter of the
financial year.
Every stakeholder has their own theory for poor response to the scheme. The bakers say
that they are “unable to find eligible borrowers from SC/ST categories.” The industry bodies
point out that there is no proper dissemination of information and banks are not reaching the
people at grassroots. Besides, the prospective entrepreneurs are unable to pool up the margin
money, feel the industry associations.
Institutional Finance • G. SAVARAIAH, D. UDAYA SANTHI, P. KOTESWARI & V. SREEVANI

260 The Economy of Andhra Pradesh
CONCLUSION
The state government has been launching many developmental programmes towards the
welfare of the downtrodden and weaker sections. Almost all weaker section communities
have separate financial corporations for their development. They are financing for the
development of the weaker sections along with the institutional financing agencies in Andhra
Pradesh. But loan amounts are inadequate to the weaker sections particularly the schedule
castes and tribes for their income and employment generating economic activities. The SC
Corporation could not able to maintain its targets for the last one decade. The present
government was started “stand up India” programme for schedule caste and tribes and women
entrepreneurs to access loans in the state of Andhra Pradesh. Half of the financial year is
going to complete within a day’s but they have selected only 42 candidates under this
programme. It shows that how the banking system has been working for the well being of
the weaker sections. We hope, the institutional credit agencies will fulfill the targets set for
the development of weaker sections in the state level banking committees.
REFERENCES
1. Sukhadev Thorat : Dalits in India - Search for A Common Destiny, Sage Publications, New Delhi,
2009.
2. Savaraiah G and Devarajulu M, Reservations under LPG Some Issues and Facts, Published in,
Ambedkar and Dalits in Contemporary India, Academic Publishers, Bangalore, 2005.
3. R. Sangeet Rao: Exploitation of Schedule castes and Tribes, Scewastam, New Delhi, 2000.
4. Stand up India Yet to Gain pace in State, The Hindu 22-Sep 2016.

261
ARTICLE / 36
DOES BANKING SECTOR HELP THE RURAL
POOR? A STUDY ON MICRO CREDIT THROUGH
COMMERCIAL BANKS IN ANDHRA PRADESH
M. Muralimohan & M. Devarajulu
INTRODUCTION
Until recent economic reforms, India was the prime example of a country that aggressively
pursued the directed-credit approach. It is rightly pointed out that the impressive recent
growth of certain sectors of the Indian economy is a necessary but insufficient condition for
the eradication of extreme poverty. The extent of poverty has been increased with the growth
rate of the economy. Of course, on one hand, many of luxurious articles like cell phones, cars
(NANO) and other electronic goods are now available even to the low income groups; but
on the other hand a majority of the population who live below the poverty line are unable
to satisfy even their basic needs. This type of situation is not a safeguard to any economy,
which finally leads to internal unrest. However, economists say that, it is quite natural that
the parallel increase in the growth and inequalities in a developing economy are not the right
answer for high incidence of poverty in the country. India is said to be the home of one third
of the world’s poor. The rapid and globalized economic growth generates many new and
innovative opportunities as well as challenges to the individuals all over the countries in the
world. The India also experienced with these global changes that leads to new strata of its
occupational distributions and introduced new methodologies in respect to its major problems
such as poverty, unemployment, inequality and financial exclusion of the poor who has been
neglected for decades and out of the fruits of the stated immense growth of the economy.
However India shines with its seventh rank for its abnormal growth rate among the world
economies and at the same time it accounts for 130th rank of the total 188 countries in its
Human Development Index (HDI) as per the estimates of UNDP Report 2015. According to
the poverty estimates 2011-12 by the Expert Group (Tendulkar Methodology) Report 2014,
there was 11 per cent representing 6.18 millions of population were below poverty line in
rural Andhra Pradesh where as it was 5.8 per cent in urban centres representing 1.7 millions
of urban poor in Andhra Pradesh. However, a lot of challenges lie in understanding poverty
from the socio-political and economic empowerment perspectives of the people in poverty.
Post-Doctoral Fellow, Department of Economics, Sri Venkateswara University, Tirupati, A. P.Professor & Registrar, Dept. of Economics, Sri Venkateswara University, Tirupati, Andhra Pradesh.

262 The Economy of Andhra Pradesh
One way of understanding poverty is to look at exclusion of poor from access to and utilization
of financial institutions, which were primarily aimed at serving the socio-economic development
of masses, especially in the developing economies. By recognising the need of financial
inclusion for excluded groups the Indian banking sector has initiated and implemented a
variety of schemes and programmes in order to bring the excluded sections in to the pathway
of rapid and sustained economic development. Among those new strategies of Indian banking
sector, the most appreciated and succeeded methodology of poverty reduction by financial
inclusion is the micro credit.
Micro credit, which received remarkable popularity among various components of
microfinance, considered as a tool of economic development whose objective is to assist the
poor to work their way out of poverty. It covers, a range of services which include, provision
of credit, money transfers, counselling and enables women’s empowerment by routing credit
directly to women, thereby enhancing their status within their families, the community and
society at large. Being driven by these factors, Micro Finance Institutions (MFIs) have emerged
in many developing countries including India and has become a critical engine of inclusive
and sustainable growth for women through group lending bank linkage programme.
MICRO CREDIT IN INDIA
The concept of microfinance has come into practice at first in India by a non-formal
financial organization started in 1974 in Gujarat named as “Self-Employed Women Association”
(SEWA), which was established based on the cooperative principles and owned by women
of petty trade groups. The microfinance sector in India gained real impetus with the
establishment of the National Bank for Agriculture and Rural Development (NABARD) in
1982. NABARD’s well-known microfinance scheme, which named as “SHG-Bank Linkage
Programme” (SBLP) was first initiated through a pilot project in Karnataka in the mid-1980s
and has now expanded throughout the country. It is increasingly adopted by Government
agencies as a vehicle for their programmes. In this model, NABARD refinances commercial
banks and this has to be distributed loans to Self-Help Groups (SHGs) in order to facilitate
relationships between the banks and poor borrowers. The SHG-Bank Linkage Programme has
made significant progress since 1998. This programme has greatly increased the outreach of
the banking system to otherwise unreached households, especially to women as SHG members
and initiated a change in the outlook of banks towards low income families from beneficiaries
to customers.
POVERTY, MICRO CREDIT AND INDIAN BANKING SECTOR
Recently, several policy initiatives were taken to advance rural banking. These include
additional capital contribution to NABARD by the RBI and the Government of India,
recapitalization and restructuring of RRBs, simplification of lending procedures as per the
Gupta Committee recommendations, preparation of a special credit plans by public sector

263
banks and launching of Kisan Credit Cards in 1998. Similarly, a scheme linking Self-Help
Groups with banks has been launched under the aegis of NABARD to augment the resources
of microcredit institutions. A Committee has gone into various measures for developing
microcredit, and submitted its report, which is under the consideration of the RBI. All these
were reinforced and directed credit became as “the mantra” of the Indian financial sector. Yet,
the entire network of Primary Cooperative Credit Societies, RRBs and other commercial
banks including SBI group in the country, established to meet the needs of the rural sector
in general and the poor in particular, has not proved to be successful in meeting the demand
for credit of the rural folk. Thus, the new initiation of microfinance is being increased as a
potential and most preferred sector in Indian financial screen through NGOs, MFOs, Banks
and other Government agencies involving in SHG-BLP scheme etc. As per the Report of
NABARD, by the end of Financial Year 2015-16 the total Rs. 37286.9 crore were disbursed
to the total number of 1832323 Self-Help Groups (SHGs) as micro credit under the scheme
of SHG-Bank Linkage (SBLP) scheme by the Indian banking sector across the country.
Among the total disbursed the amount Rs. 34411.4 crore were exclusively disbursed to
1628671 of women SHGs in the country. The report also reveals that the Indian banking
sector loans outstanding is Rs. 57119.2 crore against to the total 4672621 SHGs and it was
Rs. 51428.9 crore for the total number of 4036225 exclusive women SHG across the country
as by the end of March 2016. All these figures implies that the contribution of Indian banking
sector for the development of poor groups and to make an effective financial inclusion in
rural India.
STATEMENT OF THE PROBLEM
In Andhra Pradesh, the majority of people depend upon agriculture and its allied activities,
who often suffer from the serious problems like low rainfall, lack of irrigation facilities,
inadequate employment and income and low access to the formal credit. The Rayalaseema
region long known as a famine belt, it is economically most vulnerable part of Andhra
Pradesh. Soil erosion is one of the serious problems of the region and its ground water
potential is also very limited. As a result of this vulnerable character of the region, poverty
encourages migration. In this regard, the government of Andhra Pradesh and Society for
Elimination of Rural Poverty (SERP), which is an autonomous society of the Department of
the Ministry of Rural Development, Andhra Pradesh, jointly made many efforts to the upliftment
of the poor especially in rural areas and regarded that the provision of micro credit is the best
solution and source for survival of rural women to improve their livelihoods by taking a
variety of income generating activities.
This paper evaluates the impact of micro credit received from the banking sector on
livelihood status improvement of poor families in rural Andhra Pradesh with the following
objectives.
Does Banking Sector Help the Rural Poor? • M. MURALIMOHAN & M. DEVARAJULU

264 The Economy of Andhra Pradesh
OBJECTIVES
1. To examine the credit utilization pattern among SHG women groups in rural areas
2. To assess the impact of micro credit on income levels of the rural poor
METHODOLOGY
The study is based on both secondary and primary data. Secondary data was collected
from different sources such as administrative reports, Journals, reports of Reserve Bank of
India and NABARD. The primary data was collected through personal interview with an aid
of a schedule from the sample respondents belong to Self Help Groups (SHGs) in Kambhamvari
Palle mandal in Chittoor District of Andhra Pradesh. The sample for the study includes the
customers of bank and individual customer of the bank. The sample size for present study
is 60 from different age groups and categories in the village.
DISCUSSION AND OBSERVATIONS
CREDIT UTILIZATION PATTERN OF SAMPLE RESPONDENTS
The credit utilization pattern of SHG-Bank Linkage Programme (SBLP) sample
respondents is a better indicator in terms of taking right decision in order to improve the
living standards and raise the level of empowerment. A production-oriented (income-generating)
loan such as investing on cultivation, business, buying milch cattle and other income generating-
activities has more potential for increasing household’s income and improve welfare of the
families of sample beneficiaries than a loan used for celebration of ceremonies and other
unproductive activities. Table –1 shows the credit utilization of sample beneficiaries in the
study area.
Majority of sample respondents (65 per cent)have spent their loan amount on income-
generating activities, whereas; 10 per cent spent on un-productive activities like traditional
functions, purchase of household appliances and on other facilities like tap connection, house
renovation etc. followed by 03.33 of respondents who used their loan amount to meet the
medical expenses and 08.33 per cent of sample respondents who used it to meet for other
unforeseen expenses.
Table – 1
Credit Utilization Pattern of Sample Respondents
Sl.No Utilization of Credit No. ofRespondents Per cent
1 (A) Credit Utilized for Specific Purposes like
a For Productive Activities 39 65.00
b To Clear Other Loans 08 13.33
c For other Un–productive Activities 06 10.00
Sub-Total 53 88.33

265
2 (B) Credit Utilized Unforeseen Purposes like
a For Medical expenses 02 03.33
b For Other expenses 05 08.33
Sub-Total 07 11.67
3 Total Sample Respondents 60 100.00
Source: Field Survey.
Note: Per cent refers the percentage to the total number of respondents.
MICRO CREDIT AND INCOME GENERATION
Raising the living standards by increasing their sources of income is the main objective
of micro credit. But, the chance of increasing the sources of income is highly subjected to
the beneficiaries’ credit utilization pattern and their skills of managing the loan amount. The
Table–2 presents the responses of the sample respondents on income generation through
different activities with the help of micro credit.
Table – 2
Responses of Sample Respondents with regard to Income Generation through Micro Credit
Sl.No Micro Credit Improves Family Income No. of Respondents Per cent to Total
1 Yes – through Credit utilised for
a Agricultural Production 12 20.0
b Milk Production 19 31.67
c Business / Self-Employment 03 05.00
d Others 02 03.33
Sub-Total 36 60.00
2 No – because of Credit utilised for
a House Construction 09 15.0
b Children Education 02 03.33
c Clearing Old Debt 08 13.33
d Others 05 08.33
Sub-Total 24 40.00
3 Total Sample Respondents 60 100.00
Source: Field Survey.
Note: Per cent to total refers the percentage to the total number of respondents.
From Table –2, it was found that for majority (31.67 per cent) of respondents, maintained
milch cattle as a major source of income; whereas, only five per cent could set up their own
business owing to lack of awareness on self-employment and low levels of job-specific skills.
Significantly, 40 per cent of sample respondents utilized their loan amount for non-income
Does Banking Sector Help the Rural Poor? • M. MURALIMOHAN & M. DEVARAJULU

266 The Economy of Andhra Pradesh
generating activities and could not get proper returns from their investments made through
micro credit.
IMPACT ON INCOME GENERATION
An attempt is made to observe the social dimension of the impact of micro credit on
generation of income for sample respondents in the study area. These observations are presented
in Table –3.
Table – 3
Caste-wise Responses of Respondents with regard to Income Generation through Micro Credit
Sl. No Category Micro Credit Improves Family Income TotalRespondents
Yes No
1 SC & ST 06(30.00) 14(70.00) 20(100.00)
2 BC 18(90.00) 02(10.00) 20(100.00)
3 OC 12(60.00) 08(40.00) 20(100.00)
4 All Categories 36(60.00) 24(40.00) 60(100.00)
Source: Field Survey.
Note: Figures in parenthesis indicate percentage to the total sample respondents.
Table–3 presents the responses of sample respondents towards the increase in the overall
income of the family after availing the micro credit. As per the answers to the question
regarding the changes effected in the overall income of their family by securing the micro
credit, we found that 90 per cent of sample respondents of BC category could get new
employment opportunities enabled by micro credit loan, followed by 60 per cent of OC
category sample respondents and 30 per cent of SC & ST category sample respondents in the
study area.
MICRO CREDIT AND FAMILY INCOME LEVEL
The Women who constitute half of the population in the country play crucial role in
their family in many ways and contribute much more than the men in order to achieve good
qualitative human resource development in the economy. They actively participated in a
variety of income-generating activities with an objective of raising their family’s living standards
by contributing income as an addition to their family members’ income. It improves their
family status in society. In this connection, Table–4 reveals the changes in the levels of family
income of sample respondents ‘before’ and ‘after’ availing the micro credit from SBL
programme.
From the Table –4, it is observed that in the period ‘before’ securing micro credit, 30.0
per cent of the total sample respondents family income was less than Rs.20000, whereas;
‘after’ it reduced to five per cent only. As the same it is also significant to observe that there

267
was not even one respondent with a family income of Rs.60000 and above at the time ‘before’
securing micro credit, but after securing it has reached to 16.67 per cent which shows an
immense impact of micro credit on family income levels.
Table – 4
Impact of Micro Credit on Shifts in Family Income Levels of Sample Respondents
Sl.No Family Income Levels in Rs. No. of Respondents Families in different
Income Groups as ‘before’ and ‘after’
availing Micro Credit
Before After
No. of Res. Per cent No. of Res. Per cent
1 Up to 19999 18 30.00 03 05.00
2 20000–39999 30 50.00 09 15.00
3 40000–59999 12 20.00 38 63.33
4 60000 & Above 00 00.00 10 16.67
Total Respondents 60 100.0 60 100.0
Source: Field Survey
Note: Per cent to total refers the per centage to the total number ofrespondents.
THE SOCIAL DIMENSION
The Table–5 clearly presents caste-wise changes in family income levels of sample
respondents through micro credit in the study area.
From the Table –5, it is found that with regard to social groups, there was a considerable
positive impact among social groups with regard to growth of average annual income resulted
by micro credit. From the observations it was clear that the sample respondents of Backward
Castes category had around 1.05 times of growth in the average annual income, followed by
71.83 per cent in Other Castes category and 58.86 in Scheduled Caste& Scheduled Tribes
category’s with reference to average annual income levels compared to pre-micro credit
period.
CONCLUSIONS
From the analysis it is evidently proved that micro credit through banking sector in
India has not resulted uniformly in assisting the families of poor women respondents to come
up from below poverty line and to change their primary occupation from agriculture and its
allied activities to non-agricultural activities, which is one of the prime objectives of micro
credit. From the observations of the present study it is found that the considerable number
of the sample respondents have not utilized the total loan amount for productive purposes.
In this connection, it is suggested to the banking authorities that the rural poor should be
Does Banking Sector Help the Rural Poor? • M. MURALIMOHAN & M. DEVARAJULU

268 The Economy of Andhra Pradesh
Ta
ble
– 5
Cas
te-w
ise
Imp
act
of
Mic
ro C
redit
on
Sh
ifts
in F
amil
y I
nco
me
Lev
els
of
Sam
ple
Res
po
nd
ents
Sl.
No
Cate
gory
Nu
mb
er o
f R
espo
nd
ents
Fam
ilie
s in
dif
fere
nt
Inco
me
Tota
lRes
.A
vera
ge
An
nu
al
Fa
mil
y
Gro
up
s a
s ‘b
efo
re’
an
d ‘
aft
er’
ava
ilin
g M
icro
Cre
dit
Inco
me
(Rs)
Rs
< 1
99
99
Rs
20
00
0 –
Rs
40
00
0 –
Rs
60
00
0
399
99
599
99
& A
bo
ve
Bef
ore
Aft
erB
efo
reA
fter
Bef
ore
Aft
erB
efo
reA
fter
Bef
ore
Aft
erG
row
th(%
)
1S
C &
ST
14
03
05
07
01
08
00
02
20
22
000
34
950
58
.86
2B
C0
30
13
01
04
14
00
05
20
29
450
60
400
10
5.0
9
3O
C0
10
12
01
07
16
00
03
20
32
300
55
500
71
.83
4T
ota
l18(3
0.0
)0
3(5
.0)
30(5
0.0
)0
9(1
5.0
)1
2(2
0.0
)3
8(6
3.3
3)
00
10(1
6.6
7)
60
(100
.0)
27
917
50
283
80
.12
So
urc
e: F
ield
Su
rvey
Note
: P
er c
ent
indic
ates
gro
wth
bef
ore
an
d a
fter
; F
igu
res
in p
aren
thes
is i
ndic
ate
per
cen
tag
e to
th
e to
tal
resp
ond
ents
.

269
given preferential treatment in the disbursement of micro credit and provision of training
facilities regarding to various self-employment programmes and income generating schemes.
From the field experience it was recognised that the majority of women members of SHGs
have no perfection on ideology of financial literature and have no own skills of operating
their account which they could already had. So, it is highly needful to literate the rural poor
for maintaining their accounts by their own and to know the benefits supplemented by the
respective banks in their areas. It is also important that the habit of thrift must be cultivated
by the members who must be motivated to impose self-ceiling on their desires to save more
out of their incremental income and make sound investment for the expansion of their
business or any other income generating activity. This study also concludes that micro credit
alone could not help in uplift the poor and in addition the beneficiaries of micro credit must
be trained with special concentration on job specific or enterprise specific skills in order to
raise the profits through micro credit loan which make them more economically empowered
and finally resulted in overall human resource development in the society.
REFERENCES
1. Hulme D. and Mosley P. (1996), Finance Against Poverty, Vol.2, Route Ledge, London
2. Indira Kumari, Y., Rao B.S, and Rao R.V., “NGOs and Empowerment of Women – A case study of
Sanghamitra service society in Krishna district, published in “Empowerment of Women and Ecologcal
Development” (2000)
3. Muhammad Yunus (2004), Grammen Bank, Micro Credit and Millinium Development Goals, Economic
and Political Weekly (EPW), Vol.XXXIX, No.36, September, 2004
4. PriyaBasu with SreevasthavaPradeep, “Scaling of Micro Finance for India’s Rural Poor”, World
Bank, working paper series-3646, 2005
5. National Council of Applied Economic Research (NCAER), 2008; Impact and Sustainability of SHG-
Bank Linkage Programme, NCAER, New Delhi, India
6. Mohanty (2010), SHG-Bank Linkage Programme, Issues and Perspectives of Studies and Research,
Microfinance world, Jan-March, 2010
7. Report of Expert Group to Review the Methodology for Measurement of Poverty, 2014, Planning
Commission of India, GoI,
8. India in Figures, 2015- MOPSI, GoI, New Delhi
Does Banking Sector Help the Rural Poor? • M. MURALIMOHAN & M. DEVARAJULU

270 The Economy of Andhra Pradesh
ARTICLE / 37
IMPLEMENTATION OF ANNUAL CREDIT PLANS
FOR FARM FINANCE : AN ANALYSIS
G. Savaraiah, S. Sravani & D. Udaya Santhi
INTRODUCTION
“Access to finance, especially by the poor farmers and vulnerable groups is a pre-
condition for employment, economic growth social cohesion” which in turn, help usher in
greater economic and social equity to held up strong and safe communities, there creating a
confident and democratic India with reduced degree of discrimination and regional in realities.
Credit is vital factor in Indian agriculture since majority of the rural farmers are poor. Hence
agricultural credit becomes poor man’s credit4. Technological transformation and rural
development necessitates the provision of cheap finance for production and investment credit.
Thus, the agricultural credit is of considerable importance in a capital-scarce Country like
India. The Report of the Agricultural Finance Sub-Committee5 was rightly indicated that the
rural credit system to be really useful and effective must take into account and pay attention
to the entire gambit of agriculturists. Credit requirements of the farmers may be three fold
purpose of consumption, production and other social purposes. The advent of Green Revolution
and the new farm technology comprising of high yielding varieties of seeds, fertilizers and
the recent policy decision to undertake wasteland development and a forestation have opened
new vistas in agricultural banking6. The Report on Multi- Agency Approach in Agricultural
Finance highlighted the need for evolving nation’s institutional agricultural credit system to
fill the growing gaps in agricultural credit7. Credit is an important component in maintaining
high levels of production is modern agriculture. Modern agriculture is frequently capital –
intensive and farmers like industrialists, need to borrow, especially for capital inputs such as
farm machinery. The more highly developed the agriculture sector, the greater the amount of
credit needed.
ACHIEVEMENTS OF ANNUAL CREDIT PLAN
Andhra Bank is the Lead Bank for the State of Andhra Pradesh. It is having the
responsibility of preparation and implementation of the annual credit plans and to take decisions
Professor, Dept. of Economics, S.V. University, TirupatiResearch Scholars, Dept. of Economics, S.V. University, TirupatiResearch Scholars, Dept. of Economics, S.V. University, Tirupati

271
Ta
ble
-1
An
nual
Cre
dit
Pla
n A
chie
vem
ent-
Las
t F
ive
Yea
rs
(Am
ount
in C
rore
)Implementation of Annual Credit Plans • G. SAVARAIAH, S. SRAVANI & D. UDAYA SANTHI
272 The Economy of Andhra Pradesh
in the State Level Banker’s Committees regarding fixing the targets for priority sector lending
and sub-targets for other priority sectors and to monitor the performance of participating
banks in the implementation of the annual credit plans in their service area. The details of
achievement of annual plans are presented in Table-1
ANNUAL CREDIT PLANS IN ANDHRA PRADESH
The annual credit plans for the last eight years for the undivided State of Andhra
Pradesh (up to 2012-13) and Navyandhra (from 2013-14 to 2015-16) have shown in table-
2. The table above reveals that there was a two-fold and two and half-fold increase in the
targets and achievements of the total priority sector advances. The percentage of achievements
for priority sector has surpassed the targets for the five years up to 2012-13 except 2008-09
is the undivided Andhra Pradesh. But in case of Navyandhra, the targets have fulfilled during
2015-16 only. The targets and achievements for total agricultural credit have shown impressive
growth i.e. two –fold and three –fold increase respectively during 2008-2013 in undivided
A.P while in Navyandhra, the targets and achievements have shown one-fold and one and
half-fold increase respectively. The targets set for agriculture have achieved more than 100
per cent in all the years except during 2008-09 for undivided A.P and 2014-15 for Navyandhra.
The same trends have appeared in case of achievements of crop loans in both undivided AP
and Navyandhra. But the achievements for agricultural term loans including allied activities
have surpassed the targets for the entire period except 2014-15 in Navyandhra. This may be
attributable to the mounting of overdue with the lanes and the initial and formation period
of Navyandhra. On the whole, the targets set for agricultural credit in the annual credit plans
have fulfilled for all the years except 2008-09 and 2014-15.
DISTRICT-WISE DISBURSEMENTS OF AGRICULTURAL CREDIT
District-wise short-term production loans, agricultural term loans including infrastructural
activities and allied activities, total agricultural loans disbursed and per centage of achievements
of ACP-2015-16 are furnished in the following table-2.
The table-2 shows that the percentage of achievement in the disbursement of agricultural
credit ranges from 50 per cent to 89 per cent up to 30 thSeptember 2015. The highest total
agriculture loans disbursed in Guntur District (14.07 per cent) followed by West Godavari
District (13 per cent), East Godavari (12.28 per cent) and Krishna District (7.50 per cent)
whereas the lowest loan disbursement has made in Vizianagaram (2.86 per cent), Srikakulam
(3.73 per cent), Visakhapatnam (4.81 per cent) and SPS Nellore district (5.30 per cent). This
analysis clearly shows that the developed districts have got more agricultural loans from the
banking sector under annual credit plan 2015-16. The highest percentage of achievement to
the targets of agricultural loans made by the banking sector is found in Anathapur (89 per
cent) followed by Visakhapatnam (88 per cent), Prakasam (65 per cent) YSR district (63 per
cent) and West Godavari district (62 per cent) whereas the lowest percentage of achievement

273
is noticed in Krishna (50 per cent) and Srikakulam (50 per cent). The rest of the districts fell
above 50 per cent and below 61 per cent of the achievement. On the whole, 62 per cent of
the achievement is for Navyandhra Pradesh. The short-term production loans accounted for
more than 79 per cent of the total disbursement of agriculture credit during 2015-16. The
highest amount of short-term production loans was disbursed in Guntur district (14.82 per
cent), West Godavari District (13.20 per cent), East Godavari (12.06 per cent) and Ananthapur
(10.59 per cent) whereas the lowest loan disbursement is found in VizayaNagaram (3.05 per
cent), Srikakulam (3.66 per cent), Visakhapatnam (4.04 per cent) and SPS Nellore district
(4.69 per cent). The lowest achievement in the short-term production targets is due to the
highest number of farmers who did not repay the crop loans to the banks as they are expecting
to waive the old bank loans under the Agricultural Debt Redemption Scheme. The highest
term loans disbursed West Godavari District (13.49 per cent), followed by East Godavari
(13.16 per cent) whereas the lowest amount is available is Vizianagaram (2.14 per cent), and
Srikakulam (4.0 per cent). The above analysis reveals that Vizayanagaram, Srikakulam and
Visakhapatnam districts are badly affected with very low level achievement in both short-term
and term loans disbursements.
Table – 2
Disbursement of Agriculture credit as on 30th September 2015
(Amount in Rs. Crore)
SlNo District Short term Agricultural Total Agriculture % of Achievement
Production Loans term loans loans disbursed
1 Srikakulam 1171.22 329.89 1501.11 49.96
2 Vizianagaram 973.97 176.96 1150.93 56.03
3 Visakhapatnam 1293.04 643.01 1936.05 88.41
4 East Godavari 3855.86 1089.48 4945.34 56.44
5 West Godavari 4222.03 1116.48 5338.51 61.54
6 Krishna 2230.27 788.98 3019.25 49.68
7 Guntur 4740.06 923.76 5663.82 62.73
8 Prakasam 2232.12 692.93 2925.05 64.57
9 SPS Nellore 1498.58 634.05 2132.63 55.46
10 Y.S.R 1844.60 502.02 2346.62 62.86
11 Kurnool 2246.38 416.82 2663.20 58.83
12 Anantapur 3386.10 499.74 3885.84 89.13
13 Chittoor 2284.59 465.51 2750.10 61.32
Total 31978.82 8279.63 40258.45 61.68
Source: Finance (Institutional Finance Department)
Implementation of Annual Credit Plans • G. SAVARAIAH, S. SRAVANI & D. UDAYA SANTHI

274 The Economy of Andhra Pradesh
DISTRICT-WISE TARGETS AND ACHIEVEMENT FOR ACP-2016-17
The Lead Bank at the State level in its meeting of SLBC has fixed the targets for
various activities of agriculture sector in the Navyandhra Pradesh. The particulars relating to
the district-wise targets are shown in the following table-3.
The government has asked the bankers to provide fresh loans and advances to the
farmers in the latest SLBC meetings. But the government failed to make the banks to fulfil
the targets set for 2016-17 in the Navyandhra Pradesh. To enable adequate credit flow to
agriculture sector targets are set this year for Public sector banks, Private sector commercial
banks, RRBs and Cooperative banks, for agriculture credit. As against the farm credit target
of Rs.36, 580 crore were disbursed during the khariff season. The highest percentage of the
achievement in the crop loans is found in Prakasam district followed by Nellore Ananthapur,
Krishna, East Godavari and West Godavari. The rest of the districts did not fulfil the targets
even 60 percent of achievement. With regard to the term loans only East Godavari reached
near to the target level.
Table – 3
District-Wise Targets and Achievement of Agriculture Credit-2016-17
Sl.No District Target for Sanctioned Target for Sanctioned Total Sanctioned
Crop Loans Term Loans Target
1 Srikakulam 1,446 1,070 582 69 2,028 1,139
2 Vizianagaram 1,223 791 317 95 1,540 886
3 Visakhapatnam 1,428 936 701 451 2,129 1,387
4 East Godavari 4,250 3,847 1,710 1,573 5,961 5,420
5 West Godavari 3,438 2,242 1,576 669 5,014 2,911
6 Krishna 2,912 2,595 1,266 252 4,178 2,847
7 Guntur 5,447 3,721 1,107 327 6,554 4,048
8 Prakasam 2,167 2,802 922 424 3,090 3,225
9 SPS Nellore 1,414 1,552 703 353 2,117 1,905
10 Y.S.R 2,820 2,060 620 327 3,440 2,387
11 Kurnool 4,434 4,180 640 151 5,075 4,431
12 Anantapur 2,705 1,791 652 442 3,357 2,234
13 Chittoor 2,896 1,920 704 373 3,600 2,292
Total 36,580 29,507 11,502 5,532 48,082 35,039
Source: Finance (Institutional Finance Department
LOANS TO LAND LICENSED CULTIVATORS – DISTRICT-WISE:
Andhra Pradesh is the first state in the country to promulgate an Act, “The Andhra

275
Pradesh Land Licensed Cultivators Act, 2011 to provide loans and other benefits like providing
eligibility cards to land licensed cultivators. Under this Act, the Revenue department issued
Loan Eligibility Cards (LEC) to 5, 76,147 tenant farmers in this State. The table-5 presents
the progress in lending to Licensed Cultivators during the last five years.
The number of loan eligibility cards and credit extended to licensed cultivators during
2015-16 (up to September 2015) are shown in Table-4.
Table – 4
Loan and Other Eligibility Cards issued and credit extended to licensed cultivators during 2015-16
(up to Sep, 2015)
SlNo District No. of LECs issued No. of licensed Cultivators
Sanctioned Crop Loans
Renewal New LECs Total Cultivators Amount
of old LECs (Rs in Cr)
1 Srikakulam 7846 7644 15490 670 2.01
2 Vizianagaram 10830 4997 15827 707 0.82
3 Visakhapatnam 5043 9921 14964 1498 2.91
4 East Godavari 84288 16833 101121 39887 81.84
5 West Godavari 110650 112603 223253 23067 43.93
6 Krishna 6037 9369 15406 1024 2.94
7 Guntur 3210 7630 10840 653 3.26
8 Prakasam 13996 0 13996 689 2.28
9 SPS Nellore 6364 1971 8335 202 1.05
10 Y.S.R 12282 10179 22461 10 0.07
11 Kurnool 417 3024 3441 650 1.99
12 Anantapur 4158 1186 5344 715 2.12
13 Chittoor 2475 2961 5436 241 1.66
Total 267596 188318 455914 70013 146.88
Source: Agriculture Department
There are 2, 67,596 tenant farmers who have renewed their old loan eligibility cards.
The revenue department has issued 188318 new cards to the tenant farmers. All together,
there are 4, 55,914 licensed cultivators who are expecting crop loans from the banks. Out of
the total licensed cultivators in the Navyandhra Pradesh, only 70 thousands (15 per cent) have
obtained the crop loans from the banking institutions. The highest numbers of loan eligibility
card holders are found in west Godavari (48.97 per cent) and East Godavari districts (22.18
per cent). Districts in rayalaseema region could not able to cross at least one per cent. But
Kurnool district touched about 5 per cent of the card holders. The rest of the districts are
having less than 5 per cent of the LEC holders. 87 per cent of the licensed cultivators
Implementation of Annual Credit Plans • G. SAVARAIAH, S. SRAVANI & D. UDAYA SANTHI
276 The Economy of Andhra Pradesh
sanctioned the crop loans of Rs.135.77 crore (86 per cent) in East and West Godavari
districts. The rest of the 11 district did not get even 14 per cent of the crop loan amount. This
analysis reveals the plight of the tenant farmers in getting the crop loans during 2015-16.
PAVALAVADDI SCHEME ON CROP LOANS
Lending crop loans to the farmers at an affordable interest rate through Institutional
finance has been the priority of the Government. Although, there has been a consistent
increase in credit delivery through institutional finance, a large number of farmers are still in
the fold of private finance. To reduce the financial burden of the farmers, the Govt. of A.P
has announced Rythu Sri (Vaddileni Panta Runalu/PavalaVaddi) Scheme on crop loan disbursed.
The Government has announced the interest free crop loans to all farmers’ up to Rs.1.00 lakh
and Pavala Vaddi for crop loans from Rs.1.00 to Rs.3.00 lakhs if repaid in time.
All the loanee farmers who have availed crop loans from financial institutions and
repaid the crop loans within due date are eligible under the scheme. The Govt. will reimburse
the 4 per cent interest amount to the bank account of eligible farmers. During 2010-11, an
amount of Rs.6000.00 lakhs was released under Pavala Vaddi. An amount of Rs.4853.86
lakhs was reimbursed to 5, 38,793 farmers. During 2011-13 an amount of Rs.7500.00 lakhs
was released under PavalaVaddi. So far, an amount of Rs.3863.58 lakhs was reimbursed to
3, 13,390 farmers during 2014-15,an amount of Rs.44.31 crore was settled under
Vaddilenirunalu and Rs. 1.02 crores was settled under Pavalavaddi. During 2015-16, an
amount of Rs.156.80 crore was released under the Vaddilenirunalu as against the allocation
of Rs.172.00 crore. An amount of Rs.9.50 crore was released under the Pavalavaddi as
against the allocation ofRs.10.00 crore. An amount of Rs.527.65 crore have been settled to
0.74lakh farmers accounts (as on Sept. 2015) under Vaddilenirunalu and Rs.10.40 lakh have
been settled to 0.02 lakh farmers’ accounts under pavalavaddi, and the settlement of claims
is under progress.
CONCLUSION
It is concluded that the target for crop loans have been surpassed during the last form
years. However, the farming community has been facing a large credit gap which filled up
by the borrowings from the moneylenders. The Pavala Vaddi Scheme is not reaching to all
the farmers particularly small and marginal farmers in the State due to the non-flexible norms.
Hence, the institutional credit delivery system is to be completely rearranged so that the
weaker sections in the farming activities are to be benefited in rural areas.
REFERENCES
1. Manas Chakrabarti: Rural Banking in India, New Century publications, New Delhi, 2011. P.44.
2. Tripathy, S.N: Institutional credit to agriculture, poverty and micro-finance, published(ED) Rural
Credit, Regional Rural Banks and micro-finance, Dy Bisoyi, T.K. Abhijeet publications, Delhi,
2010.P.155.

277
3. Gosh. A.K: Role of Regional Rural Banks in the current scenario published in (Ed) “Rural Credit,
Regional Rural Banks and micro-finance by Bisoyi, T.K, Abhijeet publications, Delhi, 2010. P.106
4. Savaraiah, G: Rural Banking in India: An Empirical Study, Daya Publications House, New Delhi.
1986. P.117.
5. RBI: Report of the Agricultural Finance sub-committee, Bombay, 1945. P.3
6. Ganesh Kumari.A: Falling Agricultural investment and its consequences; Economic and political
weekly. 1992. P.2
7. RBI: Report on multi-Agency Approach in Agricultural Finance, Bombay, 1978. PP.40-48
8. Shivaji. K: Agricultural finance by Commercial banks, A.P.H Publicizing Corporation, New Delhi,
2012. P.10
9. 179th SLBC of AP meeting Agenda Covered by Andhra Bank- Hyderabad.
10. Govt. of Andhra Pradesh: Socio-Economic Survey-2012-13 P.34.
Implementation of Annual Credit Plans • G. SAVARAIAH, S. SRAVANI & D. UDAYA SANTHI

278 The Economy of Andhra Pradesh
ARTICLE / 38
ANALYSIS OF THE LINKS BETWEEN PUBLIC
EXPENDITURE ON EDUCATION AND
EDUCATIONAL SECTOR PERFORMANCE IN
ANDHRA PRADESH
Nasir Khan, B.M. Varadaraja S., Vasyanaik B.
ABSTRACT
Like in developed countries expenditure on education in India is also increasing but not
at the faster rate. The governments are facing pressures to increase budgetary allocations to
social sectors, particularly to education and health. Formerly, education was a subject in the
state list, later, it was transferred to the concurrent list, and thus there is a role for both the
union and state Governments in the field of education. This inter alia depends on what are
current levels of spending, what target spending as per cent of income the States assume to
spend on education and given fundamental relationship between income levels and public
expenditures, how fast expenditures can respond to rising income levels. We present analysis
of public expenditures on education using state level public education expenditure data to
provide preliminary analysis on these issues in Andhra Pradesh. We also focus on analysis
of relationship between public expenditure on education and NSDP in Andhra Pradesh .The
study examines whether the financial allocation to education sector has increased over the
years. Loans and advances have been excluded. Educational expenditure as a whole is
considered, the findings suggest that the state governments is allocating only about meagre
per cent of NSDP to education.
Key words: Public expenditure of education, elasticity, NSDP, CAGR, ADF and unit root
test
Asst Professor, Dept of P.G. Studies in Economics, Sir MV College, Bhadravathi-Karntaka.Asst Professor, Dept of P.G. Studies in Economics, Sir MV College, Bhadravathi-Karntaka.Asst Professor, Dept of Studies in Economics, Govt first grade college Aynur, Shimoga (dist).

279
ARTICLE / 39
ECONOMIC STATUS OF CONSTRUCTION
WORKERS : A CASE STUDY IN TIRPATI
TOWN OF CHITTOR DISTRICT
K. Radhika
ABSTRACT
The construction sector is an important sector of the economy and contributes significantly
to GDP. According to the NSSO estimates, about 5.57 percentages of workers are engaged
in building and other construction work. There are around 500,000 construction workers in
Andhra Pradesh state alone. The construction industry is one of the largest and oldest industries
to be generating employment in India, next to the agriculture sector. The construction workers
are regarded as the prototype of extremely demanding jobs tagged as 3-D: dirty, dangerous
and difficult. They have scarcity of money to cater to the needs of their family members. The
local construction workers suffer from chronic unemployment due to the availability of large
numbers of migrant workers who are, willing to work at lower wages.
Tirupati is one of the fastest growing cities in the India. There is a high need of
construction workers in Tirupati city, consequently more number of workers migrate from
different parts of country. There is a need for information regarding their socio-economic,
working conditions and its impact on their life, problems they have been facing. There are
many studies done in the past on life of female construction workers. Very few studies are
available for life and working condition of construction workers. This prompted us to undertake
this study on construction workers.
From this study, it is observed that migration compounded by illiteracy, poor working
conditions, lack of infrastructures and security, sanitation, inadequate health service utilization
made these workers a vulnerable population. It may be said that the construction workers are
working in an unorganized sector and special policies need to be initiated to protect this
group. They are not satisfied with their wages and are ignorant about the social welfare
measures available to them. The working conditions along with their health have lots of scope
for improvement. There is a need to enforce the existing laws more stringently. Parents need
to be counselled regarding the importance of education. A more healthy and satisfied workforce
would lead to better productivity. Hence this study recommends a comprehensive, universal
and integrated Social Security System for these unorganized construction workers.
Assistant Professor, Department of Economics, S. V. University, Tirupati.

THEME - VI
PERFORMANCE OF SOCIAL SECURITYPROGRAMMES IN ANDHRA PRADESH


ARTICLE / 40
PUBLIC PRIVATE PARTNERSHIP IN
SCHOOL EDUCATION : ROLE OF THE
AKSHAYA PATRA IN MID DAY MEAL
SCHEME IN VISAKHAPATANAM CITY
K. Manjusree Naidu, M. Sudha & G. Raghavaiah
INTRODUCTION
Public-Private-Partnership (PPP) is a mode of implementing government programmes/
schemes in partnership with the private sector. The term private in PPP encompasses all non-
government agencies such as the corporate sector, voluntary organizations, self-help groups,
partnership firms, individuals and community based organizations.
Public-Private-Partnership (PPP) provides an opportunity for private sector participation
in financing, designing, construction and operation & maintenance of public sector programmes
and projects. A number of welfare programmes especially in primary and upper primary
education are initiated with community participation and through voluntary organizations.
There are many benefits of using PPP model and the primary benefit is to deliver efficient
services to the society. PPP model is used in all the sectors and government identified this
as an effective tool to deliver social sector infrastructure by focusing on reducing government
spending. Among the social sector infrastructure education and health are two important areas
which are given top priority by the government for achieving inclusive growth and sustainable
development.PPP model is highly successful around the world particularly in education and
health sector and created a milestone in transforming the society. In India PPP model is
gaining momentum in education and health sector due to inadequate government funds and
ineffectiveness. The present study made an attempt to analyze the importance of PPP in
education sector.
OBJECTIVES
1. To assess the role of PPP model in school education.
Associate Professor, Gitam Institute of Management, GITAM University, Vishakhapatnam.Assistant Professor, Gitam Institute of Management, GITAM University, Vishakhapatnam.Professor, Gitam Institute of Management, GITAM University, Vishakhapatnam.

284 The Economy of Andhra Pradesh
2. To evaluate the impact of mid day meal scheme on primary and upper primary
student academic performance and health .
3. To know the opinions of important stake holders feedback on Akshaya Patra Scheme.
4. To analyze the parent profile of students using mid day meal scheme.
LINKAGE BETWEEN HEALTH AND EDUCATION
There is a very effective link between health and education because malnutrition and
under nourishment on one side leads absenteeism and on the other side affect adversely
academic performance. The Existing mid day meal scheme is unable to focus on nutrition
levels and hygiene. Human development index and Sustainable development goals emphasizes
the importance of human resources in the economic growth of a country. To achieve these
goals government should focus on grass root issues such as quality primary education, school
enrolment, malnutrition, poor health conditions, absenteeism and poor academic performance
etc. So there is a need to focus on nutritious food and its influence on education. Education
can significantly improve the quality of life of a family for generations to come. When the
basic needs of a child, such as food are not met, education often becomes the last priority.
REVIEW OF LITERATURE
A research paper by Stephanie Bonds from the University of California, Berkeley,
arrived at an important conclusion that mid day meal scheme was highly useful to children
particularly from the lowest socio-economic backgrounds. The paper highlights that mid day
meal scheme was more prominent among the children whose parents were less educated
parents and belong to lowest economic status.
The report of Planning Commission on performance evaluation of Mid-Day Meal Scheme
observed that most of states did not follow the guidelines of Government of India in delivering
the food grains at the school point by PDS dealer, thereby resulting in the leakage of supply
chain, food grains supplied got adulterated and pilfered. According to 5th Joint Review
mission (2013) study in Uttar Pradesh shows that meal is not cooked regularly in the school
premises because of the disruption in the supply of food items, thereby the nutrient intake of
children was adversely affected.
CURRENT PRACTICES AND ISSUES IN MID DAY MEAL (MDM) SCHEME
“National Programme of Nutritional Support to Primary Education (NP-NSPE)”was
launched on 15th August 1995. The Scheme was extended during 2008-09 to cover children
of upper primary classes and the name of the Scheme was changed as ‘National Programme
of Mid-Day Meal in Schools’. At present all the Government primary and upper primary,
Government-aided Local Body Schools, National Child Labour Projects Schools, the centre
run under Education Guarantee Scheme (EGS)/Alternative & Innovative Education (AIE),

285
Madrasas and Maqtabs supported under SSA are covered under Mid-Day Meal Scheme.
According to MHRD annual report 2013-14 the Mid Day Meal Scheme covered 10.68 crore
elementary class children in 12.12 lakh schools in the country. India’s Mid-Day Meal Scheme
is one of the largest food assistance programs in the world with a 2013-2014 budget. Of
Rs.30 billion ($490 million) managed by the Ministry of Education being linked with nutrition
education and related educational activities. An overview of the outlay for Mid-day meal
scheme is presented in table-1.
Table – 1
Year Wise Outlay under Mid Day Meal Scheme (Rs. In crore)
Financial Year BE RE Releases
2016-17 9700.00 —- 5471.99 56.41
(as on 26-09-2016)
2015-16 9236.40 9236.40 9151.55 99.08
2014-15 13215.00 11050.90 10526.97 95.26
2013-14 13215.00 12189.16 10927.21 89.65
2012-13 11937.00 11500.00 10867.9 94.50
2011-12 10380.00 10239.01 9901.91 96.71
2010-11 9440.00 9440.00 9128.44 96.70
2009-10 8000.00 7359.15 6937.79 94.27
2008-09 8000.00 8000.00 6539.52 81.74
2007-08 7324.00 6678.00 5835.44 87.38
Source: http://mdm.nic.in/
The table-1 shows the government spending on Mid Day Meal Scheme in this decade
almost 95 to 99 percent of the revised estimated budgets allocated was spent on providing
Mid-day to children.
NORMS FOR MID-DAY MEAL SCHEME AS PER THE ANNUAL REPORTS OF
MHRD-2013-14
Table – 2
Calorific Value of mid-day meal at Primary and Upper primary stage children
S.No Item (In Grams) Primary School Upper Primary
Children School Children
1 Food grains (rice/wheat/nutria-rich cereals) 100 150.0
2 Pulses 20 30.0
3 Vegetables 50 75.0
4 Oil/fat 5 7.5
Source : Annual Report MHRD 2013-14
Public Private Partnership in School Education • K. MANJUSREE NAIDU, M. SUDHA & G. RAGHAVAIAH

286 The Economy of Andhra Pradesh
The items shown in table 2 provide 450 calories of energy and 12grams of protein for
primary school children and 700 calories of energy and 20 grams of protein for upper school
children.
IMPLEMENTATION OF THE MID-DAY MEAL SCHEME
i. The overall responsibility for providing cooked and nutritious mid day meal to the
eligible children lies with the State Governments
ii. School Management should also be encouraged to draw the support of the community
especially mothers’ groups in ensuring efficient cooking, serving and cleaning
operations
iii. Healthy and hygienic practice to be ensured as per the prescribed guidelines
iv. Funds are released in two installments for uninterrupted implementation of the scheme.
NEED FOR PPP MODEL FOR SUCCESSFUL IMPLEMENTATION OF MID DAY
MEAL SCHEME
There is a gap between the norms for implementation of the mid day meal scheme and
the issues in the implementation process. Hence it is high time to see the alternative methods
for the effective implementation of the scheme.PPP is one of the best methods for the
effective utilization of government expenditure and to reach the target beneficiaries.
The primary benefits of using PPP to deliver services include:
i. Government expenditure can be efficiently used for the purpose it is allotted.
Greater efficiency can be achieved due to private partners operational and management
efficiency.
ii. Accountability and transparency of the private partner for the allotted project is
measured through social audit.
iii. Cost-effectiveness is key factor for the success of any project. Private partner focuses
on cost effectiveness in the allotted project .
iv. Higher Productivity is expected within the project because payments is linked to
performance
v. Clear Customer/beneficiary Focus because the selected private partner strives for
attaining high level of customer/beneficiary satisfaction.
AKSHAYA PATRA: THE PRIVATE PARTNER FOR IMPLEMENTING THE MID-
DAY MEAL SCHEME
In 2000, The Akshaya Patra Foundation was founded to address the dual challenges of
hunger and education in India. The organization provided nutrition-rich midday meals to

287
extremely underprivileged children in India with the aim of increasing school enrollment,
reducing drop-out rates, and improving academic performance. The Akshaya Patra program
had a simple vision: “No child in India should be deprived of education because of hunger.”
Because of India’s enormous population, this vision was difficult to realize.
Srila Prabhupada was the inspiration behind starting the Akshaya Patra Foundation in
2000 to open a temporary kitchen in Bangalore, India, to provide mid-day meal for students
at five local schools. Today, the program uses 19 centrally located kitchens to deliver hot
meals to schools across nine states in India. The success of this foundation delivery of quality
mid day meals for school children has resulted in reducing hunger, increased school enrollment,
regular attendance and developing hygienic habits like hand wash before the food intake,
cleaning the plates etc, and addressing chronic malnutrition.
THE AKSHAYA PATRA FOUNDATION: APPLAUDS AND AWARDS :
i. This is a very important and great mission -Dr.A.P.J.Abdul Kalam, Former President
of India
ii. Rajyotsava Award 2003" from Karnataka by the then Chief Minister Sri. S M Krishna.
iii. Government of Rajasthan Independence Day Award 2006 from then Governor – Smt.
Pratibha Devisingh Patil.
iv. CNBC IBL Awards confers “Social Enterprise of the Year 2008” to ‘The Akshaya
Patra Foundation’
v. Gold Shield from ICAI awards for EXCELLENCE in FINANCIAL REPORTING –
MARCH - 2009
vi. Distinguished Alumnus Award 2010, IIT Mumbai
vii. International acclaim: US Congressional Hunger Centre (CHC) awarded the
International Fellow to Akshaya Patra out of 35 social organizations around the
world. World Economic Forum invited Akshaya Patra to share its experiences for
THE PROJECT HUNGER in Africa
viii. National Awards for Innovations in services for Akshaya Patra was awarded by the
Indian Urban Space Foundation as the Best Innovative Project for the Innovations in
Services for Urban Poor.
ix. Reorganization from Limca Book of Records for providing food to one million
children
AKSHAYA PATRA MID-DAY MEAL SCHEME IN VISAKHAPATANAM
AkshayaPatra foundation began its operations as an NGO in Visakhapatnam in October
2008 and currently feeds 16810 students in the schools in the urban areas of Visakhapatnam.
Akshaya Patra Foundation also provides food in 307 Anganwadi centers covering 39320
children.
Public Private Partnership in School Education • K. MANJUSREE NAIDU, M. SUDHA & G. RAGHAVAIAH

288 The Economy of Andhra Pradesh
FINANCIAL IMPLICATIONS OF MID DAY MEAL SCHEME
Table –3
The coverage and expenditure trends for the scheme
Components 2007-08 2008-09 2009-10 2010-11 2011-12 2012-13 2013-14
Children covered (in cr.) 11.37 11.19 11.36 10.46 10.54 10.68 10.35
Total expenditure (in cr.)** 5835.44 6688.02 6937.79 9128.44 9901.91 10868.00 10805.00
Per child expenditurePer annum (in Rs.) 513.23 597.68 610.72 872.70 939.46 1017.60 1043.96
Expenditure per day per child (in Rs.) 1.41 1.64 1.67 2.39 2.57 2.79 2.86
Primary and Upper Primary combined** includes cost of food grains.
Source: Annual Report MHRD 2013-14
The data in table-3 provides the trends in coverage and expenditure of mid day meal
scheme during the period 2007-2008 to 2013-14. The total beneficiaries of the scheme more
or less remain the same around 10.04 to 11.04 crore per annum during the period under
consideration, but expenditure was doubled from Rs.5835.44 crore to Rs. 10805.00 crore. So
on an average per day expenditure per child increased from Rs 1.41 to Rs 2.86.
Contribution of Government and Akshaya Patra Foundation for mid day meal scheme
during the survey
i. 1st to 5th Class children’s per child per day Govt contribution Rs 4.60.
ii. 1st to 5th Class children’s per child per day Govt. rice contribution 100grams at free
of cost
iii. 6th to 10th Class students per child per day Govt contribution Rs 6.38
iv. 6th to 10th Class students per child per day Govt rice contribution 150grams free of
cost
v. Cooking and Transport cost Rs 9 to Rs 10
vi. The Akshaya Patra Foundation Contribution Rs 3.62.
ANDHRA PRADESH GOVERNMENT ORDER 31 DATE 26/2/2016
Further keeping the increasing costs recently in February 2016 government revised the
mid day meal scheme cost per day to Rs 4.86 for primary school and Rs 6.78 for upper
primary school but to provide better nutritious food it costs more than what government is
currently spending. This can be observed from expenditure made by Akshaya Patra scheme.
The comparative amounts are presented in table-4.
From the expenditure as shown in table-4 for the Mid-Day meal scheme in Visakhapatnam,
the share of the Government expenditure for 6954 primary school children is 55.96%, for 444
upper primary school children share it is 63.80% and for 9412 high school children it is

289
63.80%.The expenditure share of Akshaya Patra from total expenditure for primary school
children is 44.04%, 36.20% for upper primary school children and 36.20% high school
children.
Table – 4
Mid Day Meal Scheme Expenditure by the Government and Akshya Patra Scheme
Description Primary School Upper Primary School High School
Total Number of students (16810) 6954 444 9412
Government Expenditure 31988.4(55.96%) 2832.72(63.80%) 60048.56(63.80%)
Akshaya Patra 25173.48(44.04%) 1607.28(36.20%) 34071.44(36.20%)
Total Expenditure 57161.88(100.00) 4440.00(100.00) 94120.00(100.00)
Source: Akshaya Patra Foundation,Visakhapatnam.
An interesting observation from the above analysis is the expenditure towards Mid-day
meal scheme is shared between the public and private sector in the ratio of 55% to 60 % of
the government and 40% to 45% by Akshaya Patra. Akshaya Patra Foundation was successful
in providing the food as per the calorie value norms of mid day meal scheme without having
any problems. With the PPP model government in this case, could improve the nutritious Mid
Day Meal without any additional financial burden for the government.
DATA ANALYSIS
This section provides a brief understanding on the opinions of the beneficiaries of the
MDM scheme. For this, the opinions of 200 students who were aware about the scheme and
its benefits, 20 teachers and 12 head masters are collected through a structured questionnaire
from various schools covered under the scheme were randomly interesting. The data was
collected 58 percent are boys and 42 percent girls in the category of primary, upper primary
schools and high schools. About 93 percent of the students’ father or both the parents work
as daily wage earner. Following are the findings of the survey pertaining to health, absenteeism
and academic performance.
Table – 5
Attendance of the Students
Responses/Opinions Percentage
Daily 78
Alternate 12
Weekly 10
Total 100
Public Private Partnership in School Education • K. MANJUSREE NAIDU, M. SUDHA & G. RAGHAVAIAH

290 The Economy of Andhra Pradesh
As per the data collected, 78% of the students have attended the classes regularly and
12% of the students attended the school alternate days and 10% of the students were found
attended once in a week due to domestic commitments.
Table – 6
Opinion about the taste of the food served in the school
Responses/Opinions Percentage
Satisfactory 77
Not satisfactory 08
Neutral 15
Total 100
The data in table-6 indicates that, 77% of the respondents said that they are satisfied
with the taste of the food served by Akshaya Patra and 8% of the student said they were not
satisfied. About 15% of the students were neutral in their opinion.
Table – 7
Is the mid-day meal scheme motivating you to come to school daily
Responses/Opinions Percentage
Yes 81
No 19
Total 100
Table – 8
Academic performance of the students
Responses/Opinions Percentage
Excellent 02
Good 73
Average 10
Below Average 15
Total 100
As per the opinions of the Headmaster/teachers there was a significant improvement in
the academic performance of the students of their schools, around 75% of the students shown
an excellent to good academic performance.
FINDINGS
1. Mid-Day Meal Program has been successful in addressing classroom hunger in sample
schools.

291
2. In general, visible shortage of basic infrastructural facilities and manpower, the key
success factors of the Mid-Day Meal scheme, were addressed.
3. Mid-Day Meal Scheme seems to have contributed to an increase in the attendance
in schools across the sample schools.
CONCLUSION
In India PPP model is gaining momentum in education and health sectors because of
inadequate government funds and ineffectiveness of existing schemes. Quality of human
resources depends on health and education, particularly primary education. There is a gap
between the MHRD specified norms for mid day meal scheme and present implementation
practices. In this context the best alternative for the government is to identify the best private
partner to implement the mid day meal scheme through PPP model. The Akshaya Patra
Foundation received applauds in India and across the world for serving quality food to school
children which helped in increasing school enrolment rate and regular attendance.
MDM scheme is not just a feeding program with a Philonthrophical motive, but it is
an important commitment towards proper nourishment of future generations of India and to
improve the enrolments and academic performance at the school level. This model of PPP
with right private partner in Visakhapatnam schools proved to be a beneficial model for both
government and the public in terms of reducing the financial burden of the state and to
improve health of the students. Social Protection Schemes functions as an important mechanism
for improving the health, attendance to schools and academic performance of students
particularly in Elementary and Upper Primary Schools.
REFERENCES
1. Annual Report MHRD 2013-14.
2. Akshaya Patra Foundation,Visakhapatnam.
3. David Upton Christine Ellis Sarah Lucas Amy Yamne ,Harvard Business School,R : Akshaya Patra:
Feeding India’s Schoolchildren, December, 1 7 , 2 0 0 7.
4. Ramachandra Kamath ,Ananthapadhmanaba Achar ,Mr Bharath Shetty,A report on Measuring the
Impact of Mid- Day-Meal on Child Growth,Manipal University, Manipal, India September 2012
5. Saluja N, Bhatngar M, Garg SK, Chopra H, Bajpai SK .Nutritional Status of urban primary school
children in Meerut. The Internet Journal of Epidemiology 2010; 8 (1) .
Public Private Partnership in School Education • K. MANJUSREE NAIDU, M. SUDHA & G. RAGHAVAIAH

ARTICLE / 41
MAHATMA GANDHI NATIONAL RURAL
EMPLOYMENT GUARANTEE ACT IN
ANDHRA PRADESH
Shaik Ameer
ABSTRACT
This paper is a modest attempt to evaluate the impact of MGNREGA on employment
generated, wages paid and wages spent by the beneficiaries of the scheme. After providing
the salient features of the scheme, an attempt was made to present the functional details of
MGNREGA in 13 districts of Andhra Pradesh with reference to the year 2015-16. The
discussion in this paper is based on primary data collected from 300 beneficiaries under the
scheme covering 12 mandals in Anantapur, East Godavari and Visakhapatnam districts. The
data were analyzed by preparing tables on awareness about the scheme, duration between the
issues of job cards and provision of employment, no. of days of employment provided and
amount of wages paid. Specifically, an attempt was made to study how the wages received
under the scheme and spent by the sample beneficiaries. It was observed that majority of the
beneficiaries have spent on improving their irrigation works, educating their children, purchase
of medicines and other health related items of expenditure. The author suggests that the
scheme should be implemented in the off-seasons and special attention should be paid to
provide employment to SCs and STs. The author cautions about potential interference, which
dilutes the spirit of the scheme.
Key Words: MGNREGA, Job cards, Employment Generation, Wages Paid and Wage spent
Academic Counsellor, Department of Economics, Centre For Distance Education, Acharya NagarjunaUniversity, Guntur, Andhra Pradesh

ARTICLE / 42
PUBLIC DISTRIBUTION SYSTEM AND
FOOD SECURITY IN ANDHRA PRADESH
G. Savaraiah & M. Kumar Raju
The poverty alleviation and eradication of hunger are two vital objectives of rural
development programmes in India. Among various programmes of poverty alleviation and
hunger mitigation, the public distribution system (PDS) is considered as a means of income
support and social protection in the rural India. The euphoria on the self-sufficiency in food
grains in India is to a large measure misplaced. It India since Independence has been starving
off famines and deaths on account of starvation, there are huge area of near – saturation for
the bulk of the people and gross distributional inequalities. There is the paradox of grains
lying, even rotting, in warehouses and people starving in the outbacks. The World Food
Conference in Rome in mid-seventies arrived at a very poignant conclusion. Nothing more
overwhelms the human spirit or mocks our values than the desperate struggle for sustenance.
No tragedy is more than the look of despair in the eyes of a starving child. The World Food
Conference, convened by the General Assembly of the United Nations, adopted a famous
declaration on the eradication of hunger and malnutrition. The declaration had urged the UN,
the developed countries of the World and developing Third World to undertake a constructive
programme which should be multipronged as well as bold and meaningful. What Ghandhi
said of the role of food in a human being’s life in a 1946 speech at Noakhali, now in
Bangladesh, remains the most powerful expression of the importance of making access to
food a basic human right. Gandhi also wanted that the pathway to ending hunger should
involve opportunities for everyone to earn their daily bread, since the process of ending
hunger should not lead to the erosion of human dignity. Sixty –six years after Gandhi’s
Noakhali speech, India is still home to the largest number of under nourished and malnourished
children, women and men in any country. The number of people going to bed partially hunger
now is more than the entire population of India in 947. This is true even today; the latest
National Sample Survey (NSSO) has exposed the lopsided development of the country. It
points out that about 58 percent of the farmers starve every day. Its findings resent an
appalling picture that the farm sector has become a losing proposition for most farmers.
Professor, Department of Economics, SVU College of Arts, TIrupati.Academic Consultant, Department of Economics, SVU College of Arts, TIrupati.

294 The Economy of Andhra Pradesh
PER CAPITA CONSUMPTION OF FOOD GRAINS
India’s biggest challenge still remains ensuring food and nutritional security to its
masses. It is the right of every person to have regular access to sufficient and nutritionally
adequate food for an active and healthy life. A country can be said to have achieved complete
food and nutrition security if each and every person in that country is able to consume an
adequate and balanced diet on a regular basis 5. Gross Domestic Product has increased 4.5
times and per capita consumption has increased 3 times. Similarly, food grain production has
increased almost 2 times. However, despite phenomenal industrial and economic growth and
while India produces sufficient food to feed its population, it is unable to provide access to
food to a large number of people, especially women and children 6. Sufficient food production
is not the only criteria to provide food security in a country and eliminate hunger. Nearly 40
per cent of all fruits and vegetables and 20 per cent of food grains that are produced rot due
to inefficient supply chains and never reach to the consumer markets. The household living
below poverty line (BPL) do not have sufficient means to ensure food and nutritional security.
NSSO data reveals that BPL households in rural India are spending as high as 70 per cent
of the consumption expenditure meeting their food requirements and the situation is similar
with APL (above poverty line) which spends 50 per cent on the same. The urban working
class spends nearly 30 per cent.
STATE OF HUNGER IN INDIA
Hunger in India is a common phenomenon. It is widespread and causes are different
across various sections of the society and the States. It is indeed alarming that not a single
State in India is either low or moderate in terms of its index score, most States have a
“serious” hunger problem and one State, Madhya Pradesh, has an extremely alarming hunger
problem. According to latest FAO estimates in the State of Food Insecurity in the World
(2014) 190.7 million people are undernourished in India. By this measure, India is the home
to a quarter of all undernourished population in the World. Also 51 per cent of women
between 15 to 59 years of age are anemic and 44 percent of children under 5 are underweight.
Mal nourished children have a higher risk of death from common childhood illness such as
diarrhea, pneumonia, and malaria. India is also amongst the most undernourished in peer
group nations. The Global Hunger Index ranks India at 63 out of 78 countries on the basis
of three leading indicators- prevalence of underweight children under 5 years, under 5 child
mortality rate, and the proportion of undernourished in the population.
PUBLIC DISTRIBUTION SYSTEM IN ANDHRA PRADESH
India’s public distribution system (PDS) is perhaps the largest of its kind anywhere in
the World. The Public distribution system is among the most important food security
programmes of government of India8. In fact, the PDS in the country to facilitates the supply
of food grains to the poor at a subsidized price 9. The targeted public distribution system was

295
introduced in the state of Andhra Pradesh and elsewhere in the country in 1997 with a view
to eliminate hunger. The PDS supplies essential commodities like rice, kerosene, sugar,
palmolein oil, wheat to the poor at subsidized prices. The Telugu Desam was introduced
cheap rice at Rs.2 per Kg in the state. The fair price shops are the major outlets under public
distribution system. The number of fair price shops are functioning in the state are shown in
table-1.
Table – 1
Number of fair price shops in Andhra Pradesh
Year Urban Rural Total
2007-08 7285 32845 40130
2008-09 6879 35758 42637
2011-12 6747 37832 44579
2012-13 7393 37385 44778
2013-14 4367 24325 28692
Source: GOAP-Socio-Economic Surveys.
Table-1 show that the number of the total fair price shops has increased by 4648 in
2012-13 over 2007-08, registering an increase of 11.58 percent. Thereafter, the number of fair
price shops in A.P has declined to 28692 in 2013-14. The rural fair price shops constituted
84.8 per cent in 2013-14 as against 81.85 percent in 2007-08. During 2013-14, the number
of fair price shops has considerably declined due to political compulsion. On an average, each
shop has 535 cards / families. There is one shop for every 1965 persons in Andhra Pradesh
as against the Government of India norm of one fair price shop for every 2000 persons.
RATIONALIZATION FAIR PRICE SHOPS
Rationalization of existing F.P. Shops has been done to ensure effective functioning of
PDS, and enable card holders have easy access to fair price shops without having to travel
long distances. Rural areas: 400 to 450 BPL and 50 Pink ration cards are attached to each
F.P. shop in rural area. Urban Areas: 500 to 550 BPL and 250 Pink ration cards are attached
to each F.P. shop in urban areas. Municipal Corporations: 600 to 650 BPL and 250 Pink
ration cards are attached to each F.P. shop in Municipal Corporations
DISTRIBUTION OF RATION CARDS
Purchase of subsided commodities from the PDS outlets is contingent on households
possessing a ration card. When the PDS became targeted in 1997 with grater stress on
reaching to the poor with a higher allocation to them, it became important to distinguish
between poor and non-poor. Based upon estimates by the Planning Commission, the population
was divided into BPL and APL categories. At the time of introduction of targeted public
Public Distribution System and Food Security in Andhra Pradesh • G. SAVARAIAH & M. KUMAR RAJU

296 The Economy of Andhra Pradesh
distribution system, BPL households were entitled to 10 kilogram (kg) of grains at a much
lower price than APL households. Based upon the state-wise poverty level, the Central
Government had to supply to the States their BPL requirement of rice and wheat together with
an additional allocation for the APL households in each State. In April 2000, the size of the
food grain ration to the BPL households was raised further from 10 to 20 kg per month at
a price of 50 per cent of the economic cost of the Food Corporation of India. The price of
APL food grains was raised to the full economic cost, thus completely eliminating the price
subsidy. With effect from April 2002, grain entitlement for both APL and BPL households
was increased to 35 kg per family per month. In December 2000, another category of households
were added under the “Antyodaya Anna Yojana (AAY)” catering to the poorest of the poor
with a much lower price. Under this scheme, poorest of the poor families from amongst the
BPL population covered under targeted public distribution system were identified and provide
food grains at Rs.2 and Rs.3 per kg. For wheat and rice respectively. The costs of distribution
have to be borne by the state governments. With effect from 1 st April 2002, the entitlement
under AAY was increased from 25 to 35 kg per month. There are three kinds of ration cards
distributed by the state government: APL, BPL and AAY10.The district- wise distribution of
ration cards and the distribution of rice are presented in table 2.
The table-2 reveals that the highest number of fair price shops are located in Anantapur
district (10.05 per cent) followed by Chittoor (9.86 per cent), Guntur (9.42 per cent) and East
Godavari (8.91 per cent) districts whereas these shops are low in Vizayanagaram district (4.71
per cent) followed by Y.S.R kadapa (6.01 per cent) S.P.S. Nellore (6.69 per cent), Srikakulam
(6.92 per cent) and Vishakhapatna (6.93 per cent) districts.
Out of the total white cards (10688214), the highest number (13 per cent) of the white
cards are found in East Godavari followed by Krishna (9.97 per cent), West Godavari (9.56
per cent) and Kurnool district (9.30 per cent) whereas the lowest number of white cards are
noticed in Guntur district (1.17 per cent) followed by Vizayanagaram (5.08 per cent), Y.S.R.
Kadapa (6.10 per cent) and Srikakulam (6.37 per cent). The highest number of Pink cards
are available in Vishakhapatnam (20.57 percent) followed by Krishna (16.12 percent), East
Godavari (15.99 per cent) and Guntur district (14.87 per cent). The lowest number of Pink
cards is found in Srikakulam (5.64 per cent) Kurnool (7.13 per cent), Y.S.R Kadapa (7.54 per
cent) and Anantapur (7.97 per cent). The New white cards issued to BPL families in the
Rachabanda Programme. The highest number of new cards issued to the poor Srikakulam
(12.59 per cent). Y.S.R. Kadapa (12.56 per cent), Krishna (9.54 per cent) and West Godavari
(9.33 per cent) district. In A.P, 9.75 lakh Antyodaya Anna Yojana (AAY) cards are in circulation
as on 31-03-2014. Out of this, the highest number of cards are found in Anantapur district
(11.35 per cent) followed by Chittoor (9.31 per cent), Vijayanagaram (9.24 per cent), and East
Godavari (8.89 percent). On the whole, East Godavari and Krishna districts have benefitted
more in getting all types of ration cards.
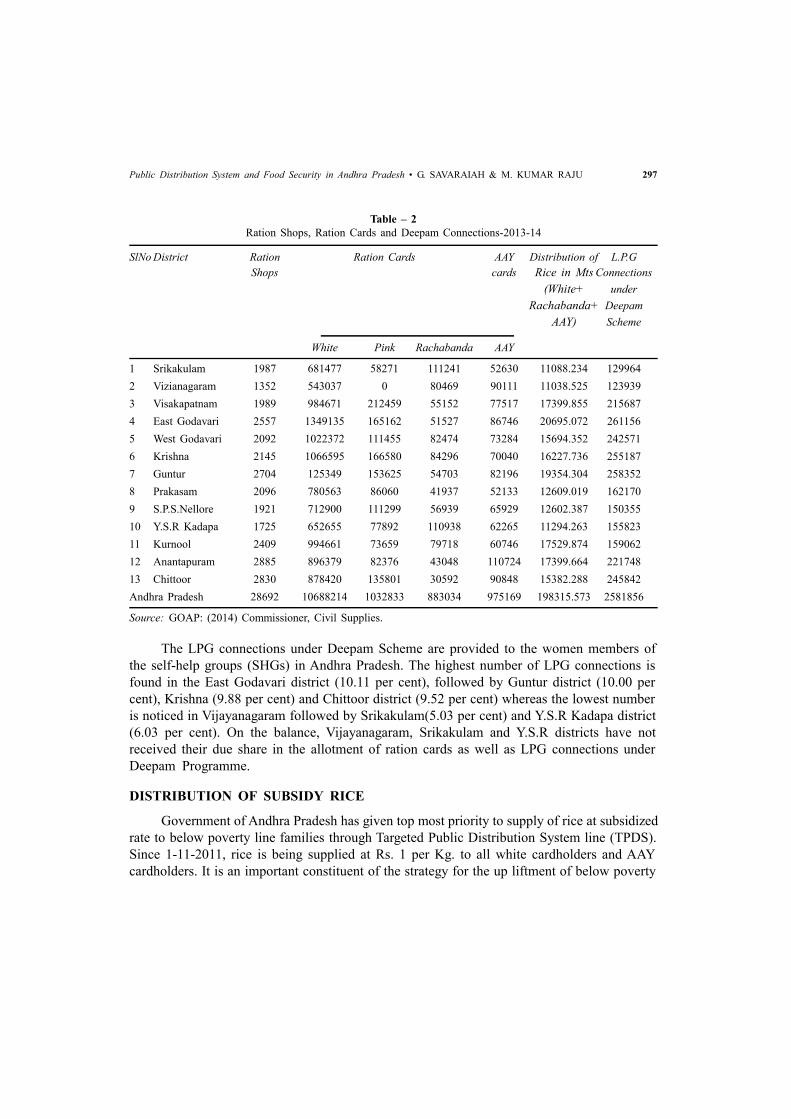
297
Table – 2
Ration Shops, Ration Cards and Deepam Connections-2013-14
SlNo District Ration Ration Cards AAY Distribution of L.P.G
Shops cards Rice in Mts Connections
(White+ under
Rachabanda+ Deepam
AAY) Scheme
White Pink Rachabanda AAY
1 Srikakulam 1987 681477 58271 111241 52630 11088.234 129964
2 Vizianagaram 1352 543037 0 80469 90111 11038.525 123939
3 Visakapatnam 1989 984671 212459 55152 77517 17399.855 215687
4 East Godavari 2557 1349135 165162 51527 86746 20695.072 261156
5 West Godavari 2092 1022372 111455 82474 73284 15694.352 242571
6 Krishna 2145 1066595 166580 84296 70040 16227.736 255187
7 Guntur 2704 125349 153625 54703 82196 19354.304 258352
8 Prakasam 2096 780563 86060 41937 52133 12609.019 162170
9 S.P.S.Nellore 1921 712900 111299 56939 65929 12602.387 150355
10 Y.S.R Kadapa 1725 652655 77892 110938 62265 11294.263 155823
11 Kurnool 2409 994661 73659 79718 60746 17529.874 159062
12 Anantapuram 2885 896379 82376 43048 110724 17399.664 221748
13 Chittoor 2830 878420 135801 30592 90848 15382.288 245842
Andhra Pradesh 28692 10688214 1032833 883034 975169 198315.573 2581856
Source: GOAP: (2014) Commissioner, Civil Supplies.
The LPG connections under Deepam Scheme are provided to the women members of
the self-help groups (SHGs) in Andhra Pradesh. The highest number of LPG connections is
found in the East Godavari district (10.11 per cent), followed by Guntur district (10.00 per
cent), Krishna (9.88 per cent) and Chittoor district (9.52 per cent) whereas the lowest number
is noticed in Vijayanagaram followed by Srikakulam(5.03 per cent) and Y.S.R Kadapa district
(6.03 per cent). On the balance, Vijayanagaram, Srikakulam and Y.S.R districts have not
received their due share in the allotment of ration cards as well as LPG connections under
Deepam Programme.
DISTRIBUTION OF SUBSIDY RICE
Government of Andhra Pradesh has given top most priority to supply of rice at subsidized
rate to below poverty line families through Targeted Public Distribution System line (TPDS).
Since 1-11-2011, rice is being supplied at Rs. 1 per Kg. to all white cardholders and AAY
cardholders. It is an important constituent of the strategy for the up liftment of below poverty
Public Distribution System and Food Security in Andhra Pradesh • G. SAVARAIAH & M. KUMAR RAJU

298 The Economy of Andhra Pradesh
line (BPL) population. The endeavor of the Government is to implement TPDS effectively,
efficiently and transparently for the best advantage of beneficiaries. Requirement of rice for
eligible card holders (white cards etc) is 1.98 lakh MTs per month. At present 9.75 lakh AAY
families are being supplied 35 Kg rice at Rs. 1 per Kg per family as against the target of 9.08
lakh AAY families. A quantity of 34217 MTs of rice is being supplied under AAY scheme
at Rs. 1 per Kg against the allotment of 31798 MTs per month. A total of 1.98 LMTs of rice
is being supplied to all BPL cardholders every month under PDS. The requirement of rice is
being met out of the allocation of 74493 MTs (i.e. 51131 MTS as regular and 23362 MTs
as additional ad hoc allocation) of BPL rice 31798 MTs of AAY rice, 499 MTs of Annapurna
rice and the remaining quantity from the APL rice of 890.92 MTs per month allotted by the
Government of India and the difference in cost of rice is being borne by the Government as
subsidy. The highest quantity rice (white cards + Rachabanda + AAY cards) is supplied to
the BPL card holders under PDS can be found in East Godavari district (1043 per cent)
followed by Guntur (9.75 per cent), Kurnool (8.83 percent) and Vishakhapatnam (8.77 per
cent). But the backward districts like Srikakulam(5.59 per cent) and Vizianagaram (95.56 per
cent ) districts require the lowest quantity of rice.
KEROSENE
A considerable number of poor families need kerosene for lighting and coking purposes
in the rural areas and urban slums. The power cut frequently occurs during the nights in the
rural areas. Hence, they are badly in need of the kerosene. 22668 KLs. of Kerosene is
allocated per month for distribution to all BPL cardholders.
PALMOLEIN OIL
The Civil Supplies Corporation purchases imported RBD Palmolein oil under Government
of India subsidy scheme at Rs. 15 per Kg or Rs. 13.65 per liter and makes it available for
distribution through PDS to BPL families at subsidized rates. All BPL card holders are being
supplied 1 liter per card at Rs. 40 /- per liter. Presently, the scheme is being run by the state
Government. The average off take per month during this year is 10604 MTs and consumed
by 1.16 Crore cardholder families.
AMMA HASTAM SCHEME
Government of Andhra Pradesh launched a scheme called “Amma Hastam” from 11-
04-2013. Under this scheme nine Essential Commodities Viz. 1 ltr Palmolien Oil 1 Kg Red
gram dhal, ½ Kg Sugar, 1 Kg Wheat, 1 Kg whole meal Atta, Chilly 250 Grams Powder, ½
Kg Tamarind, 100 Grams Turmeric Powder and 1 Kg iodized Salt are being supplied in
packed form at Rs. 185/-
The main objective of the scheme is to provide relief to BPL families from price rise
and to ensure supply of unadulterated quality and correctly weighed commodities in a packed

299
form. The cardholders can get benefit of Rs. 107/- per month against the present open market
price of Rs. 292/ for the essential commodities. In fact, it is a boon to the poor families who
afford at concessional rates.
SOCIAL WELFARE INSTITUTIONS (SWI) & SOCIAL WELFARE HOSTELS (SWH)
Central issue price of rice under SWI/SWH is Rs. 565/- per quintal. i.e.at BPL rate. The
rice is being released to meet the requirement of all Hostels, Ashram Schools, and Residential
Junior Colleges of ST, SC and BC categories and other institutions under the control of social
welfare department. And also to homes, hostels for Physically Handicapped, Residential
Schools for deaf and blind for boys and Girls, Handicapped children, State Home, Service
Home, Children Home, Collegiate girls Hostels, Crech centers (to the children of Agriculture
labour women) Balwadies, Regional Training Centers, Women Welfare Branches, Mobile
Creches, Women and Child Welfare Centre and Vocational Training Centers, which are under
control of Women Development and Child Welfare Departments. Rice is supplied at
Rs. 400/- per Qtl, to the above institutions. The normal monthly allocation made by Government
of India was 5772.260 MTs for Social Welfare Institutions as against the state requirement
of 17474.992 MTs. of rice .
MID-DAY–MEAL SCHEME
Government of India allotted a quantity of 138232 MTs, of rice under the MGNREG
scheme at free of cost for primary and upper primary classes, to meet the requirements under
cooked meal programme for the year 2012-13. Rice is being released to DWCRA women and
Self-help groups and through Fair Price Shops as allotted by the district collectors. In respect
of Hyderabad and Visakhapatnam Metropolitan Cities, rice is being released to Nandi
Foundation, an NGO, directly, for supply of cooked meal to the schools. It has been decided
by the Government, to release the rice stocks from MLS point to school point to Schools
points avoiding F.P. shops point, to ensure proper quality and weighment. In respect of IX
and X classes the state Government meets the expenditure of cost and transport and handling
charges.
CONCLUSION
The Global Hunger Index reveals that nearly 50 percent of Worlds hungry live in India.
The PDS has helped to reduce poverty and it improves food security of the poor. The targeted
public distribution system aimed at providing essential commodities to the poor both in rural
and urban areas at concessional rates. However, very often PDS is being criticized for in
effectiveness and in efficiency in achieving its objectives, the government of Andhra Pradesh
has been reducing the burden of subsidies on one hand and on the other it has drastically
reduced the number of white ration cards during 2013-14. A new study based on NSSO data,
has estimated that 46.7 per cent or 25.9 million metric tonnes of the grain (rice and wheat
Public Distribution System and Food Security in Andhra Pradesh • G. SAVARAIAH & M. KUMAR RAJU
300 The Economy of Andhra Pradesh
released through the PDS, did not reach the intended beneficiaries in 2011-12. The study
further reveals that Andhra Pradesh and Tamil Nadu are among the better performers with
11.1 per cent and 12.2 per cent leakages respectively. The Shanta Kumar Committee
recommendations are completely against the implementation of TPDS and Food Security Act.
It wants to reduce the coverage to 40 per cent of the population as against 67 per cent. The
TPDS is no doubt an instrument which reduces poverty and ensures the food security to the
millions of helpless poor.
REFERENCES
1. Planning commission : Himachal Pradesh development report, Government of India,2012, P.261
2. Declaration on the eradication of Hunger and malnutrition, adopted at Rome by the world food
conference in November 1994, held under the auspices of FAO, the United Nations.
3. M.S. Swaminathan: to the Hungry, god is bread, the Hindu, October1, 2011. P.7
4. Shivaji Sarkar : Hunger pangs of Anno dates’ the Hindu, 17 th February, 2015. P.7
5. Ghumaan, G.K and Dhiman, P.K: Role and effectiveness of Public distribution system in providing
food security in India, Indian Journal of Research, and Vol.3 issue. 5 June 2013. P.25
6. Indian Food Banking Network A food security foundation India initiative, www.india food banking.org/
hunger.
7. Ibid
8. Reetika Khera: Revival of the Public Distribution system: evidence and explanations. EPW, November,
5, 2011.
9. GOl : Tenth Five Year plan 2002-07, Planning Commission, New Delhi, 2001,P.365
10. The Hindu: Daily News paper 23-1-2015.
301
ARTICLE / 43
A COMPARATIVE STUDY OF THE PERFORMANCE
OF MGNREGA IN ANDHRA PRADESH AND
TELANGANA STATES
Putta Madhavi & G Sandhya Rani
INTRODUCTION
MGNREGA is a flagship programme of Govt. of India which forms the second strand
for development of rural areas, the first being the Bharat Nirman Programmes have been
important programme interventions in India and elsewhere in developing countries since
long. These programmes typically provide unskilled workers with short-term employment on
public works. They provide income transfers to poor households during periods when they
suffer on account of absence of opportunities of employment. In areas with high unemployment
rates and under employment, transfer benefits from workfare programmes can prevent poverty
from worsening, especially during lean periods. Durable assets that these programmes create
have the potential to generate second-round employment benefits as requisite infrastructure
is developed. MGNREGA is conceived as a holistic approach to make the growth more
inclusive.
Originally, the NREGA, National Rural Employment Guarantee Act Bill was notified
in 2005 and came into force in 2006 and further modified it as the Mahatma Gandhi National
Rural Employment Guarantee Act (MGNREGA) in 2008. The Mahatma Gandhi National
Rural Employment Guarantee Scheme is an employment scheme for providing 100 days of
unskilled work to all employment seekers above 18 years age and willing to do work.
MGNREGA
Important salient feature of the Act is to improve the quality of life of rural people who
are vulnerable to out-migration in search of daily wage employment by channelizing the wage
workforce towards developmental activities at the village level itself. The scheme was initially
in progress in the first phase districts during its cognitive stage has generated lot of enthusiasm
Assistant Professor, Dept. of Women’s Studies, Sri Padmavati Mahila Visvavidyalayam (Women’sUniversity),Tirupati, A.P.Professor, Dept. of Women’s Studies, Sri Padmavati Mahila Visvavidyalayam (Women’s University),Tirupati,A.P.

302 The Economy of Andhra Pradesh
among social scientists, and NGOs and led them to initiate several surveys on their own. The
surveys as in the cases of any other scheme are centered on the end results such as targeting
all the needy beneficiaries, and implementation of the Act and the scheme is gigantic in
nature and in the process of implementation and achieving the desired output. There are many
issues which are straddling the implementing agencies right from District to Gram Panchayat.
PRESENT STUDY
The authors have made attempt to study the situation of Andhra Pradesh after bifurcation
into Andhra Pradesh and Telangana States on 2nd June 2014 with an emphasis on the MGNREG
Scheme. The details of households which reached 100 days limit in the State of Andhra
Pradesh and Telangana during the years 2014-15 and 2015-16 is listed in the Table 1 and also
represented in Figure 1. The data shows that there isa less number of households in reaching
complete 100 days in terms of percentage of households. However the number of HHs
completed 100 days of work is bit high in Andhra Pradesh compared to Telangana during
2014-2016. HHs completed 100 days of work in Telangana and Andhra Pradesh is 6.59% and
11.59% respectively in the year 2014-15, where as in the year 2015-16, HHs completed 100
days of work in Telangana and Andhra Pradesh is 16.29% and 16.34% respectively. Average
days of employment provided per household were less than 50% in both the states in 2014-
15 and was same around 55% in 2015-16.
Table – 1
Households reached 100 days Limit in Andhra Pradesh and Telangana
State Andhra Pradesh Telangana
Year 2014-15 2015-16 2014-15 2015-16
Total Households Worked 33,00,000 36,03,000 24,33,000 25,63,000
Average days of employment provided per Household 47.25 55.26 42.42 55.29
Total No of HHs completed 100 Days of Wage Employment 3,82,545 5,88,555 1,60,281 4,17,505
% of Households Reached 100 days limit 11.59 16.34 6.59 16.29
Source: MGNREGA Official Web site
Figure 1: Number of HHs completed 100 days vs Total number of HHs

303
EMPLOYMENT PROVIDED TO WOMEN AND SCS/STS:
The details of total women participated in the MGNREG scheme during 2014-15 and
2015-16 in Andhra Pradesh and Telangana are listed in the Table 2. The data presented
reveals that, majority participants were women workers (more than 57%) in both the states.
The reason could be more awareness about the scheme among the women, and inclination
and interest to improve their economic independence.
Table – 2
Women Persondays in Andhra Pradesh and Telangana
State Andhra Pradesh Telangana
Year 2014-15 2015-16 2014-15 2015-16
Person days Generated [In Lakhs] 1559.04 1991.09 1032.06 1416.7
Women Person days out of Total (%)Person days of
employment provided 58.65 57.78 61.1 60.76
The total person days generated for the years 2014-15 and 2015-16 in the States of
Andhra Pradesh and Telangana and the SC/ST person days percentage data was given in the
Table 3. SC & ST person days percentage of total person days was high in Telangana as
compared to Andhra Pradesh during the period 2014-2016. SC & ST person days percentage
of total person days was more in Telangana as compared to Andhra Pradesh.
Table – 3
SC & ST Person Days in Andhra Pradesh and Telangana
State Andhra Pradesh Telangana
Year 2014-15 2015-16 2014-15 2015-16
Person days Generated [In Lakhs] 1559.04 1991.09 1032.06 1416.7
SC person days % as of total person days 22.77 22.58 24.17 24.2
ST person days % as of total person days 11.92 12.33 18.18 17.05
EMPLOYMENT PROVIDED TO DIFFERENTLY ABLED PERSONS
Percentage of differently abled persons worked is just 1.35% in 2014-15 and 1.26% in
2015-16 in Andhra Pradesh and the situation is same but slightly higher in Telangana and the
same is represented in the Table 4.
Households wage earnings and details of districts, blocks, Gram Panchayats are were
listed in the Table 5 it is noticed that the percentage of Gram Panchayaths with zero expenditure
is more in Telangana (3.44%in 2014-15 and 2.89% in 2015-16) compared to Andhra Pradesh
(2.6%in 2014-15 and 1.22% in 2015-16).Average wage rate per day per person is increased
A Comparative Study of the Performance of MGNREGA • PUTTA MADHAVI & G SANDHYA RANI
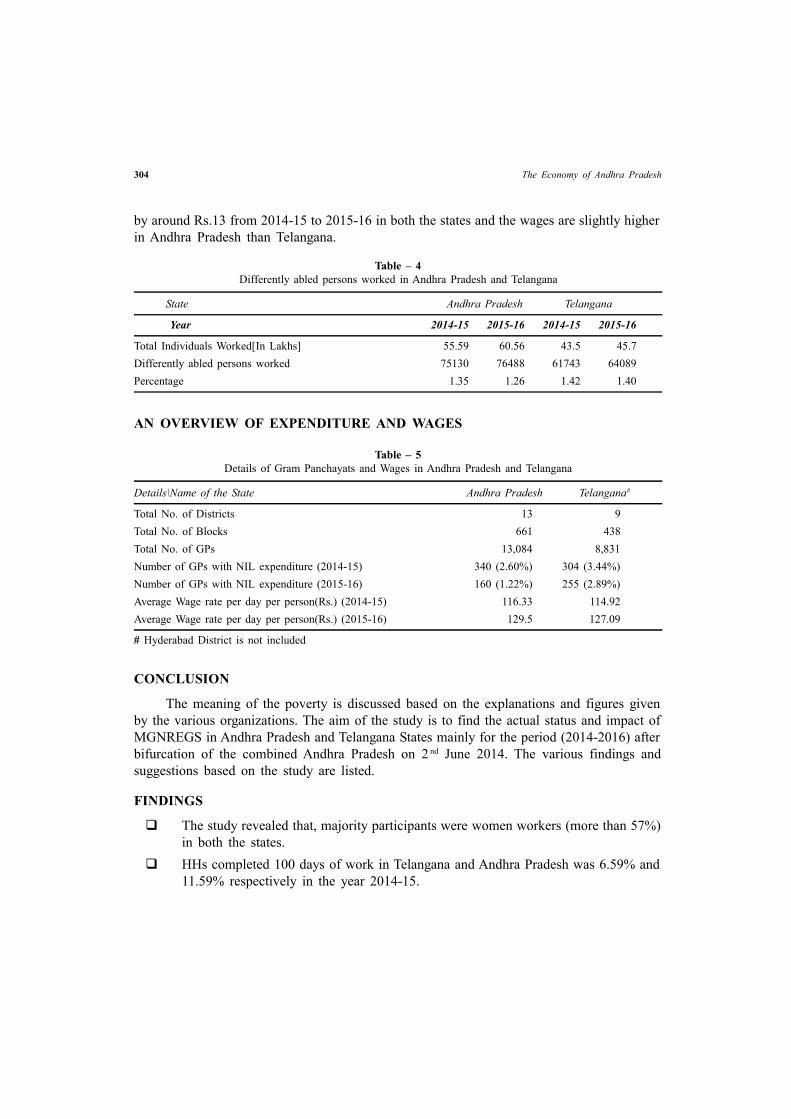
304 The Economy of Andhra Pradesh
by around Rs.13 from 2014-15 to 2015-16 in both the states and the wages are slightly higher
in Andhra Pradesh than Telangana.
Table – 4
Differently abled persons worked in Andhra Pradesh and Telangana
State Andhra Pradesh Telangana
Year 2014-15 2015-16 2014-15 2015-16
Total Individuals Worked[In Lakhs] 55.59 60.56 43.5 45.7
Differently abled persons worked 75130 76488 61743 64089
Percentage 1.35 1.26 1.42 1.40
AN OVERVIEW OF EXPENDITURE AND WAGES
Table – 5
Details of Gram Panchayats and Wages in Andhra Pradesh and Telangana
Details\Name of the State Andhra Pradesh Telangana#
Total No. of Districts 13 9
Total No. of Blocks 661 438
Total No. of GPs 13,084 8,831
Number of GPs with NIL expenditure (2014-15) 340 (2.60%) 304 (3.44%)
Number of GPs with NIL expenditure (2015-16) 160 (1.22%) 255 (2.89%)
Average Wage rate per day per person(Rs.) (2014-15) 116.33 114.92
Average Wage rate per day per person(Rs.) (2015-16) 129.5 127.09
# Hyderabad District is not included
CONCLUSION
The meaning of the poverty is discussed based on the explanations and figures given
by the various organizations. The aim of the study is to find the actual status and impact of
MGNREGS in Andhra Pradesh and Telangana States mainly for the period (2014-2016) after
bifurcation of the combined Andhra Pradesh on 2 nd June 2014. The various findings and
suggestions based on the study are listed.
FINDINGS
The study revealed that, majority participants were women workers (more than 57%)
in both the states.
HHs completed 100 days of work in Telangana and Andhra Pradesh was 6.59% and
11.59% respectively in the year 2014-15.

305
HHs completed 100 days of work in Telangana and Andhra Pradesh was 16.29% and
16.34% respectively in the year 2015-16.
Average days of employment provided per household was less than 50% in both the
states in 2014-15 and is same around 55% in 2015-16.
SCs& STs percentage of employment provided to total person days was more in
Telangana as compared to Andhra Pradesh.
Percentage of differently abled persons worked was just around 1.3 % and 1.4 % in
Andhra Pradesh and Telangana.
Percentage of Gram Panchayaths with zero expenditure was more in Telangana
(3.44%in 2014-15 and 2.89% in 2015-16) compared to Andhra Pradesh (2.6% in
2014-15 and 1.22% in 2015-16).
Average wage rate per day per person has increased by around Rs.13 from 2014-15
to 2015-16 in both the states and the wages were slightly higher in Andhra Pradesh
than Telangana.
SUGGESTIONS
MGNREGS should be diversified into the activities which need technical skill and
ability in order to increase the average person days
Awareness among the rural poor to know about the scheme and to utilize the benefit
of the scheme.
Encouragement for the people who completes 100 days by allotting additional days
of work.
REFERENCES
1. Basu, Arnab K., 2011, Impact of Rural Employment Guarantee Schemes on Seasonal Labor Markets:
Optimum compensation and Workers’ Welfare, ntl Journal of Economic Inequality
2. http://planningcommission.nic.in/plans/planrel/fiveyr/9th/vol2/v2c2-1.htm
3. http://www.effective-states.org
4. http://www.unesco.org/new/en/social-and-human-sciences/themes/international-migration/glossary/
poverty/
5. http://www.worldbank.org/en/news/press-release/2015/10/04/world-bank-forecasts-global-poverty-to-
fall-below-10-for-first-time-major-hurdles-remain-in-goal-to-end-poverty-by-2030
6. Jha, Raghbendra, Sambit Bhattacharyya, RaghavGaiha and Shylashri Shankar, 2009, Capture of Anti-
Poverty Programs: An Analysis of the National Rural Employment Guarantee Program in India,
Journal of Asian Economics 20(4): 456-464.
7. Kalarani Rengasamy and Sasi Kumar B, 2011, State Level Performace of MGNREGA in India: A
Comparative Study, International Multidisciplinary Research Journal, 1(10):36-40.
A Comparative Study of the Performance of MGNREGA • PUTTA MADHAVI & G SANDHYA RANI

306 The Economy of Andhra Pradesh
8. Khera, Reetika, (ed.), 2011, The Battle for Employment Guarantee, New Delhi: Oxford University
Press.
9. MGNREGA Official Web Site - http://www.nrega.nic.in
10. Shariff, Abusaleh, 2009, Assessment of Outreach and Benefits of National Rural Employment Guarantee
Scheme in India, Indian Journal of Labor Economics 52(2): 243-268.
11. Smelser, N. J. and Baltes, P. B. (eds.) 2001. International Encyclopaedia of the Social and Behavioural
Sciences. Elsevier. Oxford Science Ltd.
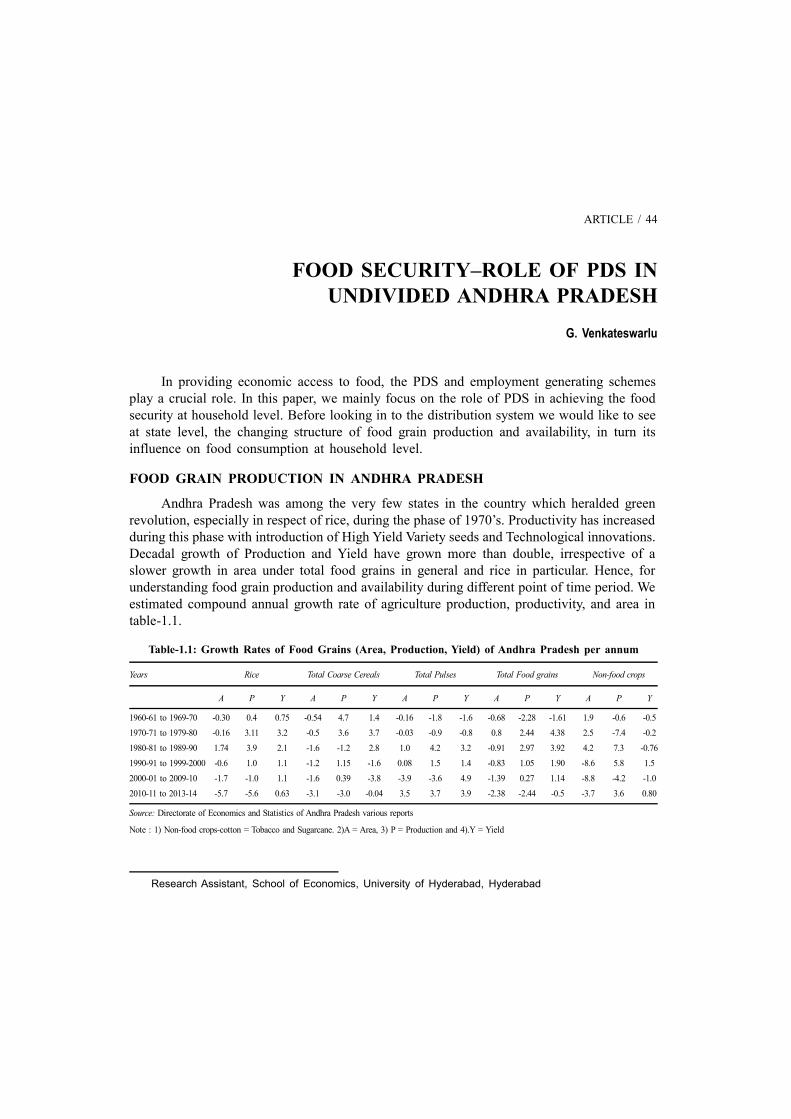
307
ARTICLE / 44
FOOD SECURITY–ROLE OF PDS IN
UNDIVIDED ANDHRA PRADESH
G. Venkateswarlu
In providing economic access to food, the PDS and employment generating schemes
play a crucial role. In this paper, we mainly focus on the role of PDS in achieving the food
security at household level. Before looking in to the distribution system we would like to see
at state level, the changing structure of food grain production and availability, in turn its
influence on food consumption at household level.
FOOD GRAIN PRODUCTION IN ANDHRA PRADESH
Andhra Pradesh was among the very few states in the country which heralded green
revolution, especially in respect of rice, during the phase of 1970’s. Productivity has increased
during this phase with introduction of High Yield Variety seeds and Technological innovations.
Decadal growth of Production and Yield have grown more than double, irrespective of a
slower growth in area under total food grains in general and rice in particular. Hence, for
understanding food grain production and availability during different point of time period. We
estimated compound annual growth rate of agriculture production, productivity, and area in
table-1.1.
Table-1.1: Growth Rates of Food Grains (Area, Production, Yield) of Andhra Pradesh per annum
Years Rice Total Coarse Cereals Total Pulses Total Food grains Non-food crops
A P Y A P Y A P Y A P Y A P Y
1960-61 to 1969-70 -0.30 0.4 0.75 -0.54 4.7 1.4 -0.16 -1.8 -1.6 -0.68 -2.28 -1.61 1.9 -0.6 -0.5
1970-71 to 1979-80 -0.16 3.11 3.2 -0.5 3.6 3.7 -0.03 -0.9 -0.8 0.8 2.44 4.38 2.5 -7.4 -0.2
1980-81 to 1989-90 1.74 3.9 2.1 -1.6 -1.2 2.8 1.0 4.2 3.2 -0.91 2.97 3.92 4.2 7.3 -0.76
1990-91 to 1999-2000 -0.6 1.0 1.1 -1.2 1.15 -1.6 0.08 1.5 1.4 -0.83 1.05 1.90 -8.6 5.8 1.5
2000-01 to 2009-10 -1.7 -1.0 1.1 -1.6 0.39 -3.8 -3.9 -3.6 4.9 -1.39 0.27 1.14 -8.8 -4.2 -1.0
2010-11 to 2013-14 -5.7 -5.6 0.63 -3.1 -3.0 -0.04 3.5 3.7 3.9 -2.38 -2.44 -0.5 -3.7 3.6 0.80
Source: Directorate of Economics and Statistics of Andhra Pradesh various reports
Note : 1) Non-food crops-cotton = Tobacco and Sugarcane. 2)A = Area, 3) P = Production and 4).Y = Yield
Research Assistant, School of Economics, University of Hyderabad, Hyderabad

308 The Economy of Andhra Pradesh
The data presented in Table -1.1 reveals that growth rate of rice in terms of area,
production and yield has shown a mixed result from 1960-61 to 1980-81. Mid 1980s registered
a positive growth for area, production and yield for rice with 1.7 percent, 3.9 percent and 2.1
per cent respectively in those variables. Between 2010-11 and 2013-14 growth rates under
area and production registered negative growth rates; however growth rate under yield continued
to be positive growth. Growth rate of area under coarse cereals was declining continuously;
it declined from -0.54 in 1960-61 to -3.1% in 2013-14.
PRODUCTION INDEX
Production index helps in understanding food grain production and availability across
the districts and regions, higher index value represents better performance in terms of production
availability at each district and region. In present study, data on production is taken from
1994-96 to 2011-13 in Andhra Pradesh.
I = *100
Where,
Ip:
Index of production
Xij:
ith production in the jth district
Ximx:
ith production in the district with highest value
Ximn:
ithproduction in the district with lowest value
The result of the Production Index are presented in Table -1.2. From table (1.2), it can
be observed that, in Telangana region, three districts namely Karimnagar, Nizamabad, and
Adilabad has better performances over the period since 1994-96 to 2011-12. In coastal
Andhra, Vizayanagaram, West Godavari and Krishna had sustainable performance, while
Rayalaseema has low performance in terms of food production as compared to coastal Andhra
region and Telangana region.
Table – 1.2
Production Indices
Districts 1994-1996 1997-1999 2000-2002 2005-2007 2008-2010 2011-2113
Adilabad 4.54 12.33 23.58 21 24 23
Nizamabad 7.78 -0.88 2.51 34 34 24
Karimnagar 15.04 14.26 -3.65 30 36 30
Medak 6.58 9.32 24 27 34 15
Rangareddy 0.64 0.85 34.9 0.89 2. 0.82
Mahabubnagar 3.96 11.14 -10.1 34 11 12
Nalgonda 13.14 9.15 22.62 22 34 19

309
Districts 1994-1996 1997-1999 2000-2002 2005-2007 2008-2010 2011-2113
Warangal 7.17 21.15 2.64 42 22 17
Khammam 8.52 11.62 4.22 24 34 10
Srikakulam 7.76 16.50 49.51 80 23 6
Vizianagaram 3.49 4.85 36.70 15 53 49
Visakhapatnam 2.25 3.55 48.09 39 10 9
East Godavari 27.7 8.68 41.24 28 22 25
West Godavari 39.91 26.44 33.78 54 34 33
Krishna 27.84 42.02 9.56 20. 23 25
Guntur 23.51 29.17 16.42 33 23 30
Prakasham 7.70 21.22 31.18 9 34 11
SPSR.Nellore 11.83 9.61 25.54 44 18. 20
Kadapa 0.56 1.03 25.32 8. 11 10
Kurnool 6.0 2.73 7.26 10 35 13
Ananthapur -0.57 0.85 12.41 9 36 16
Chittoor 1.58 5.72 12.06 5 7 2.3
Source: Computed from Hand Book of Statistics. Directorate of Economics &Statistics A P
Parthasarthy (1984) study found that North coastal Andhra region is highly instability
than south coastal Andhra. In Telangana region has had a unique experience with high growth
rates of production and with low instability, while in Rayalaseema region still remains to be
instability.
Table – 1.3
Net Availability Indices
District 1979 – 1982 1998 - 2001 2010 – 2013
Srikakulam 29 36 38
Vizianagaram 29 37 41
Visakhapatnam 14 23 13
East Godavari 41 60 26
West Godavari 60 90 16
Krishna 49 81 22
Guntur 37 67 22
Prakasam 34 48 37
Nellore 45 56 17
Kurnool 34 34 36
Ananthapur 20 17 10
Cuddapah 24 22 9
Food Security • G. VENKATESWARLU

310 The Economy of Andhra Pradesh
District 1979 – 1982 1998 - 2001 2010 – 2013
Chittoor 25 14 12
Ranga Reddy 10 8 20
Nizamabad 40 75 16
Medak 38 57 32
Mahaboobnagar 38 27 40
Nalgonda 44 63 21
Warangal 36 53 28
Khammam 34 53 15
Karimnagar 46 87 19
Adilabad 31 40 59
Source: For 1979-82 to 1998-2001 Net availability indices data is taken fromG.
NET AVAILABILITY INDICES
INPij = (Xij/ XiICMR) *100
INPij : Index of food grain availability of the jthdistrict for ith food item
Xij : Per capita availability of ith food grain item per day in the jth district
Xi ICMR: Per capita per day recommended intake of the ith food grain item
In order to understand net availability of food grains across the districts, the net availability
index is calculated. Table. (1.3), gives an idea on regional variation and disparities in terms
of production and net availability of food grains among various districts of Andhra Pradesh.
In Coastal Andhra, Net Availability of Food grains is higher in the district of West Godavari,
subsequently registers a higher food index across the districts of the state. In Telangana
Region, Karimnagar district registers higher food index, indicating higher net availability of
food grains. Amongst all regions, Rayalaseema region registers lower food indices with less
production.
ECONOMIC ACCESS TO FOOD
Food security is attained through adequate purchasing power of the consumer along
with physical access to the required food. Very often, poor sections of the society cannot
afford to obtain the available food due to higher market prices, in such context it becomes
imperative to establish various social protection programmes to ensure adequate access to
food. Economic access to food mainly depends upon the following drivers:
1. Employment
2. Real Wage growth rates
311
3. Per capita consumption expenditure and
4. Poverty
EMPLOYMENT
The sustained creation of employment goes a long way in effectively increasing access
and ensuring right to food. The increase in remunerative employment opportunities especially
for the poor enables them to obtain the purchasing power to increase their food consumption.
The overall growth in employment in the country is thus closely related to the ability to
improve access to food particularly for the poor in both rural and urban India and unemployment
leads to inadequate purchasing power to participate in the market transactions, and it would
further hinder the access to food.
REAL WAGE GROWTH RATES
Real wages effectively determines purchasing power of Individuals as well as households;
elaborately, higher the rate of growth in real wage would imply higher purchasing power.
The available data shows that Andhra region except in the district of East Godavari, all
other districts witnessed a decline in real wage growth rate during 2005-09 in comparison
with 2001-04 growth rates under male category, while there is a decline in real-wage growth
rate for females in all districts of Andhra region. In Rayalaseema region, except Kadapa
district there is deceleration in growth rates of real wages during 2005-09 in both male and
female categories. However, trends in Telangana are better in comparison to Rayalaseema and
Andhra regions. Amongst nine districts, five districts showed progress in growth rate of real
wage for female category and three districts shown progress under male category during
2005-09. Overall trend in real wage growth rates had improved in most of the districts by
2010-13. Such an increase in real wage growth rate is attributed to the introduction of
MGNREGA in rural areas. Expansion of farm income continues to be an effective strategy
for reducing poverty.
PER CAPITA CONSUMPTION EXPENDITURE
An attempt is made to establish the association between consumption expenditure and
food security. Table-1.5 presents changes in Food and Non-Food Expenditure in Rural and
Urban areas of Andhra Pradesh. Over years since 1993-94 to 2011-12, food baskets of
consumer in both urban and rural areas have changed, witnessing a decline in food expenditure
combined with an increase in non-food expenditure. Food expenditure in rural areas which
stood at 59.59 per cent in 1993-94, reduced to 51.4 per cent in 2011-12, while Non-Food
Expenditure increased from 40.4% in 1993-94 to 48.59% by 2011-12, similarly, urban areas
also witnessed a decline in food consumption and an increase in non-food consumption
expenditure, but with a higher magnitude. When compared with All-India MPCE, the magnitude
of change in consumption expenditure in both food and non-food consumption expenditure
Food Security • G. VENKATESWARLU

312 The Economy of Andhra Pradesh
is higher for All-India Estimates as compared with Andhra Pradesh estimates. Under Food
Consumption Basket, Cereals shown a drastic decline as compared to other items under food
basket, with a decline of consumption expenditure in rural areas from 24.53% in 1993- 94
to 9.76% by 2011-12. Hence, we observed that, in rural area, major share of food expenditure,
with in that cereals consumption has major share, but later on has also gradually declined,
due to diversified food habits. In urban area during the initial period, non-food consumption
was lower than food consumption, but later on it moved towards non-food consumption that
could be due to investment on education and health etc.
Table – 1.5
Monthly per Capita Consumer Expenditure (MPCE) (In Rupees)
AP 1993-94 2004-05 2009-10 2011-12
Rural Urban Rural Urban Rural Urban Rural Urban
Cereal 70.84(24.53) 73.16 (10.07) 113.60 (19.40) 124.52 (12.22) 168.36 (13.64) 215.32 (9.62) 171.98 (9.76) 204.04 (7.67)
Pulses 11.05(3.82) 13.91 (3.40) 19.25 (3.2) 22.76 (2.23) 43.87 (3.55) 57.69 (2.57) 51.88 (2.95) 59.06 (2.19)
Edible Oil 14.21 (4.92) 18.32 (4.48) 28.0 (4.78) 31.97 (3.13) 38.4 (3.11) 50.57 (2.25) 57.21 (3.26) 65.5 (2.43)
Meat/Egg 13.09 ( 4.53 ) 16.08 (3.93) 25.10 (4.28) 31.51 (3.09) 80.77 (6.54) 102.70 (4.58) 125.0 (8.66) 133.23 (4.96)
Milk Products 15.29 (5.29) 28.22(6.90) 32.34 (5.52) 59.42 (5.83) 66.76 (5.41) 114.34 (6.45) 98.91 (5.63) 145.65 (5.42)
Sugar 5.38 (1.86) 7.01 (1.71) 8.05 (1.37) 9.80 (0.96) 14.69 (1.19) 19.3 (0.86) 16.9 (0.96) 20.57 (0.76)
Total Food 172.05(59.59) 219.95 (53.83) 323.15 (55.18) 423.24 (41.55) 716.52 (58.07) 1002.30 (44.79) 901.58 (51.40) 1135.65 (42.29)
Total Non-Food 116.65(40.40) 188.65 (46.16) 262.40 (44.81) 595.31 (58.44) 517.24 (41.92) 1235.35 (55.20) 852.40 (48.59) 1549.43 (57.70)
Total Expenditure 288.70(100) 408.60 (100) 585.55 (100) 1018.55 (100) 1233.76 (100) 2237.65 (100) 1753.98 (100) 2685.09 (100)
Source: Various NSSO Report No .402, 508, 540 and 555.
POVERTY
Poverty is a state where a person is unable to maintain a minimum socially accepted
level of standard of living. As per the latest estimates of the Planning Commission, released
in March 2012, for the year 2009-10, the poverty ratios for rural and urban areas of Andhra
Pradesh was 22.8% and 17.7% respectively and combined it was 21.1%. The corresponding
figures for all India during the same period were 33.8%, 20.9% for rural and urban areas and
combined was 29.8%. Poverty levels in A.P. have been lower than the national average, and
its pace of reduction is faster than rate of reduction at all India level. Several factors have
contributed for such reduction of poverty over years. One of the reasons for such reduction
is attributed to effective functioning of Public Distribution System (PDS) ensuring access to
food resulting in attaining required calorie norm to be above poverty line.
According to Dev. (2007) poverty declined during pre-post reform period is due to
effective distribution system function, while that of growth rate of staple food grain prices
remain low and inflation is also low. These are the things attributed to reduction of poverty
in Andhra Pradesh. On one hand some policy measures to improve agriculture growth, macro
policy on industrial and rural non-farm sectors in the post period had adverse impact on

313
poverty reduction. On the other hand, it is believed that, it is due to social welfare programmes,
such as focus on providing food and nutritional security, PDS and ICDS which helped in
poverty reduction.
Table – 1.6
Average per Capita Intake of Calories, Proteins and Fat per Day in Andhra Pradesh
Years Calorie (Kcal/day) Protein (grams/day) Fat (grams/day)
Rural Urban Rural Urban Rural Urban
1972 – 73 2103 2143 53.0 51.0 21.0 31.0
1983 2204 2009 56.0 50.0 24.0 32.0
1993 – 94 2052 1992 50.8 49.6 27.2 34.9
1999 – 2000 2021 2052 49.4 50.8 29.5 41.5
2004-05 1995 2000 49.8 50.9 33.5 43.2
2009-2010 2047 1975 50.7 50.8 37.9 43.2
2011-12 2186 2150 53.6 54.2 43.4 49.9
Source: NSS Report No. 540 & 560: Nutritional Intake in India, 2011-12.
Table – 1.7
Poverty Ratios in Andhra Pradesh and for All India
Area Andhra Pradesh Poverty Percentage ChangePer Annum
Head count ratio (HCR)
1993-1994 2004-2005 2009-2010 1993-2004 2004-2010
Rural 48.1 32.3 22.8 -1.44 -1.9
Urban 35.2 23.4 17.7 -1.07 -1.14
All 44.6 29.6 21.1 -1.34 -1.76
All India
Rural 50.1 42 33.8 -0.75 -1.6
Urban 31.8 25.5 20.9 -0.55 -0.96
All 45.3 37.2 29.8 -0.74 -1.48
Source: Approach to the 12th Five Year Plan Andhra Pradesh p 28: Planning Commission
PUBLIC DISTRIBUTION SYSTEM AND FOOD SECURITY IN ANDHRA PRADESH:
It is now well recognized fact that the availability of food grains is not a sufficient
condition to ensure food security to the poor but the necessary condition is that the poor
should have sufficient means to purchase food. Hence, PDS subsidized food grain supply to
poor, is very important in providing food security. In this context, we want to see how far
functioning of PDS is effective, in providing food security to poor household.
Food Security • G. VENKATESWARLU

314 The Economy of Andhra Pradesh
For the sustenance of poor sections of households, who are excluded from remunerative
occupations, state intervention in enabling food and nutrition security becomes necessary.
Hence social security measures such as PDS plays an important role in providing access to
food at household level. Through PDS, food grains such as rice and wheat are supplied at
a subsidized price; on an average each household will be receiving 25 kgs of rice. Present
section analyses access to PDS in the state of Andhra Pradesh, which is one of the main
intervention of state to ensure food security with subsidized lending to poor sections of the
society.
The center allocates food grains to states on the basis of the identified BPL population,
the availability of food grains stocks, and the quantity of food grains lifted by states for
distribution under TPDS. Table (1.9), presents allotment and off-take of rice, a major staple
food in Andhra Pradesh during several years. It can be observed that, over years, allotment
of Rice to Andhra Pradesh has been fluctuating.
Table-1.8
Allotment and Off-take of Rice in Andhra Pradesh (in ‘000 tones)
Years Allotment Off take % Off take
1998 - 1999 128 106 83.3
1999 - 2000 137 112 81.5
2000 - 2001 161 79 48.8
2001 - 2002 171 80 47.1
2002 - 2003 359 105 29.1
2003 - 2004 343 133 38.7
2004 - 2005 345 165 47.8
2005 - 2006 400 191 47.7
2006 - 2007 432 211 48.8
2007 - 2008 273 225 82.2
2008 - 2009 241 221 91.5
2009 - 2010 295 210 71.2
2010 - 2011 315 287 91.3
2011 - 2012 315 260 82.7
2012 - 2013 295 226 76.7
2013 - 2014 295 210 71.2
Source: Andhrastat.com
From Table (1.8) it can be observed that, despite availability of rice through allotment
by Centre, state procured a less proportion, which could be witnessed through inverse
relationship between increase in allotment of rice by center and declining trends in percentage
off-take. Such trend may be due to less storage capacity of state, self-sustainable stocks with
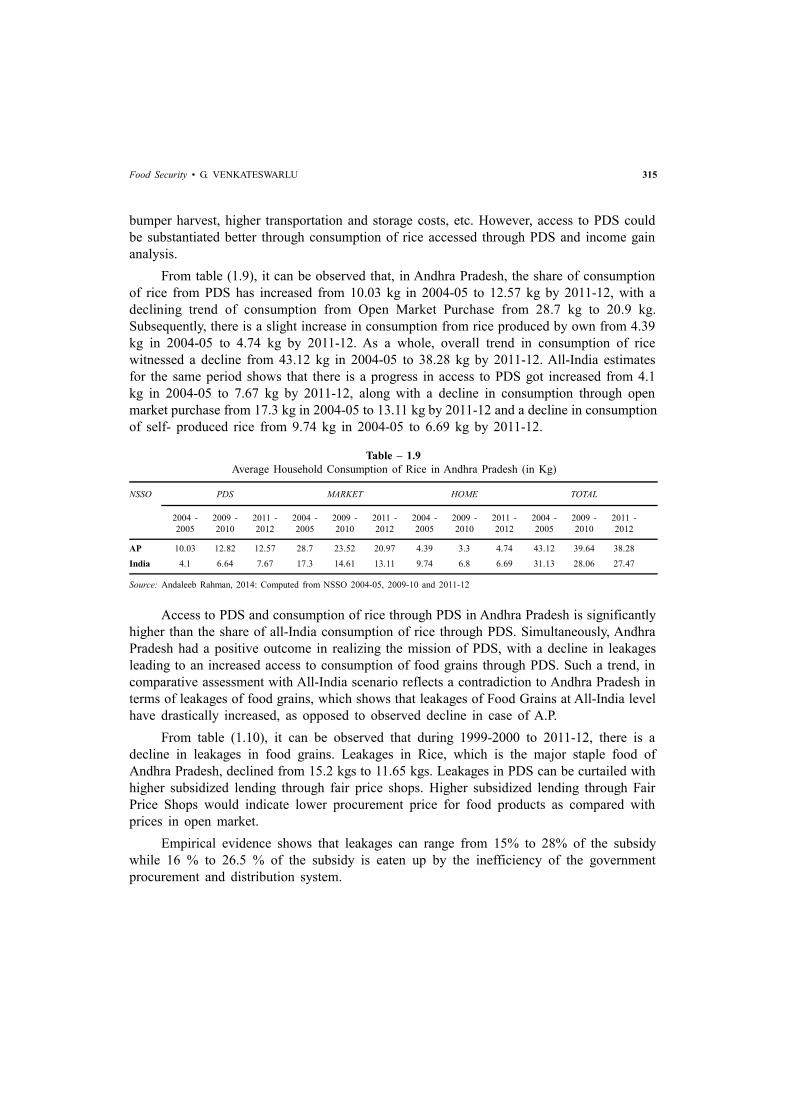
315
bumper harvest, higher transportation and storage costs, etc. However, access to PDS could
be substantiated better through consumption of rice accessed through PDS and income gain
analysis.
From table (1.9), it can be observed that, in Andhra Pradesh, the share of consumption
of rice from PDS has increased from 10.03 kg in 2004-05 to 12.57 kg by 2011-12, with a
declining trend of consumption from Open Market Purchase from 28.7 kg to 20.9 kg.
Subsequently, there is a slight increase in consumption from rice produced by own from 4.39
kg in 2004-05 to 4.74 kg by 2011-12. As a whole, overall trend in consumption of rice
witnessed a decline from 43.12 kg in 2004-05 to 38.28 kg by 2011-12. All-India estimates
for the same period shows that there is a progress in access to PDS got increased from 4.1
kg in 2004-05 to 7.67 kg by 2011-12, along with a decline in consumption through open
market purchase from 17.3 kg in 2004-05 to 13.11 kg by 2011-12 and a decline in consumption
of self- produced rice from 9.74 kg in 2004-05 to 6.69 kg by 2011-12.
Table – 1.9
Average Household Consumption of Rice in Andhra Pradesh (in Kg)
NSSO PDS MARKET HOME TOTAL
2004 - 2009 - 2011 - 2004 - 2009 - 2011 - 2004 - 2009 - 2011 - 2004 - 2009 - 2011 -
2005 2010 2012 2005 2010 2012 2005 2010 2012 2005 2010 2012
AP 10.03 12.82 12.57 28.7 23.52 20.97 4.39 3.3 4.74 43.12 39.64 38.28
India 4.1 6.64 7.67 17.3 14.61 13.11 9.74 6.8 6.69 31.13 28.06 27.47
Source: Andaleeb Rahman, 2014: Computed from NSSO 2004-05, 2009-10 and 2011-12
Access to PDS and consumption of rice through PDS in Andhra Pradesh is significantly
higher than the share of all-India consumption of rice through PDS. Simultaneously, Andhra
Pradesh had a positive outcome in realizing the mission of PDS, with a decline in leakages
leading to an increased access to consumption of food grains through PDS. Such a trend, in
comparative assessment with All-India scenario reflects a contradiction to Andhra Pradesh in
terms of leakages of food grains, which shows that leakages of Food Grains at All-India level
have drastically increased, as opposed to observed decline in case of A.P.
From table (1.10), it can be observed that during 1999-2000 to 2011-12, there is a
decline in leakages in food grains. Leakages in Rice, which is the major staple food of
Andhra Pradesh, declined from 15.2 kgs to 11.65 kgs. Leakages in PDS can be curtailed with
higher subsidized lending through fair price shops. Higher subsidized lending through Fair
Price Shops would indicate lower procurement price for food products as compared with
prices in open market.
Empirical evidence shows that leakages can range from 15% to 28% of the subsidy
while 16 % to 26.5 % of the subsidy is eaten up by the inefficiency of the government
procurement and distribution system.
Food Security • G. VENKATESWARLU

316 The Economy of Andhra Pradesh
Table – 1.10
Leakages from PDS 1999-2012 (in Kgs)
1999 - 2000 2001 – 2002 2004 - 2005 2006 - 2007
Rice Wheat Food Rice Wheat Food Rice Wheat Food Rice Wheat Food
Grains Grains Grains Grains
A.P 15.2 14.4 15.2 12.3 -210.8 11.2 22.3 93 23.2 16.1 66.9 17
(-24.6) (87.1) (25.4)
India 9.9 48.6 23.9 18.2 66.8 39 41.3 70.3 54 39.6 61.9 46.7
(40.5) (73.1) (54.8)
2007 - 2008 2009 – 2010 2011 - 2012
Rice Wheat Foodgrains Rice Wheat Foodgrain Rice Wheat Foodgrain
A.P 19.2 50.3 19.6 15.9 25.9 16 11.65 53.64 11.13
(16.8) (53.2) (-16.8)
India 37.2 57.7 43.9 45.9 59.7 41.2 36.15 62.88 46.72
(35.9) (42.9) (-42.8)
Source : Ashok Gulati, 2015.
Note : Values in the parenthesis are as calculated by Himanshu and Sen (2011).
The core issue is that, hence allocation of PDS staple food grains did not reach the
actual beneficiary, recently one of the study found that about 40 percent of the food grains
could not reach the actual beneficiaries, (IEO, 2014). Khera (2014) examined that there has
been a positive improvement in terms of leakage of PDS, from 2006-07 to 2007-08 declined
about to 46.7 per cent as compared to 43.9 per cent. And it is also suggested to have uniform
entitlement and common price for PDS items. This could attribute to low leakage and effective
functioning of PDS of the country.
Income gain to the consumer is the difference between the value of the quantity of
goods purchased in PDS when evaluated at market prices and the actual value of PDS
purchases. Income gain includes gains from all purchases of rice, wheat, sugar and kerosene
made in fair price shops. Implicit prices are used to derive income gain.
IG = (Pm - P
f) Q
f
Where IG is income gain,
Pm and P
f are open market prices and price in the PDS of the commodity and
Qf is the quantity purchased from fair price shop.
Income gain through PDS in Andhra Pradesh has been observed to rise over time, since
1986-87 to 2009-10, such increase is witnessed in all income groups. Table-1.12, presents
income gain through PDS in Andhra Pradesh. Above table is classified into poor, non-poor
and all class income grain from PDS, based on the open market price food grains and PDS
price, based on the MPCE. Income gain analysis by Sridevi, et al (2014), found that there is
an enhanced income gain from PDS in both rural and urban area for poor and non-poor

317
household based on the MPCE in Andhra Pradesh, amongst which non-poor households have
larger income gain than poor household. However the increase in income gain is higher for
poor sections, than non-poor households. On the other hand, income gain from PDS in urban
area is higher in poor households than in non-poor households, which indicates higher
dependency of poorer sections on PDS. Hence, more income gain influences by high subsidies
price of food grains through PDS and open market price of food grains can be affordable by
household. Further there is a positive relationship between subsidies of price entitlement of
food grains and income grain from PDS. The lower the ratio of PDS to market price of rice,
the greater was the real income gain (either because the quantity bought was higher or the
same quantity bought translated into higher income gain because of a higher price subsidy)
is negative, implying that the greater the rice price subsidy, the lower was the real income
gain. The extent of price subsidy, in most cases, results in larger real income transfers (Jha,
et al 2011).
Table – 1.11
Income Gain through PDS in Andhra Pradesh (in Rupees)
Income group Rural Urban
1986-87 1999-2000 2009-10 1986-87 1999-2000 2009-10
Poor 5.67 17.28 20.23 7.8 16.0 22.8
Non poor 6.13 17.53 20.24 6.0 14.34 20.3
All classes 6.02 17.1 20.01 6.8 15.2 18.1
Source: Sridevi, et al, 2014
CONCLUSION
Andhra Pradesh State is identified as the “Bejeweled Rice Bowl of India”. In Andhra
Pradesh, Agriculture plays a crucial role in its economy, with the largest segment of the
population being dependent on agricultural sector for employment. Rapid and sustainable
growth in agriculture has been identified not only as a key driver for economic development
but also for achieving self-sufficiency and ensuring food security to the people. Growth rate
of area under coarse cereals was declining continuously from -0.54 in 1960-61 to -3.1% in
2013-14. Coming to the present changes in Food and Non-Food Expenditure in Rural and
Urban areas of Andhra Pradesh, since 1993-94 to 2011-12, food baskets of consumer in both
urban and rural areas have changed, witnessing a decline in food expenditure combined with
an increase in non-food expenditure. Food expenditure in rural areas which stood at 59.59
per cent in 1993-94, reduced to 51.4 per cent in 2011-12, while Non-Food Expenditure
increased from 40.4% in 1993-94 to 48.59% by 2011-12, similarly, urban areas also witnessed
a decline in food consumption and an increase in non-food consumption expenditure, but
with a higher magnitude. There is an enhanced income gain from PDS in both rural and urban
Food Security • G. VENKATESWARLU

318 The Economy of Andhra Pradesh
area for poor and non-poor household based on the MPCE in Andhra Pradesh, amongst
which non-poor households have larger income gain than poor household. There is shift from
food crops to non-food crops. PDS in Andhra Pradesh played an important role in providing
the access to food and in reducing the poverty.
REFERENCES
1. Abusaleh Shariff Ananta C Mallick (1999), “Dynamics of Food Intake and Nutrition by Expenditure
Class in India”. Economic and Political Weekly, Vol.34, No.27, pp.1790-1800, 3rd – 9th ‘July.
2. Alessandro Tarozzi (2005), “The Indian Public Distribution System as provider of food security:
Evidence from children nutrition in Andhra Pradesh., ELSEVIER European Economics Review, 49,
1305-1330.
3. Andaleeb Rahman (2014) “Revival of Rural Public Distribution System” Expansion and Outreach”
Economic and Political weekly, May 17, Vol. XLLX, No.20.
4. Angus Deaton and Jean Drèze (2009), “Food and Nutrition in India: Facts and Interpretations”.
Economic and Political Weekly, Vol. XLIV, No.7, 14th February.
5. Angus Deaton, Jean Drèze (2010), “Nutrition, Poverty and Calorie Fundamentalism”, Response to
Utsa Patnaik. Economic and Political Weekly, Vol.XLV, No.14.
6. Anil Chandy Ittyerah (2013), “Food Security in India: Issues and Suggestions for Effectiveness”,
Indian Institute of Public Administration, New Delhi.
7. Batka M, Magalhaes R, Valmonte-Santos M, Ewing and Lee D. (2009), “Climate change: Impact on
agriculture and costs of adaptation”, Food Policy Report-19, IFPRI, Washington, DC.
8. Bhaskar Dutta and Bharat Ramaswami (2001) “Targeting and Efficiency in the Public Distribution
System: Case of Andhra Pradesh and Maharashtra”, Economic and Political Weekly, No.18, May 5th-
11th.
9. Bhattarai M, Ravi Kumar, Sandhya S and Bantilan, “Whether MGNREGS has affected agricultural
wage rate in Andhra Pradesh? A panel modelling across 23 districts from 2000 to 2011”.
10. Bhavani, R.V. (2010), “Food security: Getting it right. Info-change-Agriculture”, M.S. Swaminathan
Research Foundation, Madras.
11. Brahmanand P. S, Kumar A, Ghosh S, Roy Chowdhury, Singandhupe R.B, Singh P Nanda,
Chakraborthy H, Srivastava S.K. and Behera M.S. (2013), “Current Science”, Vol.104, No.7, 10th
April.
12. Chand Ramesh and Jumrani Jaya (2013), “Food Security and Undernourishment in India: Assessment
of Alternative Norms and the Income Effect” Indian Journal of Agriculture Economy, Vol.68, No.1,
Jan-March.
13. Himanshu (2013), “Poverty and Food Security in India”. Asian Development Bank, Economics
Working Paper Series No.369.
14. Himanshu and Abhijit Sen (2013), “In-Kind Food Transfers – I, Impact on Poverty”, Economic &
Political Weekly, Vol. XLVII, November 16th. 2013.
15. Himanshu and Abhijit Sen (2013), “In-Kind Food Transfers – II, Evaluated In-Kind Food Transfers-
II”, Economic and Political Weekly. Vol. XLVIII, November 23, 2013.
319
16. Indrakanth S. (1997), “Coverage and Leakages in PDS in Andhra Pradesh”, Economic and Political
Weekly, Vol. 32, No.19 May 10-16, pp.999-1000.
17. Khera Reetika (2011), “Revival of the Public Distribution System: Evidence and Explanations”
18. Kumar Anjani, M.C.S. Bantilan, Praduman Kumar, Sant Kumar and Shiv Jee (2012), “Food Security
in India: Trends, Patterns and Determinants”. Indian Journal of Agricultural Economics, Vol.67,
No.3, July-Sept.
19. Mahendra Dev S (2007), “Inclusive Growth in Andhra Pradesh”: Challenges in Agriculture, Poverty,
Social Sector and Regional Disparities. CESS, Hyderabad Working Paper No. 71.
20. Radhakrishna R. (2005), “Food and Nutrition Security of the Poor - Emerging Perspectives and
Policy Issues”, Economic and Political Weekly, Vol.40, No.18, pp. 1817-1821, Apr. 30 - May 6,
2005.
21. Radhakrishna R. (2006), “Food Consumption and Nutritional Status in India: Emerging Trends and
Perspectives’, Indira Gandhi Institute of Development Research, Mumbai November 2006.
22. Reetika, Khera and Nayak, Nandini (2009), “Women Workers and Perceptions of the National Rural
Employment Guarantee Act”, Economic and Political Weekly, Vol.44, No.43, October 24th-30th.
23. Sridevi Gummadi and Venkateswarlu Gunna (2014), “Poverty Targeting Errors and Food Security in
Andhra Pradesh” The Indian Economics Journal Special issue, December. Pp.450-478, ISSN: 0019-
4662.
Food Security • G. VENKATESWARLU

320 The Economy of Andhra Pradesh
ARTICLE / 45
IMPACT OF MGNREGS ON UTILISATION OF
LABOUR FORCE IN ANDHRA PRADESH –
WITH SPECIAL REFERENCE TO
ANANTAPUR DISTRICT
Dhakshayani M. Dongre & Dhanjaya K.B.
ABSTRACT
The present paper is an empirical study on the impact of MGNREG scheme in Anantapur
district of Andhra Pradesh. Primary data was collected by a personal interview from 50
marginal, small and larger formers randomly selected in 5 mandals of Anantapur District viz.
Dharmavaram, Penugonda, Kalyanadurga, Gooty and Guntakal. It was observed that, majority
of the sample beneficiaries were literates having the ownership of land holdings about 2.5
acres to 5 acres. The author observed that, the sample beneficiaries could not get fully
employed in MGNREG works in the study area. And majority of them reported that they
could get less than 30 days of employment and only 20 percent of them reported that they
could get 100days of employment. The author employed chi-square test to assess the level
of significance and the results reveal that the sample beneficiaries could not get fully employed
and they could get only 30 days of employment. It was also mentioned that the hypothesis–
MGNREGS was not utilized by the sample beneficiaries in the study area was accepted.
Since the calculated value was 0.111, which was less than the table value of 3.84 at 5% level
of significance. The author calculated the MGNREGS has not utilized by the workers in the
study area due to low level of awareness about the scheme. It was also identified the job cards
in the study area were not provided properly and hypothesis was also accepted as the results
of chi-square test were found significant at 5% level.
The author suggested that the wage rates under the scheme should be made on par with
wage rates prevailing in the market and campaigns should be organized to propagate the
usefulness of the scheme, as even the official of Grama Panchayats were also found ignorant
of the benefits of the scheme.
Keywords: MGNREGS, Employment Generation, Hypothesis, Chi-square Test results.
Assistant Professor in Economics, Sir. M.V.Govt. Arts & Commerce College, Bhadravathi, ShivamoggaDist. Karnataka.Associate Professor, DOS in Economics, Sahyadri Arts & Commerce College, Shivamogga Dist. KarnatakaState.
View publication statsView publication stats