A Brief History of Mobile Telecommunication in Europe
27
Working Paper Series #2006-034 A Brief History of Mobile Telecommunication in Europe by Theo Dunnewijk & Staffan Hultén United Nations University - Maastricht Economic and social Research and training centre on Innovation and Technology Keizer Karelplein 19, 6211 TC Maastricht, The Netherlands Tel: (31) (43) 350 6300, Fax: (31) (43) 350 6399, e-mail: [email protected], URL: http://www.merit.unu.edu
Transcript of A Brief History of Mobile Telecommunication in Europe
Working Paper Series #2006-034
A Brief History of Mobile Telecommunication in Europe
by
Theo Dunnewijk & Staffan Hultén
United Nations University - Maastricht Economic and social Research and training centre on Innovation and Technology
Keizer Karelplein 19, 6211 TC Maastricht, The Netherlands Tel: (31) (43) 350 6300, Fax: (31) (43) 350 6399, e-mail: [email protected], URL: http://www.merit.unu.edu


A brief history of mobile telecommunication in Europe
Theo Dunnewijk1 and Staffan Hultén2
ABSTRACT Since the introduction of mobile telephony in the early fifties in Europe, US and Japan the demand for this service exploded. It seems that the latent demand for mobile telecommunication services for decade’s continued to be very strong. Since the introduction of cellular technology the capacity of the services increasingly became able to meet the massive demand. Next and future generations of mobile telecommunication technologies bring increased transmission speed and more versatile services. This forces network operators to organise multi sourced information flows supplied by service providers to increase the network effect of the system instead of providing the network infrastructure and leave the content to the users as in pure voice telephony. The drivers and inhibitors behind the emergence and recent developments of mobile telecommunications systems in Europe are highlighted in this paper. Liberalisation of the telecom markets in Europe drove new entrants to the market and curbed excessive pricing. However, in recent years the lack of challenging service is the main cause for the wavering development of newer generations of mobile telecommunication services.
UNU-MERIT Working Papers ISSN 1871-9872
UNU-MERIT Working Papers intend to disseminate preliminary results of the research carried out at the institute to attract comments
1 Email address for correspondence: [email protected] 2 Stockholm School of Economics: [email protected]

28/09/2006
4

28/09/2006
1. INTRODUCTION
Mobile telecommunication technologies have developed in successive generations. The first generation (1G) appeared in the 1950’s. The second generation (2G) or GSM technology is used massively, but challenged globally by the next (third) generation (3G) technologies. This sequence of generations is characterised by increasing capacity (higher transmission speeds) and richer content of the message. Further penetration of 3G depends critically on the integration of telecommunication services and multimedia services, which turned out to be more complicated than most experts predicted. Four obstacles on this expansion path can be distinguished: Firstly, after the weakened financial position of mobile network operators, it became more difficult to finance and construct the networks because the capital markets questioned the profitability of these investments. This resulted in regulatory measures to facilitate the financial viability of UMTS networks by allowing operators to share networks and delay implementation. Secondly, many of the futuristic product and service designs (for example computerised homes and mobile telephones functioning as credit cards or parking tickets) of the new economy turned out to be more difficult and costly to develop and to market. Thirdly, many operators were drawn into costly license auctions and mergers that slowed down and scaled down their investments in the latest technology and new services. Fourthly, the operators underestimated the difficulties to develop new business models for voice and data in 3G compared with mainly voice in 2G. Despite these obstacles the markets for mobile data and mobile Internet have demonstrated a high and sustainable growth rate during last decade in Europe. Most noteworthy are the immense and surprising successes of private SMS or short messaging services, EMS or enhanced messaging services and the rapid growth of MMS or multimedia messaging services. Less spectacular have been the popularity of sports, news and weather information on the go. These markets leave ample space for a myriad of multimedia applications. So far, technology itself seems not to be an obstacle. The initial disappointing adoption of 2.5 and 3G mobile telecommunication seems to be firmly rooted in the operators’ strategic errors and the limited supply of attractive mobile data services in Europe. The succession of newer generations’ telecommunication techniques shifted the role of the network operators from being a network manager to a content organiser. Newer generations make higher transmission speeds and more and richer content possible. Upgrading existing networks is attractive from a cost perspective, however from the user’s point of view the richness of the services consists of two dimensions: higher speed and richer content. Eventually given the consumers preferences the price/quality ratio of the services determines his/her choice, while National Regulatory Authorities (NRAs) are in charge of the welfare effects. The paper shows how this mass market emerged, which strategies network operators have chosen to introduce newer generation of mobile telecommunication in a playing field increasingly influenced by the governments with a special role for the NRA’s in breaking dominant market positions of incumbent former monopolists. The next (second) part of this paper gives a historic overview of the development of the GSM family standards in Europe and adoption of mobile communication services in the EU25. The third part is on regulatory measures, which are basically an attempt of the government to curb the monopoly power of incumbent network providers, by
5

28/09/2006
stimulating entrance and actions that lower the price of telecommunication services and especially mobile telecommunication service. The fourth part interprets these developments and hypothesises on the migration paths towards newer and faster mobile technologies that network operators follow in their quest for maintaining or gaining market shares. Gradually upgrading of GSM is one path, another one is the big leap forward replacing GSM by UMTS, hence stepping at once from 2G into 3G. In the fifth part essential variables like network effects and the data rate that characterise a technology of a certain generation are presented and these variables are without doubt one of the decisive factors is the user’s uptake and sense-making of the new technologies. In the final part, we make some concluding remarks. 2. HISTORIC OVERVIEW
2.1. The Prelude
The history of mobile telephony goes back to experiments in the US in the 1920’s with radio telephony (Kargman, 1978, and Agar, 2003). The first mobile phones were usually car-bound and AT&T launched in 1947 a highway service between Boston and New York after the success of first mobile telephone network in St. Louis (Agar, 2003). Eventually radiotelephony became so crowded, especially in New York, that the network operators used waiting lists while candidate customers waited hoping to be so lucky to get a mobile phone connection (Agar, 2003). The reason for the waiting lists was that frequency spectrum is a limited resource. The arrival of modern automatic mobile telecommunications systems using cell structure helped to reduce the scarcity problem by offering a more efficient use of the frequency space. Two problems are critical in a cell structure – roaming and hand-over. Roaming is needed to keep track of the telephones and hand-over is needed to enable subscribers to keep a telephone call when moving from one cell to another. Motorola filed already in 1973 for cellular patents3 and the US Federal Communication Commission (FCC) started auctions of cellular licenses on a city-by-city basis before the break up of the Bell system in 1984. These auctions provoked so many applications that the FCC in 1982 decided to award the top thirty cities directly and to allocate the other cites by means of lotteries (Agar, 2003). After the launch of advanced mobile phone services or AMPS in 1978, which was an analogue system, the first American cellular phone system came into operation in 1979 as a trial and went into commercial operation in 19834. These services were basically city services and the myriad of mobile phone companies made roaming extremely difficult in the US. Mobile telephony developed in a slightly different manner in Europe. Sweden was an early mover with an automatic system in service in 19565. The national telecommunication authorities in Scandinavia took two important decisions in 1969-1971. The first decision was to start the standardisation work on the future analogue cellular NMT standard in 1969. A working group was set up and named the Nordic Mobile Telephone Group, the NMT-Group6. The second decision was to directly
3 The patent concerned Motorola's 1973 DynaTAC - the first cellular phone - invented by Martin Cooper and his
team, source: http://www.fcc.gov/omd/history/radio/quality.html4 http://www.telecomwriting.com/PCS/history9.htm 5 These MTL (Mobile Telephone Lauhrén) services were located around Stockholm and Gothenburg and could
serve 100 subscribers; coverage was in the range of 25-30 km around the base stations. (Meurlings and Jeans, 1994)
6 Swedish Telecom (1975)
6

28/09/2006
build manual mobile telecommunication networks with nation wide coverage to satisfy customer demand. This decision was in Sweden accompanied with another decision to let the market free for mobile telephones. The Nordic Mobile Telephone Groups took as a point of departure the following system requirements: automatic in operation, compatible, roaming between all Nordic countries, sufficient capacity, high reliability, low-cost infrastructure, and open specification which meant no exclusive supplier rights (Steinbock, 2001). It took more than ten years to develop the NMT standard and it was first introduced in Saudi-Arabia in 1981 and a few months later in the Scandinavian countries. The possibility of roaming in the Finland, Sweden, Norway, Denmark and Iceland since 1981-82 became a strong argument in favour of the NMT standard7. In the early 1980s there existed many different competing mobile telephone standards. When the Department of Trade and Industry and the two network operators in the United Kingdom (British Telecom and Cellnet) were selecting the standard of the new mobile telephone system they compared the NMT, with a Japanese (analogue) standard worldwide in use since 1979 by Nippon Telephone & Telegraph (NTT)8, the German system C450, a system developed by Alcatel and Philips called MATS-E and the US standard AMPS. The American standard was found to meet the requirements of the British market – competition was secured as the standard was available from several suppliers and it allowed sufficient capacity as it operated at a frequency band only 70 MHz below the 900 MHz band. The two appointed operators and the Department of Trade and Industry in 1983 decided, to modify the American standard Advanced Mobile Phone System (AMPS) and named it Total Access Communication System (TACS)9.A third applicant for a license in the UK named Racal the predecessor of Vodafone heavily influenced this decision. The reason for choosing the US standard was the assumed attractive price of handsets because of the large US market. However Ericsson became the supplier of TACS based on its Axe digital switch to Vodafone, while it already supplied NMT and AMPS. This occasion made Ericsson a major player in the business of mobile telephony10.
2.2. The arrival of GSM
One of the shortcomings of the analogue systems was a serious lack of interoperability. In order to bring interoperability and cross border roaming on a higher level the Groupe Spéciale Mobile (GSM), later renamed Global System for Mobile Telecommunications, was an initiative combining private and public governance (Pelkmans, 2001). GSM is an open non- proprietary and interoperable digital standard for cellular mobile systems operating in the 900 and 1800 MHz band11. A first step towards a mutual European system was taken in 1982, when the Conference on European Posts and Telecommunications (CEPT) decided to create the
7 Sweden’s early developments are described in Gerdes, O. (1991) and in Mölleryd, B. (1999). The Norwegian
history of mobile telecommunication can be found in Grimsteit, L. and H. Myhre (1995). Finland’s experience with mobile telephony can be found in Turpeinen, O. (1997). Lindmark, S. (2002) describes the history of mobile telecommunication in Sweden and beyond from an evolutionary point of view, based on sociological theories of technology development.
8 Gruber, H. and F. Verboven (2000) 9 Garrard, G. (1998), p 98. 10 Meurling, J. and R. Jeans (1994) 11 Originally GSM was planned for the 900 MHz spectrum, but the fast growing numbers of users made a new
frequency band necessary, while the US launched the 1900 MHZ band because of the popularity of the GSM standard (Source: Nokia Networks, March 2003)
7

28/09/2006
Groupe Spéciale Mobile which was commissioned to develop a mobile telephone standard. The European Commission considered it to be necessary that European network operators made a commitment to implement GSM-networks. The reason was that projections for the future growth of mobile telephony in the latter part of the 1980s were modest and analogue networks were expanded throughout Europe. This commitment convinced the industry to make substantial investments in research and development for the GSM standard. A Memorandum of Understanding to introduce GSM networks by January 1, 1991, later put forward to July 1, 1991, was signed in Copenhagen in 1987 by operators and regulators from thirteen European countries (Hultén and Mölleryd, 2003) In 1989, the European Telecommunications Standardisation Institute approved the specification of phase 1 of GSM. This ended the (pre-standard) effort in which essential patents were registered. Philips owned the most essential patents in this period. However Ericsson, Alcatel, Siemens and Motorola intensified their patent activity in the following period (from 1992 onwards). These firms controlled more than 85% of the total GSM market in the early 1990s and Motorola owned most of the essential patents. Motorola, Ericsson and Nokia rapidly came to dominate the mobile telephone market with Siemens and Alcatel as other important players. (Bekkers, Duysters and Verspagen, 2002)
2.3. Market growth
Once introduced, mobile telecommunication in the US and Europe always was in strong demand. In the 1990’s the rapid and sustained growth rate was accompanied by profound changes in the telecommunications markets. What once was the usual way to call someone changed from using the telephone booth or a fixed telephone line to using a personal phone kept in the pocket or in the handbag. Using a phone increasingly meant using a mobile phone instead of a fixed, a change that occurred in the period 1993-2002 as Table 1 shows.
Table 1 Fixed and mobile telephone connections in percentage of population 1993-2002
EU-25 1993 2002main telephone lines 40 51public payphones 2 2cellular mobile telephone subscribers 2 76
Source: ITU, Yearbook of Statistics, Telecommunication Services 1993-2000. The data speak for themselves: the fact that ‘everyone has a mobile phone’ is not very far away in Europe. Figure 1 shows the level and pace of the diffusion of mobile phones in Europe. Actually there are countries that have a market penetration of more than 100 per cent because some individuals have multiple subscriptions, for example one at work and one for private use and temporary subscriptions in foreign countries. Convergence in market penetration among countries is obvious: A Nordic country like Sweden was leading the pack for quite a while, but recently Luxembourg overtook Sweden, while Bulgaria and Romania continue to be laggards. However looking into the near future it will probably not take very long to have full market penetration everywhere in Europe.
8

28/09/2006
Figure 1 Market penetration of mobile phones in Europe 1993-2002
0.00001
0.0001
0.001
0.01
0.1
1
10
1993 1994 1995 1996 1997 1998 1999 2000 2001 2002
bulgaria
luxembourg
sweden
romania
Source: See table 1
2.4. Some reasons for the strong uptake in mobile phones An important driver of demand is price decreases. This was also true for the mobile telephone market. Additional support to the strong market growth came from the Internet revolution and worldwide liberalisation, privatisation and deregulation of the telecommunication markets. The aggregate price of mobile telecommunications has decreased substantially (see below) and the more convenient handsets using smaller more powerful batteries eventually led to different “mobile cultures”. They reinforced already existing trends as the Walkman and nomadic computing: cfr. rhizomatic identity (Deleuze and Guattari, 1976), nomadic identity (Deleuze and Guattari, 1980), interconnected nomadism (Braidotti, 1994) and the SMS text culture (Agar, 2003) to mention a few. With MMS an instant mobile culture came to life: blogging your own pictures while on the move thereby showing others where you are and what you see. Although price decreases and the emergence of mobile cultures are important drivers, ‘being in constant touch’ is today is a very common need among people around the world (Agar, 2003) as is the case with ‘diffuse expressive’ communication (Geser, 2004). The mobile phone has become a symbol of status and fashion, the use of a mobile phone is also a part of young people’s consumption style, incidentally to a large part paid by their parents (Wilska, 2003). Differences among countries are quite remarkable as the behaviour with regard to SMS and MMS shows. Norwegians, Danes, Dutch and Germans send much more of SMS and MMS compared with the countries in southern Europe. (Smoreda and Thomas, 2001 and Mante Meijer, 2001) In Sweden nearly 40 million MMS were sent in 2005, an increase of 45 % compared with 2004 and with 600 % compared with 2003. Basically MMS follows a similar
9
28/09/2006
growth pattern as SMS in the late 1990s.12. In Norway 91 million MMS were sent in 2005 approximately 26 % more than 2004.13. To some extent differences in SMS use can be explained by prices – Danes and Norwegians pay less per SMS and send many more SMS than Swedes that pay much more. The figures for 2005 is compelling reading, Swedish mobile telephone users send on average 19.7 SMS per month compared with 131.3 SMS per month in Denmark, 81.5 SMS in Norway and 42.7 SMS in Finland. According to the Swedish regulator Telia charges nearly four times more for a SMS in Sweden than in Denmark and 5 percent more in Sweden than in Norway.14. 3. REGULATION OF THE MOBILETELECOMMUNICATIONS MARKET
IN EUROPE
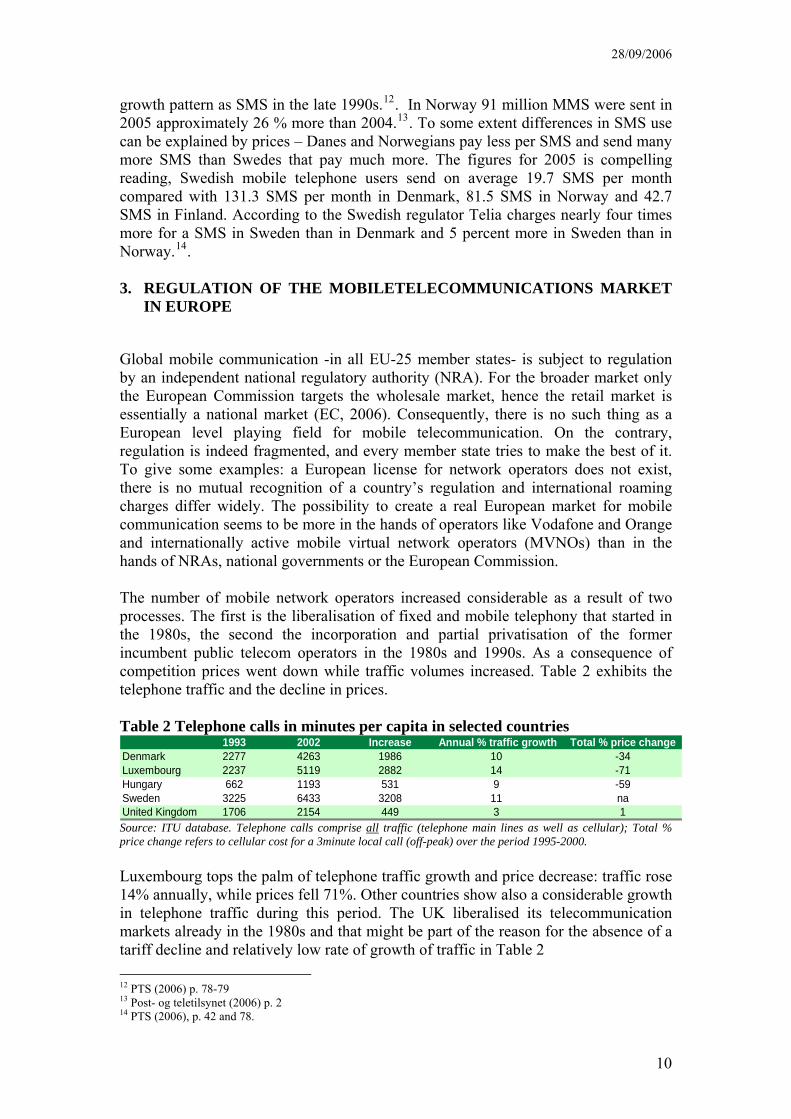
Global mobile communication -in all EU-25 member states- is subject to regulation by an independent national regulatory authority (NRA). For the broader market only the European Commission targets the wholesale market, hence the retail market is essentially a national market (EC, 2006). Consequently, there is no such thing as a European level playing field for mobile telecommunication. On the contrary, regulation is indeed fragmented, and every member state tries to make the best of it. To give some examples: a European license for network operators does not exist, there is no mutual recognition of a country’s regulation and international roaming charges differ widely. The possibility to create a real European market for mobile communication seems to be more in the hands of operators like Vodafone and Orange and internationally active mobile virtual network operators (MVNOs) than in the hands of NRAs, national governments or the European Commission. The number of mobile network operators increased considerable as a result of two processes. The first is the liberalisation of fixed and mobile telephony that started in the 1980s, the second the incorporation and partial privatisation of the former incumbent public telecom operators in the 1980s and 1990s. As a consequence of competition prices went down while traffic volumes increased. Table 2 exhibits the telephone traffic and the decline in prices. Table 2 Telephone calls in minutes per capita in selected countries
1993 2002 Increase Annual % traffic growth Total % price changeDenmark 2277 4263 1986 10 -34Luxembourg 2237 5119 2882 14 -71Hungary 662 1193 531 9 -59Sweden 3225 6433 3208 11 naUnited Kingdom 1706 2154 449 3 1Source: ITU database. Telephone calls comprise all traffic (telephone main lines as well as cellular); Total % price change refers to cellular cost for a 3minute local call (off-peak) over the period 1995-2000. Luxembourg tops the palm of telephone traffic growth and price decrease: traffic rose 14% annually, while prices fell 71%. Other countries show also a considerable growth in telephone traffic during this period. The UK liberalised its telecommunication markets already in the 1980s and that might be part of the reason for the absence of a tariff decline and relatively low rate of growth of traffic in Table 2 12 PTS (2006) p. 78-79 13 Post- og teletilsynet (2006) p. 2 14 PTS (2006), p. 42 and 78.
10
28/09/2006
Many of the former state owned public telecom operators’ mobile divisions have been assigned by a National Regulatory Authority (NRA) to have significant market power (SMP) (EC, 1997). In 2005 the number of SMP network operators diminished substantially: only Ireland and Slovenia have determined that some of their network operators have significant market power. Significant market power was defined as a market share of more than 25% in a relevant market. In the new regulatory framework, the SMP status is not solely dependent on market shares but also on other criteria that might reveal a dominant position. SMP assigned operators receive special attention from the NRAs: In principle the rules (or remedies to alleviate the negative impact on competition) for SMP operators are clear: their retail prices have to be non-discriminatory, cost based and transparent and their networks accessible to third parties at reasonable interconnection tariffs. This, concisely, is the content of several directives issued by the European Commission (EC) making up the relevant regulation concerning mobile telecommunication in Europe15. Despite opposition by the French and German governments (Thatcher, 2001) and some deviations from the SMP rule (EC, 2002) mobile telecommunication became liberalised by 2000 and the market for mobile telecommunication became more and more competitive: European regulation had in 2000 reached the whole of the telecommunication industry: infrastructure, fixed telephony and mobile telephony. NRAs in Europe have different competencies and status but they are all actively engaged in the transition process described above. Their measures have much in common, and they act within a complex network that involves multiple levels of governance. NRAs interact with consumers, business, governments, European institutions, and other supra national (world) institutions. NRAs deal with a variety of measures: licensing, numbering, broadcasting, price controls monitoring universal service obligation (USO), access and interconnection, dispute resolution, application of competition law, market monitoring, and frequency allocation. (Coen, 2005) Their status and resources differ with respect to independency and accountability. Highly independent NRAs are to be found in Denmark, Netherlands, Germany, Sweden and UK. These NRAs are also subject to high upward accountability by consumers and business interests, however the NRAs in Belgium, Finland, Greece, France, Ireland and Luxembourg are considered to be less independent (Coen, 2005) Market entry began to grow after 2000 as is exhibited in Figure 2. Entry was substantial in the UK, the Baltic and Nordic States and Germany In these countries; the entering MVNOs16 have put pressure on domestic prices. To give an example: interconnection prices17 in these countries were in 2004 more than a third lower than
15 In the Green Paper on the Development of a Common Market for telecommunications Services and Equipment,
COM 87) 290, the Commission announced (in 1987) the liberalisation of the market for mobile communication in the EU. The directive 90/388/EEC and the Proposal for a Council Directive on the Mutual Recognition of Licenses and Other National Authorisations to Operate Telecommunication Services, Including establishment of a Single Community Telecommunications license and the Setting up of a Community Telecommunication Committee , 92/C248/05. OJ C 248/4 followed in September 1992
16 In July 2004 there were 80 mobile network operators and 166 MVNO’s active in EU25 (source European Electronic Communications Regulation and Markets 2002 (10-th Report, Annex 3)
17 Interconnection charges for call termination in July 2004
11

28/09/2006
in countries without MVNOs.18. France, Spain and the Netherlands followed this trend in 2005. Despite the lack of a level playing field for mobile telecommunication in Europe, all European NRAs are participating in the so-called European Regulators Group (ERG). This Group takes initiatives to investigate suspicious differences in prices and conditions among countries. An example of joint initiatives is the above-mentioned suspiciously high terminating tariff that was successfully attacked by the ERG. However, this did not result in lower charges in all countries; Germany and France continue to have relatively high interconnection tariffs despite the initiative of the ERG to lower them. The ERG also achieved some coordination in the European wide fitting obligations for SMP operators and put emphasis on competition between mobile infrastructures. (OPTA, 2004) Figure 2 Number of mobile telephony providers in member states of EU25
0
10
20
30
40
50
60
70
Bel
gium
Cze
ch R
epub
lic
Den
mar
k
Ger
man
y
Est
onia
Gre
ece
Spa
in
Fran
ce
Irela
nd
Italy
Cyp
rus
Latv
ia
Lith
uani
a
Luxe
mbo
urg
Hun
gary
Mal
ta
Net
herla
nds
Aus
tria
Pol
and
Por
tuga
l
Slo
veni
a
Slo
vaki
a
Finl
and
Sw
eden
Uni
ted
Kin
gdom
2000200320042005
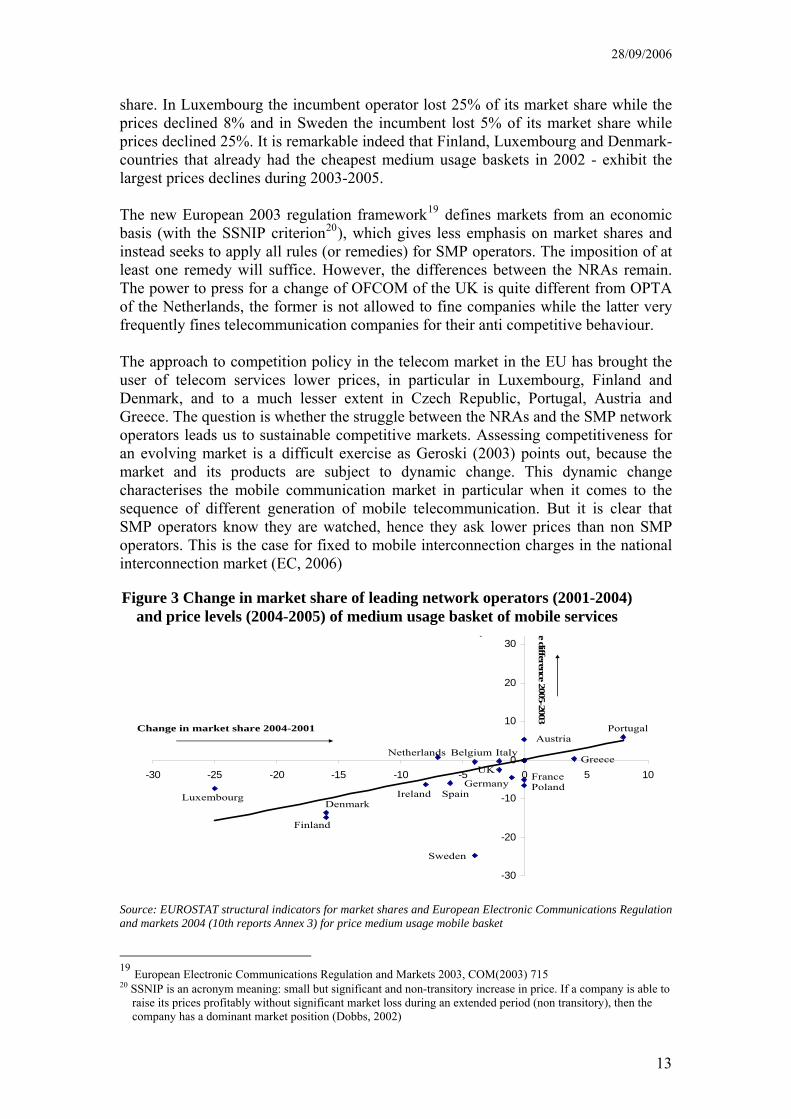
Source: Statistics in Focus, Industry trade and services-8/2005 the Annex to the 10th and 11th Report on European Electronic Communications Regulation and markets, 2004, 2006 Providers of mobile communication that enter markets increase competition in the local markets for mobile telecommunication. This has an impact on the market share of the largest mobile network operators that very often happens to be a subsidiary of the incumbent fixed network operator. These effects are described in Figure 3. The horizontal axis represents the decrease in market share of the incumbent mobile network operator in the period 2004-2001; the vertical axis represents the differences in the price level in the period 2005-2003 of the mobile services. What we can see is that the price level of mobile services is negatively associated with a drop in market
18 This can be inferred from Annex II of the 10TH report. The average (fixed-to-mobile) interconnection tariff in
Denmark, Germany, Estonia, Latvia, Luxembourg, Austria, Finland, Sweden and UK was €0.117and this is lower than the average interconnection tariff in Belgium, Greece, Italy, Ireland, France, Italy and Portugal which in June 2004 was €0.165.
12
28/09/2006
share. In Luxembourg the incumbent operator lost 25% of its market share while the prices declined 8% and in Sweden the incumbent lost 5% of its market share while prices declined 25%. It is remarkable indeed that Finland, Luxembourg and Denmark- countries that already had the cheapest medium usage baskets in 2002 - exhibit the largest prices declines during 2003-2005. The new European 2003 regulation framework19 defines markets from an economic basis (with the SSNIP criterion20), which gives less emphasis on market shares and instead seeks to apply all rules (or remedies) for SMP operators. The imposition of at least one remedy will suffice. However, the differences between the NRAs remain. The power to press for a change of OFCOM of the UK is quite different from OPTA of the Netherlands, the former is not allowed to fine companies while the latter very frequently fines telecommunication companies for their anti competitive behaviour. The approach to competition policy in the telecom market in the EU has brought the user of telecom services lower prices, in particular in Luxembourg, Finland and Denmark, and to a much lesser extent in Czech Republic, Portugal, Austria and Greece. The question is whether the struggle between the NRAs and the SMP network operators leads us to sustainable competitive markets. Assessing competitiveness for an evolving market is a difficult exercise as Geroski (2003) points out, because the market and its products are subject to dynamic change. This dynamic change characterises the mobile communication market in particular when it comes to the sequence of different generation of mobile telecommunication. But it is clear that SMP operators know they are watched, hence they ask lower prices than non SMP operators. This is the case for fixed to mobile interconnection charges in the national interconnection market (EC, 2006)
-30
-20
-10
0
10
20
30
40
-30 -25 -20 -15 -10 -5 0 5 10
Change in market share 2004-2001
Price difference 2005-2003
Source: EUROSTAT structural indicators for market shares and European Electronic Communications Regulation and markets 2004 (10th reports Annex 3) for price medium usage mobile basket
19 European Electronic Communications Regulation and Markets 2003, COM(2003) 715 20 SSNIP is an acronym meaning: small but significant and non-transitory increase in price. If a company is able to
raise its prices profitably without significant market loss during an extended period (non transitory), then the company has a dominant market position (Dobbs, 2002)
Luxembourg
Finland
PolandSpainIreland
Sweden
Czech republic
BelgiumNetherlands
FranceUK
Germany
Italy
Denmark
Austria
Greece
Portugal
-30
-20
-10
0
10
20
30
-30 -25 -20 -15 -10 -5 0 5 10
Change in market share 2004-2001
40
Price difference 2005-2003
Luxembourg
Finland
PolandSpainIreland
Sweden
Czech republic
BelgiumNetherlands
FranceUK
Germany
Italy
Denmark
Austria
Greece
Portugal
Figure 3 Change in market share of leading network operators (2001-2004) and price levels (2004-2005) of medium usage basket of mobile services
13

28/09/2006
4. MIGRATION TO THE NEXT GENERATION MOBILE TELECOMMUNICATION: FROM 2G TO 3G
Migrating from one to another technology can be done in several ways. The network operators rapidly adopted GPRS but there are more possible transitions models that firms can use to upgrade the mobile technology for faster data rates:
o Gradually upgrading the network, a general purpose technology type of argument
o Big leap forward, introduction of the new technology with a big bang, a quality of service type of argument.
o Alternative routes especially in urbanised areas Migration from GSM to UMTS can be done in small steps or at once. An example of such a small step is the upgrading of a GSM network with GPRS as is applied in the i-mode concept of NTT DoCoMo and introduced in Europe in 2002. An example of taking the big leap forward is the concept of Hutchinson 3G in the UK, Italy, Sweden and several other countries. Subsequent generations of mobile telecommunication can be characterised by increased data rates and enhanced functionality. The analogue first generation NMT-mobile telephony was able to carry voice only, while the second-generation GSM mobile telecommunication added first SMS and WAP to its functionality. Stepping from one generation into the next requires an upgraded network. An example of the upgrade strategy is applying the so-called EDGE-technologies to an existing GSM network. EDGE or enhanced data rates for GSM evolution increases the data rates up to 348Kbit/s from 9.6 Kbit/s in the original GSM (Hommen, 2003). This is stepping from the small area 2G in the left in Figure 4 towards the middle in the adjacent 3G area. This migration can be implemented without any major investment (Furuskar, et. al. 1999). Several other developments of wireless local and personal area networks also make an increase of the data rate up to 2Mbits/s possible. This is the 3G area in the middle of Figure 4 corresponding with smaller areas covered by picocells. The general idea is that wireless telecommunication can be accessed from several positions: using an operator’s network, using a (wireless) local network or (W)LAN or even a personal area network (PAN) using Bluetooth technologies delivering higher dates rates. According the Figure 4 it is envisaged that data rates up to 200 Mbps are possible in future higher generations (4G) networks, but this is not intended to be the fixed upper limit in the speed of data transmission in the future. From the operators point of view, upgrading the existing network is attractive as a migration model because it is cheap and needs only small complementary steps. This evolutionary approach is based on the idea that there should be a gradual transition from GSM towards UMTS, this was agreed upon within ETSI (Samukic, 1998). UMTS operates at much higher data rates than GSM. The GSM data rates increase from a maximum 9.6 Kbps to 144 Kbps in rural areas to 384 Kbps in urban areas and even up to 1.92 Mbps indoors using picocells. This sequence does not stop here;
14

28/09/2006
HSPDA21 is a mobile telephony protocol that allows (downlink) data rates up to 14.4 Mbps. These dramatically improved data rates however carry a disadvantage that looms large. Upgrading means that the network operator commits as much as is possible to its old –lets say 2G- infrastructure carrying voice and a little data traffic induced by SMS. Next generation mobile telecommunication not only enhances the date rates but also integrates several services and if this element lacks or gets insufficient attention then the operators are delivering something less than what is technologically possible and expected by customers, because of their experiences with the possibilities of the Internet using PC’s, laptops and palmtops. Figure 4 Views on the successive generations mobile telecommunication technologies
4.1. An example of migrating in small steps
KPN attempted to duplicate NTT DoCoMo’s success in Japan. With that goal in mind it purchased a license of NTT DoCoMo. The Japanese operator had launched i-mode in Japan as early as February 1998 and the new service reached at the end of 2001 93% of its mobile subscribers. KPN introduced i-mode in 2002 in its core markets of the Netherlands, Germany and Belgium. On December 18, 2002 KPN passed the 100.000 i-mode customer mark, while at the end of the 1st quarter in 2005 this
21 High-speed Downlink Packet Access or HSDPA, is also called a 3.5G mobile telecommunication. This
generation facilitates mobile broadband Internet much better than UMTS does. HSDPA is standardised in 3GPP TS 25.308 version 5.4.0 Release 5
15

28/09/2006
number is 1.876.000 (10.6% of the total number of subscribers) this amounts to a quarterly growth rate of almost 38%. When the Dutch network operator KPN introduced i-mode, they upgraded the existing GSM network to GPRS. This brings the IP protocol into the GSM network and boosts the data rate up to 115 Kbits/s, from 9.6 kbps. This has the advantage of being a very low cost strategy22 but has the disadvantage of bringing an inferior version of the “new” technology to the market. Introducing i-mode meant delivering a new service on a handset with a fancy but small screen and an always-on connection, or in other words an important step towards 3G. Eventually the i-mode strategy of KPN attracted 1.9 million i-mode users in Germany, the Netherlands and Belgium, but brought not the success that was anticipated23. Increasing the quality of the low quality services – as i-mode or 2.5G can be seen from the perspective of the high quality 3G service - may imply a reduction of total subscribers. The future technology 3G might be cannibalised by the introduction of intermediate technologies (like i-mode or EDGE) because they steal potential subscribers from 3G into 2.5G. If there is a high risk that this will occur a network operator can opt for the big leap forward and rapidly roll-out 3G services.
4.2. An example of the big leap forward When a network operator chooses the big leap forward as a migration model, then the new 3G technology is supplied from day one. Of course, this is a Greenfield strategy but it gives the advantage of being the technology leader, delivering vertical differentiated services of the highest possible quality. This strategy might be advantageous under certain conditions. First, it depends on the preference of potential users of the new technology and their appreciation of the high quality service. Second, it depends on the price of the relatively low quality 2.5G services in comparison with the 3G services. In general, it seems that there is a welfare gain (in terms of consumer’s surplus) in supplying a vertically differentiated quality of services. Bhargava et al. (2000) showed that the price ratio of the high quality service to the low is determined by the utility people attach to the high quality service including the network effects in relation to the utility attached to the low quality service, if the 3G price is lower no cannibalisation will occur. Building of 3G networks is a costly venture. The total investments in Europe amount to hundreds of billions of USD. The licenses in some countries cost more than the accumulated investments in the second generation of mobile telephone systems. In Germany the auction of 3G licenses gave 98.9 billion DEM, in the United Kingdom the auction gave £ 23 billion24 to the authorities. The big leap strategy was followed by 3 Group (formerly called H3G) in the UK. This company is owned by Hutchison Whampoa (80%) and NTT DoCoMo (20%). 3 UK announced in November 2002 that they intended to roll-out 3G in UK, with a subscription fee of €105/month for voice and video calls to all mobile networks in the UK as well as landlines. This was the most promising tariff according to market research - over 15,000 consumers from 150 focus groups were surveyed between
22 Compared with a strategy that aims at introducing a full fledged 3G service 23 KPN, 1st quarter results 2005. 24 The UMTS Forum web site: www.umts-forum.org August 5 2001.
16

28/09/2006
November 2002 and July 2001. The fee of €105/month was more than 2.5 times Vodafone’s blended ARPU at that time. The prices of mobile telephones were announced to be in the range from € 650 - € 970 and they could be leased/rented for € 25/month and later bought with a considerable discount. Hutchison prognosticated that 3 UK would have a 56% coverage of the UK at launch (December 2002) and that calls outside this area would be covered by a roaming agreement with mobile operator mmO225. Reality turned out to be different. The first 3G telephones26 arrived at the retail shops in March 2003 and some thousands of subscribers signed up for the 3G service27 , the 3G service was launched in the third of the same month (03-03-2003) and by June 2003, 50 cities in the UK were covered28 while 70% of the UK was covered in December 200329. However the supply of handsets was insufficient and the deliveries didn’t start before mid April. The price of these handsets was between €600 and €680, but due to disappointing sales H3G halved the price to €300, on a temporary basis. Not only handsets but also subscriptions fees, that initially were set between €90 and €135/month, were lowered several times and pre-paid subscriptions were introduced but are today much lower than initially anticipated. 3 UK’s ARPU was €68 in December 2003, with 210.000 subscribers and 660.000 globally; data traffic generates 15% of revenue30. In 2005 the best selling price plan ‘Talk, Text & Video 600’ combines voice, text with a bundle of 3's video mobile services, for €51/month, 30% above Vodafone’s 2005 (blended) ARPU in the UK. This price plan gives customers 500 voice minutes, 100 minutes on any available networks in the UK, text messages, twenty video calling minutes from a 3 video mobile handset to another, twenty video messages to other 3 mobiles and a range of 3's video mobile services, including highlights of the Barclays Premiership, full-length music videos, comedy, games, news and financial information.31. The operator 3 UK in the beginning of 2006 has 3 million customers and 3 has almost 6 million worldwide32, the latest services that have been added seek to enable customers to blog their own opinions and comments on their websites of their mobile telephones. The company 3 Group in Sweden is owned by Hutchison (60 %) and Investor (40 %). From the start in 2003 the operator used a similar strategy as 3 Group in the UK. 3 targeted business customers and other clients interested in mobile data services. To attract these groups the firm sought to develop new services that used the high data transmission capacity in the UMTS network. The operator entered agreements with content providers in different sports, gambling, news, cinemas and so on. The firm had some success with this strategy and had the biggest subscriber base of the 3G operators, but was infinitesimal small compared with the 2G operators. In 2004 the operator changed strategy and offered a number of low cost subscriptions, for example 199 SEK (22 €) for 120 minutes to all networks and unlimited number of voice and video communication in the 3 network. These subscriptions were less expensive than many 2G subscription plans and the free communication inside the 3
25 http://www.3gnewsroom.com/3g_news/nov_02/news_2772.shtml26 Oddly enough only NEC e606 and Motorola A830 handsets were available at that stage. 27 http://www.3gnewsroom.com/3g_news/mar_03/news_3228.shtml28 http://www.3gnewsroom.com/3g_news/may_03/news_3439.shtml29 http://www.3gnewsroom.com/3g_news/dec_03/month_december_03.shtml30 http://www.3gnewsroom.com/3g_news/mar_04/news_4280.shtml31 http://www.3gnewsroom.com/3g_news/apr_05/news_5731.shtml32 This is to say in Australia, Austria, Denmark, Hong Kong, Italy, Sweden and the UK.
17

28/09/2006
network attracted groups and communities of customers to join 3. One spectacular case is the deaf community in Sweden that rapidly found that it was possible to use the video in the 3G mobile telephones for sign language communication. According to an estimate by the Swedish National Association of the Deaf has 4-6000 deaf, approximately half of the deaf population in Sweden a 3G mobile telephone.33. The number of subscribers increased from 18.000 at the end of 2003 to 265.000 (nearly three per cent of the subscribers in the Swedish mobile telephone market at the end of 2004.34 According to the 3 Group its ARPU is much higher than the mobile telephone operators due to the unexpectedly high usage of non-voice services.35 In 2005 ARPU in 3 Group’s Swedish and Danish operations reached SEK 382,90 (€41,25) and non data ARPU is 16% of the total, which is a high percentage in Sweden/Denmark but relatively low compared to Italy’s 40%36. The operator 3 has continued to develop its offer in the Swedish market. It has created Sweden’s most successful service for downloading music. In 2006 3Music was elected the World’s best mobile music service at the GSM World Awards in Barcelona. Globally the 3 Group’s customer base reached 13.5 million in June 2006 and is located in nine markets: Australia, Austria, Denmark, Hong Kong, Ireland, Israel, Italy, Sweden and the UK. The world market is approaching 100 million 3G subscribers mid 2006, Europe is the largest market, Japan comes second and the US third37, while China already reached the 10 million mark in 2006.38. ARPU of the 3 Group is €44,66 and 28% of ARPU is related to data. However, like other 3G mobile network operators 3 Group’s profitability is still not achieved and earlier assumptions on this year’s (2006) break even proved to be false; break even is now assumed to be reached in the first half of 200739.
4.3. What should network operators do? The central question is what strategy should network operators follow? Introduce the next generation services 3G at once or gradually improve the previous 2G networks? Of course, this decision depends on the position of the network operator. The majority of the European network operators followed an incremental strategy. They upgraded the 2G networks and prepared for the big leap forward by investing in UMTS later on. There are few operators that began from scratch i.e. do not have a previous generation network in operation. This does not imply that new entry will not be a successful strategy. In the next section, we will discuss this intriguing question in more detail, we close this section with some remarks. First, how to manage the risk of cannibalisation if 3G is introduced at once? The argument is that if 3G is competitively priced all potential demand for high quality mobile data services is attracted towards 3G. This potential demand consists of newly created demand and customers switching from 2G and 2.5 towards 3G. To decrease the size of the potential customer base non 3G operators apply all kind of lock-in costs: from SIM-locks, to high costs for terminating the current (2G or 2.5G) contract
33 PTS (2005a) 34 PTS (2005b) 35 http://www.tre.se/templates/Page.aspx?id=2009 accessed 7 July 2005 and IHT 29 June 2005. 36 Annual Report 2005, http://202.66.146.82/listco/hk/hutchison/annual/2005/telecom.pdf 37 http://www.strategyanalytics.com/press/PR00301.htm 38 http://www.3gnewsroom.com/3g_news/feb_06/news_6756.shtml 39 http://www.telecoms.com/itmgcontent/tcoms/search/articles/20017371099.html
18

28/09/2006
before its expiry date. If these lock-in effects are substantial a new pure-play 3G operator gets a less significant first-mover advantage. Second, there exists a real possibility that the future state of the art technology is not 3G. This is in particular the case in the urban areas where there are many alternative access technologies for mobile Internet like DECT, HiperLAN-2 and the US based IEEE 802.11-a and b standards 5. THE SUCCESSIVE GENERATIONS OF MOBILE COMMUNICATION
TECHNOLOGIES
When we focus on the economics of mobile telecommunications and when it comes to a next generation of mobile telecommunications then the increased data rates is just one of the facets of what the new technology brings. Equally or more importantly is the enhanced variety and quality of the services. Typical enhancements of lower generation services are SMS that has become MMS and news delivered in text format that assumes the format of streaming video and the possibility of blogging. So in general whatever the service will be the newer generation’s mobile telecommunication services becomes more complicated to organise, as more parties are involved compared with the previous service. As we saw above a network operator that migrates from 2G to 3G and offers more advanced mobile services has to decide on two variables: the price of the new services and the content of the new services. This decision is vital because customers derive utility from the quality of their mobile services in relation to the price they have to pay. In higher generation mobile services the quality of the services increases because on the one hand the content of mobile services becomes richer and on the other the services become faster. Richness of content can be described as the number of links that are provided or should we say the number of content providers involved. The more links a mobile service provides the more utility the services will bring for the customer, or in other words the quality of the services increases. The possibilities for mobile services can at the present stage be regarded as limitless and these serve several needs in contemporary life. They serve individuals who like to escape the current place and need location-based services, in the form of tourism information (Pröll and Retschitzegger, 2000) or virtual city visits. Ahonen (2002) adds the expansion of the concept of time that can be achieved by enjoying mobile infotainment, i.e. entertainment and information combined. Other possibilities are extending yourself and your community, expanding your financial resources and getting empowering devices and gadgets. Consequently the real value of a higher generation mobile service lay in the number of links that can be established between a person and the world. Therefore the number of potential users engaging in the new services is determined simultaneously by the difference between the price of the 2G services and the 3G services and the relative quality of the mobile systems. In Figure 5 the migration to the next generation is expressed in terms of utility, prices and penetration. Assume that the fraction of 2G users equals c and they pay a price p2G for these mobile services. The utility these customer derive from their mobile services comes from a general network effect (n) of the 2G mobile communication network, which is independent of prices for each technology indicated with the line N-n. The second part of the utility derived from the mobile service is the transmission
19

28/09/2006
rate; this rate determines the slope of the line N-A-M. Assume the operator’s price for 2G services is p2G and this is how the allocation A and a total fraction of 2G users can be understood. The introduction of the next generation in this case 3G services has in general at least two consequences: the price will be higher because the quality of services is higher but also the network effects of a 3G service are higher than for 2G services and reaches the level m indicated by the line N’-m in Figure 5. These effects taken together translates the line NAM towards N’-B” and they lead to an allocation B”, with a corresponding fraction of 3G users of d” (assuming no cannibalisation). However, if the 3G services fail to deliver the promised network effects then the line shift to N-B-M’ and allocation will be B with a smaller fraction (d) of 3G users. The difference between d” and d is the potential churn, when the 3G services fails to deliver the network effects, which might be quite complicated to discover. If, however both the transmission rate and the network effects turn out to be less than expected then the fraction of users will be somewhere in between 0 and d, i.e. less than expected. This is the basis of a higher price for later generations of mobile communication. Figure 5 Migration from 2G to 3G
Stepping from one generation into another not only means higher data rates hence potentials for more utility for the user, but more utility is also added by the network effects because higher generations mobile service connects people more versatile and to a larger content base.
20

28/09/2006
6. Concluding Remarks
It is remarkable indeed that countries, which already had the cheapest mobile communication (medium usage baskets) in 2002 - exhibit the largest prices declines during 2003-2005, while the most expensive countries exhibited very small declines. The role of the NRA’s regarding especially retail prices and interconnection prices seems to be quite important and the number of mobile virtual network operators entering has had a positive impact on competition in the mobile communication markets. However transparent prices and transparency in quality of services become more difficult to assess for users when services become more integrated in newer generations of mobile communications like 3G and subsequent generations, without the support of the NRA, National Competition Authorities and Consumer Organisations. In the last decade the number of subscribers exploded in the European mobile telecommunications networks while the ARPU fell with up to nearly 50 per cent for all operators. According to International Herald Tribune (2005) Vodafone earned 24.90 € each on its 154.8 million subscribers in 2004 compared with 60.52 € per subscriber in 1996 when the operator had 3.04 million subscribers. Mobile data is regarded as one solution to this dilemma. Value-added services, MMS and video communication should bring higher revenue streams per customer. However, mobile telecommunication continues to be predominantly used for voice calls. SMS accounted for a little more than 11 per cent of the revenues in a country like Sweden and MMS contributed a fraction of this with 3 SEK per year and customer in 2004. The rise of the operator 3 in Europe can be an indication that a new business model for 3G has come into being. The customers are attracted with low cost monthly plans or low cost pre-paid card subscriptions. Once they have subscribed to the 3G services they start using the pay services the operator offers and as a result average spending goes up. 3 states this on its own web sites and comparative figures for Britain confirms this – average spending of a 3 subscriber is twice as high (£40) as for the national average (£20). As far as stock prices say something the 3 Group (Hutchison telecommunication International) has been more awarded by the stock exchange than Vodafone Group PLC or NTT DoCoMo Inc. The 3 Groups stocks rose from 10 $ at the end of 2005 to 24$ in June 2006, while Vodafone stock price fell from 28$ at the end of 2005 to 22$ in June 2006, NTT DoCoMo stocks fell from 18 to 15$. First mover advantages for new generations of mobile telecommunications need to be nurtured by NRA’s by keeping lock-in costs for users to a minimum, the sooner users can switch to newer generations electronic communication the better the chances of developing state of the art technologies and value added services using the 3G standard. A too strong emphasis on locking in the customer base may be a short-term strategy that slows down technological change in the market where it is practiced and threatens the long-term survival of the operator in this rapidly changing market.
21

28/09/2006
BIBLIOGRAPHY
Agar, J., 2003, Constant Touch, a global history of the mobile phone, Icon Books UK, Duxford, Cambridge, UK. Ahonen, T., 2002, m-Profits, Making Money from 3G Services, Wiley Bekkers, R., G. Duysters and B. Verspagen, 2002, Intellectual Property Rights, Strategic Technology Agreements and Market Structure. The case of GSM, Research Policy, 31, pp. 1141-1161. Bhargava, H., V. Choudhary and R. Krishnan, 2000, Pricing and Product Design: Intermediary Strategies in an Electronic Market, International Journal of Electronic Commerce, 5, No 1/Fall, pp. 37-56. Braidotti R., 1994, Nomadic Subjects, New York, Columbia University Press. Coen, D., 2005, Managing the political life cycle of regulation in the UK and German telecommunication sectors, Annals of Public and Cooperative Economics, 76:1, 2005, pp.59-84. Deleuze, G. and F. Guattari, 1976, Rhizome: Introduction, Paris: Editions de minuit. Deleuze, G. and F. Guattari, 1980, Mille Plateaus: Capitalisme et Schrizophrénie, Paris: Editions de Minuit. Directive 2002/21/EC A Common Regulatory Framework for Electronic Communication Networks and Services OJ[2002]L108/33. Dobbs, I. A., 2002, The assessment of market power and market boundaries using the hypothetical monopoly test, Department of Accounting and Finance, and Newcastle School of Management, University of Newcastle upon Tyne, NE1 7RU, UK. EC, 1997, European Commission, 1997. "Directive 97/33/EC of the European Parliament and of the Council of 30 June 1997 on Interconnection in Telecommunications with regard to ensuring universal service and interoperability through application of the principles of Open Network Provision", (ONP) (OJ L199/32, 26.07.97). EC, 2002, European Commission, 2002. "Eighth Report on the Implementation of the Telecommunications Regulatory Package", COM(2002) 695 ¯ EC, 2004, European Commission, 2004, Communication from the Commission to the Council, the European Parliament, the European Economic and Social Committee and the Committee of the Regions, European Electronic Communications Regulation and Markets 2004, [SEC(2004)1535] , Annex to the European Electronic Communications Regulation and Markets 2004 (10TH Report), Annex 3, Market Overview, COM(2004)759.
22

28/09/2006
EC ,2006, European Commission 2006, Annex to the Communication from the Commission to the Council, the European Parliament, The European Economic an Social Committee and the Committee of the Regions, European Electronic Communications Regulation and Markets (11th Report) COM(2006)68 final Furuskar, A, S. Mazur, F. Muller & H. Olofsson, 1999, EDGE: Enhanced data rates for GSM and TDMA/136 Evolution, IEEE Personal Communications, 6, (3), pp. 55-66. Green Paper on the Development of a Common Market for Telecommunication Services and Equipment (COM87)290 Gabel, Landis H., 1987, Open Standards in the European Computer Industry: the Case of X/OPEN, in H. Landis Gabel, Product Standardization and Competitive Strategy, Advanced Series in Management, Vol. 2 Amsterdam; North Holland, pp. 91-124 Garrard, G., 1998, Cellular Communications: Worldwide Market Development, Boston/London: Artech House Publishers. Gerdes, O., 1991, Nordisk Mobiltelefoni NMT Från trådlös telegraf till mobiltelefon, Daedalus –Tekniska Museets Årsbok. Geroski, P., Competition in Markets and Competition for Markets, 2003, Journal of Industry, Competition and Trade, 3,3, pp. 151-166. Geser, H. ,2004, Towards a sociological theory of the mobile phone. University of Zurich. http://socio.ch/mobile/t_geser1.htm Grimsteit, L. and H. Myhre, 1995, The history of mobile communications in Norway, Telektronikk, 91, 4, Telenor, pp. 15-20. Gruber, H., and F. Verboven, ,2001, The evolution of markets entry and standards regulation: the case of global mobile telecommunications, Katholieke Universiteit Leuven, 2001 Hommen, L., 2003, The Universal Mobile Telecommunication System (UMTS): Third Generation, In. Edquist Ch., The Internet and Mobile Telecommunications System of Innovation, Edgar Elgar. Hultén, S. and B. Mölleryd, 2003, Entrepreneurs, Innovations and Market Processes in the Evolution of the Swedish Mobile Telecommunications Industry, in “Change, Transformation and Development”, Springer, eds. U. Cantner and S. Metcalfe International Herald Tribune, 2005, Cell phone customers put new technologies on hold (written by Kevin J. O’Brien), 29 June. ITU, Yearbook of Statistics, Telecommunication Services 1993-2002.
23

28/09/2006
Kargman, H., 1978, Land Mobile Communications : The Historical Roots, In: Bowers, R., A.M. Lee and C. Hersey, Communicatons for a mobile society, An Assessment of New Technology, Sage Publications, Beverly Hills, London. KPN, 2003, Annual Report 2003. Lacohée, H., N. Wakeford and I. Pearson, 2003, A social history of the mobile telephone with a view of its future, BT Technology Journal, 21, 3 , July, pp. 203-211. Lindmark, S, 2002, Evolution of techno-economic systems: an investigation of the history of mobile telecommunications, Chalmers University of Technology. Mante Meijer E. and R. Ling, The adoption and use of ICT services in Europe Potential acceptance of mobile broadband services, http://www.eurescom.de/~public-web-deliverables/P900-series/P903/ICT_use_Mante.pdf Meurling J. and R. Jeans, 1994, The Mobile Phone Book, The invention of the mobile phone industry, Communication Weeks , London. Mölleryd, Bengt, G., 1999, Entrepreneurship in Technological Systems – The Development of Mobile Telephony in Sweden, Dissertation, Stockholm: The Economic Research Institute. Opta, Annual Report, 2004. http://www.opta.nl/asp/en/newsandpublications/annualreports/document.asp?id=1664 Pelkmans, J, 2001, The GSM standard: explaining a success story, Journal of European Public Policy, 8: 3 Special Issue, pp. 432-453. Post- och Telestyrelsen, 2005a, Mobil videokommunikation för döva, PTS-ER-2005:14 Post- och Telestyrelsen, 2005b, Svensk telemarknad 2004, PTS-ER-2005:34 Post- och Telestyrelsen, 2006, Svensk telemarknad 2005, PTS-ER-2006:23 Post- og Teletilsynet, 2006, Det norske telemarkedet 2005 Pröll, B. and W. Retschitzegger, 2000, Discovering Next Generation Tourism Information Systems: A Tour on TIScover, Journal of Travel Research, Vol. 39, No. 2, pp. 182-191. Samukic, A. UMTS universal mobile telecommunication system: development of standards for th third generation, IEEE transactions on Vehicular Technology, Vol 47, 4, pp1099-1104. Smoreda, Z., and F. Thomas, Social Networks and residential ICT adoption and use, 2001, http://www.eurescom.de/~ftproot/web-deliverables/public/P900-series/P903/ICT_use_Smoreda.pdf
24

28/09/2006
Steinbock, D., 2001, Assessing Finland’s Wireless Valley: can the pioneering continue?, Telecommunications Policy, 25, pp. 71-100. Swedish Telecom, 1975, Introduction of a national automatic mobile telephone network MTC, July 1975. Thatcher, M. ,2001, The Commission and national governments as partners: EC regulatory expansion in telecommunications 1979-2000, Journal of European Public Policy, 8:4 August, pp. 558-584. Turpeinen, O. ,1997, Telecommunications since 1796: Telecom Finland Ltd. Helsinki: Edita. Wilska, T-A, 2003, Mobile Phone Use as Part of Young People’s Consumption Styles, Journal of Consumer Policy, 26, pp. 441-463. Websites http://www.3gnewsroom.com/3g_news/nov_02/news_2772.shtml http://www.tre.se/templates/Page.aspx?id=2009 http://www.fcc.gov/omd/history/radio/quality.html http://www.telecomwriting.com/PCS/history9.htm www.umts-forum.org http://www.3gnewsroom.com/3g_news/may_03/news_3439.shtml http://www.3gnewsroom.com/3g_news/dec_03/month_december_03.shtml http://www.3gnewsroom.com/3g_news/mar_04/news_4280.shtml http://www.3gnewsroom.com/3g_news/apr_05/news_5731.shtml http://www.nttdocomo.com/pr/2006/001274.html
25
28/09/2006
THE UNU-MERIT WORKING PAPER SERIES
# 2006-001 A Knowledge Economy Paradigm and its Consequences by Luc Soete.
# 2006-002 Public-Private Sector Partnerships in an Agricultural System of Innovation: Concepts and Challenges by Andy Hall.
# 2006-003 Capacity Development for Agricultural Biotechnology in Developing Countries: Concepts, Contexts, Case Studies and Operational Challenges of a Systems Perspective by Andy Hall and Jeroen Dijkman.
# 2006-004 Technological Capabilities with Different Degree of Coherence: A Comparative Study of Domestic-Oriented vs. Export-Driven Bulgarian Software Companies by Rossitza Rousseva.
# 2006-005 Small Islands, New Technologies and Globalization: A Case of ICT adoption by SMEs in Mauritius by Kaushalesh Lal and Aveeraj Sharma Peedoly.
# 2006-006 Beyond Unobserved Heterogeneity in Computer Wage Premiums; and Data on Computer use in Germany, 1997-2001. Double paper by Joan Muysken, Sybrand Schim van der Loeff and Valeria Cheshko.
# 2006-007 Learning in Local Systems and Global Links: The Otigba Computer Hardware Cluster in Nigeria by Banji Oyelaran-Oyeyinka
# 2006-008 Breaking the Fence: Patent Rights and Biomedical Innovation in “Technology Followers” by Padmashree Gehl Sampath
# 2006-009 Taxation and Technolgoy Adoption: A Hotelling Approach by Ben Kriechel and Thomas Ziesemer
# 2006-010 Foreign Direct Investment and Technology Spillovers: Evidence from the Indian Manufacturing Sector by Subash Sasidharan
# 2006-011 Persistence of Innovation in Dutch Manufacturing: Is it Spurious? by Wladimir Raymond, Pierre Mohnen, Franz Palm and Sybrand Schim van der Loeff
# 2006-012 Random walks and cointegration relationships in international parity conditions between Germany and USA of the post Bretton-Woods period by Franco Bevilacqua
# 2006-013 On the Persistence of Inequality in the Distribution of Personal Abilities and Income by Adriaan van Zon and Hannah Kiiver
# 2006-014 Foreign Direct Investment, Firm-Level Capabilities and Human Capital Development: Evidence from Kenyan Manufacturing Industry by Geoffrey Gachino
# 2006-015 The Determinants of Pharmaceutical R&D Expenditures: Evidence from Japan by Jörg C. Mahlich and Thomas Roediger-Schluga
# 2006-016 Random walks and cointegration relationships in international parity conditions between Germany and USA for the Bretton-Woods period by Franco Bevilacqua
# 2006-017 Concepts and guidelines for diagnostic assessments of agricultural innovation
capacity by Andy Hall, Lynn Mytelka and Banji Oyeyinka # 2006-018 Buying and Selling Research and Development Services, 1997 to 2002 by Julio
M. Rosa, Antoine Rose and Pierre Mohnen # 2006-019 INDIA’s product patent protection regime: Less or more of “pills for the
poor”?by Padmashree Gehl Sampath
26

28/09/2006
# 2006-020 Worker Remittances and Growth: The Physical and Human Capital Channels by Thomas Ziesemer
# 2006-021 Creating the Capacity to Benefit from Technological Change in Developing
Countries by Watu Wamae # 2006-022 A Technology Acquisition Model: the role of learning and innovation by Watu
Wamae # 2006-023 Are North-South Technological Spillovers Substantial? A dynamic panel data
model estimation by Watu Wamae # 2006-024 How “black” is the black sheep compared to all others? Turkey and the EU by İ.
Semih Akçomak and Saeed Parto # 2006-025 Diffusion paths for Micro Cogeneration Using Hydrogen in the Netherlands by
Mattijs Taanman, Arend de Groot, René Kemp, & Bart Verspagen. # 2006-026 Rough Road to Market: Institutional Barriers to Innovations in Africa by Banji
Oyelaran-Oyeyinka and Padmashree Gehl Sampath # 2006-027 Innovativity: a comparison across seven European countries by Pierre Mohnen,
Jacques Mairesse & Marcel Dagenais # 2006-028 Empirical studies of innovation in the knowledge driven economy by Bronwyn H.
Hall and Jacques Mairesse # 2006-029 Information and Intellectual Property: The Global Challenges by Rishab Ghosh
and Luc Soete # 2006-030 Absorptive Capacity and Export Diversification in Sub-Saharan African
Countries by Alexis Habiyaremye & Thomas Ziesemer # 2006-031 Indian Pharma Within Global Reach? By Padmashree Gehl Sampath # 2006-032 Foreign Ownership, Technological Capabilities and Exports: Evidence from 205
Clothing Firms in Sri Lanka by Ganeshan Wignaraja # 2006-033 (S,s) Pricing: Does the Heterogeneity Wipe Out the Asymmetry on Micro Level?
by Zakaria Babutsidze # 2006-034 Brief History of Mobile Telecommunication in Europe by Theo Dunnewijk &
Staffan Hultén.
27