8th Grade Math - Groveport Madison Schools
79
8 th Grade Math Pacing Guide and Unpacked Standards Developed by: Teresa Malloy, GMLSD School Improvement Coordinator Craig Lomonico, GMLSD School Improvement Coordinator Amon Dobbins, GMLSD School Improvement Coordinator Christy Smith, GMLSD Math Teacher Carri Meek, School Improvement Specialist, Instructional Growth Seminars and Support Garilee Ogden, GMLSD Director of Curriculum, Instruction and Professional Development Resources: School District U-46, of Chicago, IL, The Ohio Department of Education, Columbus City Schools, Common Core Institute and North Carolina Department of Public Instruction. We would like to thank the teachers of GMLSD that provided feedback and support.
-
Upload
khangminh22 -
Category
Documents
-
view
1 -
download
0
Transcript of 8th Grade Math - Groveport Madison Schools

8th Grade Math
Pacing Guide and Unpacked Standards
Developed by: Teresa Malloy, GMLSD School Improvement Coordinator
Craig Lomonico, GMLSD School Improvement Coordinator
Amon Dobbins, GMLSD School Improvement Coordinator Christy Smith, GMLSD Math Teacher
Carri Meek, School Improvement Specialist, Instructional Growth Seminars and Support
Garilee Ogden, GMLSD Director of Curriculum, Instruction and Professional Development
Resources: School District U-46, of Chicago, IL, The Ohio Department of Education, Columbus City Schools, Common Core Institute and North Carolina Department of Public Instruction.
We would like to thank the teachers of GMLSD that provided feedback and support.

Groveport Madison Math Pacing Guide – Grade 8 ➤ Indicates Blueprint Focus Standards
Groveport Madison Local Schools Department of Curriculum and Instruction 2017
8th The Number System Expressions & Equations Functions Geometry Statistics & Probability Standards for Mathematical
Practice
1st 9 Weeks
➤8.NS.1 Know that real
numbers are either rational or irrational
➤8.NS.2 Know that
there are numbers that are not rational; approximate by rational numbers
➤8.EE.1 Understand, explain &
apply properties of exponents
➤8.EE.2 Use square roots and
cube root symbols in equations
➤8.EE.3 Use scientific notation
for estimation
➤8.EE.4 Perform operations
with scientific notations
➤8.EE.7(a,b) Solve linear
equations
MP.1 Make sense of problems and persevere in solving them MP.2 Reason abstractly and quantitatively MP.3 Construct viable arguments and critique the reasoning of others MP.4 Model with mathematics
MP.5 Use appropriate tools strategically
MP.6 Attend to precision
MP.7 Look for and make use of structure
MP.8 Look for and
express regularity in repeated reasoning
2nd 9 Weeks
➤8.EE.5 Graph proportional
relationships and compare
➤8.EE.6 Use triangles to
explain slope
➤8.EE.8 (a,b,c) Analyze
and solve pairs of linear equations; use graphs to find or estimate
➤8.F.3 Defining a
linear function & interpret equation
➤8.F.2 Compare
properties of functions
➤8.F.4 Construct a
function to model linear relationships
3rd 9 weeks
➤8.F.1
Understanding a function
➤8.F.5 Describe
qualitatively the functional relationships
➤8.G.6 Analyze and justify an
informal proof of Pythagorean Theorem
➤8.G.7 Apply the Pythagorean
Theorem to real world
➤8.G.8 Apply the Pythagorean
Theorem to find distance
➤8.G.1 (a,b,c) Verify properties
of rotations, reflections, and translations
➤8.G.2 Understand that 2-sided
figures are congruent
➤8.G.3 Describe effects of
dilations
➤8.G.4 Understand that figures
are similar
➤8.G.5 Use informal arguments

Groveport Madison Math Pacing Guide – Grade 8 ➤ Indicates Blueprint Focus Standards
Groveport Madison Local Schools Department of Curriculum and Instruction 2017
8th The Number System Expressions & Equations Functions Geometry Statistics & Probability Standards for
Mathematical Practice
4th 9 Weeks
➤8.G.9 Know formulas for
cylinders, cones & spheres to solve real world problems
➤8.SP.1 Construct &
interpret scatter plots
➤8.SP.2 Understand
relationships with straight lines
➤8.SP.3 Use equation of
linear models to solve problems
➤8.SP.4 Understand
patterns of association
MP.1 Make sense of problems and persevere in solving them MP.2 Reason abstractly and quantitatively MP.3 Construct viable arguments and critique the reasoning of others MP.4 Model with mathematics
MP.5 Use appropriate tools strategically
MP.6 Attend to
precision
MP.7 Look for and make use of structure
MP.8 Look for and express regularity in repeated reasoning

Groveport Madison Local Schools Department of Curriculum and Instruction 2018
Ohio’s Learning Standards- Clear Learning Targets
Math, Grade 8
Essential Understanding Vocabulary
• Rational Number
• Irrational number
• Square root
• Repeating decimal
• Terminating decimal
• Convert
• Approximate
• Compare
• Estimate
• Integer
8.NS.1-2 Rational and Irrational Numbers Know that real numbers are either rational or irrational.
8.NS.1 Know that real numbers are either rational or irrational. Understand
informally that every number has a decimal expansion; for rational
numbers show that the decimal expansion repeats eventually, and convert
a decimal expansion, which repeats eventually into a rational number which
is repeating, terminating, or is non-repeating and non-terminating .
Know how to convert fractions to decimals using long division.
Know how to convert decimals to fractions.
8.NS.2 Use rational approximations of irrational numbers to compare the size
of irrational numbers, locate them approximately on a number line diagram,
and estimate the value of expressions (e.g., π2).
For example, by truncating the decimal expansion of √2, show that √2 is
between 1 and 2, then between 1.4 and 1.5, and explain how to continue on
to get better approximations.

Groveport Madison Local Schools Department of Curriculum and Instruction 2018
Essential Skills
• I can define rational and irrational numbers.
• I can show that the decimal expansion of rational numbers repeats eventually.
• I can convert a decimal expansion, which repeats eventually into a rational number which is repeating, terminating, or is non-repeating and non-
terminating.
• I can show that every number has a decimal expansion.
• I can approximate irrational numbers as rational numbers.
• I can convert a decimal expansion which repeats into a rational number.
• I can approximately locate and order irrational numbers on a number line.
• I can estimate the value of expressions involving irrational numbers using rational approximations.
• I can compare the size of irrational numbers using rational approximations.

Groveport Madison Local Schools Department of Curriculum and Instruction 2018
Instructional Methods
8.NS.1
Students distinguish between rational and irrational numbers. Any number that can be expressed as a fraction is a rational number. Students recognize that the decimal equivalent of a fraction will either terminate or repeat. Fractions that terminate will have denominators containing only prime factors of 2 and/or 5. This understanding builds on work in 7th grade when students used long division to distinguish between repeating and terminating decimals. Students convert repeating decimals into their fraction equivalent using patterns or algebraic reasoning.
One method to find the fraction equivalent to a repeating decimal is shown below.
Change 0.4 to a fraction.
Let x = 0.444444…..
Multiply both sides so that the repeating digits will be in front of the decimal. In this example, one digit repeats so both sides are multiplied by 10, giving 10x = 4.4444444…. Subtract the original equation from the new equation. 10x = 4.4444444…. x = 0.444444….. 9x = 4
Solve the equation to determine the equivalent fraction. 9x = 4 9 9
x = 4 9
Additionally, students can investigate repeating patterns that occur when fractions have a denominator of 9, 99, or 11. For example, 9 is equivalent to 0.4, 9 is equivalent to 0.5, etc.
Students can use graphic organizers to show the relationship between the subsets of the real number system.
The distinction between rational and irrational numbers is an abstract distinction, originally based on ideal assumptions of perfect construction and measurement. In the real world, however, all measurements and constructions are approximate. Nonetheless, it is possible to see the distinction between rational and irrational numbers in their decimal representations.
A rational number is of the form a/b, where a and b are both integers, and b is not 0. In the elementary grades, students learned processes that can be used to locate any rational number on the number line: Divide the interval from 0 to 1 into b equal parts; then, beginning at 0, count out those parts. The surprising fact, now, is that there are numbers on the number line that cannot be expressed as a/b, with a and b both integers, and these are called irrational numbers. Students construct a right isosceles triangle with legs of 1 unit. Using the Pythagorean theorem, they determine that the length of the hypotenuse is √2. In the figure right, they can rotate the hypotenuse back to the original number line to show that indeed √2 is a number on the number line.
Groveport Madison Local Schools Department of Curriculum and Instruction 2018
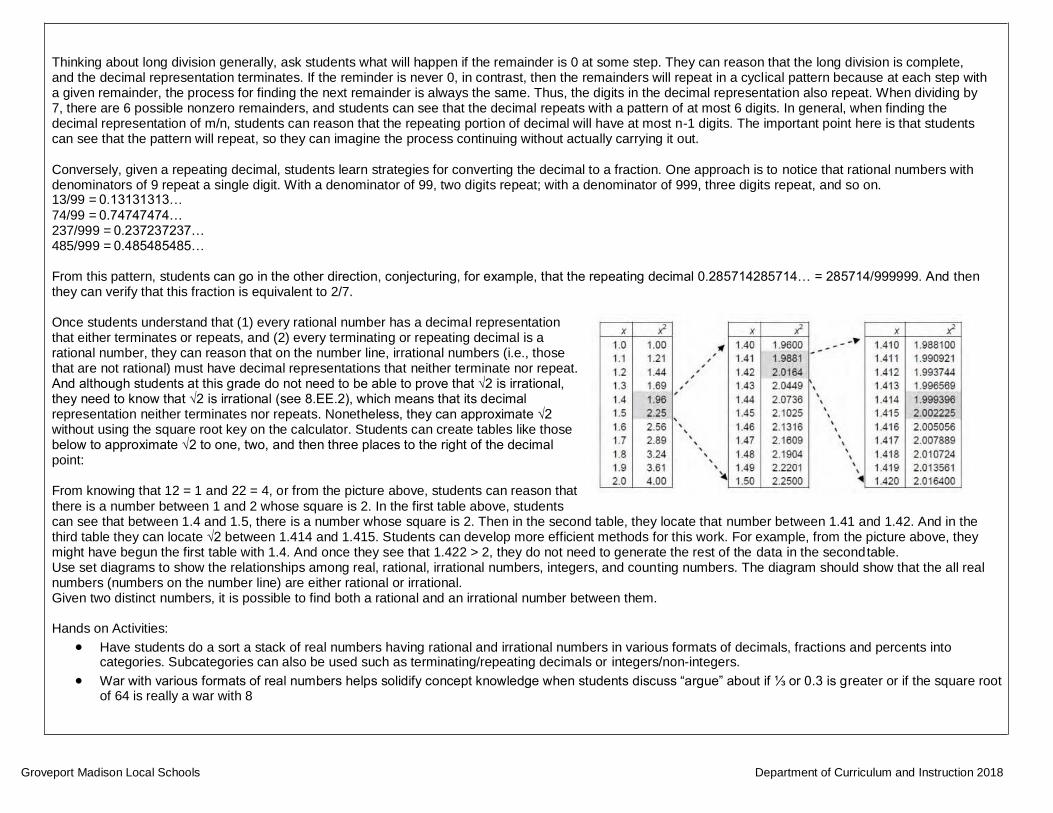
Thinking about long division generally, ask students what will happen if the remainder is 0 at some step. They can reason that the long division is complete, and the decimal representation terminates. If the reminder is never 0, in contrast, then the remainders will repeat in a cyclical pattern because at each step with a given remainder, the process for finding the next remainder is always the same. Thus, the digits in the decimal representation also repeat. When dividing by 7, there are 6 possible nonzero remainders, and students can see that the decimal repeats with a pattern of at most 6 digits. In general, when finding the decimal representation of m/n, students can reason that the repeating portion of decimal will have at most n-1 digits. The important point here is that students can see that the pattern will repeat, so they can imagine the process continuing without actually carrying it out.
Conversely, given a repeating decimal, students learn strategies for converting the decimal to a fraction. One approach is to notice that rational numbers with denominators of 9 repeat a single digit. With a denominator of 99, two digits repeat; with a denominator of 999, three digits repeat, and so on. 13/99 = 0.13131313…
74/99 = 0.74747474… 237/999 = 0.237237237… 485/999 = 0.485485485…
From this pattern, students can go in the other direction, conjecturing, for example, that the repeating decimal 0.285714285714… = 285714/999999. And then they can verify that this fraction is equivalent to 2/7.
Once students understand that (1) every rational number has a decimal representation that either terminates or repeats, and (2) every terminating or repeating decimal is a rational number, they can reason that on the number line, irrational numbers (i.e., those that are not rational) must have decimal representations that neither terminate nor repeat. And although students at this grade do not need to be able to prove that √2 is irrational, they need to know that √2 is irrational (see 8.EE.2), which means that its decimal representation neither terminates nor repeats. Nonetheless, they can approximate √2 without using the square root key on the calculator. Students can create tables like those below to approximate √2 to one, two, and then three places to the right of the decimal point:
From knowing that 12 = 1 and 22 = 4, or from the picture above, students can reason that
there is a number between 1 and 2 whose square is 2. In the first table above, students can see that between 1.4 and 1.5, there is a number whose square is 2. Then in the second table, they locate that number between 1.41 and 1.42. And in the third table they can locate √2 between 1.414 and 1.415. Students can develop more efficient methods for this work. For example, from the picture above, they might have begun the first table with 1.4. And once they see that 1.422 > 2, they do not need to generate the rest of the data in the second table. Use set diagrams to show the relationships among real, rational, irrational numbers, integers, and counting numbers. The diagram should show that the all real numbers (numbers on the number line) are either rational or irrational. Given two distinct numbers, it is possible to find both a rational and an irrational number between them.
Hands on Activities:
• Have students do a sort a stack of real numbers having rational and irrational numbers in various formats of decimals, fractions and percents into categories. Subcategories can also be used such as terminating/repeating decimals or integers/non-integers.
• War with various formats of real numbers helps solidify concept knowledge when students discuss “argue” about if ⅓ or 0.3 is greater or if the square root of 64 is really a war with 8

Groveport Madison Local Schools Department of Curriculum and Instruction 2018
8.NS.2
Students locate rational and irrational numbers on the number line. Students compare and order rational and irrational numbers. Additionally, students understand that the value of a square root can be approximated between integers and that non-perfect square roots are irrational. Students also recognize that square roots may be negative and written as −√28.
To find an approximation of √28, first determine the perfect squares 28 is between, which would be 25 and 36. The square roots of 25 and 36 are 5 and 6 respectively, so we know that √28 is between 5 and 6. Since 28 is closer to 25, an estimate of the square root would be closer to 5. One method to get an estimate is to divide 3 (the distance between 25 and 28) by 11 (the distance between the perfect squares of 25 and 36) to get 0.27. The estimate of √28 would be 5.27 (the actual is 5.29).
Students can approximate square roots by iterative processes. Examples: Approximate the value of √5 to the nearest hundredth. Solution: Students start with a rough estimate based upon perfect squares. √5 falls between 2 and 3 because 5 falls between 2² = 4 𝑎𝑛𝑑 3² = 9. The value will be
closer to 2 than to 3. Students continue the iterative process with the tenths place value. √5 falls between 2.2 and 2.3 because 5 falls between 2.2² = 4.84 𝑎𝑛𝑑 2.3 2 = 5.29. The value is closer to 2.2. Further iteration shows that the value of √5 is between 2.23 and 2.24 since 2.23² is 4.9729 and 2.24² is 5.0176
Common Misconceptions/Challenges
Squaring is not the same as doubling.
The bigger number is always divided by the smaller number.
If a decimal does not repeat within the first few digits, it will never repeat especially if they see the repetition in the calculator screen such as 1/7.
Students are surprised that the decimal representation of pi does not repeat or end at 3.14.
A few irrational numbers are given special names (pi and e), and much attention is given to sqrt(2).
Because we name so few irrational numbers, students sometimes conclude that irrational numbers are unusual and rare. In fact, irrational numbers are much more plentiful than rational numbers, in the sense that they are ―”denser” in the real line.
Students believe 0 and negative numbers are irrational

Groveport Madison Local Schools Department of Curriculum and Instruction 2018
Criteria for Success (Performance Level Descriptors)
- Limited: N/A
- Basic: Identify between which two whole number values a square root of a non-square number is located (8.NS.2).
- Proficient: Identify rational and irrational numbers and convert less familiar rational numbers (repeating decimals) to fraction form (8.NS.2); Place
irrational numbers on a number line (8.NS.2).
- Accelerated: Place irrational numbers on a number line in an abstract setting using variables (8.NS.1)
- Advanced: Notice and explain the patterns that exist when writing rational numbers (repeating decimals) as fractions (8.NS.1); Explain how to get more
precise approximations of square roots (8.NS.2)
Prior Knowledge
Students have converted a rational number to a decimal using long division; they know that the decimal form of a rational number terminates in 0s or eventually repeats. (7.NS.2d)
Understand that integers can be divided, provided the divisor is not zero, and every quotient of integers (with non-zero divisor) is a rational number.(7.NS.2b)
Future Learning
Students will solve equations using rational and irrational numbers as well as square and cube roots.
Students will use pi for volume and surface area problems. In Algebra students will use radicals to find the zeros for quadratic functions.
Career Connections
Many jobs require you to know how to estimate and measure with varying degrees of precision. Jobs in construction, engineering, medicine, and the culinary arts
(to name a few) all require you to be able to accurately measure quantities using rational numbers.

Groveport Madison Local Schools Department of Curriculum and Instruction 2018
Ohio’s Learning Standards- Clear Learning Targets
Math, Grade 8
Properties of Exponents
8.EE.1
8.EE.1 Understand, explain and apply the properties of integer exponents to
generate equivalent numerical expressions. For example, 32 × 3–5 = 3–3 = 1/33 = 1/27
Essential Understanding
Students need to understand and explain that exponential expressions represent repeated multiplication the same way that multiplication represents repeated addition.
Students will solve equations that have terms/variables raised to powers.
Vocabulary
• square
• cube
• exponent
• base
• properties
• integers
• generate
• expressions
• quotient
• product
• power
• factor
• term
• variable
• monomial
Essential Skills
• I can explain why a zero exponent produces a value of one.
• I can explain how a number raised to an exponent of -•‐1 is the reciprocal of that number.
• I can explain the properties of integer exponents to generate equivalent numerical expressions.
• I can apply the properties of integer exponents to generate equivalent numerical expressions.
Groveport Madison Local Schools Department of Curriculum and Instruction 2018
Instructional Methods
8.EE.1
Although students begin using whole-number exponents in Grades 5 and 6, it is in Grade 8 when students are first expected to know and use the properties of
exponents and to extend the meaning beyond counting-number exponents. It is no accident that these expectations are simultaneous, because it is the properties
of counting-number exponents that provide the rationale for the properties of integer exponents. In other words, students should not be told these properties but
rather should derive them through experience and reason.
For counting-number exponents (and for nonzero bases), the following properties follow directly from the meaning of exponents.
Students should have experience simplifying numerical expressions with exponents using expanded form so that these properties become natural and obvious.
For example,
If students reason about these examples with a sense of generality about the numbers, they begin to articulate the properties. For example, “I see that 3 twos is being multiplied by 5 twos, and the results is 8 twos being multiplied together, where the 8 is the sum of 3 and 5, the number of twos in each of the original factors. That would work for a base other than two (as long as the bases are the same).”
Note: When talking about the meaning of an exponential expression, it is easy to say (incorrectly) that “3⁵ means 3 multiplied by itself 5 times.” But by writing out the meaning, 3⁵=3∙3∙3∙3∙3, students can see that there are only 4 multiplications. So a better description is “3⁵ means 5 3s multiplied together.”
Students also need to realize that these simple descriptions work only for counting-number exponents. When extending the meaning of exponents to include 0 and negative exponents, these descriptions are limiting: Is it sensible to say "30 means 0 3s multiplied together” or that “3-2 means -2 3s multiplied together”?
The motivation for the meanings of 0 and negative exponents is the following principle: The properties of counting-number exponents should continue to work for integer exponents.
For example, Property 1 can be used to reason what 3⁰ should be. Consider the following expression and simplification: 3⁰ ∙3⁵=3⁰⁺⁵= 3⁵. This computation shows that the when 3⁰ is multiplied by 3⁵, the result (following
Property 1) should be 3⁵ which implies that 3⁰ must be 1.
Groveport Madison Local Schools Department of Curriculum and Instruction 2018
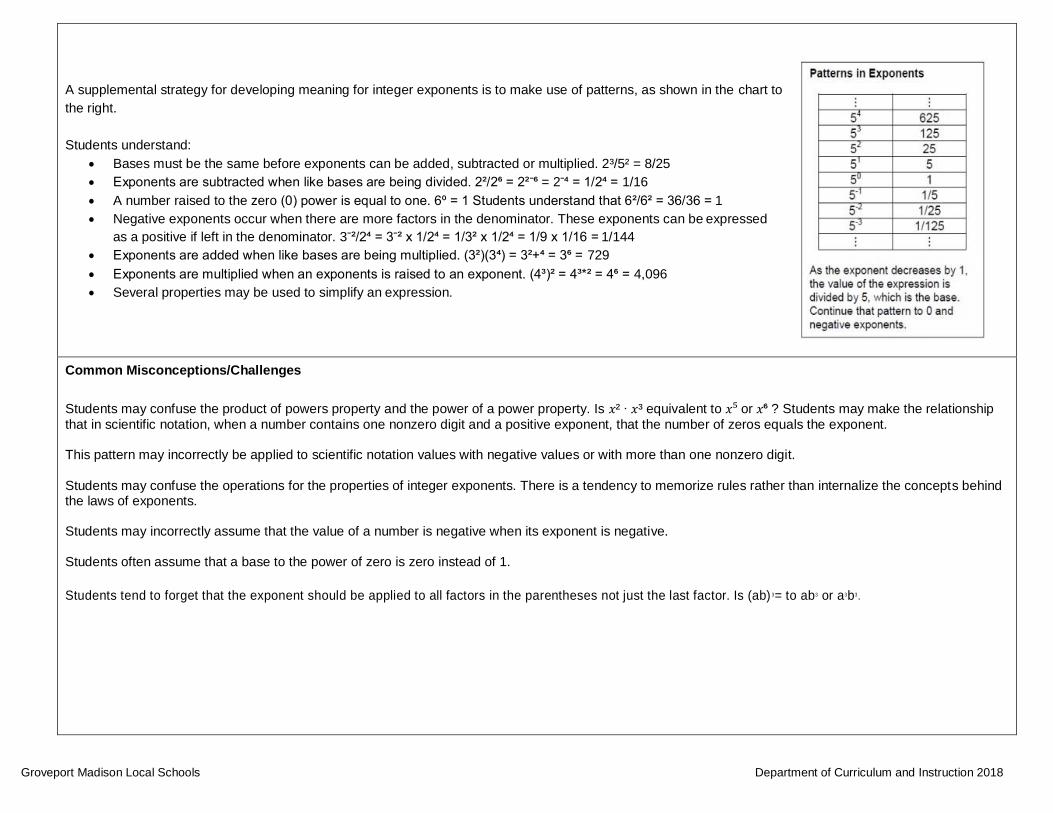
A supplemental strategy for developing meaning for integer exponents is to make use of patterns, as shown in the chart to
the right.
Students understand:
• Bases must be the same before exponents can be added, subtracted or multiplied. 2³/5² = 8/25
• Exponents are subtracted when like bases are being divided. 2²/2⁶ = 2²¯⁶ = 2¯⁴ = 1/2⁴ = 1/16
• A number raised to the zero (0) power is equal to one. 6⁰ = 1 Students understand that 6²/6² = 36/36 = 1
• Negative exponents occur when there are more factors in the denominator. These exponents can be expressed
as a positive if left in the denominator. 3¯²/2⁴ = 3¯² x 1/2⁴ = 1/3² x 1/2⁴ = 1/9 x 1/16 = 1/144
• Exponents are added when like bases are being multiplied. (3²)(3⁴) = 3²+⁴ = 3⁶ = 729
• Exponents are multiplied when an exponents is raised to an exponent. (4³)² = 4³*² = 4⁶ = 4,096
• Several properties may be used to simplify an expression.
Common Misconceptions/Challenges
Students may confuse the product of powers property and the power of a power property. Is 𝑥² ∙ 𝑥³ equivalent to 𝑥⁵ or 𝑥⁶ ? Students may make the relationship
that in scientific notation, when a number contains one nonzero digit and a positive exponent, that the number of zeros equals the exponent.
This pattern may incorrectly be applied to scientific notation values with negative values or with more than one nonzero digit.
Students may confuse the operations for the properties of integer exponents. There is a tendency to memorize rules rather than internalize the concepts behind the laws of exponents.
Students may incorrectly assume that the value of a number is negative when its exponent is negative.
Students often assume that a base to the power of zero is zero instead of 1.
Students tend to forget that the exponent should be applied to all factors in the parentheses not just the last factor. Is (ab) 3= to ab3 or a3b3.

Groveport Madison Local Schools Department of Curriculum and Instruction 2018
Criteria for Success (Performance Level Descriptors)
- Limited: Use the properties of natural number exponents to generate equivalent numerical expressions.
- Basic: Apply the properties of natural number exponents to solve simple mathematical problems.
- Proficient: Apply the properties of integer exponents to solve mathematical problems.
- Accelerated: N/A
- Advanced: Use properties of integer exponents to order or evaluate multiple numerical expressions with integer exponents.
Prior Knowledge
Students know how to write and evaluate numerical expressions involving whole-number exponents (6.EE.1)
Apply properties of operations as strategies to add, subtract, factor and expand linear expressions with rational coefficients. (7.EE.1)
Future Learning
Students will solve equations that have terms with exponents. Students will study exponential equations and functions. Students will operate with polynomials including terms with exponents.
Career Connections
Any career/job that calculates areas and volumes will need to be able to understand how to use exponents.
Scientists use exponents in many different fields…whether it is to represent really big number in Astronomy or really small numbers in quantum physics or
to calculate the half-‐life of an isotope in chemistry, archeology, and/or biology.
Geophysicists use exponents when measuring how powerful earthquakes using the Richter scale.

Groveport Madison Local Schools Department of Curriculum and Instruction 2018
Ohio’s Learning Standards- Clear Learning Targets
Math, Grade 8
8.EE.2 Roots
8.EE.2 Use square root and cube root symbols to represent solutions to
equations of the form x2 = p and x3 = p, where p is a positive rational number. Evaluate square roots of small perfect squares and cube roots of small perfect
cubes. Know that √2 is irrational.
Essential Understanding
Know how to solve equations and evaluate expressions using square and cube roots.
Know what it means for √2 to be irrational
Prove why √2 is irrational.
Vocabulary
• Radical sign
• Cube root
• Evaluate
• Perfect squares
• Perfect cubes
• Principal square root
Essential Skills
• I can use square root and cube root symbols as inverse operations to represent solutions to equations of the form
x2 = p and x3 = p, where p is a positive rational number.
• I can evaluate square roots of common perfect squares such as 122 = 144.
• I can evaluate cube roots of common perfect cubes: cube root of 1 through the cube root of 125.
• I can understand that the square root of 2 is irrational.

Groveport Madison Local Schools Department of Curriculum and Instruction 2018
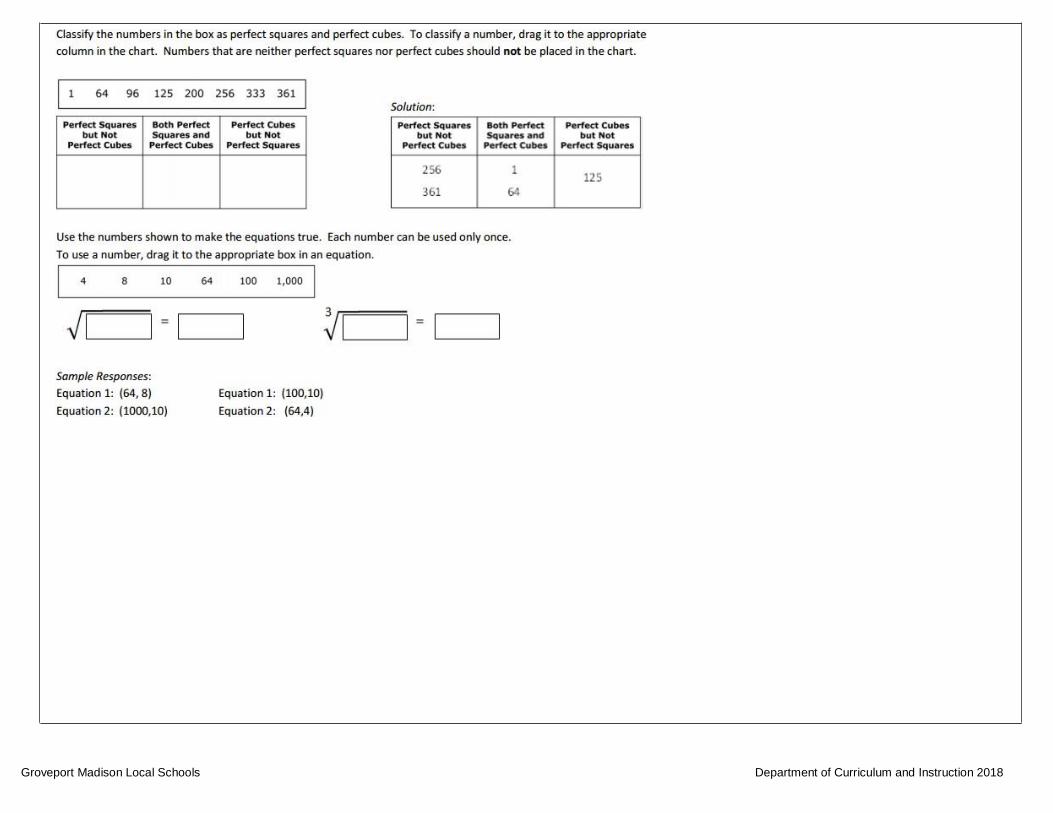
Instructional Methods
Students recognize that squaring a number and taking the square root √ of a number are inverse operations; likewise, cubing a number and taking the cube root √ 3 are inverse operations. This understanding is used to solve equations containing square or cube numbers. Equations may include rational numbers such as 𝑥² = 1/4 𝑥² = 4/9 𝑜𝑟 𝑥³ = 1/8 (Note: Both the numerator and denominators are perfect squares or perfect cubes.)
Students recognize perfect squares and cubes, understanding that non-perfect squares and non-perfect cubes are irrational. Students recognize that squaring a number and taking the square root √ of a number are inverse operations; likewise, cubing a number and taking the cube root ³√ are inverse operations. 4² = 16 and √16 = ± 4
Groveport Madison Local Schools Department of Curriculum and Instruction 2018
Groveport Madison Local Schools Department of Curriculum and Instruction 2018
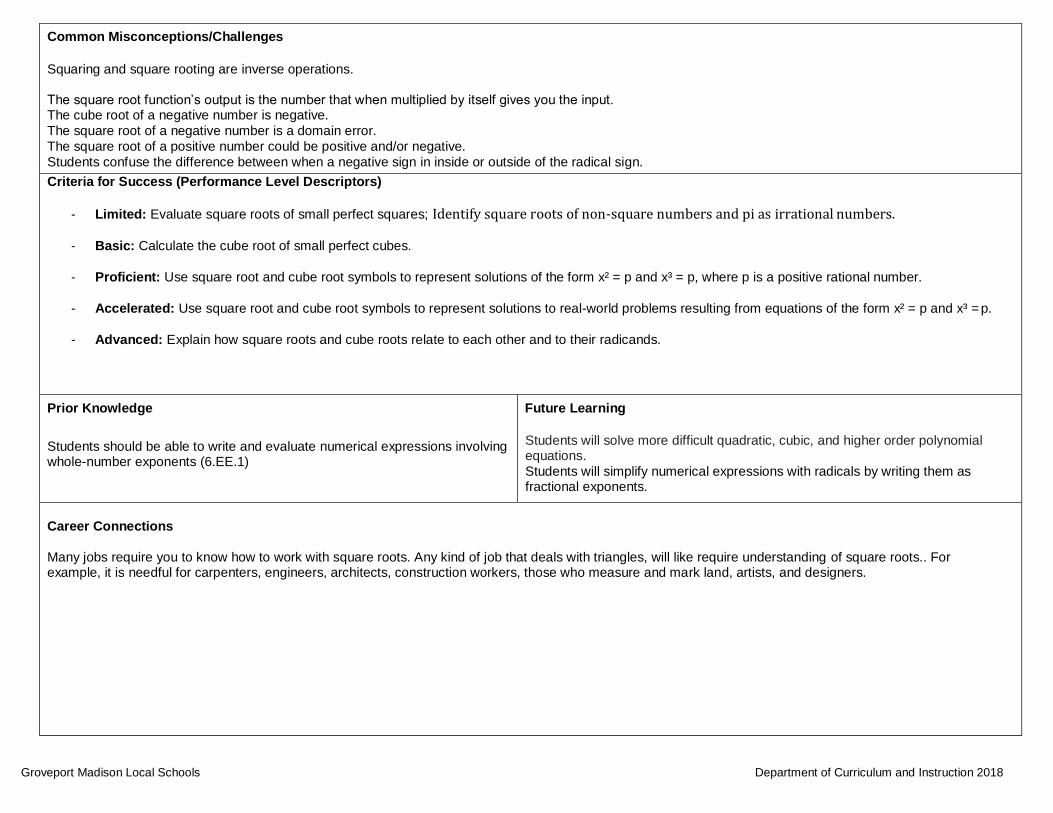
Common Misconceptions/Challenges
Squaring and square rooting are inverse operations.
The square root function’s output is the number that when multiplied by itself gives you the input. The cube root of a negative number is negative.
The square root of a negative number is a domain error.
The square root of a positive number could be positive and/or negative.
Students confuse the difference between when a negative sign in inside or outside of the radical sign.
Criteria for Success (Performance Level Descriptors)
- Limited: Evaluate square roots of small perfect squares; Identify square roots of non-square numbers and pi as irrational numbers.
- Basic: Calculate the cube root of small perfect cubes.
- Proficient: Use square root and cube root symbols to represent solutions of the form x² = p and x³ = p, where p is a positive rational number.
- Accelerated: Use square root and cube root symbols to represent solutions to real-world problems resulting from equations of the form x² = p and x³ = p.
- Advanced: Explain how square roots and cube roots relate to each other and to their radicands.
Prior Knowledge
Students should be able to write and evaluate numerical expressions involving whole-number exponents (6.EE.1)
Future Learning
Students will solve more difficult quadratic, cubic, and higher order polynomial equations.
Students will simplify numerical expressions with radicals by writing them as fractional exponents.
Career Connections
Many jobs require you to know how to work with square roots. Any kind of job that deals with triangles, will like require understanding of square roots.. For example, it is needful for carpenters, engineers, architects, construction workers, those who measure and mark land, artists, and designers.

Groveport Madison Local Schools Department of Curriculum and Instruction 2018
Ohio’s Learning Standards- Clear Learning Targets
Math, Grade 8
8.EE.3-4 Scientific Notation
8.EE.3 Use numbers expressed in the form of a single digit times an integer power of 10 to estimate very large or very small quantities, and to express how many times as much one is than the other. For example, estimate the
population of the United States as 3 × 10⁸ and the population of the world
as 7 × 10⁹, and determine that the world population is more than 20 times larger.
8.EE.4 Perform operations with numbers expressed in scientific notation,
including problems where both decimal and scientific notation are used.
Use scientific notation and choose units of appropriate size for
measurements of very large or very small quantities (e.g., use millimeters
per year for seafloor spreading). Interpret scientific notation that has been
generated by technology.
Essential Understanding
Understand that scientific notation is a method of writing equivalent numbers using multiplication and powers of ten (exponents).
Know how to convert between numbers in scientific notation and numbers in standard form.
Know how to perform operations with numbers in scientific and standard forms.
Understand the practical uses of scientific notation
Vocabulary
• Scientific Notation
• Standard form
• Estimate
• Approximate
• Appropriate
• Coefficient
Essential Skills
• I can express numbers as a single digit times an integer power of 10.
• I can use scientific notation to estimate very large and/or very small quantities.
• I can compare quantities in scientific notation to express how much larger one is compared to the other.
• I can perform operations using numbers expressed in scientific notations and decimals.
• I can use scientific notation to express very large and very small quantities.
• I can interpret scientific notation that has been generated by technology.
• I can choose appropriate units when using scientific notation.
Groveport Madison Local Schools Department of Curriculum and Instruction 2018
Instructional Methods
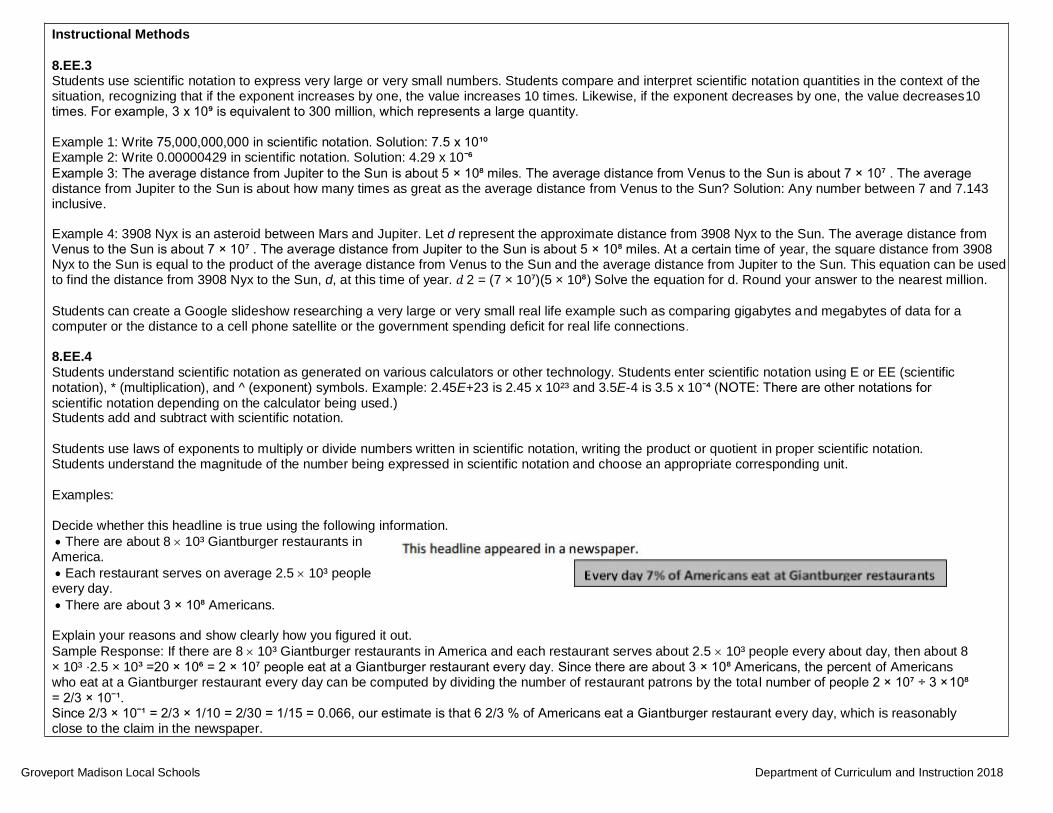
8.EE.3 Students use scientific notation to express very large or very small numbers. Students compare and interpret scientific notation quantities in the context of the situation, recognizing that if the exponent increases by one, the value increases 10 times. Likewise, if the exponent decreases by one, the value decreases 10 times. For example, 3 x 10⁹ is equivalent to 300 million, which represents a large quantity.
Example 1: Write 75,000,000,000 in scientific notation. Solution: 7.5 x 10¹⁰ Example 2: Write 0.00000429 in scientific notation. Solution: 4.29 x 10¯⁶ Example 3: The average distance from Jupiter to the Sun is about 5 × 10⁸ miles. The average distance from Venus to the Sun is about 7 × 10⁷ . The average distance from Jupiter to the Sun is about how many times as great as the average distance from Venus to the Sun? Solution: Any number between 7 and 7.143 inclusive.
Example 4: 3908 Nyx is an asteroid between Mars and Jupiter. Let d represent the approximate distance from 3908 Nyx to the Sun. The average distance from Venus to the Sun is about 7 × 10⁷ . The average distance from Jupiter to the Sun is about 5 × 10⁸ miles. At a certain time of year, the square distance from 3908 Nyx to the Sun is equal to the product of the average distance from Venus to the Sun and the average distance from Jupiter to the Sun. This equation can be used to find the distance from 3908 Nyx to the Sun, d, at this time of year. 𝑑 2 = (7 × 10⁷)(5 × 10⁸) Solve the equation for d. Round your answer to the nearest million.
Students can create a Google slideshow researching a very large or very small real life example such as comparing gigabytes and megabytes of data for a computer or the distance to a cell phone satellite or the government spending deficit for real life connections.
8.EE.4
Students understand scientific notation as generated on various calculators or other technology. Students enter scientific notation using E or EE (scientific notation), * (multiplication), and ^ (exponent) symbols. Example: 2.45E+23 is 2.45 x 10²³ and 3.5E-4 is 3.5 x 10¯⁴ (NOTE: There are other notations for
scientific notation depending on the calculator being used.) Students add and subtract with scientific notation.
Students use laws of exponents to multiply or divide numbers written in scientific notation, writing the product or quotient in proper scientific notation. Students understand the magnitude of the number being expressed in scientific notation and choose an appropriate corresponding unit.
Examples:
Decide whether this headline is true using the following information.
• There are about 8 10³ Giantburger restaurants in America.
• Each restaurant serves on average 2.5 10³ people every day.
• There are about 3 × 10⁸ Americans.
Explain your reasons and show clearly how you figured it out.
Sample Response: If there are 8 10³ Giantburger restaurants in America and each restaurant serves about 2.5 10³ people every about day, then about 8
× 10³ ⋅2.5 × 10³ =20 × 10⁶ = 2 × 10⁷ people eat at a Giantburger restaurant every day. Since there are about 3 × 10⁸ Americans, the percent of Americans who eat at a Giantburger restaurant every day can be computed by dividing the number of restaurant patrons by the tota l number of people 2 × 10⁷ ÷ 3 × 10⁸
= 2/3 × 10ˉ¹. Since 2/3 × 10ˉ¹ = 2/3 × 1/10 = 2/30 = 1/15 = 0.066, our estimate is that 6 2/3 % of Americans eat a Giantburger restaurant every day, which is reasonably close to the claim in the newspaper.

Groveport Madison Local Schools Department of Curriculum and Instruction 2018
Common Misconceptions/Challenges
Leading zeros (before the decimal point) of numbers with absolute values less than one and trailing zeros (after the decimal point) of whole numbers do not affect the value of a number and, therefore, are not considered when converting between standard from and scientific notation.
Numbers with absolute values less than one are written in scientific notation as a whole number multiplied by ten to a negative exponent. These numbers are not necessarily negative numbers.
When adding and subtracting numbers written in scientific notation, realizing that the exponent determines the place value. Therefore scientific notation expressions must be rewritten to the same exponent to represent the same place value before computing.
Criteria for Success (Performance Level Descriptors)
- Limited: Use numbers expressed in the form of a single digit times an integer power of 10 to estimate very large quantities (EE.3).
- Basic: Use scientific notation to represent and compare very large and very small quantities (EE.3).
- Proficient: Express how many times a number written as an integer power of 10 is than another number written as an integer power of 10 (EE.3); Solve
routine problems that require performing operations with numbers expressed in scientific notation, including numbers written in both decimal and scientific
notation and interprets scientific notation that has been generated by technology (EE.4).
- Accelerated: Solve problems involving the conversion between decimal notation and scientific notation and the comparison of numbers written in different
notations (EE.4).
- Advanced: Calculate and interpret values written in scientific notation within new and unfamiliar contexts (EE.3/EE.4).
Prior Knowledge
Students should understand numerical expressions and apply numerical expressions (6.EE.1 and 6.EE.3)
Future Learning
Students will need to be fluent in performing estimation and basic calculations of numbers mentally in scientific notation.
Career Connections
Many jobs require you to know how to estimate and perform operations with numbers in scientific notation. These careers work with the really big and/or the really small. Some of these careers include: astronomers, physicists, doctors, nurses, engineers, contractors, and electricians.

Groveport Madison Local Schools Department of Curriculum and Instruction 2018
Ohio’s Learning Standards- Clear Learning Targets
Math, Grade 8
8.EE.5-6 Proportional relationships, lines
Essential Understanding
It is essential for students to understand that linear relationships are defined by constant rates of change…something that is increasing or decreasing by the same amount. We call these relationships linear because when they are graphed - they create a linear representation even though there are other ways to represent these relationships than just graphically.
Students need to understand the connection between multiplication and repeated addition and how that applies to linear equations in the form y=mx.
Vocabulary
• Rate of change
• Initial value
• Slope
• Y-intercept
• Proportional relationship
• Direct variation
• Constant of variation
• Constant of proportionality
• Linear relationships
• Similar figures
• Interpret
• y-axis (vertical)
• origin
• x-axis (horizontal)
• unit rate
and linear equations
8.EE.5 Students will learn to graph proportional relationships, interpreting
the unit rate as the slope of the graph. Compare two different proportional
relationships represented in different ways. For example, compare a
distance-•‐time graph to a distance-•‐time equation to determine which of
two moving objects has greater speed.
8.EE.6 Students will use similar triangles to explain why the slope m is the
same between any two distinct points on a non-•‐vertical line in the coordinate plane; derive the equation y = mx for a line through the origin and the
equation y = mx + b for a line intercepting the vertical axis at b.
Essential Skills
• I can graph proportional relationships.
• I can determine the rate of change by the definition of slope. I can graph proportional relationships from data or equations.
• I can compare/contrast slope and rate of change.
• I can compare two different proportional relationships represented in different ways. (For example, compare a distance-time graph to a distance-time equation to determine which of the two moving objects has greater speed).
• I can interpret the unit rate of proportional relationships as the slope of a graph.
• I can identify characteristics of similar triangles.
• I can find the slope of a line.
• I can determine the y-intercept of a line.
• I can analyze patterns for points on a line that pass through the origin.
• I can derive an equation of the form y = mx for a line through the origin.
• I can analyze patterns for points on a line that do not pass through or include the origin.
• I can derive an equation of the form y=mx + b for a line intercepting the vertical axis at b (the y-intercept).
• I can use similar triangles to explain why the slope m is the same between any two distinct points on a non-vertical line in the coordinate plane.
Groveport Madison Local Schools Department of Curriculum and Instruction 2018
Instructional Methods
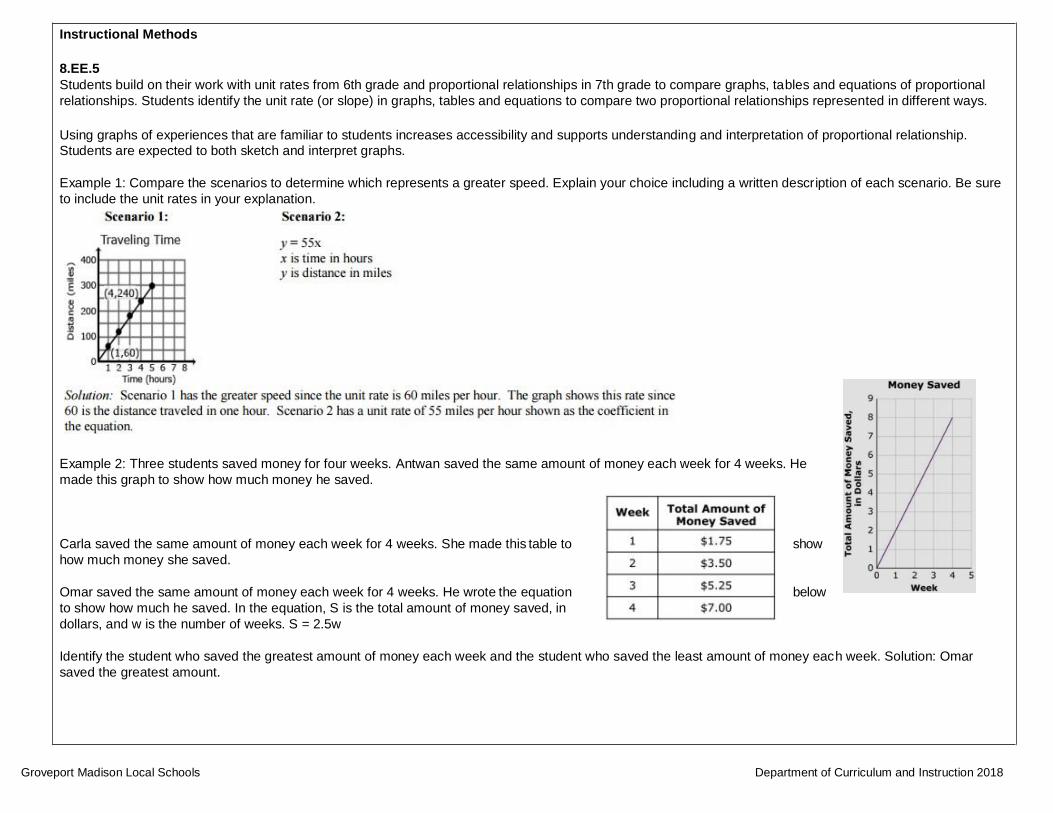
8.EE.5
Students build on their work with unit rates from 6th grade and proportional relationships in 7th grade to compare graphs, tables and equations of proportional
relationships. Students identify the unit rate (or slope) in graphs, tables and equations to compare two proportional relationships represented in different ways.
Using graphs of experiences that are familiar to students increases accessibility and supports understanding and interpretation of proportional relationship.
Students are expected to both sketch and interpret graphs.
Example 1: Compare the scenarios to determine which represents a greater speed. Explain your choice including a written description of each scenario. Be sure
to include the unit rates in your explanation.
Example 2: Three students saved money for four weeks. Antwan saved the same amount of money each week for 4 weeks. He
made this graph to show how much money he saved.
Carla saved the same amount of money each week for 4 weeks. She made this table to show
how much money she saved.
Omar saved the same amount of money each week for 4 weeks. He wrote the equation below
to show how much he saved. In the equation, S is the total amount of money saved, in
dollars, and w is the number of weeks. S = 2.5w
Identify the student who saved the greatest amount of money each week and the student who saved the least amount of money each week. Solution: Omar
saved the greatest amount.
Groveport Madison Local Schools Department of Curriculum and Instruction 2018
8.EE.6
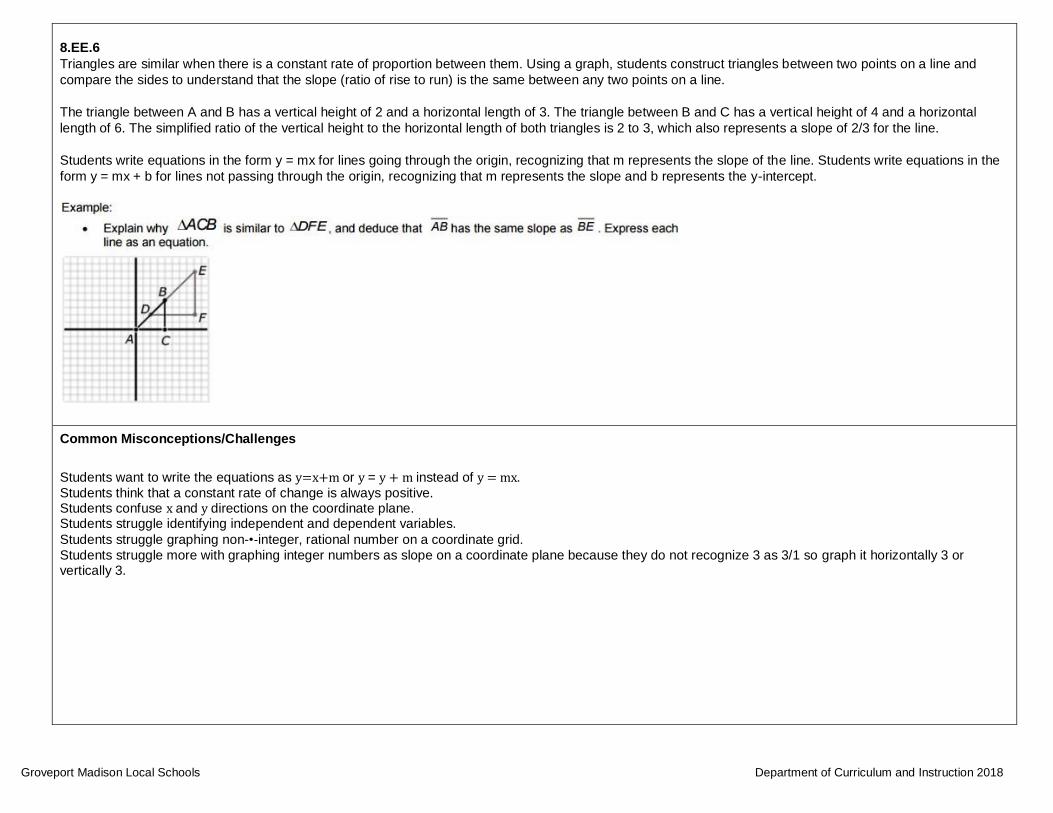
Triangles are similar when there is a constant rate of proportion between them. Using a graph, students construct triangles between two points on a line and
compare the sides to understand that the slope (ratio of rise to run) is the same between any two points on a line.
The triangle between A and B has a vertical height of 2 and a horizontal length of 3. The triangle between B and C has a vertical height of 4 and a horizontal
length of 6. The simplified ratio of the vertical height to the horizontal length of both triangles is 2 to 3, which also represents a slope of 2/3 for the line.
Students write equations in the form y = mx for lines going through the origin, recognizing that m represents the slope of the line. Students write equations in the
form y = mx + b for lines not passing through the origin, recognizing that m represents the slope and b represents the y-intercept.
Common Misconceptions/Challenges
Students want to write the equations as y=x+m or y = y + m instead of y = mx. Students think that a constant rate of change is always positive. Students confuse x and y directions on the coordinate plane. Students struggle identifying independent and dependent variables.
Students struggle graphing non-•‐integer, rational number on a coordinate grid.
Students struggle more with graphing integer numbers as slope on a coordinate plane because they do not recognize 3 as 3/1 so graph it horizontally 3 or vertically 3.

Groveport Madison Local Schools Department of Curriculum and Instruction 2018
Criteria for Success (Performance Level Descriptors)
- Limited: Graph proportional relationships, interpreting the unit rate as the slope (8.EE.5); Determine the slope of a line given a graph (8.EE.5).
- Basic: Graph proportional relationships, interpreting the unit rate as the slope and compare two different proportional relationships
using the same representation (8.EE.5).
- Proficient: Graph proportional relationships, interpreting the unit rate as the slope and compare two different proportional relationships using
different representations (8.EE.5).
- Accelerated: Apply understanding of slope to solve routine problems graphically and algebraically (8.EE.5/6).
- Advanced: Apply understanding of slope to solve non-routine problems graphically and algebraically (8.EE.5/6).
Prior Knowledge Future Learning
Students have computed unit rates associated with ratios of fractions, including ratios of lengths, areas and other quantities measured in like or different units. For example, if a person walks 1/2 mile in each 1/4 hour, compute the unit rate as the complex fraction 1/2/1/4 miles per hour, equivalently 2 miles per hour. (7.RP.1)
Students will extend their understanding of proportional relationships, rate of change, and their representations to non- •‐ proportional linear relationships that
have initial values.
Students will extend knowledge on rates of change and initial values to compare functions.
Students have recognized and represented proportional relationships between quantities. (7.RP.1)
Students recognize and represent proportional relationships between quantities. (7.RP.2)
Career Connections
There are many, many jobs that require the understanding of how to solve equations. Among these are: statisticians, accountants, construction managers, engineers, architects, computer programmers, surveyors, financial manager, funeral directors, real estate agents, farmers, medical assistants, nurses, correctional officers, human resources, judges, doctors, etc.

Groveport Madison Local Schools Department of Curriculum and Instruction 2018
Ohio’s Learning Standards- Clear Learning Targets
Math, Grade 8
8.EE.7 Solve equations in one variable.
8.EE.7 Students will give examples of linear equations in one variable with one solution, infinitely many solutions, or no solutions.
Show which of these possibilities is the case by successively transforming the given equation into simpler forms, until an equivalent equation of the form x = a, a = a, or a = b results (where a and b are different numbers).
Students will solve linear equations with rational number coefficients, including equations whose solutions require expanding expressions using the distributive property and collecting like terms.
Essential Understanding
Students need to understand that solving equations is simply using inverse operations to undo a series of operations.
Students need to understand that the procedures we use for solving equations is essential for solving more complex equations even though it may seem unnecessary or even overkill for simple equations.
Students can show/check solutions to
equations graphically by graphing both
sides.
Students can solve literal equations for a
specific variable.
Vocabulary
• inverse operation
• distributive property/distribute
• variable
• constant
• one-•‐variable equation
• ‐infinite solutions
• no solution
• like terms
• solution
• solve
• combine like terms
• properties of equality
Essential Skills
• I can solve equations in one variable with variables on both sides of the equation.
• I can give examples of linear equations in one variable with one solution.
• I can give examples of linear equations in one variable with infinitely many solutions.
• I can give examples of linear equations in one variable with no solution.
• I can show how to transform given equations into simpler forms, until the result is an equivalent equation of the form x=a, a=a, or a=b.
• I can solve linear equations with rational number coefficients.
• I can solve equations whose solutions require expanding expressions using the distributive property and/or collecting like terms.

Groveport Madison Local Schools Department of Curriculum and Instruction 2018
Instructional Methods
8.EE.7
In Grade 6, students applied the properties of operations to generate equivalent expressions, and identified when two expressions are equivalent. This cluster extends understanding to the process of solving equations and to their solutions, building on the fact that solutions maintain equality, and that equations may have
only one solution, many solutions, or no solution at all. Equations with many solutions may be as simple as 3𝑥 = 3𝑥, 3𝑥 + 5 = 𝑥 + 2 + 𝑥 + 𝑥 + 3, 𝑜𝑟 (6 + 4) where
both sides of the equation are equivalent once each side is simplified.
Students solve one-variable equations with the variables being on both sides of the equals sign. Students recognize that the solution to the equation is the value(s) of the variable, which make a true equality when substituted back into the equation. Equations shall include rational numbers, distributive property and combining like terms. Equations have one solution when the variables do not cancel out. For example, 10x – 23 = 29 – 3x can be solved to x = 4. This means that when the value of x is 4, both sides will be equal. If each side of the equation were treated as a linear equation and graphed, the solution of the equation represents the coordinates of the point where the two lines would intersect. In this example, the ordered pair would be (4, 17):
Equations having no solution have variables that will cancel out and constants that are not equal. This means that there is not a value that can be substituted for x that will make the sides equal. For example, the equation -x + 7 – 6x = 19 – 7x, can be simplified to -7x + 7 = 19 – 7x. If 7x is added to each side, the resulting equation is 7 = 19, which is not true. No matter what value is substituted for x the final result will be 7 = 19. If each side of the equation were treated as a linear equation and graphed, the lines would be parallel.
An equation with infinitely many solutions occurs when both sides of the equation are the same. Any value of x will produce a valid equation. For example, the following equation, when simplified will give the same values on both sides.
If each side of the equation were treated as a linear equation and graphed, the graph would be the same line. As students transform linear equations in one variable into simpler forms, they discover the equations can have one solution, infinitely many solutions, or no solutions. W hen the equation has one solution, the variable has one value that makes the equation true as in 12-4y=16. The only value for y that makes this equation true is -1. When the equation has infinitely many solutions, the equation is true for all real numbers as in 7x + 14 = 7 (x+2). As this equation is simplified, the variable terms cancel leaving 14 = 14 or 0 = 0. Since the expressions are equivalent, the value for the two sides of the equation will be the same regardless which real number is used for the substitution

Groveport Madison Local Schools Department of Curriculum and Instruction 2018
For each linear equation in this table, indicate whether the equation has no solution, one solution, or infinitely many solutions.
Solution: 1. One solution. This is designed to be an easy equation to solve to help students enter the problem. Answering this question correctly demonstrates minimal understanding. 2. No solution. Students may think there is no difference between adding 15 on the left-hand side and subtracting 15 on the right-hand side. 3. One solution. Students may think there are infinitely many solutions because the left-hand side is the negative of the right-hand side.
Three students solved the equation 3(5x – 14) = 18 in different ways, but each student arrived at the correct answer. Select all of the solutions that show a correct method for solving the equation.
Groveport Madison Local Schools Department of Curriculum and Instruction 2018
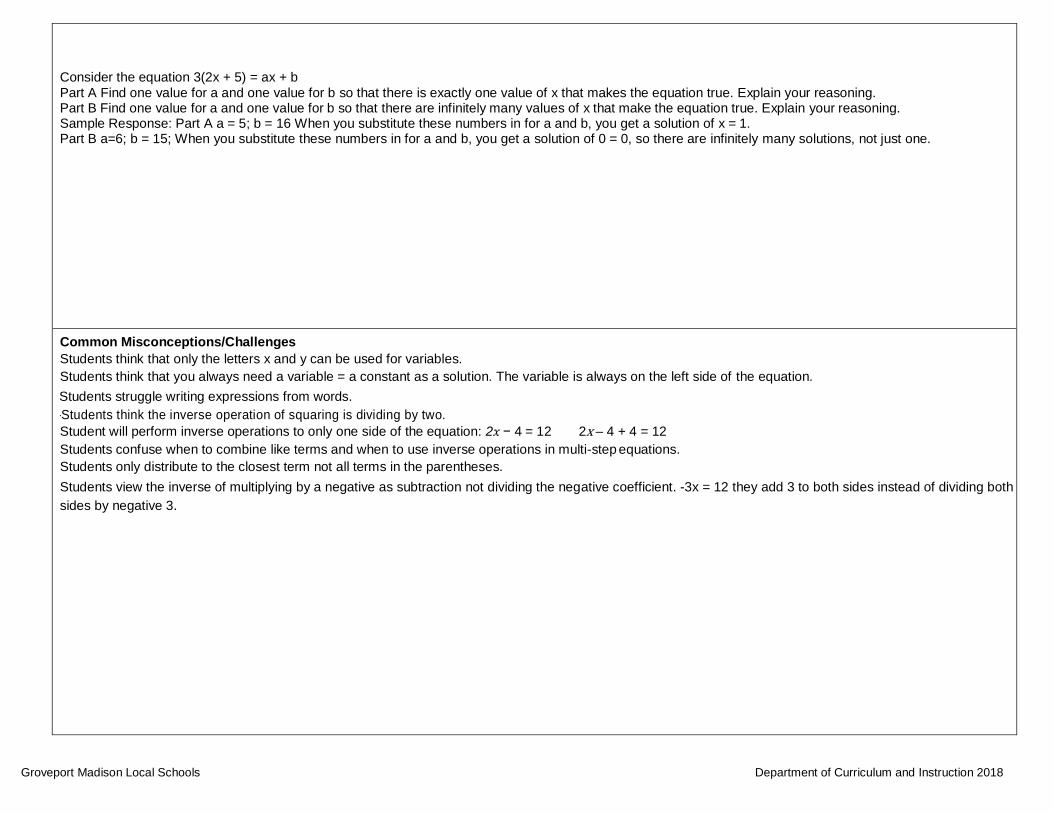
Consider the equation 3(2x + 5) = ax + b
Part A Find one value for a and one value for b so that there is exactly one value of x that makes the equation true. Explain your reasoning. Part B Find one value for a and one value for b so that there are infinitely many values of x that make the equation true. Explain your reasoning. Sample Response: Part A a = 5; b = 16 When you substitute these numbers in for a and b, you get a solution of x = 1. Part B a=6; b = 15; When you substitute these numbers in for a and b, you get a solution of 0 = 0, so there are infinitely many solutions, not just one.
Common Misconceptions/Challenges
Students think that only the letters x and y can be used for variables.
Students think that you always need a variable = a constant as a solution. The variable is always on the left side of the equation.
Students struggle writing expressions from words.
-Students think the inverse operation of squaring is dividing by two.
Student will perform inverse operations to only one side of the equation: 2𝑥 − 4 = 12 2x – 4 + 4 = 12
Students confuse when to combine like terms and when to use inverse operations in multi-step equations.
Students only distribute to the closest term not all terms in the parentheses.
Students view the inverse of multiplying by a negative as subtraction not dividing the negative coefficient. -3x = 12 they add 3 to both sides instead of dividing both
sides by negative 3.

Groveport Madison Local Schools Department of Curriculum and Instruction 2018
Criteria for Success (Performance Level Descriptors)
- Limited: Solve straightforward one or two step linear equations with integer coefficients.
- Basic: Solve straightforward multi-step linear equations with rational coefficients.
- Proficient: Solve routine multi-step linear equations with rational coefficients and variables on both sides and provide examples of equations
that have one solution, infinitely many solutions, or no solutions.
- Accelerated: Strategically choose and use procedures to solve linear equations in one variable; Justify why an equation has one solution,
infinitely many solutions, or no solution.
- Advanced: Strategically and efficiently use linear equations and systems of linear equations to represent, analyze and solve a variety of
problems.
Prior Knowledge
Students can apply properties of operations as strategies to add, subtract, factor, and expand linear expressions with rational coefficients. (7.EE.1)
Students can understand that rewriting an expression in different forms in a problem context can shed light on the problem and how the quantities in it are related. For example, a + 0.05a = 1.05a means that “increase by 5%” is
the same as “multiply by 1.05.” (7.EE.2)
Student can solve multi-•‐step real-•‐life and mathematical problems posed with positive and negative rational numbers in any form (whole numbers, fractions, and decimals), using tools strategically. (7.EE.3)
Students can use variables to represent quantities in a real-•‐world or
mathematical problem, and construct simple equations and inequalities to solve problems by reasoning about the quantities. (7.EE.4)
Future Learning
Students will solve two-•‐variable equations.
Students will solve multi-variable equations by isolating one variable
Career Connections
There are many, many jobs that require the understanding of how to solve equations. Among these are: statisticians, accountants, construction managers, engineers, architects, computer programmers, surveyors, financial manager, funeral directors, real estate agents, farmers, medical assistants, nurses, correctional officers, human resources, judges, doctors, etc.

Groveport Madison Local Schools Department of Curriculum and Instruction 2018
Ohio’s Learning Standards- Clear Learning Targets
Math, Grade 8
Essential Understanding Vocabulary
• System of equations
• Solution
• Linear equation
• Approximate
• Graphically
• Infinite solutions
• No solution • parallel lines
• coincident lines
• point of intersection
8.EE.8 Analyze and Solve Pairs of Simultaneous Linear Equations
8.EE.8 a. Understand that the solution to a pair of linear equations in two
variables correspond to point(s) of intersection of their graphs, because
point(s) of intersection satisfy both equations simultaneously.
Solutions to systems of equations satisfy both equations.
Graphically, solutions to systems of equations are points of intersection.
Know how to use graphs and to estimate and solve systems of linear equations.
b. Use graphs to find or estimate the solution to a pair of two simultaneous linear equations in two variables. Equations should include all three solution types: one solution, no solution, and infinitely many solutions. Solve simple cases by inspection. For example, 3x + 2y = 5 and 3x + 2y = 6 have no solution because 3x + 2y cannot simultaneously be 5 and 6.
c. Solve real-•‐world and mathematical problems leading to two linear
equations in two variables. For example, given coordinates for two pairs
of points, determine whether the line through the first pair of points
intersects the line through the second pair. (Limit solutions to those that
can be addressed by graphing.)
Essential Skills
• I can identify the solution(s) to a system of two linear equations in two variables as the point(s) of intersection of their graphs.
• I can describe the point(s) of intersection between two lines as the point(s) that satisfy both equations simultaneously.
• I can solve a system of two equations (linear) in two unknowns by graphing.
• I can use graphs to find or estimate the solution to a pair of two simultaneous linear equations in two variables.
• I can identify cases in which a system of two equations in two unknowns has no solution and does not intersect on a graph.
• I can identify cases in which a system of two equations in two unknowns has an infinite number of solutions (same equation).
• I can estimate the solution to a pair of two simultaneous linear equations in two variables
• Solve simple cases of systems of two linear equations with two variables by inspection.
• I can solve real-world problems leading to two linear equations in two variables.

Groveport Madison Local Schools Department of Curriculum and Instruction 2018
Instructional Methods
8. EE.8
• This cluster builds on the informal understanding of slope from graphing unit rates in Grade 6 and graphing proportional relationships in Grade 7 with a stronger, more formal understanding of slope.
• It extends solving equations to understanding solving systems of equations, or a set of two or more linear equations that contain one or both of the same two variables. Once again the focus is on a solution to the system. Most student experiences should be with numerical and graphical representations of solutions.
• Beginning work should involve systems of equations with solutions that are ordered pairs of integers, making it easier to locate the point of intersection, simplify the computation and hone in on finding a solution. More complex systems can be investigated and solve by using graphing technology.
• Contextual situations relevant to eighth graders will add meaning to the solution to a system of equations. Students should explore many problems for which they must write and graph pairs of equations leading to the generalization that finding one point of intersection is the single solution to the system of equations. Provide opportunities for students to connect the solutions to an equation of a line, or solution to a system of equations, by graphing, using a table and writing an equation.
• Students should receive opportunities to compare equations and systems of equations, investigate using graphing calculators or graphing utilities, explain differences verbally and in writing, and use models such as equation balances.
Problems such as, “Determine the number of movies downloaded in a month that would make the costs for two sites the same, when Site A charges $6 per month and $1.25 for each movie and Site B charges $2 for each movie and no monthly fee.”
Students write the equations letting y = the total charge and x = the number of movies.
Site A: y = 1.25x + 6 Site B: y = 2x
• Students graph the solutions for each of the equations by finding ordered pairs that are solutions and representing them in a t-chart. Discussion should encompass the realization that the intersection is an ordered pair that satisfies both equations. And finally students should relate the solution to the context of the problem, commenting on the practicality of their solution.
• Problems should be structured so that students also experience equations that represent parallel lines and equations that are equivalent. This will help them to begin to understand the relationships between different pairs of equations: When the slope of the two lines is the same, the equations are either different equations representing the same line (thus resulting in many solutions), or the equations are different equations representing two not intersecting, parallel, lines that do not have common solutions.
• Provide opportunities for students to change forms of equations (from a given form to slope- intercept form) in order to compare equations.
Examples:

Groveport Madison Local Schools Department of Curriculum and Instruction 2018
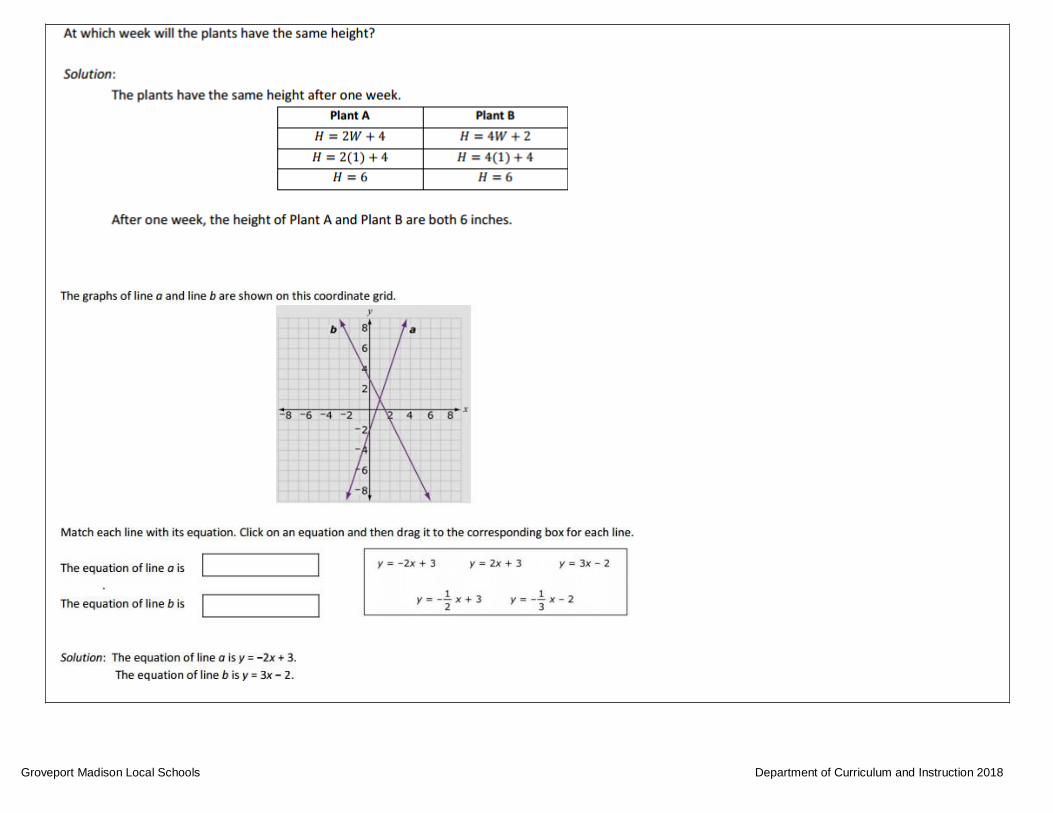
Plant A and Plant B are on different watering schedules. This affects their rate of growth. Compare the growth of the two plants to determine when their heights will be the same.
Groveport Madison Local Schools Department of Curriculum and Instruction 2018
Groveport Madison Local Schools Department of Curriculum and Instruction 2018
Common Misconceptions / Challenges
Students think that only the letters x and y can be used for variables.
Students think that you always need a variable = a constant as a solution.
The variable is always on the left side of the equation.
Equations are not always in the slope intercept form, y=mx+b
Students confuse one-variable and two-variable equations.
Criteria for Success (Performance Level Descriptors)
- Limited: N/A
- Basic: Solve a system of simple linear equations by inspection and graphically.
- Proficient: Solve a system of linear equations algebraically.
- Accelerated: Use linear equations and systems of linear equations to represent, analyze and solve a variety of problems.
- Advanced: N/A

Groveport Madison Local Schools Department of Curriculum and Instruction 2018
Prior Knowledge
Students should have a good understanding solving basic equations (6.EE.6).
Future Learning
Students will solve more difficult systems: more than two linear, linear and exponential, linear and quadratic, quadratic and quadratic.
Students will solve systems of equations using substitution and elimination methods. Students will solve systems of linear inequalities and absolute value equations. (Algebra A.REI.5-12)
Career Connections
There are many, many jobs that require the understanding of how to solve equations. Among these are: statisticians, accountants, construction managers,
engineers, architects, computer programmers, surveyors, financial manager, funeral directors, real estate agents, farmers, medical assistants, nurses, correctional officers, human resources, judges, doctors, etc.

Groveport Madison Local Schools Department of Curriculum and Instruction 2018
Ohio’s Learning Standards- Clear Learning Targets
Math, Grade 8
The Concept of a Function
8.F.1
Students will understand that a function is a rule that assigns to each input exactly one output. The graph of a function is the set of ordered pairs consisting of an input and the corresponding output.
Essential Understanding
It is important for students to be able to recognize and describe relations as functions by understanding the definition of a function and its precise language.
It is important for students to understand the importance of functions as tools used for prediction, and, conversely, how non-•‐functional relationships would be lousy predictors.
Vocabulary
• functions
• output
• input
• x-value
• y-value
• domain
• range
• element/member
• set
• corresponding
• independent variable
• dependent variable
• relation
• function rule
• vertical line test
Essential Skills
• I can define a function
• I can identify cases in which a system of two equations with two unknowns has no solution.
• I can identify cases in which a system of two equations with two unknowns has an infinite number of solutions.
• I can solve a system of two equations (linear) with two unknowns algebraically.
• I can determine if an equation represents a function.
• I can apply a function rule for any input that produces exactly one output.
• I can generate a set of ordered pairs from a function and graph the function.

Groveport Madison Local Schools Department of Curriculum and Instruction 2018
Instructional Methods
8.F.1
• In grade 6, students plotted points in all four quadrants of the coordinate plane. They also represented and analyzed quantitative relationships between dependent and independent variables. In Grade 7, students decided whether two quantities are in a proportional relationship.
• In Grade 8, students begin to call relationships functions when each input is assigned to exactly one output. Also, in Grade 8, students learn that proportional relationships are part of a broader group of linear functions, and they are able to identify whether a relationship is linear. Nonlinear functions are included for comparison. Later, in high school, students use function notation and are able to identify types of nonlinear functions.
To determine whether a relationship is a function, students should be expected to reason from a context, a graph, or a table, after first being clear which quantity is considered the input and which is the output. When a relationship is not a function, students should produce a counterexample: an “input value” with at least two “output values.” If the relationship is a function, the students should explain how they verified that for each input there was exactly one output. The “vertical line test” should be avoided because
• (1) it is too easy to apply without thinking,
• (2) students do not need an efficient strategy at this point, and
• (3) it creates misconceptions for later mathematics, when it is useful to think of functions more broadly, such as whether x might be a function of y.
Notice that the standards explicitly call for exploring functions numerically, graphically, verbally, and algebraically (symbolically, with letters). This is sometimes called the “rule of four.” For fluency and flexibility in thinking, students need experiences translating among these.
• In Grade 8, the focus is on linear functions, and students begin to recognize a linear function from its form y = mx + b. Students also need experiences with nonlinear functions, including functions given by graphs, tables, or verbal descriptions but for which there is no formula for the rule, such as a girl‘s height as a function of her age.
When plotting points and drawing graphs, students should develop the habit of determining, based upon the context, whether it is reasonable to “connect the dots” on the graph. In some contexts, the inputs are discrete, and connecting the dots can be misleading.
• For example, if a function is used to model the height of a stack of n paper cups, it does not make sense to have 2.3 cups, and thus there will be no ordered pairs between n = 2 and n = 3.
Examples: Students distinguish between functions and non-functions, using equations, graphs, and tables. Non- functions occur when there is more than one y-value is associated with any x-value.
For example, the rule that takes x as input and gives 𝑥 2 +
5𝑥 + 4 as output is a function. Using y to stand for the output
we can represent this function with the equation 𝑦 = 𝑥 2 + 5𝑥 + 4, and the graph of the equation is the graph of the function. Students are not yet expected use function notation such as 𝑓(𝑥) = 𝑥 2 + 5𝑥 + 4

Groveport Madison Local Schools Department of Curriculum and Instruction 2018
Common Misconceptions/Challenges
Some students will mistakenly think of a straight line as horizontal or vertical only.
Students may mistakenly believe that a slope of zero is the same as “no slope” and then confuse a horizontal line (slope of zero) with a vertical line (undefined slope).
Students confuse the meaning of “domain” and “range” of a function.
Some students will mix up x- and y-axes on the coordinate plane, or mix up the ordered pairs. When emphasizing that the first value is plotted on the horizontal axes (usually x, with positive to the right) and the second is the vertical axis (usually called y, with positive up), point out that this is merely a convention: It could have been otherwise, but it is very useful for people to agree on a standard customary practice.
Criteria for Success (Performance Level Descriptors)
- Limited: Identify whether a relation is a function from a graph or a mapping.
- Basic: Given tables of ordered pairs, determine if the relation is a function.
- Proficient: Complete a table to show a relation that is or is not a function.
- Accelerated: N/A
- Advanced: N/A
Prior Knowledge
Students understand relationships between two sets (5.OA.3) Students know how to create and analyze table and graphs. (6.EE.9)
Future Learning
Students will identify linear and non-•‐linear functions.
Students will study quadratic, other order polynomial, exponential, logarithmic, and other functions.
Students will use function notation to express the output.
Career Connections
Many careers/jobs use functions in their daily operations. Often these functions are programs that are used to predict certain events, and the inner-•‐workings of the function are not well understood. However, there are still many careers whose sole duty is to create functions (often synonymous with algorithms). These careers would be actuarial scientists, financial analysts, other business careers, or managers of baseball teams.

Groveport Madison Local Schools Department of Curriculum and Instruction 2018
Ohio’s Learning Standards – Clear Learning Targets
Math, Grade 8
Linear Functions
8.F.2-5 Essential Understanding
Linear functions can be writing in the
form y = mx +b where m is the rate of
change and b is the initial value.
Rate of change is the slope of a line on a
graph, the coefficient in the equation y =
mx + b. and the unit rate of a table of
values.
Initial value is the y-•‐intercept of a line
on a graph, the constant term in the
equation y = mx + b, and the y- •‐value
corresponding to x = 0.
Vocabulary
• Rate of change
• Initial value
• Slope
• Y-intercept
• Linear function
• Compare
• Contrast
• Analyze
• Representation
8.F.2 Compare properties of two functions each represented in a different way
(algebraically, graphically, numerically in tables, or by verbal descriptions). For
example, given a linear function represented by a table of values and a linear
function represented by an algebraic expression, determine which function has
the greater rate of change.
8.F.3 Interpret the equation y = mx + b as defining a linear function, whose graph
is a straight line; give examples of functions that are not linear. For example, the
function A = s2 giving the area of a square as a function of its side length is not
linear because its graph contains the points (1,1), (2,4) and (3,9), which are not
on a straight line. Use functions to model relationships between quantities.
8.F.4 Construct a function to model a linear relationship between two quantities.
Determine the rate of change and initial value of the function from a description
of a relationship or from two (x, y) values, including reading these from a table
or from a graph. Interpret the rate of change and initial value of a linear function
in terms of the situation it models, and in terms of its graph or a table of values.
8.F.5 Describe qualitatively the functional relationship between two quantities by
analyzing a graph (e.g., where the function is increasing or decreasing, linear or
nonlinear). Sketch a graph that exhibits the qualitative features of a function that
has been described verbally.
Essential Skills
• I can compare properties of two functions each represented in a different way (algebraically, graphically, numerically in tables, or by verbal descriptions).
• I can interpret the equation y=mx+b is the equation of a function whose graph is a straight line where m is the slope and b is the y-•‐ intercept
• I can provide examples of nonlinear functions using multiple representations (tables, graphs, and equations).
• I can compare the characteristics of linear and nonlinear functions using various representations.
• I can determine the rate of change (slope) and initial value (y-•‐intercept) from two (x,y) values, a verbal description, values in a table, or
graph.
• I can construct a function to model a linear relationship between two quantities.
• I can relate the rate of change and initial value to real world quantities in a linear function in terms of the situation modeled and in terms of its graph or a table of values.
• I can describe qualitatively the functional relationship between two quantities by analyzing a graph.

Groveport Madison Local Schools Department of Curriculum and Instruction 2018
Instructional Methods
8.F.1
Students compare two functions from different representations.
Example: Compare the following functions to determine which has the greater rate of change.
Function 1: y = 2x + 4
Function 2:
Groveport Madison Local Schools Department of Curriculum and Instruction 2018
8.F.3
Students use equations, graphs and tables to categorize functions as linear or non-linear. Students recognize that points on a straight line will have the
same rate of change between any two of the points.
Examples:
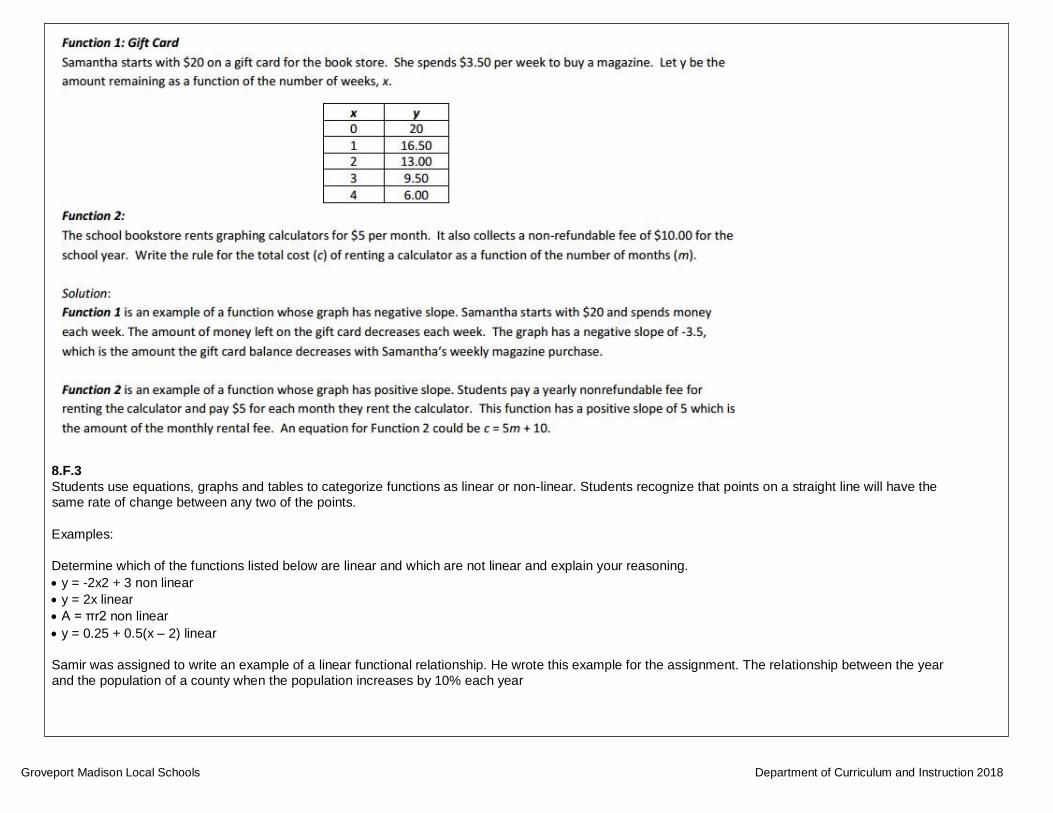
Determine which of the functions listed below are linear and which are not linear and explain your reasoning.
• y = -2x2 + 3 non linear
• y = 2x linear
• A = πr2 non linear
• y = 0.25 + 0.5(x – 2) linear
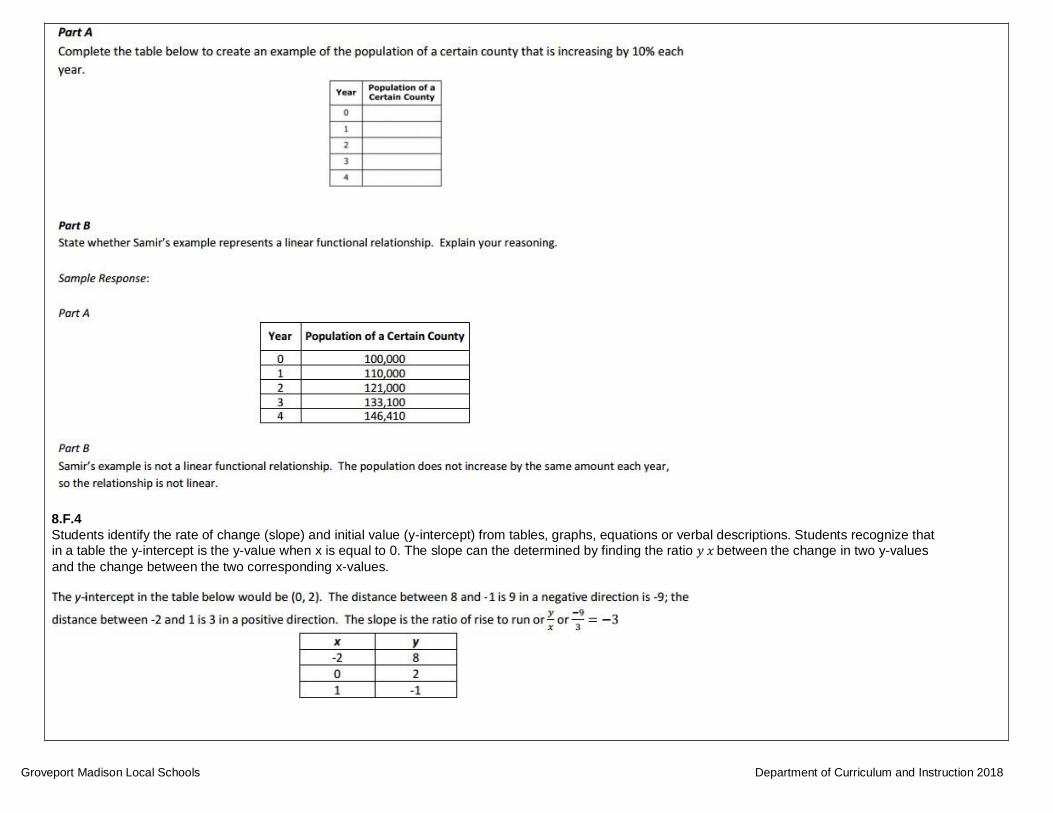
Samir was assigned to write an example of a linear functional relationship. He wrote this example for the assignment. The relationship between the year
and the population of a county when the population increases by 10% each year
Groveport Madison Local Schools Department of Curriculum and Instruction 2018
8.F.4
Students identify the rate of change (slope) and initial value (y-intercept) from tables, graphs, equations or verbal descriptions. Students recognize that
in a table the y-intercept is the y-value when x is equal to 0. The slope can the determined by finding the ratio 𝑦 𝑥 between the change in two y-values
and the change between the two corresponding x-values.

Groveport Madison Local Schools Department of Curriculum and Instruction 2018
Using graphs, students identify the y-intercept as the point where the line crosses the y-axis and the slope as the rise, run.
• In a linear equation the coefficient of x is the slope and the constant is the y-intercept. Students need to be given the equations in formats other
than y = mx + b, such as y = ax + b (format from graphing calculator), y = b + mx (often the format from contextual situations), etc. Note that
point-slope form and standard forms are not expectations at this level.
• In contextual situations, the y-intercept is generally the starting value or the value in the situation when the independent variable is 0. The slope
is the rate of change that occurs in the problem. Rates of change can often occur over years. In these situations it is helpful for the years to be
“converted” to 0, 1, 2, etc. For example, the years of 1960, 1970, and 1980 could be represented as 0 (for 1960), 10 (for 1970) and 20 (for
1980).
Students use the slope and y-intercepts to write a linear function in the form y = mx +b. Situations may be given as a verbal description, two ordered
pairs, a table, a graph, or rate of change and another point on the line. Students interpret slope and y-intercept in the context of the given situation.
Example:
The table below shows the cost of renting a car. The company charges $45 a day for the car as well as charging a onetime $25 fee for the car‘s
navigation system (GPS). Write an expression for the cost in dollars, c, as a function of the number of days, d. Students might write the equation c = 45d + 25 using the verbal description or by first making a table.
Students should recognize that the rate of change is 45 (the cost of renting the car) and that initial cost (the first day charge) also includes paying for the
navigation system. Classroom discussion about one time fees vs. recurrent fees will help students model contextual situations.
When scuba divers come back to the surface of the water, they need to be careful not to ascend too quickly. Divers should not come to the surface more
quickly than a rate of 0.75 ft per second. If the divers start at a depth of 100 feet, the equation d = 0.75t – 100 shows the relationship between the time of
the ascent in seconds (t) and the distance from the surface in feet (d).
Will they be at the surface in 5 minutes? How long will it take the divers to surface from their dive?
Make a table of values showing several times and the corresponding distance of the divers from the surface. Explain what your table shows. How do the
values in the table relate to your equation?
You work for a video streaming company that has two plans to choose from:
Plan 1: A flat rate of $7 per month plus $2.50 per video viewed
Plan 2: $4 per video viewed
a. What type of function models this situation? Explain how you know.
b. Define variables that make sense in the context and write an equation representing a function that describes each plan.
c. How much would 3 videos in a month cost for each plan? 5 videos?
d. Compare the two plans and explain what advice you would give to a customer trying to decide which plan is best for them, based on their viewing
habits.

Groveport Madison Local Schools Department of Curriculum and Instruction 2018
Sample Response:
8.F.5
Given a verbal description of a situation, students sketch a graph to model that situation. Given a graph of a situation, students provide a verbal description of the situation. Students learn that graphs tell stories and have to be interpreted by carefully thinking about the quantities shown.
Examples:
The graph below shows a student‘s trip to school. This student walks to his friend‘s house and, together, they ride a bus to school. The bus stops once before arriving at school.
Describe how each part A-E of the graph relates to the story.

Groveport Madison Local Schools Department of Curriculum and Instruction 2018
Below are two graphs that look the same. Note from the axis labels that the first graph shows the velocity of a car as a function of time and the second
graph shows the distance of the car from home as a function of time. Describe what someone who observes the car’s movement would see in each
case.
Sample Responses:
For a velocity function, output values tell us how fast the car is moving. For the distance function, output values tell us how far from home the car is.
Since we don’t have scales on either axis, we can’t talk about specific values of time, velocity and distance, but we can make qualitative statements
about velocity and distance.
Velocity Graph: The car starts at rest and speeds up at a constant rate. When the graph becomes a horizontal line, the car is maintaining its speed for a
while before speeding up for a short time and then quickly slowing down until it comes to a complete stop. It stays stationary for a little while where the
graph is on the horizontal axis. Then the car speeds up, goes at a constant speed for a while and then slows down and comes to a complete stop.
Distance Graph: The car starts its trip at home. It moves away from home at a constant speed. When the graph is horizontal, the car's distance from
home is not changing, which probably means it has come to a stop for awhile. Then the car moves farther away from home before turning around and
coming back home. After staying at home for a time, the car moves away from home at a constant speed. It comes to a stop for a while* before coming
back home.
Carla rode her bike to her grandmother’s house. The following information describes her trip:
• For the first 5 minutes, Carla rode fast and then slowed down. She rode 1 mile.
• For the next 15 minutes, Carla rode at a steady pace until she arrived at her grandmother’s
house. She rode 3 miles.
• For the next 10 minutes, Carla visited her grandmother.
• For the next 5 minutes, Carla rode slowly at first but then began to ride faster. She rode 1
mile.
• For the last 10 minutes, Carla rode fast. She rode 3 miles at a steady pace. Graph each part
of Carla’s trip.
Graph Carla’s trip.

Groveport Madison Local Schools Department of Curriculum and Instruction 2018
Common Misconceptions/Challenges
Students confuse “constant rate of change” and “constant term” of equations.
Equations are not always in the slope intercept form, y=mx+b. Students confuse one-variable and two-variable equations.
Students overlook tables that do not describe unit increases (the table could increase by fives)
Students struggle to conceptualize the structure of linear equations in slope-•‐intercept form and how it models the linear relationships.
Students may mistakenly believe that a slope of zero is the same as “no slope” and then confuse a horizontal line (slope of zero) with a vertical line (undefined slope).
Students often confuse the meaning of “domain” and “range” of a function.
Students often confuse a recursive rule with an explicit formula for a function. For example, after identifying that a linear function shows an increase of 2 in the values of the output for every change of 1 in the input, some students will represent the equation as y = x + 2 instead of realizing that this means y = 2x + b. When tables are constructed with increasing consecutive integers for input values, then the distinction between the recursive and explicit formulas is about whether you are reasoning vertically or horizontally in the table. Both types of reasoning—and both types of formulas—are important for developing proficiency with functions.
Some students may not pay attention to the scale on a graph, assuming that the scale units are always “one.”
When making axes for a graph, some students may not using equal intervals to create the scale.
Some students may infer a cause and effect between independent and dependent variables, but this is often not the case.
Some students graph incorrectly because they don‘t understand that x usually represents the independent variable and y represents the dependent variable.
Emphasize that this is a convention that makes it easier to communicate.
Criteria for Success (Performance Level Descriptors)
- Limited: Compare properties (i.e. slope, y-intercept, values) of two functions in a graph (8.F.2); Given a straightforward qualitative description of a functional relationship between two quantities, sketch a graph (8.F.5).
- Basic: Compare properties (i.e. slope, y-intercept, values) of two functions each represented in the same way (algebraically, graphically, or verbal
descriptions) (8.F.2).
- Proficient: Compare properties (i.e. slope, y-intercept, values) of two functions each represented in a different way (algebraically, graphically, numerically
in tables, or verbal descriptions) (8.F.2); Interpret the rate of change and initial value of a linear function in terms of the situation it models, and in terms of
its graph or a table of values (8.F.4).
- Accelerated: Justify whether two functions represented in different ways are equivalent or not by comparing their properties (8.F.2).
- Advanced: Explain why a function is linear or nonlinear (8.F.4); Interpret qualitative features of a function in a context (F.5); Strategically and efficiently choose different ways to represent functions in solving a variety of problems (8.F.4).

Groveport Madison Local Schools Department of Curriculum and Instruction 2018
Prior Knowledge
Students should have a very good understanding of unit rates and proportional relationships. (7.RP.1)
Future Learning
Students will study exponential functions which also have constant rates of changes and initial values.
Career Connections
Many jobs require you to know how to model and interpret linear functions as well as other functions: meteorologists, statisticians, financial investors, etc.
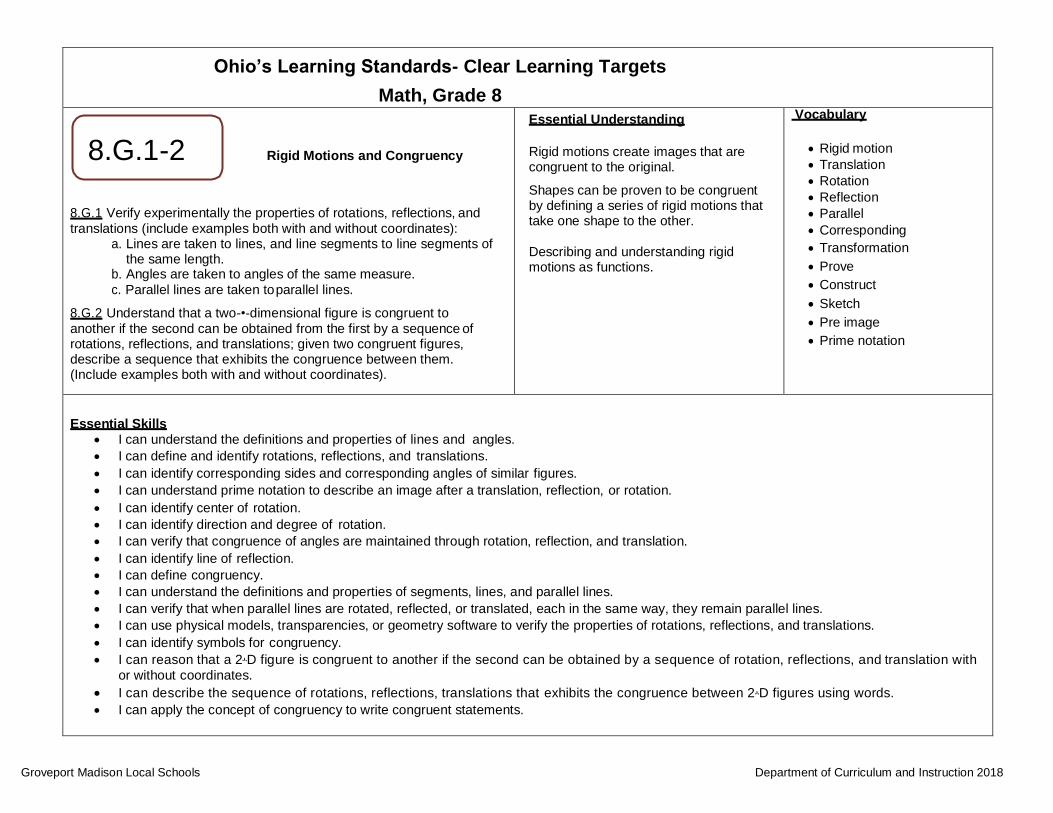
Groveport Madison Local Schools Department of Curriculum and Instruction 2018
Ohio’s Learning Standards- Clear Learning Targets
Math, Grade 8
8.G.1-2 Rigid Motions and Congruency
8.G.1 Verify experimentally the properties of rotations, reflections, and
translations (include examples both with and without coordinates): a. Lines are taken to lines, and line segments to line segments of
the same length. b. Angles are taken to angles of the same measure.
c. Parallel lines are taken to parallel lines.
8.G.2 Understand that a two-•‐dimensional figure is congruent to
another if the second can be obtained from the first by a sequence of rotations, reflections, and translations; given two congruent figures, describe a sequence that exhibits the congruence between them. (Include examples both with and without coordinates).
Essential Understanding
Rigid motions create images that are congruent to the original.
Shapes can be proven to be congruent by defining a series of rigid motions that take one shape to the other.
Describing and understanding rigid motions as functions.
Vocabulary
• Rigid motion
• Translation
• Rotation
• Reflection
• Parallel
• Corresponding
• Transformation
• Prove
• Construct
• Sketch
• Pre image
• Prime notation
Essential Skills
• I can understand the definitions and properties of lines and angles.
• I can define and identify rotations, reflections, and translations.
• I can identify corresponding sides and corresponding angles of similar figures.
• I can understand prime notation to describe an image after a translation, reflection, or rotation.
• I can identify center of rotation.
• I can identify direction and degree of rotation.
• I can verify that congruence of angles are maintained through rotation, reflection, and translation.
• I can identify line of reflection.
• I can define congruency.
• I can understand the definitions and properties of segments, lines, and parallel lines.
• I can verify that when parallel lines are rotated, reflected, or translated, each in the same way, they remain parallel lines.
• I can use physical models, transparencies, or geometry software to verify the properties of rotations, reflections, and translations.
• I can identify symbols for congruency.
• I can reason that a 2-•‐D figure is congruent to another if the second can be obtained by a sequence of rotation, reflections, and translation with
or without coordinates.
• I can describe the sequence of rotations, reflections, translations that exhibits the congruence between 2-•‐D figures using words.
• I can apply the concept of congruency to write congruent statements.

Groveport Madison Local Schools Department of Curriculum and Instruction 2018
Instructional Methods
Students create their own image in a quadrant on a grid. Then make a table values for the points. Write directions for completing 3 transformations. Draw new images and complete table for each transformation ordered pairs identifying patterns.
8.G.1
• In a translation, every point of the pre-image is moved the same distance and in the same direction to form the image.
• A reflection is the “flipping” of an object over a line, known as the “line of reflection”.
• A rotation is a transformation that is performed by “spinning” the figure around a fixed point known as the center of rotation. The figure may be rotated clockwise or counterclockwise.
• Students use compasses, protractors and rulers or technology to explore figures created from translations, reflections and rotations. Characteristics of figures, such as lengths of line segments, angle measures and parallel lines, are explored before the transformation (pre-image) and after the transformation (image).
• Students should be able to appropriately label figures, angles, lines, line segments, congruent parts, and images (primes or double primes) with or without coordinates.
• Students are expected to use logical thinking, expressed in words using correct terminology. They are NOT expected to use theorems, axioms, postulates or a formal format of proof as in two-column proofs.
Transformational geometry is about the effects of rigid motions, rotations, reflections and translations on figures. Initial work should be presented in such a way that students understand the concept of each type of transformation and the effects that each transformation has on an object before working within the coordinate system.
• For example, when reflecting over a line, each vertex is the same distance from the line as its corresponding vertex. This is easier to visualize when not using regular figures. Time should be allowed for students to cut out and trace the figures for each step in a series of transformations. Discussion should include the description of the relationship between the original figure and its image(s) in regards to their corresponding parts (length of sides and measure of angles) and the description of the movement, including the attributes of transformations (line of symmetry, distance to be moved, center of rotation, angle of rotation and the amount of dilation). The case of distance – preserving transformation leads to the idea of congruence.
It is these distance-preserving transformations that lead to the idea of congruence.
Work in the coordinate plane should involve the movement of various polygons by addition, subtraction and multiplied changes of the coordinates.
• For example, add 3 to x, subtract 4 from y, combinations of changes to x and y, multiply coordinates by 2 then by 1/2 . Students should observe and discuss such questions as “What happens to the polygon?” and “What does making the change to all vertices do?” Understandings should include generalizations about the changes that maintain size or maintain shape, as well as the changes that create distortions of the polygon (dilations).
• Example dilations should be analyzed by students to discover the movement from the origin and the subsequent change of edge lengths of the figures. Students should be asked to describe the transformations required to go from an original figure to a transformed figure (image).
• Provide opportunities for students to discuss the procedure used, whether different procedures can obtain the same results, and if there is a more efficient procedure to obtain the same results. Students need to learn to describe transformations with both words and numbers.

Groveport Madison Local Schools Department of Curriculum and Instruction 2018
Provide opportunities for students to physically manipulate figures to discover properties of similar and congruent figures, for example, the corresponding angles of similar figures are equal. Additionally use drawings of parallel lines cut by a transversal to investigate the relationship among the angles.
For example, what information can be obtained by cutting between the two intersections and sliding one onto the other?
By using three copies of the same triangle labeled and placed so that the three different angles form a straight line, students can:
• explore the relationships of the angles,
• learn the types of angles (interior, exterior, alternate interior, alternate exterior, corresponding, same side interior, same side exterior) • explore the parallel lines, triangles and parallelograms formed
Further examples can be explored to verify these relationships and demonstrate their relevance in real life.
8.G.2
Congruent figures have the same shape and size. Translations, reflections and rotations are examples of rigid transformations. A rigid transformation is one in which the pre-image and the image both have exactly the same size and shape since the measures of the corresponding angles and corresponding line segments remain equal (are congruent).
Students examine two figures to determine congruency by identifying the rigid transformation(s) that produced the figures. Students recognize the symbol for congruency (≅) and write statements of congruency.
Examples:
Is Figure A congruent to Figure A‘? Explain how you know.

Groveport Madison Local Schools Department of Curriculum and Instruction 2018
Describe the sequence of transformations that results in the transformation of Figure A to Figure A‘.
Trapezoid ABCD is shown on this coordinate grid. Translate trapezoid ABCD 6 units to the left and 5 units up and graph the image of ABCD on the grid.
Triangle ABC on this coordinate grid was created by joining points A (3, 2), B (4, 5), and C (7, 3) with line segments. Triangle ABC was reflected over the x-axis and then reflected over the y-axis to form the red triangle, where x, y, and z
represent the lengths of the sides of the red triangle.
Mark the appropriate boxes in the table to show which sides of the triangles have equal lengths.

Groveport Madison Local Schools Department of Curriculum and Instruction 2018
Common Misconceptions/Challenges
Students confuse the rules for transforming two-dimensional figures because they rely too heavily on rules as opposed to understanding what happens to figures as they translate, rotate, reflect, and dilate. It is important to have students describe the effects of each of the transformations on two-dimensional figures through the coordinates but also the visual transformations that result.
Students often confuse situations that require adding with multiplicative situations in regard to scale factor. Providing experiences with geometric figures and coordinate grids may help students visualize the different.
Students have difficulty differentiating between congruency and similarity. Assume any combination of three angles will form a congruence condition.
Students confuse terms such as clockwise and counter-clockwise. Think the line of reflection must be vertical or horizontal (e.g. across the y- axis or x-axis. Not realize that rotations are not always the origin, but can be about any point.
Criteria for Success (Performance Level Descriptors)
- Limited: Identify two congruent figures (8.G.2); Identify if two figures are related by a dilation, translation, rotation, or reflection (8.G.2).
- Basic: N/A
- Proficient: Describe a sequence of rigid transformations between two congruent figures (8.G.2).
- Accelerated: N/A
- Advanced: Justify why two figures are congruent and/or similar (8.G.2).
Prior Knowledge
Students should be able to solve problems involving scale drawings of geometric figures, including computing actual lengths and areas from a scale drawing and reproducing a scale drawing at a different scale. (7.G.1)
Future Learning
Students will notate and describe rigid motions as functions.
Career Connections
Many jobs require the understanding of rigid motions and congruency: architects, interior designers, and engineers, to name a few.

Groveport Madison Local Schools Department of Curriculum and Instruction 2018
Ohio’s Learning Standards- Clear Learning Targets
Math, Grade 8
8.G.3-4 Dilations and Similarity
8.G.3 Describe the effect of dilations, translations, rotations, and reflections on two-dimensional figures using coordinates.
8.G.4 Understand that a two-dimensional figure is similar to another if the
second can be obtained from the first by a sequence of rotations, reflections, translations, and dilations; given two similar two dimensional
figures, describe a sequence that exhibits the similarity between them. (Include examples both with and without coordinates).
Essential Understanding
Dilations create similar figures.
Similar figures have congruent corresponding angles.
Similar figures have corresponding sides of proportional length.
Figures can be proven to be similar if you
can map one object to another using a series of transformations (translations, rotations, reflections, dilations)
Describing and understanding transformations as functions
Vocabulary
• Dilate
• Center of dilation
• Similar figures
• Proportional
• Prove
• Sequence
• Scale factor
Essential Skills
• I can define dilations as a reduction or enlargement of a figure.
• I can identify scale factor of the dilation.
• I can describe the effects of dilations, translations, rotations, and reflections on 2- •‐ D figures using coordinates.
• I can define similar figures as corresponding angles are congruent and corresponding side lengths are proportional.
• I can recognize symbol for similar.
• I can reason that a 2-•‐D figure is similar to another if the second can be obtained by a sequence of rotations, reflections, translation or
dilation.
• I can describe the sequence of rotations, reflections, translations, or dilations that exhibits the similarity between 2-•‐D figures using
words and/or symbols.

Groveport Madison Local Schools Department of Curriculum and Instruction 2018
Instructional Methods
8.G.3
Students identify resulting coordinates from translations, reflections, and rotations (90°, 180°and 270° both clockwise and counterclockwise), recognizing the relationship between the coordinates and the transformation.
• For example, a translation of 5 left and 2 up would subtract 5 from the x-coordinate and add 2 to the y-coordinate. (−4, −3) → 𝐷′(−9, −1). A reflection
across the x-axis would change (6, −8) → 𝐵′(6,8).
Additionally, students recognize the relationship between the coordinates of the pre-image, the image and the scale factor following a dilation from the origin.
Dilations are non-rigid transformations that enlarge (scale factors greater than one) or reduce (scale factors less than one) the size of a figure using a scale factor.
• A dilation is a transformation that moves each point along a ray emanating from a fixed center, and multiplies distances from the center by a common scale factor. In dilated figures, the dilated figure is similar to its pre-image.
• A translation is a transformation of an object that moves the object so that every point of the object moves in the same direction as well as the same distance. In a translation, the translated object is congruent to its pre-image. ∆𝐴𝐵𝐶 has been translated 7 units to the right and 3 units up. To get from A
(1,5) to A’ (8,8), move A 7 units to the right (from x = 1 to x = 8) and 3 units up (from y = 5 to y = 8). Points B and C also move in the same direction (7 units to the right and 3 units up).
• A reflection is a transformation that flips an object across a line of reflection (in a coordinate grid the line of reflection
may be the x or y axis). In a rotation, the rotated object is congruent to its pre-image.
• A rotated figure is a figure that has been turned about a fixed point. This is called the center of rotation. A figure can be rotated up to 360˚. Rotated figures are congruent to their pre-image figures.

Groveport Madison Local Schools Department of Curriculum and Instruction 2018
Consider when ∆𝐷𝐸𝐹 is rotated 180˚ clockwise about the origin. The coordinates of ∆𝐷𝐸𝐹 are D(2,5), E(2,1), and F(8,1). When
rotated 180˚, ∆𝐷′𝐸′𝐹′ has new coordinates D’(-2,-5), E’(-2,-1) and F’(-8,-1). Each coordinate is the opposite of its pre-image.
8.G.4
This is the students’ introduction to similarity and similar figures. Students understand similar figures have angles with the same measure and sides that are
proportional. Similar figures are produced from dilations. Students describe the sequence that would produce similar figures, including the scale factors.
Students understand that a scale factor greater than one will produce an enlargement in the figure, while a scale factor less than one will produce a reduction in size.
Examples:
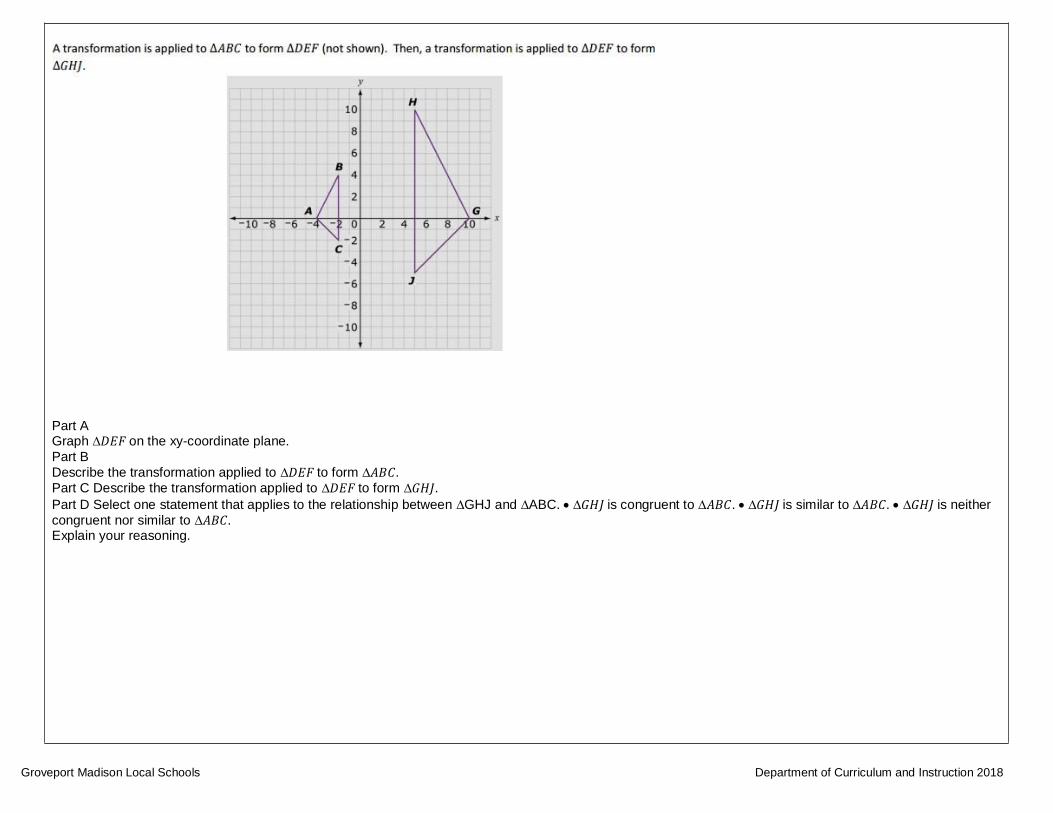
Groveport Madison Local Schools Department of Curriculum and Instruction 2018
Part A Graph ∆𝐷𝐸𝐹 on the xy-coordinate plane.
Part B
Describe the transformation applied to ∆𝐷𝐸𝐹 to form ∆𝐴𝐵𝐶.
Part C Describe the transformation applied to ∆𝐷𝐸𝐹 to form ∆𝐺𝐻𝐽. Part D Select one statement that applies to the relationship between ∆GHJ and ∆ABC. • ∆𝐺𝐻𝐽 is congruent to ∆𝐴𝐵𝐶. • ∆𝐺𝐻𝐽 is similar to ∆𝐴𝐵𝐶. • ∆𝐺𝐻𝐽 is neither
congruent nor similar to ∆𝐴𝐵𝐶. Explain your reasoning.
Groveport Madison Local Schools Department of Curriculum and Instruction 2018
Common Misconceptions/Challenges
Students struggle recognizing similar shapes that have different orientations.
Students struggle being rigorous in their proofs.
Congruent shapes are also similar shapes.
Students struggle making the figure smaller when the scale factor is a fraction. (reductions)
Completing more than one transformation at a time is a challenge.
Criteria for Success (Performance Level Descriptors)
- Limited: Create a single translation of a geometric figure (8.G.3); Identify if two figures are related by a dilation, translation, rotation, or reflection (8.G.4).
- Basic: Create an image of a geometric figure using a reflection over an axis and/or multiple translations (8.G.3); Create dilations of figures by a given
whole number scale factor (8.G.3).
- Proficient: Create and describe the effect of dilations, translations, rotations, and reflections on two-dimensional figures using coordinates and coordinate
notation (8.G.3); Recognize that dilation produces a similar figure (8.G.4).
- Accelerated: Explain why dilation produces a similar figure and that rigid transformations maintain angle measure and side lengths (8G.4).
- Advanced: Justify why two figures are congruent and/or similar (8G.4).
Prior Knowledge
Students can describe the two-dimensional figures that result from slicing three dimensional figures, as in plane sections of right rectangular prisms and right rectangular pyramids (7.G.3).
Students understand similarity as “same size but different shape”. Students understand rigid motions (8.G.1-2).
Future Learning
Students will understand dilations as functions.
Career Connections
Many jobs require you to understand dilations. Any job that adjusts sizes of objects work with dilations and similar figures.

Groveport Madison Local Schools Department of Curriculum and Instruction 2018
Ohio’s Learning Standards- Clear Learning Targets
Math, Grade 8
Essential Understanding Vocabulary
• Interior angles
• Exterior angles
• Alternate angles
• Adjacent angles
• Corresponding angles
• Vertical angles
• Prove
• Criterion
• Supplementary angles
• Complementary angles
Sum of a triangle’s interior angles is 180
Angles
8.G.5 degrees.
Sum of a triangle’s exterior angles is 360
degrees.
8.G.5 Use informal arguments to establish facts about the angle sum and exterior angle of triangles, about the angles created when parallel lines are cut by a transversal, and the angle-•‐angle criterion for similarity
Identify pairs of angles created by
parallel lines and transversals and their relationships to each other.
of triangles. For example, arrange three copies of the same triangle so Understand why two triangles are similar that the sum of the three angles appears to form a line, and give an if they share two pairs of congruent
argument in terms of transversals why this is so. angles.
Essential Skills
• I can define similar triangles
• I can define and identify transversals.
• I can identify angles created when a parallel line is cut by transversal (alternate interior, alternate exterior, corresponding, vertical,
supplementary, etc.).
• I can justify that the sum of the interior angles equals 180. (For example, arrange three copies of the same triangle so that the three angles appear to form a line).
• I can justify that the exterior angle of a triangle is equal to the sum of the two remote interior angles.
• I can use Angle-Angle Criterion to prove similarity among triangles. I can give an argument in terms of transversals why this is so.

Groveport Madison Local Schools Department of Curriculum and Instruction 2018
Instructional Methods
8.G.5 Students use exploration and deductive reasoning to determine relationships that exist between the following: a) angle sums and exterior angle sums of triangles, b) angles created when parallel lines are cut by a transversal, and c) the angle-angle criterion for similarity of triangle.
• Students construct various triangles and find the measures of the interior and exterior angles. Students make conjectures about the relationship between the measure of an exterior angle and the other two angles of a triangle. (the measure of an exterior angle of a triangle is equal to the sum of the measures of the other two interior angles) and the sum of the exterior angles (360º). Using these relationships, students use deductive reasoning to find the measure of missing angles.
• Students construct parallel lines and a transversal to examine the relationships between the created angles. Students recognize vertical angles, adjacent angles and supplementary angles from 7th grade and build on these relationships to identify other pairs of congruent angles. Using these relationships, students use deductive reasoning to find the measure of missing angles.
• Students construct various triangles having line segments of different lengths but with two corresponding congruent angles. Comparing ratios of sides will produce a constant scale factor, meaning the triangles are similar.
• Students can informally prove relationships with transversals.
Examples:

Groveport Madison Local Schools Department of Curriculum and Instruction 2018
Students can informally conclude that the sum of a triangle is 180º (the angle-sum theorem) by applying their understanding of lines and alternate interior angles. In the figure below, line x is parallel to line yz:
Angle a is 35° because it alternates with the angle inside the triangle that measures 35°. Angle c is 80° because it alternates with the angle inside the triangle that measures 80°. Because lines have a measure of 180°, and angles a + b + c form a straight line, then angle b must be 65° (180 – 35 + 80 = 65). Therefore, the sum of the angles of the triangle are 35° + 65° + 80°
Right triangle ABC and right triangle ACD overlap as shown below. Angle DAC measures 20º and angle BCA measures 30º.
What are the values of x and y?
Solution: x = 40 and y = 40 Students need to use the fact that the sum of the angles of a triangle is 180 degrees to find the correct values of x and y. Students may incorrectly assume that x + 20 must equal y + 30.
Students design a Geometric city map using vocabulary words to describe streets and intersection angles.

Groveport Madison Local Schools Department of Curriculum and Instruction 2018
Common Misconceptions / Challenges
Students often confuse the various names given to the pairs of angles created by transversals and parallel lines. Students need to understand why they are named what they are.
Criteria for Success (Performance Level Descriptors)
- Limited: Identify pairs of equivalent angles when parallel lines are cut by a transversal.
- Basic: N/A
- Proficient: Determine missing angle measures in triangles with exterior angles and/or angles formed by parallel lines cut by a transversal.
- Accelerated: Give an informal argument that a triangle can only have one 90 angle.
- Advanced: Solve a variety of real-world and mathematical problems involving the angles in triangles and those formed by when parallel lines are cut by a
transversal, and give informal arguments.
Prior Knowledge
Students know how to draw, construct and describe geometric figures and describe the relationship between. Students can use facts about supplementary, complementary, vertical, and adjacent angles in a multi- step problem to write and solve simple equations for an unknown angle in a figure. (7.G.5)
Future Learning
Students will do work with interior and exterior angles of other polygons.
Students will be proving triangles similar with criteria other than just the angle criterion.
Career Connections
Many jobs require you to understand angles and their relationships with other angles and lines. These careers work with a lot of measurements. Some of these careers would be: architects (landscape architects), engineers (aerospace, civil, etc.), contractors, construction jobs, etc.

Groveport Madison Local Schools Department of Curriculum and Instruction 2018
Ohio’s Learning Standards- Clear Learning Targets
Math, Grade 8
Pythagorean Theorem
8.G.6-8
8.G.6 Analyze and justify an informal proof the Pythagorean Theorem and its
converse.
8.G.7 Apply the Pythagorean Theorem to determine unknown side lengths in right triangles in real-world and mathematical problems in two
and three dimensions.
8.G.8 Apply the Pythagorean Theorem to find the distance between two points in a coordinate system.
Essential Understanding
The Pythagorean theorem is a specific relationship between the lengths of sides of a triangle.
It can be used to find missing length of sides of a right triangle and the distance between two points.
Vocabulary
• Right triangle
• Legs
• Hypotenuse
• Square root
• Theorem
• Converse
• Proof
Essential Skills
• I can identify the legs and hypotenuse of a right triangle.
• I can analyze an informal proof of the Pythagorean Theorem.
• I can justify an informal proof of the Pythagorean Theorem.
• I can analyze an informal proof of the converse of the Pythagorean Theorem
• I can justify an informal proof of the converse of the Pythagorean Theorem
• I can apply the Pythagorean Theorem and its converse to real world and mathematical problems (2 and 3 dimensional).
• I can solve basic mathematical Pythagorean Theorem problems and its converse to find missing lengths of sides of triangles in two-and three- dimensions.
• I can apply the Pythagorean Theorem and its converse and relate it to any two distinct points on a graph.
• I can use the Pythagorean Theorem to solve for the distance between the two points.
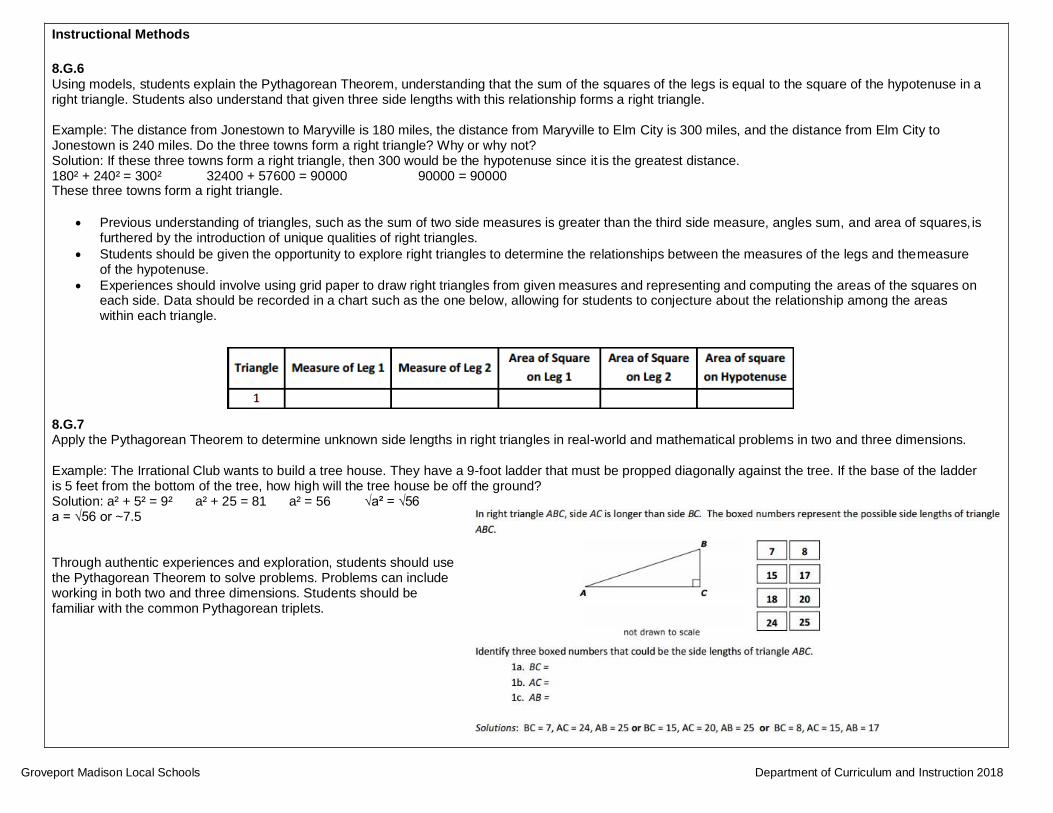
Groveport Madison Local Schools Department of Curriculum and Instruction 2018
Instructional Methods
8.G.6
Using models, students explain the Pythagorean Theorem, understanding that the sum of the squares of the legs is equal to the square of the hypotenuse in a right triangle. Students also understand that given three side lengths with this relationship forms a right triangle.
Example: The distance from Jonestown to Maryville is 180 miles, the distance from Maryville to Elm City is 300 miles, and the distance from Elm City to Jonestown is 240 miles. Do the three towns form a right triangle? Why or why not? Solution: If these three towns form a right triangle, then 300 would be the hypotenuse since it is the greatest distance. 180² + 240² = 300² 32400 + 57600 = 90000 90000 = 90000 These three towns form a right triangle.
• Previous understanding of triangles, such as the sum of two side measures is greater than the third side measure, angles sum, and area of squares, is furthered by the introduction of unique qualities of right triangles.
• Students should be given the opportunity to explore right triangles to determine the relationships between the measures of the legs and the measure of the hypotenuse.
• Experiences should involve using grid paper to draw right triangles from given measures and representing and computing the areas of the squares on each side. Data should be recorded in a chart such as the one below, allowing for students to conjecture about the relationship among the areas within each triangle.
8.G.7 Apply the Pythagorean Theorem to determine unknown side lengths in right triangles in real-world and mathematical problems in two and three dimensions.
Example: The Irrational Club wants to build a tree house. They have a 9-foot ladder that must be propped diagonally against the tree. If the base of the ladder is 5 feet from the bottom of the tree, how high will the tree house be off the ground? Solution: a² + 5² = 9² a² + 25 = 81 a² = 56 √a² = √56 a = √56 or ~7.5
Through authentic experiences and exploration, students should use the Pythagorean Theorem to solve problems. Problems can include working in both two and three dimensions. Students should be familiar with the common Pythagorean triplets.

Groveport Madison Local Schools Department of Curriculum and Instruction 2018
Part A Triangle STV has sides with lengths of 7, 11, and 14 units. Determine whether this triangle is a right triangle. Show all work necessary to justify your answer. Part B
A right triangle has a hypotenuse with a length of 15. The lengths of the legs are whole numbers. What are the lengths of the legs? Sample Response: Part A 72 + 112 does not equal 142 because 49 + 121 = 170, not 196. Therefore, it is not a right triangle because the side lengths do not satisfy the
Pythagorean Theorem. Part B 9, 12
Students in a class are using their knowledge of the Pythagorean Theorem to make conjectures about triangles. A student makes the conjecture shown below.
Use the Pythagorean Theorem to develop a chain of reasoning to justify or refute the conjecture. You must demonstrate that the conjecture is always true or that there is at least one example in which the conjecture is not true.
8.G.8
Example: Find the distance between (-2, 4) and (-5, -6).
Solution: The distance between -2 and -5 is the horizontal length; the distance between 4 and -6 is the vertical distance. Horizontal length: 3 Vertical length: 10
10² + 3² = c² 100 + 9 = c² 109 = c² √109 = √c² √109 = c
Example: Students will create a right triangle from the two points given (as shown in the diagram below) and then use the Pythagorean Theorem to find the
distance between the two given points.
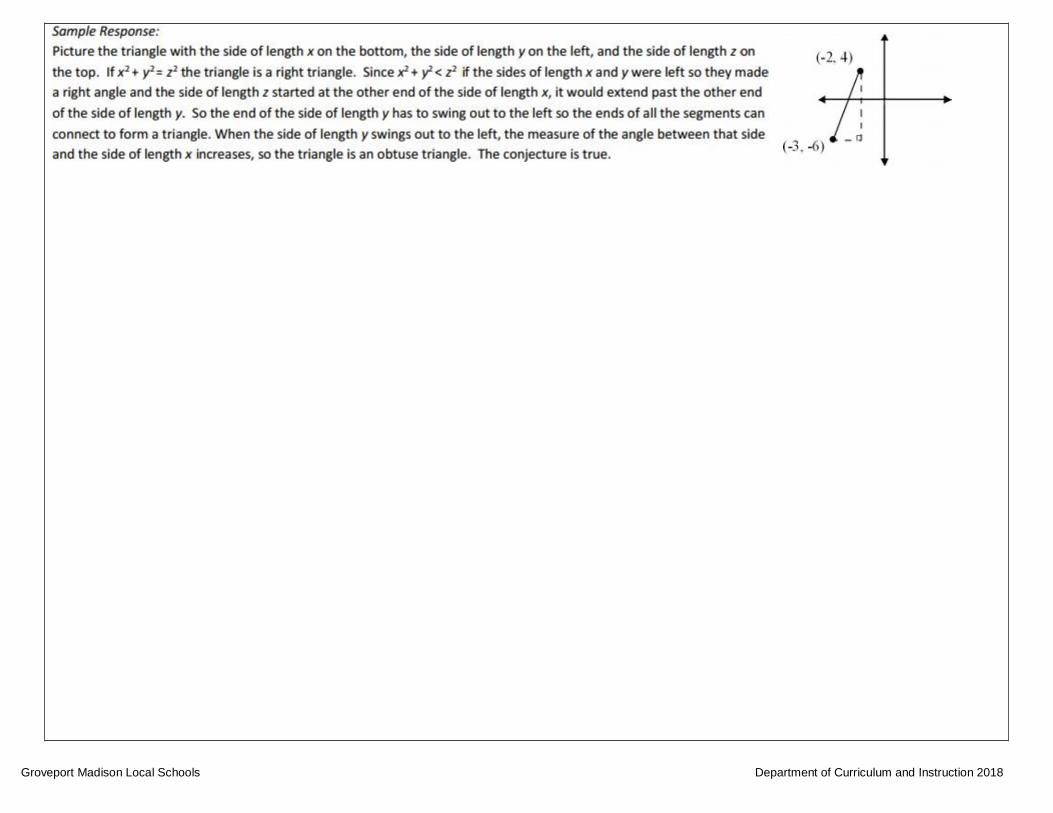
Groveport Madison Local Schools Department of Curriculum and Instruction 2018

Groveport Madison Local Schools Department of Curriculum and Instruction 2018
Common Misconceptions/Challenges
Challenge students to think about the problem rather than relying only on the equation, a² + b²+ = c²
Criteria for Success (Performance Level Descriptors)
- Limited: Use the Pythagorean Theorem to calculate the hypotenuse in mathematical problems (8G.6).
- Basic: Calculate unknown side lengths using the Pythagorean Theorem given a picture of a right triangle (8.G.7); Apply the Pythagorean Theorem to find the distance between two points in a coordinate system with the right triangle drawn (8.G.8).
- Proficient: Understand and explain the proof of the Pythagorean Theorem and its converse (8.G.6); Apply the Pythagorean Theorem to real-world situations that can be modeled in two dimensions to determine unknown side lengths (8.G.7).
- Accelerated: Understand and explain the proof of the Pythagorean Theorem and its converse in multiple ways (8.G.6); Apply the Pythagorean Theorem
in multi-step mathematical and real-world problems in two and three dimensions (8.G.7).
- Advanced: N/A
Prior Knowledge
Students should have a good understanding of solving equations (7.EE.4). They should be able to solve problems involving right triangles (7.G.1).
Future Learning
Students can use Pythagorean Theorem to help solve triangles using trigonometric functions.
Career Connections
Many jobs require you to know the relationships between sides of right triangles defined by the Pythagorean Theorem: agricultural workers, surveyors, electricians, carpenters, architects, etc.

Groveport Madison Local Schools Department of Curriculum and Instruction 2018
Ohio’s Learning Standards- Clear Learning Targets
Math, Grade 8
8.G.9 Volume of Cylinders, Spheres and Cones
8.G.9 Solve real-world and mathematical problems involving volumes of cones, cylinders, and spheres and use them to solve real‐world and
mathematical problems.
Essential Understanding
Students can reason and problem solve with problems dealing with volumes of cylinders, spheres and cones.
Students can solve real-world problems
involving volumes of cones, cylinders and spheres.
Vocabulary
• Cone
• Volume
• Cylinder
• Sphere
• Formula
• Compare
• Approximate
Essential Skills
• I can determine and apply appropriate volume formulas in order to solve mathematical and real-world problems for the given shape
• I can, given the volume of a cone, cylinder, or sphere, find the radii, height, or approximate for Pi.
• I can solve real-word problems involving volumes of cones.
• I can solve real-world problems involving volumes of cylinders.
• I can solve real-world problems involving volumes of spheres.

Groveport Madison Local Schools Department of Curriculum and Instruction 2018
Instructional Methods
8.G.9 Begin by recalling the formula, and its meaning, for the volume of a right rectangular prism: V = l × w × h. Then ask students to consider how this might be used to make a conjecture about the volume formula for a cylinder
• Most students can be readily led to the understanding that the volume of a right rectangular prism can be thought of as the area of a base times the
height, and so because the area of the base of a cylinder is r² the volume of a cylinder is 𝑉𝑐 = 𝜋𝑟 ²ℎ.
• To motivate the formula for the volume of a cone, use cylinders and cones with the same base and height. Fill the cone with rice or water and pour into the cylinder. Students will discover/experience that 3 cones full are needed to fill the cylinder. This non-mathematical derivation of the formula for the volume of a cone, 𝑉 = 1/3 𝜋𝑟²ℎ, will help most students remember the formula.
• In a drawing of a cone inside a cylinder, students might see that that the triangular cross-section of a cone is 1/2 the rectangular cross-section of the cylinder. Ask them to reason why the volume (three dimensions) turns out to be less than 1/2 the volume of the cylinder. It turns out to be 1/3.
• Students understand that the volume of a cylinder is 3 times the volume of a cone having the same base area and height or that the volume of a cone is 1/3 the volume of a cylinder having the same base area and height.
Students find the volume of cylinders, cones and spheres to solve real world and mathematical problems. Answers could also be given in terms of Pi.
Example: James wanted to plant pansies in his new planter. He wondered how much potting soil he should buy to fill it. Use the measurements in the diagram below to determine the planter’s volume.
Example: A cylindrical tank has a height of 10 feet and a radius of 4 feet. Jane fills the tank with water at a rate of 8 cubic feet per minute. At this rate, how many minutes will it take Jane to completely fill the tank without overflowing it? Round your answer to the nearest minute. Solution: 63 minutes
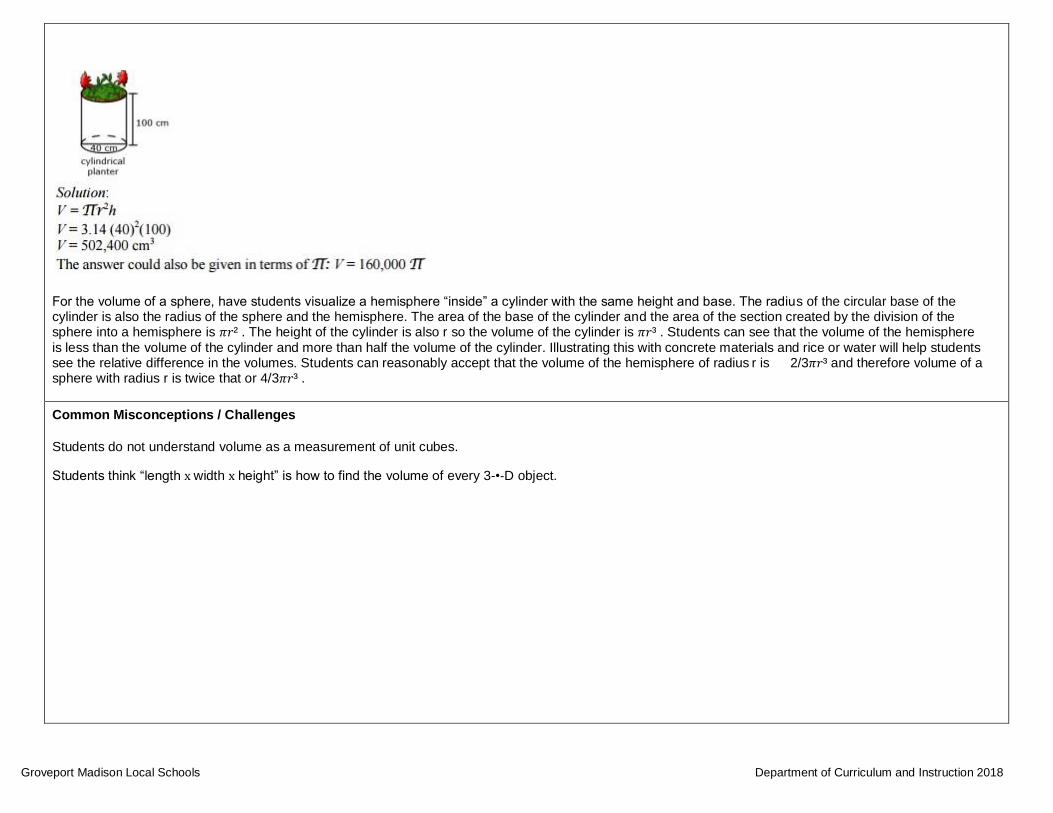
Groveport Madison Local Schools Department of Curriculum and Instruction 2018
For the volume of a sphere, have students visualize a hemisphere “inside” a cylinder with the same height and base. The radius of the circular base of the cylinder is also the radius of the sphere and the hemisphere. The area of the base of the cylinder and the area of the section created by the division of the sphere into a hemisphere is 𝜋𝑟² . The height of the cylinder is also r so the volume of the cylinder is 𝜋𝑟³ . Students can see that the volume of the hemisphere
is less than the volume of the cylinder and more than half the volume of the cylinder. Illustrating this with concrete materials and rice or water will help students see the relative difference in the volumes. Students can reasonably accept that the volume of the hemisphere of radius r is 2/3𝜋𝑟³ and therefore volume of a sphere with radius r is twice that or 4/3𝜋𝑟³ .
Common Misconceptions / Challenges
Students do not understand volume as a measurement of unit cubes.
Students think “length x width x height” is how to find the volume of every 3-•‐D object.

Groveport Madison Local Schools Department of Curriculum and Instruction 2018
Criteria for Success (Performance Level Descriptors)
- Limited: N/A
- Basic: Find the volume of a cone, cylinder or sphere given the height and/or radius.
- Proficient: Solve real-world and mathematical problems involving the volumes of cones, cylinders and spheres.
- Accelerated: Solve real-world and mathematical problems involving the volume of a composite solid including a cone, cylinder or sphere.
- Advanced: Informally explain the derivation of the formulas for cones, cylinders, and spheres.
Prior Knowledge
Students understand concept of volume and meaning of measurement in cubic units. (6.G.2). Students understand how to solve real-world problems involving area, volume and surface area of two and three dimensional objects (7.G.6)
Future Learning
Students will solve equations involving volumes of cylinders, cones, and
spheres.
Students will find volumes of composite three – dimensional figures.
Career Connections Many jobs require you to know how to calculate and solve problems involve volumes: architects, engineers, funeral directors, biologists, chemists, etc.

Groveport Madison Local Schools Department of Curriculum and Instruction 2018
Ohio’s Learning Standards- Clear Learning Targets
Math, Grade 8
8.SP.1-2-3 Bivariate Categorical Data and
Lines of Best Fit
Essential Understanding
Understand that relationships can be modeled using functions.
Vocabulary
• Scatter plot
• Bivariate data
• Measurement data
• Positive association
• Negative association
• Line of best fit
• Linear association
• Nonlinear association
• Analyze
• Interpret
• Quantitative
• Relative frequency
• Categorical data
• Outliers
Understand that we can measure how well a function models the given data.
8.SP.1 Construct and interpret scatter plots for bivariate measurement
data to investigate patterns of association between two quantities.
Describe patterns such as clustering, outliers, positive or negative association, linear association, and nonlinear association. (GAISE
Understand how these functions can be used to solve problems/predict events.
Model, steps 3 and 4)
8.SP.2 Understand that straight lines are widely used to model
relationships between two quantitative variables. For scatter plots that
suggest a linear association, informally fit a straight line, and informally
assess the model fit by judging the closeness of the data points to the
line. (GAISE Model, steps 3 and 4)
8.SP.3 Use the equation of a linear model to solve problems in the
context of bivariate measurement data, interpreting the slope and
intercept. For example, in a linear model for a biology experiment,
interpret a slope of 1.5 cm/hr as meaning that an additional hour of
sunlight each day is associated with an additional 1.5 cm in mature
plant height. (GAISE Model, steps 3 and 4)
Essential Skills
• I can describe patterns such as clustering, outliers, positive or negative association, and nonlinear association.
• I can construct and interpret scatter plots for bivariate (two different variables such as distance and time) measurement data to investigate
patterns of association between two quantities.
• I can understand and show how straight lines are used to model relationships between two quantitative variables
• I can fit a straight line and informally assess the model fit by judging the closeness of the data points to the line.
• I can use the equation of a linear model to solve problems in the context of bivariate measurement data.
• I can interpret the meaning of the slope and intercept of a linear equation in terms of the situation.
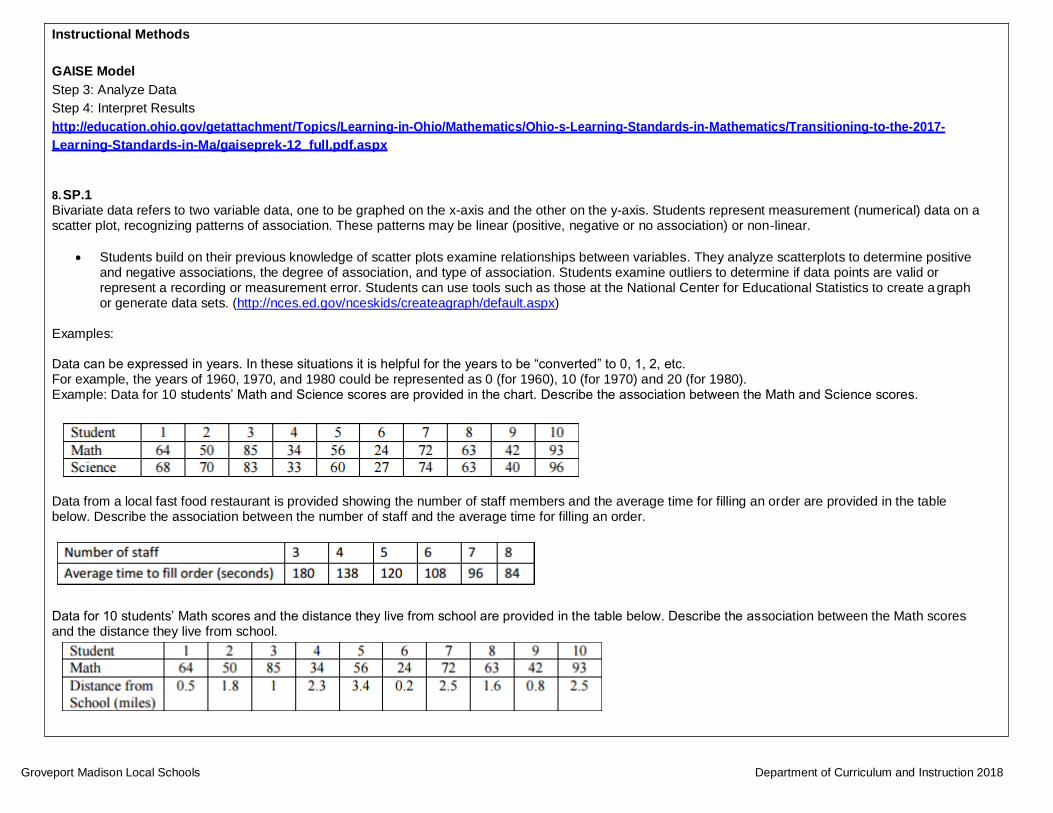
Groveport Madison Local Schools Department of Curriculum and Instruction 2018
Instructional Methods
GAISE Model
Step 3: Analyze Data
Step 4: Interpret Results
http://education.ohio.gov/getattachment/Topics/Learning-in-Ohio/Mathematics/Ohio-s-Learning-Standards-in-Mathematics/Transitioning-to-the-2017-
Learning-Standards-in-Ma/gaiseprek-12_full.pdf.aspx
8. SP.1 Bivariate data refers to two variable data, one to be graphed on the x-axis and the other on the y-axis. Students represent measurement (numerical) data on a scatter plot, recognizing patterns of association. These patterns may be linear (positive, negative or no association) or non-linear.
• Students build on their previous knowledge of scatter plots examine relationships between variables. They analyze scatterplots to determine positive and negative associations, the degree of association, and type of association. Students examine outliers to determine if data points are valid or represent a recording or measurement error. Students can use tools such as those at the National Center for Educational Statistics to create a graph or generate data sets. (http://nces.ed.gov/nceskids/createagraph/default.aspx)
Examples:
Data can be expressed in years. In these situations it is helpful for the years to be “converted” to 0, 1, 2, etc. For example, the years of 1960, 1970, and 1980 could be represented as 0 (for 1960), 10 (for 1970) and 20 (for 1980). Example: Data for 10 students’ Math and Science scores are provided in the chart. Describe the association between the Math and Science scores.
Data from a local fast food restaurant is provided showing the number of staff members and the average time for filling an order are provided in the table below. Describe the association between the number of staff and the average time for filling an order.
Data for 10 students’ Math scores and the distance they live from school are provided in the table below. Describe the association between the Math scores and the distance they live from school.

Groveport Madison Local Schools Department of Curriculum and Instruction 2018
The chart below lists the life expectancy in years for people in the United States every five years from 1970 to 2005. What would you expect the life expectancy of a person in the United States to be in 2010, 2015, and 2020 based upon this data? Explain how you determined your values.
8.SP.2
Students understand that a straight line can represent a scatter plot with linear association. The most appropriate linear model is the line that comes closest to most data points. The use of linear regression is not expected.
Examples:
The capacity of the fuel tank in a car is 13.5 gallons. The table below shows the number of miles traveled and how many gallons of gas are left in the tank. Describe the relationship between the variables. If the data is linear, determine a line of best fit. Do you think the line represents a good fit for the data set? Why or why not? What is the average fuel efficiency of the car in miles per gallon?
This scatter diagram shows the lengths and widths of the eggs of some American birds.
1. A biologist measured a sample of one hundred Mallard duck eggs and found they had an average length of 57.8 millimeters and average width of 41.6 millimeters. Use an X to mark a point that represents this on the scatter diagram. 2. What does the graph show about the relationship between the lengths of birds' eggs and their widths? 3. Another sample of eggs from similar birds has an average length of 35 millimeters. If these bird eggs follow the trend in the scatter plot, about what width would you expect these eggs to have, on average? 4. Describe the differences in shape of the two eggs corresponding to the data points marked C and D in the plot. 5. Which of the eggs A, B, C, D, and E has the greatest ratio of length to width? Explain how you decided.

Groveport Madison Local Schools Department of Curriculum and Instruction 2018
8.SP.3
Provide scatter plots and have students practice informally finding the line of best fit. Students should create and interpret scatter plots, focusing on outliers, positive or negative association, linearity or curvature. By changing the data slightly, students can have a rich discussion about the effects of the change on the graph. Have students use a graphing calculator to determine a linear regression and discuss how this relates to the graph. Students should informally draw a line of best fit for a scatter plot and informally measure the strength of fit. Discussion should include “What does it mean to be above the line, below the line?”
Examples:
Given data from students ‘math scores and absences, make a scatterplot.
Draw a line of best fit, paying attention to the closeness of the data points on either side of the line.
From the line of best fit, determine an approximate linear equation that models the given data
Students should recognize that 95 represents the y intercept and -25/3 represents the slope of the line.

Groveport Madison Local Schools Department of Curriculum and Instruction 2018
Students can use this linear model to solve problems. For example, through substitution, they can use the equation to determine that a student with 4 absences should expect to receive a math score of about 62. They can then compare this value to their line.
Groveport Madison Local Schools Department of Curriculum and Instruction 2018
Common Misconceptions/Challenges
Students want to “connect the dots” instead of drawing a line of best fit.
Students want to draw a horizontal line that “bisects” the data instead of a line of best fit.
Students may believe Bivariate data is only displayed in scatter plots.
Students think there is only one correct answer in mathematics. Students may mistakenly think their lines of best fit for the same set of data will be exactly the same.
Criteria for Success (Performance Level Descriptors)
- Limited: Construct a scatter plot (8.SP.1) Recognize a straight line can be used to describe a linear association on a scatter plot (8.SP.2); Identify the slope and y-intercept of a linear model on a scatter plot (8.SP.3).
- Basic: Construct a scatter plot and describe the pattern as positive, negative or no relationship (8.SP.1); Draw a straight line on a scatter plot that closely fits the data points (8.SP.2).
- Proficient: Describe patterns in scatterplots for routine contexts, such as: clustering, outliers, positive or negative association, linear association, and/or
nonlinear association (8.SP.1).
- Accelerated: Compare more than one trend line for the same scatter plot (8.SP.1); Create and use a linear model based on a set of bivariate data to
solve a problem in a routine context (8.SP.3).
- Advanced: Compare more than one trend line for the same scatter plot and justify the best one (8.SP.1); Construct and interpret scatter plots for bivariate measurements data to investigate patterns of association between two quantities (8.SP.1); Create and use a linear model based on a set of bivariate data to solve problems in a variety of non-routine contexts (8.SP.2/8.SP.3).
Prior Knowledge
Students understand that statistics can be used to gain information about a population by examining a sample of the population (7.SP.1). Students have a broad statistical reasoning using the GAISE Model (7.SP.2). Students can describe and analyze distributions (7.SP.3).
Future Learning
Represent data on two quantitative variables on a scatter plot, and describe how the variables are related. a. Fit a function to the data; use functions fitted to data to solve problems in
the context of the data. Use given functions or choose a function suggested by the context. Emphasize linear, quadratic, and exponential models.
b. Informally assess the fit of a function by plotting and analyzing residuals.
c. Fit a linear function for a scatter plot that suggests a linear association. Use scatter plots to find linear regression in Algebra.
Career Connections
Many jobs require you to know how to analyze and interpret data. Today, many institutions (education, research, business, etc.) are “data-•‐ driven” and rely on accurate interpretations of data to make decisions.

Groveport Madison Local Schools Department of Curriculum and Instruction 2018
Ohio’s Learning Standards- Clear Learning Targets
Math, Grade 8
Bivariate Categorical Data using
8.SP.4 Two-Way Tables
Essential Understanding
Understand that just because two things demonstrate a strong relationship (direct or inverse) that doesn’t mean that it is a causal relationship.
Understand how to interpret and analyze
data given in a two-•‐way table in relation to
the context of the data as well as the relationship between the data themselves.
Vocabulary
• Two-•‐way table
• Causation
• Correlation
• (Causal) Factors
• Frequency
• Analyze
• Interpret
• Sample
• Relative
8.SP.4 Understand that patterns of association can also be seen in bivariate
categorical data by displaying frequencies and relative frequencies in a two- •‐ way table. Construct and interpret a two-•‐ way table summarizing data on two categorical variables collected from the same subjects. Use relative frequencies calculated for rows or columns to describe possible association between the two variables. For example, collect data from students in your class on whether or not they have a curfew on school nights and whether or not they have assigned chores at home. Is there evidence that those who
have a curfew also tend to have chores?
Essential Skills
• I can recognize patterns shown in comparison of two sets of data.
• I can show how to construct a two-•‐way table.
• I can interpret the data in the two-•‐way table to recognize patterns. (For examples, collect data from students in your class on whether or not they
have a curfew on school nights and whether or not they have assigned chores at home. Is there evidence that those who have a curfew also
tend to have chores?).
• I can construct and interpret a two-•‐ way table summarizing data on two categorical variables collected from the same subjects.
• I can use relative frequencies of the data to describe relationships (positive, negative, or no correlation).
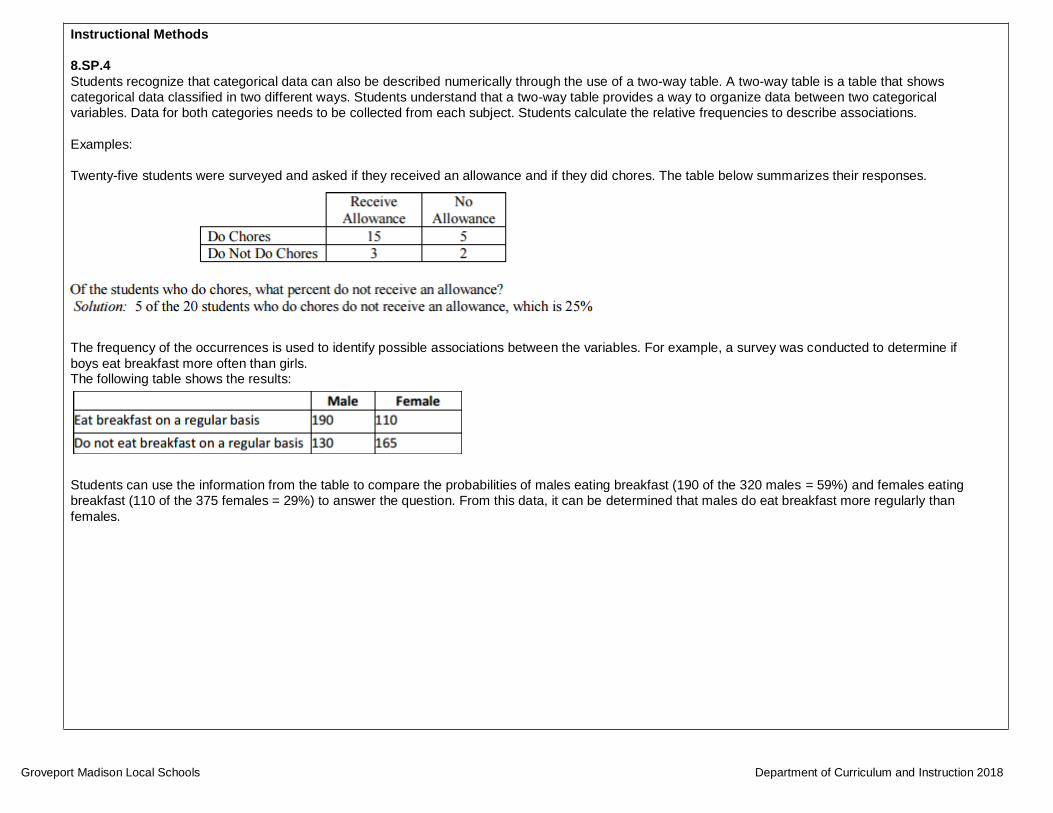
Groveport Madison Local Schools Department of Curriculum and Instruction 2018
Instructional Methods
8.SP.4
Students recognize that categorical data can also be described numerically through the use of a two-way table. A two-way table is a table that shows
categorical data classified in two different ways. Students understand that a two-way table provides a way to organize data between two categorical
variables. Data for both categories needs to be collected from each subject. Students calculate the relative frequencies to describe associations.
Examples:
Twenty-five students were surveyed and asked if they received an allowance and if they did chores. The table below summarizes their responses.
The frequency of the occurrences is used to identify possible associations between the variables. For example, a survey was conducted to determine if
boys eat breakfast more often than girls. The following table shows the results:
Students can use the information from the table to compare the probabilities of males eating breakfast (190 of the 320 males = 59%) and females eating
breakfast (110 of the 375 females = 29%) to answer the question. From this data, it can be determined that males do eat breakfast more regularly than
females.
Groveport Madison Local Schools Department of Curriculum and Instruction 2018
Common Misconceptions/Challenges
Students find it difficult to think of all possible causal factors of a data set.
Students often confuse causal relationships with correlating ones.
Criteria for Success (Performance Level Descriptors)
- Limited: N/A
- Basic: Construct a two-way table of categorical data.
- Proficient: Interpret and describe relative frequencies for possible associations from a two-way table representing a routine situation.
- Accelerated: N/A
- Advanced: Interpret, describe and compare relative frequencies to identify patterns of association in given contexts.
Prior Knowledge
Students should have an understanding of how to analyze how strong a relationship is between two data sets. (7.SP.3)
Future Learning
Summarize categorical data for two categories in two-•‐way frequency tables.
Interpret relative frequencies in the context of the data (including joint, marginal, and conditional relative frequencies). Recognize possible associations and trends in the data.
Career Connections
Many jobs require you to know how to analyze and interpret data. Today, many institutions (education, research, business, etc.) are “data-•‐ driven” and rely on
accurate interpretations of data to make decisions.