7 621 CORPORATE OWNERSHIP & CONTROL Postal Address
94
Corporate Ownership & Control / Volume 11, Issue 1, 2013, Continued - 7 621 CORPORATE OWNERSHIP & CONTROL Postal Address: Postal Box 36 Sumy 40014 Ukraine Tel: +380-542-611025 Fax: +380-542-611025 e-mail: [email protected] [email protected] www.virtusinterpress.org Journal Corporate Ownership & Control is published four times a year, in September-November, December-February, March-May and June-August, by Publishing House “Virtus Interpress”, Kirova Str. 146/1, office 20, Sumy, 40021, Ukraine. Information for subscribers: New orders requests should be addressed to the Editor by e-mail. See the section "Subscription details". Back issues: Single issues are available from the Editor. Details, including prices, are available upon request. Advertising: For details, please, contact the Editor of the journal. Copyright: All rights reserved. No part of this publication may be reproduced, stored or transmitted in any form or by any means without the prior permission in writing of the Publisher. Corporate Ownership & Control ISSN 1727-9232 (printed version) 1810-0368 (CD version) 1810-3057 (online version) Certificate № 7881 Virtus Interpress. All rights reserved. КОРПОРАТИВНАЯ СОБСТВЕННОСТЬ И КОНТРОЛЬ Почтовый адрес редакции: Почтовый ящик 36 г. Сумы, 40014 Украина Тел.: 38-542-611025 Факс: 38-542-611025 эл. почта: [email protected] [email protected] www.virtusinterpress.org Журнал "Корпоративная собственность и контроль" издается четыре раза в год в сентябре, декабре, марте, июне издательским домом Виртус Интерпресс, ул. Кирова 146/1, г. Сумы, 40021, Украина. Информация для подписчиков: заказ на подписку следует адресовать Редактору журнала по электронной почте. Отдельные номера: заказ на приобретение отдельных номеров следует направлять Редактору журнала. Размещение рекламы: за информацией обращайтесь к Редактору. Права на копирование и распространение: копирование, хранение и распространение материалов журнала в любой форме возможно лишь с письменного разрешения Издательства. Корпоративная собственность и контроль ISSN 1727-9232 (печатная версия) 1810-0368 (версия на компакт-диске) 1810-3057 (электронная версия) Свидетельство КВ 7881 от 11.09.2003 г. Виртус Интерпресс. Права защищены.
-
Upload
khangminh22 -
Category
Documents
-
view
3 -
download
0
Transcript of 7 621 CORPORATE OWNERSHIP & CONTROL Postal Address

Corporate Ownership & Control / Volume 11, Issue 1, 2013, Continued - 7
621
CORPORATE
OWNERSHIP & CONTROL
Postal Address:
Postal Box 36
Sumy 40014
Ukraine
Tel: +380-542-611025
Fax: +380-542-611025
e-mail: [email protected]
www.virtusinterpress.org
Journal Corporate Ownership & Control is published
four times a year, in September-November,
December-February, March-May and June-August,
by Publishing House “Virtus Interpress”, Kirova Str.
146/1, office 20, Sumy, 40021, Ukraine.
Information for subscribers: New orders requests
should be addressed to the Editor by e-mail. See the
section "Subscription details".
Back issues: Single issues are available from the
Editor. Details, including prices, are available upon
request.
Advertising: For details, please, contact the Editor of
the journal.
Copyright: All rights reserved. No part of this
publication may be reproduced, stored or transmitted
in any form or by any means without the prior
permission in writing of the Publisher.
Corporate Ownership & Control
ISSN 1727-9232 (printed version)
1810-0368 (CD version)
1810-3057 (online version)
Certificate № 7881
Virtus Interpress. All rights reserved.
КОРПОРАТИВНАЯ
СОБСТВЕННОСТЬ И КОНТРОЛЬ
Почтовый адрес редакции:
Почтовый ящик 36
г. Сумы, 40014
Украина
Тел.: 38-542-611025
Факс: 38-542-611025
эл. почта: [email protected]
www.virtusinterpress.org
Журнал "Корпоративная собственность и
контроль" издается четыре раза в год в сентябре,
декабре, марте, июне издательским домом Виртус
Интерпресс, ул. Кирова 146/1, г. Сумы, 40021,
Украина.
Информация для подписчиков: заказ на подписку
следует адресовать Редактору журнала по
электронной почте.
Отдельные номера: заказ на приобретение
отдельных номеров следует направлять Редактору
журнала.
Размещение рекламы: за информацией
обращайтесь к Редактору.
Права на копирование и распространение:
копирование, хранение и распространение
материалов журнала в любой форме возможно
лишь с письменного разрешения Издательства.
Корпоративная собственность и контроль
ISSN 1727-9232 (печатная версия)
1810-0368 (версия на компакт-диске)
1810-3057 (электронная версия)
Свидетельство КВ 7881 от 11.09.2003 г.
Виртус Интерпресс. Права защищены.

Corporate Ownership & Control / Volume 11, Issue 1, 2013, Continued - 7
622
CORPORATE OWNERSHIP & CONTROL Volume 11, Issue 1, 2013, Continued - 7
CONTENTS
ON RAPID INCREASE OF HOUSEHOLDS IN SOUTH AFRICA AND IMPLICATIONS ON MANAGEMENT OF DELIVERY OF BASIC SERVICES 623 Remigius C Nnadozie THE LINK BETWEEN FINANCIAL MANAGEMENT, ORGANIZATIONAL CAPACITY BUILDING AND EFFECTIVENESS IN NOT-FOR-PROFIT ORGANIZATIONS: AN EXPLORATORY STUDY 632 Ron Kluvers CORPORATE GOVERNANCE AND FIRM VALUATION IN EMERGING MARKETS EVIDENCE FROM UAE LISTED COMPANIES IN THE MIDDLE EAST 637 Mohamed Adawi, Kami Rwegasira SPONSORED ANALYST COVERAGE, INFORMATION ASYMMETRY AND STOCK TURNOVER 657 Yee-Boon Foo THE CORPORATE USE OF DERIVATIVES BY LISTED NON-FINANCIAL FIRMS IN AFRICA 671 Glen Holman, Carlos Correia, Lucian Pitt, Akios Majoni THE IMPACT OF CORPORATE GOVERNANCE ON FIRM PERFORMANCE IN EGYPTIAN LISTED COMPANIES 691 Ehab K. A. Mohamed, Mohamed A. Basuony, Ahmed A. Badawi GOVERNANCE OF STAKEHOLDER’S FINANCIAL RELATIONSHIPS: EVIDENCE FOM UKRAINIAN BANKING SECTOR 706 Maryna Brychko

Corporate Ownership & Control / Volume 11, Issue 1, 2013, Continued - 7
623
ON RAPID INCREASE OF HOUSEHOLDS IN SOUTH AFRICA AND IMPLICATIONS ON MANAGEMENT OF DELIVERY OF
BASIC SERVICES
Remigius C Nnadozie*
Abstract
Official sets of data from Statistics South Africa in the post-apartheid era suggest a general trend of rapidly increasing numbers of households against the population of individuals which is increasing at a decreasing growth-rate. Using multivariate statistical methods, this study investigates the interaction of demographic variables and their impact on the rapid increase in household numbers in South Africa. This study also examines the impact of the rapid increase of households to delivery of basic services. The results provide a scientific confirmation that the rapid increase could best be attributed to fragmentation of households. The paper recommends that the fast pace of household growth in South Africa should adequately be factored into household-based service delivery models of government at least to the next decade as the trend is expected to continue into the near future. Keywords: Households, Population, Rapid Growth, Natural Increase, Net Migration, Household Size, Fragmentation, Service Delivery * Directorate for Institutional Planning & Research, Mangosuthu University of Technology, South Africa E-mail: [email protected]
1. Introduction
The household is an important point of access to a
number of essential services such as water, sanitation,
housing, electricity amongst other services. Therefore,
deeper understanding of the dynamics of household
formation and dissolution in South Africa is vital for
effective planning, monitoring and evaluation of
service delivery especially for those services of which
the household is the unit of access.
There are divergent views on the correct
definition of the household. For the purpose of the
article the working definition of household for the
census and surveys given by Statistics South Africa
(Stats SA) is adopted since most of the data sets for
the analysis in the article are from Stats SA surveys.
“A household is a group of persons who live
together and provide themselves jointly with food
and/or other essentials for living, or a single person
who lives alone (Statistics South Africa, 1995 -
2006)”.
In the recent years, there has been a rapid
increasing trend in household numbers in South
Africa especially when compared with individual
population. The 1996 census recorded about 9 million
households, this number increased by almost 60% to
about 14.4 million households in 2011 as revealed by
the 2011 census while the individual population
increased by about 28% from 40.5 million to 51.7
million over the same period (Statistics South Africa,
2012). The rapidly rising number of households puts
increase on the yearly additional demand for
household-based services.
The problem is not that households are
increasing but rather the manner of increase in
relation with the base population. Household numbers
are bound to increase especially for a growing
economy like South Africa where householders are
increasingly getting empowered to leave home. Even
in these instances, exponential growth pattern is a
good subject for investigation. Some researchers on
this issue opine that the exponential growth
phenomena in the number of households in South
Africa could best be attributed to household mitosis or
fragmentation (van Aardt, 2007). This opinion could
mainly have been out of mere observations from
household data and thus a robust empirical
verification becomes necessary. This paper explains
how the interaction of various factors has played out
through the main components of demographic change
to influence the changing household structure and the
rapid increase of households in South Africa and how
the trends affects access to household-based services
in recent times in South Africa.
In the light of the above discussion, the
objectives of this article are:
To explain the drivers of the rapidly
increasing trends in household numbers in South
Africa with regard to main components of
demographic change.
To elucidate the impacts of rapid increasing
trends in household number would have on demand
and access to essential services in South Africa.

Corporate Ownership & Control / Volume 11, Issue 1, 2013, Continued - 7
624
The analysis is done using multivariate statistical
method of least squares analysis; this is implemented
on the platform of the Statistical Package for the
Social Sciences (SPSS) regression models. The initial
hypothetical postulation was that the rapid increase in
household numbers in post-apartheid South Africa is
driven by the main components of demographic
change, namely; changes in the natural increase in the
population and net migration.
This paper is organised into five sections. In
section one the background of the paper and research
objectives were provided, section two discusses
changing household structure in South Africa linking
the phenomenon to relevant literature and conceptual
framework. The methodological approach to the study
and data sources is presented in section three. Section
four present dwells on the results of analysis and
discussions around the results especially the impact of
the findings on service delivery. Concluding remarks
and recommendations are presented in section five.
2. Changing Household Structure in South Africa
For most instances of demographic study there has
been little emphasis on the demographic unit
(Household) intermediate between the individual and
the larger community in an area, state, province,
country or nation. Greater emphasis has been on two
units; the individual and the general population.
However, for certain demographic analysis an
intermediate unit between the individual and the lager
population remains very vital for development
planning. For forecasts of total population, of the
future labor force, of pension weight, of social grants,
it is satisfactory to work at the level of individual unit.
However, individual population information alone
does not reveal how the general population fits into
for instance the housing supply, water/sanitation
demand and supply (van Imhoff et al, 1995).
During the apartheid era in South Africa
restriction from geographical mobility and access to
land were imposed onto the dominant black Africa
race. This to a great extent changed the pre-colonial
family and household formation system in South
Africa. To this Amaoteng (2007) argues that the
situation necessitated urban-rural homesteads and
internal circular migration as a survival strategy
especially for the migrant mine workers who were
predominantly males. This created a deficit of males
in the rural areas and thus marriage was either delayed
or avoided. In the cases where there was marriage, the
man often left the wife and children behind. The
situation led to household/family patterns as female-
headed households, out-of-wedlock births leading to
unstable households among the dominant African
population (Amaoteng, 2007).
Against this backdrop, a culture of tiny
household pattern gradually became a norm against
the African traditional setting in which households
normally comprised of both nuclear and extended
family members. The situation was further intensified
with the attainment of democracy in 1994, the new
sense of freedom meant massive movement of
economic in-migrants into the urban cities leading to
the formation of new households almost at an
exponential rate as shown in Figure 1.
Figure 1. Household Trends in South Africa
Figure 1 shows plots of total household numbers
as obtained from the national surveys from Statistics
South Africa 1995 to 2006 and household projection
model (van Aardt, 2007) from the Bureau for
Marketing Research (BMR). The general trend in
Figure 1 shows almost an exponential pattern of
growth of household number, however, the individual
population has comparatively been growing almost at
a steadily decreasing growth rate as shown in Figure
2.
9,0
10,0
11,0
12,0
13,0
14,0
15,0
16,0
1996 1999 2002 2005 2008 2011 2014
Ho
use
ho
lds
in M
illi
on
s
OFFICIAL
BMR_M
Corporate Ownership & Control / Volume 11, Issue 1, 2013, Continued - 7
625
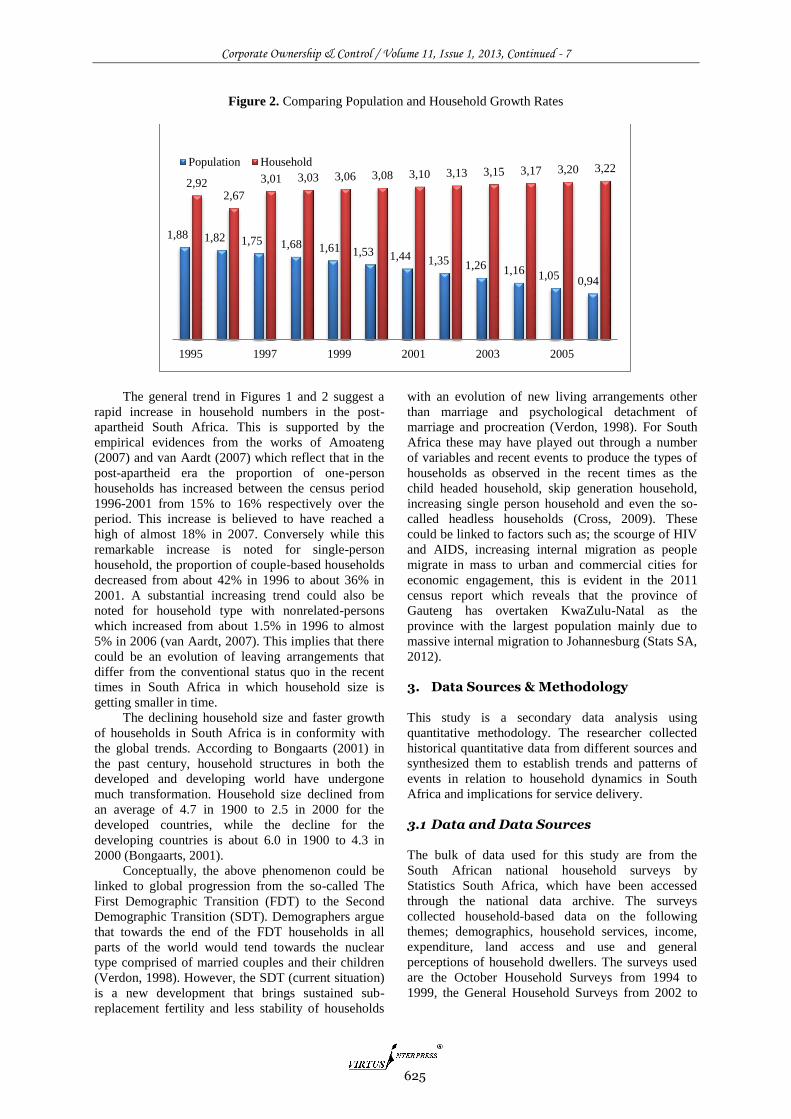
Figure 2. Comparing Population and Household Growth Rates
The general trend in Figures 1 and 2 suggest a
rapid increase in household numbers in the post-
apartheid South Africa. This is supported by the
empirical evidences from the works of Amoateng
(2007) and van Aardt (2007) which reflect that in the
post-apartheid era the proportion of one-person
households has increased between the census period
1996-2001 from 15% to 16% respectively over the
period. This increase is believed to have reached a
high of almost 18% in 2007. Conversely while this
remarkable increase is noted for single-person
household, the proportion of couple-based households
decreased from about 42% in 1996 to about 36% in
2001. A substantial increasing trend could also be
noted for household type with nonrelated-persons
which increased from about 1.5% in 1996 to almost
5% in 2006 (van Aardt, 2007). This implies that there
could be an evolution of leaving arrangements that
differ from the conventional status quo in the recent
times in South Africa in which household size is
getting smaller in time.
The declining household size and faster growth
of households in South Africa is in conformity with
the global trends. According to Bongaarts (2001) in
the past century, household structures in both the
developed and developing world have undergone
much transformation. Household size declined from
an average of 4.7 in 1900 to 2.5 in 2000 for the
developed countries, while the decline for the
developing countries is about 6.0 in 1900 to 4.3 in
2000 (Bongaarts, 2001).
Conceptually, the above phenomenon could be
linked to global progression from the so-called The
First Demographic Transition (FDT) to the Second
Demographic Transition (SDT). Demographers argue
that towards the end of the FDT households in all
parts of the world would tend towards the nuclear
type comprised of married couples and their children
(Verdon, 1998). However, the SDT (current situation)
is a new development that brings sustained sub-
replacement fertility and less stability of households
with an evolution of new living arrangements other
than marriage and psychological detachment of
marriage and procreation (Verdon, 1998). For South
Africa these may have played out through a number
of variables and recent events to produce the types of
households as observed in the recent times as the
child headed household, skip generation household,
increasing single person household and even the so-
called headless households (Cross, 2009). These
could be linked to factors such as; the scourge of HIV
and AIDS, increasing internal migration as people
migrate in mass to urban and commercial cities for
economic engagement, this is evident in the 2011
census report which reveals that the province of
Gauteng has overtaken KwaZulu-Natal as the
province with the largest population mainly due to
massive internal migration to Johannesburg (Stats SA,
2012).
3. Data Sources & Methodology
This study is a secondary data analysis using
quantitative methodology. The researcher collected
historical quantitative data from different sources and
synthesized them to establish trends and patterns of
events in relation to household dynamics in South
Africa and implications for service delivery.
3.1 Data and Data Sources
The bulk of data used for this study are from the
South African national household surveys by
Statistics South Africa, which have been accessed
through the national data archive. The surveys
collected household-based data on the following
themes; demographics, household services, income,
expenditure, land access and use and general
perceptions of household dwellers. The surveys used
are the October Household Surveys from 1994 to
1999, the General Household Surveys from 2002 to
1,88 1,82 1,75 1,68 1,61 1,53 1,44 1,35 1,26 1,16 1,05 0,94
2,92 2,67
3,01 3,03 3,06 3,08 3,10 3,13 3,15 3,17 3,20 3,22
1995 1997 1999 2001 2003 2005
Population Household

Corporate Ownership & Control / Volume 11, Issue 1, 2013, Continued - 7
626
2005, the Community Surveys of 2006 and 2007, the
South African National Censuses of 1996 and 2001.
Information was also obtained from some local
and international research bodies and institutions.
These are the population and household projection
data from the Bureau for Marketing Research at the
University of South Africa date?, South African
demographic data from the Population Reference
Bureau (2000 to 2010) and South African migration
data from the United States Census Bureau (1995 to
2008).
3.2 Fitting the Regression Model
This study basically uses multivariate statistical
techniques to explore the relationship between the
response variable and the control variables. The
dependent variable is annual increase in household
numbers while the independent variables are annual
natural increase in the population, annual net-
migration and the computed interacting variable for
annual household fragmentation.
Exploring the data-sets, SPSS frequency
tabulations and descriptive statistics were
implemented. Basic computation of average
household sizes and household headship rates were
done to prepare the data for the analysis. The average
household size is basically the quotient of total
population and total household number for a given
year. The headship rate gives an indication of the
proportion of heads of households in a population for
the year of interest. As each household is assumed to
have just one head, the number of household heads in
a state equals the number of households (O’Neill and
Jiang, 2007). The rate can only be in the range 0 to 1
and calculated as follows:
(1)
and so total household would be
Total Households = (Headship Rate) x
(Population) Total Households (2)
The headship rate and the average household
size are used for the computation of the household
fragmentation variable as explained later in this
section. For investigation of the interaction of
demographic variables and their impact on the rapid
increase of household numbers in South Africa, we
used the method of least squares through the SPSS
multiple regression analysis.
The standard least squares model is given as
(3)
where yi represent the response variable, the βs
represent the coefficients for the predicting variables
the xi, while 𝝐i represents an error term (SPSS Inc,
1999). Ultimately we want to build a model for y with
the line of best fit, i.e. of least (squared) residual
between observed values and predicted values. For
this analysis we would require consistent historical
data on trends in household numbers, fertility,
mortality, emigration and immigration. For the
household numbers we use the national household
survey data from the October Household Surveys
(1994 - 1999) to the later General Household Surveys
(2002 – 2005) from Statistics South Africa. Noting
that the data from these surveys are inconsistent,
outliers were replaced with imputed values. From the
obtained consistent household numbers and mid-year
population estimates, annual increase in household
numbers, average household size and household
headship rates are computed. The fertility and
mortality data are obtained from mid-year population
estimates from Statistics South Africa and the U.S
Census Bureau. From these data sets we compute
estimates for Natural Increase in the population for
South Africa which is the difference between fertility
and mortality for each year. The Net-migration
(difference between immigration and emigration) data
was obtained entirely from the U.S Census Bureau
because there is a general lack of quality migration
data from local sources in the developing countries. In
Table 2 we present the input variables and data for the
SPSS regression analysis.
Table 1. Variables and Data for the Least Square Model
Year Ad HH NI NM HH Size H Rate
1995 393,522 687,000 -193,000 4.6000 0.2232
1996 410,616 655,000 -29,000 4.3793 0.2283
1997 428,452 612,000 -22,000 4.2811 0.2336
1998 447,063 560,000 -23,000 4.1852 0.2389
2000 466,482 500,000 37,000 4.0914 0.2444
2001 486,745 438,000 49,000 3.9997 0.2500
2002 507,888 373,000 143,000 3.8550 0.2594
2003 529,949 310,000 155,000 3.8406 0.2604
2004 552,969 257,000 214,000 3.8316 0.2610
2005 576,989 224,000 210,000 3.8278 0.2612
2006 602,052 106,000 247,000 3.8283 0.2612
2007 628,203 187,000 240,000 3.8333 0.2609
2008 655,491 161,000 243,000 3.8399 0.2604
Source: Computed from Stats SA Household Surveys 95 - 07

Corporate Ownership & Control / Volume 11, Issue 1, 2013, Continued - 7
627
In Table 1 Ad HH represents estimates for
annual additional households, NI represents estimates
for natural increase in the population (the difference
between total births and total mortality), NM
represents estimates for net migration (the difference
between immigration and emigration), HH Size
represents average household size and H Rate
represents the headship rates. It is notable that most of
the variables in Table 1 are in the scale of hundreds of
thousand therefore some transformation need to be
done to reduce the data to a manageable scale for the
SPSS regression model.
Table 2. Variables and Data for the Least Square Model
Year logAd_HH logNI logNM HH_frag
1995 5.5950 5.8370 3.8451 0.04853
1996 5.6134 5.8162 5.2330 0.05214
1997 5.6319 5.7868 5.2504 0.05456
1998 5.6504 5.7482 5.2480 0.05709
2000 5.6688 5.6990 5.3747 0.05974
2001 5.6873 5.6415 5.3962 0.06251
2002 5.7058 5.5717 5.5353 0.06729
2003 5.7242 5.4914 5.5502 0.06780
2004 5.7427 5.4099 5.6170 0.06811
2005 5.7612 5.3502 5.6128 0.06825
2006 5.7796 5.0253 5.6503 0.06823
2007 5.7981 5.2718 5.6435 0.06805
2008 5.8166 5.2068 5.6464 0.06782
Source: Computed from Stats SA Household Surveys 95 - 07
In Table 2 the data is reduced to a manageable
scale for ease of computation and also to improve the
normal spread of the data as a basic assumption of the
regression model, we do a log transformation of the
affected variables controlled for inconsistency. We
also create an additional variable (HH frag) out of the
variables representing household size and headship
rates. The quotient of these two variables forms the
additional variable which is an interaction variable
that gives an indication of the influence of household
fragmentation. It could be noted from Table 1 that
some of the values for net-migration have negative
values, a constant figure of 200,000 was added to
each value in the series to control for the negative
values before the log transform and this figure was
chosen to be able to eliminate all the negative values
in the series.
Graphs of lines of access to water, housing and
sanitation and their respective backlogs were
computed from census and household data as
mentioned above, the lines were projected forward to
2010 using linear time series projection.
Pearson Correlation technique was also used to
correlate the trend in annual additional household
increase and annual backlogs for water, housing and
sanitation services.
4. Results and Discussion
In the regression equation the variable logAd HH for
annual additional household numbers is the dependent
variable while the three other variables (logNI, logNM
& HH frag) for natural population increase, net-
migration and household fragmentation respectively
are the predictors for increase in household numbers.
In our case the regression equation is
(4)
Table 3. SPSS Output Results for the Multiple Regression Model
Variables Coefficients β Sig(α)
Constant 6.215 22.537 0.000
Natural Increase -0.145 -4.043 0.003
Net Migration 0.007 0.443 0.668
Fragmentation 4.272 2.608 0.028
Source: Computed from Stats SA Household Surveys 95 - 07
From the above results in Table 3 it could be
observed that the partial regression coefficients were
statistically significant for both Natural Increase (β =
-0.145, t268 = -4.043, p < 0.05) and Household

Corporate Ownership & Control / Volume 11, Issue 1, 2013, Continued - 7
628
Fragmentation (β = 4.272, t268 = 2.608, p < 0.05),
however, that negative value for the coefficient for
natural increase and the negative partial correlation
coefficient (-0.947) indicate an inverse relationship
between the natural increase in the population of
South Africa and the annual household increase. The
partial regression coefficient for Net Migration (β =0
.007 & p > 0.05) indicates no statistically partial
regression with annual household increase. The
overall goodness of fit statistic (R2 = 0.954, standard
error of estimate = 0.017) indicate that the partial
combination of the control variables in the model
explains to a satisfactory measure the variability in
annual household increase.
These outputs indicate that the main driver of the
rapidly increasing household numbers in South Africa
is most likely fragmentation or household mitosis.
This is an empirical confirmation of the view of van
Aardt, (2007). Even though net-migration appears to
be statistically insignificant, one cannot rule out the
influence of emigrants especially from the
neighbouring Southern African countries in the light
of the socioeconomic crisis in neighbouring
Zimbabwe and the fact that South Africa is
increasingly becoming a choice destination for
economic migrants from the rest of Sub-Saharan
Africa. This needs further research.
Regarding service delivery and the reporting of
progress in service delivery, the fast growth of
households as a result of fragmentation could imply
that there could seemingly be a reflection of progress
when the trends of access to household-based services
are reported using percentage scores (as in most
reports) as delivery is accelerated, but that may not
translate to an equitable measure of progress when
reported in real numbers as a result of the fast pace of
increase in household numbers. For instance the 1996
census data show a backlog of about 18.8% of 9
million households in 1996 with regard to access to
piped water; this translates to about 1.6 million
households without piped water in 1996 (Statistics
South Africa, 1998). The percentage score for 2007
using the 2007 CS data implies a substantial decrease
in the deficit of piped water access to about 11.4%,
but because of the fast pace of increase in household
numbers the actual decrease is not commensurate with
reported percentage scores. The actual situation in
number terms is that 1.4 million households had no
access to piped water in 2007 despite considerable
efforts in the delivery of water (Statistics South
Africa, 2008). Housing statistics present more clearly
the effect of the rapid household growth on service
delivery. The 1996 census shows that about 35.6% of
9 million households in 1996 had no access to formal
housing (Statistics South Africa, 1998); this translates
to about 3.2 million households without formal
housing in 1996. The percentage score for 2007
implies a substantial decrease in the deficit of housing
access to about 29.5%, but because of the fast pace of
increase in household numbers (12.5 million in 2007)
the actual situation in number terms is that 3.7 million
households had no access to formal housing in 2007
which is actually an increase in housing backlogs in
real terms from 1996 to 2007 despite considerable
efforts in the delivery of housing as shown in Figure 3
below.
Figure 3. Lines of Access to Water, Housing and Sanitation
The lines of households access to water, housing
and sanitation have shown remarkable increase over
time. Access to water seems to have improved much
more than housing and sanitation. Even though the
advancement in water may be attributed to the fact
that many households access water from community
stand pipes which are less than 200 metres away as
4,00
5,00
6,00
7,00
8,00
9,00
10,00
11,00
12,00
1996 1998 2000 2002 2004 2006 2008 2010
Ho
use
ho
lds
in m
illi
on
s
Housing Water Sanitation
Corporate Ownership & Control / Volume 11, Issue 1, 2013, Continued - 7
629
opposed housing for instance which requires one
housing unit to a specific household.
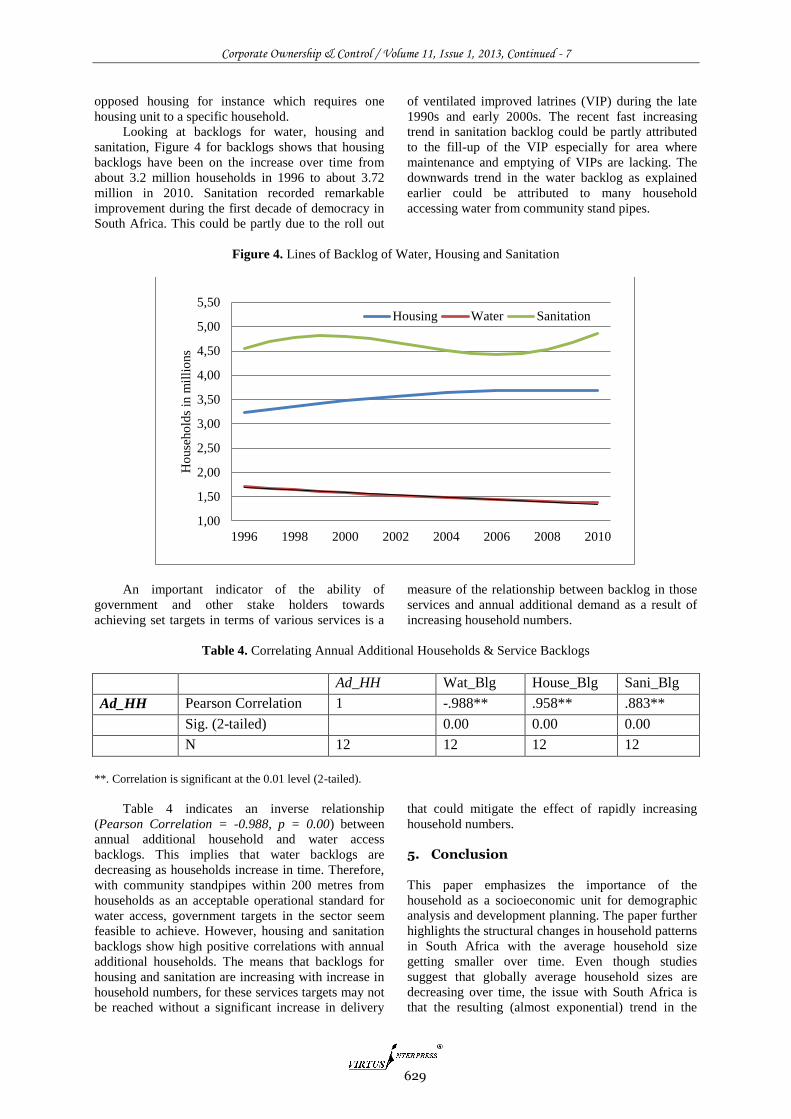
Looking at backlogs for water, housing and
sanitation, Figure 4 for backlogs shows that housing
backlogs have been on the increase over time from
about 3.2 million households in 1996 to about 3.72
million in 2010. Sanitation recorded remarkable
improvement during the first decade of democracy in
South Africa. This could be partly due to the roll out
of ventilated improved latrines (VIP) during the late
1990s and early 2000s. The recent fast increasing
trend in sanitation backlog could be partly attributed
to the fill-up of the VIP especially for area where
maintenance and emptying of VIPs are lacking. The
downwards trend in the water backlog as explained
earlier could be attributed to many household
accessing water from community stand pipes.
Figure 4. Lines of Backlog of Water, Housing and Sanitation
An important indicator of the ability of
government and other stake holders towards
achieving set targets in terms of various services is a
measure of the relationship between backlog in those
services and annual additional demand as a result of
increasing household numbers.
Table 4. Correlating Annual Additional Households & Service Backlogs
Ad_HH Wat_Blg House_Blg Sani_Blg
Ad_HH Pearson Correlation 1 -.988** .958** .883**
Sig. (2-tailed) 0.00 0.00 0.00
N 12 12 12 12
**. Correlation is significant at the 0.01 level (2-tailed).
Table 4 indicates an inverse relationship
(Pearson Correlation = -0.988, p = 0.00) between
annual additional household and water access
backlogs. This implies that water backlogs are
decreasing as households increase in time. Therefore,
with community standpipes within 200 metres from
households as an acceptable operational standard for
water access, government targets in the sector seem
feasible to achieve. However, housing and sanitation
backlogs show high positive correlations with annual
additional households. The means that backlogs for
housing and sanitation are increasing with increase in
household numbers, for these services targets may not
be reached without a significant increase in delivery
that could mitigate the effect of rapidly increasing
household numbers.
5. Conclusion
This paper emphasizes the importance of the
household as a socioeconomic unit for demographic
analysis and development planning. The paper further
highlights the structural changes in household patterns
in South Africa with the average household size
getting smaller over time. Even though studies
suggest that globally average household sizes are
decreasing over time, the issue with South Africa is
that the resulting (almost exponential) trend in the
1,00
1,50
2,00
2,50
3,00
3,50
4,00
4,50
5,00
5,50
1996 1998 2000 2002 2004 2006 2008 2010
Ho
use
ho
lds
in m
illi
ons
Housing Water Sanitation

Corporate Ownership & Control / Volume 11, Issue 1, 2013, Continued - 7
630
household line of growth is not commensurate with
the dynamics of the individual population.
This paper provides empirical evidence to the
opinion of some scholars on the subject that the rapid
growth in household numbers in South Africa could
be attributed to household Mitosis. The concept of
Mitosis or Fragmentation of households has not been
previously tested against the main components of
demographic change to explore their respective
contributing effects on the rapid growth phenomena
respect. The results confirm that indeed fragmentation
of household is the main driver of the rapid increase
in households in South Africa, while natural increase
in the population has an inverse effect on the rapid
increase of households. Even though net-migration
reflected a statistically insignificant coefficient, the
surge of migrants into South Africa cannot be
overlooked; further research with most recent data is
needed in this regard.
Service delivery evidently has received high
priority in post-apartheid regimes. Rapid household
growth puts enormous pressure on the service
delivery programmes for household-based services.
Understandably, the rapidly increasing trends may not
continue forever, the trends may not change in the
near future. Further studies are needed to investigate
the possible saturation point and time to the saturation
point. Meanwhile adequate provision should be made
in the service delivery models of government and
other stake holders for this rapidly increasing
phenomenon into the near future in order for the
various targets of universal access to basic services to
be achieved in South Africa. This would in a nutshell
entail the numerical apportionment of at least an
average of three hundred thousand new delivery units
per annum to compensate the additional households in
addition to the annual delivery units that are directed
towards dealing with historic backlogs especially for
housing and sanitation delivery.
References 1. Actuarial Society of South Africa. (2006). South
African Demographic Datasets based on ASSA HIV
Model, accessed from http://www.assa.org.za/aids/,
July 05 2007.
2. Amoateng, A .Y. and Richter, L. M. (2007). Social and
Economic Context of Families and Households in
South Africa. In Amoateng, A Y & Heaton T B, (Eds.),
Families and Households in Post-apartheid South
Africa: Socio-demographic Perspectives. Pretoria:
HSRC.
3. Bongarts J (2001). Household Size and Composition in
the Developing World in the 1990s, Population
Studies, 55; 263-279.
4. Cross, C. (2009). Impact of Social Security and
HIV/AIDS on Household Formation. Panel Discussion
at the ISI Conference, 17 – 22 August, ICC, Durban.
5. Development Policy Research Unit. (2005). Internal
Migration to the Gauteng Province. DPRU Policy Brief
Series, University of Cape Town.
6. Dorrington, R., Johnson, L., Bradshaw, D. and Daniel,
T. (2006). The Demographic Impact of HIV/AIDS in
South Africa: National and Provincial Indicators for
2006. Actuarial Society of South Africa, Cape Town.
7. Hemson, D. and O'Donavan, M. (2006). Putting the
Numbers to the Scorecard: Presidential Targets and the
State of Delivery. In Buhlungu, S., Daniel, J., Southall,
R. & Lutchman J. (Eds.), State of the Nation: South
Africa, 2005-2006. Pretoria: HSRC.
8. Kok, P., O'Donavan, M., Bouare, O.and van Zyl, J.
(2003). Postapartheid Patterns of Internal Migration in
South Africa. Pretoria: HSRC.
9. South African Data Archive. (1995). October
Household Survey 1994. Statistics South Africa,
Pretoria.
10. South African Data Archive. (1996). October
Household Survey 1995. Statistics South Africa,
Pretoria.
11. South African Data Archive. (1998). October
Household Survey 1997. Statistics South Africa,
Pretoria.
12. South African Data Archive. (1999). October
Household Survey 1998. Statistics South Africa,
Pretoria.
13. South African Data Archive. (2000). October
Household Survey 1999. Statistics South Africa,
Pretoria.
14. South African Data Archive. (2003). General
Household Survey 2002. Statistics South Africa,
Pretoria.
15. South African Data Archive. (2004). General
Household Survey 2003. Statistics South Africa,
Pretoria.
16. South African Data Archive. (2005). General
Household Survey 2004. Statistics South Africa,
Pretoria.
17. South African Data Archive. (2006). General
Household Survey 2005. Statistics South Africa,
Pretoria.
18. Statistics South Africa. (1998). The People of South
Africa: Population Census 1996. Statistics South
Africa, Pretoria.
19. Statistics South Africa. (2003). Census 2001: Census in
Brief. Statistics South Africa, Pretoria.
20. Statistics South Africa. (2012). Census 2011: Census in
Brief. Statistics South Africa, Pretoria.
21. Statistics South Africa. (2007). Statistical Release,
2006 Community Survey. Statistics South Africa,
Pretoria.
22. Statistics South Africa. (2010). Ten Percent Sample of
1996 Census Data. Online download from
www.statssa.gov.za, May 19.
23. Statistics South Africa. (2010). Ten Percent Sample of
2001 Census Data. Online download from
www.statssa.gov.za, May 19.
24. Statistics South Africa. (2010). Ten Percent Sample of
2006 Community Survey Data. Online download from
www.statssa.gov.za, May 19.
25. SPSS Inc. (1999). SPSS Regression Models. Chicago:
SPSS Inc.
26. Udjo, E. O. (1998). Fertility and Mortality Trends in
South Africa. Statistics South Africa, Pretoria.
27. Udjo, E. O. (2008). Demographic Projections of
Africa's Population for the Period 2000-2050 taking
into Account of HIV/AIDS and its Implication for
Development. Southern African Bussiness Review,
3(12).

Corporate Ownership & Control / Volume 11, Issue 1, 2013, Continued - 7
631
28. U.S. Census Bureau. (2009). South Africa:
Demographic Indicators, Online download from
http://www.census.gov/ipc/www/idb, June 16.
29. van Aardt, C. J. (2007). Population and Household
Projections for South Africa by Province and
Population Group, 2001 – 2021. BMR, Pretoria.
30. van Imhoff, E., Kuijsten, A., Hooimeijer, P. and van
Wissen, J G, 1995. Household Demography and
Household Modeling. New York: Springer.
31. Verdon, M. (1998). Rethinking Households: An
atomistic perspective on European living
arrangements. London: Routledge.
32. Zulu, E.M., and Sibanda, A. (2005). Racial Differences
in Household Structure. In Zuberi, T., Sibanda, A. and
Udjo, E.O. (Eds.). The Demography of South Africa.
New York: M.E Sharpe.

Corporate Ownership & Control / Volume 11, Issue 1, 2013, Continued - 7
632
THE LINK BETWEEN FINANCIAL MANAGEMENT, ORGANIZATIONAL CAPACITY BUILDING AND
EFFECTIVENESS IN NOT-FOR-PROFIT ORGANIZATIONS: AN EXPLORATORY STUDY
Ron Kluvers*
Abstract
The third sector literature argues that organizational capacity is important for Not-For-Profit (NFP) organizations to achieve their missions. Financial management skills are important for the enhancement of effectiveness, accountability and viability of NFP organizations. While effectiveness is a contested concept its attainment is an important aspect of NFP management. This paper examines the relationship between financial management, the development of capacity and the encouragement of effectiveness. A survey of 67 NFP organizations affiliated with the Victorian Council of Social Services (VCOSS) was conducted and the findings establish a link between financial management and organizational capacity. Keywords: Earnings Informativeness, Split Share Structure, Agency Problems * Centre for Enterprise Performance, Faculty of Business and Enterprise, Swinburne University, Australia E-mail: mailto:[email protected]
Introduction
Not-For-Profit (NFP) organizations are established to
address a need or problem in their community
(Holland and Ritvo, (2008). A NFP organization is
considered to be effective if it achieves its stated
objectives and reduces the need or introduces the
desired change. However, effectiveness is a contested
concept and therefore the methods of achieving
organizational effectiveness are unclear. Intuitively,
the ability to undertake programs, manage funds
assess performance and develop strategy should lead
to organizational effectiveness. These skills can be
grouped under the heading of “capacity” and the
enhancement of those skills referred to as “capacity
building”. However, the development of capacity
cannot happen in isolation but requires antecedent
conditions to be present. An important component of
those antecedent conditions is the existence within the
organization of financial management skills (FMS).
An important aspect of the governance in NFP
organisations is the ability to monitor the continued
viability of the organisation, and the ability to plan
and implement programs fulfilling the mission of the
organisation. This paper explores the link between
financial management skills, capacity building and
organizational effectiveness. It will be argued that if a
link can be established then a case can be made for
the development of FMS in NFPs being an important
part of governance of third sector organizations.
The model being suggested in this paper is that
the acquisition of financial management skills will
enable a NFP organization to develop capacity. The
development of capacity enables a NFP organization
to operate effectively. According to Herman and Renz
(2008) effectiveness in third sector organizations is a
contested concept and it is also a socially constructed
concept. However, they argue that it is not an
arbitrary concept. Herman and Renz (2008) point out
that there are meaningful dimensions of effectiveness
such as financial condition, fundraising performance
or program outcomes that can be supported by hard
data. Further, they argue that the use of generally
accepted accounting principles can provide evidence
about revenues, costs, and surplus that can provide
indications of an organization’s ability to manage
resources. The aim of this paper is to examine the
relationship between FMS, capacity building and
organizational effectiveness. The study reported in
this paper will focus on the FMS that may lead to the
enhancement of capacity in a NFP organization and
the development of organizational effectiveness. This
is an exploratory study that seeks to understand how
FMS might lead to enhanced capacity and the ability
for a NFP organization to operate effectively.
In the next section of this paper the literature
regarding capacity building and effectiveness will be
discussed. This will be followed by the posing of the
research question and an explanation of the research
method. The findings will then be reported followed
by a discussion of the results. Finally, conclusions
will be suggested.
Corporate Ownership & Control / Volume 11, Issue 1, 2013, Continued - 7
633
The relationship between FMS, capacity and effectiveness
For the purposes of this paper FMS includes the
ability to: understand an organization’s accounting
system and financial statements; to be able to analyse
the organization’s financial statements and use the
information to assess the viability of the NFP and
likely impact of the organizations strategic direction;
to manage cash and develop monitor budgets. These
skills are important for the enhancement of an
organization’s ability to achieve its mission. Without
capacity a NFP is limited in its ability to operate
effectively. The acquisition of FMS, as described
above, is an important component of a NFP
organization’s capacity building.
Capacity is defined by Eisinger (2002) as: a set
of attributes that help or enable an organization to
fulfil its mission He goes on to point out that effective
organizations have a broad range of capacity
attributes and the ability to use that capacity to meet
organizational objectives. Eisinger argues that, based
on the findings of others, that the critical components
of capacity include acquiring appropriate resources,
effective leadership, skilled and sufficient staff, a
certain level of organizational structure and links to
the broader community from which the organization
can receive assistance.
According to Wagner (2003) there is no one
single initiative that increases the effectiveness of
Not-For-Profit (NFP) organization but rather a
systematic approach to improve the organization’s
capabilities at all levels. However, Wagner (2003)
goes on to point out that building capacity utilizes
many resources that NFP management would prefer
to use on programs. Wagner (2003) argues that donors
have sought to increase the leverage from their
donations by encouraging NFP capacity building. He
continues that donors are justified in their demand
that organizations undertake systematic capacity
building to improve their effectiveness. However,
Wagner (2003) also points out that NFPs have been
impeded in their efforts to develop capacity by a lack
of knowledge about how to do so.
It is argued by Fredericksen and London (2000)
that internal organizational capacity enables
organizations to implement programs and achieve
goals and is derived from various elements within the
organization. They propose that there are four
elements of organizational capacity: 1) Leadership
and Vision, 2) Management and Planning, 3) Fiscal
Planning and Practice and 4) Operational Support.
Financial management is a significant component of
elements 2 and 3. Management and Planning and the
ability to adapt to changing circumstances are
essential to the survival of NFP organizations. While
Fiscal Planning and Practice enables a NFP
organization to support operations with adequate and
predictable financial resources.
Fredericksen and London (2000) emphasize that
this element of capacity is centred upon the existence
and use of a formal fiscal systems incorporating
fundraising, financial tracking systems and financial
reporting systems. A formal fiscal system provides
important information for planning as well as
evidence of accountability. The elements of capacity
operate interdependently with other organizational
components such as the existence of a budget and the
process of developing the budget both indicate the
ability of an organization to adapt to its environment
(Fredericksen and London (2000).
Dart (2010) states that effectiveness can be
defined in a number of ways but argues that the
concept of effectiveness centres on the extent to
which a NFP fulfils the purpose for which it exists.
However, Dart continues that there is no evidence that
effectiveness is understood beyond the initial steps
which commence but do not fulfil the causal chain
required to produce the change to which the NFP
aspires. He goes on to state that effectiveness is linked
to the ability to evaluate an organization’s programs
and the accountability of the organization. Both
require the existence of FMS within the NFP. In
keeping with Dart (2010) is the argument made by
Chenhall et al. (2010) that within the resource
dependent environment in which most NFPs operate
the ability to attract resources is linked to the ability
to plan and demonstrate that actions are consistent
with plans and that governance is maintained.
Herman and Renz (2008) state that a key
element found in the more effective organisations is
that they are more likely to use accepted management
practices. They also note that some NFP leaders are
uncomfortable with the idea that NFP effectiveness is
a social construct. However, they go on to say:
“ although effectiveness is socially constructed,
there are useful dimensions of effectiveness (for
example, financial condition, fundraising
performance, or program outcomes)n that can be
grounded in hard data. For example, use of generally
accepted accounting principles provides solid
evidence about revenues, costs, and surplus. Other
dimensions of effectiveness, such as those related to
community collaboration or working with volunteers,
are likely to be less amenable to hard evidence. We
support and encourage the use of hard evidence to the
extent it is legitimately possible.”(p. 410)
Thus, the effective operation of an NFP
organization is linked to capacity of which FMS is an
important element. The link between capacity and
effectiveness was further reinforced by Eisinger who
quoted Forbes (1998) as defining effectiveness in two
ways: 1) the extent to which an organization achieves
its goals; and 2) the extent to which an organization
has the ability to acquire and use resources to function
and sustain its own survival.
The ability of an organization to achieve its
goals and marshal resources is enabled by the
organization’s capacity. While capacity is linked to
Corporate Ownership & Control / Volume 11, Issue 1, 2013, Continued - 7
634
the ability to undertake the following activities:
strategic planning, budgeting, costing, recording and
reporting financial transactions, monitoring cash-
flow, measuring financial and non-financial
performance (Anthony and Young 2003, and Zietlow
Hankin and Seidner, 2007). In addition Ritchie and
Kolodinsky (2003) point out that a significant
component of organizational capacity and
effectiveness is supported by management skills,
particularly financial management skills. They argue
that the ability to use financial analysis by NFP
managers is important for ensuring sound financial
management of NFP organizations and enabling the
organization to fulfil its objectives.
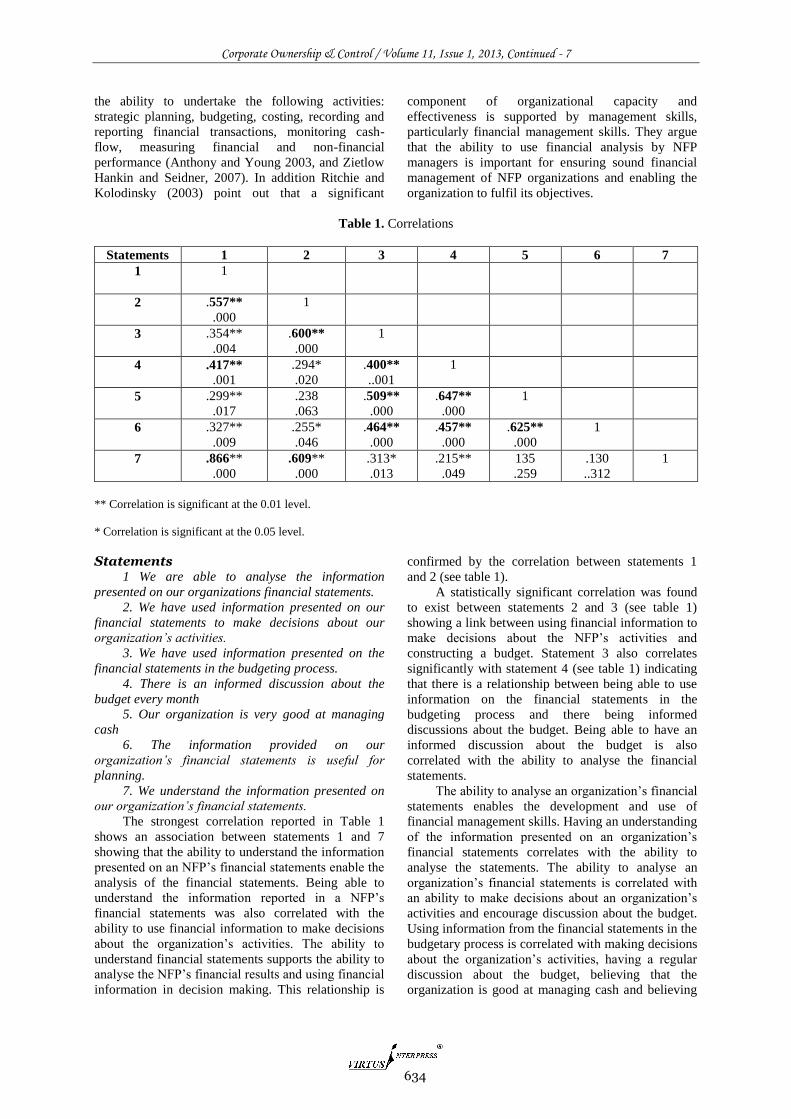
Table 1. Correlations
Statements 1 2 3 4 5 6 7
1 1
2 .557**
.000
1
3 .354**
.004
.600**
.000
1
4 .417**
.001
.294*
.020
.400**
..001
1
5 .299**
.017
.238
.063
.509**
.000
.647**
.000
1
6 .327**
.009
.255*
.046
.464**
.000
.457**
.000
.625**
.000
1
7 .866**
.000
.609**
.000
.313*
.013
.215**
.049
135
.259
.130
..312
1
** Correlation is significant at the 0.01 level.
* Correlation is significant at the 0.05 level.
Statements 1 We are able to analyse the information
presented on our organizations financial statements.
2. We have used information presented on our
financial statements to make decisions about our
organization’s activities.
3. We have used information presented on the
financial statements in the budgeting process.
4. There is an informed discussion about the
budget every month
5. Our organization is very good at managing
cash
6. The information provided on our
organization’s financial statements is useful for
planning.
7. We understand the information presented on
our organization’s financial statements.
The strongest correlation reported in Table 1
shows an association between statements 1 and 7
showing that the ability to understand the information
presented on an NFP’s financial statements enable the
analysis of the financial statements. Being able to
understand the information reported in a NFP’s
financial statements was also correlated with the
ability to use financial information to make decisions
about the organization’s activities. The ability to
understand financial statements supports the ability to
analyse the NFP’s financial results and using financial
information in decision making. This relationship is
confirmed by the correlation between statements 1
and 2 (see table 1).
A statistically significant correlation was found
to exist between statements 2 and 3 (see table 1)
showing a link between using financial information to
make decisions about the NFP’s activities and
constructing a budget. Statement 3 also correlates
significantly with statement 4 (see table 1) indicating
that there is a relationship between being able to use
information on the financial statements in the
budgeting process and there being informed
discussions about the budget. Being able to have an
informed discussion about the budget is also
correlated with the ability to analyse the financial
statements.
The ability to analyse an organization’s financial
statements enables the development and use of
financial management skills. Having an understanding
of the information presented on an organization’s
financial statements correlates with the ability to
analyse the statements. The ability to analyse an
organization’s financial statements is correlated with
an ability to make decisions about an organization’s
activities and encourage discussion about the budget.
Using information from the financial statements in the
budgetary process is correlated with making decisions
about the organization’s activities, having a regular
discussion about the budget, believing that the
organization is good at managing cash and believing

Corporate Ownership & Control / Volume 11, Issue 1, 2013, Continued - 7
635
that information provided by the financial statements
is useful for planning.
The results reported in Table 1 suggest that there
is a relationship between being able to analyse
financial statements and being able use information
presented on our financial statements to make
decisions about our organization’s activities.
Table 2. Correlations
Statements 1 2 3 4
1 1
2 .374**
.002
1
3 .566**
.000
.509**
.000
1
4 .290*
.019
.460**
.000
.345**
.005
1
** Correlation is significant at the 0.01 level.
* Correlation is significant at the 0.05 level.
Statements 1. Financial management is an important
aspect of capacity build in our organisation.
2. We have used the information presented on
our organization‘s financial statements in the
budgeting process.
3. Our organisation is very good at managing
cash.
4. We are able to determine the reasons for the
difference between our budgeted and actual results.
The correlations reported in Table 2 are all
statistically significant however only three are of
moderate strength. There is a correlation between
considering financial management being an important
aspect of organizational capacity building and the
perception that the organization is good at managing
cash. The belief that the organization is good at
managing cash is also correlated with using
information presented in the organization’s financial
statements in the budgetary process. This last
statement is also correlated with the ability to
determine the reasons for the differences between
actual and budgeted results.
Discussion and Conclusions
The research reported in this paper has investigated
the link between FMS and the enhancement of
capacity in a NFP organization and the development
of organizational effectiveness. This was an
exploratory study that sought to understand how FMS
might lead to enhanced capacity providing the ability
for a NFP organization to operate effectively. The
results reported in this paper indicate that there is an
association between the acquisition and use of FMS,
the strengthening of organizational capacity and the
creation of an environment in which organizational
effectiveness could be enhanced.
The results reported in Tables 1 and 2 show that
having the FMS of being able to understand and
analyse an organization’s financial statements
encourages the use of financial statement information
in budgeting and planning and is also linked to good
cash management. Good cash management is
fundamental to the continued viability and
development of NFP organizations.
It should be noted that the FMS of being able to
analyse a NFP organization’s financial statements was
correlated with using financial statement information
to make decisions (capacity building), understanding
and the financial statements (a financial skill) and
having informed monthly discussions about the
budget (capacity building), indicating that it is the
understanding of and ability to analyse the financial
statements that form the basis for capacity building.
Having the FMS to understand and analyse an
organization’s financial reports encourages capacity
building by providing useable financial information
that can be used in planning and budgeting. This
process was also supported by informed budgetary
discussions.
The results reported in tables 1 and 2 point to an
association between FMS and capacity building that is
non-linier. The presence of FMS skills creates
opportunities for the development of capacity as
suggested by the literature. The ability to understand
and analyse a NFP’s financial statements allows the
staff and board of the NFP to understand the
implications of their decisions and to better monitor
the financial management of the NFP.
However, the evidence for effectiveness to
develop directly from capacity is not as clear. While
capacity must be present for a NFP organization to
operate effectively a direct link between the two is
difficult to substantiate. Capacity enables an
organization to plan, enhance decision making and
encourages a discourse around purpose therefore
providing the initial steps towards effectiveness as
suggested by Dart (2010).

Corporate Ownership & Control / Volume 11, Issue 1, 2013, Continued - 7
636
As stated initially this was an exploratory study
to understand whether there is a correlation between
the acquisition and use of financial management
skills, the strengthening of organizational capacity
and the creation of an environment in which
organizational effectiveness is enhanced. The findings
reported in this paper indicate the presence of FMS
can support capacity building leading to the
development of effectiveness in a NFP organization.
However, this conclusion must remain tentative until
further research can be undertaken, in particular,
qualitative research to investigate the nature of the
relationships between FMS, capacity and
effectiveness.
References
1. Anthony R, and D. Young, 2003, Management Control
in Nonprofit Organizations, McGraw-Hill Higher
Education, 7th ed., boston.
2. Chenhall R., M. Hall, and D. Smith, 2010, Social
Capital and Management Control Systems: A Study of
Non-Government Organizations, Accounting,
Organizations and Society, 35, 737-756.
3. Dart R., 2010, A Grounded Qualitative Study of the
Meanings of Effectiveness in Canadian ‘Results-
Focused’ Environmental Organizations, Voluntas,
21:202-219.
4. Eisinger (2002), Organizational Capacity and
Organizational Effectiveness among Street-Level Food
Assistance Programs, Nonprofit and Voluntary Sector
Quarterly, 31 (1), 115-130.
5. Forbes D. (1998), Measuring the Unmeasurable:
Empirical Studies of Nonprofit Organization
Effectiveness from 1977 to 1997, Nonprofit and
Voluntary Sector Quarterly, June 1998 27: 183-202,
6. Fredericksen P. and R London (2000), Disconnect in
the Hollow State: The Pivotal Role of Organizational
Capacity in Community-Based Development
Organizations, Public Administration Review, 60 (3),
230-239.
7. Herman R. and D. Renz, 2008, Advancing Nonprofit
Organizational Effectiveness Research and Theory,
Nine Theses, Nonprofit Management & Leadership, 18
(4), 399-415.
8. Ritchie and Kolodinsky (2003), Nonprofit
Organization Financial Performance Measurement An
evaluation of new and existing financial performance
measures, Nonprofit Management & Leadership, 13
(4), 367-381.
9. Wagner L., 2003, Why Capacity Building Matters and
Why Nonprofits Ignore it, New Directions for
Philanthropic Fundraising, No. 40,103-111.
10. Zietlow J., J. Hankin, and A. Seidner, 2007, Financial
Management for Nonprofit Organizations, John Wiley
& Sons Inc., Hoboken, New Jersey.

Corporate Ownership & Control / Volume 11, Issue 1, 2013, Continued - 7
637
CORPORATE GOVERNANCE AND FIRM VALUATION IN EMERGING MARKETS: EVIDENCE FROM UAE LISTED
COMPANIES IN THE MIDDLE EAST
Mohamed Adawi*, Kami Rwegasira**
Abstract
There has been previous empirical research on corporate governance and board of directors which focused on attempting to find a direct relationship between internal governance variables and firm valuation. It has however also been argued that there are differences in the nature, direction, magnitude and processes of operation of this relationship between developed and developing financial markets because of differences in their respective economic, social, regulatory framework and market behaviour . This study examines this relationship in the context of the United Arab Emirates (UAE) as one of the emerging markets in order to extend evidence further beyond the western developed capital markets into the Middle East. Does the prevalence of family-ownership in the UAE for example matter to the company valuation? What about the presence of institutional ownership or ownership concentration? And do the corporate communication and disclosure scores published by the UAE Institutional Investor in cooperation with Hawkamah, The Institute for Corporate Governance; have any relationship to corporate valuation? More specifically this study, using multiple regression analysis, examines the impact of firm level internal corporate governance indicators namely board structure, ownership structure, and transparency and disclosure governance practices on the valuation of listed companies in the UAE after controlling for company size, industry, leverage, and dividend payout using Tobin's Q, Price - Earning Ratio (PER) and Price - Book Value Ratio (PBVR) as surrogates for company valuation. The results show no significant relationship between internal corporate governance indicators and company valuation when using Tobin's Q and PBR as measures of company valuation. However they reveal statistically significant links between some of the internal corporate governance indicators on the one hand and company market valuation on the other when company valuation is measured by the price earnings ratio (PER) which is one of the most common and important stock market indicators for investors. These results suggest that the company valuation measures like the price earnings ratio which explicitly reflects the financial markets assessment of the firm investment and dividend policies lead to a better correlation with internal corporate governance indicators. Moreover, the regression results indicate that the frequency of board meetings, adoption of best transparency practices and the presence of private institutional investors such as sovereign wealth funds are the most significant internal corporate governance variables in accounting for differences in company market values in the UAE. The structural aspects of the board such as size and composition turned out not to be statistically significant in their impact on company valuation. Keywords: Corporate Governance, Company Valuation, Corporate Board, Emerging Markets, Middle East, United Arab Emirates (UAE), Abu Dhabi Stock Exchanges (ADX) * MBA, FCCA, DBA, Chief Strategy Officer -Abu Dhabi Petroleum Ports Operating Company, P.O Box 61, Abu Dhabi, UAE Tel: 00971505323495 Fax: 0097126740512 E-mail: [email protected] ** Professor of Finance and Chair, Department of Accounting, Finance & Economics, Maastricht School of Management, MSM, Endepolsdomein 150. 6229 EP Maastricht, P.O.Box 1203. 6201 BE Maastricht, The Netherlands Tel: +31- 43-3870883 Fax: +31- 43-3870800 E-mail: [email protected]

Corporate Ownership & Control / Volume 11, Issue 1, 2013, Continued - 7
638
1. Introduction
1.1 Corporate Governance
One of the preoccupations of effective corporate
governance is the promotion of the attainment of high
level financial performance and market valuation on
behalf of the shareholders (Klapper & Love, 2004;
Rajagopalan & Zhang, 2008). La Porta, Lopez-de-
Silanes, Shleifer, and Vishny (2000) argue however
that emerging economies have traditionally been
discounted in financial markets because of their weak
governance.
This paper specifically investigates aspects of
internal corporate governance as an important driver
in corporate governance. Such a study may provide
insights to improvements in corporate governance and
possible better valuations in an emerging market
economy like UAE.
In the UAE the research is specifically motivated
by the UAE Securities and Commodities Authority
(SCA) recommendation to address the corporate
governance challenges that face the country as its
opportunities for investment and growth emerge.
The exercise of corporate governance is
normally associated with the structure and function of
the board of directors and much of the discussion
focuses on the composition of the board in regard to
the role of non-executives, separate chairman and
chief executives, and establishing board committees
(remuneration, audit and nominating committees). A
large body of empirical research has examined
different board characteristics such as board size
(Yermack, 1996), and the proportion of outsiders to
insiders (Baysinger and Butler, 1985). Empirical
research has also been carried out to analyse the
conduct and processes of the board by exploring the
dynamics of power, influences and the behaviour of
board members and their relationship with
management and mainly the CEO (Leblanc and
Gillies, 2005).But not much has been investigated
about the relationship between internal corporate
governance and corporate valuation beyond the usual
developed markets and with specific focus on
emerging markets , not to talk about the UAE socio-
economic environment in particular .
1.2 Importance of the Proposed Research
The study of corporate governance in UAE is
important because this type of economy possibly has
a number of unique governance features and issues
not prevalent in more widely researched developed
economies, like family-dominated ownership
structures which may be associated with unique
agency problems and firm valuation in the UAE.
Family-run companies may also present challenges in
terms of monitoring the transparency of operations in
order to meet international standards of corporate
governance (Jackling & Johl, 2009). The weak
investor protection inherent in many MENA countries
offers an opportunity for firms to differentiate
themselves from the rest and send strong and credible
signals to attract investors by self adopting good
corporate governance practices and policies, thus
partially compensating investors for the weak legal
environment in which these firms operate. Klapper
and Love ( 2004) and Durnev and Kim ( 2005) show
that corporate governance provisions matter more in
countries with weak legal protection.
In summary the objectives of this research will
be:
1. To investigate the relationship between
internal corporate governance variables and corporate
market valuation of UAE listed companies
2. To expand the understanding of corporate
governance practices in UAE listed companies and
specially the transparency and disclosure practices
adopted by listed firms.
The specific research questions to be addressed
here are:
1. What are the internal firm level governance
variables that significantly influence firm valuation of
listed companies in the UAE?
2. To what extent do boards’ structure variables
significantly influence firm valuation in UAE listed
companies?
3. To what extent do variables for ownership
structure influence firm valuation in the UAE?
2. Review of the Literature
2.1. Classifications of Corporate Governance Mechanisms
A significant amount of theoretical and empirical
work has been undertaken in order to describe and
classify corporate governance mechanisms (Jensen
and Meckling 1976; Fama and Jensen, 1983, Jensen
1986, Jensen 1993). Denis and McConnell (2003)
presented the dual classification of corporate
governance mechanism as (1) internal governance
mechanisms including boards of directors and
ownership structure and (2) external ones including
the takeover market and the legal regulatory system.
Farinha (2003) describing the internal disciplining
mechanisms as opposed to the external disciplining
mechanism, indicates that it includes large and
institutional shareholders, board of directors, insider
ownership, compensation packages, debt policy, and
dividend policy. Shleifer and Vishny (1997), calls the
two complimentary disciplining mechanisms as
market oriented and large shareholder - oriented
systems.
Weimer and Page (1999) focusing largely on
developed markets and Rwegasira (2000) focusing on
emerging markets in Africa , in different types of
analyses, reach a broadly similar classification
distinguishing between “market-oriented” and

Corporate Ownership & Control / Volume 11, Issue 1, 2013, Continued - 7
639
“network oriented” or “institutionally- based” systems
of corporate governance.
The market –based disciplining mechanism is
prevalent in developed markets particularly the USA
and UK where shareholding is characteristically
widely spread.
In contrast, shareholding is concentrated in
developing financial markets and follows a hybrid
system of corporate governance suggesting that the
block holders play an important role in monitoring the
activities of a firm in these financial markets.
Pyramidal and cross-shareholding, illiquid capital
markets and ineffective regulatory authority are also
features of those markets (Franks and Mayers, 1997;
Allen and Gale, 2001). The regulatory and judicial
framework in a developing market is rather
ineffective in playing any role in improving the value
of a firm.
In summary there is a broad consensus that
corporate governance mechanisms can be classified
into two broad categories: 1) the internal or firm-level
mechanisms which focus on the contribution to
governance by, inter alia, large and institutional
shareholders, board of directors, insider ownership,
compensation packages, debt policy, and dividend
policy, and 2) the external governance mechanisms
which are driven largely by the discipline imposed by
the financial markets via corporate take-over market
and the regulatory framework.The focus in this paper
is on the internal disciplining mechanism.
2.2. Relationship between Corporate Governance and Company Valuations
According to Black, Jang, and Kim (2003),
companies with better corporate governance have
better operating performance than companies with
poor corporate governance. They used Standard and
poor's corporate governance indicators ranking, which
include the structure of the board of directors, the
structure of ownership, and information transparency.
Javed & Iqbal (2007) investigated whether
differences in quality of firm-level governance
mattered to performance in a cross section of 50
companies listed on the Karachi Stock exchange
.They analysed the relationship between firm level
values as measured by Tobin's Q and the total
Corporate Governance Index (CGI) which had three
sub indices (board, shareholding and ownership, and
disclosure and transparency). The results indicate that
corporate governance does matter in Pakistan.
Bai, liu, Lu & Zhang (2004) constructed an
index to reflect overall level of governance practices
for China listed companies. The categories in their
index include four internal governance mechanisms:
board of directors, executive compensation,
ownership structure & financial transparency. Their
results indicate better corporate governance leads to
higher firm value and Chinese investors are willing to
pay premium for better corporate governance.
According to Lei & Song (2004) the major areas
of internal corporate governance mechanisms are
board structure, executive compensation, ownership
structure, conflict of interest in executives, and
financial transparency. Based on these five areas, he
constructed general model representing overall
corporate governance in Hong Kong and ranked the
listed companies accordingly.
There is evidence that broad measures of firm-
level corporate governance predict higher share prices
in emerging markets. This evidence comes from both
single country studies (Black, 2001 in Russia, Black,
Jang & Kim, 2003 in South Korea, Gompers, Ishii
and Metrick, 2003 in the U.S) and multi -country
studies (Durnev & Kim, 2005; Klapper and Love,
2004)
Javed & Iqbal (2007) investigated whether
differences in quality of firm level governance
mattered to performance in a cross section of
companies listed at Karachi Stock exchange. They
analysed the relationship between firm level values as
measured by Tobin's Q and the total Corporate
Governance Index (CGI) which has three sub indices
(board, shareholding and ownership, and disclosure
and transparency) for a sample of 50 firms. The
results indicate that such corporate governance does
matter in Pakistan.
The list of other related studies which have
sought to establish the relationship between corporate
governance and the performance or valuation of the
firm include Immik (2000) , Beiner, Drobetz, Schmid
& Zimmermann(2004) in the case of Switzerland ,
(Bradley, 2004) , Mitton (2001) in a cross country
study of the Asia-Pacific region , Banerjee et al.
(2009) in India , Brown and Caylor (2004) who
looked at 2327 U.S. firms, and found that better
governed firms are also more profitable more valuable
and pay higher dividends, Klapper and Love (2004)
who find evidence that firm-level corporate
governance provisions matter more in countries with
weak legal environments, Black (2001) in Russia who
demonstrates that corporate governance behavior has
a powerful effect on market value in a country where
legal and cultural constraints on corporate behavior
are weak and Kravchenko & Yusupova (2005)
analysis which shows that investors tend to pay less
for companies with lower level of corporate
governance in Russia.
2.3 Company valuation and its measurement
In economics or finance, the term value refers to the
price for which a good or object can be exchanged
(exchange value or market value) and is approximated
by the discounted cash flow expected to be generated
by the good or asset. Some of the important measures
or indicators of value a firm in the existing literature
include the following

Corporate Ownership & Control / Volume 11, Issue 1, 2013, Continued - 7
640
1/ Tobin's Q
Tobin's Q is defined as the ratio of the market value of
assets (equity and debt) to the replacement value of
assets. Tobin's Q is widely used to value a firm in
both developing and developed financial markets as
exemplified by MacAvoy & Millstein (2003) and
Sanda, Mikailu, & Garba (2005).
2/ Market to Book Value Ratio (MBVR)
Market to book value ratio is also used to value a firm
in the financial market (see: Drobetz, Schillhofer, and
Zimmermann 2002) .This measure relates the market
value of a firm to its book value. Higher market to
book value ratio shows that a firm is in a position to
generate more returns with respect to the capital
invested, while a lower ratio suggests that the
company is unhealthy and will not be able to create
value for the shareholders by generating higher
returns as suggested by Peirson, Brown, Easton
(2000).
3/ Price Earnings (P/E) Ratio (PER)
PER is calculated by dividing the current market price
of a share by the earnings per share. It is widely used
to measure the value of a firm in developing and
developed financial markets Sanda, Mikailu, and
Garba (2005) Drobetz, Schillhofer, and Zimmermann
(2002). And the price-earnings ratio (P/E ratio) can
also be related to the theoretical valuation Discounted
Dividends Model (DDM) of the firm which suggests
that P = d1 / (k –g) as shown below (when either side
of the equation is divided by E)
P/E = (d1/E) / (k –g)
where
d1 = dividend amount expected at the end of the
current year and thus d1/E is dividend payout ratio
E = Earnings per share (EPS)
k= required rate of return on this company share
P = current share market price or value
g=expected rate of growth of the firm dividends
(p.a.)
The variable reflects how much investors in the
market are prepared to pay for the current earnings of
the firm and it can be taken as an indicator for a
company's future earnings growth and value potential.
It represents the market assessment of the investment
and dividend policies of a firm as suggested by Morin
and Jarrell (2001) and Copeland, Weston and Shastri
(2005).
There is a substantial literature in support for the
choice of the three measures used in this study viz.
Tobin's Q, Price-Market Book Value Ratio, and Price-
earnings Ratio. Bhagat and Jefferis, (1994), Gompers
et al. ( 2003), Beiner and Schmid (2005), Morck,
Shleifer & Vishny (1988) as well as Kravchenko &
Yusupova (2005) employ the above market based
measures in their research on corporate governance
and firm performance. Sanda, Mikailu, and Garba
(2005) in their study of corporate governance
mechanisms and firm performance of Nigerian
companies used also alternative measures of firm
performance: ROA, ROE, PE ratio & Tobin's Q.
Drobetz, Schillhofer, and Zimmermann (2002)
in their study 63 German stock market companies and
trying to relate governance ratings to fundamental
valuation measures, used measures such as dividend
yield, price-earnings ratio, and market to book ratios.
And finally Abdo and Fisher (2007) in their study in
South Africa used three measures for the firm value,
namely the annual average share price returns, market
to book ratio, and price earning ratios.
Despite several weakness in both financial and
market based, more and more studies now rely on
market based measures. For instance, Demsetz et al.
(1985) used accounting measures, but Demsetz et al.
(2001) shifted to market - based measures. Banerjee et
al. (2009) believe higher reliance on market based
measures is justifiable because market-based
measures are less susceptible to accounting
manipulation or variations and they reflect investor
perceptions about the firm's future prospects. Price-
Earning Ratio (P/E) is a forward looking measure. It
shows the premium paid by the investors to own a
share on the basis of anticipated cash flow of a
company (Banerjee et al. (2009)).
In the study reported herein, we undertook to
measure company valuation in different ways
simultaneously to test the consistency of the research
results.
2.4. Internal Corporate Governance Indicators Affecting Firm Valuation
In as much as according to Rashid (2008) corporate
governance in general has a positive relationship with
the value of a firm in developing and developed
financial markets, this study focus specifically on the
internal corporate governance. And adopting the
Standard and Poor's (S&P) classification of internal
corporate governance indicators we put these
variables into three sub-categories:1/ board and
management structure and processes 2/ ownership
structure and investor relations and
3/ financial transparency and information
disclosure .Studies which have followed and used
similar S&P corporate governance indicators include
those of Black, Jang, and Kim (2003), and Javed &
Iqbal (2007).
2.4.1 Board Structure Variables and Company
Valuation
Board structure here focuses on the optimum size of
the board, board composition, board meetings, the
number of board committees that are needed, and the
Corporate Ownership & Control / Volume 11, Issue 1, 2013, Continued - 7
641
board leadership structure. These are the board
structural elements largely influenced by the roles the
board chooses to play like it is well explained further
by Carter and Lorsch (2003
2.4.1.1 Board Size:
There are two hypotheses regarding the effect of
board size on corporate performance. Jensen (1993)
and Lipton and Lorsch (1992) suggest that large
boards can be less effective than small boards,
because director free riding increase and the board
becomes more symbolic and less a part of the
management process. In support of this position
Yermack (1996) finds an inverse relationship between
firm performance and board size for US firms.
The other hypothesis is that larger boards
contribute to higher firm value, because they bring
together specialists from various functional areas, and
thus enhance their problem solving capabilities.
(Haleblian and Finkelstein, 1993). A larger board has
a wider range of expertise to make better decisions for
a firm and it is harder for a CEO to dominate a bigger
board because the collective strength of its members
is higher and can resist the irrational decisions of a
CEO (Pfeffer ,1972) and Zahra & Pearce ,1989).
However larger boards being usually associated with
higher agency costs which impact negatively the
value of the firm and smaller boards usually being
more efficient in decision making as highlighted by
Yermack (1996) , the likely relationship between
corporate board size and corporate market value may
as well be of an inverted V-shaped or as non-linear
inverted U-shaped , we will however still simply
hypothesize that
H1: The larger the size of the board the higher
the positive impact on the company valuation.
2.4.1.2 Board Meetings
The bulk of board’s work is carried out in meetings.
Board meetings can therefore be used to measure the
contribution by board members to ensure their full
commitment and engagement in overseeing the
running of the company business and monitoring
management. Chidambaran, Palia & Zheng (2006)
quote Vafeas (1999) and Adams, Almeida and
Ferreira (2005) finding that firm value is increased
when boards meet more often. Mace (1986) argues
that firm performance is a function of so many
different factors that it is difficult to imagine that the
effect of occasional board meetings would be
detectable especially in case studies.
But Charan (2005) suggests that holding more or
longer meetings will not always improve board
dynamics or add value, unless the board members
prepare well for these meetings and the meetings
themselves are well run.
Where does the UAE stand on the impact of the
frequency of board meetings on corporate value?
Carter and Lorsch (2003) hold that currently, there are
some signs of a global convergence on around eight
meetings per year. In the sample used in this study, on
average only two board meetings were held per year.
This is representative of current practices in UAE. In
contrast the corporate governance code proposes six
meeting every year, which leaves the majority of
listed companies well below the threshold of good
governance with regard to meetings. So, we will test
if the value of UAE listed companies’ has increased
when they scheduled more board meetings and
proceed to hypothesize here that.
H2: The higher the number of actual board
meetings the higher the company valuation
2.4.1.3 Board Composition (Non Executive
Directors)
The composition of the board is an important factor
for its effectiveness, because of the need to build and
sustain the right team, according to Carter and Lorsch
(2003). With respect to board composition, we will
assess how the company valuation could be affected
by the representation of non-executive directors.
Weisbach (1988) is one of the earliest studies to
report an association between the presence of outside
directors and firm performance calculated using
accounting measures. A second set of studies by
Morck et al. (1988), Hermalin and Wiesbach (1991),
and Bhagat and Black (2000) using Tobin’s q and
accounting measures to calculate firm performance
suggests that there is no significant relationship
between the proportion of outside directors and firm
valuation.
In this case it is hypothesized that company
valuation rises with a higher percentage of non-
executive directors on the board and thus
H3: The higher the percentage of non-executive
directors on the board the higher the company
valuation
2.4.2 Ownership Structure Variables and Company
Valuation
2.4.2.1 Private Institutional Ownership
The primary focus here is on the impact of
institutional ownership on firm valuation, as
independent outside directors with their investor’s
wealth at stake. Institutional investor’s representative
on the board can have a positive impact through their
ability to discipline management as well as monitor
and influence corporate performance. (Shleifer &
Vishny ,1986; Maug ,1998) Other shareholders can
free ride on the large shareholder’s activities, because
they do not bear the costs of information gathering
and other process. Results of empirical research on
the impact of institutional ownership and monitoring
on firm’s financial and marker valuation are however
mixed .They include

Corporate Ownership & Control / Volume 11, Issue 1, 2013, Continued - 7
642
McConnell and Servaes (1990) who find a
positive relationship between firm performance as
measured by Tobin’s Q, and ownership by
institutional investors and large block holders on the
one hand and . Aqrawal and Knoeber (1996) get a
negative relationship.
Maug (1998) noted that whether institutions use
their ability to influence corporate decisions is in part
a function of the size of their shareholdings. If
shareholding by institutional investors is high, shares
are less marketable and are thus held for longer
periods. In this case, there is greater incentive to
monitor a firm’s management. However, when
institutional investors hold relatively few shares in a
firm, they can easily liquidate their investments if the
firm perform poorly, and there have less incentive to
monitor. Several studies including those of Coffee
(1991), and Maug (1998) conclude that institutional
investors’ goal of maintaining the liquidity of their
holdings and their desire for short-term profit
outweighs the benefits of monitoring management in
the hope of promoting higher long-term profitability.
In this study we seek to test out the hypothesis that
H4: The larger the percentage of private
institutional ownership the higher the company
valuation.
2.4.2.2. Ownership Concentration
Ownership concentration refers to the proportion of a
firm's shares owned by a given number of the largest
shareholders. A high concentration of shares tends to
create more pressure on managers to behave in ways
that are value- maximizing. In support of this
argument, Schleifer & Vishny (1997) and Morck et al.
(1988) suggest that an increase in concentration will
be associated with an increase in firm value, but that
beyond a certain level of concentration, the
relationship might be negative.
Other studies such as Renneboog (2000)
reported results not totally in agreement with the
hypothesis of a positive relationship. Agrawal &
Knoeber (1996) reported no evidence to support the
positive relationship between firm performance and
ownership concentration. Holderness & Shehan
(1988) find little evidence that high ownership
concentration directly affects performance,
The role of majority shareholders (concentrated
shareholding) is important in affecting the value of a
firm. The studies conducted by Pinkowitz, Stulz, and
Wiklliamson (2003) and the World Bank (2003) argue
that large shareholders are mostly involved in
tunnelling and suppressing the rights of minority
shareholders. On the contrary, Shleifer and Vishny
(1986) and Kaplan and Minton (1994) suggest that
block holders play a constructive role in improving
the value of a firm in developing markets as they
inject the provisions of corporate governance into a
firm making it more democratic.
Grossman and Hart (1982) maintain that
majority shareholders also solve free rider problem.
Free rider problems arise when some of the
shareholders do not pay the monitoring cost and
acquire benefits from the cost paid by others. Frank
and Mayer (1997) support the same views and
confirm that majority shareholders discipline the
board by removing the underperforming directors and
by preventing managers from over spending the free
cash flow. These measures protect the rights of the
shareholders and improve the value of a firm.
Dispersed ownership is preferred in the US, UK, and
Europe in order to deny any single shareholder or
group privileged access to or excessive influence over
decision making. There is a belief that in emerging
markets concentrated ownership is preferred and thus
it is hypothesized that
H5: A higher concentrated ownership is
associated with a higher company valuation.
2.4.3 Transparency Practices and Company
Valuation
While disclosure is required to keep the investing
public informed, it is also a tool to ensure that
management and the board keeps the best interest of
all shareholders in mind. Weak non-transparent
practices and weak disclosure standards can actually
encourage fraudulent and unethical activities. The
transparent and timely disclosure of financial policy
(dividend and investment policy) is important for the
value creation of shareholders. The management of a
firm is responsible for spreading the information
between majority and minority shareholders on an
equal basis (Peirson et al., 2000; Full disclosure and
transparency of financial information are vital
components of the corporate governance framework
(OECD, 1999) and are regarded as important good
corporate governance ingredients. Recently, a
significant number of studies have investigated the
relationship between transparency practices employed
by the board and changes in company performance
and stock prices. The results reveal that corporate
performance and especially company valuation is
associated strongly with the standard of corporate
communication and disclosure practices that are
employed by the company, and that companies with
better corporate governance have higher standards of
disclosure and transparency (Black, Jang, and Kim,
2006; Botosan, 1997). Well-governed companies
(those that have transparency of information,
accountability for management and that operated
efficiently) attract investors and ultimately facilitate
the long term growth of the company.
Abdo and Fisher (2007) constructed a broad
measure of corporate governance in South Africa
.Their score is based largely on King II principles and
the standard and Poor's international corporate
governance index. Using three measures for the firm
value (the annual average share price returns, market

Corporate Ownership & Control / Volume 11, Issue 1, 2013, Continued - 7
643
to book ratio, and price earning ratios), they conclude
that there is a positive relationship between the level
of disclosure and corporate performance. Amidst the
pervasive culture of secrecy about corporate
governance practices and disclosure by firms in this
region, we are therefore proceeding to test out the
hypothesis that
H6: The higher the transparency in corporate
governance practice the higher the company
valuation.
2.4.4. Control Variables and Company Valuation
Given that internal corporate governance is not the
sole determinant of economic performance and
company valuation, we seek to identify the effects of
other determinants and attempt to control for them.
MacAvoy and Millstein (2003) used two variables,
the economic performance of a firm’s industry and
the life-cycle position of the firm within that industry.
Industry performance matters because some firms are
in industries that experience substantial growth in
demand, while others are in industries that are
stagnant.
Ng (2003) in a related study on firm
performance chose the control variables to include
firm size, debt ratio, firm growth, director’s
remuneration, board size, board composition, dummy
year, and dummy industry.
Wan and Ong (2005) include three control
variables: board size, industry and company size.
Also, dividend per share has been widely used in
previous studies.
Shleifer and Vishny (1986) note that institutional
investors prefer to own shares of firms making regular
dividend payments, and argue that large institutional
investors are more willing and able to monitor
management than are smaller and more diffuse
owners. As a result, corporate dividend policies can
be tailored to attract institutional investors who in turn
provide important monitoring services.
Debt ratio also has been employed by several
studies including Larcker, Richardson & Tuna (2004);
Bohren and Odegaard (2003) and Weir, Laing &
McKnight (2002). It is argued that debt ratio has a
mixed effect on firm performance. On one hand, a
positive effect may stem from reducing the free cash
flows, exposing the firm more to monitoring by the
market (the interest tax savings is an additional source
of the positive effect of the debt ratio, but is not
applicable to UAE firms since there is no corporate
income tax). In addition, the threat caused by failure
to pay debts serves as an effective motivating force
that makes firm more efficient (Bhandari and Weiss,
1996). On the other hand, a negative effect of debt on
firm performance may be caused by either the
bankruptcy cost or the debt agency cost (Ross et al.
2002). Garay and Gonzalez (2005) used three control
variables in their Venezuela study: company size,
return on assets and leverage measured as the quotient
between total debt and total assets. Javed and Iqbal
(2007) in their study of Pakistan listed companies
used control variables which included as company
size, company age, and leverage which they defined
as debt to total asset ratio. This study chose as control
variables to be company size, dividend per share,
industry, and financial leverage.
3. Corporate Governance in the UAE
What is the current state of the economic and
corporate governance environment in the UAE?
3.1 The State of the Economy in the UAE
The UAE has an open economy with a higher per
capita income and sizable annual trade surplus. Its
wealth is based on oil and gas output, and the fortunes
of the economy fluctuate with the prices of those
commodities. Since the UAE discovered the oil 30
years ago, the country has undergone a profound
transformation from an impoverished region of small
desert principalities to a modern state with a high
standard of living (the World Fact book, 2006).
The UAE corporate sector began to develop in
the middle of the seventies, which witnessed the
creation of many companies due to the rise in oil
prices and the strong interest of the federal
government to build a strong national economy. Most
of the UAE companies are either sole proprietorship
or partnership; a few are corporations. All companies
operate under Federal Commercial Law No 8/1984
and its amendments, with the exception of a few
companies which were established and operated under
royal decrees.
Over the past ten years, the UAE corporate
sector has grown rapidly due to the inception of the
country's official stock market and the federal
tendency toward privatizing some large infrastructure
companies. The main regulatory bodies in the UAE
corporate sector are the ministry of Economy, the
Central Bank, and the Securities & Commodities
Authority (SCA).
The UAE stock market was inaugurated in 2000
and is represented by two governmental security
exchanges, Dubai and Abu Dhabi, under the
supervision of the SCA. Compared to other stock
markets in the region, the UAE stock market is
relatively new and small one. However, from 2004 to
today, it has enlarged, gained strength, and become
more active in terms of the number of IPOs and the
listed companies, market capitalization, and the range
of market participants such as brokerage firms and
investment funds.
3.2 The State of Corporate Governance in UAE
There has been a significant improvement in the
standards of corporate governance in the Arab Gulf
Corporate Ownership & Control / Volume 11, Issue 1, 2013, Continued - 7
644
region. However, there is still more room for
improvement in this regard because corporate
governance is still in its initial stages. Nevertheless,
real progress is being made; the countries in the
region have started to amend their current company
laws and strengthen their mechanism for
accountability to meet the demand for corporate
governance. In the six Gulf States decision makers
have started to take control of the situation and are
more committed towards implementing standards that
promote corporate governance. These steps have been
taken to ensure sustainable growth and development,
as well as to encourage investment and boost the
confidence of international market investors in the
Gulf region.
The UAE, like many other developing countries
trying to merge with the global economy, has initiated
the application of international standards of corporate
governance. The turning point began with the
introduction of a draft of corporate governance code
in Abu Dhabi Stock Exchange in 2006 and the
establishment of the Hawkamah Institute of Corporate
Governance by the Dubai International Financial
Centre (DIFC
In March 2007, the Security and Commodities
Authority (SCA) which is the main regulatory body of
the two securities markets in the UAE issued a code
of corporate governance for listed companies. This
code was expected to be implemented with effect
from 2010 and compliance with it will be compulsory.
The new code is meant to improve the practices of
corporate governance focusing mainly on
independence board independence, the duties and
structure of the board in term of size, composition,
committees, meetings and leadership structure. There
is a strong expectation that the company law and
auditors’ law would also contain articles on corporate
governance, transparency, and accountability on
financial date according to international standards for
accountability. The study reported herein will test all
the internal corporate governance practices including
board attributes as of 2007 which have been
implemented voluntarily by ADX listed companies
prior to the compulsory enforcement of the code of
corporate governance for listed companies which is
due in 2010.
3.3 The State of Corporate Governance in Abu Dhabi Stock Exchange
Seeking to ensure that ADX listed companies
represent the best practice reputation of the market,
ADX issued in October 2006 its own Draft of
Corporate Governance Code to be included in its
Listing Rules those internationally accepted
mandatory requirements which all companies must
follow and which are not yet present or otherwise
covered in the law.The Listing Rules are to ensure
that the conduct of public joint stock companies on
the Exchange meets the standards expected by
shareholders and investors of public listed company's
internationally. To give Companies time to adopt the
new requirements and incorporate them as necessary
into their Articles of Association, the Listing Rules
would be introduced over time in three stages.
In summary the corporate governance
environment in the UAE can be said to be
characterized by:
1/ prevalence of concentrated family ownership
structure, where shares are controlled by block
holders.
2/ boards dominated by non-independent
directors.
3/ lack of significant international institutional
investor's base: the lack of international investors has
limited the degree and pace of change in corporate
governance as regulators and issuers have not been
exposed to the demands of international investors.
4/ high degree of liquidity in the region and
demands for IPOs, a situation which has not helped in
developing a sound framework for corporate
governance
5/ non- prevalence of pension plans in the
region: more prominence of pension plans as major
investors would contribute positively to corporate
governance.
6/ general compliance with good practice and
regulations of financial disclosures
7/ weak non-financial disclosure by UAE listed
companies, in particular with respect to corporate
governance related information ; with firms tending to
be relatively secretive in their governance practices.
8/ the majority of boards having on average
eight members.
9/ the positions of board chairman and CEO
being distinct and separated in almost all companies
10/ the majority of companies having Audit
committees, but, their structure, composition and
activity needing to be strengthened and aligned with
corporate governance requirements;
11/ other board committees such as nomination
and remuneration committees being less prevalent
4. Research Methodology & Design
4.1 The Model
This research is done in the quantitative paradigm .It
is deductive in nature where a conceptual and
theoretical framework is developed and then
hypotheses are logically drawn and tested by applying
regression analysis on numerical cross sectional data
about board characteristics, shareholders
characteristics, and other company characteristics
such as company performance.
On the basis of the previous studies mentioned
in section 2.4, we can classify the internal corporate
governance factors that determine the dependent
variable (company valuation) into four general
categories:

Corporate Ownership & Control / Volume 11, Issue 1, 2013, Continued - 7
645
A. Board Structure being characterized here in
terms of Board Size, Board Meetings, Board
Composition ((Non-) Executive Directors)
B. Ownership Structure factors here including
Private Institutional Ownership , and Major
Shareholders (Ownership Concentration / dispersion)
and
C. Transparency Practices. D. Control Variables taken into account here
include: Company size, Industry, Dividend per share
and financial leverage.
4.2 Measurement of Variables
1/ Company Valuation (Dependent Variable):
The following variables would be used as proxy
of company valuation
A/ Tobin q
B/ Price / Earning Ratio
C/ Market /Book value per share Ratio
A/ Tobin’s Q
In line with the studies of MacAvoy and Millstein
(2003), and Sanda, Mikailu, and Garba (2005) Tobin
Q was used as one of the measures of company
valuation in this study. Tobin Q was measured by
computing the market value (MV) of debt and equity
divided by book value (BV) of total assets on the
balance sheet, i.e. MV (Equity + LTD) / BV (TFA +
NWC). Here LTD is long term debt, TFA is total
fixed assets and NWC is net working capital i.e.
current assets minus current liabilities.
B/ Price / Earning Ratio (PER)
In line with the studies of Drobetz, Schillhofer, and
Zimmermann (2002), and Sanda, Mikailu, and Garba
(2005) price earnings ratio was used as one of the
measures of company valuation in this study. Price
earnings ratio was measured by dividing the share
market price by the earning per share.
C/ Market Book value Ratio (MBVR)
In line with the studies of Drobetz, Schillhofer, and
Zimmermann (2002) market book value ratio was
used as one of the measures of company valuation in
this study. This variable was measured by dividing its
market price by the book value per share.
2/ board size, was measured by the number of
board members.
3/ number of outside directors, was measured by
the percentage of Non Executive Directors
4/ Major Shareholders was the proxy for
ownership concentration, measured by the number of
shareholders who owns 5% and more of the total
outstanding shares of the concerned company (Major
shareholders are defined by UAE Security and
Commodity Authority by the shareholders who own
5% or more of the company listed shares)
5/ Private institutional ownership, was measured
by the percentage of their shareholding.
6/ Board Meetings were measured by the actual
number of board meetings during the year.
7/ Company Size (control variable), was
measured by taking the natural logarithm of the net
sales value
8/ Dividend per share (control variable), was
measured by the total amount of dividend paid
divided by the number of outstanding shares.
9/ Industry (control variable), was used as a
dummy variable given number from 1 – 9 as per the
concerned industry Weighted Average Accounting
Return (WAAR) which reflects the overall financial
performance in term of weighted average of return on
equity, return on assets and return on sales. Dummy
number (9) will be given to the industry with the
highest WAAR, and Dummy number (1) will be
given to the industry with the lowest WAAR.
10/ Financial leverage (control variable) was
measured by the Total liabilities / Total assets ratio.
4.3 Research Sample and Data
The empirical study was carried out using publicly
listed companies in Abu Dhabi Securities Exchange
(ADX) as the sample frame. Established in November
2000, ADX is the official stock exchange of Abu
Dhabi, the federal capital of the United Arab Emirates
(UAE). ADX serves the domestic cash equity market,
has 64 listed companies and a market capitalisation of
AED 258 billion (USD 70 billion) as at 31 December
2008. Private companies were not used as it is often
difficult to obtain data about these companies.
Information from listed firms is also more accurate,
since they have to be certified. The whole population
of 64 ADX incorporated companies will be targeted
for the study. ALL the 64 listed companies in Abu
Dhabi Securities Exchange (ADX) were included, and
only companies with missing data were dropped. The
data mainly were secondary data about board
structure which are generally available from UAE
security and commodities authority (SCA), the
regulatory body for public companies in UAE as well
as from both Abu Dhabi Securities Exchange
publications and websites.
5. Data Collection & Regression Results
5.1 Data Preparation
Appendix 10 presents the preparation steps we
followed in ranking the nine industries of Abu Dhabi
Securities Exchange (ADX), all the industries have
been ranked as per their financial performance, which
is calculated as the weighed average of return on
sales, return on assets, and return on equity and this
variable called weighted average accounting return

Corporate Ownership & Control / Volume 11, Issue 1, 2013, Continued - 7
646
(WAAR). We used WAAR as opposed to the other
three variables to have an objective and unbiased
measure of the overall financial performance of the
concerned industry. Accordingly, companies in the
real estate industry which have the highest WAAR
have been given dummy value 9 and companies in the
Energy industry which have the lowest WAAR have
been given dummy value 1.
Appendix 11 present the preparation steps we
followed in re calculating or adjusting the published
data for institutional ownership, the reason for
adjusting the data is due to the researcher
disagreement with the criteria used by the published
data of ADX for breaking down institutional
ownership into private ownership and government
ownership, in the published data they classified all
shares owned by the sovereign wealth fund of Abu
Dhabi Investment Authority (ADIA) as government
ownership. In our opinion ADIA shareholding should
be reclassifies as private ownership as it has more
resemblance with them than with UAE government
agencies in term of having a very professional
investment team which manage all of it’s portfolios in
term of equity, fixed income, and property
investment. It worth mentioning here that ADIA is the
world biggest sovereign wealth fund (SWF) estimated
at 1.3 trillion dollar. We subtracted ADIA ownership
percentage from government ownership and added to
private institutional ownership.
In Appendix 12 we calculated the score for
transparency practices (TP) by calculating the average
of the corporate communication score and disclosure
score together, both of them are published by The
Institutional Investor (TNI) in their report Back to
BASICs. The following preparatory steps have been
followed: corporate communication score was a
weighted average of 9 measures and disclosure score
was a weighted average of 25 measures. So, the
published figure for corporate communication was
multiplied by 9 and the published figure for disclosure
was multiplied by 25 and we added the result of two
variable and we divide it by 34 to reach the final
figure for measuring the score for transparency
practices. The descriptive statistics for the
independent and dependent variables are calculated to
ascertain the general characteristics of the firms in
UAE and presented in appendix 1.
5.3 Regression Results Presentation
The results of the multiple regression analyses are
presented in appendices 2 – 9:
Appendix 2 shows that the correlation between
each of the independent variables is not so high. The
highest correlation (0.439) was found between
transparency practices (TP) and company size (CS),
which is quite satisfactory.
Appendix 3 reveals that the coefficient of
determination (R2) is equal to 37.7 percent and the
adjusted R2 is equal to 24.1 percent which is a quite
acceptable result. The table also shows that the model
reaches statistical significance where the F test
statistic equal 2.782 with 10 and 46 degrees of
freedom with a p-value < .01.
Appendix 4 presents the tolerance values, which
are all above 0.10. These results verify that no
significant collinearity exists between the independent
variables (Hair et al., 2005). In addition, all the VIF
values of the independent variables are less than 10,
which suggest that there is no collinearity ((Hair et al.,
2005). Moreover, Table 5.4.3 presents the beta
coefficients for the independent variables. The largest
t statistics are -2.805 (p-value < 0.05) for industry
(IND), 1.973 (p-value < 0.01) for transparency
practices (TP), 1.863 (p-value < 0.01) for private
institutional ownership (PIO), -1.86 (p-value < 0.01)
for company size (CS) and 1.733 (p-value< 0.01) for
number of board meetings (MEET). This indicates the
variables have a comparable degree of importance in
the model. In other words, they make the strongest
unique contribution to explaining company valuation
as measured by price earning ratio.
In short, these results confirm that there is
enough evidence to support the proposition that
internal corporate governance mechanisms have a
significant impact on company valuation measured by
Price Earning Ratio (PER) , in this Middle Eastern
socio-economic environment.
The rest of the results of the tests of the drawn
up hypotheses are presented in Appendices 4-9.
6. Conclusion
Table 6.1. Hypotheses Testing Results Summary
Hypotheses Testing Outcome
H1: The bigger the Board size the higher the company valuation (Discussed in
section 2.4.1) Rejected
H2: The higher the number of actual board meetings the higher the company
valuation (discussed in section 2.4.1.4) Accepted
H3: The higher the percentage of non-executive directors the higher the
company valuation (discussed in section 2.4.1.5) Rejected
H4: The larger the percentage of private institutional ownership the higher the
company valuation (discussed in section 2.4.2.1) Accepted

Corporate Ownership & Control / Volume 11, Issue 1, 2013, Continued - 7
647
H5: The higher the number of Major Shareholders who owns more than 5% of
the company share the higher the company valuation (discussed in section
2.4.2.2)
Rejected
H6: the higher the transparency and disclosure in corporate governance practice
the higher the company valuation (discussed in section 2.4.3) Accepted
Table 6.2 is the summary of the research findings and the way they compare and contrast with other studies in
the literature.
Table 6.2. Research Findings Summary
# Research Question Research – based Answer Comments
1
What are the internal firm level
governance variables that
significantly influence firm valuation
of listed companies in the UAE?
1.Transparency practices
2.Private institutional ownership,
and
3. Board meetings frequency
Transparency practices
result is consistent with
Abdo & Fisher (2007) in
South Africa but contrary
to Attiya & Robina (2007)
findings in Pakistan.
2
To what extent do boards’ structure
variables significantly influence firm
valuation in UAE listed companies
Board meetings are significantly
and positively associated with
company valuation in the case of
the UAE, whereas, board size and
composition were not
Consistent with Adam s &
Ferreira (2005) in USA,
but contrary to Vafeas
(1999)
3
To what extent do variables for
ownership structure influence firm
valuation in the UAE
Type of shareholder whether
individual, government , or private
institutional investors is a
significantly associated with
company valuation in the UAE
Consistent with
McConnell & Servaes
(1990) in USA, and Lei &
Song (2000) in Hong
Kong
The research reported herein is the first
integrated model to link the company valuation with
the internal corporate governance indicators including
board structure variables, ownership structure
variables, and transparency practices in the ADX as
one of the emerging markets in the Middle East. The
study makes a number of improvements over the
achievements of previous related studies.
It incorporates in its analysis two board
processes variables (meetings frequency and the score
for transparency practices) to go beyond the more
traditional structural board attributes commonly used
in similar studies. It has confirmed the significance of
the use of P/E ratio as a company valuation measure
in this emerging market in the Middle East. Finally
the study tests one of the major ownership structure
variables in the region, namely the sovereign wealth
funds ownership in listed companies and its ultimate
effect on the company valuation, where the empirical
results indicated their positive impact on company
valuation through their massive role in corporate
governance implementation and efficient corporate
control.
The results of the study showed that for ADX
listed companies there is no significant relationship
between internal corporate governance indicators and
company valuation as measured by well-known
company valuation measures such as Tobin’s Q and
Market – Book Value Ratio. However a significant
relationship emerges when company valuation is
measured by PER.
Three of the internal governance variables used
in the model (private institutional investors
ownership, transparency practices, and number of
board meetings) appeared to have significant impact
on firm valuation in the UAE socio-economic
environment. In addition, the two of the three control
variables that were used (company size and industry)
showed a strong relationship with company valuation.
On the other hand three other governance variables,
namely board size, number of non-executive
directors, and ownership concentration (as measured
by the number of major shareholders owning 5% and
above the company shares) were found to have no
significant effect on firm valuation which could be
attributed to the large similarity among UAE listed
companies with respect to those internal governance
variables.
Our results suggest that the transparency
practices implemented and board activity in term of
number of board meetings play a more important role
than board size and The UAE Corporate Governance
Code for Listed Companies which will be in effect
from 2010 states in Article 3.6 ‘Meetings of the Board
of Directors shall be held at least once every two
months upon a written convocation of the Chairman
of the Board of Directors, or upon a written request
submitted by at least two thirds of the Directors. The
Convocation of the meeting shall be given, together

Corporate Ownership & Control / Volume 11, Issue 1, 2013, Continued - 7
648
with the agenda, at least one week before the meeting
is held. A director has the right to add any matter that
he may deem necessary, for discussion in the
meeting’. So, if the performance and value of UAE
listed companies’ is to improve they must schedule
more board meetings with well-structured, smart
agenda that enclose important topics. In the sample
that was studied, only two board meetings were held,
on average per year. This is representative of current
practices in UAE. In contrast the corporate
governance code proposes six meeting every year,
which leaves listed companies well below the
threshold of good governance with regard to
meetings. However, the good news is that this gap
could be compensated for by directors focusing more
on ensuring that the time spent during meetings is
quality time, so that they can be more productive and
effective.
Given the size of their shareholding, the power
of the institutional investors cannot be
underestimated. In the sample used in the study the
average ownership for institutional investors is 50%
of the total shareholding 35% for private institutional
investors and 15% for government agencies). The
institutional investors’ capacity to exert significant
influence on companies has clear implications for
corporate governance and consequently company
valuation. The results of the study confirmed this
suggestion: private institutional investor’s ownership
was confirmed to have a significant positive
relationship with company valuation. Regulators
favours the presence of institutional investors
especially private ones because of their ability to use
their power as owners to ensure that the companies in
which they invest comply with standards of corporate
governance and can enforce all the regulator codes.
Given the constructive effect that private institutional
investors have on company market valuation, they
need to be attracted to invest.
Another interesting result of the study is related
to confirming the positive role played by sovereign
wealth funds such as ADIA in inducing best-practices
corporate governance and playing a leading role in
influencing company valuation. This result confirms
that SWF motives for investment is for financial and
economical return rather than for political reasons as
some opponent of SWF argue. For the UAE to
increase the presence of SWF, the UAE needs to
make them a magnet for more local and foreign
investors by establishing an attractive investment
environment by creating the relevant economic,
regulatory and enforcement institutions that are
capable of drafting best-practices codes and standards.
This study, in short, has managed to:
1/ establish the relevance of transparency and
disclosure practices, private institutional ownership
and actual board meetings frequency in corporate
valuation in the UAE socio-economic environment.
2/ reconfirm that the degree to which
transparency practices are relevant to corporate
valuation is likely to differ from one socio-economic
environment to another.
3/ highlight the role of corporate governance in
effective utilisation of assets to improve the value of a
firm.
Therefore, the results of the study support the
argument that the differences in economic, social,
organisational and institutional structures and systems
influence the process by which the value of the firm is
affected by governance variables in developing and
developed financial markets, and are very useful in
explaining the differences in the relationship between
corporate governance and the value of the firm in
different markets.
References
1. Abdo and Fisher (2007) The impact of reported
corporate governance disclosure on the financial
performance of companies listed on the JSE,
Investment Analysis Journal – No. 66 2007
2. Adams, R., Almeida, H. & Ferreria, D. 2005. Powerful
CEOs and their impact on corporate performance.
Review of Financial Studies, 18: 1403-1432.
3. Agrawal, A. & Knoeber, C. 1996. Firm performance
and mechanism to control agency problems between
managers and shareholders. Journal of Financial and
Quantitative Analysis, 31: 377-397.
4. Allen & Gale, (2001). Comparing Financial Systems,
MIT Press, Cambridge
5. Bai, liu, Lu, Song & Zhang (2004) Corporate
Governance and Market Valuation in China, Centre for
China Financial Research, Faculty of Business and
Economics, The University of Hong Kong..
6. Baysinger, B. & Butler, H. 1985. Corporate
governance and the board of directors: Performance
effects of change in board composition. Journal of
Law, Economics, and Organization, 1: 101-134.
7. Bhagat, S. & Black, B. 2000. The non-correlation
between board independence and long term firm
performance. Journal of Corporation Law, 27:231-274.
8. Beiner, Drobetz, Schmid & Zimmermann, H. 2004. Is
Board Size an Independent Corporate Governance
Mechanism? KYKLOS, 57((3): 327-356
9. Beiner and Schmid (2005).Agency Conflicts,
Corporate Governance, and corporate Diversification
evidence from Switzerland’, SSRN, available at:
10. http://papers.ssrn.com/sol3/papers.cfm?abstract_id=66
6264paperDownload
11. Bhandari & Weiss, (1996) Corporate Bankruptcy.
Cambridge University Press
12. Black, Jang & Kim (2003) Does Corporate
Governance Predict firm’s market value? Evidence
from Korea. Stanford Law School, Working Paper No.
237.
13. Black, B., Jang, H. & Kim, W. 2006. Does corporate
governance affect firms’ market values? Evidence from
Korea. Journal of Law, Economics and Organization,
22:366-413.
14. Black, B (2001). The corporate Governance Behaviour
and market value of Russian firms, Emerging Markets
Review, 2: 89-108.
15. Bohren, O. & Odegaard, B. 2003. Governance and
performance revisited. EGGI, working paper No. 28.

Corporate Ownership & Control / Volume 11, Issue 1, 2013, Continued - 7
649
16. Botosan, C.A. 1997. Disclosure level and the cost of
equity capital. Accounting Review, 72(3): 323-349
17. Brown & Caylor (2004) Corporate Governance and
firm Performance. Working paper, Georgia State
University.
18. Carter, C. & Lorsch, J. 2003. Back to the drawing
board: Designing corporate boards for a complex
world. Boston, MA: Harvard Business School Press.
19. Charan, R. (2005) Boards that Deliver: Advancing
Corporate Governance from compliance to
Competitive Advantage, Jossey-Bass Publisher
20. Chidambaran, Palia, & Zheng Y. 2006, Does Better
Corporate Governance “Cause” Better Firm
Performance? Working Paper, Rutgers Business
School
21. Demsetz et al. (1985). The structure of corporate
ownership: Causes and consequences. Journal of
Political economy, 93: 1155-1177
22. Demsetz et al. (2001) Ownership structure and
corporate governance. Journal of Corporate Finance, 7:
209-233
23. Demsetz, H. and Villalonga, B. 2001. Ownership
structure and corporate performance. Journal of
Corporate Finance, 7:209-233
24. Denis, D. & McConnel J. 2003. International
Corporate Governance, Journal of Financial and
Quantitative Analysis, 38(1).
25. Drobetz, Schillhofer, & Zimmermann (2002)
Corporate Governance and expected stock returns:
evidence from Germany. European Financial
Management, 10 (2), 267-293
26. Durnev and Kim (2005). To steal or not to steal: Firm
attributes, legal environment, and valuation, Journal of
Finance, 60: 1461-93.
27. Fama, E. & Jensen, M. 1983. Separation of Ownership
and Control. Journal of Law and Economics, 26: 301-
325.
28. Farinha (2003) Corporate Governance: A survey of the
literature. SSRN, Working Paper, serried N). 470801
29. Franks & Mayer (1997) Ownership and Control, in H
Siebert (ed) Trends in Business Organization: DO
participation and Cooperation increase
Competitiveness? Journal of Applied Corporate
Finance, 9: 30-45.
30. Garay & Gonzalez (2005) CEO and director turnover
in Venezuela, Inter American development Bank
Working Paper No. 517
31. Grossman & Hart (1982) corporate financial structure
and managerial incentives. In J McCall (ed) The
Economics of Information and uncertainty, University
of Chicago Press, Chicago
32. Hair, Black, Babin, Anderson & Tatham. 2005.
Multivariate Data Analysis. Upper Saddle River, NJ:
Pearson Prentice Hall.
33. Haleblian & Finkelstein. 1993. Top management team
size, CEO dominance, and firm performance: The
moderating roles of environmental turbulence and
discretion. Academy of Management Journal, 36(4):
844-863.
34. Hermalin, B. & Weisbach, M. 1991. The effects of
board composition and direct incentives on firm
performance.Financial Management Association,
20(4),
35. Holderness & Shehan (1988) The Role of Majority
Shareholders in Publicly Held Corporations: An
Exploratory Analysis. Journal of Financial Economics,
25(1): 99-122.
36. Immik, H (2000) Corporate Governance, firm
performance and cost of capital of European blue chip
companies. Tiburg University Working Paper
37. Jackling & Johl (2009) Board structure and firm
performance: Evidence from India's Top Companies,
Corporate Governance: An International Review, 17:
492-509
38. Javed & Iqbal (2007) The relationship between
Corporate Governance Indicators and Firm Value: A
case study of Karachi Stock Exchange. PIDE Working
Paper 2007:14
39. Jensen, M. and Meckling W. 1976. Theory of the Firm:
Managerial Behaviour, Agency costs and Ownership
structure, Journal of Financial Economic, 3.
40. Jensen, M. 1993. The modern industrial revolution,
exit and the failure of internal control systems. Journal
of Finance, 48: 831-880.
41. Jensen, M. 1986. Agency costs of free cash-flow,
corporate finance and takeover, American Economic
Review, 76: 323-329.
42. Kaplan and Minton (1994) Appointments of outsiders
to Japanese boards: determinants and implications for
managers, Journal of Financial Economics, 36(2): 225-
258.
43. Klapper & Love (2004) Corporate Governance,
Investor protection and performance in emerging
markets, Journal of Corporate Finance, 10: 703-28.
44. Kravchenko & Yusupova (2005) corporate governance
and firms valuations: case of Russia, Novosibirsk State
university
45. Larcker, Richardson & Tuna (2004) How important is
corporate governance? Working paper, University of
Pennsylvania, Philadelphia.
46. Landier, A., Sraer, D. & Thesmar, D. 2005. Bottom up
corporate governance. Working Paper, Stern School of
Business, New York University.
47. La Porta, Lopez-de-Silanes, Shleifer & Vishny (2000)
Legal determinants of external finance, Journal of
Finance, 52(3): 1131-1150.
48. Leblanc, R. W. J. & Gillies, J. 2005. Inside the
Boardroom: how boards really work and the coming
revolution in corporate governance. Toronto: John
Wiley & Sons.
49. Lei & Song (2004) Corporate Governance and Firm
Valuations: Evidence from Hong Kong, School of
Economics and Finance, the University of Hong Kong.
50. Lipton, M. & Lorsch, J. 1992. A modest proposal for
improved corporate governance. Business Lawyer, 48:
59-77.
51. MacAvoy,P., & Millstein, I. 1999. The active board of
directors and its effect on the performance of the large
publicly traded corporation, Journal of Applied
Corporate Finance, 11(4): 8-20.
52. MacAvoy, P., & Millstein, I. 2003. The recurrent crisis
in corporate governance. Stanford, CA: Stanford
University Press.
53. Mace, M. (1986). Director: Myth and Reality, Boston,
MA: Harvard Business School Press.
54. Maug, E. 1998. Large shareholders as monitors: is
there a trade – off between liquidity and control?
Journal of Finance, 53: 65-98.
55. McConnell, J. & Servaes, H. 1990. Additional
evidence of equity ownership and corporate value.
Journal of Financial Economics, 27: 595-612.
56. Mitton (2001) A cross-firm Analysis of the Impact of
corporate governance on the East Asian Financial
Crisis, Journal of Financial Economics, 64(2): 215-241

Corporate Ownership & Control / Volume 11, Issue 1, 2013, Continued - 7
650
57. Morck, R., Shleifer, A., & Vishny, R. 1988.
Management ownership and market valuation: An
empirical analysis, Journal of Financial Economics, 68:
325-351.
58. Morin & Jarrell (2001) Driving shareholders value:
Value-Building Techniques for Creating Shareholder
Wealth, McGraw-Hill Publishers, Sydney.
59. Ng, C. 2003. An empirical study on the relationship
between ownership and performance in a family- based
corporate environment, Journal of Accounting,
Auditing & Finance, 121-146
60. Peirson, Brown, & Easton (2000) Business Finance,
7th edn, McGraw Hill, Sydney
61. Pfeffer, J. (1972) Size, composition, and function of
hospital boards of directors, Administrative Science
Quarterly, 18: 349-464.
62. Pinkowitz, Stulz, & Wiklliamson (2003) Why do firms
in countries with poor protection of investor rights hold
more cash, NBER working paper no. 10188, National
Bureau of Economic Research, Cambridge.
63. Rajagopalan & Zhang (2008) Corporate Governance
reforms in China and India: challenges and
opportunities. Business Horizons, 51:55-64
64. Rashid, K. (2008). Corporate governance and firm
performance: an econometric modelling of emerging
and developed financial markets, published in Elsevier
65. Renneboog, L (2000) Ownership, managerial control
and governance of companies listed on the Brussels
Stock exchange. Journal of Banking and Finance, 24:
1959-95
66. Rwegasira, Kami S.P.,” (2000) Corporate governance
in emerging markets: Whither Africa?” Corporate
Governance: An International Review, 8: 258–267.
67. Sanda, Mikailu, and Garba (2005) Corporate
Governance Mechanisms and firm financial
performance in Nigeria, AERC Research Paper 149,
African Economic Research Consortium, March 2005
68. Shleifer, & Vishny, 1986. Large shareholders and
corporate control. Journal of Political Economy, 94:
461-487.
69. Shleifer, & Vishny, 1997. A survey of Corporate
Governance. The Journal of Finance, Vol. LII, No.2.
70. Vafeas, N. 1999. Board meeting frequency and firm
performance. Journal of Financial Economics, 53: 113-
142.
71. Wan, & Ong, 2005. Board structure, process and
performance: evidence from public listed companies in
Singapore, Journal of Corporate Governance: An
International Review, 13(2):277-290.
72. Weimer & Page (1999) A Taxonomy of Systems of
corporate governance. Journal of Corporate
Governance, 7(2): 152-166.
73. Weir, Laing & McKnight (2002) Internal and external
governance mechanisms: their impact on the
performance of large UK public companies, Journal of
Business, Finance and Accounting, 29 (5/6): 579-611
74. Weisbach, M. 1988. Outside directors and CEO
turnover. Journal of Financial Economics, 20: 431-460.
75. World Bank (2003) Corporate Governance: an issue of
Global Concern, World Bank, Washington DC.
76. World Fact Book 2006. World Bank, Washington DC.
77. Yermack, D. 1996. Higher market valuation of
companies with a small board of directors. Journal of
Financial Economics, 40: 185-211.
78. Zahra & Pearce (1989) Boards of Directors and
corporate financial performance: a review and
integrative model, Journal of Management, 15(2): 291-
334.
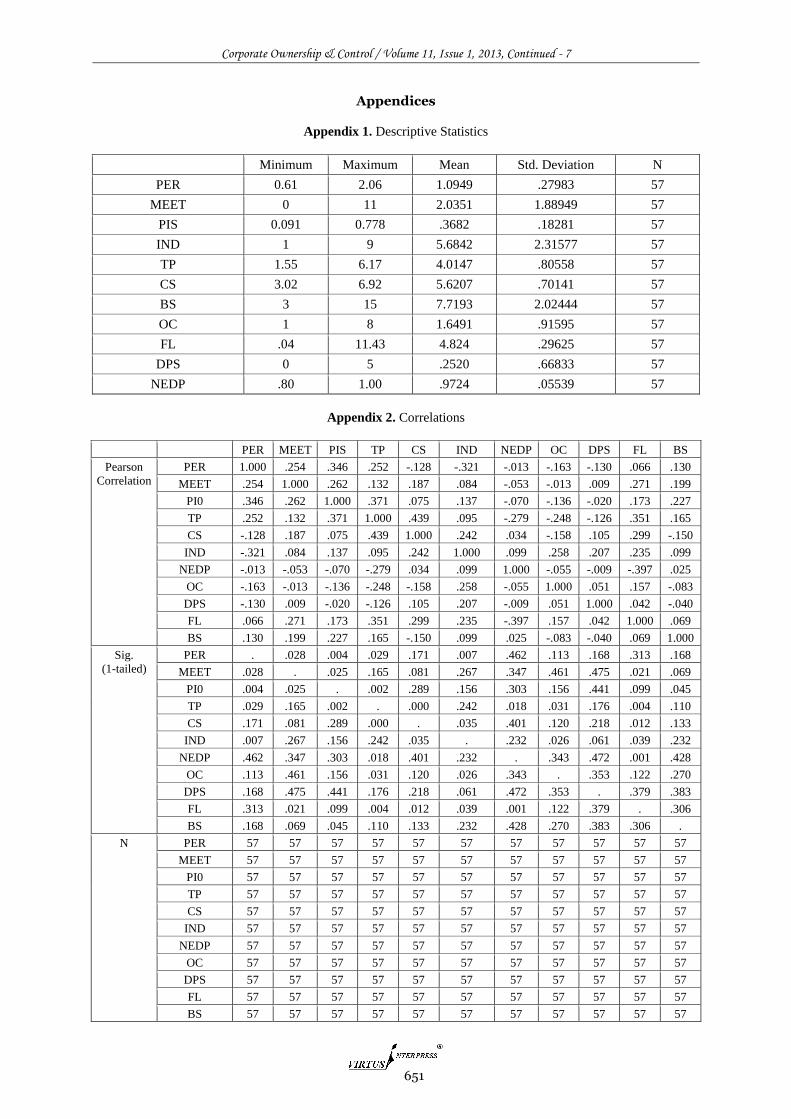
Corporate Ownership & Control / Volume 11, Issue 1, 2013, Continued - 7
651
Appendices
Appendix 1. Descriptive Statistics
Minimum Maximum Mean Std. Deviation N
PER 0.61 2.06 1.0949 .27983 57
MEET 0 11 2.0351 1.88949 57
PIS 0.091 0.778 .3682 .18281 57
IND 1 9 5.6842 2.31577 57
TP 1.55 6.17 4.0147 .80558 57
CS 3.02 6.92 5.6207 .70141 57
BS 3 15 7.7193 2.02444 57
OC 1 8 1.6491 .91595 57
FL .04 11.43 4.824 .29625 57
DPS 0 5 .2520 .66833 57
NEDP .80 1.00 .9724 .05539 57
Appendix 2. Correlations
PER MEET PIS TP CS IND NEDP OC DPS FL BS
Pearson
Correlation
PER 1.000 .254 .346 .252 -.128 -.321 -.013 -.163 -.130 .066 .130
MEET .254 1.000 .262 .132 .187 .084 -.053 -.013 .009 .271 .199
PI0 .346 .262 1.000 .371 .075 .137 -.070 -.136 -.020 .173 .227
TP .252 .132 .371 1.000 .439 .095 -.279 -.248 -.126 .351 .165
CS -.128 .187 .075 .439 1.000 .242 .034 -.158 .105 .299 -.150
IND -.321 .084 .137 .095 .242 1.000 .099 .258 .207 .235 .099
NEDP -.013 -.053 -.070 -.279 .034 .099 1.000 -.055 -.009 -.397 .025
OC -.163 -.013 -.136 -.248 -.158 .258 -.055 1.000 .051 .157 -.083
DPS -.130 .009 -.020 -.126 .105 .207 -.009 .051 1.000 .042 -.040
FL .066 .271 .173 .351 .299 .235 -.397 .157 .042 1.000 .069
BS .130 .199 .227 .165 -.150 .099 .025 -.083 -.040 .069 1.000
Sig.
(1-tailed)
PER . .028 .004 .029 .171 .007 .462 .113 .168 .313 .168
MEET .028 . .025 .165 .081 .267 .347 .461 .475 .021 .069
PI0 .004 .025 . .002 .289 .156 .303 .156 .441 .099 .045
TP .029 .165 .002 . .000 .242 .018 .031 .176 .004 .110
CS .171 .081 .289 .000 . .035 .401 .120 .218 .012 .133
IND .007 .267 .156 .242 .035 . .232 .026 .061 .039 .232
NEDP .462 .347 .303 .018 .401 .232 . .343 .472 .001 .428
OC .113 .461 .156 .031 .120 .026 .343 . .353 .122 .270
DPS .168 .475 .441 .176 .218 .061 .472 .353 . .379 .383
FL .313 .021 .099 .004 .012 .039 .001 .122 .379 . .306
BS .168 .069 .045 .110 .133 .232 .428 .270 .383 .306 .
N PER 57 57 57 57 57 57 57 57 57 57 57
MEET 57 57 57 57 57 57 57 57 57 57 57
PI0 57 57 57 57 57 57 57 57 57 57 57
TP 57 57 57 57 57 57 57 57 57 57 57
CS 57 57 57 57 57 57 57 57 57 57 57
IND 57 57 57 57 57 57 57 57 57 57 57
NEDP 57 57 57 57 57 57 57 57 57 57 57
OC 57 57 57 57 57 57 57 57 57 57 57
DPS 57 57 57 57 57 57 57 57 57 57 57
FL 57 57 57 57 57 57 57 57 57 57 57
BS 57 57 57 57 57 57 57 57 57 57 57

Corporate Ownership & Control / Volume 11, Issue 1, 2013, Continued - 7
652
Appendix 3. Model Summary
Model R R Square
Adjusted
R Square
Std. Error
of the
Estimate
Change Statistics
Durbin-
Watson
R Square
Change F Change df1 df2
Sig. F
Change
1 .614a .377 .241 .24373 .377 2.782 10 46 .009 1.987
Appendix 4. Coefficients
Model
Unstandardized
Coefficients
Standardized
Coefficients
t Sig.
95%
Confidence
Interval for B Correlations
Collinearity
Statistics
B
Std.
Error Beta
Lower
Bound
Upper
Bound
Zero-
order Partial Part Tolerance VIF
1 (Constant) .384 .739 .519 .606 -1.104 1.872
MEET .033 .019 .222 1.733 .090 -.005 .071 .254 .248 .202 .826 1.210
PI0 .379 .203 .247 1.863 .069 -.031 .788 .346 .265 .217 .768 1.301
TP .110 .056 .316 1.973 .054 -.002 .221 .252 .279 .230 .529 1.889
CS -.113 .061 -.282 -1.860 .069 -.234 .009 -.128 -.265 -.217 .589 1.699
IND -.046 .016 -.378 -2.805 .007 -.078 -.013 -.321 -.382 -.326 .748 1.338
NEDP .979 .695 .194 1.409 .166 -.420 2.379 -.013 .203 .164 .716 1.398
OC -.002 .041 -.005 -.039 .969 -.083 .080 -.163 -.006 -.005 .770 1.299
DPS .007 .051 .017 .140 .890 -.096 .110 -.130 .021 .016 .906 1.104
FL .099 .139 .105 .715 .478 -.180 .378 .066 .105 .083 .628 1.592
BS -.005 .018 -.040 -.307 .760 -.041 .030 .130 -.045 -.036 .817 1.225
Appendix 5. Annova
Model Sum of Squares df Mean Square F Sig.
1 Regression 1.653 10 .165 2.782 .009
Residual 2.733 46 .059
Total 4.385 56
Appendix 6. Coefficient Correlations
Model BS NEDP DPS OC MEET CS PIS INDU FL TP
Correlations BS 1.000 -.120 -.007 .102 -.194 .320 -.074 -.132 -.054 -.203
NEDP -.120 1.000 .103 .058 .000 -.248 -.046 -.180 .380 .287
DPS -.007 .103 1.000 .042 .020 -.141 -.027 -.192 .002 .210
OC .102 .058 .042 1.000 -.012 .175 .100 -.308 -.203 .198
MEET -.194 .000 .020 -.012 1.000 -.184 -.220 .053 -.190 .122
CS .320 -.248 -.141 .175 -.184 1.000 .159 -.199 -.209 -.442
PI0 -.074 -.046 -.027 .100 -.220 .159 1.000 -.125 -.033 -.313
IND -.132 -.180 -.192 -.308 .053 -.199 -.125 1.000 -.147 -.024
FL -.054 .380 .002 -.203 -.190 -.209 -.033 -.147 1.000 -.137
TP -.203 .287 .210 .198 .122 -.442 -.313 -.024 -.137 1.000
Covariances BS .000 -.001 -6.289E-6 7.390E-5 -6.553E-5 .000 .000
-3.823E-
5 .000 .000
NEDP -.001 .483 .004 .002 -8.407E-6 -.010 -.006 -.002 .037 .011

Corporate Ownership & Control / Volume 11, Issue 1, 2013, Continued - 7
653
Appendix 7. Collinearity Diagnostics
Model Dimension Eigenvalue
Condition
Index
Variance Proportions
(Constant) MEET PI0 TP CS IND NEDP OC DPS FL BS
1 1 8.944 1.000 .00 .00 .00 .00 .00 .00 .00 .00 .00 .00 .00
2 .865 3.216 .00 .00 .00 .00 .00 .00 .00 .00 .89 .00 .00
3 .423 4.599 .00 .72 .00 .00 .00 .01 .00 .04 .01 .01 .00
4 .253 5.946 .00 .04 .12 .00 .00 .00 .00 .34 .01 .11 .01
5 .207 6.573 .00 .16 .01 .00 .00 .00 .00 .12 .00 .58 .00
6 .130 8.295 .00 .02 .74 .00 .00 .00 .00 .18 .00 .01 .01
7 .100 9.474 .00 .00 .02 .00 .00 .90 .00 .11 .05 .01 .01
8 .052 13.074 .00 .02 .01 .02 .02 .00 .00 .00 .00 .02 .76
9 .020 21.373 .01 .01 .07 .71 .01 .00 .02 .12 .02 .14 .01
10 .006 38.366 .04 .04 .03 .16 .96 .04 .05 .06 .02 .04 .20
11 .001 90.341 .95 .00 .00 .10 .00 .04 .93 .03 .01 .10 .00
a. Dependent Variable: LPER
Appendix 8. Residual Statistics
Minimum Maximum Mean Std. Deviation N
Predicted Value .6547 1.7290 1.0949 .17179 57
Std. Predicted Value -2.562 3.691 .000 1.000 57
Standard Error of Predicted Value .056 .236 .102 .032 57
Adjusted Predicted Value -.3248 1.7029 1.0737 .25597 57
Residual -.63670 .67317 .00000 .22090 57
Std. Residual -2.612 2.762 .000 .906 57
Stud. Residual -3.343 2.925 .016 1.039 57
Deleted Residual -1.04289 1.25482 .02118 .33426 57
Stud. Deleted Residual -3.801 3.206 .014 1.087 57
Mahal. Distance 1.943 51.741 9.825 8.160 57
Cook's Distance .000 2.269 .072 .315 57
Centered Leverage Value .035 .924 .175 .146 57
DPS -6.289E-6 .004 .003 8.721E-5 1.969E-5 .000 .000 .000 1.522E-5 .001
OC 7.390E-5 .002 8.721E-5 .002 -8.893E-6 .000 .001 .000 -.001 .000
MEET -6.553E-5 -8.407E-6 1.969E-5 -8.893E-6 .000 .000 .000
1.622E-
5 .000 .000
CS .000 -.010 .000 .000 .000 .004 .002 .000 -.002 -.001
PI0 .000 -.006 .000 .001 .000 .002 .041 .000 .000 -.004
IND -3.823E-5 -.002 .000 .000 1.622E-5 .000 .000 .000 .000
-2.157E-
5
FL .000 .037 1.522E-5 -.001 .000 -.002 .000 .000 .019 -.001
TP .000 .011 .001 .000 .000 -.001 -.004
-2.157E-
5 -.001 .003

Corporate Ownership & Control / Volume 11, Issue 1, 2013, Continued - 7
654
Appendix 9. Histogram
Appendix 10. Industry Ranking Table
Industry Return on
Sales (ROS)
Return on
Assets
(ROA)
Return on
Equity
(ROE)
Weighted
Average
Accounting
Return
(WAAR)
Industry
Ranking
Banking & Financial Services 43.11 4.81 21.95 23.29 7
Construction 36.23 12.52 16.49 21.75 5
Consumer 35.45 9.81 11.94 19.07 3
Energy 11.52 2.33 10.05 7.97 1
Health 31.03 14.86 22.19 22.69 6
Industrial 34.97 5.29 11.70 17.32 2
Insurance 44.26 14.21 19.79 26.09 8
Real Estate 70.20 13.57 23.45 35.74 9
Telecommunication 27.72 10.78 23.09 20.53 4

Corporate Ownership & Control / Volume 11, Issue 1, 2013, Continued - 7
655
Appendix 11. Calculation of Private Institutional Investors Ownership
# Company
Symbol
Original
Institution
Ownership
%
Original
Govt.
Ownership
%
Original
Private
Ownership
%
Abu Dhabi
Investment
Authority
(ADIA)
Ownership
%
Adjusted
Govt
Ownership
%
Adjusted
Private
Ownership
%
Institution
Ownership
%
2 NBAD 0.78 0.73 0.05 0.73 0.00 0.78 0.78
3 ADCB
0.78 0.65 0.13 0.65 0.00 0.78 0.78
6 UNB 0.73 0.60 0.13 0.10 0.50 0.23 0.73
15 UCC 0.65 0.61 0.04 0.20 0.41 0.24 0.65
20 FCI 0.35 0.35 0.20 0.15 0.20 0.35
27 ASMAK 0.38 0.08 0.30 0.05 0.03 0.35 0.38
37 ALAIN
0.29 0.20 0.09 0.20 0.00 0.28 0.29
38 EIC 0.47 0.12 0.35 0.12 0.00 0.47 0.47
40 ADNIC
0.36 0.24 0.12 0.24 0.00 0.36 0.36
53 ADAVIATION
0.41 0.30 0.10 0.30 0.00 0.40 0.41
54 ADNH 0.32 0.18 0.14 0.18 0.00 0.32 0.32
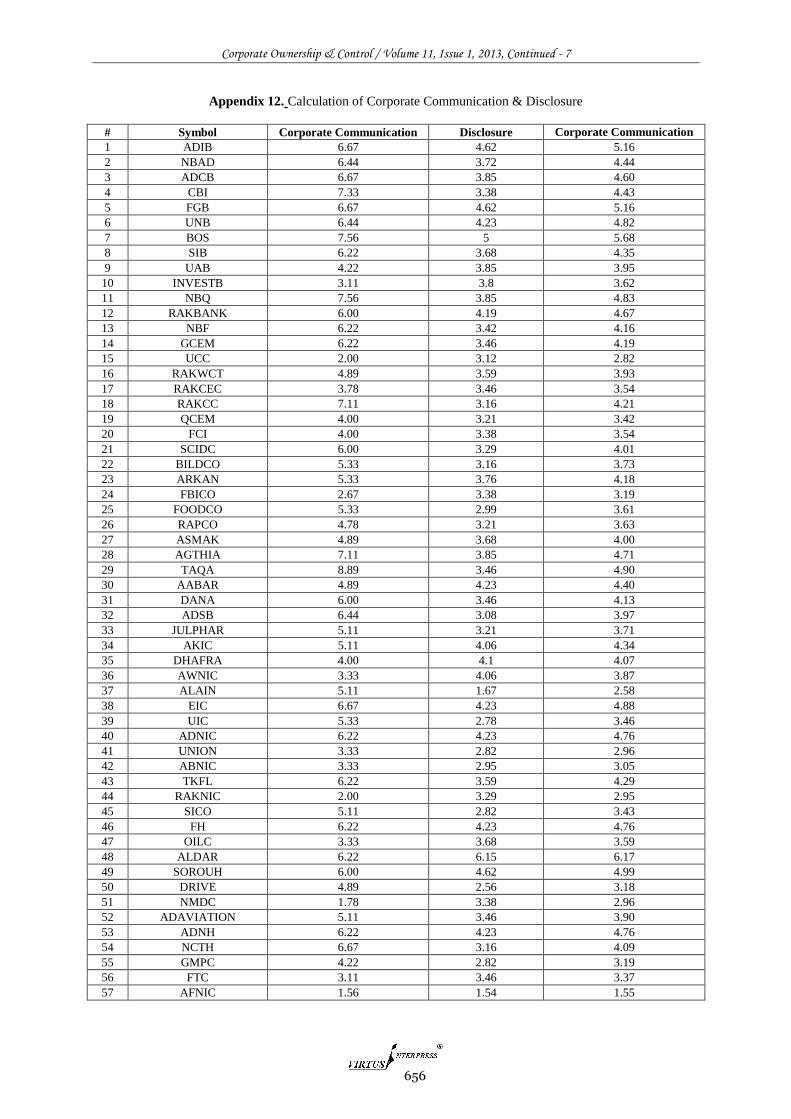
Corporate Ownership & Control / Volume 11, Issue 1, 2013, Continued - 7
656
Appendix 12. Calculation of Corporate Communication & Disclosure
# Symbol Corporate Communication Disclosure Corporate Communication
& Disclosure (CCD) 1 ADIB 6.67 4.62 5.16
2 NBAD 6.44 3.72 4.44
3 ADCB 6.67 3.85 4.60
4 CBI 7.33 3.38 4.43
5 FGB 6.67 4.62 5.16
6 UNB 6.44 4.23 4.82
7 BOS 7.56 5 5.68
8 SIB 6.22 3.68 4.35
9 UAB 4.22 3.85 3.95
10 INVESTB 3.11 3.8 3.62
11 NBQ 7.56 3.85 4.83
12 RAKBANK 6.00 4.19 4.67
13 NBF 6.22 3.42 4.16
14 GCEM 6.22 3.46 4.19
15 UCC 2.00 3.12 2.82
16 RAKWCT 4.89 3.59 3.93
17 RAKCEC 3.78 3.46 3.54
18 RAKCC 7.11 3.16 4.21
19 QCEM 4.00 3.21 3.42
20 FCI 4.00 3.38 3.54
21 SCIDC 6.00 3.29 4.01
22 BILDCO 5.33 3.16 3.73
23 ARKAN 5.33 3.76 4.18
24 FBICO 2.67 3.38 3.19
25 FOODCO 5.33 2.99 3.61
26 RAPCO 4.78 3.21 3.63
27 ASMAK 4.89 3.68 4.00
28 AGTHIA 7.11 3.85 4.71
29 TAQA 8.89 3.46 4.90
30 AABAR 4.89 4.23 4.40
31 DANA 6.00 3.46 4.13
32 ADSB 6.44 3.08 3.97
33 JULPHAR 5.11 3.21 3.71
34 AKIC 5.11 4.06 4.34
35 DHAFRA 4.00 4.1 4.07
36 AWNIC 3.33 4.06 3.87
37 ALAIN 5.11 1.67 2.58
38 EIC 6.67 4.23 4.88
39 UIC 5.33 2.78 3.46
40 ADNIC 6.22 4.23 4.76
41 UNION 3.33 2.82 2.96
42 ABNIC 3.33 2.95 3.05
43 TKFL 6.22 3.59 4.29
44 RAKNIC 2.00 3.29 2.95
45 SICO 5.11 2.82 3.43
46 FH 6.22 4.23 4.76
47 OILC 3.33 3.68 3.59
48 ALDAR 6.22 6.15 6.17
49 SOROUH 6.00 4.62 4.99
50 DRIVE 4.89 2.56 3.18
51 NMDC 1.78 3.38 2.96
52 ADAVIATION 5.11 3.46 3.90
53 ADNH 6.22 4.23 4.76
54 NCTH 6.67 3.16 4.09
55 GMPC 4.22 2.82 3.19
56 FTC 3.11 3.46 3.37
57 AFNIC 1.56 1.54 1.55

Corporate Ownership & Control / Volume 11, Issue 1, 2013, Continued - 7
657
SPONSORED ANALYST COVERAGE, INFORMATION ASYMMETRY AND STOCK TURNOVER
Yee-Boon Foo *
Abstract
This study draws on Merton’s investor recognition hypothesis to investigate whether (1) the sponsored analyst coverage scheme introduced by the Bursa Malaysia in April 2005 is associated with stock turnover, and (2) the relationship is stronger for firms with high information asymmetry. The results show that stock turnover is positively associated with the frequency of coverage and the association is stronger for firms with higher information asymmetry. In addition, it is found that during the initial stage of the scheme where the stock market was experiencing a downturn, analyst coverage has a significant constraining effect on the reduction in stock turnover. Keywords: Sponsored Analyst Coverage; Stock Turnover; Board Independence; Information Asymmetry; Malaysia School of Business, Monash University Malaysia, Jalan Lagoon Selatan, 46150, Bandar Sunway, Selangor, Malaysia
Tel.: +60 3 5514 6378; Fax:+60 3 5514 6194 Email: [email protected]
1. Introduction
This study examines whether there is an association
between the sponsored analyst research scheme
adopted by Bursa Malaysia and stock turnover. In this
scheme, analyst research reports are available to
investors free of charge through the stock exchange’s
websites. The unique feature of the research scheme is
that companies are assigned to analyst research firms
rather than the analyst research firms choosing the
companies to follow. In addition, given the centrality
of information asymmetry theory in the determination
of liquidity, we also evaluate whether information
asymmetry moderates the relationship between
analyst coverage and stock turnover; we expect the
linkage between the analyst research scheme and
stock turnover to be stronger (weaker) for firms with
high (low) information asymmetry.
We are motivated to examine these issues for
four reasons. First, it is generally recognised that
stock liquidity plays a critical role in economic
development, especially for an emerging economy.
Levine (1991) derives a growth model where more
liquid stock markets improve the incentives to
investing in long-duration projects because investors
can easily sell their stake in the project if they need
their savings before the project matures. Thus,
enhanced liquidity facilitates investments in the long
run, higher-return projects and is likely to boost
productivity economic growth. Levine and Zervos
(1998) provide empirical evidence to support this
linkage. Stock liquidity is also important for stock
exchanges, listed firms and investors. From the
perspective of stock exchanges, liquidity is an
argument often used to attract companies to cross-list
(Pagano et al., 2001) and is a key variable in the
competition with other exchanges for order flow
(Parlour and Seppi, 2003). At the individual firm
level, stock liquidity is an important determinant of
the company’s cost of capital (Amihud and
Mendelson, 1986). From the investors’ point of view,
stock liquidity determines their cost of trading and
future returns (Bekaert et al., 2007). Thus, an
understanding of the links between sponsored analyst
coverage and stock liquidity would be of interest to
both practitioners and scholars alike. Second, despite
the fact that many exchanges have launched these
analyst research schemes, little is known whether
these schemes achieve the goal of increasing stock
liquidity1. Prior studies have focused on firms self-
selected by analysts and there is no or little evidence
from firms that participate in the exchange analyst
program. Third, prior studies on the link between
analyst following and liquidity have yielded mixed
results. For example, while Brennan and
Subrahmanyam (1995) show a positive link between
analyst following and liquidity, Chung et al. (1995)
show a negative link. The difference in these results
may be explained in terms of the different role played
by analyst. Brennan and Subrahmanyam (1995) view
1 Mak and Sequeira (2007) report some evidence on the impact of stock initiation by a research firm in Malaysia. He et al. (2010) evaluate the effectiveness of the Reserch Incentive Scheme pioneered by the Singapore Stock Exchange.
Corporate Ownership & Control / Volume 11, Issue 1, 2013, Continued - 7
658
analysts as proxy for privately informed traders. Thus,
they argue that the positive relation between analyst
following and liquidity is due to increased
competition among informed traders which
subsequently reduced the adverse-selection
component of the spread. In contrast, Chung et al.
(1995) argue that analysts would follow a stock with a
greater extent of information asymmetry as the value
of private information increases with information
asymmetry. Therefore, analyst following is viewed as
a signal of the higher level of information asymmetry
which results in a negative relationship between
analyst following and stock liquidity. Recently,
Roulstone (2003) provides evidence of a positive
association and argue that the increase in liquidity is
due to the increase in public information provided by
analyst which reduces information asymmetry. This
study by investigating this issue sheds some light on
this controversy. Finally, most research on analyst
coverage2 has been conducted in developed markets,
namely the U.S. and the European market. Little or no
evidence is available on the links between analyst
coverage and stock liquidity in relatively less
developed markets such as Malaysia which is also an
order-driven market3 environment.
In this study, we focus on stock turnover as our
dependent variable since it has been the focus of
considerable interest and attention lately. A reason for
this is because stock turnover could represent a
number of important factors, including liquidity,
momentum and information (Brown et al., 2009). It
has also been adopted as primary measure of liquidity
in previous empirical studies (e.g. Datar et al., 1998;
Jayaraman and Milbourn, 2012). Datar et al. (1998)
point out that stock turnover is a good proxy for
liquidity because it is correlated with trading
frequency in equilibrium (Amihud and Mendelson,
1986). In addition, Datar et al. (1998) suggest that
stock turnover is an intuitive metric of stock liquidity
as it does take into account the differences in the
number of shares outstanding, rather than focus on
number of shares traded itself. A high value of stock
turnover indicates that the average holding period for
2 The term is used interchangeably with analyst following throughout the study. 3 There are two types of market, namely order-driven market and quote-driven market. In an order-driven market, all orders are displayed in the market and can be seen by people who access to this information. The price and the amount of the stock/share at which the seller are willing to buy or sell are submitted to an order book. On the other hand, a quote-driven market relies on specialist/dealers/market makers who buy stocks when public participants wish to sell and sell stocks when public participants wish to buy. The specialists’ bid quotes are lower than their ask quotes for them to make profit. Prices are adjusted by the market makers over time to keep supply and demand approximately balances. Prices are increased if market makers run short of stock and vice versa.
a stock is shorter. Thus, it is not surprising that
several prior studies recommend stock turnover as a
proxy for liquidity.
In developing a theoretical framework for the
link between the analyst research scheme and stock
turnover, we rely on the theoretical work developed
by Merton (1987), who proposes a model in which
investors hold the stocks that they are “aware of”. In
the model, Merton incorporates limited investor
recognition of stocks in his analyses of capital market
equilibrium and asset prices. He posits that firms with
that are relatively unfamiliar to investors should
provide higher expected stock returns and
demonstrate lower stock liquidity (see also Amihud et
al., 1999; Grullon et al., 2004).
Using a sample of 240 companies that
participated in the first phase of the research scheme,
the results show that stock turnover is positively
associated with the frequency of coverage throughout
the first phase of the scheme. However, it is found
that the positive association between analyst coverage
and stock turnover is weaker for a low information
asymmetry firms4. By comparing the pre- and post-
scheme period between the participating companies
covered by analyst and not covered by analyst, it is
found that during the stock market downturn period,
the reduction in stock turnover is significantly less
severe for companies that are covered by analysts. As
in the earlier tests we also find that the reduction is
less severe for firms with high information
asymmetry.
This study makes a number of significant
contributions to the literature. First, this study by
showing that sponsored analysts following is
associated with higher stock turnover, especially for
firms with high information asymmetry, adds to a
strand of prior literature that subscribes to the theory
that analysts following positively affects stock
turnover by reducing information asymmetry
(Brennan and Subrahmanyam,1995; Roulstone,
2003). Second, by examining the impact of the
exchange sponsored research scheme on stock
turnover, the findings have important implications for
policy makers and listed companies which aim to
improve stock liquidity at the market and company
level respectively. The empirical findings also provide
information to the Malaysian government and the
Bursa Malaysia on the effectiveness of the scheme.
Third, this study contributes to the literature by
examining the impact of analyst coverage where
analysts are assigned to a firm, unlike the prior studies
whereby analysts choose the companies to follow.
Fourth, this study adds to the capital market literature
by providing empirical evidence on the association
between stock liquidity and analyst coverage from an
emerging order driven market perspective. Finally,
the results we obtain are consistent with the investor
4 Information asymmetry is proxied by bid-ask spreads and firms’ age.

Corporate Ownership & Control / Volume 11, Issue 1, 2013, Continued - 7
659
recognition hypothesis and thus, to this extent,
validate Merton’s (1987) theory in an emerging
market context.
The remainder of the paper is structured as
follows. Section 2 provides an overview of the
institutional and the analyst research scheme
background. Section 3 discusses the prior literature on
analyst coverage and develops the research
hypotheses. Section 4 describes the sample and data
sources, the measurement of variables and model
specification. Section 5 reports results of descriptive
statistics, regressions and some robustness tests.
Section 6 discusses the limitations of the study and
the final section concludes the paper.
2. Institutional background 2.1. Bursa Malaysia
Public trading of shares commenced in Malaysia in
1960 with the establishment of the Malayan Stock
Exchange. In 1964, the Stock Exchange of Malaysia
was established and became known as Stock
Exchange of Malaysia and Singapore in 1965 with
secession of Singapore from Malaysia. With the
termination of currency interchangeability in 1973,
the Stock Exchange of Malaysia and Singapore was
split into the Kuala Lumpur Stock Exchange Berhad
and the Stock Exchange of Singapore. With the
enforcement of the Securities Industries Act 1976, a
new company limited by guarantee, The Kuala
Lumpur Stock Exchange (KLSE) was incorporated on
14 December 1976 to replace the Kuala Lumpur
Stock Exchange Berhad. In 2003, the KLSE was
demutualised with the aim to create a more
competitive and efficient market. Its name was
renamed to Bursa Malaysia on 14 April 2004.
Before the implementation of the new structure
on 3 August 2009, Bursa Malaysia comprises of the
Main Board, the Second Board and the Malaysian
Exchange of Securities Dealing and Quotation Berhad
(MESDAQ). Main Board is the platform for the
listing of large companies (with a minimum of RM60
millions of paid-up capital) while Second Board was
launched in 1988 to encourage smaller, viable and
strong growth potential companies (with a minimum
of RM40 millions of paid-up capital) to be listed. On
6 October 1997, MESDAQ was launched as a
separate market for technology-based and high
growth companies listing. It was conceived by the
Securities Commission in 1996 and it commenced
trading in April 1999. Under the new structure, the
Main and Second Board were merged into a single
unified board for established companies and was
called the Main Market. On the other hand, the
MESDAQ market was transformed into an alternative
market for emerging companies of all sizes and
sectors and was called the ACE (Access, Certainty
and Efficiency) Market.
Similar to all other stock exchanges in Asia,
Bursa Malaysia is a purely order-driven market with
no market makers or specialists. Trading takes place
from Monday to Friday, except on public holidays.
Trading on the Bursa Malaysia is fully automated
where orders are keyed into WinSCORE (a broker
front end system) and orders are matched
automatically by the system. All prices are
determined by market forces of supply and demand
through a process where bids and offers are matched.
In every transaction, a security is sold to the highest
bidder and purchased at the lowest offer.
2.2. Capital Market Development Fund-Bursa Research Scheme (CBRS)
To help create more liquidity in the market, Bursa
Malaysia has implemented a number of measures5.
One such important measure implemented is the
initiation of an exchange sponsored analyst research
scheme in April 2005, namely CBRS. The main
objective of the scheme is to generate investors’
interests in smaller capitalised stocks and at the same
time to create balancing research coverage on public
listed companies. This scheme is in line with the
argument that security analysts are prominent
information intermediaries between firms and
investors in capital markets (Chung and Jo, 1996;
Frankel et al., 2006; Chen et al., 2010). Analysts
collect information from corporate managers and
conduct analysis that interprets a firm’s past events as
well as forecasting a firm’s future earnings and cash
flows. Therefore, analyst research reports usually
contain recommendation and supporting arguments.
They are viewed as the most influential sources of
information available to the individual investors for
investment decision making (SRI International, 1987).
The scheme is similar to the Research Incentive
Scheme pioneered in December 2003 by the
Singapore Stock Exchange (SGX) and the Monetary
Authority of Singapore (MAS) which sponsored
analyst coverage of previously un-followed or poorly
followed stocks. In 2009, SGX introduced a new
research scheme, SGX Equity Research Insights
(SERI), to better cater the needs of listed companies
and their investors. Around this same period, three of
the top ten largest stock exchanges, NYSE Euronext,
NASDAQ and London Stock Exchange, also
launched a similar exchange sponsored research
scheme6.
5 The measures include the reduction of minimum of bid sizes, setting up of Over the Counter (OTC) model for stock borrowing and lending and short selling, launching of market making guidelines for structured warrants and exchange traded funds and the establishment of Malaysian Investor Relations Association (MIRA). 6 NASDAQ Euronext struck a deal with Virtua Resaerch to make financial models of under-researched companies available on the NYSE website and NASDAQ OMX inked

Corporate Ownership & Control / Volume 11, Issue 1, 2013, Continued - 7
660
The two-year pilot phase of the CBRS scheme,
with a participation of 303 listed companies, was
completed in June 2007. More than ten research
houses and stock broking firms are involved and
Standard & Poor Equity Research being the anchor
research provider. The second phase of the scheme,
which ran from end-2007 until end-2010, involves
218 listed companies and 15 research firms.
Currently, the scheme is in its third phase. Under the
scheme, participating companies pay 50% of the cost
of RM60,000 for two-year participation while CMDF
subsidises the balance. Each participating listed
company is covered by at least two research firms.
Research reports generated under this scheme are
published on the Bursa Malaysia website and made
available, free of charge to the public. At a minimum,
research firms are required to produce in each year: (i)
one initiation of Coverage Report within 3 months
from commencement date; (ii) at least four coverage
of Results Reports, corresponding to the quarterly
results and full year results announcements by the
listed company, and (iii) at least two Update Reports
to be issued at any time within the year, at the
discretion of the research firm. A sample of the
Initiation Report, Results Report and Update Reports
can be obtained from Bursa website7.
According to Bursa Malaysia Annual Report
2008, the average number of hits per day on CBRS
website is more than 38,000. In 2010, there are 50,000
downloads of analyst reports a month compared to the
30,000 downloads a month from January 2008.
According to media reports, Bursa Malaysia claimed
that the scheme has achieved its objective of
facilitating informed investing and widening the
coverage for small- and mid-cap companies.8
3. Prior related literature and hypotheses development 3.1. Prior literature
Prior literature has documented the impact of analyst
coverage on firms based on the (a) informational role,
(b) monitoring role, and (c) both informational and
monitoring role played by analysts in the capital
market. Examples of the first strand include Brennan
and Subrahmanyam (1995) who conjecture that more
analyst coverage results in a greater number of
informed traders in the market for a stock. Therefore,
prices will tend to be more informative and as a result,
uninformed traders face smaller expected losses from
an exclusive agreement with Morningstar under which Morningstar will provide research profiles of companies listed on its exchanges. London Stock Exchange launched PSQ Analytics, a service that produces research coverage of smaller companies on the London Stock Exchange’s Main Market and AIM. 7 http://www.klse.com.my. 8 See for example The Star, 7th August 2010.
transactions with informed traders which lead to a
smaller spread. Using 1,550 common stocks that were
listed continuously on the New York Stock Exchange
for the calendar year 1988, Brennan and
Subrahmanyam (1995) find that greater analyst
following reduces adverse selection costs and deepens
the market. In a similar vein, Brennan and
Tamarowski (2000) also show that the number of
analyst who follows a firm has a positive effect on the
liquidity of trading in the firm’s shares by reducing
information asymmetry. Recently, Bowen et al.
(2008) hypothesise that analyst coverage reduce
information asymmetry among investors and thus
lower the cost of raising equity capital. They
investigate the effect of analyst coverage on the
underpricing of 4,776 seasoned equity offerings
whereby underpricing represents a substantial cost of
issuing new shares. They find that a higher level of
analyst following is associated with less underpricing,
which suggests lower cost of equity for heavily
followed firms.
Chung and Jo (1996) posit that analysts’
monitoring of corporate performance helps motivate
managers, thus reducing agency costs associated with
the separation of ownership and control. At the same
time, analysts also help to expand the breadth of
investor recognition. Consistent with these
conjectures, they find evidence that analyst following
exerts a significant and positive impact on firms’
market value, as proxied by Tobin’s q. Similarly,
Lang et al. (2004) also find that increased analyst
following is associated with higher valuations arguing
from monitoring perspective.
Using both the informational as well as
monitoring role of analysts, Cheng and Subramanyam
(2008) hypothesise a negative relation between
analyst following and default risk. They argue that
this relationship is expected because of both the
monitoring and the informational roles played by
analysts. Consistent with their hypothesis, the results
document that default risk, as proxied by credit rating,
is lower when a firm is followed by a large number of
analysts.
Another strand of research investigates how the
market reacts to analyst recommendations published
or broadcasted (Davies and Canes, 1978; Groth, et al.,
1979; Bjerring et al., 1983; Pari, 1987)9. These
empirical studies show that abnormal performance is
associated with the recommendations. However, these
studies do not examine what drives the abnormal
performance associated with the recommendations.
9 Davies and Canes (1978) examine the analyst recommendations appearing in the Wall Street Journal’s “Heard on the Street” column. Groth et al. (1979) and Bjerring et al. (1983) evaluate the investment advice of a U.S. brokerage house and a leading Canadian brokerage house respectively. Pari (1987) investigates guest recommendations on the Wall Street Week television program.

Corporate Ownership & Control / Volume 11, Issue 1, 2013, Continued - 7
661
Barber and Loeffler (1993) address the issue by
suggesting two potential hypotheses, namely price
pressure hypothesis and the information hypothesis.
The price pressure hypothesis states that the
recommendation creates temporary buying pressures
by uninformed investors. Investors rush out to buy or
sell stocks based on recommendations even though
these recommendations are tied to no value related
information, creating temporary price pressure and
thus causes the observed abnormal returns. On the
other hand, the information hypothesis proposes that
analyst’s recommendation reveals relevant
information, and thus the abnormal performance on
the announcement of a recommendation represents a
fundamental revaluation of the security. Using
analysts’ recommendations published in the monthly
“Dartboard” column of the Wall Street Journal,
Barber and Loeffler (1993) conclude that the positive
abnormal return on announcement of the
recommendations is a result of naive buying pressure
as well as the information content of the analysts’
recommendations. Recently, Keasler and McNeil
(2010) examine the market’s reaction to stock
recommendations of Jim Cramer on Mad Money, a
CNBC hour long weekday television show. Their
results, however, provide greater support for the price
pressure hypothesis as opposed to the information
hypothesis.
3.2. Theoretical framework and hypotheses development
This study draws on investor recognition hypothesis
suggested by Merton (1987) to investigate the impact
of analyst research scheme on stock turnover. Merton
modifies the rational framework of the capital asset
pricing model (CAPM) to account for incomplete
information. The key behavioural assumption
underpinning Merton’s model is that investor’s
incomplete information affects their trading behaviour
and the resulting stock values. Due to incomplete
information, some investors may not be aware about
certain stocks and as a result, they do not hold the
stocks in their portfolio. In such case, investors will
be inadequately diversified and their undiversified
positions entail the bearing of some non-systematic
risk for which they require compensation. Based on
this rationale, Merton (1987) shows that when stocks
are recognised by large number of investors, the
investor base for the stocks will be increased and
subsequently the expected rate of return will be
reduced. Likewise, analyst research scheme can help
to increase the investors’ awareness of the companies
as information is disseminated to more investors via
the stock exchange’s website. Therefore, companies
are recognised by more investors and the decreased in
expected rate of return is likely to improve stock
liquidity, as suggested by Merton.
Merton’s (1987) model has been empirically
tested and supported in a number of studies. Kadlec
and McConnel (1994) provide the first empirical test
of Merton's model. Using 273 Nasdaq stocks that
listed on the NYSE over the period 1980 to 1989,
Kadlec and McConnel examine a few aspects of
investor recognition. Their results show that newly
listed companies experience a 19% increase in the
number of registered shareholders and a 27% increase
in the number of institutional shareholders. They also
find that after controlling for changes in bid-ask
spread, companies that experience the greatest
increase in number of shareholders after listing have
the greatest increase in stock prices. Chung and Jo
(1996) also postulate in their study that the
information intermediary function provided by
security analysts helps expand the breadth of investor
recognition. Using Tobin’s q as measure of market
value, Chung and Jo (1996) find that market value is
significantly and positively associated with the
number of analysts following the firm. Chen et al.
(2004) study the price effects of inclusion in the S&P
500 index. They document a permanent increase in
the price of added firms and explain that the price
effect arises from the changes in investor awareness.
More recently, Lehavy and Sloan (2008) find that
investor recognition can explain more of a firm’s
stock return than investment fundamentals, such as
earnings and cash flows.
Consistent with the above arguments, this study
posits that there is positive relationship between
analyst coverage and stock turnover. Analyst reduces
information asymmetry by collecting and
disseminating information to investors. The
information increases market liquidity by increased
trading of informed or uninformed investors. In a
similar vein, the investor recognition hypothesis
suggests that more complete information would create
investors’ awareness in a particular stock and as a
result, stock turnover is improved. In addition to the
information role, analyst coverage serves as
monitoring device to helps reduce agency costs and
the lower the cost of capital which results in improve
stock liquidity. The above reasoning leads to the
following hypothesis stated in the alternative form:
H1. Analyst coverage is positively associated
with stock turnover.
A central concept in the theoretical and
empirical work examining stock turnover is
information asymmetry. As pointed out earlier, prior
literature suggests that analysts reduce information
asymmetry between informed and uninformed
investors by disseminating information to investors.
Thus, the effectiveness of the analyst is likely to vary
with the level of information asymmetry of a
company that participates in the analyst research
scheme. More specifically, the involvement of analyst
is likely to enhance stock turnover more for a high
information asymmetry company than for a low
information asymmetry company. Thus, we also
investigate whether the association between analyst
coverage and stock turnover is stronger for firms with
Corporate Ownership & Control / Volume 11, Issue 1, 2013, Continued - 7
662
a high level of information asymmetry of a company.
To test this reasoning we set up the following
hypothesis in alternative form:
H2. The positive association between analyst
coverage and stock turnover is stronger for
companies with high information asymmetry.
4. Research design
4.1. Sample selection and data
The initial sample consists of all 303 Bursa Malaysia
listed companies that participated in the first phase of
CBRS. Thirty eight companies that were listed during
year 2005, 2006 and 2007 are eliminated from the
sample to avoid the confounding effects of newly
listed firms (with perhaps different characteristics and
incentives to maintain liquidity). The remaining
companies are matched with the availability of stock
data. If stock data of a company is not available, the
company is excluded from the sample. As a result, the
final sample comprised 240 participating companies.
For each of the sample companies, analyst
research reports from 1 April 2005 to 30 June 2007
are downloaded from the Bursa Malaysia CBRS
website. Daily stock data, covers the period from 1
January 2005 to 30 June 2007, are collected from the
Datastream. The companies’ daily stock data include
trading volume (both in number and dollar), last
traded price, last ask price, last bid price, market
capitalization, number of outstanding shares and
market to book ratio. For each of the variables
constructed, the daily data has to be available for at
least 45 trading days in each calendar quarter and the
data are averaged for the calendar quarter. Failing
which, the company quarter will be excluded from the
analysis.
4.2. Variable Measurement
4.2.1. Dependent Variable
Stock turnover (TURN) is proposed by Datar et al.
(1998) which reflects trading activity. It is defined as
the ratio of the number of shares traded (trading
volume) to the number of shares outstanding for a
company. Stock turnover is computed as averages of
daily data at quarterly frequencies.
di
D
d
di
qi
qi SOVOLD
TURN ,
1
,
,
, /1
(1)
where Di,q is the number of trading days for
company i in quarter q. VOLi,d is the trading volume
(number of shares traded) and SOi,d is the number of
shares outstanding for company i on day d. Both the
volume and number of shares outstanding data are
collected on a daily basis. The use of daily data
eliminates the issue of stock changes due to stock
splits etc.
4.2.2. Test Variable
The commonly used measure for analyst coverage or
analyst following in the prior empirical studies is the
number of analyst following a firm (the number of
analyst who issued earnings forecast for the firm) and
the data is drawn from I/B/E/S (I/B/E/S refers to
Institutional Brokers’ Estimate System.) (see for
example Ahn et al., 2005; Chan and Hameed, 2006).
Since the aim of this study is to examine the effect of
the exchange sponsored analyst scheme, the analyst
coverage measure thus refers to the analyst following
a company participating in the scheme.
This study adopts two different measures for
analyst coverage. The first measure is the frequency
of analyst coverage, proxied by the number of analyst
research reports posted on the CBRS website. The
second measure is a dichotomous measure to
distinguish whether or not there is analyst coverage
for a firm in a certain period.
4.3. Model specification
To test for the effect of frequency of analyst coverage
on stock turnover, the following regression model is
estimated:
where TURNi,Qt is the stock turnover of company
i during quarter Qt, measured as stock turnover
(TURN). RPTi,Qt is the number of analyst research
reports of company i uploaded on Bursa CBRS
website during quarter Qt. The number of analyst
research reports is used as an indication of the
frequency of analyst coverage. If analyst research
reports reduce information asymmetry by revealing
information, the stock turnover is likely to be
improved. Therefore, the coefficient associated with
Log(1+RPTi,Qt) will have a positive sign.
Following previous research (for example
Roulstone, 2003; Chung et al., 2010), a total of four
firm specific control variables that are known to
influence stock turnover are included in this study, i.e.
company size (MCAP), growth (MTB), stock price
(PRICE) and stock return volatility (SDRET).
Company size is proxied by market capitalization
tiiQti
QtiQtiQtiQtiQti
mmiesIndustryDumiesQuarterDumINEDSDRET
PRICEMTBMCAPRPTLOGTURN
,876,5
,4,3,2,1, )1(*
(2)

Corporate Ownership & Control / Volume 11, Issue 1, 2013, Continued - 7
663
(MCAP) defined as shares outstanding multiplied by
price. Large companies are expected to be more liquid
as they are more transparent due to the greater
demand from shareholders. On the other hand, high
growth companies, proxied by high market to book
ratio (MTB) are likely to be less liquid as they are
associated with higher information asymmetry. MTB
is defined as the stock price divided by the book
value. Stock price (PRICE) is the last traded share
price at the end of the day whereas stock return
volatility is proxied by the standard deviation of daily
returns (SDRET). We also include board
independence (INED) as a proxy for corporate
governance since Foo and Mat Zain (2010) provide
some evidence on the relationship between board
independence and stock liquidity in Malaysia. They
argue that the inclusion of independent non-executive
directors on corporate boards improves firms’
compliance with disclosure requirements and reduces
agency costs thus leading to higher liquidity.
Similarly, Kent and Steward (2008) as well as Taylor
et al. (2010) also provide evidence that disclosure is
positively related to some aspects of corporate
governance. Board independence is measured as the
percentage of independent non-executive directors on
the board. Table 1 provides a summary of the
variables used in the study.
Table 1. Variable Definitions
Variable Definition
Analyst coverage variables:
RPTi,qt = number of analyst research report of company i in Quarter qt.
COVERi,qt = An indicator variable set to one if the company is covered by analyst during Quarter qt.
Dependent variables:
TURNi,q = stock turnover ratio of company i in quarter q, calculated as the natural log of average daily stock trading
volume divided by the number of outstanding shares.
di
D
d
di
qi
SOVOLD
Log ,
1
,
,
/1
ΔTURNi,qt = change in stock turnover of company i in quarter qt, calculated as stock turnover ratio of company i in
Quarter qt less stock turnover ratio of company i in quarter q1. [TURNi,qt –TURNi,q1]
Other variables:
MCAPi,q = market capitalisation of company i in quarter q, calculated as natural log of average daily share price
multiplied by number of outstanding shares.
D
d
dingSharesOutsprice
qiD
Log
1
tan*
,
1
MTBi,q = market to book ratio of company i in quarter q, calculated as natural log of average daily shares price
divided by the book value.
D
dqi BookValue
iceShare
DLog
1,
Pr1
PRICEi,q
=
share price of company i in quarter q, calculated as natural log of average daily share price.
D
dqi
priceD
Log1,
1
SDRETi,q = standard deviation of return of company i in quarter q, calculated as natural log of standard deviation of
return.
INED = proportion of independent non-executive director on board.
ΔMCAPi,qt = change in market capitalisation of company i in quarter q, calculated as market capitalisation of company i
in Quarter qt less stock market capitalisation of company i in quarter q1. [MCAP i,qt –MCAPi,q1]
ΔMTBi,qt = change in market to book ratio of company i in quarter q, calculated as market to book ratio of company i
in Quarter qt less market to book ratio of company i in quarter q1. [MTB i,qt –MTBi,q1]
ΔPRICEi,qt = change in price of company i in quarter q, calculated as share price of company i in Quarter qt less share
price of company i in quarter q1. [PRICE i,qt –PRICEi,q1]
ΔSDRETi,qt = Change in standard deviation of return of company i in quarter q, calculated as standard deviation of
return of company i in Quarter qt less standard deviation of return of company i in quarter q1.
[SDRET i,qt –SDRETi,q1]
Note: Quarter 1 (q1) denotes Quarter 1 Year 2005, the quarter before the launch of the analyst research scheme. Quarter t (qt)
denotes quarters after the launch of the analyst research scheme.

Corporate Ownership & Control / Volume 11, Issue 1, 2013, Continued - 7
664
5. Empirical results
5.1. Descriptive statistics
For the 240 sample companies, a total of 4,439
research reports were posted on Bursa CBRS website
during the first phase of the research scheme. Table 2
summarises the descriptive statistics for the pooled
data of the 240 sample companies (2160 company-
quarter for most of the variables) from April 2005 to
June 2007. The average number of analyst research
report for a quarter is two with a maximum of seven
research reports in a quarter. The mean market
capitalization is RM 341 million and market to book
ratio is 1.1213. Table 3 provides simple correlations
between variables. As expected, stock turnover
(TURN) is positively significantly correlated with the
number of analyst research report (RPT). The size of a
company (MCAP) is positively related to TURN.
There is no high correlation between the independent
variables, namely market capitalization (MCAP),
market to book ratio (MTB), price (PRICE), return
volatility (SDRET) and the proportion of independent
non-executive directors (INED).
Table 2. Descriptive Statistics (240 companies) for 9 quarters from April 2005 to June 2007
Observation Mean Std. Dev. Min Max
TURN 2160 0.0021 0.0060 0.0000 0.1426
RPT 2160 2.0551 1.2561 0.0000 7.0000
MCAP 2160 340.0668 643.5578 16.90377 8707.69
MTB 2099 1.1213 1.0222 0.1410 14.2750
PRICE 2160 1.6784 2.0030 0.1032 40.4468
SDRET 2160 0.0257 0.0159 0.0029 0.1439
INED 2106 0.3992 0.1148 0.1000 0.8300
Note:
TURN = stock turnover
RPT = number of analyst research report
MCAP = market capitalisation (in MYR million)
MTB = market to book ratio
PRICE = share price
SDRET = standard deviation of return
INED = proportion of independent non-executive director on board
Table 3. Correlations
RPT TURN MCAP MTB PRICE SDRET INED
RPT 1
TURN 0.1495** 1
MCAP 0.03812* 0.0963** 1
MTB -0.02325 0.1282** 0.3092** 1
PRICE -0.0144 -0.1503** 0.5992** 0.3968** 1
SDRET 0.0693** 0.3600** 0.2669** -0.1449** -0.5011** 1
INED -0.0328 0.0750** 0.0482* -0.0438* 0.0069 0.0279 1
Note:
RPT = natural log of one plus number of analyst research report for company i in quarter t.
TURN = natural log of stock turnover
MCAP = natural log of market capitalization
MTB = natural log of market to book ratio
PRICE = natural log of share price
SDRET = natural log of standard deviation of return
INED = proportion of independent non-executive director on board
** and * correlation is significant at the 0.01 and 0.05 level (2-tailed).
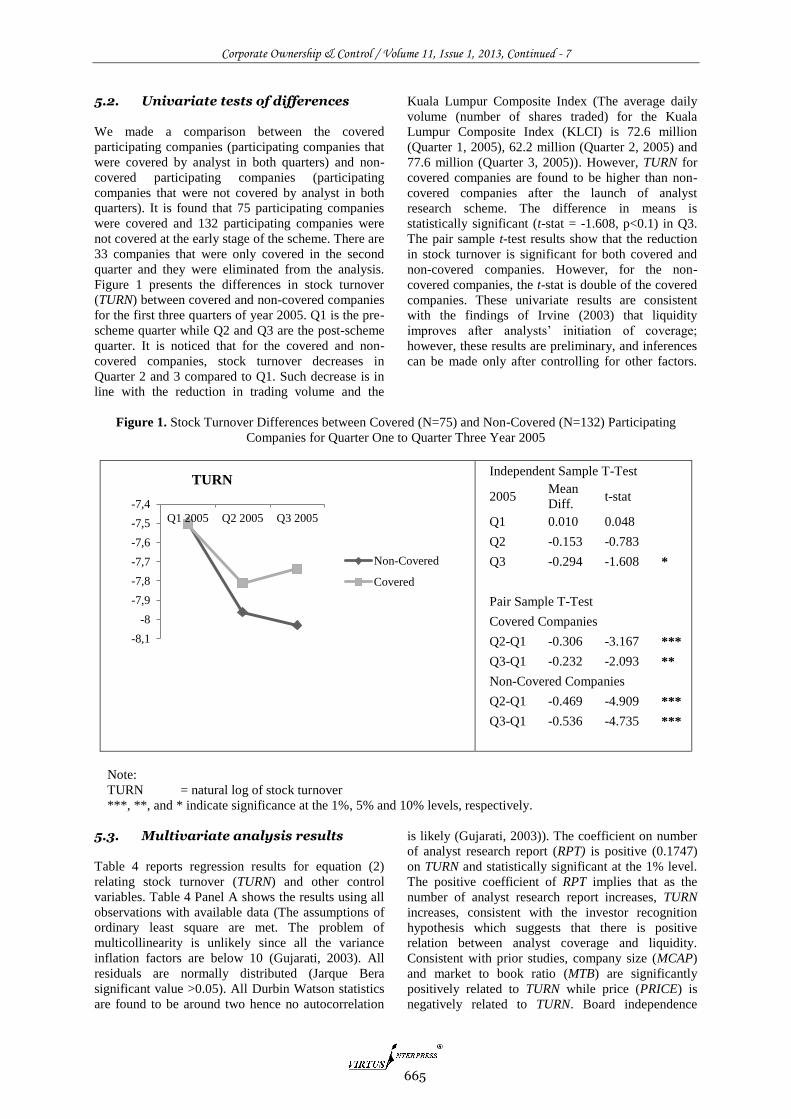
Corporate Ownership & Control / Volume 11, Issue 1, 2013, Continued - 7
665
5.2. Univariate tests of differences
We made a comparison between the covered
participating companies (participating companies that
were covered by analyst in both quarters) and non-
covered participating companies (participating
companies that were not covered by analyst in both
quarters). It is found that 75 participating companies
were covered and 132 participating companies were
not covered at the early stage of the scheme. There are
33 companies that were only covered in the second
quarter and they were eliminated from the analysis.
Figure 1 presents the differences in stock turnover
(TURN) between covered and non-covered companies
for the first three quarters of year 2005. Q1 is the pre-
scheme quarter while Q2 and Q3 are the post-scheme
quarter. It is noticed that for the covered and non-
covered companies, stock turnover decreases in
Quarter 2 and 3 compared to Q1. Such decrease is in
line with the reduction in trading volume and the
Kuala Lumpur Composite Index (The average daily
volume (number of shares traded) for the Kuala
Lumpur Composite Index (KLCI) is 72.6 million
(Quarter 1, 2005), 62.2 million (Quarter 2, 2005) and
77.6 million (Quarter 3, 2005)). However, TURN for
covered companies are found to be higher than non-
covered companies after the launch of analyst
research scheme. The difference in means is
statistically significant (t-stat = -1.608, p<0.1) in Q3.
The pair sample t-test results show that the reduction
in stock turnover is significant for both covered and
non-covered companies. However, for the non-
covered companies, the t-stat is double of the covered
companies. These univariate results are consistent
with the findings of Irvine (2003) that liquidity
improves after analysts’ initiation of coverage;
however, these results are preliminary, and inferences
can be made only after controlling for other factors.
Figure 1. Stock Turnover Differences between Covered (N=75) and Non-Covered (N=132) Participating
Companies for Quarter One to Quarter Three Year 2005
Independent Sample T-Test
2005 Mean
Diff. t-stat
Q1 0.010 0.048
Q2 -0.153 -0.783
Q3 -0.294 -1.608 *
Pair Sample T-Test
Covered Companies
Q2-Q1 -0.306 -3.167 ***
Q3-Q1 -0.232 -2.093 **
Non-Covered Companies
Q2-Q1 -0.469 -4.909 ***
Q3-Q1 -0.536 -4.735 ***
Note:
TURN = natural log of stock turnover
***, **, and * indicate significance at the 1%, 5% and 10% levels, respectively.
5.3. Multivariate analysis results
Table 4 reports regression results for equation (2)
relating stock turnover (TURN) and other control
variables. Table 4 Panel A shows the results using all
observations with available data (The assumptions of
ordinary least square are met. The problem of
multicollinearity is unlikely since all the variance
inflation factors are below 10 (Gujarati, 2003). All
residuals are normally distributed (Jarque Bera
significant value >0.05). All Durbin Watson statistics
are found to be around two hence no autocorrelation
is likely (Gujarati, 2003)). The coefficient on number
of analyst research report (RPT) is positive (0.1747)
on TURN and statistically significant at the 1% level.
The positive coefficient of RPT implies that as the
number of analyst research report increases, TURN
increases, consistent with the investor recognition
hypothesis which suggests that there is positive
relation between analyst coverage and liquidity.
Consistent with prior studies, company size (MCAP)
and market to book ratio (MTB) are significantly
positively related to TURN while price (PRICE) is
negatively related to TURN. Board independence
-8,1
-8
-7,9
-7,8
-7,7
-7,6
-7,5
-7,4
Q1 2005 Q2 2005 Q3 2005
TURN
Non-Covered
Covered

Corporate Ownership & Control / Volume 11, Issue 1, 2013, Continued - 7
666
(INED) is also significantly positively related to
TURN. Industry and quarter effect are included in the
regression analysis but in order to present the results
parsimoniously, the individual coefficient on seven
industries and eight quarters are excluded from the
table.
To test H2, we partitioned the sample based on
the level of information asymmetry, proxied by bid-
ask spread (Bid-ask spread is measured as the average
of closing ask price less bid price scaled by the
middle prices. It is commonly used as the proxy for
information asymmetry in prior studies (for example
Welker, 1995; Petersen and Plenborg, 2006). We also,
in additional tests, split the sample by firm age based
on the argument that younger firms are associated
with higher information asymmetry (Pastor and
Veronesi, 2003; Pittman and Fortin, 2004)).
Companies are categorised as HIGH (LOW) if their
bid-ask spreads are above (below) median. Table 4
Panel B and C reports the regression results of the
companies with HIGH and LOW information
asymmetry respective. Consistent with H2, the
positive coefficient on RPT on TURN is statistically
significant at the 5% level for companies with HIGH
information asymmetry and not significant for the
companies with LOW information asymmetry. We
also ran a regression with an interaction term between
high/low dummy (1=high, 0=low) variable for the
bid-ask spreads and RPT in the same regression and
the results (unreported) show a significant negative
interaction thus supporting the earlier results.
Table 4. Regression on stock turnover
Panel A
Panel B
Panel C
All
High
Low
Variable Coef t-Stat Sig
Coef t-Stat Sig
Coef t-Stat Sig
CONSTANT -7.2467 -16.27 ***
-6.8362 -10.31 ***
-1.2573 -2.68 ***
RPT 0.1747 2.41 ***
0.1995 2.03 **
0.0876 1.14
MCAP 0.4692 10.97 ***
0.0066 0.07
-0.0467 -1.13
MTB 0.3272 5.54 ***
0.0357 0.39
0.4942 8.20 ***
PRICE -0.4994 -8.02 ***
-0.6564 -6.81 ***
-0.2701 -4.85 ***
SDRET 0.5652 6.77 ***
0.2743 2.24 **
1.2095 14.55 ***
INED 0.7298 2.77 ***
0.5066 1.16
0.2831 1.24
INDUSTRY
included
included
included
QUARTER
included
included
included
F-stat 44.25 (p <0.01)
20.84 (p<0.01)
50.93 (p<0.01)
Adj R2 30.8%
30.4%
50.8%
N 2044
1022
1022
Note:
Refer to Table 1 for variable definition.
***, **, and * indicate significance at the 1%, 5% and 10% levels, respectively (1-tailed)
t-statistics are White-corrected.
5.4. Additional tests
5.4.1. Pre and post scheme liquidity
To evaluate the impact of analyst coverage on the
changes in stock liquidity, we estimate equation (3)
with the subsample of the first six months of the
analyst scheme.
where ΔTURN is the change in stock turnover. ,
defined as TURNi,Qt – TURNQ1. TURNi,Qt is the
quarterly average stock liquidity post analyst research
scheme while TURNi,Q1 is the stock turnover before
the launch of the analyst research scheme. COVERi,Qt
is an indicator variable set equal to one if there is
analyst coverage for company i during quarter q. If
analyst coverage improves stock liquidity, then the
iQti
QtiQtiQtiQtiQti
INEDSDRET
PRICEMTBMCAPCOVERTURN
6,5
,4,3,2,1,
(3)

Corporate Ownership & Control / Volume 11, Issue 1, 2013, Continued - 7
667
estimated coefficient on COVERi,Qt should be positive
for stock turnover (ΔTURN). Similar to the equation
(2) mentioned above, four company-level control
variables, i.e. size (measured by market capitalization,
MCAP), growth (measured by market to book ratio,
MTB), share price (PRICE) and share return volatility
(measured by standard deviation of return, SDRET),
are added in the model to capture the shifts in the
company market data after (Qt) and before (Q1) the
analyst research scheme. ΔMCAPi,Qt is the change in
natural log of company i’s market capitalisation for
quarter Qt, defined as MCAPi,Qt - MCAPi,Q1. ΔMTBi,Qt
is the change in natural log of company i’s market to
book ratio volume for quarter Qt, defined as MTBi,Qt -
MTBi,Q1. ΔPRICEi,Qt is the change in natural log of
company i’s share price for quarter Qt, defined as
PRICEi,Qt - PRICEi,Q1 and ΔSDRETi,Qt is the change in
natural log of company i’s standard deviation of share
return for quarter Qt, defined as SDRETi,Qt -
SDRETi,Q1. Board independence (INED) is also
included.
The results are reported in Panel A of Table 5.
The coefficient on analyst coverage (COVER) is
0.2886 with a significant t-value of 2.92, thus
providing evidence that analyst coverage has an
impact on the changes in stock turnover comparing
the post-scheme and pre-scheme quarter. However,
the results are not clearly interpretable as some
companies experience reduction while some
experience increase in stock turnover. To further
examine the impact of analyst coverage on the
increase or decrease in stock turnover, we partition
the sample into increase in stock turnover and
decrease in stock turnover and run the regression on
the subsample respectively. The results in Panel B
Table 5 clearly indicate significantly negative
coefficient (-0.3964) on COVER for those companies
experiencing a decrease in stock turnover. However,
there is no significant association between COVER
and stock turnover for companies which experienced
an increase in stock turnover (Panel C Table 5). The
evidence suggests that the presence of analyst
coverage reduces the reduction in stock turnover. In
other words, reduction in stock turnover is less severe
for companies that are covered by analyst, as shown
in Figure 2. We also split the sample (based on
terciles) for the test in Panel B in terms of high and
low information asymmetry. The results (untabulated)
are significant for firms with high information
asymmetry (coefficient -0.3476, t-stat = 2.12) and not
for firms with low information asymmetry
(coefficient -0.1863, t-stat = 1.41), consistent with
hypothesis 2.
Table 5. Regression on changes in stock turnover
Panel A
Panel B
Panel C
ΔTURN
Decrease in TURN
Increase in TURN
Variable Coef t-Stat Sig
Coef t-Stat Sig
Coef t-Stat Sig
CONSTANT -0.6601 -2.69 ***
-1.4336 -6.21 ***
0.5810 2.95 ***
COVER 0.2886 2.92 ***
-0.3964 -4.72 ***
0.0601 0.61
ΔMCAP 1.4258 4.55 ***
0.9574 2.32 **
0.6417 2.49
ΔMTB 0.0015 0.01
0.0027 0.02
-0.4177 -0.96
ΔPRICE -0.1860 -0.69
-0.6003 -1.40
0.2932 2.69 ***
ΔSDRET 0.7152 6.58 ***
0.4028 3.30 ***
0.3549 0.81
INED 0.1526 0.35
0.2594 0.68
INDUSTRY
included
included
included
QUARTER
included
included
included
F-stat 7.59 (p<0.01)
4.07 (p<0.01)
2.25 (p<0.01)
Adj R2 19.9%
12.8%
19.2%
N 442
294
148
Note:
Refer to Table 1 for variable definition.
***, **, and * indicate significance at the 1%, 5% and 10% levels, respectively (1-tailed).
t-statistics are White-corrected.

Corporate Ownership & Control / Volume 11, Issue 1, 2013, Continued - 7
668
5.4.2. Sensitivity tests
First, we perform tests to control for the possible
correlation in the time-series and cross-sectional error
structure by using the methodology discussed in
Petersen (2009) to control for clustered standard
errors. The results (untabulated) are qualitatively
similar to those reported in Table 4.
Second, we perform sensitivity checks by using
firm age as another proxy for information asymmetry
and partition the sample into HIGH and LOW
information asymmetry. Prior research suggests that
information problems subside with age as firms’
accumulate a history in the capital markets (Pittman
and Fortin, 2004). By examining the link between
auditor choice and debt pricing for newly public
firms, Pittman and Fortin (2004) provide evidence
that the economic value of auditor reputation to the
cost of credit declines over time as borrowers
gradually shift toward relying on their own
reputations to moderate information asymmetry. In a
similar vein, we conjecture that older firms have less
information asymmetry than younger firms. Thus, the
positive association between analyst coverage is
likely to be stronger for younger firm. The results
(untabulated) are qualitatively similar to those
reported using bid-ask spread as a proxy for
information asymmetry for tests in Table 4 and Panel
B of Table 5.
6. Limitations
This study is subject to several limitations. First, the
empirical evidence provided in this study is confined
to participating companies in the first phase of the
analyst research scheme, i.e. from April 2005 to June
2007. Future research may expand the investigation to
the second phase of the analyst research scheme
which has just been completed in December 2010.
Second, this study has only taken into account the
number of analyst research reports as a proxy for
frequency of analyst coverage without considering the
content of analyst research reports which could have
an impact on stock liquidity. One could therefore
extend the study by examining the content as well as
the type of recommendation (“buy”, “sell” or “hold”)
presented in the analyst research reports.
Third, this study has not taken into account the
time that an analyst research report is posted on
Bursa’s website. Timeliness is a necessary component
of financial information disseminate through internet
(Abdelsalam and Street, 2007). The availability of
high frequency data (intraday data) would enable a
study into the speed with which the information
generated on analyst research reports is impounded
into stock prices. Lastly, the results cannot be
generalised to other countries as the evidence is
drawn from companies listed on the Malaysian stock
exchange. It may be worthwhile for future studies to
consider a comparative analysis of the analyst
research scheme offered by stock exchanges in
different countries.
7. Conclusion
This study examines whether the analyst research
scheme has an impact on stock turnover. Using a
sample of 240 companies that participated in the first
phase of the research scheme, the results show that
stock turnover is positively associated with the
frequency of coverage throughout the first phase of
the scheme. The positive association between analyst
coverage and stock turnover is stronger for firms with
higher information asymmetry. By comparing the pre-
and post-scheme period between the companies
covered by analyst and not covered by analyst, it is
found that during the stock market downturn period,
the reduction in stock turnover is significantly less
severe for companies that are covered by analysts.
Thus, the results support the investor recognition
hypothesis as suggested by Merton (1987).
The fundamental contribution of this study is
that it sheds light on the controversy regarding the
link between analyst following and stock turnover
discussed earlier. The results support the theory that
analyst coverage improves stock turnover due to the
reduction in information asymmetry, consistent with
the findings in Brennan and Subrahmanyam (1995)
and Brennan and Tamarowski (2000). Further, these
results have implications for Malaysian policy makers
in the sense that it demonstrates that sponsored
analyst scheme does indeed achieve the objective of
increasing stock liquidity. Other emerging countries
with low stock liquidity might very well emulate the
Malaysian practice.
References 1. Abdelsalam, O.H. and D.L. Street (2007), ‘Corporate
governance and the timeliness of corporate internet
reporting by U.K. listed companies’, Journal of
International Accounting, Auditing & Taxation, 16:
111-130.
2. Ahn, H.-J., J. Cai, Y. Hamao and R.Y. K. Ho (2005),
‘Adverse selection, brokerage coverage, and trading
activity on the Tokyo Stock Exchange’, Journal of
Banking & Finance, 29 (6): 1483-508.
3. Amihud, Y. and H. Mendelson (1986), ‘Asset pricing
and the bid-ask spread’, Journal of Financial
Economics, 17 (2): 223-249.
4. Amihud, Y., H. Mendelson and J. Uno (1999),
‘Number of Shareholders and Stock Prices: Evidence
from Japan’, The Journal of Finance, 54 (3): 1169-
1184.
5. Barber, B.M. and D. Loeffler (1993), ‘The "Dartboard"
Column: Second-Hand Information and Price
Pressure’, Journal of Financial & Quantitative
Analysis, 28 (2): 273-284.
6. Bekaert, G., C.R. Harvey and C. Lundblad (2007),
‘Liquidity and Expected Returns: Lessons from
Emerging Markets’, The Review of Financial Studies,
20 (6): 1783-1831.

Corporate Ownership & Control / Volume 11, Issue 1, 2013, Continued - 7
669
7. Bjerring, J.H., J. Lakonishok and T. Vermaelen (1983),
‘Stock Prices and Financial Analysts'
Recommendations’, Journal of Finance, 38 (1): 187-
204.
8. Bowen, R.M., X. Chen and Q. Cheng (2008), ‘Analyst
Coverage and the Cost of Raising Equity Capital:
Evidence from Underpricing of Seasoned Equity
Offerings’, Contemporary Accounting Research, 25
(3): 657-699.
9. Brennan, M.J. and A. Subrahmanyam (1995),
‘Investment analysis and price formation in securities
markets’, Journal of Financial Economics, 38 (3): 361-
381.
10. Brennan, M.J. and C. Tamarowski (2000), ‘Investor
Relations, Liquidity, And Stock Prices’, Journal of
Applied Corporate Finance, 12 (4): 26-37.
11. Brown, J.H., D.K. Crocker and S.R. Foerster (2009),
‘Trading Volume and Stock Investments’, Financial
Analysts Journal, 65 (2): 1-18.
12. Chan, K. and A. Hameed (2006), ‘Stock price
synchronicity and analyst coverage in emerging
markets’, Journal of Financial Economics, 80 (1): 115-
147.
13. Chen, H., G. Noronha and V. Singal (2004), ‘The Price
Response to S&P 500 Index Additions and Deletions:
Evidence of Asymmetry and a New Explanation’, The
Journal of Finance, 59 (4): 1901-1930.
14. Chen, X., Q. Cheng and K. Lo (2010), ‘On the
relationship between analyst reports and corporate
disclosures: Exploring the roles of information
discovery and interpretation’, Journal of Accounting
and Economics, 49 (3): 206-226.
15. Cheng, M. and K.R. Subramanyam (2008), ‘Analyst
Following and Credit Ratings’, Contemporary
Accounting Research, 25 (4): 1007-1043.
16. Chung, K.H., T.H. McInish, R.A. Wood and D.J.
Wyhowski (1995), ‘Production of information,
information asymmetry, and the bid-ask spread:
Empirical evidence from analysts' forecasts’, Journal
of Banking & Finance, 19 (6): 1025-1046.
17. Chung, K.H. and H. Jo (1996), ‘The Impact of Security
Analysts' Monitoring and Marketing Functions on the
Market Value of Firms’, Journal of Financial &
Quantitative Analysis, 31 (4): 493-512.
18. Chung, K. H., J. Elder and J.-C. Kim (2010),
‘Corporate Governance and Liquidity’, Journal of
Financial & Quantitative Analysis, 45 (2): 265-291.
19. Datar, V.T., N.Y. Naik and R. Radcliffe (1998),
‘Liquidity and stock returns: An alternative test’,
Journal of Financial Markets, 1 (2): 203-219.
20. Davies, P.L., and M. Canes (1978), ‘Stock Prices and
the Publication of Second-Hand Information’, Journal
of Business, 51 (1): 43-56.
21. Foo, Y.-B. and M. Mat Zain (2010), ‘Board
independence, board diligence and liquidity in
Malaysia: A research note’, Journal of Contemporary
Accounting & Economics, 6 (2): 92-100.
22. Frankel, R., S.P. Kothari and J. Weber (2006),
‘Determinants of the informativeness of analyst
research’, Journal of Accounting and Economics, 41
(1-2): 29-54.
23. Groth, J.C., W.G. Lewellen, G.G. Schlarbaum and
R.C. Lease (1979), ‘An Analysis of Brokerage House
Securities Recommendations’, Financial Analysts
Journal, 35 (1): 32-40.
24. Grullon, G., G. Kanatas and J.P. Weston (2004),
‘Advertising, Breadth of Ownership, and Liquidity’,
The Review of Financial Studies, 17 (2): 439-461.
25. Gujarati, D. N. (2003), Essentials of Econometrics.
McGraw-Hill Irwin.
26. He, W., L. Shivakumar, B.K. Sidhu and D. Simmonds
(2010), ‘Exchange Sponsored Analyst Research’. 23rd
Australasian Finance and Banking Conference 2010
Paper, Available at SSRN:
http://ssrn.com/abstract=1677713
27. Irvine, P.J. (2003), ‘The incremental impact of analyst
initiation of coverage’, Journal of Corporate Finance,
9 (4): 431-451.
28. Jayaraman, S. and T.T. Milbourn (2012), ‘The Role of
Stock Liquidity in Executive Compensation’, The
Accounting Review, 87 (2): 537-563.
29. Kadlec, G. B. and J.J. McConnell (1994), ‘The Effect
of Market Segmentation and Illiquidity on Asset
Prices: Evidence from Exchange Listings’, Journal of
Finance, 49 (2): 611-636.
30. Keasler, T. and C. McNeil (2010), ‘Mad Money stock
recommendations: market reaction and performance’,
Journal of Economics & Finance, 34 (1): 1-22.
31. Kent, P. and J. Stewart (2008), ‘Corporate governance
and disclosures on the transition to International
Financial Reporting Standards’, Accounting &
Finance, 48 (4): 649-671.
32. Lang, M.H., K.V. Lins and D.P. Miller (2004),
‘Concentrated Control, Analyst Following, and
Valuation: Do Analysts Matter Most When Investors
Are Protected Least?’, Journal of Accounting
Research, 42 (3): 589-623.
33. Lehavy, R. and R. Sloan (2008), ‘Investor recognition
and stock returns’, Review of Accounting Studies, 13
(2): 327-361.
34. Levine, R. (1991), ‘Stock Markets, Growth, and Tax
Policy’, Journal of Finance, 46 (4): 1445-1465.
35. Levine, R. and S. Zervos (1998), ‘Stock Markets,
Banks, and Economic Growth’, The American
Economic Review, 88 (3): 537-558.
36. Mak, Y.T. and J.M. Sequeira (2007), ‘An Analysis of
the Impact of the CMDF-Bursa Research Scheme’.
Available at
http://www2.standardandpoors.com/spf/pdf/equity/
Impact_Study_Revised.pdf.
37. Merton, R.C. (1987), ‘A Simple Model of Capital
Market Equilibrium with Incomplete Information’,
Journal of Finance, 42 (3): 483-510.
38. Pagano, M., O. Randl, A.A. Röell and J. Zechner
(2001), ‘What makes stock exchanges succeed?
Evidence from cross-listing decisions’, European
Economic Review, 45 (4-6): 770-782.
39. Pari, R. (1987), ‘Wall Street Week recommendations:
yes or no?’ Journal of Portfolio Management, 13: 74–
76.
40. Parlour, C.A., D.J. Seppi (2003), ‘Liquidity‐Based
Competition for Order Flow’, Review of Financial
Studies, 16 (2): 301-343.
41. Pastor, L., and P. Veronesi (2003), ‘Stock Valuation
and Learning about Profitability’, Journal of Finance,
58 (5): 1749-1790.
42. Petersen, C. and T. Plenborg (2006), ‘Voluntary
disclosure and information asymmetry in Denmark’,
Journal of International Accounting, Auditing and
Taxation, 15 (2): 127-149.

Corporate Ownership & Control / Volume 11, Issue 1, 2013, Continued - 7
670
43. Petersen, M.A. (2009), ‘Estimating Standard Errors in
Finance Panel Data Sets: Comparing Approaches’,
Review of Financial Studies, 22 (1): 435-480.
44. Pittman, J.A. S. Fortin (2004), ‘Auditor choice and the
cost of debt capital for newly public firms’, Journal of
Accounting and Economics, 37 (1): 113-136.
45. Roulstone, D.T. (2003), ‘Analyst Following and
Market Liquidity’, Contemporary Accounting
Research, 20 (3): 551-578.
46. SRI International (1987), ‘Investor Information Needs
and the Annual Report’. Morristown, N.J: Financial
Executives Research Foundation.
47. Taylor, G., G. Tower and J. Neilson (2010), ‘Corporate
communication of financial risk’, Accounting &
Finance, 50 (2): 417-446.
48. Welker, M. (1995), ‘Disclosure Policy, Information
Asymmetry, and Liquidity in Equity Markets’,
Contemporary Accounting Research, 11 (2): 801-827.
49. White, H. (1980), ‘A Heteroskedasticity-Consistent
Covariance Matrix Estimator And A Direct Test For
Heteroskedasticity’, Econometrica, 48 (4): 817-838.

Corporate Ownership & Control / Volume 11, Issue 1, 2013, Continued - 7
671
THE CORPORATE USE OF DERIVATIVES BY LISTED NON-FINANCIAL FIRMS IN AFRICA
Glen Holman*, Carlos Correia**, Lucian Pitt*, Akios Majoni*
Abstract
This paper presents the results of an extensive analysis of derivative use by 692 companies in 20 countries across the African continent. The results show that 29% of non-financial companies in Africa use derivatives but that derivative use is dominated by firms within South Africa. The study finds that 54% of firms in South Africa use derivatives but only 5% of non-financial firms in Africa (excluding South Africa) use derivatives for hedging purposes. The majority of derivative use is directed toward the management of currency risks and the derivative instrument of choice is OTC forwards. Swaps are used to hedge interest rate risk and minimal use is made of OTC or exchange traded options and futures. Keywords: Derivatives, Currency Exposure, Hedging, Interest Rate Risk, Forwards, Swaps, Options, Commodity Price Risk, Equity Derivatives * University of Cape Town ** Corresponding author, University of Cape Town E-mail: [email protected]
Introduction
Markets have been characterised by increased
volatility in foreign exchange rates, interest rates,
market prices for securities and commodity prices and
as a consequence, companies face increased exposure
to a broad spectrum of financial risks. There is
increasing shareholder expectation that management
not only identify but effectively manage the
company’s exposure to these risks (Bodnar et al.,
1999) and risk management has become a key
strategic focus for companies. The availability of a
variety of derivative instruments may be instrumental
in enabling effective financial risk management by
companies and can have a positive impact on the
value of the firm (Prevost et al, 2000; Nance et al,
1999 and Berkman et al., 1996).
Benson and Oliver (2004) set out the reasons for
risk management which include the reduction of
financial distress and agency costs, achieving
economies of scale at the company level, taking
advantage of differing tax rates and the minimisation
of the costs of external financing. Increased volatility
in earnings and cash flows may result in an increase
in the costs of financial distress and the use of
derivatives may be effective in reducing the volatility
of earnings and cash flows.
Increased volatility in currency rates, interest
rates and commodity prices have been matched by a
significant growth in the use of derivatives such as
swaps, futures, forwards and options. Managers now
have a wide range of derivative instruments available
to manage a corporation’s exposure to volatility in
exchange rates, interest rates and commodity prices.
Nguyen and Faff, (2002) reported that the notional
value of derivatives employed within the corporate
sector rose from USD18 trillion in 1994 to USD70
trillion in 1998. This significant growth in the use of
derivatives continued over the next decade with the
notional value of derivatives used exceeding USD600
trillion by December 2008 (Deutsche Borse, 2009).
The total over-the-counter (OTC) derivative contracts
outstanding amounted to $632.6 trillion in December
2012 (Bank for International Settlements, June 2013).
Smithson and Simkins (2005) in a
comprehensive review of the evidence conclude that
risk management and derivative use by the corporate
sector adds value and refer to a ISDA study which
reported that 92% of the world’s 500 largest
companies used derivatives, with 92% of the firms
using derivatives to manage interest rate risk, 85% of
firms using derivatives to manage currency risks and
25% of firms using derivatives to manage commodity
price risks.
Derivatives markets can facilitate the
management of financial risk exposure, since they
allow investors to unbundle and transfer financial
risk. The development of derivatives markets in sub-
Saharan African countries would enable companies to
self-insure against volatile capital flows and reduce
their dependence on bank financing (Adelegan, 2009).
Research into the extent of the use of derivatives
by the corporate sector and the motives for the use of
derivatives by this sector has thus far mainly focused
on North America, South America, the UK and
Europe, East Asia, Australia and New Zealand. There

Corporate Ownership & Control / Volume 11, Issue 1, 2013, Continued - 7
672
is little published research into derivative use in
Africa. This paper aims to bridge this gap by
analysing the extent to which companies in Africa
make use of derivatives, investigating the motives for
derivative use and identifying the main instruments
used to hedge financial risks. This study addresses the
following research questions;
To what extent do non-financial companies
in Africa make use of derivatives?
Which types of risks are hedged by
companies?
What types of derivatives are most
commonly used by firms in Africa to hedge these
risks?
What number of derivative instruments do
companies employ?
To what extent are there regional differences
in the use of derivatives by firms in Africa,
particularly between South Africa and the rest of
Africa?
How does derivative use in Africa compare
to derivative use in other developed and emerging
markets?
What is the derivative use per sector?
An objective of this study is to understand the
extent to which the use of derivatives by companies in
Africa compares with the use of derivatives in other
countries; however there are some limitations
attached to such a comparison. Sprčić (2007),
Jalivland (1999) and Correia et al (2012) point out
that the timing of the studies may have an impact on
any comparative analysis of results. Comparisons are
more meaningful between studies that have been
carried out over the same period or in periods that are
as close as possible to each other. Similarly,
differences in the scope of the studies undertaken may
limit direct comparison of one with the other. As an
example, the studies by Junior (2007 and 2011) and
Schiozer and Saito (2009), are specifically focused on
the use of currency derivatives, this is a narrower
focus than the studies based on the Wharton School
surveys of Bodnar, et al. (1995). This study
endeavours to focus on the use of derivatives by non-
financial firms so that the use of derivatives by
financial institutions are not included as part of this
study. The intent is to focus on the use of derivatives
for risk management purposes.
This study is organised as follows; the first
section consists of the introduction which includes the
rationale for the study, the context and the research
questions. This is followed by the second section
which consists of a review of prior studies undertaken
in developed and emerging economies. The third
section represents an outline of the data and research
methodologies employed in this study. The fourth
section sets out the results of the study which includes
a detailed descriptive analysis of the use of
derivatives by companies in Africa and includes a
comparative analysis of the use of derivatives in
Africa in relation to derivative use in other parts of
the world. A further comparative analysis is
undertaken of derivative use by South African
companies in relation to the use of derivatives by
companies in the rest of Africa.
Literature Review Format of prior studies
Prior studies of derivative use can be broadly
classified into two approaches; firstly, there are those
that follow a questionnaire-based survey approach
(see Bodnar et al. 1995, 1996, 1998, 1999, 2003 &
2008; Jalilvand 1999; Phillips 1995; Berkman et al.
1997; Pramborg 2003; Correia, Holman & Jahreskog
2012) and secondly, there are studies of derivative use
based on the review of company financial statements
(see Berkman & Bradbury 1996; Junior 2007 & 2011;
Schiozer & Saito 2009; Martin et al. 2009; Marsden
& Prevost 2005; Prevost, et al. 2000; Shu et al. 2003;
Ameer et al. 2011; Selv et al. 2010; Brunzell et al.
2011; and Bartram et al. 2009). There are also
variations. For example, Sprčić, (2007) followed up a
survey with interviews with companies whilst Sheedy
(2006) used the survey approach introduced by the
Wharton school, but completed the surveys by
interviewing the treasury staff at the targeted
companies. Ameer, et al. (2011), followed up his
questionnaires with a review of secondary data on
derivatives obtained from the 2007 and 2008 annual
reports of the companies reviewed in Malaysia.
Limitations of survey questionnaires relate to
poor response rates, issues regarding interpretation,
non-response bias and comparability issues. The
improvement in disclosure required in terms of
International Financial Reporting Standards (IFRS),
specifically IFRS 7 and IAS 39 relating to mandatory
disclosure required in relation to financial
instruments, has improved the ability to extract
information from annual reports in respect to
derivative use. Whilst the use of annual reports may
limit the ambit of the study in relation to such issues
as investigating the motives for derivative use, the use
of annual reports improves the objectivity of such
analysis even though such a study may be limited in
scope.
In relation to Africa, Modack, Holman and
Correia (2012) analysed derivative use of South
African companies by reviewing annual financial
statements and yet the results of this study of annual
reports of the largest 100 companies in South Africa
was closely correlated to the results of using a
questionnaire survey of derivative use undertaken by
Correia, Holman and Jahreskog (2012).
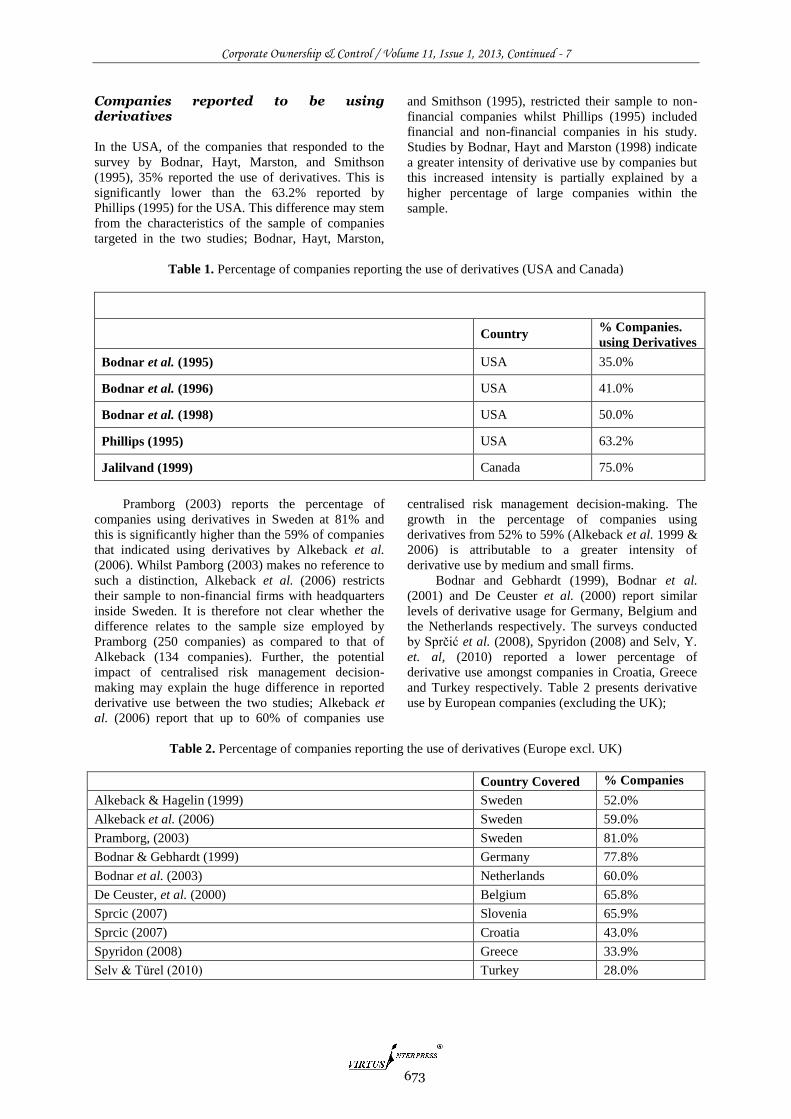
Corporate Ownership & Control / Volume 11, Issue 1, 2013, Continued - 7
673
Companies reported to be using derivatives
In the USA, of the companies that responded to the
survey by Bodnar, Hayt, Marston, and Smithson
(1995), 35% reported the use of derivatives. This is
significantly lower than the 63.2% reported by
Phillips (1995) for the USA. This difference may stem
from the characteristics of the sample of companies
targeted in the two studies; Bodnar, Hayt, Marston,
and Smithson (1995), restricted their sample to non-
financial companies whilst Phillips (1995) included
financial and non-financial companies in his study.
Studies by Bodnar, Hayt and Marston (1998) indicate
a greater intensity of derivative use by companies but
this increased intensity is partially explained by a
higher percentage of large companies within the
sample.
Table 1. Percentage of companies reporting the use of derivatives (USA and Canada)
Country % Companies.
using Derivatives
Bodnar et al. (1995) USA 35.0%
Bodnar et al. (1996) USA 41.0%
Bodnar et al. (1998) USA 50.0%
Phillips (1995) USA 63.2%
Jalilvand (1999) Canada 75.0%
Pramborg (2003) reports the percentage of
companies using derivatives in Sweden at 81% and
this is significantly higher than the 59% of companies
that indicated using derivatives by Alkeback et al.
(2006). Whilst Pamborg (2003) makes no reference to
such a distinction, Alkeback et al. (2006) restricts
their sample to non-financial firms with headquarters
inside Sweden. It is therefore not clear whether the
difference relates to the sample size employed by
Pramborg (250 companies) as compared to that of
Alkeback (134 companies). Further, the potential
impact of centralised risk management decision-
making may explain the huge difference in reported
derivative use between the two studies; Alkeback et
al. (2006) report that up to 60% of companies use
centralised risk management decision-making. The
growth in the percentage of companies using
derivatives from 52% to 59% (Alkeback et al. 1999 &
2006) is attributable to a greater intensity of
derivative use by medium and small firms.
Bodnar and Gebhardt (1999), Bodnar et al.
(2001) and De Ceuster et al. (2000) report similar
levels of derivative usage for Germany, Belgium and
the Netherlands respectively. The surveys conducted
by Sprčić et al. (2008), Spyridon (2008) and Selv, Y.
et. al, (2010) reported a lower percentage of
derivative use amongst companies in Croatia, Greece
and Turkey respectively. Table 2 presents derivative
use by European companies (excluding the UK);
Table 2. Percentage of companies reporting the use of derivatives (Europe excl. UK)
Country Covered % Companies
using
Derivatives Alkeback & Hagelin (1999) Sweden 52.0%
Alkeback et al. (2006) Sweden 59.0%
Pramborg, (2003) Sweden 81.0%
Bodnar & Gebhardt (1999) Germany 77.8%
Bodnar et al. (2003) Netherlands 60.0%
De Ceuster, et al. (2000) Belgium 65.8%
Sprcic (2007) Slovenia 65.9%
Sprcic (2007) Croatia 43.0%
Spyridon (2008) Greece 33.9%
Selv & Türel (2010) Turkey 28.0%

Corporate Ownership & Control / Volume 11, Issue 1, 2013, Continued - 7
674
A number of studies of derivative use have been
undertaken for the UK. Grant and Marshall (1997)
report that 90% of companies in the UK use
derivatives. This is significantly higher than that
reported in other studies for the UK ( see Bailly et al.
2003, Mallin et al. 2001 and El-Masry 2006). Grant
and Marshall restricted their sample of companies to
250 of the largest firms in the UK, whereas the studies
of Bailly et al, (2003), Mallin et al (2001) and El-
Masry (2006) included smaller companies.
The results of the studies by Bailly et al. (2003)
supports the premise of a positive correlation between
firm size and the intensity of derivative use and this
may partially explain the difference in the reported
use of derivatives between the study by Grant and
Marshall (1997) and Bailly et al. (2003), Mallin et al.
(2001) and El-Masry (2006).
Table 3. Percentage of companies reporting the use of derivatives in the UK
Country Covered
% Companies
using
Derivatives
Bailly et al. (2003) UK 72.0%
Grant and Marshall (1997) UK 90.0%
Mallin et al. (2001) UK 60.0%
El-Masry (2006) UK 67.0%
Studies on derivative use have been undertaken
in other countries in Asia as well as Australia, New
Zealand and emerging economies. The percentage of
companies reporting the use of derivatives in Hong
Kong and Singapore is high at 81% and 75%
respectively (Sheedy, 2006). As large companies were
poorly represented in the sample of companies
surveyed by Sheedy (2006), the expectation would
have been that the overall rate of derivative use would
be low since the level of derivative use is found to be
positively correlated with company size (Bodnar et al.
1996 & 1998). Yet, derivative use amongst small and
medium companies in Hong Kong and Singapore is
high and this partially explains the higher overall rate
of derivative use by companies in Hong Kong and
Singapore.
Berkman, Bradbury and Magan (1997) found
that 53.1% of companies in New Zealand used
derivatives. A subsequent study for New Zealand by
Prevost et al. (2000) reported a higher usage rate of
67.1% by companies in New Zealand. Both surveys
reported a high percentage of derivative use by large
companiesi which is consistent with other studies,
however, Prevost et al. (2000) reported a higher
percentage of smaller companies using derivatives;
with more than 50% compared to 36% reported by
Berkman et al. (1997). A similar level of derivative
use by companies in the Industrial sector (52.8%) and
Mining sector (61.5%) was reported by Berkman,
Bradbury, Hancock, and Innes (2002) for Australia.
In Malaysia, Ameer, et al. (2009), reported a
derivative usage rate of 24% and this is supported by
Bartram et al. (2009) who reported that only 20.9% of
firms in Malaysia used derivatives based on a review
of financial statements.
i For Berkman et al, (1997) company size is based on market value. Large >$250m; Medium < $250m and >$50m and small <$50m For Prevost et al., (2000), large firms are defined as those with sales value in excess of NZ$750m and small firms are defined as those with sales value below NZ$50m.
Table 4. Percentage of companies reporting the use of derivatives (Asia, New Zealand and Australia)
Country
Covered
% Companies using
Derivatives Berkman et al. (1997) New Zealand 53.1%
Prevost et al. (2000) New Zealand 67.1%
Berkman et al. (2002) Australia (Industrial) 52.8%
Berkman et al. (2002) Australia (Mining) 61.5%
Sheedy (2006) Hong Kong 81.0%
Sheedy (2006) Singapore 75.0%
Shu & Chen (2003) Taiwan 37.0%
Pramborg (2003) Korea 51.0%
Ameer (2009) Malaysia 43.0%

Corporate Ownership & Control / Volume 11, Issue 1, 2013, Continued - 7
675
Junior (2007) studied the use of foreign currency
derivatives of 212 Brazilian firms, which represented
more than two thirds of all publicly traded firms, and
found that the growth in the percentage of firms using
currency derivatives to be significant. In 1996, 8.2%
of firms were found to be using foreign currency
derivatives but this had grown to 21.9% by 2004. A
change from a fixed to a flexible exchange rate
system during this period would have partially
contributed to the growth in the use of foreign
currency derivatives. Bartram et al. (2009) found
from a sample of 89 large firms that 69.6% of firms in
Latin America use derivatives.
Al-Momani and Gharaibeh (2008) studied the
extent to which firms in Jordan engage in the use of
derivatives to manage foreign exchange risk. Their
study found that 66% of firms engage in the
management foreign currency risk. However, only a
small fraction of these companies engage in derivative
transactions to manage these risks. The most common
methods used by firms to reduce foreign exchange
risks include the use of “natural hedging techniques”
(Al-Momani & Gharaibeh 2008, p.219). In another
study, Bartram et al. (2009) reported on derivative use
in two countries in the Middle East and found that
67.6% of firms in Israel reported to be using
derivatives and yet no firms were found to be using
derivatives in Jordan. Al-Momani and Gharaibeh
(2008) gathered information on the use of derivatives
via questionnaires to directors; and these were written
in Arabic. Bartram’s primary source of information
was obtained by matching firms on the Thomson
Analytics database with firms that have annual reports
in English.
The percentage of companies reporting the use
of derivatives in South Africa remained consistent
over the period 2006 to 2010 (Correia, Holman &
Jahreskog 2012; Modack, Holman & Correia 2012).
The study by Correia et al. (2012) was carried out by
mailing questionnaires to 98 of the largest listed non-
financial companies in South Africa in 2006, whilst
the study by Madock et al. (2012) was carried out by
reviewing the annual financial reports in 2009 and
2008 of the largest 100 listed companies in South
Africa. This partially explains the high percentage of
reported derivative use by companies in these studies.
The results are set out in Table 5.
Table 5. Percentage of companies reporting the use of derivatives (South Africa)
Country Covered
% Companies
using
Derivatives
Correia, Holman & Jahreskog (2012) South Africa 90.0%
Modack, Holman & Correia (2012) South Africa 93.0%
2.3 The relationship between the use of derivatives and the size of the firm Company size has been identified as a significant
determinant of derivative use and may be linked to the
existence of economies of scale as well as to the
greater range of risk exposures that larger companies
are expected to experience (Bodnar et al. 1999;
Bodnar et al. 2003). For Canada, Jalilvand (1999)
reported that the companies using derivatives are
significantly larger than non-users. Table 6
summarises differences in derivative use amongst
large (>$250m), medium ($50m-$250m) and small
(<$50m) companies in the USA. Company size is
based on market capitalisation.
Table 6: Percentage of companies using Derivatives (by company size) (USA)
Large Medium Small
Bodnar et al. (1998) 83% 45% 12%
Bodnar et al. (1996) 59% 48% 13%
Bodnar et al. (1995) 65% 30% 12%
In studies carried out in the UK and Europe
region, the percentage of large companies reporting
the use of derivative exceeded 75%; the only
exception being Belgium. Only 40% of large
companies in Belgium reported the use of derivatives
(De Ceuster et al. 2000). One of the reasons cited for
the low level of derivative use by large companies in
Belgium is related to policy restrictions imposed on
the treasury department by the board of directors;
90% of non-users cite this as an important
consideration in their decision concerning the use of
derivatives. As with all other studies, a decrease in the
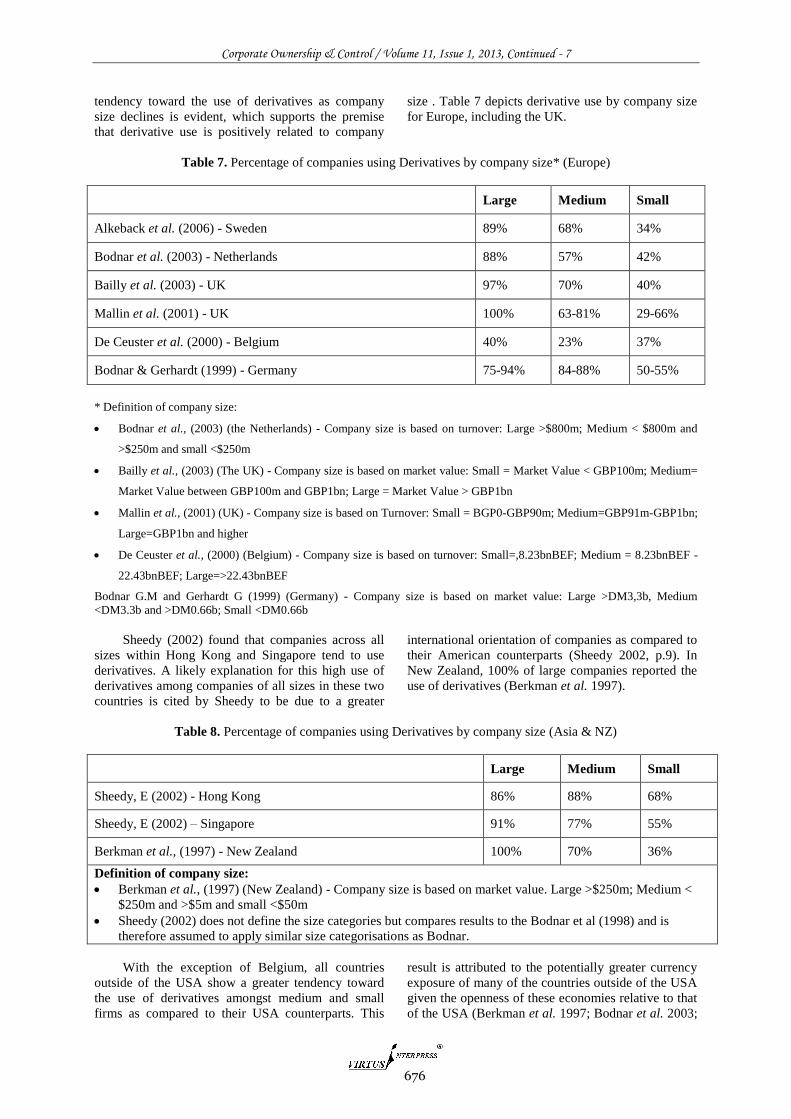
Corporate Ownership & Control / Volume 11, Issue 1, 2013, Continued - 7
676
tendency toward the use of derivatives as company
size declines is evident, which supports the premise
that derivative use is positively related to company
size . Table 7 depicts derivative use by company size
for Europe, including the UK.
Table 7. Percentage of companies using Derivatives by company size* (Europe)
Large Medium Small
Alkeback et al. (2006) - Sweden 89% 68% 34%
Bodnar et al. (2003) - Netherlands 88% 57% 42%
Bailly et al. (2003) - UK 97% 70% 40%
Mallin et al. (2001) - UK 100% 63-81% 29-66%
De Ceuster et al. (2000) - Belgium 40% 23% 37%
Bodnar & Gerhardt (1999) - Germany 75-94% 84-88% 50-55%
* Definition of company size:
Bodnar et al., (2003) (the Netherlands) - Company size is based on turnover: Large >$800m; Medium < $800m and
>$250m and small <$250m
Bailly et al., (2003) (The UK) - Company size is based on market value: Small = Market Value < GBP100m; Medium=
Market Value between GBP100m and GBP1bn; Large = Market Value > GBP1bn
Mallin et al., (2001) (UK) - Company size is based on Turnover: Small = BGP0-GBP90m; Medium=GBP91m-GBP1bn;
Large=GBP1bn and higher
De Ceuster et al., (2000) (Belgium) - Company size is based on turnover: Small=,8.23bnBEF; Medium = 8.23bnBEF -
22.43bnBEF; Large=>22.43bnBEF
Bodnar G.M and Gerhardt G (1999) (Germany) - Company size is based on market value: Large >DM3,3b, Medium
<DM3.3b and >DM0.66b; Small <DM0.66b
Sheedy (2002) found that companies across all
sizes within Hong Kong and Singapore tend to use
derivatives. A likely explanation for this high use of
derivatives among companies of all sizes in these two
countries is cited by Sheedy to be due to a greater
international orientation of companies as compared to
their American counterparts (Sheedy 2002, p.9). In
New Zealand, 100% of large companies reported the
use of derivatives (Berkman et al. 1997).
Table 8. Percentage of companies using Derivatives by company size (Asia & NZ)
Large Medium Small
Sheedy, E (2002) - Hong Kong 86% 88% 68%
Sheedy, E (2002) – Singapore 91% 77% 55%
Berkman et al., (1997) - New Zealand 100% 70% 36%
Definition of company size:
Berkman et al., (1997) (New Zealand) - Company size is based on market value. Large >$250m; Medium <
$250m and >$5m and small <$50m
Sheedy (2002) does not define the size categories but compares results to the Bodnar et al (1998) and is
therefore assumed to apply similar size categorisations as Bodnar.
With the exception of Belgium, all countries
outside of the USA show a greater tendency toward
the use of derivatives amongst medium and small
firms as compared to their USA counterparts. This
result is attributed to the potentially greater currency
exposure of many of the countries outside of the USA
given the openness of these economies relative to that
of the USA (Berkman et al. 1997; Bodnar et al. 2003;

Corporate Ownership & Control / Volume 11, Issue 1, 2013, Continued - 7
677
Sheedy 2002) as well as the international pricing of
products in US Dollars. It is also evident that there
has been a growth in the use of derivatives by
companies of all sizes over time. Alkeback et al.
(2006), reported that the use of derivatives amongst
the medium and smaller companies in Sweden
increased significantly from 1996 to 2003. Medium
companies who reported the use of derivatives
increased from 43% to 68% and smaller companies
using derivatives increased from 18% to 34%. This
trend is also evident in the studies by Bodnar et al.
(1994) and Bodnar et al. (1998). Junior (2007) in a
study of the use of currency derivatives by Brazilian
companies reported that larger firms were more likely
to use currency derivatives. Shiozer and Saito (2009)
reported a greater intensity of derivative use by large
firms in Latin America (Argentina, Brazil, Chile and
Mexico) and indicated that this may be due to the fact
that large firms in Latin America have often had debt
stated in foreign currency.
2.4 The relationship between the use of derivatives and industry sector
As with the analysis of the use of derivatives by size
of the firm, a number of studies (see Jalilvand 1999;
Sprcic 2007;, Alkeback et al., 2006; Bodnar &
Gerhardt 1999; Junior 2007 and Schiozer & Saito
2009) did not analyse the use of derivatives use by
industry sector. Bodnar et al., (1995, 1996, and 1998)
for the USA found the use of derivatives to be most
common amongst companies in commodity-based
(primary sector) industry sectors and manufacturing
industries. Bodnar et al. (1998) reported that 68% of
commodity based companies used derivatives, 48% of
manufacturing companies used derivatives and 42%
of transportation, retail / wholesale and services
companies used derivatives. The higher percentage of
companies using derivatives in the commodity-based
industries in the USA is linked to the availability of
suitable derivative products and relative maturity of
commodities derivatives exchanges in the USA
(Bodnar et al., 1995). These percentages had
increased since Bodnar et al. (1995) but were
consistent across industry classification.
All studies of derivative use in the UK and
Europe show consistently that the use of derivatives
by firms across all sectors is higher than that of their
North American counterparts. Manufacturing firms in
the UK and Europe show on average a greater
tendency toward the use of derivatives than firms in
the primary sector.
Table 9. Percentage of companies using Derivatives by Industry Classification (Europe)
Primary Manufacturing Service
Bodnar et al. (2003) - Netherlands not given 66% 48%
Bailly et al. (2003) - UK 77% 75% not given
Mallin et al., (2001) - UK 57% 63% 57%
Alkebach and Hagelin (1999) - Sweden 63% 79% 39%
Alkeback et al., (1999) attributes the trend in the
UK and Europe to that fact that economies such as
that of Sweden and the Netherlands are characterised
as small open economies; as such manufacturing
companies in these countries who engage in high
levels of international trade are exposed to a high
level of foreign exchange risk. Companies in the UK
show a higher level of derivative use in the
manufacturing sector as compared to their US
counterparts (Mallin et al. 2001; Bailly et al. 2003).
There is a greater tendency toward derivative use by
firms in the manufacturing sector in countries such as
New Zealand, Taiwan and Hong Kong relative to
their counterparts in the USA [Berkman et al. 1997;
Shu & Chen 2003; Sheedy 2002). However, this may
also be related these economies being small open
economies.
Table 10. Percentage of companies using Derivatives by Industry Classification (Asia & NZ)
Primary Manufacturing Service
Shu & Chen (2003) - Taiwan 54% 47% 0%
Sheedy (2002) - Hong Kong 93% 81% 58%
Sheedy (2002) - Singapore 100% 85% 63%
Berkman et al. (1997) - New Zealand 29% 82-86% 32-86%
Ameer et al. (2011) - Malaysia 38% 20% 27%
For the New Zealand study by Berkman et al.
(1997), derivative use for the service category
includes services (32%), retail and wholesale (86%)
and transport & utility (73%) whilst manufacturing is
divided between non-durables (82%) and durables
(86%). One of the characteristics of firms in Hong
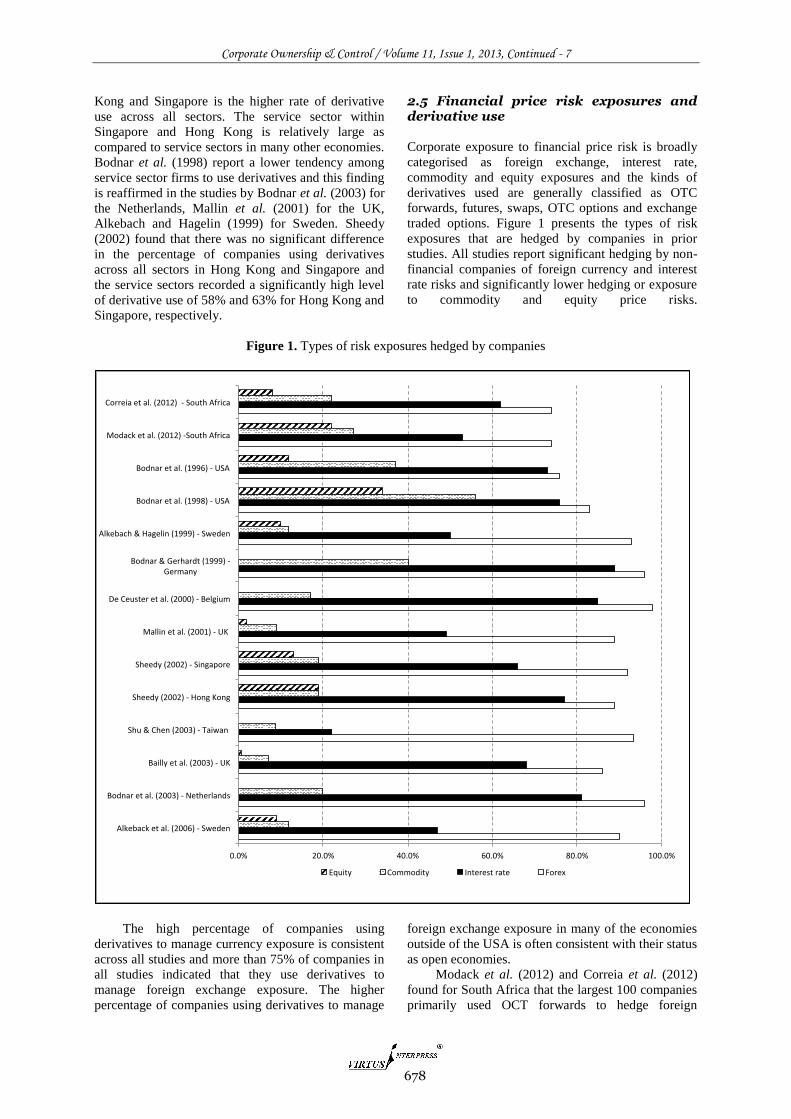
Corporate Ownership & Control / Volume 11, Issue 1, 2013, Continued - 7
678
Kong and Singapore is the higher rate of derivative
use across all sectors. The service sector within
Singapore and Hong Kong is relatively large as
compared to service sectors in many other economies.
Bodnar et al. (1998) report a lower tendency among
service sector firms to use derivatives and this finding
is reaffirmed in the studies by Bodnar et al. (2003) for
the Netherlands, Mallin et al. (2001) for the UK,
Alkebach and Hagelin (1999) for Sweden. Sheedy
(2002) found that there was no significant difference
in the percentage of companies using derivatives
across all sectors in Hong Kong and Singapore and
the service sectors recorded a significantly high level
of derivative use of 58% and 63% for Hong Kong and
Singapore, respectively.
2.5 Financial price risk exposures and derivative use
Corporate exposure to financial price risk is broadly
categorised as foreign exchange, interest rate,
commodity and equity exposures and the kinds of
derivatives used are generally classified as OTC
forwards, futures, swaps, OTC options and exchange
traded options. Figure 1 presents the types of risk
exposures that are hedged by companies in prior
studies. All studies report significant hedging by non-
financial companies of foreign currency and interest
rate risks and significantly lower hedging or exposure
to commodity and equity price risks.
Figure 1. Types of risk exposures hedged by companies
The high percentage of companies using
derivatives to manage currency exposure is consistent
across all studies and more than 75% of companies in
all studies indicated that they use derivatives to
manage foreign exchange exposure. The higher
percentage of companies using derivatives to manage
foreign exchange exposure in many of the economies
outside of the USA is often consistent with their status
as open economies.
Modack et al. (2012) and Correia et al. (2012)
found for South Africa that the largest 100 companies
primarily used OCT forwards to hedge foreign
0.0% 20.0% 40.0% 60.0% 80.0% 100.0%
Alkebacketal.(2006)-Sweden
Bodnaretal.(2003)-Netherlands
Baillyetal.(2003)-UK
Shu&Chen(2003)-Taiwan
Sheedy(2002)-HongKong
Sheedy(2002)-Singapore
Mallinetal.(2001)-UK
DeCeusteretal.(2000)-Belgium
Bodnar&Gerhardt(1999)-Germany
Alkebach&Hagelin(1999)-Sweden
Bodnaretal.(1998)-USA
Bodnaretal.(1996)-USA
Modacketal.(2012)-SouthAfrica
Correiaetal.(2012)-SouthAfrica
Equity Commodity Interestrate Forex

Corporate Ownership & Control / Volume 11, Issue 1, 2013, Continued - 7
679
exchange exposure and interest rate swaps to hedge
interest rate risk. OTC options were also used but
little use was made of exchange traded options or
futures. Modack et al. (2012) reported that 65% of
swaps were entered into to hedge interest rate risk;
83% of forward contracts were undertaken in order to
hedge foreign currency risk and 47% of all option
contracts were entered into to hedge equity price risk.
The study found that all futures contracts were
undertaken to hedge commodity price risk.
Whilst Sprcic (2007), De Ceuster et al. (2000),
Berkman et al. (1997), Bailly et al. (2003), Bodnar et
al. (1996, 1999 and 2003) and Correia et al. (2012)
found OTC Forwards to be the most preferred
instrument for the management of foreign exchange
exposure, Alkeback and Hagelin (1999) found that
firms in Sweden use a wider range of instruments to
manage currency exposure and companies use OTC
Forwards, Exchange-traded Forwards, Swaps and
Futures. The most preferred instruments to manage
currency risks in Malaysia is cited as OTC Forwards
(Ameer et al. 2011) and this is due to the greater
flexibility of Forward foreign-exchange contracts
(which are available from licensed local banks) over
other standardized foreign-exchange Options and
Futures contracts. In New Zealand, OTC Forwards is
cited as the derivative instrument of choice to manage
currency risk (Berkman et al. 1997). Interestingly,
Junior (2007) reported a preference by Brazilian firms
to use swaps to hedge currency exposure. However,
this may be due to the longer term nature of currency
exposures of Brazilian firms to foreign currency debt
financing.
Interest rate risk exposure is the second most
commonly managed exposure cited in all studies.
Studies indicate that firms mostly use interest rate
swaps to hedge interest rate risk and the growth in the
use of swaps to hedge interest rate risk has been
impressive. More than 60% of firms in all studies
indicated the use of derivatives to manage interest rate
exposure; the only exceptions being the UK (Mallin et
al. 2001), Sweden (Alkebach & Hagelin 1999 and
Alkeback et al. 2006), South Africa (Modack, et al.
2012 and Correia et al. 2012) and Taiwan (Shu &
Chen, 2003). Alkeback et al. (2006) found that the
reason behind the lower use derivatives to manage
interest rate exposure in Sweden to be size related;
they found that only 5% of small companies managed
interest rate exposure and that interest rate exposure
tended to be managed to a larger extent by larger
companies than medium-sized companies. In South
Africa, more than 50% of companies used interest rate
swaps to hedge interest rate risk (Modack, et al. 2012
and Correia et al. 2012) but both these studies refer to
the use of swaps by large companies. Across all
studies the most favoured derivative instrument for
the management of interest rate exposure tended to be
Swaps. Studies reported a significant growth in the
use of swaps to manage interest rate risk exposure
(see Bartram et al. 2004; Correia et al. 2012).
A pattern of significantly lower use of
derivatives to manage commodity price risk and
equity risk, is consistent across all studies and all
countries. The use of derivatives to manage
commodity price risk is highest in the USA which is
consistent with a larger primary sector and a more
developed market for these types of derivatives.
2.6 The most important objective in the hedging decision of firms
The studies of De Ceuster et al (2000), Bodnar and
Gerhardt (1999), Mallin et al. (2003), Bailly et al.
(2003) and Alkeback et al. (2006) conclude that a
major objective of European companies in hedging
with derivatives is to minimise fluctuations in
accounting earnings. An exception relates to the
Netherlands (Bodnar et al. 2003) where 60% of firms
cite the minimisation of fluctuation in cash flow as a
major objective. It is believed that the role of
accounting and taxation rules has a material influence
on the motives for hedging activity in Europe (De
Ceuster et al. 2000, p. 311).
The initial studies by Bodnar et al. (1995 &
1996) indicate a greater concern for the minimisation
of cash flow volatility in determining the hedging
decision in the USA. The management of cash flow
volatility is also cited as a major objective in the
hedging decision amongst Korean companies
(Pramborg 2003). According to Schiozer and Saito
(2009), the important objectives behind the hedging
decision by Latin American firms relates to the
reduction of financial distress costs and in order to
guarantee adequate funding for investment
opportunities.
The hedging of the balance sheet involves using
derivatives to protect the balance sheet values and
balance sheet ratios and will therefore reduce the
volatility of asset and liability values (Correia et al.
2009, p.22). Yet few companies cited the protection
of balance sheet values as a major objective for using
derivatives. Alkeback et al. (2006) quotes the highest
percentage of companies citing the protection of the
balance sheet as a major objective (30%); in every
other study, fewer than 14% of companies cited
protection of balance sheet values as a major objective
in the hedging decision.
2.7 Reasons for not using Derivatives
Some of the reasons cited for not using derivatives
include the lack of exposure to financial risk (Mallin
et al. 2001; El-Masry 2006) and the high cost relative
to the perceived benefit due to onerous reporting
requirements (El-Masry 2006; Sprčić et al. 2008).
Other reasons for not using derivatives include policy
restrictions within the firm, lack of knowledge and
concerns about disclosure (De Ceuster et al. 2000);
Al-Momani & Gharaibeh 2008; Alkebäck & Hagelin
1999). Correia et al. (2012) found that companies in

Corporate Ownership & Control / Volume 11, Issue 1, 2013, Continued - 7
680
South Africa refrained from using derivatives due to a
lack of exposure to movements in interest rates,
exchange rates and commodity and equity price risks.
In addition, concerns about the accounting treatment
thereof and the cost of establishing and maintaining a
derivatives program as well as transaction costs were
cited as concerns or reasons for not using derivatives.
2.7 Other findings
Jalilvand (1999) found that large multi-national
companies are more likely to use derivatives and that
derivative users have higher leverage ratios and lower
credit ratings than non-users. It is thought that
hedging reduce(s) the adverse wealth effects of
keeping longer term debt by lowering the firm’s
default risk (Jalilvand 1999, p.220) Consistent with
the conclusions by Jalilvand (1999) for Canada,
Sprčić et al. (2008), for Croatia and Slovenia, found a
positive relationship between derivative usage and
foreign ownership and/or the company’s status as a
multi-national company.
Derivative use by non-financial firms is more
likely to be driven by economic factors rather than
cultural influences (Alkebäck & Hagelin 1999;
Spyridon 2008). This finding was consistent with the
findings by Bodnar and Gebhardt (1999) for North
America . Bodnar et al. (2001) concluded that the
higher propensity of Dutch firms to use derivatives, as
compared to USA firms, can be explained by the
greater openness of the Dutch economy and broader
economic factors but not by institutional differences.
Schiozer and Saito (2009) concluded that firms
operating in economies with sophisticated financial
markets, volatile currencies and high level of foreign
corporate ownership such as in Brazil and Chile are
more likely to use derivatives. Schiozer and Saito
(2009) reported that 84.6% and 91.6% of firms were
found to be using derivatives in Brazil and Chile
respectively. These high rates of derivative use may
be driven by the make-up of the sample of companies
on which the study was carried out which consisted of
companies in Brazil and Chile that were part of the
Bank of New York Latin American ADR (American
Depositary Receipts) index as at year end 2004.
Junior (2007) concluded that larger companies with a
higher ratio of foreign sales to total sales and those
with higher ratio of foreign debt to total debt were
more likely to use derivatives to reduce the
probability of financial distress and that firm leverage
was positively correlated with derivative usage.
Athough there is little research on derivative use
in Africa, the African Fixed Income and Derivatives
Guidebook by the African Development Bank Group
(2010) sets out country guides on financial markets in
Africa. Whilst this guide indicates that there are active
if illiquid fixed income markets, and foreign currency
markets (many subject to restrictions), there are few
active derivative markets in Africa. Adelegan (2009)
in an IMF study, reported that the derivatives market
had grown significantly in South Africa and that this
provided lessons for the rest of Africa which should
focus on regional co-operation in the listing and
trading of derivative instruments.
3. Data and methodology
3.1 Data collection
The sample of firms include all listed non-financial
firms in Africa. This required an extensive search for
published annual reports of all listed firms across
Africa. Disclosure of derivative use and qualitative
and quantitative information should be disclosed in
the financial statements and notes to the financial
statements. Annual reports are mainly prepared in
accordance with International Financial Reporting
Standards (IFRS) or in line with local Generally
Accepted Accounting Practice (GAAP). In terms of
IFRS, annual reports were analysed and reviewed on
the basis of the information required to be disclosed in
terms of IFRS 7 (Financial Instruments: Disclosures)
and IAS 39 (Financial Instruments: Recognition and
Measurement). For African companies with annual
reports prepared in accordance with local GAAP , a
manual search was performed searching for key
words such as “derivatives”, “forwards”, “swaps”,
“futures”, “options”, and “hedging”.
Several financial resources were employed in
order to procure the required annual reports;
The Bloomberg financial database was used
as the initial source of information. However, the
searches returned company details that did not include
the notes to the financial statements and in some cases
financials were not listed at all.
The BFA McGregor financial database was
then used as a secondary source of information. There
were approximately thirty financial statements
available from this source.
As a third option, the website African
Financials (www.africanfinancials.com) was used as
a source of information. This website contains a
database of annual financial reports of companies
trading in Africa. The database has in excess of 4000
current and historical financial reports and proved to
be a useful source of financial information.
As a fourth option the financial-database of
the Thompsons Reuters Corporation was used to
source information, which was missing from the first
three sources.
Finally, for those firms which were still not
available on these data sources, an online search was
done for the company’s official website from which
the relevant financial statements were accessed, if
available.
The study was able to access the annual reports
of 692 listed non-financial firms trading in Africa
although there was an uneven distribution number of
companies per country. The study covers the period
2008 and 2009. The list of companies included in the

Corporate Ownership & Control / Volume 11, Issue 1, 2013, Continued - 7
681
study was obtained from a Bloomberg database on the
3rd
of May 2010; this list formed the basis for the
selection of companies included in the study.
3.2 Sample of countries
This study is a comprehensive review of derivative
usage by listed companies in Africa. Information on
the use of derivatives, the reasons behind the use of
derivatives and the instruments used was obtained
from annual financial statements of 692 firms within
the African continent. Unlike the questionnaire-based
survey approach where the data is reliant on the
responses of companies, the financial statement
review approach adopted in this study allows for a
much broader coverage and eliminates to an extent the
problems of low response rates and non-response bias
associated with the questionnaire-based approach.
The objective of the study was to analyse the use
of derivatives in every country on the African
continent. However, this was not possible due to lack
of information for many countries. The starting point
of the study is therefore with countries in which an
active stock exchange was available at that point in
time. On this basis of this criterion, the initial sample
consisted of 28 countries with securities exchanges.
Cameroon, Libya, Algeria, Cape Verde, Rwanda and
Sudan were excluded due to limited accounting
disclosure despite the presence of an active securities
exchange.
Mozambique had only 3 listed companies of
which only 1 had financial statements but which
lacked sufficient information to be considered in the
final sample of countries chosen. The final list of
countries is recorded in Table 11.
Table 11. Countries included in this study
Benin Senegal Kenya South Africa
Ivory Coast Tunisia Uganda Namibia
Burkina Faso Egypt Zambia Botswana
Togo Morocco Malawi Zimbabwe
Ghana Nigeria Tanzania Mauritius
The countries Benin, Ivory Coast, Burkino Faso,
Togo, Senegal and Ghana fall within the West African
Economic Monetary Union (WAEMU) and will be
grouped and referred to as WAEMU in this study.
3.3 Sample of companies
The initial number of listed companies consisted of
1,383 companies. However, 387 of these are financial
services companies and were therefore excluded in
line with the objective of the study to analyse
derivative use by non-financial firms in Africa. This
resulted in a potential population of 996 non-financial
listed companies. Despite an intensive search for all
annual reports, it was not possible to obtain the annual
financial statements of 304 companies and these
companies were excluded from the study leaving 692
companies (70%) in the final sample.
Of the countries under review, seven countries
had less than ten companies in their final sample, six
countries had between twenty and fifty companies in
their final sample and two countries (Egypt and South
Africa) had more than 50 companies in the final
sample. The companies in Egypt and South Africa
therefore make up 61% of the total sample of
companies in Africa. It would be expected that any
regional view taken in the analysis would be
dominated by activity within these two countries.
Table 12. Companies making up the final sample
Country Listed
companies
Non- financial
companies
Companies in the
final sample
Effective sample
rate
Morocco 76 54 40 74%
Egypt 212 155 118 76%
Tunisia 54 33 25 76%
Nigeria 222 155 49 32%
Uganda 14 6 6 100%
Kenya 58 40 25 63%
Zambia 26 25 16 64%
Namibia 8 1 1 100%
Tanzania 16 10 9 90%

Corporate Ownership & Control / Volume 11, Issue 1, 2013, Continued - 7
682
Botswana 21 11 6 55%
WAEMU 69 39 24 62%
Malawi 15 6 3 50%
Mauritius 84 56 22 39%
South Africa 424 328 307 94%
Zimbabwe 84 77 41 53%
Totals 1383 996 692 69%
South Africa 424 328 307 94%
Africa(excl. SA) 959 668 385 58%
A limitation of this type of study relates to the
possibility that natural hedges are being used to hedge
effectively any longer term risk exposure. For
example, exporters of commodities may borrow in the
same currency. Further, investors may view forward
sales as a negative indicator as has occurred in the
gold mining sector as it may be easier for investors to
diversify their risks directly. In other words, investors
would prefer firms to be exposed to commodity price
changes. The other natural hedge may consist of
taking advantage of any negative correlation between
commodity price movements and changes in the value
of the domestic currency. However, in any natural
hedging programme, there should be some residual
risk exposure and the study refers generally to the use
of derivatives.
4. Results of Analysis 4.1 Derivative usage
Across the sample of 692 non-financial companies in
Africa, the study found that 201 companies use
derivatives and this translates to 29% of the sample
population. This is presented per country in Table 13.
None of the companies in Zambia, Zimbabwe and
Botswana use derivatives whilst countries in which a
high rate of derivative usage is recorded generally
have very few companies in the sample set. This
includes countries such as Namibia, Malawi and
Uganda although companies in these countries are
generally export orientated. The percentage of use is
significantly affected by the number of companies in
the final sample but the final results reflect the very
low use of derivatives across Africa although there are
significant differences on a regional basis.
Table 13. The number of companies using derivatives
Country Number of companies in
the final sample
Number of companies
using derivatives
Percentage companies
using derivatives
Morocco 40 7 17.5%
Egypt 118 2 1.7%
Tunisia 25 1 4.0%
Nigeria 49 2 4.1%
Uganda 6 2 33.3%
Kenya 25 5 20.0%
Zambia 16 0 0.0%
Namibia 1 1 100.0%
Tanzania 9 3 33.3%
Botswana 6 0 0.0%
WAEMU 24 4 16.7%
Malawi 3 2 66.7%
Mauritius 22 6 27.3%
South Africa 307 166 54.1%
Zimbabwe 41 0 0.0%
Totals 692 201 29.0%
At 166, the number of companies in South
Africa using derivatives makes up 82.6% of the total
companies using derivatives in Africa. This study
found that the percentage of companies using
derivatives in South Africa is 54.1%, which is
significantly higher than the percentage of companies
using derivatives in the Rest of Africa (5.1%). This
difference in derivative use is placed in stark contrast
in Figure 2. This study found further that the
percentage of companies using derivatives for South
Africa is significantly lower than that recorded by
Correia et al. (2012) and Modack, et al. (2012) which
reported derivative use at a rate of 90% and 93%
respectively. This difference in derivative use is
mostly explained by the fact that the sample of
companies used in the Correia et al. (2012) and

Corporate Ownership & Control / Volume 11, Issue 1, 2013, Continued - 7
683
Modack, et al. (2012) surveys were made up of the
100 largest JSE listed companies, whereas this study
analysed derivative use by all listed companies in
South Africa and therefore includes many smaller
companies. This further indicates that there is a
positive relationship between firm size and derivative
use in South Africa.
Figure 2. The percentage of companies using derivatives in South Africa & Rest of Africa
Given that the number of companies in Egypt
and South Africa make up 61% of the total sample of
companies in Africa, one would expect that any
regional view taken in the analysis would be
dominated by activity within these two countries. As
is evident from table 6 and figure 3, this view is true
for South Africa, but a surprisingly low number of
companies in Egypt use derivatives and only 2 out of
188 companies (1.7%) use derivatives. In all Islamic
countries the use of derivatives and trading in
derivatives is controlled and Ameer, et al. (2011)
reports that interest rate, foreign currency, and stock
index futures do not meet the conditions set out in
Islamic law. Yankson (2011) notes that although the
Quran prohibits excessive risk in financial
transactions, which on the face of it would render
derivatives a prohibitive class of investments, if
certain pre-conditions are met even trades in
seemingly high risk assets such as interest rates swaps
could be permitted. However the challenge of meeting
these preconditions restricts the development of the
market for derivatives in countries subject to Islamic
law.
This study found that only 30.4% of companies
that indicated the use of derivatives hedge more than
one risk and only 1 company in Africa hedges all four
risks. The study found that 16 companies (8.0 % of
the companies using derivatives) hedge 3 types of risk
exposures whilst 44 companies (21.9%) hedge 2 types
of risk and 140 companies (69.7%) hedge 1 type of
risk. This is presented in Table 14.
0,00%
10,00%
20,00%
30,00%
40,00%
50,00%
60,00%
South Africa Rest of Africa
54,10%
5,10%

Corporate Ownership & Control / Volume 11, Issue 1, 2013, Continued - 7
684
Table 14. Concentration of derivative use in Africa
Number of Risks hedged by companies
Four Three Two One
Africa 1 16 44 140
Percentage 0.5% 8.0% 21.9% 69.6%
South Africa 1 14 36 115
Percentage 0.6% 8.4% 21.7% 69.3%
Africa (excl. South Africa) 0 2 8 19
Percentage 0.0% 11.4% 22.9% 65.7%
With the exception of South Africa, this study
indicates that the overall percentage of companies
using derivatives is extremely low across Africa and
these findings are inconsistent with the results of
studies of derivative use in developed economies.
This may be attributed to the limited availability of
active derivative markets in countries in Africa. This
view is supported by Martin et al. (2009) who stated
that the absence of clear regulations and adequate
market infrastructures are perceived as major
obstacles to the development of derivative markets in
a country and the lack of expertise was also suggested
to be a significant constraint to derivative usage (De
Ceuster et al. 2000). The lack of derivative markets
beyond South Africa and the possible advantages
arising from the establishment of such markets is
explained by Adelegan (2009) in an IMF study of
derivatives in Africa.
In order to obtain possible reasons for the low
level of derivative use in Africa, interviews were
conducted with the senior partners responsible for
Africa of three of the largest public accounting firms,
being PWC, EY and KPMG. In response to a short
questionnaire on their views for the reasons for the
low level of derivative use in Africa, these three
public audit and accounting firms engaged in business
in Africa support the views of Martin et al. (2009) and
Adelegan (2009) but also state that an added reason
for the low level of derivative use for countries on the
continent outside of South Africa is the tendency for
groups to centralise risk management activities at
head office level, and many of these head offices are
not within the country in which business is conducted.
This raises questions as to shareholder bases and risk
management in that the shareholders of subsidiaries
are not effectively obtaining the risk management
benefits of derivative use in relation to the
shareholders at the holding company level.
Surprisingly, the restriction on derivative use due to
capital controls is not cited as a major factor
determining the intensity of derivative use in
countries in Africa. However, the lack of depth in the
money and capital markets in Africa is viewed as a
further restriction on the intensity of derivative use.
This is because duration in the money market is
generally less than one year and although the capital
market may have bonds issued for periods that may
extend to 5 years, trading in the secondary market is
characteristically very thin. As a result, pricing off the
yield curve is difficult and as such derivatives are
difficult to price and if priced tend to be expensive.
4.2 Types of Risk hedged
Figure 3 illustrates that derivatives are mainly used to
manage currency risks. The analysis indicates that
57.8% of the use of derivatives by companies is
devoted to the management of currency risks, whilst
19.6% of the use of derivatives is devoted to the
management of commodity price risk and 18.6% and
4.0% of the use of derivatives is devoted to the
management of interest rate risk and equity price risk,
respectively. The dominance of the use of derivatives
to manage currency risks relative to other forms of
risk management is consistent with findings of earlier
studies in more developed economies such as the
USA, UK and Europe.
The use of derivatives to manage commodity
price risk ranks second behind that of currency risk,
and this trend contradicts the trends found in earlier
studies in other regions where the use of derivatives to
manage interest rate risk ranks higher than that of
commodity price risk. This is mainly true for Africa
(excluding South Africa) whilst for South Africa there
is a slightly greater focus on hedging interest rate risk
(20%) as compared to commodity price risk (19%).
The studies by Correia et al. (2012) and Modack et al.
(2012) indicated that a significantly greater number of
South African companies were involved in the
hedging of interest rate risk as compared to
commodity price risk. However, their results apply to
the largest 100 companies whilst this study includes
all listed JSE companies and therefore includes a
greater proportion of smaller listed companies.
The small number of companies per country in
Africa that use derivatives, if we exclude South
Africa, makes individual country analysis of little
value although the major conclusion that derivative
use is so low per country is an important finding.
Figure 3 therefore analyses derivative use in South

Corporate Ownership & Control / Volume 11, Issue 1, 2013, Continued - 7
685
Africa and Africa (excluding South Africa) as separate regions.
Figure 3. Types of risks hedged by firms in Africa
4.3 Derivative Instruments of Choice
Table 15 indicates that companies have an
overwhelming preference for OTC Forwards as the
main derivative instrument used to hedge risk
exposure. The analysis shows that 55.2 % of
derivatives used by companies in Africa are OTC
Forwards and this is followed by Swaps at 25.6%,
OTC Options at 14.3% and Futures at 4.9%.
This trend is consistent with the findings of
studies in other regions. The low usage of futures is
significant given that many African economies are
driven by commodities and Ghana’s use of futures
was nil despite it being actively involved in the trade
of cocoa, a commodity that is actively traded on the
global futures market. However, this may reflect the
absence of domestic derivative markets.
Table 15. Derivative instruments of choice
Table 15 confirms again the lack of derivative
use beyond South Africa and in Figure 4 presents the
proportion of the various derivatives employed within
South Africa and Africa (excluding South Africa) as
well as the number of companies employing such
instruments in South Africa and Africa (excluding
South Africa).
0% 10% 20% 30% 40% 50% 60% 70% 80% 90% 100%
South Africa
Africa (excl. South Africa)
Currency Risk Commodity Price Risk Interest Rate Risk Equity Price Risk
Swaps OTC Forwards OTC Options Futures
Morocco 0 5 0 0
Egypt 2 2 0 0
Nigeria 0 0 2 0
Uganda 2 1 1 0
Kenya 2 5 1 0
Namibia 1 1 0 0
Tanzania 0 1 1 1
WAEMU 0 5 0 0
Malawi 1 2 0 0
Mauritius 2 7 1 0
South Africa 74 152 41 15
Total 84 181 47 16

Corporate Ownership & Control / Volume 11, Issue 1, 2013, Continued - 7
686
Figure 4. Derivative instruments used by companies in Africa
A further question refers to the derivative
instruments used in relation the type of risk
exposures. This is set out in Figure 5 which illustrates
the derivative instruments employed for the
management of each type of risk. For the management
of currency risk, OTC Forwards is the instrument of
choice as 82.1% of companies that hedge currency
risk employ OTC Forwards.
For the management of interest rate risk, Swaps
are the preferred derivative employed and the study
found that 92.3% of companies that hedge interest
rate risk use Swaps. For the management of
commodity price risk, companies tend to use a wider
array or derivative instruments. It was found that
35.9% of companies that hedge commodity price risk
use OTC Forwards but this is closely followed by the
use of OTC Options with 32.8% of companies
reporting the use of OTC options to hedge commodity
price risk. Finally, although very few companies
hedge equity price risk, 90.9% of companies that
hedge equity price risk use OTC Options.
Figure 5. The use of derivatives per type of risk exposure
In order to place this in context in relation to the
extent of derivative use per type of risk, Figure 6 sets
out the number of companies that hedge each type of
risk and the type of derivative employed. This more
0% 20% 40% 60% 80% 100%
South Africa
Africa (excl.South Africa)
74
10
152
29
41
6
15
1
Swaps OTC Forwards OTC Options Futures
82,1%
3,3%
35,9%
10,5%
95,0%
10,9%
6,8%
1,7%
32,8%
92,3%
0,5%
20,3%
7,7%
0,0% 20,0% 40,0% 60,0% 80,0% 100,0%
FX Risk
Interest rate risk
Commodity Price Risk
Equity Price Risk
OTC Forwards Swaps Options Futures

Corporate Ownership & Control / Volume 11, Issue 1, 2013, Continued - 7
687
clearly indicates the focus on the use of OTC
forwards to hedge currency risk and the use of Swaps
to hedge interest rate risk.
Figure 6. Derivative instruments employed per type of risk
These findings are consistent with earlier studies
in other regions which find that OTC Forwards and
Swaps are predominantly used for the management of
currency risk and interest rate risk respectively.
Earlier studies show a trend toward a use of Forwards
and Futures for the management of Commodity Price
Risk in the USA, UK Europe and East Asia and New
Zealand. The African preference for OTC Options
ahead of Futures is therefore inconsistent with
practices elsewhere. The results for South Africa are
consistent with the findings of Correia et al., (2012).
4.4 Derivative use by Sector
Of the companies that use derivatives, 41% are
classified under the Manufacturing Sector, 34% under
the Services Sector and 25% under the Primary
Sector. This trend is consistent with that of the UK
and Europe where the tendency to use derivatuives is
greater in the manufacturing sector than in the
primary sector (see Mallin et al. 2001; Alkebach &
Hagelin 1999). The experience in the USA is
different, here the tendency to use derivatives is
greater in the primary sector than in the
manufacturing sector, albeit marginally so (Bodnar et
al. 1995, 1996 & 1998). This trend also differs from
that of the countries in East Asia where a high level of
derivative use is evident across all sectors. In New
Zealand the level of derivative use in the Services
sector is dominant (Berkman et al. 1997). The
dominance of basic materials and manufacturing
sectors is consistent with the results postulated by
Bodnar et al (1995, 1996 & 1998) and Phillips (1995)
who found a high level of derivative use by
commodity-based (agriculture, mining & refining)
and manufacturing industries. Bodnar et al. (1995)
concluded that the natural users of derivatives are
those firms with exposure to commodities. The
derivative use per sector and type of derivatives
employed in each sector is presented in Figure 7.
OTC Forwards
Swaps
OTC Options
Futures
0
50
100
150
CurrencyRisk
InterestRate Risk Commodity
Price Risk Equity PriceRisk
156
2 23
0
20
57
7
0
13
1 21
12
1 1 13
1
OTC Forwards Swaps OTC Options Futures

Corporate Ownership & Control / Volume 11, Issue 1, 2013, Continued - 7
688
Figure 7. Derivative instruments per sector
OTC Forwards makes up 79.6% of derivatives
used in the Primary Sector, 83.1% in the
Manufacturing sector and 87% in the Services sector.
Swaps makes up 26.5% of derivatives used in the
Primary sector, 34.9% in the Manufacturing sector
and 42% in the Service sector. OTC Options makes
up 30.6% of derivatives used in the Primary sector,
12% in the Manufacturing sector and 17.4% in the
Service sector. The use of futures across all sectors is
very low. The dominance of OTC Forwards and
Swaps as derivative instruments to hedge risk
exposures across sectors is consistent with findings in
earlier studies.
5. Conclusion
This study examined the use of derivatives by 692
non-financial firms listed in 20 countries in Africa. It
uses the disclosure required in terms of international
financial reporting standards to determine the extent
that companies use derivatives as hedging
instruments. The study aimed to understand the extent
to which non-financial companies in Africa make use
of derivatives, the types of derivatives most
commonly used, the types of risks being hedged and
the most commonly used derivatives employed for
each type of risk exposure. The results indicate that
only 201 (29%) companies in Africa engage in the use
of derivatives. However, 166 of the 201 (82%)
companies using derivatives in Africa are within
South Africa. If South Africa is excluded from the
analysis then the average number of companies in the
remainder of Africa that use derivatives is estimated
to be only 5%. This is well below the levels recorded
for other countries. This low rate of derivative use is
consistent with an under-developed market and
trading infrastructure. Consistent with findings in
similar studies for other countries, the highest
percentage of derivative use is directed at the
management of currency risk and for Africa this is
estimated at 57.8%. The use of derivatives to manage
commodity price exposure ranks second behind that
of currency exposure whilst in most other studies,
interest rate exposure ranked second to currency
exposure as the risk most commonly hedged with
derivatives. Companies were found to have an
overwhelming preference for OTC Forwards (55.2 %)
to hedge and this is followed by Swaps (25.6%), OTC
Options (14.3%) and Futures (4.9%). This trend is
consistent with the findings of studies for other
regions. The low usage of futures is significant given
that most African economies are dominated by
commodities.
The types of derivatives employed to manage the
categories of risk exposures is consistent with prior
studies for other regions which indicate that OTC
Forwards are predominantly used for the management
of currency risk and Swaps are predominantly used to
hedge interest rate risk. In contrast to other studies
which indicated a trend towards a use of Forwards
and Futures for the management of commodity price
risk in developed markets, this study found that
African firms have a preference for Options ahead of
Futures for the management of commodity price risk.
The Manufacturing Sector is identified as the largest
user of derivatives (41%) followed by the Services
Sector (34%) and the Primary Sector (25%). The use
of OTC Forwards is identified as the derivative
Primary Sector
Manufacturing…
Services sector
0
10
20
30
40
50
60
SwapsOTC
Forwards OTC OptionsFutures
Primary Sector Manufacturing sector Services sector

Corporate Ownership & Control / Volume 11, Issue 1, 2013, Continued - 7
689
instrument of choice across all sectors and this is
determined by the extent of hedging activity that is
concentrated in the hedging of currency risk. The
wide use of derivatives to hedge risk exposures is not
available to firms in Africa outside South Africa. As
derivative use as been found to add value, the lack of
derivative use in Africa (outside South Africa) is not
aligned to maximising the value of companies in
Africa. An important conclusion from this study is the
confirmation that companies in less developed
countries with less liquid derivatives markets are less
likely to hedge, and this applies even for large
corporations.
References 1. Adelegan, O.J. (2009), The Derivatives Market in
South Africa: Lessons for sub-Saharan African
Countries, International Monetary Fund Working
Paper, WP/09/196, September 2009
2. African Development Bank Group (2010), African
Fixed Income and Derivatives Guidebook, May 2010
3. Alkeback, P. and Hagelin, N., (1999), Derivative usage
by non-financial companies in Sweden with an
international comparison, Journal of International
Financial Management and Accounting, 10, 105-120
4. Alkeback, P., Hagelin, N. and Pramborg, B., (2006),
Derivative usage by non-financial companies in
Sweden 1996 and 2003: what has changed?,
Managerial Finance, 32(2), 101-114
5. Al-Momani, R., Gharaibeh, M. R., (2008), “Foreign
Exchange risk management practices by Jordanian
non-financial firms”, Journal of Derivatives & Hedge
Funds, 14 (3/4), 198–221
6. Ameer, R., (2009), “Value Relevance of Foreign
Exchange and Interest Rate Derivatives disclosure: the
case of Malaysian firms”, The Journal of Risk Finance,
Vol. 10 No. 1, 78-90
7. Bailly, N, Browne, D, Hick, E and Skerrat, L, (2003),
“UK Corporate use of derivatives”, The European
Journal of Finance 9, 169-193
8. Ball R., (2001), “Infrastructure Requirements for an
Economically Efficient System of Public Financial
Reporting and Disclosure.” Brookings-Wharton Papers
on Financial Services, 127-182
9. Bank for International Settlements (2013), BIS
Quarterly Review, June 2013, A141 (available at
http://www.bis.org/statistics/dt1920a.pdf)
10. Bartram, S. M., Brown, G. W., Fehle, F. R., (2009),
“International Evidence on Financial Derivative
Usage”, Financial Management (Spring 2009), 185 –
206
11. Bartram, S.M., G.W. Brown, and F. Fehle. (2009).
“International evidence on financial derivative usage.”
Financial Management (Spring 2009), 38(1), 185–206.
12. Berkman, H., and Bradbury, M.E., (1996), Empirical
Evidence on the Corporate Use of Derivatives,
Financial Management, (Summer 1996), 25(2), 5-13
13. Berkman, H., Bradbury, M.E. and Magan, S., (1997),
“An international comparison of derivatives use”,
Financial Management, (Winter 1997), 26(4), 69-73
14. Bodnar, G.M., Hayt, G.S., Marston, R.C. and
Smithson, C.W., (1995), Wharton survey of derivatives
usage by US non-financial companies, Financial
Management, 24(2), 104-114
15. Bodnar, G.M., Hayt, G.S. and Marston, R.C., (1996),
1995 Wharton survey of derivatives usage by US non-
financial companies, Financial Management, 25(4),
113-133.
16. Bodnar, G.M., Hayt, G.S. and Marston, R.C., (1998),
1998 Wharton survey of financial risk management by
US non-financial companies, Financial Management,
27(4), 70-91.
17. Bodnar, G.M. and Gebhardt, G., (1999), Derivatives
usage in risk management by US and German non-
financial companies: A comparative study, Journal of
International Financial Management and Accounting,
10, 153-187
18. Bodnar, G.M., Hayt, de Jong, A., and Macrae, V.,
(2003), The Impact of Institutional Differences on
Derivatives Usage: a Comparative Study of US and
Dutch Companies, European Financial Management,
9(3), 271-297.
19. Bodnar, G. M., Consolandi, C., Gabbi, G., Jaiswal-
Dale, A., (2008), “A Survey on Risk Management and
Usage by Non-Financial Italian firms”, Centre for
Applied Research in Finance (Carefin) work paper
7/08.
20. Brunzell, T., Hansson, M. and Liljeblom, E., (2011),
“The Use of derivatives in Nordic Firms”. The
European Journal of Finance, (May–July 2011), 17(5-
6), 355–376
21. Chavez and Guedira, 2006,” Derivatives Exchange in
Morocco: Dream or Reality? - Market demand and
lessons from other exchanges.” University of Goteborg
22. Choi and Mueller, 2002, International Accounting,
Fourth Edition, Prentice –Hall, p.41.
23. Correia C., Holman G., Jahreskog A., (2009), “The
corporate use of derivatives: a survey of South Africa’s
top listed non-financial firms”, Economic Society of
South Africa (ESSA) Conference 2009, Feather Market
Convention Centre Port Elizabeth.
24. Correia C., Holman, G. and Jahreskog (2012) “The
corporate use of derivatives: a survey of South Africa’s
large listed non-financial firms”, South African Journal
of Accounting Research, 26(1), 67-94
25. Crnkovic, J., (2011), “An investigation into the use of
derivatives by Botswana, Namibia, Zambia and
Zimbabwe”, Masters in Commerce dissertation,
University of Cape Town
26. De Ceuster, M.J.K., Durinck, E., Laveren, E. and
Lodewyckx, J., (2000), ‘‘A survey into the use of
derivatives by large non-financial companies operating
in Belgium’’, European Financial Management, 6(3),
301-318
27. Donaldson, A., (2011), “"An investigation into the use
of derivatives by the 3rd tier South African companies”,
Masters in Commerce dissertation, University of Cape
Town
28. El-Masry, A. A., (2006), “Derivative Use and risk
management practices by UK non-financial
companies”, Managerial Finance, 32(2), 137-159
29. Ernst and Young, (2009), “Classification of financial
instruments within the IFRS 7 fair value hierarchy”,
EYGM Limited, pp.1-16
30. Grant, K. and Marshall, A.P., (1997), Large UK
companies and derivatives, European Financial
Management, 3(2), 191-208
31. Henning, L., (2011), “Derivative usage by listed
companies in Ghana and Nigeria 2008/2009”, Masters
in Commerce dissertation, University of Cape Town

Corporate Ownership & Control / Volume 11, Issue 1, 2013, Continued - 7
690
32. ISDA (2009) Derivatives Usage Survey, “Isda
Research Note No 2 (Spring 2009), available at
http://www.isda.org/statistics/stat_nav.html
33. ISDA, (2012), OTC Derivatives Market Analysis Mid-
Year 2012, (December 2012)
34. Jacobs, A., (2011), “"An investigation into the use of
derivatives by the 2nd 100 largest listed companies in
South Africa”, Masters in Commerce dissertation,
University of Cape Town
35. Jalilvand, A. (1999), “Why Companies use derivatives:
Evidence from Canada”, Canadian Journal of
Administrative Sciences, 16(3), 213-227
36. Jalilvand, A. Switzer, J. and Tang, C. (2000), “A
Global perspective on the use of derivatives for
corporate risk management decisions”, Managerial
Finance, 26(3), 29-38
37. Junior, J.L.R (2011), “Exchange Rate Exposure,
Foreign Currency Debt and the use of Derivatives:
Evidence from Brazil” Emerging Markets Finance &
Trade, January–February 2011, 47(1), 67–89.
38. Junior, J.L.R (2007), “The Use of Currency
Derivatives by Brazilian Companies: An Empirical
Investigation” Revista Brasileira de Financas, 5(2),
205–232
39. Mallin, C., Ow-Yong, K. and Reynolds, M., (2001),
‘‘Derivatives usage in UK non-financial listed
companies’’, European Journal of Finance, 7(1), 63-
91
40. Martin, M., Rojas, W., Erausquin, J., and Vera, D.,
(2009), “Derivatives Usage by Non-financial Firms in
Emerging Markets: The Peruvian Case”, Journal of
Economics, Finance and Administrative Science,
December 2009, 14(27),73-86
41. Modack, G., (2011), “"An investigation into the use of
derivatives by the 100 largest companies listed on the
main board of the JSE Securities Exchange, South
Africa”, University of Cape Town
42. Modack, G., Holman, G. and Correia C., (2012),
“Derivative use in South Africa: a study of financial
statements of JSE-listed companies.” In Proceedings of
2012 Southern African Accounting Association,
Western Cape Regional Conference, 7 September
2012, Cape Town: Southern African Accounting
Association. ISBN 9780620536738
43. Phillips, A.L., (1995), “1995 Derivatives Practices and
Instruments Survey”, Financial Management, 24(3),
115-125
44. Pitt, L., (2011), “An investigation into the use of
derivative by 89 of the smallest companies listed on the
main board of the JSE as well as those companies
listed on the ALTX”, Masters in Commerce
dissertation, University of Cape Town
45. Pramborg, B., (2003), “Foreign Exchange risk
management by Swedish and Korean non-financial
firm: a comparative survey”, Pacific-Basin Finance
Journal, 13, 343– 366
46. Prevost, A.K., Rose, L.C., and Miller, G., (2000),
Derivatives Usage and Financial Risk Management in
Large and Small Economies: A Comparative Analysis,
Journal of Business Finance & Accounting, 27(5/6),
733-759
47. Schiozer, R., and Saito, R., (2009), “The Determinants
of Currency Risk Management in Latin American
Nonfinancial Firms”, Emerging Markets Finance &
Trade, 45(1), 49–71
48. Selv, Y., and Türel, A, (2010), “Derivatives Usage in
Risk management by Turkish non- financial firms and
banks: a comparative study”, Annales Universitatis
Apulensis Series Oeconomica, 12(2), 663-671
49. Sheedy, E., (2006), “Corporate Risk Management in
Hong Kong and Singapore”, Managerial Finance,
32(2), 89-100
50. Shu, P-G and Chen, H-C, (2003), ‘The determinants of
derivatives use: evidence from non-financial
companies in Taiwan”, Review of Pacific Basin
Financial Markets and policies 6(4), 473-500.
51. Smithson, C. and Simkins, B. (2005) “Does risk
management add value? A survey of the evidence”,
Journal of Applied Corporate Finance, 17(3), 8-17.
52. Spyridon, K., (2008), “Derivatives Usage in Risk
Management by Non-Financial firms: Evidence from
Greece”, MPRA Paper No. 10945, (available at
http://mpra.ub.uni-muenchen.de/10945/)
53. Yankson, S., (2011), “Derivatives in Islamic Finance-
A case for profit rate swaps” Journal of Islamic
Economics, Banking and Finance, 7(1), 39-56
54. Deutsche Börse Group (2008) The global derivatives
market, an introduction” Deutsche Börse Group White
Paper, 4-42
55. www.africanfinancials.com

Corporate Ownership & Control / Volume 11, Issue 1, 2013, Continued - 7
691
THE IMPACT OF CORPORATE GOVERNANCE ON FIRM PERFORMANCE IN EGYPTIAN LISTED COMPANIES
Ehab K. A. Mohamed*, Mohamed A. Basuony**, Ahmed A. Badawi***
Abstract
This paper examines the impact of corporate governance on firm performance using cross sectional data from non-financial companies listed in the Egyptian Stock Exchange. The 88 non-financial companies on EGX100 index of listed companies on the Egyptian Stock Market are studied to examine the relationship between ownership structure, board structure, audit function, control variables and firm performance by using OLS regression analysis. The results show that ownership structure has no significant effect on firm performance. The only board structure variable that has an effect on firm market performance is board independence. Firm book value performance is affected by both board independence and CEO duality. Firm size and leverage have varying effects on both market and book value performance of firms. Keywords: Ownership Structure, Board Structure, Audit, Corporate Governance, Firm Performance, Egypt Corresponding author, Professor of Accounting & Vice of Academic Affairs, Faculty of Management Technology, German
University in Cairo, New Cairo, Post Code: 11835, Cairo, Egypt Tel. +20 227590764, Fax +20 227581041, E-mail: [email protected] ** American University in Cairo, Egypt *** American University of the Middle East, Kuwait
1. Introduction
Corporate governance has assumed a central place in
the continued effort to sanitize corporate reporting
and shore up public confidence in financial markets
around the world. The issue seems to revolve around
putting the right rules, regulations and incentives in
place to ensure transparency and accountability in the
management of the affairs of corporate entities
(Cadbury, 1992). Interest in corporate governance has
grown in the last three decades bringing the term from
obscurity to the centre of attention of many academic
and professional studies. This interest appears more
appropriate at this time, when business executives and
auditors are continually being held to higher standards
of accountability and responsibility, even though
corporate governance issues may be traced back to the
nineteenth century with the advent of limited liability
incorporation (Vinten, 1998). Corporate governance is
viewed as an indispensable element of market
discipline (Levitt 1999) and this is fuelling demands
for strong corporate governance mechanisms by
investors and other financial market participants (Blue
Ribbon Committee 1999; Ramsay 2001).
Corporate Governance has received a lot of
attention in recent years both in the professional and
academic literature. Regulators enthusiastically
recommend it and have successfully enacted corporate
governance reforms into law in some countries such
as the USA (Sarbanes-Oxley Act, 2002). In other
countries such UK (Combined Code of Corporate
Governance, 2003) the corporate governance codes
are principles of best practice with some indirect
element of legislature operating through the
respective stock exchange listing rules.
The term corporate governance describes the
system by which companies are directed and
controlled. The overall objective of good governance
is to ensure sustained growth or survival of companies
and the attainment of multiple goals of corporate
stakeholders, that is, investors, employees, and
society in general (Charkham, 1994). It is defined as
the system by which companies are controlled,
directed and made accountable to shareholders and
other stakeholders; control being understood as
including indirect influences of financial markets
(Demirag, 1998). Hence control is a major element of
corporate governance, both in terms of environment
and organizational activities (Committee of
Sponsoring Organizations of the Treadway
Commission (COSO), 1992; Public Oversight Board
(POB), 1993; Cohen and Hanno, 2000).
Comparative studies of corporate governance,
performance pressures, and accountability of
management reveal significant variations among
countries (Charkham, 1994). Some of these
Corporate Ownership & Control / Volume 11, Issue 1, 2013, Continued - 7
692
differences may be traced to cultural differences
(Hofstede, 2001), institutional differences (North,
1990), political structures, and ownership forms
(Thomsen and Pedersen, 1995), as well as board
composition and characteristics (Finkelsrein and
Hambrick, 1996). Cultural differences between
countries, industries, and companies can explain a
great deal of the diversities in corporate governance
structures and processes in different countries (Kuada
and Gullestrup, 1998). For example, the extent to
which corporate governance is legally regulated will
depend on the degree of uncertainty avoidance in a
society. To avoid uncertainty, societies may institute
formal and/or informal rules, which are used as
regulatory mechanism to ensure that deliberate steps
are taken to guard against unacceptable future
conditions. Hence, in societies where a viable
coalition of stakeholders is the primary objective of
corporate governance, regulations encourage long-
term orientation of management decisions and
professionalism in their implementation.
Despite the impact of cultural differences on
corporate governance, there is evidence suggesting
that most of the issues and challenges of corporate
governance in a rapidly changing global business
environment are similar, irrespective of geographical
locations. Byrne (1996; 1997), for example, find that
too few people are constantly appearing on the same
boards, and consequently, attending too few board
meetings, and that many board members have vested
interest in the companies and hence could not devote
their full attention to management and control issues
that require objectivity and independence. Despite
cultural differences, this is common in many other
countries, and notably so in Egypt. Arguably, an
emerging economy, such as Egypt is likely to require
more effective and stronger governance mechanisms
than their western developed counterparts if they are
to become equal, full and active participants in the
global financial marketplace.
The aim of this paper is to examine the effect of
corporate governance on both book value and market
value firm performance in Egyptian firms. The rest of
the paper is organised as follows: the following
section provides a brief overview of the institutional
framework in Egypt, followed by the theoretical
background and hypothesis development. The
research methodology is provided in section 4,
followed by the findings and analysis in section 5; and
finally summary & conclusion are provided in section
6.
2. Institutional Framework
The corporate legal framework in Egypt has its origin
in French civil law. However, Anglo-American
common law concepts became more prominent in
Egyptian corporate law with the drafting of the
Central Depository Law in 2001 and the proposed
new Capital Market Law in 2002. The main laws
governing the legal framework that impacts the
concepts of corporate governance in Egypt can be
divided into two main groups (UNCTAD, 2007):
(a) Laws governing incorporation of companies:
1. Companies’ Law (CL 159/1981), which
regulates joint stock companies,
limited liability companies and partnerships limited
by shares;
2. Investment Law (IL 8/1997), which endorses
investment in specific industrial locations or
economic sectors by offering specific income tax
exemptions or tax free zones;4 and
3. Public Business Sector Law (PBLS
203/1991), the law that governs the
incorporation of public business sector companies;
and
(b) Laws governing public and private sector
companies listed on the Cairo Alexandria Stock
Exchange (CASE):
1. Capital Market Law (CML 95/1992), the
main law regulating the Egyptian financial market in
terms of monitoring the market status in general and
maintaining steadiness and growth; and
2. Central Depository Law (CDL 93/2000),
which aims at reducing risks associated with trading
physical securities, enhancing market liquidity, in
addition to assuring fast securities exchange. In other
words, the law maintains all registration, clearance
and settlement procedures associated with trading
transactions.
Egypt started engaging in a number of activities
aimed at improving its corporate governance practices
even before the Enron-type scandals broke. Since the
early 1990s the government and business leaders in
Egypt recognized that if applied properly, corporate
governance should help the country realize high and
sustainable rates of growth. Then following the
developments around the world, regulatory authorities
in Egypt attempted to respond to the need for greater
transparency and accountability with regards to
corporate governance disclosure. The first Egyptian
Code of Corporate Governance (ECCG) introduced
by the Ministry of Investment and the General
Authority for Investment and Free Zones (GAFI).
These guidelines are to be primarily implemented in
joint-stock companies listed on the stock exchange,
and companies that use the banking systems as a
major source of finance. The Capital Market
Authority (CMA) further contributed to the corporate
governance reforms by restructuring its organization
and initiating three major sectors: (a) the Corporate
Finance and Corporate Governance sector; (b) The
Market Regulation sector; and (c) the Market
Surveillance and Enforcement sector, in addition to
other central departments and units. Furthermore, a
Code of Corporate Governance for State-Owned
Companies was issued by the Ministry of Investment
in 2006. This code is primarily based on the ECCG
and the report of the OECD working group on

Corporate Ownership & Control / Volume 11, Issue 1, 2013, Continued - 7
693
privatization and corporate governance of State-
owned assets (UNCTAD, 2007).
3. Theoretical background and Hypothesis Development
Corporate governance is a multi-disciplinary research
field and has a range of meanings and definitions
depending on how one uses it and which discipline
and which country one is considering. Traditional
finance literature has indicated several mechanisms
that help solve corporate governance problems. There
is a consensus on the classification of corporate
governance mechanisms to two categories: internal
and external mechanisms. However, there is a
dissension on the contents of each category and the
effectiveness of each mechanism. In addition, the
topic of corporate governance mechanisms is too vast
and rich research area to the extent that no single
paper can survey all the corporate governance
mechanisms developed in the literature and instead
the papers try to focus on some particular governance
mechanisms.
Jensen (1993) criticises the existing governance
mechanisms in USA, UK, Japan and Germany and
outlines four basic categories of individual corporate
governance mechanisms: (1) legal and regulatory
mechanisms; (2) internal control mechanisms; (3)
External control mechanisms; and (4) product market
competition. In their survey of corporate governance,
Shleifer and Vishny (1997) concentrate on: incentive
contracts, legal protection for the investors against the
managerial self-dealing, and the ownership by large
investors.
Denies (2001) provides the following four
mechanisms: (1) legal and regulatory mechanisms
exist outside the firm; (2) internal control mechanisms
within a firm, (which include; the board of directors;
executive compensation and ownership; non
executive owners; and debt); (3) external control
mechanisms such as the corporate takeover market;
and (4) product market competition. Then Denis and
McConnell (2003) survey the international corporate
governance concentrating on countries other than
United States and using a dual classification of
corporate governance mechanisms (They use systems
as synonym to mechanisms) as follows: (1) internal
governance mechanisms including: boards of
directors and ownership structure and (2) external
ones including: the takeover market and the legal
regulatory system.
Farinha (2003) surveys two categories of
governance (or disciplining) mechanisms, the first one
is the external disciplining mechanisms including:
takeovers threat; product market competition;
managerial labour market and mutual monitoring by
managers; security analysts; the legal environment;
and the role of reputation. The other category is the
internal disciplining mechanisms which include: large
and institutional shareholders; board of directors;
insider ownership; compensation packages; debt
policy; and dividend policy.
Despite the existence of different corporate
governance structures, the basic building blocks of the
structures are similar. They include the existence of a
Company, Directors, Accountability and Audit,
Directors’ Remuneration, Shareholders and the AGM.
Cadbury (1992), Greenbury (1995) and Hampel
(1998) called for greater transparency and
accountability in areas such as board structure and
operation, directors’ contracts and the establishment
of board monitoring committees. In addition, they all
stressed the importance of the non-executive
directors’ monitoring role.
Ownership Structure
Large shareholders and institutional investors can be
seen as potential controllers of equity agency
problems as their increased shareholdings can give
them a stronger incentive to monitor firm
performance and managerial behavior (Demsetz,
1983; Demsetz and Lehn 1985; and Shleifer and
Vishny, 1986; Shleifer and Vishny, 1997, La Porta et
al, 1998; La Porta et al, 1999; Claessens et al, 2000,
and Denis and McConnell, 2003). This potentially
helps to circumvent the free rider-problem associated
with ownership dispersion. Another potential benefit
relates to the potential challenge that large
shareholders offer to outside raiders, thus increasing
the takeover premium (Burkart, 1995).
Ownership concentration in both developed and
developing countries show high concentration of
ownership (La Porta et al, 1998 & 1999; Faccio et al,
2001; Lemmon and Lins, 2003; Ginglinger and L’her,
2006). It is also noted that in several countries around
the world control of proportional ownership is usually
achieved through pyramidal ownership structures in
which one firm is controlled by another firm, which
maybe itself controlled by some other entity
(Lemmon and Lins, 2003).
One rather intuitive way by which equity agency
costs can be reduced is by increasing the level of
managers' stock ownership, which may permit a better
alignment of their interests with those of shareholders.
In fact, in the extreme case where the manager's share
ownership is 100%, equity agency costs are reduced
to zero (Jensen and Meckling, 1976). As managerial
ownership increases, managers bear a large fraction of
the costs of shirking, perquisite consumption and
other value-destroying actions. Further, larger share
ownership by managers reduces the problem of
different horizons between shareholders and managers
if share prices adjust rapidly to changes in firm’s
intrinsic value.
A limitation, however, of this mechanism as a
tool for reducing agency costs is that managers may
not be willing to increase their ownership of the firm
because of constraints on their personal wealth.
Additionally, personal risk aversion also limits the

Corporate Ownership & Control / Volume 11, Issue 1, 2013, Continued - 7
694
extension of this monitoring device as the allocation
of a large portion of the manager's wealth to a single
firm is likely to translate into a badly diversified
portfolio (Beck and Zorn, 1982). Management
buyouts, whereby insiders increase dramatically their
shareholdings in the firm, provide a natural field study
for the effects of insider ownership in the reduction of
conflicts between owners and managers.
In accordance with the proposition that larger
managerial ownership reduce agency costs, Kaplan
(1989) finds that following large management
buyouts, firms experience significant improvements
in operating performance. He interprets this evidence
as suggesting that operating changes were due to
improved management incentives instead of layoffs or
managerial exploitation of shareholders through
inside information. Smith (1990) reports similar
results and notes that the amelioration observed in
operating performance is not due to reductions in
discretionary expenditures such as research and
development, advertising, maintenance or property,
plant and equipment. Macus (2008) argues that the
basic issue from an agency perspective is how to
avoid such opportunistic behavior. Previous studies
suggest that corporate governance is an effective tool
to control the opportunistic behaviours of
management (Denis and McConnell, 2003; Bhagat
and Bolton, 2008; Chen et al., 2009).
In a study of the effects of changes in ownership
structure on performance for a sample of thrift
institutions that converted from mutual to stock
ownership, Cole and Mehran (1998) find that changes
in performance are significantly associated with
changes in insider ownership. They document that the
greater the increase in insider ownership, the greater
the performance improvement, which is consistent
with the alignment of interests hypothesis arising
from a larger insider ownership. Also consistent with
that hypothesis of Subrahmanyam et al (1997) who
find evidence, in a sample of successful bidders in
bank acquisitions, of a positive association between
bidder returns and the level of insider ownership
when the latter exceeds 6%.
Research by Morck et al (1988), McConnell and
Servaes (1990) and Hermalin and Weisbach (1991) is
also consistent with the view that insider ownership
can be an effective tool in reducing agency costs,
although they report a non- monotonic relation. This
functional form has been related to the observation
that, within a certain ownership range, managers may
use their equity position to entrench themselves
against any disciplining attempts from other
monitoring mechanisms.
However, some other studies find no evidence of
a positive relationship between insider ownership and
performance (see, for instance, Demsetz and Lehn,
1985; Loderer and Sheehan, 1989; Holderness and
Sheehan, 1988; Denis and Denis, 1994; and Loderer
and Martin, 1997). Moreover, the studies that find a
positive relationship typically present results that have
very low explanatory power (R2s usually between 2%
and 6%).
A possible explanation for these mixed results is
that many of the studies do not properly distinguish
the possibility of alignment of interests across a
certain range of ownership values and of
entrenchment over another range. Furthermore, these
analyses usually do not take into account the
possibility that several different mechanisms for
alignment of interests can be used simultaneously,
with substitution effects with insider ownership. It is
quite conceivable that different firms may use
different mixes of corporate governance devices
(Rediker and Seth, 1995).
These different mixes can, however, all be
optimal as a result of varying marginal costs and
benefits of the several monitoring instruments
available for each firm. If so, then one would not be
able to observe a relationship between performance
and any of these particular mechanisms.
It appears that the main conflict is between
owners and managers in common law countries due to
the existence of dispersed control and ownership
structures. While, in civil law countries the control
and ownership structures are concentrated, thus the
main governance problem arises between minority
and controlling shareholders. Therefore, ownership
structure has greater importance in civil law countries
where protection of shareholders right is weak (La
Porta et al., 1998; Beck et al., 2003). The situation is
more prevalent in developing countries where large
concentration of ownership is more evident while the
stock markets weak. In those countries there is a
higher degree of economic uncertainties coupled with
weak legal controls and investor protection, and
frequent government intervention; all resulting in
poor performance (Ahunwan, 2002; Rabelo and
Vasconcelos, 2002; Tsamenyi et al; 2007).
The fact that the logical argument goes for a
causal relationship between the ownership structure
and firm performance on the basis of placing
ownership structure as the independent variable can
influence firm performance. This is the underlying
assumption of several studies (Claessens and Fan,
2002; Klapper and Love, 2004; Lins, 2003; and Sung
Wook, 2003; Kumar and Singh, 2013). Another line
of research suggested that, contrary to the logic
suggested that firm performance is the independent
variable that can influence ownership structure and
not the opposite (Demsetz and Lehn, 1985; Loderer
and Martin, 1997; Cho, 1998). Chang (2003) reveals
that the concentration of ownership, which enables
owners to reduce managers’ discretion, and increased
ownership by managers, which aligns managers’
interests with those of shareholders, improve firm
performance. Krivogorsky (2006) indicates that a
strong positive relation between the level of relational
ownership and profitability ratios. This explains the
strong reliance on the ownership structure as
corporate governance mechanisms that might

Corporate Ownership & Control / Volume 11, Issue 1, 2013, Continued - 7
695
significantly affect the firms’ performance. This
prompt the first hypothesis:
H1: There is a significant relationship between
ownership structure and firm performance.
H1a: There is a significant relationship between
ownership structure and book value performance.
H1b: There is a significant relationship between
ownership structure and market value performance.
Board Structure
Based on the agency perspective the separation of the
roles of CEO from chairman is another crucial
monitoring mechanisms. CEO duality is when the
CEO also serves as chairman. This situation is
problematic from an agency perspective as the CEO
seems to get dominant influence on board decisions
by chairing the group of people in charge of
monitoring and evaluating his performance. This in
effect results in weakening the board's independency
and may result in ineffective monitoring of
management. Therefore good governance will occur
when the two roles of Chairman and CEO are
separated (Baliga et al, 1996; Brickley et al, 1997;
Coles and Hesterly, 2000; Wier and Liang, 2001;
William et al. 2003).
Moreover, several studies reveal that there is
negative relation between the size of the board and
performance. Larger boards seems to be less efficient
due to the slow pace of decision making and the
difficulty in both arranging board meeting and
reaching consensus. It is also argued that the CEO
seems to have more dominant power when the board
size is too large. (Jensen 1993; Yermack 1996;
Eisenberg et al, 1998; Singh and Davidson, 2003;
Cheng, 2008)
Hermalin and Weisbach (1991) find that in the
US board size is negatively related to both general
firm performance and the quality of decision-making.
Evidence of a negative relation between board size
and firm performance is also revealed in Singapore
and Malaysia (Mak and Yuanto, 2003) Finland
(Eisenberg et al, 1998) and UK (Carline et al, 2002).
It is not only the size of the board that seems to
have a governing effect on firm performance, it is
argued that the board composition in terms of the
number of outside directors versus inside directors
results in better performance through better
monitoring. This argument is mainly based on the
agency theory (Fama 1980; Demsetz and Lehn, 1985).
Several studies find that the larger the number of
outside directors on the board, the better the firm
performance (Rosenstein and Wyatt, 1990; Weisbach,
1988; Huson, 2001).
On the other hand, some argue that based on the
stewardship theory executive directors have a positive
effect on corporate R&D costs and better performance
based on improved strategic innovation (Donaldson,
1990; Kochar and David, 1996; Davis et al, 1997).
Several studies reveal negative relation between the
number of outside directors and firm performance
(Agrawal and Knoeber, 1996; Kochar and David,
1996; Bhagat and Black, 2002). Meanwhile, several
other studies find no significant relation between the
number of outside directors and corporate
performance (Hermalin and Weibach, 1991; Dalton et
al, 1998; Vafeas and Theodorou, 1998; Liang and
Wier, 1999; Lam and Lee, 2012). Hermalin and
Weisbach (1991) find that in the US higher
proportions of outside directors are not associated
with superior firm performance, but are associated
with better decisions concerning issues such as
acquisitions, executive compensation, and CEO
turnover. Further explanation is provided by Adams
and Ferreira (2007) who suggest that CEOs may be
reluctant to share information with more independent
boards, thereby decreasing shareholder value.
The relationship between corporate performance
and corporate governance is measured using only one
of the two variables (ownership structure and board
structure) in relation with the firm performance
(Krivogorsky, 2006). There is a debate regarding the
effect of board composition on firm performance
(Dulewicz and Herbert, 2004; De Andres et al., 2005;
Ehikioya, 2009). Bhagat and Black (2002) find a
negative relationship between the proportion of
outside directors and corporate performance.
Moreover, Yermack (1996) reported evidence that a
higher percentage of independent directors leads to
worse performance. In addition, Klein (2002)
suggestes that high percentage of outside directors
will have the same negative effect. On the other hand,
a meta-analysis of studies in this area conducted by
Dalton et al. (1998) fails to find any relationship
between corporate performance and non-executive
director’s independence. Moreover, other studies
based on data from UK companies do not show any
evidence of an existing relationship between the
proportion of non-executive directors and firm
performance (Vafeas and Theodorou 1998; Liang and
Wier, 1999). Dalton et al. (1998) point out that the
empirical literature examining leadership structure in
relation to firm performance fail to provide any
consistent results. This leads to the second hypothesis:
H2: There is a significant relationship between
board structure and firm performance.
Rechner and Dalton (1989) find no significant
differences in firm performance between separated
leadership structure firms and combined leadership
structure firms over a five year period. However,
further study of the same sample reveal that firms
with separated leadership structure have higher
performance than the firms with combined leadership
structure measured with ROE, ROI and profit margin
(Rechner and Dalton, 1991).
H2a: There is a significant relationship between
board structure and book value performance.
Sundaramurthy et al. (1997) provide evidence
that separating the positions will affect the
shareholder wealth positively. Moreover, Coles and

Corporate Ownership & Control / Volume 11, Issue 1, 2013, Continued - 7
696
Hesterly (2000) find that firms that separate CEOs
and board chairs will have better stock returns than
firms that do not separate the two roles. On the other
hand, Baliga et al. (1996) do not find sufficient
evidence to support a performance distinction
between separated and combined leadership firms
when the performance was measured using the market
value added (MVA) and economic value added
(EVA) as performance indicators.
H2b: There is a significant relationship between
board structure and market value performance.
Audit Function
Auditing is an important function that contributes to a
trustful relationship between the agent and the
organisation’s principals and other stakeholders who
rely on the financial information. The audit adds to
the reliability and quality of the financial reporting
through scrutinizing the accounting and reporting
(Porter et al., 2008; Collin et al., 2013).
Audit committees are identified as effective
means for corporate governance that reduce the
potential for fraudulent financial reporting (NCFFR,
1987). Audit committees oversee the organization’s
management, internal and external auditors to protect
and preserve the shareholders’ equity and interests.
To ensure effective corporate governance, the audit
committee report should be included annually in the
organization’s proxy statement, stating whether the
audit committee has reviewed and discussed the
financial statements with the management and the
internal auditors. As a corporate governance monitor,
the audit committee should provide the public with
correct, accurate, complete, and reliable information,
and it should not leave a gap for predictions or
uninformed expectations (BRC, 1999). The BRC
report provides recommendations and guiding
principles for improving the performance of audit
committees that should ultimately result in better
corporate governance. The importance of the audit
function in terms of the audit committee and audit
firm is further strengthened by the Sarbanes-Oxley
Act of 2002.
It is assumed that all auditors whether large
international firms (i.e. Big 4) or national and local
firms are professionals and apply the standards issued
by professional bodies. Nonetheless, it can be
assumed that audit practice in the Big 4 is more
influenced by international development than in the
national audit firms. The acquisition of more up-to-
date practice and strength from international
experience that put power behind the Big 4 demands
and audit effort can lead us to assume that use of a
Big Four audit firm will positively impact
performance (Collin et a1., 2013).
The presence of a large international audit firm
(i.e., Big 4) has been considered as a significant factor
in the possibility of having a good corporate
governance mechanism. These firms are expected, on
average, to provide a relatively high quality of
auditing service (Kane & Velury, 2004). Chen et al.
(2005) examine empirically the relationship between
audit quality (measured by industry specialization)
and the number of audit committee meetings in a year
(as a signal of good corporate governance practice).
They find that an association exists between the
presence of an audit committee and an industry
specialist audit firm. To sum up, it is possible for big
audit firms to control opportunistic management
behaviours, reduce agency costs, and increase the
firm’s value.
H3: There is a significant relationship between
audit function and firm performance.
H3a: There is a significant relationship between
audit function and book value performance.
H3b: There is a significant relationship between
audit function and market value performance.
Control Variables
Firm size, age industry type and leverage are control
variables which are proved to have an effect on firm
performance and are used widely in the empirical
literature of corporate governance. (for example:
Klapper and Love, 2003; Bahgat and Bolton, 2008;
Ehikioya, 2009; Kumar and Singh, 2013). The
hypothesis to be tested is as follows:
H4: There is a significant relationship between
control variables and firm performance.
H4a: There is a significant relationship between
firm size, age, industry type, leverage
and book value performance.
H4b: There is a significant relationship between
firm size, age, industry type, leverage and market
value performance.
4. Research Methodology
The research models in figure (1) consist of corporate
governance variables, control variables and firm
performance. The corporate governance variables
adopted in this research consists of three variables
which are the audit function variable, ownership
structure variable and, board structure variable. ROA
and ROE are the two variables used to represent the
book value performance, while Tobin’s Q is the
variable adopted to represent the market value
performance. Finally, the age, industry type, firm size
and leverage are the control variables used.

Corporate Ownership & Control / Volume 11, Issue 1, 2013, Continued - 7
697
Figure 1. Research Models
The sample comprises of the top 88 firms listed
on the Egyptian Stock Exchange top 100 index
EGX100 for the year 2010; excluding all financial
firms (including Banks). Data collected is cross
sectional for the year 2010. Data are collected from
Osiris and Kompass Egypt databases.
Definition and measurement of all variables used
in the research are provided in table (1).
Table 1. Definition and Measurement of Variables
Variable Groups Symbol Measurement
Governance Variables
(Independent Variables)
Audit function
Audit committee AC takes the value of 1 if exists, 0 otherwise
Audit type AudType takes value of 1 if auditor is one of the big 4 audit firms, 0
otherwise
Ownership Structure
Institutional Ownership IOwn takes the value of 1 if exists, 0 otherwise
Directors Ownership DOwn takes the value of 1 if exists, 0 otherwise
Ownership Concentration OwnCon Adding up all share ratios of shareholders of 5% or more
Board Structure
Duality Duality takes the value of 0 if exists, 1 otherwise
Board Size BrdSize Total number of board members
Board independence BIndp Number of non-executive members on the board / Board
Size
Control Variables
Age Age Takes the value of 1 if the firm is old, 2 for medium age,
and 3 for new firms.
Industry Type Indtype takes the value of 1 for manufacturing firms, 2 for
Book value
Performance
Market value
Performance
H1
H2a
H3a
Control Variables
- Age
- Type of industry
- Size
- Leverage
Ownership Structure
Variable
Board Structure
Variable
Audit Function Variable
H1a
H3b
Tobin’s Q
ROA ROE
H1b
H2b
H4a H4b

Corporate Ownership & Control / Volume 11, Issue 1, 2013, Continued - 7
698
nonfinancial services firms
Size Size natural log of total assets
Leverage Leverage Debt / Equity
Performance Variables
(Dependent Variables)
Book Value Performance
ROE ROE return on equity = net income / equity
ROA ROA return on assets = net income / total assets
Market Value Performance
Tobin’s Q Tobin’s Q We use Chung and Pruitt (1994) measure of Q (CPQ) as an
approximation of Tobin Q, since it does not require an
estimate of the market values of debt and preferred stock.
C-P Q = (MV (CS) + BV (PS) + BV (LTD) + BV (INV) +
BV (CL) - BV (CA)) / BV (TA)
To test the research objective outlined in section
1, regression analysis (OLS) is used to depict the
effect of CG and control variables on firm
performance. Four equations are used (using SPSS) to
test the hypotheses as follows.
Tobin’s Q = α + β1 BIndp + β2 Duality + β3
Brdsize + β4 Ac + β5 AudType + β6 IOwn +β7 DirOwn
+ β8 OwnCon + β9 Size + β10 IndType + β11 Age + β12
Leverage + ε
ROE = α + β1 BIndp + β2 Duality + β3 Brdsize +
β4 Ac + β5 AudType + β6 IOwn + β7 DirOwn + β8
OwnCon + β9 Size + β10 IndType + β11 Age + β12
Leverage + ε
ROA = α + β1 BIndp + β2 Duality + β3 Brdsize +
β4 Ac + β5 AudType + β6 IOwn + β7 DirOwn + β8
OwnCon + β9 Size + β10 IndType + β11 Age + β12
Leverage + ε
5. Findings and Analysis
Table (2) illustrates the minimum and maximum
values for the models variables. The descriptive
findings show the central tendency and dispersion of
the indicators of the CG. The calculated means of
ROE and ROA are 14.55 and 8.66, where the standard
deviations as a measure of dispersion are 11.45 and
8.12 respectively. Meanwhile, the mean of Tobin’s Q
is 2.08 with standard deviation of 1.02. The table
shows details of descriptive statistics for CG and
control variables.
Table 2. Descriptive Statistics
N Minimum Maximum Mean Std. Deviation
Tobinq 88 .34 5.35 2.0841 1.01500
ROE 88 -3.37 47.15 14.5522 11.45082
ROA 88 -2.78 34.00 8.6556 8.11681
BIndp 88 .00 1.00 .3715 .32494
Duality 88 0 1 .34 .477
BrdSize 88 3 19 8.89 3.268
AC 88 0 1 .19 .397
AudType 88 0 1 .45 .501
IOwn 88 0 1 .78 .414
DOwn 88 0 1 .47 .502
OwnCon 88 .00 1.00 .7024 .25917
Size 88 10.38 17.82 13.7101 1.80624
IndType 88 1 2 1.41 .494
Age 88 1 3 2.67 .541
Leverage 88 .00 1.87 .1804 .31527
Figure (2) shows auditor type statistics based on
“big 4” and “non-big 4” audit firms in Egypt. The
mean is 0.45 where standard deviation is 0.50. The
frequency for big 4 is 45.5% while for the non-big 4

Corporate Ownership & Control / Volume 11, Issue 1, 2013, Continued - 7
699
is 54.5%. This means that the majority of Egyptian firm depend on the non-big 4 audit firms.
Figure 2. Audit Type
Figure (3) shows audit committee statistics
based on “AC” and “non AC” in Egypt. The mean is
0.19 where standard deviation is 0.397. The frequency
for firms that have AC is 19.3% while for the firms
that do not have AC is 80.7%. This means that the
majority of Egyptian firms do not have on audit
committee.
Figure 3. Audit committee
Pearson correlation coefficients for all variables
are presented in table (3). Table (3) indicates that
there is a significant correlation between Tobin’s Q
and the following CG variables: audit committee,
audit type, board independence and duality. Firm size
and leverage are also significantly correlated with
Tobin’s Q. On the other hand, the only CG variable
that is significantly correlated with ROE is board
independence as well as firm size and industry type.
While, ROA is significantly in correlation with board
independence, director ownership, industry type and
leverage.
Using OLS regression models to test the impact
of corporate governance variables on performance in
firms listed in the Egyptian stock exchange as in the
equations above. Where, for equation 1 (F = 3.951, p
< 0.01); equation 2 (F = 1.876, p < 0.10) and equation
3 (F = 2.624, p < 0.01); the maximum VIF for all
three models is 2.070. The following results are
reported in table 4.
Ownership Structure
The three variables used in this study for ownership
structure are institutional ownership (IOwn), director
ownership (Down), and ownership concentration
(OwnCon). The results reveal that the coefficients of
all three ownership structure variables are
insignificant with all the three dependent variables of
performance (Tobin’s Q, ROE, and ROA). The results
reveal that ownership concentrate in Egypt shows
high concentration which is consistent with prior
studies that reveal high ownership concentration in
both developed and developing countries (La Porta et
al, 1998 & 1999; Faccio et al, 2001; Lemmon and
Lins, 2003; Ginglinger and L’her, 2006). However,
such high concentration together with high
institutional and director ownership as in the case of
Egypt does not seem to have any significant impact
on performance. Nonetheless, the results show
consistency with previous findings (Demsetz and
Lehn, 1985; Loderer and Sheehan, 1989; Holderness
and Sheehan, 1988; Denis and Denis, 1994; and
Loderer and Martin, 1997; Pathirawasam and
Wickremasinghe, 2012).
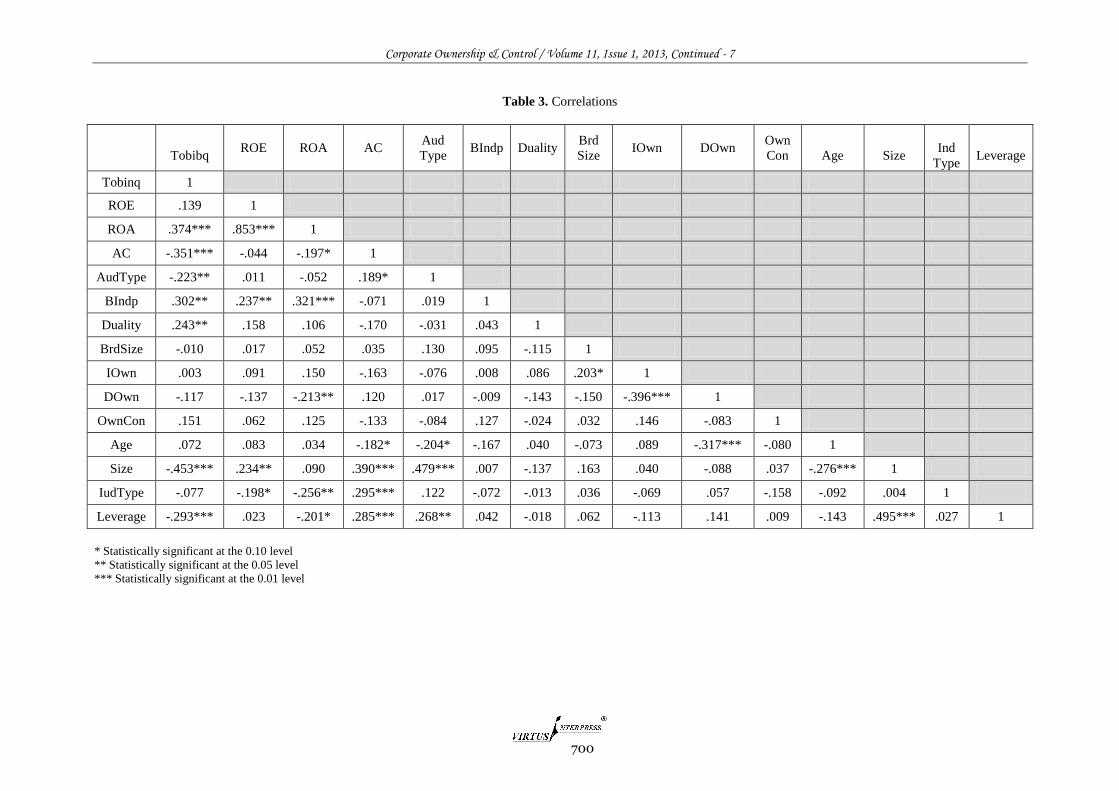
Corporate Ownership & Control / Volume 11, Issue 1, 2013, Continued - 7
700
Table 3. Correlations
Tobibq ROE ROA AC
Aud
Type BIndp Duality
Brd
Size IOwn DOwn
Own
Con
Age
Size
Ind
Type
Leverage
Tobinq 1
ROE .139 1
ROA .374*** .853*** 1
AC -.351*** -.044 -.197* 1
AudType -.223** .011 -.052 .189* 1
BIndp .302** .237** .321*** -.071 .019 1
Duality .243** .158 .106 -.170 -.031 .043 1
BrdSize -.010 .017 .052 .035 .130 .095 -.115 1
IOwn .003 .091 .150 -.163 -.076 .008 .086 .203* 1
DOwn -.117 -.137 -.213** .120 .017 -.009 -.143 -.150 -.396*** 1
OwnCon .151 .062 .125 -.133 -.084 .127 -.024 .032 .146 -.083 1
Age .072 .083 .034 -.182* -.204* -.167 .040 -.073 .089 -.317*** -.080 1
Size -.453*** .234** .090 .390*** .479*** .007 -.137 .163 .040 -.088 .037 -.276*** 1
IudType -.077 -.198* -.256** .295*** .122 -.072 -.013 .036 -.069 .057 -.158 -.092 .004 1
Leverage -.293*** .023 -.201* .285*** .268** .042 -.018 .062 -.113 .141 .009 -.143 .495*** .027 1
* Statistically significant at the 0.10 level
** Statistically significant at the 0.05 level
*** Statistically significant at the 0.01 level

Corporate Ownership & Control / Volume 11, Issue 1, 2013, Continued - 7
701
Board Structure
The three variables used in this study for board
structure are board independence (BIndp), CEO
duality (Duality), and board size (BrdSize). The
results show that board independence (BIndp) appears
to have significant positive effect on Tobin’s Q (β =
0.823, p < 0.01), ROE (β = 8.960, p < 0.05), ROA (β
= 7.849, p < 0.01). This result is consistent with
previous studies (Baysinger and Butler, 1985;
Weisbach, 1988; Alonso and Gonzalez, 2006; Andres
and Vallelado, 2008; O’Connell and Cramer, 2010;
Muttakin et al., 2012). This supports the argument
that based on agency theory a larger proportion of
outside directors improves firm performance by
ensuring better monitoring through effective
management and reduction of conflict of interest
between ownership and control.
The results show that CEO duality appears to
have significant positive effect on ROE (β = 4.507, p
< 0.10). However, the coefficients of CEO duality are
insignificant in terms of Tobin’s Q and ROA. The
results are consistent with prior studies which report
varying the impact of CEO duality on firm
performance where certain industry type benefit from
duality and separation of duties is better for others
(Baliga et al., 1996; William et al. 2003; Elsayed,
2007; Muttakin et al., 2012). However, the results
reveal that the coefficients of board size (BrdSize) are
insignificant with all the three dependent variables of
performance.
Audit Function
The two variables used in this study for audit function
are audit committee (AC) and audit type (AudType).
The results reveal that the coefficients of both
variables are insignificant with all the three dependent
variables of performance. Taking into consideration
that most firms in Egypt have no audit committees
(81%) and the majority hire local audit firms instead
of one of the big 4 audit firms, it appears that this
aspect of corporate governance in Egypt still have to
improve. Nonetheless, performance of firms in Egypt
is not significantly affected by the audit function.
Control Variables
Four variables are uses as control variables in this
study, they are: firm size (size), industry type
(IndType), firm age (Age), and financial leverage
(Leverage). The results show that firm size (Size)
appears to have significant positive effect on ROE (β
= 2.825, p < 0.01) and ROA (β = 1.540, p < 0.05).
This result is consistent with previous studies
(Odegaard and Bohren, 2003; Klapper and Love,
2004, Arouri, 2011). However, Tobin’s Q is
negatively affected by firm size (β = -0.208, p < 0.01).
Meanwhile, the results show that financial leverage
(Levrage) appears to have significant negative effect
on ROA (β = -7.814, p < 0.05). The result is
consistent with prior literature (see for example,
Muttakin et al., 2012). On the other hand, firm age
has no significant on any of the three performance
variables.
Table 4. OLS regression results
*Statistically significant at the 0.10 level
** Statistically significant at the 0.05 level
*** Statistically significant at the 0.01 level
Model 3
(Dependent Variable ROA)
Model 2
(Dependent Variable ROE)
Model 1
(Dependent Variable Tobin
Q)
t-statistics Coeff. t-statistics Coeff. t-statistics Coeff. -1.047
3.132***
.955
.058
-.999
-.696
.159
-.592
.251
2.457**
-1.605
.532
-2.611**
-12.438
7.849
1.655
.015
-2.359
-1.282
.342
-1.125
.798
1.540
-2.752
.897
-7.814
2.624
0.006
0.296
0.183
2.070
-1.896*
2.425**
1.765*
-.148
-.292
-.846
.119
.223
.005
3.058***
-1.237
1.603
-1.145
-33.220
8.960
4.507
-.056
-1.018
-2.296
.378
.625
.022
2.825
-3.126
3.980
-5.053
1.876
0.051
0.231
0.108
2.070
3.457***
2.816***
1.650
.500
-1.231
-.117
-1.034
-1.266
1.216
-2.851***
.010
-.502
-.738
4.791
.823
4.791
.015
-.339
-.025
-.259
-.281
.451
-.208
.002
-.099
-.257
3.951
0.000
0.387
0.281
2.070
Const.
BIndp
Duality
BrdSize
Ac
AudType
IOwn
Down
OwnCon
Size
IndType
Age
Leverage
F-statistics
p-value for F- test
R-squared
adjusted R2
Max VIF

Corporate Ownership & Control / Volume 11, Issue 1, 2013, Continued - 7
702
6. Summary & Conclusion
This paper examines the effect of corporate
governance on both book and market value
performance in firms listed on the Egyptian stock
exchange. Though Egypt enacted a Code of Corporate
Governance for companies as far back as 2005;
companies listed in the Egyptian stock exchange are
operating under a voluntary CG reporting regime.
This results in a varying corporate governance
practices among companies in Egypt.
The importance of this paper is derived from the
fact that it extends the previous studies in corporate
governance by examining the effect of corporate
governance mechanisms on firm performance among
companies listed in the Egyptian Stock Exchange.
Good corporate governance is critical to the
investment activities in Egypt in a period of both
political and economical instability when the country
seeks to attract more investment particularly foreign
investment. Therefore, the results of the paper provide
valuable insight of the Egyptian market to those who
invest in the Egyptian Stock Exchange.
The results reveal that both the ownership
structure and audit function have no impact on the
performance of firms operating in Egypt. Meanwhile,
the only board structure variable that has an effect on
firms' market performance is board independence. On
the other hand, firms' book performance is affected by
both the board independence and CEO duality. Firm
size and leverage have varying effects on both market
and book performance of firms listed in Egypt.
Though the regulatory authorities in Egypt have
taken the necessary actions to have a strong financial
market, the Egyptian corporate governance code is not
as elaborate as corporate governance regimes in
western countries. While, the code can be said to
provide adequate coverage of the key disclosure
issues of relevance in a market with a nascent
disclosure culture, implementation is still patchy and
regulators are facing the challenge of ensuring
effective implementation of corporate governance,
especially in the areas of transparency, disclosure and
board practices.
Investors have an important role to play in the
continuing efforts to improve corporate governance
practices in Egypt. Shareholders in Egypt seem to be
considered as financial investors with only short-term
transient interest in the affairs of the company, rather
than owners who are investing for the long-term.
Shareholders are not exercising their ownership rights
and obligations in a professional and effective
manner. These include the rights of attending and
voting at AGM meetings, appointing directors and
approving their remuneration, approving the
appointment of company auditors and their fees,
being kept informed of the affairs and performance of
the company etc. Therefore, investors should play a
more active role in driving corporate governance
reform. Investors should integrate corporate
governance factors in their investment decision
process.
References 1. Adams, R, and Ferreira, D. (2007), "A theory of
friendly boards", Journal of Finance, Vol. 62 No. 1,
pp. 217–250.
2. Agrawal, A. and Knoeber, R. (1996), "Firm
performance and mechanisms to control agency
problems between managers and shareholders",
Journal of Financial Quantitative Analysis, Vol. 31
No. 3, pp. 377-398.
3. Ahunwan, B. (2002), "Corporate governance in
Nigeria", Journal of Business Ethics, Vol. 3, pp. 269-
287.
4. Alonso, P.A. and Gonzalez, E.V. (2006), ‘‘Corporate
governance in banking: the role of board of directors’’,
Working Paper 06/4, Department of Business
Economics, Universitat Autonoma de Barcelona,
Barcelona, June, available at: http://selene.uab.es/dep-
economia-empresa/documents/06-4.pdf (Accessed on
15/03/2013).
5. Andres, P. and Vallelado, E. (2008), “Corporate
governance in banking: The role of board of directors”,
Journal of Banking and Finance, Vol. 32 No.12, pp.
2570-2580.
6. Arouri, H., Hossain, M. and Muttakin, M. (2011),
“Ownership structure, corporate governance and bank
performance: evidence from GCC countries”,
Corporate Ownership and Control, Vol. 8 No. 4, pp.
365-372.
7. Bhagat, S. and Black, B. (2002), "The non-correlation
between board independence and long-term firm
performance, Journal of Corporation Law, Vol. 27, pp.
231-273.
8. Bahgat, S. and Bolton, B. (2008), "Corporate
governance and firm performance", Journal of
Corporate Finance, Vol. 14, pp. 257-273
9. Baliga, B., Moyer, R. and Rao, R. (1996), "CEO
duality and firm performance: What’s the fuss?",
Strategic Management Journal, Vol. 17 No.1, pp. 41-
53.
10. Baysinger, B. D., & Butler, H. N. (1985). “Corporate
governance and the board of directors: Performance
effects of changes in board composition”, Journal of
Law, Economics, & Organization, Vol. 1 No. 1, pp.
101-124
11. Beck, P. and Zorn, T. (1982), "Managerial incentives
in a stock market economy", Journal of Finance, Vol.
37, pp. 1151-1167.
12. Beck, T., Demirgüç-Kunt, A., and Levine, R. (2003),
"Law and finance: why does legal origin matter?",
Journal of Comparative Economics, Vol. 31 No.4, pp.
653–675.
13. Blue Ribbon Committee (BRC) (1999), Report and
Recommendations of the Blue Ribbon Committee on
Improving the Effectiveness of Corporate Audit
Committees, New York Stock Exchange, New York,
NY.
14. Brickley, J., Coles, J. and Jarrell, G. (1997),
"Leadership structure: Separating the CEO and
chairman of the board", Journal of Corporate Finance,
Vol. 3, pp. 189-220.
15. Burkart, M. (1995), "Initial shareholdings and
overbidding in takeover contests", Journal of Finance,
Vol. 50, pp. 1491-1515

Corporate Ownership & Control / Volume 11, Issue 1, 2013, Continued - 7
703
16. Byrne, J. (1996), "The best and worst Boards: Our
special report on corporate governance", Business
Week, November 25, pp. 82-120.
17. Byrne, J. and Brown, L. (1997), "The best and worst
boards: Our special report on corporate governance",
Business Week, December 8, pp. 90-104.
18. Cadbury Committee (1992), Report of the Committee
on the Financial Aspects of Corporate Governance,
Gee Publishing, London.
19. Carline, N., Linn, S. and Yadav, P (2002), "The
influence of managerial ownership on real gains in
corporate mergers and market regulation of merger
partners: empirical evidence, EFA Berlin Meetings
Discussion Paper, Available at SSRN:
http://ssrn.com/abstract=302606 (Accessed on
15/12/2012)
20. Chang, S. (2003), "Ownership structure, expropriation,
and performance of group-affiliated companies in
Korea", Academy of Management Journal, Vol. 46 No.
2, pp. 238-253.
21. Charkham, J. (1994), Keeping Good Company: A study
of Corporate Governance in Five Countries, Oxford
Press, Oxford, UK.
22. Chen, K., Chen Z, Wei K (2009), "Legal protection of
investors, corporate governance, and the cost of equity
capital", Journal of Corporate Finance, Vol. 12, pp.
424-448.
23. Chen, Y., Moroney, R., and Houghton, K. (2005).
"Audit committee composition and the use of an
industry specialist audit firm", Accounting & Finance,
Vol. 45 No. 2, pp. 217-239.
24. Cheng. (2008), "Board size and the variability of
corporate performance", Journal of Financial
Economics, Vol. 87, pp. 157–176.
25. Cho, M. (1998), "Ownership structure, investment, and
the corporate value: An empirical analysis", Journal of
Financial Economics, Vol. 47, pp.103-121.
26. Chung, K.H. and S.W. Pruitt, (1994), "A simple
approximation of Tobin’s Q", Financial Management,
Autumn, pp. 70-74.
27. Claessens, S., Djankov, S. and Lang, L.H.P. (2000),
"The separation of ownership and control in East Asian
corporations’’, Journal of Financial Economics, Vol.
58, Nos 1/2, pp. 81-112.
28. Claessens, S. and Fan, J. (2002), ‘‘Corporate
governance in Asia: A survey’’, International Review
of Finance, Vol. 3 No. 2, pp. 71-103.
29. Cohen, J. and Hanno, D. (2000), "Auditors’
consideration of corporate governance and
management control philosophy in preplanning and
planning judgments", Auditing: A Journal of Practice
and Theory, Vol. 19 Fall, pp. 133–46.
30. Cole, R., and Mehran, H. (1998), "The effect of
changes in ownership structure on performance:
evidence from the thrift industry", Journal of Financial
Economics, Vol. 50, pp. 291-317.
31. Coles, J., & Hesterly, W. (2000), "Independence of the
chairman and board composition: Firm choices and
shareholder value", Journal of Management, Vol. 26
No. 2, pp. 195-214.
32. Collin, S., Smith, E., Umans, T., Broberg, P. and
Tagesson, T. (2013) "Mechanisms of corporate
governance going international: Testing its
performance effects in the Swedish economy, 2004",
Baltic Journal of Management, Vol. 8 No.: 1, pp.79-
101.
33. Committee of Sponsoring Organizations of the
Treadway Commission (COSO) (1992), Internal
Control-Integrated Framework, AICPA, Jersey City,
NJ.
34. Dalton, D., Daily, C., Ellstrand, A. and Johnson, J.
(1998), "Meta-analytic reviews of board composition,
leadership structure, and performance", Strategic
Management Journal, Vol. 19, pp. 269–290.
35. Davis, J., Schoorman, F. and Donaldson, L. (1997),
"Towards a Stewardship Theory of Management",
Academy of Management Review, Vol. 22, pp. 20–47.
36. De Andres, P., Azofra, V., & Lopez, F. (2005).
"Corporate boards in OECD countries: Size,
composition, functioning and effectiveness",
Corporate Governance: An International Review, Vol.
13 No. 2, pp. 197-210.
37. Demirag, I. (1998), "Short termism, financial systems,
and corporate governance", In Corporate Governance,
Accountability, and Pressures to Perform: An
International Study, JAI Press, pp. 7-24.
38. Demsetz, H. (1983), "The structure of ownership and
the theory of the firm", Journal of Law and Economics,
Vol. 26, pp. 301-325.
39. Demsetz, H., and Lehn, K. (1985), "The structure of
corporate ownership: causes and consequences",
Journal of Political Economy, Vol. 93, pp. 1155-1177.
40. Denis, D. and Denis, D., (1994), "Majority owner-
managers and organizational efficiency", Journal of
Corporate Finance, Vol. 1, pp. 91-118.
41. Denis, D. (2001), "Twenty –five years of corporate
governance research ….and counting", Review of
Financial Economics, Vol. 10, pp. 191-212.
42. Denis, D., and McConnell, J. (2003), "International
corporate governance", ECGI Working Paper Series in
Finance, No. 05/2003.
43. Donaldson, L. (1990), "the ethereal hand:
Organizational economics and management theory",
Academy of Management Review, Vol. 15, pp. 369-
381.
44. Dulewicz, V. and Herbert, P. (2004), ‘‘Does the
composition and practice of boards of directors bear
any relationship to the performance of their
companies?’’, Corporate Governance: An
International Review, Vol. 12 No. 3, pp. 263-80.
45. Ehikioya, B. (2009), "Corporate governance structure
and firm performance in developing economies:
Evidence from Nigeria", Corporate Governance, Vol.
9 No. 3, pp. 231-243.
46. Eisenberg, T., Sundgren, S. and Wells, M. (1998),
"Large board size and decreasing firm value in small
firms", Journal of Financial Economics, Vol. 48, pp.
35-54.
47. Elsayed, K. (2007), “Does CEO duality really affect
corporate performance?”, Corporate Governance: An
International Review, Vol. 15 No. 6, pp. 1203-1214.
48. Faccio, M., Lang, L. and Young, L. (2001). "Dividends
and expropriation", American Economic Review, Vol.
91, pp. 54–78.
49. Fama, E., (1980), "Agency problems and the theory of
the firm", Journal of Political Economy, Vol. 88, pp.
288-307.
50. Farinha, J. (2003), "Corporate governance: a survey of
the literature", Universidade do Porto Economia
Discussion Paper, No. 11.
51. Finkelstein, S. and Hambrick, D. (1996), Strategic
Leadership, West, St. Paul, Minneapolis, MN.
Corporate Ownership & Control / Volume 11, Issue 1, 2013, Continued - 7
704
52. Ginglinger, E., & L'her, J. (2006), "Ownership
structure and open market stock repurchases in
France", The European Journal of Finance, Vol. 12
No. 1, pp. 77-94.
53. Greenbury, R. (1995), Directors’ Remunerations:
Report of the Study Group, Chaired by Sir Richard
Greenbury, Gee Publishing, London.
54. Hampel Report (1998), Committee on Corporate
Governance, Final Report of Committee, Gee
Publishing, London.
55. Hermalin, B., and Weisbach, M. (1991), "The effects
of board composition and direct incentives on firm
performance", Financial Management, Vol. 20, pp.
101-112.
56. Hofstede, G. (2001), Culture's Consequences:
Comparing Values, Behaviors, Institutions, and
Organizations Across Nations, Sage Publications:
Thousand Oaks, California.
57. Holderness, C., and Sheehan, D. (1988), "The role of
majority shareholders in publicly held corporations",
Journal of Financial Economics, Vol. 20, pp. 317-346.
58. Huson, M. (2001), "Internal monitoring and CEO
turnover: A long-term perspective", Journal of
Finance, Vol. 56 No. 6, pp. 2265-2297.
59. Jensen, M., (1993), "The modem industrial revolution,
exit and the failure of internal control systems",
Journal of Finance, Vol. 48, pp. 831-880.
60. Jensen, M., and Meckling, W. (1976), "Theory of the
firm: managerial behaviour, agency costs and
ownership structure", Journal of Financial Economics,
Vol. 3, pp. 305-360.
61. Kane, G. D., & Velury, U. (2004). "The role of
institutional ownership in the market for auditing
services: an empirical investigation", Journal of
Business Research, Vol. 57 No. 9, pp. 976-983.
62. Kaplan, S. (1989), "The effects of management
buyouts on operating performance and value", Journal
of Financial Economics, Vol. 24, pp. 217-254.
63. Klapper, L.F. and Love, I. (2004), “Corporate
governance, investor protection, and performance in
emerging markets”, Journal of Corporate Finance,
Vol. 10 No. 5, pp. 703-28.
64. Klein, A. (2002), "Audit committee, board of director
characteristics, and earnings management", Journal of
Accounting and Economics, Vol. 33 No. 3, pp. 375-
400.
65. Kochar, R. and David, P. (1996), "Institutional
investors and firm innovation: a test of competing
hypotheses", Strategic Management Journal, Vol. 17,
pp. 73-84.
66. Krivogorsky, V. (2006), "Ownership, board structure,
and performance in Continental Europe", The
International Journal of Accounting, Vol. 41 No. 2, pp.
176-197.
67. Kuada, J. and H. Gullestrup (1998), Culture Context of
Corporate Governance, In Corporate Governance,
Accountability, and Pressures to Perform: An
International Study, JAI Press, pp. 25-56.
68. Kumar, N., & Singh, J. (2013). "Effect of board size
and promoter ownership on firm value: some empirical
findings from India", Corporate Governance, Vol. 13
No. 1, pp. 88-98.
69. La Porta, R., Lopez-de-Silanes, F. Shleifer, A. and
Vishny, R (1998), "Law and Finance", Journal of
Political Economy, Vol. 106, pp. 1113-1155.
70. La Porta, R., Lopez-de-Silanes, F. and Shleifer, A.
(1999) , "Corporate ownership around the world", The
Journal of Finance, Vol. 54, pp. 471-517.
71. Laing, D. and Weir, C. (1999), "Governance structures,
size and corporate performance in UK firms",
Management Decision, Vol. 37 No. 5, pp. 457-467.
72. Lam, T. Y., & Lee, S. K. (2012), "Family ownership,
board committees and firm performance: evidence
from Hong Kong". Corporate Governance, Vol. 12
No. 3, pp. 353-2366.
73. Lemmon, M., & Lins, K. (2003), "Ownership structure,
corporate governance, and firm value: Evidence from
the East Asian Financial crisis", Journal of Finance,
Vol. 58, pp. 1445-1468.
74. Levitt, A. (1999), "Levitt plays up shareholder rights to
directors", Investor Relations Business,
75. April 12, p 2.
76. Lins, K. (2003), "Equity ownership and firm value in
emerging markets", Journal of Financial and
77. Quantitative Analysis, Vol. 38 No. 1, pp. 159-184.
78. Loderer, C., and Martin, K. (1997), "Executive stock
ownership and performance: tracking faint traces",
Journal of Financial Economics, Vol. 45, pp. 223-255.
79. Loderer, C., and Sheehan, D. (1989), "Corporate
bankruptcy and managers' self- serving behavior",
Journal of Finance, Vol. 44, pp. 1059-1075.
80. Macus, M. (2008), “Board capability: An interactions
perspective on boards of directors and firm
performance”, International Studies of Management &
Organization, Vol. 38 No. 3, pp. 98-116.
81. Mak, Y. & Yuanto, K. (2003), Board Size Really
Matters: Further Evidence on the Negative
Relationship Between Board Size and Firm Value,
Pulses by Singapore Stock Exchange
82. McConnell, J., and Servaes, H. (1990), "Additional
evidence on equity ownership and corporate value",
Journal of Financial Economics, Vol. 27, pp. 595-612.
83. Morck, R., Shleifer, A. and Vishny, R. (1988),
"Managerial ownership and market valuation", Journal
of Financial Economics, Vol. 20, pp. 293-315.
84. Muttakin, M. Khan, A. and Subramaniam, N. (2012),
“Board structure and firm performance: evidence from
an emerging economy”, Academy of Taiwan Business
Management Review, Vol. 8 No. 2, pp. 97-108.
85. National Commission on Fraudulent Financial
Reporting (NCFFR) (1987), Report of the National
Commission on Fraudulent Financial Reporting,
AICPA New York.
86. North, D. (1990), Institutions, Institutional Change and
Economic Performance, Cambridge University Press,
Cambridge.
87. O’Connell, V., and Cramer, N. (2010). “The
relationship between firm performance and board
characteristics in Ireland”, European Management
Journal, Vol. 28 No. 5, pp. 387-399.
88. Pathirawasam, C., & Wickremasinghe, G. (2012),
“Ownership concentration and financial performance:
The case of Sri Lankan listed companies”, Corporate
Ownership and Control, Vol. 8 No. 4, pp. 170-177.
89. Porter, B., Simon, J. and Hatherly, D. (2008),
Principles of External Auditing, Wiley, Chichester.
90. Public Oversight Board (POB) (1993), Issues
Confronting the Accounting Profession, POB
Stamford, CT:.
91. Rabelo, F. and Vasconcelos, F. (2002), "Corporate
governance in Brazil", Journal of Business Ethics, Vol.
3, pp. 321-335.

Corporate Ownership & Control / Volume 11, Issue 1, 2013, Continued - 7
705
92. Ramsay, I. (2001), Ramsay Report: Independence of
Australian Company Auditors: Review of Current
Australian Requirements and Proposals for Reform,
available at http//www.treasury.gov.au (Accessed on
15/12/2012)
93. Rechner, P and Dalton, D. (1989). ‘The impact of CEO
as board chairperson on corporate performance:
Evidence vs. rhetoric’, Academy of Management
Executive, Vol. 3, pp. 141–143.
94. Rechner, P. and Dalton, D. (1991). ‘CEO duality and
organizational performance: A longitudinal analysis’,
Strategic Management Journal, Vol. 12 No. 2, pp.
155–160.
95. Rediker, K., and Seth, A. (1995), "Board of directors
and substitution effects of alternative governance
mechanisms", Strategic Management Journal, Vol. 16,
pp. 85-99.
96. Rosenstein, S. and Wyatt, J. (1990), "Outside directors,
board effectiveness and shareholders wealth", Journal
of Financial Economics, Vol. 26, pp. 175-191.
97. Sundaramurthy, C., Mahoney, J., and Mahoney, J.
(1997), "Board structure, anti-takeover provisions, and
stockholder wealth", Strategic Management Journal.
Vol. 18 No. 3, pp. 231-245.
98. Shleifer, A., and Vishny, R. (1986), Large
Shareholders and Corporate Control, Journal of
Political Economy, Vol. 94, pp. 461-488.
99. Shleifer, A., and Vishny, R. (1997), A Survey of
Corporate Governance, Journal of Finance 52, pp 737-
783.
100. Singh, M. and Davidson,W. (2003), "Agency costs,
ownership structures and corporate governance
mechanisms". Journal of Banking and Finance, Vol.
27, pp. 793–816.
101. Smith, A. (1990), "Corporate ownership structure and
performance: The case of management buyouts",
Journal of Financial Economics, Vol. 27, pp. 143-164
102. Subrahrnanyam, V., Rangan, N. and Rosenstein, S.
(1997), "The role of outside directors in bank
acquisitions", Financial Management, Vol. 26, pp. 23-
36.
103. Sung Wook, J. (2003), "Corporate governance and firm
profitability: Evidence from Korea before the
economic crisis", Journal of Financial Economics,
Vol. 68. No. 2, pp. 287-322.
104. Thomsen, S. and Pedersen, T. (1995), "European
models of corporate governance", Working Paper, WP
4-95, Copenhagen Business School, Institute of
International Economics and Management, Denemark.
105. Tsamenyi, T., Enninful-Adu, E and Onumah, J. (2007),
"Disclosure and corporate governance in developing
countries: Evidence from Ghana", Managerial
Auditing Journal, Vol. 22 No. 3, pp. 319-334.
106. UNCTAD (2007), Review of the Implementation Status
of Corporate Governance Disclosures: Case Study
Egypt, Report TD/B/COM.2/ISAR/CRP.7 by the
UNCTAD secretariat available at UNCTAD.org
107. Vafeas, N. , and Theodorou, E. (1998), "The
relationship between board structure and firm
performance in the UK", British Accounting Review,
Vol. 30, pp. 383-407.
108. Vinten, G. (1998), "Corporate governance: An
international state of the art", Managerial Auditing,
Vol. 13 No. 7, pp. 419-431.
109. Weisbach, M. (1988), "Outside directors and CEO
turnover", Journal of Financial Economics, Vol. 20,
pp. 431–460.
110. Wier, C. & Laing, D. (2001), "Governance structures,
director independence and corporate performance in
the UK", European Business Review, Vol. 13 No. 2,
pp. 86-94.
111. William, Q., Naoumova I. & Koutzevol, N. (2003),
"Corporate governance and firm performance in
Russia: An empirical study", Journal of World
Business, Vol. 38, pp. 385–396.
112. Yermack, D. (1996), "Higher market valuation for
firms with a small board of directors", Journal of
Financial Economics, Vol. 40, pp. 185-211.

Corporate Ownership & Control / Volume 11, Issue 1, 2013, Continued - 7
706
GOVERNANCE OF STAKEHOLDER’S FINANCIAL RELATIONSHIPS: EVIDENCE FOM UKRAINIAN BANKING
SECTOR
Maryna Brychko*
Abstract
This paper makes two related contributions to corporate finance theory and stakeholder theory. First, the author intend to examine relationship between sustainability of stakeholders’ financial relations and efficiency of corporate governance, taking into account lagging of decision-making corporate governance in banks to it financial performance. Second, the author seeks to prioritize stakeholders’ financial relations of the emerging stakeholder model of corporate governance at banks by analyzing two relevant dimensions of this model: contribution valued resources to the bank and power that the stakeholders have within the bank. The findings confirm that efficiency of bank management in the system of stakeholder’s financial relationships in absolute efficiency of corporate governance achieved solely through sustainable financial relations of “principal-agent” (where principals are individuals and agent is apparatus of corporate governance). The results show that the role of individuals as sub-agents, enterprises as principals and sub-agents, shareholders as principals formed negative effect. Keywords: Financial Relations, Stakeholders, Corporate Finance, Corporate Governance, Corporate Efficiency, Bank Management Ukrainian Academy of Banking of the National Bank of Ukraine, Department of Finance, Petropavlivska Str., 57, 40000, Sumy,
Ukraine, Tel. +380542665027 E-mail: [email protected]
1. Introduction
Preliminary analysis of economic theory formed an
idea of causal relationships between stakeholders’
financial relations of the bank and corporate
governance as a part of the bank management at a
qualitative level. Mathematical modeling is widely
used in various fields of knowledge: mechanics,
physics, medicine, biology, chemistry, economy. There
are determinist and stochastic modeling. If in quantities
analyzed by deterministic models their stability is
expected and random deviations are omitted attributing
them only on observations and measurements errors,
then random character of variables estimated by
probable methods is based in stochastic models. Here
the task is to find trends that occur in random
efficiency deviations of commercial banks.
Deterministic models describe patterns that
appear in the separate bank of Ukrainian banking
system. Such regularities inherent strong mechanical
causality that specifically defines the behavior of each
bank. It was called dynamic pattern or pattern with
solid determination. In dynamic patterns the
relationship between cause and effect can be expressed
quite accurately in specific mathematical formulas.
Here, each set of values of the explanatory variables
always corresponds to definite values of explanatory
variable. This relationship is called functional.
Deterministic model is the expression of functional
relationships.
In the centralized planned economy were widely
used deterministic models. The result was known in
advance and the theory was intended for it justification.
Mainly balance or optimization models were used:
interbranch balance and linear programming.
Under conditions of market economy the result of
the bank management is unknown beforehand and it is
impossible considering the randomness. Economic
phenomena and processes are the result of many
simultaneously and collectively acted reasons. When
considering the relationships between them the main
reasons that necessarily lead to this outcome should be
distinguished from secondary. Last reasons impede and
distort significant effect in this respect of reasons.
Moreover, the reasons may have unpredictable
character. For example, in banking daily cash flows are
formed influenced by certain patterns (scheduled
payments), as well as unnecessary and sometimes
unforeseen financial relationship of bank stakeholders,
which ensure costs and revenues, receipts or payments.
Thus, economic processes have probable nature and the
development of the investigated object is determined
by the total impact of patterns and randomness.
To separate the essential factors acting on the
bank from the minor and accidental factors,
observations should be repeated and massive. Patterns
that revealed under mass observations are called
statistical observations. Statistical patterns are also
reason-conditioned as dynamic one, but it can be
caused by a set of reasons and they are mutually

Corporate Ownership & Control / Volume 11, Issue 1, 2013, Continued - 7
707
connected and act in different ways [2]. The probability
of obtaining the particular result is zero. In such
situations it is possible to define only an interval in
which the value of studied parameters with
predetermined probability falls. Detecting statistical
patterns, determining interval estimates of unknown
parameters and test of different hypotheses are made
by methods of mathematical statistics.
Stochastic models describe patterns which are
caused by the simultaneous action into the object of
many factors which appear clearly only in mass
observations. To the most common methods for
building stochastic models we can include methods
grouped under the general title - multivariate statistical
analysis, in particular - correlative and regression
analyzes. Detection of quantitative relations in the form
of regression enables a better understanding of the
nature of the phenomenon. This allows influencing the
identified factors, interfering in the proper economic
process in order to obtain the desired results.
Classical regression analysis describes the
economic processes by means of a single regression
equation. This equation is not functional, but
stochastic. In this equitation to each set of explanatory
variables may correspond several values of explanatory
variables simultaneously. The equation should contain
only significant explanatory variables. Uncontrolled or
unmeasured factors, as well as errors of measurement
are included in the random term (random variation). It
is assumed that the explanatory variables are not
random and are not correlated with each other and the
random component has a diagonal variance- covariance
matrix with equal diagonal elements.
Often in order to describe economic processes
with a single regression equation is not enough through
many causes and effects. For a more adequate
reflection of real relations in economic processes it is
necessary to use a system of regression equations.
Applications of based tests for testing the hypothesis of
the form variance-covariance matrix of the random
deviations showed that the calculated values of random
member of regression in many cases (especially in the
analysis of time series) reject the basic assumptions of
the classical regression analysis. The idea of the
relationship between economic variables and
assumptions about the general form of variance-
covariance matrix of random has led to the creation of
a new type of stochastic models that became known as
econometric [3].
Thus, we propose to use the linear model
considering decisions of corporate governance in value
added growth based on creating bank stakeholders
financial relations that allows determining and
estimating the importance of financial relationships of
key stakeholder groups that can affect the success of
the management of the banks in the system of financial
relations [4]. The current model also allows
considering the influence of hard managed factors of
direct impact on the primary (easily managed) financial
stakeholder relations, thus, determining the probability
that the role of financial relations of different groups of
stakeholders do not coincide and, therefore, has a
negative impact.
2. Data and empirical definitions
Let’s consider the work of N banks over the period of T
years. We have vector хij, consisting of (m +1) factors
that affect the work of i-th bank for j-th year. Bank’
management performance in the system of financial
relationships of their stakeholders is expressed by the
corporate governance effectiveness; n banks for a
period of T years we denote by the matrix F, whose
values φij responsible for bank i-th and j- th year.
Values φi are range from one to infinity, reflecting the
approach of each bank to the efficiency limit. In this
case, we consider that the best option when the value of
the corporate governance effectiveness is equal to one.
Hence, it is necessary to find such set of vectors хij, that
all values φij = 1, where i = 1.. N and j = 1..T. Progress
in solving this problem will consist of two sub-tasks:
1) building a model that will show the connection
between parameter vector хij, and values of φij matrix
F;
2) finding of the optimal values of some
parameters хij, to perform condition all φij = 1
To determine the view of the model it is
necessary to analyze certain statistical information. The
simplest is linear parametric model. In economics there
are many examples of such models (Leontiev model,
Solow model). To find the unknown parameters of the
linear model the method of least squares (MLS) is used
[1]. The quality of the model will be measured by the
coefficient of determination (R²). For example, let’s
consider bank performance for j-th year. Then the
regression equation will be following

Corporate Ownership & Control / Volume 11, Issue 1, 2013, Continued - 7
708
uaXy
.
nj
j
j
y
2
1
,
nu
u
u
u
2
1
,
ma
a
a
a
1
0
,
nmjjnjn
mjjj
mjjj
xxx
xxx
xxx
X
...
........................
...
...
10
22120
11110
,
(1)
Where,
φij – value of the integral indicator of corporate governance effectiveness for i-th bank and j-th year;
uі – random component of the model;
аі – measured parameters of the model;
хij – factors of influence that expressed by stakeholders financial relationships of i-th bank for j-th year.
It is assumed that in linear regression models
random observations should be such that the number of
degrees of freedom l = n – m – 1 is greater than 0, and
the matrix X
has full column rank m + 1. In this
case the transposed matrix rank is also equal to m + 1,
and the symmetric matrix of dimension (m + 1) x (m +
1) has a rank equal to m + 1, and hence, there is an
inverse matrix 1
XX
.
It may be noted that the system of linear
equations (1) which are determined by MLS-estimator
, can be written as
yXaXX
(2)
where, we find a column vector of unknown MLS-estimators. We have
yXXXa
1
(3)
So, vector estimation aˆ we can determine using formula (3).
The following equations (4-8) characterize vector estimation aˆ
uXXXaa
1
(4)
aaM
)(
(5)
12)(
XXaD u
(6)
12)(
XXaD u
(7)
1
2
mn
uuu
, aXyu
.
(8)
Equation (4) shows that the MLS–estimators
maaa ˆ...,,ˆ,ˆ10 are linear for perturbations and,
therefore, have the same distribution law as the
perturbation. Assuming that the disturbances are
normally distributed, the mentioned quality allows us
to build confidence intervals for the regression
coefficients.
From the equation (5) implies fixity of MLS –
estimation aˆ . It can be shown that the MLS –
estimation aˆ is also effective and reasonable.
Estimation efficiency means that of all possible linear
fixed estimates, estimates maaa ˆ...,,ˆ,ˆ10 have
minimum dispersions which are equal to the

Corporate Ownership & Control / Volume 11, Issue 1, 2013, Continued - 7
709
corresponding diagonal elements of the covariance
matrix
(6). The validity of estimation aˆ means that
covariance matrix
attached to n is reduced to zero
matrixes. If according to the formula (8) we have
estimation 2ˆu disturbances dispersions
2
u , then, the
estimated covariance matrix can be calculated
according to the formula (7).
As noted above, the quality of the regression
model we will characterize by the coefficient of
determination, which in case of linear regression is
indicated R². The meaning of determination coefficient
is given by the formula 9.
2
22 1
yy
uR
i
i
(9)
According to the formula (9) is defined as a
unit minus the quotient of the sum of squared errors on
the sum of squared deviations from the sample average.
It is known that the coefficient of determination ranges
from zero to one (0 2R 1).
Also, we can say that the value (in percent)
means that the linear model (1) explains % of the
total regression dispersion, the rest (1 - ) are not
specified in percentage by linear model. From the
formula (4) implies the following: minimizing error
function by the method of least squares is equivalent to
maximizing of determination coefficient . The
closer ceteris paribus value to 1, the better the
estimated regression equation and thus, better quality
of the obtained model.
The need to consider lags occurs while modeling
many dynamic processes. Therefore, we believe it is
necessary to take into account the lags in banking in
the system of financial relations, including lagging of
corporate governance in banks. In general, if some
variable appears in the model with the delay for s
periods, then it is called lag and is written with
subscript st and has a lag of length s.
During model building we define three types of
lagged variables:
1. Lagged independent variable. The value of
explanatory variables хij and хi(j-1) are closely correlated
because they represent the same set of observations
with a lag in one period. Therefore, in models with
lagged independent variables there is a phenomenon of
multicollinearity.
2. Lagged dependent variable. In such situations,
the variable φij is both explicable and explanatory.
Thus, explanatory variable φij is stochastic.
3. Lagged residual variable. If there is
dependence between values, the model has
autocorrelation.
The next step will be the specification of the
model. Let’s consider the statistics over 6 years (2007-
2012) for 50 banks which represent about 63% of the
entire banking system. Banks were chosen due to
limited information for analysis, however, the banks
included in the sample under control both foreign and
domestic capital and includes state-owned banks. For
each bank we have 12 performance indicators (11
factors that characterize financial relationship of bank
stakeholders and influence on the bank management,
whilst the integral indicator of the corporate
governance effectiveness, which characterizes the
efficiency of banks activities in the system of financial
relations of their stakeholders).
Primary and secondary factors that are considered
easily and hard managed characterize stakeholders’
financial relationship of bank on the formation of own
or borrowed capital and also, financial relationships
connected with the process of distribution and
redistribution of financial resources in order to increase
the value added of the bank are shown in Appendix A.
In order to build the model between factors хij and
efficiency of corporate governance φij for some j-th
year we consider general linear model (10) and 5
different types of linear models with lagged variables
(10-15). The first model in the general form as follows:
j j jy X a
(10)
This is a linear model that ignores the effects of
the previous years for the value of the commercial
banks performance management. It is the simplest and
therefore, not always well describes the statistical
information.
The second model considering the lagged
variables
is as follows
where βj – a coefficient for j-th year.
For this model a lag of dependent variable yj-1 is
typical. Lagged variable yj-1 means that the result of the
effectiveness of bank management is expressed by the
efficiency of corporate governance of the bank this
year depends on its effectiveness in the previous year.
1j j j j jy X a y
(11)

Corporate Ownership & Control / Volume 11, Issue 1, 2013, Continued - 7
710
If βj = 0, it means that the value for the previous year
does not impact on the effectiveness of corporate
governance of the bank this year, and equality βj = 1
indicates a high effect of prior to the next.
The third model is represented by equation 12 and
considering the lagged dependent variables for two
periods
2
1 2j j j j j j jy X a y y
(12)
In this model the length of a lag for the dependent
variable is two, and the coefficient is chosen as βj2.
This choice is explained by a decrease in the impact
factor with increasing lag length, i.e., the dependence
of the efficiency of the bank corporate governance for a
year from value for 2 years ago is less than 1 year ago.
The fourth model considering the lagged
independent variable is as follows:
1j j j j jy X a X
(13)
where αj – a coefficient for j-th year.
This model has lagged independent variable Xj-1.
This means that the model has dependence on the
values of the factors for the previous year. Moreover,
the coefficient αj must belong to the range 0 <αj <1.
This coefficient shows the dependence power of banks
corporate governance on the values of the factors for
the previous period. If αj = 0, it means that the factors
mentioned in the previous period have no significant
effect on the effectiveness of the bank corporate
governance and the equality αj = 1 indicates its high
impact.
The fifth model is shown in equation 14.
1 1j j j j j j jy X a X y
(14)
For this model lags of independent variable Xj-1,
as well as dependent yj-1.one is typical.
The sixth model is represented by the following
equation:
2
1 1 2j j j j j j j j jy X a X y y
(15)
This model is the most complex and takes into
account the largest number of lagged variables, namely
the lagged independent variable Xj-1, lagged dependent
variables yj-1, yj-2. This means that the factors
mentioned in the previous period, the result of effective
management of banks expressed by the efficiency of
the bank corporate governance for the previous two
periods influence the effectiveness of the bank
corporate governance this year.
All the models mentioned above can describe the
situation that will be solved in the process. But for
every year we’ll choose a suitable model that would
have the best quality. It is necessary for the further
study of the banking sector. To optimize banking it is
necessary to find the managing factor, namely, the
financial relationships that have the greatest impact on
value added growth of the bank and subjected to the
management of the agent, and setting the value to
which we could increase the effectiveness of bank
management in the system of stakeholders’ financial
relations.
3. Empirical results
Let’s estimate the unknown parameters aj for each j-th
year in all three linear models using matrix MNK (3),
moreover we choose coefficients in the range of
0<αj, βj<1 by sorting them in this range. The best
model for each year will be considered the one that has
the highest quality, namely, the highest value of the
determination coefficient (9). As the present model has
lagged variables, using statistics for 6 years we will
estimate the unknown coefficients of the model only
for the last 5 years.
Table 2. Values of the determination coefficient ( %) for the period of 2008-2012 in accordance with the six
selected models of evaluation
2008 р. 2009 р. 2010 р. 2011 р. 2012 р.
1 model 20% 39% 28% 47% 47%
2 model 20% 50% 39% 47% 71%
3 model - 48% 32% 47% 71%
4 model 39% 45% 56% 72% 90%
5 model 89% 58% 66% 65% 89%
6 model - 66% 59% 72% 90%
According to the data in Table 2 the optimal
model for 2008 is the fifth model as the coefficient is
close to one, and in percentage is equal to 89 %. This
means that in 2008 the effectiveness of the bank
corporate governance is characterized by 89%
constancy financial relations of the bank stakeholders
and only 11% by other factors which include directly
external institutional factors and factors of institutional

Corporate Ownership & Control / Volume 11, Issue 1, 2013, Continued - 7
711
influence. For 2009 we determine the sixth model as
optimal one and the fifth model - for 2010; the
coefficient of determination ( %) herewith is
amounted to 66%. This effect we consider essential
because during the period of 2009-2010 the impact of
external factors and sustainability of financial relations
with public authorities, other financial and credit
institutions at the national and international level
become increasingly important at the stage of
economic crisis period.
Thus, the impact of these financial relations of
indirect effect explains the effectiveness of bank
management in the system of financial relationships of
their stakeholders in 2009 and 2010 by 44%. For 2011
and 2012 according to the coefficient of determination
( = 72% in 2011 and = 90% in 2012) the
fourth model is optimal. It should be noted that since
2010 the coefficient of determination increases
indicating the growing importance of sustainability
development of financial relationships with the
stakeholders of direct influence in the post-crisis
period. We can assume that exactly sustainability of
financial relationships with stakeholders of direct
influence provide banks' willingness to critical
fluctuations in the economy and allows to avoid
reinforcing negative impact of the economic crisis,
which is characterized by more complex financial
relationships that provide banks by financial resources
and assist banks in the post-crisis reincarnation.
Choice of the appropriate model has economic
justification. Thus, the effectiveness of management
decisions of the agent (the system of corporate
governance) will implement only after a long period of
time due to the objective process of long-term creating
of added value, moreover, considering the gradual
development of the economy in 2008, the very
meaning of the efficiency of previous decisions of
corporate governance and the quality of the existing
financial relations in previous years determine the
effectiveness of bank management in the system of
financial relationships of their stakeholders.
Choosing the sixth model in 2009, which includes
the effect of the established in the bank financial
relations both - this period and prior periods, as well as
the effectiveness of corporate governance last year and
two years ago. This model has the largest number of
lagged variables that are dependent and independent
variables because of the attention in the peak of crisis
period. The global financial crisis in 2009 has made
adjustments in the development of each bank of the
entire banking system in Ukraine and therefore, stable
effectiveness of bank management in the previous
periods (2007-2008) or its irregularity, negligence in
financial relations between the agent and principals that
form the loan and equity bank capital, ignoring the
constant relations of first level agents and subagents in
the analyzed period and last year made impact on the
efficiency of bank management. In the following years
the number of lagged variables will decrease since the
post-crisis period reflects the beginning of the new
stage of the banking system development.
First of all, it should be noted that the results and
expectations of past pre-crisis period cannot act as a
forecast basis or influence the bank management, as
banks begin to operate in the new reality, changing
relationships between stakeholders. Thus, to 2010
corresponds the fifth model that takes into account the
interactions of bank stakeholders and the results of the
bank efficiency of its activities during the crisis period.
The fourth model using in 2011-2012 is treated in the
need to build effective bank management exclusively
on providing a stable sustainability of financial
relationships of the bank stakeholders, thereby,
considering their peculiarities of the previous year.
Thus, the system of equations is as follows:
1 1
2
1 1 2
1 1
1
1
j j j j j j j
j j j j j j j j j
j j j j j j j
j j j j j
j j j j j
y X a X y
y X a X y y
y X a X y
y X a X
y X a X
(12)
We have built models and we face the problem of
selecting such values of the factors x2, x3, x7, x8 and x9,
which reflect financial relationships of the bank
stakeholders in order to all values φij be equal to 1,
where i = 1 .. n and j = 1 .. T. For this purpose all
models received for 5 years we combine in the system
of equations and solve it according to our relatively
unknown factors x2, x3, x7, x8 та x9, which will be
expressed through other factors x1, x4, x5, x6, x10 and x11.
Factors x2, x3, x7, x8 and x9, are basic and show
financial relationship of the bank stakeholders that
provide the greatest impact on value added growth of
the bank; they are managed factors, i.e. such
relationships are subjected to regulation and are under
the direct control of the bank management. Six other
parameters are free, i.e. their values, hypothetically,
could be any of this kind. These parameters are more
difficult to control and therefore, hypothetically, in this
problem their value can be any of this kind. Each bank
is trying to have the absolute efficiency with zero
reserve, which indicates that this bank is on the edge of
efficiency and can serve as a model for a certain bank.
For banks with absolute efficiency the reserve of
governance efficiency will be zero. Thus, in the
proposed model values φij = 1 and for the lagged
variables we take the averaging values for all banks in
a given year. We’ll get 5 equations with five unknown
x2, x3, x7, x8 and x9.

Corporate Ownership & Control / Volume 11, Issue 1, 2013, Continued - 7
712
Let’s create the matrix A as follows,
12 13 17 18 19
22 23 27 28 29
32 33 37 38 39
42 43 47 48 49
52 53 57 58 59
a a a a a
a a a a a
A a a a a a
a a a a a
a a a a a
(17)
The system of equations 16 is not generated in
case if the matrix (17) det (A) ≠ 0. In this case the
system is not generated, so we have a clear solution. If
the system were degenerated, then it would be
necessary to reduce the number of basic variables by
one and then solve the system of four equations.
Thus, according to the formula 16 the system of
equations is as follows
1 1 2 3 4 5 6 7 8
9 10 11 01 02 03 04 05 06
07 08 09 010 011 0
2
0,11 14,46 9,76 3,66 1,83 1,41 3,49 10,36 7,81
0,52 0,28 3,11 9,13 5,99 0,34 0,11 1,48 0,95
5,19 2,01 2,36 0,37 0,11
0,34 11,0
y õ õ õ õ õ õ õ õ
õ õ õ õ õ õ õ õ õ
õ õ õ õ õ y
y
1 2 3 4 5 6 7
8 9 10 11 11 12 13 14
15 16 17 18 19 110 111 1 0
3
1 7,63 2,07 0,33 0,32 1,32 7,32
2,34 3,86 0,16 38,94 12,61 10,79 6,764 1,62
0,02 1,54 6,48 3,37 1,52 0,10 51,69 0,7 0,49
0,36 0,73
õ õ õ õ õ õ õ
õ õ õ õ õ õ õ õ
õ õ õ õ õ õ õ y y
y
1 2 3 4 5 6 7 8
9 10 11 21 22 33 34 35 36
37 38 39 310 311 2
4 1 2
0,03 5,60 0,02 0,03 0,31 4,39 1,63
0,06 0,05 7,57 4,50 2,78 7,57 0,07 0,12 0,42
0,06 0,35 0,32 0,03 9,07 0,8
1,24 0,63 1,47 1,39
õ õ õ õ õ õ õ õ
õ õ õ õ õ õ õ õ õ
õ õ õ õ õ y
y õ õ
3 4 5 6 7 8
9 10 11 41 42 43 44 45 46
47 48 49 410 411
5 1 2 3 4 5
0,20 0,03 0,27 3,19 0,52
1,57 0,20 6,09 0,32 0,32 0,72 0,46 0,33 0,27
0,82 1,01 0,35 0,20 4,07
1,41 3,57 2,59 20,98 0,28 0,33 1,2
õ õ õ õ õ õ
õ õ õ õ õ õ õ õ õ
õ õ õ õ õ
y õ õ õ õ õ
6 7 8
9 10 11 51 52 53 54 55 56
57 58 59 510 511
3 16,71 13,89
13,11 0,25 1,11 0,89 0,45 16,58 1,93 0,28 0,47
5,38 10,52 13,10 0,50 5,04
õ õ õ
õ õ õ õ õ õ õ õ õ
õ õ õ õ õ
(18)
And matrix 17 for finding the solution of our problem is
9,78 3,66 10,36 7,81 0,52
7,63 2,07 7,32 2,34 3,86
0,03 5,60 4,39 1,63 0,06
1,47 1,39 3,19 0,52 1,57
2,59 20,98 16,71 13,89 13,11
A
(19)
According to the research the factors x2, x3, x7, x8
and x9 are expressed in terms of other factors x1, x4, x5,
x6, x10 and x11 as follows:
x9 = -0.1679277434 1011
+ 0.1006388300 x1 +
0.1355219899 x4 - 0.5200778380 x5 -0.2073169393x6 +
36997.68816 x10 + 778799.7172 x11;
x8= -2090253.240 - 2.205883368 x1 -
4.322024522 x4 + 6.677315307 x5 + 0.8058218258 x6 -
1607067.970 x10 + 11821610.50 x11;
x7= -62900933.73 + 0.3069553964 x1 +
2.350220538 x4 - 57.56668813 x5 -13.19740602x6 +
2056413.583 x10 + 54243263.42 x11;
x3= 91425293.98 + 15.44064201 x1 +
3.461400299 x4 + 11.88754258 x5 + 21.63363630 x6 -
1232007.799 x10 - 110439944.1 x11;
x2= -6723055.239 - 0.2304462554x1 +
2.105610744x4 - 3.185035690x5 - 2.880181932x6 +
720794.0423x10 + 8742588.651 x11.

Corporate Ownership & Control / Volume 11, Issue 1, 2013, Continued - 7
713
Table 3. Effect of secondary factors on the secondary ones under the conditions of the bank optimal management
through the absolute efficiency of corporate governance in it
а х1 х4 х5 х6 х10 х11
х9 − + + − − + +
х8 − − − + + − +
х7 − + + − − + +
х3 + + + + + − −
х2 − − + − − + +
Thus, the conditions for the providing efficiency
of the bank management in the system of financial
relations of their stakeholders expressed through the
effectiveness of corporate governance allow to
determine the appropriate factors that are basic and
easily managed by the bank, and the parameters that
are hardly managed. The proposed econometric model
that takes into account the lag decisions of corporate
governance enables to analyze quite widely the bank
activity, to identify ways of its improvement in order to
increase efficiency.
Determined factors in such way allows us to
analyze the impact of each of the secondary hard
managed factor that characterizes financial
relationships of the bank stakeholders to the primary
easily managed factors under optimal bank
management expressed through the effectiveness of
corporate governance in it. Table 3 shows this effect.
Studies demonstrate that the efficiency of the
banking system under conditions of transformation
processes in Ukraine to the international financial
sector is highly dependent on maintaining their own
development opportunities, primarily due to the
sustainability development of financial relationships of
bank stakeholders.
On the influence of the primary factors the CEO
can affect. Primary easily managed (controlled,
regulated) financial relations are restricted by the bank
and include a strategy for its development, the
structural problems of production management and
banking, all kinds of resources, profitability of banks,
production capacity, research and development
activities, competitiveness. The primary factors can
take different values in solving problems affecting their
secondary factors that generate many alternative
solutions. Herewith, secondary factors can substantially
affect the results of decisions and effective
management of the banks. The results of Table 3
reflect that the impact of secondary hard managed
factors on factors that are subjected to regulation by
management has a different area of influence.
4. Conclusion and concluding remarks
So, we have analyzed 50 banks which constitute 60%
of Ukrainian banking system, that include
representatives from all four groups that are under the
control of foreign and domestic capital and it allows to
determine the major trends influence of financial
relations on the bank management effectiveness in the
system of financial relations of their stakeholders.
Determining factors in such way we define that basic
financial relations, which are characterized by funds of
legal entities (x2) and loans and liabilities of
individuals (x8), funds of banks (x1) has a negative
impact. The "principal-agent" financial relations
related to the formation of bank financial resources
specified by features of their circulation (issued as
securities) influence negatively only on loans and
liabilities of individuals (x8), i.e. on the cross-cutting
financial relations "agent- subagent" deal with
substitution of the agent functions completely or partly
which are obtained from the "principal". Securities
held for trading (x5) positively affects the "principal-
agent" financial relations (individuals’ funds (x3)) and
"agent-subagent" (loans and liabilities of individuals
(x8)) only if principal or agent is acting as individuals.
At the same time, specific hard managed factor,
expressed as a share of equity in the banks' liabilities
(x10) has a negative impact on the above- mentioned
group of financial relations. Financial relations that
affect absolutely all the directions of the bank added
value growth expressed by the individuals’ funds (x3)
depend on the negative impact of the share of assets in
the total assets of the banking system (x11). However,
the results show positive role of individuals as s bank’
stakeholders in the system of "principal-agent"
financial relations, since individuals are the main
fighters in the case of violation of their rights as
depositors.
Thus, the sustainability of the bank’
stakeholders financial relations expressed by the
system of corporate governance, shareholders,
creditors, persons involved in active transactions
related to the bank's activities that generates wealth can
act as potential beneficiaries and as possible victims.
Rather important is the specification of positive and
negative consequences of disharmonization of financial
relations for individual stakeholders groups.
References
1. Bos J.W.B. Effects of Heterogeneity on Bank Efficiency
Scores / European Journal of Operational Research. –
2009. – № 195. – pp. 251–261.
2. Heffernan S. Modern Banking / John Wiley & Sons Ltd.
– 2005. – 716 p.
3. Monks R. A. G. Creating value through corporate
governance / Corporate Governance: An International
Review. – 2002. – Т. 10. – №. 3. – pp. 116-123.
4. Stanwick P. A. Managing Stakeholder interest in
turbulent times: A study of corporate governance of
Canadian firms / Journal of American Academy of
Business Cambridge. – 2005. – Vol. 7. – Iss.2. – pp.42.

Corporate Ownership & Control / Volume 11, Issue 1, 2013, Continued - 7
714
Appendix A
Indicators used in assessment of the effectiveness of banks’ management in the system of financial relations.
Indicator Financial relations of the bank’s stakeholders
Characterization of the financial relationships based on modified model of "principal-agent"
Type of the factor
x1 Funds of banks The "principal-agent" financial relations related to formation of the bank
debt capital. "Principal" acts as the banking institution.
Secondary
(hard managed)
х2 Funds of legal entities The "principal-agent" financial relations related to formation of the bank debt capital. "Principal" act as legal entities.
Primary (easy managed)
х3 Funds of individuals The "principal-agent" financial relations related to formation of the bank
debt capital. "Principal" act as individuals.
Primary (easy
managed)
х4 Debt securities issued by the
Bank
The "agent-subagent" financial relations related to formation of the bank
debt capital. "Principal" act as individuals and/or legal entities. Auxiliary tool (agency contract) is debt securities issued by the bank.
Secondary
(hard managed)
х5 Securities held for trading The "agent-subagent" financial relations associated with substitution of the
function, derived from the "principal". "Subagent" acts as individuals and/or legal entities.
Secondary
(hard managed)
х6 Funds in other banks The "agent-subagent" financial relations associated with substitution of the
function, derived from the "principal". "Subagent" acts as other banking
institutions.
Secondary
(hard managed)
х7 Loans and liabilities of legal
entities
The "agent-subagent" financial relations associated with substitution of the
function, derived from the "principal". "Subagent" acts as legal entities.
Primary (easy
managed)
х8 Loans and liabilities of
individuals
The "agent-subagent" financial relations associated with substitution of the
function, derived from the "principal". "Subagent" acts as individuals.
Primary (easy
managed)
х9 Share capital The "principal-agent" financial relations related to formation of the bank
equity capital. "Principal" acts as bank’ shareholders.
Primary (easy
managed)
х10 The share of equity in the banks' liabilities
An index that characterizes the complex nature of "principal-agent" financial relationships associated with the formation of debt and bank equity capital.
Secondary (hard managed)
х11 The share of assets in the total
assets of the banking system,%
An index that characterizes the bank’ "agent-subagent" financial relationship
to the financial relationship "agent-subagent" of Ukrainian banking system.
Secondary
(hard managed)