4. EXAMINATION OF POWER DEVELOPMENT
221
4. EXAMINATION OF POWER DEVELOPMENT
-
Upload
khangminh22 -
Category
Documents
-
view
0 -
download
0
Transcript of 4. EXAMINATION OF POWER DEVELOPMENT

4. EXAMINATION OF POWER DEVELOPMENT
4-1
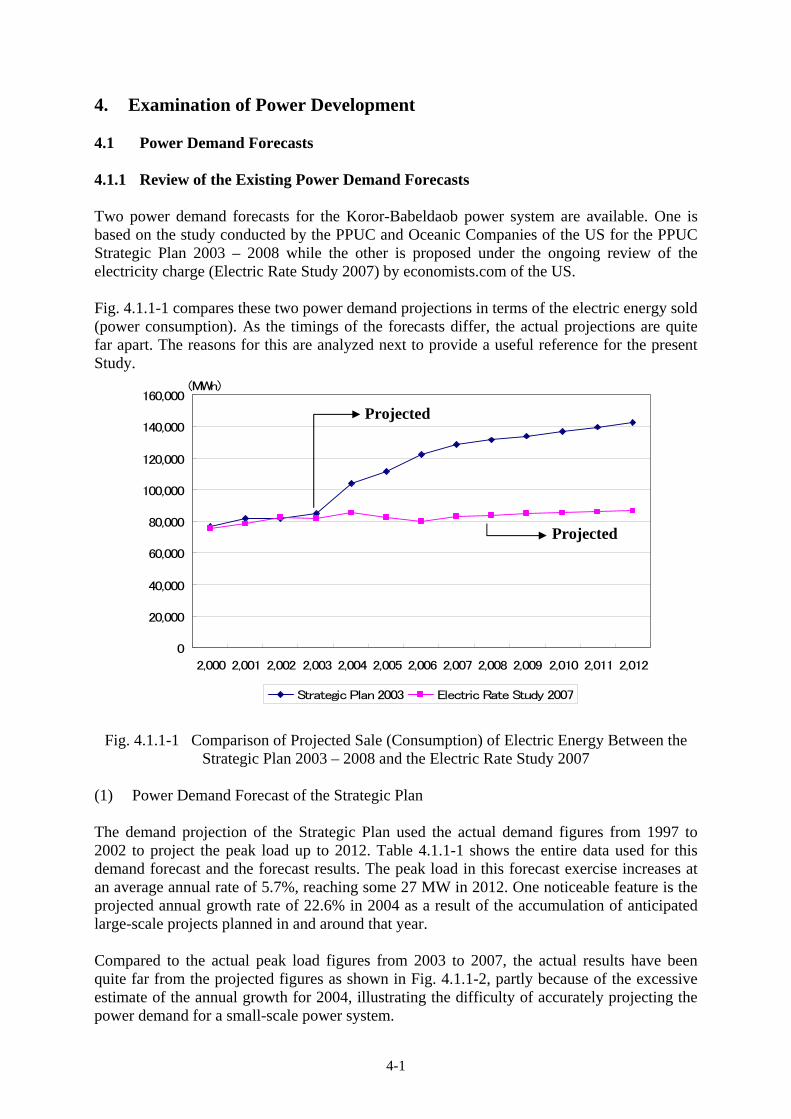
4. Examination of Power Development 4.1 Power Demand Forecasts 4.1.1 Review of the Existing Power Demand Forecasts Two power demand forecasts for the Koror-Babeldaob power system are available. One is based on the study conducted by the PPUC and Oceanic Companies of the US for the PPUC Strategic Plan 2003 – 2008 while the other is proposed under the ongoing review of the electricity charge (Electric Rate Study 2007) by economists.com of the US. Fig. 4.1.1-1 compares these two power demand projections in terms of the electric energy sold (power consumption). As the timings of the forecasts differ, the actual projections are quite far apart. The reasons for this are analyzed next to provide a useful reference for the present Study.
0
20,000
40,000
60,000
80,000
100,000
120,000
140,000
160,000
2,000 2,001 2,002 2,003 2,004 2,005 2,006 2,007 2,008 2,009 2,010 2,011 2,012
Strategic Plan 2003 Electric Rate Study 2007
(MWh)
Fig. 4.1.1-1 Comparison of Projected Sale (Consumption) of Electric Energy Between the Strategic Plan 2003 – 2008 and the Electric Rate Study 2007
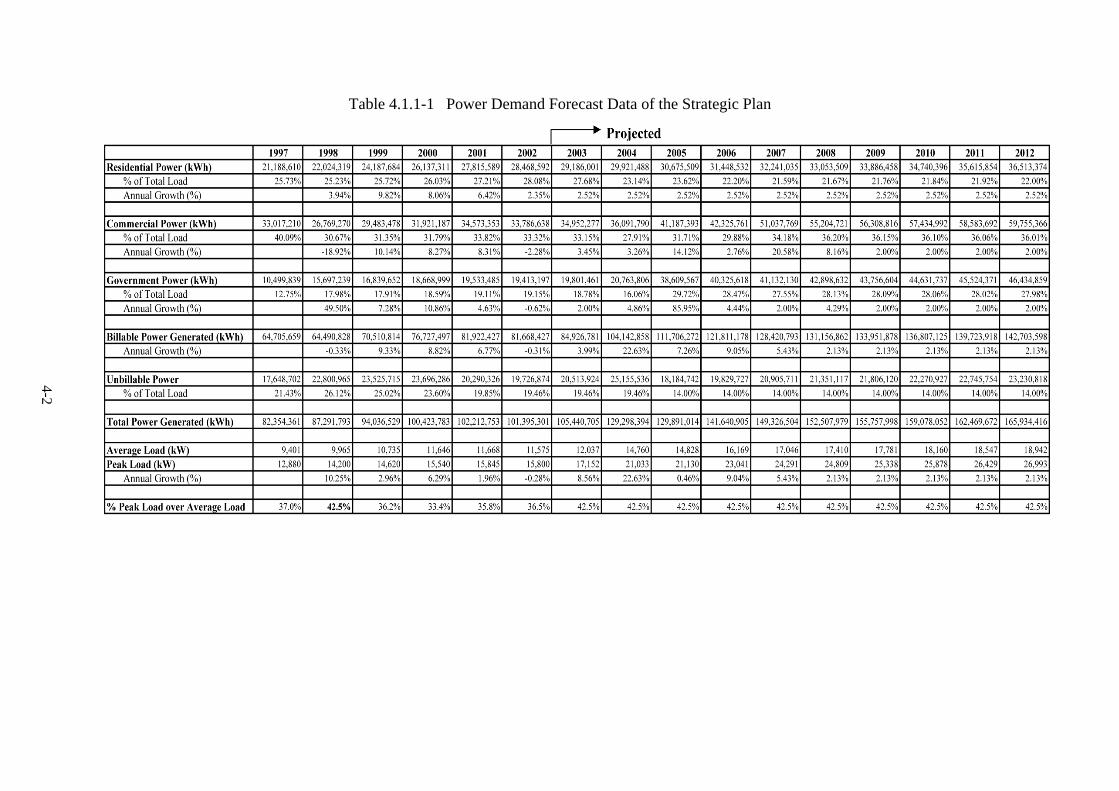
(1) Power Demand Forecast of the Strategic Plan The demand projection of the Strategic Plan used the actual demand figures from 1997 to 2002 to project the peak load up to 2012. Table 4.1.1-1 shows the entire data used for this demand forecast and the forecast results. The peak load in this forecast exercise increases at an average annual rate of 5.7%, reaching some 27 MW in 2012. One noticeable feature is the projected annual growth rate of 22.6% in 2004 as a result of the accumulation of anticipated large-scale projects planned in and around that year. Compared to the actual peak load figures from 2003 to 2007, the actual results have been quite far from the projected figures as shown in Fig. 4.1.1-2, partly because of the excessive estimate of the annual growth for 2004, illustrating the difficulty of accurately projecting the power demand for a small-scale power system.
Projected
Projected
4-2
Table 4.1.1-1 Power Demand Forecast Data of the Strategic Plan

4-3
Table 4.1.1-2 shows the results of the analysis and evaluation of the entire data included in Table 4.1.1-1.
Fig. 4.1.1-2 Peak Generated Power Projection of the Strategic Plan (2) Power Demand Forecast of the Electric Rate Study The actual figures for 2000 to 2007 were used in this power demand forecast to project the net system demand energy (sale of electric energy) up to 2033 as shown in Table 4.1.1-3. An increase of 60 – 70 customers a year was basically assumed and the sale of electric energy was expected to increase at a rate of approximately 0.8% a year. As the provisional study report is designed to examine and propose a future electricity tariff based on the financial situation and expected income of the PPUC, its forecast of the growth of the power demand is on the conservative side. As the power demand in this report is a conservative forecast, the report calls for modification of the projection to reflect an increased demand in the period from 2000 to 2004 in the case of a subsequent power demand increase. In other words, the power demand forecast of this report reflects the stagnant growth of the power demand in the last several years. As the report does not consider the impacts of individual large-scale projects and past outages on the sale of electricity, the growth rates of the GDP and population and other relevant factors, it is unsuitable for use for the formulation of future plans for the transmission/distribution system and power generation.
0
5,000
10,000
15,000
20,000
25,000
30,000
1997
1998
1999
2000
2001
2002
2003
2004
2005
2006
2007
2008
2009
2010
2011
2012
-10
0
10
20
30
40
50
Peak Generated Power Annual Growth (%)
Ann
ual G
row
th (%
)
Peak
Gen
erat
ed P
ower
(kW
)
Actual Result
Historical Projected

4-4
Table 4.1.1-2 Evaluation of Power Demand Forecast of the Strategic Plan Item Forecast of the Strategic Plan Evaluation
1. Demand forecast method
The future demand is calculated by multiplying the past power demand (kWh) of each of the residential, commercial and government sectors by a constant growth rate while taking the non-technical loss and new demand under future projects in both the public and private sectors into consideration. Based on this future power demand (kWh), the average annual load (kW) is calculated. The peak load (kW) is calculated by multiplying the average annual load (kW) by the conversion factor.
While it is appropriate to project the power demand (kWh) for each of the residential, commercial and government sectors for conversion to the peak load (kW) incorporating the power demand by anticipated public and private sector projects, the forecast method does not consider the future trends of such macroeconomic indicators as the GDP growth rate and population growth rate.
2. Parameters used for forecast
(1) Power demand growth rate 1) Residential : 2.52%/year 2) Commercial : 2.00% year 3) Government : 2.00%/year
(2) Conversion from the average load to the peak load The actual result for 1998 (42.5%) is used to represent the proportion of excess of the peak load over the average load.
(3) Non-technical loss The rate of the non-technical loss is assumed to be 14%.
(1) Power demand growth rate The actual growth rate by sector from 1997 to 2002 was as follow. 1) Residential : 6.12% 2) Commercial : 1.10% 3) Government : 14.33% There is a large gap between the actual growth rates and the existing power demand projection.
(2) Conversion of the average load to the peak load As the actual result from 1997 to 2002 ranged from 35.56% to 42.5%, the projected value uses the largest figure in the last six years.
(3) Non-technical loss As the actual results from 1997 to 2001 ranged from 19.46% to 26.12%, the forecast is lower than the actual results. Although the forecast appears to anticipate a future decline of the non-technical loss, there is no prospect of improvement in the immediate future.
3. Adequacy of demand forecast
Peak load in 2012: 28.43 MW Average annual growth rate from 2006 to 2012: 2.6%
The projected average annual growth rate of the peak load (2.6%) is lower than the average growth rate for the five year period before 2002 (4.24%). The GDD elasticity value of the projected power demand growth rate will be checked to evaluate the adequacy of the demand forecast.

4-5
Table 4.1.1-3 Power Demand Forecast Data of the Electric Rate Study
FY 2000 2001 2002 2003 2004 2005 2006 2007 2008 2009 2010 2011 2012 2013 2014 2015 2016
Commercial 31,486,985 32,365,128 33,772,180 32,866,728 33,836,507 37,647,715 31,720,505 32,736,668 33,064,035 33,408,631 33,753,228 34,097,824 34,442,421 34,787,017 35,131,614 35,476,210 35,820,807
Percentage of total load (%) 41.71 41.23 40.99 40.22 39.58 45.88 39.51 39.43 39.48 39.57 39.66 39.75 39.83 39.92 40.00 40.08 40.17
Annual Growth (%) 2.79 4.35 -2.68 2.95 11.26 -15.74 3.20 1.00 1.04 1.03 1.02 1.01 1.00 0.99 0.98 0.97
Government 18,344,167 11,697,527 4,072,823 3,967,150 4,453,483 4,552,558 4,698,512 4,180,277 4,201,178 4,216,108 4,231,038 4,245,967 4,260,897 4,275,826 4,290,756 4,305,685 4,320,615
Percentage of total load (%) 24.30 14.90 4.94 4.85 5.21 5.55 5.85 5.03 5.02 4.99 4.97 4.95 4.93 4.91 4.89 4.86 4.85
Annual Growth (%) -36.23 -65.18 -2.59 12.26 2.22 3.21 -11.03 0.50 0.36 0.35 0.35 0.35 0.35 0.35 0.35 0.35
Republic of Palau - 7,180,683 15,461,909 16,086,386 17,137,042 17,129,229 16,908,446 18,769,754 18,863,603 18,926,589 18,989,574 19,052,560 19,115,546 19,178,532 19,241,517 19,304,503 19,357,489
Percentage of total load (%) - 9.15 18.77 19.69 20.05 20.87 21.06 22.61 22.53 22.42 22.31 22.21 22.11 22.01 21.91 21.81 21.71
Annual Growth (%) 115.33 4.04 6.53 -0.05 -1.29 11.01 0.50 0.33 0.33 0.33 0.33 0.33 0.33 0.33 0.27
Residential 25,663,376 27,264,820 29,075,060 28,798,010 30,057,298 22,729,418 26,951,352 27,338,944 27,612,333 27,871,765 28,131,197 28,390,629 28,650,061 28,909,493 29,168,925 29,428,357 29,667,789
Percentage of total load (%) 33.99 34.73 35.29 35.24 35.16 27.70 33.57 32.93 32.97 33.01 33.05 33.09 33.13 33.17 33.21 33.25 33.27
Annual Growth (%) 6.24 6.64 -0.95 4.37 -24.38 18.57 1.44 1.00 0.94 0.93 0.92 0.91 0.91 0.90 0.89 0.81
Total Sales (kWh) 75,494,528 78,508,158 82,381,972 81,718,274 85,484,330 82,058,920 80,278,815 83,025,643 83,741,149 84,423,093 85,105,037 85,786,980 86,468,925 87,150,868 87,832,812 88,514,755 89,166,700
Annual Growth (%) 3.99 4.93 -0.81 4.61 -4.01 -2.17 3.42 0.86 0.81 0.81 0.80 0.79 0.79 0.78 0.78 0.74
FY 2017 2018 2019 2020 2021 2022 2023 2024 2025 2026 2027 2028 2029 2030 2031 2032 2033
Commercial 36,165,403 36,510,000 36,854,596 37,199,193 37,543,789 37,888,386 38,232,982 38,577,579 38,922,175 39,266,772 39,611,368 39,955,965 40,300,561 40,645,158 40,989,754 41,334,351 41,678,947
Percentage of total load (%) 40.24 40.32 40.39 40.47 40.54 40.61 40.69 40.76 40.83 40.90 40.96 41.03 41.10 41.16 41.23 41.29 41.35
Annual Growth (%) 0.96 0.95 0.94 0.94 0.93 0.92 0.91 0.90 0.89 0.89 0.88 0.87 0.86 0.86 0.85 0.84 0.83
Government 4,335,544 4,350,474 4,365,404 4,380,333 4,395,263 4,410,192 4,425,122 4,440,051 4,454,981 4,469,910 4,484,840 4,499,770 4,514,699 4,529,629 4,544,558 4,559,488 4,574,417
Percentage of total load (%) 4.82 4.80 4.78 4.77 4.75 4.73 4.71 4.69 4.67 4.66 4.64 4.62 4.60 4.59 4.57 4.55 4.54
Annual Growth (%) 0.35 0.34 0.34 0.34 0.34 0.34 0.34 0.34 0.34 0.34 0.33 0.33 0.33 0.33 0.33 0.33 0.33
Republic of Palau 19,430,475 19,493,460 19,556,446 19,619,432 19,682,418 19,745,403 19,808,389 19,871,375 19,934,361 19,997,346 20,060,332 20,123,318 20,186,304 20,249,289 20,312,275 20,375,261 20,438,247
Percentage of total load (%) 21.62 21.53 21.43 21.34 21.25 21.17 21.08 20.99 20.91 20.83 20.75 20.66 20.59 20.51 20.43 20.35 20.28
Annual Growth (%) 0.38 0.32 0.32 0.32 0.32 0.32 0.32 0.32 0.32 0.32 0.31 0.31 0.31 0.31 0.31 0.31 0.31
Residential 29,947,221 30,206,653 30,466,085 30,725,517 30,984,949 31,244,381 31,503,813 31,763,245 32,022,677 32,282,109 32,541,541 32,800,973 33,060,405 33,319,837 33,579,269 33,838,701 34,098,133
Percentage of total load (%) 33.32 33.36 33.39 33.42 33.46 33.49 33.53 33.56 33.59 33.62 33.65 33.68 33.71 33.74 33.77 33.80 33.83
Annual Growth (%) 0.94 0.87 0.86 0.85 0.84 0.84 0.83 0.82 0.82 0.81 0.80 0.80 0.79 0.78 0.78 0.77 0.77
Total Sales (kWh) 89,878,643 90,560,587 91,242,531 91,924,475 92,606,419 93,288,362 93,970,306 94,652,250 95,334,194 96,016,137 96,698,081 97,380,026 98,061,969 98,743,913 99,425,856 100,107,801 100,789,744
Annual Growth (%) 0.80 0.76 0.75 0.75 0.74 0.74 0.73 0.73 0.72 0.72 0.71 0.71 0.70 0.70 0.69 0.69 0.68
Projected

4-6
4.1.2 Review of Economic Policies, Economic Growth Rate Forecast and Local Development Programme
10 years have passed since the announcement of the Palau National Master Development Plan (PNMDP) which is the current master plan for economic policies in Palau and the work to revise this plan is presently in progress with the technical assistance (TA) of the Asian Development Bank (ADB) for the purpose of formulating a road map for sustained economic development following the end of US assistance under the Compact agreement. It is planned to implement this TA with a budget of US$ 1.4 million in a 22 month period starting in August, 2007. In August, 2007, contract negotiations between the ADB and the consultant (Polytechnics International New Zealand Ltd.) to be responsible for the TA took place. While a draft report has been compiled, the Office of Planning and Statistics of the Bureau of Budget and planning is checking the detail of the report at the moment. Other useful references for the present Study include such comparatively recent studies on the economic policy and local development programme as (1) the Study for the Local Development Plan in Palau (JICA, October, 2000) and (2) the Public Sector Investment Programme 2003 – 2007 (PSIP). (1) Study for the Local Development Plan in Palau (JICA, October, 2000) The report for this study proposes a long-term development strategy for each industrial sector up to 2020 and a medium to long-term development plan for each industrial sector up to 2009 to achieve private sector-led economic development to boost government revenue in addition to a structural adjustment programme featuring a reduction of the fiscal expenditure and an increase of government revenue in line with the development path adopted by the PNMDP 2020. The report also identifies 58 projects/programmes to realise the roles of each industrial sector to contribute to national development and selects 20 priority projects/programmes designed to ensure balanced development with the natural and social environments and also to minimise the financial burden on the government. The growth scenario under this study indicates the future growth of the GDP, etc. as shown in Table 4.1.2-1. The nominal annual GDP rate is predicted to slowly increase from 4.3% in 2000 to 6.2% in 2020. The number of tourists visiting Palau is predicted to reach 90,000 in 2010 and 140,000 in 2020.
Table 4.1.2-1 Projected Changes of the GDP by the JICA Study 1995 2000 2005 2010 2015 2020
Total Population 17,255 19,312 21,441 22,054 22,585 23,513Employment Creation 8,368 9,211 10,426 11,602 12,252 13,454Nominal GDP (US$ million) 105.21 134.83 172.24 212.70 298.56 404.07Real GDP (US$ million) 1995 Base 105.21 116.14 122.17 129.25 143.98 160.83Nominal GDP per Capita (US$) 6,108 6,982 8,033 9,645 13,219 17.185Real GDP per Capita (US$) 6,108 6,014 5,698 5,861 6,375 6,840 (2) Public Sector Investment Programme 2003 – 2007 (PSIP) The Government of Palau formulated the Public Sector Investment Programme (PSIP) in April, 2003 to review the planned development of the public sector and compiled the development projects to be implemented in the five year period from 2003 to 2007. The emphasis of economic development is placed on tourism, agriculture, fisheries, trade and light

4-7
industry and the concrete projects to achieve the planned economic development in the transport (roads, airports and harbours), water supply, sewage treatment, waste disposal, energy and communication sectors are classified into three categories in terms of their priority: A (30 projects), B (20 projects) and C (16 projects). Although some of these projects are being implemented with the assistance of various donors, many have been shelved because of a lack of funding. Table 4.1.2-2 lists the main projects affecting the power demand among the high priority Category A projects.
Table 4.1.2-2 High Priority Projects in the PSIP (Those Affecting the Power Demand) Implementation
Status Project Title Budget (US$ ‘000)
Expansion and Repair of the Water Supply System in Koror State 5,000 Improvement of Sewage Treatment in Koror State 5,000 Relocation of the Capital (Phase 2) 3,600 Completed
Renovation of the Venue for the Pacific Arts Festival 1,300 Rehabilitation of Trunk Roads in the Capital Region 19,000 Introduction of Power Generation System Using Renewable Energy 10,000 In Progress Expansion of the Water Supply System in North of Babeldaob Island 1,100 Construction of Waste Disposal Facility on Babeldaob Island 12,000 Improvement of Sanitary Waste Treatment 2,000 Development of the Marine Centre 5,300 Ocean Thermal Energy Conversion (OTEC) 80,000
Not Yet Started
Installation of PV Street Lamp Along Compact Road 2,000 There is a population growth forecast up to 2025 based on the population statistics for 2000 as shown in Fig. 4.1.2-1. According to this forecast, the population of 19,129 in the 2000 census will increase to 22,813 in 2025, recording a population growth of 19.3% in 25 years. Meanwhile, the population growth rate will drop from 1.898%/year in 2000/01 to 0.305% in 2024/25. This data is useful for prediction of the power demand up to 2025.
19.0
19.5
20.0
20.5
21.0
21.5
22.0
22.5
23.0
2000 2005 2010 2015 2020 2025年
人口
(千
人)
Source: Centre for International Research, US Bureau of the Census
Fig. 4.1.2-1 Population Forecast Up To 2025
For the economic growth of Palau, the IMF predicts the GDP growth rate based on three patterns (end, continuation and increase) of the Compact assistance after 2009 in its 2005 report entitled “Article IV Consultation Staff Report” (see Table 4.1.2-3). As shown by the IMF’s prediction, the GDP growth rate of Palau in the future will be considerably affected by the decision on the future of the Compact assistance and improvement of the accuracy of this prediction by studying the likely future of the Compact assistance is essential.
Pop
ulat
ion
(‘000
)
Year

4-8
Table 4.1.2-3 Prediction of the Future Annual GDP Growth Rate by the IMF
(Unit: %) Actual Estimate IMF Prediction Status of Compact
Assistance 2004 2005 2006 2007 2008 2009 2010 2024 End 5.7 5.5 4.8 4.4 4.0 -2.0 Continuation 5.7 4.5 3.0 2.0 1.0 0.5 Increase
4.9 5.5 5.7 5.5 4.8 4.8 4.5 3.3
Source: International Monetary Fund, 2005 Article-IV Consultation Staff Report Meanwhile, the Office of Planning and Statistics of the Government of Palau forecasts the annual GDP growth rate up to 2010 to reflect the development plans/projects in the coming years. The forecast figures are much higher than the IMF figures. No regional GDP, which is useful for the power demand forecast for each area, is calculated.
Table 4.1.2-4 Forecast of Future Annual GDP Growth Rate by the Government of Palau (Unit: %)
FY 2005 2006 2007 2008 2009 2010 Annual GDP Growth Rate 8.4 8.8 8.2 7.8 7.4 7.1 Source: Office of Planning and Statistics, Bureau of Budget and Planning, Ministry of Finance
4.1.3 Examination of Demand Side Management 4.1.3.1 Background of the Examination of Demand Side Management The current electricity tariff employed by the PPUC has an escalated structure to encourage energy saving. However, the introduction of demand side management (DSM) aimed at reducing the generating cost, improving the operational efficiency, reducing the investment in equipment and reducing the environmental cost is feasible. All electricity power companies throughout the world are now required to make active efforts to ensure the efficient use of energy against the background of rising international opinions demanding effective measures to deal with the sharp increase of the fuel cost due to the oil price hike in recent years and also to deal with global warming and other environmental issues. 4.1.3.2 Examination Method of Introduction of DSM (1) Utilisation of the Guidebook As the issue of demand side management (DSM) is examined in various countries, it is possible to refer to the efforts of other countries. The Demand Side Management Best Practices Guidebook for Pacific Island Power Utilities (July, 2007 of the International Institute for Energy Conservation, UNDESA) is particularly useful as it has been compiled to assist DSM at power utilities in Pacific island countries where the state of the power business is similar to that of the PPUC. The applicability of the programmes introduced in this guidebook and listed in Table 4.1.3-1 to Palau has been examined under the Study.

4-9
Table 4.1.3-1 Demand Side Management Programmes Requiring Examination Programme Title Programme Contents
Promotion of Wide Use of Compact Fluorescent Lamps (CFLs)
Recommendation of the replacement of incandescent lamps with CFLs by users
Promotion of Wide Use of High Efficiency Fluorescent Lamps
Implementation of activities deigned to enhance the understanding of high efficiency fluorescent lamps among distributors to promote the sale of such products to consumers
Promotion of Wide Use of High Efficiency Refrigerators
Compulsory indication of the power consumption rating by refrigerator manufacturers and distributors and introduction of the minimum required performance criteria to promote the use of high efficiency refrigerators
Promotion of Wide Use of High Efficiency Air-Conditioning Units
Similar contents to the above
Promotion of Efficient Operation and Maintenance of Commercial Refrigerators
Implementation of a publicity campaign and equipment diagnosis service, etc. for the efficient operation and maintenance of commercial refrigerators which consume much electric energy to reduce the power consumption
Promotion of Efficient Operation and Maintenance of Air-Conditioning Units
Similar contents to the above
Peak-Cut Contracts with Large Users Requesting of the allowance of the temporary suspension of the power supply during peak hours by large users in exchange for a preferential tariff
Energy Use Diagnosis Service for Large Users
Diagnosis of the energy efficiency of equipment used by large users and proposal of the use of high efficiency equipment and the efficient use of electricity to reduce the consumption level of electric energy
Control of Operating Hours of Air-Conditioning Units
Promotion of the use of a device to control the operating hours of commercial air-conditioning units in office buildings, etc. as there are periods, such as late a night, when operation is unnecessary
(2) Examination Method The examination of DSM will be conducted in accordance with the sequence shown in Fig. 4.1.3-1. The future of DSM at the PPUC will also be examined along with prediction of the power demand under a DSM regime.

4-10
Fig. 4.1.3-1 Types and Sources of Data Required for the Load Survey 1) Load Survey
• Types, composition and load data of users • Electricity tariff • Load characteristics (daily load curve) • Identification of user types affecting the daily load curve
2) Setting of Load Improvement Targets
Based on the load survey conducted in 1) above, feasible load improvement patterns (see Fig. 4.1.3-2) will be examined.
Fig. 4.1.3-2 Load Improvement Patterns
Electricity Company
Area 1 Area 2 Area 3
Sector 1 (Resident
ial)
Sector 2 (Commer
cial)
Sector 3 (Large users)
Category 1 (Large
consumption)
Category 2 (Average
consumption)
Category 3 (Small
consumption)
Type 1 (Lighting)
Type 2 (Vacuum cleaner)
Type 3 (Refriger
ator)
Type 1 (Incandescent
lamp)
Type 2 (Fluorescent
lamp)
Type 3 (CFL)
Company data (Bills and
substations)
Load survey data (watt-hour meter)
Market and load survey data (analysis results;
watt-hour meter)
・Number of users ・Mean monthly power
consumption ・Number and
classification of sectors ・Mean peak demand
・Load curve (weekdays and weekends)
・Number of users ・Mean monthly power
consumption ・Number and
classification of categories
・Mean peak demand ・Load curve (weekdays
and weekends)
・Number of users ・Mean monthly power
consumption ・Number and
classification of types ・Mean peak demand
・Load curve (weekdays and weekends)
・Extension level ・Technical
characteristics ・Power consumption
characteristics
・Power consumption share of each type
・Mean peak demand forecast
・Load curve (weekdays and weekends)
Suppression of Peak Demand
Energy Saving Demand Development
Improvement of Load Factor
Levelling of Load Factor

4-11
3) Examination of the Programme Implementation Method The planned examination/analysis will include the identification of electrical appliances to suppress the peak demand and the cost-benefit of each programme for users and the PPUC, including the social and environmental benefits. In addition, a feasible DSM regime for the PPUC will be established to evaluate its impacts on the power demand o that the power demand prediction reflects such impacts.
4.1.3.3 Examination Results for the Prospect of Introducing DSM (1) Load Survey 1) Types, Composition and Load Data of Users
The power demand for the Koror-Babeldaob power system in FY 2007 compiled by the PPUC is classified into the commercial, government (state governments), Republic of Palau (Government of Palau) and residential demands with the respective shares shown in Fig. 4.1.3-3. To be more precise, the shares of the commercial sector, residential sector, Republic of Palau sector and government sector are 40%, 32%, 23% and 5% respectively.
0
5,000
10,000
15,000
20,000
25,000
30,000
35,000
Commercial Government Republic of
Palau
Residential
Power Deman
d (M
W
40%
5%23%
32%
Republic of Palau
Commercial
Gevernment
Residential
Source: PPUC
Fig. 4.1.3-3 Power Demand by User Type (FY 2007) The average number of users at the time of the monthly watt-hour reading in FY 2007 was 6,797 and the power consumption per user was 12,215 kWh/year. As shown in Table 4.1.3-2, the changes of the number of users since 2000 indicate an increase of the number of users and a decrease of the annual power consumption per user, recording an 18.4% decrease from 14,973 kWh/year per user in FY 2000 to 12,215 kWh/year in FY 2007. The power consumption per different type of user shows that the power consumption per commercial user was as high as 34,460 kWh/year in FY 2007 because of the high number of large users, such as shopping centres. This figure is much higher than the power consumption per residential user of 5,189 kWh/year. One noticeable characteristic is that the power consumption per Republic of Palau user of 62,986 kWh/year was 1.8 times higher than that of a commercial user. According to the draft report prepared in 2007 for the Project to Formulate an Energy Efficiency Action Plan,
Demand Energy (MWh)

4-12
which is being implemented by the Energy Office of the MRD with EU assistance, the power load to operate the pumps for water supply and sewerage services accounts for 32% of the power demand of the Republic of Palau. As mentioned earlier, the power consumption per residential user was 5,189 kWh/year in FY 2007 which was 1.4 times higher than the average power consumption per household in Japan of approximately 3,600 kWh/year (the Home Page of the Federation of Electric Power Companies in Japan gives a monthly power consumption per household in FY 2004 of 301.6 kWh). This high level of power consumption is presumably influenced by the use of air-conditioning units (the household ownership ratio is more than 50%) and refrigerators (the household ownership ratio is 93%) in view of the mean annual temperature of 27°C. Moreover, electricity is used for the preparation of meals by 86% of households (2005 Census). The report for the Project to Formulate an Energy Efficiency Action Plan states that electric water heaters are responsible for 20% of the residential power demand.
Table 4.1.3-2 Historical Changes of the Number of Users and Power Consumption per User
2000 2001 2002 2003 2004 2005 2006 2007 No. of Users 600 607 646 673 767 841 883 950
Commercial Power Consumption per User (kWh/year) 52,478 53,320 52,279 48,836 44,115 44,765 35,924 34,460
No. of Users 421 299 232 243 246 263 273 280Government Power Consumption per
User (kWh/year) 43,573 39,122 17,555 16,326 18,104 17,310 17,211 14,930
No. of Users - - 239 255 281 278 274 298Republic of Palau Power Consumption per
User (kWh/year) - - 64,694 63,084 60,986 61,616 61,710 62,986
No. of Users 4,021 4,101 4,308 4,514 4,836 4,995 5,054 5,269Residential Power Consumption per
User (kWh/year) 6,382 6,648 6,749 6,380 6,215 4,550 5,333 5,189
No. of Users 5,042 5,007 5,425 5,685 6,130 6,377 6,484 6,797Total Power Consumption per
User (kWh/year) 14,973 15,680 15,186 14,374 13,045 12,868 12,381 12,215
Source: PPUC
Table 4.1.3-3 Electrification Rate and Ownership Rate of Electrical Equipment Electrification
Rate
Air-Conditioning
Units Refrigerators TVs PCs Microwave
Ovens
State No. of Households
No.
of
Hou
seho
lds
Ow
ners
hip
Rat
e (%
)
No.
of
Hou
seho
lds
Ow
ners
hip
Rat
e (%
)
No.
of
Hou
seho
lds
Ow
ners
hip
Rat
e (%
)
No.
of
Hou
seho
lds
Ow
ners
hip
Rat
e (%
)
No.
of
Hou
seho
lds
Ow
ners
hip
Rat
e (%
)
No.
of
Hou
seho
lds
Ow
ners
hip
Rat
e (%
)
Koror 2,993 2,984 99.7 1,307 43.7 2,821 94.3 2,688 89.8 675 22.6 1,149 38.4Aimeliik 78 73 93.6 51 65.4 62 79.5 55 70.5 7 9.0 15 19.2Ngatpang 96 96 100.0 52 54.2 68 70.8 88 91.7 24 25.0 34 35.4Airai 529 527 99.6 280 52.9 493 93.2 449 84.9 106 20.0 208 39.3Ngchesar 75 75 100.0 69 92.0 71 94.7 63 84.0 3 4.0 11 14.7Melekeok 103 101 98.1 76 73.8 97 94.2 92 89.3 15 14.6 34 33.0Ngaremlengui 78 77 98.7 64 82.1 73 93.6 70 89.7 2 2.6 24 30.8Ngiwal 56 55 98.2 41 73.2 50 89.3 51 91.1 2 3.6 28 50.0Ngardmau 47 47 100.0 42 89.4 45 95.7 36 76.6 1 2.1 6 12.8Ngaraad 120 117 97.5 111 92.5 108 90.0 90 75.0 9 7.5 12 10.0Ngarchelong 150 150 100.0 124 82.7 144 96.0 120 80.0 12 8.0 28 18.7Total 4,325 4,302 99.5 2,217 51.3 4,032 93.2 3,802 87.9 856 19.8 1,549 35.8Source: 2005 Census, Republic of Palau

4-13
2) Electricity Tariff System The electricity tariff (electricity rate) system in Palau has already been explained in 3.3. Fig. 4.1.3-4 shows the historical changes of the electricity tariff since October, 1998. As the figure clearly shows, the tariff has been rising since the application of the automatic fuel price adjustment clause in 2001 and the increasing trend has been accelerating in recent years because of the oil price hike. The high tariff in recent years must have been caused by the recent decline of the power consumption per user. Although it is difficult to predict the future trend of the oil price, the electricity tariff of the PPUC is expected to lightly increase in order to improve the financial strength of the PPUC. However, a further decline of the power consumption per user is likely to occur if the ongoing PR activities of the PPUC on the efficient use of electricity (distribution of a pamphlet entitled “Your Guide to a Lower Power Bill – Energy Conservation Tips” and PR activities regarding demand) continue to raise the awareness of users.
0
0.05
0.1
0.15
0.2
0.25
0.3
1998年
10月
1999年
4月
1999年
10月
2000年
4月
2000年
10月
2001年
4月
2001年
10月
2002年
4月
2002年
10月
2003年
4月
2003年
10月
2004年
4月
2004年
10月
2005年
4月
2005年
10月
2006年
4月
2006年
10月
2007年
4月
0-500kWh 501-2000kWh 2000kWh<
(USD/kWh)
Fig. 4.1.3-4 Historical Changes of the Electricity Tariff (for Residential Users)
3) Characteristics of the Load (Daily Load Curve) and Demand Affecting the Daily Load
Curve Fig. 4.1.3-5 shows the typical load curve on weekdays. The demand is steady from around 09:00 to around 17:00 but the demand gradually increases thereafter, resulting in a peak at 19:00. The peak load, however, is not extremely high as it only represents a some 10% increase of the daytime load. The power demand of offices and commercial facilities begins to rise around 08:00 but steadies throughout the daytime. The power demand of offices is assumed to drop around 17:00. In contrast, the power demand of commercial facilities is inferred to be
Oct
., 19
98
Apr
., 19
99
Oct
., 19
99
Apr
., 20
00
Oct
., 20
00
Apr
., 20
01
Oct
., 20
01
Apr
., 20
02
Oct
., 20
02
Apr
., 20
03
Oct
., 20
03
Apr
., 20
04
Oct
., 20
04
Apr
., 20
05
Oct
., 20
06
Apr
., 20
06
Oct
., 20
07
Apr
., 20
07

4-14
higher at 19:00 than the daytime level because of the lighting load as these facilities tend by open until relatively late (22:00 in the case of large shopping centres). In the evening, the residential power demand starts to rise because of the use of air-conditioning units, lighting and cooking appliances, culminating in a peak demand at 19:00.
0
2
4
6
8
10
12
14
16
0 1 2 3 4 5 6 7 8 9 10 11 12 13 14 15 16 17 18 19 20 21 22 23 24
Fig. 4.1.3-5 Daily Load Curve (Weekdays)
(2) Establishment of Load Improvement Targets As described in 2.3.3, the load factor in Palau of 73 – 74% is not particularly bad and feasible load improvement patterns are the suppression of the peak demand and/or energy saving in Fig. 4.1.3-2. (3) Examination of Programme Implementation Body The Government of Palau is currently in the midst of formulating the Energy Efficiency Action Plan with the intention of actively promoting energy saving activities in the coming years. The draft report compiled in November, 2007 proposes 14 programmes as listed in Table 4.1.3-4, indicating the necessary cost for programme implementation, effects and schedule and these programmes are expected to commence in the near future. As it is clear from the table, the proposal includes quite a variety of energy saving measures and covers most of the items referred to in the UNDESA Guidebook. As this plan primarily focuses on actions relating to government buildings, it is important to publicise the results and positive effects of government efforts to encourage similar efforts by commercial and residential electricity users. Because of the necessity for initial investment, some programmes may not be implemented to produce immediate positive effects. However, the establishment of a fund to provide financial assistance for equipment procurement is planned and the energy saving effects of these programmes are likely to materialise in the future. Reduction of the power consumption by approximately 1.5% is currently believed to be possible by these programmes. While there are projects of which the reduction effect is difficult to quantify, further reduction of the power consumption is certainly possible if reduction of the load for pumps, which currently accounts for 32% of the power consumption by the government, is achieved.
Gen
erat
ed P
ower
(MW
)

4-15
Table 4.1.3-4 Proposed Programmes in Energy Efficiency Action Plan Programme Title Description
1. Campaign to Distribute CFLs to Households
Joint distribution of two or three Energy Star-certified (certified by the US Department of Energy) CLFs to each household by the PPUC and electrical shops • Budget: US$ 15,000 – 20,000 • Energy saving effect: 820 MWh (US$ 180,000) Note: Interviews by the Study Team at four electrical shops found that some 90% of people already choose CFLs when purchasing lamps. Therefore, the energy saving effect of this programme is likely to be small.
2. Establishment of Fund to Promote the Introduction of a Hot Water Supply System Using Solar Heat
Facilitation of the introduction of a hot water supply system using solar heat as an alternative to en electric water heating system in homes and hotels, etc. to supper the energy consumption • Budget: US$ 20,000 • Energy saving effect: impossible to estimate (some 20% reduction of the energy consumption if an electric system is replaced by a solar system)
3. Application of Energy Saving Measures to the Bureau of Public Works Building and Campaign to Publicise Actual Examples
Replacement of fluorescent lamps using iron-core ballast with those using electronic ballast and repainting of the rooftop in white based on the findings of the energy diagnosis of the building conducted in August, 2007• Budget: US$ 9,200 • Energy saving effect: US$ 340/month
4. Implementation of Findings of Energy Diagnosis Conducted at Buildings in the Capital
Appropriate setting of the air-conditioning temperature and control of the air-conditioning hours • Budget: US$ 20,000 • Energy saving effect: < US$ 117,000/year
5. Replacement of Lighting Fixtures at Government Buildings
Replacement of the incandescent lamps used in government buildings with CFLs and replacement of fluorescent lamps using iron-core ballast with those using electronic ballast • Budget: US$ 40,000 • Energy saving effect: US$ 20,000/year
6. Replacement of Rooftop of Government Buildings
Repainting of the rooftop of government buildings in white to improve the air-conditioning efficiency • Budget: US$ 50,000 • Energy saving effect: impossible to estimate
7. Improved Air-Tightness of Windows and Doors in Government Buildings
Improvement of the air-tightness of windows and doors through which cool air currently leaks in government buildings • Budget: US$ 7,000 • Energy saving effect: impossible to estimate
8. Survey on Pumps Used for Water Supply and Sewerage Systems in Koror and Airai States
Survey on pipeline leakage to reduce the pumping load of these systems which currently accounts for 34% of the government’s electricity consumption; transition to a metered rate from the existing fixed tariff system and the installation of water meters • Budget: under examination • Energy saving effect: impossible to estimate
9. Reduced Use of 2-Stroke Outboard Petrol Engines
Establishment of a fund to subsidize the replacement of 2-stroke outboard petrol engines by more fuel-efficient 4-stroke engines or diesel engines to cover the cost differential • Budget: US$ 10,000 • Energy saving effect: 25% saving of the fuel consumption compared to
2-stroke engines 10. Establishment of Fund to
Promote the Purchase of Certified Low Energy Consumption Electrical Products
Partial refund of the purchase cost of certified (US standard or equivalent) low energy consumption electrical products using a fund with the cooperation of electrical stores and the PPUC; cooperation of the PPUC for monitoring of the power consumption before and after such purchase • Budget: US$ 30,000 • Energy saving effect: impossible to estimate
4-16
Programme Title Description 11. Campaign to Introduce the
Effects of Energy Saving Programmes to Congressmen
Palau has few energy-related laws and the tax rate on fuel (US$ 0.05/gallon) has not been changed for a long time. Under this programme, congressmen will be provided with information for their examination of a law designed to reduce the energy consumption. • Budget: US$ 1,000 • Energy saving effect: impossible to estimate
12. Facilitation of the Recovery of Gas from Pig Farms
Establishment of a fund to provide a subsidy for the purchase of gas recovery equipment so that the gas produced from excreta at pig farms can be effectively used • Budget: US$ 10,000 • Energy saving effect: little
13. Energy Consumption Reduction Campaign on Remote Islands
Distribution of CFLs, repainting of rooftops in white and the offer of an energy diagnosis to suppress the energy consumption on remote islands because of the high generation cost on these islands • Budget: US$ 15,000 • Energy saving effect: 11,400 kWh (US$ 2,500)/year
14. Workshops on Efficient Energy Use and Energy Diagnosis of Ordinary Households
Local workshops to educate ordinary islanders on the need for energy saving and education in preparation for energy diagnosis • Budget: US$ 2,000 • Energy saving effect: impossible to estimate
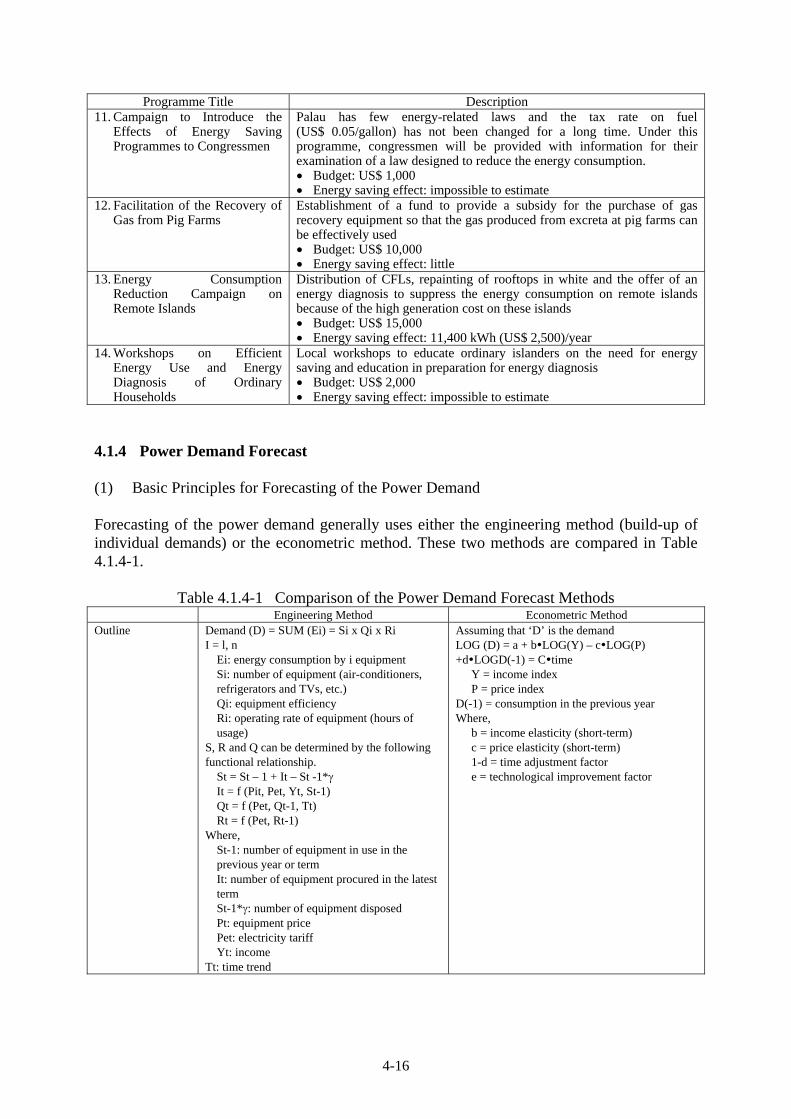
4.1.4 Power Demand Forecast (1) Basic Principles for Forecasting of the Power Demand Forecasting of the power demand generally uses either the engineering method (build-up of individual demands) or the econometric method. These two methods are compared in Table 4.1.4-1.
Table 4.1.4-1 Comparison of the Power Demand Forecast Methods Engineering Method Econometric Method
Outline Demand (D) = SUM (Ei) = Si x Qi x Ri I = l, n
Ei: energy consumption by i equipment Si: number of equipment (air-conditioners, refrigerators and TVs, etc.) Qi: equipment efficiency Ri: operating rate of equipment (hours of usage)
S, R and Q can be determined by the following functional relationship.
St = St – 1 + It – St -1*γ It = f (Pit, Pet, Yt, St-1) Qt = f (Pet, Qt-1, Tt) Rt = f (Pet, Rt-1)
Where, St-1: number of equipment in use in the previous year or term It: number of equipment procured in the latest term St-1*γ: number of equipment disposed Pt: equipment price Pet: electricity tariff Yt: income
Tt: time trend
Assuming that ‘D’ is the demand LOG (D) = a + b LOG(Y) – c LOG(P) +d LOGD(-1) = C time
Y = income index P = price index
D(-1) = consumption in the previous year Where,
b = income elasticity (short-term) c = price elasticity (short-term) 1-d = time adjustment factor e = technological improvement factor

4-17
Engineering Method Econometric Method 1. Data
Gathering • Huge individual demand data is required (X) • Time-series data is unnecessary (O)
• Relatively few types of data must be gathered (O)
• Time-series data equivalent to the forecast period or longer is required (X)
Com
paris
on
2. Ease of Forecast
• Prediction of the equipment efficiency in the future (long-term) is difficult (X)
• The creation of a model is difficult (X)
• A model can be created once time-series data becomes available (O)
• The creation of a model is easy (O) Evaluation Many practical problems (X) Applicable when time-series data is collected (O) Based on the comparative analysis results in Table 4.1.4-1, the econometric model will be used for the power demand forecast in the Study. The annual increase rate of the peak generation power in the eight year period from 2000 to 2007 considerably fluctuated from 6.16% in 2004/05 to -6.644% in 2005/06 (see table 2.3.3-1). Such fluctuation indicates that any appearance of a new large user(s) will greatly affect the increase of the peak generation power because of the relatively small system capacity of some 20 MW. While the Study will basically employ the econometric forecast method, the build-up method will also be used to produce a forecast which reflects an increase of the power demand by new large users by examining the existing development programmes of government and commercial facilities to ensure an accurate demand forecast. (2) Examination of Power Demand Forecast Models 1) Historical Changes of the Electrification Rate
An increase of the electrification rate is believed to considerably affect an increase of the power demand and the electrification rate on Koror and Babeldaob Islands in 2005 was 99.5% as shown in Table 4.1.3-3, almost reaching the state of universal electrification. The historical changes of the nationwide electrification rate in Palau shown in Table 4.1.4-2 indicate that the electrification rate once reached 100% in 1995. As the oldest power demand data which can be obtained is data for 1996, the electrification rate does not affect the present forecasting of the power demand.
Table 4.1.4-2 Historical Changes of the Electrification Rate 1980 1986 1990 1995 2000 2005
Total Number of Households 2,265 2,501 3,312 2,973 3,350 4,707Number of Electrified Households 1,715 2,137 2,989 2,972 3,284 4,656Electrification Rate (%) 75.7 85.4 87.5 100.0 98.0 98.9
Source: Census 2005, Republic of Palau 2) Historical Changes of the GDP
For forecasting of the GDP in the coming years, the forecast figures up to 2010 of the Bureau of Budget and Planning (BOBP) of the Ministry of Finance are used. For the period from 2010 to 2025, the GDP growth rate as of 2024 predicted by the IMF in its Article-IV Consultation Staff Report in 2005 is employed while assuming a linear decline of the GDP growth from 2010 to 2024. Based on this assumption, the forecast GDP growth rates in the future are shown in Table 4.1.4-3.

4-18
Table 4.1.4-3 Forecast GDP Growth Rates Used for Power Demand Forecast (Unit: %)
Actual BOBP Forecast IMF Forecast
2005 2010 2015 2020 2024 Low Case End of Compact Assistance 3.9 0.6 -2.0 Base Case Continuation of Compact Assistance 4.8 2.4 0.5 High Case Increase of Compact Assistance
8.4 7.1 5.8 4.4 3.3
3) Changes of the Population
For changes of the population in the coming years, the forecast up to 2025 of the Centre for International Research (US Bureau of the Census) is used (see Fig. 4.1.2-1).
4) Power Demand in the Past For the planned power demand up to 2025, power demand data for the last 20 years or so is required. However, only statistical data since 1996 is available in Palau and this data for the last 12 years is used. For the period from 1996 to 1999, data contained in the Statistical Year Book 2000 (Republic of Palau) is used. Data possessed by the PPUC is used for the period from 2000 to 2007. Power demand data in Palau used to be classified in three categories up to 2000 as shown in Fig. 4.1.4-1 but has been classified in four categories since 2001. For the purpose of the present power demand forecast, the categories of “Government” and “Republic of Palau” for data since 2001 are combined in the single category of “Government” to ensure the continuity of the composition of the power demand data.
Fig. 4.1.4-1 PPUC User Categories 5) Power Loss Factor
The power loss is defined here as the value achieved by subtracting the net system energy demand from the electric energy generated and 20.8% which is the average value for the last five years is adopted. This 20.8% is extremely high and includes the non-technical loss, providing room for future improvement. For the present forecasting exercise by the econometric forecast method, however, this factor is adopted and then the forecast is revised using the future power loss rate that are analyzed and studied (see 4.1.1 (4)) in consideration of PPUC power system improvement plan and this master plan study.
Commercial
Government
Residential
Commercial
Republic of Palau
Residential
Government
Categories up to 2000 Categories from 2001
(State Government facilities)
(Palau Government Facilities)

4-19
6) Load Factor The load factor is calculated by the following formula using the generating end maximum output and the gross generated energy.
Load Factor = Gross Generated Energy (kWh) x 1 x 100 (%) 365 x 24 Generating End Maximum Output (kW)
The load factor used for the present power demand forecast is 73.1% which is the average load factor for the last five years for the PPUC.
7) Building of a Model A forecasting model is built on Simple EE (ASIAM Research Institute, Japan) which is an economic forecasting simulation software used by Southeast Asian countries to forecast the power demand. In general, an econometric model is built as an aggregate of various estimation equations and definitional equations and it is necessary to verify the “suitability of the model”. This verification of the suitability of the power demand forecasting model for the Study has been conducted using the following indicators. • Determination coefficient: 0.85 or higher is aimed at • Durbin-Watson ratio: a value between 1.00 and 3.00 is aimed at • Sign test of the coefficient: checking of the economic principles With the forecasting model adopted for the Study, the power demand has been forecast for each user category using the following structural equations. ① Commercial
Power demand = f (GDP of the industrial sector; actual result for the previous year)
② Government Power demand = f (GDP; actual result for the previous year)
③ Residential
Power demand = f (GDP/population; actual result for the previous year) Based on the GDP growth rate forecast mentioned earlier, the power demand has been forecast for three cases of the GDP growth rate (high, base and low).
8) Flow of Forecast of Generating End Maximum Output and Maximum Power Demand
For the present power demand forecast, the generating end maximum output (peak generated power) and maximum demand (peak demand) are forecast in accordance with the flow shown in Fig. 4.1.4-2.

4-20
Fig. 4.1.4-2 Flow of Forecast of Power Demand (3) Power Demand Forecast Results (Regression Analysis) 1) Forecast Results for Base Case (Continuation of Compact Assistance)
Table 4.1.4-4 shows the power demand and the peak demand forecast by the power demand forecast model for the base case. Fig. 4.1.4-3 is a graphic representation of the said table.
Table 4.1.4-4 Forecast Power Demand and Peak Demand (Base Case)
Unit FY2007 FY2010 FY2015 FY2020 FY2025 Government kWh 22,150,461 25,107,780 29,971,623 33,467,361 34,760,372Residential kWh 25,639,272 26,920,845 29,801,193 31,980,398 32,891,706Commercial kWh 32,639,230 40,468,171 48,902,179 55,068,712 57,343,296
Total kWh 80,428,963 92,496,796 108,674,996 120,516,471 124,995,374Growth Rate % 3.8 5.1 2.9 1.5 0.3
Generated Energy kWh 92,704,705 116,788,884 137,215,904 152,167,261 157,822,442Peak Gen. Power kW 15,581 18,238 21,428 23,763 24,646
Peak Demand kW 13,518 14,445 16,971 18,820 19,520Source: JICA Study Team
Analysis of Economic Structure
GDP Population
Distribution of GDP to Each User Category
Regression Analysis of Power Demand ・Calculation of Demand Energy (kWh) by User Category ※Electrification rate not considered because it is almost 100%
Power Demand by User Category 1. Commercial=f (Commercial Sector GDP, Actual Result for Previous Year) 2. Government=f (GDP, Actual Result for Previous Year) 3. Residential = f (GDP/Population, Actual Result for Previous Year
Power Demand by Individual Government and Private Projects (kWh)
Total Demand Energy (kWh)
Total Power Energy Generated (kWh)
Technical Loss Non-Technical Loss
Load Factor (%)
Peak Demand(kW)
Power Supply by Renewable Energies Non-Technical Loss
Demand Suppression Effect by DSM
Switching of Users with Independent Generator to Power Supply by PPUC(kWh)

4-21
0
5000
10000
15000
20000
25000
30000
1996
1998
2000
2002
2004
2006
2008
2010
2012
2014
2016
2018
2020
2022
2024
Fig. 4.1.4-3 Forecast Results for Peak Generated Power and Peak Demand (Base Case)
2) Forecast Results for Low Case (End of Compact Assistance)
Table 4.1.4-5 shows the power demand and peak demand forecast by the power demand forecast model for the low case. Fig. 4.1.4-4 is a graphic representation of the said table.
Table 4.1.4-5 Forecast Power Demand and Peak Demand (Low Case) Unit FY2007 FY2010 FY2015 FY2020 FY2025
Government kWh 22,150,461 25,107,780 29,526,013 31,531,464 30,444,893
Residential kWh 25,639,272 26,920,845 29,631,091 31,141,206 30,908,618
Commercial kWh 32,639,230 40,468,171 48,074,283 51,488,761 49,409,885
Total kWh 80,428,963 92,496,796 107,231,387 114,161,431 110,763,396
Growth Rate % 3.8 5.1 2.4 0.5 -1.1
Generated Energy kWh 92,704,705 116,788,884 135,393,165 144,143,221 139,852,772
Peak Gen. Power kW 15,581 18,238 21,143 22,510 21,840
Peak Demand kW 13,518 14,445 16,746 17,828 17,297Source: JICA Study Team
Peak Generated Power
Peak Demand
(kW)

4-22
0
5000
10000
15000
20000
25000
1996
1998
2000
2002
2004
2006
2008
2010
2012
2014
2016
2018
2020
2022
2024
Fig. 4.1.4-4 Forecast Results for Peak Generated Power and Peak Demand (Low Case) 3) Forecast Results for High Case (Increase of Compact Assistance)
Table 4.1.4-6 shows the power demand and peak demand forecast by the power demand forecast model for the high case. Fig. 4.1.4-5 is a graphic representation of the said table.
Table 4.1.4-6 Forecast Power Demand and Peak Demand (High Case)
Unit FY2007 FY2010 FY2015 FY2020 FY2025
Government kWh 22,150,461 25,107,780 30,479,298 35,807,172 40,518,065
Residential kWh 25,639,272 26,920,845 29,994,400 32,975,602 35,411,015
Commercial kWh 32,639,230 40,468,171 49,847,389 59,438,850 68,185,167
Total kWh 80,428,963 92,496,796 110,321,086 128,221,623 144,114,247
Growth Rate % 3.8 5.1 3.4 2.8 2.2
Generated Energy kWh 92,704,705 116,788,884 139,294,301 161,895,989 181,962,433
Peak Gen. Power kW 15,581 18,238 21,753 25,282 28,416
Peak Demand kW 13,518 14,445 17,228 20,023 22,505Source: JICA Study Team
Peak Generated Power
Peak Demand
(kW)

4-23
0
5000
10000
15000
20000
25000
30000
1996
1998
2000
2002
2004
2006
2008
2010
2012
2014
2016
2018
2020
2022
2024
Fig. 4.1.4-5 Forecast Results for Peak Generated Power and Peak Demand (High Case) 4) Comparison of the Forecast for Each Case
Fig. 4.1.4-6 shows changes of the forecast peak demand for the base, low and high cases. Each case shows a similar pattern up to around 2013 but the growth slows down thereafter for both the base case and the low case, reflecting the predicted decline of the GDP growth rate.
0
5000
10000
15000
20000
25000
1996
1998
2000
2002
2004
2006
2008
2010
2012
2014
2016
2018
2020
2022
2024
HighBaseLow
Fig. 4.1.4-6 Changes of the Forecast Peak Demand for Each Case
Peak Generated Power
Peak Demand
(kW)

4-24
(4) Revision of Power Demand Forecast Results 1) Revision by Expected New Large Users
The timing and scale of power supply to anticipated new large users are predicted as shown in Table 4.1.4-7 based on information provided by the Foreign Investment Board which issues permits for inward investment, the Tax Office which controls taxation affairs, state governments (particularly the government of Koror State, the subject state for many development plans) which issue building permits and the Office of Planning and Statistics. The existing size of the load at facilities similar to the planned facilities is referred to in order to determine the required scale of power supply.
Table 4.1.4-7 Anticipated New Large Users
User/Project State Outline Expected Year of Opening
Peak Demand (kW)
Sea Passion Hotel Koror 5 stories with 90 rooms 2008 300 Bai Ra Hotel Koror Bungalow type with 70
rooms 2008 250
Palau Vacation Hotel Koror 5 stories (40 m x 77 m) with 100 rooms
2010 300
Sources: Office of Planning and Statistics, Koror State and interview survey by the JICA Study Team
2) Impacts of Large Users with a Private Power Generation System In the area served by the Koror-Babeldaob power system, there is one large user, PPR (Palau Pacific Resort Hotel), which has a private power generation system which is completely independent from the PPUC power grid. The peak power demand of this user recorded so far, which is 800kW, is equivalent to some 5% of the entire load of the PPUC. The switching of this user to power provided by the PPUC would, therefore, have a significant impact. PPUC is now negotiating with the user for connecting the PPUC grid. Since the generation cost of the user is getting higher and higher due to high fuel price these days, the connection produces an advantage on cost reduction to the user. Therefore, it is assumed here that the user will connect to the PPUC grid in 2009.
3) Revision by Power Demand Increase in Melekeok State As mentioned in Fig. 2.3.1-2, the power demand in Melekeok State rose suddenly after the transfer of the capital from Koror State to Melekeok State in 2006. As shown in Fig. 4.1.4-7, compared the power demand in the first half of the fiscal year 2008 with that in the first half of the fiscal year 2007, the high growth of power demand has reached a stage where it can take a rest. Melekeok State, especially around the new capital, however, is expected to develop rapidly in the near future. Since there are not any distinct development plans of Melekeok State at this moment, it is difficult to accumulate power demand caused by each project. The Study Team assumes that the power demand in Melekeok State will grow at the growth rate of 5% for coming five years.

4-25
0
50
100
150
200
250
300
350
400
Oct. Nov. Dec. Jan. Feb. Mar.
FY2007 FY2008
(MWh)
Fig. 4.1.4-7 Comparison of Power Demand Energy in Melekeok State between the First Half
of FY 2007 and 2008
4) Effect on Power Demand Reduction by Introducing DSM As explained in 4.1.3.3-(3), Palau has a lot of margins for reduction of power consumption by introducing DSM. The Palau Energy Office under Ministry of Resource and Development that is promoting the Energy Efficiency Action Plan has set up the target of 10% power demand reduction in the government sector by 2010, which amounts to 2.8% reduction of total PPUC power demand. The Energy Office intends to actively promote the action plan to the private sector after the government. Therefore, it is assumed that saving energy will advance continuously after 2010 and finally around 5% power demand reduction of the present total power demand of PPUC will be realized by 2013. Based on this assumption, the power demand forecast is revised.
5) Effect on Power Demand Reduction by Introducing Renewable Energy As mentioned in 4.3, the most expected renewable energy to be developed in Palau is photovoltaic power generation. It will not affect the peak demand because the peak demand in Palau occurs in the evening time when electricity cannot be generated by photovoltaic power generation system. It is hard to make a definite plan for development of photovoltaic power generation system in Palau and the amount to affect to the total power generated energy is estimated small. Therefore, reduction of peak demand and total power generated energy is not considered in this Study. If electric water heaters that account for some 20 % of household power consumption are switched to solar water heaters, impact on reduction in power consumption will be huge. Therefore, further demand reduction effect is expected in the future.
6) Estimation of Future Trend of Power Loss The average power loss rate for the last five years that was used for the power demand forecast by the econometric forecast method is 20.8 %. The latest power loss rate estimated from data in the first half of FY 2008 (from October, 2007 to March, 2008) is 19.1 % as shown in Table 4.1.4-8. This power loss is defined as the value achieved by subtracting the net system demand energy from the energy generated and includes the non-technical loss. The PPUC has

4-26
been trying to reduce the non-technical loss, such as illegal connections, stealing electricity, etc., through extensive investigation since last year. The effort may result in such power loss reduction.
Table 4.1.4-8 Power Loss Rate in the First Half of FY2008
Month, Year Generated Energy (kWh)
Sales Energy (kWh)
Power Loss (kWh)
Power Loss Rate (%)
Oct., 2007 8,873,514 6,693,026 2,180,488 24.6
Nov., 2007 8,486,153 6,915,457 1,570,696 18.5
Dec., 2007 8,679,200 7,122,148 1,557,052 17.9
Jan., 2008 8,441,870 6,890,333 1,551,537 18.4
Feb., 2008 8,023,735 6,145,448 1,878,287 23.4
Mar., 2008 8,445,251 7,467,493 977,758 11.6
Total 50,949,723 41,233,905 9,715,818 19.1 Source: PPUC
No power energy meter is installed for streetlights in Palau. The electricity consumed by the streetlights is statistically included in the power loss. According to information from the PPUC, Koror-Babeldaob power system has 1,468 streetlights and the rated output of streetlights generally used in Palau is 227.5W. Supposing that they light up for twelve hours in a day, the power loss caused by the streetlights is estimated by the following calculation.
1,468 (lamps)×227.5 (W)×12 (hours)×365 (days) =1,462,788,600 (Wh) =1,462,789 (kWh)
This value accounts for 1.58 % of total generated energy in 2007.
(%)58.1100705,704,92
789,462,1=×
From the above calculation, the present power loss excluding streetlights is estimated to be 17.5 %. Other reasons of the power loss are parasitic power of power plants, transmission and distribution loss, non-technical loss, etc. Here the present situation and future trend of both the parasitic power and transmission and distribution loss are reviewed and forecasted as follows;
① Parasitic Power in Power Plants The parasitic power consumed by auxiliary equipment is indispensable to operate power plants. The present parasitic power rate in the Aimeliik Power Plant is from 8.0 to 9.0 % (see Table 4.1.4-9), which value is fairly high for a diesel power plant. As a result, total parasitic power rate in the PPUC including the Malakal Power Plant is around 6.2 %. When new diesel generators are installed in the Aimeliik Power Plant in the future, the parasitic power rate will change according to the plans. Therefore, such change is reflected in the revision of the power demand forecast in this Study. This master plan proposes that heavy fuel oil combustion engines should be adopted instead of diesel oil combustion generators in consideration of fuel cost advantage. The heavy fuel oil

4-27
combustion engines require much parasitic power by 2.5 % compared to diesel oil combustion ones. This influence also is considered in the power demand forecast revision.
Table 4.1.4-9 Parasitic Power Rate of Power Plants in PPUC Parasitic Power (kWh) Total Generated Energy (kWh) Parasitic Rate (%) Month,
Year MPP APP Total MPP APP Total MPP APP Total
Oct., 2007 174,627 377,470 552,097 4,270,384 4,603,130 8,873,514 4.1 8.2 6.2
Nov., 2007 209,647 324,700 534,347 4,897,793 3,588,360 8,486,153 4.3 9.0 6.3
Dec., 2007 225,944 308,450 534,394 5,027,560 3,651,640 8,679,200 4.5 8.4 6.2
Jan., 2008 192,040 339,800 531,840 4,194,600 4,247,270 8,441,870 4.6 8.0 6.3
Feb., 2008 211,518 282,600 494,118 4,736,485 3,287,250 8,023,735 4.5 8.6 6.2
Mar., 2008 230,872 295,570 526,442 5,033,081 3,412,170 8,445,251 4.6 8.7 6.2
Total 1,244,648 1,928,590 3,173,238 28,159,903 22,789,820 50,949,723 4.4 8.5 6.2Note: MPP: Malakal Power Plant, APP: Aimeliik Power Plant Source: PPUC ② Transmission and Distribution Loss
The present transmission loss rate is estimated around 1% from the power system analysis results (see 4.2.2.4). Since the power system analysis for distribution systems cannot be conducted due to insufficient data, therefore, although it is nothing but a rough estimate, the distribution loss rate is estimated from 10 to 11%. This value is fairly high for distribution loss, so future loss reduction is necessary for the PPUC. The PPUC is going to install some capacitors to distribution lines to improve the power factor and the voltage drop in 2008. This project will bring the PPUC a profit to reduce some 3 or 4 % power loss.
③ Future Trend of Power Loss Rate in the PPUC Fig. 4.1.4-8 shows the future trend estimate of power loss rate in the PPUC through the above examinations and the power system analysis conducted based on power plant construction plan and transmission, distribution and substation facility expansion plan. Future steady efforts, such as distribution system improvement, power factor improvement, transformer loss reduction by proper load operation, etc., will bring the PPUC more power loss reduction. It is very difficult to define the value, however, Fig. 4.1.4-8 is used for the revision of power demand forecast in this Study.

4-28
0%
5%
10%
15%
20%
25%
2008
2009
2010
2011
2012
2013
2014
2015
2016
2017
2018
2019
2020
2021
2022
2023
2024
2025
Heavy Fuel Oil Combustion Diesel Oil Combustion
Fig. 4.1.4-8 Estimation of Power Loss Trend
7) Power Demand Forecast after Revision Fig. 4.1.4-9 through 4.1.4-11 show the result of revision on the power demand forecast conducted by econometric forecast method in 4.1.4 (3) on condition that the above mentioned and Table 4.1.4-11 provides the peak power for each state in Koror and Babeldaob. The revised power demand forecast of Base Case is used for all examinations in this Study, such as power plant construction plans and transmission, distribution and substation expansion plan. In case that new diesel generators that are planned to be installed in 2013, 2014 and 2019 in the Aimeliik Power Plant adopts heavy fuel oil combustion engines, the power loss is much more than that of diesel oil combustion engines. However, utilization of heavy fuel oil has an advantage on fuel cost. The power demand forecast in case of heavy fuel oil combustion is used for this Study.
0
5000
10000
15000
20000
25000
30000
1996
1998
2000
2002
2004
2006
2008
2010
2012
2014
2016
2018
2020
2022
2024
Fig. 4.1.4-9 Forecast Results for Peak Generated Power and Peak Demand after Revision
(Base Case, Heavy Fuel Oil Combustion)
Peak Generated Power After Revision
Peak Demand After Revision
Peak Demand Before Revision
Peak Generated Power Before Revision
(kW)
Capacitor Installation to 13.8 kV Distribution Networks
5MW Diesel Generator Installation to Aimeliik P/P
Two 5MW Diesel Generators Installation to Aimeliik P/P
New Transmission Lines to Melekeok
- Two 5MW Diesel Generators Installation to Aimeliik P/P (Loss Increase) - New Transmission Line from Aimeliik to Koror and Koror Substation (Loss Decrease)
Two 5MW Diesel Generators Installation to Aimeliik P/P
Pow
er L
oss R
ate
(%)

4-29
0
5000
10000
15000
20000
25000
1996
1998
2000
2002
2004
2006
2008
2010
2012
2014
2016
2018
2020
2022
2024
Fig. 4.1.4-10 Forecast Results for Peak Generated Power and Peak Demand after Revision
(Low Case, Heavy Fuel Oil Combustion)
0
5000
10000
15000
20000
25000
30000
1996
1998
2000
2002
2004
2006
2008
2010
2012
2014
2016
2018
2020
2022
2024
Fig. 4.1.4-11 Forecast Results for Peak Generated Power and Peak Demand after Revision
(High Case, Heavy Fuel Oil Combustion)
(kW) Peak Generated Power After Revision
Peak Demand After Revision
Peak Demand Before Revision
Peak Generated Power Before Revision
(kW) Peak Generated Power After Revision
Peak Demand After Revision
Peak Demand Before Revision
Peak Generated Power Before Revision

4-30
Table 4.1.4-10 Power Demand Forecast Data after Revision Case Kinds of Data Unit 2008 2009 2010 2011 2012 2013 2014 2015 2016 2017 2018 2019 2020 2021 2022 2023 2024 2025 (In case of Heavy Fuel Combustion)
Demand Energy MWh 84,336 95,100 100,519 103,048 105,615 108,110 111,108 113,973 116,674 119,179 121,455 123,479 125,223 126,671 127,806 128,609 129,076 129,478 Peak Demand MW 13.17 14.85 15.70 16.09 16.49 16.88 17.35 17.80 18.22 18.61 18.97 19.28 19.56 19.78 19.96 20.08 20.16 20.22 Generated Energy MWh 104,247 113,350 121,253 123,944 127,040 130,830 135,767 137,648 142,401 145,431 148,134 151,721 153,813 155,547 156,948 157,878 158,466 158,574
Base
Peak Generated Power MW 16.28 17.70 18.94 19.36 19.84 20.43 21.20 21.50 22.24 22.71 23.13 23.69 24.02 24.29 24.51 24.65 24.75 24.76
Demand Energy MWh 84,336 95,100 100,519 102,985 105,405 107,641 110,256 112,611 114,662 116,375 117,713 118,658 119,194 119,312 119,005 118,282 117,156 115,966
Peak Demand MW 13.17 14.85 15.70 16.08 16.46 16.81 17.22 17.59 17.91 18.17 18.38 18.53 18.61 18.63 18.58 18.47 18.30 18.11 Generated Energy MWh 104,247 113,350 121,253 123,868 126,788 130,264 134,737 136,000 139,969 142,039 143,609 145,870 146,497 146,618 146,267 145,345 144,001 142,216
Low
Peak Generated Power MW 16.28 17.70 18.94 19.34 19.80 20.34 21.04 21.24 21.86 22.18 22.43 22.78 22.88 22.90 22.84 22.70 22.49 22.21 Demand Energy MWh 84,336 95,100 100,519 103,119 105,852 108,640 112,072 115,527 118,990 122,442 125,860 129,231 132,533 135,752 138,871 141,867 144,727 147,631 Peak Demand MW 16.28 17.70 18.94 19.37 19.88 20.53 21.38 21.79 22.68 23.33 23.96 24.78 25.41 26.01 26.61 27.17 27.71 28.20 Generated Energy MWh 104,247 113,350 121,253 124,029 127,326 131,469 136,932 139,527 145,201 149,375 153,461 158,702 162,684 166,568 170,377 173,968 177,461 180,551
High
Peak Generated Power MW 13.17 14.85 15.70 16.10 16.53 16.97 17.50 18.04 18.58 19.12 19.65 20.18 20.70 21.20 21.69 22.15 22.60 23.05 (In case of Diesel Oil Combustion)
Generated Energy MWh 104,247 113,350 121,253 123,944 127,040 129,330 132,767 136,232 139,431 142,431 145,134 148,080 150,169 151,917 153,273 154,231 154,791 154,899 Base
Peak Generated Power MW 16.28 17.70 18.94 19.36 19.84 20.20 20.73 21.27 21.77 22.24 22.66 23.12 23.45 23.72 23.94 24.09 24.17 24.19 Generated Energy MWh 104,247 113,350 121,253 123,868 126,788 128,764 131,737 134,584 136,999 139,039 140,609 142,229 142,853 142,988 142,592 141,698 140,326 138,541
Low Peak Generated Power MW 16.28 17.70 18.94 19.34 19.80 20.11 20.57 21.02 21.39 21.71 21.96 22.21 22.31 22.33 22.27 22.13 21.91 21.63 Generated Energy MWh 104,247 113,350 121,253 124,029 127,326 129,969 133,932 138,111 142,231 146,375 150,461 155,061 159,041 162,938 166,702 170,321 173,786 176,876
High Peak Generated Power MW 16.28 17.70 18.94 19.37 19.88 20.30 20.92 21.57 22.21 22.86 23.50 24.21 24.84 25.44 26.03 26.60 27.14 27.62
Source: JICA Study Team

4-31
Table 4.1.4-11 Power Demand Forecast by State (Base Case) State FY2007 FY2010 FY2015 FY2020 FY2025
Koror 10,111 11,743 13,280 14,586 15,080
Aimeliik 230 267 302 332 343
Ngatpang 68 78 89 98 101
Airai 2,109 2,449 2,770 3,042 3,145
Ngchesar 68 78 89 98 101
Melekeok 554 641 772 854 886
Ngaremlengui 108 126 142 156 161
Ngiwal 68 78 89 98 101
Ngardmau 41 47 53 59 60
Ngaraad 95 110 124 137 141
Ngarchelong 68 78 89 98 101
8) Examination of Power Demand Forecast Results and Recommendations
Fig. 4.1.4-12 shows that the result compared the power demand forecast result after revision in this Study with the latest power demand forecast of the PPUC, which was provided by Strategic Plan 2003. The forecast in Strategic Plan 2003 excessively estimated and accumulated the power demand from many individual projects. On the contrary, the JICA Study considered only the definite projects already started their construction and it is the realistic forecast. Palau has a lot of projects planned, but it takes much time to actually go forward and some of the projects are postponed and cancelled so often. Therefore it is recommended that the PPUC should revise repeatedly the power demand forecast as well as the power system expansion plan according to the individual projects that affects the power demand.
0
5,000
10,000
15,000
20,000
25,000
30,000
2003
2004
2005
2006
2007
2008
2009
2010
2011
2012
2013
2014
2015
2016
2017
2018
2019
2020
2021
2022
2023
2024
2025
JICA Study Team Strategic Plan 2003
Fig. 4.1.4-12 Comparison of Peak Generated Power between JICA Study Team and Strategic Plan 2003
Peak
Gen
erat
ed P
ower
(kW
)

4-32
The future annual GDP growth rate used for the regression analyses was predicted by IMF in 2005. The Palauan economy is greatly influenced by negotiation result on continuation of grant aid based on the Compact with the US, which will become clear in 2009. At that time Palau will revise the future growth rate and then the PPUC also needs to revise the power demand forecast. From this point of view, the PPUC is recommended to record the actual power demand every year and check and review the gap from the forecast and revise the power system expansion plan.

4-33
4.2 Formulation of the Power Development Plan 4.2.1 Examination of the Power Station Construction Plan 4.2.1.1 Basic Concept (1) Power Generation Method The electric power generated in Palau at present comes entirely from diesel power generating units. In general, the generating method is selected taking the required scale of power generation, operating mode (base, middle and peak), procurable fuel, site conditions and environmental impacts, etc. into consideration. Table 4.2.1-1 compares the common thermal power generation methods. Palau’s continual employment of the diesel power generation method for future power stations is desirable in view of the facts that the peak demand in 2025 of around 25 MW will still be modest, that the construction of large-scale harbour facilities is difficult as the country is surrounded by coral reefs and that the staff members of the PPUC’s power generation division are very familiar with the diesel power generation method. (2) Fuel for Power Generation The fuel currently used by the PPUC for power generation is a type of diesel oil (automotive diesel oil with a low sulphur content). Given the fact that the global oil price hike in recent years has been damaging the financial soundness of the PPUC, the use of heavy oil, which is cheaper than diesel oil, is proposed as the fuel for the generating units to be installed in the future. Currently, diesel oil is supplied to Aimeliik and Malakal power stations by Shell and Mobil, respectively. The both companies transport diesel oil from Singapore to Palau by a tanker. The specifications of the tanker that Shell is using are as follows;
• Capacity: 7,850 DWT • Total length: 110 m • Total width: 41.6 m • Draft: 7.1 m
Singapore is known as the third biggest oil refinery centre in the world following Houston in the US and Rotterdam in Netherlands and is also oil supply and trading hub to Asia and pacific countries. According to Bunkerworld.com who is a provider of market information for the marine fuels market and owned and operated by Petromedia Ltd (UK), seventy one companies that include five oil major companies such as BP, Chevron, ExxonMobil, Shell and TOTAL are registered to its web site as marine fuels (bunker fuel, a kind of heavy fuel oil used for vessels) supplier in Singapore. The above mentioned five oil major companies deal with marine fuels that comply with ISO standards shown in Table 4.2.1-2 and that are commonly used for marine diesel engines. Thus, it is judged that the specifications of marine fuels are compatible to diesel engines for power generation. In this Study, the specifications of heavy fuel oil to be used for new Aimeliik Power Station are supposed to be RME 180 (ISO grade) or equivalent. According to Shell’s web site, the minimum order quantity of RME180 is 500 ton. Since monthly heavy oil consumption that is estimated around 1,000 ton in year 2013 when two of 5MW diesel

4-34
generators start operation exceeds minimum order quantity of Shell, the procurement of heavy fuel oil is highly possible even if it is procured from spot market.
Table 4.2.1-1 Comparison of Thermal Power Generation Methods Internal Combustion
Power Generation Type of Power Generation Steam-Power Generation
Gas Turbine Diesel
Fuel Coal Heavy Oil Gas Kerosene/Gas Oil/Gas
Heavy Oil/Gas Oil/Gas
Generation Method The fuel is combusted in a boiler to produce hot, high pressure steam to turn the turbines to generate electric energy.
Turning of turbines by combustion gas
Turning of generator by mechanical movement of internal combustion engine
Common Single Unit Capacity
100 – 1,000 MW As left As left 0.6 – 100 MW 0.06 – 20 MW
Service Life (Statutory)
15 years As left As left As left As left
Service Life (Actual)
20 – 30 years As left As left As left As left
Difficulty of Operation
Difficult Many ancillary facilities, including coal transportation facilities and pollution control facilities
Slightly difficult Slightly difficult Easy Easy
Difficulty of Maintenance
Difficult Many ancillary facilities, including coal transportation facilities and pollution control facilities
Slightly difficult Slightly difficult Difficult - Complex engine
structure
Slightly difficult
[Merits] - No special merits
[Merits] - No special merits
[Merits] Fuel handling facilities are simple
[Merits] - Easy installation due to simple structure - High output despite small size and light weight - Small installation area - No need or small quantity of cooling water to be used - Quick starting and stopping
[Merits] - High thermal efficiency - Much smaller installation area than that of steam power plant - Small quantity of cooling water to be used - Quick starting and stopping - Applicability of wide range of fuels (heavy oil, gas oil and gas) - Low efficiency drop with partial load operation
Merits or Demerits from Facility Aspect
[Demerits] - Large-scale fuel unloading and storage facilities (port facilities and coal storage facilities) are required due to lower calorific value per unit weight than heavy oil and gas, etc. - Fuel transportation facilities are large because of solid fuel - Installation of mechanical and electric dust collectors is
[Demerits] - Installation of electric dust collector is required to prevent scattering of soot and dust in exhaust gas - Installation of exhaust gas desulphuriser is required when sulphur content of fuel is high. When this facility is installed, large quantities of water and limestone, producing gypsum as a by-product
[Demerits] - Large quantity of cooling water (seawater or river water) is required as steam used for power generation must be cooled to return to water
[Demerits] - High generation cost due to poor generation efficiency - Decrease of output when ambient temperature is high - Applicable fuels are limited to such high quality fuels as gas oil and gas (to prevent hot corrosion of hot parts) - High efficiency drop with partial load operation
[Demerits] - No special demerits

4-35
Internal Combustion Power Generation Type of
Power Generation Steam-Power Generation Gas Turbine Diesel
Fuel Coal Heavy Oil Gas Kerosene/Gas Oil/Gas
Heavy Oil/Gas Oil/Gas
required to prevent scattering of soot and dust in exhaust gas - Installation of exhaust gas desulphuriser is required when sulphur content of fuel is high. When this facility is installed, large quantities of water and limestone, producing gypsum as a by-product - Ash disposal site is required for landfilling of coal ash - Large quantity of cooling water (seawater or river water) is required as steam used for power generation must be cooled to return to water - High level of wear of boiler due to soot and dust
- Large quantity of cooling water (seawater or river water) is required as steam used for power generation must be cooled to return to water
[Merits] - No special merits
[Merits] - No special merits
[Merits] - Clean fuel mean lower emission of air pollutants
[Merits] - Clean fuel mean lower emission of air pollutants
[Merits] - No special merits
Merits and Demerits from Environmental Aspect
[Demerits] - High concentrations of NOx, SOx, soot and dust in exhaust gas than other fuels - Release of cooling water used to cool steam as warm effluent
[Demerits] - Generation of SOx due to sulphur in the fuel - Release of cooling water used to cool steam as warm effluent
[Demerits] - Release of cooling water used to cool steam as warm effluent
[Demerits] - No special demerits
[Demerits] - High levels of noise (low frequency) and vibration due to reciprocating piston movement - Generation of SOx when sulphur is contained in the fuel
Construction Cost ($/kWh) 2,730*1 1,730*1 1,820*1 910 – 2,270*2 910 – 1,820*2
Operation and Maintenance Cost ($/kWh)
0.014*3 0.014*3 0.01*3 0.018*2 0.018*2
Note For the construction cost and fuel cost, the costs in Japanese yen are converted to the US dollar costs based on an exchange rate of US$ 1 to ¥110. The original costs in Japanese yen are the estimated construction cost and the estimated unit generation cost in Japan. Sources *1 Agency for Natural Resources and Energy (estimated average unit generation cost based on the assumption that
generating operation started in 1992 for the duration of the expected service life) *2 Basics and Application of Co-Generation (edited by T. Fuji, Corona Publishing Co., Ltd., 2003) *3 Agency for Natural Resources and Energy (for the 70th Meeting of the Nuclear Safety and Security Working Group of
the Advisory Committee for Natural Resources and Energy in December, 1999) Remarks Combined cycle power generation combines gas turbine power generation and steam power generation. Its environmental load is small due to the use of gas as the principal fuel and the generation efficiency is high due to the use of recovered waste heat from the gas turbine for power generation (the generation efficiency is 40 – 50% based on the higher heating value while the efficiency of steam power generation is approximately 40%). In terms of operation and facilities, combined cycle power generation has the characteristics of both gas turbine power generation and steam power generation.

4-36
Table 4.2.1-2 Standard Specifications of Marine Fuels (ISO 8217) ISO Category
Parameter Unit Limit RMA30 RMB30 RMD80 RME180 RMF180 RMG380 RMH380 RMK380 RMH700 RMK700
Density at 15 °C kg/m³ Max 960.0 975.0 980.0 991.0 991.0 1010.0 991.0 1010.0
Viscosity at 50°C mm²/s Max 30.0 80.0 180.0 380.0 700
Water % V/V Max 0.5 0.5 0.5 0.5 0.5
Micro Carbon Residue % m/m Max 10 14 15 20 18 22 22
Sulfur 1 % m/m Max 3.5 4.00 4.50 4.50 4.50
Ash % m/m Max 0.10 0.10 0.10 0.15 0.15 0.15 0.15
Vanadium mg/kg Max 150 350 200 500 300 600 600
Flash point °C Min 60 60 60 60 60
Pour point, Summer °C Max 6 24 30 30 30 30
Pour point, Winter °C Max 0 24 30 30 30 30
Aluminium + Silicon mg/kg Max 80 80 80 80 80
Total Sediment Potential % m/m Max 0.10 0.10 0.10 0.10 0.10
Zinc 2 mg/kg Max 15
Phosphorus 2 mg/kg Max 15
Calcium 2 mg/kg Max 30
1: A sulfur limit of 1.5% m/m will apply in SOx Emission Control Areas designated by the International Maritime Organization, when its relevant Protocol comes into force. There may be local variations.
2: The Fuel shall be free of Used Lubrication Oil (ULO). A Fuel is considered to be free of ULO if one or more of the elements are below the limits.All three elements shall exceed the limits before deemed to contain ULO.
(3) Single Unit Capacity The single unit capacity of the generating units to be installed in the coming years is set at 5 MW per unit based on the relevant examination results explained later. (4) Reserve Capacity The required capacity of the generating units to be examined in the power development plan must take the capacities of the generating units of which operation is suspended due to periodic inspection or sudden breakdown (reserve capacity) into consideration in addition to the generation capacity designed to meet the future power demand. In general, this reserve capacity is set at around 10% of the system capacity in industrialised countries or countries with a large system capacity. In the case of island countries such as Palau, however, it is essential for any examination of the required reserve capacity to take the situation of the suspension of operation of an individual generator into consideration as the ratio of the generating capacity of a single unit to the system capacity is fairly high. Fig. 4.2.1-1 shows the periodic inspection schedule (example) for the Aimeliik Power Station after the replacement. Assuming the periodic inspection of the seven diesel engine generators, including the 5 MW generator to be installed with a loan from Taiwan, the operation of one of these seven generators will be suspended for inspection for a period of some three-quarters of the year as calculated below. [Standard Periodic Inspection Interval for Diesel Engine Generator] • Simple overhaul: every 2,500 – 3,000 hours, stoppage for 7 – 8 days • Intermediate overhaul: every 7,500 – 8,000 hours, stoppage for 15 – 18 days

4-37
• Major overhaul: every 16,000 hours, stoppage for 20 – 25 days The period of diesel engine stoppage due to periodic inspection (overhaul) is calculated below. 8 days (simple) x 4 times + 18 days (intermediate) x 1 + 25 days (major) x 1 = 75 days unit/2 years 75 days x 7 units ÷ 2 years = 262.5 days/year = 9 months/year = 3/4 years Accordingly, only six out of the seven units can be expected to be constantly available. To ensure a stable power supply, the establishment of reserve capacity to cater for the situation where the operation of one generating unit is suspended due to an unforeseen accident during the periodic inspection of another unit is essential. For this reason, reserve capacity equivalent to the combined generating output of the two largest generating units is proposed for the Koror-Babeldaob power system in this Study.

4-38
[Remarks] Simple overhaul (every 2,500-3,000 hours): 7-8days shutdownImtermediate overhau (every 7,500-8,000 hours): 15-18days shutdownMajor overhaul (every 16,000 hours) : 20-25days shutdown
[Source] JICA Study Team
Operational
Maintenance
Operational
Maintenance
Operational
Maintenance
Operational
Maintenance
Operational
Maintenance
8 9 10 11Unit No. Status 4th Year1 2 3 4 5 6 7 127 81 2 3 4
1st Year1 2 39 10 11 125 6 4 5 6 7 8 9 10 11 712 1 2 3 12
2nd Year 3rd Year8 9 10 114 5 6
CAT
New DG#1
New DG#2
New DG#3
8 months
New DG#4
New DG#5
New DG#64 months
Operational
Maintenance
Operational
Maintenance
Fig. 4.2.1-1 Periodic Inspection (Overhaul) Cycle for Diesel Generator (Example)

4-39
4.2.1.2 Existing Generating Unit Decommissioning Plan Medium speed (≥750 rpm) and low speed (≥500 rpm) diesel generators being to experience significant deterioration of the output and generation efficiency some 20 years after their commissioning. As the economic performance and reliability suffer, decommissioning around that time is the common practice. Meanwhile, the life of high speed diesel generators designed for short operation at the time of an emergency or to cover the peak load is shorter than that of medium speed or low speed diesel generators. The Pielstick-2 through Pielstick-5 generating units at the Aimeliik Power Station are 22 years old and their output and efficiency have considerably deteriorated. While rehabilitation work is planned in FY 2008 for the No. 2 and No. 3 units and in or after FY 2009 for the No. 4 and No. 5 units, the planned work is the replacement of such major parts as the cylinder heads, piston and cylinder liners, etc. The planned rehabilitation work can, therefore, be classified as a measure to prolong the life of these units until the commencement of operation of the new units. For each of the existing units, the major overhaul to be conducted every 24,000 hours of operation has been conducted three times during these 22 years although major overhaul should have been conducted five times in view of the total operating hours so far. Hardly any periodic inspection (overhaul) to be conducted every 1,000 hours, 3,000 hours, 6,000 hours and 12,000 hours in the intervening periods of the major overhaul has been conducted contrary to the recommendation of the manufacturer. The Mitsubishi-12 and Mitsubishi-13 units and the Wartsila-2 and Wartsila-3 units at the Malakal Power Station successively broke down in 2006 due to burning of the crankshaft. Although the Mitsubishi-12 and Mitsubishi-13 units resumed operation in October, 2006 and January, 2007 respectively, the two Wartsila units are still out of order. In the case of the two Mitsubishi units, grinding work was conducted as part of the repair of the burned crankshaft and the No. 13 unit was found to be more severely damaged. It is, therefore, essential to pay careful attention to the operation of these units so that the engine is not overloaded. No major overhaul of the three Wartsila units has been conducted although the filters have been regularly replaced after 1,000 hours of operation. Based on the general characteristics of diesel generators and the operation and maintenance history of the generating units at the Aimeliik Power Station and Malakal Power Station, the decommissioning plan for the existing generating units shown in Table 4.2.1-3 has been formulated. It is assumed that the Aimeliik Power Station will cater for the base load of the Koror-Babeldaob power system after the replacement work at this power station while one generator at the Malakal Power Station will be continuously operated in order to reduce transmission and distribution losses and to pursue reliable power supply.

4-40
Table 4.2.1-3 Existing Generating Unit Decommissioning Plan Power Station Unit
Rated Output (MW)
Available Output (MW)
Total Operating Hours *1
Present Status Decommissioning Plan
Pielstick-2 3.2 2.0 128,860 Operable Rehabilitation is scheduled to take place in FY 2008 as a measure to prolong the life until the introduction of the new units. Because of the significant decline of the output and efficiency due to severe deterioration, this will be one of the first units to be decommissioned with the commencement of the operation of the new units (to be decommissioned in 2013).
Pielstick-3 3.27 2.0 122,359 Operable Rehabilitation has been implemented since February, 2008 as a measure to prolong the life until the introduction of the new units. Because of the significant decline of the output and efficiency due to severe deterioration, this will be one of the first units to be decommissioned with the commencement of the operation of the new units (to be decommissioned in 2013).
Pielstick-4 3.27 2.0 134,584 Operable Rehabilitation is scheduled to take place in 2009 or thereafter as a measure to prolong the life until the introduction of the new units. Because of the significant decline of the output and efficiency due to severe deterioration, this will be one of the first units to be decommissioned with the commencement of the operation of the new units (to be decommissioned in 2014).
Pielstick-5 3.27 2.0 132.149 Operable As above
Aimeliik
Sub-Total 13.08 8.0 Wartsila-1 2.00 1.7 59,587 Operable As this is a high speed machine (1,200
rpm), long life cannot be expected. It will be decommissioned after 20 years of operation (in 2019).
Malakal
Wartsila-2 2.00 (1.7) n/a Inoperable Repair of crankshaft is scheduled afterFY 2009.As this is a high speed machine (1,200 rpm), long life cannot be expected. It will be decommissioned after 20 years of operation (in 2019).
Wartsila-3 2.00 (1.7) n/a Inoperable Repair of crankshaft is scheduled in June, 2008. As this is a high speed machine (1,200 rpm), long life cannot be expected. It will be decommissioned after 20 years of operation (in 2019).
Mitsubishi-12 3.40 3.2 69,177 Operable Damage to the crankshaft is less severe than that of the No. 13 unit and its operation for load adjustment will continue.
Mitsubishi-13 3.40 3.0 65,386 Operable After 20 years of operation (in 2019), this unit will become a stand-by generator that is only in operation during unit 12 is shut down.
Caterpillar-1 1.825 1.6 4,379 Operable As this is only used for a short period each time due to the high speed of 1,800 rpm, long life cannot be expected. This will be decommissioned after 10 years of operation (in 2016).
Caterpillar-2 1.825 1.6 4,379 Operable As above
Alco-9 1.25 0.5 35,207 Operable (stand-by)
This will be decommissioned (in 2008) once the Wartsila-3 recommences operation.
Sub-Total 17.70 11.6 Total 30.78 19.6
[Remarks] *1: as of January, 2008

4-41
Since PPUC currently has a reserve margin of only one unit’s capacity, it must maintain its existing generating units in good working conditions at any time and also ensure power supply capacity by elongating the life of its aged generators. It is strongly recommended that deteriorated generators at the Aimeliik Power Station must be rehabilitated and elongated their lives by replacing the worn-out major parts. Regarding the Malakal Power Station, periodical maintenance, check-up and replacement of major parts must be strictly conducted in conformity with manufacturer’s operation and maintenance manual by stopping the generators in a timely manner. 4.2.1.3 Power Station Expansion Plan The plan to install the new generating units required up to 2025 has been formulated as shown in Table 4.2.1-4 based on the power demand forecast (base case) under the Study, taking the reserve capacity and generating unit decommissioning plan described earlier into consideration. According to this expansion plan, the new generating units will commence operation in three phases (Phase 1: 2 x 5 MW in FY 2013; Phase 2: 2 x 5 MW in 2014; Phase 3: 2 x 5 MW in 2019) and reserve capacity equivalent to the combined output of the two largest generating units will be continuously maintained. The year when the new generators commence operation in Phase-1 and Phase-2 is set as the earliest timing taking the procurement of fund and period of manufacturing into consideration. The delay of commercial operation for new HFO-fired diesel engine generators (Phase-1) will curtail fuel cost reduction by US$ 5.5 million/ year for one year delay and US$ 11million/year for two years delay. From the view point of power supply reliability and fuel economy, the operation of new HFO-fired generators should commence as soon as possible.

4-42
Table 4.2.1-4 Power Station Expansion Plan for the Koror-Babeldaob Power System Installed Capacity
Year (MW) 2008 2009 2010 2011 2012 2013 2014 2015 2016 2017 2018 2019 2020 2021 2022 2023 2024 2025
1. Peak Demand(MW) 16.28 17.70 18.94 19.36 19.84 20.43 21.20 21.50 22.24 22.71 23.13 23.69 24.02 24.29 24.51 24.65 24.75 24.76
Growth Rate(%) 8.73% 6.97% 2.22% 2.50% 2.98% 3.77% 1.39% 3.45% 2.13% 1.86% 2.42% 1.38% 1.13% 0.90% 0.59% 0.37% 0.07%
2. Generating Capacity(MW) 21.80 22.71 29.30 29.15 29.01 33.98 38.94 38.74 35.48 35.30 35.12 37.26 37.08 36.89 36.71 36.52 36.34 36.16
2.1 Malakal P/S 12.80 12.74 14.37 14.30 14.23 14.16 14.09 14.02 10.87 10.82 10.76 3.03 3.01 3.00 2.98 2.97 2.95 2.94
(1) Wartsila-1 1998 2.00 1.70 1.69 1.68 1.67 1.67 1.66 1.65 1.64 1.63 1.63 1.62 Retire
(2) Wartsila-2 1998 2.00 - - 1.70 1.69 1.68 1.67 1.67 1.66 1.65 1.64 1.63 Retire
(3) Wartsila-3 1998 2.00 1.70 1.69 1.68 1.67 1.67 1.66 1.65 1.64 1.63 1.63 1.62 Retire
(4) Mitsubishi-12 1998 3.40 3.20 3.18 3.17 3.15 3.14 3.12 3.11 3.09 3.07 3.06 3.04 3.03 3.01 3.00 2.98 2.97 2.95 2.94
(5) Mitsubishi-13 1998 3.40 3.00 2.99 2.97 2.96 2.94 2.93 2.91 2.90 2.88 2.87 2.85 Stand-by Stand-by Stand-by Stand-by Stand-by Stand-by Stand-by
(6) Caterpillar-1(High Speed) 2006 1.88 1.60 1.59 1.58 1.58 1.57 1.56 1.55 1.54 Retire
(7) Caterpillar-2 (High Speed) 2006 1.88 1.60 1.59 1.58 1.58 1.57 1.56 1.55 1.54 Retire
2.2 Aimeliik P/S 9.00 9.98 14.93 14.85 14.78 19.83 24.85 24.73 24.60 24.48 24.36 34.24 34.06 33.89 33.72 33.56 33.39 33.22
(1) Pielstick-2 1986 3.27 2.50 2.49 2.48 2.46 2.45 Retire
(2) Pielstick-3 1986 3.27 2.50 2.49 2.48 2.46 2.45 Retire
(3) Pielstick-4 1986 3.27 2.00 2.50 2.49 2.48 2.46 2.45 Retire
(4) Pielstick-5 1986 3.27 2.00 2.50 2.49 2.48 2.46 2.45 Retire
(5) Mak-CAT (Medium Speed) 2010 5.00 5.00 4.98 4.95 4.93 4.90 4.88 4.85 4.83 4.80 4.78 4.76 4.73 4.71 4.68 4.66 4.64
(6) New DG-1 2013 5.00 5.00 4.98 4.95 4.93 4.90 4.88 4.85 4.83 4.80 4.78 4.76 4.73 4.71
(7) New DG-2 2013 5.00 5.00 4.98 4.95 4.93 4.90 4.88 4.85 4.83 4.80 4.78 4.76 4.73 4.71
(8) New DG-3 2014 5.00 5.00 4.98 4.95 4.93 4.90 4.88 4.85 4.83 4.80 4.78 4.76 4.73
(9) New DG-4 2014 5.00 5.00 4.98 4.95 4.93 4.90 4.88 4.85 4.83 4.80 4.78 4.76 4.73
(10) New DG-5 2019 5.00 5.00 4.98 4.95 4.93 4.90 4.88 4.85
(11) New DG-6 2019 5.00 5.00 4.98 4.95 4.93 4.90 4.88 4.85
5.52 5.01 10.36 9.80 9.17 13.55 17.74 17.25 13.24 12.59 11.99 13.57 13.06 12.60 12.20 11.87 11.60 11.40
3.20 3.18 5.00 4.98 4.95 5.00 5.00 4.98 4.95 4.93 4.90 5.00 4.98 4.95 4.93 4.90 4.88 4.85
18.60 19.53 24.30 24.18 24.06 28.98 33.94 33.77 30.53 30.37 30.22 32.26 32.10 31.94 31.78 31.62 31.47 31.31
2.32 1.83 5.36 4.82 4.22 8.55 12.74 12.27 8.29 7.66 7.09 8.57 8.08 7.65 7.27 6.97 6.72 6.54
3.00 2.99 3.17 3.15 3.14 5.00 5.00 4.98 4.95 4.93 4.90 5.00 4.98 4.95 4.93 4.90 4.88 4.85
(0.68) (1.16) 2.19 1.67 1.08 3.55 7.74 7.30 3.34 2.74 2.19 3.57 3.11 2.70 2.35 2.07 1.84 1.69Source: Forecasted by JICA Study Team Remarks: Decreasing factor for each engine is supposed to be 0.5 % per annum.
7. Capacity of second largest Generator (MW)
8. Safe reserve margin(MW)(6.-7.)
3. Power Balance(MW) (2.-1.)
4. Capacity of the largest generator (MW)
5. Firm capacity (MW) (2.-4.)
6. Reserve margin(MW)(5.-1.)
Forecast (in Fiscal Year)

4-43
Fig. 4.2.1-2 shows the growth of power demand after 2008 and power development plan. The reserve margin of two largest generators is not secured in year 2008 and 2009 due to lack of long term power development planning and implementation in Palau for long periods. It is highly possible that the main power source in Palau will be still diesel generation for foreseeable future. Construction period of diesel power station requires around 24 months after concluding a contract with an equipment manufacturer and contractor. It will become longer if fund procurement period is considered. Thus, PPUC is strongly recommended to start power development planning and fund procurement planning for the period after year 2025 in or before 2020 at the latest and continue well-planned power development.
0
5
10
15
20
25
30
35
40
45
2007 2009 2011 2013 2015 2017 2019 2021 2023 2025Fiscal Year
Gen
erat
or O
utpu
t(M
W)
Power Development Plan
Peak at Gen. end +2units
Peak at Gen. end +1unit
Peak at Gen. end (Demand Forecast)
Mak-CAT5MW
new Aimeliik5MW x 2
new Aimeliik5MW x 2
new Aimeliik5MW x 2
Reserve of 1unit capacity
Reserve of 2units capacity
Fig. 4.2.1-2 Comparison of power demand forecast and power development
4.2.2 Examination of the Transmission, Distribution and Substation Facility Expansion
Plan 4.2.2.1 Planning Principles Under the Study (1) Basic Concept A transmission, distribution and substation facility expansion plan up to 2025 will be formulated under the Study based on comprehensive analysis of the efficiency, relevance and reliability, etc. of the relevant facilities. A realistic and optimal power system will be planned and special attention will be paid to the following points. ① Plan contents which take the natural environment of Palau into consideration ② Adequate establishment of the demand trend from the long-term viewpoint ③ Compatibility between the power generation facilities and transmission/distribution
facilities ④ Effective utilisation of the existing facilities (in consideration of their efficiency) ⑤ Determination of the necessary timing to boost the facilities while allowing for the
construction period

4-44
⑥ Cost reduction by means of the slimming down of the facilities and containment of the construction cost
⑦ Achievement of the required supply reliability and maintenance of adequate power quality
⑧ Compatibility with the existing facilities (common maintenance work and the sharing of spare parts)
⑨ Compatibility with existing development plans/programmes (2) Evaluation of the Transmission/Distribution and Substation Facility Expansion Plan by
Means of System Analysis A power system is commonly a complicated system where the generation and consumption of electric energy must be continually balanced. Any disturbance of the power system quickly travels through the system, resulting in the possible breaking down of the entire system almost instantaneously. For this reason, detailed analysis is necessary from the following points of view for the formulation of a future plan for the power system. 1) Secured Stable Power Supply
It is important to maintain the stable operation of the power system by means of not only maintaining an adequate voltage and frequency at the time of normal operation but also swiftly repairing accident damage without damaging the facilities when an accident occurs within the power system.
2) Rationalisation of Design Excessive investment in the power system is likely to occur when the maintenance of stable operation is the only consideration. Cost efficient planning while maintaining the reliability of an adequate power supply is necessary, demanding highly accurate analysis of the system.
3) Evaluation of Equipment and Control and Protection Systems Analysis from the viewpoint of the installed capacity and fault current interupting capability, etc. is essential to determine the specifications of new equipment to be added to the power system. Evaluation and confirmation of the power system protection system, which is installed to protect the equipment at the time of an accident, must be conducted without fail. For the present Study, the following power system analysis will be conducted in accordance with the flow shown in Fig. 4.2.2-1.
• Confirmation of the secured installed supply capacity by means of power flow
calculation • Analysis of the static stability and transient stability of the system • Confirmation of the maintenance of an adequate voltage and voltage stability • Checking of any exceeding of the rated interrupting current of the circuit breaker by
means of calculating the short-circuit current

4-45
Planning of Palau Power System START
-Demand Forecast (Long-Term Projection) -Plan to Develop New Power Sources and Expand the Existing Sources -Plan to Construct New Substations and to Expand the Existing Substations -Plan to Construct New Transmission Lines and Expand the Existing Lines
Current < InstalledCapacity Tolerance -Expansion of the
Existing Facilities -Installation of New Facilities
Computation of Short-circuit Current (Short-Circuit Capacity Diagramme)
-Review of the Measure to Expand the Existing Facilities
-System Change -Replacement of Circuit
Breaker
Preservation of Stability
Maintenance of Adequate Voltage and Confirmation of Voltage Stability
No
YES
No Short-Circuit Current <Facility Tolerance
YES
Review of the Measure to Expand the Existing
Facilities
No
YES
END
Analysis of System Stability Data on protective relays is required
Setting and operating hours, etc.
Power Flow Calculation Data on the existing system is required
Impedance and system capacity, etc.
Fig. 4.2.2-1 Flow of Power Analysis Work

4-46
4.2.2.2 Review of the Development Plan of the PPUC The latest plan of the PPUC for expansion of the transmission, distribution and substation facilities is the Strategic Plan for 2003 to 2008 formulated by a US consultancy firm (Oceanic Companies, Inc.) in August, 2003. One of its reports entitled “Financing Basis and Construction Plan for a New Power Plant and Upgrading of Transmission and Distribution” points out the problems of the present power system and proposes a transmission, distribution and substation facilities upgrading plan. Table 4.2.2-1 shows the outline of this upgrading plan, its review results and the present situation.
Table 4.2.2-1 Review Results of the PPUC’s Upgrading Plan Proposed Item Outline Present Situation and Evaluation
Construction of a new substation in Koror State
A new substation and transmission line are required as power supply to Koror State where the power demand in Palau is concentrated can become impossible if a problem occurs with the transformer at the Airai Substation or the transmission line between Airai and Aimeliik.
Koror State is responsible for 75% of the power demand in Palau. The construction of a new substation is required following the installation of the second transmission line between the Aimeliik Power Station and Koror State.
Construction of a new seabed transmission line (34.5 kV) between the Aimeliik Power Station and T Dock on Koror Island
A new seabed transmission line will be constructed to double the power supply lines from the Aimeliik Power Plant to Koror State to rectify the fragile power supply system for Koror State to improve the power supply reliability.
The construction of an overhead line may be considered as an alternative because of cost and environmental considerations.
Overhead transmission line (34.5 kV) between T Dock and the Koror Substation
Following the construction of a new seabed transmission line as outlined above, a new transmission line will be required between the terminal section of this seabed line on the Koror side and the Koror Substation.
This new line will be required if a new seabed transmission line is constructed.
Increased voltage for the distribution line between the Kokusai Substation and Melekeok State (upgrading to a transmission line)
While power supply to Melekeok, the new capital, is currently provided from the Kokusai Substation via a 13.8 kV distribution line, upgrading of this line to a 34.5 kV transmission line is necessary in view of an expected demand increase in the coming years.
As the transformer capacity at the Kokusai Substation has been increased from 750 kVA to 5 MVA, any demand increase can be met for some time. The old HDCC 38 mm2 wire has been replaced by AAC 150 mm2 wire.
Construction of a new substation in the capital (Melekeok State)
The construction of a new substation is required to ensure a stable power supply for the new capital as explained above.
As above
Replacement of the wire of the Malakal distribution line
The capacity of the existing distribution wire (HDCC 38 mm2) is insufficient for some feeder line and consideration of its replacement by AAC 150 mm2 wire is necessary.
Already completed
Upgrading of the distribution lines on Koror Island
The distribution line on Koror Island uses wooden poles at some sections and their modernisation is necessary. Along with the modernisation work, replacement of the wire from HDCC 38 mm2 to AAC 150 mm2
should be considered to increase the distribution capacity.
Modernisation work is being conducted when found to be necessary.
Introduction of a SCADA system
The installation of a new seabed transmission line will enable loop operation between the Aimeliik Power Station and Koror State, an important load area, and both the reliability of the power supply and the flexibility of operation of the power facilities will improve. To achieve this, however, the introduction of a SCADA system is necessary so that the entire status of operation can be constantly monitored.
A SCADA system has already been introduced by a US consultancy firm (Electric Power Systems, Inc.) However, some improvements are required, including the introduction of a full range of equipment and the ability to download records.

4-47
4.2.2.3 Transmission, Distribution and Substation Facility Expansion Plan A transmission, distribution and substation facility expansion plan has been formulated based on the review results described in the previous section and the latest survey findings. Fig. 4.2.2-2 through Fig. 4.2.2-4 show the configuration of the transmission system in 2008 (present), 2013 and 2025. Meanwhile, Fig. 4.2.2-5 and Fig. 4.2.2-6 show the configuration of the distribution grid in Koror State in 2008 (present) and 2013. Table 4.2.2-2 outlines the planned projects and their timing. (1) Construction of the New Koror Substation The new Koror Substation will be constructed as an important substation to supply power to Koror State, replacing the Airai Substation. As shown in Fig. 4.2.2-3, a lead-in wire arrangement is adopted for the existing Airai-Malakal transmission line and two supply routes from the Aimeliik Power Station to the Koror Substation will be secured to enable continual power supply when one transmission line breaks down. 3 MVA capacitors will be installed in the Malakal Power Plant and the Koror Substation to compensate for a voltage drop of the system. There are two options to install the compensator. One is to install 3 MVA at the same time, and the other is to increase the capacity step by step according to the necessity. The first option has an advantage in reducing transmission loss while the second option has an advantage in reducing the initial cost. In case that a PPUC plan, which is to install some capacitors to distribution lines in 2008, has been carried out actually, the timing and capacity of installing the capacitors in the Malakal Power Station and the Koror Substation must be reconsidered and revised according to the power factor of the total power system after the capacitors installation to distribution lines. It is assumed that the new Koror Substation will cater for some 70% of the power load in Koror State after its commissioning as shown in Fig. 4.2.2-6. FY 2013 is planned as the year of commissioning in line with the completion of both the new transmission line and the new gererating units at the Aimeliik Power Plant. The detailed examination results are explained later in 5.1.2.2 – Preliminary Design.
Table 4.2.2-2 Transmission, Distribution and Substation Facility Expansion Plan Up To FY 2025 FY Project Outline Estimated Cost
(MUSD)
2008 Relocation of transmission and distribution lines Relocating parts of transmission and distribution lines along the Compact road PPUC Planned
2008 Extension of distribution lines to unelectrified areas Parts of Ngiwal and Airai States PPUC Planned2008 Capacitor installation in distribution lines 13.8kV, Total 4.4MVA PPUC Planned
2009 SCADA improvement Completion of repair by EPS and adding data store function PPUC Planned
2010 Auto-Recloser installation in Babeldaob 13.8kV, 6 places (Aimeliik 1, Aimeliik 2, Nekken, Ibobang, Ngaraad 1, Ngaraad 2) PPUC Planned
2012 Installation of a capacitor at the Malakal Power Station 34.5 kV; 3 MVA 0.3
Construction of the Koror Substation 34.5 kV; 15 MVA; three transmission circuits; 3 MVA capacitor 3.0
Construction of the new Aimeliik-Koror transmission line
34.5 kV; 19.3 km; AAC 150 mm2 2.7
Construction of the new Nekken-Kokusai transmission line
34.5 kV; 3.1 km; AAC 150 mm2 0.3
Improvement of the distribution grid in Koror State Improvement of the distribution grid following the construction of the new Koror Substation 0.2
2013
Construction of the new Aimeliik Substation 34.5 kV; 15 MVA x 1 new transformer; relocation of two existing transformers; three transmission circuits 4.2

4-48
FY Project Outline Estimated Cost (MUSD)
2013 Control Center and transmission line improvement in Northern area
Upgrading SCADA, Equipment for Control Center, 34.5 kV Auto-Reclosers in three places (Kokusai, Asahi and Ngerdmau)
0.5
2014 – 2019
2020 - 2024 Rebuilding of the Airai Substation (to be conducted in correspondence with the situation of equipment deterioration)
34.5 kV; 15 MVA; three transmission circuits 2.5
Construction of the new Airai-Melekeok transmission line
34.5 kV; 24.5 km; AAC 150 mm2 2.5
Construction of the new Melekeok Substation 34.5 kV; 10 MVA; three transmission circuits 2.3 Increase of the voltage of the Kokusai-Melekeok distribution line
13.8 kV → 34.5 kV; 10.5 km 0.2
2025
Replacement of a transformer at the new Aimeliik Substation
34.5 kV; 10 MVA (one unit) → 15 MVA (one unit) 1.2
(2) Construction of the New Aimeliik-Koror Transmission Line The 2003 Strategic Plan recommends the construction of a new Aimeliik-Koror transmission line using submarine cable. However, as a result of comprehensive analysis of the cost and environmental implications of the new line, it has now been decided to double the Aimeliik-Koror transmission line by introducing a new overhead transmission line to improve the reliability of power supply on this route. The planned time for commissioning is FY 2013 in accordance with the plan to commission the new generating units at the Aimeliik Power Plant. The detailed examination results are explained later in 5.1.2.1 – Preliminary Design.

4-49
Existing Power System in Palau (2008)
G
G
NGERDMAU S/S
NGERAAD-2
NGERAAD-1/
ASAHI S/S
IBOBANG S/S
KOKUSAI S/S
NEKKEN S/S
AIMELIIK-1S/S
AIMELIIK P/P
AIMELIIK-2S/S
AIRAI S/S
MALAKAL P/P
Fig. 4.2.2-2 Transmission Line (2008)

4-50
Power System of Palau in 2013
G
G
NGERDMAU S/S
NGERAAD-2
NGERAAD-1ASAHI S/S
IBOBANG S/S
NEKKEN S/S
AIMELIIK-1S/S
AIMELIIK P/P
AIRAI S/S
MALAKAL P/P
KOROR S/S
①
KOKUSAI S/S
AIMELIIK-2S/S
Fig. 4.2.2-3 Transmission Line (2013)

4-51
Power System of Palau in 2025
G
G
NGERDMAU S/S
NGERAAD-2
NGERAAD-1ASAHI S/S
IBOBANG S/S
NEKKEN S/S
AIMELIIK-1S/S
AIMELIIK P/P
NEW AIRAI S/S
MALAKAL P/P
MELEKEOK S/S
②③
KOROR S/S
AIMELIIK-2S/S
Replacing AIRAI S/Saccording to the operatingconditions by 2025
KOKUSAI S/S
Fig. 4.2.2-4 Transmission Line (2025)

4-52
Fig. 4.2.2-5 Distribution Line in Koror (2008)

4-53
Fig. 4.2.2-6 Distribution Line in Koror (2013)

4-54
(3) Construction of the New Aimeliik Substation In accordance with the installation of two new diesel generators at the Aimeliik Power Station scheduled to take place in 2013, the construction of the new Aimeliik Substation next to the power station is planned. The detailed analysis results are explained in 5.1.2.3 – Preliminary Design. (4) Improvement of the Distribution Grid in Koror State As a result of the examination of the preferable distribution method for Koror State after the construction of the new Koror Substation, it is now planned to draw two feeder distribution lines from the Koror Substation for their connection to the existing distribution line between Airai and Koror and the distribution line in the Ngerchemai District respectively as shown in Fig. 4.2.2-6. For the connection to Ngerchemai District, if the direct route from the Koror Substation to the existing line cannot be realized due to the problems of land acquisition and environmental issues, another route shown in Fig. 4.2.2-7 may be selected. At present, power load in Koror is separated by two switches, M55 and L75. After the Koror Substation starts operation, M55 and L10 should be used to share the power load in Koror, so that the Koror Substation will take about 70 % of the Koror load and the Malakal Power Plant will take about 30 % of that. All switches in 13.8 kV distribution lines are manually operated at this moment, however, the PPUC has a plan to change M55 and M124 to remote controlled switches and besides, the new switch and L10, L75, M53 should be operated by remote control in order to quickly change the power load in Koror for minimizing the outage in an emergency.
Fig. 4.2.2-7 Installation Method for Feeders from Koror Substation
Koror Substation
Airai Substation
K-BBridge
Ngerchemai District
Malakal Power Plant
Feeder 1 Feeder 2
Feeder 2 Route 1
Feeder 2 Route 2
Place necessary for careful consideration on land acquisition and environmental issues
〔Legend〕
Switch Circuit Breaker Existing distribution line New distribution line (Feeder 1) New distribution line (Feeder 2)

4-55
(5) Rebuilding of the Arai Substation Since its construction in 1986, the Airai Substation has lacked proper maintenance and its state of deterioration is often pointed out. It is planned to overhaul the transformer in 2008 with the follow-up assistance of the JICA. While it is inferred that this substation will probably operate for another 10 years after this overhaul, rebuilding of the substation is likely to be necessary around 2020 to 2025. The precise timing of such rebuilding work will depend on the state of deterioration of the building. As shown in Fig. 4.2.2-4, a π arrangement will be made for the lead-in cable of the Aimeliik-Airai transmission line at the time of this rebuilding work to allow for extension of the transmission line in the direction of Melekeok if required. (6) Upgrading of the Voltage of the Kokusai-Melekeok Distribution Line (Upgrading to a
Transmission Line) At present, Melekeok State in which the new capital is located receives 13.8 kV power distribution from the Kokusai Substation. Given the importance of ensuring the reliability of power supply for the capital, the Strategic Plan calls for upgrading of the existing distribution line to a 34.5 kV transmission line. Although the power demand in Melekeok State has been rapidly increasing since the relocation of the capital to this state as shown in Fig. 2.3.1-2, it is still around 600 kW based on the results for 2007. Even if a high level of power demand in the near future is assumed, it can be dealt with by the existing transformer (capacity: 5 MVA) at the Kokusai Substation. Moreover, the capital has a reserve diesel generator (2.0 MW) and long outages are unlikely to occur. For this reason, upgrading of the Kokusai-Melekeok distribution line to a 34.5 kV transmission line is not an urgent requirement from the viewpoint of the power demand. As the postponement of investment is a very effective way of improving the financial health of the PPUC, the implementation of this project based on careful consideration of the demand growth trend and the development situation in and around the capital is desirable. Upgrading to a transmission line can be achieved by either using the existing distribution line or installing a new 34.5 kV transmission line. In both cases, a source to supply power to the capital via a different route will be required because of the necessity to suspend the use of the existing distribution line for a long period of time as described in Table 4.2.2-3.
Table 4.2.2-3 Comparison of Voltage Increase Methods Between Kokusai and Melekeok Power Supply Method Advantages and Disadvantages
Use of the existing distribution line
• Low cost • A source to supply power via a different route will be required as the
existing distribution line will be inoperable for a long period of time. Construction of a new 34.5 kV transmission line on the same route
• Power supply to the capital will be suspended for a long period of time and some supports for the existing distribution line will require relocation.
• The existing distribution line will no longer be required as there will be no power demand between the Kokusai Substation and Melekeok.
Two alternative routes to supply power to the capital are feasible as shown in Table 4.2.2-4. As both routes run along Compact Road, few problems are anticipated in regard to the construction and maintenance of a new transmission line. The construction of the Airai-Melekeok transmission line (alternative ) is preferable for the future of the Koror-Babeldaob power system from the viewpoint of a possibility of new substation construction
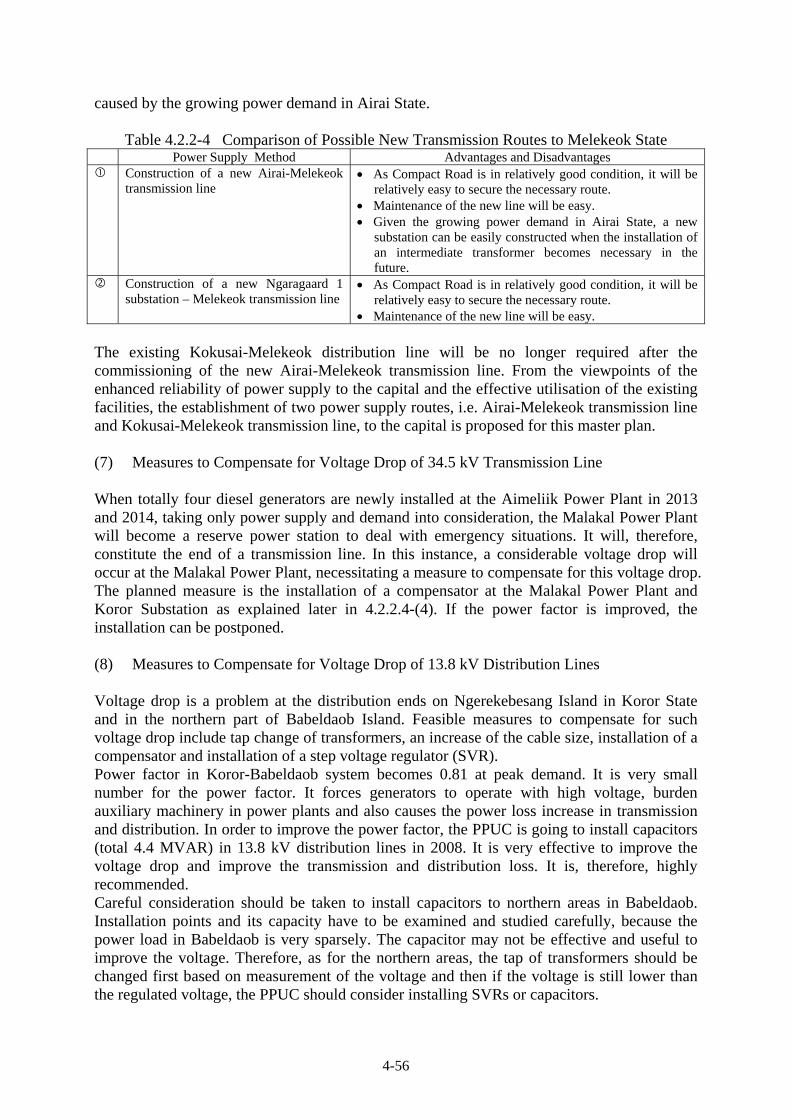
4-56
caused by the growing power demand in Airai State.
Table 4.2.2-4 Comparison of Possible New Transmission Routes to Melekeok State Power Supply Method Advantages and Disadvantages Construction of a new Airai-Melekeok
transmission line • As Compact Road is in relatively good condition, it will be
relatively easy to secure the necessary route. • Maintenance of the new line will be easy. • Given the growing power demand in Airai State, a new
substation can be easily constructed when the installation of an intermediate transformer becomes necessary in the future.
Construction of a new Ngaragaard 1 substation – Melekeok transmission line
• As Compact Road is in relatively good condition, it will be relatively easy to secure the necessary route.
• Maintenance of the new line will be easy. The existing Kokusai-Melekeok distribution line will be no longer required after the commissioning of the new Airai-Melekeok transmission line. From the viewpoints of the enhanced reliability of power supply to the capital and the effective utilisation of the existing facilities, the establishment of two power supply routes, i.e. Airai-Melekeok transmission line and Kokusai-Melekeok transmission line, to the capital is proposed for this master plan. (7) Measures to Compensate for Voltage Drop of 34.5 kV Transmission Line When totally four diesel generators are newly installed at the Aimeliik Power Plant in 2013 and 2014, taking only power supply and demand into consideration, the Malakal Power Plant will become a reserve power station to deal with emergency situations. It will, therefore, constitute the end of a transmission line. In this instance, a considerable voltage drop will occur at the Malakal Power Plant, necessitating a measure to compensate for this voltage drop. The planned measure is the installation of a compensator at the Malakal Power Plant and Koror Substation as explained later in 4.2.2.4-(4). If the power factor is improved, the installation can be postponed. (8) Measures to Compensate for Voltage Drop of 13.8 kV Distribution Lines Voltage drop is a problem at the distribution ends on Ngerekebesang Island in Koror State and in the northern part of Babeldaob Island. Feasible measures to compensate for such voltage drop include tap change of transformers, an increase of the cable size, installation of a compensator and installation of a step voltage regulator (SVR). Power factor in Koror-Babeldaob system becomes 0.81 at peak demand. It is very small number for the power factor. It forces generators to operate with high voltage, burden auxiliary machinery in power plants and also causes the power loss increase in transmission and distribution. In order to improve the power factor, the PPUC is going to install capacitors (total 4.4 MVAR) in 13.8 kV distribution lines in 2008. It is very effective to improve the voltage drop and improve the transmission and distribution loss. It is, therefore, highly recommended. Careful consideration should be taken to install capacitors to northern areas in Babeldaob. Installation points and its capacity have to be examined and studied carefully, because the power load in Babeldaob is very sparsely. The capacitor may not be effective and useful to improve the voltage. Therefore, as for the northern areas, the tap of transformers should be changed first based on measurement of the voltage and then if the voltage is still lower than the regulated voltage, the PPUC should consider installing SVRs or capacitors.

4-57
(9) Extension of Distribution Lines to Unelectrified Areas There are still unelectrified areas in parts of Ngiwal State and Airai State and the extension of a distribution line to these areas is necessary. Because of the high level of urgency and small budget requirement, the implementation of the necessary work disregarding the target period of the master plan (2010 – 2025) is preferable. (10) Upgrading of SCADA and Control Center Establishment Since installation of the existing SCADA system has not yet finished, important functions to operate the power system, such as controlling remote controlled switches and auto-reclosers, should be set as soon as possible. Furthermore, the function of storing operation data should be added because it is very useful and important for grasping operational conditions of the power system. The new Aimeliik-Koror transmission line and new Koror Substation will be installed in 2013. In accordance with the above transmission system expansion, the Control Center should be established in the same year. To operate all transmission and distribution system in the PPUC, the SCADA system must be upgraded. The detailed examination results are explained later in 6.2.3. (11) Installation of Auto-Reclosers in 34.5 kV Transmission Lines and 13.8 kV Distribution
Lines At present, no circuit breaker with proper protection system is installed and no function to measure voltage, current, power factor, etc. is provided on 13.8 kV feeders of six substations (Aimeliik 1, Aimeliik 2, Nekken, Ibobang, Ngaraad 1 and Ngaraad 2). To solve this problem, newly installation of auto-reclosers at the said six substations should be realized before 2010, so that operators can remotely control and supervise the feeders. The Aimeliik-Babeldaob transmission line is protected by only one circuit breaker installed in the Aimeliik Substation. Because the distance of this transmission line is so long, over 50 km, it takes much time to locate the fault point. In order to properly protect the transmission line and quickly detect the fault point, three auto-reclosers should be added. The installation timing would be in 2013 in synchronization with the Control Center establishment. 4.2.2.4 Power System Analysis Results System analysis was conducted for the present power system and future power system examined in the previous section and the problems were checked and verified. This system analysis was conducted using POPONAS (a power system stability analysis system developed by the Central Research Institute of Electric Power Industry) and ADAPOS (a power system analysis support system developed by Mitsubishi). (1) Power Flow Calculation Results Power flow calculation was conducted for those years (2012, 2013, 2024 and 2025) in which the system configuration will differ from the present configuration (2008). Fig. 4.2.2-8 through Fig. 4.2.2-14 show the results of these calculations and whether or not the transmission and substation facilities are within the tolerance of the installed capacity was checked based on these calculation results.

4-58
In regard to the transformers, it was confirmed that no cross-section exceeds the tolerance as shown in Table 4.2.2-5. All of the transmission lines use or plan to use AAC 150 mm2 wire and the available transmission capacity is 23 MW. It was also confirmed that no cross-section on any route exceeds 23 MW.
Table 4.2.2-5 Comparison Between Power Flow Calculation Results and Transformer Capacities
Substation Capacity (MVA) 2008 2012 2013 2024 2025
Ngeraard2 0.75 0.07 0.08 0.09 0.11 0.11 Ngeraard1 0.225 0.10 0.13 0.13 0.16 0.16 Ngerdmau 0.225 0.04 0.05 0.05 0.06 0.06 Asahi 0.3 0.12 0.15 0.15 0.18 0.18 Ibobang 0.225 0.03 0.04 0.04 0.04 0.05 Kokusai 5 0.73 0.92 0.94 1.13 - Nekken 0.225 0.04 0.05 0.05 0.06 0.06 Aimelik-1 0.3 0.12 0.15 0.16 0.19 0.19 Aimelik-2 0.225 0.12 0.15 0.16 0.19 0.19 Airai 10 7.14 8.94 2.90 3.46 9.47 Malakal 10 0.81 2.17 1.61 2.55 2.55 Aimeliik 20 7.72 12.85 - - - Koror 15 - - 9.73 11.61 11.65 Melekeok 10 - - - - 1.13 New Aimeliik 35 - - 16.05 19.74 19.81
(2) Short-Circuit Current Calculation Results It has been confirmed that the short-circuit current calculated based on the system analysis results is within the breaking capacity of each existing circuit breaker as shown in Table 4.2.2-6 and Table 4.2.2-7. For each of the planned new circuit breakers, the rated breaking current will be selected based on the said analysis results.

4-59
Fig. 4.2.2-8 Power Flow in 2008

4-60
Fig. 4.2.2-9 Power Flow in 2012

4-61
Fig. 4.2.2-10 Power Flow in 2013

4-62
Fig. 4.2.2-11 Power Flow in 2014
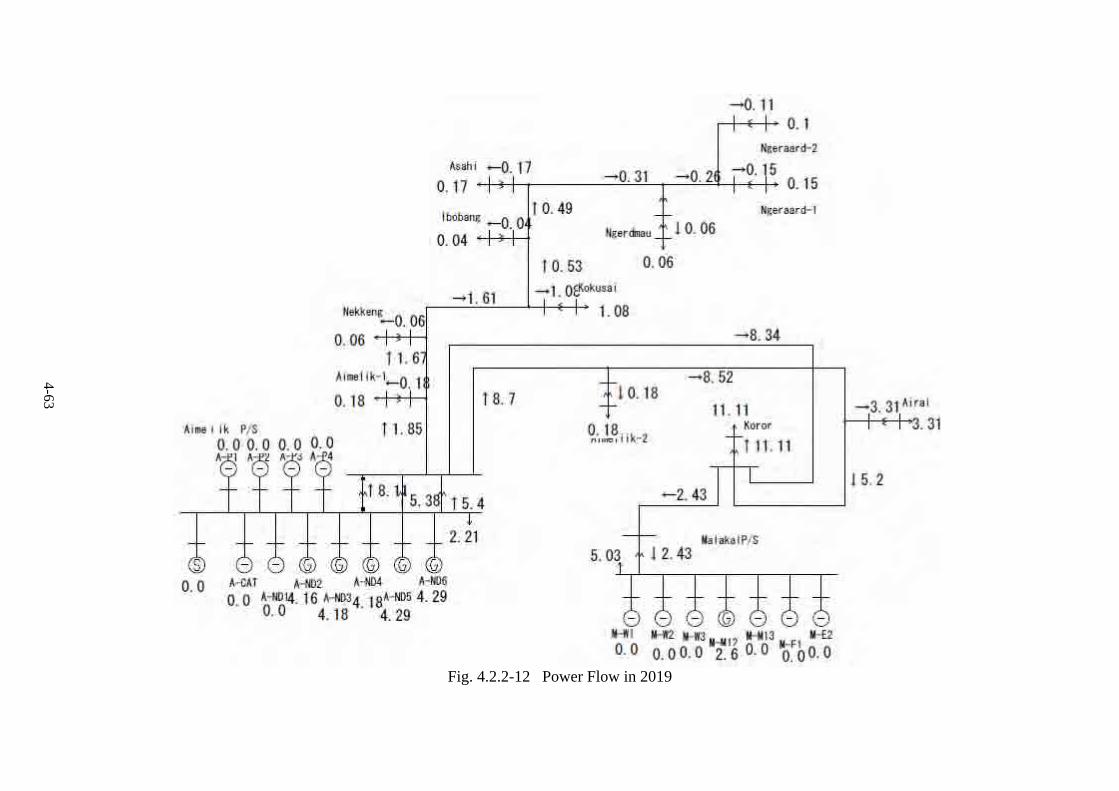
4-63
Fig. 4.2.2-12 Power Flow in 2019

4-64
Fig. 4.2.2-13 Power Flow in 2024

4-65
Fig. 4.2.2-14 Power Flow in 2025

4-66
Table 4.2.2-6 Short-Circuit Current Calculation Results and Rated Interrupting Current of Circuit Breakers (for the Power System in 2008)
Short-Circuit Capacity (MVA) Short-Circuit Current (kA) Rated Interrupting Current
of Circuit Breaker (kA) 34.5 kV side 13.8 kV side 34.5 kV side 13.8 kV side 34.5 kV side 34.5 kV sideNgeraard2 39 1 0.7 0.04 - - Ngeraard1 45 10 0.8 0.42 - - Ngerdmau 53 1 0.9 0.04 - - Asahi 72 5 1.2 0.21 - - Ibobang 83 1 1.4 0.04 - - Kokusai 97 43 1.6 1.80 - - Nekken 135 1 2.3 0.04 - - Aimelik-1 160 5 2.7 0.21 - - Aimelik-2 133 1 2.2 0.04 - - Airai 133 76 2.2 3.18 12.5 18 Malakal 124 130 2.1 5.44 12.5 12.5 Aimeliik 165 2.8 12.5
Table 4.2.2-7 Short-Circuit Current Calculation Results and Rated Interrupting Current of Circuit Breakers (for the Power System in 2013)
Short-Circuit Capacity (MVA) Short-Circuit Current (kA) Rated Interrupting Current
of Circuit Breaker (kA) 34.5 kV side 13.8 kV side 34.5 kV side 13.8 kV side 34.5 kV side 34.5 kV sideNgeraard2 39 1 0.7 0.04 - - Ngeraard1 45 10 0.8 0.42 - - Ngerdmau 54 1 0.9 0.04 - - Asahi 72 5 1.2 0.21 - - Ibobang 83 1 1.4 0.04 - - Kokusai 97 43 1.6 1.80 - - Nekken 135 1 2.3 0.04 - - Aimelik-1 161 5 2.7 0.21 - - Aimelik-2 128 1 2.1 0.04 - - Airai 135 75 2.3 3.14 12.5 18 Malakal 114 95 1.9 3.97 12.5 12.5 Aimeliik 165 244 2.8 10.21 12.5 Koror 130 2.2 (3) Power System Stability Analysis Both static stability and transient stability analysis for the Koror- Babeldaob power system were conducted in the Study. The static stability of all generators was kept in case of no power system fault. The transient stability analysis this time featured the two cases listed below and convergence took place without any problems as shown in Fig. 4.2.2-15 and Fig. 4.2.2-16. (System Analysis Conditions) Case : In 2025 (breakdown of one transformer at the Aimeliik Power Station) Case : In 2025 (interruption of the transmission route between the Kokusai Substation
and Melekeok)

4-67
(at the Malakal Power Plant)
(at the Aimeliik Power Plant)
Fig. 4.2.2-15 Simulated Waveform at the Time of the Breakdown of One Transformer at the Aimeliik Power Station (Case )
Breakdown of Transformer Base
Inte
rnal
Pow
er A
ngle
(°)
Time (seconds)
Breakdown of Transformer Base
Inte
rnal
Pow
er A
ngle
(°)
Time (seconds)

4-68
(at the Malakal Power Plant)
(at the Aimeliik Power Plant)
Fig. 4.2.2-16 Simulated Waveform at the Time of Interruption of the Transmission Route Between the Kokusai Substation and Melekeok (Case )
Base
Inte
rnal
Pow
er A
ngle
(°)
Time (seconds)
Base
Inte
rnal
Pow
er A
ngle
(°)
Time (seconds)

4-69
(4) Voltage Drop and Transmission Loss Following the installation of four new generators at the Aimeliik Power Station in 2013 and 2014, the generating units at the Malakal Power Station will only be operated at the time of an emergency. As a result, the Malakal Power Station will become an end of the power system and the voltage drop there is expected to cause problems. Measures to compensate for such a voltage drop have been examined with each year cross-sections. Given the fact that the load power factor for the present Koror-Babeldaob power system reaches some 81% at peak hours, the voltage drop has been examined for two cases of the load power factor, i.e. 80% and a slightly improved 90%. As described below, while there is currently no problem, some measures will be necessary to deal with the low voltage at the Malakal Power Plant from 2013 onwards. 1) Measures to Improve Voltage Drop
① Conditions of Voltage Regulation in This Simulation
Two measures to improve the voltage drop are generally adopted as below: - Voltage regulation by compensators - Voltage regulation by generators As operation using a higher generator voltage is undesirable because of its negative impacts on the generator and auxiliary machinery, the sending voltage is regulated by tap change of the step-up transformer as an alternative measure. Compensators are installed at the place with significantly dropped voltage. From this concept, the Malakal Power Plant, the Koror Substation and the Airai Substation are selected. However the Airai Substation will be excluded because there is no space for a compensator.
② Criteria of Voltage Regulation
Voltage is regulated based on the following criteria. - Not less than 95% of 34.5 kV at normal operation - Not less than 85% of 34.5 kV when a loop-off fault occurs at loop operation after commissioning of the new transmission line from Aimeliik to Koror in 2013
③ Measures to Improve Voltage Drop (a) In the case where no generator at the Malakal Power Plant is operated after 2014
In case of 90 % of power factor, if the tap of the step-up transformer at the new Aimeliik Substation is changed and the sending voltage is kept higher, the above criteria can be cleared. In case of 80 % of power factor, countermeasures shown in Table 4.2.2-8 are necessary. Fig. 4.2.2-17 and Fig. 4.2.2-18 show the voltage change of 34.5kV transmission system by year at the Airai Substation and the Malakal Power Plant respectively. As understood from these figures, any countermeasures against voltage drop have to be taken if all generators at the Malakal Power Plant stop operation in 2014. Fig. 4.2.2-19 and Fig. 4.2.2-20 indicate the voltage drop when a loop-off fault of the Aimeliik-Koror transmission line occurs. The tremendous system voltage drop also requires any countermeasures.

4-70
Table 4.2.2-8 Countermeasures necessary in case of 80% Power Factor FY Countermeasures against voltage drop
2014 - Change the tap of the step-up transformer at new Aimeliik Substation (5% up) - Install a 1 MVA compensator at Koror Substation and Malakal Power Plant respectively
2015 - Increase the capacity by 0.5 MVA at Koror Substation and Malakal Power Plant respectively
2017 - Increase the capacity by 0.5 MVA at Koror Substation and Malakal Power Plant respectively
2019 - Increase the capacity by 0.5 MVA at Koror Substation and Malakal Power Plant respectively
2020 - Increase the capacity by 0.5 MVA at Koror Substation and Malakal Power Plant respectively (in consideration of loop-off)
2023 - Increase the capacity by 0.5 MVA at Koror Substation and Malakal Power Plant respectively (in consideration of loop-off)
85%
90%
95%
100%
2008
2009
2010
2011
2012
2013
2014
2015
2016
2017
2018
2019
2020
2021
2022
2023
2024
2025
Power Factor 80% After Voltage Improvement (Power Factor 80%)
Power Factor 90% After Voltage Improvement (Power Factor 90%)
Fig. 4.2.2-17 Voltage Change of 34.5kV Transmission System by Year at the Airai
Substation (In case of no Malakal generator operation)
85%
90%
95%
100%
2008
2009
2010
2011
2012
2013
2014
2015
2016
2017
2018
2019
2020
2021
2022
2023
2024
2025
Power Factor 80% After Voltage Improvement (Power Factor 80%)
Power Factor 90% After Voltage Improvement (Power Factor 90%)
Fig. 4.2.2-18 Voltage Change of 34.5kV Transmission System by Year at the Malakal
Substation (In case of no Malakal generator operation)
Rat
io to
rate
d vo
ltage
(%)
Rat
io to
rate
d vo
ltage
(%)

4-71
85%
90%
95%
100%
2013 2014 2015 2016 2017 2018 2019 2020 2021 2022 2023 2024 2025
Loop-off (Power Factor 80%) After Voltage Improvement (Power Factor 80%)
Loop-off (Power Factor 90%) After Voltage Improvement (Power Factor 90%)
Fig. 4.2.2-19 Voltage Change of 34.5kV Transmission System by Year at the Airai Substation
(in case of a loop-off fault and no Malakal generator operation)
85%
90%
95%
100%
2013 2014 2015 2016 2017 2018 2019 2020 2021 2022 2023 2024 2025
Loop-off (Power Factor 80%) After Voltage Improvement (Power Factor 80%)
Loop-off (Power Factor 90%) After Voltage Improvement (Power Factor 80%)
Fig. 4.2.2-20 Voltage Change of 34.5kV Transmission System by Year at the Malakal
Substation (in case of a loop-off fault and no Malakal generator operation)
(b) In the case where at least one generator at the Malakal Power Plant is operated after 2014 A generator at the Malakal Power Plant can regulate the voltage. It can reduce the voltage drop at the Malakal Power Plant, the Koror Substation and the Airai Substation. If measures to improve the voltage, in addition to the Malakal generator operation, are taken, power quality will be fairly improved and also transmission loss will be reduced. Fig. 4.2.2-21 and Fig. 4.2.2-22 show the voltage change of 34.5kV transmission system by year at the Airai Substation and the Malakal Power Plant respectively in the case where one generator (Mitsubishi-12) is operated and measures to improve the voltage, such as the tap change of the step-up transformer at the new Aimeliik
Rat
io to
rate
d vo
ltage
(%)

4-72
Substation and installation of capacitors at the Koror Substation and the Malakal Power Plant, are taken. In these cases, the voltage can be kept near the rated voltage and operation of a generator at the Malakal Power Plant helps improve the power quality. Compared to the case of no generator operation at the Malakal Power Plant, the deference of voltage drop by power factor is small. So it has another significant merit.
85%
90%
95%
100%
105%
2008 2009 2010 2011 2012 2013 2014 2015 2016 2017 2018 2019 2020 2021 2022 2023 2024 2025
After Voltage Improvement (Power Factor 80%) After Voltage Improvement (Power Factor 90%)
Fig. 4.2.2-21 Voltage Change of 34.5kV Transmission System by Year at the Airai
Substation (In case of Malakal generator operation)
85%
90%
95%
100%
105%
2008 2009 2010 2011 2012 2013 2014 2015 2016 2017 2018 2019 2020 2021 2022 2023 2024 2025
After Voltage Improvement (Power Factor 80%) After Voltage Improvement (Power Factor 90%)
Fig. 4.2.2-22 Voltage Change of 34.5kV Transmission System by Year at the Malakal
Substation (In case of Malakal generator operation)
Table 4.2.2-9 and Table 4.2.2-10 show data of the voltage in 34.5kV transmission system by year at main power plants and substations in the case where one generator (Mitsubishi-12) is operated and measures to improve the voltage are taken. The voltage at the Ngaraard-1 and Ngaraard-2 that are located in the northern end of 34.5 kV transmission line can be kept properly.
Rat
io to
rate
d vo
ltage
(%)
Rat
io to
rate
d vo
ltage
(%)

4-73
Table 4.2.2-9 Voltage Change of 34.5kV Transmission System by Year at Power Plants and Substations (In case of power factor 80% and Malakal generator operation after voltage improvement) [Unit: p.u.]
2008 2009 2010 2011 2012 2013 2014 2015 2016 2017 2018 2019 2020 2021 2022 2023 2024 2025 Aimelik 0.991 0.990 0.990 0.990 0.989 0.989 1.035 1.036 1.036 1.036 1.036 1.037 1.036 1.036 1.037 1.037 1.037 1.035 Airai 0.962 0.955 0.949 0.947 0.946 0.953 0.992 0.993 0.991 0.993 0.991 0.993 0.992 0.991 0.993 0.993 0.992 0.992 Koror 0.952 0.989 0.990 0.989 0.990 0.989 0.991 0.990 0.989 0.991 0.991 0.990 0.989 Malakal 0.975 0.970 0.964 0.963 0.961 0.963 0.992 0.994 0.993 0.995 0.993 0.995 0.994 0.994 0.996 0.996 0.996 0.992 Ngaraard -1 0.981 0.978 0.978 0.977 0.976 0.979 1.026 1.026 1.025 1.026 1.025 1.026 1.025 1.025 1.026 1.026 1.026 1.018 Ngaraard -2 0.981 0.979 0.979 0.978 0.977 0.980 1.026 1.027 1.026 1.027 1.026 1.027 1.026 1.026 1.027 1.027 1.027 1.019
* p.u.: ratio of voltage to the rated voltage
Table 4.2.2-10 Voltage Change of 34.5kV Transmission System by Year at Power Plants and Substations
(In case of power factor 90% and Malakal generator operation after voltage improvement) [Unit: p.u.] 2008 2009 2010 2011 2012 2013 2014 2015 2016 2017 2018 2019 2020 2021 2022 2023 2024 2025 Aimelik 0.995 0.994 0.995 0.995 0.995 0.994 1.038 1.038 1.038 1.038 1.038 1.037 1.037 1.037 1.037 1.037 1.037 1.038 Airai 0.971 0.966 0.961 0.960 0.959 0.965 0.998 0.997 0.996 0.995 0.994 0.993 0.993 0.992 0.992 0.991 0.991 0.998 Koror 0.963 0.996 0.994 0.993 0.993 0.991 0.990 0.990 0.989 0.989 0.988 0.988 0.994 Malakal 0.982 0.978 0.972 0.971 0.970 0.972 0.995 0.995 0.994 0.993 0.992 0.991 0.991 0.990 0.990 0.990 0.989 0.994 Ngaraard -1 0.987 0.985 0.985 0.985 0.984 0.986 1.031 1.030 1.030 1.029 1.029 1.029 1.028 1.028 1.028 1.028 1.028 1.023 Ngaraard -2 0.987 0.986 0.986 0.986 0.985 0.987 1.031 1.031 1.031 1.030 1.030 1.030 1.029 1.029 1.029 1.029 1.029 1.024

4-74
Fig. 4.2.2-23 explains the difference of 34.5kV system voltage at the Airai Substation, the Koror Substation and the Malakal Power Plant. When no generator at the Malakal Power Plant is operated, the Malakal Power Plant is the end of the 34.5 kV transmission system, so the voltage drops. On the contrary, when a generator at the Malakal Power Plant is operated, the voltage at the Malakal Power Plant rises and whole system voltage also goes up. In the case where a transmission between the Aimeliik Power Plant and the Koror Substation is looped off, power flow per circuit gets large and reactive power is consumed and finally the voltage drops tremendously.
Fig. 4.2.2-23 System Voltage between Aimeliik PP and Malakal PP
2) Measures to Reduce Transmission Loss Transmission loss is affected by the system voltage. Low power factor lowers the transmission system voltage and the low voltage produces much transmission loss as shown in Fig. 4.2.2-24. That is because a heavy current flows when the system voltage drops. When the voltage drop is improved and the flowing current is reduced, the transmission loss is also reduced. Therefore measures against voltage drop are useful for transmission loss reduction. Furthermore, operation of one generator at the Malakal Power Plant contributes to maintain the system voltage and reduce the transmission loss. The transmission loss reduction, in the case where one generator at the Malakal Power Plant is operated, deserves annually US$ 0.5 to 1.0 Million of financial benefit if it is converted using 0.1904¢/kWh of generating cost in 2007. (Refer to Table 4.2.2-11)
Aimeliik PP Malakal PP Koror SS Airai SS
Voltage In case of Malakal Generator Operation
In case of no Malakal Generator Operation
In case of no Malakal Generator Operation and Loop-off
GG
G
G

4-75
0
200
400
600
800
1,000
1,200
1,400
1,600
2008 2009 2010 2011 2012 2013 2014 2015 2016 2017 2018 2019 2020 2021 2022 2023 2024 2025
Malakal Operation (Power Factor 80%, After Voltage Improvement)Malakal Operation (Power Factor 90%, After Voltage Improvement)Malakal Stop (Power Factor 80%)Malakal Stop (Power Factor 90%)Malakal Stop (Power Factor 80%, After Voltage Improvement)Malakal Stop (Power Factor 90%, After Voltage Improvement)
Fig. 4.2.2-24 Transmission Loss Change by Year
Table 4.2.2-11 Benefit of Operation of a Generator at the Malakal Power Plant Case Item 2013 2014 2015 2016 2017 2018 2019 2020 2021 2022 2023 2024
Improvement of transmission loss (%)
2.5% 2.7% 2.9% 3.0% 3.0% 3.2% 3.3% 3.4% 3.5% 3.6% 3.6% 2.7%Power Factor 80% Annual benefit
(US$ Million) 0.6 0.7 0.8 0.8 0.9 0.9 1.0 1.0 1.0 1.1 1.1 0.8
Improvement of transmission loss (%)
1.4% 1.5% 1.6% 1.7% 1.6% 1.7% 1.7% 1.8% 1.8% 1.8% 1.9% 1.5%Power Factor 90% Annual benefit
(US$ Million) 0.4 0.4 0.4 0.5 0.5 0.5 0.5 0.5 0.5 0.5 0.6 0.4
In this Study, the new Aimeliik-Koror transmission line is to be operated in 2013. The transmission loss of a single-circuit transmission line will be more than twice of that of double-circuit transmission line. Accordingly the double-circuit transmission line is helpful to reduce the transmission loss. The transmission loss reduction, in the case where the transmission route from the new Aimeliik Substation to the Koror Substation is double- circuited, deserves annually around US$ 0.6 Million of financial benefit if it is converted using 0.1904¢/kWh of generating cost in 2007. (Refer to Table 4.2.2-12) This trial calculation is done under the condition that capacitors are installed at the Malakal Power Plant and the Koror Substation. In the case where the capacitors are not installed there, the system voltage decreases and the transmission loss increases. Therefore, installation of capacitors is effective for not only power quality management and also transmission loss reduction.
Tran
smis
sion
Los
s (kW
)

4-76
Table 4.2.2-12 Benefit of Double Circuits of Transmission Line between Aimeliik and Koror Case Item 2013 2014 2015 2016 2017 2018 2019 2020 2021 2022 2023 2024
Improvement of transmission loss (%)
1.7% 1.7% 1.7% 1.8% 1.8% 2.0% 2.0% 2.1% 2.1% 2.1% 2.1% 2.1%Power Factor 80% Annual benefit
(US$ Million) 0.4 0.4 0.5 0.5 0.5 0.6 0.6 0.6 0.6 0.6 0.6 0.6
Improvement of transmission loss (%)
1.6% 1.6% 1.6% 1.7% 1.7% 1.9% 2.0% 2.0% 2.0% 2.0% 2.1% 2.1%Power Factor 90% Annual benefit
(US$ Million) 0.4 0.4 0.4 0.5 0.5 0.5 0.6 0.6 0.6 0.6 0.6 0.6
*Calculation conditions: After voltage improvement by compensators installed at Malakal and Koror
Fig.4.2.2-25 and Fig.4.2.2-26 show the transmission loss at the peak time in 2014. As mentioned above, the transmission loss depends on the system conditions, such as voltage improvement by capacitors, loop-on or loop-off of double-circuit transmission line from Aimeliik to Koror. In every case, the transmission loss in case of Malakal generator operation is half of that in case of no Malakal generator operation.
0
500
1000
1500
2000
2500
3000
Loop-off(No Voltage Improvement)
Loo-off(After Voltage Improvement)
Loop-on(No Voltage Improvement)
Loop-on(After Voltage Improvement)
No Malakal Generator Operation Malakal Generator Operation
Fig. 4.2.2-25 Transmission Loss (In case of Power Factor 80%)
0
500
1000
1500
2000
2500
3000
Loop-off(No Voltage Improvement)
Loo-off(After Voltage Improvement)
Loop-on(No Voltage Improvement)
Loop-on(After Voltage Improvement)
No Malakal Generator Operation Malakal Generator Operation
Fig. 4.2.2-26 Transmission Loss (In case of Power Factor 90%)
Tran
smis
sion
Los
s (kW
) Tr
ansm
issi
on L
oss (
kW)

4-77
3) Continuation of the Malakal Power Plant Operation after 2014 Following the installation of four new generators at the Aimeliik Power Station in 2013 and 2014, taking only total generating capacity into consideration, the generating units at the Malakal Power Station will not be operated. However, operation of a generating unit of the Malakal Power Plant is important for power quality improvement and power loss reduction. The Malakal Power Plant located in Koror that is the most centralized area in power load with important load, such as hospitals, big hotels, etc., has a merit from the viewpoint of effective operation of total power system. It helps minimize the outage area in case of faults at transmission lines and substations, so the Malakal Power Plant plays an important role in power supply security. Once the operation is suspended, it will take much time, cost and effort to restart the operation. Above these reasons recommend the PPUC should continue to operate the Malakal Power Plant.
4) Recommendations As examined here, a fall of the load power factor will lead to increased investment in equipment because of the need to deal with a voltage drop. Meanwhile, the apparent power will increase, reducing the actual installed capacity. In contrast, a high power factor will reduce the level of the current on the transmission line, reducing the transmission loss and achieve efficient use of the transformer. Improvement of the load power factor has substantial merits and this is worth attempting for Palau where the energy supply relies on imported fuel from the viewpoint of reducing energy consumption at the national level. It may, therefore, be necessary to introduce a scheme to urge large users with a low power factor to improve their power factor by installing a compensator and/or measures to provide an incentive for power factor improvement, such as the introduction of a discount tariff for users with a better power factor than the reference power factor value of 85%. Since PPUC Electrical Service Regulations says that “The Utility may require the customer to provide, at his own expense, equipment to increase the operating power factor.”, it is recommended that the PPUC should examine power factor of each big customer. After installation of capacitors to 13.8 kV distribution network, which is planned in 2008, the PPUC should observe continuously the power factor of the distribution system and revise the plan to install capacitors at the Malakal Power Plant and the Koror Substation, which is proposed in this Study.
4.2.3 Environmental and Social Considerations at the Examination Stage of the Power
Development Plan 4.2.3.1 Power Development Projects subject to Environmental and Social
Considerations in the Master Plan Study The present Study features the power development plan for a period of 15 years from 2010 to 2025 and the power supply facility construction projects under this plan are the subjects of “environmental and social considerations at the examination stage of the power development plan”. Those projects of which the inclusion in the power development plan at the present stage is assumed are listed in Table 4.2.3-1 and Table 4.2.3-2. The installation of new equipment and the replacement of existing equipment at the existing substations are not included in the scope of the environmental and social consideration under the Study because of the negligible environmental and social impacts of such work.

4-78
Table 4.2.3-1 Power Generation Projects Included in the Power Development Plan FY Project Title Outline
2013 Replacement of Aimeliik Power Station (Phase 1)
• Procurement of two diesel generators (5 MW class) and auxiliary machinery
• Remodelling of the fuel storage and supply facilities (in the case of heavy oil firing)
• Construction of the power house (including those for the two generators in Phase 2) and an office building
2014 Replacement of Aimeliik Power Station (Phase 2)
• Procurement of two diesel generators (5 MW class) and auxiliary machinery
2019 Replacement of Aimeliik Power Station (Phase 3)
• Procurement of two diesel generators (5 MW class) and auxiliary machinery
• Construction of additional power house (for the two new generators in Phase 3)
[Remarks] Priority Projects (subject to pre-Feasibility Study)
Table 4.2.3-2 Transmission and Distribution Projects Included in the Power Development Plan
FY Project Outline Requirement for Social and Environmental Consideration
2012 Installation of a compensator at the Malakal Power Station
34.5 kV; 3 MVA No
Construction of the Koror Substation
34.5 kV; 15 MVA; three transmission circuits; 3 MVA compensator
Yes
Construction of the new Aimeliik-Koror transmission line
34.5 kV; 20.7 km; AAC 150 mm2
Yes
Construction of the new Nekken-Kokusai transmission line
34.5 kV; 3.1 km; AAC 150 mm2 Yes
Improvement of the distribution grid in Koror State
Improvement of the distribution grid following the construction of the new Koror Substation
No (Installation of switch and
replacement of cable) Construction of the new Aimeliik Substation
34.5 kV; 15 MVA x 1 new transformer; relocation of two existing transformers; three transmission circuits
To be included in the Aimeliik Power Station replacement
project because of the involvement of the same site
2013
Control Center and transmission line improvement in Northern area
Upgrading SCADA, Equipment for Control Center, 34.5 kV Auto-Reclosers in three places (Kokusai, Asahi and Ngerdmau)
No (Simple installation and/or modification of equipment)
2020 -
2024
Rebuilding of the Airai Substation (to be conducted in correspondence with the situation of equipment deterioration)
34.5 kV; 15 MVA; three transmission circuits
No (Rebuilding at the existing
substation side)
Construction of the new Airai-Melekeok transmission line
34.5 kV; 24.5 km; AAC 150 mm2
Yes
Construction of the new Melekeok Substation
34.5 kV; 10 MVA; three transmission circuits
No (Site undecided)
Increase of the voltage of the Kokusai-Melekeok distribution line
13.8 kV → 34.5 kV; 10.5 km No (Reutilizing of the existing cable)
2025
Replacement of a transformer at the new Aimeliik Substation
34.5 kV; 10 MVA (one unit) → 15 MVA (one unit)
No (Renewal of the existing transformer)
[Remarks] Priority Projects (subject to pre-Feasibility Study) The detailed introduction plan of renewable energy that is to be included in the master plan study as long-term target will be formulated based on the results of the field survey. This report contains the results of environmental and social considerations on renewable energy such as hydropower, wind power and solar power that is examined in this report as possible renewable energy resources to be incorporated into the introduction plan.

4-79
4.2.3.2 Initial Environmental Examination (IEE) on the Master Plan Study (1) Current Situation of the Target Area 1) Conservation Areas of Palau
Palau designates 21 conservation areas that consist of marine reserves, mangrove reserves, etc. and restricts activities within the conservation areas such as entrance, hunting and fishing. Especially, Lake Ngardok Nature Reserve, one of Palau’s conservation areas, was designated as important wetlands of the Ramsar List (in year 2002). Fig. 4.2.3-1 and Table 4.2.3-3 show the location and list of Palau’s conservation areas.

4-80
Source:Palau Conservation Society
Fig. 4.2.3-1 Conservation Areas of Palau

4-81
Table 4.2.3-3 List of Conservation Areas of Palau
Source:Palau Conservation Society
2) Historical and Cultural Heritage
Palau has rich historical and cultural heritage such as the stone monument in northern Babeldaob and the remains of the World War II, etc. Fig. 4.2.3-2 shows the distribution of historical and cultural heritage in Palau.

4-82
Fig. 4.2.3-2 Distribution of Historical and Cultural Heritage in Palau
Source:Palau Automated Land and Resources Information System

4-83
(2) Impact Assessment General environmental and social impact assessment on the construction projects of power supply facilities that are possible to be incorporated into the Power Development Plan is shown in the table below.
Table 4.2.3-4 Environmental and social impact assessment on the construction projects of
power supply facilities Hydropower T&D Line
Environmental Factors Dam type
Flow-intype
Microhydro
Wind Power
Solar Power
Diesel Power Over-
head Sub-
marine
Sub- station
Involuntary resettlement A B C B C B B C C Local economy, such as employment and livelihood A B C C C B B B C
Land use and utilisation of local resources A B B B B B B C B
Social institutions, such as social infrastructure and local decision-making system
C C C C C C C C C
Existing social infrastructure and services C C C C C C B C C
The poor, indigenous and ethnic people C C C C C C C C C
Erroneous communication of interests C C C C C C C C C
Cultural heritage B C C C C C C C C Local conflict of interests C C C C C C C C C Water usage or water rights and rights in common A B B C C C C C C
Public hygiene C C C C C C C C C
Soci
al E
nviro
nmen
t
Infectious diseases C C C C C C C C C Topography and geographical features A B C C C C C C C
Soil erosion B C C C C C C C C Groundwater C C C C C C C C C Hydrogical conditions A B C C C C C C C Coastal zone C C C C C C C B C Flora, fauna and biodiversity A B C B C B B A C Meteorology C C C C C C C C C Landscape A B C B B B B C C
Nat
ural
Env
ironm
ent
Global warming C C C C C B C C C Air pollution C C C C C B C B C Water pollution A B C C C B C C C Soil contamination C C C C C C C C C Waste B B C C B B C C C Noise and vibration B B C B C B C C C Ground subsidence C C C C C C C C C Offensive odour C C C C C C C C C Bottom sediment A B C C C C C B C
Pollu
tion
Accidents A B C C C C B C B Legend A:Serious impact is expected
B:Some impact is expected C:No or minimal impact is expected

4-84
4.2.3.3 Mitigation Measures and Items to be Considered in the Implementation Stage (1) Hydropower Even though Palau has a lot of rainfall as 3,800mm/year, it is difficult to generate enough power by flow-in type hydropower as described previously in the section 2.6.2 because the elevation is not high enough even the top of the highest mountain Ngerchelchuus reaches 242 m. Thus, it is considered that dam-type and micro-hydro are the feasible types of hydro power generation。 In case of applying dam-type hydro, a construction site must be carefully selected in order to avoid the location of conservation areas and historical and cultural heritage as well as large scale resettlement. In addition, full scale EIA (Environmental Impact Assessment) and flow measurement of a target river should be implemented and the results of the assessment and the measurement should be taken into consideration in construction and site work planning in order to minimize the impact on the eco-system and the river basin. (2) Wind Power As long as judging from the currently available wind monitoring data, Palau does not have high potential for wind power generation. It is recommended that impact on flying birds, noise and landscape should be carefully considered in implementing wind monitoring and site selection. (3) Solar Power Generally speaking, solar power generation has less environmental impact. In case of grid-connection solar system, batteries are not necessary and battery disposal is not a problem. However, used-battery management system should be established for independent solar system because it requires periodical replacement of batteries. (4) Diesel Generation Diesel generation may cause air pollution due to nitrogen oxides and sulfur oxides contained in exhaust gas and noise disturbance. Application of mitigation measures (i) to reduce ground concentration of air pollutant such as selecting low-NOx type engines and higher stacks and (ii) to reduce noise level at residences around the power station by utilizing the power house as a noise-prevention wall are necessary. (5) Transmission and Distribution Lines Overhead lines may give impact on land utilization, flora and fauna and traffic during construction work. Transmission and distribution line routes should be carefully selected in order to avoid the location of conservation areas and historical and cultural heritage as well as involuntary resettlement. Impact on traffic during construction work should be mitigated by clearly indicating detour and “men at work” signs and enforcing traffic control. (6) Substation Change of land utilization by the land acquisition and electric shock to ordinary people who enter the premise of the Substation is concerned. Since the land for electric pole or substation

4-85
in Palau is often provided by the landowner free of charge as a local custom, there is no specific concern on the land acquisition. Electric shock to ordinary people should be prevented by installing a fence around the substation and locking the entrance. 4.3 Examination of Power Supply Options Including Renewable Energies 4.3.1 Current Condition and Assessment of Renewable Energies in Palau 4.3.1.1 Photovoltaic Power Generation Photovoltaic power generation has now entered the practical application stage and its introduction as an effective means of utilizing renewable energy geared to reducing emissions of CO2 is rapidly advancing throughout the world. As of the end of 2005, photovoltaic power generation output capacity equivalent to 3.7 GW had been introduced throughout the world, and the targeted output of photovoltaic power generation in Japan by the end of 2010 is 4.82 GW, up from 1.422 GW at the end of 2005. Against this international background, in Palau too, it is planned to install a 100 kWp photovoltaic power generation system under support from the EU in the car parking space next to the parliament building in Melekeok, and delivery of the equipment for this was recently commenced based on a contract concluded with a German contractor. Palau has high potential for photovoltaic power generation because it enjoys a high degree of solar radiation throughout the year. The Japan Agency for Marine Earth Science and Technology (JAMSTEC) established a meteorological data observation station at Aimeliik in 2003 and has since been gathering data on solar radiation on the ground surface. According to data gathered over the past three years, the mean annual amount of solar radiation is 4.51 kWh/m2/day (see Table 2.6.2-7). Incidentally, data measured by NASA indicates a mean annual amount of solar radiation of 5.01 kWh/ m2/day (specifications of the photovoltaic power generation system in the car parking space next to the parliament building in Melekeok). Meanwhile, since the mean annual amount of solar radiation in Tokyo is 3.92 kWh/ m2/day, this means that Palau has the potential to generate between 1.15~1.28 times more solar radiation than Tokyo. However, since a photovoltaic system is unable to generate power at nighttime and during rainy and cloudy weather, there is a limit to its independent use. Accordingly, the Study examines the method of grid connection to the PPUC power system, i.e. linking power generated by photovoltaic cells during times of strong solar radiation to the grid side with a view to reducing PPUC diesel power generation, fuel consumption and CO2 emissions. Furthermore, photovoltaic power generation takes up a vast amount of land space for the installation of photovoltaic cells. For example, a photovoltaic power generation system with output of 100 kWp requires a photovoltaic cell area of approximately 1,000 m2; moreover, the space required to conduct the installation and maintenance of photovoltaic cells and to secure access to them amounts to many times the area of the actual photovoltaic cells themselves. The forest coverage ratio of Palau is given as 87% (according to “Native Trees of Palau” by Ann Hillmann-Kitalong et al (2007)) and there are not a lot of open spaces suitable for the installation of photovoltaic cells. It is not easy to acquire land for this purpose, while the idea

4-86
of cutting down trees to make way for photovoltaic cells makes little sense. Accordingly, examination in the Study shall be advanced based on the assumption that photovoltaic cells will be installed on the rooftops of large government buildings, universities, high schools, elementary schools, gymnasiums and hospitals, etc. that are numerously built in Koror. Since the cost of installing photovoltaic cells is still expensive, it is still not easy to install large-scale equipment in Palau. However, it is anticipated that the cost of such equipment will come down in the near future in line with the global advance of photovoltaic power generation. Moreover, amid forecasts that the price of diesel fuel will continue to spiral from now on, it may be effective to install a photovoltaic system with output of between 100~200 kWp in Koror city center and use this to impress the need for energy saving and CO2 emissions reduction to the citizens of Palau. 4.3.1.2 Hydropower Generation Hydropower generation has a long history, meaning that the necessary technology for it is already established, and it is widely adopted throughout the world. Palau has extremely high rainfall. Even though this fluctuates greatly from 520 mm/month during the rainy season in July to 100 mm/month during the dry season in February, the total amount of annual rainfall reaches 3,520 mm (see Fig. 2.6.2-2). However, the altitude of Palau is generally low. Since the highest altitude on Babeldaob Island (the country’s largest island) is around 100~200 m, there are no major rivers on the island and effective head cannot be adequately secured, conditions are not suitable for large-output hydropower generation. However, since there is high rainfall and numerous small rivers, there is thought to be high potential for the installation of micro hydropower systems having capacity of around 200 kW. It is necessary to secure a certain degree of water flow and effective head in order to conduct hydropower generation, however, when using river water, it is necessary to conduct extended flow survey and overcome various environmental and social issues. Accordingly, the best candidate plan at present is thought to be to utilize overflow water from the waterworks reservoir that is currently being planned under support from the ADB. Regarding the present public water supply in Koror and Airai State, water from the Ngerimal source in Airai State in the south of Babeldaob Island is currently sent to the Ngetkit purification plant, where it is purified before being supplied to consumers; however, during the dry season, since the water source dries up, this region is faced with critical water shortages. In response to this situation, the Government of Palau is advancing plans to construct a public water supply system on Babeldaob Island using ADB funds in order to secure a new source of water. Work on the project is currently in progress and the new system is scheduled to be commissioned in 2011. As is described later, it will be possible to realize hydropower generation potential of up to 200 kW through utilizing the overflow water from this new public water supply source being planned under ADB funding. When conducting hydropower generation using overflow water, the water flow and consequently output vary between the rainy season and dry season. Accordingly, through adopting the method of grid connection to the PPUC power system, i.e. linking energy generated by hydropower generation during periods of abundant water flow to the grid side, it should be possible to reduce PPUC diesel power generation, fuel consumption and CO2 emissions.

4-87
Hydropower generation systems are extremely economical because the equipment involved is relatively simple and easy to handle and it can be operated for a long time once it has been installed. It is proposed that the Government of Palau plans the installation of a micro hydropower generation system in line with construction of the new public water supply system being planned with ADB funding. 4.3.1.3 Solar Thermal Energy Utilization Being a warm country and enjoying a lot of solar radiation throughout the year, Palau has high potential for solar thermal energy utilization. Concerning the type of technology that is suited to Palau, solar water heaters, which are an established, economical and widespread technology throughout the world, are thought to be appropriate. There are no statistics on the utilization of solar water heaters in Palau so the situation regarding dissemination is unclear, however, judging from conditions in Koror, no solar water heaters can be seen on building rooftops apart from one Taiwanese-owned hotel. Moreover, the Director of the Energy Office has said that electric water heaters are commonly used and that the spread of solar water heaters has so far been slow in Palau. Within the Energy Efficiency Action Plan currently being compiled by the Government of Palau, one of the programs proposed for the reduction of energy consumption is the establishment of a fund for promoting the introduction of solar water heaters (see Table 4.1.3-4). Following publication of the Energy Efficiency Action Plan, agreements for the borrowing of new housing loans have come to include a clause requiring the installation of a solar water heater. Moreover, with the appearance of cheap Chinese-made solar water heaters in recent years, it is expected that such heaters will become more widespread from now on. Solar water heaters are simple, relatively cheap and can certainly enable electricity tariff savings for power users. Since solar water heaters can lead to reduction of diesel power generation, fuel consumption and CO2 emissions, they are a promising means of introducing renewable energy, and it is desirable that the Government of Palau continues to promote their dissemination. 4.3.1.4 Wind Power Generation Wind power generation is similar to photovoltaic power generation in that it is rapidly being introduced throughout the world as an effective means of utilizing renewable energy and cutting CO2 emissions. The total amount of wind power generation capacity introduced in the world as of the end of 2005 was 59.21 GW. Wind power generation, which is conditional on stable and appropriate winds blowing throughout the year, continues to be introduced in Germany, the United States, Spain and Denmark. Installed wind power generation capacity in Japan at the end of 200 was 1.08 GW, however, the goal is to increase this to 3 GW by the end of 2010. Palau does not experience typhoons and has a moderate climate throughout the year. There is not a lot of data on wind conditions in Palau available at present, however, judging from meteorological data obtained in Aimeliik, Koror and the airport districts, wind velocity ranges between 1~6 m/sec throughout the year (see Fig.s 2.6.2-3, 2.6.2-4 and 2.6.2-5).

4-88
According to the NEDO guidebook on introducing wind power generation, since an annual mean wind velocity of between 5~6 m/sec is recommended for wind power generation, Palau may not be a suitable location for introduction. The Energy Office of Palau plans to construct two or three data collecting towers (wind condition surveying towers) under EU support in 2008 and to implement a survey of wind conditions from the end of 2008. However, the data measurement sites have not yet been specifically decided. The induced generators that are adopted in wind power generation, due to their generating characteristics, must be connected to the PPUC grid and receive power supply from the power system. Moreover, because the power generated by windmills varies according to changes in wind velocity, it is possible that the quality of power over the overall PPUC system will deteriorate depending on the balance between windmill output and PPUC grid capacity. For this reason, it is necessary to implement ample technical examination. However, through linking energy generated by windmills to the grid side, it should be possible to reduce PPUC diesel power generation, fuel consumption and CO2 emissions. Since the success of wind power generation absolutely depends on stable winds, the introduction of a wind power generation system should only be examined after conducting a survey of wind conditions and identifying suitable installation sites. 4.3.1.5 Other Renewable Energies (Biomass Energy, Ocean Thermal Energy
Conversion) The type of biomass utilization thought to be possible in Palau is power generation from the combustion of solid waste. However, the total population of Palau is only less than 20,000, and even if 90,000 tourists per year are taken into account, the total figure is only around 110,000, meaning that little solid waste for fueling power generation is generated. Accordingly, there is deemed to be no prospect for the generation of power from solid waste before 2025. Concerning ocean thermal energy conversion, Saga University of Japan has been advancing research since 1973 and experimental work is continuing in the United States and India, etc., however, since the equipment required for this is large and costly in relation to output, the technology has so far not been refined for practical use and there has been no instances of long-term power generation in connection with a power grid. There are also environmental concerns that the pumping of large quantities of ocean water will have an adverse impact on ecosystems. For these reasons, there is deemed to be no prospect for the practical implementation of ocean thermal energy conversion in Palau before 2025. 4.3.1.6 Order of Priority for Introduction of Renewable Energy in Palau Introduction of photovoltaic power generation as an effective renewable energy is advancing throughout the world. In view of Palau’s high potential for the introduction of photovoltaic power generation based on its abundant solar radiation, it is proposed that this be definitely introduced based on a long-term viewpoint to keep step with the worldwide efforts currently being made to cut CO2 emissions.

4-89
Being blessed with abundant rainfall, Palau also has high potential for the introduction of hydropower generation. The technology for hydropower generation has already been established and this is a highly economical form of renewable energy, however, it is conditional on the securing of water sources. In the Study, it is proposed that hydropower generation be introduced based upon the utilization of overflow water from the public water supply source currently being planned under support from the ADB. It is proposed that a plan for the introduction of hydropower generation be compiled upon conducting a water source survey and natural environment survey and appropriating land as soon as possible. Solar water heaters are used throughout the world and they offer a simple, sure and economical means of utilizing renewable energy. Utilizing the fact that Palau is warm, has a lot of solar radiation and thus has high potential for the introduction of solar water heaters, it is proposed that government schemes for the dissemination of solar water heaters, including establishment of the solar water heater dissemination fund indicated in the Energy Efficiency Action Plan, be further extended. Wind power generation is rapidly spreading throughout the world as a promising source of renewable energy, although it tends to concentrate in areas where stable and appropriate winds blow all year round. Palau has feeble wind velocity throughout the year and is not suited to wind power generation. If a suitable site is identified based on the results of the wind survey being implemented by the Energy Office in 2008, introduction of a system will be examined at that time, however, no such plans will be considered in this Study. Other potential renewable energies are power generation from the combustion of solid waste and ocean thermal energy conversion. Since Palau only has a small population and cannot be expected to generate large quantities of solid waste for use as fuel in power generation, there is little prospect of energy generation from waste and this will not be examined here. As for ocean thermal energy conversion, although experiments and research are ongoing in different parts of the world, the technology has not yet been refined for practical application. Moreover, amidst concerns over the impact on the environment and ecosystems, there is deemed to be no prospect for the practical implementation of ocean thermal energy conversion in Palau before 2025. Accordingly, this technology will also not be examined in the study. 4.3.2 Effects of Introducing Renewable Energies 4.3.2.1 Photovoltaic Power Generation (1) Examination of Photovoltaic Power Generation Capacity Concerning photovoltaic power generation, which has the highest potential for dissemination in Palau, it is proposed that photovoltaic cells be installed on the rooftops of large government buildings, universities, high schools, elementary schools, gymnasiums and hospitals, etc. that are numerously built in Koror. As a result of survey, it is deemed that cells with maximum total capacity of 3,000 kWp can be installed. Table 4.3.2-1 indicates the results of a survey of the roof area of government buildings, schools, gymnasiums, hospitals and fisheries facilities, etc. in Koror that can accommodate photovoltaic cells. Also, Fig. 4.3.2-1 shows a photograph of Palau Community College as an example of the type of site where photovoltaic cells can be installed.
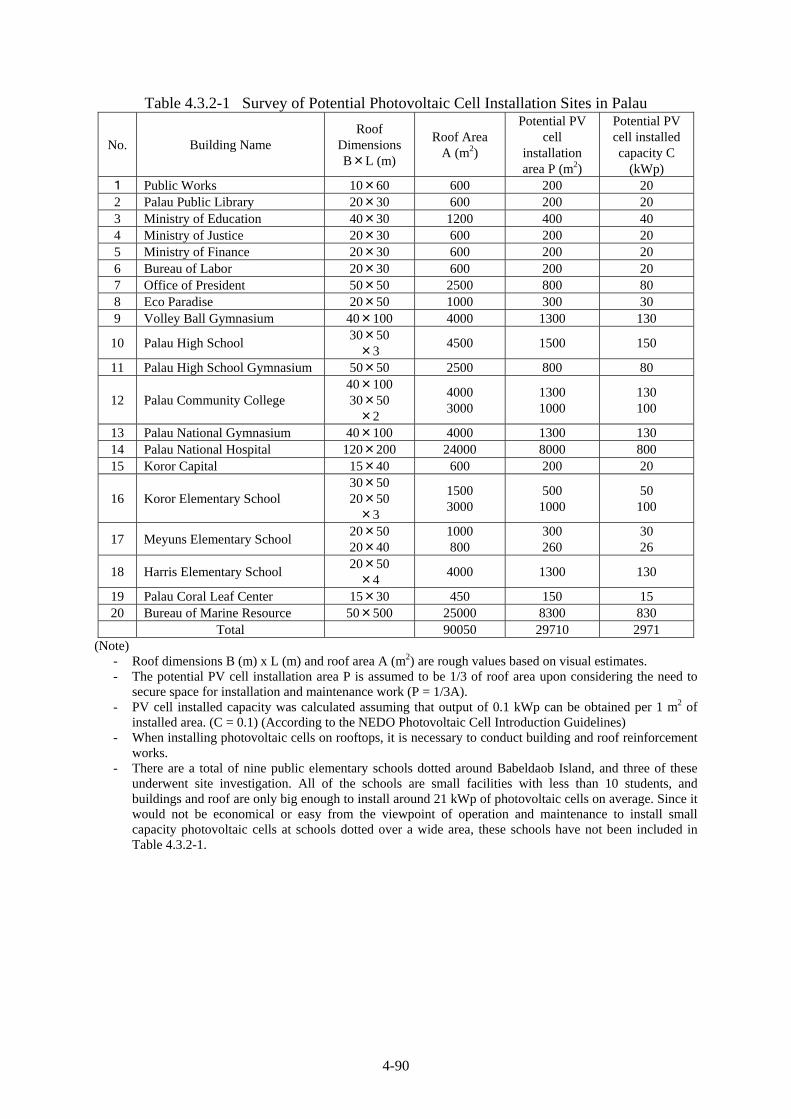
4-90
Table 4.3.2-1 Survey of Potential Photovoltaic Cell Installation Sites in Palau
No. Building Name Roof
Dimensions B×L (m)
Roof Area A (m2)
Potential PV cell
installation area P (m2)
Potential PV cell installed capacity C
(kWp) 1 Public Works 10×60 600 200 20 2 Palau Public Library 20×30 600 200 20 3 Ministry of Education 40×30 1200 400 40 4 Ministry of Justice 20×30 600 200 20 5 Ministry of Finance 20×30 600 200 20 6 Bureau of Labor 20×30 600 200 20 7 Office of President 50×50 2500 800 80 8 Eco Paradise 20×50 1000 300 30 9 Volley Ball Gymnasium 40×100 4000 1300 130
10 Palau High School 30×50 ×3 4500 1500 150
11 Palau High School Gymnasium 50×50 2500 800 80
12 Palau Community College 40×100 30×50 ×2
4000 3000
1300 1000
130 100
13 Palau National Gymnasium 40×100 4000 1300 130 14 Palau National Hospital 120×200 24000 8000 800 15 Koror Capital 15×40 600 200 20
16 Koror Elementary School 30×50 20×50 ×3
1500 3000
500 1000
50 100
17 Meyuns Elementary School 20×50 20×40
1000 800
300 260
30 26
18 Harris Elementary School 20×50 ×4 4000 1300 130
19 Palau Coral Leaf Center 15×30 450 150 15 20 Bureau of Marine Resource 50×500 25000 8300 830
Total 90050 29710 2971 (Note)
- Roof dimensions B (m) x L (m) and roof area A (m2) are rough values based on visual estimates. - The potential PV cell installation area P is assumed to be 1/3 of roof area upon considering the need to
secure space for installation and maintenance work (P = 1/3A). - PV cell installed capacity was calculated assuming that output of 0.1 kWp can be obtained per 1 m2 of
installed area. (C = 0.1) (According to the NEDO Photovoltaic Cell Introduction Guidelines) - When installing photovoltaic cells on rooftops, it is necessary to conduct building and roof reinforcement
works. - There are a total of nine public elementary schools dotted around Babeldaob Island, and three of these
underwent site investigation. All of the schools are small facilities with less than 10 students, and buildings and roof are only big enough to install around 21 kWp of photovoltaic cells on average. Since it would not be economical or easy from the viewpoint of operation and maintenance to install small capacity photovoltaic cells at schools dotted over a wide area, these schools have not been included in Table 4.3.2-1.

4-91
Fig. 4.3.2-1 Gymnasium of Palau Community College (2) Calculation of the Generated Energy, Equipment Utilization Efficiency, Diesel Fuel
Saving and Equipment Cost Redemption of Photovoltaic Power Generation Here, based on the assumption that a standard photovoltaic cell system of 100 kWp capacity is installed and linked to the PPUC grid, calculation of the annual generated energy, equipment utilization efficiency, CO2 emission reductions, reduction in fuel consumption for diesel power generation, reduction in diesel fuel costs, and redemption of photovoltaic cell equipment costs is carried out. The results of calculation are given in Tables 4.3.2-2 and 4.3.2-3. 1) Annual generated energy and annual equipment utilization efficiency of photovoltaic
cells
The capacity of photovoltaic equipment is assumed to be 100 kWp. Annual generated energy of photovoltaic cells (e)
e= (a/c)×b×d×365=100/1×4.51×0.7×365=115230kWh/year (NEDO guidelines on introduction of photovoltaic power generation)
a = Rated output of power generating equipment = Maximum output of generating equipment in the reference state = 100 kW
b = Mean annual solar radiation = 4.51 kW/ m2/day (Solar radiation measurements in Palau: see Table 2.6.2-7)
c = Solar radiation intensity in the reference state = 1 kW/ m2 d = General design coefficient = 0.7
1year=365days (Reference state: temperature 25°C, air mass 1.5, solar radiation intensity = 1 kW/m2)

4-92
Annual equipment utilization efficiency of photovoltaic cells (γ) γ= e/(a×24×365)= 115230/(100×24×365)=0.131=13.1%
2) CO2 reduction effect resulting from photovoltaic power generation (conversion to forest area)
CO2 emissions reduction (g)
g = e×f=115.23×0.188=21.7 ton -C/year (f=0.188 ton-C/MWh: base unit of CO2 emissions, NEDO guidelines on introduction of photovoltaic power generation)
Forest area conversion of CO2 reduction effect (i)
i = g/j=21.7 ton -C/year÷0.974 ton-C/ha=22.3ha (j=0.974 ton-C/year/ha: CO2 absorption per ha of forest, NEDO guidelines on introduction of photovoltaic power generation)
3) Reduction of fuel consumption for diesel power generation as a result of photovoltaic
power generation Reduction of fuel consumption for diesel power generation Assuming that annual diesel power generation can be reduced in the same quantity as energy generated by photovoltaic power generation (115,230 kWh/year), the reduction in fuel consumption in diesel power generation is calculated as follows. Diesel power generation fuel consumption rate = 0.22 kg/kWh, specific gravity of diesel oil = 0.8. Annual reduction in diesel fuel (q)
q = 115230kWhr/year×0.22kg/kWh÷0.8=31,688l/year
4) Redemption of the photovoltaic power generation equipment cost 100 kWp photovoltaic power generation equipment cost = 1,040,102 Euros = $1,612,158 (According to the budget and contract for the EU-supported 100 kWp photovoltaic power generation system in Melekeok; contract concluded in March 2008) Exchange rate: 1 Euro = $1.546 (as of May 5, 2008) Redemption period of photovoltaic power generation equipment cost due to reduction in diesel fuel costs)
= (100 kWp photovoltaic power generation equipment cost) / (Reduction in diesel fuel cost)
Assuming a diesel fuel price of between 2~5 US$/gal, Table 4.3.2-3 shows the amount of fuel cost reduction and the equipment redemption period.

4-93
Table 4.3.2-2 Calculation Results for Photovoltaic Power Generation Equipment Item Calculation Results Unit
Capacity of photovoltaic power generation equipment 100 kWp Photovoltaic power generation equipment cost 1,612,158 $ Annual generated energy of photovoltaic cells 115,230 kWh/year Annual utilization efficiency of photovoltaic cells 13.1 % CO2 emissions reduction 21.7 ton -C/year CO2 reduction effect converted into forest area 22.3 ha Annual reduction in diesel fuel 31.7 kl/year
Table 4.3.2-3 Fuel Cost Reduction Resulting from Photovoltaic Power Generation,
and Equipment Cost Redemption Period Diesel fuel price ($/gal) 2.0 3.0 4.0 5.0 Diesel fuel price ($/l) 0.529 0.794 1.058 1.323 Fuel cost reduction ($/year) 16,800 25,200 33,500 41,900 Number of years for redemption of photovoltaic power generation equipment
96.2 64.1 48.0 38.5
(3) Effect of Introducing Photovoltaic Power Generation 1) Assuming that a standard photovoltaic cell system of 100 kWp capacity is installed and
linked to the PPUC grid, the annual amount of generated energy is 115,230 kWh/year, which is equivalent to 0.12% of the total power generation of the PPUC in 2007 of 92,704,705 kWh/year. Moreover, diesel fuel consumption can be reduced by 31.7 kL per year.
2) The annual equipment utilization efficiency is 13.1%, which is approximately 1.09
times compared to the standard equipment utilization efficiency in Japan of 12%. This is due to the abundant solar radiation enjoyed by Palau throughout the year, indicating that Palau is suited to photovoltaic power generation.
4.3.2.2 Hydropower Generation (1) Hydropower Generation Equipment Installation Method With respect to hydropower generation, neither the Energy Office nor the PPUC have any concrete candidate sites for development. Moreover, since there are not sufficient topographical maps or rainfall data, etc. to select candidate sites, the Study Team proposes that a 200 kW hydropower plant utilizing overflow water from the reservoir of the new public water supply system being planned on Babeldaob Island under ADB funding be installed and connected to the power grid of the PPUC. Through linking the energy generated by hydropower generation during periods of abundant water flow to the grid side, it is planned to reduce PPUC diesel power generation, fuel consumption and CO2 emissions. (2) Calculation of the Generated Energy, Equipment Utilization Efficiency, Diesel Fuel
Saving and Equipment Cost Redemption of Hydropower Generation Here, based on the assumption that overflow water from a public water supply system reservoir is used as the water source for hydropower generation, calculation of the water source inflow, overflow, generator mean output, generator maximum output, generator

4-94
minimum output, annual generated energy, reduction in fuel consumption for diesel power generation, mean equipment utilization efficiency, CO2 emission reductions, and redemption of power generating equipment costs is carried out. The results of calculation are given in Tables 4.3.2-4 and 4.3.2-5. 1) Annual generated energy
Annual water inflow to the reservoir (v) v=A×h×0.7=25,230,000m3/year Inflow catchment area (A) A=4 Square Miles=10.24 km2
(according to the ADB public water supply planner)
Annual rainfall (h) h = 3520 mm (See 2.6.2-2 for actual measurements)
Mean daily water inflow to the reservoir (V) V=25,230,000/365=69,120m3/day (according to the ADB public water supply planner)
Water transmitted for public water supply (daily) (W) W=3.8Mgallon/day=14,360m3/day (according to the ADB public water supply planner)
Mean overflow (daily amount) (O) O=V-W=54,760 m3/day Mean water flow for driving the turbine (per second) (Q)
Q=O/(24×3600)=0.634m3/sec Mean theoretical hydraulic power for driving the turbine (P)
P=9.8×Q×H=9.8×0.634×20=124.26kW (NEDO guidelines for introducing micro hydropower generation)
Effective head H = 20 m (according to the ADB public water supply planner)
Mean hydraulic generator output (E) E=P×η×ζ=124.26×0.8×0.85=84.50 kW Turbine efficiency η=0.8 (η=0.75~0.90: NEDO guidelines for
introducing micro hydropower generation)
Generator efficiency ζ=0.85 (ζ=0.82~0.93: NEDO guidelines for introducing micro hydropower generation)
Annual generated energy (e) e=84.50×24×365=740,220kWh (NEDO guidelines for introducing micro hydropower generation)
2) Reduction of fuel consumption for diesel power generation as a result of hydropower
generation Reduction of fuel consumption for diesel power generation Assuming that annual diesel power generation can be reduced in the same quantity as the energy generated by hydropower generation (740,220 kWh/year), the reduction in fuel consumption in diesel power generation is calculated as follows.

4-95
Diesel power generation fuel consumption rate = 0.22 kg/kWh, specific gravity of diesel oil = 0.8. Annual reduction in diesel fuel (q)
q = 740,220kWhr/year×0.22kg/kWh÷0.8 = 203,501l/year Assuming a diesel fuel price of between 2~5 US$/gal, Table 4.3.2-5 shows the amount of fuel cost reduction and the equipment cost redemption period.
3) Generator maximum output
Peak monthly reservoir inflow (w) w = A×h×0.7=3,870,000/month Inflow catchment area (A) A = 4 Square Miles = 10.24 km2 Peak monthly rainfall (h) h =540 mm/month (see Fig. 2.6.2-2 for
actual measurements in July) Peak daily reservoir inflow (V) V = 3,870,000/31 = 124,840m3/day Water transmitted for public water supply (daily) (W)
W = 14,360 m3/day Peak overflow (daily) (O) O = V-W = 124,840-14,360 = 110,480
m3/day Peak turbine drive water flow (per second) (Q) Q = O/(24×3600)= 1.279m3/sec Peak turbine drive theoretical power (P) P = 9.8×Q×H=9.8×1.279×20=250.68kW Effective head H = 20 m Peak hydraulic generator output (E) E = P×η×ζ= 250.68×0.8×0.85 = 170.46
kW Turbine efficiency η=0.8 Generator efficiency ζ=0.85
4) Generator minimum output
Minimum monthly reservoir inflow (w) w = A×h×0.7 = 716,800/month Inflow catchment area (A) A = 4 Square Miles = 10.24 km2 Minimum monthly rainfall (h) h =100 mm/month (see Fig. 2.6.2-2 for
actual measurements in February) Minimum daily reservoir inflow (V) V = 716,800/28=25,600 m3/day Water transmitted for public water supply (daily) (W)
W = 14,360 m3/day Minimum overflow (daily) (O) O = V - W = 25,600-14,360=11,240
m3/day Minimum turbine drive water flow (per second) (Q)
Q = O/(24×3600)= 0.130 m3/sec Minimum turbine drive theoretical power (P) P = 9.8×Q×H=9.8×0.130×20=25.48 kW Effective head H = 20 m Peak hydraulic generator output (E) E = P×η×ζ= 25.48×0.8×0.85=17.32 kW Turbine efficiency η=0.8 Generator efficiency ζ=0.85

4-96
5) Capacity of hydropower generation equipment Assuming around 110% of the peak generator output, the hydropower generator capacity shall be 200 kW.
6) Mean equipment utilization efficiency = (mean hydropower generator output) / (hydropower generating equipment capacity)
=84.50 kW/200kW=0.423 (42.3%)
7) Redemption of hydropower generating equipment cost
200 kW hydropower generating equipment cost = $5,000,000 (estimated based on figures at other plants)
Table 4.3.2-4 Hydropower Generation Equipment Calculation Results Item Calculation Results Unit
Capacity of hydropower generation equipment 200 kW Hydropower generation equipment cost 5,000,000 $ Generator mean output 84.5 kW Generator peak output 170.5 kW Generator minimum output 17.3 kW Annual hydropower generated energy 748,980 kWh Mean equipment utilization efficiency 42.3 % CO2 emissions reduction 141.1 ton -C/year CO2 reduction effect converted into forest area 145.0 ha Annual reduction in diesel fuel 206.0 kl/year
Table 4.3.2-5 Fuel Cost Reduction Resulting from Hydropower Generation,
and Equipment Cost Redemption Period Diesel fuel price ($/gal) 2.0 3.0 4.0 5.0 Diesel fuel price ($/l) 0.529 0.794 1.058 1.523 Fuel cost reduction ($/year) 107,600 161,600 215,300 269,200 Redemption period for hydropower generation equipment 46.5 30.9 23.2 18.6
(3) Effect of Introducing Hydropower Generation 1) If overflow water from the Babeldaob Island public water supply reservoir being
planned under ADB funding is utilized, it will be possible to install a hydropower generation system with capacity of 200 kW and annual mean output of approximately 84.5 kW. The annual generated energy is 748,980 kW, which is equivalent to 0.81% of the total power generation (92,704,705 kWh/year) of the PPUC in 2007. Moreover, diesel fuel consumption can be reduced by 206.0kL per year.
2) Since water flow varies between the rainy and dry seasons and the hydropower
generating output changes throughout the year, the annual equipment utilization efficiency is 42.3%. Through connecting the system to the PPUC power grid and transmitting the power generated during abundant water flow to the grid, this will reduce PPUC diesel power generation, save on fuel consumption and lead to reduction

4-97
in CO2 emissions. 4.3.2.3 Solar Thermal Energy Utilization (1) Method of Solar Thermal Energy Utilization Palau is a tourist resort visited by approximately 90,000 tourists per year. These tourists consume a lot of bathwater and shower water; however, the hotels in Palau generally use electric water heaters to provide hot water. Electric water heaters are also widespread in general households, and these appliances account for 20% of electricity demand (according to the Energy Efficiency Action Plan Report). Through switching the hot water appliances in tourist hotels and general households from electric water heaters to solar water heaters, it is proposed that power consumption be reduced while at the same time saving on power tariffs on the power demand side. (2) Estimation of Power Consumption and Electricity Tariff Savings through Introduction
of Solar Water Heaters Here, based on the assumption that solar water heaters are installed in hotels that accommodate tourists, calculation of the hot water usage, power consumption savings, electricity tariff savings, redemption period of solar water heater equipment, CO2 emission reductions and reduction in fuel consumption for diesel power generation is carried out. The results of calculation are given in Tables 4.3.2-6 and 4.3.2-7. 1) Estimation of hot water usage
The amount of hot water used by heavy consumption tourists is estimated as follows. Total number of tourists visiting Palau per year = 90,000, average stay = 4.6 days. Number of tourists per day = 90,000×4.6÷365 = 1,134/day Assuming that half these tourists use 300 liters of 40°C hot water for bath, shower, washing and laundry purposes, etc. everyday, hot water usage = (1134/2×300) = 170,100 l/day
2) Power consumption of electric water heaters used for heating water Amount of heat used to heat water from room temperature of 25°C to 40°C: Q = 170,100×15 = 2,551,500kcal/day Since 860 kcal = 1 kWh, then: Q = 2,551,500÷860 = 2,967kWh/day Electric water heat power consumption P = Q/η= 2,967/0.8 = 3,709 kWh/day Electric water heater efficiency η= 0.8 Annual electric water heater power consumption = 3,709kWh/day×365 = 1,353,785 kWh/year
3) Reduction in power consumption through solar water power heaters The above electric water heaters will be replaced with solar water heaters, however, since solar water heaters cannot heat water during rainy weather and so on, taking into account follow-up heating by electric water heaters for maintaining water temperature at

4-98
night, it is assumed that power consumption of the above electric water heaters can be reduced by 50%. Reduction in power consumption = 1,353,785kWh/year×0.5 = 676,893 kWh/year
4) Reduction in electricity tariffs for electricity consumers Since the electricity tariff for hotels, etc. is 0.27$/kWh, the annual saving will be as follows: 676,893 kWh/year×0.27$/kWh = 182,761 $/year
5) Required number of installed solar water heaters and installation cost Each solar water heater has a capacity of 300 liters and an installation cost of $4,000. Since daily hot water usage is 170,100l/day, the required number of solar water heaters = 170,100/300 = 567 units The installation cost of solar water heaters = 4,000×567 = $2,268,000
6) Redemption period on solar water heater equipment The cost of installing solar water heaters is redeemed through the savings gained on electricity tariffs. Redemption period = (Solar water heater installation cost) ÷ (Annual electricity tariff saving) = 2,268,000$ ÷ 182,761 $/year = 12.41 years
7) Reduction of fuel consumption for diesel power generation as a result of introducing solar water heaters Assuming that annual diesel power generation can be reduced in the same quantity as the reduction in power consumption by solar water heaters (676,893 kWh/year), the reduction in fuel consumption in diesel power generation is calculated as follows. Diesel power generation fuel consumption rate = 0.22 kg/kWh, specific gravity of diesel oil = 0.8. Annual reduction in diesel fuel (q) q = 676,893 kWhr/year×0.22kg/kWh÷0.8 = 186,146 l/year Assuming a diesel fuel price of between 2~5 US$/gal, Table 4.3.2-7 shows the amount of fuel cost reduction and the equipment redemption period.

4-99
Table 4.3.2-6 Solar Water Heater Equipment Calculation Results Item Calculation Results Unit
Capacity of solar water heater equipment (mean) 300 l/unit Necessary quantity (over all Palau) 567 Units Solar water heater equipment installation cost 2,268,000 $ Saving in power consumption due to solar water heaters (annual) 676,893 kWh/year Electricity tariff saving for electricity consumer households 182,800 $/year Equipment redemption period (based on electricity tariff savings) 12.4 Year CO2 emissions reduction 127.5 ton -C/yearCO2 reduction effect converted into forest area 131.0 ha Annual reduction in diesel fuel 186.1 kl/year
Table 4.3.2-7 Fuel Cost Reduction Resulting from Solar Water Heaters
Diesel fuel price ($/gal) 2.0 3.0 4.0 5.0 Diesel fuel price ($/l) 0.529 0.794 1.058 1.523 Fuel cost reduction ($/year) 107,600 161,600 215,300 269,200
(3) Effect of Introducing Solar Water Heaters 1) For Palau, which has high temperatures and solar radiation throughout the year, solar
water heaters, which are an established and widely used technology, are an appropriate means of utilizing solar thermal energy.
2) Through using solar water heaters to supply the hot water used by 90,000 tourists for
baths, showers and laundry, etc. every year, electricity saving equivalent to 0.73% of the PPUC annual power generation output of 92,704,705 kWh/year can be achieved. Moreover, diesel fuel consumption can be reduced by 186.2 kl per year.
3) Since solar water heater equipment is relatively cheap, it has a redemption period of
12.4 years and is extremely economical. 4.3.3 Plan for Introduction of Renewable Energies Based on the assumption that peak power generation capacity in Palau in 2025 will be 25,000 kW, it is planned to introduce renewable energies comprising photovoltaic power generation, hydropower generation and solar thermal energy utilization with generation capacity of 750 kW or approximately 3% of the said peak power generation capacity. 4.3.3.1 Photovoltaic Power Generation Photovoltaic power generation has now entered the practical application stage and its introduction as an effective means of utilizing renewable energy and reducing CO2 emissions is rapidly advancing throughout the world. In Palau too, it is planned to install a 100 kWp photovoltaic power generation system under support from the EU in the car parking space next to the parliament building in Melekeok, and a contract has recently been concluded with a German contractor. It can thus be said that Palau has now earnestly embarked on an era of photovoltaic power generation introduction.

4-100
Assuming that one-third of renewable energy power generation in 2025 is derived from photovoltaic power generation, this means that the power generation capacity of photovoltaic power will be 250kWh/year. Accordingly, it will be necessary to install additional photovoltaic power generation equipment with capacity of 100~250 kWp by 2025. Concerning the specific approach, photovoltaic cells will be installed on the rooftops of government office buildings and connected to the PPUC grid. Based on survey findings, it is deemed that photovoltaic cells with a maximum total capacity of 3,000 kWp can be installed. Through using photovoltaic power generation to bear part of the total generating capacity of PPUC, diesel generating capacity and fuel consumption can be reduced and CO2 emissions can be cut. The installation cost of photovoltaic power generation equipment remains high at approximately US$ 15,000 per 1 kWp of capacity, and it will be unreasonable to expect the redemption of equipment costs based on the savings in diesel fuel costs enabled by photovoltaic power generation for the immediate future. However, as photovoltaic power generation becomes more widespread throughout the world, it is expected that equipment prices will come down; moreover, since diesel fuel prices are expected to remain inflated, the redemption period of photovoltaic power plant costs will become shorter. In view of the CO2 reduction effect of photovoltaic power generation irrespective of the small capacity, as a follow-up to the100 kWp photovoltaic power generation equipment at the Babeldaob parliament building, there would be great significance in further advertising energy saving and CO2 reduction to the citizens of Palau through installing a 100~200 kWp class photovoltaic power generation system on the roof of a building in the central part of Koror, for example, Palau Community College or Palau High School. 4.3.3.2 Hydropower Generation A hydropower generation system with capacity of 200 kW is relatively simple and easy to handle. Although output variations exist between the rainy and dry seasons, hydropower generation, as a source of renewable energy, offers high equipment utilization efficiency and is economical in the long run because it can be operated for a long time once it is installed. Currently two alternatives have been compiled regarding the plan to obtain water from the new public water supply system being planned under ADB funding. The first alternative entails constructing a storage reservoir with capacity of 150,000,000 gallons on Edeng River in Arai State, Babeldaob Island, and transmitting the stored water to the water treatment plant currently operating close to Ngekit in Airai State. Meanwhile, the second alternative entails directly obtaining water from Tabecheding River in Ngatpang State, Babeldaob Island and transmitting it to the water treatment plant close to Ngekit in Airai State. Currently, since technical data for the said public water supply system have not yet been disclosed, it is not possible to conduct rough examination on the overflow water intake mouth, water pipe and penstock, etc. However, since the plan is for a small-scale hydropower generation system of around 200 kW, the civil engineering works, mechanical equipment and piping will also be small-scale, and it should be possible to later easily install a micro hydropower generation system if the overflow water intake, water pipe and penstock are considered in the public water supply system planning, design and works stages. The

4-101
equipment cost of a hydropower system of 200 kW capacity is estimated to be approximately 500 million yen. 4.3.3.3 Solar Thermal Energy Utilization Solar water heaters installed on or above roofs have a sure effect in terms of enabling electricity tariff savings for consumers. Since the equipment cost of such heaters is relatively cheap, the equipment cost redemption period is extremely short at around 12 years. Moreover, since these heaters have a simple structure and are easy to handle, they are convenient for consumers and thus present a highly feasible means of renewable energy utilization in Palau. Through disseminating solar water heaters on a widespread basis, it is planned to reduce electricity consumption while enabling consumers to save on electricity tariffs. This will make it possible to reduce diesel power generation and fuel consumption and thus cut emissions of CO2. The Energy Efficiency Action Plan currently being compiled by the Government of Palau contains a proposal to establish a fund for promoting the introduction of solar water heaters as just one program of energy conservation. Following publication of the Energy Efficiency Action Plan, agreements for the borrowing of new housing loans have come to include a clause requiring the installation of a solar water heater. Moreover, with the appearance of cheap Chinese-made solar water heaters in recent years, it is expected that such heaters will become more widespread from now on. The dissemination promotion efforts of the Government of Palau are anticipated in future. 4.3.4 Issues and Recommendations in Promoting Introduction of Renewable Energy 4.3.4.1 Photovoltaic Power Generation (1) Issues 1) Since photovoltaic power generation equipment is costly in relation to output, the
biggest issue concerns the raising of funds for installation. The 100 kWp photovoltaic power generation equipment being installed in Melekeok under EU assistance will cost approximately $1.5 million. In the case where a photovoltaic power generation system of 100~200 kWp is introduced by 2025, the Government of Palau will need to raise between $1.5~3 million of funds.
2) Since Palau is largely covered by forest, it does not have many open spaces for
installing photovoltaic cells; moreover, the complex nature of land ownership issues makes it difficult to acquire land. For the time being it is proposed that photovoltaic cells be installed on the roofs of government office buildings in Koror, however, the securing of installation sites remains a major issue confronting the introduction of photovoltaic power generation.
3) Through connecting photovoltaic power generation equipment to the PPUC grid, it is
anticipated that even a small percentage of diesel fuel consumption can be covered,

4-102
however, because photovoltaic power generation equipment cannot generate energy at nighttime and during rainy weather, the equipment utilization efficiency is low at 13.1% even in such a sunny country as Palau, and the savings in diesel fuel consumption will be negligible.
4) Since the generating capacity of diesel power generation on the PPUC side, which will
be connected to the solar power generation, is small, it will be prone to the effects of photovoltaic power generation, which experiences constant output changes, and there is concern that this will lead to deterioration in the quality of the overall PPUC power system.
5) In spite of recent advances in practical application, photovoltaic power generation
remains a sophisticated cutting edge technology. Installation and grid connection require a high level of electric technical knowledge and operation and maintenance technology. Therefore, when introducing photovoltaic power generation equipment here, it will be necessary to strengthen the technical capacity of managers, engineers and maintenance personnel in the PPUC generation and transmission/distribution departments and to take budget measures for the purchase of replacement parts, etc.
(2) Recommendations 1) In order to introduce photovoltaic power generation, in addition to fully examining the
objective, effect, schedule and capacity of introduction, it is necessary to compile detailed plans for funding too. As a rule the Government of Palau should raise funds based on a long-term plan for the introduction of renewable energy, although requesting international assistance is another option. For example, it is recommended that frank discussions be held with USAID, AUSAID, UNDF, GEF and JICA, etc.
In the case of Japan, a policy of promoting the introduction of photovoltaic power generation while utilizing the vitality of local public authorities and private operators has been adopted, and subsidization systems have been established to support such public authorities and private operators. Table 4.3.5-1 shows photovoltaic power generation subsidy systems in Japan.
2) Concerning installation sites for photovoltaic cells, it is proposed that roofs of
government office buildings and schools, etc. in Koror be targeted. In order to realize the introduction of photovoltaic power generation in future, it is proposed that the Government of Palau conduct further investigation with a view to securing installation sites for photovoltaic cells.
3) Rather than assessing photovoltaic power generation solely from the economic aspect,
utilize it as a means of educating citizens through demonstrating its effectiveness in terms of reducing CO2 emissions. Towards this end, it is proposed that a 100~200 kWp photovoltaic power generation system be installed in central Koror, for example on the roof of Palau Community College or Palau High School, and used to demonstrate energy conservation and CO2 reduction to the citizens of Palau.
4) Ensuring that introduction of photovoltaic cells does not reduce quality over the entire
PPUC power system

4-103
It is necessary to gauge the actual state of existing power generation, transmission and distribution equipment and the distribution network on the PPUC side and prepare for the introduction of photovoltaic cells while giving careful examination to grid linkage and grid protection.
5) It is scheduled for five operating staff to receive training to coincide with the introduction of the 100 kW photovoltaic power generation system under EU assistance. Considering the future introduction of photovoltaic power generation, it will be necessary to further implement the planned and vigorous training of human resources through recruiting graduates of electric engineering universities and sending personnel to overseas training courses in order to develop them as expert engineers.
4.3.4.2 Hydropower Generation (1) Issues 1) The success of hydropower generation depends on the securing of water sources. Since
Palau has high rainfall throughout the year and the largest island of Babeldaob has numerous small rivers, there is a lot of potential for the installation of 100 kW class hydropower generation systems. However, due to the complex and intertwined nature of land ownership issues, environmental and nature protection problems, it is not easy to develop water sources for hydropower generation. Moreover, the construction of new hydropower plants requires huge amounts of funding.
2) There are plans to construct a new public water supply system and water source on
Babeldaob Island under ADB funding, however, the possibility of combining this with hydropower generation has so far not been considered. It is assumed that small scale hydropower generation which utilizes overflow water from the reservoir will not give significant impact on the environment.
3) Diesel power generation capacity on the PPUC side that will be connected to
hydropower generation is small and prone to the effects of changes in hydropower generation output, which fluctuates from 170 kW to 17 kW depending on the season. Accordingly, it is thought that this will have an impact on the quality of the overall PPUC power system.
4) PPUC has no past experience of hydropower generation. Moreover, it possesses no
engineers endowed with the electric technical know-how or operation and maintenance capacity related to grid linkage.
(2) Recommendations 1) It is proposed that concrete examination be advanced into utilizing overflow water for
hydropower generation from the new water source that is planned for construction on Babeldaob Island. Compared to the case of constructing a hydropower plant at a separate site, this is thought to be easier in terms of fundraising and appropriating land.
2) The ideal scenario is to construct the hydropower plant at the same time as the new
public water supply water source, however, at the very least it is proposed that plans for the future installation of the hydropower plant be incorporated from the planning stage

4-104
of the new public water supply water source. 3) To ensure that introduction of hydropower generation doesn’t adversely affect quality of
the overall PPUC power system, it is necessary to advance preparations upon gauging and carefully examining the actual state of existing power generation, transmission and distribution equipment and the distribution network on the PPUC side and giving careful examination to grid linkage and grid protection.
4) Since hydropower turbine and generator equipment hardly differs from diesel power
generation equipment, existing personnel can operate and maintain the hydropower generation equipment. However, it is necessary to secure engineers who can adjust the turbine output in line with seasonal fluctuations in water flow and who can make technical judgments for grid linkage.
4.3.4.3 Solar Water Heaters (1) Issues 1) Electric water heaters are already widely used in Palau, and there is little likelihood that
consumers will want to buy new solar water heaters. 2) It is hard to imagine that citizens will want to switch to solar water heaters from electric
water heaters, which are convenient for them and which they have grown accustomed to over many years.
3) Since solar water heaters cannot heat water at nighttime and during rainy weather, there
is doubt over whether they can secure the satisfaction of consumers. (2) Recommendations 1) It is proposed that the Government of Palau vigorously advertise the electricity
conservation effect of solar water heaters. If electricity tariffs further increase in line with diesel fuel inflation in future, switching to solar water heaters will become even more attractive in terms of saving on electricity charges.
2) It is proposed that the Government of Palau further expand systems for promoting the
dissemination of solar water heaters, for example, bank loans conditional on the installation of such heaters and the fund for promoting solar water heaters as indicated in the Energy Efficiency Action Plan.
4.3.5 Organization and Functions for Introduction of Renewable Energies (1) Issues Electric power and energy policies in Palau fall under the jurisdiction of the Ministry of Resources and Development (MRD), and the MRD Public Works Bureau contains the Energy Office, which is mainly responsible for the promotion of the introduction of renewable energies as well as energy saving. However, the Energy Office in reality only has a staff of two, i.e. Director and Energy Planner, who are too busy with attending routine liaison

4-105
meetings, collecting information and processing clerical duties to compile energy policies, renewable energy introduction plans and energy saving plans, etc. (2) Recommendations Regardless of whether Palau likes it or not, it is essential that energy policies, renewable energy introduction plans and energy saving plans, etc. are compiled and executed and that the activities of each department are coordinated. Accordingly, it is necessary to immediately strengthen the organization and technical capacity of the Energy Office. In specific terms, it is proposed that first a small number of young engineers be recruited and given the opportunity to attend training and short-term overseas study, the technical capacity of the Energy Office overall be bolstered through inviting experts, and that the organization and authority of the Energy Office be reinforced.
Table 4.3.5-1 Photovoltaic Power Generation Systems in Japan Agency with Jurisdiction Name of System Target Equipment Subsidy Contents
Ministry of Economy, Trade and Industry
New Energy Operators Support Program
Photovoltaic power generation systems of 50 kW or more
Project cost subsidy (up to 1/3) Debt guarantee: 90% guarantee rate Guarantee charge: 0.2%/year
NEDO Field Test Program for Photovoltaic Power Generation New Technologies, etc.
Photovoltaic power generation systems of 10 kW or more Building integrated type: 4 kW or more
Bearing of 50% of project cost (joint research)
NEDO Local Energy Vision Compilation, etc. Program
Local new energy vision formulation study, etc.
Fixed amount
NEDO Local New Energy Introduction Promotion Program
New energy introduction (photovoltaic power generation systems of 10 kW or more), etc.
No more than 50% or 400,000 yen of the cost targeted for subsidy
NEDO New Energy and Energy Saving Non-Profit Activities Promotion Program
Equipment introduction non-profit activity support program, etc.
No more than 50% of the cost targeted for subsidy
Ministry of Environment Global Environmental Bureau
Local Equipment Program for High Level Introduction of Renewable Energies
Multiple combined introduction of photovoltaic power generation, wind power and biomass, etc.
50% of the cost targeted for subsidy
Ministry of Environment Global Environmental Bureau
Global Warming Countermeasures Technical Development Program (Competitive Funds)
Energy saving, new energy practical application development, urban regeneration environmental model technical development (concentrated linkage, mega solar, etc.)
Ministry of Environment Global Environmental Bureau
Global Warming Countermeasures Business Model Incubator
Urban regeneration environmental model program, plant construction model program
Ministry of Environment Global Environmental Bureau
Plant Subsidy Program for Setting Autonomous Reduction Targets for Greenhouse Gases
Energy saving, new energy equipment
50% of the cost targeted for subsidy Up to 200 million yen
Ministry of Environment Global Environmental Bureau
CDM/JI Plant Subsidy Program
Energy saving, new energy (large-scale photovoltaic power generation equipment, etc. in development countries)
Subsidization rate 50%

4-106
Agency with Jurisdiction Name of System Target Equipment Subsidy Contents Ministry of Environment General Environment Policy Bureau
Model Program for Eco Reform and Environmental Education in Schools, etc.
Combination of energy saving and new energies (light shielding, green insulation, etc.)
50% of the cost targeted for subsidy 100 million yen x 10 sites
Ministry of Environment General Environment Policy Bureau
Local Model Program for Favorable Circulation of Environment and Economy
Wind power generation, fuel cells, alternative energies in the civil sector, etc.
Subsidization rate 2/3 Large-scale 185 million yen Small-scale 37 million yen
Ministry of Land, Infrastructure and Transport
Pioneering Urban Development Project
Photovoltaic power generation installation in public facilities, grid connection devices, energy management centers, etc.
State: 1/3 Local public authority: 1/3
Ministry of Land, Infrastructure and Transport
Model Program for Environmental Symbiosis Residential Areas
Photovoltaic power generation systems as survey, design and planning costs and environmental symbiosis facilities construction costs
State: 1/3 Local public authority: 1/3
Ministry of Land, Infrastructure and Transport
Urban Park Development Cost Subsidization
Photovoltaic power generation equipment for use in park broadcasting, lighting and swimming pools, etc.
50% of installation cost
Ministry of Education Ministry of Economy, Trade and Industry Ministry of Agriculture, Forestry and Fisheries
Pilot Model Project concerning Promotion of Environmentally Considerate School Facilities (Eco Schools)
Installation of photovoltaic power generation systems, etc. in school facilities
50% of the photovoltaic power generation system, etc. installation cost
Ministry of Finance Energy Demand Structure Reform Investment Promotion Tax
Individual and private programs
Selection of one of the following in cases where photovoltaic power generation systems are introduced and put to program use within a year: 1. Tax deduction
equivalent to 7% of the standard acquisition cost
2. Special depreciation worth up to 30% of the acquisition cost in addition to standard depreciation (small enterprises only)

5. PRE-FEASIBILITY STUDY
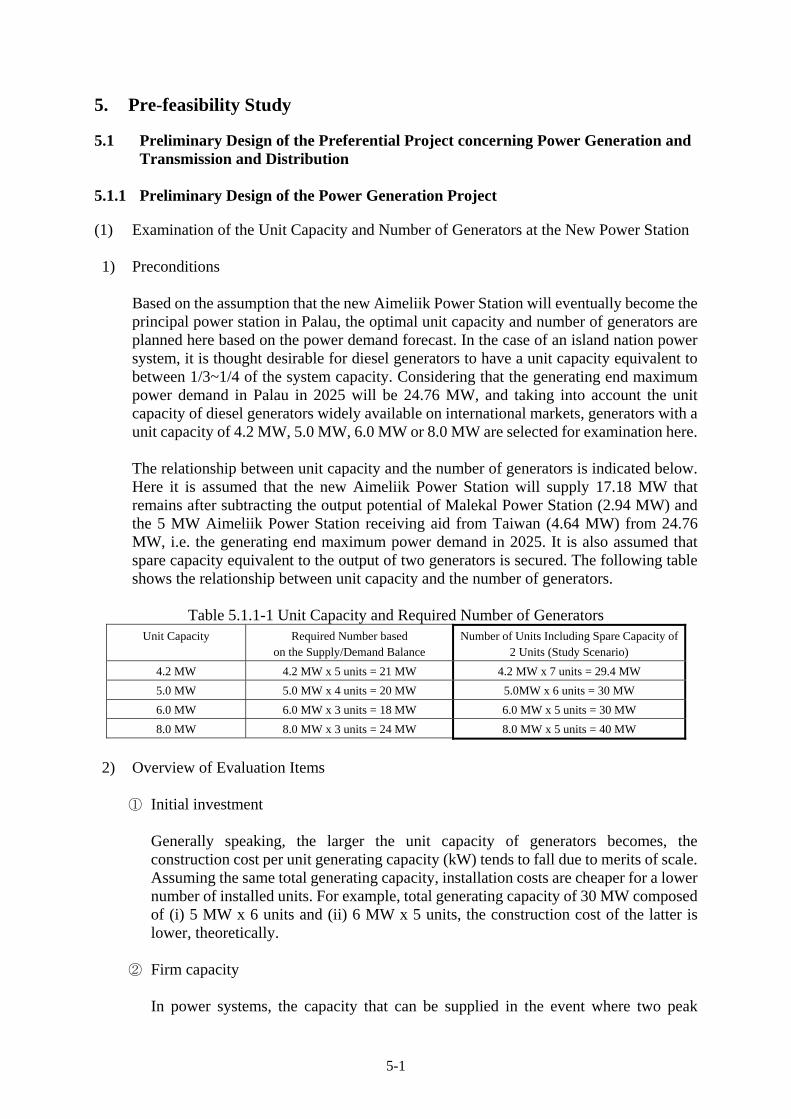
5-1
5. Pre-feasibility Study 5.1 Preliminary Design of the Preferential Project concerning Power Generation and
Transmission and Distribution 5.1.1 Preliminary Design of the Power Generation Project (1) Examination of the Unit Capacity and Number of Generators at the New Power Station 1) Preconditions
Based on the assumption that the new Aimeliik Power Station will eventually become the principal power station in Palau, the optimal unit capacity and number of generators are planned here based on the power demand forecast. In the case of an island nation power system, it is thought desirable for diesel generators to have a unit capacity equivalent to between 1/3~1/4 of the system capacity. Considering that the generating end maximum power demand in Palau in 2025 will be 24.76 MW, and taking into account the unit capacity of diesel generators widely available on international markets, generators with a unit capacity of 4.2 MW, 5.0 MW, 6.0 MW or 8.0 MW are selected for examination here. The relationship between unit capacity and the number of generators is indicated below. Here it is assumed that the new Aimeliik Power Station will supply 17.18 MW that remains after subtracting the output potential of Malekal Power Station (2.94 MW) and the 5 MW Aimeliik Power Station receiving aid from Taiwan (4.64 MW) from 24.76 MW, i.e. the generating end maximum power demand in 2025. It is also assumed that spare capacity equivalent to the output of two generators is secured. The following table shows the relationship between unit capacity and the number of generators.
Table 5.1.1-1 Unit Capacity and Required Number of Generators Unit Capacity Required Number based
on the Supply/Demand Balance Number of Units Including Spare Capacity of
2 Units (Study Scenario) 4.2 MW 4.2 MW x 5 units = 21 MW 4.2 MW x 7 units = 29.4 MW 5.0 MW 5.0 MW x 4 units = 20 MW 5.0MW x 6 units = 30 MW 6.0 MW 6.0 MW x 3 units = 18 MW 6.0 MW x 5 units = 30 MW 8.0 MW 8.0 MW x 3 units = 24 MW 8.0 MW x 5 units = 40 MW
2) Overview of Evaluation Items
① Initial investment
Generally speaking, the larger the unit capacity of generators becomes, the construction cost per unit generating capacity (kW) tends to fall due to merits of scale. Assuming the same total generating capacity, installation costs are cheaper for a lower number of installed units. For example, total generating capacity of 30 MW composed of (i) 5 MW x 6 units and (ii) 6 MW x 5 units, the construction cost of the latter is lower, theoretically.
② Firm capacity
In power systems, the capacity that can be supplied in the event where two peak

5-2
capacity generators are idle is called the firm capacity and is an indicator of the supply stability. The required number of units based on the supply/demand balance indicates the supply capacity excluding two spare capacity units and shows the same value as the firm capacity.
③ Maintenance cost Assuming that generators have the same capacity, the overall maintenance cost goes up as the number of installed units increases, and the maintenance cost per unit goes up as the unit capacity increases.
④ Fuel efficiency Diesel engines are designed to display the highest efficiency when operated at 100% load. Therefore, fuel efficiency gradually declines as the engine load factor decreases. Here, based on the assumption that generating end maximum power demand is 24.76 MW in 2025 and the night time minimum output is 12.1 MW, the diesel engine load factor in the case where generators are operated in this range is evaluated as an indicator of fuel efficiency. Figure 5.1.1-1 shows the relationship between single unit capacity and load factor. In the case of 6 MW and 8 MW in terms of single unit capacity, load factor falls down lower than 70 %.
65%
70%
75%
80%
85%
90%
95%
100%
105%
12 13 14 15 16 17 18 19 20 21 22 23 24 25
4.2MW5.0MW6.0MW8.0MW
Figure 5.1.1-1 Relationship between single unit capacity and load factor
⑤ Total generating output Evaluate the total generating output obtained through multiplying the unit capacity by the number of units.
3) Evaluation of Unit Capacity and Number of Units
General evaluation was carried out through giving scores of 0~4 points for each of the above evaluation items. Table 5.1.1-2 shows the evaluation results. According to these, it
Load
Fac
tor
Total Output (MW)

5-3
is preferable to install six diesel generators each with a unit capacity of 5 MW.
Table 5.1.1-2 Evaluation of Unit Capacity and Number of Generators
Case Initial
Investment Firm
Capacity Maintenance
Cost Fuel
EfficiencyTotal
Output Total
4.2 MW x 7 units (29.4 MW) 2 3 1 4 1 11 5.0 MW x 6 units (30 MW) 3 2 3 4 2 14 6.0 MW x 5 units (30 MW) 4 1 4 1 2 12 8.0 MW x 5 units (40 MW) 0 (max) 4 2 1 4 11
Note : Concerning the scoring scale of 0~4, higher scores indicate better performance.
Since the new Aimeliik Power Station will carry the base load of Palau, diesel engines of the medium speed type (no more than 750 rpm), which enable long-term continuous operation, shall be adopted.
5 MW class diesel engine generators are manufactured by three Japanese companies (Daihatsu Diesel, Mitsubishi Heavy Industries and Niigata Power System) as well as one German company (Man Diesel), one Finnish company (Wartsila) and one US company (Caterpillar). Sufficient competitiveness can, therefore, be secured by a tender. Table 5.1.1-3 compares the specifications of the diesel engines manufactured by these companies.
Table 5.1.1-3 Comparison of Diesel Engine Specifications Manufacturer Daihatsu
Diesel Niigata Power System Mitsubishi Heavy Industries
Model Number 12DK-36 16V28HLX 16V32CX1 16KU30A 18KU30A 12MARK30B Output (MW) 5.50 5.76 5.5 5.00 5.65 5.18 Speed (rpm) 600 720 720 720 720 720 Number of Cylinders 12 16 16 16 18 12 Cylinder Configuration V V V V V V Cylinder Bore Diameter (mm) 360 280 320 300 300 300 Break Mean Effective Pressure (MPa) 2.03 2.44 2.05 2.00 2.00 2.50
Heat Consumption* (kJ/kWh) 8,369 7,882 8,071 8,071 7,772 Total Engine Length (mm) 7,765 7,035 7,685 8,225 - Total Length, including Generator (mm) 12,020 10,585 - - 10,970
Generator Frequency (Hz) 60 60 60 60 60 60
Manufacturer Caterpillar MAN Diesel WartsilaModel Number 12CM32 6CM43 12V32/40PGI 12V32/40 14V32/40DF 16V32/40DF 12V32 Output (MW) 5.59 5.24 5.005 5.82 5.23 5.975 5.211 Speed (rpm) 720 514 720 720 720 720 720 Number of Cylinders 12 6 12 12 14 16 12 Cylinder Layout V L V V V V V Cylinder Bore Diameter (mm) 320 430 320 320 320 320 320
Break Mean Effective Pressure (MPa) 2.40 2.40 2.27 2.62 2.02 2.02 2.36
Heat Consumption (kJ/kWh) 7,792 7,748 7,740 7,860 8,284 8,284 7,901 Total Engine Length (mm) - - 6,991 6,475 7,105 7,670 6,435 Total Length, including Generator (mm) 11,560 14,295 10,460 10,690 11,320 12,120 10,030
Generator Frequency (Hz) 60 60 60 60 60 60 60 Source: Home Page and Catalogue of each manufacturer Note: Lowest value Highest value in the table in the table *: Heat consumption (kJ/KWh) means heat consumed to generate 1kWh electricity which represents fuel
efficiency. The lower heat consumption means the less fuel consumption required for unit generation.

5-4
(2) Rough Specifications for New Aimeliik Power Station The rough specifications for the new Aimeliik Power Station are shown in Table 5.1.1-4.
Table 5.1.1-4 Rough Specifications for the New Aimeliik Power Station Work Category Type of Work Main Components of the Work and Equipment
1. Civil work • Access road: approx. 6 m wide x 200 m long • Site preparation: approx. 100 m x 100 m • Exterior work: premise roads, water supply and drainage facilities and others • Foundations for outdoor machinery, etc: radiator, water tank and others • Fuel unloading jetty: for berthing of a 6,000 class oil tanker
1. Facility construction
2. Building work • Construction of generator house: two story, steel frame with a total floor area of 3,332 m2 (2,176 m2 for the ground floor and 1,156 m2 for the first floor)
• Ancillary systems: lighting, ventilation and overhead crane, etc. • Building for auxiliary machinery: incineration furnace and others
Engine • Normal mode of operation: continuous (base load; 8,000 hours/year) • Rated output: generating end 5,000 kW or higher • Speed: 720 rpm or less (medium speed engine) • Engine type: four stroke; compression ignition; internal combustion engine with
reciprocal piston motion • Supercharger: water-cooled V type engine • Fuel oil: normal Type C fuel oil and diesel oil for starting up and stopping
operation • Cooling method: radiator • Starting up method: compressed air (30 Mpa) • Lubricating oil: local procurement • Waste oil treatment system: suitable system to ensure no damage to the
environment • Installation method: common base with anti-vibration structure
AC generator • Rated mode of operation: continuous (base load; 8,000 hours/year) • Rated output: 6,250 kVA (5,000 kW) or higher • Rated power: 13.8 kV; 60 Hz; three phase; three wire • Power factor: 0.8 (lagging current) • Winding connection: Y connection; neutral leader line • Insulation class: F class (JIS) or equivalent
2. Equipment procurement and installation
Mechanical systems
• Fuel supply system: DFO service tank HFO buffer tank HFO service tank HFO purifier FO supply system heat trace • Lubricating oil system: LO priming pump LO cooler LO purifier LO supply system • Cooling water system: water tank HT expansion tank LT expansion tank primary cooling water pump secondary cooling water pump • Compressed air system: compressor air tank control system • Air supply and exhaust system: air supply filter air supply silencer air supply cooler exhaust cooler exhaust stack duct, expansion joint • Waste oil treatment system: oil separating tank oil separating system waste oil tank waste oil incinerator • Black start-up: emergency generator (150 kW) with ancillary systems

5-5
Work Category Type of Work Main Components of the Work and Equipment Electrical installations
• Engine control panel: machine side control panel • Generator control: desk control type • Generator breaker panel: 13.8 kV; VCB 630 A • Transformer breaker panel: 13.8 kV; DC • Bass breaker panel: 13.8 kV; VCB 630 A • Transmission breaker panel: 13.8 kV; VCB 630 A • Neutral grounding panel: 13.8 kV • Protective relay panel: 13.8 kV • MCC: 400 V; three phase; four wire • DC power panel: battery; charger • Low voltage distribution panel: L-1; M-1
Type C fuel oil unloading system
• Pipeline: jetty → tank yard; heat trace; heat insulation work • Fuel tank remodelling work: suction heater; heat insulation work
(3) Locationing of the New Power Station There are three candidate sites (A, B and C) as shown in Fig. 5.1.1-1 for the location of the planned new power station (including a new substation) under the plan in consideration of the re-use of the existing fuel storage facilities, fuel unloading facilities and transmission/distribution lines, etc.
Plan C
Plan A
Plan B
Source: JICA Study Team
Fig. 5.1.1-1 Candidate Location for the New Power Station

5-6
Table 5.1.1-5 Evaluation of Candidate Project Sites Conditions Site A (North of Tank Yard;
approx. 100 m x 100 m) Site B (North of Site A; approx.
100 m x 100 m) Site C (West of Tank Yard;
approx. 100 m x 100 m) Vegetation Woodland
Felling will have a negative impact.
Woodland and grassland The felling area will be smaller than that of Site A but there will still be an environmental impact.
Grassland Unlike Site A and Site B, the felling of trees will be unnecessary.
Topography Land preparation work (cutting and banking) will be required to deal with the highly undulating land; generator installation on banked ground should be avoided.
Land preparation work (cutting and banking) will be required although the scale will be smaller than the similar work for Site A; generator installation on banked ground should be avoided; the cost is higher than that for Site A because of the steeper gradient.
The site forms a small hill and land preparation work may only consist of cutting. The cost will be the lowest among the alternatives.
Access Road The length of the new access road will be short because of the proximity of the existing road but levelling work will be required to deal with the 3% height difference.
As left The construction of a new access road for some 200 m will be required to modify the existing road.
Noise and Vibration The distance to the nearest private house will be 250 m, possibly increasing the impacts on this and other houses because of the shorter distance than is currently the case.
The distance to the nearest private house of 200 m will be the shortest among the alternatives, causing concern in regard to noise pollution.
The distance to the nearest private house of 400 m will be the longest among the alternatives, improving the present situation.
Distance Between Old and New Power Stations
300 m (distance between the circuit breaker panels); connecting cable length: medium
350 m (distance between the circuit breaker panels); connecting cable length: short
400 m (distance between the circuit breaker panels); connecting cable length: long
Overall Evaluation Δ (Fair)
X (Poor)
(Best)
Source: JICA Study Team Based on the site evaluation results shown in Table 5.1.1-5, Candidate Site C is the best site for the location of the new Aimeliik Power Station. However, the land for Candidate Site C is owned by the government and it will be necessary for the PPUC to negotiate with the government for its acquisition for the new Aimeliik Power Station. The Study Team intends to proceed with the work in consideration of the fact that Candidate Site C is the best site for the said power station. (4) Planning Fuel Oil Loading Equipment
Since the existing generators use diesel oil-fired engines, the existing fuel oil loading equipment is designed for use with diesel oil. Tankers in the 7,850 ton class (L = 110 m, W = 41.6 m, D = 7.1) moor at a distance of around 50 m from the existing pier, and oil is transferred by a pressure-resistant hose housed in a drum on the pier. Since diesel oil has a lighter specific gravity (0.86) than water, the pressure-resistant hose floats on the sea surface during loading. The pier is connected to the existing fuel oil tanks by a pipeline. In the event where heavy oil-fired engine generators are installed, due to the high viscosity of the heavy fuel oil, the oil temperature must be raised to 60°C or higher during the transfer. Accordingly, the existing fuel oil loading equipment cannot be used, and it is necessary to newly install specialized equipment for heavy fuel oil.

5-7
Depending on the method used to install receiving pipes, the following three alternatives can be considered for the heavy fuel oil loading equipment. Table 5.1.1-6 indicates the results of comparing and examining the three methods. Table 5.1.1-7 shows the results of sea bottom survey in front of the existing fuel oil unloading jetty. It was observed that the sea bottom soil in the surveyed area is fine and white mud and no coral was found as a result of the survey.
Table 5.1.1-6 Comparison Sheet of Heavy Fuel Oil Loading Equipment Option 1
Extension of pier Option 2
Seabed pipeline Option 3
Arc tunneling
Method
Driving piles into the sea bed, extend the pier and install the pipeline along that.
Install a pipeline along the sea bottom, anchor it down and fix it by burying in the seabed, etc.
Advance an arc-shaped pipe from the land into the target seabed. This is a new method devised out of environmental consideration.
Environmental and social consideration
Marine pollution during the works is a concern. Impact on adjoining mangroves, etc. is forecast.
Marine pollution during the works is a concern. Impact on adjoining mangroves, etc. is forecast. Revetment works are needed at the point pierced by the pipeline.
Options 1 and 2 have an impact along the pipeline, however, Option 3 entails a much smaller point impact. It is possible to select the underwater pipeline extension position.
Merit and demerits
Since piping is aboveground, maintenance is easy. Works are conducted at sea. Separate piping is required from the existing pier to the tank yard
Since piping is laid in the sea, maintenance is difficult. Works are conducted at sea. Separate piping is required from the existing pier to the tank yard
Since piping is laid in the seabed, maintenance is difficult. The length of piping to the tank yard is shortest.
Landscape The extended pier is installed at sea. The landscape will be changed.
Since the piping is installed undersea, impact on the landscape is small.
Since the piping is installed undersea, impact on the landscape is small.
Price Expensive Medium price Medium price
General assessment △
Major environmental impact during the works
△
Major environmental impact during the works
O The best method in terms of
environment Source: JICA Study Team Accordingly, Option 3 (arc tunneling method) shall be planned as the pipeline for transporting fuel oil from the tanker moored out at sea. Figure 5.1.1-2 shows a rough outline of this method.
Source: JICA Study Team
Fig. 5.1.1-2 Arc Tunneling Method

5-8
Table 5.1.1-7 Results of Sea Bottom Survey (Off the shore of Aimeliik oil jetty) Date of Survey:April 26, 2008 (Sat) 9:00~10:30AM
Latitude(N) Longitude(E)Distancefrom jetty
(m)1 7°26' 24.3" 134°28' 20.4" 0 2.4 Limestone, sand Edge of jetty2 7°26' 23.9" 134°28' 20.0" 15 4.0 ditto
3 7°26' 23.4" 134°28' 20.2" 28 9.5 sand
4 7°26' 23.0" 134°28' 19.8" 44 10.6 sand
5 7°26' 22.3" 134°28' 19.7" 60 11.6 sand
6 7°26' 21.7" 134°28' 20.0" 85 12.5 sand
7 7°26' 21.0" 134°28' 20.0" 109 13.4 sand8 7°26' 20.6" 134°28' 19.4" 120 13.9 sand
9 7°26' 20.1" 134°28' 18.8" 140 14.4 sand
10 7°26' 19.2" 134°28' 18.9" 164 15.0 sand
11 7°26' 16.6" 134°28' 18.5" 245 16.4 sand near buoy
PhotoDepth (m) Remarkds
GPS Data
No. Sea BottomCondition

5-9
(5) Overall Work Schedule In accordance with the contents of 4.2.1, the implementation schedule shown in Table 5.1.1-8 is planned. It will be necessary for the PPUC to commence fund raising and other preparatory work as soon as possible in view of the early commencement of the actual construction work to deal with the projected poor power supply and demand situation in FY 2012.
Table 5.1.1-8 Implementation Schedule (New Aimeliik Poser Station Construction Work) Item 2009 2010 2011 2012 2013 2014 2015 2016 2017 2018 20191 Fund Raising
2 Consultant Selection
3 Detailed Design
Phase-I Phase-II Phase-III
4 Tender
Phase-I Phase-II Phase-III
5 Work Supervision
Phase-I Phase-II Phase-III
6 Facility Construction
Phase-I Phase-III
7
Equipment Procurement and Installation
Phase-I Phase-II Phase-III
Source : JICA Study Team (6) Power Station Construction Cost Table 5.1.1-9 shows the estimated project cost for two cases, i.e. that with heavy oil firing engine generators and that with diesel oil firing engine generators.
Table 5.1.1-9 Estimated Project Cost (New Aimeliik Power Station Construction Work) (Unit: US$ million)
Source: JICA Study Team
Phase-Ⅰ Phase-ⅡUrgent Project,(Phase-Ⅰ+Ⅱ) Phase-Ⅲ Total Phase-Ⅰ Phase-Ⅱ
Urgent Project,(Phase-Ⅰ+Ⅱ) Phase-Ⅲ Total
1.Land Acquisition 0.24 0.00 0.24 0.00 0.24 0.24 0.00 0.24 0.00 0.24
2.Construction Cost 5.22 0.00 5.22 1.56 6.78 8.22 0.00 8.22 1.56 9.78
3.Equipment Procurementand Installation Cost
10.40 9.60 20.00 9.60 29.60 12.60 10.00 22.60 10.00 32.60
4.Engineering Fee 1.59 0.96 2.55 1.12 3.67 2.11 1.00 3.11 1.16 4.27
5.Administration Cost 0.17 0.11 0.28 0.12 0.40 0.23 0.11 0.34 0.13 0.47
6.Contingency 1.76 1.07 2.83 1.24 4.07 2.34 1.11 3.45 1.28 4.73
Total 19.38 11.74 31.12 13.64 44.76 25.74 12.22 37.96 14.13 52.09
Basic PlanDiesel Oil Conversion Engine
Alternative PlanHeavy Oil Conversion Engine
Item

5-10
5.1.2 Preliminary Design of the Transmission and Distribution Project 5.1.2.1 Submarine Cable Transmission Line Between Aimeliik Power Plant and T
Dock on Koror Island and Alternative The preliminary design work has been conducted to compare the plan to lay a submarine cable between the Aimeliik Power Plant and T Dock on Koror Island and the alternative plan to upgrade the existing transmission line as this issue is considered to be an issue to be dealt with in the short term. (1) Laying of Submarine Cable 1) Selection of the Route
The preferable route was selected based on the following requirements.
• Short and straight as possible • Flat seabed with few steep slopes or undulations • Sandy or muddy seabed with few rocks or exposed bedrock • Avoidance of any environmental conservation areas and diving spots • A seabed survey was conducted along the anticipated route on 22nd January, 2008 to
clarify the state of inhabitation of marine creatures and the soil properties (at the 12 points shown in Fig. 5.1.2-1).
2) Finalization of the Route
Based on the findings of the route selection, the route shown in Fig. 5.1.2-1 has been finalized. • It was decided to avoid the shallows near the T Dock and Aimeliik to ensure few
undulations along the cable route. For this reason, the route would run towards the north by northeast from the T Dock and detour the shallows near Aimeliik. The resulting length is approximately 11.6 km.
• The submarine cable is classified as Plan A.
Fig. 5.1.2-1 Submarine Cable Route Fig. 5.1.2-2 Sea Chart Showing the Area
Along the Cable Route

5-11
3) Findings of the Seabed Survey
Table 5.1.2-1 outlines the findings of the seabed survey. At those points marked in red in Fig. 5.1.2-1, the inhabitation of Echinopora lamellose and other coral species was confirmed. Therefore, impact on the coral during the laying work of submarine cable is concerned. The existence of scattered, rocky stretches was also confirmed. Photo 1 and Photo 2 show the types of coral found by the survey.
Table 5.1.2-1 Summary of the Survey Findings
Survey Point 0 1 2 3 4 5 6 7 8 9 10 11Rock - O - - - - - - - O O - Sand O - O - - - - - - O - O
Geology
Mud - - - O O O - - - - - - Coral - O - - O - O O O - - OMarine
Creatures Zostera marina (type of seaweed) O - - - - - - - - - - - * O indicates the existence
№0
№1
№2
№3
№4№5
№6
№7
№8
№9
№10№11
-40
-30
-20
-10
0
0 2,000 4,000 6,000 8,000 10,000Distance (m)
dept
h (m
)
T Doc Aimeliik
Fig. 5.1.2-3 Profile of the Survey
4) Outline of the Preliminary Design for Submarine Cable
① Selection of Submarine Cable
The type of cable will be CV insulated cable in view of maintainability and environmental implications (Oil-filled cable requires oil management and could cause environmental pollution as the result of an accident). The conductor size will be 250 mm2 to meet the required transmission capacity when power supply on another 34.5 kV transmission route is interrupted (the projected demand of 25 MW in FY 2025 is taken into consideration).
② Cable Protection
The cable will have double steel wire armour for protection from possible contact with ship anchors or rocks and will be buried some 1 m below the seabed. When such burying is not possible because of the presence of bedrock, etc., the cable will be fully protected by protective tube.

5-12
③ Salt-Contamination Countermeasure
When submarine cable is laid, the rising points are near the sea. Accordingly, a salt-contamination countermeasure, such as the construction of cable housing, is required.
5) Calculation of the Construction Cost for Submarine Cable
The construction cost will be calculated taking the following points into consideration. • To determine the cable length, 3% of the route length is added in consideration of
seabed undulations. • As expert knowledge is required for the work, procurement, engineers, a surveyor and
diver, etc. will be dispatched from overseas while simple work will be conducted by local workers.
• It is assumed that the transportation of the cable from overseas to Palau will take approximately two weeks (one way).
• The cable will be laid by a cable laying ship with a laying capacity of 1,500 m a day. The cable will be buried 1 m below the seabed and cable burying equipment capable of burying up to 500 m a day will be employed.
Fig. 5.1.2-4 Example of Power Cable Laying Ship (2) Examination of Alternative Plan to Upgrade the Existing Transmission Line 1) Selection of the Route for Overhead Transmission Line
The route for overhead transmission line has been selected taking the following conditions into consideration.
• The new transmission line will be constructed along the road for better workability. • The link between Babeldaob Island and Koror Island will use the space inside KB
Bridge where the power cable can be laid. • The existing transmission line will be upgraded to a double circuit transmission line at
the sections between KB Bridge and the Koror Substation where there is no space for a new transmission line.

5-13
2) Finalization of the Overhead Transmission Line Route
① Between the Aimeliik Power Plant and Nekken Substation
At present, double circuit transmission lines run along the road towards the Airai Substation and Kokusai Substation respectively. The new transmission line will also be constructed along the road to ensure better workability. The construction of the new line needs to eliminate the road crossing points of the existing transmission line (see Fig. 5.1.2-5).
Fig. 5.1.2-5 Installation Steps for the New Transmission Line ② Between the Nekken Substation and Compact Road
The following two alternative plans will be examined.
• Plan B: Construction of a new transmission line along the existing route While the existing transmission line to the Airai Substation and Kokusai Substation use the same poles for the section from the Aimeliik Power Plant and Nekken Substation, they use different supports (concrete poles) after the Nekken Substation. The new transmission line towards the Koror Substation will be constructed next to these existing lines. Since the proposed transmission line route follows existing transmission lines and roads, no environmental and social impact is concerned.
Fig. 5.1.2-6 New Transmission Line Towards the Koror Substation (Plan B)
Road Existing TransmissionLines (2 Lines) New Installation Line Existing Pole
→To Airai →To Kokusai
→To Airai →To Kokusai
→To Koror
To Airai and Kokusai To Airai To Kokusai To Koror (New Installation)

5-14
• Plan C: Use of the transmission line from the Nekken Substation to the Kokusai Substation As there is a road to the east of the Nekken Substation leading to the Kokusai Substation, the new transmission line to the Kokusai Substation will be constructed along this road, diverting the existing transmission line to the Kokusai Substation to serve the Koror Substation (Photo 3 and Photo 4). In this case, part of the existing transmission line along Compact Road will become redundant but will be kept as a reserve for future extension or as a detour line at the time of a problem. Even though the new transmission line route between Nekken and Kokusai crosses Ngaremeduu Conservation Area, impact on the conservation area will not be a concern because the new line will be constructed along the existing roads. Since other paths of the new transmission line routes also follow the existing roads, environmental and social impact to be caused by the new transmission line will not be negligible.
Fig. 5.1.2-7 New Transmission Line Towards the Koror Substation (Plan C)
③ Between Compact Road and KB Bridge
Following the same steps shown in Fig. 5.1.2-5, the new transmission line will be constructed while eliminating the road crossing points.
④ KB Bridge Section (Link Between Babeldaob Island and Koror Island)
A survey on KB Bridge found sufficient space to lay the new power cable inside the bridge structure. The new cable will, therefore, be laid inside the bridge structure (see Photo 5 and Photo 6).
⑤ Between KB Bridge and Koror Substation
The steps shown in Fig. 5.1.2-5 will be basically adopted although double transmission lines will be opted for in some areas where there is no space for new poles by means of the remodelling or replacement of the existing concrete poles (resulting in a configuration of three lines because of the existence of a 13.8 kV distribution line). The surveying, pole arrangement examination and strength design will, therefore, be conducted in greater detail (Photo 7 and Photo 8).
To Airai and Kokusai To Airai To Kokusai (New Installation) To Koror (New Installation) To Koror (Existing) For Future (Existing)

5-15
⑥ Measures to Avoid Long-term Power Outages for Construction of New Transmission Lines
Since construction of new transmission lines requires power outages during the construction period, the following measures should be taken into consideration in order to avoid prolonging the power outage period.
- New poles erection and wiring in the new construction sections should be carried out beforehand and then only conductor connection work should be executed at the power outage period, so that the period without power for customers is shortened.
- The power supply to Malakal and Koror area should be kept by operating all generators of the Malakal Power Plant and by requesting the large users with a private power generator to switch to their own power generator as an emergency load reduction measure.
- During the conductor connection work of the transmission line from the Aimeliik Power Plant to the Nekken Substation, power outages of the northern areas from the Aimeliik Power Plant are unavoidable. To shorten the period without power, it is important to resume normal supply conditions every night after the daytime construction work. If there are important areas where any outage is not forgiven, temporary power supply by a Vehicle-Mounted Generator is a measure to avoid the power outages.
3) Outline of the Preliminary Design
① Supports
The supports will be concrete poles which have a high corrosion resistance as in the case of the existing transmission lines. The specifications will be the same as the existing poles as outlined in Table 5.1.2-2.
Table 5.1.2-2 Outline of Supports
Pole Arrangement Specifications Application Point Single circuit Length: 13 m
Design load: 700 kg• Single 34.5 kV circuit
Double circuit Length: 16 m Design load: 700 kg
• Double 34.5 kV circuit • Single 34.5 kV circuit plus single 13.8 kV circuit (While 15 m long poles are used in some areas, the length of all poles will be unified at 16 m.)
② Transmission Conductor
The type and size of the transmission conductor will be the same as those of the existing transmission lines. The neutral line will be HDCC cable which is currently used.
Table 5.1.2-3 Outline of Conductor Category Type of
Conductor Size
34.5 kV transmission line AAC 150 mm2 Neutral line HDCC 38 mm2

5-16
③ Power Cable The power cable to be installed inside the KB Bridge structure will be highly workable CVT insulated (Triplex) cable. The size will be determined to satisfy the allowable current (430 A) of the AAC 150 mm2 used for the existing transmission lines (approximately CV 200 mm2: the final decision must be made after detailed examination of the cable laying conditions).
④ Insulators The same types of insulators used for the existing transmission lines will be used as shown in Table 5.1.2-4.
Table 5.1.2-4 Outline of Insulators Type of Insulator Power Line Place of Application LP30 LP10 250 mm suspension insulator
Straight pull pole 1 - - 34.5 kV transmission line Angle pole 1 – 2 - 4
⑤ Standard Span, Ground Clearance and Phase to Phase distance
The standard span will be the same as that (approx. 50 – 70 m) of the existing transmission lines while the minimum ground clearance of the conductor and phase to phase distance are as shown in Table 5.1.2-5 complying with the NESC.
Table 5.1.2-5 Minimum Ground Clearance and Phase to Phase distance
Type of Power Line Minimum Ground Clearance Phase to Phase distance
34.5 kV 6.4 m 1,190 mm 13.8 kV 6.1 m 825 mm
4) Calculation of the Construction Cost
The construction cost will be calculated taking the following points into consideration.
• The overhead cable will be laid by local workers. • Plan A and Plan B described earlier will be examined for the section between the
Nekken Substation and Compact Road. • The laying of the cable inside the KB Bridge structure will require expert skills and an
engineer will be dispatched from Japan with the necessary materials being procured in Japan.
• The cable will be laid in the following method. ① The target section will be covered by two separate cables for their connection
near the central point of the bridge. ② The rising of the cable will use a concrete pole. ③ No manholes or other will be installed between the bridge and the concrete pole.
(3) Comparison of the Plan to Lay Underwater Cable Line and the Plan to Upgrade the
Existing Transmission Line The following three alternative plans have been compared and Plan C has been selected.

5-17
• Plan A : Installation of a underwater cable line • Plan B : Upgrading of the existing transmission line (new line from the Nekken
Substation to Compact Road) • Plan C : Upgrading of the existing transmission line (new line from the Nekken
Substation to the Kokusai Substation and the diverted use of the existing line from the Nekken Substation to Compact Road)
These plans are compared in Table 5.1.2-6
Fig 5.1.2-8 Examination of the route
Plan A Plan B Plan C Existing Substation New Substation

5-18
Table 5.1.2-6 Comparison of Alternative Plans Plan A Plan B Plan C
Configuration of the new line
Submarine cable: 11.6 km Overhead line: 23.2 km Bridge section: 0.6 km
Overhead line: 21.8 km Bridge section: 0.6 km
Workability The scale of the work will be large because of the involvement of a cable laying barge but no special problems are anticipated unless there are restrictions to the work.
• For those sections where the existing line will be diverted, each section must be worked on separately.
• For the section from KB Bridge to the substation, the existing poles will require remodelling or replacement.
• For the section between the Nekken Substation and Compact Road, it will be difficult to secure the necessary work space because of the existing double lines along the road.
• As left • As left • No work will be required
between the Nekken Substation and Compact Road as the existing line will be converted.
Construction period (site work)
3 months 9 months 8 months
Reliability As the cable will be protected against anchors and rock, no problems are anticipated in regard to reliability.
The cable at the bridge section will require some management at the openings of the bridge. The reliability of the overhead line is the same as that of other similar line.
As left. The section along Compact Road which will be made redundant may be used to quickly restore the power supply at the time of power failure incidents.
Environmental impacts
There is concern in regard to a possible negative impact on the confirmed coral communities.
Careful attention will be required for the route selection at those sites where mangrove grows at the roadside.
As left
Maintenance Routine maintenance will not be required but any accident will mean a prolonged power cut.
The maintenance requirements are the same as those of the existing lines. The cable in the bridge section is less likely to be damaged because of its position inside the bridge structure.
As left
Estimated project cost (US$ million)
Land acquisition: 0.00 Construction: 0.00 Equipment procurement and installation: 10.94 Consultant: 1.09 Management (PPUC): 0.12 Contingency: 1.22 Total: 13.37
Land acquisition: 0.00 Construction: 0.00 Equipment procurement and installation: 2.51 Consultant: 0.25 Management (PPUC): 0.03 Contingency: 0.28 Total: 3.07
Land acquisition: 0.00 Construction: 0.00 Equipment procurement and installation: 2.45 Consultant: 0.25 Management (PPUC): 0.03 Contingency: 0.27 Total: 3.00
Transmission loss 0.4-0.5% reduction in comparison with plan B,C
0.4-0.5% increase in comparison with plan A
As left
Overall evaluation The total cost including project cost and transmission loss is by far the highest and there is in concern in regard to a negative impact on marine creature. This plan has been rejected.
While the total cost including project cost and transmission loss is small, there is a possibility of a problem in regard to workability. This plan has been rejected.
While further examination is required in regard to workability, the total cost including project cost and transmission loss is the lowest. This plan has been selected.

5-19
(4) Implementation Schedule The implementation schedule for Plan C is shown in Table 5.1.2-7.
Table 5.1.2-7 Implementation Schedule (Work to Construct New 34.5 kV Transmission Line Between the Aimeliik Power Plant and the Koror Substation)
Item 2009 2010 2011 2012 2013 1 Fund Raising
2 Selection of Consultant
3 Detailed Design
4 On-Site Supervision
5 Equipment Procurement and Installation
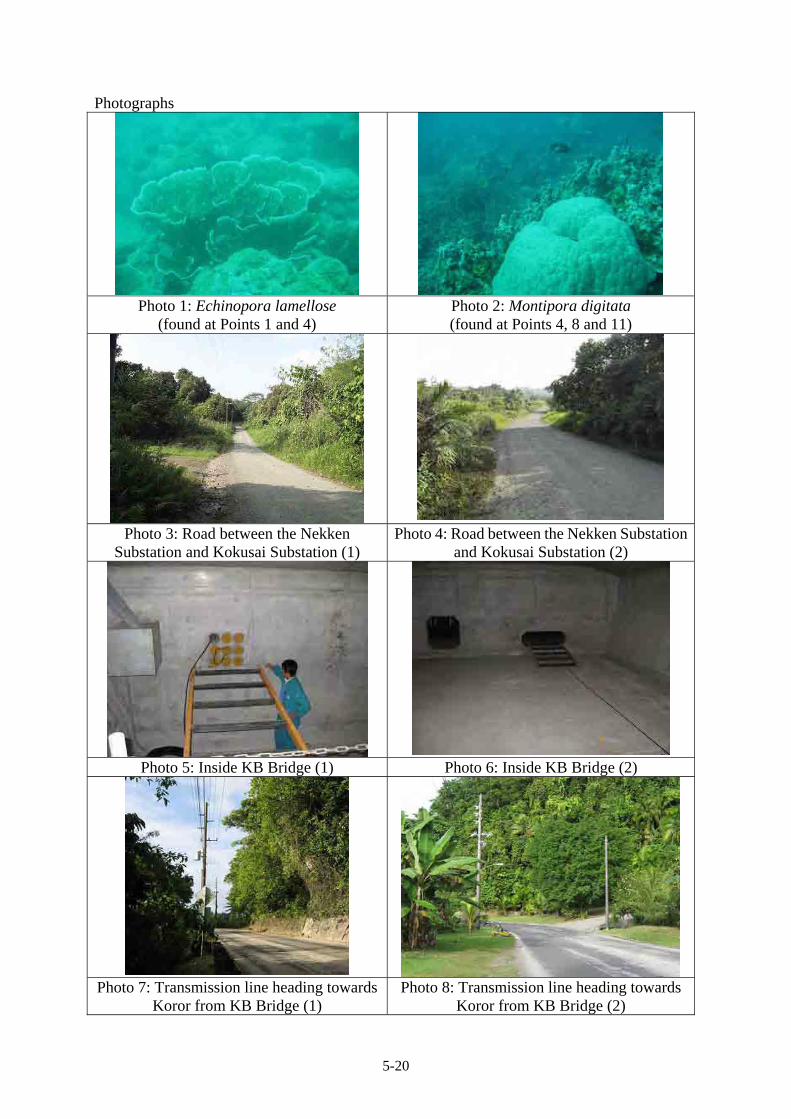
5-20
Photographs
Photo 1: Echinopora lamellose
(found at Points 1 and 4) Photo 2: Montipora digitata (found at Points 4, 8 and 11)
Photo 3: Road between the Nekken
Substation and Kokusai Substation (1) Photo 4: Road between the Nekken Substation
and Kokusai Substation (2)
Photo 5: Inside KB Bridge (1) Photo 6: Inside KB Bridge (2)
Photo 7: Transmission line heading towards
Koror from KB Bridge (1) Photo 8: Transmission line heading towards
Koror from KB Bridge (2)

5-21
5.1.2.2 Preliminary Design of Koror Substation (1) Selection of Substation Site Location The Koror Substation shall be located near KB Bridge on Koror Island. It is judged that the implementation of the original plan to supply power via a submarine cable transmission line will be difficult because of its very high cost and also from the viewpoint of environmental protection (Echinopora lamellose and other creatures inhabit the planned submarine cable route). For this reason, it is assumed that power supply will be made by a double circuit overhead transmission line (laying of the cable inside the bridge structure at the section crossing KB Bridge). Because of the change of planned route, it is not necessary to choose the site near T Dock (for reclamation of the land to locate the new substation). In case of avoiding the center of downtown where land procurement seems to be difficult, Babeldaob Island side is better, because Airai substation’s transforming facilities can be utilized in southern area of Babeldaob Island if the load of Malakal Island is supplied from the Malakal Power Plant or the Koror Substation. From some sites near the 34.5kV transmission line, Site A in Fig. 5.1.2-9 is chosen considering that small development is expected due to comparatively flat land. Since Site A is private land, Site B owned by Koror State shall be the alternative. The selection of a suitable site must be based on a judgement which takes all of the relevant aspects into consideration as a judgement based solely on the land acquisition cost may well result in a high land preparation cost as well as a high transmission/distribution work cost.
Fig. 5.1.2-9 Koror Substation Site Location (2) Site Size In view of the fact that the shape of the site and direction for the extension of the transmission and distribution lines have not yet been decided, a type site size of 736 m2 (23 m x 32 m) is assumed. This size may, therefore, be changed when the new substation site is finalised.
Site A→
Site B →

5-22
(3) Scale of Facilities 1) Three 34.5 kV Transmission Lines
The Koror Substation will be served by a new transmission line from the Aimeliik Power Plant and the existing transmission line (running from the Airai Substation to the Malakal Power Plant) via a π connection. With this arrangement, the area of interrupted power supply at the time of an incident involving a transmission line can be localised. As further expansion of the transmission grid in Koror State is unlikely, the final number of transmission line connections of the Koror Substation is set at three.
2) Two 13.8 kV Distribution Lines It is desirable to divide a distribution line into several sections in view of a low ground clearance, relative ease of incidents occurring due to contact with trees and other reasons and the need to localise the area of an outage and to check the switching facilities at the time of an incident. Two lines will be drawn out from the Koror Substation for their connection with the existing distribution grid. No additional line is planned in the future because of the difficulty of establishing a viable distribution route.
3) One 15 MVA Transformer The projected total power demand in Koror State for FY 2025 is approximately 15 MW. However, as it is assumed that power supply to Malakal Island and Arakabesan Island will be provided by the Malakal Power Plant, it will be necessary to establish a 10 MW class power source. The capacity of the new transformer is designed to be 15 MVA in the case that it is necessary to deal with a breakdown of the transforming facilities at the Malakal Power Plant which will be a terminal of the power system.
(4) Bus Bar Connection Method The single bus bar method will be used because of the small configuration of three transmission lines and one transformer bank. In view of the widespread salt damage throughout Koror Island and the difficulty of introducing planned outages for equipment inspection, a metal-enclosed switchgear will be installed indoors to improve the performance to resist adverse environmental conditions and also to secure a means of providing emergency restoration (switching of a circuit breaker, etc.) (5) Equipment Rating 1) Transformer
Rated capacity: 15 MVA Winding: Y-Y (-Δ) If Δ-Y winding which is the standard for a distribution substation is adopted, it will be impossible to conduct uninterrupted switching over with the neighbouring Airai Substation and Malakal Power Plant. For this reason, Y-Y (-Δ) winding will be adopted (tertiary built-in Δ winding is tightly sealed). The transformer at the Airai Substation is 22

5-23
years old (made in 1986) and is expected to reach the age of renewal in the next 10 years or so. While it may be an idea to adopt Δ–Y winding for the transformer at the Koror Substation assuming that uniform Δ–Y winding will be adopted for the Airai Substation at the time of transformer renewal, it will be risky to allow systems with a phase angle difference to operate side by side. In addition, if the plan is not properly passed down, Y-Y winding may still be adopted at the time of renewal. Conversely, the adoption of uniform winding has the advantage of allowing uninterrupted switching over between the distribution line from the Airai Substation and the distribution lines from other substations on Babeldaob Island after such unification. However, this advantage cannot be achieved at present because of the absence of a plan (necessity) to link the distribution line from the Airai Substation to the distribution lines from other substations. Based on the above examination results, Y-Y (-Δ) winding will be adopted for the transformer at the Koror Substation, allowing a phase angle difference between the north and south of Palau.
2) Transmission Line Circuit Breaker Rated voltage: 36 kV Rated current: 600 A in view of the allowable current (430 A) of the transmission line (AAC 150 mm2) Rated interrupting current: 12.5 kA in view of the maximum short-circuit capacity of 135 MVA from 2013 onwards
3) Distribution Line Circuit Breaker Rated voltage: 24 kV Rated current: 600 A in view of the allowable current (430 A) of the transmission line (AAC 150 mm2) Rated interrupting current: The short circuit capacity is smaller than the value (135 MVA) on the 34.5 kV side by the value of the transformer’s impedance. As the rated breaking current in the case of 135 MVA is 5.6 kA, 12.5 kA is adopted here.
4) Compensator Based on the system analysis results, a 3 MVA capacitor bank shall be installed to counteract a voltage drop.
5) 34.5 kV Power Cable
① Transmission Line
The allowable current (430 A) of the existing transmission lines (AAC 150 mm2) is adopted as the standard. XLPE insulated (Triplex) cable (250 mm2) will be laid in a conduit line.

5-24
② Transformer Primary Side The rated current (251 A) of the transformer (15 MVA) is adopted as the standard. Single core XLPE insulated cable (150 mm2) will be laid in a conduit line.
6) 13.8 kV Power Cable
① Distribution Line
The allowable current (430 A) of the existing distribution line (AAC 150 mm2 ) is adopted as the standard. XLPE insulated (Triplex) cable (250 mm2) will be laid in a conduit line.
② Transformer Secondary Side The rated current (628 A) of the transformer (15 MVA) is adopted as the standard. Single core XLPE insulated cable (400 mm2) will be laid in a conduit line.
7) Substation Transformer
The capacity will be 20 KVA and will be installed inside the 13.8 kV switchgear. (Continual 5 kW for the DC power unit, continual 7 kW for air-conditioning and lighting and intermittent 5 kW for work are assumed.)
8) DC Power Unit
Nominal voltage: 100V Rectifier output: 30 A Capacity of Battery: 90 Ah (Continual 5 A (instantaneous 20 A) for the switchgear, continual 10 A for the communication unit and six hours of outage are assumed.)
(6) Estimated Project Cost 1) Land cost : Donation is assumed because of the public nature of the project. 2) Construction cost : US$ 2.45 million 3) Consultant fee : US$ 0.245 million 4) PPUC labour cost : US$ 0.027 million 5) Contingency : US$ 0.278 million
Total : US$ 3.0 million (7) Implementation Schedule
Table 5.1.2-8 Implementation Schedule (Work to construct the Koror Substation) 2009 2010 2011 2012 2013 Fund Raising
Selection of Consultant
Detailed Design
On-Site Supervision
Equipment Procurement and Installation

5-25
(8) Drawings • Fig. 5.1.2-10 Koror Substation Single Line Diagram • Fig. 5.1.2-11 Koror Substation Equipment Layout Plan

5-26
Fig. 5.1.2-10 Koror Substation Single Line Diagram

5-27
Fig. 5.1.2-11 Koror substation Equipment Layout Plan

5-28
5.1.2.3 Preliminary Design of the New Aimeliik Substation (1) Selection of Substation Site Location This new substation will be located on the premises of the Aimeliik Power Plant. The installation of an additional bank at the existing Aimeliik Substation was originally planned but the planned has been changed to locate it next to the power station for the following reasons. 1) The existing equipment is more than 20 year old (made in 1986). It is usual to renew
switchgear after some 30 years of use even if the maintenance regime is appropriate. The conditions of the existing switchgear do not appear to be good and the switchgear will probably require renewal in the near future.
2) The space for maintenance work cannot be described as sufficient at present. The
available space will become even smaller if the transformer undergoes the necessary increase of its capacity. If the present two circuits with two banks are forcibly expanded to three circuits with three banks, future equipment maintenance and replacement will become quite difficult.
3) As the Aimeliik Power Plant will become the principal source of power supply in the
coming years, it will become increasingly difficult to stop operation for maintenance and inspection purposes. It is preferable for the equipment to be installed indoors as a measure to improve the performance to withstand the environmental conditions. It is inevitable that the new substation will be an open-air substation, however, if the equipment of this station has to be compatible with the existing equipment.
(2) Site Size The land preparation work (30 m x 50 m) will be carried out in concert with the new Aimeliik Power Station construction plan. (3) Scale of Facilities 1) Three 34.5 kV Transmission Lines
In addition to the two existing transmission lines, another transmission line to the Koror Substation will be drawn out to improve the transmission grid.
2) Three 15 MVA Transformers
Three banks will be installed to match the bus bar of the generator. In view of the generator capacity of 10 MW per bus bar of the generator, the unit capacity of the transformer is set at 15 MVA. When the three banks are finally installed, power supply will not be interrupted even if one bank is out of operation.
(4) Bus Bar Connection Method The single bus bar method is adopted based on the results of the “Single Line Diagram Comparison” described in Fig. 5.1.2-12 and a circuit breaker will be installed for each transmission line and transformer. In view of the widespread salt damage throughout the island

5-29
and the difficulty of introducing planned outages for equipment inspection, a metal-enclosed switchgear will be installed indoors to improve the performance to resist adverse environmental conditions and also to secure a means of providing emergency restoration (switching of a circuit breaker, etc.) (5) Equipment Rating 1) Transformer
Rated capacity: 15 MVA Winding: Y-Δ (standard) Cost reduction will be attempted by using two existing transformers (10 MVA made in 1986 and scheduled for overhaul in 2008). 35 MVA operation (15 + 10 + 10 MVA) will continue for some time and the 10 MVA transformers will have been replaced (estimated cost of US$ 1.2 million) by the time when the power station output exceeds 20 MVA (meaning that power supply will be interrupted when the 15 MVA transformer breaks down). This is forecast to occur in 2025 or thereafter in the Base Case but the final decision will be taken based on the future power demand situation.
2) Transmission Line Circuit Breaker Rated voltage: 36 kV Rated current: 600 A in view of the allowable current (430 A) of the transmission lines (AAC 150 mm2) Rated interrupting current: 12.5 kA in view of the maximum short-circuit capacity of 135 MVA in 2025.
3) 34.5 kV Power Cable
① Transmission Line
The allowable current (430 A) of the existing transmission lines (AAC 150 mm2) is adopted as the standard. XLPE insulated (Triplex) cable (250 mm2) will be laid in a conduit line.
② Transformer Primary Side The rated current (251 A) of the transformer (15 MVA) is adopted as the standard. Single core XLPE insulated cable (150 mm2) will be laid in a conduit line.
4) 13.8 kV Power Cable ① Transformer Secondary Side
The rated current (628 A) of the transformer (15 MVA) is adopted as the standard. Single core XLPE insulated cable (400 mm2) will be laid in a conduit line.
5) Station service Transformer
The capacity will be 20 KVA and will be installed inside the 13.8 kV switchgear. Because

5-30
of the importance of this substation, two units shall be installed for their switching over by an AC power panel. (Continual 5 kW for the DC power unit, continual 7 kW for air-conditioning and lighting and intermittent 5 kW for work are assumed.)
6) DC Power Unit Nominal voltage: 100V Rectifier output: 30 A Capacity of Battery: 90 Ah (Continual 5 A (instantaneous 20 A) for the switchgear, continual 10 A for the communication unit and six hours of outage are assumed.)
(6) Estimated Project Cost 1) Land cost : (This will be part of the land preparation cost for the new power station.) 2) Construction cost : US$ 3.5 million 3) Consultant fee : US$ 0.35 million 4) PPUC labour cost : US$ 0.038 million 5) Contingency : US$ 0.312 million
Total : US$ 4.2 million (7) Implementation Schedule
Table 5.1.2-9 Implementation Schedule (Work to construct the New Aimeliik Substation) 2009 2010 2011 2012 2013
Fund Raising
Selection of Consultant
Detailed Design
On-Site Supervision
Equipment Procurement and Installation
(8) Drawings • Fig. 5.1.2-12 New Aimeliik Substation Single Line Diagram • Fig. 5.1.2-13 New Aimeliik Substation Equipment Layout Plan • Fig. 5.1.2-14 New Aimeliik Substation Single Line Diagram Comparison • Fig. 5.1.2-15 New Aimeliik Substation Switching Process

5-31
Fig. 5.1.2-12 New Aimeliik Substation Single Line Diagram

5-32
Fig. 5.1.2-13 New Aimeliik Substation Equipment Layout Plan

5-33
Plan A Plan B Plan C
Single Line Diagram
Koror Aimeliik2 Aimeliik1
Koror Aimeliik2 Aimeliik1 Koror Aimeliik2 Aimeliik1
Merits(+) and D
emerits(-)
<34.5kV equipment> (+) 5 sets of circuit breaker (-) 3 VTs shall be installed to the Bus bar. (-) In case of failure of a transformer, a transmission
line’s circuit breaker will trip. (+) Black out during the Bus extension work can be
avoided by installing future bus-tie unit. (+) Inspection of Bus bar can be conducted by suspension
of a transmission line and a transformer bank. (+) No condition circuit for switching bus-tie CB. <13.8kVequipment> (-) 10 CBs, 2 DSs (+) Control circuit for switching CB is simple. (-) Condition circuit is required for switching bus-tie DS.
<34.5kV equipment> (-) 6 sets of circuit breaker (-) 3 VTs shall be installed to the Bus bar. (+) In case of failure, power outage area will be
minimized. (+) Black out during the Bus extension work can be
avoided by installing future bus-tie unit. (+) Inspection of Bus bar can be conducted by suspension
of a transmission line and a transformer bank. (-) Condition circuit is required for switching bus-tie DS. <13.8kV equipment> (+) 9 CBs, 3 DSs (-) Control circuit for switching CB is complicated. (Both
bus-tie and generators should be considered.) (+) No condition circuit for switching bus-tie CB.
<34.5kV equipment> (-) 6 sets of circuit breaker (+) 1 VTs shall be installed to the Bus bar. (+) In case of failure, power outage area will be minimized. (-) In case of extension work, the entire service
interruption is required. (+) In case of Inspection of bus, the entire service interruption is required. <13.8kV equipment> (-) 10 CBs, 2 DSs (+) Control circuit for switching CB is simple. (-) Condition circuit is required for switching bus-tie DS.
Conclusion
Plan C is superior to Plan B from view point of cost. And Plan A shall be rejected, because minimizing power outage area by system fault is very important. Countermeasures against demerits(-) on Plan C
All 34.5kV bus-bar shall be installed at the first stage. Switchgears shall be installed indoors to avoid deterioration of insulation of the bus-bar. Its cost will be decreased by applying simplified cubicles. CB is adopted to Bus-tie, but it may be replaced to DS after detail study.
Remarks CB DS
Fig. 5.1.2-14 Comparison and Consideration of the Preliminary Design of the New Aimeliik Substation
G G G G G G G G G G G G G G G G G G

5-34
Step New installation Existing Explanation
Installation of 5MW generators (2 set).
Installation of 13.8kV switchgear Removing an existing generator, and connect to new switchgear’s future unit with power cable. Then supply power with existing transmission lines.
New transmission line for Koror starts operation. Switch transmission line for Aimeliik2 from existing S/S to new S/S. Installation of a 15MW transformer.
Installation of 5MW generators (2 set).
Move existing 10MVA transformer to new S/S.
Switch transmission line for Aimeliik1 from existing S/S to new S/S
Move existing 10MVA transformer to new S/S. Planned transforming facilities are completed. Moved transformers shall be replaced in case of lack of capacity, or by its condition. But planned transformer’s capacity will be enough, because demand forecast as of 2025 is 20.22MW. Suspension of a transformer will not be a big issue, because already three transformers are equipped.
Fig. 5.1.2-15 Installation Plan of the Transforming Equipment and Transmission Lines
G G Aimeliik2
Koror Aimeliik2 Aimeliik11
G G G G
G G G G
G G G G
Aimeliik1
G G G G
Phase2 (2013) Step1
Phase1 (2012)
Phase2 (2013) Step2
Phase2 (2013) Step3
Phase2 (2013) Step4
G G G G Koror Aimeliik2
G G G G
Aimeliik1Ai liik
G G G G
Koror Aimeliik2
Koror
G G G G
Aimeliik1
G G G G
Aimeliik1 Aimeliik2

5-35
5.2 Environmental and Social Considerations Regarding Priority Projects 5.2.1 Environmental and Social Consideration System in Palau (1) Legal Framework for Social and Environmental Considerations It is necessary to obtain an environmental permit from the Environmental Quality Protection Board (EQPB) in accordance with the Environmental Protection Act of Palau (24 PNCA) when any of the following activities are planned.
① Civil engineering work (excavation, banking, levelling, dredging and stone crushing, etc.)
② Drainage to the ocean or a river (discharge of sewage and harmful substances to a water area)
③ Construction and operation of waste treatment facilities ④ Installation of toilets and foul water treatment facilities ⑤ Use of agrochemicals ⑥ Construction and operation of a water supply or sewerage system ⑦ Construction and operation of a fixed emission source of air pollutants ⑧ Burning of fields
The flow to obtain an environmental permit is shown below.
Decision on Project Scope (Project Owner)
Submission of the Application along with the permit by the Bureau of Historical Preservation Office and the Title Deed
Examination by the EQPB on the Necessity of EA
Preparation and Submission of EA
Examination by the EQPB on the Necessity of EIS
Preparation and Submission of EIS
Environmental Permit
Procedure to Hear Opinions of Local Residents 聴 等
YES
YES
NO
YES
YES
〔Notes〕 EQPB: Environmental Quality
Protection Board EA: Environmental Assessment EIS: Environmental Impact
Statement
Source:EQPB
Preparation of Environmental Permit Application (Project Owner)
NO

5-36
1) Environmental Assessment Procedure
The EQPB examines the environmental permit application submitted by the project owner and decides whether or not an environmental assessment (EA) is necessary. When an EA is judged to be necessary, the EQPB demands that the project owner prepares an environmental assessment report. When the EQPB judges that the proposed work may have serious impacts on the environment, it instructs the project owner (applicant) to prepare an environmental impact statement (EIS). The project owner entrusts a qualified third party consultant approved by the EQPB to prepare a draft EIS and submits it to the EQPB. This draft EIS is then distributed to the ministries concerned and the interested local community for comment which are acted on in the finalised EIS.
2) Projects Subject to EA and EIS
There are no specific regulations regarding the type or scale of a project for which the preparation of an EA or EIS must be prepared. The necessity for an EA or EIS is judged by the EQPB solely on the perceived scale of environmental impacts (whether or not pollutant emissions will increase, whether or not the emission/discharge level is within the accepted limit, whether or not the technology to be used is a new technology, whether or not the planned development is to be conducted on public land, whether or not land reclamation is required and whether or not any cultural heritage is involved). The types of projects subject to an EA are stipulated by the Environmental Impact Assessment Act (Chapter 2401-61) of Palau as follows.
(a) Use of government or state-owned land (b) Use of government or state funding except in following cases i. and ii.
i) Feasibility study or planning survey for a future plan or project which has not yet been approved, adopted or funded but the environmental factors and alternatives must be considered in the said feasibility study or planning survey
ii) Acquisition of undeveloped real estate (c) Use of land which has been designated or which may be designated a sanctuary by the
land use commission of the central or state government (d) Activity directly or indirectly affecting a designated “coastal area” or “wetland” by
the seawater and freshwater quality regulations (e) Activity within an area designated as a historical site by the Bureau of Historical
Preservation Office (f) Activity judged by the EQPB to be an activity causing a significant impact on the
environment Any activity which falls under any of the items below is judged to cause “a significant impact on the environment” and the submission of an EIS is required.
(a) Activity which causes the irrevocable loss or damage to a natural or cultural resource (b) Activity which restricts the beneficial use of the environment (c) Activity which infringes a long-term environmental policy or target, the
Environmental Protection Act or guidelines indicated by various regulations or judicial precedents based on this Act

5-37
(d) Activity which causes a severe impact on the economy and/or social welfare of communities
(e) Activity which causes a severe impact on public health (f) Activity which causes a serious secondary impact on demographic changes, public
facilities and infrastructure, etc. (g) Activity which causes the serious deterioration of the quality of the environment (h) Activity of which the individual impacts are limited but which causes a serious
impact or becomes a large-scale activity through the accumulation of individual impacts
(i) Activity which causes a severe impact on an endangered species or its habitat (j) Activity which causes negative impacts in terms of air quality, water quality and
environmental noise (k) Activity which causes a severe impact on such environmentally fragile areas as a
flood plain, area prone to erosion, geographically dangerous land, river mouth, lagoon, reef, mangrove swamp, freshwater area and coastal waters
3) Status of the Present Study from the Viewpoint of the Environmental Impact Assessment
Act The Environmental Impact Assessment Act of Palau (Chapter 2401-61) stipulates that feasibility studies and planning studies are excluded from the list of projects/activities using central or state government funds which require an EA. Because of this, it is unnecessary for the present Study to obtain an environmental permit. However, there are individual projects planned by the Study which fall under such activities listed in 5.2.1-(1) which do require an environmental permit as civil engineering work (excavation, banking, levelling, dredging and crushing of stone, etc.),
drainage to the sea or a river, installation of toilets or sewage treatment facilities and construction and operation of a fixed source of air pollutants. An environmental permit
will, therefore, be required for the construction of the new Aimeliik Power Station, the new Koror Substation, and construction of transmission and distribution lines.
(2) Environmental and Social Considerations Protocol to be taken by the Implementation Agency
As the implementation body for the Project, the PPUC must swiftly prepare the application for an environmental permit after the finalisation of the Study and submit it to the EQPB together with a letter of confirmation that no important historical, cultural or archaeological objects are involved (issued by the Historical Preservation Office), the title deed for the land and a building permit issued by the state government. PPUC needs to prepare Environmental Assessment Report based on the results of Initial Environmental Examination (IEE) conducted by the Study Team and the IEE report and to submit four copies of the document to EQPB if it requires to do so as a result of the examination for the application.
Since presidential election is schedule in November 2008 in Palau, neither the disclosure of power development plan nor negotiation with land owners of new Aimeliik Power Station and new Koror Substation to acquire the land has been conducted in the Mater Plan Study stage in order to avoid unnecessary social unrest. A stakeholder meeting on the Project has not been held from the same reason. Therefore, PPUC must commence the above mentioned protocol, namely, the stakeholder meeting and the land acquisition negotiation soon after the social situation is calmed down following the conclusion of the presidential election.

5-38
(3) Government Bodies Relating to Social and Environmental Considerations The EQPB is responsible for the issue of environmental permits, examination of EA/EIS and approval of EA/EIS. Important historical, cultural and archaeological objects are under the jurisdiction of the Bureau of Arts and Culture of the Ministry of Community and Cultural Affairs. The protection of fish and wildlife falls under the jurisdiction of the Division of Fish and Wildlife Protection. (4) Environmental Standards and Regulations In principle, Palauan laws and regulations will be applied as environmental standards and regulations that should be complied by the Projects. However, international and/or Japanese standards will be applied for the environmental impact assessment in this report if there are not such relevant environmental standards in Palau. Table 5.2.1-1 shows environmental standards to be applied for this environmental study.
Table 5.2.1-1 Environmental standards and regulations to be applied for the environmental impact assessment
Palauan standards International standards
Japanese standards Standards Under the Plan
Concentration of Nitrogen Oxides in the ambient air
Not to exceed 0.05 ppm
(Annual arithmetical mean)
Not to exceed 0.05 ppm
(Annual arithmetical mean)
Concentration of Sulphur Oxides in the ambient air
Not to exceed 0.02 ppm
(Annual arithmetical mean)
Not to exceed 0.02 ppm
(Annual arithmetical mean)
NOx emission in exhaust gas from engine -
Project Guideline of the World Bank: ≤ 2,000 mg/HNm3, 13% oxygen) Converted value: ≤ 1,200 ppm
Air Pollution Prevention Law: ≤ 950 ppm, 13% oxygen
≤ 950 ppm, 13% oxygen
Noise by generating unit
-
Project Guideline of the World Bank: Residential area Daytime: ≤ 55dB Night time: ≤ 45 db
Basic Environment Law: Residential area Daytime: ≤ 55 dB Night time: ≤ 45 db
Neighbouring residential area: Daytime: ≤ 55 dB Night time: ≤ 45 db
5.2.2 Target Projects subject to Pre-Feasibility Study Among power supply facilities construction projects included in the Power Development Plan and listed in Table 4.2.3-1 and 4.2.3-2, projects that have high urgency and should be implemented in recent years are categorized as “priority projects” and subject to pre-feasibility study. In this Environmental and Social Considerations on priority project, the following three projects, namely, replacement of Aimeliik Power Station, construction of Koror Substation and construction of transmission line between Aimeliik Power Station and Koror are examined.

5-39
5.2.3 Initial Environmental and Social Considerations on Power Generation Project 5.2.3.1 Replacement of Aimeliik Power Station (1) Outline of the Project Outline of the replacement of Aimeliik power station (Phase-1 and Phase-2) are shown in the table below. The location of the new power station will be the west side of the existing fuel storage tank yards as described in section 5.1.1(3) “Locationing of the New Power Station” and Table 5.1.1-5 “Evaluation of the Candidate Project Sites”. The arrangement of power station equipment is shown in the attached drawings in front pages.
Table 5.2.3-1 Outline of the Replacement of Aimeliik Power Station FY Project Title Outline
2013 Replacement of Aimeliik Power Station (Phase 1)
• Procurement of two diesel generators (5 MW class) and auxiliary machinery
• Remodelling of the fuel storage and supply facilities (in the case of heavy oil firing)
• Construction of the power house (including those for the two generators in Phase 2) and an office building
2014 Replacement of Aimeliik Power Station (Phase 2)
• Procurement of two diesel generators (5 MW class) and auxiliary machinery
(2) Initial Environmental Examination 1) Social Environment
a. Land Use and Utilization of Local Resources
The planned site to be used for the replacement of the Aimeliik Power Station is a private land owned by a clan and land acquisition is necessary. The site is currently covered by trees and grass and is not used. Therefore, no special problems are anticipated in regard to the acquisition of this site for the replacement of the Aimeliik Power Station. There is no land expropriation law and procedure for national project in Palau. The only protocol to be taken is prescribed in the Constitution of Palau which requires “to pay appropriate compensation for land expropriation”. After the completion of the Study, PPUC shall acquire the land through the process of disclosure, explanation and agreement with the Governor, local residents and land owners.
b. Local Conflict of Interests
(a) Predicted Impacts
Complaints have been made by residents living near the Aimeliik Power Station about the noise and vibration caused by the power station and these residents may object to the replacement plan. As shown in Fig. 5.2.3-1, the direct distance between the existing Aimeliik Power Station and the nearest private house is slightly less than 300 m and there is currently nothing which blocks the loud noise from the radiator and air intake silencer from reaching this house.

5-40
Aimeliik Power Station
100m
200m
300m
Residences
Residences
Residences
Fig. 5.2.3-1 Location of Existing Aimeliik Power Station and
Nearby Private Houses
(b) Present Situation of Noise and Vibration
Fig. 5.2.3-2 shows the noise level measurement results for the boundary of the existing Aimeliik Power Station premises. The noise level is the highest on the eastern side which is near the radiator and is low on the western side where noise from the radiator is blocked by the power house. The reason for the higher noise level on the northern side than the southern side is that ventilating fans for the power house are installed on the north-facing wall of the building. On the same day as the measurement of the noise level at the power station, the noise level near a house located to the northeast of the power station was measured and was found to be 52.1 dB (A). The noise from the ventilating fans and radiator could be heard but was not unbearably high. The actual noise level was lower than the permissible value (daytime noise in residential areas: 55 dB (A) or lower) suggested by the noise guidelines of the World Bank. No vibration could be felt.

5-41
Fig. 5.2.3-2 Noise Level at Boundary of the Existing Aimeliik Power Station Premises
(c) Analysis of Debates on Noise and Vibration Generated by the Power Station
During an interview with a local resident (70 year old woman) living near the power station, the following complaints were made.
① The noise from the power station intensified 6 – 7 years ago. ② The vibration is strong enough to make her jump out of bed at night.
In FY 2008, the PPUC has started a scheme to visit all states in Palau, including remote islands, to appeal for a reduction of the power consumption and to exchange opinions with users. During the visit to Aimeliik State on 24th January, 2008, complaints similar to those above were made about the noise and vibration. The PPUC admits that the following complaints about noise and other matters have been made. • The first complaint about noise was made more than 10 years ago. • Complaints have been made that the catch of fish and shellfish has declined because
of contamination of the sea by diesel oil. • However, no complaint has been made in the form of an official document. The travelling of noise is affected by the wind direction. As the wind velocity is generally higher in the upper sky, sound waves bend downwards in the leeward and bend upward in the windward. Accordingly, the attenuation of sound in the leeward is generally smaller than that in the windward. According to data gathered by the meteorological observation station in Aimeliik State of the Institute of Observational Research for Global Change, Japan Agency for Marine-Earth Science and Technology (JAMSTEC), a south-westerly wind prevails for most of the year except for 3 – 4 months during the rainy season. This means that private houses located to the northeast of the power station are often in the leeward of the noise source and noise from the power station reaches them without much attenuation.
①② ③ ④⑤
⑥
⑦
⑧
⑨⑩ ⑪
⑬
⑫
⑭
⑮ Measuring
Point Noise Level Measuring Point Noise Level
① 75.1dB(A) ⑨ 67.8 dB(A) ② 76.9dB(A) ⑩ 62.3 dB(A) ③ 81.7dB(A) ⑪ 63.1 dB(A) ④ 78.0 dB(A) ⑫ 66.2 dB(A) ⑤ 79.2 dB(A) ⑬ 63.1 dB(A) ⑥ 84.9 dB(A) ⑭ 62.2 dB(A) ⑦ 85.5 dB(A) ⑮ 67.3 dB(A) ⑧ 78.2 dB(A)
Time of measurement: 26th January, 2008, 10:30 – 11:00 Notes: The colours used to classify the measuring points
have the following meanings. Blue: noise level < 70 dB (A) Green: noise level < 80 dB (A) Red: noise level ≥ 80 dB (A)
N

5-42
Table 5.2.3-2 Wind Direction Data of the Aimeliik Observation Station
Month Jan Feb Mar Apr May Jun Jul Aug Sep Oct Nov Dec Annual Year Ave.
2007 239 229 220 242 270 264 308 23 36 21 28 245 1772006 236 229 227 234 265 271 38 35 63 37 235 242 1762005 220 222 229 224 260 318 37 26 32 313 292 244 201
Source: JAMSTEC(Japan Agency for Marine-Earth Science and Technology), Suginohara Observation Site at Aimeliik StateRemarks: Wind directions are indicated in degree (from 0 to 360).
Dry SeasonRainy SeasonDry Season
Note: The Suginohara Observation Site is located some 1 km north of the Aimeliik Power Station.
It can be concluded that the private houses located to the northeast of the Aimeliik Power Station are in an environment in which noise from the power station is likely to reach them because of the combination of such specific conditions as the positioning of the radiator and air intake silencer, which are the main sources of noise, at the near side of the private houses, the absence of any structure to block the travelling of noise between the power station and the private houses and the frequent positioning of the power station in the windward throughout the year. Because of the constant exposure to noise even if the noise level is not especially high, it can be inferred that the noise constitutes a psychological problem for local residents, resulting in their making complaints. In the case of vibration, no vibration source capable of transmitting vibration to a location nearly 300 m from the power station exists on a diesel power station and the vibration felt by local residents must be caused by a source other than the Aimeliik Power Station.
(d) Impact Assessment As mentioned later (section 5.2.3.1 (2) 3) Pollution ④ Noise), noise level that will be observed at the nearest houses around the power station after the replacement of the Aimeliik power station is acceptable if it is compared with the World Bank’s ambient noise standard. However, it is considered to be unavoidable that the residents around the power station may object to the replacement plan if the current complaints about the noise from the power station are taken into consideration.
(e) Impact Avoidance or Mitigation Measures
As part of the project to replace the Aimeliik Power Station, the following measures will be implemented to reduce the noise which travels to nearby private houses and the understanding of these measures on the part of local residents will be secured. • Phased decommissioning of the existing Aimeliik Power Station with the
commissioning of the new generating units • Locationing of the new generating units as far as possible from private houses
(attenuation of noise by distance) • Locationing of such noisy machinery as the radiator and air intake silencer as far as
possible from private houses and locationing of the power house, etc. so as to allow them to function as a sound barrier (attenuation of noise by a sound barrier)

5-43
2) Natural Environment
a. Soil Erosion
(a) Predicted Impacts
There is concern in regard to subsequent soil erosion by rain during land preparation work.
(b) Impact Assessment
The Candidate Replacement Site shown in Fig. 5.2.3-3 has a gentle slope as shown in the following photographs and the felling of many trees will be unnecessary. Moreover, by preparing the ground on two levels, it will be possible to reduce the scale of the excavation work and the impact of soil erosion seems to be minimal.
Plan-C
Plan-A
Aimeliik Power Station
Plan-B
Residences
Residences
Residences
Fig. 5.2.3-3 Candidate Replacement Sites for the Aimeliik Power Station

5-44
Situation of Candidate Replacement Site C
(View facing west from the fuel tank site)
Candidate Replacement Sites (Plan C)
View from the east side of the Aimeliik Power Station)
Palau has dry and rainy seasons and the rainfall level is particularly high in the five month period from May to September during the rainy season as shown in Fig. 5.2.3-4. Soil erosion will be prevented by avoiding land preparation work during the rainy season.
Aimeliik Power Station
Plan-C

5-45
Rainfall at Aimeliik [mm/month]
0
100
200
300
400
500
600
700
Jan Feb Mar Apr May Jun Jul Aug Sep Oct Nov Dec
2007
2006
2005
Fig. 5.2.3-4 Rainfall in Aimeliik State
b. Flora, Fauna and Biodiversity
(a) Predicted Impacts
The felling of trees to prepare land at the Candidate Replacement Site may have a negative impact on the flora, fauna and biodiversity.
(b) Impact Assessment The vegetation at Candidate Replacement Site C predominantly consists of ferns as shown in the photograph and the felling of trees as part of the land preparation work will be unnecessary. While a community of Nepenthes mirabilis, an insectivorous plant, is observed at Candidate Replacement Site C, this species is not listed on the IUCN’s Red List as an endangered species. Thus, the impacts of the land preparation work on the flora, fauna and biodiversity will become minimal.
Vegetation at Candidate Replacement Site A Vegetation at Candidate Replacement Site C
Nepenthes mirabilis

5-46
c. Global Warming
(a) Predicted Impacts
The number of generating units will increase as a result of the replacement of the Aimeliik Power Station, resulting in an increase of the emission of CO2.
(b) Impact Examination With the growth of the power demand, the electric energy generated in FY 2025 will have increased by 59% from the FY 2006 level while the rate of increase of CO2 emission is expected to be 38%. Although an increase of the emission of CO2 following an increase of the generated electric energy is unavoidable, the improved thermal efficiency of the generating units by the replacement of the Aimeliik Power Station will reduce the CO2 emission by unit electric energy generated. In addition, due to the reduction of transmission and distribution losses by the expansion of the transmission and distribution systems, the growth of generated energy will be less than the growth of electricity demand. Meanwhile, the emission factor by type of fuel is 0.0189 tC/GJ for diesel oil (assumed to be equivalent to Type A fuel oil) and 0.0195 tC/GJ for heavy oil (assumed to be Type C fuel oil). Based on the same calorific value, heavy oil (Type C fuel oil) emits 3.2% more CO2 than diesel oil.
Table 5.2.3-3 Estimation of CO2 Emission (with the Projects)
FY Power
demand (GWh)
Electric Energy Generated
(GWh) Fuel Consumption
CO2 Emission(t-CO2)
T& D losses (including parasitic power)
Thermal Efficiency
(%) 2006 77.5 99.5 Diesel oil: 27.1 x 10⁶ ℓ 68,902 22.1% 36.0%
2025 129.5 158.6 Heavy oil: 29.0 x 10⁶ ℓDiesel oil: 6.6 x 10⁶ ℓ 95,245 18.3% 42.6%
Rate of Increase +67% +59% - +38% -17%
(relative ratio) +18%
(relative ratio)Sources: PPUC for FY 2006 operating data and the Study Team for estimated FY 2025 operating data. The
CO2 emission factor is cited from the “GHG Emission Calculation and Reporting Manual Ver. 2.1” (June, 2007 of the Ministry of the Environment and the METI).
If the replacement of the Aimeliik power station and the expansion of transmission and distribution systems are not implemented and the current generating efficiency and transmission and distribution loss is unchanged toward the future, generated power will grow by 67% from 2006 to 2005, on the contrary, CO2 emission will grow by 70% due to the performance degradation of generating facilities. In case where the recommended propriety projects are implemented (with case), CO2 emission in 2025 will be reduced by 22,118 tons (reduction by 18.8%) if it is compared with the case where the projects are not implemented (without case).

5-47
Table 5.2.3-4 Estimation of CO2 Emission (without the Projects)
FY Power
demand (GWh)
Electric Energy Generated
(GWh) Fuel Consumption
CO2 Emission(t-CO2)
T& D losses (including parasitic power)
Thermal Efficiency
(%) 2006 77.5 99.5 Diesel oil: 27.1 x 10⁶ ℓ 68,902 22.1% 36.0% 2025 129.5 166.2 Diesel oil: 46.2 x 10⁶ ℓ 117,363 22.1% 35.3%
Rate of Increase +67% +67% - +70% ±0 -1.9%
(relative ratio)Sources: PPUC for FY 2006 operating data and the Study Team for estimated FY 2025 operating data. The
CO2 emission factor is cited from the “GHG Emission Calculation and Reporting Manual Ver. 2.1” (June, 2007 of the Ministry of the Environment and the METI).
3) Pollution
a. Air Pollution
The ground surface concentration of Nitrogen Oxides and Sulfur Oxides that are emitted from the power station is calculated utilizing Bosanquet and Sutton’s formula. The outline of the calculation is as follows; (i) Effective height of Exhaust port
He=H0 +0.65(Hm+Ht) Hm=0.795(QV)1/2/(1+2.58/V) Ht =2.01×10⁻³Q(T-288)(2.30logJ+1/J-1) J={1/(QV)1/2}{1460-296×V/(T-288)} +1
(ii) Ground surface concentration of pollutant at X(m) apart from the source C(x) = (q/3600) / (πσyσzU) exp (-He
2/2σz2)×106
C(x)1h = C(x)×(3 / 60) 0.3
C(x)24h = C(x)×(3 / (60×24)) 0.3
where
He:Effective height of Exhaust port (m) H0:Actual height of Exhaust port (m) Q:Quantity of exhaust gas at 15℃ for one unit (m3/sec) V:Exhaust gas velocity at exhaust port (m/sec) q:Quantity of NO2 or SO2 in the exhaust gas (Nm3/hr) C(x):Ground surface concentration of pollutant at X(m) apart from the source
(3minutes mean value) (ppm) C(x)1h:Ground surface concentration of pollutant at X(m) apart from the source
(1 hour mean value) (ppm) C(x)24h:Ground surface concentration of pollutant at X(m) apart from the source
(24 hours mean value) (ppm) σy,σz:Standard deviation of concentration range
here, σy = Cy・X1-n/2 / 2 0.5 , σz = Cz・X1-n/2 / 2 0.5 Cy, Cz, n:Sutton’s diffusion parameter, here Cy=0.07 / 0.15, Cz=0.07, n=0.25 U:Wind Velocity, here 4.5 m/sec is applied (m/sec)
The preconditions of the calculation are as follows; • Capacity and number of diesel engines in operation: 5MW class × 7 unit

5-48
(including a 5MW class diesel engine to be installed utilizing Taiwanese loan) • Quantity of exhaust gas: 31,600Nm3/h・unit • Exhaust gas temperature: 365℃ • Concentration of NOx in exhaust gas: 950ppm • Concentration of SOx in exhaust gas: 1,125ppm
(in case of 4.5% sulfur heavy fuel oil) • Height of stack: 20m • Diameter of stack (exhaust port): 0.85m
Fig. 5.2.3-5 and 5.2.3-6 shows the results of calculation that indicates the relation of NOx / SOx concentration and distance from the pollutant source.

5-49
0.000
0.005
0.010
0.015
0.020
0.025
0.030
0.035
0.040
0.045
0.050
0 1,000 2,000 3,000 4,000 5,000 6,000 7,000 8,000 9,000 10,000
Distance from the pollution source (m)
Gro
und
surfa
ce c
once
ntra
tion
of N
O2 (
ppm
)
CATNew #1New #2New #3New #4New #5New #6Total
Air Quality Standards of PalauNitrogen Oxides: Not to exceed 0.05ppm (annual arithmetlic mean)
Fig. 5.2.3-5 Ground surface Concentration of Nitrogen Oxides (annual arithmetic mean)

5-50
(4.5% Sulfur Heavy Fuel Oil, Stack height=20m)
0.000
0.002
0.004
0.006
0.008
0.010
0.012
0.014
0.016
0.018
0.020
0 1,000 2,000 3,000 4,000 5,000 6,000 7,000 8,000 9,000 10,000
Distance from the pollution source (m)
Gro
und
surfa
ce c
once
ntra
tion
of S
O2 (
ppm
)
CATNew #1New #2New #3New #4New #5New #6Total
Air Quality Standards of PalauSulfur Oxides: Not to exceed 0.02ppm (annual arithmetic mean)
Fig. 5.2.3-6 Ground surface Concentration of Sulfur Oxides (annual arithmetic me an)

5-51
As shown in the following table, calculated maximum ground surface concentration of Nitrogen oxides and Sulfur oxides is lower than Palauan Air Quality Standards. Even though monitoring data of NOx and SOx in the ambient air are not available in Palau, ground surface concentration of NOx and SOx that is emitted from the Aimeliik Power Station is acceptable compared with the Palauan Air Quality Standards because there is no major pollutant source other than the Aimeliik Power Station.
Table 5.2.3-5 Calculated Maximum Ground Surface Concentration of Pollutant and Palauan Air Quality Standards (annual arithmetic mean)
Palauan Air Quality
standards
Calculated Maximum
Concentration
Remarks
Nitrogen Oxides 0.05 ppm 0.01565 ppm - Sulfur Oxides 0.02 ppm 0.01618 ppm In case of 4.5% Sulfur HFO
b. Water Pollution
(a) Predicted Impacts
There is concern in regard to water pollution as a result of the seepage of fuel oil, lubricating oil and waste oil, etc. into the discharged water.
(b) Impact Assessment
In the preliminary design of the Study, a waste oil treatment system and oil water separator that meet Palauan waste water quality standards are incorporated into the design and impacts of water pollution will be minimal.
c. Waste
(a) Predicted Impacts The increased generating output following the replacement of the Aimeliik Power Station will increase the amount of waste oil for disposal. If heavy oil (Type C fuel oil) is used as the fuel for the new generating units, the amount of sludge produced will increase compared to the diesel oil currently used.
(b) Impact Assessment In the preliminary design of the Study, a waste oil incinerator shall be installed to burn off waste oil from the power station. Thus, the impacts of waste oil will be minimal.
d. Noise (a) Noise level calculation
Noise reduction by diffusion, distance and prevention wall is calculated by simplified equations and noise level at the nearest residences to the Aimeliik Power station is estimated. The calculation methods are shown as follows;

5-52
i. Noise calculation method (i) Noise level of major equipment
Based on general noise level of the same kind of equipment, unit noise levels which are used for noise level prediction are shown as follows;
Table 5.2.3-6 Noise level of equipment used for noise prediction
Name of Equipment Noise Level (dB(A))
Remarks
Diesel Engine Generator CAT 96 Noise level at 1m apart from the power houseDiesel Engine Generator New-#1 96 ditto Diesel Engine Generator New-#2 96 ditto Diesel Engine Generator New-#3 96 ditto Diesel Engine Generator New-#4 96 ditto Diesel Engine Generator New-#5 96 ditto Diesel Engine Generator New-#6 96 ditto Radiator CAT 95 Noise level at 1m apart from the equipment Radiator New-#1 95 ditto Radiator New-#2 95 ditto Radiator New-#3 95 ditto Radiator New-#4 95 ditto Radiator New-#5 95 ditto Radiator New-#6 95 ditto
(ii) Noise level reduction by distance
Noise level at a distant point is lower than the noise level of the source because power density of the noise will be reduced as it travels. Noise level reduction by distance is calculated as the following formula; ΔL = L1-L2 =20 log (r1/r2) (2.1) If L1, r1 and r2 are known, L2 (noise level at a prediction point) is calculated as the following formula; L2 = L1-ΔL where ΔL: Noise level reduction by distance L1 : Noise level at r1 distance from source
(Usually, r1=1m is used for noise prediction) L2 : Noise level at r2 distance from source (Noise level at prediction point)
(iii)Noise level reduction by a wall Noise level is reduced when it goes through a wall. Noise level reduction by a wall is calculated as the following formula;
δ = A+B-d N = δf/170 R = 10 log N + 13 (3.1)
where
O
S P
A B
d

5-53
S: Location of noise source O: Upper end of the wall P: Prediction point A: Distance between S and O (m) B: Distance between O and P (m) D: Distance between S and P (m) f : Frequency of the noise (Hz) R: Noise level reduction (dB)
(iv) Combination of noise level
Noise levels are combined as the following formula; Lp = 10 log ( 10L1/10+10L2/10+10L3/10 ・・・+10Lx/10 ) (4.1) where
Lp: Combined noise level Li: Noise level of each equipment (i=1,2,3・・・・x)
(v) Noise level prediction
[Step 1] Noise reduction of each source (diesel engine generator and radiator) is calculated by using (2.1) and (3.1) formula based on the distance from the source to the prediction point and location of the wall (in this case, power house and fuel storage tanks are deemed as walls). [Step 2] Noise levels at prediction point generated from each source are combined by using (4.1) formula. Combined noise level is an overall noise level that will be measured at prediction point.
ii. Impact Assessment
Table 5.2.3-7 shows the results of noise level prediction. Since current load curve of Koror-Babeldaob power system indicates that load in night time is almost 70% of the day time load, number of generators in operation after the replacement of Aimeliik Power Station is assumed to be seven in day time and five in night time. Based on this assumption, noise level at the nearest residences to the power station is calculated. In the evaluation of noise level, the World Bank’s ambient noise guidelines area applied as reference because there is no Palauan noise guideline. The calculation results indicates that the estimated noise level at the nearest residence-1 and 2 is lower than the maximum allowable level of the World Bank’s ambient noise guidelines in residential category. In addition, noise level at residence-1 after the replacement of the Aimeliik Power Station will become lower than the current noise level that measures around 52dB (A). Thus, the impact of noise is minimal.

5-54
Table 5.2.3-7 Results of Noise Level Prediction World Bank’s
Ambient Noise Guidelines Noise Prediction Results (dB(A))
One Hour LAeq(dB(A)) Residence-1 Residence-2 Receptor Day time
(07:00-22:00)Night time
(22:00-07:00)Day time
Night time
Day time
Night time
Residential; Institutional; Educational
55 45 51.5 41.2 49.2 32.2
Industrial; Commercial 70 70 - - - -
Fig. 5.2.3-7 shows the location of noise sources and prediction points and noise prediction results.
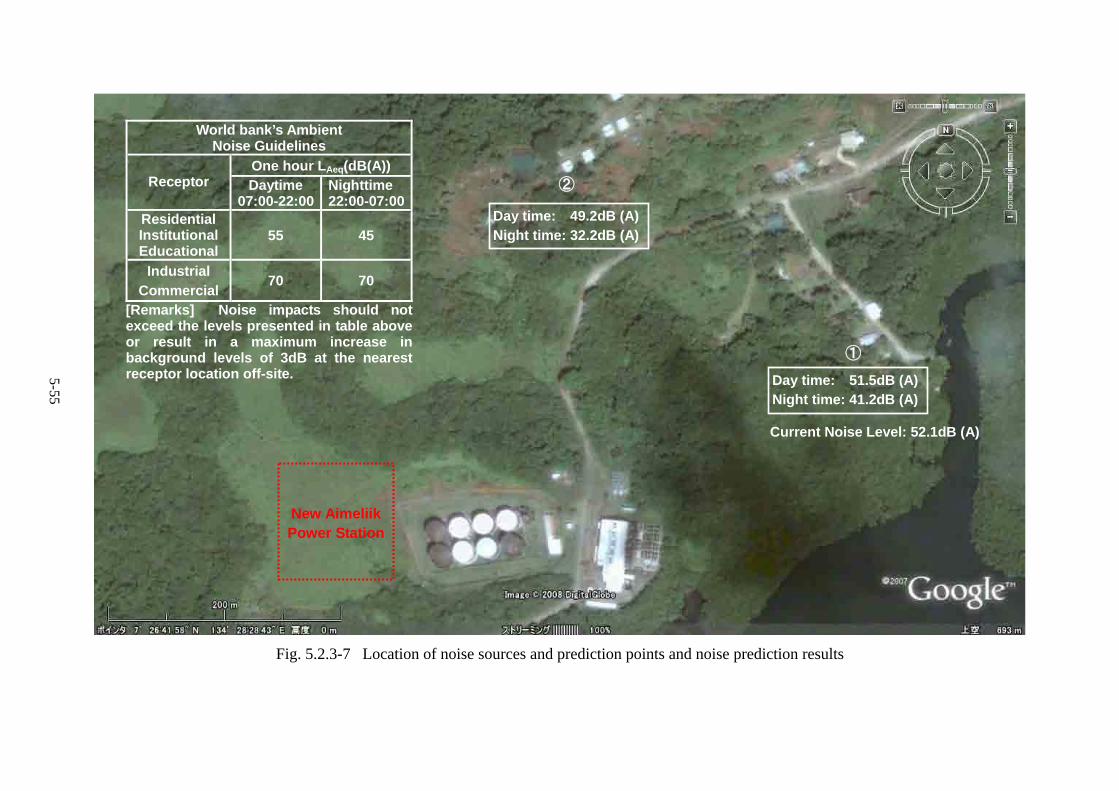
5-55
New Aimeliik Power Station
①
②
Day time: 49.2dB (A) Night time: 32.2dB (A)
Day time: 51.5dB (A)Night time: 41.2dB (A)
World bank’s Ambient Noise Guidelines
One hour LAeq(dB(A)) Receptor Daytime
07:00-22:00 Nighttime 22:00-07:00
Residential InstitutionalEducational
55 45
Industrial Commercial
70 70
[Remarks] Noise impacts should not exceed the levels presented in table above or result in a maximum increase in background levels of 3dB at the nearest receptor location off-site.
Current Noise Level: 52.1dB (A)
Fig. 5.2.3-7 Location of noise sources and prediction points and noise prediction results

5-56
f. Bottom sediment (a) Predicted Impacts
During the construction of heavy oil unloading pipeline off the shore of existing jetty, disturbance of bottom sediment and impacts on sea bottom fauna is concerned.
(b) Impact Assessment
It was observed that the sea bottom soil is fine and white mud as a result of underwater survey. Table 5.1.1-7 shows the summary of the results of the survey. Neither coral nor fish was observed around the surveyed sea area. Horizontal Directional Drilling (HDD) method shall be adopted as the installation method of heavy oil unloading pipeline as explained in the section 5.1.1. A pipe is thrust into the ground tracing arch-shape by the HDD method and the edge of the pipe pops out from the bottom of the sea at the targeted point. Since large-scale marine construction work is not required by HDD, impacts on sea bottom fauna is minimal, only a little sediment might be blown up.
(c) Impact Avoidance and Mitigation Measures
Silt fence will cover around the point where the pipe pops up to prevent the disturbance of bottom sediment.
4) Comparison with zero-option
Compared with the planned diesel generating method, “zero-option” in which the Project is not implemented will give much less negative impact to the environment. However, since it is impossible to meet growing power demand and to supply reliable and enough power, considerable negative social impact is unavoidable if the zero-option is adopted. Therefore, the Project should be implemented with careful environmental mitigation measures (emission, noise and waste) are incorporated into it.
(3) Outline of the Initial Environmental Examination Table 5.2.3-8 shows the outline of evaluation results of initial environmental examination for the replacement of the Aimeliik Power Station.

5-57
Table 5.2.3-8 Evaluation Results of Environmental and Social Factors for the Replacement of the Aimeliik Power Station
Environmental Factor
Ove
rall
Rat
ing
Dur
ing
Con
stru
ctio
n W
ork
Dur
ing
Ope
ratio
n
Remarks
Involuntary resettlement C C C Local economy, such as employment and livelihood C C C Land use and utilisation of local resources
B B C
The site for replacement must be purchased (currently owned by a clan (private land)).
Social institutions, such as social infrastructure and local decision-making system C C C
Existing social infrastructure and services C C C The poor, indigenous and ethnic people C C C Erroneous communication of interests C C C Cultural heritage C C C Local conflict of interests
B B B
Complaints have been made about noise by residents living near the existing Aimeliik Power Station and there is a concern regarding their objection to the expansion of this power station. Mitigation measures such as shutting down of the existing generating units and arrangement of equipment that will contribute to noise attenuation shall be considered.
Water usage or water rights and rights in common C C C Public hygiene C C C
Soci
al E
nviro
nmen
t
Infectious diseases C C C Topography and geographical features C C C Soil erosion C C C Groundwater C C C Hydrological conditions C C C Coastal zone C C C Flora, fauna and biodiversity C C C Meteorology C C C Landscape C C C N
atur
al E
nviro
nmen
t
Global warming B C B
Increased CO2 emission but decreased CO2 emission per unit generation
Air pollution C C C Water pollution C C C Soil contamination C C C Waste C C C Noise and vibration C C C Ground subsidence C C C Offensive odour C C C Bottom sediment
B B C
Concern regarding disturbance of bottom sediment during installation of HFO unloading pipeline. Silt fence shall be applied as a countermeasure.
Pollu
tion
Accidents C C C Rating A: Serious impact is expected B: Some impact is expected C: No or minimal impact is expected

5-58
5.2.4 Initial Environmental and Social Considerations on Transmission and Distribution Facilities
Out of prioritized projects, “Installation of New Transmission Line between Aimeliik Power Station and Koror” and “Construction of Koror Substation” are the transmission and distribution facilities projects that are subject to initial environmental and social impact assessment in this section. The assessment on the construction of new Aimeliik Substation is included in “5.2.3.1 Replacement of Aimeliik Power Station” because the substation will be constructed within the premises of the replacement site. 5.2.4.1 Installation of New Transmission Line between Aimeliik Power Station and
Koror (1) Outline of the Project As described previously in section 5.1.2.1 “Submarine Cable Transmission Line Between Aimeliik Power Station and T Dock on Koror Island and Alternative”, overhead wiring method will be adopted for the transmission line. Accordingly, impact assessment on overhead wiring method is examined in this section. As shown in section 5.1.2.1(2) “Examination of Alternative Plan to Upgrade the Existing Transmission Line” and Table 5.1.2-6 “Comparison of Alternative Plans”, the plan C in which a part of the existing transmission line is selected. The transmission line route is shown in Fig. 5.1.2-7 and 5.1.2-8. Line voltage is 34.5kV, pole length for single and double circuit is 13m and 16m, respectively. Concrete poles will be installed at the shoulder of the existing roads.
(2) Initial Environmental Examination 1) Social environment
a. Land Use and Utilisation of Local Resources (a) Predicted Impacts
The installation of electric poles restricts the land use around them.
(b) Impact Assessment Even though electric poles are designed to be installed in a span of 50 to 70 meters, the span can be adjusted depending on the land situation. Thus, the installation of electric poles will not restrict the land use.
2) Natural Environment
a. Flora, Fauna and Biodiversity (a) Predicted Impacts
There is a concern that the installation of electricity poles may give negative impacts on flora and fauna along the transmission line route.
(b) Evaluation of Impacts The transmission line will be constructed along the existing gravel covered roads and asphalt paved Compact Road with the pole interval of 50 to 70 meters. The line mainly goes through forests, savanna and grass fields avoiding swamp and mangrove forests.

5-59
[Detailed Map between Aimeliik and Kokusai]
Fig. 5.2.4-1 New Transmission Route between Aimeliik Power Station and Koror
Raulerson1 et al. (1996) conducted botanical reconnaissance along the construction route of Compact Road as a part of Environmental Impact Assessment for “Compact Road Construction Project”. In the survey report, Raulerson el al. noted three species of interest, namely, Finischia chloroxantha, Parkia parvifoliola and Semecarpus venenosus. Finischia is one of only a few members of the family of Proteaceae which is native north of the Equator – the family is native to the Southern Hemisphere- and indigenous to Babeldaob. Finischia also should be considered for protected status but is not designated in IUCN’s Red List. Parkia is quite rare and designated as one of the endangered species in IUCN’s Red List. According to Department of Agriculture, Ministry of Resources and Development, Parkia is only found in Ngiwal, Ngarmlengui and Ngchesar state but not found in Aimeliik, Airai and Koror states where the new transmission line route is planned. Semecarpus is known as ”Poison wood” in Palau, can be quite toxic for people exposed to its black sap or simply touching the trunk, stems, leaves and flowers may irritate the skin. The Study Team conducted field survey on flora and fauna along the new transmission line route as a part of Initial Environmental Examination for the Study. The survey route consists of three sections; (1) From Aimeliik Power Station to Nekken Substation, (2) From Nekken Substation to Kokusai Substation and (3) along Compact Road via K-B bridge up to Koror. The section from Aimeliik Power Station to Nekken Substation follows the same route as the existing transmission line, the vegetation along the route consists of forest trees with the height of around 10m and understory such as Ixora casei, ferns, etc.
1 Raulerson, Lynn, Agnes F. Rinehart, Marie C. Falaruw, Yvonne Singeo, Sean Slappy and Steven Victor (1996), “A Botanical Reconnaissance of the Proposed Compact Road Alignment on Babeldaob Island, Republic of Palau”
■ New Koror SubstationTransmissionLine Route
▲ Aimeliik Power Station
Nekken Substation ■ ■
Kokusai Substation
DetailedMap
K-B bridge
To Airai and Kokusai S/S To Airai S/S To Kokusai S/S (New) To Koror (New) To Koror (existing) Spare for future (existing) To K-B bridge and Koror
Com
pact
Roa
d
Aimeliik Power Station
Nekken Substation
Kokusai Substation

5-60
Transmission line route from Aimeliik to Nekken Vegetation along the route (Ixora casei)
The section from Nekken to Kokusai substation is new along the existing road that was constructed in open and cleared fields. The vegetation consists of low trees such as Pandanus tectorius and understory such as Nepenthes mirabilis and ferns.
Transmission line route from Nekken to Kokusai Vegetation along the route
(Nepenthes mirabilis)
According to the Ngaremeduu Conservation Authority, even though the road that connects Nekken and Kokusai substations crosses the Ngaremeduu Conservation Area, the construction of transmission lines along the existing road will not give any impact on the conservation area. Since the line along Compact Road via K-B bridge up to Koror will be constructed along the existing asphalt paved road by electing electric poles on road shoulder, no impact on the vegetation is predicted. There are two causeways between Babeldaob and Koror islands and mangroves are found around the causeways. Still, no impact on marine ecosystem is predicted because electric poles will be elected on the existing road shoulders.

5-61
Causeway connecting K-B bridge and Koror (New poles will be elected on the opposite
side of the existing ones)
Mangroves around causeways (Bruguiera gymnorrhiza)
IUCN’s Red List designates five botanical species of endangered, namely, Cycas micronesica, Horsfieldia palauensis, Parkia parvifoliola, Aglaia mariannensis andPericopsis mooniana. None of those species were found throughout the field survey. Regarding animals and birds, also no endangered species were found. Thus, there is no concern of the impact from the construction of the transmission line.
b. Landscape (a) Predicted Impact
The Landscape will change when the transmission line is constructed.
(b) Evaluation of the Impact There is no conservation area along the transmission line route, nor scenic areas. Since only a few people travel along the transmission line and recognize, no impact on landscape is concerned.
3) Pollution
a. Magnetic Field (a) Predicted Impacts
The EQPB of Palau has pointed out that the magnetic field created around an overhead transmission line could affect public health and has requested that the Study team include the possible impacts of such magnetic field in the IEE.
(b) Impact Examination In its International Electromagnetic Field Project which commenced in 1996, the WHO reviewed research on various diseases worldwide to assess the health risk posed by magnetic fields. The WHO subsequently concluded that there were no substantive health issues related to ELF electric fields at the levels generally encountered by members of the public in its Fact Sheet 322 – Electromagnetic Fields and Public Health which compiles the results of the above review and the Environmental Health Criteria Monograph No. 238 regarding electromagnetic fields. For the present Study, the strength of a magnetic field occurring along the transmission line under the conditions assumed for the project has been calculated in the following manner.

5-62
[Calculation of Strength of Magnetic Field] • Software used : magnetic field analysis programme Crimag 97 Ver.
2.10 (of the Power Computing Centre and Central Research Institute of the Electric Power Industry)
• Cable type : AAC 150 mm2
• Examination conditions
(i) Subject current for examination Case Current Value I-1 Allowable current of the cable 430 A 1-2 Current at a transformer capacity of 20 MVA 340 A 1-3 Current at a transformer capacity of 15 MVA 251 A
(ii) Cable height above the ground Case Height Remarks
H-1 Immediately below the pole 9.37 m ― H-2 Deflection of the cable considered 7.47 m Deflection: 1.9 m
(Pole span of 60 m and maximum tension of 500 kg)
0.595m 0.595m電 線
地上高9.37m
1.19m
電線 電線 電線
Electromagnetic Field Strength Calculation Results
Case (Current, Height)
CurrentValue
Cable Height Above Ground
Max. Magnetic Field Value
(mG)
Max. Magnetic Field Value
(μT)* ICNIRP
Guidelines Evaluation
Result
1 (I-1, H-1) 430 A 9.37 m 19.85 1.9846 < 83 μT 2 (I-1, H-2) 430 A 7.47 m 30.93 3.0928 As above 3 (I-2, H-1) 340 A 9.37 m 15.69 1.5692 As above 4 (I-2, H-2) 340 A 7.47 m 24.46 2.4455 As above 5 (I-3, H-1) 251 A 9.37 m 11.58 1.1584 As above 6 (I-3, H-2) 251 A 7.47 m 18.05 1.8053
83 μT (60 Hz)
As above * 1G = 100 μT
As shown in the above table, the strength of the magnetic field produced by the planned transmission line is far below the threshold indicated in the Guidelines of the International Commission on Non-Ionization Radiation Protection and it is judged that there will be no harmful effects to humans.
4) Comparison with zero-option
Compared with the planned overhead transmission line method, “zero-option” in which
Cable Height
Cable Cable Cable

5-63
the Project is not implemented will give much less negative impact to land utilization and landscape. However, since it is impossible to meet growing power demand and to supply reliable and enough power, considerable negative social impact is unavoidable if the zero-option is adopted. Therefore, the Project should be implemented with careful environmental and social mitigation measures are incorporated into it.
(3) Outline of the Results of the Initial Environmental Examination Table 5.2.4-1 shows the outline results of initial environmental examination for the Installation of New Transmission Line between Aimeliik Power Station and Koror.
Table 5.2.4-1 Outline Results of Initial Environmental Examination for the Installation of New
Transmission Line between Aimeliik Power Station and Koror
Environmental Factor O
vera
ll R
atin
g
Dur
ing
Con
stru
ctio
n W
ork
Dur
ing
Ope
ratio
n
Remarks
Involuntary resettlement C C C Local economy, such as employment and livelihood C C C
Land use and utilization of local resources C C C Social institutions, such as social infrastructure and local decision-making system C C C
Existing social infrastructure and services C C C The poor, indigenous and ethnic people C C C Erroneous communication of interests C C C Cultural heritage C C C Local conflict of interests C C C Water usage or water rights and rights in common C C C
Public hygiene C C C
Soci
al E
nviro
nmen
t
Infectious diseases C C C Topography and geographical features C C C Soil erosion C C C Groundwater C C C Hydrological conditions C C C Coastal zone C C C Flora, fauna and biodiversity C C C Meteorology C C C Landscape C C C N
atur
al E
nviro
nmen
t
Global warming C C C Air pollution C C C Water pollution C C C Soil contamination C C C Waste C C C Noise and vibration C C C Ground subsidence C C C Offensive odour C C C Bottom sediment C C C Accidents C C C
Pollu
tion
Electro magnetic field C C C Rating A: Serious impact is expected B: Some impact is expected C: No or minimal impact is expected

5-64
5.2.4.2 Construction of Koror Substation (1) Outline of the Project The scope of the new Koror Substation consists of a 34.5/13.8 kV step down transformer, three circuits of incoming transmission lines (34.5kV) and two circuits of outgoing distribution feeders (13.8kV). The land area of the substation is approximately 23m×32m (736m2). The arrangement of the substation equipment is shown in Fig. 5.1.2-11. The location of the new substation is selected as point A of Figure 5.1.2-9 which is located near KB bridge at Koror island side. The reason why the location is selected is described in section 5.1.2.2 (1) “Selection of Substation Site Location”. (2) Initial Environmental Examination 1) Social environment
a. Land Use and Utilisation of Local Resources (a) Predicted Impacts
As a result of field survey, it turned out that the candidate of the new Koror substation is privately owned and it will be necessary for the PPUC to purchase it. Since available land in Koror is limited because it is densely populated, the negotiation of land acquisition with the land owner may be difficult.
Candidate site of new Koror substation
(b) Impact Assessment
Since the land is vacant and not used for any purpose at the moment, the change of land use status will not be a problem. The land for electric pole or substation in Palau is often provided by the landowner free of charge as a local custom. There is no land expropriation law and procedure for national project in Palau. The only protocol to be taken is prescribed in the Constitution of Palau which requires “to pay appropriate compensation for land expropriation”. When necessary, the PPUC pays a reasonable price to acquire the necessary land. Since 10% contingency is already included in the cost estimation, land compensation expense will be appropriated from the contingency, if necessary. As the land owner was identified during the field survey, PPUC considers that the negotiation of land acquisition will be tough.

5-65
(c) Impact Avoidance or Mitigation Measures From the viewpoint of reduction of distribution loss, above mentioned site is the most appropriate. However, alternative land that is owned by the Koror state government (currently used for stock yard of gravel) will be examined as a candidate site if the land acquisition is difficult.
2) Natural Environment a. Flora, Fauna and Biodiversity (a) Predicted Impacts
The construction of the new substation will threaten the survival of plants and animals traditionally inhabiting the site.
(b) Impact Assessment
As shown in the above photograph, the planned construction site for the new Koror Substation has already been prepared and the grass and trees have been cleared. It is, therefore, judged that the construction of the new substation at this site will not have any impact on local flora and fauna.
3) Comparison with zero-option Compared with the planned construction of new substation, “zero-option” in which the Project is not implemented will give much less negative impact to land utilization and landscape. However, since it is impossible to meet growing power demand and to supply reliable and enough power, considerable negative social impact is unavoidable if the zero-option is adopted. Therefore, the Project should be implemented with careful environmental and social mitigation measures are incorporated into it.
(3) Outline of the Results of Initial Environmental Examination Table 5.2.4-2 shows outline results of initial environmental examination for the construction of Koror substation.

5-66
Table 5.2.4 -2 Outline Results of Initial Environmental Examination for the Construction of Koror Substation
Environmental Factor
Ove
rall
Rat
ing
Dur
ing
Con
stru
ctio
n W
ork
Dur
ing
Ope
ratio
n
Remarks
Involuntary resettlement C C C Local economy, such as employment and livelihood C C C Land use and utilisation of local resources
B B C Currently the candidate site is a private land and impact caused by land acquisition is concerned.
Social institutions, such as social infrastructure and local decision-making system C C C
Existing social infrastructure and services C C C The poor, indigenous and ethnic people C C C Erroneous communication of interests C C C Cultural heritage C C C Local conflict of interests C C C Water usage or water rights and rights in common C C C Public hygiene C C C
Soci
al E
nviro
nmen
t
Infectious diseases C C C Topography and geographical features C C C Soil erosion C C C Groundwater C C C Hydrological conditions C C C Coastal zone C C C Flora, fauna and biodiversity C C C Meteorology C C C Landscape C C C N
atur
al E
nviro
nmen
t
Global warming C C C Air pollution C C C Water pollution C C C Soil contamination C C C Waste C C C Noise and vibration C C C Ground subsidence C C C Offensive odour C C C Bottom sediment C C C Accidents C C C
Pollu
tion
Electro magnetic field C C C Rating A: Serious impact is expected B: Some impact is expected C: No or minimal impact is expected
5.2.5 Recommendations to PPUC’s Organization in Charge of Environmental
Management The PPUC currently has no specially appointed personnel in charge of environmental and social consideration matters and no engineers who possess expert know-how on environmental impact assessment. It is necessary to obtain an environmental permit for the priority projects formulated in the Study, i.e. the replacement of Aimeliik Power Station, installation of transmission line between Aimeliik Power Station and Koror, and installation of Koror Power Station. The PPUC will need to make an environmental permit application to the EQPB based on the findings of the Study and the initial environmental impact assessment report prepared by the Study Team. Regarding environmental management, the PPUC does not currently monitor air pollution and noise, however, complaints regarding noise have been made by residents living around the

5-67
existing Aimeliik Power Station. In order to secure the understanding of local residents for the replacement of Aimeliik Power Station, it will be necessary for the PPUC to conduct periodic noise measurements and to plan and implement countermeasures. Taking into account the above points, in order to smoothly execute the priority projects, it is necessary for the PPUC to as quickly as possible recruit an environmental engineer to take charge of the environmental permit application, environmental impact assessment and environmental monitoring.

5-68
5.3 Financial Analysis and Fund Procurement for the Projects Proposed 5.3.1 Necessary fund and Lending Institutions for Concessional Loan In response to power demand forecast and power supply planning, JICA Study Team has conducted technical design and formulated the projects:
1) Power generation projects (Aimeliik Power Plant Replacement), 2) Transmission and distribution improvement project.
JICA study Team’ cost estimate is conducted in accordance with the technical design which is set forth in the section 5.1 of this chapter. The total amount accounts for US$72.0 million in case of embarking on the use of heavy fuel oil, and US$64.7 million in case of continuing to use only diesel oil.
Table 5.3.1-1 Necessary Fund to be procured for the Master Plan implementation Unit: Million USD
Diesel Oil Case HFO Case Phase 1 19.38 25.73 Phase 2 11.73 12.22 Phase 3 13.64 14.13
Power Generation
Projects Total 44.75 52.08
Phase 1/2 11.20 11.20 Phase 3 8.70 8.70
Transmission & Distribution
Projects Total 19.90 19.90 Grand Total 64.65 71.98
Source: JICA Study Team Note: These amounts correspond to the fund volume to be needed for the implementation of the Master Plan that
JICA Study Team is proposing herein. The scope of the priority projects for near future to be defined in the foregoing work in this study.
The whole project comprises three phases. The Phase 3 will be implemented 5-6 years after completion of Phase 1 and Phase 2. It will be a too long time interval to include all the three phases into one investment package. In this connection, JICA Study Team recommends to define “Priority Project” which includes Phase and Phase 2. In terms of investment, Phase 3 is separated from the Phase 1 and 2. The necessary fund procurement for Phase 3 shall be procured as another investment package in future. The following table shows the necessary fund for the Priority Project (Phase 1 and Phase 2). The estimated cost includes physical contingency (5%) as well as price contingency (5%).
Table 5.3.1-2 Necessary Fund for the Priority Projects (Phase 1 and Phase 2) Diesel Oil Case HFO Case
Power Generation Project US$31.1 million US$38.0 million Transmission and Distribution project US$11.2million US$11.2 million
Total US$42.3 million US$49.2 million Source: JICA Study Team The following part will examine fund procurement for the Priority Project. In terms of domestic procurement in Palau, National Development Bank of Palau will not be able to extend such a large amount of loan for the long term repayment such as 20-25 years, and the interest rate is fairly high: 5.5-6%. Palau has CTF, but such a big amount will not be possibly withdrawn for only one sector. PPUC should seek for foreign assistance. Considering about the fact that the per capita GNI of Palau has already reached US$ 7,267 (2006) and that

5-69
the necessary amount for the projects is fairly high, Palau had better not expect grant assistance to cover such a big amount for the whole scope. With the reference to a small-scale pilot project such as US$ 1-2 million or less, however, grant assistance may be extended as merely one element of the whole project. As aforementioned, PPUC cannot borrow from a private bank for this big amount of a long term investment. PPUC will have to seek for concessional loan. There will be four possible sources for soft loan lending institutions:
JBIC (Japan Bank for International Cooperation) ADB (Asian Development Bank) World Bank Taiwan ODA
JBIC
Japan has not extended Japanese yen credit to Palau so far, but provided technical assistance and grant assistance under JICA, probably because of the existence of the US direct financial support under the Compact. However, the situation will be gradually changed as the direct financial support will be terminated in 2009. Japanese Yen Credit will be one option for PPUC to seek necessary fund. The following table shows the classification category of countries for JBIC lending. Table 5.3.1-3 JBIC’s General Classification of Recipient Countries for Japanese Yen Credit
Catyegory of Countries for Japanese Yen Credit
Category Percapita GNI
1.LDC (Least Developed Countries)Less than US$750 Population: less than 75 million
2.Low-Income Countries Less than US$875 3.Lower-Middle Income Countries US$876-1,675 4.Middle-Income Countries US$1,676-3,465 5.Upper-Middle-Income Countries US$3,466-6,055 Source: JBIC
Since Palau’s per capita GNI is over US$ 7,000, Palau is already beyond even the category No. 5 (Upper-Middle-Income Countries). Although GNI is one of criteria, the peculiar situation of Palau will be considered, in conjunction with the Compact and the very small size of the country. With the reference to Compact, the present level of GNI seems to be distorted and inflated by such strong support from US. For reference, ADB has already determined on Palau’s development status as Group Country B so that Palau may be able to get access to a very soft loan from the fund source of ADF. Anyhow, the decision-making on the terms and conditions of Japanese Yen credit for Palau is up to JBIC and Ministry of Foreign Affairs, Japan. The following table will show the term and condition in case of Category 4 and 5 for reference.

5-70
Table 5.3.1-4 Terms and Condition of Japanese Yen Credit to be assumingly applied to “Upper middle income countries” and “Middle-income countries” Possibility 1: Terms and condition for Upper-Middle Income Countries
Interest(%)RepaymentPeriod
Grace Period(included in R.P.)
Standard 1.7 25 7Option 1 1.6 20 6Option2 1.5 15 5Standard 1.2 25 7Option 1 1 20 6Option2 0.6 15 5
Possibility 2: Terms and Condition for Middle-Income Countries
Interest(%)RepaymentPeriod
Grace Period(included in R.P.)
Standard 1.40 25 7Option 1 0.95 20 6Option2 0.80 15 5Standard 0.65 40 10Option 1 0.55 30 10Option2 0.50 20 6Option3 0.40 15 5Standard 0.20 40 10Option 1 0.10 30 10
Step
General Terms
PreferentialTerms
General Terms
PreferentialTerms
Source: Prepared by JICA study Team
With the reference to Japanese Yen Credit, around 90% of the total amount shall be provided to the recipient country. The rest of the amount (about 10%) has to be provided from the recipient country’s self-effort. PPUC shall use its own money reserve, or the Government of Palau has to provide the 10% of the total amount as equity to PPUC or subsidy. Although it is only 10%, the amount is not so small for PPUC and Palau. It this connection, it is noteworthy to underscore the importance of implementing electricity tariff revision as soon as possible. As the upsurge speed of oil price is far beyond our past recognition, PPUC’s financial condition will be deteriorated rapidly. One more condition to be reminded is that Japanese yen credit is a sovereign loan. JBIC needs the guarantee by the Government of Palau for the loan repayment.
ADB With the reference to ADB, Palau became the 63rd member country of ADB at the end of 2003. Thereafter the development status and the debt service capacity of Palau were assessed by ADB. It was determined in December 2005 that Palau would be a Group B country. It means that Palau is eligible for borrowing from ADF as well as from OCR, but all the projects will not be entitled to use ADF. It depends on appraisal of each projects and the availability of ADF. In case of a Group B Country, it is up to negotiation with donor countries. In some cases, OCR may be used. In other cases, ADF and OCR may be blended. To date, however, Palau has not submitted any request for financial assistance of ADB. So far, no ADB loan projects have been developed for Palau. ADB has cooperated in the aspect of policy advice and analytical support as in the same manner as WB. However, ADB is now changing its attitude and strengthening support for not only Palau but also other Pacific island countries, in the face of the gradually changing situation of the Compact. As ADB is currently formulating the 10th budget

5-71
appropriation for ADF for three years (2009-2011), intensive in-house discussion is currently held in the aspect of an appropriation for Palau as well. The budget allocation includes a certain amount for ADF and another amount for TA (technical assistance). It is very timely that ADB is scheduled to dispatch the mission to Palau in order to update and revise its country strategy and program for Palau for the period of June-July 2008. In reference to the corresponding criteria of ADB to classify developing member countries into three groups (A, B and C), ADB does not show such statistical criteria table as shown above as JBIC. ADB intentionally avoid indicating the clear-cut criteria table in terms of per capita GNI, because there will be various socio-economic circumstances to take into considerations. In particular, debt service ratio and debt service management capacity are very important aspects to be taken into considerations. As Palau is a very tiny country, ADB is seriously concerned about Palau’s economic fragileness and weak capacity for loan repayment. In this connection, ADB classifies Palau as Country Group B. The following table shows a general term and condition of financial assistance of ADB for a Group B Country. The term and conditions largely differ, depending on whether the financing source is ADF or OCR.
Table 5.3.1-5 Term and condition of fiancial assistance from ADB ADF OCR
Repayment Period 32 yearsEconomic life of the projectconcerend
Grace Period 8 yearsImplementation period of theproject concerned
Interest rate1% (Grace period)1.5% (Repayment period)
LIBOR + Commission charge
Note 1: In case of OCR, the repayment period and the implementationperiod are determined individually by each project
Note 2: In case of ADF, the repayment priod and the grace period areuniversally 32 years and 8 years respectively.
Note 4: LIBOR : London inter-bank offered rate
Note 3: Floating interest rate, to be changed by every 6 months, inconsideration of the past 6-month performance
Source: Prepared by JICA Study Team on the basis of ADB’s information and data
In case of OCR, the interest rate is determined by LIBOR (London Inter-bank Offered Rate) + Commission Charge. That is to say, the interest rate is a floating ratio and not so concessional. For instance, a one-year loan interest rate of LIBOR has been floating in the range from 3.07 to 5.37% for this latest one year (May 2007~May 2008). As a matter of fact, the interest rate will be around the range of 4.5~5%. The interest rate is far more than that of Japanese yen credit. In case of ADF, the interest rate is almost same level as the case of Japanese yen credit for the upper-middle income countries. In terms of the repayment period, ADF loan offers more generous term as 40 years of the total repayment period including grace period. When it comes to Japanese yen credit for middle income countries, Japanese yen credit’s interest rate is softer than ADF. With the reference to government guarantee for repayment, all the ADF projects need the government guarantee. On the other hand, OCR loan projects do not always need government guarantee. Depending on institutional viability and management capacity as well as project

5-72
financial viability, ADB shall determine about whether the guarantee of the Government is necessary or not.
World Bank Palau is an IBRD-eligible country. World Bank’s current stance to Palau, however, is clear. WB is to focus on the provision of the targeted policy advice and analytical support in a few key areas to leverage donor resources and build local capacity. WB’s stance is shaped by the recognition of the substantial support from the Compact as well as Taiwan’s aid and JICA’s assistance as well as the high position of per capita GNI.
Taiwan ODA Although Taiwan’s aid might be a possible fund source, the issue is the size of the necessary fund amount and interest rate. In December 2007, PPUC determined to procure a 5MW generator with the assistance from Taiwan. The loan agreement was reached. The interest rate is 3.5%, and the money borrowed is US$ 7million. Taiwan ODA will be one option to be taken by Palau. For Palau, the term and condition will not be so generous than the soft loan to be extended from international aid financial agencies. In addition, the necessary money size is by far bigger than last year’s loan agreement amount.
Co-financing by JBIC and ADB When it comes to con-financing, ADB and JBIC, last year made a co-financing loan agreement for the power sector development to Samoa, together with Australian AID. JBIC’s portion is around 38%, ADB’s portion is around 42%. Another 8% comes from AusAID and 12% from Samoa, it self. As shown in the case of Samoa, another possibility for Palau is this sort of co-financing between JBIC and ADB. Besides, the scheme of ACFA (Accelerated co-financing with ADB) was recently developed by JBIC and ADB in order to promote co-financing. Anyway, it is deemed as essential for Palau to make full-understanding of the characteristics and available financial resources of those international aid agencies. In the aspect of technical assistance for PPUC or regulatory framework improvement, such multilateral aid donors may be expected to play a significant role as well. 5.3.2 Underlying assumption for financial analysis of the projects (1) Project life The main component of the projects is the replacement of old generators in Aimellik Power Plant, in which six 5-MW power generators will be installed under this technical design work. In general, economic life of generators is 20 years, and depreciation period is 20 years as well. The operation of the new Aimeliik will start in FY 2013. JICA Study Team determines on 20 years for project life (FY2013-2032). The construction period ranges from 2011 to 2012, prior to the operation start. For further detail, please refer to the Section 4.1.4 of this report. (2) Technical design and plan The financial calculation conducted for this financial analysis is based on the technical study and design conducted by JICA Study Team. (3) Computing incremental cash flows The project’s net cash flows shall be forecast over the project life. In this case, the project’s

5-73
main part will be the replacement and expansion of the existing power plant. The incremental part will be computed on an incremental basis, comparing between the “with project scenario” and “without project scenario”. Concretely speaking, the generated and consumed power from the generators concerned will be the new incremental portion for the project of power generation. In case of transmission and distribution improvement project, the improvement work of transmission efficiency will enable to increase the effective use portion of the power through reduction of transmission loss. Without the project, the portion concerned would have been lost through inefficient transmission.
Power generation: sales of electric power to be generated from the newly installed equipments
Transmission and distribution: improvement of transmission loss (4) Current price terms As in the custom of ADB, JBIC and World Bank, this financial analysis projection is prepared in current price terms. It does not count any inflation elements. (5) Fuel expense and price As analyzed and shown in Chapter 3, the fuel expense is the key factor of PPUC’s operation expenses. The future move of oil price will significantly affect the financial performance of PPUC. In recent years, the oil price has showed a surprising upsurge in the world. Taking a look at the current tight situation of demand and supply of oil, it will be probably on the upward trend in the long term. Only Market, however, knows market price in future. Nobody will be able to foresee the future price. The proposed scheme of AFPAC is to fluctuate on monthly basis and to fully cover the fuel cost. Provided that the AFPAC’s prompt revision is actually implemented from now on, the oil price hike will be sufficiently absorbed by power sales revenue. The current price of diesel oil procurement for PPUC is US$ 3.67/gallon as of May 2008. For this study, this current price is used for financial projection analysis. The price of HFO is counted by summing up of the current market price of HFO180, Singapore MOPS (Mean of Platts Singapore), the same price of ocean freight of diesel, the same amount for handling fee, secondary transport, LFT and GRT. It is US$ 2.6/gallon. The gap is fairly big: US$ 1/gallon. It will be a crucial point to generate big difference on financial projection outcomes for two scenarios. (Using HFO or Continuing to use diesel only) Not only Palau but also the neighbor countries in pacific areas have not imported HFO. It is only Guam that is currently importing and actually using HFO. Therefore, there will be some unclear points to be clarified. It is a challenge, how to make it possible for Palau to procure HFO. The technical design conducted by JICA Study Team will solve almost all of the technical issues and environmental concerns. However, such actual procurement of oil will be implemented through business negotiation. Some points will dependent on business negotiation. 5.3.3 FIRR and NPV (1) The Priority Project In the aspect of operation expense, fuel cost is a decisive factor. On the other hand, in the aspect of operation revenue, the financial result of operation will differ, depending on electricity tariff. The following table and figure distinctly shows the difference between the HFO use operation and the conventional operation of using only diesel oil.

5-74
The financial rate of return and the net present value are calculated as below:
Table 5.3.3-1 FIRR and NPV analysis with the variable of Electricity Tariff Rate
HFO use Diesel ETR FIRR NPV at 5% ETR FIRR NPV at 5%
US$/kWh % US$ US$/kWh % US$ US$0.31 6.60% 6,576,292 US$0.40 8.43% 12,131,285US$0.32 8.49% 14,649,472 US$0.41 10.63% 20,555,580US$0.33 10.31% 22,722,650 US$0.42 12.73% 28,979,880US$0.34 12.06% 30,795,830 US$0.43 14.74% 37,404,180US$0.35 13.75% 38,869,011 US$0.44 16.69% 45,828,478US$0.36 15.40% 46,942,189 US$0.45 18.58% 54,252,775US$0.37 17.01% 55,015,370 US$0.46 20.42% 62,677,072US$0.38 18.58% 63,088,548 US$0.47 22.22% 71,101,372US$0.39 20.11% 71,161,727 US$0.48 23.99% 79,525,670US$0.40 21.61% 79,234,908 US$0.49 25.72% 87,949,968US$0.41 23.09% 87,308,087 US$0.50 27.42% 96,374,269US$0.42 24.54% 95,381,265US$0.43 25.96% 103,454,445
FIRR (%)
0.00%
5.00%
10.00%
15.00%
20.00%
25.00%
30.00%
35.00%
40.00%
1 2 3 4 5 6 7 8 9 10 11 12 13 14 15 16 17 18 19 20 21
FIR
R
HFO Diesel
0.30 0.35 0.40 0.45 0.50
Electricity Tariff Rate (US$/kWh) Source: Prepared by JICA Study Team
Fig. 5.3.3-1 Comparison between Two Scenarios (HFO use or Diesel Oil Use) In case of continuing to use diesel oil, PPUC has to keep on charging US$ 0.39/kWh. If the price goes up, PPUC will have to raise the tariff furthermore in order to continue the service.

5-75
On the other hand, provided that PPUC successfully introduces HFO use, PPUC will be able to decrease the rate to around US$0.31/kWh, simultaneously keeping the reasonable return. The improvement of power transmission and distribution is essentially important to keep the service efficiently as well as to prevent disconnection. Although the direct benefit of the project will not be so large as that of power generation, the function of transmission and distribution is indispensable. Without the stable and efficient operation of transmission and distribution, the electricity company will not be able to sustainably manage the operation as a whole. The benefit is, herein, calculated as improvement of transmission. Without these investment activities, the risk of operation will be getting larger. For this time, JICA Study Team has not calculated the benefit of avoiding such risk by using meticulous approach of calculation, because the benefit will be sufficient by integrating both PG and TD into one comprehensive project. (2) Sensitivity Analysis Fuel cost is the largest risk factor as shown in Chapter 3. By setting forth several scenarios of as follows (0%, 10% up, 20% up, 30% up and 40% up and 50% up), let’s examine the sensitivity on FIRR for the Priority Project in case of HFO use. In addition to the fuel price hike scenarios, the several scenarios of electricity tariff will be examined. The following table shows the sensitivity on FIRR change for the Priority Project of HFO use case.
Table 5.3.3-2 Sensitivity on the Priority Project, by several scenario of fuel cost increase Overall electricity rate 0% Case 10% case 20% case 30% case 40% case 50% case
US$0.35/kWh 13.75% 9.93% 5.90% 1.53% minus minus
US$0.39/kWh 20.11% 16.61% 12.98% 9.21% 5.21% 0.89%
US$0.43/kWh 25.96% 22.67% 19.29% 15.82% 12.24% 8.50%
Too good Appropriate Not viable 5.3.4 Time-schedule from the confirmation of fuund procurement up to the operation
commencement This study is to prepare the medium-long term master plan for PPUC, and it includes this pre-FS. In order to fulfill the proposed contents of the pre-FS, Palau should make follow-up effort concerning land acquisition, fund procurement and other related issues. The following figure shows the referential time-schedule as one example, under the assumption that the power generation plant of Phase 1 shall commence in 2013 and that of Phase 2 shall commence in 2014.

5-76
Table 5.3.4-1 Time-Schedule from Fund procurement to Plant Operation Commencement 1 2 3 4 5 6 7 8 9 10 11 12 1 2 3 4 5 6 7 8 9 10 11 12 1 2 3 4 5 6 7 8 9 10 11 12 1 2 3 4 5 6 7 8 9 10 11 12 1 2 3 4 5 6 7 8 9 10 11 12
JICA MP andPre-FS
Follow-up actions forland acquisition, fundprocurement etc.
Loan agreement
Retaining ofconsultant
Detai design
Bidding of phase 1construction
Phase 1 constructionwork
Bidding of phase 1machinery
Phase 1 machineryProcurement
Operation
Year 2012Year 2008 Year 2009 Year 2010 Year 2011
P Bid Bid Evaluation
Contract Negotiation
PQ Bid EvaluationBid
Contract Negotiation
Source: Prepared by JICA Study Team

6. EXAMINATION FOR OPERATIONAL IMPROVEMENT OF POWER SUPPLY EQUIPMENT

6-1
6. Examination for Operational Improvement of Power Supply Equipment 6.1 Operational Improvement of Power Generation Equipment 6.1.1 Current Operation and Maintenance Conditions of Power Generation Equipment The American consulting firm Electric Power Systems Inc. compiled the current conditions and necessary improvement points concerning operation and maintenance in the PPUC Power Generation Department into the “Power station Performance Audit” in June 2007. As of May 2008, the PPUC has made a start on introducing the recommendations made in this report to its running of the Power Generation Department, and the operation and maintenance situation is being improved. However, supply continues to be impeded by breakdowns and stoppages in the generating equipment, and further improvements need to be made. The following sections indicate the current conditions regarding operation and maintenance in the Power Generation Department. (1) Organizational Setup Fig. 6.1.1-1 and Fig. 6.1.1-2 show the organizational setup of the PPUC Power Generation Department.
※
Mechanic Supervisor
(1)
Power Plant Mechanic I
(2)
Power Plant Mechanic II
(2)
Power Plant Electrician I
(1)
Power Plant Electrician II
(1)
PlantShift
Supervisor(1)
Plant Operator
(1)
PlantShift
Supervisor(1)
Plant Operator
(1)
PlantShift
Supervisor(1)
Plant Operator
(1)
Plant Shift
Supervisor (1)
Plant Operator
(1)
Office Clerk (1)
Malakal Superintendent (1)
Power Generation Manager (1)
Mechanical Engineer(1)
Plant Operator
Daily Worker(1)
Fig. 6.1.1-1 Organization Chart of Malakal Power Station
Mechanic Supervisor
(1)
Power Plant Mechanic I
(2)
Power Plant Mechanic I
(2)
Power Plant Electrician I
(1)
PlantOperator
(4)
PlantShift
Supervisor(1)
Plant Operator
(1)
PlantShift
Supervisor(1)
Plant Operator
(1)
PlantShift
Supervisor(1)
Plant Operator
(1)
Plant Shift
Supervisor (1)
Plant Operator
(1)
Office Clerk (1)
Plant Operator
Daily Worker(2)
Aimeliik Superintendent (1)
※
Fig. 6.1.1-2 Organization Chart of Aimeliik Power Station

6-2
Operation is carried out based on the shift system indicated in Table 6.1.1-1. Four teams comprising two members each work three shifts (the shift schedule is arranged so that one team can rest at any one time). Maintenance is supervised by the machine equipment manager, however, concerning operation management, there is no operating manager to analyze and assess the operating data.
Table 6.1.1-1 Work Hours of Operating Personnel Shift Work Hours
1st shift 08:00 ~ 16:00 2nd shift 16:00 ~ 12:00 3rd shift 12:00 ~ 08:00
Regarding actual maintenance work such as periodic inspections and maintenance, etc., rather than outsourcing this to the equipment makers, a team of roughly 10 members under the mechanical equipment manager directly handles the work at both power stations. However, in accordance with recommendations given in the Power Station Performance Audit, in an effort to improve operation and maintenance, the PPUC has bound a contract to recruit a mechanical engineer from a nearby country to implement the following work for two years from November 2007. - Add up remaining operating times and compile future maintenance plans for each item of
equipment. - Implement and supervise periodic inspections and maintenance from an expert
viewpoint. The recruited mechanical engineer has experienced the supervision of diesel power generating equipment at a company in the Philippines, which also conducted its own maintenance without outsourcing to the makers. He also has experience of providing guidance as a maintenance instructor and is confirmed to be the ideal person for passing on the above work to the PPUC. This mechanical engineer has helped formulate the following maintenance plans: 1) Operating plans giving a breakdown of daily operating plans for generators at Malakal
and Aimeliik Power Stations (2008-2010) 2) Formulation of periodic inspection and maintenance schedules for each equipment based
on the operating plans 3) Examination of inspection and maintenance items in each generator and periodic
inspection 4) Preparation of the list of spare parts required in each generator and periodic inspection 5) Preparation of the spare parts ordering schedule based on the periodic inspection and
maintenance schedule 6) Preparation of the ordering standard and inventory list for emergency spare parts
Although the mechanical engineer has advanced the formulation of plans, not much progress has been made in transferring planning techniques to the local PPUC staff. Moreover, the mechanical engineer has not implemented much technical transfer in inspection and maintenance supervision through providing education in technical know-how concerning power generating equipment. Moreover, clerical personnel at Aimeliik Power Station were laid off in May 2008. Apart from the plant manager’s offices at Aimeliik and Malakal Power Stations, since staff in the Power

6-3
Generation Department have no equipment for conducting deskwork, the plant managers have to conduct all planning work by themselves. Clerical staff members are provided with the aim of assisting this work. (2) Legal Systems and Statutory Technical Standards concerning Operation and
Maintenance Palau currently has no legal systems or statutory technical standards for power generating equipment. It will need to establish such legislation and standards based on a long-term viewpoint in future. Concerning existing power generating equipment, each supplier has designed and installed equipment based on the technical standards in each country. In particular, since safety technical standards are important from the operation and maintenance viewpoint, it is necessary to establish these from a long-term perspective, however, the training of engineers to perform such work is the most pressing issue at present. (3) Safety Regulations and Emergency Communications Networks The PPUC does not have a document (safety regulation) specifying its policy regarding safety matters such as the types prescribed by Japanese electric power companies for the purpose of securing stable supply. However, the mechanical engineers at the PPUC have compiled an “Emergency Preparedness Plan” providing guidelines on how to respond to major accidents and other emergency situations in the Power Generation Department. The issue in future will be to publicize and implement these contents. As for the emergency communications setup, persons who discover problems are required to notify the plant manager, however, concrete standards for this and the network for notifying other personnel haven’t been confirmed. (4) Budget Measures Table 6.1.1-2 shows the maintenance budgets and actually incurred expenses concerning engines and generators over the past five years at Malakal and Aimeliik Power Stations. According to the actual figures for 2007, a start has been made on managing maintenance expenses for each generator unit. When deciding the budgets, since not enough attention is paid to discerning the amount that can be outlaid in the following year or compiling budgets based on maintenance plans, it can be seen that maintenance expenses are not being properly managed, for example, actual expenses are sometimes much lower than the budget amount or they are sometimes more than 10% higher than the budget amount. However, because the mechanical engineer has started to prepare maintenance plans from fiscal 2007, it is expected that budget and actual cost performance will be improved from now on.

6-4
Table 6.1.1-2 Budget and Actual Expenditure for Engine and Generator Maintenance Unit: USD
Projected Actual Projected Actual Projected Actual Projected Actual Projected ActualEngine Overhaul Total
404-7160-051 Engine Overhaul 2 475,000.00 333,090.08 150,000.00404-7160-052 Engine Overhaul 3 429,000.00 437.48 150,000.00 218,168.00404-7160-053 Engine Overhaul 4 625,000.00 313,859.56404-7160-054 Engine Overhaul 5 535,000.00 296,757.23
Gen. Parts & Maintenance Total 130,000.00 123,827.36 120,000.00 87,574.96 250,000.00 183,105.12 152,000.00404-7160-071 Gen. Parts & Maintenance 2 23,101.77 38,000.00 11,151.27404-7160-072 Gen. Parts & Maintenance 3 24,063.22 15,000.00 5,746.29404-7160-073 Gen. Parts & Maintenance 4 18,810.78 38,000.00 22,741.53404-7160-074 Gen. Parts & Maintenance 5 6,814.49 38,000.00 7,678.87404-7160-112 Gen. Parts & Maintenance 7,024.96 71,000.00 4,057.05
Total 605,000.00 456,917.44 655,000.00 384,332.19 875,000.00 496,964.68 581,000.00 80,252.70 500,000.00 269,543.01
Unit: USD
Projected Actual Projected Actual Projected Actual Projected Actual Projected ActualEngine Overhaul Total 680,000.00 130,287.56 210,000.00 387,959.74 1,158,195.00 10,793.23 404,000.00
403-7160-051 Engine Overhaul W-1 129,400.00403-7160-052 Engine Overhaul W-2
403-7160-053 Engine Overhaul W-3
403-7160-054 Engine Overhaul M-12 5.48 250,300.00 145,028.08403-7160-055 Engine Overhaul M-13 243,088.20 250,300.00 187.32
Engine Overhaul C-1
Engine Overhaul C-2
Engine Overhaul A-7
Gen. Parts & Maintenance Total 48,000.00 147,215.20 41,000.00 277,736.55 180,000.00 434,220.80 180,000.00403-7160-071 Gen. Parts & Maintenance W-1 1,428.14 10,000.00 950.00403-7160-072 Gen. Parts & Maintenance W-2 13.25 10,000.00403-7160-073 Gen. Parts & Maintenance W-3 14,379.55 10,000.00 1,306.00403-7160-074 Gen. Parts & Maintenance M-12 101,565.30 25,000.00 4,407.50403-7160-075 Gen. Parts & Maintenance M-13 142,191.87 25,000.00 2,290.55
Gen. Parts & Maintenance C-1
Gen. Parts & Maintenance C-2
Gen. Parts & Maintenance A-9 1,283.93 36,702.22403-7160-112 Gen. Parts & Maintenance General 20,000.00
Total 728,000.00 277,502.76 251,000.00 665,696.29 1,338,195.00 445,014.03 584,000.00 503,955.72 730,000.00 190,871.67
Maintenance Expences for Aimeliik Power Plant
2004 2005 2006 2007 2008
Maintenance Expences for Malakal Power Plant
2004 2005 2006 2007 2008
Source: PPUC
(5) Operation of Power Generating Equipment Daily operating plans are compiled by the mechanical engineer based on daily load curves from the same period of the previous year. However, since Pielstick-3 at Aimeliik Power Station is currently undergoing rehabilitation work (see 4.2.1.1 (4)), there are no such plans and, except for the stoppage of high-speed low-capacity generators at times of low demand (nighttime, etc.), all the generating equipment is kept operating. Shift operators are able to start and stop these high-speed rotating units (Wartsila-1, Caterpillar-1 or Caterpillar-2) according to their own judgment, and they are also able to decide which units are started and stopped. Basic data on operation is collected by means of log sheets, handover ledgers, trouble reports, trip reports and emergency record sheets in the case of Malakal Power Station, and by means of log sheets, handover ledgers and trouble ledgers in the case of Aimeliik Power Station. Although records are made, they are not effectively utilized because there is no system for analyzing and assessing them, while storage procedures are not specified. Moreover, some log sheets were found to contain no data because of troubles with measuring instruments. The accuracy of measuring instruments is not checked. (6) Maintenance of Engines Although equipment makers recommend that engines undergo periodic inspections every 1,000 hours, 3,000 hours, 6,000 hours, 12,000 hours and 24,000 hours, due to inadequate maintenance plans and budget measures, only the 1,000-hour and 24,000-hour inspections are implemented at Aimeliik Power Station. Meccron Co., which performs the rehabilitation work, plans to compile periodic inspection and maintenance plans based on internal conditions in future. As for Malakal Power Station, ever since the aforementioned mechanical engineer has been recruited, periodic inspection and maintenance plans have been compiled and implemented according to the operation and maintenance manuals of the equipment manufacturers.

6-5
Concerning the periodic inspection and maintenance of engines, since neither Aimeliik Power Station nor Malakal Power Station have made or kept records of crankshaft defection, bearings clearance, bearings abrasion and replaced parts, etc., it is not possible to trace the current condition of equipment. (7) Maintenance of Systems In order to keep engines operating with good efficiency, it is necessary to compile maintenance plans and conduct maintenance on lubrication systems and cooling water systems too. Currently, concerning the periodic inspection and maintenance of engines and generators, maintenance plans are being finalized and budget items are finely compartmentalized, however, this progress has so far not been reflected in other systems. It will be necessary for the mechanical engineer to clarify heat exchanger cleaning intervals and filter replacement intervals, etc. for other systems and to compile maintenance plans for entire plants. (8) Lubricating Oil and Cooling Water Management At Aimeliik Power Station, lubricating oil is sampled every 1,000 hours and sent to the petroleum company for analysis, and the results of analysis are used to determine whether or not to replace the lubricating oil. At Malakal Power Station, the lubricating oil circulated in systems is managed by means of monthly sampling. Concerning cooling water, the generating units made by Mitsubishi are equipped with water softeners, while other units use city water for cooling purposes (anti-corrosive is not applied). Periodic analysis of cooling water properties is not implemented. (9) Spare Parts The storage situation regarding emergency spare parts is good with lists of inventory quantities and locations maintained and renewed every month. Fig. 6.1.1-3 indicates the storage conditions. Regarding Aimeliik Power Station, the clerical worker who was recruited in May 2008 conducts the inventory management of these spare parts. Concerning gaskets and other consumable items, more than the quantities required for a single overhaul are kept on hand. As for relatively large and expensive spare parts, between 1~5 are held in readiness for any problems.
Gasket storage conditions - Sorted according to type
Spare parts storage conditions - Shelves are numbered and
storage locations can be checked by looking at the spare parts list
Spare parts inventory manager - An office worker conducts
inventory management
Fig. 6.1.1-3 Storage Conditions of Spare Parts

6-6
(10) Maintenance Tools Similar to the spare parts, storage conditions are also good for maintenance tools. Standard tools such as spanners and wrenches are managed by each machine technician, whereas special tools used for disassembling and assembling engines are kept in the machining rooms of power stations. The power stations also possess cutting and processing machines such as lathes and milling cutters, etc. and they are able to manufacture emergency parts that may become necessary when repairing problems. Welding machines were observed, however, welding technicians possessing the necessary expertise were not confirmed. Fig. 6.1.1-4 shows the situation regarding maintenance tools.
Standard tools (managed by each
machine technician)
Special tools (stored in the power station
machining rooms)
Lathe (milling cutters and sawing machines are also owned)
Welding burner Welding machine Machine technicians and rest room
Fig. 6.1.1-4 Storage Situation of Maintenance Tools (11) Work Guidelines and Inspection Record Formats In maintenance workplaces in Japan, as a supplement to the operation and maintenance manuals provided by equipment makers, work supervisors prepare work guidelines suited to each workplace and work is conducted according to these in order to ensure safety and the certain implementation of inspection items. Work contents, preliminary and follow-up measures and divisions of roles are clarified based on such work guidelines, and through securing the advance approval of managers and providing education to work operators, they help secure the safe and sound implementation of work. Such work guidelines are currently not prepared in the Power Generation Department of the PPUC. In future, it will be necessary to prepare such guidelines according to the actual work conducted in each workplace. (12) Human Resources Development Human resources development in the Power Generation Department is based on OJT. Even

6-7
when new employees are recruited, concentrated training entailing dispatches to equipment makers, etc. for imparting technical know-how is not conducted. Only five employees have experienced operation and maintenance training at equipment makers, i.e. the plant manager, two mechanical engineers and one electrical engineer at Malakal Power Station, and the machine equipment manager at Aimeliik Power Station. It is scheduled for the equipment maker to conduct operation and maintenance training for three members at Aimeliik Power Station when it delivers the new 5 MW generator. In addition to know-based on experience, it is important from the viewpoint of improving operation and maintenance technology for employees to learn systematic know-how. Furthermore, it is also essential to efficiently collect, analyze and store data for improving operation and maintenance. However, since staff members do not possess the apparatus to conduct deskwork and they also lack basic computer skills, the plant manager and mechanical engineer have to undertake all these responsibilities. Another important issue is that each employee acquires the basic skills required to operate personal computers. It is necessary to thoroughly respond to these specific issues and criteria by incorporating steps into personnel evaluations and so on. Employees currently undergo evaluation once every year, however, since evaluations only comprise giving marks for general written items, it is impossible to discern how skills are being honed with respect to specific issues. (13) Current Conditions of Power Generating Equipment Since Wartsila-2 and Wartsila-3 units at Malakal Power Station have not been used as power sources ever since they experienced crankshaft burning in 2006, there is a lack of supply reserve capacity at the plant. Repair parts for both units have already been delivered and work is currently being advanced on Wartsilla-3 ahead of Wartsilla-2. Fig. 6.1.1-5 shows the repair situation regarding Wartsilla-3. It appears that Wartsilla-3 will be ready for recommissioning around July 2008, while Wartsilla-2 should be operational again by the middle of 2009 or the start of 2010 at latest.
Engine block cleaned after being opened up Detached piston undergoing cleaning

6-8
Cylinder head awaiting maintenance work Lubricating oil cooler to be cleaned after opening
Fig. 6.1.1-5 Wartsilla-3 Maintenance Conditions Concerning the power generating equipment at Aimeliik Power Station, PPUC concluded a contract for the rehabilitation of Peilstick-3 with Meccron Co., which conducts consulting for the Philippine plant equipment and industrial equipment, and this rehabilitation work was commenced from the end of February 2008 over a 60-day schedule. Following confirmation of operating conditions in Pielstick-3, where work has finished, it is planned to bind similar contracts with the same company for the rehabilitation of the three remaining units. In fiscal 2008 (October 2007 to September 2009), budget has been appropriated for the rehabilitation work of Pielstick-3 and Pielstick-2. However, upon implementing internal inspection of Pielstick-3, since damage that cannot be repaired on site (for example, cracking at the bottom of the cooling water jacket, etc.) was confirmed, related parts will be transported to Meccron Co. for repairs there. Fig. 6.1.1-6 shows the extent of damage. For this reason, it appears that the restoration of Pielstick-3 will be delayed until around August 2008.
Cooling water jacket (green circle indicates the cracked area)
Cracking in the cooling water jacket
Fig. 6.1.1-6 Cracking Confirmed in the Cooling Water Jacket Concerning switchgear in Wartsila-2 and Wartsila-3 units, the two Caterpillar generator switchgear sets that were hurriedly introduced and switched to when frequent crankshaft burning occurred in 2006 are still in use today. Assuming that Wartsila-2 and Wartsila-3 units

6-9
will be repaired and recommissioned in future, it will be necessary to prepare two sets of Caterpillar generator switchgear. It is possible to apply the Alco-7 and Alco-8 switchgear that is currently obsolete, however, since this is deteriorated, it will be necessary to first implement inspections and restore missing instruments, confirm operations, prepare power switching procedures and secure reserve supply capacity as soon as possible. Fig. 6.1.1-7 shows the current condition of the Alco-7 and Alco-8 switchgear.
Missing instruments Internal condition of switchgear
Fig. 6.1.1-7 Condition of Switchgear in Alco-7 and Alco-8 Meanwhile, as of May 2008, the Mitsubishi-13 unit at Malakal Power Station is due for its 7,500-hour periodic inspection. As was mentioned above, since there is currently not enough reserve supply capacity available, it will be necessary to delay the periodic inspections of other units in the event where an unexpected problem occurs as shown in Fig. 6.1.1-3. Such delays in periodic inspections lead to the occurrence of further problems, and such a vicious cycle prevents the planned implementation of preventive maintenance. In addition to the rehabilitation of Wartsila-2 and Wartsila-3 units, there are plans to add another 5 MW generator to Aimeliik Power Station. The contract for this is to be signed in May 2008 and the new unit is scheduled for commissioning as a new power source in 2010. 6.1.2 Recommendations for Operational Improvement of Power Generating Equipment (1) Problems and Recommendations concerning Routine Operation
1) Operating Setup
Both power stations have two operators at work at all times, and four teams of operators share the workload over three shifts (morning, evening and night). One of the teams provides cover for day shifts and personnel who take leave. At times of routine operation, operating personnel manage equipment load, frequency, voltage, power factor, current and electric energy, and they decide when to turn generators on and off in line with daily load fluctuations based on their own experience. However, the mechanical engineer should compile clear procedures and implement periodic OJT so that operating disparities according to individual operator differences are eliminated. In the event of emergencies, communication setups are established and enable pertinent instructions to be given.

6-10
2) Operating Records Log sheets are divided into those for engine generators, transmitted energy and fuel oil (see Annex 1). Performance records are not kept and there are also missing entries due to broken or missing instruments. In addition, some areas have been neglected for an extended period and the partial absence of data impedes the appropriate gauging of current conditions and forecasting of risks. Operators record the operating values of each engine generator hourly in record sheets. Generator unit-related items such as generated electric energy, exhaust gas temperature, fuel rack, cooling water pressure and temperature, lubricating oil pressure and temperature and so on as well as instrument readings from the generator control panel are covered and provide adequate operating records. Operating records are the equivalent of patient records in hospitals and provide basic information for determining current status, forecasting future status and predicting risks of engine generators. Generally speaking, engine generators display the best performance in terms of peak generated energy and fuel consumption rate, etc. immediately after the start of operation; this gradually declines over time and recovers slightly following maintenance. In view of this, operating records provide the basis for determining current status, forecasting future condition and predicting risks when compared against performance test records (performance records at start of operation following installation and following maintenance) and when viewed over time.
3) Analysis of Operating Records The above operating records are only sent to plant engineers and stored inside the plants, however, they are not utilized for conducting the technical assessment (determining current status, forecasting future condition and predicting risks) of engine generators. Operating records are only written down and archived. The PPUC does not have sufficient skilled engineers who are capable of making technical assessments from operating records for engine generators and power generating systems, however, it is important to report such technical assessments to the PPUC headquarters so that they can be fed back to operators and maintenance staff and shared through all the PPUC. Such sharing of information makes it possible to conduct the operation and maintenance of sound power generating equipment. Operators keep notes of everyday occurrences and these notes sometimes contain important hints, which engineers should be able to decipher and, where necessary, translate into detailed investigations, identification of causes and compilation of steps and measures. All alarm situations should be recorded and dealt with according to the above procedure. Statistics of breakdown records are not currently maintained. Monthly and annual statistics of operating time, routine stoppage time, breakdown stoppage time and generated electric energy for each generating unit give a numerical indication of the reliability of power generating equipment and provide indices of sound operation and maintenance.

6-11
4) Maintenance of Instruments In addition to implementing education via OJT and so on and thoroughly ensuring that operators report instrument breakdowns and problems, it is necessary to build a setup for predicting breakdowns and problems in instruments from operating records. It is important for both the reporting side and the side receiving and making judgments based on reports, i.e. the entire PPUC organization, to have common awareness that instrument failures and deficiencies are abnormal. Furthermore, it is strongly recommended that instruments are periodically calibrated and that broken instruments are replaced with new products.
5) Recommendations - Formulation of the start and stop procedure for power generating equipment - Calibration, maintenance and replacement of instruments - Analysis, assessment, countermeasures and reporting of operating records (log
sheet) and incident records - Preparation and reporting of breakdown report statistics
(2) Problems and Recommendations in Periodic Inspections Engines and so forth should periodically undergo maintenance. The operation and maintenance manuals that are supplied by equipment makers give detailed descriptions of the work items that need to be performed after different operating periods. Although there are minor differences according to each engine maker, the following general procedure is prescribed for medium-speed engines (Pielstick and Mitsubishi). - Maintenance inspection every 500~1,000 hours: stoppage of around 4 hours
Cleaning and inspection of fuel filters and lubricating oil filters Cleaning and inspection of fuel injection valves according to necessity
- Maintenance inspection every 2,500~3,000 hours: stoppage of around 1 week Dismounting and maintenance of cylinder head, inspection of fuel injection valve, inspection of inlet valve / outlet valve, measurement of crankshaft, inspection of cylinder liner, inspection and replacement of fuel injection pump deflector, inspection of fuel control link, inspection of inlet manifold, internal inspection of crankshaft, inspection of compressed air start valve
- Maintenance inspection every 7,500~9,000 hours: stoppage of around 4 weeks Dismounting and maintenance of cylinder head, inspection of fuel injection valve and replacement of nozzle, inspection of inlet valve / outlet valve, maintenance of piston, replacement of piston crown, measurement of crankshaft, inspection of cylinder liner, inspection and replacement of fuel injection pump deflector, inspection of fuel control link, inspection of inlet manifold, internal inspection of crankshaft, inspection of compressed air start valve

6-12
- Maintenance inspection every 15,000~18,000 hours: stoppage of around 6 weeks Dismounting and maintenance of cylinder head, inspection of fuel injection valve, inspection of inlet valve / outlet valve, measurement of crankshaft, inspection of cylinder liner, inspection and replacement of fuel injection pump deflector, inspection of fuel control link, inspection of inlet manifold, internal inspection of crankshaft, inspection of compressed air start valve
- Maintenance inspection every 22,500~27,000 hours: stoppage of around 7 weeks Dismounting and maintenance of cylinder head, inspection of fuel injection valve, inspection of inlet valve / outlet valve, measurement of crankshaft, inspection of cylinder liner, inspection and replacement of fuel injection pump deflector, inspection of fuel control link, inspection of inlet manifold, internal inspection of crankshaft, inspection of compressed air start valve
- Maintenance inspection every 30,000~36,000 hours: stoppage of around 8 weeks Dismounting and maintenance of cylinder head, inspection of fuel injection valve, inspection of inlet valve / outlet valve, measurement of crankshaft, inspection of cylinder liner, inspection and replacement of fuel injection pump deflector, inspection of fuel control link, inspection of inlet manifold, internal inspection of crankshaft, inspection of compressed air start valve
However, inspections are currently not implemented at periodic intervals due to the pressing demand for electricity and shortages of replacement parts resulting from the inadequate budget. As a result, maintenance inspections are postponed and massive repair costs are incurred when major breakdowns are allowed to occur and render operation impossible for extended periods. A noteworthy example of this was the crankshaft breakdown that occurred in the Mitsubishi engine in 2006. Furthermore, when engines are disassembled for maintenance inspections following extended periods of operation without any maintenance inspections, other problems are found and stoppage times are prolonged due to the need to procure parts. When this happens, the demand for power becomes more pressing and subsequent maintenance inspections end up being postponed again. This kind of vicious cycle is repeated over and over. The PPUC recruited a Philippine engineer last year and assigned him to Malakal Power Station with a view to breaking free of this negative cycle. It is vital that periodic inspections be compiled in a manner that takes actual conditions into account and fully utilizes the skill and experience of the Philippine engineer. A broad outline of periodic inspections is given below. 1) Formulation and implementation of short-term and long-term plans for maintenance
inspections of engine generators Concerning maintenance inspections at intervals of 2,500 hours and more, compile schedules taking past inspections and engine conditions, etc. into account. Detailed schedules should be compiled for 2 years in the short term and 10 years in the long term.
6-13
2) Procurement and storage of emergency spare parts for engine generators Concerning large parts kept permanently on hand in case of sudden accidents (for example, pistons, cylinder liners, cylinder heads, crank pins, main bearings), make sure that stores can be checked at any time. Currently, handwritten documents about the use of inventory items are communicated to headquarters, where inventory data is managed. It is desirable to build an internal network so that information concerning spare part inventories can be shared.
3) Procurement and storage of replacement parts for engine generators Conduct management so that the replacement parts required in 1) can be procured and inventories can be checked at any time. Original maker tools are required to conduct the disassembly of engines, and these should be permanently kept on hand.
4) Formulation and implementation of long-term and short-term plans for auxiliary equipment maintenance inspections Periodic inspections or pumps and motors (cleaning, greasing, seal replacement, bearings replacement, alignment checking, current measurements, etc.), and periodic inspections of filters (cleaning and replacement of filter elements, disassembly maintenance, seal replacement, bearings replacement, current measurements, etc.)
5) Procurement and storage of emergency spare parts and replacement parts for auxiliary equipment Conduct management so that the replacement parts required in 4) can be procured and inventories can be checked at any time.
6) Formulation and implementation of long-term and short-term plans for control panel and circuit breaker panel, etc. maintenance inspections Calibrate meters during stoppages for engine generator maintenance inspections. Moreover, implement protective relay calibration every two years. Keep inventories of display lamps and fuses equivalent to around 50% of total installed quantities, and replace whenever necessary. Keep one of every type of MCCB on hand in readiness for use in emergencies.
7) Quality control of fuel oil Have fuel suppliers submit constituent tables and performance tables with every lot purchased, and make sure that values satisfy the standards prescribed by the engine makers. In particular, make sure that the combustion lower calorific value is on or above the standard value (reference value: ISO standard diesel oil = 10,200 kcal/kg). Due to the recent inflation in fuel prices, the ratio of fuel costs to the generating cost has risen to more than 75%. The combustion lower calorific value is extremely important because it is directly related to the fuel consumption rate and has an impact on the power generating cost.

6-14
8) Quality control of lubricating oil Have lubricating oil suppliers submit constituent tables and performance tables with every lot purchased, and make sure that values satisfy the standards prescribed by the engine makers. The PPUC currently takes samples of lubricating oil every 1,000 hours and sends them to the oil supply company for analysis. This is an extremely effective method for managing lubricating oil. However, since the results of analysis take around one month to be known, it is important to forecast future conditions of lubricating oil based on changes in past analysis results. Since fuel oil and cooling water sometimes get mixed in with lubricating oil, the lubricating oil should also be visually inspected during the sampling every 1,000 hours. As a rough guide, lubricating oil should be entirely replaced every 8,000 hours if the lubricating oil cleaner is working properly and every 3,000 hours if it is not working. The normal functioning of lubricating oil cleaners limits the consumption rate of oil and leads to improvement in operating cost. It is proposed that a simple viscometer be used to measure viscosity and determine the degree of degradation of lubricating oil. Aimeliik Power Station invites an instructor from the oil maker Shell to conduct OJT about lubricating oil for employees since this is included in its fuel oil procurement contract. Since such education enhances the technical capability and skills of the PPUC personnel, it is earnestly hoped that this training will be continued in future.
9) Quality control of cooling water Cooling water systems for power generating equipment in Palau are the circulatory type using radiators and city water. Generally it is required that radiator circulation water has hardness of no more than 40 ppm. If water is too hard, extended operation leads to precipitation of CaCO3 inside radiator tubes and this impedes the flow of water, leading to deterioration in the thermal efficiency of radiators, increase in the temperature of cooling water and lubricating oil during operation, and decline in the peak output of engine generators. Hardness management of cooling water is one of the important items in the maintenance inspections of engine generators. Quality control of cooling water is outlined as follows. First, analyze the raw water to roughly understand its current hardness and state. Second, compile measures for reducing hardness. Third, continuously implement hardness management. Water softeners are installed with Mitsubishi Units 12 and 13 at Malakal Power Station, however, since there are no control records, it is guessed that management is not carried out. It is necessary to measure and record hardness everyday using a portable hardness testing

6-15
instrument. Record the amount and date of resin cartridge backwashing agent (salt), forecast the next injection date and conduct planned maintenance.
10) Request for dispatch of maintenance instructors (SV) from equipment makers during overhauls The PPUC currently implements overhauls by itself since SV dispatch costs from makers are too expensive. However, as may be gathered from rehabilitation case studies at Ameliik Power station, because the wear and tear of major parts has been left neglected for extended periods, it had become necessary to implement large-scale repairs by the time problems were discovered by external engineers, and the PPUC incurred massive costs (in terms of both finance and repair time) as a result. Accordingly, it is considered necessary to request the dispatch of SVs from equipment makers when conducting overhauls and to periodically assess the integrity of equipment from an expert point of view.
11) Maintenance budget A maintenance budget was appropriated from 2004 to 2008, however, in reality this wasn’t used, the reasons being the shortage of funds within the PPUC, inflation of fuel costs, long-term stoppages due to major breakdowns of generating equipment, and continued operation due to the pressing demand for power. In order to establish the appropriate maintenance setup, the annual maintenance budget should continue to be appropriated from now on. Since the cost of maintenance is generally 2.0 cents/kWh and total electric energy in fiscal 2009 is forecast as 113,350 GWh, it will be necessary to raise a maintenance budget of approximately US$ 2.27 million for fiscal 2009.
(3) Problems and Recommendations in the Power Generation Division 1) Assignment of a Planning Engineer
Assign a Planning Engineer (1) to be responsible for the following tasks in Ameliik and Malakal Power Stations. i) Formulation of periodic inspection plans for the power stations ii) Formulation of annual budgets for operation and maintenance iii) Control and procurement of the spare parts and expendables required for periodic
inspections and everyday maintenance iv) Generator performance management (output and thermal efficiency) v) Fuel consumption management and fuel ordering vi) Control of operating records and inspection and maintenance records All the above tasks are currently handled by the mechanical engineer, however, it is necessary to carry out transfer of technology in order to enable the Palau personnel to conduct planned maintenance and performance management, etc. of generating equipment by themselves. For this reason, a planning engineer shall be assigned to work

6-16
full-time on the above tasks.
2) Recruitment of a System Planning Manager to Manage Long-Term Demand Forecasting and Power Development Plans Currently, external consultants are depended on to compile long-term power development plans, etc., however, in order to rapidly respond to changes in the environment surrounding the electric power utility, it is necessary to train PPUC personnel to independently compile long-term plans and financing plans. Through planning and promoting systematic power source plans and securing appropriate reserve supply capacity, it will become possible to periodically stop generating equipment and conduct planned maintenance (preventive maintenance), thereby contributing to smoother power supply.
6.2 Operational Improvement of Transmission and Distribution Equipment 6.2.1 Current Operation and Maintenance Conditions of Transmission and Distribution
Equipment (1) Organizational Setup The transmission/distribution and transforming branch of PPUC is composed of the System Control Department and Power Distribution Department, and the composition and mandates of each department are as indicated below. 1) System Control Department
The System Control Department, which comprises seven members led by the manager, mainly conducts equipment maintenance planning, equipment data and breakdown data management, site survey of power receiving applications, works planning, testing and management of watt meters and so forth. The department headquarters is located in the offices of Malakal Power Station.
Fig. 6.2.1-1 Organization Chart of the System Control Department 2) Power Distribution Department
The Power Distribution Department, which comprises 22 members led by the manager, is responsible for conducting all maintenance and works on the PPUC transmission, distribution and transforming facilities. The department headquarters is located in the offices of Malakal Power Station.
Manager (1)
Planning & Scheduling (1) Survey (2) GIS (1) Metering (2)

6-17
The department has two work teams (each comprising 1 supervisor, 4 workers, and 1 heavy equipment operator) that implement transmission and distribution line works such as pole installations, etc. In addition, there is one tree trimming crew (1 supervisor and 3 workers). The Power Distribution Department materials store is located in the grounds of Malakal Power Station, and two members work on managing and replenishing spare parts here.
Fig. 6.2.1-2 Organization Chart of the Power Distribution Department (2) Legislation and Standards Palau does not have any original legislation or standards pertaining to electric power, however, in light of its historical links with the United States, the American electricity technical standard NESC is applied and separation distances under lines are adhered to in order to secure public safety. Moreover, linemen (operators who work on transmission and distribution line operations) attend Pacific Lineman Training courses hosted by the United States, and American rules are incorporated regarding technology and skills. PPUC enacted the Electrical Service Regulations stipulating its power supply rules on March 30, 1995, and it operates the utility based on these. According to these, power supply voltage is managed according to the C84.1 Standard of the American National Standards Institute (ANSI). Concerning work safety too, a safety manual was enacted on July 11, 1995 to provide internal rules. (3) Operation of the Power System SCADA was introduced in 2003 and the monitoring and control of the power system can be carried out from both Aimeliik Power Station and Malakal Power Station. However, since Aimeliik Power Station has experienced trouble with communication lines and department managers are based at Malakal Power Station, actual control work is almost all carried out at Malakal Power Station. The SCADA monitors are installed in the power station control rooms,
*Now vacant
Manager (1)
Asst. Manager (1)
Office Clerk (1) Project Scheduler (1)
HE : Heavy Equipment
Warehouse Crew (2)
Line Worker Supervisor (1)
Line Worker Supervisor (1)*
Line Worker Supervisor (1)
Tree Trimmer Supervisor (1)
Line Worker Crew (4)
HE Operator (1)
Line Worker Crew (2)*
HE Operator (1)*
Line Worker Crew (4)
HE Operator (1)
Tree Trimmers (3)

6-18
and plant operators also conduct system operation. Concerning generators, only a minor amount of information can be monitored from SCADA, while control cannot be exercised. When alarms are raised in SCADA, operators simply notify the Power Distribution Department or System Control Department, but they do not implement any autonomous recovery operations. (4) Voltage Management and Load Management of Distribution Lines The transformers (13.8kV/240V/120V) mounted on distribution line poles have taps for switching the voltage ratio over five stages, however, voltage management is not carried out to an adequate extent because voltage adjustment using these is not even carried out in areas where voltage drop is a problem. Moreover, transformers with far larger capacity than power demand (load) can be seen in numerous cases. (5) Daily and Periodic Inspections Inspections and maintenance of transmission and distribution equipment are conducted according to the System Preventive Maintenance Schedule from January 2008 (see Fig. 6.2.1-3, O&M Manual Annex 2-1). This System Preventive Maintenance Schedule was compiled by the System Control Department and approved by the General Manager (GM) on December 5, 2007, and inspections of all transmission and distribution lines and transformer substations are carried out according to it. Moreover, the same check sheet is used from the confirmation through to the resolution of troubles.
Fig. 6.2.1-3 Composition of the System Preventive Maintenance Schedule There are 10 items on the check sheet concerning transmission and distribution equipment and these include proximity to trees, supports, state of insulators and so on. Inspections are implemented by a minimum of three linemen who belong to the Power Distribution Department. The linemen usually travel by car when making inspections, however, they also conduct foot patrols and inspections around once every one or two months. Transformer equipment inspections are conducted under the responsibility of the Power Distribution Department, however, assistance is provided by two members from the Power Generation Department (Implementation Plan 3.0), while measurement engineers from the System Control Department implement watt meter operations (Implementation Plan 4.0). The check sheet used in inspections is not the one from the System Preventive Maintenance Schedule but the previous one (see the O&M Manual Annex 2-2), which is slightly different. The results of inspections are shared among members in meetings of the Power Distribution
Implementation Plan 1.0) - 5.0)
Preventive Maintenance Schedule
Maintenance Check Sheet
System Preventive Maintenance Schedule

6-19
Department, and the manager enters the contents in the said check sheet. When abnormalities are discovered, the Power Distribution Department manager compiles a repair plan (need for outages, preparation of materials, work plan, etc.) and reports to the GM. Moreover, the Power Distribution Department manager reports on operating performance to the GM once every month. The results of inspection work are directly submitted from each department to the GM. Moreover, thoughts and improvement proposals from the System Control Department are reported to the GM every week. Concerning tree trimming, a schedule for implementing this over all Babeldaob Island is prepared separately from the System Preventive Maintenance Schedule every six months (the same thing is scheduled for Koror Island too), and the work is conducted by four tree trimmers. The scope of tree trimming underneath transmission lines is prescribed as a width of 50 feet (approximately 15 m). (6) Spare Parts Spare parts are stored according to different item headings in the materials store of the Power Distribution Department, and a store manager prepares and manages a list of items in stock. Shelves are numbered according to the items they carry, and the same numbers are entered on the list to make management easier. Stored quantities are determined according to past frequency of use, and the store is managed so as to maintain the said quantities. (7) Troubleshooting Whenever accidents occur, the manager of the Power Distribution Department receives notification either from the customer center that is contacted by the consumer or by the power station operator that takes the SCADA alarm; procedures (power outage, preparation of materials, compilation of work plan) are taken by the Power Distribution Department Manager and System Control Department Manager, and the restoration work is implemented. (8) Utilization of Manuals The linemen use the texts provided in Pacific Lineman Training as their working manuals. Plenty of written materials such as the user manuals provided by equipment suppliers and maintenance manuals proposed by the consultants are available, however, these are not adequately utilized.

6-20
Table 6.2.1-1 Main Manuals Owned by the PPUC Name Source, Year Issued Major Contents
Operation and Maintenance Guide for Babelthaup Electric Power Transmission Line System
EPDC, 1986
Frequency, contents and check list of patrol inspection, and methods of standard work implementation
Maintenance and Test Manual Electric Power System, 1999
Transformer equipment inspection procedure
Operation and Maintenance Manual
Marubeni Power System, 1999
User information from the installed equipment maker, and general contents on patrol inspections
PUC Safety Manual PPUC, 1995
All cautionary items concerning work safety
Electrical Essentials for Powerline Workers
THOMSON, 2004 , etc.
The text used in Pacific Lineman Training, this covers from the basics of electricity to electrical equipment. All linemen have a copy.
Safety Manual For Electric Utility American Public Power Association, 1999
This states cautionary points concerning clothing, work and training, etc. Only a few linemen possess a copy, but it is used as a written procedure.
(9) Human Resources Training and Owned Technology and Skills The PPUC autonomously builds concrete poles and it possesses ample capability in this area. So far it has not experienced any injurious accidents in the course of this work. All linemen have attended Pacific Lineman Training (held by the U.S. Department of Interior, comprising one year of training followed by a completion examination) and they possess expert know-how. 6.2.2 Recommendations concerning Operational Improvement of Transmission and
Distribution Equipment (1) Power System Operation When troubles occur in the power system, the system operators need to promptly implement primary treatment. For example, it is necessary to confirm whether problems are ongoing through conducting test charging or to limit the scope of power outage through switching systems. Operators also need to analyze and assess operating records in order to secure power quality, and this work requires a high level of technology and skill. SCADA does not automatically operate power systems; rather its function is to assist operators in rapidly collecting accurate information and definitely transmitting control commands. Concentrating monitoring and control functions in preparation for the expansion of power systems, i.e. installing control posts, is a rational measure for advertising personnel increases. However, power station operators really do not possess the capacity to operate power systems. Currently, due to problems on the equipment side (SCADA, power equipment), the amount of work that can be implemented is limited, and it is necessary to overcome this problem first. Moreover, since power system operating technology is not something that can be easily acquired, it is recommended that specialist operators for power systems be recruited and trained on a planned basis in readiness for the future rehabilitation of equipment and installation of control posts. Concerning training, since opportunities for training and plant observation are
6-21
limited in Palau, it is more effective to take part in overseas training courses and equipment observation. (2) Distribution Line Voltage Control and Load Control When complaints arise over voltage drop, it is necessary to definitely conduct voltage measurement and confirmation of the transformer tap position onsite. It is preferable to confirm voltage during the peak period when voltage drop is at its largest, however, since there are occasions when short-term voltage drop becomes problematic due to load characteristics, it is recommended that an oscilloscope which is capable of continuously measuring voltage be installed. Since the oscilloscope can simultaneously measure and record voltage, current, frequency and power factor, etc., it can also be utilized for measuring the load power factor of consumers. The PPUC supply voltage is set according to ANSI C84.1, so if rated voltage is 240 V, supply voltage must be maintained at between 228~252 V. Since it is the duty of the PPUC to supply electricity at appropriate voltage and voltage control is an important aspect of its work, it is recommended that the existing GIS be used to control the installation locations of transformers, tap locations and voltage measurement results as indicated in Table 6.2.2-1. Moreover, since the loss factor increases when transformers are used at low load, it is necessary to install transformers that have variable capacity according to load. In future it is desirable that transformers commensurate to the power demand (load) be installed and planned as an efficient equipment configuration.
Table 6.2.2-1 Example of a Power Control Sheet Managed by GIS Voltage Measurement
Results Transformer installation
site
Transformer capacity
Maker and Model Tap Position
Measurement Date
Measured Value
○○ ○○ ○○ ○○ ○○ ○○ ○○ ○○ ○○ ○○ ○○ ○○
(3) Daily and Periodic Maintenance In the System Preventive Maintenance Schedule, the lineman is supposed to patrol all power transmission, distribution and transformer facilities in a month, however, in cases where troubles are discovered in the patrols, since it takes time to conduct repairs, subsequent patrol work is delayed. Concerning power transmission and distribution, rather than confirming all items of equipment in a short span such as a month, it is more efficient to separate inspection items into those requiring monthly inspection (caution points close to trees and so on) and those requiring inspection every two or three months (external appearance of equipment, etc.). By doing this, it would be possible to handle the necessary work based on the existing lineman staff (13 linemen). In addition to inspecting equipment, recording and archiving the results and gauging the condition of equipment, linemen should conduct the cleaning of insulators and utilize records as data for the compilation of equipment rehabilitation plans. Moreover, although transmission

6-22
equipment is only 23 years old and is not in need of immediate replacement, it will be necessary to gauge changes in the condition of equipment through regular patrols and inspections when it comes to planning future countermeasures against deterioration. In order to facilitate the future maintenance of transmission and distribution lines, each line should be given a name (for example, the Aimeliik-Koror line, etc.). Furthermore, since the numbers written on supports have been erased due to exposure to rain and so on, it is necessary to clearly remark them. Concerning patrol records and inspection records too, through prescribing line names and numbers, it will become easier to gauge the state of each piece of equipment and to compile upgrading plans. Through clarifying such items, it will become effective to utilize the patrol check sheets and tree trimming survey sheets that are indicated in Fig. 6.2.2-1 and 6.2.2-2, and control work will become much easier if these are used together with the check lists under the System Preventive Maintenance Schedule. Concerning transformer equipment, periodic inspections basically consist of external appearance inspections. When abnormalities are discovered in these, power outages and repairs are scheduled. Accordingly, internal inspections are not implemented so long as the external appearance of equipment is good, and internal problems are left unattended until a breakdown occurs. Due to the configuration of systems, it is not so easy to conduct power outages because they impede the supply of power, however, considering that equipment breakages lead to even longer power outages and higher repair costs, it is desirable that the internal inspections (usually conducted every few years) recommended by equipment makers are carried out in major transformer substations. Moreover, although the values obtained in inspections are used to determine equipment status, no examination is carried out regarding changes following previous inspections. For the purpose of preventive maintenance, it is necessary to spot signs of trouble as early as possible, so it is recommended that control of trends be introduced with respect to the gas pressure of gas circuit breakers and the oil level of transformers. Moreover, concerning transformers, it is recommended that sampling analysis of insulation oil be periodically implemented. As an example of trend control, the Study Team offered and explained a GCB gas pressure record sheet (see Fig. 6.2.2-3).
Table 6.2.2-2 List of Forms Prepared by the JICA Study Team Name of Form Outline
Patrol check sheet Contains check points for transmission and distribution line patrols Tree trimming survey sheet Record form for use in tree trimming surveys GCB gas pressure record sheet Gas pressure record form for use in substation patrols
(4) Spare Parts The spare parts list does not include the date of purchase or maker guarantee period of parts, however, these items need to be recorded for the sake of quality control. In particular, since electroscopes, grounding tools and insulation instruments such as measuring poles carry a risk of electric shock if insulation performance declines, it is absolutely necessary to conduct periodic inspections on them.

6-23
Made by JICA STUDY TEAM 2008.05Transmission & Distribution
1 line & substation Vegetation・Offset distance from line to vegetation defined by NESC
2 Clean,check & inspect pole, line insulators(All pole)・Lack , broken ,less-visible of pole number plate・Digging or lay earth the ground around the bordering of pole and ground・Ground loose At the bordering of pole and ground・Damage of the car crash,etc・Pole leaning(Concrete pole)・Crack of concrete・Weathering of concrete surface(Wooden pole)・Remarkable damage of body and head part・Remarkable corrosion at the bordering of pole and ground(Steel pole)・Rust , a strangely shaped part・Corrosion at the bordering of pole and ground(Insulator)・Damage,crack of porcelain part・Dirt of porcelain part
3 Clean & Inspect line cable terminal & conditions(Conductor)・Offset distance defined by NESC・Unevenness sag , too large sag・Disconnecting , looseness of bindings・Contact of bindings to the live part・Sticking of flying object(a branch ,etc) on the conductor・Contact and approching of fallen tree and fying objects to the conductor(Rising part of cable)・A strangely shaped part of rising cable・Damage of cable sheath・Location installed supporting band
4 Check pole accessories,aligment & conditons(Gay wire)・Vine・Damage, remarkable rust,corrosion・Anything unusal at the bordering of pole and ground・Looseness・Approach to the live part
5 Check & clean fuse cut outs ,pole arresters & its terminals(Arrester)・Looseness of the earth side and the line side・Crack , damage ,dirt of porcelain・Mark of follow current
6 Check recloser & its terminal connections・Damage, remarkable rust,corrosion
7 Check system grounding cable its accessories & terminations・Damage, remarkable rust,corrosion
8 Check substation transformer physical conditions,oil leaks ,cable & insulator terminals
9 Check pole mounted distribution transformers physical conditions ,fuse cut outs , oil leaks & cable termination terminals .
(transformer body)・Unususal sound・Leaning of body・Abnormal temparature・Flaking of painting・Remarkable rack of case・Oil leaks from any parts・Mark of arc on the case(Bushing)・Damage,crack of porcelain part・Remarkable dirt
10 Check customer service drop wires from pole to meter・Offset distance from line to other object defined by NESC
SCOPE OF WORK POINT
Fig. 6.2.2-1 Patrol Check Sheet

6-24
Fig. 6.2.2-2 Trimming Check Sheet
Made by JICA STUDY TEAM 2008.0
Investigation for Trimming
Line Name Section Location Pole or Span date
Tree's Owner Adress Tel
Necessary trimming area Record of negotiation with Owner
Clearance from wire to tree
Degree
Horizontal
Vertical
Kind of Tree
№ №

6-25
date temperature (degree Celsius) ( readings) (@30 degree)
SF6 gas pressure record
gas pressure
Made by JICA STUDY TEAM 2008.05
4.0
4.5
5.0
5.5
6.0
6.5
20 25 30 35 40
Ratedgas pressure
Feed alarm
Lock(degree)
(kg/cm2)
Fig. 6.2.2-3 Check Sheet for Gas Pressure of GCB

6-26
(5) Troubleshooting It is important to prevent troubles from occurring in advance through investigating the cause of accidents and examining and executing reoccurrence prevention measures. It would be effective to add a column for entering reoccurrence prevention measures to the accident reports that are prepared by the PPUC. (6) Improvement in Equipment Maintenance Capacity The System Preventive Maintenance Schedule was prepared based upon analysis of current equipment and organizational capacity levels by the manager of the System Control Department who possesses ample experience of working in overseas power companies. The System Preventive Maintenance Schedule has only just gone into use in the PPUC. For the immediate future, it is deemed appropriate to implement continuous maintenance work based on the System Preventive Maintenance Schedule and, when the need arises, to carry out review of it upon referring to existing manuals. A section on patrols and inspections has been extracted from an existing manual considered to be the most useful one at present, and this has been attached for reference (see Annex 2-3 of the O&M Manual). (7) Training and Securing of Human Resources Since Palau does not have many education agencies that can offer expert technology, it is difficult to secure engineers who possess the necessary technology and skills. Recruiting foreign engineers is a short-term solution, however, it is necessary for the PPUC to internally train local engineers who can support the company in the long term. In order to continue to secure highly capable Palauan personnel in the future, it is desirable to offer scholarships geared to giving promising human resources the opportunity to acquire expert education overseas. 1) Power Transmission, Distribution and Substation
The PPUC directly conducts all work regarding installation of concrete poles and overhead lines and it possesses ample experience and capacity of actual work. Equipment rehabilitation plans are largely compiled by the System Control Department. However, it is necessary to develop human resources who are able to compile rehabilitation plans from patrol and inspection records within the Power Distribution Department which actually controls the equipment. In this Master Plan, it is scheduled for the power system to undergo major changes in 2013 with the new installation of substations and transmission lines, etc. The Power Distribution Department does not currently possess any power transformation engineers, however, it is necessary for this department to compile transformation equipment inspection schedules and to conduct degradation trend control. Accordingly, it is necessary to immediately assign at least one power transformation engineer to compile the inspection schedule and conduct guidance for the other personnel.

6-27
2) Power System Operation Since there are no SCADA or Communications Department engineers, it is difficult to implement maintenance or expansion of power systems. In the current situation, since there is a risk that appropriate systems cannot be constructed even if SCADA is replaced, it is recommended that engineers be assigned. The PPUC has plans to carry out the large-scale revision of equipment as well as the installation of control posts for performing the integrated monitoring and control of equipment in 2013. Since it is necessary to have the correct understanding of operating work and to conduct the planned training of operators, it is necessary to assign at least four control post operators in 2011 and to train them in operation methods utilizing the existing SCADA so that they can be rapidly deployed to the control posts. Control post operators require work capability covering such wide-ranging areas as system operation, voltage adjustment, frequency control and trouble recovery, etc. and they also need to possess broad electrical know-how concerning equipment functions, power system protection methods, the relationship between reactive power and voltage and so on. However, since the PPUC has so far placed little need on power systems, it does not possess personnel who can be assigned to control posts at present. As was mentioned previously, overseas training and observation of control posts in foreign countries are effective means of conducting initial operator training, however, it is also necessary to compile troubleshooting guidelines within the PPUC in advance and to effect improvements in terms of organization and human resources too. Accordingly, training by experienced personnel based on OJT is desirable. If installation of electric power equipment is not accompanied by higher operating capacity, not only will it be impossible to conduct the efficient operation of power equipment, but also there will be risk of disasters affecting the public. Therefore, this is an extremely important issue for the PPUC and it will need to implement planned training from two or three years before the commissioning of control posts. Possible approaches towards achieving this would be to implement a human resources training project (for example, a technical cooperation project of the type implemented by international donors) or to receive experts.

6-28
6.2.3 SCADA Improvement Plan The present SCADA is faced with the following problems: - Some devices are incomplete (monitors, generator information, etc.) - Operating records cannot be downloaded. - Passwords necessary for changing equipment settings have not been conferred. - Display and control of instruments installed following the commissioning of SCADA
have not been incorporated. It should be noted that the current supplier handed over an incomplete SCADA to the PPUC and that the current problems could have been avoided if the PPUC had sufficient technical capability. Moreover, since upgrading in line with equipment installations and revisions needs to be carried out irrespective of what SCAD maker is adopted, it is necessary to select a supplier that can provide follow-up services into the long term. The following three scenarios can be considered as the future SCADA expansion plan:
1) Bind a contract with the existing SCADA supplier covering the repair of problems and
incorporation of newly added instruments. 2) In addition to binding a contract with the existing SCADA supplier covering the repair of
problems and incorporation of newly added instruments, purchase the necessary information (passwords and maintenance tools) required to lower the level of dependence on the supplier.
3) Abandon upgrading by the existing supplier, and carry out full-scale renewal.
In order for the PPUC to appropriately implement maintenance and renewal work in future, as was proposed in the section of developing operation personnel, it is recommended that SCADA engineers are assigned to train human resources with a view to realizing option 2) above. In the event where the existing supplier rejects such a contract or the work doesn’t go according to schedule, it will be necessary to select option 3), however, even in this case, it will be necessary to recruit SCADA engineers, training operators and make other advance preparations on the PPUC side.

7. CONCLUSIONS AND RECOMMENDATIONS

7-1
7. Conclusions and Recommendations 7.1 Power Station Construction Plans and Transmission, Distribution and Substation
Expansion Plans The Study Team recommends the Republic of Palau to implement the following projects as the power development plan of Koror-Babeldaob power system from year 2010 to 2025. The Team also recommends Palau to utilize heavy fuel oil as fuel for the new Aimeliik Power Station.
Table 7.1-1 Power Station Construction Plans Estimated Cost (million USD) FY Project Title Outline HFO Firing Diesel Oil firing
2013 Replacement of Aimeliik Power Station (Phase 1)
• Procurement of two diesel generators (5 MW class) and auxiliary machinery
• Remodelling of the fuel storage and supply facilities (in the case of heavy oil firing)
• Construction of the power house (including those for the two generators in Phase 2) and an office building
25.73 19.38
2014 Replacement of Aimeliik Power Station (Phase 2)
• Procurement of two diesel generators (5 MW class) and auxiliary machinery
12.22 11.73
2019 Replacement of Aimeliik Power Station (Phase 3)
• Procurement of two diesel generators (5 MW class) and auxiliary machinery
• Construction of additional power house (for the two new generators in Phase 3)
14.13 13.64
Total 52.08 44.75[Remarks] Priority Projects
Table 7.1-2 Transmission, Distribution and Substation Expansion Plans FY Project Outline Estimated Cost
(Million USD)
2008 Relocation of transmission and distribution lines Relocating parts of transmission and distribution lines along the Compact road PPUC Planned
2008 Extension of distribution lines to unelectrified areas Parts of Ngiwal and Airai States PPUC Planned2008 Capacitor installation in distribution lines 13.8kV, Total 4.4MVA PPUC Planned
2009 SCADA improvement Completion of repair by EPS and adding data store function PPUC Planned
2010 Auto-Recloser installation in Babeldaob 13.8kV, 6 places (Aimeliik 1, Aimeliik 2, Nekken, Ibobang, Ngaraad 1, Ngaraad 2) PPUC Planned
2012 Installation of a capacitor at the Malakal Power Station 34.5 kV; 3 MVA 0.3
Construction of the Koror Substation 34.5 kV; 15 MVA; three transmission circuits; 3 MVA capacitor 3.0
Construction of the new Aimeliik-Koror transmission line
34.5 kV; 19.3 km; AAC 150 mm2 2.7
Construction of the new Nekken-Kokusai transmission line
34.5 kV; 3.1 km; AAC 150 mm2 0.3
Improvement of the distribution grid in Koror State Improvement of the distribution grid following the construction of the new Koror Substation 0.2
2013
Construction of the new Aimeliik Substation 34.5 kV; 15 MVA x 1 new transformer; relocation of two existing transformers; three transmission circuits 4.2
2013 Control Center and transmission line improvement in Northern area
Upgrading SCADA, Equipment for Control Center, 34.5 kV Auto-Reclosers in three places (Kokusai, Asahi and Ngerdmau)
0.5
2014- 2019

7-2
FY Project Outline Estimated Cost (Million USD)
2020 -
2024
Rebuilding of the Airai Substation (to be conducted in correspondence with the situation of equipment deterioration)
34.5 kV; 15 MVA; three transmission circuits 2.5
Construction of the new Airai-Melekeok transmission line
34.5 kV; 24.5 km; AAC 150 mm2 2.5
Construction of the new Melekeok Substation 34.5 kV; 10 MVA; three transmission circuits 2.3 Increase of the voltage of the Kokusai-Melekeok distribution line
13.8 kV → 34.5 kV; 10.5 km 0.2 2025
Replacement of a transformer at the new Aimeliik Substation
34.5 kV; 10 MVA (one unit) → 15 MVA (one unit) 1.2
Total 19.9 [Remarks] Priority Projects Financial internal rate of return will be affected by electricity tariff rate and fuel price. The following table shows the sensitivity analysis results of FIRR on priority projects in case of HFO usage. Table 7.1-3 Sensitivity analysis results of FIRR with the variation of fuel price and electricity tariff rate
Overall electricity rate 0% Case 10% case 20% case 30% case 40% case 50% case
US$0.35/kWh 13.75% 9.93% 5.90% 1.53% minus minus
US$0.39/kWh 20.11% 16.61% 12.98% 9.21% 5.21% 0.89%
US$0.43/kWh 25.96% 22.67% 19.29% 15.82% 12.24% 8.50%
Too good Appropriate Not viable Source: JICA Study Team’s analysis
7.2 Renewable Energy Introduction Plan 7.2.1 Photovoltaic Power Generation It is recommended to install additional photovoltaic power generation equipment with capacity of 100 to 200 kWp by 2025. Concerning the specific approach, photovoltaic cells will be installed on the rooftops of government office buildings and connected to the PPUC power grid. 7.2.2 Hydropower Generation Hydropower generation system with capacity of 200kW which utilizes overflow water from a planned water reservoir to be constructed under ADB’s assistance should be incorporated into the public water supply plan. 7.2.3 Solar Thermal Energy Utilization Introduction and dissemination of solar water heaters should be promoted. The dissemination promotion efforts such as the establishment of new housing loans which have a clause requiring the installation of a solar water heater, the establishment of a fund for promoting the introduction of solar water heaters as described in the Energy Efficiency Action Plan, etc. should be expanded by the government of Palau in addition to the aggressive advertisement on an electricity bill saving effect by a solar water heater.

7-3
7.3 Improvement Plans for PPUC’s Business Management The following electricity tariff revisions are strongly recommended by the Study Team in order to improve PPUC’s business management. (1) Short Term Measures (2009-2013)
1st Option: Electricity tariff shall be revised in FY 2009
Table7.3-1 New Electric Tariff Rate to be proposed for the Target Year FY 2009 (Case 1: Even Imposing Option)
Unit: US$
Charge item Residential Commercial/ Government
Monthly Minimum Energy Charge 3 10 0-500 kWh 0.08 0.10 501-2,000kWh 0.10 0.10 Cost per kWh 2,001kWh above 0.12 0.12
AFPAC Oct. 2008-Sep.2009 0.31 0.31 Note: AFPAC (Automatic Fuel Price Adjustment Clause)
Source: Calculated by JICA Study Team
Table 7.3-2 New Electric Tariff Rate to be proposed for the Target Year FY 2009 (Case 2: Residential Customer Preferential Option)
Unit: US$
Charge item Residential Commercial/ Government
Monthly Minimum Energy Charge 3 10 0-500 kWh 0.08 0.10 501-2,000kWh 0.10 0.10 Cost per kWh 2,001kWh above 0.12 0.12
AFPAC Oct. 2008-Sep.2009 0.26 0.33 Note: AFPAC (Automatic Fuel Price Adjustment Clause)
Source: Calculated by JICA Study Team
2nd Option: It shall take two years to catch up and make both ends meet (FY2009-2010)
Alternative Option 2 2-Year Step Up Option Table: Proposed Electric Tariff Schedule of PPUC Table: Proposed Electric Tariff Schedule of PPUC
(1st Year: FY2009) (2nd Year: FY2010)
Residential Commercial/Government
Residentia
Commercial/Government
3 10 3 10
0-500 Kwh 0.08 0.10 0-500 Kwh 0.08 0.10501-2000 Kwh 0.10 0.10 501-2000 Kwh 0.10 0.102001aboveKwh 0.12 0.12 2001aboveKwh 0.12 0.12
0.21 0.24 0.26 0.33
Unit: US$
Charge item
Monthly Minimum Energy ChargeCoste per Kwh
AFPAC Oct. 2009-Sept. 2010
Unit: US$
AFPAC Oct. 2008-Sept. 2009
Coste per KwhMonthly Minimum Energy Charge
Charge item

7-4
3rd Option: It shall take three years to catch up and make both ends meet (FY2009-2011)
Alternative Option 3 3-Year Step Up Option Table: Proposed Electric Tariff Schedule of PPUC Table: Proposed Electric Tariff Schedule of PPUC
(1st Year: FY2009) (2nd Year: FY2010)
Residential Commercial/Government
ResidentiaCommercial/Government
3 10 3 10
0-500 Kwh 0.08 0.10 0-500 Kwh 0.08 0.10501-2000 Kwh 0.10 0.10 501-2000 Kwh 0.10 0.102001aboveKwh 0.12 0.12 2001aboveKwh 0.12 0.12
0.2 0.23 0.23 0.28
Table: Proposed Electric Tariff Schedule of PPUC(3rd Year: FY2011)
Residential Commercial/Government
3 10
0-500 Kwh 0.08 0.10501-2000 Kwh 0.10 0.102001aboveKwh 0.12 0.12
0.26 0.33
Cost per Kwh
AFPAC Oct. 2010-Sept. 2011
Unit: US$
Charge item
Monthly Minimum Energy Charge
Unit: US$
AFPAC Oct. 2008-Sept. 2009
Cost per KwhMonthly Minimum Energy Charge
Charge item
AFPAC Oct. 2009-Sept. 2010
Unit: US$
Charge item
Monthly Minimum Energy ChargeCost per Kwh
(2) Long Term Measures (FY2013~:After the commencement of operation at new
Aimeliik Power Station)
1) Case of Diesel Oil utilization at new Aimeliik Power Station
Sub-case1: Fuel cost will be the same level as current (Diesel: US$ 3.6/gallon) Basically, PPUC shall charge US$0.41/kWh: Overall electricity rate shall rise by 2 cents from US$39/kWh.
Sub-case2: Fuel cost 20% up from now PPUC will have to raise overall rate of electricity tariff up to US$ 0.47/kWh.
Sub-case3: Fuel cost 30% up from now PPUC will have to raise overall rate of electricity tariff up to US$ 0.51/kWh.
Sub-case4: Fuel cost 40% up from now PPUC will have to raise overall rate of electricity tariff up to US$ 0.57/kWh.
2) Case of Heavy Fuel Oil utilization at new Aimeliik Power Station
Sub-case 1: Fuel cost will be the same level as current Due to the benefit of big fuel cost reduction, PPUC can afford to make reduction of electricity tariff with the big margin to be generated. Overall electricity rate shall fall down to the level of probably around US$ 0.33/kWh from US$0.39/kWh..
Sub-case2: Fuel cost 20% up from now Still, PPUC will not have to raise overall rate of electricity tariff. The rate shall stay on almost the same level, and get down to US$0.38/kWh by only 1 cent.
Sub-case3: Fuel cost 30% up from now PPUC will still not have to raise overall rate of electricity tariff so largely: only 1

7-5
cent up to US$ 0.40/kWh. Sub-case4: Fuel cost 40% up from now PPUC will have to raise overall rate of electricity tariff , but only 3 cents up to US$ 0.42/kWh.
Sub-case5: Fuel cost 50% up from now PPUC will have to raise overall rate of electricity tariff up to US$0.44/kWh by 5 cents.
(3) The new actions currently taken by PPUC promptly response to the revision
direction proposed by JICA Study Team On June 5, 2008, the prompt effort has resulted in the passage of the bill to revise PPUC’s electricity tariff. The PPUC’s immediate action in response to the recommendations to solve the raised problems is highly appreciated. The content is as follows:
Commercial customers and Governments Comprehensively the title charge shall be US$ 0.425/kWh The basic rate shall be US$11
Residential customers By the range of electricity consumption rage, the title charge shall be:
0~500 kWh : US$0.30/kWh 500~2000kWh: US$0.38/kWh More than 2000kWh: US$0.425/kWh
The basic rate shall be US$3 7.4 Recommendations for Operational Improvement of Power Supply Facilities 7.4.1 Power Generation Facilities (1) Recommendations to Improve Daily Operation ① Formulation of the start and stop procedure for power generating equipment ② Calibration, maintenance and replacement of instruments ③ Analysis, assessment, countermeasures and reporting of operating records (log sheet)
and incident records ④ Preparation and reporting of breakdown report statistics
(2) Recommendations to Improve Periodical Maintenance ① Formulation and implementation of short-term and long-term plans for maintenance
inspections of engine generators ② Procurement and storage of emergency spare parts for engine generators ③ Procurement and storage of replacement parts for engine generators ④ Formulation and implementation of long-term and short-term plans for auxiliary
equipment maintenance inspections ⑤ Procurement and storage of emergency spare parts and replacement parts for
auxiliary equipment ⑥ Formulation and implementation of long-term and short-term plans for control panel

7-6
and circuit breaker panel, etc. maintenance inspections ⑦ Quality control of fuel oil ⑧ Quality control of lubricating oil ⑨ Quality control of cooling water ⑩ Request for dispatch of maintenance instructors (SV) from equipment makers during
overhauls ⑪ Securing enough maintenance budget
(3) Recommendations to the Organizational Structure of Power Generation Division ① Assignment of a Planning Engineer ② Recruitment of a System Planning Manager to Manage Long-Term Demand
Forecasting and Power Development Plans 7.4.2 Transmission, Distribution and Substation Equipment (1) Recommendations to Improve Power System Operation It is recommended that specialist operators for power systems be recruited and trained on a planned basis in readiness for the future rehabilitation of equipment and installation of control posts. (2) Recommendations to Improve Distribution Line Voltage Control and Load Control It is recommended that an oscilloscope which is capable of continuously measuring voltage be installed. It is also recommended that the existing GIS be used to control the installation locations of transformers, tap locations and voltage measurement results. (3) Recommendations to Improve Daily and Periodic Maintenance It is more efficient to separate inspection items into those requiring monthly inspection (caution points close to trees and so on) and those requiring inspection every two or three months (external appearance of equipment, etc.). Each line should be given a name (for example, the Aimeliik-Koror line, etc.). It is desirable that the internal inspections (usually conducted every few years) recommended by equipment makers are carried out in major transformer substations. It is recommended that control of trends be introduced with respect to the gas pressure of gas circuit breakers and the oil level of transformers. Moreover, concerning transformers, it is recommended that sampling analysis of insulation oil be periodically implemented. (4) Recommendations to Spare Parts and Maintenance Tools The spare parts list does not include the date of purchase or maker guarantee period of parts, however, these items need to be recorded for the sake of quality control. In particular, since electroscopes, grounding tools and insulation instruments such as measuring poles carry a risk of electric shock if insulation performance declines, it is absolutely necessary to conduct periodic inspections on them.

7-7
(5) Recommendations to Improve Troubleshooting It would be effective to add a column for entering reoccurrence prevention measures to the accident reports that are prepared by the PPUC. (6) Improvement in Equipment Maintenance Capacity For the immediate future, it is deemed appropriate to implement continuous maintenance work based on the System Preventive Maintenance Schedule and, when the need arises, to carry out review of it upon referring to existing manuals. (7) Training and Securing of Human Resources
1) Power Transmission, Distribution and Substation
It is necessary to immediately assign at least one substation engineer to compile the inspection schedule and conduct guidance for the other personnel.
2) Power System Operation
It is recommended that SCADA engineers be assigned. It is necessary to assign at least four control post operators in 2011 and to train them in operation methods utilizing the existing SCADA so that they can be rapidly deployed to the control posts.