
3D Face Recognition Evaluation on Expressive Faces Using the IV2 Database
12
3D Face Recognition Evaluation on Expressive Faces Using the IV 2 Database Joseph Colineau and Johan D’Hose 1 , Boulbaba Ben Amor 2 , Mohsen Ardabilian and Liming Chen 3 , Bernadette Dorizzi 4 1 Thales Research & Technology, Palaiseau, France 2 Telecom-Lille1, Lille, France 3 Ecole Centrale de Lyon, Lyon, France 4 Institut Telecom; T &M SudParis, Evry, France Abstract. The purpose of this paper is to study the influence of face expressions on the performance of a 3D face recognition algorithm. Three facial surface matching based algorithms, namely ICP, Localized ICP (L- ICP) and Region-based ICP (R-ICP), are benchmarked on several sets of data : the two first sets with neutral faces and the last with expressive ones. Results show that the R-ICP algorithm provides more robustness to face expression verification than the two other approaches. 1 Introduction Face recognition is an attractive biometrics as compared to other ones such as fingerprint or iris which require explicit cooperation from users. Unfortunately, as described in the Face Recognition Vendor Test Report [17], despite great strides achieved over the past few decades, face recognition technologies still face difficult challenges such as lighting conditions, pose variations, often leading to greater intra-class variation as compared to inter-class variation. In the last few years, 3D face recognition has emerged as a major research trend for its theoretical robustness to lighting condition and pose variations. However, one still needs to deal with intra-class variations related to facial expressions. There exists a number of 3D face recognition approaches proposed in the lit- erature, ranging from subspace-based solutions which propose to apply classical 2D methods for 3D face recognition by considering for instance range (depth) images [6] [7], to geometry feature-based techniques which propose to represent facial surfaces by certain geometrical features sets, such as the convex parts, ar- eas with high curvatures, saddle points, etc [8]. For face surface matching, ICP (Iterative Closest Point) [1] is mostly applied; this algorithm computes the resid- ual error between the probe surface and the 3D images in the gallery as proposed in [10] and [9]. Although such feature definitions are intuitively meaningful, the computation of curvatures involves numerical approximation of second deriva- tives, and thus is very susceptible to observation noise. All these approaches treat the face as a rigid object and do not perform well in the presence of expression variation. A good review and comparison studies of some of these techniques
-
Upload
independent -
Category
Documents
-
view
0 -
download
0
Transcript of 3D Face Recognition Evaluation on Expressive Faces Using the IV2 Database
3D Face Recognition Evaluationon Expressive Faces Using the IV 2 Database
Joseph Colineau and Johan D’Hose1, Boulbaba Ben Amor2, MohsenArdabilian and Liming Chen3, Bernadette Dorizzi4
1 Thales Research & Technology, Palaiseau, France2 Telecom-Lille1, Lille, France
3 Ecole Centrale de Lyon, Lyon, France4 Institut Telecom; T &M SudParis, Evry, France
Abstract. The purpose of this paper is to study the influence of faceexpressions on the performance of a 3D face recognition algorithm. Threefacial surface matching based algorithms, namely ICP, Localized ICP (L-ICP) and Region-based ICP (R-ICP), are benchmarked on several setsof data : the two first sets with neutral faces and the last with expressiveones. Results show that the R-ICP algorithm provides more robustnessto face expression verification than the two other approaches.
1 Introduction
Face recognition is an attractive biometrics as compared to other ones such asfingerprint or iris which require explicit cooperation from users. Unfortunately, asdescribed in the Face Recognition Vendor Test Report [17], despite great stridesachieved over the past few decades, face recognition technologies still face difficultchallenges such as lighting conditions, pose variations, often leading to greaterintra-class variation as compared to inter-class variation. In the last few years,3D face recognition has emerged as a major research trend for its theoreticalrobustness to lighting condition and pose variations. However, one still needs todeal with intra-class variations related to facial expressions.
There exists a number of 3D face recognition approaches proposed in the lit-erature, ranging from subspace-based solutions which propose to apply classical2D methods for 3D face recognition by considering for instance range (depth)images [6] [7], to geometry feature-based techniques which propose to representfacial surfaces by certain geometrical features sets, such as the convex parts, ar-eas with high curvatures, saddle points, etc [8]. For face surface matching, ICP(Iterative Closest Point) [1] is mostly applied; this algorithm computes the resid-ual error between the probe surface and the 3D images in the gallery as proposedin [10] and [9]. Although such feature definitions are intuitively meaningful, thecomputation of curvatures involves numerical approximation of second deriva-tives, and thus is very susceptible to observation noise. All these approaches treatthe face as a rigid object and do not perform well in the presence of expressionvariation. A good review and comparison studies of some of these techniques

(both 2D and 3D) is given in [7] [11]. Their challenge is expression changes. Todeal with facial expression variations, Bronstein et al. [12] use a geodesic dis-tance function to define level curves that are invariant to rigid motions and alsoto facial expressions to some extent. Another interesting work in [13] proposesto approximate facial surface by indexed sets of level curves of a continuousfunction, such as the depth function, defined on these surfaces. However, theseapproaches only partially solve the problem of facial expression variation as facialsurface also has some elastic properties.
In this paper, we investigate the influence of facial expressions on the perfor-mance of facial surface matching-based 3D face recognition algorithms. Using theFrench biometric IV 2 dataset, we benchmarked three facial surface matching-based algorithms, namely ICP [1][14], L-ICP which is a variant of ICP appliedto localized facial surface centred at the nose comparable to the work describedin [5], and R-ICP which is a region-based facial surface algorithm [15][16].
The rest of the paper is organized as follows. We describe in section 2 theIV 2 dataset and in section 3 the evaluation protocol. Section 4 briefly introducesthe three facial surface-based algorithms. The experimental results are then dis-cussed and compared in section 5. Section 6 contains our concluding remarksand some future research directions.
2 Presentation of the IV 2 Database
The IV 2 base is a large multimodal biometric database, with more than 480sessions, corresponding to 365 subjects, collected in several locations, by differ-ent operators. The data base is designed to allow for evaluations of biometricalgorithms in regard to different variability parameters known to tamper theperformance, such as image quality, pose, expressions, and illumination.
For each subject, more than 2GB of data have been collected:- 2D stereoscopic sequences: 2000 MB- 3D faces : 11 MB- Talking faces and 2D faces : 200 MB- low quality talking faces : 15 MB- iris images : 15 MBThe different modalities have been gathered according to well defined proto-
cols. A small part of the database (53 sessions), which was gathered according toslightly different protocols is isolated, and used as a training set for algorithmsrequesting learning ( PCA,...).
The acquisition protocols for the 3D faces are the following:- neutral and expressive steady faces were digitized thanks to a laser scanner.
The device is a Konika-Minolta Vivid 300 sensor. The data format is vrml2.0.The different expressions and conditions are : neutral expression, neutral expres-sion with low ambient light, eyes closed, smile, surprise, disgust. In addition tothe neutral frontal view, lateral views have been scanned in order to reconstructa full 3D reference face.
- stereo records of videos of animated faces were realised with variable light,pose and expression. Two stereo heads were used, one taking a front view of thesubject, and the other a profile view. These records can be used as stereo videosor pairs of images can be extracted from them.
For the present work, only the simple vrml files were used.The IV 2 data base was chosen for this experiment instead of the well known
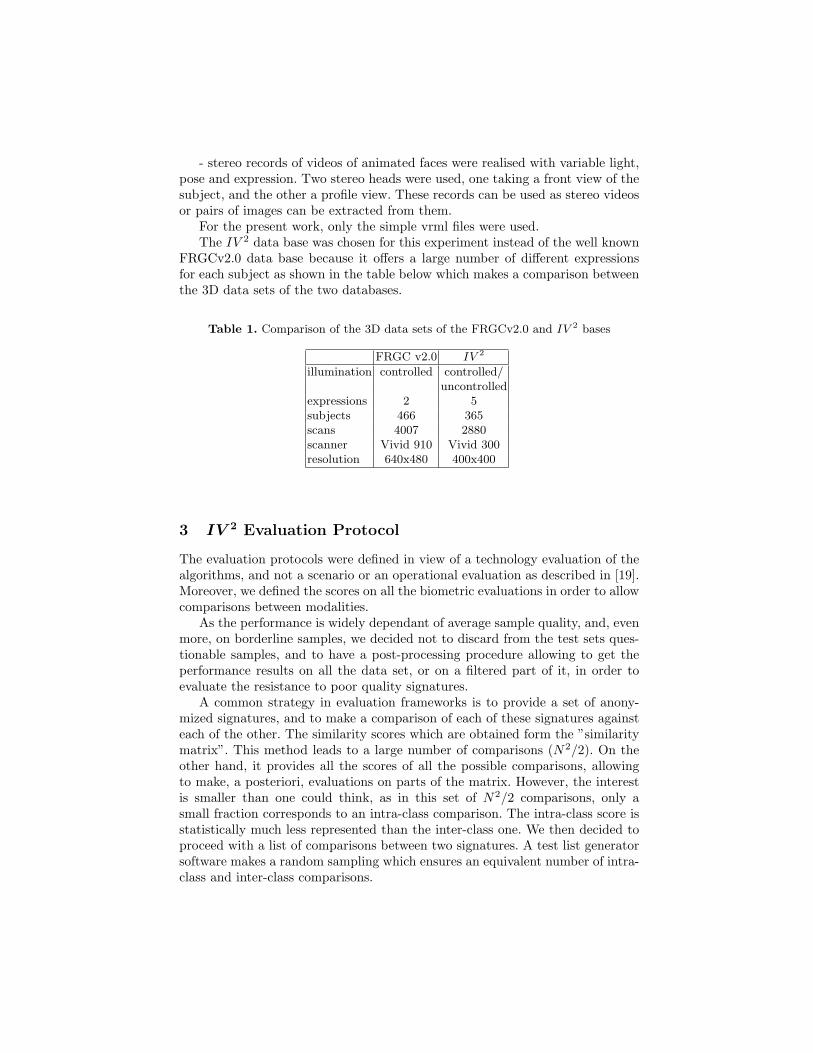
FRGCv2.0 data base because it offers a large number of different expressionsfor each subject as shown in the table below which makes a comparison betweenthe 3D data sets of the two databases.
Table 1. Comparison of the 3D data sets of the FRGCv2.0 and IV 2 bases
FRGC v2.0 IV 2
illumination controlled controlled/uncontrolled
expressions 2 5subjects 466 365scans 4007 2880scanner Vivid 910 Vivid 300resolution 640x480 400x400
3 IV 2 Evaluation Protocol
The evaluation protocols were defined in view of a technology evaluation of thealgorithms, and not a scenario or an operational evaluation as described in [19].Moreover, we defined the scores on all the biometric evaluations in order to allowcomparisons between modalities.
As the performance is widely dependant of average sample quality, and, evenmore, on borderline samples, we decided not to discard from the test sets ques-tionable samples, and to have a post-processing procedure allowing to get theperformance results on all the data set, or on a filtered part of it, in order toevaluate the resistance to poor quality signatures.
A common strategy in evaluation frameworks is to provide a set of anony-mized signatures, and to make a comparison of each of these signatures againsteach of the other. The similarity scores which are obtained form the ”similaritymatrix”. This method leads to a large number of comparisons (N2/2). On theother hand, it provides all the scores of all the possible comparisons, allowingto make, a posteriori, evaluations on parts of the matrix. However, the interestis smaller than one could think, as in this set of N2/2 comparisons, only asmall fraction corresponds to an intra-class comparison. The intra-class score isstatistically much less represented than the inter-class one. We then decided toproceed with a list of comparisons between two signatures. A test list generatorsoftware makes a random sampling which ensures an equivalent number of intra-class and inter-class comparisons.

3.1 Metrics
Many different performance metrics have been used. In the case of algorithmperformance, a significant metric is the similarity score returned by the algo-rithm. The ultimate performance evaluation of a system is the operational falseacceptation and false rejection rates. In fact, the acceptation or rejection deci-sion depends on a threshold which can only be settled in reference to a givensystem (for instance, the threshold can be fixed a priori, or after a learning ordevelopment phase, or even be adjusted in real time in some cases). This thresh-old depends on a set of specifications (for instance to ensure a given rate of falseacceptance, or allow a given false rejection rate, with a specified maximum num-ber of trials). It depends also on the a-priori knowledge on the users populationstatistics (closed world test, open world test, like ”watch list” function, a-priorievaluation on the percentage of fraud trials per test).
The FAR (False Acceptance Rate) and FRR (False Rejection Rate) are thecurves which represent the statistical error in acceptance and the statistical errorin rejection versus the threshold value.
In our case of algorithm evaluation, it makes sense to present results whichare independent from any threshold settling. The well known DET (DetectorError Tradeoff) curve, defined in [4] corresponds to this requirement.
The EER (Equal Error Rate) is the value on this curve where FAR = FRR.It is also a figure independent of the threshold. It is usual also to give the FRRvalue for a given FAR(i.e. 0.01).
3.2 Test sets
The test sets must be built according to the available data set. Their size andcontent must be chosen in order to allow a good evaluation of a given perfor-mance. For instance, if one wants to evaluate, or to compare algorithms, whoseEER is estimated to be in the range of 4%, with a ”sensitivity” of .5%, a ”ruleof the thumb” indicates that the test should produce a number of errors ( forthe threshold corresponding to this position ) in the range of 10 . This leads toa test set size of 250 intra-class comparisons. Now, if one wants to evaluate asmall performance increase, he could have to increase this number, in order toimprove this sensitivity of the evaluation. One could alleviate that this samplesize dimensioning is not based on accurate statistical estimations. Our experi-ence is that the distributions in this domain are often far from normal, and makehazardous the application of strict probabilistic reasoning. Moreover, a good es-timation of statistical distributions remain a true challenge, because of the smallnumber of samples generally available, as much as the representativity of thesesamples for a given population, because of the large importance of parameterslike age or ethnicity.
Available data have been used in a way such as to construct several testseries, which are presented in the table below.
The Multi-session Test allows comparisons between neutral faces of two dif-ferent sessions. Neutral faces include : neutral expression, neutral expression inlow ambiant light, eyes closed.
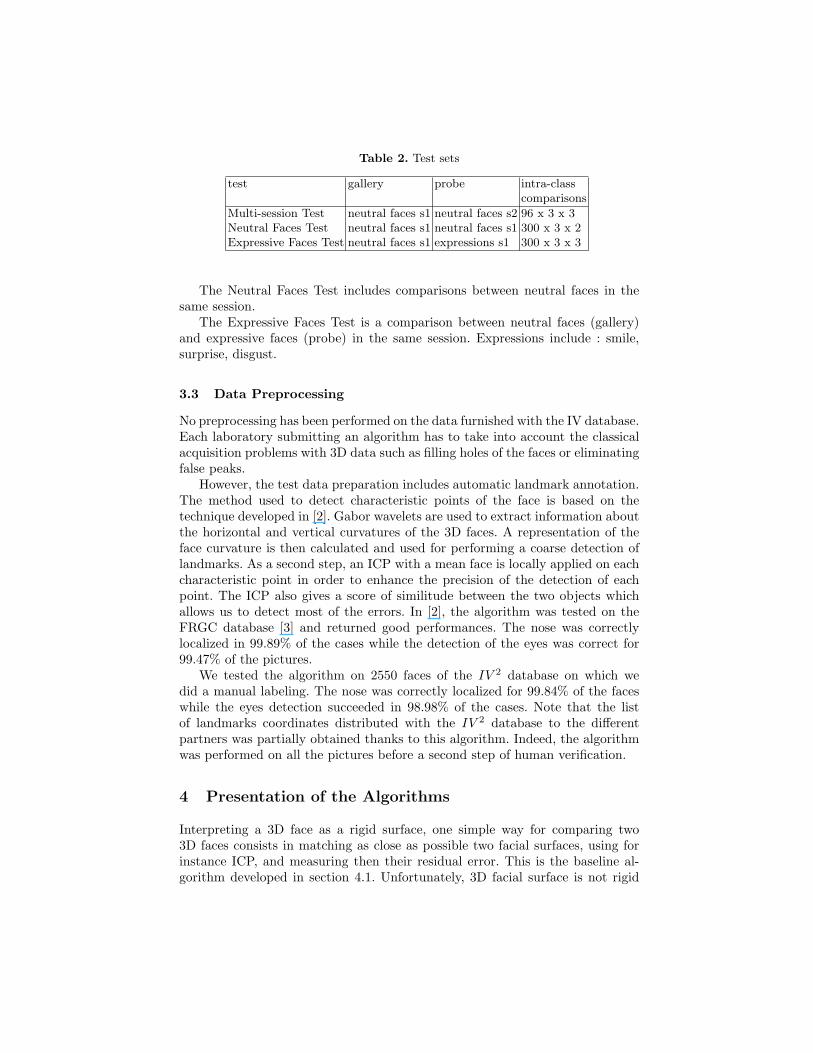
Table 2. Test sets
test gallery probe intra-classcomparisons
Multi-session Test neutral faces s1 neutral faces s2 96 x 3 x 3Neutral Faces Test neutral faces s1 neutral faces s1 300 x 3 x 2Expressive Faces Test neutral faces s1 expressions s1 300 x 3 x 3
The Neutral Faces Test includes comparisons between neutral faces in thesame session.
The Expressive Faces Test is a comparison between neutral faces (gallery)and expressive faces (probe) in the same session. Expressions include : smile,surprise, disgust.
3.3 Data Preprocessing
No preprocessing has been performed on the data furnished with the IV database.Each laboratory submitting an algorithm has to take into account the classicalacquisition problems with 3D data such as filling holes of the faces or eliminatingfalse peaks.
However, the test data preparation includes automatic landmark annotation.The method used to detect characteristic points of the face is based on thetechnique developed in [2]. Gabor wavelets are used to extract information aboutthe horizontal and vertical curvatures of the 3D faces. A representation of theface curvature is then calculated and used for performing a coarse detection oflandmarks. As a second step, an ICP with a mean face is locally applied on eachcharacteristic point in order to enhance the precision of the detection of eachpoint. The ICP also gives a score of similitude between the two objects whichallows us to detect most of the errors. In [2], the algorithm was tested on theFRGC database [3] and returned good performances. The nose was correctlylocalized in 99.89% of the cases while the detection of the eyes was correct for99.47% of the pictures.
We tested the algorithm on 2550 faces of the IV 2 database on which wedid a manual labeling. The nose was correctly localized for 99.84% of the faceswhile the eyes detection succeeded in 98.98% of the cases. Note that the listof landmarks coordinates distributed with the IV 2 database to the differentpartners was partially obtained thanks to this algorithm. Indeed, the algorithmwas performed on all the pictures before a second step of human verification.
4 Presentation of the Algorithms
Interpreting a 3D face as a rigid surface, one simple way for comparing two3D faces consists in matching as close as possible two facial surfaces, using forinstance ICP, and measuring then their residual error. This is the baseline al-gorithm developed in section 4.1. Unfortunately, 3D facial surface is not rigid

and has deformations especially during facial expressions. A simple way to copewith these deformations (section 4.2) is to apply the baseline algorithm to aless deformable part of the facial surface, leading to L-ICP applied to the faceregion centered at the nose. In section 4.3, we further consider a region-basedICP which gives more weight to stable facial regions in the computation of thesimilarity scores.
4.1 Standard ICP algorithm
Proposed by Besl and McKay[1], the Iterative Closest Point (ICP) algorithmperforms a registration between two 3D objects by searching the best corre-spondence between the two point clouds representing the object shapes. Aftera first rough registration using 3 landmarks (for instance the eyes and nose 3Dpositions) the algorithm associates to each point of the first face a point of thesecond one. From these couples of points, a distance between the two faces canbe calculated, and a geometric transformation to apply to the first face in orderto minimize this distance. The operations of matching the points by couple, cal-culating the distance and the transformation are applied iteratively until a stopcriterium is reached. This stop criterium can be based on the distance variationfrom step to step. The final transformation is applied, and the final ICP distancecan be taken as a distance score between the two faces.
Due to different factors like the facial expressions and the quality of theacquired data, two faces of the same person will not match perfectly. In order tominimize the error due to this noise, the mean distance between the two faces isnot calculated from all the distances of the couples of points. Indeed, the couplesof points having the largest distances are discarded in this calculation and only apredefined percentage of couples is kept. In our case, the experiments performedon the training database showed that the best results were obtained when usinga percentage of 82% of the couples of points.
4.2 L-ICP algorithm
A problem of the ICP algorithm is that when it is performed on the entire face,the registration of local regions of the face is degraded. Indeed, each part of theface does not match as well as if we had tried to match it alone, without the restof the face. For example, in some cases, when comparing two faces of the sameperson with different facial expressions, the algorithm will not register perfectlythe noses of the two faces in order to have a better matching on the rest of theface.
In [5], Chang et al. proposed a local approach for 3D face recognition. It isbased on a combination of scores corresponding to matching multiple overlappingregions around the nose. Their experiments performed on the FRGC databaseshowed that their algorithm outperformed the ICP baseline that uses a frontalface region.
Based on this work and on previous experiments we had performed in ourlaboratory, we decided to focus on the small region localized around the nose
which is less sensitive to facial expressions than the entire face, and performedthe ICP on it. We defined a reference distance Dr (here, 60% of the distancebetween the eyes) and kept only the points which were closer than Dr from thetip of the nose.
Compared to the baseline ICP algorithm, the region to match in our methodis really localized. The percentage of couple of points to eliminate in order tocalculate the distance between the faces is also more limited than in the firstcase. Here, the experiments performed on the training database showed that thebest results were obtained when using a percentage of 93% of the couples ofpoints.
4.3 R-ICP algorithm
The aim of this third variant of ICP for 3D face matching (published in [15]and [16]) is to propose a weighted similarity metric based on the distance be-tween aligned facial regions according to their degree of deformation. We usedthe principle that the more static the region is, the greater is its weight. In fact,according to the anatomy of face, we can split a facial surface into regions havingmore or less the same moving amplitude during facial expressions. Remarkablefacial surface deformations during facial expressions are provoked by the activa-tion of some specific muscles such as zygomaticus major while smiling and themovements of the lower jaw.
In order to perform recognition, first we processed the scans in order to cropfacial region and cancel non-facial parts such as clothes, shoulder, and hair.Second, we split automatically the probe face surface onto two regions (rigidand non-rigid). Here a specified sphere function (centered on the nose bridgeand with a radius of 50mm) was used in order to separate the rigid part (insidethe volume defined by the function) and the non-rigid part (outside the samevolume). Then, we performed standard ICP on rigid region (region around nose)and 3D face from the gallery in the one hand and the same algorithm on thenon-rigid region and 3D face from the gallery in the other hand.
Finally, since each of these steps produces a normalized similarity score thefinal score is the fusion using :
ξ = αξrigid + (1− α)ξnon−rigid
Weights are produced using the IV2 trainig dataset as described in [16].
5 Results
Whilst the performance of 2D algorithms is tampered by many different parame-ters (illumination, pose, expressions, time between two sessions), most of the 3Dface algorithms are known to be sensitive to two main variability parameters :expressions and time left between two acquisitions. The test sets have been builtin order to evaluate the influence of these parameters. Monosession comparisons
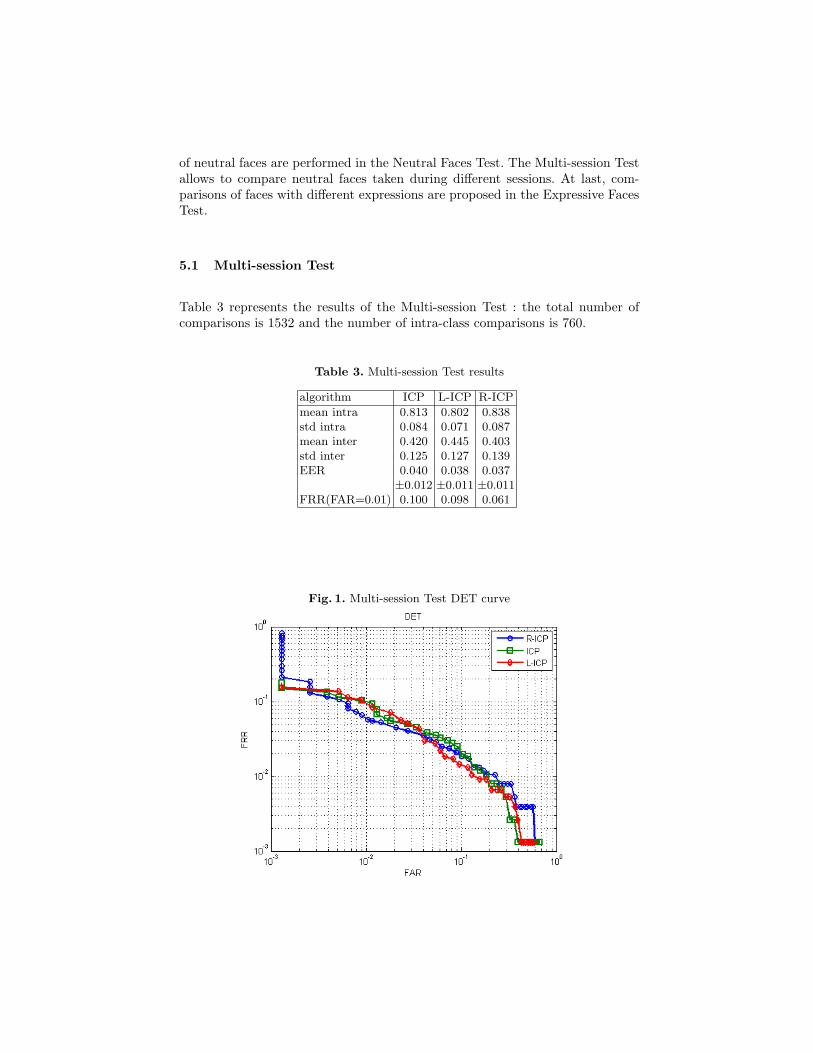
of neutral faces are performed in the Neutral Faces Test. The Multi-session Testallows to compare neutral faces taken during different sessions. At last, com-parisons of faces with different expressions are proposed in the Expressive FacesTest.
5.1 Multi-session Test
Table 3 represents the results of the Multi-session Test : the total number ofcomparisons is 1532 and the number of intra-class comparisons is 760.
Table 3. Multi-session Test results
algorithm ICP L-ICP R-ICP
mean intra 0.813 0.802 0.838std intra 0.084 0.071 0.087mean inter 0.420 0.445 0.403std inter 0.125 0.127 0.139EER 0.040 0.038 0.037
±0.012 ±0.011 ±0.011FRR(FAR=0.01) 0.100 0.098 0.061
Fig. 1. Multi-session Test DET curve
The multisession test shows good performance, confirming that the 3D facemodality is not very sensitive to the environment and time distance betweengallery and probe.
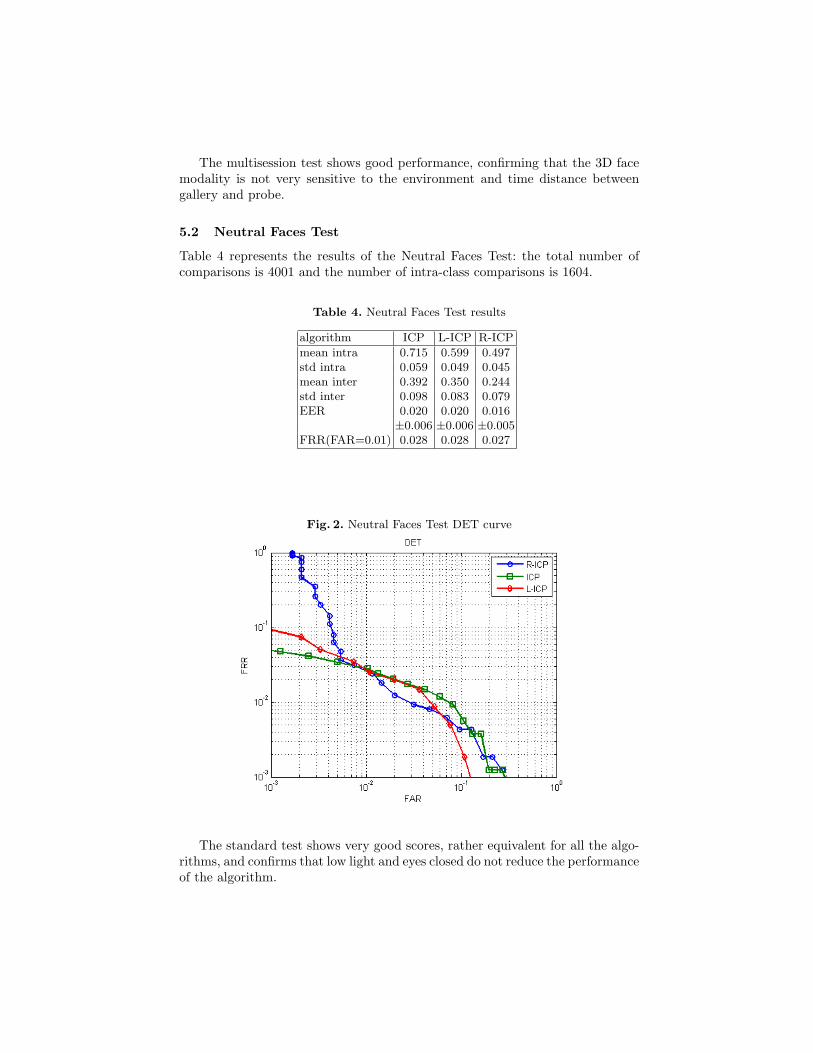
5.2 Neutral Faces Test
Table 4 represents the results of the Neutral Faces Test: the total number ofcomparisons is 4001 and the number of intra-class comparisons is 1604.
Table 4. Neutral Faces Test results
algorithm ICP L-ICP R-ICP
mean intra 0.715 0.599 0.497std intra 0.059 0.049 0.045mean inter 0.392 0.350 0.244std inter 0.098 0.083 0.079EER 0.020 0.020 0.016
±0.006 ±0.006 ±0.005FRR(FAR=0.01) 0.028 0.028 0.027
Fig. 2. Neutral Faces Test DET curve
The standard test shows very good scores, rather equivalent for all the algo-rithms, and confirms that low light and eyes closed do not reduce the performanceof the algorithm.

5.3 Expressive Faces Test
Table 5 represents the results of the Expressive Faces Test : the total number ofcomparisons is 4724 and the number of intra-class comparisons is 2380.
Table 5. Expressive Faces Test results
algorithm ICP L-ICP R-ICP
mean intra 0.721 0.716 0.408std intra 0.110 0.093 0.081mean inter 0.510 0.503 0.225std inter 0.099 0.101 0.078EER 0.167 0.141 0.109
±0.013 ±0.012 ±0.010FRR(FAR=0.01) 0.450 0.392 0.408
Fig. 3. Expressive Faces Test DET curve
This test results reveal the large degradation of the performance when ex-pressive faces are tested. One should notice that the R-ICP algorithm performsbetter on such difficult cases.
5.4 Sensitivity to the sample quality
In the results above, signatures presenting a defect (hole at the nose or eyebrowarcade) were discarded. This represents about 7% of the 2444 files used. In order

Table 6. Neutral Faces Test results on low quality samples
algorithm ICP L-ICP R-ICP
Filtered dataEER 0.020 0.020 0.016FRR(FAR=0.01) 0.028 0.028 0.027
Raw dataEER 0.035 0.026 0.058FRR(FAR=0.01) 0.050 0.034 0.090
to show the sensitivity of the different algorithms to acquisition defects, we givehere for the Neutral Faces Test, the results on all data, including poor signatures.
One can see that the sensitivity to acquisition defects is not the same for thedifferent algorithms. This is due mainly to the different methods used for faceregistration.
6 Conclusion and Perspectives
In this paper, we investigated the influence of facial expressions on the per-formance of 3D facial surface matching-based algorithms. Using the French IV 2
dataset, we benchmarked three facial surface matching-based algorithms, namelyICP, L-ICP and R-ICP. The experimental results show that facial expressionsaccount for a major intra-class variations and the region-based facial surfacematching algorithm (R-ICP), while giving more weight to stable facial regionsin the similarity score computation process, gives promising results.
Currently, we have been working on 3D face preprocessing in order to enableautomatic coarse 3D facial surface alignment within the framework of the Frenchnational FAR 3D project [18]. Furthermore, we are also investigating optimalweight and deformation region selection by a learning process. Large experimentson full FRGC dataset and IV 2 dataset are under way.
Acknowledgements
This work was supported by the French Ministries of Defense and Research.
References
1. Paul J. Besl and Neil D. McKay. A Method for Registration of 3-D Shapes. PatternAnalysis and Machine Intelligence, Volume 14 Number 2, p. 239-255, February 1992.
2. Johan D’Hose, Joseph Colineau, Cyrille Bichon and Bernadette Dorizzi. PreciseLocalization of Landmarks on 3D Faces using Gabor Wavelets. Biometrics: Theory,Applications, and Systems, 2007. BTAS 2007. First IEEE International Conferenceon 27-29 Sept. 2007, Crystal City, VA, USA .

3. P. Jonathon Phillips, Patrick J. Flynn, Todd Scruggs, Kevin W. Bowyer and WilliamWorek. Preliminary Face Recognition Grand Challenge Results, Proceedings of the7th International Conference on Automatic Face and Gesture Recognition (FGR06),pp. 15-24, 2006.
4. A. Martin, G. Doddington, T. Kamm, M. Ordowski, M. Przybocki. The DET Curvein Assessment of Detection Task Performance, Proceedings of Eurospeech 1997.
5. Kyong I. Chang, Kevin W. Bowyer, and Patrick J. Flynn. Multiple Nose RegionMatching for 3D Face Recognition under Varying Facial Expression, IEEE Trans-actions on Pattern Analysis and Machine Intelligence, 28(10):1695-1700, October2006.
6. C. Xu and Y. Wang and T. Tan and L. Quan: Depth vs. Intensity: Which is MoreImportant for Face Recognition?, Proc. 17th International Conference on PatternRecognition, 2004.
7. K-I. Chang, K-W. Bowyer, and P-J. Flynn, An evaluation of multimodal 2d+3dface biometrics, IEEE Transactions Pattern Analysis and Machine Intelligence.,27(4):619624, 2005.
8. X. Lu and A.K. Jain, Matching 2.5D Face Scans to 3D Models, IEEE Trans. PatternAnalysis and Machine Intelligence, vol. 28, no. 1, pp. 31-43,Jan. 2006.
9. X. Lu and A-K. Jain, Integrating Range and Texture Information for 3D Face Recog-nition, Proc. 7th IEEE Workshop on Applications of Computer Vision pages 156-163(2005).
10. C. Beumier and M. Acheroy, Automatic Face Authentication from 3D Surface,Proc. British Machine Vision Conf., 1998.
11. K-I. Chang, K-W. Bowyer, and P-J. Flynn, Multiple nose region matching for3d face recognition under varying facial expression, IEEE Pattern Transactions onPattern Analysis and Machine Intelligence, 28(10):1695 1700, 2006.
12. A.M. Bronstein, M.M. Bronstein, and R. Kimmel, Three-Dimensional Face Recog-nition , International Journal of Computer Vision, vol. 64, no. 1, pp. 5-30, 2005.
13. C. Samir, A. Srivastava, and M. Daoudi, 3D Face Recognition Using Shapes ofFacial Curves, IEEE Transactions Pattern Analysis and Machine Intelligence, Vol.(28), Issue (11), Page 1858- 1863, Nov. 2006.
14. B. Ben Amor, M. Ardabilian, L. Chen. New Experiments on ICP-based 3D FaceRecognition and Authentication, 18th International Conference on Pattern Recogni-tion, (ICPR 2006), pp. 1195-1199.
15. B. Ben Amor, M. Ardabilian, L. Chen. Enhancing 3D Face Recognition by MimicsSegmentation, Proceedings of the Sixth International Conference on Intelligent Sys-tems Design and Applications (ISDA 2006): 150-155, October 16-18, 2006, Jinan,China. IEEE Computer Society 2006, ISBN 0-7695-2528-8
16. Boulbaba Ben Amor, Mohsen Ardabilian, Liming Chen, Toward a region-based 3Dface recognition approach, 2008 IEEE International Conference on Multimedia &Expo (ICME 2008), June 23-26 2008, Hannover, Germany
17. http://face.nist.gov/frvt/frvt2006/FRVT2006andICE2006LargeScaleReport.pdf18. http://www-rech.telecom-lille1.eu/far3d/19. http://www.cesg.gov.uk/site/ast/biometrics/media/BestPractice.pdf