Developmental Neurotoxicity Study of Dietary Bisphenol A in Sprague-Dawley Rats
Upload
independentCategory
view
1download
0
1 23
NeuroMolecular Medicine ISSN 1535-1084 Neuromol MedDOI 10.1007/s12017-013-8243-0
3-Methylcholanthrene InducesNeurotoxicity in Developing NeuronsDerived from Human CD34+Thy1+ StemCells by Activation of Aryl HydrocarbonReceptorAbhishek K. Singh, MahendraP. Kashyap, Vivek Kumar, VinayK. Tripathi, Dharmendra K. Yadav,Firoz Khan, Sadaf Jahan, et al.

1 23
Your article is protected by copyright and all
rights are held exclusively by Springer Science
+Business Media New York. This e-offprint is
for personal use only and shall not be self-
archived in electronic repositories. If you wish
to self-archive your article, please use the
accepted manuscript version for posting on
your own website. You may further deposit
the accepted manuscript version in any
repository, provided it is only made publicly
available 12 months after official publication
or later and provided acknowledgement is
given to the original source of publication
and a link is inserted to the published article
on Springer's website. The link must be
accompanied by the following text: "The final
publication is available at link.springer.com”.
ORIGINAL PAPER
3-Methylcholanthrene Induces Neurotoxicity in DevelopingNeurons Derived from Human CD34+Thy1+ Stem Cellsby Activation of Aryl Hydrocarbon Receptor
Abhishek K. Singh • Mahendra P. Kashyap • Vivek Kumar •
Vinay K. Tripathi • Dharmendra K. Yadav • Firoz Khan •
Sadaf Jahan • Vinay K. Khanna • Sanjay Yadav • Aditya B. Pant
Received: 26 February 2013 / Accepted: 26 June 2013
� Springer Science+Business Media New York 2013
Abstract Developing neurons, derived from the human
umbilical cord blood stem cells (hUCBSCs), were investi-
gated for their stage-specific responses against 3-methyl-
cholanthrene (MC), a well-known polycyclic aromatic
hydrocarbon. Three-dimensional (3D) molecular docking
demonstrates the strong hydrogen bonding and hydrophobic
interactions of MC with amino acids of aryl hydrocarbon
receptor (AHR) and aryl hydrocarbon receptor nuclear
translocator (ARNT) within 4 A and subsequent inhibition of
cAMP response element-binding protein (CREB), a-amino-
3-hydroxy-5-methyl-4-isoxazolepropionic acid (AMPA)
and N-methyl-D-aspartate (NMDA) receptors. Protein–pro-
tein docking also confirms that induced levels of AHR inhibit
the neurogenesis-related transcription factor (CREB) with
maximum docking scores. In concurrence with in silico data,
MC exposure significantly up regulates the expression and
activity of AHR, CYP1A1 and glutathione S-transferase P1-
1 (GSTP1-1) and down regulates the expression of CREB,
AMPA and NMDA receptors in hUCBSC-derived neuronal
cells at various maturity (0, 2, 4, 8 days of differentiation).
MC-mediated significant down regulation in the expression
of stage-specific neuronal markers (Nestin, neural cell
adhesion molecule–NCAM, synaptophysin–SYP, CREB,
AMPA and N-methyl-D-aspartate receptor subunit 2A–
NR2A) was also noticed in cells all through the differentia-
tion. Data identify the possible interference of MC in neu-
ronal transmission and neurogenesis.
Keywords Aryl hydrocarbon receptor � Developmental
neurotoxicity � Human cord blood stem cells � Molecular
docking � 3-Methylcholanthrene
Introduction
It is reported that the developing brain is more vulnerable
to drugs and chemicals even at concentrations that are
usually safe to mature developed brain (Bal-Price et al.
2010). One among the reasons suggested is the non-avail-
ability of blood-brain barrier (BBB) in the developing brain
(Tilson 2000). In addition, placental barriers are also
insufficient to restrict maternal exposure to developing
fetuses (Bal-Price et al. 2010). Brain development is a
complex process that involves various strictly controlled
steps, viz. proliferation, differentiation and migration of
neuronal precursor cells, neuritogenesis, formation of
neural network, receptors and apoptosis. Environmental
chemicals may interfere at any step of brain development.
The chemicals shown to interact with brain tissues are
polycyclic aromatic hydrocarbons (PAHs), pesticides,
cigarette smoke, alcohol, etc. (Tayebati et al. 2009). Due to
lipophilicity, these chemicals can cross placenta and
immature BBB and hence affect the developing brain cells
(Liu et al. 2011; Nielsen et al. 2011). Any such injury to the
developing brain cells may lead the long-lasting disability
(Slotkin and Seidler 2010; Talge et al. 2007). The role of
A. K. Singh � M. P. Kashyap � V. Kumar �V. K. Tripathi � S. Jahan � V. K. Khanna � S. Yadav �A. B. Pant (&)
In Vitro Toxicology Laboratory, CSIR-Indian Institute
of Toxicology Research, Post Box: 80, MG Marg,
Lucknow 226001, India
e-mail: [email protected]; [email protected]
D. K. Yadav � F. Khan
Metabolic & Structural Biology Division, CSIR-Central Institute
of Medicinal and Aromatic Plants, Lucknow 226015, India
123
Neuromol Med
DOI 10.1007/s12017-013-8243-0
Author's personal copy

cytochrome P450s (CYPs) is well reported in the metab-
olism of toxicants reaching the brain (Ferguson and Tyn-
dale 2011; Nebert and Russell 2002). However, the
reactive intermediates produced by CYPs have also been
reported to induce deleterious effects to brain cells by
binding to the receptors, ion channels and macromolecules
(Wells et al. 2010). CYPs are also reported to play a key
role in the metabolism of endogenous fatty acids, steroids,
hormones, cholesterols, vitamins and neurotransmitters
(Liu et al. 2004).
The fate of xenobiotics and their neurotoxic effects in
developing fetus brain has not been investigated in detail,
mainly due to the non-availability of developing human
fetal brain tissue and cells. Therefore, most of the mecha-
nistic studies have been carried out using mature and ter-
minally differentiated cultured cells of neuronal origin, and
for neurotoxicity assessment only (Grandjean and Landri-
gan 2006; Schreiber et al. 2010). Besides that, neural
progenitor cells have also been used to study the effect of
chemicals on proliferation (Breier et al. 2008). We, as
others, have used PC12 cells, a rat pheochromocytoma cell
line, in our investigation, to study the effect of these
chemicals on neurite outgrowth (Radio et al. 2008; Sidd-
iqui et al. 2008). Recently, we have been able to success-
fully demonstrate the complete neuronal differentiation of
human hematopoietic stem cells derived from umbilical
cord blood. We have also been able to confirm the xeno-
biotic metabolizing capabilities of these human stem cell-
derived neuronal cells at various stages of development
(Singh et al. 2012).
The present investigations were carried out to study the
applicability of developing neuronal cells derived from
human umbilical cord blood stem cells as a prescreening
tool to assess the drug- and chemical-induced develop-
mental neurotoxicity. 3-Methylcholanthrene (MC), an
environmental contaminant polycyclic aromatic hydrocar-
bon, is usually generated by the incomplete combustion of
organic compounds at high temperature. MC, a known
inducer of CYP1A1, was used as a test compound in the
study, as the exposure of human subjects to this chemical is
very common. Naruse et al., 2002 have already shown MC-
mediated prevention in the proliferation and differentiation
of osteoblasts under both in vitro and in vivo conditions.
The selection of MC for the study was also based on the
existing literature, which says that the exposure of PAHs to
developing brain in fetuses is quite common through
maternal cigarette smoking during pregnancy (Polanska
et al. 2009; Rodgman et al. 2000). It is also reported that
maternal cigarette smoking and consumption of alcohol
during pregnancy results in reduced intelligence quotient
(Batty et al. 2006), psychiatric disorders and behavioral
problems (Grandjean and Landrigan 2006; Thapar et al.
2003) in the offspring.
Materials and Methods
In Silico Studies
Protein Structure Homology Modeling of Aryl
Hydrocarbon Receptor (AHR)
The three-dimensional (3D) structure of cytochrome P450
(CYP) regulator receptor AHR can be experimentally
determined by radiographic (X-ray) crystallography or by
nuclear magnetic resonance (NMR) spectroscopy. As no
experimental structure is available in any protein data
bank, a homology model was developed by us. Homology
modeling represents a starting point for the biologist
involved in structure–function relationships studies. In the
homology modeling study, the distance geometry, simu-
lated annealing and energy minimization approaches were
used to build the 3D model of AHR protein by employing
GENO3D, an automatic web server for protein structure
modeling (http://geno3d-pbil.ibcp.fr). Query protein
sequence of AHR protein with length of 318 amino acids
was retrieved from GenBank database (NCBI, USA).
Homologous template protein sequences with known 3D
structure were identified through Basic Local Alignment
Search Tool (BLAST) program. Template-query protein
sequence validation was done by multiple sequence
alignment method through CLUSTALW, while the statis-
tical verification of generated model was evaluated by
PROCHECK, and model comparisons in three-dimensional
form were performed by RasMol-3D viewer. Finally, after
structural and energy minimization evaluation, Model_9
was identified as more accurate than others with maximum
homology to the known 3D structure. Though this com-
puter-generated molecular model cannot act as a substitute
for a crystal structure, it can support the investigation of the
structure–function relationships.
Molecular Modeling and Energy Minimization Parameters
The molecular modeling of compound, viz. MC, was per-
formed with CYP regulators AHR (aryl hydrocarbon
receptor), ARNT (aryl hydrocarbon receptor nuclear
translocator), neurogenesis-related transcription factor
CREB (cAMP response element-binding protein), and
neurotransmission receptors; AMPA receptor (a-amino-3-
hydroxy-5-methyl-4-isoxazolepropionic acid receptor) and
NMDA receptor (N-methyl-D-aspartate receptor) by using
Sybyl X 1.3 molecular modeling and drug discovery soft-
ware (www.tripos.com; Tripos International, USA). The
molecular docking, construction, geometry optimization
and energy minimization of MC were carried out using the
Sybyl X 1.3. All the molecules were initially designed in
Sybyl. However, the molecular construction, geometry
Neuromol Med
123
Author's personal copy
optimization and energy minimization process were done
by using HP XW4600 workstation configured with Intel
Core 2 Duo E8400 (3.2 GHz) processor and 6 GB of
RAM, running the Red Hat� Enterprise Linux 4.0 (32-bit
compatible) operating system (Silicon Graphics Inc.,
Mountain View, CA, USA). The Tripos force field with a
distance-dependent dielectric and Powell gradient algo-
rithm with a convergence criterion of 0.001 kcal mol-1
were used for optimization. Partial atomic charges were
assessed by using Gasteiger–Huckel method. Two-dimen-
sional structures were converted to 3D structures using the
program Concord v4.0, and the maximum number of iter-
ations performed in the minimization was set to 2000.
Further, the geometry optimization was done through
MOPAC-6 package using the semiempirical PM3 Hamil-
tonian method (Kalani et al. 2011).
3-Methylcholanthrene Protein Molecular Docking Studies
To find the possible bioactive conformations of MC-
interacting targets, the Sybyl X 1.3 interfaced with Surflex-
Dock program (Tripos International, USA) was operated to
dock the compound into the active site of AHR (model_9,
designed by us) and known targets, viz. ARNT (PDB ID:
2A24), CREB (PDB ID: 1DH3), NMDA receptor (PDB ID:
2A5S) and AMPA receptor (PDB ID: 3KG2). Program
automatically docks ligand into binding pocket of target
proteins by using protomol-based algorithm and empiri-
cally produced scoring function. The protomol is a very
important and necessary factor for docking algorithm and
works as a computational representation of the proposed
ligand that interacts with binding site. Surflex-Dock’s
scoring function has several factors that play an important
role in the ligand–receptor interaction, in terms of hydro-
phobic, polar, repulsive, entropic and solvation, which is a
worldwide well-established and recognized method. The
most standard docking protocols have ligand flexibility into
the docking process, while the protein is counted as a rigid
structure. In the present study, molecular docking involved
several steps, viz. the first step involved importing the
protein structure into Surflex and addition of hydrogen
atoms, and generating protomol using a ligand-based
strategy. During the second step, two parameters, first
called protomol_bloat (which determines how far the site
should extend from a potential ligand) and the second
called protomol_threshold (which determines deepness of
the atomic probes, used to define the protomol penetration
into the protein), were specified to form the appropriate
binding pocket. Therefore, protomol_bloat and proto-
mol_threshold were set to 0 and 0.50, respectively. In a
reasonable binding pocket, the compound was docked into
the binding pocket and 20 possible active docking con-
formations with different scores were obtained. During the
docking process, all of the other parameters were assigned
their default values. Surflex-Dock total scores, expressed in
log10 (Kd) units to represent binding affinities, were
applied to estimate the ligand–receptor interactions of
selected molecule (MC). Docking simulation-based muta-
tion studies were carried out to further confirm the binding
affinity of MC to these proteins. Two conserved amino
acids (lysine—Lys; and arginine—Arg) were found in all
the binding sites within 4A radii, and therefore, these two
residues were selected for mutation studies. Less conserved
residues within docked binding sites were replaced with
either of Lys or Arg, and docking was performed for each
mutant. Following the identical protocol, numbers of
mutational dockings were performed for each mutant.
Protein–Protein Molecular Docking Studies
Protein–protein docking was performed by ZDOCK v2.5
module of Discovery Studio (DS; Accelrys, USA) (Gabb
et al. 1997; Katchalski-Katzir et al. 1992). The terms
‘receptor’ and ‘ligand’ refer to the two input proteins, with
the receptor generally being the larger protein or known to
function as a receptor in vivo (e.g., an antibody in an
antigen–antibody interaction). ZDOCK docking score
contains pairwise shape complementarity (PSC) scoring
function of each docking pose. In the present study, Pose-1
showed the best and highest ZDOCK docking score and
was thus selected for further studies.
In vitro Validation Studies
Reagents and Consumables
All the chemicals, reagents and kits used in this study were
purchased from Stem Cell Technologies, Vancouver, BC,
Canada and Sigma St. Louis, USA, unless otherwise stated.
All cytokines and growth factors such as recombinant
human nerve growth factor [rhNGF], basic fibroblast
growth factor [rhbFGF], thrombopoietin [rhTPO], stem cell
factor [rhSCF] and fetal liver tyrosine kinase 3 ligand
[rhFLT-3 ligand] were purchased from Pepro-Tech (Rocky
Hill, NY). All the antibodies were procured from Chem-
icon International, USA, and Abcam, CA, USA. Culture
wares and plastic wares were procured from Nunc, Den-
mark, and Corning Incorporated, NY. Autoclaved Milli-Q
water was used in all the experiments.
Ethical Clearance for Collection and Transportation
of Human Tissues
The entire study was carried out by following the protocols
and procedures approved by Institutional Human Ethical
Committees of Indian Institute of Toxicology Research
Neuromol Med
123
Author's personal copy
(IITR), Lucknow, India, and CSM Medical University, Luc-
know, India. A written informed consent of parents was
obtained prior to collecting the blood from the umbilical cord.
Isolation and Purification of Human Cord Blood
Hematopoietic Stem Cells
Hematopoietic stem cells (HSCs) were purified from col-
lected human umbilical cord blood following the protocols
described earlier (Singh et al. 2012). In brief, 23 cord blood
samples (*40 ml/cord) were collected from the cord vein
in a sterile container having an anticoagulant citrate dex-
trose buffer and immediately transported to the Indian
Institute of Toxicology Research (IITR), Lucknow, India,
for further processing. Blood was diluted in the ratio of 1:1
with Dulbecco’s phosphate-buffered saline (DPBS) with-
out Ca2? and Mg2? at pH 7.5 (Stem Cell Technologies).
Subsequently, cord blood mononuclear cells were segre-
gated by negative immunodepletion of CD3?, CD14?,
CD19?, CD38?, CD66b? cells, followed by FicollpaqueTM
(1.077 g/cm3, Stem Cell Technologies) density gradient
centrifugation (7009g for 30 min). CD34? hematopoietic
stem cells were isolated from mononuclear (1 9 108 cells/
ml) cells using automated robotic and magnetic cell sepa-
rator RoboSepTM (Stem Cell Technologies, catalog no.
20000) and EasySepTM human cord blood CD34 positive
selection kit (Stem Cell Technologies, catalog no. 18056)
as per the manufacturer’s instructions.
Undifferentiated Proliferation and Culture
of Hematopoietic Stem Cells
Freshly isolated hematopoietic stem cells were cultured in a
plastic 25-cm2 ultralow-attachment culture flask (Corning
Incorporated, USA) at a density of 1 9 105 cells/ml in serum
containing myelocult medium (Stem Cell Technologies
#H5150) supplemented with hydrocortisone (10-6M) and
other growth factors, viz. rhbFGF (50 ng/ml), rhSCF (25 ng/
ml), rhTPO (25 ng/ml) and rhFLT-3 ligand (10 ng/ml)
(PeproTech, Rocky Hill, NY). Cells were maintained in a
suspension in a humidified atmosphere at 37 �C and 5 %
carbon dioxide (CO2) (Singh et al. 2012). Half of the medium
was changed twice in a week. Cells were subcultured at the
confluence of 80–90 % in a myelocult medium supple-
mented with hydrocortisone and other growth factors.
Characterization of Purified Population of Hematopoietic
Stem Cells
Following the purification, HSCs were checked for CD34?
and Thy1? markers by flow cytometry to ascertain the
purity of stem cells and colony-forming unit (CFU) assay
to establish lineage-specific plasticity potential.
(a) Flow cytometry: Purity of HSCs was analyzed by
phenotyping of HSC cell surface markers CD34? and
Thy1? using flow cytometry. In brief, stem cells
(1 9 105) were centrifuged at 5009g for 10 min and
then stained with fluorescein isothiocyanate (FITC)-
conjugated anti-CD34 and PE-Texas Red-conjugated
anti-Thy1 antibodies (Stem Cell Technologies) in
dark for 30 min at 4 �C. The cells were then washed
three times with DPBS and analyzed using flow
cytometry (BD FACS Canto II) equipped with BD
FACS Diva, version 6.1.2 software. The data are
presented in percent population of stem cells.
(b) Colony-forming unit assay: HSCs (1 9 106) was
suspended in 0.5 ml myelocult medium and gently
mixed with a 3.5 ml of semisolid methylcellulose
culture medium (MethoCultTM Stem Cell Technolo-
gies; catalog no. 03434), which was supplemented with
recombinant colony-stimulating factors, viz. erythro-
poietin (EPO) and granulocyte–monocyte colony-
stimulating factors (GM-CSF); 1 ml of the mixed cells
was transferred gently into small gridded petri dishes.
The dishes were incubated at 37 �C (95 % oxygen–O2
and 5 % CO2) for 14 days. The CFU were classified
and enumerated based on the morphological recogni-
tion of one or more types of hematopoietic lineage cells
within the colony in situ by inverted light microscopy.
Differentiation of Hematopoietic Stem Cells into Neuronal
Subtype
Hematopoietic stem cells were differentiated into neuronal
subtypes following the protocols described earlier by us
(Singh et al. 2012). In brief, confluent growing cells were
subcultured as per the experimental demand and allowed to
adhere in SynthemaxTM 6-well culture plate and 75-cm2
culture flask (Corning Incorporated, NY). The cells were
then induced to differentiate into neuronal subtype in
serum-free neurobasal medium (Gibco-BRL, USA) sup-
plemented with N2, B27 supplements, rhNGF (50 ng/ml),
rhFGF-basic (50 ng/ml), rhTPO (25 ng/ml), rhSCF (25 ng/
ml) and retinoic acid (10-5M) for a period of up to 8 days.
Differentiation medium was changed every alternate day.
Differentiating cells were observed for morphological
changes and expression (mRNA and protein) of markers of
neuronal development at various points of maturity.
Identification of Non-cytotoxic Doses
of 3-Methylcholanthrene
Prior to the experiments, non-cytotoxic dose of MC
was ascertained using standard endpoint of cytotox-
icity, that is. MTT (3-(4, 5-Dimethylthiazol-2-yl)-2,
Neuromol Med
123
Author's personal copy
5-diphenyltetrazolium bromide) assay (Kashyap et al.
2010). Cytotoxicity analysis was done by exposing the
cells at days 0, 2, 4 and 8 of differentiation. Cells (1 9 104
cells/well) at various stages of maturity (days 0, 2, 4 and 8)
were incubated with a medium containing different con-
centrations of MC (1–10 lM) for 6–72 h and MTT assay
was done. Tetrazolium bromide salt (10 ll/well; 5 mg/ml
of stock in PBS) was added 4 h prior to the completion of
respective incubation periods. Then, the reaction mixture
was carefully taken out and 200 ll of culture grade
dimethylsulphoxide (DMSO) was added to each well by
pipetting up and down several times, until the content was
homogenized. After 10 min, the color was read at 550 nm
using multiwell microplate reader (Synergy HT, Bio-Tek,
USA). The unexposed sets were also run simultaneously
under identical conditions, which served as control.
Exposure of Differentiating Neuronal Cells
to 3-Methylcholanthrene
Cells at various maturities of days 0, 2, 4 and 8 were exposed to
MC (4 lM) for a period of 12 and 24 h for mRNA and protein
expression studies, respectively. The unexposed control sets
were run under identical conditions at every point of matu-
ration. Upon the completion of respective exposures, cells
were harvested and processed for transcriptional, translational
expression and enzymatic activity studies.
RNA Extraction and Real-Time PCR (RT-PCRq)
Transcriptional changes in marker genes associated with
stemness, neuronal development and xenobiotic metabolism
were studied in the experimental and control groups by real-
time PCR using SYBR Green dye. Total RNA was isolated
using Gene Elute mammalian total RNA Miniprep Kit
(Sigma, USA; catalog no. RTN-70). Total RNA (1 lg) was
reverse transcribed into cDNA by SuperScript III first-strand
cDNA synthesis kit (Invitrogen Life Science, USA; catalog
no. 18080-051). Sequences of different primers are given in
Table 1. The specificity of each primer was assessed by
melting curve analysis and no template controls for respective
primers. Quantitative PCR reactions were then carried out
using the ABI PRISM 7900HT Sequence Detection System
(Applied Biosystems, USA). Real-time reactions were carried
out in triplicate wells for each sample. b-actin was used as an
internal control to normalize the data. Exposure-induced
alterations are expressed in relative quantification.
Western Blot Analysis for Markers of Stemness, Neuronal
Cells and Xenobiotic Metabolism
The altered expression of marker proteins of stemness (CD34,
THY1, CD133 and NANOG), neuronal cells (NES, PSA-
NCAM, SYP, CREB, AMPA receptor and NR2A receptor) and
xenobiotic metabolism (AHR, CYP1A1 and GSTP1-1) was
studied in differentiating cells at days 2, 4 and 8 of maturation.
Proteins harvested from different experimental and control
groups were processed for western blot analysis following the
protocol described earlier by us (Kashyap et al. 2010). In brief,
following exposures, cells were scraped, pelleted and lysed
using CelLyticTM M Cell Lysis Reagent (Sigma St. Louis,
USA) in the presence of protein inhibitor cocktail (Sigma St.
Louis, USA). After protein estimation by Bradford’s Reagent
(Fermentas Inc., Maryland, USA), equal amount (40 lg/well)
of denatured proteins was loaded onto 10 % SDS gel and
blotted to polyvinylidene fluoride (PVDF) membrane (Milli-
pore, USA) by wet transfer method using transfer buffer
(25 mM Tris (pH 8.3), 190 mM glycine, 20 % methanol) at
Table 1 Real-time PCR primer sequence for genes of human stem cell markers, cytochrome P450s, their receptor regulators and GSTP1-1
Genes Forward primer Reverse primer Reference
CD34 50-gccctgctggctgtcttg-30 50-gctgcggcgattcatca-30 Primer express 3.0
THY 50-tcaggaaatggcttttccca-30 50-tcctcaatgagatgccataagct-30 (True et al. 2010)
CD133 50-cgtgattttttactacctgg-30 50-gggtggcatgcctgtcatag-30 Primer express 3.0
NANOG 50-aaatctaagaggtggcagaa-30 50-cttctgcgtcacaccattgc-30 Primer express 3.0
NESTIN 50-gaactctcgcttgcagacacct-30 50-tgctggtcctctggtatcccaa-30 (Scobioala et al. 2008)
NCAM 50-gagatcagcgttggagagtcc-30 50-ggagaaccaggagatgtctttatctt-30 (Valentiner et al. 2011)
SYP 50-actcctcgtcagccgaattct-30 50-gcccccatggagtagaggaa-30 Primer express 3.0
CREB 50-ttcagtctccacaagtccaaaca-30 50-cccttcgcttttgggaatc-30 Primer express 3.0
GRIA2 50-tggcatcgcaacacctaaag-30 50-ccttgctcactgagtttcaatactg-30 Primer express 3.0
GRIN2A 50-cacggagagaaacattcggaata-30 50-agactgcggcatcgtagatga-30 Primer express 3.0
AHR 50-cggctgggcaccatga-30 50-ctgggattggctttactgttttct-30 Primer express 3.0
CYP1A1 50-accttccgacactcttccttcg30 50-aagcggatttgtcttggtgaa-30 (Shao et al. 2007)
GSTP1-1 50-gtagtttgcccaaggtcaag-30 50-agccacctgaggggtaag-30 Primer express 3.0
b-actin 50-aaccccaaggccaaccg-30 50-agggatagcacagcctgga-30 (Shao et al. 2007)
Neuromol Med
123
Author's personal copy
250 mA current for 2 h. Nonspecific binding was blocked with
2 % BSA and 3 % non-fat dry milk powder in TBST (20 mM
Tris–HCl (pH 7.4), 137 mM NaCl and 0.1 % Tween 20) for 2 h
at 37 �C. After blocking, the membranes were incubated
overnight at 4 �C with primary antibodies specific for AHR
(1:1000, Abcam, USA), CYP1A1, NESTIN, SYP, PSA-
NCAM, CREB, AMPA, NR2A (1:1000, Chemicon, USA),
GSTP1-1 (1:1000, Calbiochem, USA), b-actin (1:5000, Sigma,
USA) in blocking buffer (pH 7.5). The membrane was then
incubated for 2 h at room temperature with secondary anti-
primary immunoglobulin G (IgG)-conjugated with horseradish
peroxidase (Chemicon, USA). Then, the blots were developed
using Super Signal West Fempto Chemiluminescent Sub-
strateTM (Thermo Fisher Scientific, USA) and Bio Rad Versa
DocTM Imaging System 4000 (Bio-Rad, PA, USA). The den-
sitometry for protein-specific bands was done in Gel Docu-
mentation System (Alpha Innotech, USA) with the help of
Alpha EaseTM FC Stand Alone v.4.0 software.
7-Ethoxyresorufin-O-Deethylase (EROD) for CYP1A1
Catalytic Activity
Microsome Preparation
Following the completions of exposure period (24 h), cells
were harvested from MC exposed and control groups and
processed for microsome preparation following the protocol
described earlier by us (Kapoor et al. 2006). In brief, cells
were scrapped in PBS at 4 �C and pelleted by centrifuging at
5009g for 10 min. The cell pellet was resuspended in
microsomal dilution buffer containing 0.1 % (v/v) glycerol,
0.25 mM protease inhibitors cocktail, 0.01 M EDTA and
0.1 mM dithiothreitol. The cells were then sonicated thrice
at 20 Hz for 10 s each. Following sonication, the cells were
again centrifuged at 9,0009g for 20 min. The supernatant
was then further centrifuged at 105,0009g for 60 min, to
isolate the microsomal fraction. The microsomal pellet thus
obtained was then resuspended in microsomal dilution buf-
fer and protein estimation was done by Bradford’s Reagent
(Fermentas Inc., Maryland, USA).
Enzymatic Activity of CYP1A1
CYP content in microsomes of differentiating neuronal cells
(days 0, 2, 4 and 8), exposed to MC described earlier along
with unexposed control, were assayed by the carbon mon-
oxide difference spectrum after reduction with sodium
dithionite. The activity of 7-ethoxyresorufin-O-deethylase
(EROD) was determined in microsomes by the methods of
Kapoor et al. 2006. The reaction mixture in 1.25 ml con-
tained 50 mM Tris buffer, pH 7.5, 25 mM MgC12,
0.005 mM ethoxyresorufin and suitable amount of micro-
somal enzyme. The reaction was initiated by the addition of
0.5 mM nicotinamide adenine dinucleotide phosphate-oxi-
dase (NADPH) following incubation of reaction mixture at
37 �C for 30 min. After incubation, reactions were termi-
nated by adding 2 ml of methanol and the mixtures were
centrifuged at 2,0009g for 10 min. Levels of resorufin in the
supernatant were measured using a Perkin Elmer LS 55
Luminescence spectrometer at excitation wavelength of
550 nm and emission wavelength of 585 nm.
Suppression of AHR Gene Expression in Stem Cells
by siRNA Transfection
Human cord blood stem cell–derived differentiating neu-
ronal cells (days 2, 4 and 8) were transfected with 100 nM
siRNA using LipofectamineTM 2000 (Invitrogen, USA)
following the manufacturer’s instructions. Transfection
efficiency was recorded more than 60 % through all the
experiments as determined by counting the number of
siGLO Lamin A/C (Dharmacon, USA) positive cells using
fluorescent microscope (Nikon Eclipse 80i equipped with
Nikon DS-Ril 12.7-megapixel camera, Japan). Following
24 h of transfection, differentiating neuronal cells were
exposed to 4 lM of MC. After the completion of exposure
period, the expression (mRNA/protein) of AHR and
selected neuronal markers, viz. nestin, SYP, PSA-NCAM,
CREB, AMPA receptor and NR2A receptor, was measured
all through the differentiation. siRNAs specific to AHR,
control siRNA and siGLO Lamin A/C siRNA were
obtained as siGENOME SMARTpool reagent (Dharmacon,
USA), which contained a pool of four different siRNAs.
Further, the specificity of siRNA was assessed, and it was
ensured that it did not suppress irrelevant genes like b-actin
and suppressed the expression of the relevant gene—AHR.
Statistical Analysis
The results are expressed as mean and standard error of
means (Mean ± SE) for at least three experiments. One-
way analysis of variance (ANOVA) followed by post hoc
Dunnett’s test and Student’s t-test were employed to detect
differences between the groups of treated and control.
Graphpad Prism 3.0 software (Graphpad Software) was
used for all the statistical analyses. The value p \ 0.05 was
considered to be significant.
Results
In Silico Molecular Docking Analysis
of 3-Methylcholanthrene
The aim of the molecular docking study was to elucidate
the possible mechanisms of action of test compound MC in
Neuromol Med
123
Author's personal copy
modulation of the human CYP regulators, AHR and
ARNT; neurogenesis-related transcription factor CREB;
and neurotransmitter receptor, NMDA and AMPA recep-
tors. The results of the molecular docking suggest that
studied compound modulates the activity of these recep-
tors. In the present study, we explored the orientation and
binding affinity (in terms of the total docking score) of MC
toward the selected targets (Fig. 1 and Table 2).
Homology modeling approaches were used to predict
the structure of AHR which was used as a template on the
basis of highest sequence identity. To check the authen-
ticity of predicted 3D structure, models were subjected to
Ramachandran plot analysis. The model_9 was selected
based on highest number of residues present in the allowed
region of Ramachandran plot. The docking results for MC
against AHR (through homology modeling) also showed
high binding affinity docking score indicated by total score
of 4.1343. In docking pose, the chemical nature of binding
site residues within a radius of 4A from bound compound
was basic (polar, hydrophobic and positive charged), that
is, LEU-19, LEU-20, LEU-190, PRO-226 (leucine), PRO-
21, PRO-146 (proline), ARG-191 (arginine); nucleophilic
(polar, hydrophobic), that is, SER-147, SER-152 (serine),
CYS-192 (cysteine); aromatic (hydrophobic), that is, PHE-
22 (phenylalanine); and polar amide, that is, ASN-145
(asparagine); thus, bound compound showed high binding
affinity and strong hydrophobic interaction which may lead
to more stability and activity (Fig. 1a).
The docking results for MC against ARNT (PDB ID:
2A24) showed a high binding affinity docking score indicated
by a total score of 2.419. However, the docking score for
ARNT is lower than that of AHR confirming the lesser binding
of MC to ARNT. In the docking pose, the chemical nature of
binding site residues within a radius of 4A from bound com-
pound was nucleophilic (polar, hydrophobic), that is, THR-85
(threonine); basic (polar, hydrophobic and positive charged),
that is, HIS-12 and HIS-57 (histidine); hydrophobic, that is,
MET-16, MET-53, MET-73 (Methionine), GLY-87 (gly-
cine), ALA-41 (alanine), ILE-101 (isoleucine); aromatic
(hydrophobic), that is, TYR-45, TYR-71 (tyrosine), PHE-8,
PHE-18 (phenylalanine); nucleophilic (polar, hydrophobic),
that is, SER-10, SER-68 (serine), CYS-103 (cysteine); and
polar amide, that is, GLN-86 (glutamine), ASN-105 (aspara-
gine); thus, bound compound showed high binding affinity
and strong hydrophobic interaction which may lead to more
stability and activity (Fig. 1b).
Similarly, the docking results for MC against neuro-
genesis-related transcription factor CREB (PDB ID: 1DH3)
showed high binding affinity docking score indicated by
total score of 5.5392. In docking pose, the chemical nature
of binding site residues within a radius of 4 A from bound
compound were basic (polar, hydrophobic and positive
charged), that is, ARG301 (arginine), LYS-304, LYS-305
(lysine); nucleophilic (polar, hydrophobic), that is, SER-
300 (serine); thus, bound compound showed high binding
affinity and indicates strong hydrophobic interaction which
may lead to more stability and activity (Fig. 1c). The
docking of adenosine-50-triphosphate (ATP) onto CREB
showed high binding affinity with total docking score of
4.5622 and also showed the formation of a three H-bond of
length 2.9, 2.6 and 2.3 A to the hydrophobic nucleophilic
(polar, hydrophobic and positive charged) residues, that is,
ARG-301, LYS-304 and LYS-305. The ATP-CREB pro-
tein docked complex also showed binding site residues
within a radius of 4A of bound ligand such as basic (polar,
hydrophobic and positive charged) residues, for example,
ARG-301 (arginine), LYS-304, LYS-305 (lysine) with
strong and stable hydrophobic interactions (Fig. 1d). Sur-
prisingly, MC share the same residue of amino acids in
binding pocket as in the case of ATP with higher total
docking score of 5.5392. Thus, MC showed competitive
binding to CREB and possibly interfered with the phos-
phorylation of CREB protein which is necessary for its
functionality.
Similarly, the docking results for MC against neuro-
transmitter NMDA receptor (PDB ID: 2A5S) showed high
binding affinity docking score indicated by total score of
2.6179. In docking pose, the chemical nature of binding
site residues within a radius of 4A from bound compound
was basic (polar, hydrophobic and positive charged), that
is, HIS-88 (histidine), LYS-87, LYS-222 (lysine); hydro-
phobic, that is, ALA-17 (alanine), ILE-21 (isoleucine),
LEU-14 (leucine), VAL-197 (valine); aromatic (hydro-
phobic), that is, TYR-214 (tyrosine); and acidic (polar,
negative charged), that is, GLU-15, GLU-16, GLU-198
(Glutamic acid); thus, bound compound showed high
binding affinity and strong hydrophobic interaction which
may lead to more stability and activity (Fig. 1e).
Likewise, the docking results for MC against neuro-
transmitter AMPA receptor (PDB ID: 3KG2) showed high
binding affinity docking score indicated by total score of
5.2795. In docking pose, the chemical nature of binding site
residues within a radius of 4A from bound compound was
acidic (polar, negative charged), that is, GLU-402, GLU-705
(Glutamic acid); nucleophilic (polar, hydrophobic), that is,
THR-707 (threonine); basic (polar, hydrophobic and posi-
tive charged), that is, ARG-485 (arginine); hydrophobic, that
is, MET-708 (Methionine), GLY-451, GLY-653 (glycine),
LEU-479, LEU-650 (leucine), PRO-478 (proline); aromatic
(hydrophobic), that is, TYR-405, TYR-450, TYR-732
(tyrosine); and nucleophilic (polar, hydrophobic), that is,
SER-403, SER-654 (serine); thus, bound compound showed
high binding affinity and strong hydrophobic interaction
which may lead to more stability and activity (Fig. 1f). The
docking reliability between MC and AMPA receptor was
validated by using the known crystallized X-ray structure of
Neuromol Med
123
Author's personal copy
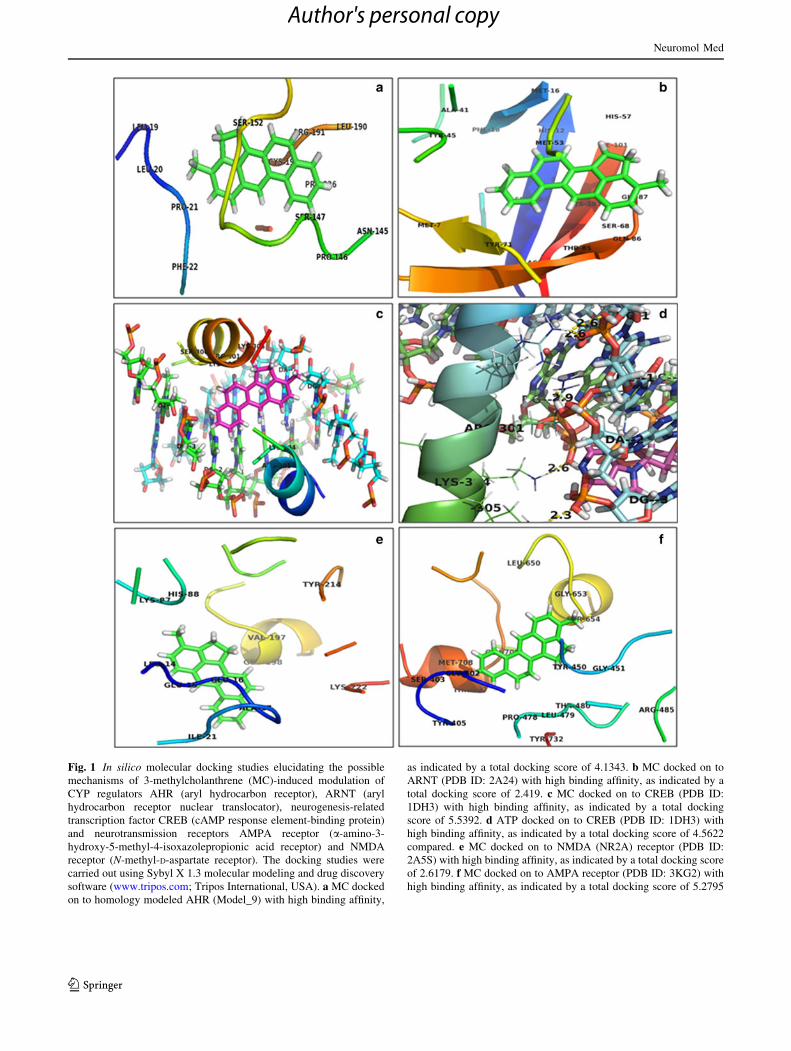
Fig. 1 In silico molecular docking studies elucidating the possible
mechanisms of 3-methylcholanthrene (MC)-induced modulation of
CYP regulators AHR (aryl hydrocarbon receptor), ARNT (aryl
hydrocarbon receptor nuclear translocator), neurogenesis-related
transcription factor CREB (cAMP response element-binding protein)
and neurotransmission receptors AMPA receptor (a-amino-3-
hydroxy-5-methyl-4-isoxazolepropionic acid receptor) and NMDA
receptor (N-methyl-D-aspartate receptor). The docking studies were
carried out using Sybyl X 1.3 molecular modeling and drug discovery
software (www.tripos.com; Tripos International, USA). a MC docked
on to homology modeled AHR (Model_9) with high binding affinity,
as indicated by a total docking score of 4.1343. b MC docked on to
ARNT (PDB ID: 2A24) with high binding affinity, as indicated by a
total docking score of 2.419. c MC docked on to CREB (PDB ID:
1DH3) with high binding affinity, as indicated by a total docking
score of 5.5392. d ATP docked on to CREB (PDB ID: 1DH3) with
high binding affinity, as indicated by a total docking score of 4.5622
compared. e MC docked on to NMDA (NR2A) receptor (PDB ID:
2A5S) with high binding affinity, as indicated by a total docking score
of 2.6179. f MC docked on to AMPA receptor (PDB ID: 3KG2) with
high binding affinity, as indicated by a total docking score of 5.2795
Neuromol Med
123
Author's personal copy
AMPA receptor complexed with {[7-morpholin-4-yl-2,
3-dioxo-6- (trifluoromethyl)-3,4-dihydroquinoxalin-1-
(2H)-yl] methyl} phosphonic acid inhibitor. The co-crys-
tallized inhibitor was re-docked into the binding site of
AMPA receptor with total docking score of 12.7636 and was
selected as the most probable binding conformation. The low
root mean-square deviation (RMSD) of 0.6798 A between
the docked and the crystal conformations indicates the high
reliability of Surflex-Dock software in reproducing the
experimentally observed binding mode for this inhibitor. As
shown in Fig. 2a, redocked molecules were almost in the
same position with co-crystallized at the active site of
inhibitor. This redocking study was carried out to confirm the
proper functionality of our system which served as a positive
control.
Protein–Protein Molecular Interaction
The docking result for AHR (model_9; designed by us)
against neurogenesis transcription factor CREB (PDB ID:
1DH3) showed a high binding affinity docking score
indicated by a ZDOCK score of 25.48 (Fig. 2b). In the
docking pose, the chemical nature of binding site residues
within a radius of 6A from bound surface was hydrophobic
due to glycine (GLY-113, GLY-357), valine (VAL-119,
VAL-166, VAL-167), leucine (LEU-127, LEU-181), iso-
leucine (ILE-128, ILE-174), alanine (ALA-134) and pro-
line (PRO-171, PRO-175, PRO-176, PRO-180). This
binding site also showed hydrophobic chemical nature due
to aromatic residues, viz. phenylalanine (PHE-114, PHE-
136) and tyrosine (TYR-125, TYR-169). The binding site
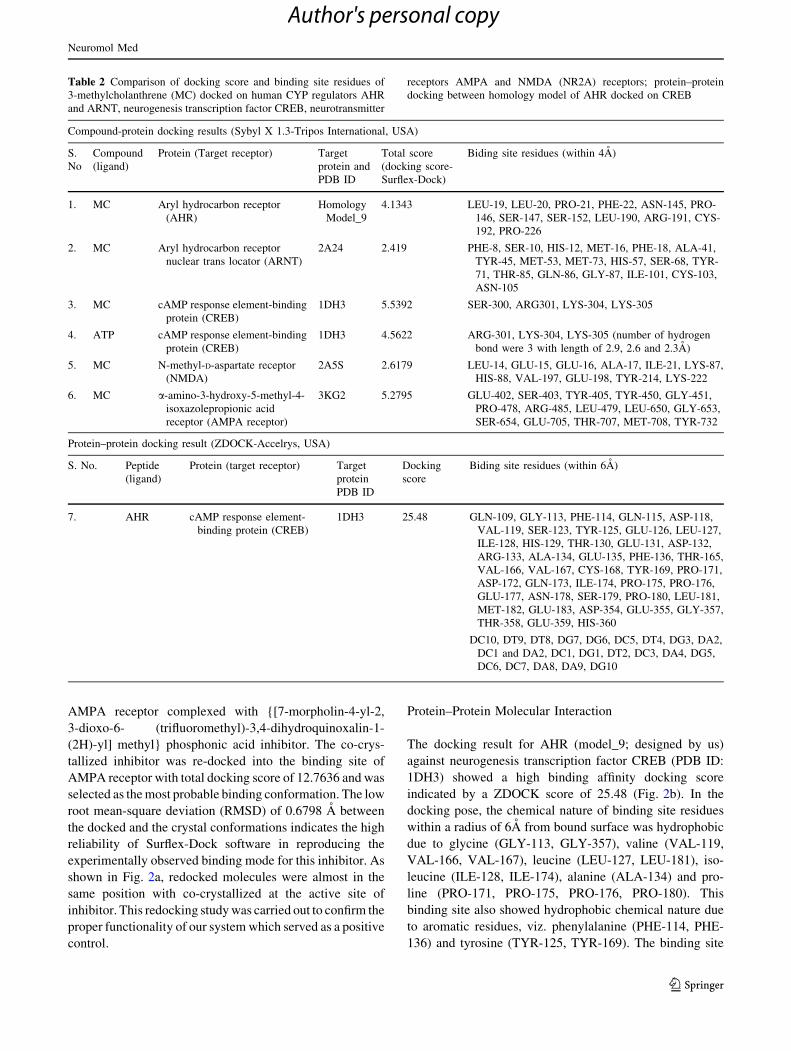
Table 2 Comparison of docking score and binding site residues of
3-methylcholanthrene (MC) docked on human CYP regulators AHR
and ARNT, neurogenesis transcription factor CREB, neurotransmitter
receptors AMPA and NMDA (NR2A) receptors; protein–protein
docking between homology model of AHR docked on CREB
Compound-protein docking results (Sybyl X 1.3-Tripos International, USA)
S.
No
Compound
(ligand)
Protein (Target receptor) Target
protein and
PDB ID
Total score
(docking score-
Surflex-Dock)
Biding site residues (within 4A)
1. MC Aryl hydrocarbon receptor
(AHR)
Homology
Model_9
4.1343 LEU-19, LEU-20, PRO-21, PHE-22, ASN-145, PRO-
146, SER-147, SER-152, LEU-190, ARG-191, CYS-
192, PRO-226
2. MC Aryl hydrocarbon receptor
nuclear trans locator (ARNT)
2A24 2.419 PHE-8, SER-10, HIS-12, MET-16, PHE-18, ALA-41,
TYR-45, MET-53, MET-73, HIS-57, SER-68, TYR-
71, THR-85, GLN-86, GLY-87, ILE-101, CYS-103,
ASN-105
3. MC cAMP response element-binding
protein (CREB)
1DH3 5.5392 SER-300, ARG301, LYS-304, LYS-305
4. ATP cAMP response element-binding
protein (CREB)
1DH3 4.5622 ARG-301, LYS-304, LYS-305 (number of hydrogen
bond were 3 with length of 2.9, 2.6 and 2.3A)
5. MC N-methyl-D-aspartate receptor
(NMDA)
2A5S 2.6179 LEU-14, GLU-15, GLU-16, ALA-17, ILE-21, LYS-87,
HIS-88, VAL-197, GLU-198, TYR-214, LYS-222
6. MC a-amino-3-hydroxy-5-methyl-4-
isoxazolepropionic acid
receptor (AMPA receptor)
3KG2 5.2795 GLU-402, SER-403, TYR-405, TYR-450, GLY-451,
PRO-478, ARG-485, LEU-479, LEU-650, GLY-653,
SER-654, GLU-705, THR-707, MET-708, TYR-732
Protein–protein docking result (ZDOCK-Accelrys, USA)
S. No. Peptide
(ligand)
Protein (target receptor) Target
protein
PDB ID
Docking
score
Biding site residues (within 6A)
7. AHR cAMP response element-
binding protein (CREB)
1DH3 25.48 GLN-109, GLY-113, PHE-114, GLN-115, ASP-118,
VAL-119, SER-123, TYR-125, GLU-126, LEU-127,
ILE-128, HIS-129, THR-130, GLU-131, ASP-132,
ARG-133, ALA-134, GLU-135, PHE-136, THR-165,
VAL-166, VAL-167, CYS-168, TYR-169, PRO-171,
ASP-172, GLN-173, ILE-174, PRO-175, PRO-176,
GLU-177, ASN-178, SER-179, PRO-180, LEU-181,
MET-182, GLU-183, ASP-354, GLU-355, GLY-357,
THR-358, GLU-359, HIS-360
DC10, DT9, DT8, DG7, DG6, DC5, DT4, DG3, DA2,
DC1 and DA2, DC1, DG1, DT2, DC3, DA4, DG5,
DC6, DC7, DA8, DA9, DG10
Neuromol Med
123
Author's personal copy
also showed nucleophilic chemical nature due to polar
hydrophobic residues, viz. threonine (THR-130, THR-
165), cysteine (CYS-168) and methionine (MET-182). The
binding site also showed basic polar hydrophobic chemical
nature due to positive-charged residues such as arginine
(ARG-133) and histidine (HIS-129, HIS-360). The binding
site also showed polar amide chemical nature due to glu-
tamine (GLN-109, GLN-115, GLN-173), asparagines
(ASN-178, ASP-118, ASP-132, ASP-172, ASP-354) and
glutamic acid (GLU-126, GLU-131, GLU-135, GLU-177,
GLU-183, GLU-355, GLU-359) amino acid residues. The
binding site also showed hydroxylic chemical nature due to
serine (SER-123, SER-179), amino acid residues. More-
over, DNA nucleotide residues, viz. DC10, DT9, DT8,
DG7, DG6, DC5, DT4, DG3, DA2, DC1 and DA2, DC1,
DG1, DT2, DC3, DA4, DG5, DC6, DC7, DA8, DA9,
DG10, were also present at DNA-binding domain in the
vicinity of bound peptide and showed the DNA-binding
site of target protein. Therefore, bound peptide showed a
high binding affinity and strong hydrophobic interaction on
target protein surface which may lead to more stability and
biological activity (Fig. 2b).
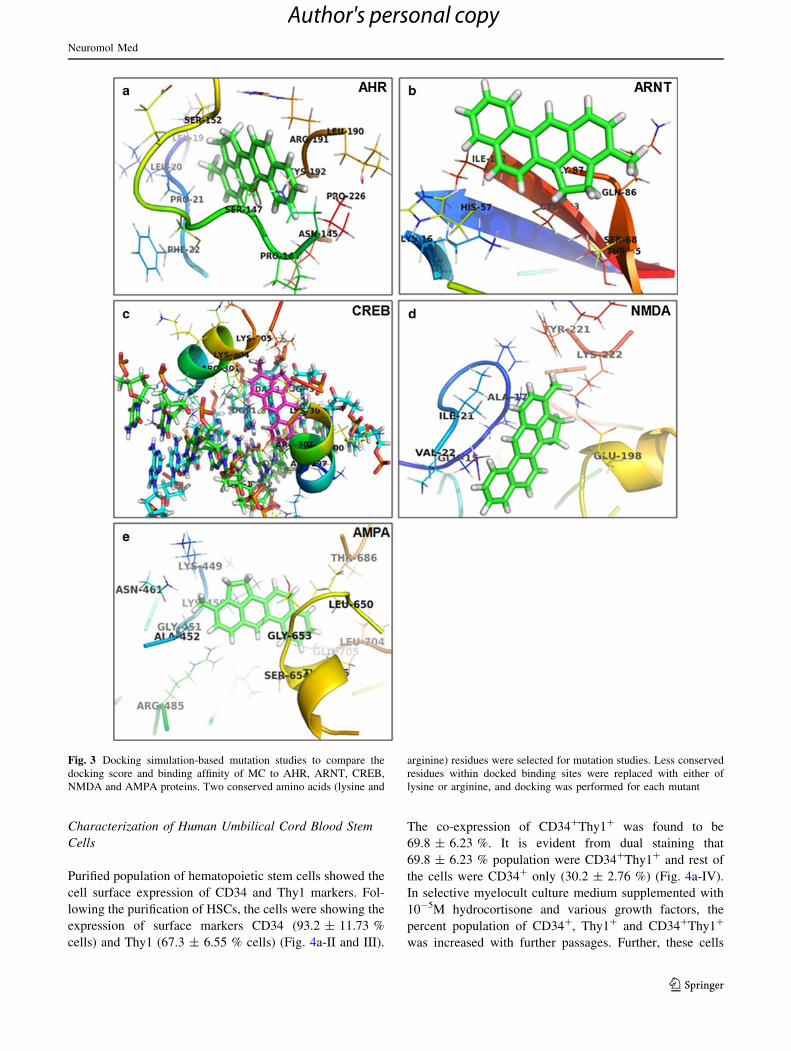
Mutation Docking Analysis of 3-Methylcholanthrene
In order to confirm the binding affinity of MC with down-
stream target proteins, docking simulation-based mutation
studies were carried out. In the mutation studies, it was
observed that all mutants were having low binding affinity
with MC, except the N-methyl-D-aspartate (NMDA) recep-
tor (PDB: 2A5S) mutant (Fig. 3a–e, Table 3). When less
conserved residues of low docking score binding sites are
replaced with Lys or Arg, the binding affinity for MC
increases, e.g., N-methyl-D-aspartate receptor (NMDA),
while high docking score binding sites showed no/decrease
in binding affinity, e.g., cAMP response element-binding
protein (CREB). Mutational docking results suggest that
lysine (Lys) residues play an important role in binding
affinity. Less conserved residues were identified on the basis
of their presence in low docking score binding sites and their
absence in high docking score complexes.
In Vitro Studies
Isolation, Purification and Culture of CD34?
Hematopoietic Stem Cells
Following the purification, the frequency of CD34? cells
was found to be 95-115 cells/ml of cord blood. The via-
bility of the HSCs was determined with trypan blue dye
exclusion method, and viability was found ranging from 83
to 92 %. Purified HSCs were cultured in selective myelo-
cult culture medium supplemented with cocktails of growth
factors for 4–6 months. The total cell counts were per-
formed weekly using haemocytometer. The cells grown
under deprivation of growth factors showed a rapid
decrease in cell number during the first 4 weeks, and by the
week 5, no cells were alive. In the long-term cultures
(LTC) containing the cocktails of growth factors, a pro-
gressive, steady increase in cell production could be seen.
After reaching 80–85 % confluency, the cells were pas-
saged for further proliferation.
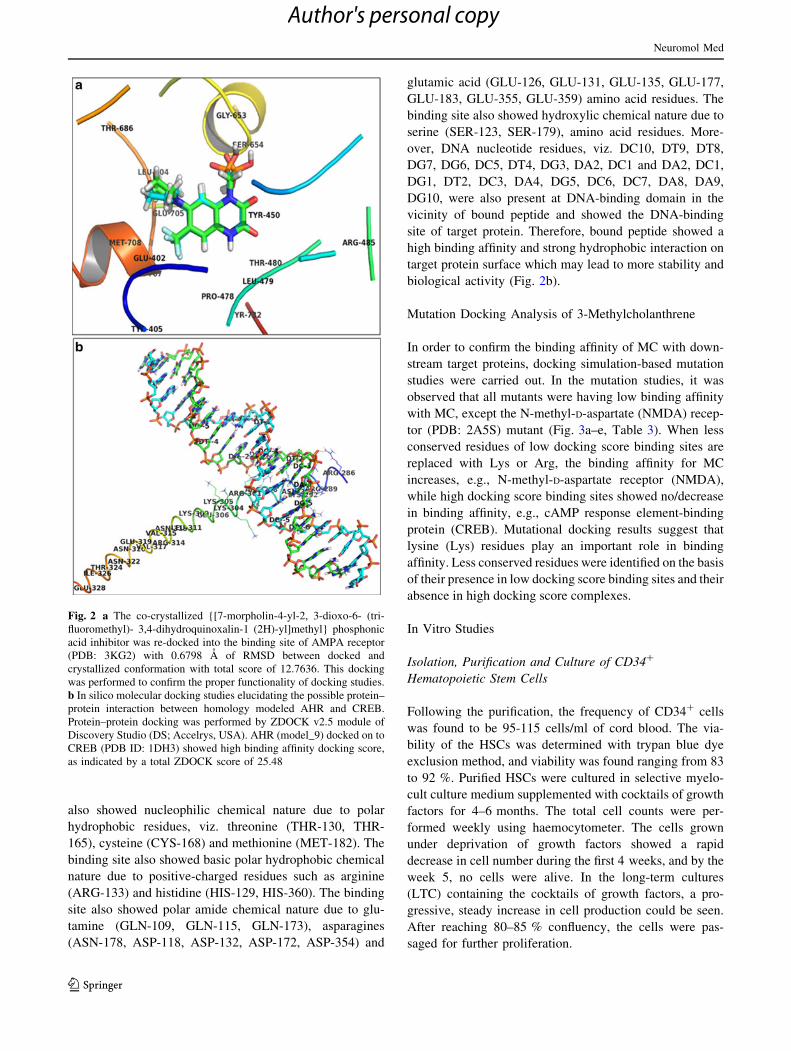
Fig. 2 a The co-crystallized {[7-morpholin-4-yl-2, 3-dioxo-6- (tri-
fluoromethyl)- 3,4-dihydroquinoxalin-1 (2H)-yl]methyl} phosphonic
acid inhibitor was re-docked into the binding site of AMPA receptor
(PDB: 3KG2) with 0.6798 A of RMSD between docked and
crystallized conformation with total score of 12.7636. This docking
was performed to confirm the proper functionality of docking studies.
b In silico molecular docking studies elucidating the possible protein–
protein interaction between homology modeled AHR and CREB.
Protein–protein docking was performed by ZDOCK v2.5 module of
Discovery Studio (DS; Accelrys, USA). AHR (model_9) docked on to
CREB (PDB ID: 1DH3) showed high binding affinity docking score,
as indicated by a total ZDOCK score of 25.48
Neuromol Med
123
Author's personal copy
Characterization of Human Umbilical Cord Blood Stem
Cells
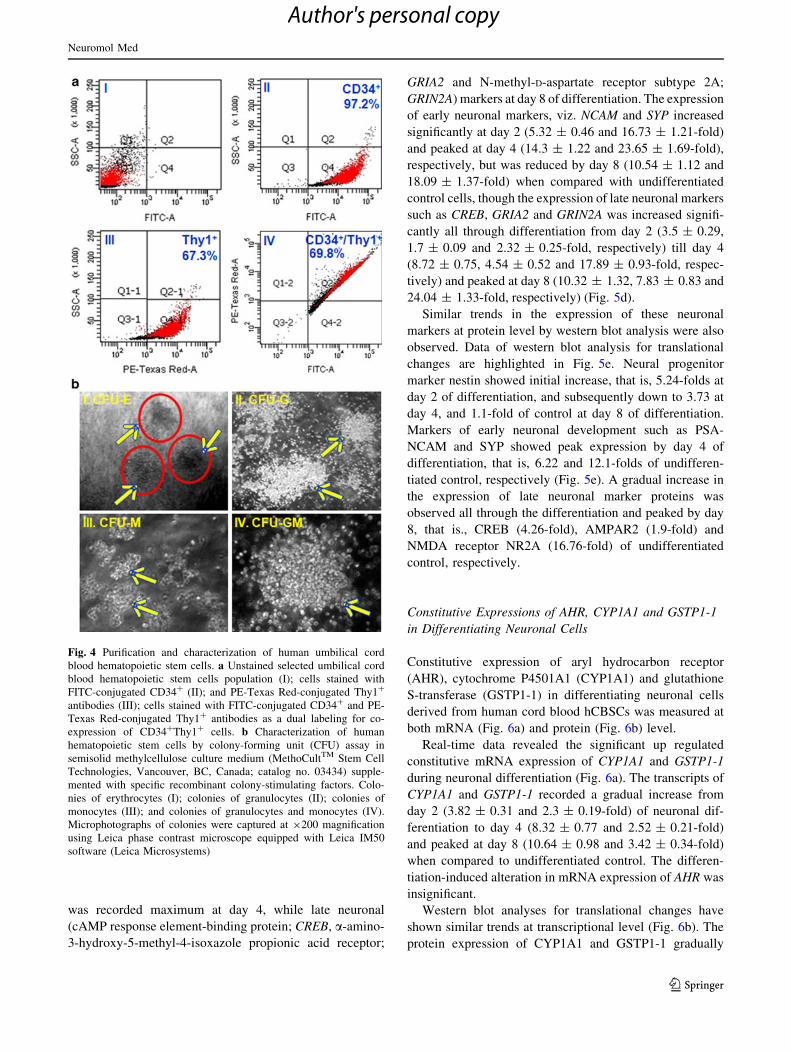
Purified population of hematopoietic stem cells showed the
cell surface expression of CD34 and Thy1 markers. Fol-
lowing the purification of HSCs, the cells were showing the
expression of surface markers CD34 (93.2 ± 11.73 %
cells) and Thy1 (67.3 ± 6.55 % cells) (Fig. 4a-II and III).
The co-expression of CD34?Thy1? was found to be
69.8 ± 6.23 %. It is evident from dual staining that
69.8 ± 6.23 % population were CD34?Thy1? and rest of
the cells were CD34? only (30.2 ± 2.76 %) (Fig. 4a-IV).
In selective myelocult culture medium supplemented with
10-5M hydrocortisone and various growth factors, the
percent population of CD34?, Thy1? and CD34?Thy1?
was increased with further passages. Further, these cells
Fig. 3 Docking simulation-based mutation studies to compare the
docking score and binding affinity of MC to AHR, ARNT, CREB,
NMDA and AMPA proteins. Two conserved amino acids (lysine and
arginine) residues were selected for mutation studies. Less conserved
residues within docked binding sites were replaced with either of
lysine or arginine, and docking was performed for each mutant
Neuromol Med
123
Author's personal copy
were characterized by clonogenic potential under the
influence of lineage-specific cytokine. HSCs showed the
commitment toward erythrocytes, granulocytes, monocytes
and granulocytes–monocytes lineages and resulted in the
formation of well-differentiated colony of respective lin-
eages, viz. CFU-E, CFU-G, CFU-M and CFU-GM
(Fig. 4b).
Neuronal Differentiation of Human Umbilical Cord Blood
Stem Cells
Morphological Study: hCBSCs were differentiated into
neuronal subtype, and differentiating neuronal cells at
various stages of maturities are highlighted in Fig. 5a.
After the onset of differentiation at day 2, the HSCs started
differentiating into neuronal morphology with clearly dis-
tinct cell body and dendrites. Upon further differentiation,
the neuronal cell bodies were found increasing with mul-
tiple cell processes at day 4. Subsequently, at day 8, more
than 95 % of cells acquired neuronal morphology with
extended neurites and well-arranged neuronal networks.
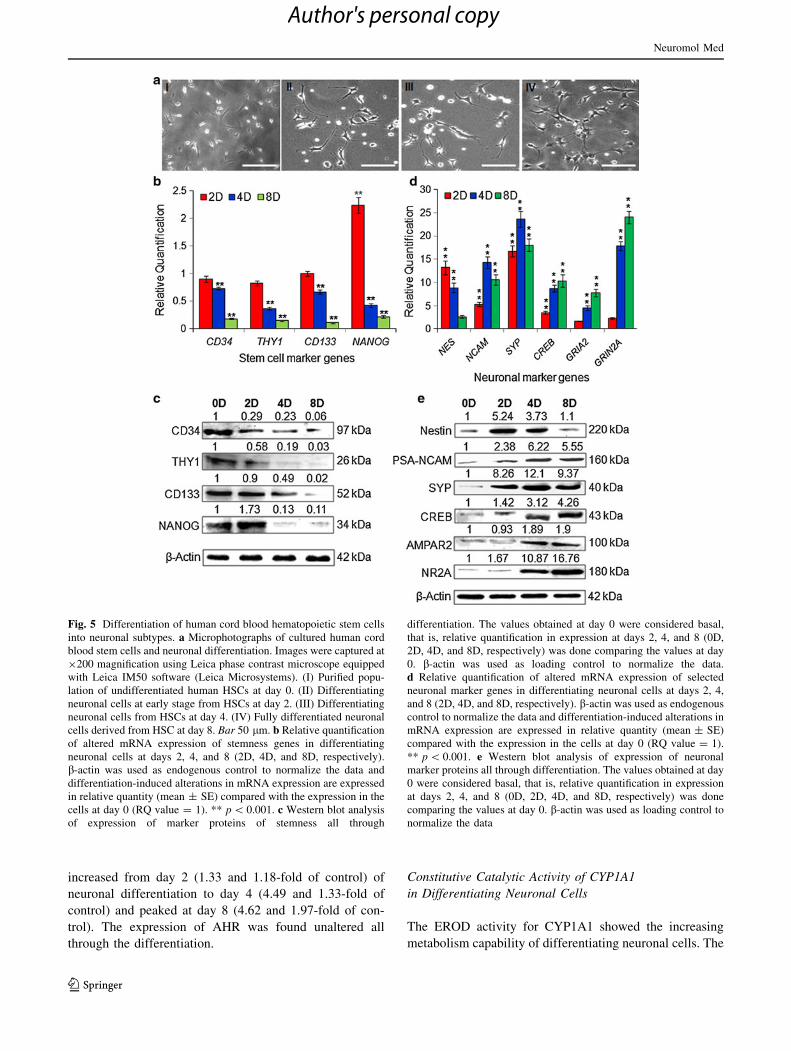
Study of Stemness Markers: Morphological changes
observed were accompanied by detectable down regulated
expression in transcripts of stemness marker genes. Quan-
titative RT-PCR analysis revealed that the mRNA expres-
sion of stemness marker genes (CD34, THY1, CD133 and
NANOG) was down regulated significantly (p \ 0.001) with
the progress of differentiation. The expressions of CD34,
THY1 and CD133 were found to be significantly decreasing
with the progress of neuronal differentiation, that is,
0.9 ± 0.05, 0.83 ± 0.04, 1.0 ± 0.03-fold and 0.73 ± 0.03,
0.37 ± 0.02, 0.67 ± 0.03-fold on days 2 and 4, respectively,
when compared to undifferentiated cells at day zero. At day 8
of neuronal maturity, the transcriptional expression of CD34,
THY1 and CD133 was not detectable, that is, 0.18 ± 0.012,
0.15 ± 0.012, 0.11 ± 0.013-fold, respectively, while
NANOG showed a biphasic response with increased
expression at day 2 (2.24 ± 0.14) and thereafter at days 4
and 8 reduced to 0.43 ± 0.03-fold and 0.22 ± 0.023-fold of
control (Fig. 5b).
Data of western blot analysis are highlighted in Fig. 5c.
Data showed significant alterations in protein expression of
stemness markers, viz. CD34 (0.29, 0.23 and 0.06-fold of
undifferentiated control), THY1 (0.58, 0.19 and 0.03-fold
of undifferentiated control), CD133 (0.9, 0.49 and 0.02-
fold of undifferentiated control) and NANOG (1.73, 0.13
and 0.11-fold of undifferentiated control) at days 2, 4 and 8
of differentiation, respectively.
Study of Neuronal Markers: The transcriptional changes
in the expression of selected neuronal markers are pre-
sented in Fig 5d. The mRNA expression of neural pro-
genitor marker nestin (NES) recorded significantly higher
at day 2 (13.2 ± 1.52-fold) and thereafter a reduction in
subsequent differentiation at day 4 (8.87 ± 1.03-fold) and
day 8 (2.66 ± 0.32-fold). However, the overall expression
of nestin was higher than the undifferentiated cells. The
expressions of early and late neuronal markers were
increased with progression of differentiation. In general,
the mRNA expression of early neuronal markers (neural
cell adhesion molecules; NCAM and synaptophysin; SYP)
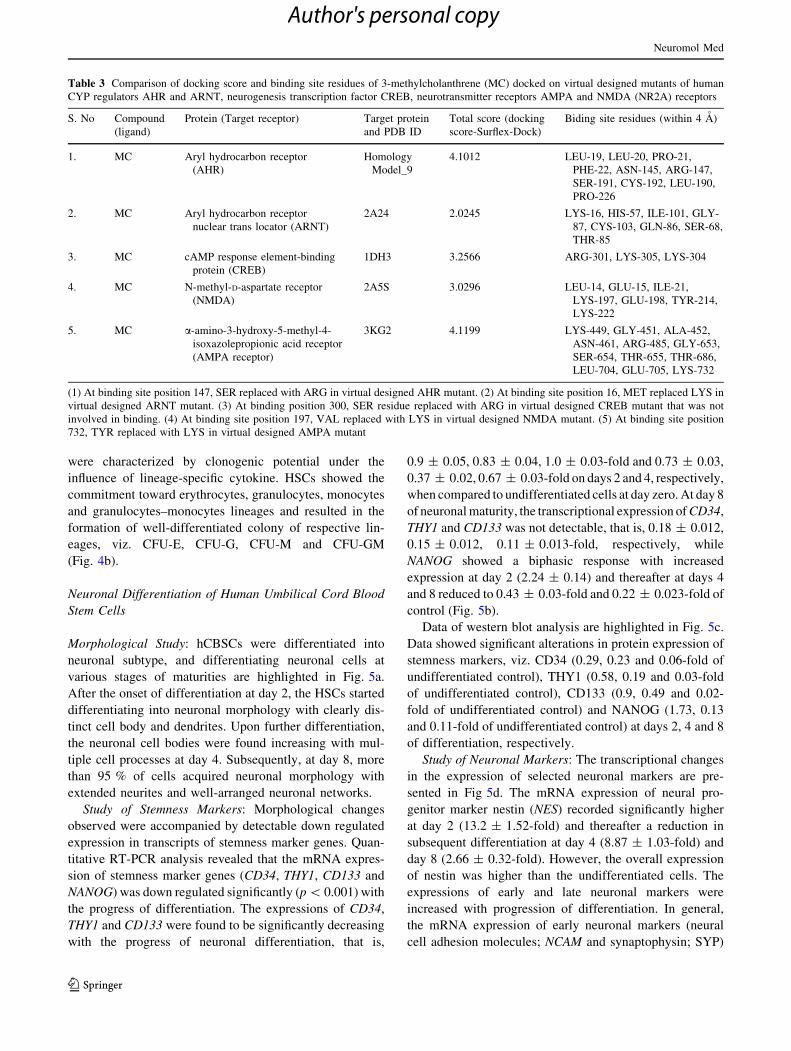
Table 3 Comparison of docking score and binding site residues of 3-methylcholanthrene (MC) docked on virtual designed mutants of human
CYP regulators AHR and ARNT, neurogenesis transcription factor CREB, neurotransmitter receptors AMPA and NMDA (NR2A) receptors
S. No Compound
(ligand)
Protein (Target receptor) Target protein
and PDB ID
Total score (docking
score-Surflex-Dock)
Biding site residues (within 4 A)
1. MC Aryl hydrocarbon receptor
(AHR)
Homology
Model_9
4.1012 LEU-19, LEU-20, PRO-21,
PHE-22, ASN-145, ARG-147,
SER-191, CYS-192, LEU-190,
PRO-226
2. MC Aryl hydrocarbon receptor
nuclear trans locator (ARNT)
2A24 2.0245 LYS-16, HIS-57, ILE-101, GLY-
87, CYS-103, GLN-86, SER-68,
THR-85
3. MC cAMP response element-binding
protein (CREB)
1DH3 3.2566 ARG-301, LYS-305, LYS-304
4. MC N-methyl-D-aspartate receptor
(NMDA)
2A5S 3.0296 LEU-14, GLU-15, ILE-21,
LYS-197, GLU-198, TYR-214,
LYS-222
5. MC a-amino-3-hydroxy-5-methyl-4-
isoxazolepropionic acid receptor
(AMPA receptor)
3KG2 4.1199 LYS-449, GLY-451, ALA-452,
ASN-461, ARG-485, GLY-653,
SER-654, THR-655, THR-686,
LEU-704, GLU-705, LYS-732
(1) At binding site position 147, SER replaced with ARG in virtual designed AHR mutant. (2) At binding site position 16, MET replaced LYS in
virtual designed ARNT mutant. (3) At binding position 300, SER residue replaced with ARG in virtual designed CREB mutant that was not
involved in binding. (4) At binding site position 197, VAL replaced with LYS in virtual designed NMDA mutant. (5) At binding site position
732, TYR replaced with LYS in virtual designed AMPA mutant
Neuromol Med
123
Author's personal copy
was recorded maximum at day 4, while late neuronal
(cAMP response element-binding protein; CREB, a-amino-
3-hydroxy-5-methyl-4-isoxazole propionic acid receptor;
GRIA2 and N-methyl-D-aspartate receptor subtype 2A;
GRIN2A) markers at day 8 of differentiation. The expression
of early neuronal markers, viz. NCAM and SYP increased
significantly at day 2 (5.32 ± 0.46 and 16.73 ± 1.21-fold)
and peaked at day 4 (14.3 ± 1.22 and 23.65 ± 1.69-fold),
respectively, but was reduced by day 8 (10.54 ± 1.12 and
18.09 ± 1.37-fold) when compared with undifferentiated
control cells, though the expression of late neuronal markers
such as CREB, GRIA2 and GRIN2A was increased signifi-
cantly all through differentiation from day 2 (3.5 ± 0.29,
1.7 ± 0.09 and 2.32 ± 0.25-fold, respectively) till day 4
(8.72 ± 0.75, 4.54 ± 0.52 and 17.89 ± 0.93-fold, respec-
tively) and peaked at day 8 (10.32 ± 1.32, 7.83 ± 0.83 and
24.04 ± 1.33-fold, respectively) (Fig. 5d).
Similar trends in the expression of these neuronal
markers at protein level by western blot analysis were also
observed. Data of western blot analysis for translational
changes are highlighted in Fig. 5e. Neural progenitor
marker nestin showed initial increase, that is, 5.24-folds at
day 2 of differentiation, and subsequently down to 3.73 at
day 4, and 1.1-fold of control at day 8 of differentiation.
Markers of early neuronal development such as PSA-
NCAM and SYP showed peak expression by day 4 of
differentiation, that is, 6.22 and 12.1-folds of undifferen-
tiated control, respectively (Fig. 5e). A gradual increase in
the expression of late neuronal marker proteins was
observed all through the differentiation and peaked by day
8, that is., CREB (4.26-fold), AMPAR2 (1.9-fold) and
NMDA receptor NR2A (16.76-fold) of undifferentiated
control, respectively.
Constitutive Expressions of AHR, CYP1A1 and GSTP1-1
in Differentiating Neuronal Cells
Constitutive expression of aryl hydrocarbon receptor
(AHR), cytochrome P4501A1 (CYP1A1) and glutathione
S-transferase (GSTP1-1) in differentiating neuronal cells
derived from human cord blood hCBSCs was measured at
both mRNA (Fig. 6a) and protein (Fig. 6b) level.
Real-time data revealed the significant up regulated
constitutive mRNA expression of CYP1A1 and GSTP1-1
during neuronal differentiation (Fig. 6a). The transcripts of
CYP1A1 and GSTP1-1 recorded a gradual increase from
day 2 (3.82 ± 0.31 and 2.3 ± 0.19-fold) of neuronal dif-
ferentiation to day 4 (8.32 ± 0.77 and 2.52 ± 0.21-fold)
and peaked at day 8 (10.64 ± 0.98 and 3.42 ± 0.34-fold)
when compared to undifferentiated control. The differen-
tiation-induced alteration in mRNA expression of AHR was
insignificant.
Western blot analyses for translational changes have
shown similar trends at transcriptional level (Fig. 6b). The
protein expression of CYP1A1 and GSTP1-1 gradually
Fig. 4 Purification and characterization of human umbilical cord
blood hematopoietic stem cells. a Unstained selected umbilical cord
blood hematopoietic stem cells population (I); cells stained with
FITC-conjugated CD34? (II); and PE-Texas Red-conjugated Thy1?
antibodies (III); cells stained with FITC-conjugated CD34? and PE-
Texas Red-conjugated Thy1? antibodies as a dual labeling for co-
expression of CD34?Thy1? cells. b Characterization of human
hematopoietic stem cells by colony-forming unit (CFU) assay in
semisolid methylcellulose culture medium (MethoCultTM Stem Cell
Technologies, Vancouver, BC, Canada; catalog no. 03434) supple-
mented with specific recombinant colony-stimulating factors. Colo-
nies of erythrocytes (I); colonies of granulocytes (II); colonies of
monocytes (III); and colonies of granulocytes and monocytes (IV).
Microphotographs of colonies were captured at 9200 magnification
using Leica phase contrast microscope equipped with Leica IM50
software (Leica Microsystems)
Neuromol Med
123
Author's personal copy
increased from day 2 (1.33 and 1.18-fold of control) of
neuronal differentiation to day 4 (4.49 and 1.33-fold of
control) and peaked at day 8 (4.62 and 1.97-fold of con-
trol). The expression of AHR was found unaltered all
through the differentiation.
Constitutive Catalytic Activity of CYP1A1
in Differentiating Neuronal Cells
The EROD activity for CYP1A1 showed the increasing
metabolism capability of differentiating neuronal cells. The
Fig. 5 Differentiation of human cord blood hematopoietic stem cells
into neuronal subtypes. a Microphotographs of cultured human cord
blood stem cells and neuronal differentiation. Images were captured at
9200 magnification using Leica phase contrast microscope equipped
with Leica IM50 software (Leica Microsystems). (I) Purified popu-
lation of undifferentiated human HSCs at day 0. (II) Differentiating
neuronal cells at early stage from HSCs at day 2. (III) Differentiating
neuronal cells from HSCs at day 4. (IV) Fully differentiated neuronal
cells derived from HSC at day 8. Bar 50 lm. b Relative quantification
of altered mRNA expression of stemness genes in differentiating
neuronal cells at days 2, 4, and 8 (2D, 4D, and 8D, respectively).
b-actin was used as endogenous control to normalize the data and
differentiation-induced alterations in mRNA expression are expressed
in relative quantity (mean ± SE) compared with the expression in the
cells at day 0 (RQ value = 1). ** p \ 0.001. c Western blot analysis
of expression of marker proteins of stemness all through
differentiation. The values obtained at day 0 were considered basal,
that is, relative quantification in expression at days 2, 4, and 8 (0D,
2D, 4D, and 8D, respectively) was done comparing the values at day
0. b-actin was used as loading control to normalize the data.
d Relative quantification of altered mRNA expression of selected
neuronal marker genes in differentiating neuronal cells at days 2, 4,
and 8 (2D, 4D, and 8D, respectively). b-actin was used as endogenous
control to normalize the data and differentiation-induced alterations in
mRNA expression are expressed in relative quantity (mean ± SE)
compared with the expression in the cells at day 0 (RQ value = 1).
** p \ 0.001. e Western blot analysis of expression of neuronal
marker proteins all through differentiation. The values obtained at day
0 were considered basal, that is, relative quantification in expression
at days 2, 4, and 8 (0D, 2D, 4D, and 8D, respectively) was done
comparing the values at day 0. b-actin was used as loading control to
normalize the data
Neuromol Med
123
Author's personal copy
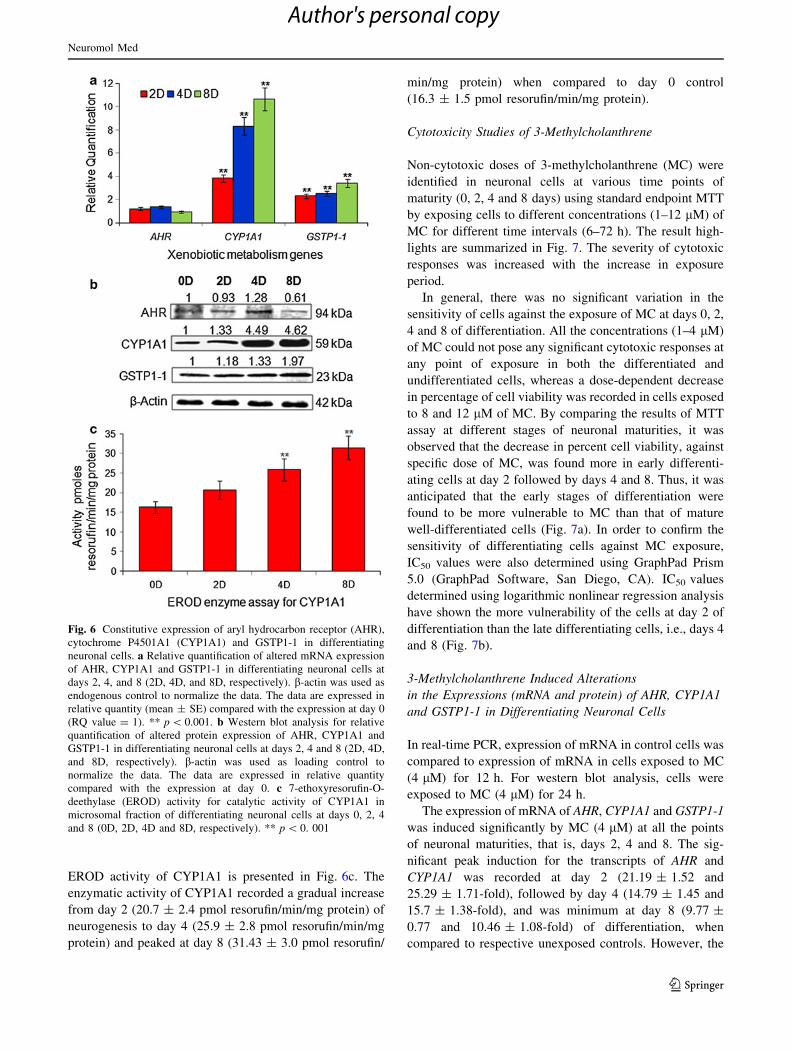
EROD activity of CYP1A1 is presented in Fig. 6c. The
enzymatic activity of CYP1A1 recorded a gradual increase
from day 2 (20.7 ± 2.4 pmol resorufin/min/mg protein) of
neurogenesis to day 4 (25.9 ± 2.8 pmol resorufin/min/mg
protein) and peaked at day 8 (31.43 ± 3.0 pmol resorufin/
min/mg protein) when compared to day 0 control
(16.3 ± 1.5 pmol resorufin/min/mg protein).
Cytotoxicity Studies of 3-Methylcholanthrene
Non-cytotoxic doses of 3-methylcholanthrene (MC) were
identified in neuronal cells at various time points of
maturity (0, 2, 4 and 8 days) using standard endpoint MTT
by exposing cells to different concentrations (1–12 lM) of
MC for different time intervals (6–72 h). The result high-
lights are summarized in Fig. 7. The severity of cytotoxic
responses was increased with the increase in exposure
period.
In general, there was no significant variation in the
sensitivity of cells against the exposure of MC at days 0, 2,
4 and 8 of differentiation. All the concentrations (1–4 lM)
of MC could not pose any significant cytotoxic responses at
any point of exposure in both the differentiated and
undifferentiated cells, whereas a dose-dependent decrease
in percentage of cell viability was recorded in cells exposed
to 8 and 12 lM of MC. By comparing the results of MTT
assay at different stages of neuronal maturities, it was
observed that the decrease in percent cell viability, against
specific dose of MC, was found more in early differenti-
ating cells at day 2 followed by days 4 and 8. Thus, it was
anticipated that the early stages of differentiation were
found to be more vulnerable to MC than that of mature
well-differentiated cells (Fig. 7a). In order to confirm the
sensitivity of differentiating cells against MC exposure,
IC50 values were also determined using GraphPad Prism
5.0 (GraphPad Software, San Diego, CA). IC50 values
determined using logarithmic nonlinear regression analysis
have shown the more vulnerability of the cells at day 2 of
differentiation than the late differentiating cells, i.e., days 4
and 8 (Fig. 7b).
3-Methylcholanthrene Induced Alterations
in the Expressions (mRNA and protein) of AHR, CYP1A1
and GSTP1-1 in Differentiating Neuronal Cells
In real-time PCR, expression of mRNA in control cells was
compared to expression of mRNA in cells exposed to MC
(4 lM) for 12 h. For western blot analysis, cells were
exposed to MC (4 lM) for 24 h.
The expression of mRNA of AHR, CYP1A1 and GSTP1-1
was induced significantly by MC (4 lM) at all the points
of neuronal maturities, that is, days 2, 4 and 8. The sig-
nificant peak induction for the transcripts of AHR and
CYP1A1 was recorded at day 2 (21.19 ± 1.52 and
25.29 ± 1.71-fold), followed by day 4 (14.79 ± 1.45 and
15.7 ± 1.38-fold), and was minimum at day 8 (9.77 ±
0.77 and 10.46 ± 1.08-fold) of differentiation, when
compared to respective unexposed controls. However, the
Fig. 6 Constitutive expression of aryl hydrocarbon receptor (AHR),
cytochrome P4501A1 (CYP1A1) and GSTP1-1 in differentiating
neuronal cells. a Relative quantification of altered mRNA expression
of AHR, CYP1A1 and GSTP1-1 in differentiating neuronal cells at
days 2, 4, and 8 (2D, 4D, and 8D, respectively). b-actin was used as
endogenous control to normalize the data. The data are expressed in
relative quantity (mean ± SE) compared with the expression at day 0
(RQ value = 1). ** p \ 0.001. b Western blot analysis for relative
quantification of altered protein expression of AHR, CYP1A1 and
GSTP1-1 in differentiating neuronal cells at days 2, 4 and 8 (2D, 4D,
and 8D, respectively). b-actin was used as loading control to
normalize the data. The data are expressed in relative quantity
compared with the expression at day 0. c 7-ethoxyresorufin-O-
deethylase (EROD) activity for catalytic activity of CYP1A1 in
microsomal fraction of differentiating neuronal cells at days 0, 2, 4
and 8 (0D, 2D, 4D and 8D, respectively). ** p \ 0. 001
Neuromol Med
123
Author's personal copy
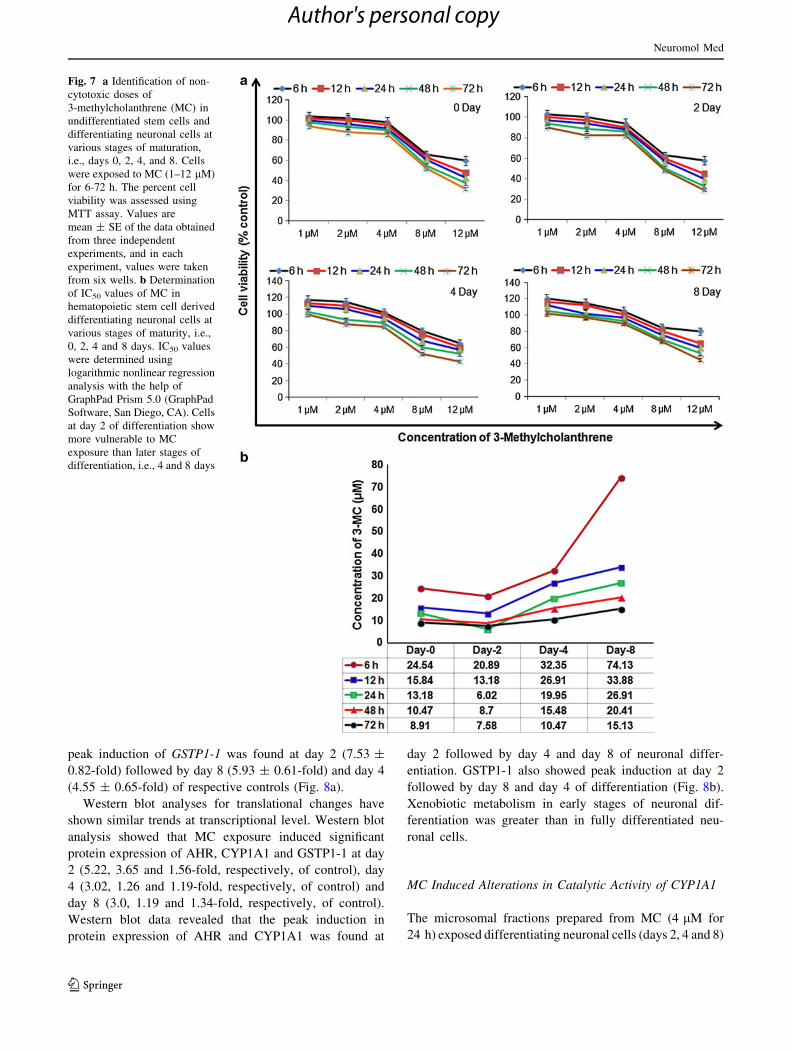
peak induction of GSTP1-1 was found at day 2 (7.53 ±
0.82-fold) followed by day 8 (5.93 ± 0.61-fold) and day 4
(4.55 ± 0.65-fold) of respective controls (Fig. 8a).
Western blot analyses for translational changes have
shown similar trends at transcriptional level. Western blot
analysis showed that MC exposure induced significant
protein expression of AHR, CYP1A1 and GSTP1-1 at day
2 (5.22, 3.65 and 1.56-fold, respectively, of control), day
4 (3.02, 1.26 and 1.19-fold, respectively, of control) and
day 8 (3.0, 1.19 and 1.34-fold, respectively, of control).
Western blot data revealed that the peak induction in
protein expression of AHR and CYP1A1 was found at
day 2 followed by day 4 and day 8 of neuronal differ-
entiation. GSTP1-1 also showed peak induction at day 2
followed by day 8 and day 4 of differentiation (Fig. 8b).
Xenobiotic metabolism in early stages of neuronal dif-
ferentiation was greater than in fully differentiated neu-
ronal cells.
MC Induced Alterations in Catalytic Activity of CYP1A1
The microsomal fractions prepared from MC (4 lM for
24 h) exposed differentiating neuronal cells (days 2, 4 and 8)
Fig. 7 a Identification of non-
cytotoxic doses of
3-methylcholanthrene (MC) in
undifferentiated stem cells and
differentiating neuronal cells at
various stages of maturation,
i.e., days 0, 2, 4, and 8. Cells
were exposed to MC (1–12 lM)
for 6-72 h. The percent cell
viability was assessed using
MTT assay. Values are
mean ± SE of the data obtained
from three independent
experiments, and in each
experiment, values were taken
from six wells. b Determination
of IC50 values of MC in
hematopoietic stem cell derived
differentiating neuronal cells at
various stages of maturity, i.e.,
0, 2, 4 and 8 days. IC50 values
were determined using
logarithmic nonlinear regression
analysis with the help of
GraphPad Prism 5.0 (GraphPad
Software, San Diego, CA). Cells
at day 2 of differentiation show
more vulnerable to MC
exposure than later stages of
differentiation, i.e., 4 and 8 days
Neuromol Med
123
Author's personal copy

showed significant induction in CYP-dependent EROD
(CYP1A1) activity (Fig. 8c). The trend in the induction of
CYP1A1 activity was fairly correlative with the data of real-
time PCR and western blot analysis. The cells showed peak
induction in the catalytic activity of CYP1A1 at day 2
(47.8 ± 4.7 pmol resorufin/min/mg protein) compared to
unexposed day 2 control (20.7 ± 2.4 pmol resorufin/min/
mg protein) and subsequently decreased in induction at day 4
(37.7 ± 3.52 pmol resorufin/min/mg protein) compared to
unexposed day 4 control (25.88 ± 2.7 pmol resorufin/min/
mg protein) and at day 8 (39.45 ± 4.27 pmol resorufin/min/
mg protein) of differentiation when compared to unexposed
control of day 8 (31.43 ± 3.0 pmol resorufin/min/mg
protein).
Developmental Neurotoxicity Studies
of 3-Methylcholanthrene
Cells receiving MC (4 lm; 12 h for mRNA and 24 h for
protein expression) exposure showed statistically signifi-
cant down regulation in the expression of (mRNA and
protein) all the neuronal marker genes studied.
At transcriptional level, the mRNA expression of NES,
NCAM and CREB was recorded as significantly down
regulated all through the differentiation, following the
exposure of MC with maximum reduction at day 2
(0.37 ± 0.04, 0.29 ± 0.03 and 0.23 ± 0.02-fold, respec-
tively) then at day 4 (0.59 ± 0.03, 0.55 ± 0.04 and
0.78 ± 0.06-fold) and day 8 (0.9 ± 0.04, 0.72 ± 0.05 and
0.88 ± 0.052-fold) of differentiation in comparison with
unexposed respective controls, while the maximum
reduction in the mRNA expression of SYP was recorded at
day 8 (0.3 ± 0.01-fold) followed by day 4 (0.67 ± 0.05-
fold) and minimum inhibition at day 2 (0.83 ± 0.045-fold).
However, the mRNA expression of GRIA2 and GRIN2A
was not detectable at day 2 of differentiation, and MC
down regulated GRIA2 and GRIN2A most significantly at
day 4 (0.07 ± 0.009 and 0.39 ± 0.046-fold, respectively)
and then at day 8 (0.97 ± 0.04 and 0.47 ± 0.07-fold,
respectively) of differentiation in comparison with the
respective unexposed controls (Fig. 9a).
The trend in down regulated protein expression (Fig. 9b)
of selected early and late neuronal markers was fairly
correlated with the data of real-time PCR. Western blot
analysis revealed that MC most significantly down regu-
lated the expression of NES, PSA-NCAM and CREB at
Fig. 8 MC induced altered expression of AHR, CYP1A1 and
GSTP1-1 in differentiating neurons. a MC induced altered expression
in transcripts of AHR, CYP1A1 and GSTP1-1 genes in human HSC-
derived differentiating neuronal cells at days 2, 4 and 8 (2DT, 4DT
and 8DT, respectively). b-actin was used as internal control to
normalize the data. MC-induced alterations in mRNA expression are
expressed in relative quantity compared with respective unexposed
control groups (RQ values of controls = 1). Reliability of specific
products was checked by melting curve analysis as well as by running
the product on 2 % agarose gel. ** p \ 0.001. b MC-induced
alterations in the protein expression of AHR, CYP1A1 and GSTP1-
1 in differentiating neuronal cells at days 0, 2 and 4. b-actin were used
as loading control to normalize the data. MC-induced alterations in
protein expression are expressed in relative quantity compared with
respective unexposed control groups. C2: unexposed control cells at
day 2 of differentiation; T2: differentiating cells at day 2 exposed to
MC (4 lM) for 24 h; C4: unexposed control cells at day 4 of
differentiation; T4: differentiating cells at day 4 exposed to MC
(4 lM) for 24 h; C8: unexposed control cells at day 8 of differen-
tiation; T8: differentiating cells at day 8 exposed to MC (4 lM) for
24 h. c MC induced 7-ethoxyresorufin-O-deethylase (EROD) activity
for catalytic activity of CYP1A1 in microsomal fraction of differen-
tiating neuronal cells at days 2, 4 and 8 of differentiation (2D, 4D and
8D, respectively). * p \ 0.05, ** p \ 0. 001
b
Neuromol Med
123
Author's personal copy
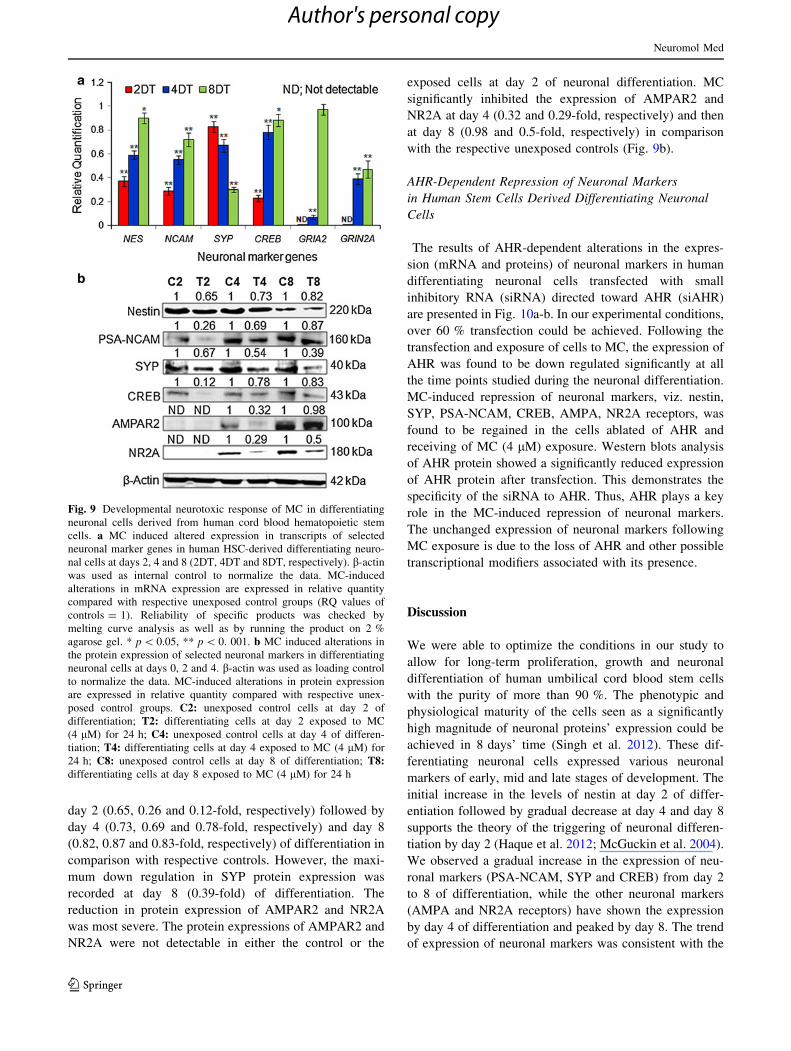
day 2 (0.65, 0.26 and 0.12-fold, respectively) followed by
day 4 (0.73, 0.69 and 0.78-fold, respectively) and day 8
(0.82, 0.87 and 0.83-fold, respectively) of differentiation in
comparison with respective controls. However, the maxi-
mum down regulation in SYP protein expression was
recorded at day 8 (0.39-fold) of differentiation. The
reduction in protein expression of AMPAR2 and NR2A
was most severe. The protein expressions of AMPAR2 and
NR2A were not detectable in either the control or the
exposed cells at day 2 of neuronal differentiation. MC
significantly inhibited the expression of AMPAR2 and
NR2A at day 4 (0.32 and 0.29-fold, respectively) and then
at day 8 (0.98 and 0.5-fold, respectively) in comparison
with the respective unexposed controls (Fig. 9b).
AHR-Dependent Repression of Neuronal Markers
in Human Stem Cells Derived Differentiating Neuronal
Cells
The results of AHR-dependent alterations in the expres-
sion (mRNA and proteins) of neuronal markers in human
differentiating neuronal cells transfected with small
inhibitory RNA (siRNA) directed toward AHR (siAHR)
are presented in Fig. 10a-b. In our experimental conditions,
over 60 % transfection could be achieved. Following the
transfection and exposure of cells to MC, the expression of
AHR was found to be down regulated significantly at all
the time points studied during the neuronal differentiation.
MC-induced repression of neuronal markers, viz. nestin,
SYP, PSA-NCAM, CREB, AMPA, NR2A receptors, was
found to be regained in the cells ablated of AHR and
receiving of MC (4 lM) exposure. Western blots analysis
of AHR protein showed a significantly reduced expression
of AHR protein after transfection. This demonstrates the
specificity of the siRNA to AHR. Thus, AHR plays a key
role in the MC-induced repression of neuronal markers.
The unchanged expression of neuronal markers following
MC exposure is due to the loss of AHR and other possible
transcriptional modifiers associated with its presence.
Discussion
We were able to optimize the conditions in our study to
allow for long-term proliferation, growth and neuronal
differentiation of human umbilical cord blood stem cells
with the purity of more than 90 %. The phenotypic and
physiological maturity of the cells seen as a significantly
high magnitude of neuronal proteins’ expression could be
achieved in 8 days’ time (Singh et al. 2012). These dif-
ferentiating neuronal cells expressed various neuronal
markers of early, mid and late stages of development. The
initial increase in the levels of nestin at day 2 of differ-
entiation followed by gradual decrease at day 4 and day 8
supports the theory of the triggering of neuronal differen-
tiation by day 2 (Haque et al. 2012; McGuckin et al. 2004).
We observed a gradual increase in the expression of neu-
ronal markers (PSA-NCAM, SYP and CREB) from day 2
to 8 of differentiation, while the other neuronal markers
(AMPA and NR2A receptors) have shown the expression
by day 4 of differentiation and peaked by day 8. The trend
of expression of neuronal markers was consistent with the
Fig. 9 Developmental neurotoxic response of MC in differentiating
neuronal cells derived from human cord blood hematopoietic stem
cells. a MC induced altered expression in transcripts of selected
neuronal marker genes in human HSC-derived differentiating neuro-
nal cells at days 2, 4 and 8 (2DT, 4DT and 8DT, respectively). b-actin
was used as internal control to normalize the data. MC-induced
alterations in mRNA expression are expressed in relative quantity
compared with respective unexposed control groups (RQ values of
controls = 1). Reliability of specific products was checked by
melting curve analysis as well as by running the product on 2 %
agarose gel. * p \ 0.05, ** p \ 0. 001. b MC induced alterations in
the protein expression of selected neuronal markers in differentiating
neuronal cells at days 0, 2 and 4. b-actin was used as loading control
to normalize the data. MC-induced alterations in protein expression
are expressed in relative quantity compared with respective unex-
posed control groups. C2: unexposed control cells at day 2 of
differentiation; T2: differentiating cells at day 2 exposed to MC
(4 lM) for 24 h; C4: unexposed control cells at day 4 of differen-
tiation; T4: differentiating cells at day 4 exposed to MC (4 lM) for
24 h; C8: unexposed control cells at day 8 of differentiation; T8:differentiating cells at day 8 exposed to MC (4 lM) for 24 h
Neuromol Med
123
Author's personal copy

earlier findings observed in different in vitro systems
(Sanchez-Ramos et al. 2001; Zigova et al. 2002). The
physiological differentiation of cells into neuronal subtypes
was also confirmed by the down regulation in the expres-
sion of stemness markers, viz. CD34, Thy1, CD133 and
Nanog all through the neuronal differentiation. The
increased expression of Nanog at day 2 might be due to the
intracellular competition between the proliferation and
differentiation processes.
Though there was a significant expression and activity
of CYP1A1, AHR and phase II xenobiotic metabolizing
GSTP1-1, all through the differentiation of neuronal cells,
the early differentiating (day 2) neuronal cells had the
highest expression and activity of these markers of
metabolism. This may be suggested as that the early dif-
ferentiating neuronal cells are metabolically more active.
Such significant expression and activity of CYP1A1 and
AHR in differentiating neuronal cells has been suggested
due to the possible association of xenobiotic metabolizing
enzymes in neuronal development and physiological role in
brain (Gervasini et al. 2004; Miksys and Tyndale 2002;
Singh et al. 2012). The role of adrenoreceptors has also
been reported in the regulation of CYP1A1 gene that
causes a reduction in the levels of noradrenaline and a
depletion of catecholamine in central nervous system,
which subsequently down regulates the expression of
CYP1A1 (Konstandi et al. 2004; Konstandi et al. 2005).
MC is known to activate AHR that induces the expres-
sion of various genes including CYP1A1 for the metabo-
lism of MC (Kumagai et al. 2012). Thus, the 3D structure
of human-specific AHR was developed for the first time
using homology molecular modeling and was used in
molecular docking studies to understand the binding
properties. We observed a strong binding of MC to mod-
eled AHR target protein with a high docking score. Such
MC-AHR binding was found to induce significant expres-
sion of CYP1A1. At the same time, MC and AHR inde-
pendently as well as in combinations were found to show
the strong binding with neurogenesis inducing transcription
factor CREB. The key mediator of MC toxicity is the AHR
which upon activation translocates from cytoplasm to
nucleus, dimerizes with ARNT and interacts with other
transcription factors to modulate the expression of various
genes via binding to xenobiotic-responsive elements
(XREs) of promoter sequence of target genes (Omiecinski
et al. 2011). Our in silico data also supported the induction
of CYP1A1 by MC through binding at XREs with AHR
and ARNT. The data further revealed the highest stable
binding of MC to neurogenesis-related transcription factor
CREB with maximum docking energy via hydrophobic
interactions at Arg301, Lys-304/305 and Ser-300 residues.
The docking studies showed that MC modulates the
activity of CREB, NMDA and AMPA receptors. We
observed that the MC has interacted with target proteins
with conserved hydrophobic amino acid residues in binding
pockets, thus leading to more stability and potency. To
better understand the binding nature of MC to AMPA, the
MC-AMPA docked structure was compared with the
Fig. 10 Role of AHR in MC-induced developmental neurotoxicity in
differentiating neuronal cells derived from hUCBSCs. a Real-time
PCR analysis for altered expression in transcripts of selected neuronal
marker genes in differentiating neuronal cells at days 2, 4 and 8 (2DT,
4DT and 8DT) following the transfection of siAHR and exposure of
cells to MC. MC-induced repression of neuronal markers, viz. nestin,
SYP, NCAM, CREB, AMPA, NR2A receptors, was found to be
regained in the cells ablated of AHR and receiving of MC (4 lM)
exposure. b-actin was used as internal control to normalize the data.
MC-induced alterations in mRNA expression are expressed in relative
quantity compared with respective unexposed control groups (RQ
values of controls = 1). * p \ 0.05, ** p \ 0.001. b MC-induced
alterations (regain) in the protein expression of selected neuronal
markers in differentiating neuronal cells at days 0, 2 and 4 following
the transfection of siAHR. b-actin was used as loading control to
normalize the data. MC-induced alterations in protein expression are
expressed in relative quantity compared with respective unexposed
control groups. C2: unexposed control transfected cells at day 2 of
differentiation; T2: differentiating transfected cells at day 2 exposed
to MC (4 lM) for 24 h; C4: unexposed control transfected cells at day
4 of differentiation; T4: differentiating transfected cells at day 4
exposed to MC (4 lM) for 24 h; C8: unexposed control transfected
cells at day 8 of differentiation; T8: differentiating transfected cells at
day 8 exposed to MC (4 lM) for 24 h
Neuromol Med
123
Author's personal copy
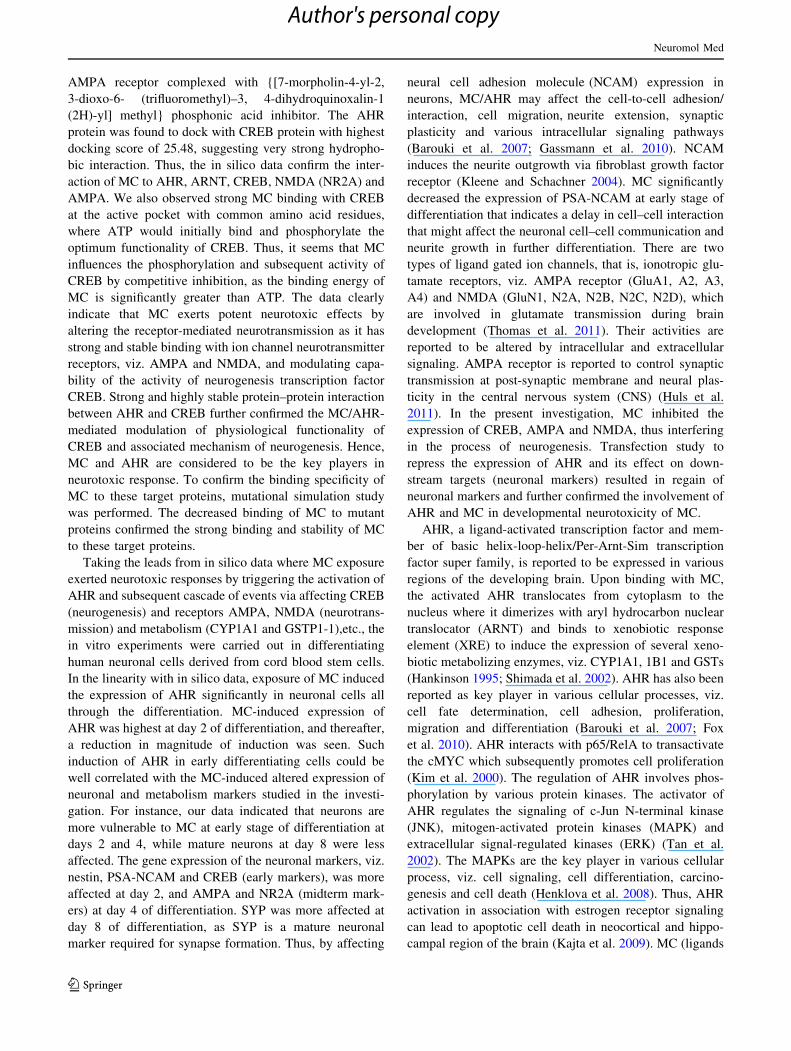
AMPA receptor complexed with {[7-morpholin-4-yl-2,
3-dioxo-6- (trifluoromethyl)–3, 4-dihydroquinoxalin-1
(2H)-yl] methyl} phosphonic acid inhibitor. The AHR
protein was found to dock with CREB protein with highest
docking score of 25.48, suggesting very strong hydropho-
bic interaction. Thus, the in silico data confirm the inter-
action of MC to AHR, ARNT, CREB, NMDA (NR2A) and
AMPA. We also observed strong MC binding with CREB
at the active pocket with common amino acid residues,
where ATP would initially bind and phosphorylate the
optimum functionality of CREB. Thus, it seems that MC
influences the phosphorylation and subsequent activity of
CREB by competitive inhibition, as the binding energy of
MC is significantly greater than ATP. The data clearly
indicate that MC exerts potent neurotoxic effects by
altering the receptor-mediated neurotransmission as it has
strong and stable binding with ion channel neurotransmitter
receptors, viz. AMPA and NMDA, and modulating capa-
bility of the activity of neurogenesis transcription factor
CREB. Strong and highly stable protein–protein interaction
between AHR and CREB further confirmed the MC/AHR-
mediated modulation of physiological functionality of
CREB and associated mechanism of neurogenesis. Hence,
MC and AHR are considered to be the key players in
neurotoxic response. To confirm the binding specificity of
MC to these target proteins, mutational simulation study
was performed. The decreased binding of MC to mutant
proteins confirmed the strong binding and stability of MC
to these target proteins.
Taking the leads from in silico data where MC exposure
exerted neurotoxic responses by triggering the activation of
AHR and subsequent cascade of events via affecting CREB
(neurogenesis) and receptors AMPA, NMDA (neurotrans-
mission) and metabolism (CYP1A1 and GSTP1-1),etc., the
in vitro experiments were carried out in differentiating
human neuronal cells derived from cord blood stem cells.
In the linearity with in silico data, exposure of MC induced
the expression of AHR significantly in neuronal cells all
through the differentiation. MC-induced expression of
AHR was highest at day 2 of differentiation, and thereafter,
a reduction in magnitude of induction was seen. Such
induction of AHR in early differentiating cells could be
well correlated with the MC-induced altered expression of
neuronal and metabolism markers studied in the investi-
gation. For instance, our data indicated that neurons are
more vulnerable to MC at early stage of differentiation at
days 2 and 4, while mature neurons at day 8 were less
affected. The gene expression of the neuronal markers, viz.
nestin, PSA-NCAM and CREB (early markers), was more
affected at day 2, and AMPA and NR2A (midterm mark-
ers) at day 4 of differentiation. SYP was more affected at
day 8 of differentiation, as SYP is a mature neuronal
marker required for synapse formation. Thus, by affecting
neural cell adhesion molecule (NCAM) expression in
neurons, MC/AHR may affect the cell-to-cell adhesion/
interaction, cell migration, neurite extension, synaptic
plasticity and various intracellular signaling pathways
(Barouki et al. 2007; Gassmann et al. 2010). NCAM
induces the neurite outgrowth via fibroblast growth factor
receptor (Kleene and Schachner 2004). MC significantly
decreased the expression of PSA-NCAM at early stage of
differentiation that indicates a delay in cell–cell interaction
that might affect the neuronal cell–cell communication and
neurite growth in further differentiation. There are two
types of ligand gated ion channels, that is, ionotropic glu-
tamate receptors, viz. AMPA receptor (GluA1, A2, A3,
A4) and NMDA (GluN1, N2A, N2B, N2C, N2D), which
are involved in glutamate transmission during brain
development (Thomas et al. 2011). Their activities are
reported to be altered by intracellular and extracellular
signaling. AMPA receptor is reported to control synaptic
transmission at post-synaptic membrane and neural plas-
ticity in the central nervous system (CNS) (Huls et al.
2011). In the present investigation, MC inhibited the
expression of CREB, AMPA and NMDA, thus interfering
in the process of neurogenesis. Transfection study to
repress the expression of AHR and its effect on down-
stream targets (neuronal markers) resulted in regain of
neuronal markers and further confirmed the involvement of
AHR and MC in developmental neurotoxicity of MC.
AHR, a ligand-activated transcription factor and mem-
ber of basic helix-loop-helix/Per-Arnt-Sim transcription
factor super family, is reported to be expressed in various
regions of the developing brain. Upon binding with MC,
the activated AHR translocates from cytoplasm to the
nucleus where it dimerizes with aryl hydrocarbon nuclear
translocator (ARNT) and binds to xenobiotic response
element (XRE) to induce the expression of several xeno-
biotic metabolizing enzymes, viz. CYP1A1, 1B1 and GSTs
(Hankinson 1995; Shimada et al. 2002). AHR has also been
reported as key player in various cellular processes, viz.
cell fate determination, cell adhesion, proliferation,
migration and differentiation (Barouki et al. 2007; Fox
et al. 2010). AHR interacts with p65/RelA to transactivate
the cMYC which subsequently promotes cell proliferation
(Kim et al. 2000). The regulation of AHR involves phos-
phorylation by various protein kinases. The activator of
AHR regulates the signaling of c-Jun N-terminal kinase
(JNK), mitogen-activated protein kinases (MAPK) and
extracellular signal-regulated kinases (ERK) (Tan et al.
2002). The MAPKs are the key player in various cellular
process, viz. cell signaling, cell differentiation, carcino-
genesis and cell death (Henklova et al. 2008). Thus, AHR
activation in association with estrogen receptor signaling
can lead to apoptotic cell death in neocortical and hippo-
campal region of the brain (Kajta et al. 2009). MC (ligands
Neuromol Med
123
Author's personal copy
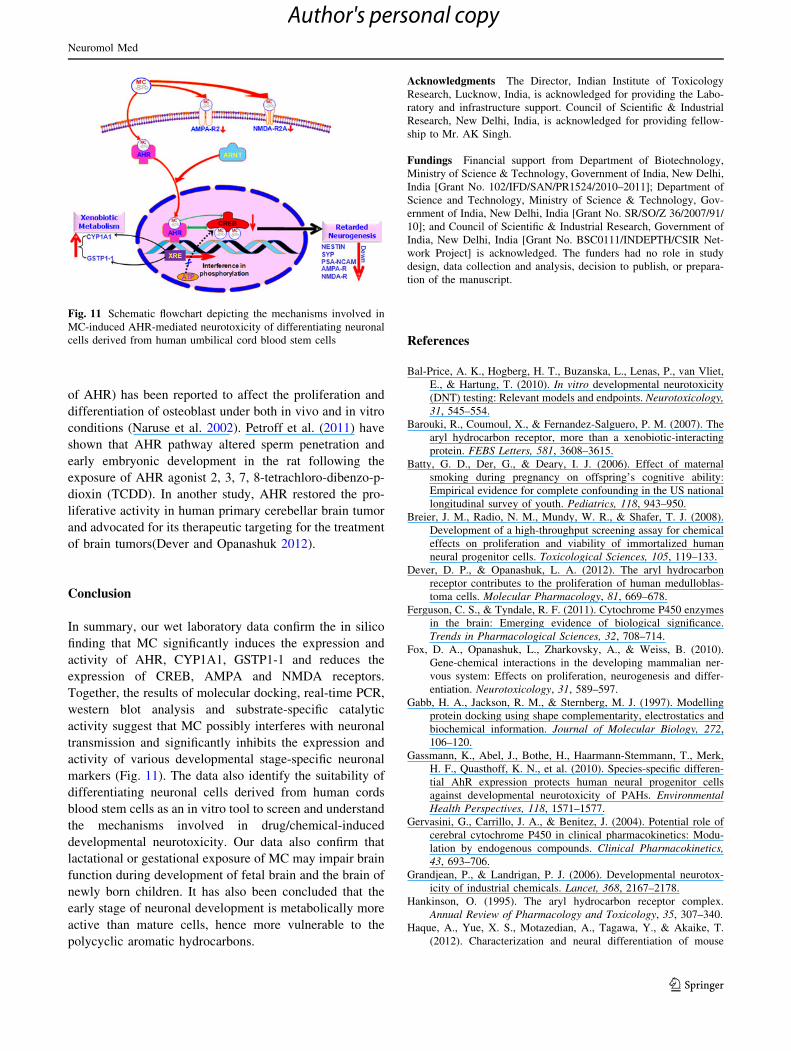
of AHR) has been reported to affect the proliferation and
differentiation of osteoblast under both in vivo and in vitro
conditions (Naruse et al. 2002). Petroff et al. (2011) have
shown that AHR pathway altered sperm penetration and
early embryonic development in the rat following the
exposure of AHR agonist 2, 3, 7, 8-tetrachloro-dibenzo-p-
dioxin (TCDD). In another study, AHR restored the pro-
liferative activity in human primary cerebellar brain tumor
and advocated for its therapeutic targeting for the treatment
of brain tumors(Dever and Opanashuk 2012).
Conclusion
In summary, our wet laboratory data confirm the in silico
finding that MC significantly induces the expression and
activity of AHR, CYP1A1, GSTP1-1 and reduces the
expression of CREB, AMPA and NMDA receptors.
Together, the results of molecular docking, real-time PCR,
western blot analysis and substrate-specific catalytic
activity suggest that MC possibly interferes with neuronal
transmission and significantly inhibits the expression and
activity of various developmental stage-specific neuronal
markers (Fig. 11). The data also identify the suitability of
differentiating neuronal cells derived from human cords
blood stem cells as an in vitro tool to screen and understand
the mechanisms involved in drug/chemical-induced
developmental neurotoxicity. Our data also confirm that
lactational or gestational exposure of MC may impair brain
function during development of fetal brain and the brain of
newly born children. It has also been concluded that the
early stage of neuronal development is metabolically more
active than mature cells, hence more vulnerable to the
polycyclic aromatic hydrocarbons.
Acknowledgments The Director, Indian Institute of Toxicology
Research, Lucknow, India, is acknowledged for providing the Labo-
ratory and infrastructure support. Council of Scientific & Industrial
Research, New Delhi, India, is acknowledged for providing fellow-
ship to Mr. AK Singh.
Fundings Financial support from Department of Biotechnology,
Ministry of Science & Technology, Government of India, New Delhi,
India [Grant No. 102/IFD/SAN/PR1524/2010–2011]; Department of
Science and Technology, Ministry of Science & Technology, Gov-
ernment of India, New Delhi, India [Grant No. SR/SO/Z 36/2007/91/
10]; and Council of Scientific & Industrial Research, Government of
India, New Delhi, India [Grant No. BSC0111/INDEPTH/CSIR Net-
work Project] is acknowledged. The funders had no role in study
design, data collection and analysis, decision to publish, or prepara-
tion of the manuscript.
References
Bal-Price, A. K., Hogberg, H. T., Buzanska, L., Lenas, P., van Vliet,
E., & Hartung, T. (2010). In vitro developmental neurotoxicity
(DNT) testing: Relevant models and endpoints. Neurotoxicology,
31, 545–554.
Barouki, R., Coumoul, X., & Fernandez-Salguero, P. M. (2007). The
aryl hydrocarbon receptor, more than a xenobiotic-interacting
protein. FEBS Letters, 581, 3608–3615.
Batty, G. D., Der, G., & Deary, I. J. (2006). Effect of maternal
smoking during pregnancy on offspring’s cognitive ability:
Empirical evidence for complete confounding in the US national
longitudinal survey of youth. Pediatrics, 118, 943–950.
Breier, J. M., Radio, N. M., Mundy, W. R., & Shafer, T. J. (2008).
Development of a high-throughput screening assay for chemical
effects on proliferation and viability of immortalized human
neural progenitor cells. Toxicological Sciences, 105, 119–133.
Dever, D. P., & Opanashuk, L. A. (2012). The aryl hydrocarbon
receptor contributes to the proliferation of human medulloblas-
toma cells. Molecular Pharmacology, 81, 669–678.
Ferguson, C. S., & Tyndale, R. F. (2011). Cytochrome P450 enzymes
in the brain: Emerging evidence of biological significance.
Trends in Pharmacological Sciences, 32, 708–714.
Fox, D. A., Opanashuk, L., Zharkovsky, A., & Weiss, B. (2010).
Gene-chemical interactions in the developing mammalian ner-
vous system: Effects on proliferation, neurogenesis and differ-
entiation. Neurotoxicology, 31, 589–597.
Gabb, H. A., Jackson, R. M., & Sternberg, M. J. (1997). Modelling
protein docking using shape complementarity, electrostatics and
biochemical information. Journal of Molecular Biology, 272,
106–120.
Gassmann, K., Abel, J., Bothe, H., Haarmann-Stemmann, T., Merk,
H. F., Quasthoff, K. N., et al. (2010). Species-specific differen-
tial AhR expression protects human neural progenitor cells
against developmental neurotoxicity of PAHs. Environmental
Health Perspectives, 118, 1571–1577.
Gervasini, G., Carrillo, J. A., & Benitez, J. (2004). Potential role of
cerebral cytochrome P450 in clinical pharmacokinetics: Modu-
lation by endogenous compounds. Clinical Pharmacokinetics,
43, 693–706.
Grandjean, P., & Landrigan, P. J. (2006). Developmental neurotox-
icity of industrial chemicals. Lancet, 368, 2167–2178.
Hankinson, O. (1995). The aryl hydrocarbon receptor complex.
Annual Review of Pharmacology and Toxicology, 35, 307–340.
Haque, A., Yue, X. S., Motazedian, A., Tagawa, Y., & Akaike, T.
(2012). Characterization and neural differentiation of mouse
Fig. 11 Schematic flowchart depicting the mechanisms involved in
MC-induced AHR-mediated neurotoxicity of differentiating neuronal
cells derived from human umbilical cord blood stem cells
Neuromol Med
123
Author's personal copy
embryonic and induced pluripotent stem cells on cadherin-based
substrata. Biomaterials, 33, 5094–5106.
Henklova, P., Vrzal, R., Ulrichova, J., & Dvorak, Z. (2008). Role of
mitogen-activated protein kinases in aryl hydrocarbon receptor
signalling. Chemico-Biological Interactions, 172, 93–104.
Huls, S., Hogen, T., Vassallo, N., Danzer, K. M., Hengerer, B., Giese,
A., et al. (2011). AMPA-receptor-mediated excitatory synaptic
transmission is enhanced by iron-induced alpha-synuclein olig-
omers. Journal of Neurochemistry, 117, 868–878.
Kajta, M., Wojtowicz, A. K., Mackowiak, M., & Lason, W. (2009).
Aryl hydrocarbon receptor-mediated apoptosis of neuronal cells:
A possible interaction with estrogen receptor signalling. Neuro-
science, 158, 811–822.
Kalani, K., Yadav, D. K., Khan, F., Srivastava, S. K., & Suri, N.
(2011). Pharmacophore, QSAR, and ADME based semisynthesis
and in vitro evaluation of ursolic acid analogs for anticancer
activity. Journal of Molecular Modeling, 18, 3389–3413.
Kapoor, N., Pant, A. B., Dhawan, A., Dwievedi, U. N., Seth, P. K., &
Parmar, D. (2006). Cytochrome P450 1A isoenzymes in brain
cells: Expression and inducibility in cultured rat brain neuronal
and glial cells. Life Sciences, 79, 2387–2394.
Kashyap, M. P., Singh, A. K., Siddiqui, M. A., Kumar, V., Tripathi,
V. K., Khanna, V. K., et al. (2010). Caspase cascade regulated
mitochondria mediated apoptosis in monocrotophos exposed
PC12 cells. Chemical Research in Toxicology, 23, 1663–1672.
Katchalski-Katzir, E., Shariv, I., Eisenstein, M., Friesem, A. A.,
Aflalo, C., & Vakser, I. A. (1992). Molecular surface recogni-
tion: Determination of geometric fit between proteins and their
ligands by correlation techniques. Proceedings of the National
Academy of Sciences of the United States of America, 89,
2195–2199.
Kim, W., Gazourian, L., Quadri, S. A., Romieu-Mourez, R., Sherr, D.
H., & Sonenshein, G. E. (2000). The RelA NF-kappaB subunit
and the aryl hydrocarbon receptor (AhR) cooperate to transac-
tivate the c-myc promoter in mammary cells. Oncogene, 19,
5498–5506.
Kleene, R., & Schachner, M. (2004). Glycans and neural cell
interactions. Nature Reviews Neuroscience, 5, 195–208.
Konstandi, M., Johnson, E. O., Marselos, M., Kostakis, D., Fotopo-
ulos, A., & Lang, M. A. (2004). Stress-mediated modulation of
B(alpha)P-induced hepatic CYP1A1: Role of catecholamines.
Chemico-Biological Interactions, 147, 65–77.
Konstandi, M., Kostakis, D., Harkitis, P., Marselos, M., Johnson, E.
O., Adamidis, K., et al. (2005). Role of adrenoceptor-linked
signaling pathways in the regulation of CYP1A1 gene expres-
sion. Biochemical Pharmacology, 69, 277–287.
Kumagai, T., Suzuki, H., Sasaki, T., Sakaguchi, S., Miyairi, S.,
Yamazoe, Y., et al. (2012). Polycyclic aromatic hydrocarbons
activate CYP3A4 gene transcription through human pregnane X
receptor. Drug Metabolism and Pharmacokinetics, 27, 200–206.
Liu, M., Hurn, P. D., & Alkayed, N. J. (2004). Cytochrome P450 in
neurological disease. Current Drug Metabolism, 5, 225–234.
Liu, J., Li, J., Liu, Y., Chan, H. M., Zhao, Y., Cai, Z., et al. (2011).
Comparison on gestation and lactation exposure of perfluori-
nated compounds for newborns. Environment International, 37,
1206–1212.
McGuckin, C. P., Forraz, N., Allouard, Q., & Pettengell, R. (2004).
Umbilical cord blood stem cells can expand hematopoietic and
neuroglial progenitors in vitro. Experimental Cell Research, 295,
350–359.
Miksys, S. L., & Tyndale, R. F. (2002). Drug-metabolizing
cytochrome P450 s in the brain. Journal of Psychiatry and
Neuroscience, 27, 406–415.
Naruse, M., Ishihara, Y., Miyagawa-Tomita, S., Koyama, A., &
Hagiwara, H. (2002). 3-Methylcholanthrene, which binds to the
arylhydrocarbon receptor, inhibits proliferation and differentiation
of osteoblasts in vitro and ossification in vivo. Endocrinology, 143,
3575–3581.
Nebert, D. W., & Russell, D. W. (2002). Clinical importance of the
cytochromes P450. Lancet, 360, 1155–1162.
Nielsen, J. K., Vikstrom, A. C., Turner, P., & Knudsen, L. E. (2011).
Deoxynivalenol transport across the human placental barrier.
Food and Chemical Toxicology, 49, 2046–2052.
Omiecinski, C. J., Vanden Heuvel, J. P., Perdew, G. H., & Peters, J.
M. (2011). Xenobiotic metabolism, disposition, and regulation
by receptors: From biochemical phenomenon to predictors of
major toxicities. Toxicological Sciences, 120(Suppl 1), S49–S75.
Petroff, B. K., Valdez, K. E., Brown, S. B., Piasecka, J., & Albertini,
D. F. (2011). The aryl hydrocarbon receptor agonist 2,3,7,8-
tetrachloro-dibenzo-p-dioxin (TCDD) alters early embryonic
development in a rat IVF exposure model. Reproductive
Toxicology, 32, 286–292.
Polanska, K., Hanke, W., Sobala, W., Brzeznicki, S., & Ligocka, D.
(2009). Exposure of smoking pregnant women to polycyclic
aromatic hydrocarbons. Medycyna Pracy, 60, 103–108.
Radio, N. M., Breier, J. M., Shafer, T. J., & Mundy, W. R. (2008).
Assessment of chemical effects on neurite outgrowth in PC12
cells using high content screening. Toxicological Sciences, 105,
106–118.
Rodgman, A., Smith, C. J., & Perfetti, T. A. (2000). The composition
of cigarette smoke: A retrospective, with emphasis on polycyclic
components. Human and Experimental Toxicology, 19, 573–595.
Sanchez-Ramos, J. R., Song, S., Kamath, S. G., Zigova, T., Willing,
A., Cardozo-Pelaez, F., et al. (2001). Expression of neural
markers in human umbilical cord blood. Experimental Neurol-
ogy, 171, 109–115.
Schreiber, T., Gassmann, K., Gotz, C., Hubenthal, U., Moors, M.,
Krause, G., et al. (2010). Polybrominated diphenyl ethers induce
developmental neurotoxicity in a human in vitro model:
Evidence for endocrine disruption. Environmental Health Per-
spectives, 118, 572–578.
Scobioala, S., Klocke, R., Kuhlmann, M., Tian, W., Hasib, L.,
Milting, H., et al. (2008). Up-regulation of nestin in the infarcted
myocardium potentially indicates differentiation of resident
cardiac stem cells into various lineages including cardiomyo-
cytes. FASEB J, 22, 1021–1231.
Shao, J., Stapleton, P. L., Lin, Y. S., & Gallagher, E. P. (2007).
Cytochrome p450 and glutathione s-transferase mRNA expres-
sion in human fetal liver hematopoietic stem cells. Drug
Metabolism and Disposition, 35, 168–175.
Shimada, T., Inoue, K., Suzuki, Y., Kawai, T., Azuma, E., Nakajima,
T., et al. (2002). Aryl hydrocarbon receptor-dependent induction
of liver and lung cytochromes P450 1A1, 1A2, and 1B1 by
polycyclic aromatic hydrocarbons and polychlorinated biphenyls
in genetically engineered C57BL/6J mice. Carcinogenesis, 23,
1199–1207.
Siddiqui, M. A., Singh, G., Kashyap, M. P., Khanna, V. K., Yadav, S.,
Chandra, D., et al. (2008). Influence of cytotoxic doses of
4-hydroxynonenal on selected neurotransmitter receptors in PC-
12 cells. Toxicology in Vitro, 22, 1681–1688.
Singh, A. K., Kashyap, M. P., Jahan, S., Kumar, V., Tripathi, V. K.,
Siddiqui, M. A., et al. (2012). Expression and inducibility of
cytochrome P450s (CYP1A1, 2B6, 2E1, 3A4) in human cord
blood CD34(?) stem cell-derived differentiating neuronal cells.
Toxicological Sciences, 129, 392–410.
Slotkin, T. A., & Seidler, F. J. (2010). Diverse neurotoxicants
converge on gene expression for neuropeptides and their
receptors in an in vitro model of neurodifferentiation: Effects
of chlorpyrifos, diazinon, dieldrin and divalent nickel in PC12
cells. Brain Research, 1353, 36–52.
Talge, N. M., Neal, C., & Glover, V. (2007). Antenatal maternal
stress and long-term effects on child neurodevelopment: How
Neuromol Med
123
Author's personal copy
and why? Journal of Child Psychology and Psychiatry, 48,
245–261.
Tan, Z., Chang, X., Puga, A., & Xia, Y. (2002). Activation of
mitogen-activated protein kinases (MAPKs) by aromatic hydro-
carbons: Role in the regulation of aryl hydrocarbon receptor
(AHR) function. Biochemical Pharmacology, 64, 771–780.
Tayebati, S. K., Di Tullio, M. A., Ricci, A., & Amenta, F. (2009).
Influence of dermal exposure to the pyrethroid insecticide
deltamethrin on rat brain microanatomy and cholinergic/dopa-
minergic neurochemistry. Brain Research, 1301, 180–188.
Thapar, A., Fowler, T., Rice, F., Scourfield, J., van den Bree, M.,
Thomas, H., et al. (2003). Maternal smoking during pregnancy
and attention deficit hyperactivity disorder symptoms in off-
spring. American Journal of Psychiatry, 160, 1985–1989.
Thomas, C. G., Tian, H., & Diamond, J. S. (2011). The relative roles
of diffusion and uptake in clearing synaptically released
glutamate change during early postnatal development. Journal
of Neuroscience, 31, 4743–4754.
Tilson, H. A. (2000). Neurotoxicology risk assessment guidelines:
Developmental neurotoxicology. Neurotoxicology, 21, 189–194.
True, L. D., Zhang, H., Ye, M., Huang, C. Y., Nelson, P. S., von
Haller, P. D., et al. (2010). CD90/THY1 is overexpressed in
prostate cancer-associated fibroblasts and could serve as a cancer
biomarker. Modern Pathology, 23, 1346–1356.
Valentiner, U., Muhlenhoff, M., Lehmann, U., Hildebrandt, H., &
Schumacher, U. (2011). Expression of the neural cell adhesion
molecule and polysialic acid in human neuroblastoma cell lines.
International Journal of Oncology, 39, 417–424.
Wells, P. G., Lee, C. J., McCallum, G. P., Perstin, J., & Harper, P. A.
(2010). Receptor- and reactive intermediate-mediated mecha-
nisms of teratogenesis. Handb Exp Pharmacol, pp 131–162.
Zigova, T., Song, S., Willing, A. E., Hudson, J. E., Newman, M. B.,
Saporta, S., et al. (2002). Human umbilical cord blood cells
express neural antigens after transplantation into the developing
rat brain. Cell Transplantation, 11, 265–274.
Neuromol Med
123
Author's personal copy
Copyright © 2022 FDOKUMEN


![Antifungal Agents. 11. N -Substituted Derivatives of 1-[(Aryl)(4-aryl-1 H -pyrrol-3-yl)methyl]-1 H -imidazole: Synthesis, Anti Candida Activity, and QSAR Studies](https://static.fdokumen.com/doc/165x107/63341d2c7a687b71aa0889f6/antifungal-agents-11-n-substituted-derivatives-of-1-aryl4-aryl-1-h-pyrrol-3-ylmethyl-1.jpg)