
246.pdf - Rockefeller University Press
18
STRUCTURE OF INTERPHASE NUCLEI IN RELATION TO THE CELL CYCLE Chromatin Organization in Mouse L Cells Temperature-Sensitive for DNA Replication GEORGE SETTERFIELD, ROSE SHEININ, IRVING DARDICK, GEZA KISS, and MARGARET DUBSKY From the Department of Biology,ELBA, Carleton University,Ottawa, Canada K1S 5B6, and the Department of Microbiology and Parasitology,Universityof Toronto, Toronto, Canada M5S 1A1 ABSTRACT Mutant lines of mouse L cells, TS A1S9, and TS C1, show temperature-sensitive (TS) DNA synthesis and cell division when shifted from 34 ~ to 38.5~ With TS A1S9 the decline in DNA synthesis begins after 6-8 h at 38.5~ and is most marked at about 24 h. Most cells in S, G~, or M at temperature upshift complete one mitosis and accumulate in the subsequent interphase at G~ or early S as a result of expression of a primary defect, failure of elongation of newly made small DNA fragments. Heat inactivation of TS C1 cells is more rapid; they fail to complete the interphase in progress at temperature upshift and accumulate at late S or G2. Inhibition of both cell types is reversible on return to 34~ Cell and nuclear growth continues during inhibition of replication. Expression of both TS mutations leads to a marked change in gross organiza- tion of chromatin as revealed by electron microscopy. Nuclei of wild-type cells at 34 ~ and 38.5~ and mutant cells at 34~ show a range of aggregation of condensed chromatin from small dispersed bodies to large discrete clumps, with the majority in an intermediate state. In TS cells at 38.5~ condensed chromatin bodies in the central nuclear region become disaggregated into small clumps dispersed through the nucleus. Morphometric estimation of volume of condensed chromatin indicates that this process is not due to complete decondensation of ehromatin fibrils, but rather involves dispersal of large condensed chromatin bodies into finer aggregates and loosening of fibrils within the aggregates. The dispersed condition is reversed in nuclei which resume DNA synthesis when TS cells are downshifted from 38.5 ~ to 34~ The morphological observations are consistent with the hypothesis that condensed chromatin normally undergoes an ordered cycle of transient, localized disaggregation and reaggregation associated with replication. In temperature-inactivated mutants, normal progressive disag- gregation presumably occurs, but subsequent lack of chromatin replication prevents reaggregation. 246 J, CELLBIOLOGY t~ The RockefellerUniversityPress. 0021-9525/78/0401-0246 $1.00 Downloaded from http://rupress.org/jcb/article-pdf/77/1/246/1073000/246.pdf by guest on 10 July 2022
-
Upload
khangminh22 -
Category
Documents
-
view
7 -
download
0
Transcript of 246.pdf - Rockefeller University Press

STRUCTURE OF INTERPHASE NUCLEI IN RELATION
TO THE CELL CYCLE
Chromatin Organization in Mouse L Cells Temperature-Sensitive for DNA
Replication
GEORGE SETTERFIELD, ROSE SHEININ, IRVING DARDICK, GEZA KISS,
and MARGARET DUBSKY
From the Department of Biology, ELBA, Carleton University, Ottawa, Canada K1S 5B6, and the Department of Microbiology and Parasitology, University of Toronto, Toronto, Canada M5S 1A1
ABSTRACT
Mutant lines of mouse L cells, TS A1S9, and TS C1, show temperature-sensitive (TS) DNA synthesis and cell division when shifted from 34 ~ to 38.5~ With TS A1S9 the decline in DNA synthesis begins after 6-8 h at 38.5~ and is most marked at about 24 h. Most cells in S, G~, or M at temperature upshift complete one mitosis and accumulate in the subsequent interphase at G~ or early S as a result of expression of a primary defect, failure of elongation of newly made small DNA fragments. Heat inactivation of TS C1 cells is more rapid; they fail to complete the interphase in progress at temperature upshift and accumulate at late S or G2. Inhibition of both cell types is reversible on return to 34~ Cell and nuclear growth continues during inhibition of replication.
Expression of both TS mutations leads to a marked change in gross organiza- tion of chromatin as revealed by electron microscopy. Nuclei of wild-type cells at 34 ~ and 38.5~ and mutant cells at 34~ show a range of aggregation of condensed chromatin from small dispersed bodies to large discrete clumps, with the majority in an intermediate state. In TS cells at 38.5~ condensed chromatin bodies in the central nuclear region become disaggregated into small clumps dispersed through the nucleus. Morphometric estimation of volume of condensed chromatin indicates that this process is not due to complete decondensation of ehromatin fibrils, but rather involves dispersal of large condensed chromatin bodies into finer aggregates and loosening of fibrils within the aggregates. The dispersed condition is reversed in nuclei which resume DNA synthesis when TS cells are downshifted from 38.5 ~ to 34~ The morphological observations are consistent with the hypothesis that condensed chromatin normally undergoes an ordered cycle of transient, localized disaggregation and reaggregation associated with replication. In temperature-inactivated mutants, normal progressive disag- gregation presumably occurs, but subsequent lack of chromatin replication prevents reaggregation.
246 J, CELL BIOLOGY t~ The Rockefeller University Press. 0021-9525/78/0401-0246 $1.00
Dow
nloaded from http://rupress.org/jcb/article-pdf/77/1/246/1073000/246.pdf by guest on 10 July 2022

KEY WORDS mutant L cells nuclei chromatin organization cell cycle
Recent studies on chromatin structure indicate that DNA and its associated proteins are orga- nized in nu bodies or nucleosomes, and at higher levels in 10-nm nucleofilaments and 20-30-nm solenoidal fibrils (17, 32, 33). Beyond these lev- els, nuclei show organized structure resulting from various degrees of association and packing of chromatin fibrils. Such higher-order structure is microscopically obvious as the condensed chro- mosomes of mitosis and meiosis, but it is also evident as different amounts and distributions of condensed and dispersed chromatin in interphase nuclei. The molecular basis for this gross chroma- tin organization and its relation to nuclear differ- entiation, chromatin replication, and genetic activ- ity remains poorly understood (2, 11, 36).
The gross organization of interphase nuclei shows great diversity. In many plant species con- densed chromatin occurs only in small discrete masses, so-called prochromosomes, whereas in other species it forms an extensive reticular net- work (23, 25). Analogous differences in inter- phase chromatin distribution have been noted in closely related animal species and have been cor- related with differences in amounts of constitutive heterochromatin (18). Characteristic patterns of chromatin distribution are also seen in different mature tissues of the same organism (24, 38) resulting from progressive changes in nuclear or- ganization during differentiation. Such changes are particularly obvious in the course of avian erythropoiesis, where morphometric analysis indi- cates that the basic content of condensed chroma- tin of the erythroid cell is established early in development and is progressively aggregated into large masses as the nucleus matures. The change in overall nuclear morphology depends on changes in distribution, not amount, of condensed chro- matin (13). Taken overall, these considerations are consistent with the view that organization of chromatin fibrils within interphase nuclei is not random but rather represents ordered distribution of genetic material with functional significance in cell development (8, 11).
As one aspect of regulated nuclear organiza- tion, it has been suggested that in interphase nuclei of cells active in division chromatin may undergo sequential changes in distribution which relate to the cell cycle (27, 28, 34-36). In effect, such a hypothesis proposes that the large-scale condensation of chromosomes in mitosis is just
one aspect of a continuous cycle of chromatin rearrangements. Cyclical interphase chromatin changes could be important in gene transcription, nuclear growth, ordered chromosome replication, and preparation for cell division. As will be dis- cussed below, direct evidence for such a cycle is still scanty.
One approach to the study of chromatin changes related to the cell cycle is to interrupt the cycle at specific points and follow changes in nuclear structure. In the experiments reported here, we have analyzed nuclear morphology in two mutant lines of mouse L cells, designated TS AIS9 and TS C1, (46, 47), which grow normally at 34~ but are temperature-sensitive (TS) for DNA synthesis and cell division at 38.5~ The available evidence indicates that the TS A1S9 gene product is involved in the conversion of newly replicated single DNA strands of molecular weight about >- 5 • 10 ~ to mature chromosomal DNA (41). The TS defect is quite specific; TS A1S9 cells infected with polyoma virus at the nonpermissive temperature (38.5~ support nor- mal nuclear synthesis of viral DNA (40). Mi- tochondrial DNA synthesis proceeds apparently normally also, but the absolute amount made declines, presumably because of secondary cell cycle events (43). Knowledge of the TS defect in TS C1 mouse L cells is far less advanced. DNA synthesis is very rapidly inhibited upon tempera- ture upshift (42, 47). The TS C1 gene product appears to be required throughout the S phase, perhaps for normal termination of chromosomal DNA (Guttman and Sheinin, unpublished data). Results of the cytological analysis indicate that expression of both TS mutations leads to substan- tial but reversible change~in gross organization of interphase chromatin. These changes are consist- ent with the interpretation that inhibition of DNA and chromatin replication leads to disruption of a normal cycle of chromatin disaggregation and reaggregation which occurs during S phase of the cell cycle.
MATERIALS AND METHODS
Cells
Wild-type (WT-4), TS A1S9, and TS C1 mouse L cells were maintained in suspension culture, in medium supplemented with 7.5% fetal calf serum as previously described (41). Care was taken to ensure that cells did not enter stationary phase; when cells grew to 6-7 • 105 ml, they were diluted with prewarmed medium. This did not affect any of the parameters under study
SE'ITERFIELD El" AL. Nuclear Structure in Mutant L Cells 247
Dow
nloaded from http://rupress.org/jcb/article-pdf/77/1/246/1073000/246.pdf by guest on 10 July 2022

here. Cells were counted in a Coulter counter. In individual experiments, cultures were established
at a concentration of 5-8 x 10⁴ cells/ml and grown at 34"C to midlogarithmic phase (3-4 x 10~/ml). For temperature upshift and downshift experiments, cells were spun down and resuspended in prewarmed medium at the appropriate temperature, 38.5 o or 34"C, respec- tively. To label DNA, cells were grown in medium lacking nucleosides, and during intervals noted in specific experiments [methyl-aH]dThd was added (approximate sp act 20 Ci/mmol, approximate concentration 0.05/.LM) to a final level of 10 /xCi/ml, For analysis, cells were harvested by centrifugation (800 g, 10 rain at 2 ~ C) and washed in phosphate-buffered saline (PBS) containing 1% fetal calf serum.
Measurement of [~H]dThd Incorporation Incorporation of [aH]dThd into acid-insoluble mate-
rial is linear for several hours under the experimental conditions used. Therefore the rate of DNA synthesis was measured in terms of incorporation of this precursor during a 1-h interval into cells incubated as noted above. Triplicate 1-ml rot of cell culture were removed for each assay. 10 vol of nonradioactive complete medium (containing 41 #M dThd) at 2~176 was added to each sample. The cells were collected by centrifugation in the cold, washed twice with cold medium, and then sus- pended in cold trichloroacetic acid (TCA) and incubated in ice for at least 1 h, The precipitated macromolecules were collected on glass fiber filters, washed with cold TCA, dried, and counted for radioactivity as previously described (41).
Flow Microfluorimetry The distribution of cells in cultures in terms of their
DNA content was assessed by flow microfluorimetry (12). Nuclei were Feulgen-stained with acriflavine. These experiments were kindly performed by Dr. Larry Thompson at the Lawrence Livermore Laboratory, Uni- versity of California, Livermore.
Microscopy and Autoradiography Approximately 5 x 10⁶ cells, grown as described
above (with or without [3H]dThd), were harvested by centrifugation and processed essentially as described by Brasch et al. (7). All fixation and washing steps were done at 2~ Cells were suspended in 1 ml of 1.5% (vol/vol) glutaraldehyde in PBS for 1 h, centrifuged, and resuspended in 6% glutaraldehyde in PBS for 4 h. After three washes in PBS, 15 ml each, cells were suspended in 1 ml of 2% (wt/vol) OsO4 in PBS for 12- 15 h and then washed three times with PBS as above. The fixed cells were then warmed to room temperature, dehydrated in an ethanol-propylene oxide series, and embedded in Epon-Araldite. For light microscopy, 1-2 /~m thick sections were stained for I-2 rain in 1% methylene blue in 1% borax. Thin sections for electron
microscopy were stained with saturated uranyl acetate in 50% ethanol for 2.5-3 h followed by lead citrate for 10-15 rain.
For autoradiography, 1-/~m sections mounted on slides were dipped in Ilford LA emulsion diluted I/1 (vol/vol) with water at 40* C. Exposure was made for 8 days at 2~ and development was carried out in Dektol/ water (Eastman Kodak Co., Rochester, N.Y.), 1/1 (vol/vol) for 2 rain at 20"C. After fixation and washing, sections were stained in methylene blue as above, and by light microscopy random samples of nuclei were scored in three categories: 0 grains, 1-15 grains, > 15 grains.
Morphometry Volumes of individual cells were estimated directly in
the light microscope by measuring two diameters at right angles in 2-/zm sections, calculating mean radius, and applying the formula 4/3 zrr ~. Glancing sections showing cell profiles with smafl nuclear areas were avoided. Volumes of nuclei and condensed chromatin were estimated by stereologlcal point counting (50). Random electron micrographs of individual cell profiles with magnification of about x 6,000 were overlain with a lattice of points spaced 0.5 cm apart. The number of lattice points over the complete cell, nucleus, and con- densed chromatin areas were recorded, and the mean percent of points over the latter two compartments calculated. These percentage values multiplied by mean cell volume gave volumes of the nucleus and condensed chromatin.
Chemicals and Reagents [*H]dThd was purchased from Amersham-Searle,
Don Mills, Ontario, Can.; glutaraldehyde from Polysci- ences, Inc., Warrington, Pa; and fetal calf serum from Reheis Chemical Co., Chicago, I11.
R E S U L T S
Cell Proliferation and DNA Synthesis The course of cell proliferat ion and D N A syn-
thesis for WT-4 , TS A1S9 , and TS CI mouse L cells incubated at the permissive t empera tu re (34~ at the nonpermiss ive tempera ture (38.5~ and subsequent ly backshif led to 34~ is shown in Fig. 1. Doubl ing t imes (TD) (calculated in eight o ther exper iments in which more t ime points were taken) for WT-4, TS A1S9, and TS C1 cells grown at 34~ were 24.5, 21.8, and 24 h, respectively. The TD was 19.2 h for WT-4 cells grown at 38.5~ TS A1S9 cells incubated at 38.5~ underwent one doubl ing whereas division of TS C1 cells was immediately inhibi ted at this tempera ture . The cell-cycle block observed at 38.5~ in bo th mutants was reversible; tempera-
248 THE JOURNAL OF CELL BIOLOGY" VOLUME 77, 1978
Dow
nloaded from http://rupress.org/jcb/article-pdf/77/1/246/1073000/246.pdf by guest on 10 July 2022

Z -1 ,_J
12
4
60C
X
XII
I--
-r- . ,o .
20C
0 20 4 0 60 80 0 20 4 0 60 80 0 20 4 0 60 0 0
PERIOD OF INCUBATION (H)
FIGURE 1 Cell division and DNA synthesis of WT-4, TS A1S9, and TS CI cells at different temperatures. Cells were grown in suspension at 34~ to about 2 • 105 cells/ml. A portion of each culture was shifted to 38,5~ After 24 h, a major fraction of the latter cultures was backshifted to 34~ At the various intervals noted, cells were counted electronically and the incorporation of [aH]dThd into TCA-precipitable material was measured. [aH]dThd was supplied to cells for 1 h before sampling. (O O) incubated throughout at 34~ (O O) incubated throughout at 38.5~ (x • in- cubated at 38.5"C for 24 h and backshifted at 340C.
ture-inactivated cells resumed cell division within 24-36 h after backshift to 34~ and doubled in number in about a 20-h period, indicating re- covery of most cells in the population. These results are in general agreement with those re- ported previously (41, 46, 47).
Incorporation of [aH]dThd into acid-precipita- ble material by WT-4, TS A1S9, and TS C1 cells is illustrated in the lower portion of Fig. 1. Control cultures (WT-4 grown at 34 ~ or 38.5~ and mu- tant cells at 34~ showed little change in rate of DNA synthesis until cells approached stationary phase of growth. By 24-h incubation at 38.5~ both TS mutants showed a drop in incorporation to only 2-5% of the control value. Inhibited ceils returned to 34~ after 24 h at 38.5~ resumed DNA synthesis within 14-20 h. Autoradiographic analysis of these recovering populations showed frequencies of labeled cells comparable to control cultures maintained at 34~ DNA synthesis in the recovered cells showed a cyclic pattern at
later times, indicative of induced cell-cycle syn- chrony.
Details of the inhibition of DNA synthesis in the TS mutants during the first 24 h at 38.5~ are not shown in Fig. 1, but have been presented in other studies (41,46, 47). On temperature upshift of TS AIS9 cells, DNA synthesis proceeds at a normal rate for 6-8 h, and then is rapidly in- hibited, reaching a minimum level at 20-24 h. Inhibition of DNA synthesis starts more quickly in TS C1 cells, being measurable within 2 h at 38.50(2, and reaching a minimum at 17-20 h.
The assessment of [aH]dThd incorporation in autoradiographs is shown in Fig. 2. In all control cultures, the percentage of heavily (>15 grains) and lightly (1-15 grains) labeled nuclei was about the same over a 48-h period, exhibiting the label- ing distribution expected of exponentially growing cells (45). In TS A1S9 cultures at 38.5~ the frequency of heavily labeled nuclei remained high up to 6 h, began to decline at 9 h, and reached
SETrERFIELD ET AL. Nuclear Structure in Mutant L Cells 2 4 9
Dow
nloaded from http://rupress.org/jcb/article-pdf/77/1/246/1073000/246.pdf by guest on 10 July 2022

6 0 ~ , ~ - - ~ . . . ~ ~ . . , ,~
2O ! . . . . . O-
0 I I / / I / i I 60- ts AIS9
--~:~tillb_zC.)_l 40 ~ ~ - ~ - ' ' 4 P ' ~ P'4~ "~'1)
>" 20 z .c~
"'~ T - " . . . . . o.-
401
o ~ x "~ "C). -//,. ,0" i P
o ".-~--.-, .~-~,,.-~J~-~t--r 12 24 36 48 PERIOD OF INCUBATION (H)
FIGURE 2 Frequency of labeled nuclei in WT-4, TS A1S9, and TS C1 cells incubated at 34 ~ and 38.5~ [aH]dThd was supplied to cells for 1 h before sampling. 150-200 nuclei were scored for each sample. (Ik-----O) > 15 grains/nucleus, 34"C; (x x) > 15 grains/ nucleus, 38.5~ ( �9 1-15 grains/nucleus, 34"C; (F1--F1) 1-15 grains/nucleus, 38.5~
zero at 15 h. The frequency of lightly labeled nuclei remained more or less similar to control levels up to 15 h and only declined to near zero by 24 h. On the other hand, with TS C1, heavily labeled nuclei showed a noticeable decline by 6 h after upshift to 38.5~ and reached zero by 12 h. During this interval, the frequency of lightly la- beled nuclei rose noticeably and then dropped to zero at 12-15 h.
Results of analysis of the TS cultures by flow microfluorimetry are presented in Figs. 3 and 4,
.J .J W 0
d
34~ 0 h
38.5"C 24 h
_L_
38.5~ 16h I
L_ 38.5"C 32 h l
RELATIVE CELLULAR DNA CONTENT
FIGURE 3 Distribution of TS A1 $9 cells in relation to DNA content as determined by flow microfluorimetry after various times of culture at 38.5~
34*C 0 h 38.5=C 0.5 h
. .
W 38.5~ 6h
J_ 38.5~ 9.5h
&_ RELATIVE CELLULAR DNA CONTENT
FIGURE 4 Distribution of TS C1 cells in relation to DNA content as determined by flow microfluorimetry after various times of culture at 38.5~
For cells grown at 34~ to midlogarithmic phase, the profiles are similar to those obtained by others for normally cycling cells (12). At 38.5~ the
250 THE JOURNAL OF CELL BIOLOGY' VOLUME 77,1978
Dow
nloaded from http://rupress.org/jcb/article-pdf/77/1/246/1073000/246.pdf by guest on 10 July 2022

mutants showed substantially different behavior. With TS A1S9, after 9 h at 38.5~ there was reduction in the number of cells moving through S and G2 and a concomitant accumulation of ceils in G~ or early S. This distribution persisted un- changed at later times with a small proportion of cells remaining in S and Gz, even after 32 h (Fig. 3). In contrast, when TS C1 cells were incubated at 38.5~ there was an immediate shift in distri- bution away from the normal profile; cells in G~ declined in frequency and those in late S and G2 accumulated. The profile did not change signifi- cantly after 9.5 h, with some cells remaining in G~ or very early S (Fig. 4).
Morphology o f Nuclei
The morphology of nuclei of WT-4 cells grown at 34 ~ and 38.5~ and of both TS mutants at 34~ was similar. The majority of these nuclei showed substantial amounts of condensed chromatin dis- tributed in three general regions: in close associa- tion with the nuclear membrane, in association with large, centrally located nucleoli, and in vari- ably sized electron-dense masses in the main nu- clear space (lower nucleus, Fig. 5; Figs. 12 and 13). In all cultures, variations were observed in the distribution of condensed chromatin, particu- larly that of the nuclear space between the mem- brane and nucleoli. At one extreme, some nuclei showed substantial aggregates of condensed chro- matin (Fig. 13). Although such nuclei may repre- sent very early prophases, they lacked the distinct chromosomes clearly identifiable in unequivocal prophases (Fig. 14). At the opposite extreme were nuclei in which all condensed chromatin apart from that adjacent to the membrane and nucleoli was distributed in dispersed small clumps (upper nucleus, Fig. 5). All degrees of structure between these extremes were seen, with most nuclei showing an intermediate pattern.
When cells of both TS mutants were incubated at 38.5~ for 24 h or more, there was a substantial change in chromatin distribution in a majority of the nuclei. In general, while condensed chromatin remained associated with the nucleolus and as a thin layer at the nuclear membrane, the chromatin of the remaining nuclear space was dispersed in small clumps, giving a general decondensed ap- pearance. Not all nuclei were equally affected; some of them still retained organization similar to that of average control nuclei (Fig. 6).
In an attempt to assess the morphological re- sponses more objectively, chromatin distribution
in individual nuclei was arbitrarily classified on a progressive scale 1 to 5, where type 1 represented maximum dispersion into small dumps and type 5 represented maximum aggregation into large clumps. Examples of the five types of nuclei are illustrated in Figs. 7-13. Thin sections of cell samples of WT-4 and both mutants, at 34 ~ and 38.5~ were coded, and 100-300 nuclei per sample were independently scored by two investi- gators as to frequency of the five nuclear types. The results from the independent blind scoring were parallel, reproducible on repeat trials, and consistent with subjective appraisals of the sec- tions. We therefore adopted the scoring technique as a general approach to assaying nuclear mor- phology in different treatment conditions.
Fig. 15 presents histograms illustrating the fre- quency distribution of nuclear types in WT-4 and TS mutant cells cultured at 34 ~ and 38.5~ for varying periods of time. All control cultures, wild type or mutant, showed a consistent pattern throughout the experiment, i.e. a preponderance of type 3 nuclei, substantial numbers of the highly aggregated types 4 and 5, and some types 1 and 2. At 38.5~ both TS mutants exhibited this same pattern of nuclear morphology for several hours, and then a shift in distribution toward higher frequencies of types 1 and 2 nuclei oc- curred. The change was more rapid with TS C1, being noticeable by 12-15 h whereas TS A1S9 nuclei showed little difference until 24 h. Cultures of both TS cell types had a preponderance of nuclear types 1 and 2 at 36 h. This general pattern of morphological change was observed in six separate experiments with TS A 1 $9 cells and in two with TS C1 cells.
The histograms in Fig. 16 show nuclear re- sponses of the TS A1S9 mutant shifted first from 34 ~ to 38.5~ and then allowed to recover at 34~ At 38.5~ a change to the dispersed state was evident at 24 h and reached a maximum at 36 h. Return to 34~ after 24 h at 38.5~ caused a reestablishment of the normal distribution of nuclear structure. Condensed chromatin structure in recovered TS A1S9 nuclei is illustrated in Figs. 10, 11, and 14. The timing of the recovery was not always the same. In the experiment shown in Fig. 16, reestablishment of a distribution of nuclei similar to that of the control occurred at around 28-32 h. In two other experiments, reversal oc- curred between 12-16 h and 15-24 h, respec- tively. In general, the structural recovery occurred at about the same time that capacity for sub-
SETIERFIELD ET AL. Nuclear Structure in Mutant L Cells 251
Dow
nloaded from http://rupress.org/jcb/article-pdf/77/1/246/1073000/246.pdf by guest on 10 July 2022

FIGURE 5 Electron micrograph of WT-4 cells incubated at 34~ This view is selected to illustrate the maximum range of variation in nuclear structure seen in control cultures. The lower nucleus shows numerous medium-sized aggregates of condensed chromatin in the main nuclear area, while most of the condensed chromatin in the upper nucleus is dispersed in fine aggregates. Bar, 1 /zm. • 10,000.
Dow
nloaded from http://rupress.org/jcb/article-pdf/77/1/246/1073000/246.pdf by guest on 10 July 2022
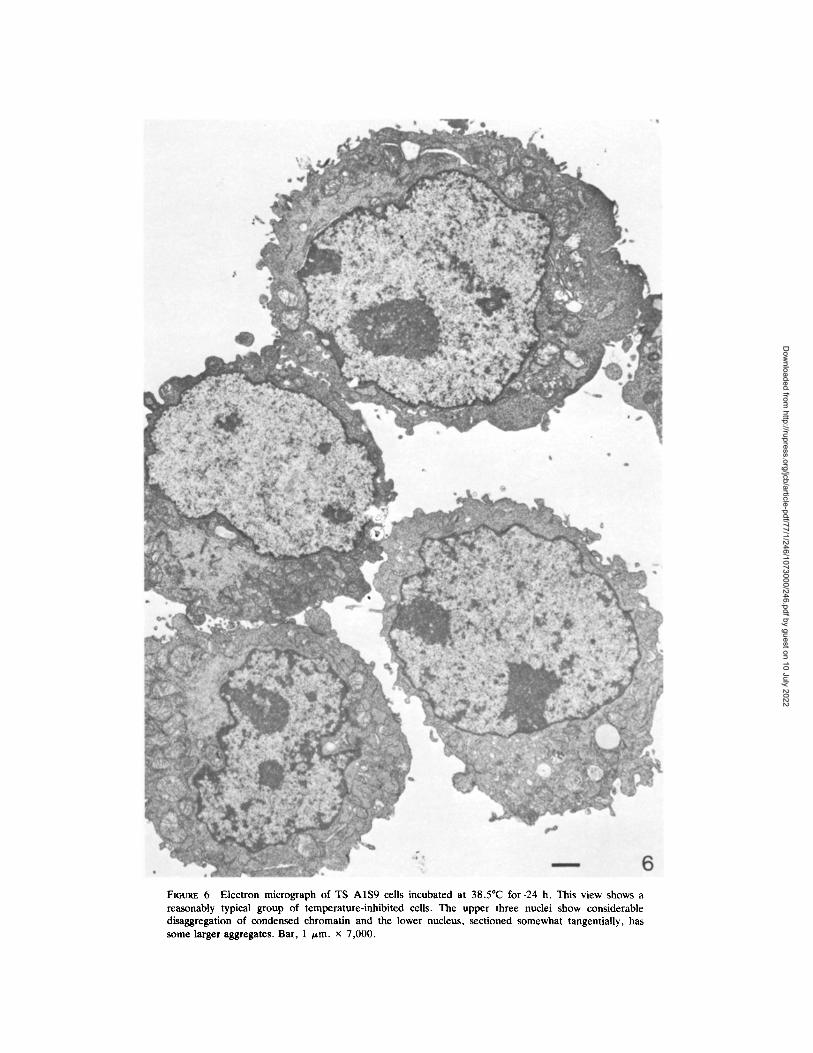
FIGtrRE 6 Electron micrograph of TS A1S9 cells incubated at 38.5~ for .24 h. This view shows a reasonably typical group of temperature-inhibited cells. The upper three nuclei show considerable disaggregation of condensed chromatin and the lower nucleus, sectioned somewhat tangentially, has some larger aggregates. Bar, 1 /zm. x 7,000.
Dow
nloaded from http://rupress.org/jcb/article-pdf/77/1/246/1073000/246.pdf by guest on 10 July 2022

stantial incorporation of [3H]dThd was first de- tectable.
The TS C1 mutant also showed structural rever- sal when returned to 34 ~ from 38.5~ (Fig. 17). Here, the shift to dispersed nuclei was maximum by 16 h at 38.5~ while recovery became evident about 24 h after return to 34~ again at the time DNA synthesis recommenced. The distributions of nuclei in the recovery treatment were somewhat variable at longer times, showing substantial num- bers of types 1 and 2 at 36 and 40 h. This may reflect some synchronization of chromosome rep- lication in the reversed cells.
Morphometry
The volumes of cells, nuclei, and condensed chromatin as measured in several experiments are summarized in Table 1. At 34~ the mean vol- umes of cells and nuclei of the TS mutants re- mained stable at approximately the same level as that of WT-4 cells. In contrast, at 38.5~ both mutants showed a marked increase in cell and nuclear volumes, indicating that growth was con- tinuing in the absence of cell division. Thompson et al. (46) reported similar results for TS A1S9 cells.
The estimated mean volume of condensed chro- matin per nucleus for WT-4, TS AIS9 , and TS C1 cells at 34 ~ and 38.5~ is presented in the final column of Table 1. In this assessment, con- densed chromatin was classified as any region of the nucleus, outside the nucleolus, in which chro- matin fibrils were packed to give recognizably greater electron density than the main regions of decondensed chromatin. There is a degree of uncertainty in classifying chromatin as condensed or decondensed, particularly when the condensed aggregates are small and irregular. Despite this problem, however, the values were reasonably consistent. The volume of condensed chromatin in all control nuclei was similar, falling in the range of 130-160/zm 3. In the mutants at 38.5~ despite the change in distribution of condensed chromatin revealed by morphological scoring, there was no drop in the estimated total amount of condensed chromatin. The main change in overall appearance of the inhibited nuclei resulted then, from a breaking up of large distinct aggre- gates of condensed chromatin into many small clumps spread through enlarged nuclei.
In general, the small clumps of condensed chro- matin in the types 1 and 2 nuclei appeared less electron dense than the larger clumps of types 3-
5 nuclei. This indicates that within the small dumps of the types 1 and 2 nuclei a loosening of chromatin fibrils was occurring, which would probably account in part for the apparent rise in volume of condensed chromatin in the mutants at 38.5~ (Table I). It appears therefore that the overall morphological change in the inhibited TS nuclei is complex, involving both disaggregation of large chromatin clumps into smaller ones and a loosening of individual fibrils within clumps. Com- plete decondensation of fibrils to give nuclei with a homogeneous distribution of chromatin fibrils was encountered only rarely.
DISCUSSION
Expression of the two mutations TS A1S9 and TS C1 at the nonpermissive temperature has a number of similarities. Both lead to cessation of cell proliferation, inhibition of semiconservative DNA synthesis, and accumulation of ceils in inter- phase. At later times, semiconservative DNA synthesis is replaced by repair replication (41, 42). Temperature inactivation of DNA synthesis is followed within 6 h by inhibition of de novo synthesis of chromatin histones although pre- formed histones are fully conserved (44). Proto- plasmic growth is not blocked and continues over several days, leading eventually to at least a doubling of cell and nuclear volume. Both mutants are able to synthesize substantial amounts of mitochondrial DNA at a time when nuclear DNA synthesis is declining (43). Neither mutation leads to an absolute block at a single point in the mitotic cycle, as some heterogeneity in cellular DNA content is present in both strains at the nonpermissive temperature. The significance of this heterogeneity is unclear at present.
Despite similarities in phenotypic expression, the two mutations show important differences. With TS A 1 $9, cell division and DNA replication proceed normally for 6-8 h after upshift to 38.5~ and then decline to a minimal level at about 24 h (41,42). Flow microfluorimetry shows that the majority of cells accumulate at G1 or early S. It appears that most ceils in S and G~ at the time of temperature elevation continue through a normal mitosis and become inhibited only in the succeeding interphase. Temperature inactivation of TS A1 $9 gene product is expressed as a block in the process of chain elongation and maturation of high molecular weight DNA (41). If this is the prime molecular defect, then failure to complete proper replication of the first DNA
254 TrtE JOURNAL OF CELL BIOLOGY - VOLUME 77 , 1978
Dow
nloaded from http://rupress.org/jcb/article-pdf/77/1/246/1073000/246.pdf by guest on 10 July 2022

to commence synthesis in early S leads to a cessation of further replication and to accumula- tion of nuclei at the G1/S interface.
In TS C1 cells at 38.5~ incorporation of dThd into high molecular weight DNA starts to decline almost immediately after transfer of cells to 38.5~ with maximal inhibition of synthesis observed by 17-20 h (42). Low molecular weight DNA does not accumulate (Guttman and Sheinin, unpublished data). A majority of cells appear unable to complete the interphase in progress at temperature upshift and accumulate toward late S and G2. The numerous, lightly labeled nuclei observed in autoradiographs during early stages of temperature inactivation presumably represent nuclei with declining rates of DNA synthesis at various points in S. Another population of cells, presumably those traversing M and G1 at temper- ature upshift, are blocked at the Gdeariy S inter- face.
Clearly, the two mutations provide major blocks at different points in the cell cycle, TS A1S9 at GJS and TS C1 at S/G2. The main finding in the present study is that expression of both mutations leads to a similar change in gross organization of interphase chromatin despite these quite distinct forms of cycle inhibition. In both mutants, temperature inactivation of DNA syn- thesis is closely followed by dispersion of larger aggregates of condensed chromatin into small clumps. As far as can be estimated by electron microscopy morphometry, this process involves a
breaking up of larger chromatin aggregates into smaller ones and some separation of fibrils within chromatin aggregates. These gross changes prob- ably reflect alternations in the configurational organization of condensed chromatin at the mo- lecular level. The morphological change is revers- ible on reestablishment of normal cell cycle activ- ity by return of temperature-inactivated cells from 38.5 ~ to 34~
Because two quite disparate blocks in the cell cycle lead to substantially the same changes in nuclear morphology, the observed reorganization of chromatin is probably not a direct effect of the TS lesions, but rather results from secondarily induced imbalances in normally coordinate proc- esses of the cell cycle. In particular, we suggest that in normal nuclei ordered disaggregation of condensed chromatin occurs in tandem arrays of replicating units (19) in association with initiation of DNA replication. Minicycles of disaggregation and reaggregation of chromatin would occur in ordered fashion throughout S paralleling an or- dered progression of chromosome replication (3, 14), with reaggregation being dependent upon normal completion of replication. The progressive accumulation of dispersed type 1 and 2 nuclei in temperature-inactivated TS A 1 $9 and TS C 1 cells would result from the mutational blocks affecting chromatin replication without substantially inter- fering with the disaggregation process. As TS A1 $9 cells become blocked in early S some 8-24 h after temperature upshift, they would continue
FIGURES 7-13 are electron micrographs of nuclei with different degrees of aggregation of condensed chromatin classified in the five arbitrary "types" used for morphological scoring.
FIGOnE 7 Type 1 nucleus. Maximum chromatin disaggregation. TS A1S9 cell at 38.5"C for 24 h. Bar, 1 /am. x 10,000.
FmuaE 8 Type 2 nucleus. Condensed chromatin in fine dumps. TS A1S9 cell at 38.5~ for 36 h. Bar, 1 ttm. • 10,000.
FmURE 9 Type 2 nucleus. TS C1 cell at 38.5"C for 24 h. Bar, 1 /xm. x 9,000.
FmVRE 10 Type 3 nucleus. Medium aggregation of condensed chromatin. TS A1S9 cell at 38.5"C for 24 h, then at 34"C for 36 h. Bar, 1 /~m. x 13,000.
FIGURE 11 Type 4 nucleus. Substantial aggregation of condensed chromatin. TS A1S9 cell at 38.5~ for 24 h, then at 34~ for 36 h. Bar, 1 /am, x 9,000.
FIGURE 12 Type 5 nucleus. Maximum aggregation of condensed chromatin. TS C1 cell at 34"C. Bar, 1 /,tm. • 11 ,000 .
FIGURE 13 Type 5 nucleus. WT-4 cell at 34"C. Bar, 1 /am.
FmuaE 14 Electron micrograph of a nucleus in a clearly recognizable prophase with discrete condensed mitotic chromosomes. TS AlS9 cell at 38.5~ for 24 h, then at 34"C for 52 h. Bar, 1 /am. x 12,000.
SEITERFIELD ET AL. Nuclear Structure in Mutant L Cells 255
Dow
nloaded from http://rupress.org/jcb/article-pdf/77/1/246/1073000/246.pdf by guest on 10 July 2022

256 THE JOURNAL OF CELL BIOLOGY" VOLUME 77, 1978
Dow
nloaded from http://rupress.org/jcb/article-pdf/77/1/246/1073000/246.pdf by guest on 10 July 2022

SETI'ERFIELD ET AL. Nuclear Structure in Mutant L Cells 2 5 7
Dow
nloaded from http://rupress.org/jcb/article-pdf/77/1/246/1073000/246.pdf by guest on 10 July 2022

WT-4 ~-_~
WT-4 38.5
E ~ts AIS9 uJ 34 I - c3 z
Ld 0_ ts AIS9
38.5 .-I _J O
tsCl 34
ts el 38.5
0 12 15 24 36
PERIOD OF INCUBATION (H I
FIGURE 15 Histograms showing frequencies of nuclei with different degrees of chromatin dispersion as scored in electron micrographs of cultures of WT-4, TS A1S9, and TS C1 cells incubated for various times at 34 ~ and 38.5~ Each individual histogram displays the percent of each of the five nuclear types as labeled in the histogram in the upper left. Type 1 nucleus, maximum chromatin dispersion; type 5, maximum aggregation (see Figs. 7-13). The number in the upper right of each histogram gives the number of nuclei scored.
to undergo progressive decondensation more or less as they would in a normal S phase. Inasmuch as further replication is blocked, however, recon- densation would be prevented and dispersed nu- clei would accumulate. With TS C1 at 38.5~ cells become more rapidly inhibited in all stages of S. In this case, we would envisage that as chromatin decondensation progresses during S phase, progressive inability to properly complete replication of all replicons in the same group would lead to accumulation of decondensed re- gions. A shift to decondensed nuclei occurs more rapidly with this mutant than with TS A1S9. Reestablishment of normal replication in mutant cells downshifted from 38.5 ~ to 34~ would allow progressive reaggregation to proceed and lead eventually to normal distributions of condensed chromatin. Although we have not done detailed
kinetics on these situations, and the heterogeneous distribution of cells in the blocked mutants creates complication, the results on nuclear morphology in Figs. 15-17 are in general as expected from this hypothesis.
If this interpretation is valid, other situations which specifically block chromosome replication without affecting the S phase chromatin aggrega- tion cycle should lead to changes in nuclear orga- nization similar to those observed here. Indeed, we have found that the inhibitors hydroxyurea, mitomicin C, 5-fluorodeoxyuridine, and cyto- sine arabinoside produce substantially the same changes in nuclear morphology as do the TS mutations (Setterfield, Sheinin, and Dardick, un- published data). Hydroxyurea gives biochemical responses similar to the inhibited TS A1S9 mu- tant (26). Furthermore, cytological consequences of the disease megaloblastic anemia could be interpreted on the same basis. This condition results from inadequate levels of folic acid and vitamin B12, leading to reduced DNA synthesis, and is characterized by accumulation of erythro- blasts with markedly disaggregated chromatin (20).
Although several workers have suggested that there may be a regular cycle of changes in chro- matin organization during interphase, its existence remains to be firmly established. Progressive changes during interphase in several properties of chromatin, such as binding of actinomycin D (35), sensitivity to DNase attack (34), binding of safranine (1), circular dichroism and binding of ethidium bromide (31), and interaction with heparin and phosphorylation of histones (18), have been taken as indirect evidence of ordered changes in chromatin organization associated with the cell cycle. It is difficult, however, to relate these parameters directly to the state of gross organization of chromatin.
Results from direct microscope observation of interphase structure in normally cycling cells have been inconclusive in establishing ordered patterns of change in chromatin organization. This is not surprising as the changes envisaged involve local- ized parts of the genome and are transitory. If disaggregation, replication, and reaggregation are closely coupled, only the condensed chromatin actually replicating would be temporarily disaggre- gated, and the appearance of a nucleus at the time of fixation would depend on which chromatin was undergoing replication. If much of the con- densed chromatin replicated in a limited part of
258 THE JOURNAL OF CELL BIOLOGY" VOLUME 77,1978
Dow
nloaded from http://rupress.org/jcb/article-pdf/77/1/246/1073000/246.pdf by guest on 10 July 2022
34 continuous
58.5
I-- 24 h~,38.5
34
Oh 29,12,h 2,9 i
I 2 3 4 5124h 261136h 247148h 3aol Nuclear ~ ~
i \ ........ 28h 34o 32 h a6o
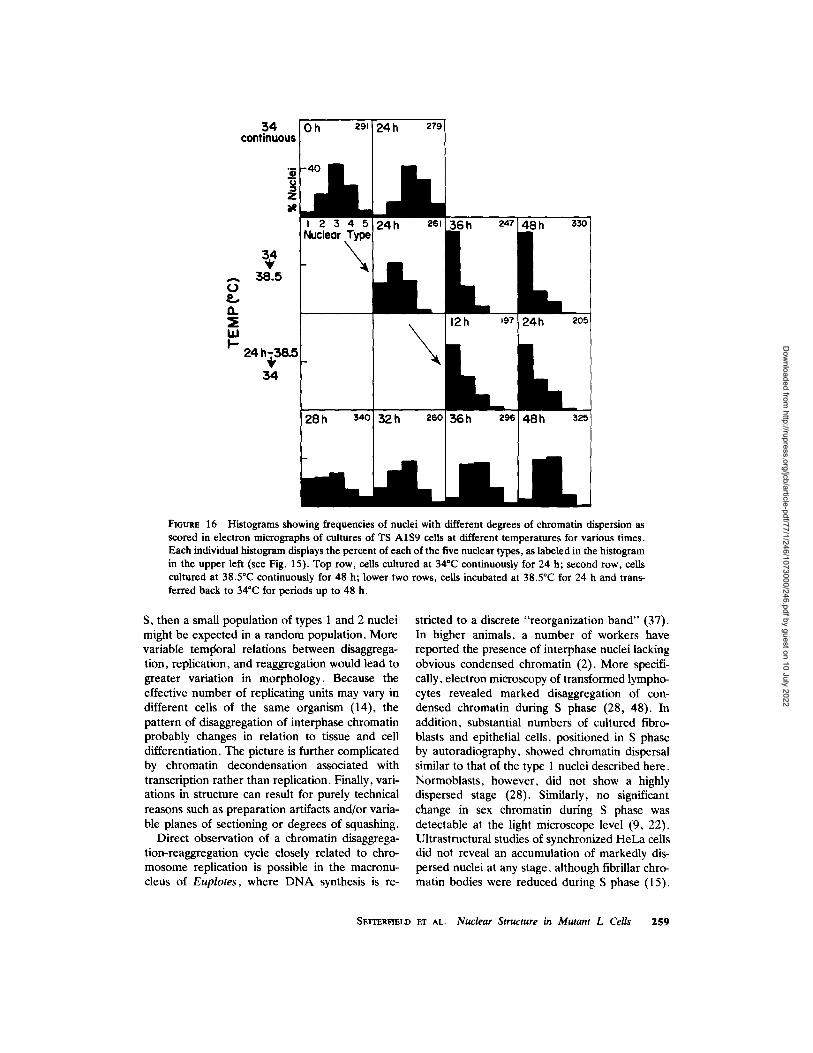
FIGURE 16 Histograms showing frequencies of nuclei with different degrees of chromatin dispersion as scored in electron micrograpbs of cultures of TS A1S9 cells at different temperatures for various times. Each individual histogram displays the percent of each of the five nuclear types, as labeled in the histogram in the upper left (see Fig. 15). Top row, cells cultured at 34"C continuously for 24 h; second row, ceils cultured at 38.5"C continuously for 48 h; lower two rows, cells incubated at 38.5~ for 24 h and trans- ferred back to 34~ for periods up to 48 h.
S, then a small population of types 1 and 2 nuclei might be expected in a random population. More variable teml~ral relations between disaggrega- tion, replication, and reaggregation would lead to greater variation in morphology. Because the effective number of replicating units may vary in different cells of the same organism (14), the pattern of disaggregation of interphase chromatin probably changes in relation to tissue and cell differentiation. The picture is further complicated by chromatin decondensation associated with transcription rather than replication. Finally, vari- ations in structure can result for purely technical reasons such as preparation artifacts and/or varia- ble planes of sectioning or degrees of squashing.
Direct observation of a chromatin disaggrega- tion-reaggregation cycle closely related to chro- mosome replication is possible in the macronu- cleus of Euplotes, where DNA synthesis is re-
stricted to a discrete "reorganization band" (37). In higher animals, a number of workers have reported the presence of interphase nuclei lacking obvious condensed chromatin (2). More specifi- cally, electron microscopy of transformed lympho- cytes revealed marked disaggregation of con- densed chromatin during S phase (28, 48). In addition, substantial numbers of cultured fibro- blasts and epithelial cells, positioned in S phase by autoradiography, showed chromatin dispersal similar to that of the type 1 nuclei described here. Normoblasts, however, did not show a highly dispersed stage (28). Similarly, no significant change in sex chromatin during S phase was detectable at the light microscope level (9, 22). Ultrastructural studies of synchronized HeLa cells did not reveal an accumulation of markedly dis- persed nuclei at any stage, although fibrillar chro- matin bodies were reduced during S phase (15).
SETrER~mLD ET AL. Nuclear Structure in Mutant L Cells 259
Dow
nloaded from http://rupress.org/jcb/article-pdf/77/1/246/1073000/246.pdf by guest on 10 July 2022

34 t 72h continuous
47s196h 28,{
UJ
16 h-38.5
3 4
Nuclear Type h 435
337fl2 h 33alt6h 264
20h 35Jl 24 h 404 I 28h 2a~ 132h t92
36 h 4o6140 h 365 j 48 h 419160 h z;'o
FIGURE 17 Histograms showing frequencies of nuclei with different degrees of chromatin dispersion as scored in electron micrographs of cultures of TS C1 cells at different temperatures for different times. Each individual histogram displays the percent of each of the five nuclear types, as labeled in the histo- gram in the upper left (see Fig. 15). Top row, cells cultured at 34"C continuously for 96 h; bottom three rows, cells incubated at 38.5~ for 16 h and transferred back to 34"C for periods up to 60 h.
A quantitative microscope analysis of Feulgen- stained nuclei of cultured mouse fibroblasts indi- cated a progressive increase in the proportional area of condensed chromatin from Gl to Gz, with considerable variation at all stages (39). Quanti- tative light and electron microscopy of synchro- nized cells in onion root tips revealed a loosening of chromatin fibrils in condensed chromatin bod- ies between mid Gt and mid S, and a considerable increase in condensed chromatin from mid S to mid G~ (49). A distinct difference in the con- densed chromatin of G~ and G2 nuclei was also observed in the related plant, Allium flavum (29). In several plant species, there is a short period of massive chromatin disaggregation, the Z phase, which occurs near the end of S, and is followed by an accumulation of an increased proportion of condensed chromatin (4, 5).
With short labeling times and light microscope autoradiography, in both animals (10) and plants
(30), silver grains are found over condensed chro- matin, indicating that no large-scale, prolonged decondensation is essential for replication. The low resolution of the technique, however, does not rule out the possibility of transient small-scale chromatin dispersal at immediate sites of replica- tion. Results of several electron microscope auto- radiographic studies of animal cells after short pulse labeling of DNA indicate that the sites of precursor incorporation are in dispersed chroma- tin, often at the periphery of condensed chromatin masses (6, 16, 21, 28, 48). This is particularly obvious in transformed lymphocytes (28, 48) and reactivated erythrocyte nuclei in heterokaryons (21). Similarly, Lafontaine and Lord (23) have demonstrated in the plant Allium porrum that at all periods of S, after a 10-min pulse of [~H]dThd, the majority of silver grains lie over diffuse chro- matin often at the margins of a reticulum of condensed chromatin. This reticulum shows par-
260 THE JOURNAL OF CELL BIOLOGY "VOLUME 77, 1978
Dow
nloaded from http://rupress.org/jcb/article-pdf/77/1/246/1073000/246.pdf by guest on 10 July 2022

TABLE I
Volumes o f Cells, Nuclei, and Condensed Chromatin for WT-4, TS A1S9, and TS C1 Cells Incubated at 34* and 38.5~
Mr.an volume
Period of incu- Condensed Cell fine Temperature bation N Cell Nucleus chromatin
WT-4 34 24 19 660 270 162 38.5 24 20 716 274 135
TS A1S9 34 0 67 818 295 148 24 56 850 304 142 48 27 736 290 157
38.5 12 20 1,023 377 162 24 46 1,177 446 172 48 25 1,318 584 240
TS C1 34 0 58 724 278 131 24 74 708 278 138 48 27 818 367 162
38.5 12 33 1,177 445 210 24 45 1,194 462 196 48 21 1,597 688 217
Cell volumes were calculated from diameter measurements of samples of 40-80 cells taken in a light microscope on sections 2 /zm thick. Volumes of nuclei and condensed chromatin were estimated by stereological point counting on electron micrographs of thin sections; the column "N" gives the number of cells in each point-count sample. The periods of incubation are taken from the time at the start of the experiment; before this, the cells were in culture at 34* C.
tial dispersal during G, to S. A similar effect is even more evident in EM autoradiographs of replicating chromocenters in radish (25). In this case, highly localized clumps of condensed chro- matin showed marked dispersal at the points of [~H]dThd incorporation.
Taken overall, these microscope observations are consistent with the concept of a cycle of chromatin dispersion associated with replication. However , the situation is not simple. Although large-scale disaggregation occurs in some cases, transient localized dispersion seems the more prevalent condition. The finding of a small popu- lation of type 1 nuclei in wild-type L-cell cultures (Fig. 5), however, raises the possibility that there may be a short phase of large-scale disaggregation in these cells analogous to the Z phase in plant cells (4, 5). For normoblasts and human sex chromatin where no S phase disaggregation has been demonstrated, very localized, transient dis- persal can only be postulated at this time. The full understanding of chromatin changes in any cell type, then, requires very detailed analysis by several methods. Inasmuch as both histone (18) and nonhistone (8, 51) chromosomal proteins have been implicated in chromatin condensation,
the possible molecular mechanisms for regulated changes in interphase structure are numerous. In this context, the observation that inhibition of histone synthesis follows closely on temperature inactivation of D N A replication in TS A1S9 and TS C1 cells (44) acquires added significance.
The authors wish to thank Dr. L. Thompson for carrying out the microfluorimetric analyses.
This investigation was supported by grants from the National Research Council of Canada, Medical Re- search Council of Canada, and the National Cancer Institute of Canada.
Received for publication 2 August 1977, and in revised form 6 December 1977.
R E F E R E N C E S
1. ALVAREZ, Y., and Y. VALLARDES. 1972. Differen- tiated staining of the cell cycle. Nat. New Biol. 238:279-280.
2. BACK, F. 1976. The variable condition of euchro- matin and heterochromatin. Int. Rev. Cytol. 45:25- 64.
3. B~Low, P. W. 1972. The ordered replication of chromosomal DNA: a review and a proposal for its control. Cytobios. 6:55-80.
SE'ITERI~ELD ET AL. Nuclear Structure in Mutant L Cells 261
Dow
nloaded from http://rupress.org/jcb/article-pdf/77/1/246/1073000/246.pdf by guest on 10 July 2022

4. BARLOW, P. W. 1976. The relationship of the dispersion phase of chromocentric nuclei in the mitotic cycle to DNA synthesis. Protoplasma. 90:381-392.
5. BARLOW, P. W. 1977. Changes in chromatin struc- ture during the mitotic cycle. Protoplasma. 91:207- 211.
6. BLONDEL, B. 1968. Relation between nuclear fine structure and 3H-thymidine incorporation in a syn- chronous cell culture. Exp. Cell Res. 53:348-356.
7. BRASCH, K., G. SETrERFIELD, and J. M. NEELIN. 1972. Effects of sequential extraction of histone proteins on structural organization of avian eryth- rocyte and liver nuclei. Exp. Cell Res. 74:27-41.
8. BRASCH, K., and G. SETrERFIELD. 1974. Structural organization of chromosomes in interphase nuclei. Exp. Cell Res. 83:175-185.
9. COMINGS, D. E. 1967. The duration of replication of the inactive X chromosome in humans based on the persistence of the heterochromatic sex chroma- tin body during DNA synthesis. Cytogenetics (Basel). 6:20-37.
10. COMINGS, D. E. 1967. Sex chromatin, nuclear size and the cell cycle. Cytogenetics (Basel). 6:120-144.
11. COMINGS, D. E. 1968. The rationale for an ordered arrangement of ehromatin in the interphase nucleus. Am. J. Hum. Genet. 20:440-460.
12. CRISSMAN, H. A., P. F. MULLANEY, and J. A. STEINKAMP. 1975. Methods and applications of flow systems for analysis and sorting of mammalian cells. Methods Cell Biol. 9:179-246.
13. DARDICK, I., and G. SETrERFIELD. 1976. Volume of condensed chromatin in developing primitive- line erythrocytes of chick. Exp. Cell Res. 100:159- 171.
14. EDENBERG, H. J., and J. A. HUBERMAFI. 1975. Eucaryotic chromosome replication. Annu. Rev. Genet. 9:245-283.
15. ERLAr~DSON, R. A., and E. DE HARVEN. 1971. The ultrastructure of synchronized HeLd cells. J. Cell Sci. 8:353-397.
16. FAKAN, S., and R. HANCOCK. 1974. Localization of newly-synthesized DNA in a mammalian cell as visualized by high resolution autoradiography. Exp. Cell Res. 83:95-102.
17. Frucl-I, J. T., and A. KLUG. 1976. Solenoidal model for superstructure in chromatin. Proc. Natl. Acad. Sci. U. S. A. 73:1897-1901.
18. GURLEY, L. R., R. A. WALTERS, C. E. HILDE- BRAND, P. G. HOHMANN, S. S. BARHAM, L. L. DEAVEN, and R. A. TOBEY. 1977. Histone phos- phorylation related to chromatin structure. In: International Cell Biology 1976-1977. B. R. Brink- ley and K. R. Porter, editors. The Rockefeller University Press, New York.
19. HAND, R. 1975. Regulation of DNA replication on subchromosomal units of mammalian cells. J. Cell Biol. 64:89-97.
20. HOFFBRAND, A. V., K. GANESHAGURU, J. W. L. HOOTON, and E. TRIPP. 1976. Clinics in Haematol- ogy 5:727-745.
21. JOHNSON, R. T., and A. M. MULLINGER. 1975. The induction of DNA synthesis in the chick red cell nucleus in heterokaryons during the first cell cycle after fusion with HeLd cells. J. Cell Sci. 18:455-490.
22. KLINGER, H. P., H. G. SCHWARZACHER, and J. WEISS. 1967. DNA content and size of sex chro- matin positive female nuclei during the cell cycle. Cytogenetics (Basel). 6:1-19.
23. LAFONTAXNE, J. G., and A. LORD. 1974. An ultra- structural and radioautographic study of the evolu- tion of the interphase nucleus in plant meristematic cells ( Allium porrum ). J. Cell Sci. 14:263-287.
24. LEE, J. C., and J. J. YUNIS. 1971. Cytological variations in the constitutive heterochromatin of Microtus agrestes. Chromosoma ( Berl. ). 35:117- 124.
25. LORD, A., and J. G. LAFONTAINE. 1976. An ultra- structural and radioautographic study of the chro- mocentric interphase nucleus in plant meristematic cells ( Raphanus sativus ). J. Cell Sci. 21:193-207.
26. MARTIN, R. F., I. RADFORD, and M. PARDEE. 1977. Accumulation of short DNA fragments in hydroxyurea treated mouse L-cells. Biochem. BIO- phys. Res. Commun. 74:9-15.
27. MAZIA, D. 1963. Synthetic activities leading to mitosis. J. Cell. Comp. Physiol. 62(Suppl. 1): 123- 140.
28. MILNER, G. 1969. Nuclear morphology and the ultrastructural localization of deoxyribonucleic acid synthesis during interphase. J. Cell Sci. 4:569-582.
29. NAGL, W. 1970. Correlation of chromatin structure and interphase stage in nuclei of Allium flavum. Cytobiologie. 1:395-398.
30. NAGL, W. 1970. The mitotic and endomitotic nu- clear cycle in Allium carinatum II. Relations be- tween DNA replication and chromatin structure. Caryologia. 23:71-78.
31. NICOLrNI, C., K. AnRO, T. W. BORUN, and R. BASERGA. 1975. Chromatin changes during the cell cycle of HeLa cells. J. Biol. Chem. 250:3381-3385.
32. OtaNS, A. L., M. B. SENIOR, and D. E. DUNS. 1976. Ultrastructural features of chromatin nu bod- ies. J. Cell Biol. 68:787-792.
33. OUDET, P., M. GROSSoBELLARD, and P. CHAMBON. 1975. Electron microscopic and biochemical evi- dence that chromatin structure is a repeating unit. Cell. 4:281-300.
34. PEDERSON, T. 1972. Chromatin structure and the cell cycle. Proc. Natl. Acad. Sci. U. S. A. 69:2224- 2228.
35. PEDERSON, T., and E. ROBBINS. 1972. Chromatin structure and the cell division cycle, actinomycin binding in synchronized HeLd cells. J. Cell Biol. 55:322-327.
262 THE JOURNAL OF CELL BIOLOGY �9 VOLUME 77, 1978
Dow
nloaded from http://rupress.org/jcb/article-pdf/77/1/246/1073000/246.pdf by guest on 10 July 2022
36. RAO, P. N., and R. T. Jorl~soN. 1974. Induction of chromosome condensation in interphase cells. Adv. Cell Mol. Biol. 3:135-189.
37. RIN6ERTZ, N. R., J. L. E. EmcssoN, and O. NILSSON. 1967. Macronuclear chromatin structure in Euplotes. Exp. Cell Res. 48:97-117.
38. RtJcn, F., and A. ROSS~LEX. 1970. A cytochemical study of euchromatin and heterochromatin in roots of Rhoeo discolor. Exp. Celt Res. 62:219-227.
39. Snwlcra, W., J. ROWlNSrd, and R. SWENSON. 1974. Change of chromatin morphology during the cell cycle detected by means of automated image analysis. J. Cell. Physiol. 84:423-428.
40. SnEININ, R. 1976. Polyoma and cell DNA synthesis in mouse L-cells temperature-sensitive for the rep- lication of cell DNA. J. Virol. 17:692-704.
41. ShEnSi, R. 1976. Preliminary characterization of the temperature-sensitive defect in DNA replication in a mutant mouse L-cell. Cell. 7:49-57.
42. Sn~ir~rs, R., and S. Gtn'rMAN. 1977. Semi-con- servative and non-conservative replication of DNA in temperature-sensitive mouse L-cells. Biochim. Biophys. Acta. 479:105-118.
43. SI~E~rS, R., P. DA.mtAGH, and M. DtmsKY. 1977. Mitochondrial DNA synthesis in mouse L-cells tem- perature-sensitive in nuclear DNA replication. Can. J. Biochem. 55:543-547.
44. SnEInIN, R., P. DAmo,61t, and M. DtmsKv. 1978. Some properties of chromatin synthesized by mouse
L-cells temperature sensitive in DNA replication. J. Biol. Chem. In press.
45. Srm4NF.gs, C. P., and J. C. TILL. 1960. DNA synthesis in individual L-strain mouse cells. Biochim. Biophys. Acta. 37:406--419.
46. Tnor, i~oN, L. H., R. MANKovrrz, R. M. BAKER, J. E. TILL, L. SnaI~oVlTcn, and G. F. WmTMORE. 1970. Isolation of temperature-sensitive mutants of L-cells. Proc. Natl. Acad. Sci. U. S. A. 66:377- 384.
47. TnouPSON, L. H., R. MANKOVlTZ, R. M. BAKER, J. A. WmGnl, J. E. TILL, and G, F, W m m o ~ , 1971. Selective and non-selective isolation of tem- perature-sensitive mutants of mouse L-ceUs and their characterization. J. Cell. Physiol. 78:431-439.
48. TOKUYASU, K., S. C. MADDEN, and L. J. ZELOIS. 1968. Fine structural alterations of interphase nuclei of lymphocytes stimulated to growth activity in vitro. J. Cell Biol. 39:630-660.
49. DE LA TORRE, C., A. SACRISTAN-GARATE, and M. H. NAVARRETE. 1975. Structural changes in chro- matin during interphase. Chromosoma (Berl.). 51:183-198,
50. WEIaEL, E. R., G. S. KISTLER, and W. F. SC8ERLE. 1966. Practical stereological methods for morpho- metric cytology. J. Cell Biol. 30:23-38.
51. WUNDERLICH, F., and G. HERLAN. 1977. A revers- ibly contractile nuclear matrix Its isolation, struc- ture, and composition. J. Cell Biol. 73:271-278.
SE'ITERFIELD ET AL. Nuclear Structure in Mutant L Cells 263
Dow
nloaded from http://rupress.org/jcb/article-pdf/77/1/246/1073000/246.pdf by guest on 10 July 2022


![100040.ppt [\254\333\256e\274\322\246\241]](https://static.fdokumen.com/doc/165x107/633baafca215b3a22b0d61d3/100040ppt-254333256e274322246241.jpg)


![HKIFM CPD MVAC.ppt [\254\333\256e\274\322\246\241]](https://static.fdokumen.com/doc/165x107/63175591c72bc2f2dd056c30/hkifm-cpd-mvacppt-254333256e274322246241.jpg)
![Betty_Eng.ppt [\254\333\256e\274\322\246\241]](https://static.fdokumen.com/doc/165x107/6320bdd6aaa3e1b19f07a319/bettyengppt-254333256e274322246241.jpg)

![100019.ppt [\254\333\256e\274\322\246\241]](https://static.fdokumen.com/doc/165x107/631ce499b8a98572c10d1be1/100019ppt-254333256e274322246241.jpg)