Introduction of HIGEN \(English_131001_Rev2\).ppt [\310\243 ...
Upload
khangminh22Category
view
5download
0
.I
I
I
. .
.-
I11III
..
m
m
KPP~DKomIt. Pemantauan Pelaksanaan Otonoml D..rahReg/ollal Autonomy Watch
.The Asia Foundation
Supported by:
AustralianAlD~

This 2011 report on Local Economic Governance (LEG) is the fruit of a cooperation effort between KPPOD (Komite Pemantauan Pelaksanaan Otonomi Daerah, or Regional Autonomy Watch) and The Asia Foundation. The members of the KPPOD team were Sigit Murwito, Riyanto, Firman Bakrie, Robert Endi Jaweng and Boedhi Reza, with P. Agung Pambudhi acting as coordinator, while the Asia Foundation team consisted of Mochamad Mustafa, Romawati Sinaga and Ronaldo Oktaviano, coordinated by Erman A. Rahman and supported by Frida Rustiani, Hari Kusdaryanto, R. Alam Surya Putra, Aryasatyani Sintadewi and Hesti Wulandari.
This report is based on the results of a survey of business operators carried out by Nielsen Indonesia. In addition, the Jawa Pos Institute of Pro-Otonomi (JPIP) performed a qualitative study to complement the quantitative survey. The analysis and writing of the report was done jointly by KPPOD and The Asia Foundation. Valuable input and suggestions from Prof. Dr. Suahasil Nazara and Prof. Dr. Robert Simanjuntak, both of the University of Indonesia, Faculty of Economics, have been taken into consideration in the writing of the report.
Funding for this undertaking has been provided by the Australian Agency for International Development (AusAID). However, AusAID is exempted from responsibility for the material contained in this report.

iiiKPP D
Decentralization has been underway in Indonesia for more than ten years, but recently many have challenged the how effectively decentralization – and even democratization – is being implemented. Deterioration in the quality of public services, the many corruption cases involving local governments, and low economic growth rates in some regions have prompted discourse about whether the country is making a reversal away from decentralization and democratization.
We recognize that the move toward regional autonomy has not been without its faults. Nevertheless, a choice was made to strengthen democracy and move towards local autonomy based on the problems created by the centralistic, authoritarian system of the previous regime. Yet it is unfair to judge regional autonomy a failure after it has been implemented for such a short time, and under a somewhat inconsistent policy framework.
Since 2001, the Regional Autonomy Watch (KPPOD) and The Asia Foundation have aimed to present a clear picture of the quality of regional economic governance from the perspective of business owners. Our studies provide input to government at the central, provincial and regional/municipal levels, as well as information to other stakeholders regarding efforts that can be undertaken to promote improve economic growth under regional autonomy.
This year’s study finds significant variation among regions in the quality of economic governance. This indicates that despite many limitations, some regions have used the opportunities provided by autonomy to foster good governance while others have not. It is hoped that this present study, and the awards presented to regencies and municipalities with the best performance, will promote a healthy competition among regional leaders. It is also envisioned that local governments whose performance is still low can learn from their neighbors who are doing better, and be inspired to improve.
We recognize that improving economic governance requires a strong commitment and hard work, not only from the heads of regions but from all ranks of government officials, politicians, business owners and other stakeholders. This study can help set priorities for reform of local economic governance, identifying areas for immediate improvement that are relatively easy to achieve but have the potential of significant impact. Other aspects may need more time for improvement.
Preface

iv
KPPOD and The Asia Foundation would like to thank all parties who supported this study being conducted, and particularly the Government of Australia (AusAID) for its funding support. We hope that this small contribution will encourage improvements in decentralized governance in Indonesia.
Jakarta, June 2011
P. Agung Pambudhi Robin BushExecutive Director Country RepresentativeRegional Autonomy Watch/KPPOD The Asia Foundation

vKPP D
Preface iiiTable of Contents ................................................................................................................................................ vList of Tables .................................................................................................................................................... viiiList of Graphs ..................................................................................................................................................... ixList of Boxes .......................................................................................................................................................xiiList of Terms and Abbreviations ..................................................................................................................xiiiExecutive Summary .......................................................................................................................................... xv
1. INTRODUCTION .........................................................................................................................................1 1.1 Background .............................................................................................................................................1 1.2 Research Objectives ................................................................................................................................2 1.3 Results of the Study ...............................................................................................................................2
2. METHODOLOGY.........................................................................................................................................3 2.1 Conceptual Framework .........................................................................................................................3 2.2 Indicators of Local Economic Governance .........................................................................................4 2.3 Research Locations .................................................................................................................................4 2.4 Research Instruments ............................................................................................................................5 2.5 Weighting of Indicators Forming the Local Economic Governance Index ....................................6 2.6 Sampling ..................................................................................................................................................7 2.7 Construction of LEG Index ...................................................................................................................7
3. CHARACTERISTICS OF RESPONDENTS AND FIRMS ...................................................................9 3.1 Characteristics of Respondents ............................................................................................................9 3.2 Characteristics of Firms .........................................................................................................................9 3.3 Firms' Performance and Plans ............................................................................................................11
4. LAND ACCESS ...........................................................................................................................................13 4.1 Background ...........................................................................................................................................13 4.2 Land ownership ....................................................................................................................................14 4.3 Time Needed to Process Land Certificates .......................................................................................14 4.4 Perceived Ease of Obtaining Land ....................................................................................................15 4.5 Land Eviction Cases .............................................................................................................................16 4.6 Land Conflict Cases .............................................................................................................................17 4.7 Significance of Land Problems on Business .....................................................................................17 4.8 Land Access Sub-Index .......................................................................................................................18
Table of Contents

vi
5. LOCAL INFRASTRUCTURE ...................................................................................................................21 5.1 Background ...........................................................................................................................................21 5.2 Quality of Local Infrastructure ...........................................................................................................21 5.3 Time Needed to Repair Damaged Infrastructure ............................................................................23 5.4 Frequency of Blackouts and Level of Generator Ownership .........................................................25 5.5 Obstruction Level of Infrastructure for Firm Performance ............................................................26 5.6 Local Infrastructure Sub-Index...........................................................................................................26
6. BUSINESS LICENSING ............................................................................................................................31 6.1 Background ...........................................................................................................................................31 6.2 Level of Permit Ownership .................................................................................................................31 6.3 Time Needed to Obtain TDP ..............................................................................................................32 6.4 Perceived Level of Difficulty of Obtaining TDP ..............................................................................33 6.5 Cost of TDP and Firms’ Perceptions of Cost as an Obstacle to Business ....................................33 6.6 Licensing Services Free from Collusion, Efficient and Free from Illegal Changes .....................34 6.7 Availability of Complaint Mechanisms ............................................................................................35 6.8 Obstruction Level of Business Licensing for Business Performance ............................................36 6.9 Business Licensing Sub-Index ............................................................................................................36
7. LOCAL-LEVEL REGULATIONS .............................................................................................................39 7.1 Background ...........................................................................................................................................39 7.2 Methodology and Variables Forming the Local-Level Regulations Sub-Index ..........................39 7.3 Characteristics of the Local-Level Regulations Studied .................................................................40 7.4 Juridical Problems ................................................................................................................................41 7.5 Substance Problems .............................................................................................................................42 7.6 Principle Problems ...............................................................................................................................43 7.7 Local-Level Regulations Sub-Index ...................................................................................................44
8. TRANSACTION COSTS ...........................................................................................................................49 8.1 Background ...........................................................................................................................................49 8.2 Obstruction Level of Local Taxes and Local User Charges on Firm Performance .....................49 8.3 Official Costs for Inter-regional Commodity Distribution Activities ...........................................51 8.4 Level of Payment of Donations to Local Governments ..................................................................52 8.5 Security Costs ........................................................................................................................................53 8.6 Impact of Transaction Costs on Business Activities ........................................................................54 8.7 Transaction Costs Sub-Index ..............................................................................................................54
9. CAPACITY AND INTEGRITY OF REGENTS/MAYORS ..................................................................59 9.1 Background ...........................................................................................................................................59 9.2 Understanding by Regents/Mayors of Business Problems and Professionalism of Local Government Officials ................................................................................................................59 9.3 Attitude and Character of Regents/Mayors toward Corruption .................................................61 9.4 Leadership Character of Regents/Mayors .......................................................................................62 9.5 Capacity and Integrity of Regents/Mayors as Obstacles to Business Performance ..................62 9.6 Sources of Information regarding Behavior of Regents/Mayors ..................................................63 9.7 Capacity and Integrity of Regents/Mayors Sub-Index ..................................................................63

viiKPP D
10. LOCAL GOVERNMENT AND BUSINESS INTERACTION ............................................................67 10.1 Background ...........................................................................................................................................67 10.2 Awareness of Communication Forums ............................................................................................67 10.3 Level of Business Problem Solving by Local Governments ...........................................................68 10.4 Level of Local Government Support for Business ...........................................................................69 10.5 Level of Non-Discriminatory Local Government Policies .............................................................71 10.6 Level of Local Government Policies’ Influence on Business Expenditures and Level of Uncertainty for the Business Community ........................................................................................71 10.7 Obstruction Level of Interaction between Local Governments and Businesses ........................72 10.8 Local Government and Business Interaction Sub-Index ................................................................72
11. BUSINESS DEVELOPMENT PROGRAMS (BDP) ..............................................................................77 11.1 Background ...........................................................................................................................................77 11.2 Level of Awareness of Existence of BDP ..........................................................................................77 11.3 BDP Participation Level ......................................................................................................................79 11.4 Level of Benefits of BDP ......................................................................................................................80 11.5 Impact of BDP on Firm Performance ................................................................................................81 11.6 Role of Local Governments in Addressing Problems of Raw Material Supply and Distribution of Products ......................................................................................................................81 11.7 Business Development Programs Sub-Index ...................................................................................83
12. SECURITY AND CONFLICT RESOLUTION ......................................................................................87 12.1 Background ..........................................................................................................................................87 12.2 Level of Theft Incidents at Business Sites .........................................................................................87 12.3 Quality of Police Handling of Crimes ...............................................................................................88 12.4 Quality of Police Handling of Labor Demonstrations ...................................................................88 12.5 Obstruction Level of Security for Business Performance ...............................................................89 12.6 Security and Conflict Resolution Sub-Index ....................................................................................89
13. LOCAL ECONOMIC GOVERNANCE INDEX ....................................................................................93 13.1 Weights of Indicators Forming the Local Economic Governance Index ......................................93 13.2 Local Economic Governance Index ...................................................................................................93
14. CONCLUDING REMARKS AND RECOMMENDATIONS ............................................................99
APPENDIX ........................................................................................................................................................101

viii
Table 5.1 Quality of Local Infrastructure, by Province (Percentages Stating “Poor” and “Very Poor”) ..............................................................................................................................................22
Table 5.2 Time Needed to Repair Damaged Infrastructure, by Province (in Days) .............................24Table 7.1 14 Assessment Criteria for Local-Level Regulations with Assigned Weight ..........................40Table 7.2 Types and Composition of Local-Level Regulations Examined ............................................41Table 7.3 Substance Problems in Regulations on Basic Business Permits (in Percentages) ................43Table 8.1 Levels of Payment of Local Taxes and User Charges, by Scale and Sector of Business (in Rp/Worker/Year) ...................................................................................................................50Table 8.2 Level of Objections to Local User Charges and Local Taxes, for East Java, NTB and NTT, 2007 and 2011 (in Percentages) ..........................................................................................51Table 8.3 Official and Unofficial Commodity Distribution Costs, by Regional Characteristics and Locations (in Rupiah) ............................................................................................................52Table 9.1 Comparison of Business Operators’ Perception of the Leadership and Integrity of
Regents/Mayors, for East Java, NTB and NTT, 2007 and 2011 (in Percentages) .................60Table 10.1 Level of Trust in Local Government Support to Business Operators, by Province (in Percentages) ..............................................................................................................................69Table 10.2 Assessment of Local Governments Support for the Business Community, by Scale of Business (in Percentages) .............................................................................................................70Table 10.3 Positive Impact of Local Government Policies and Interaction Between Local
Governments and Business Operators for Firm Performance, by Scale of Business (in Percentages) ..............................................................................................................................72Table 11.1 Level of Awareness on Existence of BDPs, by Scale of Business (in Percentages) ..............78Table 11.2 Level of Awareness on Existence of BDPs, by Region Characteristics (in Percentages) .....79Table 11.3 Participation Level of BDPs, by Scale of Business (Proportions on BDP Programs’
Awareness, in Percentages)..........................................................................................................80Table 11.4 Level of Benefit of BDPs, by Scale of Business (Proportions on BDP Programs’
Participation, in Percentages) ......................................................................................................80Table 12.1 Quality of Police in Handling Worker Demonstrations, by Scale of Business (in Percentages) ..............................................................................................................................89Table 13.1 Weights of Local Economic Governance Sub-Indices/Dimensions ......................................93
List of Tables

ixKPP D
Graph 2.1 Coverage of LEG Studies: 2007-2011 ............................................................................................5Graph 2.2 Stages in Calculation of Final Index .............................................................................................7Graph 3.1 Level of Education of Respondents (in Percentages) .................................................................9Graph 3.2 Scale of Business, 2007 and 2011 (in Percentages) ....................................................................10Graph 3.3 Sector of Business, 2007 and 2011 (in Percentages) ..................................................................10Graph 3.4 Firms Received Loan from Banks (in Percentages) ..................................................................11Graph 3.5 Firms’ Financial Condition (in Percentages) .............................................................................11Graph 3.6 Firms’ Performance in The Last Three Years (in Percentages) ...............................................12Graph 4.1 Business Premises’ Status (in Percentages) ................................................................................14Graph 4.2 Business Premises’ Ownership (in Percentages) ......................................................................14Graph 4.3 Time Needed to Obtain Land Certificates, by Province (in Weeks) ......................................15Graph 4.4 Level of Difficulty in Arranging Land Use Permits and Level of Difficulty in Obtaining Business Land, by Province (in Percentages) .........................................................15Graph 4.5 Level of Difficulty in Arranging Land Use Permits and Level of Difficulty in Obtaining Business Land, by Region Characteristics (in Percentage) ...................................16Graph 4.6 Levels of Perceived Likelihood of Eviction and Frequency of Occurrence of Eviction, by Province (in Percentages) ........................................................................................................17Graph 4.7 Level of Obstruction of Business Performance Due to Land Access Problems and to Legal Certainty of Land Ownership, by Province (in Percentages) ..................................17Graph 4.8 Land Access Sub-Index .................................................................................................................19Graph 5.1 Quality of Local Infrastructure, by Region Characteristics (Percentages Stating “Good” and “Very Good”) ...........................................................................................................23Graph 5.2 Time Needed to Repair Damaged Infrastructure, by Region Characteristics (in Days) .....25Graph 5.3 Frequency of Water Supply Not Running per Week, by Province ........................................26Graph 5.4 Frequency of Blackouts and Level of Generator Ownership, by Province ...........................26Graph 5.5 Local Infrastructure Sub-Index and Population Density .........................................................27Graph 5.6 Local Infrastructure Sub-Index ....................................................................................................28Graph 6.1 Level of Ownership of Basic Business Permits, by Scale of Business (in Percentages) .......32Graph 6.2 Time Needed to Obtain TDP, by Province (in Days) ...............................................................32Graph 6.3 Perceived Level of Difficulty of Obtaining TDP, by Scale of Business (in Percentages) .....33Graph 6.4 Cost to Arrange TDP and TDP Cost Perceived as Obstacle, by Province (in Thousand Rp and Percentages) ......................................................................................................................34Graph 6.5 Perceived Quality of Licensing Services (in Percentages) .......................................................35Graph 6.6 Knowledge about Complaint Handling Mechanisms, by Province (in Percentages) .........35Graph 6.7 Business Licensing Sub-Index .....................................................................................................37Graph 7.1 Categorization of Local-Level Regulations Studied (in Percentages) ....................................41Graph 7.2 Juridical Problems on Local-Level Regulations Studied (in Percentages) ............................41
List of Graphs

x
Graph 7.3 Juridical Problems on Local-Level Regulations Studied Concerning Basic Business Permits (in Percentages) ...............................................................................................................42
Graph 7.4 Substance Problems on Local-Level Regulations Studied (in Percentages) .........................43Graph 7.5 Principle Problems on Local-Level Regulations Studied (in Percentages) ...........................44Graph 7.6 Local-Level Regulations Sub-Index ............................................................................................46Graph 8.1 Level of Objection to Local Taxes and User Charges, by Province (in Percentages) ...........50Graph 8.2 Payments and Objecting to Payments of Donations to Local Governments, by Province (in Percentages) ........................................................................................................53Graph 8.3 Paying and Objecting to Additional Security Costs (in Percentages) ....................................53Graph 8.4 Obstruction Level of Transaction Costs, by Province (in Percentages) ....................................54Graph 8.5 Transaction Costs Sub-Index .......................................................................................................56Graph 9.1 Understanding by Regents/Mayors of Business Problems and Regent/Mayors Selected Local Government Officials Professionally, by Province (in Percentages) ...........60Graph 9.2 Regents/Mayors do NOT Engage in Activities for Personal Gain and Regents/Mayors
Act Firmly Against Corruption by Staffs, by province (in Percentages) ...............................61Graph 9.3 Leadership Character of Regents/Mayors, by Province (in Percentages) ............................62Graph 9.4 Sources of Information In Regards to Behavior of Regents/Mayors (in Percentages) .......63Graph 9.5 Capacity and Integrity of Regents/Mayors Sub-Index............................................................64Graph 10.1 Level of Awareness of Communication Forum, by Province (in Percentages) ....................68Graph 10.2 Level of Awareness of Communication Forum, by Scale of Business and Region
Characteristics (in Percentages) ...................................................................................................68Graph 10.3 Assessment of Local Government Commitment to Promoting Investment, by Province (in Percentages) ........................................................................................................70Graph 10.4 Assessment of Non-Discriminatory Local Government Policies, by Province (in Percentages) ..............................................................................................................................71Graph 10.5 Local Government and Business Interaction Sub-Index..........................................................74Graph 11.1 Level of Awareness on Management and Manpower Training Programs, by Province (in Percentages) ........................................................................................................78Graph 11.2 Main Obstacle in Obtaining Raw Materials (in Percentages) .................................................81Graph 11.3 Local Governments’ Actions to Overcome The Constraints of Raw Materials’ Access (in Percentages) .................................................................................................................82Graph 11.4 Constraint in Distribution/Marketing of Products (in Percentages) .....................................82
xiKPP D
Graph 11.5 Local Governments Actions to Overcome Impediments to The Distribution of Products (in Percentages) .............................................................................................................83Graph 11.6 Business Development Programs Sub-Index ............................................................................85Graph 12.1 Level of Theft Incidents at Business Sites (in Percentages) .....................................................88Graph 12.2 Quality of Police in Crimes Handling, by Scale of Business (in Percentages) ......................88Graph 12.3 Obstruction Level of Security and Conflict Resolution for Business Performance (in Percentages) ..............................................................................................................................89Graph 12.4 Security and Conflict Resolution Sub-Index ..............................................................................91Graph 13.1 Kota Blitar’s Spider Diagram .......................................................................................................94Graph 13.2 LEG Index and Regional Characteristics ...................................................................................94Graph 13.3 LEG Index and Population Density ............................................................................................94Graph 13.4 LEG Index and GRDP Per Capita ...............................................................................................95Graph 13.5 LEG Index and Proliferation of Regions ....................................................................................95Graph 13.6 Local Economic Governance Index .............................................................................................96

xii
Box 4.1 Variables Forming the Land Access Sub-Index .............................................................................18Box 5.1 Variables Forming the Local Infrastructure Sub-Index ................................................................27Box 6.1 Variables Forming Business Licensing Sub-Index ........................................................................36Box 8.1 Variables Forming Transaction Costs Sub-Index ..........................................................................54Box 9.1 Variables Forming Capacity and Integrity of Regents/Mayors Sub-Index ..............................63Box 10.1 Variables Forming Local Government and Business Interaction Sub-Index ............................72Box 11.1 Variables Forming the Business Development Programs (BDP) Sub-Index .............................83Box 12.1 Variables Forming Security and Conflict Resolution Sub-Index ................................................89
List of Boxes

xiiiKPP D
APBD : Anggaran Pendapatan dan Belanja Daerah (Local Government Budget)APBN : Anggaran Pendapatan dan Belanja Negara (National Budget) Babel : Bangka BelitungBDP : Business Development ProgramsBPD : Badan Pertanahan Daerah (Regional Land Agency) BPN : Badan Pertanahan Nasional (National Land Agency)BPS : Badan Pusat Statistik (Central Bureau of Statistics)BUMD : Badan Usaha Milik Daerah (Local Government-Owned Enterprise Corporation)BUMN : Badan Usaha Milik Negara (State-Owned Enterprise, SOE)CU : Credit UnionCSR : Corporate Social ResponsibillityFGD : Focus Group DiscussionGDP : Gross Domestic ProductGRDP : Gross Regional Domestic ProductHGB : Hak Guna-Bangunan (Leasehold rights)HGU : Hak Guna-Usaha (Leasehold land right for business)HM : Hak Milik (Proprietary rights)HO : Hinder Ordonantie (Nuisance Permit)IMB : Izin Mendirikan Bangunan (Building Permit)IPM : Indeks Pembangunan Manusia (Human Development Index, HDI)JPIP : Jawa Pos Institute of Pro-OtonomiKabupaten : Regency KKN : Korupsi, Kolusi dan Nepotisme (Corruption, Collusion and Nepotism)Kota : MunicipalityKPK : Komisi Pemberantasan Korupsi (Corruption Eradication Commission)KPPOD : Komite Pemantauan Pelaksanaan Otonomi Daerah (Regional Autonomy Watch)LEG : Local Economic GovernanceLPEM-FEUI : Lembaga Penyelidikan Ekonomi dan Masyarakat - Fakultas Ekonomi Universitas
Indonesia (Institute for Economics and Social Research-Faculty of Economics University of Indonesia)
MOF : Ministry of FinanceMOHA : Ministry of Home AffairsNTB : Nusa Tenggara Barat (West Nusa Tenggara) NTT : Nusa Tenggara Timur (East Nusa Tenggara)Ormas : Organisasi Masyarakat (Mass organization)OSS : One Stop Shop for Business LicensingPAD : Pendapatan Asli Daerah (Locally-Generated Revenue)
List of Terms and Abbreviations

xiv
PDAM : Perusahaan Daerah Air Minum (Municipal Waterworks)Pemda : Pemerintah Daerah (Local Government)Perbup : Peraturan Bupati (Regent Regulation)Perda : Peraturan Daerah (Local Regulation) Permendag : Peraturan Menteri Perdagangan (Minister of Trade Regulation)Permendagri : Peraturan Menteri Dalam Negeri (Minister of Home Affairs Regulation)Permenpan : Peraturan Menteri Negara Pendayagunaan Aparatur Negara (Regulation from Minister
for Supervision of the State Apparatus)Perwali : Peraturan Walikota (Mayoral Regulation)PJ-PPUS : Penyedia Jasa Program Pengembangan Usaha Swasta (Private Business Development
Program Service Provider) PLN : Perusahaan Listrik Negara (State Power Company)PO : Perusahaan Perorangan (Sole Proprietorship)PP : Peraturan Pemerintah (Government Regulation) PT : Perusahaan Terbatas (Limited Liability Company)PT Tbk : Perusahaan Terbuka (Publicly Listed Corporation)PTSA : Pelayanan Terpadu Satu Atap (“One Roof” One Stop Shop for business licensing)PTSP : Pelayanan Terpadu Satu Pintu (“One Door” One Stop Shop for business licensing)SD : Sekolah Dasar (Elementary School)Seknas FITRA : Sekretariat Nasional Forum Indonesia untuk Transparansi Anggaran (National
Secretariat-Indonesian Forum for Budget Transparency)SITU Surat Izin Tempat Usaha (Business Location Permit)SIUP : Surat Izin Usaha Perdagangan (Trading Business License)SLTP : Sekolah Lanjutan Tingkat Pertama (Junior High School)SP3 : Sumbangan Pihak Ketiga (Third-Party Contribution)Sumbar : Sumatera Barat (West Sumatera)TDI : Tanda Daftar Industri (Certificate of Industrial Registration)TDP : Tanda Daftar Perusahaan (Certificate of Company Registration) THR : Tunjangan Hari Raya (Religious Holiday Allowance)Tramtib : Ketentraman dan Ketertiban Masyarakat (Public Order and Tranquility) UD : Usaha Dagang (Trading Business)SME : Usaha Kecil dan Menengah (Small and Medium-Scale Businesses)UMK : Usaha Mikro dan Kecil (Micro and Small-Scale Businesses)UU : Undang-undang (Law, Act)

xvKPP D
This 2011 study of Local Economic Governance (LEG) is aimed at giving a portrayal of the quality of local economic governance in 245 regencies/municipalities in 19 provinces in Indonesia.1 It is hoped that this study will serve as a basis for local governments at the local level to prioritize reforms and improvements in their performance in various aspects of local economic governance. It is also expected that this study will create an atmosphere of healthy competition among regencies/municipalities. For the provincial governments, the results of this study can be used as an instrument to monitor the performance of local governments and to set priorities – in terms of aspects of LEG and of location – in facilitation and support for regencies/municipalities in improving their performance. For business operators, the results of the LEG study are expected to provide information on the quality of economic governance in the respective regencies/municipalities that will help them make decisions on investment and business development.
This study uses the same methodology as the 2007 LEG study of 15 provinces and the 2008 and 2010 study in Aceh. In the period 2001-2005, Komite Pemantauan Pelaksanaan Otonomi Daerah (KPPOD or Regional Autonomy Watch) and The Asia Foundation conducted annual studies on “Local Investment Attractiveness”, with the number of regencies/municipalities examined rising steadily from 90 regions (2001) to 228 (2005). The study methodology then underwent significant changes; the indicators used focused on various aspects of local economic governance, rather than on investment attractiveness. As it uses the same methodology, design and survey instruments as the three previous studies, the results of this 2011 LEG study can be compared with those of the 2007 LEG study and the 2008 and 2010 Aceh LEG studies. Thus, with the completion of this 2011 LEG study, the views of business operators in nearly all regencies/municipalities in Indonesia are now available,2 though in different time frames. Furthermore, changes in the perceptions of business operators in regencies/municipalities in four provinces – Aceh, East Java, West Nusa Tenggara and East Nusa Tenggara – can be measured, because these regions have had two LEG studies in two different years.
The criteria used in the 2011 LEG study included nine indicators, most of which are within the authority of the regency/municipality governments. The variables used are grouped into the following nine aspects: (i) Land access; (ii) Local infrastructure; (iii) Business licensing; (iv) Local-
1 The nineteen provinces included in this 2011 LEG study are Papua, West Papua, Maluku, North Maluku, Southeast Sulawesi, Central Sulawesi, West Sulawesi, South Kalimantan, Central Kalimantan, West Kalimantan, East Nusa Tenggara (NTT), West Nusa Tenggara (NTB), East Java, Banten, Lampung, Bengkulu, Bangka Belitung, Jambi, and West Sumatera.
2 According to data from the Ministry of Home Affairs (May 2010), there are 267 regencies/municipalities in the 19 provinces targeted in this 2011 LEG study. However, 22 regencies/municipalities in West Sumatera, East Nusa Tenggara, West Papua and Papua were not surveyed or analyzed because they had recently experienced natural disasters, were deemed unsafe, or had a low response rate.
Executive Summary

xvi
level regulations; (v) Transaction costs; (vi) Capacity and integrity of regents/mayors; (vii) Local government and business interaction; (viii) Business development programs (BDPs); and (ix) Security and conflict resolution. These nine aspects are chosen because they accurately reflect LEG, are not endowment factors, and, insofar as possible, are within the authority of the regency/municipality governments. Furthermore, the indicators that are measured are operational and practical, rather than indicators of outcomes or impacts, and therefore can be addressed in a relatively short time.
Data gathered through direct interviews and analyses of local level regulations were then used to calculate the sub-indices for each aspect of LEG, and then the final index. Apart from the aspect of quality of local-level regulations, which was examined through analysis of secondary data, a firm survey (direct interviews with 40 to 50 business operators in each regency/municipality) was performed to obtain data on the other eight aspects. The sub-index indicating the performance of one regency/municipality in one aspect of LEG is compared with the other localities by calculating the average of the variables included in one sub-index after normalization. The final index was calculated using weighting to reflect the importance of one sub-index compared to the others based on firms’ perceptions. To complement the survey results, qualitative studies were conducted by the Jawa Pos Institute of Pro-Otonomi (JPIP), as well as focus group discussions (FGDs) by KPPOD in a number of regions.
Based on business operators’ perceptions, infrastructure is the most important aspect of LEG, so it has been given the greatest weight in calculating the final LEG index. The weights for the respective sub-indices are based on the percentages of perceptions of business operators who feel that the particular sub-index (dimension or aspect of LEG) is a major constraint for business activities. Infrastructure received the greatest weight, 38%, followed by business development programs (BDPs) with a weight of 14%, local government and business interaction (13%), land access (9%), business licensing (8%), and transaction costs (7%). In contrast, capacity and integrity of regents/mayors, local level regulations and security and resolution of business conflicts each received weights of less than 5%.
The survey was conducted in August 2010 to January 2011 with respondents from 12,391 firms. The 2006 Economic Survey (Central Bureau of Statistics, BPS) was used as a sampling frame to select the respondents. Most of the respondents are the owners of their businesses (68%), manager-level employees (25%) and directors (8%). In terms of scale of business of the companies surveyed, small businesses (with 5 to 19 workers) dominated, at 58%, followed by 36% medium-sized businesses, 4% large companies and 2% micro scale enterprises (with fewer than five workers).
Land access – a basic prerequisite for doing business – is still seen as a major problem, especially in urban areas. Most firms own the land on which they do business. Nevertheless, on average one out of three business operators expressed difficulties in accessing land, and roughly one out of four had difficulties in arranging land use permits. Business operators in municipality areas found it relatively more difficult to obtain business land than those in regencies. In terms of the length of time needed to arrange a land certificate, there were significant differences between regions. More time was needed in Western Indonesia (Java and Sumatera, with the highest provincial average of 16 weeks in Bangka-Belitung) than in Eastern Indonesia (Kalimantan, Sulawesi, Nusa Tenggara, Maluku and Papua), with the shortest times, only four weeks, in Central Sulawesi and South Kalimantan. Most business operators considered the risks of eviction and conflict of land to be low. For the land access sub-index, Kolaka Utara in North Sulawesi was the best, while Tebo in Jambi had the lowest performance. Five of the eight regencies/municipalities in the province of Banten were among the 20 regions ranked lowest for this sub-index.

xviiKPP D
Infrastructure, deemed to be the main constraint to business performance, is still considered poor by a lot of business operators. Of the five types of infrastructure examined, telephone and electricity – neither of which is under the authority of the local governments – were considered relatively good by business operators, with 22% and 34% of respectively regarding these as poor. On the contrary, quality of roads, water supply and streetlights are considered in bad quality by over 40% business operators. Business operators in Jambi, West Kalimantan, Central Kalimantan and Papua have to wait 100 days or even longer for damaged roads to be repaired, while in West Sumatera such repairs take less than 20 days. On average, blackouts occur around three times per week, and in Maluku, NTB, West Kalimantan and West Sulawesi they range between five and seven times per week. Regencies/municipalities in East Java dominate the 20 highest ranked regions for the local infrastructure sub-index, with Kota Blitar in first place. In contrast, all of the 20 lowest ranked localities for this sub-index are regencies (no municipality) in Eastern Indonesia, with Waropen (Papua) in last place.
Many business operators still do not have licenses, though most business operators feel that business licensing services are good. Overall, more than 70% of firm feel that business licensing services in their areas are free from collusion, free from illegal levies, and efficient. However, this positive perception of these services is not reflected in the level of permit ownership. Certificates of Company Registration (Tanda Daftar Perusahaan, TDP) – which are mandatory for all business – are held by only around half of the business operators who were interviewed. Similarly, Trading Business Licenses (Surat Izin Usaha Perdagangan, SIUP) – required by most banks to arrange loans – are held by only 58% of business operators. The average time required to arrange a TDP is 11 days, whereas the standard set by the Ministry of Trade is only three days. The costs borne by business operators to obtain TDP are also relatively high, at nearly Rp 500 thousand. Yet the fee set by the central government is only Rp 100 thousand for a sole proprietorship (PO) – the category of most respondents in this study. Lampung Utara (Lampung) is ranked the highest for this sub-index, while Gunung Mas (Central Kalimantan) is the lowest. Among the “top 20” in the business licensing sub-index are nine regencies/municipalities located in East Java and four in South Kalimantan. On the other hand, the “bottom 20” for this sub-index are dominated by regencies (with not one municipality) outside Java (only one regency in East Java).
There are still many problematic local-level regulations. A study was conducted of 1,480 local-level regulations – including local regulation (perda) and regent/mayor regulations/decrees – that affect the business community, examining three aspects: juridical, substance and principle. Juridical problems were considered the worst. No fewer than 1,192 regulations (81%) were identified as having at least one problem from the juridical perspective. Around 72% of all the regulations examined have outdated juridical references; the local-level regulations failed to refer to the most recent versions of the higher-level regulations. Moreover, 35% of all regulations examined were also legally incomplete. In terms of substance, 21% of regulations were found to lack clarity on time, cost and procedural standards (or fee structure and standards). Many regulations relating to business licensing have problems in these aspects. With regard to principles, 17% of regulations were identified as creating negative economic impacts. Most of the problematic regulations are ones that regulate commodity trading. Kubu Raya (West Kalimantan) was the best regency for the local-level regulations sub-index, while Kotabaru (South Kalimantan) had the lowest score.
One impact of these problematic regulations is transaction costs, which increase the costs borne by companies and thus reduce their competitiveness. Official transaction costs (those based on local-level regulations) include taxes, user charges and donations (third-party contributions or SP3). Due to the economies of scale the amounts of taxes and user charges per worker paid by business operators are inversely correlated with the scale of business. Micro-scale businesses pay user charges of around

xviii
Rp 48 thousand/worker and taxes of Rp 65 thousand/worker, while large businesses pay only Rp 14 thousand and Rp 26 thousand per worker for user charges and taxes, respectively. Even so, fewer than 10% of business operators felt these local taxes and user charges were burdensome. Meanwhile, for inter-region movement of goods, roughly one out of two business operators pay official levies, and around one out of four pay unofficial levies. Two newly established regencies, Kolaka Utara (Southeast Sulawesi) and Sumba Barat Daya (NTT), share the highest ranking for the transaction costs sub-index. At the other end of the scale, six of the eight regencies/municipalities in the province of Banten are among the 20 ranked lowest, with Serang in last place.
Generally, business operators’ level of trust in the capacity and integrity of their regents/mayors is fairly high. Around two out of three firms feel that their regents/mayors have a good understanding of the problems of the business community and that the regents/mayors appoint staff with appropriate expertise. A similar proportion was found for business operators’ perceptions that their regents/mayors have strong integrity and take firm action against their staff who engages in corruption. However, this resolute action against staffs does not correlate with the perceived integrity of the regents/mayors themselves. Overall, around three out of four business operators felt that their regents/mayors were strong, respected figures and good role models. Three regencies in Southeast Sulawesi – Buton, Buton Utara and Wakatobi – were in the highest ranking for this sub-index. In contrast, four regencies each in Papua and NTT were among the 20 regions ranked lowest, with Merangin (Jambi) receiving the lowest sub-index score.
Firms’ perception of interaction between local governments and the business community is not too bad. Although only around one out of four business operators are aware of the existence of a communication forum, which is a vehicle for local governments to discuss and seek solutions for the problems of the business community, generally a majority of business operators have positive views of their local governments’ support for the private sector. However, the trust level tends to be lower for smaller-scale businesses. Around 59% of large business operators stated that their local governments provide facilities to support business development, while only around 47% of micro business operators made this statement. With regard to investment promotion, more than half of business operators feel that their local governments have promoted investment and created equal opportunities (non-discriminatory). Kota Probolinggo (East Java) was the best for this sub-index, while Seram Bagian Barat (Maluku) received the lowest score.
Business Development Programs (BDPs) remain relatively unknown, though business operators feel they significantly influence firm performance. Business operators’ level of knowledge of the various BDP activities – business management training, manpower training, promotion of local products, connecting small, medium and large businesses, training in applying for loans and matchmaking of business partners – remains very low. The BDP activity best known by business operators is manpower training, though only 24% of firms are aware of it, and this activity is more familiar to large businesses than to micro and small business operators, who are actually the main target of this program. It is interesting to examine further the efforts made by the regency/municipality governments in West Sumatera, six of which are among the 20 regions ranked highest for this sub-index. According to the results of the FGD held there, most of these local governments facilitate the corporate social responsibility (CSR) activities of private companies to help business operators, rather than financing BDP activities from their own budgets. Lumajang (East Java) has the highest score for the BDP sub-index, while Lampung Timur (Lampung) has the lowest.

xixKPP D
Although the incidence of thefts in business sites are relatively high, firms’ perceptions on the police performance in dealing with crime rases and demonstrations are quite positive. Only 3% of business operators stated that these aspects create problems. However, one out of five business operators were aware of thefts affecting businesses. Regarding the quality of police handling of crimes, around three out of four business operators felt that the police act promptly and minimize losses to companies. Kolaka Utara (Southeast Sulawesi) is the regency with the highest score for this sub-index, while Lampung Timur (Lampung) received the lowest.
Kota Blitar received the highest ranking for the overall Local Economic Governance Index, with ten other regencies/municipalities in East Java among the “top 20”. Kota Blitar also received the highest score in the 2007 LEG study. Of the nine aspects forming the final LEG Index, Kota Blitar was considered particularly good in the sub-indices of infrastructure (ranked first), local government and business interaction (sixth), capacity and integrity of regents/mayors (12th), and business licensing (14th). Furthermore, ten other regions in the province of East Java were among the top 20 in the overall LEG index: Kota Probolinggo, Kota Batu, Magetan, Probolinggo, Lamongan, Tulungagung, Blitar, Kota Kediri, Ngawi and Nganjuk.
In contrast, the 20 regions with the lowest overall LEG indices were regencies (no municipality) outside Java, mainly in Eastern Indonesia. Kabupaten Waropen was judged by its business operators as having the lowest quality of LEG among the 245 regencies/municipalities studied. Further, four other regencies in Papua – Mappi, Sarmi, Asmat and Keerom – were also among the 20 lowest-ranked regions. Apart from the province of Papua, Maluku also had quite a few regencies in this list. Two adjoining regencies, Seram Bagian Barat and Seram Bagian Timur, were ranked second and third from the bottom. Maluku Barat Daya and Maluku Tenggara Barat were also among the bottom ten.
The imbalance in LEG between relatively developed regions and disadvantaged regions requires special attention. Overall, the LEG indices are relatively higher in Western Indonesia (except Banten and Jambi) than in Eastern Indonesia (except Central Sulawesi and South Kalimantan); higher in municipalities than in regencies; and higher in regions with high gross regional domestic product (GRDP) per capita than in those with low GRDP. This situation is clearly cause for concern; we hope that the quality of governance in relatively disadvantaged regions can improve, so as to create opportunities to increase private investment, which will in turn stimulate local economic development and thereby reduce poverty. What we see, however, is the opposite: governance in disadvantaged regions is poorer, so it is likely that the disparity between developed and disadvantaged regions will in fact increase.
LEG in newly created autonomous regions also tends to be fairly low; as well as the gap between “rich” and “poor” regions, “older” regions tend to have slightly higher LEG indices when being compared to “younger” regions. The average LEG index of the 98 regions that experienced no administrative partitioning at all was 65.9 – slightly higher than the average of 63.3 for the 56 parent regions from which new regions had been created. Furthermore, the average LEG index for autonomous regions newly created after decentralization was only 59.5. This indicates that the creation of new administrative regions has not yet contributed to improving the quality of local economic governance.

xx

1KPP D
1.1 Background
The decentralization process is occurring in a time of increasingly tight global competition. Private investment is a critical driver of the economy. Steadily increasing private investment is essential for job creation and sustainable reduction of poverty. A conducive business climate is a crucial prerequisite for attracting and maintaining investment in a given region.
The Indonesian investment climate has shown improvement, though further improvement is needed. According to Doing Business 2011 (World Bank, 2010), among the 183 countries surveyed, Indonesia was ranked number 121, down from 115 the previous year. In the Global Competitiveness Report 2010-2011 (World Economic Forum, 2010), Indonesia is ranked number 44 (of 139 countries), up from number 54 the year before. However, compared with other countries in Southeast Asia, Indonesia is still far behind Thailand and Malaysia, and roughly on a par with Vietnam (which has a higher score in Doing Business but lower in the Global Competitiveness Report).
The decentralization process that has taken place in the past ten years creates new challenges for Indonesia. Decentralization provides wide-ranging authority to sub-national governments, especially regencies/municipalities, including with respect to the investment climate. This authority can be used to simplify licensing procedures, revoke regulations and levies that burden or disrupt the business community, encourage small business development and provide adequate infrastructure. These aspects
1. Introduction
of economic governance need to be continually upgraded to improve Indonesia’s investment climate.
KPPOD, together with The Asia Foundation, is working continuously to promote improved local economic governance in order to improve the investment climate in Indonesia. One part of this effort is a series of studies relating to the investment climate of regions in Indonesia. This was first done in 2001 with annual studies on Investment conpetitiveness of Regions, which were refined starting in 2007 as studies of Local Economic Governance (LEG). In 2007, the LEG study was conducted in 243 regencies/municipalities in Indonesia. The same methodology was also used for LEG studies of 23 regencies/municipalities in Aceh in 2008 and 2010 (also including two regencies in the island of Nias, North Sumatra).
This 2011 LEG study uses the same methodology that was employed in 2007 to 2010 and was conducted in 245 regencies/municipalities in 19 provinces of Indonesia. This study, conducted in 2010-2011, included 16 provinces that were not covered in the previous studies, as well as three provinces that were covered in the 2007 LEG study: East Java, West Nusa Tenggara (NTB) and East Nusa Tenggara (NTT). With the completion of this study, nearly all regencies/municipalities in 32 provinces in Indonesia (all provinces except Jakarta, which is administratively at province level) have been covered, and a complete picture of local economic governance conditions in Indonesia has been obtained.

2011 Local Economic Governance Report
2
1.2 Research Objectives
This study of local economic governance (LEG) is aimed at providing a portrayal of the quality of local governance, which strongly affects the business climate in regencies/municipalities. This portrayal of LEG in the respective regencies/municipalities is based on nine sub-indices (groups of indicators) that are believed to be under the direct control of the regency/municipality governments and not based on endowment factors, which can be improved and generate quick observable results.
We hope that local governments will use this LEG study as a basis for implementing governance reform. Based on this study, local governments can identify and prioritize factors considered important by business operators and formulate policies and reform efforts for business climate improvement in their respective districts. These efforts toward improvement should be undertaken jointly with other stakeholders in the regions through constructive dialogue between business operators and governments to overcome the obstacles to doing business in the regions.
It is hoped that governments at all levels will facilitate a cross learning process, based on good practices already implemented throughout Indonesia. The results of this study should also promote healthy competition among regions in creating a conducive business climate, which will, in turn, ultimately enhance national economic competitiveness. It is hoped that provincial governments and the central government will facilitate joint learning processes so that each
regency/municipality can learn from others that are more advanced. Both the central and the provincial governments can use the results of this study as part of their monitoring and evaluation of the performance of local governments. Furthermore, the study results can also be used to provide incentives and disincentives – both fiscal and non-fiscal – to local governments. Priorities in facilitation and support for regency/municipality governments in improving their performance – in terms of aspects of LEG and of location – can also be planned based on the results of this study.
This study will also be useful for business operators. The results of this LEG study are expected to provide information on the quality of economic governance in the respective regencies/municipalities that will help business operators make decisions on investment and business development.
1.3 Results of the Study
There are three major results of this study. It is expected that these three study results will be useful to all parties concerned in the efforts to create a conducive investment climate in the regions:(1) A ranking of the regencies/municipalities
surveyed based on local economic governance to support a positive business climate.
(2) An overview of the problems faced by the business community in conducting their business activities in the regions, as related to local government policies.
(3) Policy recommendations for improvement of the business climate in the regions.

3KPP D
2.1 Conceptual Framework
The methodology used in this study is the same as that used in the 2007 study of local economic governance (LEG) in 15 provinces and the 2008 Aceh LEG study and the 2010 Aceh-Nias LEG study. The indicators that are used focus on various aspects of local economic governance, rather than on investment attractiveness. Since they all use the same methodology, the results of this 2011 LEG study can be compared with those of both the 2007 LEG study and the 2008 and 2010 Aceh LEG studies.
The LEG study focuses on the perspectives of the business community regarding various aspects of policies, institutions and services at the regency/municipality level. “Local economic governance” refers to the policies of local governments that regulate the activities of the business community in the regions in accordance with their authority. This study examines the policies, institutions and services of local governments in line with the needs of the business community as positive conditions for creation of a healthy business climate in their regions.
The LEG study is not focused on outcomes indicators. This survey is aimed at identifying how the local governments provide services for business activity. This study is therefore different from other surveys that focus mainly on outcomes not under the direct control of local governments, such as employment rate, Human Development Index, and economic growth rate.
2. Methodology
The indicators selected are, insofar as possible, ones that are under local government control, rather than endowment factors. Endowment factors, do certainly affect the investment climate, but they cannot be changed by local governments, or at least take a very long time to change. Therefore, such factors are not selected as indicators in this study.
However, several very important indicators under central government control are still used in this study because they strongly influence the business climate. For instance, several business security indicators remain under control of the police, as a central government agency in the districts. The same applies for land access indicators, which remain under National Land Agency (BPN) authority and are not decentralized; this includes forest and mining concessions. Nevertheless, local governments can, to some extent, influence their performance through more intensive coordination with these central government agencies.
It is hoped that the indicators selected can be immediately adopted, improved and produce tangible results. This LEG study was undertaken to provide information for local governments to prioritize reform of economic governance in their districts. Thus, one of the criteria used in selecting the indicators is that reform ought to be mostly of an operational nature and generate noticeable results in a relatively short time. Besides making it easier for local governments to carry out the required improvements, this should also facilitate non-government stakeholders, such as the business community and civil society, in advocating for policies.

2011 Local Economic Governance Report
4
2.2 Indicators of Local Economic Governance
Based on the various considerations outlined above and on theories of how local economic governance influences economic performance, particularly for private businesses, nine indicators have been selected for measuring LEG, as follows:
1) Land Access strongly affects businesses, as companies will not make new investments if they do not have access to land. At the same time, existing business activities are affected if there is no certainty about the status of their land.
2) Local Infrastructure – good quality district roads, power supply, street lighting, water supply and telecommunication – is a prerequisite for business activities to operate effectively and efficiently. Conversely, poor infrastructure quality increases the cost for businesses to invest and develop.
3) Simple and inexpensive Business Licensing will encourage development of new businesses. In contrast, a difficult, long and expensive business licensing procedure discourages businesspersons from arranging licenses and impedes the growth of new business activities.
(4) Quality of Local-Level Regulations is an indicator of local governments’ policy framework for developing the economy of their districts. Complicated and confusing local level regulations are an obstacle to business in districts, as they lead to uncertainties and restrict trade and market access.
(5) High Transaction Costs in the form of taxes, user charges and other transaction costs, both legal and illegal, may become obstacles to business in districts if they are imposed solely to increase local revenue without taking into
account their impact on business development. On the other hand, transaction costs will not become obstacles when they are enforced based on explicit reasons, properly implemented, and the proceeds are directed toward improving public services.
(6) Capacity and Integrity of Regents/Mayors is critical to guarantee effective implementation of government policies. Trusted and capable regional heads enhance investor confidence and will probably implement investment-friendly policies.
(7) Local Government and Business Interaction is extremely important for guaranteeing that policies and public investments undertaken by local governments are in line with the needs of business operators. In contrast, ineffective interaction between local governments and businesses may lead to policy implementation that impedes business growth.
(8) Business Development Programs (BDPs) carried out by local governments can be an effective method to enhance management capacity and skill of workers, and to connect business operators with markets outside their districts.
(9) Security and Conflict Resolution are critical aspects in the investment climate. It is difficult for business operators to stay in business if they often face security disturbances. Likewise, a good mechanism for resolution of conflicts or business disputes enhances investors’ confidence in starting and doing business.
2.3 Research Locations
The study was conducted in 260 regencies/municipalities located in 19 provinces. Three of the 19 provinces were also surveyed in LEG 2007,3 i.e. East Java, West Nusa Tenggara (NTB) and East
_______________________________________________________________3 The LEG study covered all 243 regencies/municipalities in 15 provinces of Indonesia: North Sumatra, Riau, Riau Islands, South
Sumatra, West Java, Central Java, Yogyakarta, East Java, Bali, NTB, NTT, East Kalimantan, South Sulawesi, North Sulawesi, and Gorontalo. The 2008 Aceh LEG study covered all 23 regencies/municipalities in Aceh. The 2010 Aceh-Nias LEG study covered all 23 regencies/municipalities in Aceh and two regencies on the island of Nias.

Survey of Businesses in 245 Regencies/Municipalities in Indonesia
5KPP D
Nusa Tenggara (NTT), while the other 16 had not previously been surveyed. Based on data from the Directorate General of Public Administration in the Ministry of Home Affairs (May 2010), there are 267 regencies/municipalities in these 19 provinces. However, the survey was not carried out in seven regencies in West Sumatra (Sumbar) and Papua,4 so only 260 regencies/municipalities were covered.
Analysis was performed for 245 regencies/municipalities. Of the 260 regions surveyed, 155
could not be analyzed for various reasons. In several regencies, the response rates for certain variables were very low, making it impossible to compare them equivalently with other regions. Further, in certain regencies over 80% of the firms who were interviewed were micro business operators with fewer than four workers, who were considered to have very little interaction with their local governments and to lack adequate understanding about local economic governance. For these two reasons, 15 regencies were excluded from the analysis in this study.
Various regional characteristics are represented by the 245 localities analyzed. Of the 245 regions analyzed, 202 (82%) are regencies and 43 (18%) are municipalities. Overall, 106 of these regions (43%) are located in Western Indonesia (Java and Sumatra) and 139 (57%) in Eastern Indonesia (Kalimantan, Sulawesi, Nusa Tenggara, Maluku and Papua). In terms of regional typology, they are divided into 190 mainland regions (78%) and 55 (22%) with island characteristics. Among the regions analyzed are 98 newly-created
administrative districts (40%), 56 (23%) that were the parent districts of newly-established districts, and 91 (37%) that have not undergone such partitioning. This variety allows an analysis of the impact of these of characteristics on local economic governance, and also of the correlation between economic indicators and population.
2.4 Research Instruments
This 2011 LEG Study uses two data sources: a firm survey and secondary data. The firm survey of selected businesspersons in each regency/
W Sumatra
Banten
Jambi Babel
Lampung
E Java NTB
NTT
Bengkulu
W Kalimantan
C KalimantanW Sulawesi
S Kalimantan
SE Sulawesi
C Sulawesi
N Maluku
Maluku
W Papua
Papua
Graph 2.1 Coverage of LEG Studies: 2007-2011
_______________________________________________________________4 The Mentawai Islands (West Sumatra) were not surveyed due to a recent natural disaster, while Puncak Jaya, Tolikara, Mamberamo
Raya, Yalimo, Nduga, and Puncak (all in Papua) were excluded from the survey for security reasons.5 The regencies that could not be analyzed were Sabu Raijua and Sumba Tengah (NTT), Buru Selatan (Maluku), Raja Ampat,
Tambrauw, and Maybrat (West Papua), and Paniai, Yahukimo, Pengunungan Bintang, Supiori, Mamberamo Tengah, Lanny Jaya, Dogiyai, Deiyai and Intan Jaya (Papua).

2011 Local Economic Governance Report
6
municipality was carried out through direct interviews (face-to-face) over the period of September 2010-January 2011 to obtain data – perception and quantitative – to measure performance in eight LEG indicators. To measure the indicators for the local-level regulations sub-index, local-level regulations affecting business in each regency/municipality were analyzed. Secondary socio-economic data were collected to complement the firm survey results and local-level regulation assessments.
A questionnaire was used for the firm survey. The questionnaire used in the 2011 LEG study was the same one used in the 2007 LEG study and the 2008 and 2010 Aceh LEG studies, with some minor modifications and simplifications to make things easier for interviewers and respondents. The questionnaire includes questions to obtain both data on businesspersons’ perceptions and quantitative (numerical) data on eight LEG indicators. For instance, respondents were asked about how often they experience blackouts while at work and whether they have generator sets; also asked was their perception about the quality of existing electricity supply.
To complement the firm survey and the analysis of local-level regulations, qualitative studies and focus group discussions (FGD) were conducted in several regions. The qualitative studies were conducted by the Jawa Pos Institute of Pro-Otonomi (JPIP) in February-April 2011 in 15 regencies/municipalities in the provinces of East Java, NTB and NTT.6 These qualitative studies were conducted by interviewing key informants from local governments, business associations and business operators. In addition, secondary data, such as local legal products and programs conducted in the regions, were collected and analyzed. As well as the qualitative studies conducted by JPIP, KPPOD also held FGDs with relevant stakeholders in March 2011 in East Java,
West Kalimantan, West Papua, NTT and West Sumatra to discuss the preliminary findings of the firm surveys.
Qualitative analysis scorecards were used to assess local-level regulations. Various regulations issued by local governments – including Local Regulations (perda),7 Regulations and Decrees of Regents/Mayors and Circular Letters from Regents/Mayors – relating to the business community were collected and assessed. Scorecards based on the indicators and variables were used to evaluate problems with each policy. An assessment weighting is provided on each aspect of each regulation, based on possible impact on economic activities. A more detailed explanation on this is included in the discussion on the Local-Level Regulations sub-index (Chapter 7).
2.5 Weighting of Indicators Forming the Local Economic Governance Index
The weights for each sub-index are based on percentages of business operators’ perceptions of the extent to which a given sub-index (LEG dimension) is a major obstacle to doing business. Although all nine sub-indices and their supporting variables are important aspects of local economic governance, business operators felt that certain sub-indices were more important than others. Based on these weights and priorities, it is hoped that governments can have a more accurate reference for determining the priorities of policies to be undertaken in improving the performance of economic governance in their regions. The weights for each sub-index are explained in Chapter 13 (Local Economic Governance Index).
The calculation of the overall 2011 LEG index uses different weights from those in the 2007 LEG study. The main reason for using different weights from those in the previous studies was to observe the changes in the issues faced by the business
_______________________________________________________________6 Qualitative studies were undertaken in Tuban, Jombang, Lumajang, Sampang, Kota Blitar, and Kota Surabaya (East Java); Bima,
Sumbawa Barat, Lombok Barat and Kota Mataram (NTB); and Timor Tengah Utara, Manggarai, Belu, Kota Kupang and Sumba Barat (NTT).
7 Local regulation (peraturan daerah or perda) is the highest level of legal document. It must be discussed and passed by the legistative council (DPRD) and signed into law by the executive.

Survey of Businesses in 245 Regencies/Municipalities in Indonesia
7KPP D
community over the course of four years. Also, most of the regions surveyed were different regions from before, so the problems faced by the business community were different as well.
2.6 Sampling
The respondents targeted in this survey represent businesspersons from all non-primary business sectors: services, production and trading. Services, production and trading are the key economic sectors that most often come into contact with the government. Businesspersons engaged in agriculture, forestry and fishery were not selected as respondents for this survey. The reason for not including these primary business sectors is that the handling of those sectors by government is very different. However, business activities for processing agricultural, forest and fishery products are included in this survey, while government-owned enterprises (BUMN/BUMD), government agencies engaged in education and health care services and other public services are excluded from the survey.
In terms of business scale, this survey originally focused only on business of small, medium and large scale, but eventually also included micro-scale enterprises. This was because some districts did not have sufficient numbers of small (5-19 workers), medium-scale (20-99 workers) and large (more than 99 workers) businesses to serve as a sample. So that each district would be adequately represented, micro-scale businesses (less than 5 workers) were also interviewed, though businesses with only one worker were excluded from the analysis.8
The 2011 LEG study used the 2006 Economic Survey9 as its sample frame. The 2006 Economic Survey was also used as the sampling frame for the three previous LEG studies. Proportional random sampling was used to obtain samples representing
the sectors and scales of business10 that are the focus of the survey.
For the three provinces that were covered in the 2007 study, the respondents interviewed in the previous survey were prioritized. In the implementation, 68% of the respondents in the 2007 LEG study in East Java, NTB and NTT were interviewed again as respondents in this survey. NTB had the highest panel respondents, at 82%, followed by East Java (68%) and NTT (56%). Some of the respondents surveyed previously had moved, could not be contacted, or no longer fulfilled the requirements as respondents due to changes in scale of business. In these cases, proportional random sampling was again applied to the data from the 2006 Economic Survey after these old respondents were removed from the population.
2.7 Construction of LEG Index
The benchmark for the LEG index is the best and worst regencies/municipalities among the districts surveyed. The main source of LEG data is the firm survey, to ensure that the ensuing results are facts and practices experienced by businesspersons, not just the opinions of experts, and not due to prevailing regulations. The LEG performance benchmarks used
Graph 2.2 Stages in Calculation of Final
Index
Final Index
Based on weights identified by business operators as
major obstacles
9 Sub-Indices
Average value of each Sub-Index
Variables in Each Sub-Index
_______________________________________________________________8 The definitions of micro, small, medium and large scale businesses are based on the business classifications used by the Central
Bureau of Statistics (BPS). 9 The 2006 Economic Survey compiled by the Central Bureau of Statistics (BPS) contains the most comprehensive data on firms
characteristics (business scales and business sectors).10 BPS Line of Business Classification (KLU) is used to determine sector and scale of business.

2011 Local Economic Governance Report
8
are the best and worst regencies/municipalities surveyed for each variable. Thus, the LEG performance of a given region is compared with the benchmark achieved by other districts in the provinces surveyed. Comparisons are not made using benchmarks unachievable in the 19 provinces (for instance, benchmarks from best practices in other countries).
Index is calculated is done to compare local economic governance conditions in the 245 regencies/municipalities. The steps taken to calculate the final index are as follows:
(1) Defining variables to be used for forming sub-indices. Variables are selected because they are believed to be elements forming a sub-index. For instance, the Land Access Sub-index is formed from the variables of time needed to arrange a land certificate; ease or difficulty to access land for doing business; eviction level; frequency of land conflict; and impact of land as obstacles to business.
(2) Normalization of variables through determining t value. In the questionnaire, each indicator consists of several questions representing quantitative variables (continuous variables) and qualitative variables (discrete
variables). The two types of variables could not be aggregated directly, due to their different measurement units; for instance, money amounts (Rp) versus perceptions (1 = very poor and 4 = excellent). Therefore, normalization must first be done by removing units from each variable using the following formula:
Other than that, some variables must have their values reversed to ensure that a higher value indicates a better performance. For instance, a longer time to arrange a land certificate indicates poorer performance. The t value for variables such as these should be reversed through calculating t
rev = 100 - t.
(3) Calculation of sub-indices. The various composite variables in each LEG aspect are averaged to obtain the sub-indices. At this stage, each variable has the same weighting.
(4) Calculation of final index. The next phase is calculation of the final index as the aggregation of the nine sub-indices used. At this stage, weighting is applied, based on the opinions of respondents in the survey regarding the main obstacles they face.

9KPP D
3.1 Characteristics of Respondents
The respondents of the 2011 Local Economic Governance study are 12,391 persons with authority to make decisions in their companies. Around two out of three respondents were owners of their companies, followed by 24% managers and 8% directors. This indicates that the information obtained in the survey comes from sources who have a reasonable understanding of the ins and outs of business and who have the authority to make decisions in their companies.
In terms of educational background, 64% of respondents have at least a high school education. The highest proportion of respondents comprised those who have graduated from high school but not continued to higher education (43%). Around 21% of respondents have studied in three-year academic diploma (D3) programs or up to the doctoral level (S3). This indicates that most of the
3. Characteristics of Respondents and Firms
information was obtained from respondents with a fairly high educational level. While there were some respondents who did not complete elementary school (4%), only graduated from elementary school (16%), or graduated from junior high school (16%), these persons are the decision makers in their companies, so they have a sound understanding of the problems faced by their business in connection with local government policies.
A majority of the respondents interviewed were aged between 19 and 65, and they had been working for an average of 12.6 years. The average age of respondents was 43 years, and around 98% of respondents were aged between 19 and 65, with the remainder over 65. The respondents interviewed in this survey have experience working or managing companies ranging from one year (0.3%) to 60 years, with an average of 12.6 years. From the ages of the respondents and the length of their business management experience, it is evident that the information obtained in this survey comes from very accurate sources. Women constituted 22% of the survey respondents.
3.2 Characteristics of Firms
A majority (89%) of the firms surveyed are local ones with business capital originating from the same regencies. Companies with capital coming from other regencies/municipalities within the same provinces accounted for only 8%, while those with national investors from another province came to only 2%. Less than 1% of firms had any foreign capital. This indicates that investment from outside
Graph 3.1 Level of Education of Respondents (in Percentages)
Did Not Finish Elementary School
Elementary School
Junior High School
Senior High School
Academy/Diploma
University
Master and Doctorate

2011 Local Economic Governance Report
10
Micro Small Medium Large
the regions remains very low and is not yet evenly distributed to all parts of the country.
The average age of the firms surveyed is 13.4 years, slightly “younger” than the companies in the 2007 LEG study (14.4 years). Firms aged between six and ten years were the largest contingent, at 29%, followed by those established within the past one to five years, at 21%.
Sole proprietorships (PO) are the most prevalent type of business entity among the companies surveyed. Out of all the respondents, 37% are PO – lower than in the LEG 2007 study, when PO comprised half of all respondents. The other prominent forms of legal entity include trading businesses (UD, 16%), limited partnerships (CV, 12%), limited companies (PT, 8%), cooperatives (6%) and trading companies (PD). Only 0.4% are publicly listed companies. It is interesting to note that 16% of business activity in some regions is conducted by entities with the legal form of foundations, which commonly operate in non-profit social welfare activities.
In terms of scale of business, the largest proportion is small businesses with between 5 and 19 workers. No less than 58% of the companies surveyed were small companies; 73% of these had between 10 and 19 workers. Medium-scale businesses, with 20-99 workers, constituted 36% of firms, followed by large companies, at 4%. The smallest proportion was micro enterprises with fewer than five workers, at only 2%. The proportions of companies by scale of business in this 2011 LEG study differ somewhat from those in the 2007 LEG study. Four years
ago, small businesses accounted for 51% of firms, medium-scale businesses 43% and large companies 6%.
In terms of business sector, the largest proportion operates in the production sector. No fewer than 42% of the firms interviewed work in the production sector, followed by 35% in services and 23% in trade. This composition is quite similar to the 2007 LEG study, when production sector accounted for 44%, followed by the service sector (36%) and the trade sector (21%).
Most of the companies surveyed are still oriented toward the local markets near their business locations. Around seven out of ten firms interviewed stated that their main customers are located in the regencies/municipalities where they operate. In fact, 30% have customers in the same villages, and 23% have customers in the same sub-district but in different villages. Business operators with their main customers in other regencies/municipalities within the same province account for only 22% of respondents. Only 8% have customers in other provinces, and only 1% have customers abroad. This indicates that very few companies are oriented toward overseas markets.
Only 29% of the companies surveyed have obtained credit from banks for their business activities. The level of companies dealing with the banking sector is lower in this survey than in the 2007 LEG study, when 39% of firms had obtained credit from banks. Further, as in the 2007 LEG study, this survey again found that the larger the scale of business, the likelier that the firm has borrowed from a bank. The
Graph 3.2 Scale of Business, 2007 and 2011(in Percentages)
Graph 3.3 Sector of Business, 2007 and 2011 (in Percentages)
LEGS2007
LEGS2011
Production Trade Services
LEGS2007
LEGS2011

Survey of Businesses in 245 Regencies/Municipalities in Indonesia
11KPP D
W S
umat
ra
Bant
en
C Su
lawes
i
W S
ulaw
esi
E Ja
va
W K
alim
anta
n
N M
aluk
u
Beng
kulu
Jam
bi
C Ka
liman
tan
SE S
ulaw
esi
S Ka
liman
tan
Mal
uku
Papu
a
W P
apua
NTT
Aver
age
Lam
pung
Babe
l
NTB
3.3 Firms' Performance and Plans
Of the 12,391 companies surveyed, 71% stated that their businesses had earned a profit. On the other hand, 19% of respondents said they had just broken even, and 10% had suffered losses. These conditions are better than in the 2007 LEG study, when the proportions of companies earning a profit, breaking even, and running at a loss were 66%, 22%, and 12% of respectively. The financial conditions of these companies indicate that the national economy has improved over the past four years.
proportion of large companies that have obtained credit from banks is 41%; 30% of medium-scale businesses have done so, but only 17% of micro enterprises. This is logical, as it is generally easier for large businesses to gain access to the banking sector, as they are more able to provide suitable collateral.
West Sumatra is the province with the largest proportion of companies that have experience dealing with banks, while NTB has the smallest. Around 44% of firms in West Sumatra have borrowed from banks, compared with only 13% in NTB. From the qualitative studies and focus group discussions (FGD) in the 2011 LEG study, it was identified that the entrepreneurial spirit of a given region influences the level of relationships with banks. Quite a few business operators in West Sumatra feel bold enough to apply for loans from banks to expand their businesses. Another aspect that influences the level of borrowing from banks is the availability of alternative, non-bank financial institutions that can provide loans with less stringent conditions. For example, in West Kalimantan, business operators prefer to obtain credit from credit unions (CU), which have much simpler lending requirements than banks.
Graph 3.4 Firms Received Loan from Banks (in Percentages)
Graph 3.5 Firms’ Financial Condition (in Percentages)
Loss
Break Even
Profit

2011 Local Economic Governance Report
12
In the three provinces that were studied in 2007, East Java and NTT displayed different results from NTB. In East Java and NTT, the proportions of companies suffering a business loss in 2011 were 11% and 4% respectively, lower than the 14% and 7% found in 2007. Companies making a profit in East Java rose from 64% (2007) to 73% (2011). In NTT, the proportion of companies earning a profit also rose, from 70% (2007) to 88% (2011). In contrast, the proportion of companies suffering losses in NTB came to 17% (2011), the highest among all the provinces studied. This figure is also higher than in 2007 (12%). Only 56% of companies in NTB made a profit in 2011, compared with 76% in 2007.
With regard to firm performance in the last three years, on average 47% of companies stated their performance has improved. Meanwhile, 41% of companies said their performance was the same and 12% felt conditions had worsened. Compared with the respondents in the 2007 LEG study, 54% of companies stated their financial conditions had improved (more than in LEG 2007), but the proportion who said conditions had worsened was also higher, at 18%.
A large number of firms plan to expand in the future. Around 35% of companies plan to increase their capital, 22% intend to expand their work force and 18% plan to add machinery. In contrast, only 23% have no plans to make such changes. One interesting fact is that companies’ future plans do not correlate with their current financial conditions or with the trend in their conditions over the last three years. Both companies that suffered losses and those that made a profit, and both those that feel conditions have worsened and those that say they have improved, plan to expand.
Graph 3.6 Firms’ Performance in The Last Three Years
(in Percentages)
Worsened
Unchanged
Better

13KPP D
4.1 Background
Land is an essential aspect in creating a positive investment climate for businesses, though the authority for this has not been decentralized. Every business needs land, whether to build a factory, store goods, or simply establish an office or a store to sell products. Therefore, policies that promote ease in access to land will promote new investment. Just as important as ease in obtaining land is maintaining the ownership/use of the land. When rights to the ownership or use of land are guaranteed, companies will be much more likely to invest. The National Land Agency (Badan Pertanahan Nasional, BPN), as stipulated in Basic Agrarian Law No. 5/1960, is the institution responsible for land management in Indonesia.
Overall, there are three main categories of land rights: formal legal rights, traditional rights of ownership (ulayat), and holdover rights (garapan). Formal legal land rights comprise several types, based on the type of certificate issued by BPN. Hak Milik (HM), or right of ownership, the only legal category which does not have a fixed period of time, is the strongest type of land right an individual or legal entity can have, and can be passed on through inheritance. Hak Guna-Usaha (HGU), or leasehold, is a right to exploit land that is controlled directly by the state. Hak Guna-Bangunan (HGB), building rights, is the right to erect a
4. Land Access
structure for a certain period. Hak Pakai is the right to use and/or to extract products from land that is directly controlled by the state or another party. Hak Sewa untuk Bangunan is the right of an individual or a legal entity to use land owned by another party for the purpose of building, with payment of money to the owner as rent. Rights to open land for cultivation and to collect forest products may only be held by Indonesian citizens. In the second category are rights to traditional land that are not officially registered, including girik. The last category, the garapan classification, is one of quasi-legal ownership; these rights are holdover rights which allow owners to apply for formal ownership, but the state must first release the rights to the land.
Land right processing costs are often a burden on businesses; consequently, much land has not been registered. Government Regulation (PP) No. 46/2002 actually stipulates rules on land registration fees, but the reality in the field is that the fees can be quite high and vary from region to region. The land regulation procedures also fail to clearly specify time limits for land registration services. A World Bank study (2005) stated that only 20% of land in Indonesia is registered with BPN. As a result, there is a lot of informal “control” or “use” of land, especially by the middle and lower classes. Consequently, they cannot use this land as collateral to borrow capital.

2011 Local Economic Governance Report
14
ownership status by scale of business.
4.3 Time Needed to Process Land Certificates
The average time needed to obtain a land certificate is eight weeks. The median time to arrange a land certificate is only four weeks, which indicates that many business operators have to spend much longer on this process than the majority of firms. Business operators in Bangka Belitung experience the longest time to arrange land certificates, averaging 16 weeks (median 12 weeks). In contrast, Southeast Sulawesi and South Kalimantan are the regions with the shortest land certificate processing time, averaging only four weeks in both provinces. As can be seen in Graph 4.3, certificate processing times are generally longer in Western Indonesia than in Eastern Indonesia. This study also identified that there is no significant difference in the times needed to arrange land certificates by status, i.e. HM, HGU or HGB.
Compared with the results of the 2007 LEG survey, the average time to arrange a land certificate in East Java has become shorter. The results of the 2011 study indicate that the average time to arrange a land certificate in East Java is now 11 weeks (median eight weeks), better than the average of 15 weeks (median 12 weeks) in 2007. Some regions where, in the 2007 study, the land certificate processing time was very long, such as Kota Surabaya, Sidoarjo and Kabupaten Sampang, have improved significantly, respectively from 36 to 17 weeks, from 30 to 20 weeks and from 32 weeks to only nine weeks. Even so, Kota Surabaya and Sidoarjo are still among the regions with the longest times to complete land certificates (by comparison, the longest average time is in Sarmi, Papua, at 26 weeks).
Land certificate processing times have also become shorter in NTT and NTB. While in 2007 the average time needed in NTT was 8-9 weeks, arranging a land certificate in this province now takes around 6-7 weeks. Similarly, in NTB the time needed to arrange a land certificate had declined from an average of 11-12 weeks (2007) to 9-10 weeks when this survey was conducted.
4.2 Land ownership
The vast majority of business operators (82%) own the land that they use for their business activities, followed by 15% who rent. This is almost the same as the result of the 2007 study, in which 80% of firms owned their places of firms and 17% of rented. There is no significant difference in land ownership between large and small businesses. This reflects the fact that most business operators enjoy a fairly high level of certainty about their places of business. It also means that business operators display an intention to invest permanently in the places where they now do business.
Ownership right (HM) is the type of land certificate most commonly held (73%) by the business operators interviewed. This indicates a high level of legal certainty for the ownership of business land, because HM status is the strongest type. Another 7% of firms hold HGU, 6% have HGB, and 4% use girik. There is no significant difference in land
Graph 4.1 Business Premises’ Status (in Percentages)
Borrowed
Rented
Owned
Others
Graph 4.2 Business Premises’ Ownership (in Percentages)
Girik
HGU
HGB
HM
Don’t Know

Survey of Businesses in 245 Regencies/Municipalities in Indonesia
15KPP D
Babe
l
Bant
en
Mal
uku
N M
aluk
u
C Ka
liman
tan
E Ja
va
SE S
ulaw
esi
W S
ulaw
esi
Beng
kulu
Jam
bi
W K
alim
anta
n
W P
apua
S Ka
liman
tan
W S
umat
ra
Aver
age
Lam
pung
C Su
lawes
i
NTB
Papu
a
NTT
The qualitative study also recorded complaints about the services of BPN in East Java and NTB. The concerns were mainly regarding the long time needed to arrange land ownership certificates and the complex requirements that must be fulfilled by applicants, such as witness statements from neighbors, and the continuing incidence of land disputes and multiple certificates for the same land.
At the regency/municipality level, times needed to arrange land certificates vary tremendously. The longest time was found in two regencies in Papua, Kaimana and Sarmi; in both places, it takes nearly seven months to arrange a land certificate. Batanghari (Jambi) is another regency where this process takes a very long time – nearly six months. In contrast, business operators in Pulang Pisau (Central Kalimantan), Lebong (Bengkulu) and Lembata (NTT) only need two weeks on average to arrange their land certificates.
4.4 Perceived Ease of Obtaining Land
In general, the level of difficulty in obtaining land correlates with the level of difficulty in arranging permits. Among the 19 provinces surveyed, business operators in Jambi faced the greatest difficulties in obtaining land (51%) and also the most difficulty in arranging permits (42%). A similar situation was found in Papua – 44% of
firms found it difficult to obtain land, and 37% found it difficult to arrange permits. In contrast, very few business operators in West Sulawesi had any difficulty in either obtaining land or arranging permits. Maluku and East Java are anomalies in this regard; quite a few business operators said it is difficult to obtain land, but relatively few said it was difficult to arrange permits in these two provinces.
The levels of difficulty in obtaining land and land use permits are lower in regencies than in municipalities. Nearly half (47%) of business operators who do business in urban areas said they faced difficulties in obtaining land. This figure is quite high compared with business operators in regencies, where only 31% of respondents mentioned difficulties in obtaining land. Further, while the difference is not so great (though it is statistically significant), the level of difficulty in arranging land use permits is also higher in municipalities (30%) than in regencies (25%).
One effort to enhance performance to improve business operators’ access to land was identified in the qualitative study on LEG in Sampang (East Java). The government of this regency formed a “Team of Nine” who were tasked with facilitating land procurement for construction. The members comprised representatives from various local government work units (SKPD) and from district
Graph 4.3 Time Needed to Obtain Land Certificates, by Province (in Weeks)
Mean Median

2011 Local Economic Governance Report
16
Level of Difficulty in Arranging Land Use PermitsLevel of Difficulty in Obtaining Land
Jam
bi
Papu
a
NTT
Bant
en
C Ka
liman
tan
Mal
uku
SE S
ulaw
esi
W P
apua
NTB
Lam
pung
Aver
age
W S
umat
ra
C Su
lawes
i
S Ka
liman
tan
W K
alim
anta
n
Babe
l
N M
aluk
u
E Ja
va
W S
ulaw
esi
Beng
kulu
(kecamatan) governments with competence in procuring and ensuring legal certainty of land. The team’s duties were to disseminate information to the public, examine the legal status of land, present the results of its inventory, and provide considered opinions when there were problems relating to land status. The results are evident from the reduction in numbers of business operators who assert it is difficult to obtain land from 57% on 2007 to 27%, as of now.
4.5 Land Eviction Cases
The risk of eviction from the place of business is perceived to be very low. Overall, only 3% of business operators stated that land eviction cases often occur in their regions, and only 9% felt that this was a possibility. Business operators in Bangka Belitung were the most likely to feel that eviction could occur, at 22%. Nevertheless, only 3% of firm there stated that evictions often take place. Meanwhile, business operators in Banten were most likely to feel that eviction from business premises often occurs, as stated by 6% of firmd. Nearly 20% of business operators in this province also felt that the likelihood of eviction was high. In contrast, West Sulawesi and NTT are two provinces where conditions are relatively better in this aspect. The proportions of business operators in West Sulawesi and NTT stating that eviction often occurs were only 0.4% and 2%, and those who felt that eviction could occur were only 4% and 3%, respectively.
4.6 Land Conflict Cases
Very few business operators stated they had experienced conflicts involving collective use of land. Out of 12,391 business operators, only 6% said that land conflicts often occur in their regions.
Graph 4.4 Level of Difficulty in Arranging Land Use Permits and Level of Difficulty in Obtaining Land, by Province (in Percentages)
Graph 4.5 Level of Difficulty in Arranging Land Use Permits and Level of Difficulty in Obtaining Land, by Region Characteristics (in Percentages)
Obtaining Business Land
Municipality Regency
Arranging Land Use Permits

Survey of Businesses in 245 Regencies/Municipalities in Indonesia
17KPP D
Land conflicts in collective use of land occurred most frequently in Papua, as mentioned by 26% of business operators there. Conflicts regarding shared use of land in Papua mostly occur because so much traditional land is claimed by more than one group, leading to a great deal of uncertainty in land use in Papua. Apart from Papua, other provinces where land conflicts are relatively frequent include Southeast Sulawesi, Maluku, West Papua, West Kalimantan and Jambi.
4.7 Significance of Land Problems on Business
Not many business operators feel that land access is an obstacle to their business performance.
Papua is the province where the greatest numbers of business operators (12%) feel that land access problems impede their businesses. Other regions where more than 8% of firms express this view are Central Kalimantan, Maluku and NTB. In contrast, the regions with the lowest proportions of business operators stating that land access is an impediment to business were West Sulawesi, Lampung and South Kalimantan. It is interesting to note that two adjoining provinces, Central Kalimantan and South Kalimantan, showed very significant differences in perceptions of land access as a constraint to business. Business Operators in Kota Tual (Maluku) were the most likely to feel that land access was an obstacle, at 44%.
Babe
l
Bant
en
W P
apua
C Ka
liman
tan
Papu
a
Jam
bi
Lam
pung
W K
alim
anta
n
W S
umat
ra
N M
aluk
u
Aver
age
SE S
ulaw
esi
NTB
C Su
lawes
i
Beng
kulu
S Ka
liman
tan
Mal
uku
E Ja
va
W S
ulaw
esi
NTT
Perceived Likelihood of EvictionFrequent Occurrence of Eviction
Graph 4.7 Level of Obstruction of Business Performance Due to Land Access Problems and to Legal Certainty of Land Ownership, by Province (in Percentages)
Papu
a
C Ka
liman
tan
Mal
uku
NTB
W S
umat
era
W K
alim
anta
n
Jam
bi
Babe
l
N M
aluk
u
Aver
age
NTT
Bant
en
SE S
ulaw
esi
C Su
lawes
i
E Ja
va
W P
apua
Beng
kulu
S Ka
liman
tan
Lam
pung
W S
ulaw
esi
Land Access ProblemsLegal Certainty of Land Ownership
Graph 4.6 Levels of Perceived Likelihood of Eviction and Frequent Occurrence of Eviction, by Province (in Percentages)

2011 Local Economic Governance Report
18
supporting areas for the municipality of Jakarta. The pressures of population growth and economic activity have produced steadily increasing demand for land in these regions. In the province of Papua,
regencies/municipalities with the lowest scores in the land access sub-index. As discussed earlier, the causes of land problems in Papua are very different from in Banten; communal ownership of traditional land (ulayatmain issues here.
Kolaka Utara in Southeast Sulawesi received the highest score and Tebo in Jambi the lowest score, for the land access sub-index. This new regency in Southeast Sulawesi received the highest score because there were three variables in which it performed better than the other 244 regions: ease in obtaining land, no evictions and low obstruction levels of land access and legal certainty of land ownership. Nevertheless, it still takes quite a long
The opposite situation prevails in Tebo; business
business activities, evictions occur frequently and it
Tebo in the lowest position.
Municipalities tend to have relatively lower land access sub-index scores. The average land access sub-index score in municipality regions is 64.8, lower than the average score of 75.7 found
13 of the 20 regions with the lowest rankings are municipalities. Furthermore, there is not one municipality among the 20 regions ranked highest
Surabaya, the largest municipality surveyed, has not changed much since it was surveyed in 2007. In 2007, this municipality was ranked the lowest
Surabaya was ranked 240 out of the 245 regions surveyed.
Only 2% of business operators felt that legal certainty of land ownership was an obstacle to doing business. Very few business operators
certainty of land was an impediment to their
province (see Graph 4.7
proportion of business operators feel that legal certainty of land ownership is an obstacle: 14%
quite a bit higher than in “second ranked” Papua, where only 6% of business operators perceive this
stating that legal certainty of land ownership is a problem: 73%.
4.8 Land Access Sub-Index
South Kalimantan and NTT were the provinces with the greatest numbers of regencies in the “top 20”. Of the 20 regencies/municipalities with the highest sub-index scores, four regencies are located
Tanah Laut (11), Tabalong (13) and Balangan (20). Also in the “top 20” are three regencies located in NTT: Manggarai Timur (fourth place), Ngada (ninth) and Sikka (15).
In contrast, Banten and Papua contributed the largest numbers of regencies/municipalities among the 20 worst for the land access sub-index. Five of the eight regencies/municipalities in the province of Banten had the lowest land access sub-indices
were centered on two locations – Tangerang
Box 4.1
(2) Ease of obtaining land;(3) Frequency of land eviction cases;
(5) Overall assessment of impact of land issues on business continuity.

Survey of Businesses in 245 Regencies/Municipalities in Indonesia
19KPP D
Graph 4.8 Land Access Sub-Index

2011 Local Economic Governance Report
20

21KPP D
5.1 Background
Infrastructure correlates strongly with business operators’ decisions to invest. Availability and quality of infrastructure is a determining factor in business operators’ decisions, as it strongly influences the distribution costs of production input and output. Thus, good infrastructure can enhance a region’s productivity. For example, availability of decent transportation facilities will promote greater mobility of persons, goods and services. Conversely, poor access to transportation will make it more difficult for business operators to perform their activities. Therefore, availability of infrastructure is essential for smooth production and distribution processes.
Indonesia’s performance in the area of infrastructure remains relatively poor compared with that of its neighbors. The Global Competitiveness Report 2010-2011 (World Economic Forum, 2010) indicates that Indonesia’s infrastructure performance is very low. Of the 139 countries studies, Indonesia is ranked 90 for infrastructure as a whole, while Malaysia and Thailand are ranked 27 and 46, respectively. With regard to the quality of roads, Indonesia is ranked 84, far lower than Malaysia (ranked 21) and Thailand (36). Likewise, for quality of electric power supply, Indonesia is ranked 97, compared with Malaysia at 40 and Thailand at 42.
The poor quality of infrastructure can be caused by the low level of funding allocated to infrastructure.
5. Local Infrastructure
The World Bank estimates that Indonesia’s infrastructure expenditure in 2007 was only 3.4% of the total Gross Domestic Product (GDP), still far lower than the infrastructure expenditure before the 1998 economic crisis of 5-6% of GDP. The results of the Local Budget Analysis Study11 show that the average funding allocation for the public works sector in 2007-2010 in 40 regencies/municipalities came to only 14%. For road and bridge programs, the average funding allocated was only Rp 52 million per kilometer of road, or around a quarter of the amount needed for periodic maintenance alone.
5.2 Quality of Local Infrastructure
Street lighting is the form of infrastructure considered by business operators to have the lowest quality. Overall, half of business operators stated that street lighting was poor or very poor. The quality of water supply and of roads was also considered poor by 44% and 40% of firms, respectively. Further, two types of infrastructure that are not under the authority of local government – electricity and telephones – were considered poor or very poor by only 34% and 22% of firms, respectively.
The quality of infrastructure in East Java, Lampung, and South Kalimantan is relatively better than in other provinces. Compared with the other 18 provinces, the proportions of business operators stating that the quality of infrastructure
_______________________________________________________________11 National Secretariat of the Indonesian Forum for Budget Transparency (Seknas FITRA) and The Asia Foundation, 2011.

2011 Local Economic Governance Report
22
is poor/very poor in East Java is relatively low for all types of infrastructure examined, even for street lighting and electricity, which were considered the worst. Meanwhile, firms in Lampung feel that the quality of street lighting, electricity and telephones is good and telephones were rated the best among the 19 provinces. The proportions of business operators in South Kalimantan stating that the quality of road, street lighting and water supply is poor/very poor were the lowest among all the provinces surveyed.
In contrast, the quality of infrastructure in Southeast Sulawesi, Maluku and North Maluku is the worst among the 19 provinces examined. Southeast Sulawesi had the highest proportions of business operators who feel that the quality of roads and telephones is poor/very poor. Further, the quality of street lighting and water supply was
also considered poor by, respectively, 84% (second highest among the 19 provinces) and 73% of firms (highest). Street lighting was considered the worst form of infrastructure in Maluku, while water supply and electricity were also judged relatively poor in this province. Infrastructure conditions were also considered poor by business operators in its “sister province”, North Maluku. Electricity in this province was considered the worst among all provinces surveyed, while roads and telephones were placed second worst among the 19 provinces.
At the regency/municipality level, firms’ perceptions of the quality of infrastructure vary tremendously. All business operators in four regencies – Bombana, Buton and Konawe Utara (all in Southeast Sulawesi) and Halmahera Timur (North Maluku) – feel that the quality of roads is poor/very poor. In contrast, all business operators in Tulungagung, Magetan
Province Roads Street Lighting Water Supply Electricity Telephones
Bengkulu 53 65 40 38 13
Jambi 68 55 41 36 24
W Sumatra 26 40 37 37 13
Lampung 43 40 42 16 6
Babel 21 59 83 36 25
Banten 47 48 36 24 9
E Java 24 (28) 20 (25) 26 (27) 7 (10) 11 (10)
NTB 42 (35) 59 (37) 24 (40) 45 (33) 16 (28)
NTT 55 (41) 82 (68) 60 (44) 56 (48) 29 (25)
W Kalimantan 53 62 58 48 23
S Kalimantan 11 20 18 19 15
C Kalimantan 39 50 34 25 18
SE Sulawesi 70 84 73 30 53
C Sulawesi 39 55 38 32 18
W Sulawesi 32 50 36 16 44
Maluku 44 89 63 64 39
N Maluku 56 73 57 75 51
Papua 29 53 58 48 31
W Papua 34 61 51 43 34
Average 40 50 44 34 22
Table 5.1 Quality of Local Infrastructure, by Province (Percentages Stating “Poor” and “Very Poor”)
Note: Figures in parentheses are results from 2007 LEG study.

Survey of Businesses in 245 Regencies/Municipalities in Indonesia
23KPP D
Municipality
Road Streetlights Water Supply Electricity Telephone
Regency Mainland Island Western Indonesia Eastern Indonesia
and Kota Blitar (all in East Java), Manggarai Timur (NTT), Hulu Sungai Selatan (South Kalimantan) and Pulang Pisau (Central Kalimantan) feel that the quality of roads is good/very good. A similarly extreme difference in perceptions of business operators was found for the quality of water supply. All firms in Bungo (Jambi), Pesawaran and Lampung Barat (Lampung) and Kediri and Tulungagung (East Java) feel that the water supply in their regions is of good quality. Conversely, all business operators in Asmat, Mappi and Mimika (Papua), Buton Utara (Southeast Sulawesi) and Tanggamus and Tulang Bawang (Lampung) feel that their water supply is of poor quality.
Of the three provinces surveyed in 2007, business operators in NTB and NTT perceived a decline in the overall quality of infrastructure. As shown in Table 5.1, generally, more firms stated that the quality of infrastructure in Nusa Tenggara was worse than four years ago. Apart from water supply and telephones in NTB, more firms in both provinces felt that the quality of infrastructure was poor/very poor. The results of the qualitative study on LEG in Manggarai, Sumba Barat and Belu (NTT) and Kota Mataram (NTB) confirm this. Business operators in these regions feel that the slow expansion of roads, poor road conditions, and the long time needed for road repairs are obstacles to the distribution of goods. Frequent power cuts were also identified as a problem in these regions. In contrast, though the figures are not very different, fewer business operators in East Java stated that
the quality of infrastructure was poor/very poor, except for telephone service.
Ten years of regional autonomy has not been able to reduce the discrepancy in quality of infrastructure between regions in Eastern and Western Indonesia, between islands and non-islands and between municipalities and regencies. The quality of infrastructure in Western Indonesia is far better than in Eastern Indonesia. For example, street lighting is considered good by only 39% of firms in Eastern Indonesia, but by 62% in Western Indonesia. A similar situation is found when we compare the quality of infrastructure by municipalities versus regencies, or by island versus mainland regions. In municipalities and mainland regions, the proportions of business operators reporting that the quality of infrastructure is good are higher.
5.3 Time Needed to Repair Damaged Infrastructure
Speed of repairs to roads and street lighting is much worse than for the other three types of infrastructure. Overall, the average time needed to repair damaged roads is 76 days (2.5 months), and for street lighting nearly one month. These repair times for roads and street lighting are much longer than for water supply, electricity and telephones, for which repair times average less than one week.
Graph 5.1 Quality of Local Infrastructure, by Region Characteristics(Percentages Stating “Good” and “Very Good”)

2011 Local Economic Governance Report
24
The time needed to repair roads varies tremendously. In the perception of business operators, the time needed to repair roads in Bengkulu, West Sumatra and West Papua is less than one month. In West Sumatra, it takes on average only 19 days to repair damaged roads. In contrast, the time needed for regency/municipality governments in Jambi to repair roads is over nine months. Two provinces in Kalimantan – West and Central – also have relatively long road repair times, around four months.
In contrast, the time needed to repair telephones, electricity and water supply does not vary greatly between regions. Telephone and electricity infrastructure is managed by state-owned enterprises (SOEs), which may be why there is
so little variation. As is generally known, PLN (the power company) and Telkom (the telephone company) are publicly listed companies that have nationwide operating standards and are managed relatively professionally, so their response to complaints or damaged infrastructure is fairly prompt. North Maluku is an exception for electricity, as repairs there take over one month. Meanwhile, West Sulawesi and Papua are anomalies for the quality of telephone service; repairs take two weeks. The speed of repairs to water supply infrastructure is also relatively good, probably because it is generally managed by local government-owned companies (PDAM or municipal waterworks), rather than directly by the local governments as is the case for street lighting and roads.
Table 5.2 Time Needed to Repair Damaged Infrastructure, by Province (in Days)
Province Roads Street Lighting Water Supply Electricity Telephones
Bengkulu 27 10 4 7 2
Jambi 285 121 5 2 6
W Sumatra 19 8 4 3 2
Lampung 42 11 3 3 3
Babel 57 24 13 4 5
Banten 30 11 4 2 2
E Java 73(65) 9(15) 4(20) 1(2) 2(5)
NTB 32(23) 5(7) 2(4) 2(3) 2(3)
NTT 52(52) 47(22) 7(8) 6(3) 5(2)
W Kalimantan 122 22 6 4 3
S Kalimantan 59 33 5 6 3
C Kalimantan 110 27 7 5 6
SE Sulawesi 88 40 12 8 6
C Sulawesi 49 19 8 13 4
W Sulawesi 37 27 4 5 15
Maluku 95 86 16 13 8
N Maluku 54 41 6 35 7
Papua 100 104 6 5 13
W Papua 24 16 9 7 7
Average 76 29 6 6 4
Note: Figures in parentheses are results from 2007 LEG study.

Survey of Businesses in 245 Regencies/Municipalities in Indonesia
25KPP D
Infrastructure repair times have improved in East Java and NTB (except for roads) but have generally deteriorated in NTT. In the perception of business operators, local governments in East Java are more responsive now than in 2007, except for road repairs, for which the repair time has risen from 65 days to 73 days. On the other hand, significant improvement has been seen in street lighting and water supply, from 15 and 20 days respectively in 2007 to only 9 and 4 days in 2011. Similarly, in NTB, there has been improvement in repair times for street lighting, water supply, electricity and telephones, but not for roads. The average road repair time in NTB has actually increased from 23 days to 32 days. Unlike in the other two provinces, the time to repair infrastructure in NTT is generally worse than in 2007, except for roads and water supply. Street lighting repairs now take 47 days, compared with only 22 days in 2007. The time needed to repair electricity and telephones is also twice as long now as in 2007.
Infrastructure repair is faster in municipalities than in regencies. Apart from water supply, for which repair times are relatively similar, for the other four types of infrastructure, the repair times in regencies are far longer than in municipalities, as can be seen in details in Graph 5.2.
The frequency of water supply not running is relatively lower in Western Indonesia than in Eastern Indonesia. As indicated in Graph 5.3,
based on the perception of firms, on average the water stops running in Western Indonesia only 0.8 times per week, while in Eastern Indonesia this happens twice a week. Of the 11 provinces where the frequency of water not running is higher than the overall average, only Bangka Belitung and Jambi represent the Western part of Indonesia. Meanwhile, in the other five regencies the frequency of water not running is lower than the average for all regions, at 1.6 times per week. And in East Java, this problem occurs only 0.2 times per week. In contrast, business operators in Papua, Southeast Sulawesi, Papua and Central Sulawesi claim that the water stops running more than twice a week.
Graph 5.2 Time Needed to Repair Damaged Infrastructure, by Region Characteristics (in Days)
RegencyMunicipality
Road Streetlights Water Supply Electricity Telephone
Graph 5.3 Frequency of Water Supply Not Running per Week, by Province
NTT
SE S
ulaw
esi
Papu
a
C Su
lawes
i
Mal
uku
W K
alim
anta
n
W P
apua
Babe
l
N M
aluk
u
NTB
Jam
bi
Aver
age
S Ka
liman
tan
Lam
pung
W S
ulaw
esi
C Ka
liman
tan
W S
umat
era
Bant
en
Beng
kulu
E Ja
va

2011 Local Economic Governance Report
26
5.4 Frequency of Blackouts and Level of Generator Ownership
Business operators experience power cuts nearly three times a week. As with stoppage of the flow of water, business operators in Eastern Indonesia experience blackouts more often (four times per week on average) than those doing business in the West (twice a week on average). Maluku, NTB, West Kalimantan and West Sulawesi are the four provinces where businesses experience blackouts most often, more than five times a week. In contrast, the two provinces surveyed in Java, Banten and East Java only experience blackouts 1.1 and 0.4 times per week.
The average level of generator ownership is nearly 19%. In fact, nearly 8% of firms receive their electricity only from generators. However, a high level of generator ownership in a given region does not always correlate with the frequency of blackouts. In North Maluku, the level of generator ownership and frequency of blackouts are both relatively high. However, fairly high numbers
of business operators own generators in Central Kalimantan and Bangka Belitung, though the frequency of blackouts is low. In contrast, the level of generator ownership in NTB is relatively low, though the frequency of power cuts is fairly high.
5.5 Obstruction Level of Infrastructure for Firm Performance
Infrastructure is the main constraint for firm performance. Overall, 27% of firms assert that their business performance is impaired by infrastructure problems. South Kalimantan (5%) and East Java (10%) are the two provinces where business operators are least affected by infrastructure problems. Conversely, NTB (51%), Maluku (51%) and Southeast Sulawesi (46%) are the provinces where firm performance is most badly affected by infrastructure. The obstacles of infrastructure for firm performance in island regions (34%) are far higher than in non-island regions (25%). These infrastructure constraints are experienced by all business sectors – services, trade and industry.
Graph 5.4 Frequency of Blackouts and Level of Generator Ownership, by Province
Frequency of Blackouts (Left Axis)
Generator Ownership (Right Axis)
Freq
uenc
y of
Bla
ckou
ts (T
imes
/Wee
k)
Gene
rato
r Ow
ners
hip
(Per
cent
ages
)
Mal
uku
NTB
W K
alim
anta
n
W S
ulaw
esi
N M
aluk
u
Papu
a
SE S
ulaw
esi
W S
umat
era
W P
apua
Jam
bi
C Su
lawes
i
Aver
age
NTT
Beng
kulu
S Ka
liman
tan
Lam
pung
C Ka
liman
tan
Babe
l
Bant
en
E Ja
va

Survey of Businesses in 245 Regencies/Municipalities in Indonesia
27KPP D
Graph 5.5 Local Infrastructure Sub-Index and Population Density
5.6 Local Infrastructure Sub-Index
The top ranks for the infrastructure sub-index are dominated by East Java. Seventeen of the regions in the top 20 for this sub-index are municipalities/
Lamongan, with sub-index scores that are nearly the same. One interesting note is the presence of two regencies in Papua – Biak Numfor and
which was only established in 2002, in the top 20 for the infrastructure sub-index.
Box 5.1Variables Forming the Local Infrastructure Sub-Index(1) Quality of local infrastructure;(2) Length of time needed to repair damaged
infrastructure;(3) Level of generator ownership;(4) Frequency of power cuts; and
performance.
In contrast, all the districts in the 20 lowest ranks for the infrastructure sub-index are located in Eastern Indonesia. The provinces of Papua, West Papua, Maluku and North Maluku each “contribute” four regencies where the quality of infrastructure management is considered the worst by business operators. Waropen (Papua), Seram Bagian Timur (Maluku) and Teluk Bintuni (West Papua) are in the lowest ranks for this sub-index, with scores that are roughly the same.
infrastructure management is strongly correlated with the gap in availability of infrastructure between Java and these four provinces in the easternmost part of Indonesia.
Infrastructure sub-indices are higher in more densely populated regions. As can be seen in Graph5.5, the average infrastructure sub-index score in sparsely populated regions (less than 25 people/km2) is only 60. The scores for this sub-index rise steadily in line with population density, and in the most densely populated regions (over 1,200 people/km2) reaches 79.0. This also explains why there are seven municipalities in the top 20 rankings for the infrastructure sub-index but not one municipality among the 20 lowest rankings for this sub-index.
Most of the newly established districts are among those ranked lowest for the local infrastructure sub-index. The average local infrastructure sub-index for newly created regions is 63.0, slightly lower than for parent regions at 69.4, and well below regions that have never undergone partitioning (75.7). Surprisingly, however, regions that were split off in 2001 have the best infrastructure management performance among the new regions, at 73.2, even higher than parent regions.
< 25people/km2
300-600people/km2
75-150people/km2
>1200people/km2
25-75people/km2
600-1200people/km2
150-300people/km2

2011 Local Economic Governance Report
28
Graph 5.6 Local Infrastructure Sub-Index

Survey of Businesses in 245 Regencies/Municipalities in Indonesia
29KPP D

30

31KPP D
6.1 Background
Business licensing still creates burdens for business operators in Indonesia. According to the report Doing Business 2011 (World Bank, 2010), to start a new business in Jakarta, an entrepreneur has to go through nine procedures, taking 47 working days and costing up to 22% of total per capita income. These problems can stifle business activity, hamper the development of small businesses, discourage the establishment of new businesses, and dissuade entrepreneurs from formalizing their businesses.
There are five basic types of licenses that must be held by most businesses. A business operator that plans to construct a building must obtain a building permit (Izin Mendirikan Bangunan, IMB). Then, if the business generates a disturbance for its surroundings, such as noise and/or pollution, it needs to obtain a nuisance permit (hinder ordonantie or HO), while if there is no such disturbance, the business needs to obtain a business location permit (Surat Izin Tempat Usaha, SITU). After these “physical permits” (IMB and HO/SITU) are obtained, the business needs to apply for operational licenses. For a business that engages in any kind of trade activities, a trading license (Surat Izin Usaha Perdagangan, SIUP) is required, while firms operating in the industrial/manufacturing sector need to obtain industrial registration certificates (Tanda Daftar Industri, TDI). Within three months after a firm has obtained SIUP and/or TDI or started operating, it needs to register itself to obtain a company registration certificate (Tanda Daftar Perusahaan, TDP). This enables the LG to
6. Business Licensing
have information on all the businesses under its jurisdiction.
The issuance of licenses in the regions is managed by technical agencies or one-stop shops (OSS/PTSP). At the local level, the agencies with the authority to operate business licensing services are technical agencies (local government work units, or SKPD) that are granted this authority. One of these is the Trade and Industry Department for related licenses, such as SIUP, TDP and TDI. Business licensing services can also be provided by an One-Stop Shop (OSS) for business licensing, as mandated by Minister of Home Affairs Regulation (Permendagri) No 24/2006. OSS is an institution that is granted the authority by the regent/mayor to issue various types of licenses. Until the OSS is established, the business licensing process is conducted at several separate locations. Having an OSS makes business licensing much simpler; the number of procedures can be reduced, thus reducing the time and costs for arranging licenses.
6.2 Level of Permit Ownership
Of the five basic types of permits, overall the SITU/HO is the type most often held by businesses, while the TDI is the least often held. No fewer than 63% of business operators have at least one of SITU and/or HO. The SIUP, which is required for all businesses that trade in their products, is held by 58% of firms. IMB and TDP are held by 48% and 49% of firms, respectively, though a TDP is actually mandatory for all businesses. According to the results of a focus group discussion (FGD), the

2011 Local Economic Governance Report
32
reason for this low level of TDP ownership is that banks and other financial institutions do not require TDP to apply for credit, while HO/SITU and SIUP are parts of the requirements. The TDI, which is only required for businesses in the industry category, is held by only 17% of firms.
Generally, the level of ownership of business permits positively correlates with the scale of business. For all types of business licenses, the tendency is that the larger the scale of the business, the higher the level of ownership of basic permits. Among large businesses, 82% hold TDP, compared
with only 20% of micro entrepreneurs. A similar tendency is seen for HO/SITU, SIUP, IMB and TDI. This low level of ownership of basic permits by micro and small business operators constrains them from applying for credit from formal financial institutions to expand their businesses, as well as from participating in government programs.
6.3 Time Needed to Obtain TDP
The average time needed to arrange a TDP was 11 days. Pursuant to Minister of Trade Regulation (Permendag) No. 37/2007, the time to process a TDP shall be a maximum of three working days. Thus, local governments generally fail to comply with the standard set by the Ministry of Trade, which is one of the national-level regulations.
At the provincial level, Banten takes the longest time, and Bengkulu the shortest, to issue a TDP. As shown in Graph 6.2, on average it takes business operators in Banten 18 days to arrange a TDP. Among the eight regencies/municipalities in the province, on average business operators in Lebak only need one week, while it takes four times as long in Kota Cilegon. The province with the shortest time to arrange a TDP is Bengkulu, with an average of only six days. The regency with the longest TDP processing time in this province is Rejang Lebong (nine days), and the shortest is
Graph 6.1 Level of Ownership of Basic Business Permits, by Scale of Business (in Percentages)
Micro Small Medium Large Average
Graph 6.2 Time Needed to Obtain TDP, by Province (in Days)
Bant
en
W P
apua
SE S
ulaw
esi
S Ka
liman
tan
Papu
a
C Su
lawes
i
NTB
W K
alim
anta
n
E Ja
va
Aver
age
N M
aluk
u
C Ka
liman
tan
W S
umat
era
Jam
bi
W S
ulaw
esi
Lam
pung
Babe
l
NTT
Mal
uku
Beng
kulu

Survey of Businesses in 245 Regencies/Municipalities in Indonesia
33KPP D
difficulty increases slightly for small and medium scale business operators. And around one out of five micro scale firms said that arranging a TDP is difficult. This means that the level of difficulty felt by micro entrepreneurs in arranging TDP is nearly twice as high as for large business operators.
As well as being easier for operators of large businesses, arranging a TDP is more difficult for business operators in urban areas. On average, 18% of respondents who do business in urban areas feel that arranging a TDP is difficult/very difficult. In contrast, only 12% of business operators in regencies feel it is difficult. There is no significant difference in this regard between businesses in Eastern and Western Indonesia.
6.5 Cost of TDP and Firms Perceptions of Cost as an Obstacle to Business
The average cost to arrange a TDP is Rp 473 thousand, but only 11% of firms feel this is a burden. Pursuant to Permendag No.37/2007, no fee shall be collected from a company that applies for a TDP in the first time. For renewals, the lowest standard fee is for cooperatives and sole proprietorships (PO), at Rp 100 thousand; for limited partnerships (CV), firms and other types of companies, Rp 250 thousand; for limited companies (PT), Rp 500 thousand; and the highest renewal fee,
Bengkulu Tengah (average 1.7 days). Bengkulu Tengah regency has the shortest TDP processing time of all 245 regencies/municipalities surveyed.
At the regency/municipality level, the longest times to arrange a TDP are in Ketapang (West Kalimantan) and Kota Malang (East Java). The longest time to arrange a TDP among all the regencies/municipalities surveyed is in Ketapang. According to business operators in this regency, it takes them 49 days to arrange a TDP. This process also takes quite a long time in Kota Malang – 36 days, far longer than in the neighboring municipality of Kota Batu, where it takes only 11 days.
In the three provinces that were also surveyed in 2007, the length of time needed to arrange permits in East Java and NTT has become shorter in 2011, while in NTB it now takes slightly longer. In 2007 business operators in East Java needed 16 days to arrange a TDP, and 12 days in NTT. The results of the 2011 LEG study show that these times have improved to only 11 and eight days. In contrast, the time to arrange permits in NTB was only ten days in 2007, slightly shorter than the 12 days it takes now.
6.4 Perceived Level of Difficulty of Obtaining TDP
In general, business operators feel that the process to obtain a TDP is not difficult. Only 13% of firms stated that it was difficult to arrange a TDP. Among the 19 provinces, the proportions of business operators in Southeast Sulawesi, West Kalimantan and Jambi stating that arranging a TDP is difficult were relatively high, at 30%, 25% and 23% of respectively. In contrast, 99% of firms in West Sulawesi felt that arranging a TDP was not difficult. Among the 245 regencies/municipalities surveyed, there were 79 districts where all business operators stated that arranging a TDP was not difficult.
The level of difficulty in arranging TDP tends to correlate inversely with scale of business. Only 11% of large business operators stated that arranging a TDP is difficult. The perceived level of
Micro MediumSmall Large
Graph 6.3 Perceived Level of Difficulty of Obtaining TDP, by Scale of Business
(in Percentages)

2011 Local Economic Governance Report
34
TDP
Cost
(Rp
Thou
sand
)
TDP
Cost
Per
ceive
d as
Obs
tacle
(Per
cent
ages
)
Mean Cost of TDP (Left Axis) Median Cost of TDP (Left Axis) TDP Cost Perceived as Obstacle (Right Axis)
Bant
en
W P
apua
Papu
a
Babe
l
Lam
pung
C Ka
liman
tan
N M
aluk
u
SE S
ulaw
esi
Aver
age
C Su
lawes
i
NTB
Beng
kulu
Mal
uku
W S
umat
era
E Ja
va
S Ka
liman
tan
W K
alim
anta
n
Jam
bi
W S
ulaw
esi
NTT
for foreign companies, is Rp 1 million. In general, the actual level of payments is Rp 473 thousand, with most business in the form of PO, UD and CV, indicating that the Regulation is not fully complied with and/or that there are still many unofficial fees collected to obtain a TDP. But again, most respondents do not feel this is a great burden.
Banten, West Papua and Papua are the provinces with the highest TDP fees, while North Maluku has the highest level of business operators who feel the fees are a burden. The average cost spent by business operators in these three provinces is around twice the average for all provinces studied. However, the difference between the median and the average in the three provinces is over 40%, indicating that a few firms pay far more than the majority of other business operators in the same provinces. Although the costs are quite high, the level of complaints about these fees is relatively low – only around 8%-12%. In North Maluku, though the cost paid by business operators to obtain TDP is not so high (Rp 520 thousand), this province has the highest proportion of business operators asserting that this is a burden, at 26%.
Compared with the situation in 2007, the trends in TDP costs and respondents’ perceptions in East
Java, NTB and NTT vary greatly from province to province. In East Java, the actual cost of TDP has not changed greatly, but the level of complaints has fallen from 11% (2007) to 7% (2011). The two provinces in Nusa Tenggara have both shown contrary changes. In NTB, the cost to arrange a TDP has fallen sharply from Rp 754 thousand (2007) to Rp 431 thousand (2011), but the level of complaints about the fee has risen from 8% to 20%. In contrast, in NTT the actual cost to arrange a TDP has risen from Rp 214 thousand to Rp 250 thousand, but the proportion of business operators complaining about the cost has fallen by half, from 8% (2007) to 4% (2011).
6.6 Licensing Services Free from Collusion, Efficient and Free from Illegal Charges
Most firms feel that their business licensing services are free from collusion, free from illegal levies, and efficient. Around 76-77% of business operators feel that licensing services in their regions are free from practices of collusion and illegal levies. Even higher proportions of business operators feel that the business licensing process is operated using an efficient working system, at 84% of all firms. And
Graph 6.4 Cost to Arrange TDP and TDP Cost Perceived as Obstacle,by Province (in Thousands Rp and Percentages)

Survey of Businesses in 245 Regencies/Municipalities in Indonesia
35KPP D
Licensing process is operated using an efficient working system
Licensing services are free from collution practices
Licensing services are free from illegal levies
in certain regions, such as West Papua, over 85% of firms feel that the business licensing services are efficient, free from illegal levies, and free from collusion. The provinces with relatively low proportions of respondents for these three aspects of the quality of business licensing services are Jambi and Banten. Only around half of respondents in these two provinces feel that business licensing is free from collusion and free from illegal levies, and only 66% (in Jambi) and 72% (in Banten) feel they are efficient.
Most business operators arrange their own TDP. This was stated by 77% of firms. Of the others, some arrange TDP through local government officials who do not actually handle business licensing (12%), individual middlemen (4%), commercial service agencies (3%), notaries (3%) and others. A majority (54%) of business operators who arrange
TDP through third parties do so in order to save time. Other reasons given are that they do not know the procedures (22%), feel the procedures are too complicated (20%), or want to save on costs (2%).
6.7 Availability of Complaint Mechanisms
Of the 12,391 business operators interviewed, only 26% are aware of the existence of a mechanism for handling complaints. By province, there are three provinces where reasonable numbers of business operators say they are aware of the existence of a mechanism for handling complaints about business licensing: South Kalimantan (61%), Bangka Belitung (53%) and East Java (49%). In contrast, only 10% of business operators in Jambi and 8% in West Papua are aware of the existence of complaint handling mechanisms.
Business operators’ lack of knowledge about complaint mechanisms may be due to their lack of knowledge about OSS. In the 19 provinces that served as the study regions, overall only 22% of firms are aware of the existence of OSS for business licensing, which are required to have a complaint-handling mechanism. Provinces where firms’ level of knowledge is relatively high (over 40%) are South Kalimantan, West Sumatra, Bangka Belitung and East Java. Business operators in these four provinces also have a higher than average level of awareness about complaint mechanisms.
Graph 6.6 Knowledge about Complaint Handling Mechanisms, by Province (in Percentages)
Graph 6.5 Perceived Quality of Licensing Services (in Percentages)
S Ka
liman
tan
Babe
l
E Ja
va
C Ka
liman
tan
W S
umat
era
Aver
age
Bant
en
Papu
a
N M
aluk
u
NTB
NTT
W S
ulaw
esi
C Su
lawes
i
Mal
uku
Beng
kulu
W K
alim
anta
n
Lam
pung
SE S
ulaw
esi
Jam
bi
W P
apua

2011 Local Economic Governance Report
36
In contrast, business operators’ knowledge about OSS in West Papua, West Sulawesi and Southeast Sulawesi is very low.
6.8 Obstruction Level of Business Licensing for Business Performance
Overall, only 6% of business operators feel that business licensing poses a major constraint to their business performance. In some provinces, such as
licensing is an impediment to their business. In contrast, around 21% of business operators in
hinders their business performance.
6.9 Business Licensing Sub-Index
Gunung Mas (Central Kalimantan) is ranked lowest.because this regency is the second best in TDP ownership and ninth for business licensing
levies and collusion; for the other variables forming this sub-index, it has medium rankings. In contrast, Gunung Mas is ranked 240 out of 245
levies and collusion, and is ranked the lowest for
performance variable.
East Java and South Kalimantan dominate the top 20 for the Business Licensing Sub-Index. No fewer than nine regions in East Java are among the
province with several districts in the top ranks; the regencies of Tapin, Hulu Sungai Selatan, Hulu Sungai Tengah and Tanah Bumbu are ranked number three through seven for this sub-index.
Only one region in Java, and no municipalities, are among the lowest 20 for the Business Licensing Sub-Index. Malang Regency (East Java) is the only region in Java in the “bottom 20” in business licensing. Apart from Malang, all regions in the bottom 20 for this sub-index are located outside
and Southeast Sulawesi “contributing” three regencies each. This may be because most OSS that have been established are located in Java. OSS enables business licensing services to be better in terms of quality of services, certainty of time and
Based on the OSS database issued by the Ministry of Home Affairs, 17 of the 20 regions ranked highest for the business licensing sub-index have established OSS with fairly strong authority. The
strong authority that are among the “top 20” are Biak Numfor (Papua), Mamuju (West Sulawesi) and Bangka Tengah (Bangka Belitung). The other 17 have OSS with the authority to issue permits in various sectors in addition to the basic permits. In contrast, only seven regencies with OSS with strong authority are found in the bottom 20 for the business licensing sub-index. This shows that establishment of an OSS does not in itself guarantee that business licensing services will run well; special attention and effort is required to promote continuous improvement in the quality of business licensing services.
Box 6.1Variables Forming Business Licensing Sub-Index
(2) Perception of ease in obtaining TDP and average time needed to obtain TDP;
impediment to doing business;(4) Perception that business licensing services
illegal levies;(5) Percentage of availability of complaint
mechanisms; and (6) Perception of business licenses as a constraint
to business.

Survey of Businesses in 245 Regencies/Municipalities in Indonesia
37KPP D
Graph 6.7 Business Licensing Sub-Index

2011 Local Economic Governance Report
38

39KPP D
7.1 Background
Local-level regulations are policy instruments that can indicate the local government’s position toward the business community. Law No. 22/1999 on Local Government and Law No. 34/2000 on Local Taxes and Local User Charges grant greater authority to local governments to issue local regulations that can be used to stimulate and provide incentives to, or, conversely, impede the development of business. The consequence is that the excessive “enthusiasm” of local governments to increase locally generated revenue (pendapatan asli daerah, PAD) has created problems for both business operators and the general public.
Since the start of decentralization, more than half of local regulations (peraturan daerah, perda) issued by local governments contain problems, but there has been no effective follow-up. From the beginning of decentralization to the end of 2010, no fewer than 13,622 perda have been sent to the central government. The Ministry of Finance (MOF) has examined 13,252 perda and recommended to the Ministry of Home Affairs (MOHA) that 4,885 of them be revoked. However, so far MOHA has revoked only 1,843 perda; consequently, there are still 3,042 perda for which no follow-up has been undertaken to revoke them, request revision from the local governments concerned, or respond to the MOF recommendation to keep them in effect.
The Government has been trying to control the issuance of perda that create problems for the business community since 2004, but this has not been entirely effective. Reduction of local
7. Local-Level Regulations
governments’ authority to issue perda started with Law No. 32/2004 on Local Government, which requires that certain types of perda, including those relating to Local Taxes and User Charges, be examined beforehand by the provincial and central governments before they become effective. More recently, Law No. 28/2009 on PDRD has further tightened these restrictions. Local governments may only issue perda on local taxes and user charges that are included in a “closed list” stipulated in the Law, while certain levies that had previously been under the authority of the central government were decentralized to the regions.
7.2 Methodology and Variables Forming the Local-Level Regulations Sub-Index
The Local-Level Regulations Sub-Index is derived from the results of analysis guided by three categories of potential problems: principle, substance and judicial references. Unlike the other sub-indexes, which are analyzed based on primary data resulting from interviews with business operators; the analysis of local level regulations is based on the textual content of regulations the that were collected. To analyze the quality of local level regulations, they were assessed using 14 variables categorized into three aspects, namely judicial, substance and principle.
Principle problems receive the greatest weight, followed by substance and legality. The result of the analysis of each regulation was given an assessment weight for each aspect/indicator based on the likelihood of impact on economic activity.

2011 Local Economic Governance Report
40
Judicial problems received the lowest weight (15%) because the impact of legality issues on business operators is not as great as the economic impact of principle and substance problems. Substance and principle problems received greater weights: 35% and 50%, respectively. Table 7.1 shows the 14 variables for assessment of local-level regulations, together with their weightings.
7.3 Characteristics of the Local Level Regulations Studied
The local-level regulations examined include perda and regulations and decrees issued by regents/mayors that relate to economic activity in the regions concerned. These local-level regulations were obtained from the KPPOD database and local government websites, and collected from the local governments. The regulations examined were ones that are still in force, i.e. which have not been
superseded or revoked. In all, 1,480 regulations from 239 regencies/municipalities12 were examined, comprising 1,451 perda, 26 regent/mayor regulations (perbup/perwali) and three mayoral decrees (SK). In terms of year of issuance, the oldest was from 1988 and the most recent from 2010.
The largest numbers of regulations studied were those relating to business licensing. No fewer than 812 (55%) of the regulations examined related to business licensing, including ones dealing with basic business permits such as SIUP, TDP, SITU/HO, TDI and IMB. Other prominent sectors among the regulations studied included livestock and energy. The livestock regulations dealt with matters such as abattoir permits, user charges for livestock inspections and livestock markets, and livestock cards. The regulations on mining and energy dealt with matters such as general mining, quarrying, fuel, water and minerals. Apart from these three sectors, regulations on the agriculture, plantation
Table 7.1 14 Assessment Criteria for Local Level Regulations with Assigned Weight
No. Assessment Variables Weight
Legality
1 Relevance of legal references
15%2 Up-to-date legal references in use
3 Legal completeness
Substance
4 Disconnection of objective and subtance
35%
5 Clarity of objects
6 Clarity of subjects
7 Clarity of rights and obligations of fee payers and local governments
8 Clarity of standards on time, costs and procedures, or rate structure and standards
9 Conformity between philosophy and principles of levies
Principle
10 National economic integrity and the principle of free internal trade
50%11 Healthy competition
12 Negative economic impact
13 Obstacles to public access and public interest (e.g. environment)
14 Violations of governmental authority
_______________________________________________________________12 There was no available regulation from Kepulauan Sula (North Maluku), Boven Digoel, Nabire, Mappi, Sarmi and Asmat (all in
Papua) that can be analyzed.

Survey of Businesses in 245 Regencies/Municipalities in Indonesia
41KPP D
and forestry sector were also studied.
The local-level regulations studied can be categorized into those dealing with taxes, user charges and non-levies. A majority (62%, or 916) of the regulations analyzed dealt with user charges. These included regulations on user charges for business permits such as IMB, SIUP, TDP, and SITU/HO. The second most common type of regulation studied was those that do not impose levies: 380 regulations (26%). The third category, 12%, or 184 regulations, covered taxes on hotels, restaurants, and commodities, birds’ nests, and so on.
Table 7.2 Types and Composition of Local-Level Regulations Examined
No. Type of Regulation Number %
1 TDP 92 6.0%
2 SIUP 104 6.7%
3 HO or SITU 198 12.8%
4 Hotel and Restaurant 60 3.9%
5 IMB 190 12.3%
6 Industry Business Permit (IUI) and TDI 118 7.7%
7 Other business permits 22 1.4%
8 Warehouse Registration Certificate (TDG) 19 1.2%
9 Land 29 1.9%
10 Forestry 67 4.3%
11 Livestock and Animal Husbandry 149 9.7%
12 Agriculture and Plantations 50 3.2%
13 Fishery and Maritime Affairs 83 5.4%
14 Vehicles and Transportation 50 3.2%
15 Labor 60 3.9%
16 Mining and Energy 132 8.6%
17 Products of Regional Businesses 15 1.0%
18 Advertising 37 2.4%
19 Sanitation 16 1.0%
20 Markets 16 1.0%
21 Others 34 2.2%
Total 1,480 100.0%
7.4 Juridical Problems
The assessment of juridical problems covered analysis of three variables. These three variables are: (i) relevance of legal references; (ii) use of the most up-to-date legal references; and (iii) legal completeness.
Of the regulations analyzed, 1,192 (81%) contained at least one problem regarding juridical. The most common type of juridical problem found was failure to use the most up-to-date legal references (72%). Problems with legal completeness were found in 35% of the regulations studied, and problems with relevance of legal references in 9%. This high level of problems relating to use of the most current legal references indicates that most local governments do not update their regulations when there are changes in the associated central
Graph 7.1 Categorization of Local-Level Regulations Studied (in Percentages)
Graph 7.2Juridical Problems on Local-Level Regulations Studied
(in Percentages)
TaxesUser ChargesNon-Levies
Up-to-date legal references in use
Legal completeness
Relevance of legal references

2011 Local Economic Governance Report
42
government regulations. In the context of perda on taxes and user charges, Law No. 28/2009 on Regional Taxes and Regional User Charges was issued in October 2009 and requires such adjustments starting January 2010. In practice, however, very few local governments have come into compliance with this new rule.
The various regulations dealing with basic business permits (TDP, SIUP, SITU/HO and IMB) also have many problems relating to the use of the most current legal references. For regulations on TDP, failure to refer to the most recent legal references was found in 78%, followed by SIUP at 77%, HO (67%) and IMB (71%). With regard to regulations on TDP and SIUP, Minister of Trade Regulation (Permendag) No. 36/2007 and 37/2007 regarding issuance of SIUP and TDP came into force in 2007. From the analysis of 92 regulations on TDP and 104 on SIUP, over 70% of perda do not refer to the provisions of these two Permendag. In practice fees are still often collected from applicants for new SIUP and TDP, for which there should in fact be no charges. Another problem found in regulations on permits relates to legal completeness, such as failure to specify the category of user charges, rate structures and amounts and so on.
In terms of region, Maluku had the fewest regulations containing juridical problems. Of the 49 regulations examined from regencies/municipalities in Maluku, only 6% were found to violate the aspect of relevance of legal references, 14% had problems with use of the most recent legal
references, and 29% were not legally complete. Among the regulations studied from Maluku were five perda issued by the Tual Municipality Government in 2010 that had no legal problems at all. These five perda properly followed the provisions of Law No. 28/2009 on Local Taxes and Local User Charges.
The largest number of juridical problems was found in regulations in the province of Lampung. This study examined 76 regulations issued by municipality/regency governments in Lampung. No fewer than 39% of these regulations were found to have problems with relevance of legal references, 72% had problems with use of the most recent legal references, and 42% had problems with legal completeness. Tanggamus is the regency in Lampung that contributed the greatest number of perda with legality problems. For example, Perda No. 23/2001 on SIUP User Charges and Perda No. 13/2001 on Amendment of Perda No. 5/1999 on IMB User Charges violate all three types of juridical problems.
7.5 Substance Problems
The assessment of substance problems included analysis of six variables. The analysis of local level regulations examined the following six variables: (i) disconnection of objective and subtance; (ii) clarity of objects; (iii) clarity of subjects; (iv) clarity of rights and obligations of fee payers and local governments; (v) clarity of standards on time, costs and procedures, or rate structure and standards; and (vi) conformity between the philosophy and the principles of levies.
Of the 1,480 regulations, 580 (39%) contained at least one type of substance problem. The most common problems found (21%) relate to lack of clarity on procedures, time standards and rates. Lack of clarity on procedures was found most often in perda on business licensing, with procedures on how a certain permit is arranged either unclear or even missing entirely. The second substance problem most often encountered was lack of clarity on rights and obligations of fee payers (12%). Many local level regulations stipulate obligations
Graph 7.3 Juridical Problems on Local-Level Regulations Studied Concerning
Basic Business Permits (in Percentages)
Up-to-date legal references in use
Legal completeness
Relevance of legal references

Survey of Businesses in 245 Regencies/Municipalities in Indonesia
43KPP D
of citizens, but few stipulate citizens’ rights or the obligations of the local governments.
In the regulations relating to basic business permits, the most common substance problems were in clarity of standards on time, costs and procedures. In regulations on TDP and SIUP, 27% and 32% of the problems, respectively, related to clarity of procedures and costs, even though these are the most crucial matters in business licensing services. While the technical procedures could be stipulated separately in regent/mayor regulations or decrees, the time limits and fees should be clearly set forth in the perda itself. Lack of clarity on these aspects can easily give rise to corruption and collusion. Furthermore, complexity of regulations on business licensing services can discourage business operators from complying with the obligation to obtain business licenses for their activities.
The province with the fewest regulations with substance problems is Southeast Sulawesi. Of the 74 regulations analyzed in Southeast Sulawesi, not one perda was found to have problems with conformity between aims and content or with clarity of the rights and obligations of local governments. The problems most often found in Southeast Sulawesi were those relating to standards on time, costs, procedures and rate structure, and these were found in only 17% of all perda in the province. And the other three substance aspects (clarity of objects, subjects, and philosophic conformity) were found in only 3% of the perda analyzed.
North Maluku is the province with the greatest number of regulations with substance problems. Problems with clarity of objects and subjects were found in 31% of the local-level regulations studied in North Maluku. One example of a regulation with multiple substance problems is Halmahera Timur Perda No. 8/2006 on Control of Stockpiling of Processed Wood. This Perda violates all six variables in the substance aspect. The declared purpose of this perda is to control stockpiling of processed wood in order to prevent negative externalities, but the articles it contains are aimed mostly at generating local government revenue through various levies, and even then it is not clear whether these are local taxes or local user charges. This regulation, intended to provide control, does not clearly stipulate the obligations of the local government or the services it provides.
7.6 Principle Problems
The assessment of principle problems comprised analysis of five variables. The five variables are:
Graph 7.4 Substance Problems on Local-Level Regulations Studied (in Percentages)
Clarity of standards on time, costs and procedures,
or rate structure and standards
Clarity of rights and obligations of fee payers and
local governments
Clarity of objects
Conformity between philosophy and principles of levies
Clarity of subjects Disconnection of objective
and subtance
Substance Problems on Local Regulations Studied
Table 7.3 Principle Problems on Local-Level Regulations on Basic Business Permits (in Percentages)
Type of Problem TDP SIUP SITU / HO IMB
Disconnection of objective and subtance 1.1% 1.9% 1.0% 0.0%
Clarity of objects 13.0% 11.5% 6.1% 8.9%
Clarity of subjects 13.0% 11.5% 0.0% 7.9%
Clarity on rights and obligations of fee payers and local governments 13.0% 14.4% 11.1% 9,5%
Clarity of standards on time, costs & procedures, or rate structure & standards 27.2% 31.7% 16.2% 17.4%
Conformity between the philosophy and the principles of levies 15.2% 18.3% 5.6% 4.7%

2011 Local Economic Governance Report
44
(i) territorial integrity of the national economy and the principle of free internal trade; (ii) healthy competition; (iii) negative economic impacts; (iv) obstacles to public access and the public interest (e.g., environment); and (v) violations of governmental authority.
A total of 334 (23%) of the regulations analyzed contained at least one type of principle problem. The most common problem was negative economic impact created by the regulations (17%), followed by violations of governmental authority (5%) and obstacles to public access or violations of the public interest (3%). Principle problems are the most significant type of problems in a perda, as these violations are detrimental to the public or the objects of the regulations.
Regulations on trade on commodities are the type that most often contain principle problems. These include regulations on the plantation, mining, livestock and agriculture sectors. For example, many perda on user charges on produce of oil palm plantations (fresh fruit bunches) are found in South Kalimantan, West Kalimantan and Sumatra. Levies on trade in commodities transported out of a region or between regions are a form of restraint of interregional trade. These violations give rise to multiple levies that can trigger increases in the selling prices of goods and reduce the competitiveness of products.
Central Sulawesi is the province with the fewest local level regulations containing principle problems. Of 77 regulations studied in Central Sulawesi, only three types of principle problems were found: negative economic impacts (7%), obstacles to public access or violations of the public interest, and violations of governmental authority, each at 1%. One regulation in Central Sulawesi that violates the principle of public access or the public interest is Perda of Tojo Una-Una Regency No. 20/2008 on User Charges for Issuance of Permits to Collect Forest Products and Permits for the Use of Wood and Permits for Collection of wood by smallholders‘ users. This regulation on collection of wood from smallholder forests is a type of obstacle to public access to resources and a violation of the public interest, in the form of levies on wood collection activity by the public. Any regulation on this type of activity should not be accompanied by levies that impose a burden on the public, who are in this case the owners of the smallholder forests concerned. Apart from this one perda, however, no significant principle problems were found.
In contrast, principle problems were found most often in regulations in South Kalimantan. Most of the violations in regulations in South Kalimantan related to negative economic impacts. One perda in South Kalimantan that contains several principle problems is Perda of Balangan Regency No. 19/2006 on Management of General Mining Businesses. General mining is actually under the authority of the central government, but through this perda the Balangan government prescribes regulations, thereby violating governmental authority. Further, the regulation also stipulates levies, leading to multiple levies and a negative impact on mining investment.
7.7 Local-Level Regulations Sub-Index
Kubu Raya (West Kalimantan) is in first place, with a sub-index score of 100 followed by Kota Solok (West Sumatra) and Maluku Tengah (Maluku) with sub-index scores of 99. Kubu Raya is the only one of the 239 regions where none of the four perda analyzed contained any problems. Kota Solok and Maluku Tengah were ranked second
Graph 7.5 Principle Problems on Local-Level Regulations Studied (in Percentages)
Negative economic impact
Violations of governmental authority
Obstacles to public access and public interest
National economic integrity and the principle of free internal trade
Healthy competition

Survey of Businesses in 245 Regencies/Municipalities in Indonesia
45KPP D
because in the seven perda analyzed in each of these regions, only one perda in each region was found to have a problem in one of the 14 criteria. In Kota Solok, this was Perda No. 6 /2006 on Street Lighting Tax, which violates the aspect of clarity of standards on time, costs and procedures, or rate structure and standards. In North Maluku, the only perda found to have a problem was Perda No. 10/2009 on User Charges for Construction Service Business Permits (IUJK). Again, the problem lies in the issue of clarity of standards on time, costs and procedures, or rate structure and standards.
In contrast, Kotabaru (South Kalimantan) was ranked lowest. Kotabaru is in the lowest position for the Local Level Regulations Sub-Index because all four of the four perda analyzed were found to have principle problems, specifically violation of governmental authority and negative economic impacts. Apart from these violations of principle, there were also problems with legality and substance. For example, Perda No. 10/2002 on User Charges on Products of Plantation Businesses violates the authority of the local government,
because the same object is also subject to central government taxes, i.e. value added tax (VAT) and export taxes. Levies on plantation products that are being taken out of the district also create obstacles to trade between regions and thus violate the principle of free internal trade, thereby reducing the competitiveness of products. Furthermore, in terms of philosophy, it is inappropriate to assess these user charges, because there is no direct service provided by the local government.
The other regions in South Kalimantan and North Maluku among the lowest 20 share the same types of problems as were found in Kotabaru. Most of the problematic regulations in these two provinces related to principle problems. This was because the objects regulated by the perda are more or less the same, relating to management of natural resources such as agriculture, plantation, mining and forestry. Perda of this type were most often found in localities such as Tapin, Hulu Sungai Utara and Balangan (South Kalimantan) and Halmahera Timur, Halmahera Utara and Kepulauan Morotai (North Maluku).

2011 Local Economic Governance Report
46
Graph 7.6 Local-Level Regulations Sub-Index

Survey of Businesses in 245 Regencies/Municipalities in Indonesia
47KPP D
Note:Local regulations from Nabire, Mappi, Kepulauan Sula, Asmat, Boven Digoel and Sarmi could not be obtained and analyzed. Overall calculation of Local Economic Governance Index for these particular six municipalities did not include Local-Level Regulation Sub-Index.

48

49KPP D
8.1 Background
Official transaction costs include local taxes, user charges and donations legalized by local-level regulations. Local taxes include compulsory levies applied by the local government without any service provided directly in return, while local user charges are fees charged as compensation for certain services provided, or permits issued, by the local government in connection with the interests of businesses. Official third-party contributions (SP3) are various non-compulsory payments made by companies to local government on the basis of mayoral/regental regulations or decrees.
In addition to official transactions, business operators are also burdened by various additional payments for security costs. These illegal costs are paid to police, the military, mass organizations and thugs, thus increasing the expenses that companies must bear. Particularly for businesses involved in transportation, the illegal levies imposed by these parties are quite onerous, especially when added to the official levies already imposed by the relevant government authorities. One case study conducted in NTT in 2010 found that the component of costs borne by trucks transporting goods on several routes came to as much as 17% of the total transportation cost (not including ferry crossing charges); of this amount, 12% was official levies (user charges, port entry fees, parking, SP3) and the remaining 5% was illegal levies.13
8. Transaction Costs
8.2 Obstruction Level of Local Taxes and Local User Charges on Firm Performance
Due to the economies of scale, small businesses tend to pay more taxes and user charges per worker than large companies. The average amounts of user charges and taxes paid each year came to Rp 33 thousand and Rp 42 thousand, respectively, per worker. However, if we examine this in terms of scale of business, micro entrepreneurs pay user charges of Rp 48 thousand/worker/year, while large businesses pay only around Rp 14 thousand/ worker/year. The same tendency also applies for the amount of taxes per worker per year: micro businesses pay Rp 65 thousand, while large businesses pay only Rp 26 thousand.
In terms of business sectors, there is little difference in the amounts of user charges paid by companies, but there are tremendous differences in the amounts of taxes. The user charges paid by business operators in production, trade and service sectors all range between Rp 31 thousand to Rp 36 thousand/worker/ year. On the other hand, businesses in the service sector pay nearly twice as much tax per worker per year as those in the industry and trade sectors, at an average of Rp 62 thousand.
_______________________________________________________________13 Transportation of Goods in Nusa Tenggara Timur: Costs and Problems, LPEM-FEUI and The Asia Foundation, 2010

2011 Local Economic Governance Report
50
Local User Charges Local Taxes
Business operators in urban areas pay much higher local taxes and user charges. On average, business operators in municipalities pay user charges and taxes of Rp 53 thousand and Rp 79 thousand per worker per year, respectively. In contrast, business operators in regencies only have to pay user charges of Rp 28 thousand per worker and taxes of Rp 34 thousand per worker per year. Probably this is because it is easier for governments to administer and collect taxes and user charges in urban areas, as the business operators are more concentrated by location.
Geographical factors influence levels of payment of local taxes and user charges. A significant difference is also seen between business operators in Eastern Indonesia and in the West. Business operators in Eastern Indonesia have to pay Rp
43 thousand/worker/year in user charges, while those in the West pay only Rp 22 thousand. Those operating in Eastern Indonesia also pay higher taxes (Rp 46 thousand/worker/year) than in the West (Rp 37 thousand/worker/year). This may be due to the differences in types of economic activities in the two regions.
Overall, most business operators do not object to their local taxes and user charges, especially in West Sulawesi and Bengkulu. Out of all firms interviewed, only 8% expressed complaints about local user charges and 9% objected to local taxes. Business operators in Bengkulu were the least concerned about local user charges, with only 2% of firms expressing objections. And in certain regencies such as Bengkulu Selatan, Bengkulu Tengah and Pesawaran, no business
Graph 8.1. Level of Objection to Local Taxes and User Charges, by Province (in Percentages)
Table 8.1 Levels of Payment of Local Taxes and User Charges, by Scale and Sector of Business(in Rp/Worker/Year)
Type of Transaction Cost
Scale of Business Business Sector
AverageMicro Small Medium Large Industry Trade Services
User charges/ Worker 47.747 34.934 30.519 14.204 30.510 35.558 33.747 32.849
Taxes/ Worker 65.254 47.878 32.468 25.757 29.980 32.515 61.899 41.923
NTB
Bant
en
S Ka
liman
tan
N M
aluk
u
Babe
l
Jam
bi
W K
alim
anta
n
W P
apua
Papu
a
Mal
uku
SE S
ulaw
esi
Aver
age
E Ja
va
C Ka
liman
tan
NTT
Lam
pung
W S
umat
era
C Su
lawes
i
W S
ulaw
esi
Beng
kulu

Survey of Businesses in 245 Regencies/Municipalities in Indonesia
51KPP D
operators voiced any objections. For local taxes, the proportion of business operators expressing objections in this province is slightly higher, but still only 5.4%. The proportion of business operators in West Sulawesi who complain about taxes is the lowest among the 19 provinces studied, at only 1%. Further, objections to user charges in this West Sulawesi came to only 3%, the second lowest after Bengkulu. In some of the regencies in West Sulawesi, such as Mamuju, Mamuju Utara and Majene, no firms expressed any objections at all to taxes or user charges. However, the level of local taxes and user charges paid in West Sulawesi is also the lowest among all the provinces, at only Rp 17 thousand per worker per year.
In contrast, NTB, Banten and South Kalimantan had the highest proportions of business operators who objected to their local user charges and taxes. The proportions of business operators in these three provinces who feel their local user charges are a burden are nearly 16%, while those who object to local taxes range from 16% (South Kalimantan) to 18% (Banten). Kota Mataram (NTB) is the region with the most business operators objecting to their payments of local taxes and user charges, at 46%, followed by Bombana (Southeast Sulawesi) at 44%, Banjar (South Kalimantan) at 30% and Kota Tangerang (Banten) at 31%.
In the three provinces also studied in 2007, the level of objection to user charges has declined, though the level of objection to taxes rose in NTB. In the 2007 LEG study, 24% of business operators in NTB objected to the user charges they in paid, while in this study only 16% objected. Similar declines in objections to user charges were seen in
East Java and NTT, though the declines were not so significant as in NTB. The trends for level of objection to local taxes varied: the views of business operators in East Java remained much the same; in NTT, fewer objected; and in NTB, more objected.
The 2011 qualitative study on LEG in East Java demonstrated the positive impact of Law No. 28/2009 on Local Taxes and Local User Charges. In Jombang Regency, 30 types of permits have been exempted from user charges since 2009. As a result, the proportion of types of permits in this regency that have no user charges is now greater than those with user charges. In 2010, the Regent of Tuban issued a decree exempting 32 objects from taxes.
8.3 Official Costs for Inter-regional Commodity Distribution Activities
On average, 48% of business operators acknowledged paying official costs for distributing commodities between regions. In addition to these official costs, 26% of business operators also have to pay unofficial costs when they transport goods between regions. Banten was the only region where 100% of business operators stated they pay both official and unofficial costs when transporting goods between regions. This is probably due to the high intensity of movement of goods to and from the port of Merak and industrial zones in Banten. In contrast, very few business operators in Bangka Belitung said they paid official or unofficial costs for commodity distribution. As a general tendency, island regions pay lower commodity distribution costs. This is because in these regions, most of the markets or customers for the firms’ business activities are located in the same district, or even the same sub-district (kecamatan), so they rarely transport goods between regions.
Business operators in municipalities and in Western Indonesia generally pay higher costs for transporting goods between regions than those in regencies and in the East. The official and unofficial commodity distribution costs borne by business operators in urban areas average over Rp 5 million, while the amount paid by those doing business in regencies averages Rp 3.3 million. The official
Table 8.2 Level of Objections to Local User Charges and Local Taxes, for East Java, NTB and
NTT, 2007 and 2011 (in Percentages)
ProvinceObjection to User Charges Objection to Taxes
2007 2011 2007 2011
E Java 11.1% 7.4% 11.4% 11.3%
NTB 24.0% 15.8% 13.3% 16.5%
NTT 6.6% 5.1% 10.6% 8,0%

2011 Local Economic Governance Report
52
and unofficial commodity distribution costs paid by businesses in Western Indonesia (total Rp 4.5 million) are also higher than in Eastern Indonesia (Rp 3.2 million). This may be because the distances covered and the mobility of business operators in municipalities and in Western Indonesia are greater than in regencies and in Eastern Indonesia. Municipalities and Western Indonesia are pass-through areas for commodity distribution, and businesses in these places also distribute goods to the surrounding areas. This is probably why business operators in municipalities tend to pay higher commodity distribution costs. It should be noted that, as can be seen in Table 8.3, the median for commodity distribution costs is very different from the average, indicating that some business operators pay much more than others.
8.4 Level of Payment of Donations to Local Governments
The amounts of business operators paying donations to local governments varies greatly among the 19 provinces, but the proportions of firms who object to this are low in all provinces. Two out of three firms interviewed in Central Sulawesi admitted paying donations – usually in the form of “Third-Party Contributions” (SP3) – to their local governments. In contrast, only 10%-11% of firms in Bengkulu, South Kalimantan and West Sulawesi paid such donations. Even so, overall only
7% of firms objected to paying these donations. The variation between provinces in this regard is also low, ranging from a minimum of 2% of business operators (South Kalimantan) to a maximum of 13% (Maluku). This indicates that most business operators are fairly “permissive” in that they do not object to donating to their local governments in forms other than taxes and user charges.
At the district level, Ende in NTT is the region with the most business operators paying donations to local governments, at 96%. Other regions with high levels of payment of donations to local governments are Lamongan (East Java) at 94%, followed by Katingan (South Kalimantan) at 92% and Halmahera Timur (North Maluku) at 90%. Apart from these regions, six regencies in West Sulawesi also have quite high levels of payment of donations to local governments. Banggai is the highest of these six regencies, at 79%; the levels of donation payments in Buol, Parigi Moutong, Morowali, Tojo Una-Una, and Toli-toli, are 68%, 70%, 72%, 77% and 78%, respectively.
Fewer business operators in NTT and in East Java admit paying donations to their local governments. While in 2007, around 35% paid such donations in NTT, in 2011 the figure had slightly declined to 33%. Similarly, the number of business operators in East Java who said they paid donations to the government decreased from 46% to 42%. In contrast, the proportion of business operators in
Table 8.3 Official and Unofficial Commodity Distribution Costs, by Regional Characteristics and Locations (in Rupiah)
Official distribution costs Unofficial distribution costs
Average Median Average Median
Regional Characteristics
Regencies 2.094.686 300.000 1.180.054 100.000
Municipalities 2.551.475 240.000 2.567.064 300.000
Locations
Eastern Indonesia 1.984.255 300.000 1.238.859 100.000
Western Indonesia 2.550.006 240.000 1.982.672 300.000
Average 2.189.907 250.000 1.517.104 150.000

Survey of Businesses in 245 Regencies/Municipalities in Indonesia
53KPP D
NTB paying such donations more than doubled, from 16% to 39%. However, despite this increase in payments, the proportion of business operators in NTB who objected to paying these donations actually fell significantly, from 24% in 2007 to only 4% in 2011. The changes in East Java and NTT were not significant, at around 7% and 3% of firms objectivy the donations.
8.5 Security Costs
In addition to official transaction costs (taxes, user charges and donations), business operators also pay various “security costs”. Around 13% of business operators interviewed asserted that they pay security costs to mass-based organizations. This figure is roughly the same with the result of the 2007 LEG study. Furthermore, at least 11% of business operators also make additional payments to the police. As well as these two institutions, around 3%-4% of firms said they made such payments to local government officials, the Armed Forces (TNI), and hoodlums to “guarantee” the security of their businesses.
Business operators object more to paying “security costs” to hoodlums than to mass organizations. Around a third of firms who make such payments said they objected to paying security costs to hoodlums. In contrast, though the level of payments to mass organizations is relatively high, only 5% of business operators objected to these additional costs. The levels of firms’ objections to payments of security costs to the police, local government officials and TNI are roughly the same, at around 20%.
The qualitative study also found that business operators are fairly permissive with regard to transaction costs. Most of the business operators
Graph 8.2 Payments and Objecting to Payments of Donations to Local Governments, by Province (in Percentages)
Graph 8.3 Paying and Objecting to Additional Security Costs (in Percentages)
C Su
lawes
i
N M
aluk
u
W P
apua
Bant
en
E Ja
va
NTB
C Ka
liman
tan
Papu
a
NTT
Aver
age
Lam
pung
Jam
bi
W K
alim
anta
n
SE S
ulaw
esi
W S
umat
era
Mal
uku
Babe
l
W S
ulaw
esi
S Ka
liman
tan
Beng
kulu
Paying Donations Objecting to Donations
Paying Additional Security Costs Objecting to Additional Security Costs
Mass-based Police Local Government Military HoodlumsOrganizations Officials

2011 Local Economic Governance Report
54
interviewed felt that the transaction costs they pay are still reasonable and do not reduce their competitiveness. They also feel that most of these transaction costs are based on local regulations that should be complied with. Similarly, the various contributions paid to village governments through the neighborhood associations (RT/RW) for celebrations of national or religious holidays are also felt to be within reasonable limits.
8.6 Impact of Transaction Costs on Business Activities
A majority of business operators do not feel that transaction costs impede their business activities. Only 4% of business operators feel that transaction
costs are an impediment. The largest proportions of business operators who feel that taxes, user
impeded their business performance are in Southeast Sulawesi and Banten, and even then the
Sulawesi are places where the largest numbers of business operators complain about the impact of transaction costs on their business activities are Bombana, Wakatobi and Buton, where 38%, 28% and 23%, respectively, of business operators say that transaction costs are a constraint to doing business. The region in Banten where the impact of transaction costs is most strongly felt is Serang, at 22%.
8.7 Transaction Costs Sub-Index
Kolaka Utara (Southeast Sulawesi) and Sumba
transaction costs sub-index with sub-index scores of 100, while Serang (Banten) has the lowest ranking
variables calculated for this sub-index. In contrast, Serang received a sub-index score of only 44.2. This regency was ranked lowest for this sub-index because it received very poor assessments from
Graph 8.4 Obstruction Level of Transaction Costs, by Province (in Percentages)
Box 8.1 Variables Forming Transaction Costs Sub-Index
performance;(2) Level of donation payments to local
governments;(3) Obstruction level of donations to local
(4) Level of informal payments to police; and
performance.
SE S
ulaw
esi
Bant
en
Mal
uku
NTB
C Su
lawes
i
Jam
bi
W S
umat
era
Aver
age
W K
alim
anta
n
W P
apua
Papu
a
C Ka
liman
tan
N M
aluk
u
E Ja
va
Beng
kulu
NTT
Babe
l
Lam
pung
S Ka
liman
tan
W S
ulaw
esi

Survey of Businesses in 245 Regencies/Municipalities in Indonesia
55KPP D
business operators for nearly all the variables forming this sub-index.
Nearly all regencies/municipalities in the province of Banten are among the 20 lowest for this sub-index. Of the eight regencies/municipalities in this province, six are ranked between 234 and 245. Apart from lowest-ranked Serang, three other districs – Kota Tangerang, Tangerang Regency, Kota Tangerang Selatan, Lebak and Pandeglang – also displayed poor performance in transaction costs. The other two regions in Banten, Kota Cilegon and Kota Serang, also received fairly low rankings of 186 and 206.
In contrast, five districts in NTT and four in South Kalimantan were among the 20 highest. Apart from Sumba Barat Daya, which received the highest
ranking, four other regions in NTT received very high scores: Ngada, Sumba Timur and Alor, ranked six through eight and Sumba Barat in position 14. Apart from NTT, South Kalimantan also contributed four regencies/municipalities to the top 20 list for the transaction costs sub-index. Balangan was ranked fourth, while Kotabaru, Tabalong and Hulu Sungai Utara occupied rankings 11 to 13.
Urban areas tend to have low scores for the transaction costs sub-index. Not only are there no municipalities among the 20 regions ranked highest for this sub-index; the statistical average for municipalities tends to be worse than for regencies. The average sub-index for regencies is 83%, compared with only 74% for municipalities.

2011 Local Economic Governance Report
56
Graph 8.5 Transaction Costs Sub-Index

Survey of Businesses in 245 Regencies/Municipalities in Indonesia
57KPP D

58

59KPP D
9.1 Background
The performance government, besides being influenced by systems and institutions, also depends greatly on the government officials who operate these systems. A properly institutionalized system can set strong limits and guidelines to minimize misconduct by its officials. On the other hand, in a weak system, the operating officials can ignore the restraints imposed by the system. Several studies have revealed the importance of the role of regents/mayors (bupati/ walikota) in governance. The results of the 2007 JPIP study in East Java found that the decision makers who brought about innovations in the regions were mostly regents/mayors, at up to 73.2%. Similarly, KPPOD (2005) found that the integrity of regents/mayors has a critical impact on a region’s attractiveness for investment.
Through various laws and regulations, the central government has declared its political will to combat corruption.The Government has passed Law No. 28/1999 on Conduct of State Administration that is Clean and Free from Corruption, Collusion and Nepotism and Law No. 31/1999 as amended by Law No. 20/2001 on Eradication of Corruption Crimes. These policies are complemented by the existence of the Corruption Eradication Commission (KPK) as stipulated in Law No. 30/2002 on the Commission for Eradication of Corruption Crimes.
9. Capacity and Integrity of Regents/Mayors
9.2 Understanding by Regents/Mayors of Business Problems and Professionalism of Local Government Officials
In general, business operators have a fairly high level of trust in their regents/mayors. Around 64% of all firms believe that their regents/mayors have a good understanding of the problems of the business community. The same proportion of business operators, 64%, feels that local government officials are placed properly and professionally. As shown in Graph 9.1, there is a strong tendency that when the regent/mayor is felt to have a good understanding of business problems, he/she is also felt to place local officials professionally.
Jambi, Maluku and West Kalimantan are the provinces with the lowest proportions of business operators believing that their regents/mayors understand the problems of the business community and place officials professionally. Business operators in Jambi have the lowest level of trust in their regents/mayors. Only 44% of business operators believe that their regents/mayors understand the problems of the business community, and 42% believe that their regents/mayors place officials professionally. Other provinces with low levels of trust from business operators are Maluku and West Kalimantan. While more than half of business operators in Maluku feel that their regents/mayors understand business problems, only 45% of firms believe that local government officials have been placed professionally. Meanwhile, half of business

2011 Local Economic Governance Report
60
Rege
nts/
May
ors
Selec
ted
Loca
l Gov
ernm
ent O
fficia
ls Pr
ofes
siona
lly (P
erce
ntag
es)
Regents/Mayors Understand Business Problems (Percentages)
operators in West Kalimantan feel that their regents/mayors understand the problems of the business community, and 55% feel they have placed officials properly.
In contrast, business operators in West Papua, Bangka Belitung, Lampung and Southeast Sulawesi have very high levels of trust in their regents’ understanding of the business community and professional placement of officials. Regents/mayors in West Papua enjoy the greatest trust from business operators in these two aspects, at 89% and 81%, respectively. Meanwhile, business operators’ level of trust in their regents and mayors in the other three provinces is generally around 79%
for both understanding of business problems and professional placement of civil servants.
In the three provinces that were also surveyed in 2007, there have been no significant changes in East Java and NTB, but the approval rate of regents/mayors is now lower in NTT. The perceptions of business operators in East Java and NTB in 2011 regarding their regents’/mayors’ understanding of the business community and professional placement of officials have not changed greatly since 2007. On the other hand, business operators in NTT seem to have less trust in their regents/mayors now than four years ago. Only 62% of business operators in NTT said that their regents/mayors
Table 9.1 Comparison of Business Operators’ Perception of the Leadership and Integrity of Regents/Mayors, for East Java, NTB and NTT, 2007 and 2011 (in Percentages)
Province
Regents/Mayors have good understanding of business community
problems
Regents/Mayors place officials professionally
Regents/Mayors act firmly against corruption
by subordinates
Regents/Mayors do NOT engage in activities for
personal gain
Regents/Mayors are strong figures, admired, and worthy of emulation
2007 2011 2007 2011 2007 2011 2007 2011 2007 2011
E Java 62.8 61.6 66.1 61.4 65.6 71.2 67.0 65.7 83.1 77.8
NTB 65.9 62.6 66.1 67.8 61.5 72.4 43.1 67.4 73.0 79.5
NTT 84.7 61.5 83.6 62.8 66.5 62.6 68.6 63.6 91.0 77.3
Graph 9.1 Understanding by Regents/Mayors of Business Problems and Regent/Mayors Selected Local Government Officials Professionally, by Province (in Percentages)

Survey of Businesses in 245 Regencies/Municipalities in Indonesia
61KPP D
have a good understanding of their problems, down from 85% in 2007. And their confidence that their regents/mayors have placed public officials based on their professionalism has also declined, from 84% in 2007 to 63% in 2011.
9.3 Attitude and Character of Regents/Mayors toward Corruption
Two out of three business operators feel that their regents/mayors act firmly against their staffs who engage in corruption. In terms of regions, business operators in three provinces in Sulawesi (Central Sulawesi, Southeast Sulawesi and West Sulawesi) and West Papua have very high levels of confidence – over 80% - which their regents/mayors act resolutely against civil servants who engage in corruption. In contrast, less than 50% of firms in Jambi and Papua feel this way.
The integrity of regents/mayors is judged to be good by 66% of business operators. In Bangka Belitung, West Sulawesi, Central Sulawesi and North Maluku, more than 80% of business operators feel that their regents/mayors do not engage in acts for their own personal gain. In contrast, only 43% of business operators in Papua feel that their regents/mayors have strong integrity. A similar situation
Graph 9.2 Regents/Mayors do NOT Engage in Activities for Personal Gain and Regents/Mayors Act Firmly Against Corruption by Staffs, by province (in Percentages)
prevails in Lampung and Maluku, where around half of firms believe that their regents/mayors seek personal gains.
The resoluteness of regents/mayors in fighting corruption by their staffs does not always reflect their own integrity. As shown in Graph 9.2, there is no significant correlation between these two variables. Over 80% of business operators in West Sulawesi and Central Sulawesi believe that their regents/mayors do not act for personal gain and do act firmly against civil servants engaged in corruption. In contrast, less than 50% of business operators in Papua agree with these two statements. However, in quite a few regions there is no correlation between these two variables. In Bengkulu, for example, the level of trust in the integrity of regents/mayors is quite high (71%), but only 53% of business operators feel that their regents/mayors act firmly against corruption by their subordinates. In Lampung, these figures are somewhat reversed: only 51% of business operators believe that their regents/mayors have integrity, but two out of three firms believe that they act firmly against staffs engaged in corruption.
More business operators in NTB feel that their regents/mayors have integrity and act firmly against corrupt officials now than in 2007. As can
Regents/Mayors do not engage in activities for personal gain (percentages)
Rege
nts/M
ayor
s ac
t firm
ly a
gain
st c
orru
ptio
n by
sub
ordi
nate
s

2011 Local Economic Governance Report
62
be seen in Table 9.1, in general, there is no great difference of the views of business operators in East Java and NTT on these two variables between the results of the 2011 LEG study and that in 2007. However, in NTB the figures have increased quite significantly. While in 2007 only 43% of firms stated that their regents/mayors have strong integrity, in 2011 67% of firms agreed with this statement. A similar situation prevails for the statement about firm action by regents/mayors against corrupt staff. Around 72% of business operators feel that regents/mayors act resolutely in 2011, up from 62% four years before.
9.4 Leadership Character of Regents/Mayors
Most business operators feel that their regents/mayors have strong leadership character. Overall, more than three out of four business operators feel that their regents/mayors have strong character, are admired, and are worthy of emulation. In West Papua, over 90% of business operators interviewed made these statements. In contrast, the regions with the lowest level of confidence in the leadership character of regents/mayors (57%-60%) were in Maluku, Jambi and Papua.
As shown in Table 9.1, fewer business operators in NTT and East Jawa feel that their regents/mayors have strong leadership character. Based on the results of the 2007 LEG study, no less than 91% of business operators in NTT felt that their regents/mayors had strong leadership character, were admired, and were good role models. This confidence level slipped to only 77% in 2011. A similar though less significant decline also occurred in East Java, from 83% (2007) to 78% (2011). In contrast, more business operators in NTB feel that their regents/mayors have strong leadership character in 2011 (80%) than four years previously (73%).
9.5 Capacity and Integrity of Regents/Mayors as Obstacles to Business Performance
Overall, the capacity and integrity of regents/mayors is not considered a major constraint for the performance of businesses in the regions. Only 5% of business operators feel that the performance of their companies is impeded by the capacity and integrity of their regents/mayors. This can be interpreted as meaning that most of the regents/mayors in the regions examined in this study provide adequate support for the performance of businesses in their regions.
Graph 9.3 Leadership Character of Regents/Mayors, by Province (in Percentages)
W P
apua
C Su
lawes
i
C Ka
liman
tan
SE S
ulaw
esi
Babe
l
W S
ulaw
esi
Lam
pung
S Ka
liman
tan
NTB
Bant
en
E Ja
va
NTT
Aver
age
W S
umat
era
N M
aluk
u
Beng
kulu
W K
alim
anta
n
Papu
a
Jam
bi
Mal
uku

Survey of Businesses in 245 Regencies/Municipalities in Indonesia
63KPP D
Graph 9.4 Sources of Information in Regards to Behavior of Regents/Mayors (in Percentages)
9.6 Sources of Information regarding Behavior of Regents/Mayors
Local mass media are the main source of information for business operators to know about the quality of their regents/mayors. No
from the local mass media. Interaction with other business operators is another important source of information to learn about the quality of and behavior of regents/mayors, used by 30% of business operators. Although involvement in government projects is a source of information for
for business operators in West Papua; 18% of respondents in this province obtain information on the capacity and integrity of their regents/mayors from this source.
9.7 Capacity and Integrity of Regents/Mayors Sub-Index
Four regencies each in the provinces of Southeast Sulawesi and West Papua are ranked in the top 20 for the capacity and integrity of regents/mayors
sub-index. Three regencies in Southeast Sulawesi are in the top positions for this sub-index: Buton
seven. Another province with quite a few regencies earning high rankings for this sub-index is West Papua: Sorong, Sorong Selatan and Manokwari hold positions nine through eleven, and Teluk Wondama is number 19. The fairly high proportion of respondents involved in government projects in West Papua (18%, compared with only 6% of all respondents in the study) may be why business operators in this province have such positive assessments of their regents.
In contrast, four regencies in each of the provinces of Papua and NTT are among the 20 regions ranked lowest for the capacity and integrity of regents/mayors sub-index
between 231 and 241, among the lowest of all the regencies/municipalities studied. Several regencies in NTT were also in the bottom 20: Rote Ndao in
Tengah Selatan at 230 and 234. The regency with the lowest ranking for this sub-index is Merangin in Jambi, with a sub-index score of only 14.9, far below
Box 9.1 Variables Forming Capacity and Integrity of Regents/Mayors Sub-Index
problems of the business community;
(3) Acts committed by regents/mayors for personal gain;
(4) Resoluteness of regents/mayors against corruption by subordinates;
(5) Leadership character of regents/mayors; and
obstacles to business performance.
Local mass media
Interaction with other businesspeople
Head of business met withmayor/regent several times
Several involvement in government projects
Business association
Others

2011 Local Economic Governance Report
64
Graph 9.5 Capacity and Integrity of Regents/Mayors Sub-Index

Survey of Businesses in 245 Regencies/Municipalities in Indonesia
65KPP D

66

67KPP D
10.1 Background
Communication between business operators and government is essential to build constructive interaction. Unfortunately, the nature of the interaction between local governments and the business community is not always constructive. Businesses often complain that the local government makes policy without consulting them, sometimes giving rise to the implementation of distortionary or damaging local charges and regulations. Local governments often do not perform well in providing public services or are seen as only being interested in generating as much local government revenue as possible through taxes, user charges and other levies, and are felt not to understand the needs of the business community. Moreover, it is sometimes claimed that local governments are biased towards particular local business groups, favoring them over other business people in the community.
The communication forums between local governments and business operators that have been introduced in many regions provide a means of interaction and communication. These communication forums provide a formal mechanism for business involvement in the process of drafting local government policies, especially as related to development of the local business climate. Communication forums enable dialogue between different interests regarding all policies that will be or need to be formulated by the government.
10. Local Government and Business Interaction
10.2 Awareness of Communication Forums
Most business operators are not aware of the existence of a communication forum. These forums, which are expected to serve as a bridge between governments and the business community to discuss and resolve the problems of businesses, are known by 28% of firms. West Sumatra has the highest proportion of business operators (41%) who know about the existence of a communication forum. In contrast, almost no business operators in West Sulawesi are aware of the existence of such forums – only 7% of firms know about them.
Business operators in urban areas are more likely to know about communication forums than those in regencies, and the larger the scale of business, the greater the awareness of existence of a communication forum. Around 40% of firms in urban areas know about communication forums, while only one out of four business operators in regencies knows about them. This study also found that scale of business correlates with level of knowledge about communication forums. Large business operators are much more likely to know about communication forums (46%) than micro entrepreneurs (14%). This indicates that the communication forums operated by local governments still have not reached the micro and small businesses that are in fact their intended targets.

2011 Local Economic Governance Report
68
Micro Small Medium Large Regency Municipality
W S
umat
era
W P
apua
C Su
lawes
i
Babe
l
E Ja
va
Papu
a
Bant
en
Mal
uku
NTT
Aver
age
C Ka
liman
tan
N M
aluk
u
Beng
kulu
NTB
Lam
pung
W K
alim
anta
n
S Ka
liman
tan
Jam
bi
SE S
ulaw
esi
W S
ulaw
esi
The communication forum in Kota Kediri is the best known by business operators. A total of 92% of business operators in Kota Kediri know about the existence of this communication forum. Apart from Kota Kediri, there are five other regions in East Java where fairly high numbers of business operators know about the communication forums with the local governments: Trenggalek (77%), Kota Probolinggo (70%), Lumajang (64%), Tulungagung (62%) and Kota Batu (57%).
Among the 20 regions with the highest levels of knowledge about communication forums,
eight are municipalities. The opposite is true for regencies. Communication forums between business operators and local governments are totally unknown in 15 regencies, of which four are located in Maluku and three in SE Sulawesi.
10.3 Level of Business Problem Solving by Local Governments
It is felt that local governments do not play an adequate role in helping to solve problem of the business community. Overall, 43% of business operators do not agree with the statement that their local governments provide concrete solutions to the problems that they face. Nearly half of firms do not feel that the solutions provided by local governments meet their expectations, and they are not confident that the problems of the business community will be followed up by their local governments.
Business operators in West Papua have the highest confidence in their local governments’ support for business. Overall, 82% of business operators in West Papua state that they believe their regents/mayors provide genuine solutions to problems, and 75% feel that the solutions provided by the local governments are in line with their expectations. Further, 81% of business operators express confidence that the relevant agencies will
Graph 10.2 Level of Awareness of Communication Forum, by Scale of Business and
Region Characteristics (in Percentages)
Graph 10.1 Level of Awareness of Communication Forum, by Province (in Percentages)

Survey of Businesses in 245 Regencies/Municipalities in Indonesia
69KPP D
always follow up on the solutions provided by their regents/mayors. All regions in West Papua have strong levels of trust; the number of business operators agreeing with these statements range from 70% (Kainama) to a high of 97% (Sorong). Sorong is the region in West Papua with the highest level of confidence in regents/mayors and local governments; the average for the three variables above comes to 97%. Nevertheless, Sorong is ranked third for this parameter, below Buton and Buton Utara in Southeast Sulawesi, which both have confidence levels of 99%.
On the other hand, business operators in Jambi have very low confidence in local government support for business. These low levels of confidence from business operators in Jambi apply for both regents/mayors and local government officials, with confidence levels ranging only between 35% and 38%. The lowest confidence level in Jambi is in Tanjung Jabung Timur, where on average only 9% believe that their regent provides concrete solutions to problems. Even worse, only 6% of business operators in Tanjung Jabung Timur believe that these solutions will be followed up by the regent’s staffs. Yet the overall confidence level of business operators in Tanjung Jabung Timur is still slightly better than in Rote Ndao (average 9%) and in Seram Bagian Barat (5%).
10.4 Level of Local Government Support for Business
A fairly high proportion of business operators feel that their local governments do not understand the needs of the business community or even try to understand these needs. Around 58% of micro entrepreneurs feel that their local governments understand their needs. This figure is lower than the proportions of medium and large businesses – only 62% and 68% – who feel their local governments understand their needs. This indicates that local governments’ orientation to support small-scale enterprises has not really been noticed by the entrepreneurs. Around half of business operators are aware that their local governments have held meetings to discuss business problems and that the local governments hold public consultations on policies that they (plan to) undertake. There is no significant difference between different scales of business for these two questions.
Business operators feel that local governments do not “disrupt” the private sector, but neither do they provide very much help. Around three out of four firms feel that local governments do not form companies that could be detrimental to the private sector. In this area, the assessment by large-scale business operators is better: 80% feel that local governments do not establish companies
Table 10.1 Level of Trust in Local Government Support to Business Operators, by Province
(in Percentages)
Province
Regents/Mayors Provide
Concrete Solutions to
Problems
Solutions Are in Line with
Business Operators’
Expectations
Relevant Agencies Always Follow Up on Solutions Determined by
Regents/Mayors
Bengkulu 57 55 65
Jambi 38 33 35
W Sumatra 50 44 44
Lampung 72 70 71
Babel 70 62 64
Banten 43 37 45
E Java 56 47 48
NTB 60 52 54
NTT 59 54 55
W Kalimantan 44 35 38
S Kalimantan 62 55 55
C Kalimantan 62 53 55
SE Sulawesi 67 63 65
C Sulawesi 65 63 67
W Sulawesi 61 51 48
Maluku 46 41 40
N Maluku 50 52 46
Papua 48 45 46
W Papua 82 75 81
Average 57 51 53

2011 Local Economic Governance Report
70
that create unhealthy competition with the private sector, while 69% of micro entrepreneurs express this view. However, around 55% of firms feel that local governments provide facilities that support business development. In this regard, it is also noted that more operators of medium-scale and large businesses state that local governments provide such facilities than operators of micro and small businesses.
Business operators’ views on the commitment of their local governments to promote investment
vary widely among provinces. The highest level of confidence from business operators for their local governments is in Bangka Belitung with regard to investment promotion and not collecting money from the private sector; no less than 80% of firms stated these opinions. Considerably below this are the second and third ranked provinces, Nusa Tenggara Timur (NTT) and Southeast Sulawesi, where 64% of business operators believe their local governments are committed to supporting investment. In contrast, local governments in Bengkulu have the lowest level of
Table 10.2 Assessment of Local Governments Support for the Business Community, by Scale of Business (in Percentages)
Forms of Local Government SupportScale of business
AverageMicro Small Medium Large
Understands the needs of the business community 57.6 57.0 61.9 67.9 59.2
Holds public consultations 48.0 49.1 53.5 58.6 51.1
Holds meetings with the business community to discuss their problems 46.3 47.7 51.9 58.9 49.6
Does not establish companies that might be detrimental to private business activity
68.6 73.0 76.6 79.8 74.5
Provides facilities that support business development 47.2 52.4 57.9 59.4 54.6
Graph 10.3 Assessment of Local Government Commitment to Promoting Investment, by Province (in Percentages)
BabelNTT
SE SulawesiC Sulawesi
W PapuaNTB
W SumateraC Kalimantan
W SulawesiE Java
AverageN Maluku
BantenLampung
PapuaJambi
W KalimantanMaluku
S KalimantanBengkulu
Local governments do nothing to promote investment, simply extract revenue from the private sectorInvestment promotion and collecting money from the private sector
Investment promotion at the minimum
Investment promotion and not collecting money from the private sector

Survey of Businesses in 245 Regencies/Municipalities in Indonesia
71KPP D
business confidence regarding local government commitment toward investment. And around 30% of firms in the two provinces of Maluku feel that their local governments do nothing to promote investment, but simply extract revenue from the private sector.
10.5 Level of Non-Discriminatory Local Government Policies
Overall, 58% of business operators feel that local governments have created equal opportunities, though some of them feel that local governments still tend to favor certain businesses. In contrast, around 14% of business operators feel that local governments do not create equal opportunities. In terms of region, local governments located in Kalimantan Tengah and Jambi are perceived as the most discriminatory among the 19 provinces examined. In contrast, local governments in West Papua are perceived by 54% of firms as having created equal opportunities. If we add to this figure those who feel that local governments still slightly favor certain businesses, nearly 80% of business operators in this new province feel that their local
governments’ policies are non-discriminatory.
10.6 Level of Local Government Policies’ Influence on Business Expenditures and Level of Uncertainty for the Business Community
Three out of four business operators state that local government policies do not cause an increase in their business expenditures. The highest level of trust in this regard is in Sulawesi Tengah, at 87%. In contrast, the regions where local government policies are perceived as increasing business expenditures are in Maluku, where fewer than 50% of business operators agree that local government policies lead to higher business expenditures.
Nearly 70% of business operators state that local government policies do not lead to uncertainty in doing business. A majority of business operators in Bangka Belitung (85%), in Lampung (82%) and in Central Sulawesi (81%) agree that local governments in their regions do not produce policies that lead to uncertainty. Regions where
Graph 10.4 Assessment of Non-Discriminatory Local Government Policies, by Province (in Percentages)
C KalimantanJambi
BantenBabel
C SulawesiS Kalimantan
PapuaE Java
NTTAverage
MalukuNTB
W SumateraN MalukuLampungBengkulu
W KalimantanSE SulawesiW Sulawesi
W Papua
Created equal opportunities Slightly favor certain businesses
Tend to favor certain business, with minimum policies in creating equal oppurtunities Not creating equal opportunities

2011 Local Economic Governance Report
72
business operators perceive a high fairly level of uncertainty from local government policies include
in these provinces, only around 50% of business operators feel that the policies produced by local governments do not give rise to uncertainty.
10.7 Obstruction Level of Interaction between Local Governments and Businesses
Businesses in the regions can grow without support from local government policies, as long as they are not disrupted by destructive local government “policies”. This study found that most of the policies produced by local governments relating to the business community have not had a positive
quality of interaction between business operators and local governments disturb their business performance. In general, only 14% of business operators state that local government policies have not been able to encourage development of businesses in the regions. But, on the other hand, only 8% of business operators stated that interactions between local governments and
businesses disrupt the performance of their companies.
There is a tendency that the larger the scale of business, the greater the positive impact of local government policies. Large companies provide more favorable responses than small business operators regarding the positive impact of local government policies on their companies. Among large companies, 22% feel that local government policies have a positive impact, compared with only 12% of micro enterprises.
10.8 Local Government and Business Interaction Sub-Index
There are enormous differences in the conditions of local government and business interaction, both between one region and another within the same province and between provinces. In East Java, four regencies/municipalities are among the top 20 for
in East Java – Malang and Pasuruan – are in the bottom 20. This shows that regions within the same
Table 10.3 Positive Impact of Local Government Policies and Interaction Between Local
Governments and Business Operators for Firm Performance, by Scale of Business (in Percentages)
Scale of Business
Local Government Policies Have Positive
Impact on Business Development
Interaction between Local Governments and
Business Operators Impedes Firm Performance
Micro 12.4 8.1
Small 12.1 8.8
Medium 16.6 7.5
Large 21.5 6.3
Average 14.1 8.2
Box 10.1Variables Forming Local Government and Business Interaction Sub-Index(1) Existence of a communication forum between
local governments and business operators;(2) Level of business problem solving by local
governments;(3) Level of local government support for local
businesses;(4) Level of local government policies oriented
toward improving the investment climate;(5) Level of non-discriminatory local government
policies;(6) Impact of local government policies on
business expenditures;
on business; and(8) Obstruction level of interaction between local
government and businesses.

Survey of Businesses in 245 Regencies/Municipalities in Indonesia
73KPP D
province can differ greatly in the relationships between business operators and local governments.
Kota Probolinggo is ranked first among the 245 regions surveyed. In the 2007 LEG study, Kota Probolinggo was also ranked first among the regions in East Java (and also higher than regencies/municipalities in NTT and NTB). Kota Probolinggo succeeded in maintaining this top position despite not being the best in any of the 12 variables forming the Interaction between Local Governments and Business Operators Sub-Index, though on average it had good scores in all these variables. The aspect that still requires improvement in Kota Probolinggo is the local government’s commitment to promoting investment.
Bombana, which is ranked second, did have the highest scores in three of the variables. These three variables were certainty of local government policies for business, local government support for local businesses, and commitment of the local government to investment promotion. The remaining weakness in Bombana is existence of a communication forum, which is not well known to the business operators there.
Seram Bagian Barat has the lowest rank for this sub-index. Business operators gave it poor scores for all variables forming this sub-index. Particularly on three variables - level of awareness on the existence of communication forums, local government’s capacity in solving business’ problems and support to business - this district local government is ranked on the bottom-5.

2011 Local Economic Governance Report
74
Graph 10.5 Local Government and Business Interaction Sub-Index

Survey of Businesses in 245 Regencies/Municipalities in Indonesia
75KPP D

76

Survey of Businesses in 245 Regencies/Municipalities in Indonesia
77KPP D
11.1 Background
Business Development Programs (BDP) are services for business development that are provided by local governments. These activities are provided without any fees collected by the local governments from the business operators. To date, a number of central and local government policies have been established to support creation of business condition favorable to small businesses, including Law No. 25/1992 on Cooperatives; Law No. 9/1995 on Small Businesses; Law No. 5/1999 on Prohibition of Monopolistic Practices and Unhealthy Business Competition; Presidential Instruction No. 6/2007 on Policies for Acceleration of the Real Sector and Empowerment of Micro, Small and Medium Enterprises; and Regulation of the State Minister for Cooperatives and Small and Medium Enterprises No. 02/2008 on Empowerment of Business Development Service Providers to help develop Cooperatives and Micro, Small and Medium Enterprises.
Business Development Programs (BDP) exist to help overcome the problems faced by business operators, especially small and medium enterprises (SMEs). SMEs need special attention because they are the most dominant form of enterprise in Indonesia’s economy. According to the 2006 Economic Census, around 99% of businesses in Indonesia are micro and small enterprises, as measured with number of their workers: between one and twenty. By identifying the problems faced by SMEs, programs can be formulated to stimulate their development. The main problems faced by small and medium enterprises are limited capital,
11. Business Development Programs (BDP)
very limited access to capital from formal financial institutions and lack of expertise in business management.
Local governments play a key role in developing SMEs in their territories. According to Government Regulation No. 38/2007, local governments are obliged to empower SMEs through programs such as the following:a. Establishing policies for empowerment
of SMEs by fostering a favorable business climate for small businesses at the local level, including: funding and provision of funding sources, simplifying procedures and requirements for fulfillment of funding needs, infrastructure, competition, information, partnership, licensing and protection.
b. Guidance and development for small businesses, including production, marketing, human resources, and technology.
c. Facilitating access to guarantees in provision of funding for SMEs at the local level, including bank loans, guarantees to non-bank institutions, loans from donor funds as SOE proceeds, grants and other forms of financing.
11.2 Level of Awareness of Existence of BDP
Manpower training is the type of BDP activity best known by business operators. As shown in Table 11.1, overall, 24% of firms are aware of manpower training activities, followed by business management training (known to 19.5% of firms). In contrast, the activities of matching up business

2011 Local Economic Governance Report
78
partners and connecting small, medium and large firms are the two BDP activities least known by business operators, at only 9% and 12% of firms. From the results of the focus group discussion (FGD) in Kota Padang (West Sumatra), the business community was of the opinion that BDP are still not well publicized, and therefore few business operators are aware of the existence of BDP conducted by local governments.
In general, business operators’ awareness about BDP correlates directly with scale of business. This applies for all BDP activities. Manpower training, for example, is familiar to 51% of large-scale business operators interviewed, but only 29% of medium-scale, 20% of small scale, and 5% of micro scale businesses are awake about this training. Business management training is also known by 35% of large business operators but only 5% of micro entrepreneurs.
Level of awareness on BDP varies between regions. Overall, 35% of business operators in Bangka Belitung are aware of the existence of business management training. Apart from Bangka Belitung, business operators in West Sumatra (35%) and in Central Sulawesi (34%) also have fairly good knowledge about the existence of business management training conducted by local governments. On the other hand, in Maluku and West Sulawesi only 8% and 9% of business operators know about the existence of
business management training conducted by local governments. For manpower training, the largest proportion of business operators who know about this are in West Sumatra, at 43%, followed by Central Sulawesi and Bangka Belitung, at 41% and 31% respectively. In contrast, in West Sulawesi and Lampung, only 12% and 14% of business operators know about the existence of manpower training.
The qualitative study found that some local governments focus on development of SMEs and cooperatives. Many local governments have programs for training and guidance for SMEs and cooperatives through training in business techniques and business management. In addition, local governments support the establishment of SME centers in their regions and help SMEs take part in exhibitions to develop their marketing networks. In Kota Kupang (NTT), the local government has facilitated the establishment of street vendor centers along the main roads to enable them to operate from afternoon into the night. Similarly, the Kota Blitar government has since 2005 helped street vendors with arranging permits and business locations. However, these efforts are not reflected in the perceptions of the business operators who were interviewed in the quantitative survey on LEG.
Business operators in municipalities have relatively better knowledge about the existence of BDP in their regions (for all types of BDP) than
Table 11.1 Level of Awareness on Existence of BDPs, by Scale of Business (in Percentages)
Scale of Business
Business Management
Training
Manpower Training
Promotion of Local Products
Linking Small-Medium-Large
Businesses
Loan Application Training for
SMEs
Matching Business Partners
Micro 5.1 8.3 5.1 5.6 5.6 2.3
Small 16.4 20.2 14.1 9.7 15.2 6.9
Medium 23.6 28.7 21.8 15.0 20.0 12.3
Large 35.2 50.7 35.9 22.3 24.9 20.7
Average 19.5 24.2 17.5 12.0 17.1 9.3

Survey of Businesses in 245 Regencies/Municipalities in Indonesia
79KPP D
those doing business in regencies. For example, 31% of businesses in municipalities know about programs on promotion of local products, compared with only 15% in regencies. For SME training in applying for loans, 26% of businesses in municipality are aware of this training, compared with only 15% in regencies. This difference in level of knowledge between municipalities and regencies may arise because access to information is better in urban areas than in rural areas.
11.3 BDP Participation Level
Level of participation of smaller scale of businesses is lower in several BDP activities. Business management training, promotion of local products and linking small, medium and large business operators, which should be directed mainly toward
small and medium enterprises, tend in practice to be used mostly by large-scale businesses. Although for the training for SMEs in applying for credit and the program to match business partners, the largest numbers of participants are micro entrepreneurs, it should also be noted that quite a few large businesses also take part in the loan application training for SMEs.
Regions in the provinces of NTB, West Sumatra and Central Sulawesi have the highest levels of participation in BDPs. The regions with the lowest participation levels are West Papua, West Sulawesi and Central Sulawesi. Apart from the business partner matchmaking activities, business operators in NTB are the strongest participants in BDP activities. Among the BDP programs with the highest participation levels are manpower training and business management training. The levels of
Table 11.2 Level of Awareness on Existence of BDPs, by Region Characteristics (in Percentages)
Region Characteristics
Business Management
Training
Manpower Training
Promotion of Local Products
Linking Small-Medium-Large
Businesses
Loan Application Training for
SMEs
Matching Business Partners
Regencies 17.1 21.5 14.5 10.4 15.3 7.8
Municipalities 30.7 36.7 31.4 19.3 25.8 16.4
Babe
l
W S
umat
era
C Su
lawes
i
SE S
ulaw
esi
E Ja
va
Aver
age
E Pa
pua
S Ka
liman
tan
NTB
C Ka
liman
tan
Papu
a
Jam
bi
Lam
pung
Beng
kulu
NTT
W K
alim
anta
n
Bant
en
N M
aluk
u
W S
ulaw
esi
Mal
uku
Graph 11.1 Level of Awareness on Management and Manpower Training Programs, by Province (in Percentages)
Management training
Manpower training

2011 Local Economic Governance Report
80
participation in business management training in NTB vary by region from 76% in Kota Mataram to 100% in Lombok Timur.
11.4 Level of Benefits of BDP
Although the level of participation by business operators in BDP is very low (on average, 39%-58% of those who know about the existence of BDP), the majority of business operators that do take part in BDP perceive great benefits from the activities. The highest levels of perceived benefits are for the business management training and the manpower training, at 91% for each. And while promotion of local products is the activity with the lowest perceived level of benefit, 86% of business operators
say it is useful. From Table 11.4 below, we can see that there are no significant differences in level of benefit between micro, small, medium and large scale businesses. For the business management training and matching of business partners, all the micro-scale business operators who have participated say the benefits are great.
Business operators in West Sulawesi perceive the greatest benefits from their participation in BDPs. Of the six types of BDP conducted by local governments, the two types felt to be most beneficial are business management training and manpower training, both at 91%. The highest perceived benefit from business management training is felt by business operators in West Papua (100%) and the lowest is in West Kalimantan (81%).
Table 11.3 Participation Level of BDP, by Scale of Business (Proportions of the Firms that are Aware of BDP, in Percentages)
Scale of Business
Business Management
Training
Manpower Training
Promotion of Local Products
Linking Small-Medium-Large
Businesses
Loan Application Training for
SMEs
Matching Business Partners
Micro 40.0 47.1 10.0 0.0 41.7 60.0
Small 54.6 53.9 40.3 43.1 39.3 48.8
Medium 56.6 60.6 48.3 49.2 37.9 58.4
Large 60.4 67.1 63.8 54.5 41.1 66.3
Average 55.8 57.8 45.5 46.3 38.8 54.9
Table 11.4 Level of Benefit of BDPs, by Scale of Business (Proportions on BDP Programs’ Participation, in Percentages)
Scale of Business
Business Management
Training
Manpower Training
Promotion of Local Products
Linking Small-Medium-Large
Businesses
Loan Application Training for
SMEs
Matching Business Partners
Micro 100 87 80 78 92 100
Small 91 90 84 89 88 86
Medium 91 90 87 88 87 88
Large 93 94 90 87 85 91
Average 91 91 86 88 88 88

Survey of Businesses in 245 Regencies/Municipalities in Indonesia
81KPP D
For the manpower training, the highest perceived benefit is felt by business operators in Bengkulu, at 100% and the lowest is in West Kalimantan (80%).
11.5 Impact of BDP on Firm Performance
BDP have a fairly strong impact on company performance. Although only 12% of respondents say that the existence of BDP has an impact on their companies’ performance, if we compare this with the other eight indicators, this is the second highest figure after infrastructure. NTB is the province reporting the strongest impact of the existence of BDPs on company performance (26%), while South Kalimantan reports the lowest (5%). Respondents in municipalities tend to perceive higher impact of BDPs on their business performance (19%) than those in regencies (11%). The larger the scale of business, the greater the perceived impact of the existence of BDPs on business performance.
11.6 Role of Local Governments in Addressing Problems of Raw Material Supply and Distribution of Products
Few business operators feel impeded in their access to raw materials or in distribution of their
products. Only 15% of business operators state that they are constrained in their performance in accessing raw materials and distributing their products. With regard to distribution of goods, the level of obstruction of business performance in the East (18%) is higher than the West (11%). Among the regions in Western Indonesia, the highest obstruction level is in Dharmasraya (Bengkulu), as reported by 50% of business operators in that regency. Other such regions in Western Indonesia include Kota Solok and Solok Selatan, as reported by 20% of business operators in each region. The regions in Eastern Indonesia reporting the greatest obstacles are Sorong Selatan and Fakfak in West Papua, at 33% and 25%, respectively.
Price instability is the largest constraint in access to raw materials. Among the seven main obstacles in obtaining raw materials, the greatest is price instability, reported by 59% of business operators. Business operators in East Java and South Kalimantan most often state that instability in the prices of raw materials is a major constraint to their business activities. Halmahera Selatan in North Maluku is the regency with the worst problems with price instability, as reported by 72% of business operators. Apart from price instability, other issues include scarcity of raw materials (30%), geographical problems, i.e. distance between the source of raw materials and the business venue (21%), unavailability of raw materials in the region (16%), and low quality of roads (13%). The regions facing the greatest constraints from distance from the sources of raw materials are in Kalimantan (Kapuas Hulu, Sintang, Kotawaringin, Pulang Pisau and others), Papua (Keerom, Waropen and so on) and Southeast Sulawesi (Bombana, Buton and Buton Utara).
More than 50% of business operators feel that their local governments take no action to overcome the constraints to availability of raw materials. While the greatest problem in obtaining raw materials is price instability, the action most often undertaken by local governments is building road infrastructure (30%). Other actions undertaken by local governments to address constraints in the supply of raw materials are provision of market
Graph 11.2 Main Obstacle in Obtaining Raw Materials (in Percentages)
Port-related problems
Lack of information on location of raw materials
Unfavorable quality of roads
Unavailability of raw materials in the region
Substantial distance between the source of raw materials and
the business venue
Scarcity of raw materials
Prices' instability

2011 Local Economic Governance Report
82
Facilitating the procurement of raw
materials
Provision of raw materials' market information
Building road infrastructure
No action
Lack of ports
Others
Regulatory constraints
Lack of supporting industry/businesses
Roads/transportation-related problems
Lack of market information
information (5%) and facilitating the procurement of raw materials (4%). From this we can see that there is a mismatch between the actions taken by local governments and the problems actually faced. In terms of the priority sequence of the problems, the aspects that should receive attention, apart from stability of material prices, are scarcity and unavailability of materials. Local governments rarely provide information on sources of raw materials or facilitate proviion of raw materials.
Lack of market information is the greatest constraint to distribution/marketing of products. Overall, 17% of business operators state that they face obstacles in distributing (marketing) their production output due to lack of market information. The second greatest obstacle is problems with roads or transportation, as reported by 16% of business operators. Other constraints include lack of supporting industry/businesses (8%), regulatory constraints (2%) and lack of ports (1%). The regions perceived by business operators as facing the greatest constraints from lack of market information are Sarmi and Keerom in Papua, as reported by 68% and 66% of business operators in these two regencies. Many other regions in Papua, Maluku and Kalimantan also face obstacles from roads and transportation for the
Graph 11.3 Local Governments’ Actions to Overcome The Constraints of Raw Materials’
Access (in Percentages)
movement of their goods.
Not much is done by local governments to overcome impediments to the distribution of goods. Overall, 31% of business operators state that local governments do nothing to overcome problems with the distribution of goods. Construction of road infrastructure is the action most often performed by local governments to overcome obstacles to the movement of goods, though the greatest problem in distribution of goods is actually shortage of market information. And only 3% of business operators say that their local governments provide market information to help overcome problems with the distribution of goods.
Some local governments play a role as collector organizations to help with distribution of products. In distributing their products, most business operators (66%) use privately managed distributors. Interestingly, however, 23% of business operators state that they distribute their products using collector organizations managed by their local governments. The unavailability of private distributors forces local governments to take over this role as distributors of goods to assist the private sector. Yet it must be noted that local governments do not perform exactly the same role that should be
Graph 11.4 Constraint in Distribution/Marketing of Products (in Percentages)

Survey of Businesses in 245 Regencies/Municipalities in Indonesia
83KPP D
performed by the private sector, especially when private institutions able to perform the distribution role have developed in their regions. The last thing that needs to be noted by local governments is that many business operators (9%) still use brokers (tengkulak).
11.7 Business Development Programs
Sub-Index
No less than six regencies/municipalities among the top 20 for the BDP sub-index are located in West Sumatra
Overcome Impediments to The Distribution of Products (in Percentages)
Box 11.1Variables Forming the Business Development Programs (BDP) Sub-Index(1) Level of awareness of existence of BDP;(2) BDP participation level;
operators; and(4) Impact of BDP on business performance.
Padang (15). According to the FGD conducted
BDP activities, but only facilitates large companies located in the province, such as PT Semen Padang,
activities aimed at empowering SMEs.
In contrast, regencies/municipalities in Maluku, Papua and East Java make up half of the 20 regions ranked lowest for the BDP sub-index. Four
Bagian Barat, Seram Bagian Timur and Maluku Barat Daya – are ranked between 233 and 241. And Jayawijaya, Asmat and Mappi regencies, located in Papua, occupy rankings 227, 228 and 244. One interesting phenomenon is that three regencies in East Java – Madiun, Magetan and Situbondo – are among the lowest 20 for this sub-index, mixed in with regencies/municipalities located in Eastern Indonesia.
Lumajang (East Java) is felt by business operators to have the best performance for the BDP sub-index. Lumajang managed to achieve the top score for the BDP sub-index mainly because of business operators’ very high levels of awareness about and participation in BDP activities. On average, business operators’ level of awareness in Lumajang about the existence of BDP, for all types of activities, ranges between 30% and 50%. And among business operators who know about the existence of BDP, the participation level ranges between 60% and 70% for all types of BDP activities. What the BDP operators in Lumajang still need to be concerned about is
from the BDP activities in which they take part.
Lampung Timur is the ranked the lowest with a score of 0.0always gets the lowest rank for each of the variables used to construct this sub-index.
Constitute distribution-related regulation
Provide distribution-related assistance
Provision of market information
Building road infrastructure
No action

2011 Local Economic Governance Report
84
Municipalities have better performance in BDP than regencies. The average BDP sub-index score for the 43 municipalities surveyed is 51.4, higher the average BDP sub-index of 35.9 for the 202 regencies. This can also be seen from the fact that ten municipalities are among the top 20 regions for the BDP sub-index. In contrast, all regions in the bottom 20 are regencies.

Survey of Businesses in 245 Regencies/Municipalities in Indonesia
85KPP D
Graph 11.6 Business Development Programs Sub-Index
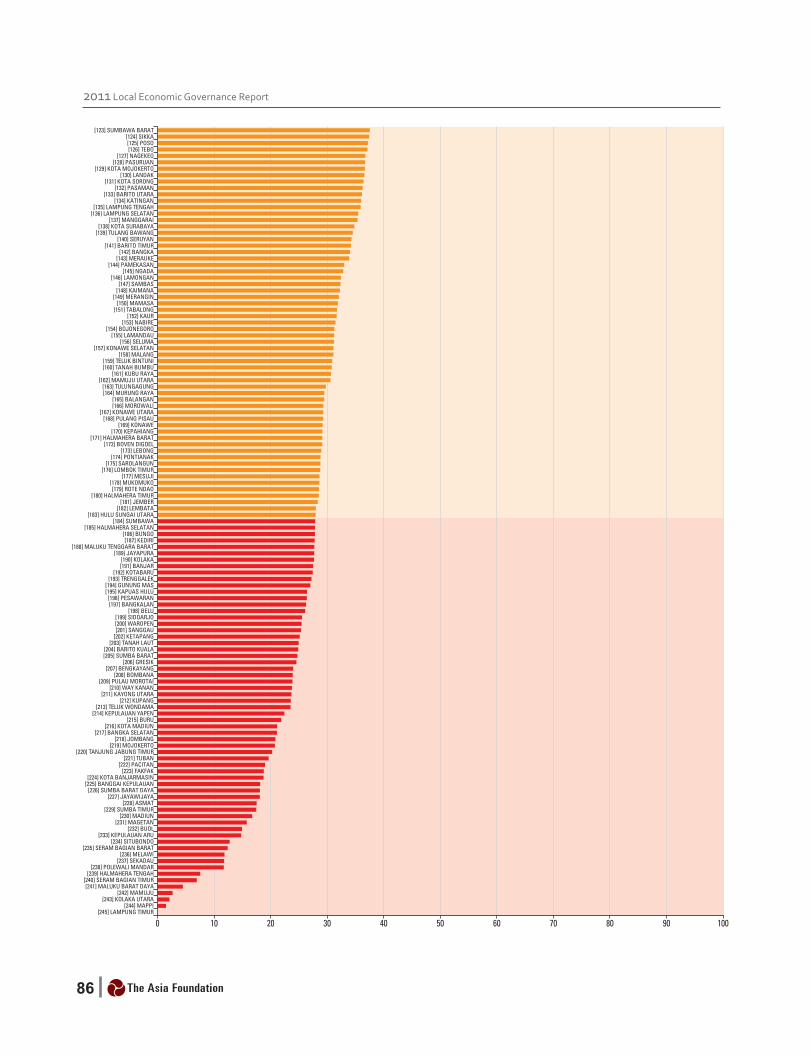
2011 Local Economic Governance Report
86

87KPP D
12.1 Background
Security, or at least perceived sense of security, is an essential condition for businesses to be able to operate successfully. Security concerns and conflicts can affect the reliability of their business operations, deter new investors, and have a negative impact on the overall business climate in a region. The responsibility for providing businesses with a sense of security is generally exercised by the police. Police performance in handling various types of crimes is an important function that has a very definite impact on the business community. The level of success in carrying out the functions of prevention, safeguarding and handling of security disturbances and violations of the law will determine the sense of security created by this institution in a given region.
This study focuses on the performance of police institutions at the regency/municipality level. It is a challenge for local governments to try to “influence” the performance of the police, since the authority of this institution is centralized at the national level. Apart from crime, the function of handling labor-related conflicts, represented in this study by worker demonstrations, is another measure of security related directly to the business community. Alternative approaches to resolution of labor problems, from mediation through legal remedies, will determine the quality of the police agencies concerned.
12. Security and Conflict Resolution
12.2 Level of Theft Incidents at Business Sites
Theft is the most common type of crime that business operators are aware of, with Lampung as the most unsafe province. Overall, around one out of five firms are aware of thefts occurring in their areas, higher than the 2007 LEG result of only 13%. Lampung and Jambi are the provinces with the highest theft rates, 35% and 34% respectively. Lampung also has by far the highest average rates of armed robbery and extortion. One fifth of business operators in this province are aware of armed robberies, compared with only 3% of all firms. Furthermore, 10% of firms in Lampung are aware of extortion cases, also far higher than the average for all 19 provinces of only 2%. The three regions in Lampung with the highest rates of thefts at business sites are Lampung Timur (79%), Tulang Bawang (64%) and Pesawaran (50%). In addition to theft, armed robberies are also quite frequent in these three regencies, as reported by between 50% and 75% of business operators.
In contrast, the theft rates in Bengkulu and NTT are relatively low. Only around 10% of businesses in these provinces are aware of thefts. Of the ten regencies/municipalities in Bengkulu, business operators in four regions have never experienced any thefts at their places of business. These four regencies are Bengkulu Utara, Seluma, Mukomuko and Lebong. The highest rates of theft in Bengkulu occur in Bengkulu Selatan and Kota Bengkulu, as reported by 26% and 25% of business operators in those regions. And of the 19 regions in NTT, ten reported no thefts during 2011: Alor, Lembata,

2011 Local Economic Governance Report
88
Flores Timur, Sikka, Ngada, Manggarai, Rote Ndao, Manggarai Barat, Nagekeo and Manggarai Timur. The highest rates of theft in NTT were reported in Sumba Barat and Sumba Barat Daya, by 38% of business operators in these two regencies.
12.3 Quality of Police Handling of Crimes
In general, business operators feel that the police handle crimes well. Around 73% of business operators believe that what the police do to handle crimes minimizes losses to the business community, and 74% feel that the police do not create losses for their companies when handling crimes. Even more business operators believe that the police act promptly in responding to crimes: 78%.
The level of trust in the quality of police handling of crimes is inversely proportional to the scale of business. More micro business operators feel that the police handle cases well, ranging between 78% and 86% for the three statements above. The level of trust declines with increasing scale of business. Only 70%-74% of operators of large businesses feel that the police handle crimes well.
12.4 Quality of Police Handling of Labor Demonstrations
Business operators record more positive assessments for the quality of police handling of labor demonstrations than for their handling of crimes. The average confidence level of all business operators regarding timeliness of police handling of worker demonstrations is 87%, and for minimizing
Graph 12.1 Level of Theft Incidents at Business Sites (in Percentages)
Graph 12.2Quality of Police in Crimes Handling, by Scale of
Business (in Percentages)
Lam
pung
Jam
bi
Papu
a
W K
alim
anta
n
Bant
en
W S
umat
era
W P
apua
Mal
uku
C Su
lawes
i
Aver
age
N M
aluk
u
E Ja
va
W S
ulaw
esi
S Ka
liman
tan
NTB
C Ka
liman
tan
Babe
l
SE S
ulaw
esi
Beng
kulu
NTT
Solution provided by the police minimizes losses to
the business community
Solution provided by the police do not create losses
when handling crimes
Act promptly in responding to crimes
Large Medium Small Micro

Survey of Businesses in 245 Regencies/Municipalities in Indonesia
89KPP D
losses to business, 84%. As with the assessment of handling of crimes, the smaller the scale of business,
should be noted that worker demonstrations do not actually occur in all regions, but only in certain regions with concentrations of industry.
12.5 Obstruction Level of Security for Business Performance
Overall, only 3.4% of business operators feel security is a constraint to their companies’ performance. This perception about the obstruction level of security also correlates directly with scale of business. Larger numbers of large business operators feel that security problems hinder
their business performance. In terms of regional characteristics, more business operators in urban areas feel impeded by security factors than those in regencies. And in terms of location, business operators in Western Indonesia tend to feel more secure than those in the East.
Sub-Index
Kolaka Utara (Southeast Sulawesi) and Manggarai (NTT) are the two regencies with the highest
sub-index, while Lampung Timur (Lampung) is ranked lowest. this sub-index mainly because of the low level of security disturbances in this region. In addition, the perceptions of business operators regarding the quality of police handling of security disturbances are also very positive. Generally, business operators
resolution are obstacles to business activities in their region. Manggarai, in second place, is also a region where business operators have a very
Graph 12.3 Obstruction Level of Security and
(in Percentages)
Police Actions in Handling DemonstrationsScale of Business
Micro Small Medium Large Average
Police act promptly in responding to worker demonstrations 92.3 88.1 87.1 85.9 87.4
Solutions provided by police in handling demonstrations minimize negative impacts on business
92.3 84.3 83.3 80.9 84.0
Box 12.1
Resolution Sub-Index(1) Level of theft incidents at business sites;(2) Quality of police handling of crimes;(3) Quality of police handling of worker
demonstrations; and
Average
MicroSmall
MediumLarge
Eastern IndonesiaWestern Indonesia
RegencyMunicipality

2011 Local Economic Governance Report
90
positive perception of the quality of police handling of worker demonstrations. Furthermore, the level of security disturbances is very low; consequently, they feel that that security and conflict resolution in this region is not an obstacle to business activity. In contrast, Lampung Timur has by far the lowest score for this sub-index, only 2.4, well below the second lowest, Bungo (Jambi), with a sub-index score of 16.2.
Six regencies located in Central Kalimantan, four in Southeast Sulawesi and three in NTT are among the top 20 for the security and conflict resolution sub-index. Apart from Kolaka Utara, in first place, there are three other regencies in Southeast Sulawesi in the top 20 – Buton Utara (third), Bombana (sixth) and Buton (17). It is interesting that apart from Buton, these regencies are autonomous regions newly created through partitioning since 2002. Two other regencies in NTT are also in the top 20, apart
from second-ranked Manggarai. Manggarai Timur, which was split off from Manggarai, is ranked tenth and Ngada is 13th. Central Kalimantan is the province with the most number of regency in this list: Lamandau, Barito Utara, Kotawaringin Barat, Pulang Pisau, Gunung Mas and Katingan.
In contrast, half of the regencies/municipalities in the lowest 20 regions for this sub-index are located in the provinces of East Java, Banten and Lampung. Apart from Lampung Timur, which received the lowest score, two other regencies in Lampung – Mesuji and Tulang Bawang – also received very low scores. Meanwhile, Banten contributed Pandeglang and the two neighboring municipalities of Tangerang and Tangerang Selatan to the bottom 20 in this sub-index. Four regencies in East Java – Banyuwangi, Lumajang, Pasuruan and Malang – had rankings between 228 and 241 among the 245 regencies/municipalities in this survey.

Survey of Businesses in 245 Regencies/Municipalities in Indonesia
91KPP D
Graph 12.4 Security and Conflict Resolution Sub-Index

2011 Local Economic Governance Report
92

93KPP D
13.1 Weights of Indicators Forming the Local Economic Governance Index
Local Infrastructure and Business Development Programs (BDP) are the two indicators with the greatest influence on Local Economic Governance as a whole. From Table 13.1, it can be seen that the weight for the Local Infrastructure sub-index in 2007 was 35.5, while in 2011 it was 37.9. Meanwhile, the weight for BDP fell slightly, from 14.8 in 2007 to 13.9 this year. These data indicate that over the past four years, the problems of local infrastructure have not been overcome, and this problem remains the main obstacle to business activity. Land Access, in 2007 the third most important issue after BDP, slipped in 2011 to fourth, with a weight of 8.8, while
13. Local Economic Governance Index
Local Government and Business Interaction rose from fourth to third, with a weight of 13.1.
13.2 Local Economic Governance Index
The Local Economic Governance (LEG) Index measures aggregate quality of all dimensions of LEG. The overall LEG Index is obtained by applying a weighted average to the nine sub-indices. It is hoped that this will make it easier for all parties concerned, both the various levels of government and components of society, to observe the position of one regency/municipality relative to the others in terms of economic governance. The index rankings are expected to foster constructive competition among the regencies/municipalities in Indonesia and encourage cross-learning between regions.
As in 2007, Kota Blitar (East Java) is in first place. This municipality achieved the highest sub-index score for infrastructure, which has the highest weight in the calculation of the final LEG Index. Kota Blitar also had very high positions for three other sub-indices – ranking six for interaction between the local government and the business community, ranking 12 for capacity and integrity of regent/mayor, and ranking 14 for business licensing. Kota Blitar’s score for transaction cost sub-index is high (87.7), but the rank is fairly low: 77. The scores for the other sub-indices were fairly average. Kota Blitar still has weaknesses, especially in the operation of BDP. By knowing its strengths and weaknesses in each of the indicators, the local government can formulate further strategies
Table 13.1 Weights of Local Economic Governance Sub-Indices/Dimensions
Sub-IndexWeight
2007 2011
Local Infrastructure 35.5 37.9
Business Development Programs 14.8 13.9
Land Access 14.0 8.8
Local Government and Business Interaction 10.0 13.1
Transaction Costs 9.9 7.3
Business Licensing 8.8 8.0
Security and Conflict Resolution 4.0 3.0
Capacity and Integrity of Regents/Mayors 2.0 4.4
Local Level Regulations 1.0 3.6

2011 Local Economic Governance Report
94
to improve its performance in local economic governance and thereby become more competitive. Other regions can learn from the success of Kota Blitar to improve their own local economic governance performance.
The top 20 rankings for the overall LEG index are dominated by districts in East Java, while many in the bottom 20 are regencies/municipalities in Papua and Maluku. In addition to Kota Blitar, 11 of the top 20 regencies/municipalities are located in East Java, including Kota Probolinggo and Kota Batu in the “big five”. Apart from these three municipalities in East Java, Lampung Utara (Lampung) is in second place and Sorong (West Papua) is ranked fifth. In contrast, five regencies located in Papua are among the 20 lowest in the final LEG Index, including Waropen in last place, ranked 245. Apart from Papua, another province with quite a few regencies in the bottom 20 is Maluku. Four regencies in Maluku – all of them newly created administrative districts – are in the bottom 20, including Seram Bagian Timur and Seram Bagian Barat, ranked 243 and 244 respectively.
The characteristics of a region influence the overall LEG index it achieves. In general, municipalities have higher LEG index scores than regencies, while regencies/municipalities located in island areas tend to have lower index scores than mainland regions (those located in large/major islands). Also, regencies/municipalities located in Western
Indonesia have much better index scores than those in Eastern Indonesia.
Regencies/municipalities with greater population density also have better LEG index scores. Sparsely populated regions tend to have low average index scores. In contrast, densely populated regions have high index scores, especially those recorded as having over 600 people/km2. This may also explain why urban areas have higher index scores than regencies, regions in Western Indonesia are higher than those in Eastern Indonesia and non-island regions do better than island regions. An optimum level of population density enables more efficient governance. In addition, this optimum
Graph 13.1Kota Blitar’s Spider Diagram
LocalInfrastructure Business
DevelopmentPrograms
Security andConflict
Resolution
Capacity andIntegrity of
Regents/Mayors
Local Governmentand BusinessInteraction
Land Access
Transaction CostsBusiness Licensing
Local Regulations
LEG Index
Graph 13.2LEG Index and Regional Characteristics
Municipality
Regency
Western Indonesia
Eastern Indonesia
Mainland
Island
LEG
Inde
x
Graph 13.3 LEG Index and Population Density

Survey of Businesses in 245 Regencies/Municipalities in Indonesia
95KPP D
level of population also enables identification of good human resources to conduct government administration.
The LEG indices in “wealthier” regions – those with higher GRDP per capita – tend to be higher than in those with low GRDP per capita. By grouping regencies/municipalities into several categories by per capita GRDP, we see that regions with high per capita GRDP also have relatively high LEG index scores. However, this only applies up to the category with per capita GRDP of Rp 10-15 million. Further increases in per capita GRDP do not produce corresponding increases in average LEG index.
Graph 13.5 LEG Index and Proliferation of Regions
Graph 13.4 LEG Index and GRDP Per Capita
LEG
Inde
x
LEG
Inde
x
The LEG performance of newly created administrative regions is lower than that of their parent regions or of regions that have never undergone partitioning. In fact, all of the regions with the 10 lowest rankings are new regions. The average index for newly autonomous regions is only 59.5, while the average index for parent regions is 63.3, and 65.9 for regions that have never been partitioned. This indicates that the proliferation of regions has not made a positive contribution to economic governance. Interestingly, however, new regions that were created in 2001 tend to have high LEG indices, averaging 66.7. This suggests that new regions may be able to achieve better performance after attaining several years of governmental stability.
<Rp 5 Rp 5-10 Rp 10-15 Rp 15-20 > Rp 20 million million million million million
District Without Split Districts Newly Proliferation Established Districts

2011 Local Economic Governance Report
96
Graph 13.6 Local Economic Governance Index

Survey of Businesses in 245 Regencies/Municipalities in Indonesia
97KPP D

98

99KPP D
The central government and provincial governments need to use the LEG results to monitor, assist, and provide incentives to the regencies/municipalities under their jurisdiction. The results of the LEG study, which provide a detailed picture of various aspects of the quality of local economic governance, can be used by governments on a higher level of authority to set priorities for their activities in facilitating and assisting local governments improve their performance. Collection and dissemination of information about innovations and good practices in one regency/municipality to be emulated by other regions is one such form of facilitation, as well as direct provision of technical assistance, technical upgrading, and facilitating cross-learning processes between regencies/municipalities.
Infrastructure, as the most important aspect of LEG, needs to be the main priority. This aspect is considered to be the main obstacle to business performance in the regions and, based on the perception of business operators, is still of poor quality. Furthermore, local governments are still not responsive in maintaining and improving the conditions of existing infrastructure. Since the authority for management of certain types of infrastructure lies with the central and provincial governments, coordination between local, provincial and central governments is essential. In addition, in the three provinces that have undergone LEG surveys twice, in 2007 and again in 2011 – East Java, West Nusa Tenggara (NTB) and East Nusa Tenggara (NTT) – it was identified that the quality of infrastructure management in NTB and NTT has actually deteriorated over the past four years, while there has been some improvement
14. Concluding Remarks and Recommendations
in East Java. Given that these provinces serve as “representatives” of Eastern Indonesia (NTB and NTT) and Western Indonesia (East Java), it is evident that the business community has not felt sufficient attention to construction of infrastructure in the eastern part of the country.
The business operators, assesments for the aspects of business development programs (BDP) and interaction between local governments and businesses indicate that government roles are still very relevant. This shows that business operators still expect their local governments to interact, consult, and help them to develop their businesses. On the other hand, firms’ low level of knowledge about communication forums and about the various BDP activities suggests that local governments need innovative breakthroughs to interact with and assist development of businesses, especially for micro, small and medium enterprises.
The relatively low quality of local level regulations and continuing high transaction costs indicate that many large local governments are not yet ready to “welcome” the enactment of the new regulation on local taxes and user charges. Law No. 28/2009 on Local Taxes and Local User Charges was introduced over two years and will come fully into force in 2011. However, it is evident that a majority of local governments have not done enough to examine, revise, or revoke local level regulations that conflict with this new standard. Intensive monitoring and facilitation by various parties is needed to ensure that the implementation of this new regulation will be effective in the field.

2011 Local Economic Governance Report
100
One Stop Shops (OSS) are an excellent initiative, but the establishment of OSS alone is not enough to guarantee business licensing services of good quality. The central government has, over the past several years, been strongly encouraging local governments to establish OSS. In general, a majority of business operators have positive perceptions that business licensing services are free from collusion, free from illegal levies, and efficient. However, also in the perception of business operators, quite a few OSS are not functioning well or providing good business licensing services. Costs higher than what is stipulated in the regulations and relatively long processing times to obtain permits are indicators of this. Moreover, the relatively low level of permit ownership also suggests that businesses have not yet felt the impact of OSS.
The government’s comitment to support micro, small and medium enterprises is not reflected in the results of this study. The analysis of differences in perception by scale of business performed in this study indicates that the smaller business categories do not receive adequate services and support from governments. For example, more large and medium-scale businesses participate in the communication forums between local governments and the business community, and they are more likely to know about and benefit from the various BDP activities. In contrast, micro and
small entrepreneurs find it more difficult to obtain business permits, and they pay higher transaction costs per employee. Interestingly, their perceptions of their governments are still relatively positive, suggesting a fairly permissive attitude. Therefore, imposing government policies that truly support small and medium enterprises development remains an important task.
The relatively low quality of local economic governance in disadvantaged regions requires particular attention. In general, the quality of local economic governance is better in the Western part of Indonesia than in Eastern Indonesia; better in municipalities than in rural areas; better in mainland regions than in island regions; and better in regions that have never been partitioned that in regions that have undergone partitioning (both the parent regions and the newly established regions). All this is worrisome, because the relatively disadvantaged regions are also falling behind in improving their local economic governance; thus, it will be even harder for them to catch up. Special efforts are needed from the central government and provincial governments to accelerate governance development in these regions.

Appendix: Local Economic Governance Index and Sub-Indices Values for Regencies/Municipalities
101KPP D
No. Provinces Regencies/Municipalities
Sub-Index
LEG
Inde
x
Rank
Land
Acc
ess
Loca
l Inf
rast
ruct
ure
Busi
ness
Lic
ensi
ng
Loca
l Reg
ulat
ions
Tran
sact
ion
Cost
s
Capa
city
and
Inte
grity
of
Rege
nts/
May
ors
Loca
l Gov
ernm
ent a
nd
Busi
ness
Inte
ract
ion
Busi
ness
Dev
elop
men
t Pr
ogra
ms
Secu
rity
and
Confl
ict
Reso
lutio
n
1 East Java Kota Blitar 75.6 94.0 77.4 74.3 87.7 71.1 73.6 56.9 74.8 80.5 1
2 Lampung Lampung Utara 79.3 83.7 84.6 73.3 95.8 65.5 74.6 62.7 84.4 79.0 2
3 East Java Kota Probolinggo 77.9 90.6 82.5 81.6 73.0 81.3 80.1 44.9 69.4 78.4 3
4 East Java Kota Batu 77.1 88.4 72.3 79.4 89.3 42.9 58.2 68.7 59.7 76.3 4
5 West Papua Sorong 92.5 82.1 59.3 71.9 79.5 75.1 77.3 45.4 83.9 74.6 5
6 Bangka Belitung Bangka Tengah 72.4 71.9 75.7 83.9 97.2 70.3 67.9 74.8 71.6 74.3 6
7 East Java Magetan 93.5 90.7 77.5 88.8 85.0 62.4 64.3 15.8 78.9 73.9 7
8 East Java Probolinggo 76.8 85.3 73.6 66.9 76.3 65.3 65.4 52.5 69.8 73.8 8
9 West Sumatra Kota Solok 80.8 82.7 73.3 99.0 79.4 38.6 55.4 60.3 72.0 73.2 9
10 West Sumatra Kota Padang Panjang 71.1 84.7 69.3 85.2 84.8 52.5 45.5 68.7 69.8 73.1 10
11 Lampung Kota Metro 86.5 81.0 70.9 83.9 88.6 57.1 63.1 48.5 68.8 73.0 11
12 East Java Lamongan 85.5 90.1 75.3 85.6 86.4 58.9 47.2 32.4 87.5 73.0 12
13 East Java Tulungagung 89.1 88.8 72.9 90.6 82.1 52.3 60.1 29.8 69.4 73.0 13
14 East Java Blitar 76.2 81.7 72.7 83.7 91.5 50.9 58.0 55.2 72.6 72.9 14
15 East Java Kota Kediri 80.1 86.7 78.6 65.1 75.6 51.7 66.7 40.2 69.5 72.7 15
16 West Papua Sorong Selatan 76.6 82.6 54.0 85.6 86.7 71.8 75.9 39.1 80.1 72.7 16
17 East Java Ngawi 80.0 78.7 70.0 91.9 83.6 66.5 64.4 49.6 77.2 72.5 17
18 East Java Nganjuk 73.0 85.4 60.2 75.3 88.9 45.2 56.3 58.3 67.4 72.3 18
19 Central Sulawesi Banggai 83.4 76.1 65.9 78.4 80.5 69.4 55.7 68.3 68.7 72.1 19
20 Central Kalimantan Pulang Pisau 87.6 87.7 62.0 73.7 97.2 67.3 51.0 29.3 84.7 71.9 20
21 West Sumatra Kota Sawah Lunto 66.3 74.0 63.5 81.4 84.5 49.2 67.1 76.3 74.6 71.9 21
22 Central Sulawesi Parigi Moutong 78.6 77.4 58.3 87.7 72.2 67.3 59.0 66.6 67.5 71.3 22
23 Lampung Lampung Barat 68.1 84.8 58.0 72.5 94.6 55.9 65.5 45.8 53.1 71.3 23
24 Central Kalimantan Seruyan 92.3 79.4 64.9 87.5 94.3 63.1 58.6 34.3 83.6 71.2 24
25 Central Sulawesi Sigi 82.5 81.0 56.9 91.5 79.4 69.6 53.1 52.3 76.1 71.2 25
26 West Sumatra Tanah Datar 66.1 76.8 69.4 91.1 90.4 50.9 50.7 68.7 69.3 70.8 26
27 East Java Bojonegoro 87.2 85.7 73.6 84.6 68.5 61.2 54.5 31.3 82.9 70.8 27
28 East Java Mojokerto 87.6 85.0 67.2 89.9 86.8 63.0 61.0 20.8 72.0 70.7 28
29 South Kalimantan Tapin 64.6 82.3 82.0 51.9 85.8 53.9 60.2 48.3 69.1 70.6 29
30 South Kalimantan Hulu Sungai Selatan 62.9 83.4 81.6 81.7 90.3 52.1 54.4 40.0 74.8 70.4 30
31 East Java Kota Mojokerto 78.1 86.8 65.2 84.6 81.8 50.4 53.0 36.7 70.4 70.4 31
32 East Java Bondowoso 83.3 81.5 65.0 80.8 82.7 54.9 59.6 40.9 69.6 70.3 32
33 Bangka Belitung Belitung Timur 78.5 73.5 64.2 86.9 93.1 64.0 58.2 56.0 73.7 70.3 33
34 East Java Jombang 82.1 85.8 64.6 89.2 91.7 65.0 56.3 20.9 76.1 70.2 34
35 East Java Sampang 84.3 78.2 79.2 95.1 86.3 48.5 50.1 43.3 77.1 70.1 35

2011 Local Economic Governance Report
102
No. Provinces Regencies/Municipalities
Sub-Index
LEG
Inde
x
Rank
Land
Acc
ess
Loca
l Inf
rast
ruct
ure
Busi
ness
Lic
ensi
ng
Loca
l Reg
ulat
ions
Tran
sact
ion
Cost
s
Capa
city
and
Inte
grity
of
Rege
nts/
May
ors
Loca
l Gov
ernm
ent a
nd
Busi
ness
Inte
ract
ion
Busi
ness
Dev
elop
men
t Pr
ogra
ms
Secu
rity
and
Confl
ict
Reso
lutio
n
36 West Sumatra Dharmasraya 70.0 76.6 78.8 88.1 86.1 49.4 59.0 50.6 75.1 70.1 36
37 East Java Sumenep 70.5 84.1 65.3 89.7 86.7 57.8 50.8 42.1 67.3 69.9 37
38 NTT Alor 80.1 64.3 60.9 81.1 97.4 64.1 60.2 74.8 83.7 69.9 38
39 Papua Biak Numfor 64.9 86.1 76.0 69.3 78.8 42.8 49.1 49.3 68.1 69.9 39
40 West Sumatra Kota Bukittinggi 70.9 83.1 70.4 97.2 80.9 45.2 47.5 49.4 68.6 69.9 40
41 Papua Merauke 79.7 85.9 71.7 93.4 79.1 43.9 54.3 33.9 55.6 69.9 41
42 East Java Trenggalek 86.1 81.8 71.5 66.8 92.4 48.2 61.9 27.2 77.0 69.8 42
43 Bengkulu Bengkulu Selatan 91.7 73.1 65.6 91.0 93.0 67.6 51.2 49.0 73.9 69.8 43
44 South Kalimantan Hulu Sungai Utara 88.4 84.5 66.5 62.7 96.1 57.8 52.5 28.0 68.2 69.7 44
45 West Sulawesi Mamuju 89.0 81.4 76.8 85.1 99.7 76.2 62.8 2.7 83.7 69.7 45
46 South Kalimantan Hulu Sungai Tengah 67.7 83.4 81.3 90.2 93.4 46.3 46.5 38.4 67.7 69.6 46
47 West Sumatra Kota Payakumbuh 70.1 76.3 64.3 86.1 88.5 46.6 55.0 63.1 55.3 69.5 47
48 South Kalimantan Kotabaru 94.0 82.8 69.4 31.6 97.0 59.0 55.4 27.4 75.5 69.4 48
49 West Sumatra Kota Padang 55.8 78.3 66.7 95.1 65.4 44.3 58.2 67.9 67.7 69.2 49
50 West Sulawesi Majene 66.8 76.7 65.4 83.3 82.5 57.0 49.1 64.7 66.1 69.1 50
51 West Sumatra Solok 73.8 75.7 74.2 95.3 85.0 37.9 51.4 54.7 78.6 69.1 51
52 Lampung Pringsewu 78.9 79.3 50.8 74.5 84.5 62.2 62.1 45.8 64.3 69.1 52
53 Central Sulawesi Toli-Toli 82.6 74.0 65.3 82.7 80.3 69.8 58.1 50.2 67.7 69.1 53
54 East Java Kota Madiun 76.1 86.4 78.3 84.9 75.4 61.5 51.9 21.2 75.6 69.0 54
55 South Kalimantan Kota Banjarbaru 74.4 85.3 68.2 70.0 68.8 52.4 45.1 48.2 71.7 69.0 55
56 West Papua Fakfak 86.9 77.8 63.5 79.4 84.7 64.0 73.6 18.8 82.8 68.8 56
57 East Java Kediri 81.3 86.5 62.8 87.8 89.5 47.1 45.9 27.8 73.1 68.8 57
58 South Kalimantan Tabalong 90.3 82.1 60.8 71.3 96.7 54.2 48.9 31.7 67.0 68.8 58
59 Bengkulu Kota Bengkulu 71.1 75.2 72.0 83.9 78.1 55.4 55.6 56.7 63.6 68.8 59
60 Central Sulawesi Tojo Una-Una 84.2 72.6 61.3 88.9 73.0 64.9 53.8 60.5 68.9 68.8 60
61 Central Sulawesi Donggala 86.0 74.9 61.6 86.9 80.0 59.7 61.3 40.9 71.3 68.3 61
62 East Java Pamekasan 76.1 80.9 70.7 76.0 77.6 55.3 58.1 33.0 74.7 68.3 62
63 Central Kalimantan Kota Palangka Raya 63.2 70.5 69.0 77.1 63.0 54.2 64.6 74.6 62.7 68.3 63
64 Bangka Belitung Belitung 69.9 75.5 63.5 74.2 87.1 60.7 56.8 49.6 78.5 68.2 64
65 East Java Lumajang 57.7 76.0 67.3 67.8 73.1 46.0 52.4 78.4 44.1 68.2 65
66 West Papua Manokwari 63.8 76.6 70.6 81.9 82.8 71.8 61.8 40.6 63.9 68.1 66
67 Bengkulu Rejang Lebong 76.5 79.2 57.7 91.6 90.3 47.4 44.9 49.4 61.3 67.9 67
68 West Sumatra Kota Pariaman 77.4 71.4 60.4 87.1 90.3 42.1 45.9 73.2 45.2 67.8 68
69 East Java Sidoarjo 71.0 86.7 67.9 90.6 80.1 51.6 50.2 25.6 58.5 67.8 69
70 East Java Tuban 71.8 91.1 60.1 69.8 90.2 64.5 42.5 19.7 59.3 67.7 70

Appendix: Local Economic Governance Index and Sub-Indices Values for Regencies/Municipalities
103KPP D
No. Provinces Regencies/Municipalities
Sub-Index
LEG
Inde
x
Rank
Land
Acc
ess
Loca
l Inf
rast
ruct
ure
Busi
ness
Lic
ensi
ng
Loca
l Reg
ulat
ions
Tran
sact
ion
Cost
s
Capa
city
and
Inte
grity
of
Rege
nts/
May
ors
Loca
l Gov
ernm
ent a
nd
Busi
ness
Inte
ract
ion
Busi
ness
Dev
elop
men
t Pr
ogra
ms
Secu
rity
and
Confl
ict
Reso
lutio
n
71 East Java Bangkalan 88.0 84.0 62.0 94.3 75.3 56.5 45.3 26.3 69.2 67.6 71
72 Papua Kota Jayapura 50.0 74.5 66.7 81.2 72.6 65.5 66.3 57.0 62.8 67.6 72
73 East Java Gresik 69.9 87.0 61.7 86.7 87.8 57.5 45.8 24.6 57.7 67.3 73
74 NTT Flores Timur 68.8 63.8 78.3 84.3 81.2 30.7 55.8 75.1 78.0 66.9 74
75 Central Sulawesi Buol 88.8 76.2 68.2 87.9 87.1 50.1 66.4 14.9 73.2 66.8 75
76 Central Sulawesi Kota Palu 69.0 71.0 65.5 82.8 70.2 58.6 58.9 59.0 63.5 66.7 76
77 Lampung Lampung Selatan 81.2 77.4 57.9 63.6 76.2 58.6 61.5 35.5 67.1 66.6 77
78 Lampung Tulang Bawang 62.4 81.4 60.5 80.4 89.8 52.0 59.1 34.5 32.6 66.4 78
79 Lampung Way Kanan 82.9 79.5 60.1 80.9 67.4 62.9 60.5 23.8 78.3 66.4 79
80 NTT Ende 75.7 76.2 59.7 82.8 80.5 49.2 55.4 41.2 69.0 66.4 80
81 West Papua Kaimana 73.4 74.6 66.9 93.4 89.4 64.0 54.0 32.2 65.3 66.3 81
82 East Java Kota Pasuruan 74.5 82.1 65.0 93.4 73.2 32.7 40.1 43.7 65.7 66.3 82
83 South Kalimantan Tanah Laut 90.8 78.2 63.6 95.3 86.2 54.2 44.4 25.0 68.5 66.2 83
84 South Kalimantan Balangan 88.6 82.1 52.5 42.1 99.1 57.8 42.8 29.5 67.9 66.2 84
85 NTT Manggarai Timur 93.0 62.5 68.7 69.8 92.3 58.4 63.0 44.0 85.5 66.1 85
86 West Sulawesi Polewali Mandar 86.9 78.1 65.4 85.6 91.9 60.8 53.3 11.7 77.5 65.9 86
87 East Java Ponorogo 70.5 77.7 70.7 83.7 80.8 36.3 50.4 39.7 65.8 65.9 87
88 Lampung Pesawaran 78.4 80.1 57.8 63.6 90.6 55.9 54.6 26.4 59.9 65.9 88
89 Bangka Belitung Bangka 74.5 70.8 68.4 65.8 95.5 64.7 59.2 34.0 69.2 65.6 89
90 East Java Madiun 74.9 85.1 57.6 79.3 81.9 57.3 47.9 16.7 68.7 65.5 90
91 West Sumatra Solok Selatan 76.2 70.4 61.1 71.6 90.4 52.7 49.8 52.7 62.5 65.5 91
92 North Maluku Kota Tidore Kepulauan 81.8 72.0 63.5 69.8 82.0 55.4 51.0 43.4 75.5 65.5 92
93 East Java Jember 71.5 83.1 61.7 86.0 72.5 44.6 50.4 28.3 60.1 65.4 93
94 NTT Sumba Timur 86.6 73.4 64.2 94.2 98.6 55.0 56.4 17.5 65.0 65.4 94
95 Jambi Sarolangun 81.7 75.6 56.2 80.7 92.1 52.9 52.5 28.8 72.5 65.4 95
96 West Kalimantan Pontianak 75.4 76.5 68.1 92.3 87.1 47.9 46.5 28.8 76.0 65.2 96
97 Lampung Kota Bandar Lampung 57.7 78.5 57.1 74.6 72.4 57.3 56.9 43.3 61.3 65.2 97
98 NTT Kota Kupang 57.2 73.5 69.8 80.1 82.7 44.9 54.1 47.7 70.5 65.2 98
99 Bengkulu Kepahiang 83.9 83.8 55.3 72.9 82.7 38.5 40.4 29.2 59.9 65.1 99
100 West Sumatra Sijunjung 73.5 78.7 66.1 69.8 74.4 36.2 46.7 41.0 70.0 65.1 100
101 NTB Sumbawa Barat 71.8 64.9 68.6 95.1 92.5 77.9 55.8 37.5 79.2 64.9 101
102 Lampung Tanggamus 72.8 72.2 56.1 74.5 78.0 68.6 60.8 38.3 63.7 64.8 102
103 Southeast Sulawesi Kolaka Utara 94.3 67.8 71.5 91.3 100.0 77.1 61.0 2.1 94.2 64.8 103
104 NTT Manggarai 83.0 61.2 63.7 69.8 86.0 78.8 70.2 35.4 92.6 64.7 104
105 Bengkulu Bengkulu Utara 82.9 71.2 59.2 74.9 89.8 47.2 52.2 37.9 76.0 64.7 105

2011 Local Economic Governance Report
104
No. Provinces Regencies/Municipalities
Sub-Index
LEG
Inde
x
Rank
Land
Acc
ess
Loca
l Inf
rast
ruct
ure
Busi
ness
Lic
ensi
ng
Loca
l Reg
ulat
ions
Tran
sact
ion
Cost
s
Capa
city
and
Inte
grity
of
Rege
nts/
May
ors
Loca
l Gov
ernm
ent a
nd
Busi
ness
Inte
ract
ion
Busi
ness
Dev
elop
men
t Pr
ogra
ms
Secu
rity
and
Confl
ict
Reso
lutio
n
106 Southeast Sulawesi Kota Bau-Bau 51.4 65.1 63.7 90.6 68.6 60.7 58.3 68.6 77.4 64.7 106
107 North Maluku Kota Ternate 65.0 71.6 67.6 86.9 75.8 58.0 46.6 53.6 55.4 64.7 107
108 Papua Jayawijaya 66.5 80.0 52.4 67.9 82.8 60.0 66.6 18.1 64.2 64.7 108
109 Bengkulu Bengkulu Tengah 74.6 68.4 65.8 74.9 84.1 38.7 55.6 48.5 72.8 64.5 109
110 East Java Kota Surabaya 48.6 85.8 60.6 83.8 66.5 48.5 46.6 34.8 57.5 64.3 110
111 Papua Mimika 62.3 73.4 68.7 66.1 67.2 48.3 52.0 52.0 70.0 64.3 111
112 Southeast Sulawesi Konawe Utara 83.3 71.5 55.6 87.6 92.3 59.2 50.1 29.3 75.8 64.3 112
113 Banten Kota Cilegon 58.3 75.6 61.4 82.6 74.2 53.2 50.0 47.1 57.4 64.2 113
114 NTT Sumba Barat 87.6 71.9 70.2 86.9 95.5 42.9 51.6 24.7 47.2 64.2 114
115 Lampung Tulang Bawang Barat 71.4 66.5 60.4 80.4 85.2 60.1 63.2 42.8 56.4 64.0 115
116 South Kalimantan Tanah Bumbu 68.5 76.4 79.3 96.0 88.1 40.0 37.0 30.8 60.4 63.9 116
117 East Java Kota Malang 61.3 77.9 59.8 74.5 75.1 45.6 46.4 42.6 63.0 63.8 117
118 NTT Nagekeo 85.6 64.6 61.2 93.4 85.0 58.4 58.2 36.8 64.5 63.7 118
119 NTT Ngada 91.6 55.7 69.3 93.4 98.8 66.3 63.2 32.8 84.5 63.6 119
120 Central Kalimantan Kapuas 68.9 62.6 68.5 82.5 66.8 49.5 50.4 71.5 58.8 63.6 120
121 Bangka Belitung Bangka Barat 63.0 63.2 64.8 87.9 88.6 57.9 62.5 46.1 71.0 63.6 121
122 Central Sulawesi Banggai Kepulauan 86.3 73.0 62.8 86.0 88.7 42.4 54.3 18.2 71.6 63.5 122
123 Bengkulu Kaur 91.7 69.1 61.1 67.5 94.5 50.5 47.1 31.7 71.7 63.4 123
124 Bengkulu Seluma 85.8 68.4 63.3 74.2 88.9 45.3 52.9 31.2 76.8 63.3 124
125 Maluku Kota Ambon 47.4 68.9 58.4 93.4 66.2 53.9 54.6 63.7 55.4 63.2 125
126 NTT Belu 82.7 71.3 64.3 59.5 93.8 50.8 51.6 26.1 70.5 63.2 126
127 NTT Rote Ndao 83.1 72.9 61.2 90.2 89.1 34.4 44.2 28.6 76.7 63.1 127
128 East Java Banyuwangi 76.8 75.1 57.1 82.2 71.3 35.2 49.9 39.7 49.7 63.1 128
129 South Kalimantan Barito Kuala 71.5 75.7 68.6 75.0 88.3 53.8 44.5 24.9 60.2 63.1 129
130 NTT Timor Tengah Utara 75.4 67.3 60.0 88.6 75.5 31.1 43.7 59.4 64.8 62.9 130
131 Central Sulawesi Poso 88.8 63.5 65.0 84.9 82.1 51.9 54.6 37.2 72.4 62.9 131
132 Maluku Maluku Tengah 71.2 65.0 66.2 99.0 81.3 46.2 46.5 50.7 60.1 62.7 132
133 South Kalimantan Kota Banjarmasin 54.0 82.1 67.0 89.4 65.8 52.9 53.2 18.8 50.3 62.6 133
134 West Sumatra Padang Pariaman 70.5 70.4 55.5 74.1 63.3 40.5 46.5 61.0 55.1 62.6 134
135 South Kalimantan Banjar 72.3 77.8 63.7 70.5 64.7 48.3 49.8 27.5 63.9 62.6 135
136 Central Kalimantan Kotawaringin Timur 69.5 57.8 66.1 81.9 68.8 45.7 56.0 73.2 57.5 62.5 136
137 NTT Timor Tengah Selatan 58.9 68.3 68.4 94.4 80.9 29.6 51.3 46.5 73.1 62.5 137
138 Central Kalimantan Kotawaringin Barat 85.3 61.9 69.8 64.3 85.6 61.0 52.0 38.1 85.7 62.5 138
139 NTB Kota Mataram 51.8 71.1 59.6 88.4 56.0 52.8 48.0 61.4 58.5 62.4 139
140 West Kalimantan Melawi 81.4 69.3 69.2 88.9 89.8 54.7 54.9 11.8 77.6 62.3 140

Appendix: Local Economic Governance Index and Sub-Indices Values for Regencies/Municipalities
105KPP D
No. Provinces Regencies/Municipalities
Sub-Index
LEG
Inde
x
Rank
Land
Acc
ess
Loca
l Inf
rast
ruct
ure
Busi
ness
Lic
ensi
ng
Loca
l Reg
ulat
ions
Tran
sact
ion
Cost
s
Capa
city
and
Inte
grity
of
Rege
nts/
May
ors
Loca
l Gov
ernm
ent a
nd
Busi
ness
Inte
ract
ion
Busi
ness
Dev
elop
men
t Pr
ogra
ms
Secu
rity
and
Confl
ict
Reso
lutio
n
141 West Sumatra Agam 63.0 67.5 63.8 83.4 72.0 51.8 45.4 56.6 54.1 62.2 141
142 Bangka Belitung Kota Pangkalpinang 53.3 64.1 62.5 72.6 71.6 54.5 60.3 58.1 66.2 62.2 142
143 Southeast Sulawesi Kota Kendari 51.8 62.2 61.5 91.6 66.3 56.5 54.9 66.6 67.3 62.1 143
144 NTB Lombok Barat 77.5 68.1 39.1 90.9 74.4 66.1 47.2 47.2 65.5 62.1 144
145 Central Sulawesi Morowali 84.0 64.1 61.7 90.6 82.0 52.9 56.5 29.3 79.5 62.0 145
146 West Sumatra Pasaman Barat 60.1 67.2 56.1 93.0 77.2 53.3 47.4 55.0 52.9 62.0 146
147 Central Kalimantan Lamandau 80.5 65.8 61.1 64.5 95.1 58.0 45.6 31.2 87.3 61.7 147
148 Southeast Sulawesi Muna 71.5 60.1 61.9 89.3 81.5 60.1 50.8 50.0 72.5 61.6 148
149 East Java Situbondo 84.7 73.8 58.8 79.6 70.7 44.2 58.3 12.8 68.3 61.5 149
150 West Sumatra Pesisir Selatan 70.4 67.7 59.6 86.0 73.2 41.0 41.9 52.5 61.8 61.5 150
151 NTT Sikka 89.5 57.2 67.8 54.1 94.3 65.1 54.2 37.4 77.2 61.3 151
152 Papua Jayapura 59.4 71.6 56.6 85.8 67.2 60.8 62.2 27.7 55.4 61.2 152
153 Jambi Kerinci 77.8 65.4 52.6 66.4 76.9 46.4 54.0 48.1 47.9 61.1 153
154 West Kalimantan Kapuas Hulu 73.3 65.6 64.8 87.6 92.9 51.6 49.2 26.4 72.3 61.0 154
155 NTB Bima 79.1 64.8 56.0 87.2 77.5 33.5 44.3 51.5 59.0 61.0 155
156 NTB Lombok Timur 66.3 71.0 52.6 91.4 78.1 70.0 52.3 28.8 33.1 60.9 156
157 NTB Kota Bima 68.4 64.9 59.8 91.6 74.2 40.0 46.7 50.0 63.7 60.8 157
158 West Kalimantan Sintang 60.9 62.0 71.7 71.0 86.9 46.2 50.6 49.2 55.8 60.7 158
159 West Sumatra Limapuluh Kota 79.4 61.8 65.0 86.5 89.3 34.4 44.7 44.8 58.9 60.6 159
160 East Java Pacitan 78.8 66.1 80.8 94.2 89.9 30.0 42.5 19.0 84.4 60.4 160
161 NTT Lembata 83.4 60.9 70.0 79.8 93.7 41.8 49.7 28.0 81.0 60.4 161
162 West Kalimantan Sambas 79.9 69.5 49.3 71.9 75.5 48.4 46.6 32.4 70.0 60.2 162
163 North Maluku Halmahera Tengah 88.1 70.7 63.9 86.4 73.6 53.4 49.2 7.6 73.6 60.2 163
164 Southeast Sulawesi Kolaka 90.1 64.5 62.4 78.9 90.4 44.9 40.3 27.7 74.4 60.2 164
165 NTT Manggarai Barat 85.6 48.1 70.3 74.4 94.4 57.5 58.6 47.3 76.4 60.0 165
166 Central Kalimantan Barito Utara 90.8 57.6 70.9 78.8 85.6 53.8 41.1 36.2 86.2 60.0 166
167 West Kalimantan Kota Pontianak 66.3 64.9 63.7 65.1 70.3 46.0 52.3 46.1 54.4 59.9 167
168 Bangka Belitung Bangka Selatan 69.8 63.9 67.2 87.8 80.7 47.2 58.6 21.1 80.1 59.9 168
169 Central Kalimantan Barito Selatan 83.9 56.8 61.7 95.0 94.3 41.9 45.0 40.4 79.1 59.9 169
170 Southeast Sulawesi Buton Utara 76.9 50.2 51.5 93.4 80.6 87.1 65.4 40.6 89.4 59.9 170
171 NTT Sumba Barat Daya 87.0 58.2 58.6 86.9 100.0 60.4 57.7 18.1 72.7 59.8 171
172 East Java Pasuruan 75.5 77.1 55.6 87.3 62.8 21.9 32.3 36.7 43.7 59.7 172
173 Bengkulu Lebong 81.8 66.6 42.7 90.8 99.0 46.7 39.1 29.0 70.0 59.6 173
174 Jambi Tanjung Jabung Barat 83.2 60.1 57.9 71.4 95.7 37.7 46.9 39.0 70.6 59.6 174
175 West Sumatra Pasaman 71.1 65.8 55.3 89.5 81.6 45.8 45.2 36.3 62.0 59.6 175

2011 Local Economic Governance Report
106
No. Provinces Regencies/Municipalities
Sub-Index
LEG
Inde
x
Rank
Land
Acc
ess
Loca
l Inf
rast
ruct
ure
Busi
ness
Lic
ensi
ng
Loca
l Reg
ulat
ions
Tran
sact
ion
Cost
s
Capa
city
and
Inte
grity
of
Rege
nts/
May
ors
Loca
l Gov
ernm
ent a
nd
Busi
ness
Inte
ract
ion
Busi
ness
Dev
elop
men
t Pr
ogra
ms
Secu
rity
and
Confl
ict
Reso
lutio
n
176 Lampung Lampung Tengah 84.9 59.3 61.7 74.5 80.4 40.4 55.2 35.9 72.0 59.6 176
177 Bengkulu Mukomuko 68.1 68.3 55.3 84.8 89.7 41.8 44.0 28.6 68.9 59.6 177
178 NTT Kupang 83.2 69.7 57.1 77.7 73.5 41.9 44.4 23.6 66.1 59.4 178
179 Jambi Batanghari 61.4 67.1 58.5 55.2 81.1 44.3 49.5 40.8 60.0 59.3 179
180 West Kalimantan Kota Singkawang 59.9 66.1 55.7 93.4 85.7 28.4 43.5 44.2 53.2 59.1 180
181 Central Kalimantan Sukamara 81.3 58.1 59.8 89.6 74.2 54.8 43.3 42.9 79.2 59.0 181
182 Banten Kota Tangerang Selatan 55.3 75.9 51.6 90.8 60.0 36.9 38.3 39.2 51.0 59.0 182
183 West Kalimantan Bengkayang 68.2 68.0 61.3 69.4 90.2 45.3 43.7 24.0 72.4 59.0 183
184 West Kalimantan Ketapang 71.9 70.6 52.3 84.7 85.0 40.8 38.6 25.1 66.1 58.9 184
185 Jambi Kota Jambi 66.0 67.5 57.3 80.7 72.2 38.4 40.6 43.6 53.4 58.8 185
186 Lampung Mesuji 66.7 66.8 51.2 80.4 80.9 55.5 49.5 28.7 48.7 58.5 186
187 Banten Kota Tangerang 55.9 73.3 55.8 74.8 52.8 47.9 41.3 41.1 48.3 58.4 187
188 Banten Kota Serang 49.8 73.5 59.6 63.5 71.3 45.5 33.5 40.2 58.6 58.3 188
189 Banten Lebak 66.2 65.4 62.9 57.2 62.1 54.4 47.7 41.1 53.8 58.2 189
190 Jambi Bungo 57.0 79.9 46.4 86.9 81.3 37.0 31.6 27.8 16.2 58.2 190
191 Banten Tangerang 52.4 71.0 52.2 90.8 48.1 43.8 43.9 45.2 54.1 58.1 191
192 Southeast Sulawesi Wakatobi 63.1 54.9 44.4 89.6 70.1 82.1 65.4 38.9 73.3 58.0 192
193 Jambi Muaro Jambi 76.6 63.2 49.2 51.2 75.4 46.5 43.2 44.5 69.6 58.0 193
194 West Sulawesi Mamuju Utara 86.7 55.5 63.7 84.8 91.8 56.3 44.1 30.6 63.0 57.9 194
195 Southeast Sulawesi Buton 66.6 45.8 49.9 87.1 60.7 89.8 70.4 52.3 84.1 57.7 195
196 Papua Boven Digoel 73.9 70.1 55.2 83.3 45.3 45.6 29.1 71.6 57.7 196
197 Jambi Kota Sungai Penuh 67.9 58.4 60.0 66.4 72.2 38.5 43.7 58.3 54.0 57.7 197
198 Banten Pandeglang 56.9 65.7 58.3 76.2 56.5 40.4 42.3 54.4 44.6 57.7 198
199 West Papua Kota Sorong 63.2 66.1 54.9 78.9 56.4 52.2 49.7 36.4 54.7 57.5 199
200 Southeast Sulawesi Konawe Selatan 79.8 55.0 57.9 83.8 85.5 58.7 49.3 31.1 69.2 57.2 200
201 NTB Sumbawa 69.4 56.5 59.0 90.0 87.9 55.6 51.8 27.9 69.6 57.1 201
202 West Papua Teluk Wondama 71.3 54.1 58.8 93.4 83.8 67.9 58.4 23.5 69.3 57.0 202
203 Maluku Maluku Tenggara 65.2 56.1 65.5 76.9 80.3 47.5 45.3 43.8 64.1 56.9 203
204 NTB Dompu 75.0 54.0 67.0 82.5 78.2 34.8 41.2 49.1 67.0 56.9 204
205 North Maluku Kepulauan Sula 78.1 61.7 59.2 77.0 52.9 47.6 37.8 67.9 56.5 205
206 East Java Malang 77.0 68.8 49.5 93.3 65.0 37.7 32.2 31.1 39.1 56.3 206
207 Papua Nabire 65.0 62.0 65.9 64.2 52.0 62.1 31.5 61.9 55.8 207
208 West Kalimantan Sekadau 78.0 60.3 58.7 91.4 88.6 38.8 43.7 11.8 67.0 55.2 208
209 Banten Serang 56.7 67.6 56.3 69.5 44.2 41.9 34.6 41.3 57.2 54.7 209
210 North Maluku Halmahera Selatan 90.5 51.3 61.8 87.9 49.0 62.3 51.7 27.9 67.0 54.5 210

Appendix: Local Economic Governance Index and Sub-Indices Values for Regencies/Municipalities
107KPP D
No. Provinces Regencies/Municipalities
Sub-Index
LEG
Inde
x
Rank
Land
Acc
ess
Loca
l Inf
rast
ruct
ure
Busi
ness
Lic
ensi
ng
Loca
l Reg
ulat
ions
Tran
sact
ion
Cost
s
Capa
city
and
Inte
grity
of
Rege
nts/
May
ors
Loca
l Gov
ernm
ent a
nd
Busi
ness
Inte
ract
ion
Busi
ness
Dev
elop
men
t Pr
ogra
ms
Secu
rity
and
Confl
ict
Reso
lutio
n
211 NTB Lombok Utara 62.7 51.2 59.5 90.9 80.2 54.3 47.1 38.8 53.7 54.4 211
212 Central Kalimantan Katingan 76.0 63.2 57.1 84.3 52.3 18.9 29.9 36.0 84.1 54.3 212
213 Maluku Kota Tual 47.9 57.1 65.6 93.4 70.3 47.1 36.5 44.6 48.9 54.1 213
214 West Sulawesi Mamasa 81.6 50.7 58.5 78.8 92.4 38.4 41.1 31.9 64.5 54.1 214
215 Southeast Sulawesi Konawe 65.6 49.0 55.5 87.6 82.2 63.8 52.1 29.2 77.0 53.9 215
216 West Kalimantan Kubu Raya 76.1 50.9 54.5 100.0 74.0 44.5 49.9 30.7 58.1 53.9 216
217 NTB Lombok Tengah 63.3 60.0 50.6 69.5 71.4 35.1 38.9 39.6 49.5 53.7 217
218 Maluku Kepulauan Aru 83.3 49.9 70.1 76.9 89.2 49.2 45.3 14.8 72.1 53.5 218
219 North Maluku Halmahera Utara 76.9 44.7 63.0 54.6 80.3 52.2 51.4 41.9 57.1 53.2 219
220 West Kalimantan Landak 66.4 52.7 53.2 83.7 79.4 43.6 43.2 36.6 52.6 53.1 220
221 Central Kalimantan Barito Timur 86.9 46.9 62.2 77.7 87.0 51.1 30.2 34.2 82.9 53.0 221
222 Central Kalimantan Gunung Mas 57.2 62.4 31.1 85.7 72.3 49.0 37.9 27.0 84.4 53.0 222
223 Lampung Lampung Timur 69.1 74.9 39.8 79.8 80.7 32.9 29.3 0.0 2.4 51.8 223
224 Maluku Buru 81.5 51.2 51.2 78.1 94.6 27.4 35.0 21.9 83.1 51.7 224
225 Papua Kepulauan Yapen 42.4 63.0 56.8 93.4 82.5 24.9 28.2 22.4 61.7 51.3 225
226 West Kalimantan Sanggau 70.1 52.8 51.0 88.7 83.4 34.4 32.5 25.4 58.4 50.6 226
227 West Kalimantan Kayong Utara 72.7 49.0 44.4 92.1 92.8 37.9 38.7 23.7 52.5 50.2 227
228 Jambi Tanjung Jabung Timur 72.5 54.3 43.0 69.0 85.3 40.0 37.7 20.3 51.2 50.1 228
229 Jambi Merangin 56.1 55.9 51.8 75.2 83.8 14.9 32.6 32.1 54.4 50.1 229
230 Central Kalimantan Murung Raya 83.3 45.5 47.2 79.3 87.7 48.9 27.7 29.5 82.7 50.0 230
231 Papua Mappi 77.2 55.7 60.5 86.2 31.0 49.1 1.5 84.8 49.6 231
232 Papua Sarmi 54.3 46.7 46.9 65.9 35.5 46.1 58.8 72.6 49.0 232
233 Jambi Tebo 41.8 50.7 51.6 77.4 80.2 28.0 39.7 37.1 52.4 48.8 233
234 North Maluku Halmahera Timur 83.1 36.8 72.0 50.4 85.6 50.0 38.5 28.5 71.9 48.4 234
235 Papua Asmat 80.0 42.7 57.2 88.7 40.9 52.4 17.5 86.7 48.0 235
236 Maluku Maluku Tenggara Barat 58.0 42.3 56.2 94.2 79.1 37.7 38.8 27.7 73.1 47.6 236
237 Papua Keerom 70.5 38.8 49.2 77.1 79.7 22.8 37.0 50.4 41.3 47.5 237
238 Maluku Maluku Barat Daya 78.8 38.4 58.4 94.2 83.5 52.9 48.8 4.5 83.8 47.5 238
239 Southeast Sulawesi Bombana 64.0 38.0 39.0 65.3 49.3 49.3 77.8 23.9 87.0 47.4 239
240 North Maluku Pulau Morotai 72.3 40.6 54.4 57.2 89.0 38.3 42.0 23.9 46.6 46.6 240
241 West Papua Teluk Bintuni 59.5 31.0 55.7 91.6 79.6 53.4 46.4 30.9 63.9 45.2 241
242 North Maluku Halmahera Barat 67.0 39.0 54.0 47.9 79.2 34.8 34.0 29.1 73.7 44.8 242
243 Maluku Seram Bagian Timur 72.4 30.5 52.1 77.3 84.3 28.3 40.5 6.9 73.1 40.7 243
244 Maluku Seram Bagian Barat 64.7 39.7 52.9 88.0 65.3 19.3 25.0 12.4 62.1 40.6 244
245 Papua Waropen 45.7 29.5 54.0 88.9 89.5 29.3 28.6 25.5 53.0 39.4 245

108

Didukung oleh::!t
Australian Government</, AusAID
KPP~DKomlte Pemantauan Pelakaanaan Otonoml DaerahReg/ona' Autonomy Watch
Gedung Permata Kuningan 10th FI.JI. Kuningan Mulia Kav. 9CGuntur SetiabudiJakarta Selatan 12980Phone: +62 21 83780642/53Fax: +62 21 83780643Website: www.kppod.org
.The Asia FoundationThe Asia FoundationPO BOX 6793 )KSRBJakarta 12067Tel: +62 21 72788424Fax: +62 21 7203123Website: http://asiafoundation.org/Email: [email protected]
Copyright © 2022 FDOKUMEN