2–15–07 Vol. 72 No. 31 Thursday Feb. 15, 2007 Pages 7345 ...
Upload
khangminh22Category
view
2download
0
Advances in Clinical and Experimental M
edicine2022, Vol. 31, N
o. 1 (January)
Advances in Clinical and Experimental Medicine
Impact Factor (IF) – 1.727Ministry of Science and Higher Education – 70 ptsIndex Copernicus (ICV) – 166.39 pts
2022, Vol. 31, No. 1 (January)
MONTHLY ISSN 1899-5276 (PRINT) ISSN 2451-2680 (ONLINE) www.advances.umw.edu.pl

Advances in Clinical and Experimental M
edicine2022, Vol. 31, N
o. 1 (January)
Advances in Clinical and Experimental
Medicine

ISSN 1899-5276 (PRINT) ISSN 2451-2680 (ONLINE) www.advances.umw.edu.pl
Advances in Clinical and Experimental Medicine
MONTHLY 2022 Vol. 31, No. 1 (January)
Editor-in-ChiefProf. Donata Kurpas
Deputy EditorProf. Wojciech Kosmala
Managing EditorMarek Misiak
Advances in Clinical and Experimental Medicine (Adv Clin Exp Med) publishes high quality original articles, research-in-progress, research letters and systematic reviews and meta-analyses of recognized scientists that deal with all clinical and experimental medicine.
Section EditorsBasic SciencesProf. Iwona Bil-LulaProf. Bartosz KempistyDr. Anna LebedevaDr. Mateusz OlbromskiDr. Maciej SobczyńskiBiochemistryProf. Małgorzata Krzystek-Korpacka Clinical Anatomy, Legal Medicine,
Innovative TechnologiesProf. Rafael Boscolo-BertoDentistryProf. Marzena Dominiak Prof. Tomasz Gedrange Prof. Jamil Shibli
Scientific CommitteeProf. Sabine Bährer-Kohler Prof. Antonio Cano Prof. Breno Diniz Prof. Erwan Donal Prof. Chris Fox Prof. Naomi Hachiya Prof. Carol Holland Prof. Markku Kurkinen Prof. Christos Lionis
Statistical EditorsWojciech Bombała, MScKatarzyna Giniewicz, MSc Eng.Anna Kopszak, MScDr. Krzysztof Kujawa
Manuscript editingMarek Misiak, Jolanta Krzyżak
Prof. Raimundo Mateos Prof. Zbigniew W. Ras Prof. Jerzy W. Rozenblit Prof. Silvina Santana Prof. James Sharman Prof. Jamil ShibliProf. Michal Toborek Prof. László Vécsei Prof. Cristiana Vitale
DermatologyProf. Jacek Szepietowski Emergency Medicine, Innovative TechnologiesProf. Jacek Smereka Gynecology and ObstetricsProf. Olimpia Sipak-SzmigielHistology and EmbryologyProf. Marzenna Podhorska-Okołów Internal Medicine
AngiologyDr. Angelika ChachajCardiologyProf. Wojciech Kosmala Dr. Daniel Morris
Editorial Officeul. Marcinkowskiego 2–6 50-368 Wrocław, PolandTel.: +48 71 784 11 36 E-mail: [email protected]
PublisherWroclaw Medical UniversityWybrzeże L. Pasteura 1 50-367 Wrocław, Poland
Online edition is the original version of the journal
Editorial Policy Advances in Clinical and Experimental Medicine (Adv Clin Exp Med) is an independent multidisciplinary forum for exchange of scientific and clinical information, publishing original research and news encompassing all aspects of medicine, including molecular biology, biochemistry, genetics, biotechnology and other areas. During the review pro-cess, the Editorial Board conforms to the “Uniform Requirements for Manuscripts Submitted to Biomedical Journals: Writing and Editing for Biomedical Publication” approved by the International Committee of Medical Journal Editors (www.ICMJE.org/). The journal publishes (in English only) original papers and reviews. Short works considered origi-nal, novel and significant are given priority. Experimental studies must include a statement that the experimental protocol and informed consent procedure were in compliance with the Helsinki Convention and were approved by an ethics committee.
For all subscription-related queries please contact our Editorial Office: [email protected]
For more information visit the journal’s website: www.advances.umw.edu.pl
Pursuant to the ordinance No. 134/XV R/2017 of the Rector of Wroclaw Medical University (as of December 28, 2017) from January 1, 2018 authors are required to pay a fee amounting to 700 euros for each manuscript accepted for publication in the journal Advances in Clinical and Experimental Medicine.
Indexed in: MEDLINE, Science Citation Index Expanded, Journal Citation Reports/Science Edition, Scopus, EMBASE/Excerpta Medica, Ulrich’sTM International Periodicals Directory, Index Copernicus
Typographic design: Piotr Gil, Monika KolędaDTP: Wydawnictwo UMWCover: Monika KolędaPrinting and binding: Drukarnia I-BiS Bierońscy Sp.k.
EndocrinologyProf. Marek BolanowskiGastroenterologyProf. Piotr EderAssoc. Prof. Katarzyna Neubauer HematologyProf. Andrzej DeptałaProf. Dariusz Wołowiec Nephrology and TransplantologyAssoc. Prof. Dorota Kamińska Assoc. Prof. Krzysztof Letachowicz PulmonologyProf. Elżbieta Radzikowska
MicrobiologyProf. Marzenna Bartoszewicz Assoc. Prof. Adam Junka Molecular BiologyDr. Monika BieleckaProf. Jolanta Saczko Dr. Marta Sochocka NeurologyAssoc. Prof. Magdalena KoszewiczAssoc. Prof. Anna Pokryszko-Dragan Dr. Masaru Tanaka
OncologyProf. Andrzej DeptałaDr. Marcin Jędryka Prof. Lucyna Kępka
Gynecological OncologyDr. Marcin Jędryka
OphthalmologyProf. Marta Misiuk-Hojło OrthopedicsProf. Paweł Reichert OtolaryngologyAssoc. Prof. Tomasz Zatoński Pediatrics
Pediatrics, Metabolic Pediatrics, Clinical Genetics, Neonatology, Rare DisordersProf. Robert Śmigiel Pediatric NephrologyProf. Katarzyna Kiliś-Pstrusińska Pediatric Oncology and HematologyAssoc. Prof. Marek Ussowicz
Pharmaceutical SciencesAssoc. Prof. Maria KepinskaProf. Adam Matkowski
Pharmacoeconomics, RheumatologyDr. Sylwia Szafraniec-Buryło PsychiatryProf. Istvan BoksayProf. Jerzy Leszek Public HealthProf. Monika Sawhney Prof. Izabella Uchmanowicz Qualitative Studies, Quality of CareProf. Ludmiła Marcinowicz RadiologyProf. Marek SąsiadekRehabilitationProf. Jakub Taradaj SurgeryAssoc. Prof. Mariusz Chabowski Prof. Renata Taboła Telemedicine, Geriatrics, MultimorbidityAssoc. Prof. Maria Magdalena
Bujnowska-Fedak

MONTHLY 2022, Vol. 31, No. 1 (January)
ISSN 1899-5276 (PRINT) ISSN 2451-2680 (ONLINE)
www.advances.umw.edu.pl
Advances in Clinical and Experimental Medicine
Contents
Editorials5 Zbigniew Raś
Reduction of hospital readmissions
Original papers9 Jun Yang, Youxin Liao, Yonghong Dai, Ling Hu, Yihong Cai
Prediction of prognosis in sepsis patients by the SOFA score combined with miR-150
17 Conghui Zhu, Guanfeng Chen, Jiadi Yao, Wenji LinEffect of infection after liver cancer interventional therapy on T lymphocyte subsets and Toll-like receptors in peripheral blood mononuclear cells and its mechanism
25 Małgorzata Godala, Ewa Sewerynek, Ewelina GaszyńskaVitamin D status in Polish women with endocrine and osteoporotic disorders in relation to diet, supplement use and exposure to ultraviolet radiation
33 Agata Ewa Kaczyńska, Adam Kosiński, Katarzyna Bobkowska, Miłosz Andrzej Zajączkowski, Rafał Kamiński, Grzegorz Marek Piwko, Marta Gleinert-Rożek, Tomasz Gos, Karol Karnecki, Dariusz KozłowskiClinical anatomy of the spatial structure of the right ventricular outflow tract
41 Joanna Budny-Wińska, Aleksandra Zimmer-Stelmach, Michał PomorskiImpact of selected risk factors on uterine healing after cesarean section in women with single-layer uterine closure: A prospective study using two- and three-dimensional transvaginal ultrasonography
49 Lifeng An, Dandan Zhu, Xin Zhang, Jingwen Huang, Guangbao LuIsoastilbin inhibits neuronal apoptosis and oxidative stress in a rat model of ischemia-reperfusion injury in the brain: Involvement of SIRT1/3/6
59 Jingjing Guo, Zhu Wang, Ming Xue, Lei Mi, Mengpeng Zhao, Chao Ma, Jian Wu, Xinqiang HanMetformin protects against abdominal aortic aneurysm by Atg7-induced autophagy
71 Ayşegül Çopur Çiçek, Vicdan Şemen, Nebahat Aydoğan Ejder, Deniz Zehra Ulusan Gündoğdu, Sema Koçyiğit Kalcan, Fatma Tufan Köse, Osman Birol ÖzgümüşMolecular epidemiological analysis of integron gene cassettes and tetA/tetB/tetD gene associations in Escherichia coli strains producing extended-spectrum β-lactamase (ESBL) in urine cultures
81 Edyta Banaczkowska-Duda, Alicja Bieńkowska-Tokarczyk, Maciej MałeckiGene capsules as functional pharmaceutical formulations for delivery of DNA as an active substance
Reviews95 Grzegorz Charliński, Artur Jurczyszyn
Non-secretory multiple myeloma: Diagnosis and management


Cite asRaś Z. Reduction of hospital readmissions. Adv Clin Exp Med. 2022;31(1):5–8. doi:10.17219/acem/144413
DOI10.17219/acem/144413
CopyrightCopyright by Author(s) This is an article distributed under the terms of theCreative Commons Attribution 3.0 Unported (CC BY 3.0)(https://creativecommons.org/licenses/by/3.0/)
Address for correspondenceZbigniew RaśE-mail: [email protected]
Funding sourcesNone declared
Conflict of interestNone declared
Received on November 23, 2021Accepted on December 1, 2021
Published online on January 7, 2022
AbstractIn recent years, healthcare spending has risen and become a burden on many governments. There are multiple reasons for this increase such as overtesting, long medical treatment path, ignoring doctors’ orders, ineffective use of technologies, medical errors, many hospital readmissions, unnecessary emergency room (ER) visits, and medical treatment acquired side effects and infections. The first part of this editorial presents Health-care Cost and Utilization Project (HCUP) datasets and their hierarchical partition used to build hierarchically structured personalized recommendation systems in healthcare domain. The second part outlines a simple strategy for reducing the number of readmissions using the concept of action rules to provide recommenda-tions. First, we extract from HCUP datasets all possible procedure paths (course of treatments) for a given initial medical procedure. Then, we cluster patients according to the similarities in their diagnoses in order to increase the predictability of the course of treatment following this initial procedure. Finally, we present a novel algorithm that provides recommendations (actionable knowledge) to the physicians to put patients on a treatment path that would result in optimal reduction of the number of readmissions for these patients. There is not much research done on decreasing the number of readmissions to hospitals after initial procedure and almost none based on action rules.
Key words: recommendation systems, hospital readmissions, HCUP data, procedure graph, actionable knowledge
Editorials
Reduction of hospital readmissions
Zbigniew RaśD
Computer Science Department, University of North Carolina, Charlotte, USA
A – research concept and design; B – collection and/or assembly of data; C – data analysis and interpretation; D – writing the article; E – critical revision of the article; F – final approval of the article
Advances in Clinical and Experimental Medicine, ISSN 1899–5276 (print), ISSN 2451–2680 (online) Adv Clin Exp Med. 2022;31(1):5–8

Z. Raś. Reduction of hospital readmissions6
Introduction
There are many papers focused on predicting hospital readmissions,1–4 especially predicting hospital admissions and readmissions to emergency or intensive care units.5–11 This editorial focuses on the basics of a knowledge-based recommendation system12,13 for decreasing the number of readmissions to hospitals, based on actionable knowl-edge extracted from medical datasets, using the concept of action rules14–16 to provide recommendations. There is not much research done on decreasing the number of re-admissions to hospitals after initial procedure and almost none based on action rules.8
This editorial presents the results obtained from mining the Florida State Inpatient Database (SID) that is a part of the Healthcare Cost and Utilization Project (HCUP17). The SID datasets are primarily a state-level discharge data collected from nonfederal community hospitals constitut-ing most of the hospitals in the USA. The SID includes patients’ demographic data, such as race, age and gender. In addition to the demographic information, SID includes patients’ medical data, such as diagnoses and medical procedures. The main table in SID is the core table that contains over 280 features. Two types of coding schemes are used in the core table for labeling and formatting: (1) The International Classification of Diseases, 9th Revi-sion, Clinical Modification (ICD-9-CM), (2) The Clinical Classifications Software (CCS). The ICD-9-CM coding uses more codes to label the procedures and diagnoses, whereas the CCS is a generalized and collapsed version of the ICD-9-CM. There are 15,072 diagnosis categories and 3948 procedure categories in the ICD-9-CM. Clinical
Classifications Software clusters them into 285 diagnosis categories and 231 procedure categories.
Procedure graph
The ordered sequence of primary medical procedures representing procedure P followed by all procedures a sin-gle patient had after procedure P during the whole course of treatment in a hospital is called a procedure path for P.13
By a procedure graph,13 for a medical procedure P, we mean a directed graph representing a collection of all procedure paths for P extracted from the Florida SID, as-sociated with patients during their course of treatment. The procedure graph can be used by physicians to visual-ize all possible outcomes which took place in Florida state hospitals after performing the initial procedure P. Nodes in the graph represent medical procedures that could be minor, such as breast biopsy, arthroscopy or laparoscopy, or that could be major, such as cesarean section, organ replacement or heart surgeries. The length of a path with a starting node P in a procedure graph gives the number of hospital readmissions after P. Figure 1 shows an example of the procedure graph for a procedure P(0,1). The numbers assigned to arrows represent the number of patients fol-lowing that path and numbers in the dashed squares, above each procedure, represent the number of patients who had that procedure and did not come back to the hospital. Each node in a procedure graph is represented as term P(n,m), where n refers to the level of the node in a graph (distance from the initial node), which is the number of current readmissions, and m represents the path identifier.
Fig. 1. Procedure graph and score function

Adv Clin Exp Med. 2022;31(1):5–8 7
For example, P(1,3) refers to the procedure node repre-senting the 1st readmission to the hospital and belonging to the 3rd path in the procedure graph. Now, from the pro-cedure graph, we can predict the most probable procedure path which follows the procedure P(i,j) for any i and j. Func-tion “score” is used to evaluate nodes in the procedure graph (see Fig. 1). The number of procedures directly following procedure Px is denoted by n, and |Pk| denotes the number of patients who underwent the kth procedure in a specific path. The Pk denotes the kth procedure right after Px.
The procedure score function assigned to a node in a procedure graph calculates the average number of readmissions after undergoing the procedure assigned to that node. It is a backward function which begins by as-signing 0 score to all leaves of the procedure graph, which is the same as assigning 0 readmissions to them. Next, the procedure score function is calculated by moving back-ward until it reaches the starting node (initial procedure) of the graph. Figure 1 shows the scores assigned to all nodes in the procedure graph. The score 1.323 assigned to procedure P(0,1) means that the average number of re-admissions for all patients who underwent this procedure is 1.323. It also means that 1.323 is the expected num-ber of readmissions for a new patient scheduled to take procedure P(0,1).
Hierarchical clustering
The algorithm7 is hierarchical and splits patients re-corded in HCUP data into clusters using the concept of positive and negative sets. The positive set (P-Set), also called the included set, is a set of diagnoses that a patient must exhibit in order to belong to a certain cluster. Sim-ilarly, the negative set (N-Set), also called the excluded set, is a set of diagnoses a patient cannot exhibit in order to belong to a given cluster. From now on, we will use notation (P-Set, N-Set) to define a cluster of patients re-corded in HCUP data. For example, taking CCS coding, the label [{157}, {−3, −48}] identifies patients (on the 3rd level of granularity – 3 diagnoses are listed) having positive di-agnosis 157 (included set) and negative diagnoses 3 and 48 (excluded set). In CCS coding, diagnosis 3 means bacterial infection, 48 means thyroid disorders, while 157 means acute and unspecified renal failure. More diagnoses are used in the labels, smaller are constructed granules and personalization is deeper.
The main goal of this clustering is to partition the pa-tients into subgroups using their common characteristics as the filtering tool. Such process is called personalization of patients, which increases the predictability of the fol-lowing procedures in the procedure graph and decreases the value of procedure score function (decreases the antici-pated number of readmissions). Higher level of personaliza-tion is achieved by using labels containing more diagnoses
and the same producing smaller granules. The number of generated clusters will keep increasing when granules are getting smaller. Therefore, there is a need to use a filter-ing technique to reduce the number of generated clusters. Clearly, if a majority of patients have a common diagnosis or do not have it, then this diagnosis will not play a signifi-cant role in determining the state in which the patients will end up. We tested 4 thresholds (5%, 10%, 15%, and 20%) and it looks like the optimal cut (in terms of generated clusters and time complexity) should be between 15% and 20%.
Reducing the number of readmissions
In this section, we present a new method for construct-ing medical recommendations to be used by physicians for placing a patient on the shorter, more successful and safer procedure path. The number of anticipated hospi-tal readmissions will be decreased as well. Let us pres-ent an example based on Florida State HCUP dataset and CCS coding to explain how these recommendations are constructed.
Figure 2 refers to kidney transplant procedure. If a new patient is assigned to cluster 1 identified by label [{106}, {−53, −156}], then we cannot enhance the patient’s medi-cal status, as this cluster has the minimum score among the 3 clusters shown in Fig. 2. However, if a patient belongs to any of the 2 remaining clusters, then we can provide a medical recommendation allowing the patient to fol-low the same path as patients in cluster 1. If we do that, the number of readmissions for this patient should de-crease by 48%–52%.
The interpretation for all recommendation actions used in Fig. 2 is as follows:
• (d → d): keep diagnostic code d for patients in the de-sired cluster;
• (∼ → −d): patients in the desired cluster cannot have diagnostic code d;
• (d → −d): diagnostic code d has to be treated;• (∼ → d): patients in the desired cluster need to have
diagnostic code d.The largest gain in the procedure score is achieved
by following the recommendations for patients assigned to cluster 3 identified by label [{53, 106}, {−3}], which will move them to cluster 1. These patients additionally cannot have disorder 156.
The recommendation that the system will provide to the physician is to treat diagnostic code 53 (53 → −53) for patients in cluster 3 who do not have disorders identi-fied by diagnostic code 156. By following this recommen-dation, patients in cluster 3 should end up with the same outcomes as patients in cluster 1. It is worth mentioning that lifestyle changes and drugs are sufficient to treat dis-order 53. This will result in 0.5 reduction of hospital re-admissions scoring function for these patients (see Fig. 2).

Z. Raś. Reduction of hospital readmissions8
ORCID iDsZbigniew Raś https://orcid.org/0000-0002-8619-914X
References1. Almardini M, Raś ZW. A supervised model for predicting the risk
of mortality and hospital readmissions for newly admitted patients. In: Kryszkiewicz M, Appice A, Ślęzak D, Rybinski H, Skowron A, Raś Z, eds. Foundations of Intelligent Systems. Cham, Switzerland: Springer; 2017:29–36. doi:10.1007/978-3-319-60438-1_3
2. Vedomske MA, Brown DE, Harrison JH. Random forests on ubiqui-tous data for heart failure 30-day readmissions prediction. Paper presented at: 12th International Conference on Machine Learning and Applications; December 4, 2013; Washington, USA. doi:10.1109/ICMLA.2013.158
3. Veloso RF, Portela F, Santos MF, et al. Clustering approach for predict-ing readmissions in intensive medicine. Procedia Technology. 2014;16: 1307–1316. doi:10.1016/J.PROT CY.2014.10.147
4. Vukicevic M, Radovanovic S, Kovacevic A, Stiglic G, Obradovic Z. Improving hospital readmission prediction using domain knowledge based virtual examples. Lect Notes Bus Inf Process. 2015;224:695–706. doi:10.1007/978-3-319-21009-451
5. Fernandes MPB, Silva CF, Vieira SM, Sousa JMC. Multi-modeling for the prediction of patient readmissions in intensive care units. Paper presented at: 2014 IEEE International Conference on Fuzzy Systems (FUZZ-IEEE); July 6, 2014; Beijing, China. doi:10.1109/FUZZ-IEEE.2014.6891779
6. Lisowska A, Szwamel K, Kurpas D. Somatic symptoms and level of anx-iety and depression in self-referral patients at the emergency depart-ment. Med Sci Pulse. 2020;14(1):1–23. doi:10.5604/01.3001.0014.0685
7. Rocha CN, Rodrigues F. Forecasting emergency department admis-sions. J Intel Inf Syst. 2021;56(3):509–528. doi:10.1007/s10844-021-00638-9
8. Shams I, Ajorlou S, Yang K. A predictive analytics approach to reduc-ing 30-day avoidable readmissions among patients with heart fail-ure, acute myocardial infarction, pneumonia, or COPD. Health Care Manag Sci. 2015;18(1):19–34. doi:10.1007/s10729-014-9278-y
9. Silva C, Vieira SM, Sousa JMC. Fuzzy decision tree to predict readmis-sions in intensive care unit. In: Moreira A, Matos A, Veiga G, eds. Con-trolo’2014 – Proceedings of the 11th Portuguese Conference on Automatic Control. Cham, Switzerland: Springer; 2015:365–373. doi:10.1007/978-3-319-10380-835
10. Szwamel K, Kurpas D. Assessment of the health care system function-ing in Poland in light of the analysis of the indicators of the hospital emergency department (ED) and primary health care (PHC) – propos-als for systemic solutions. Fam Med Prim Care Rev. 2019;21(2):164–173. doi:10.5114/fmpcr.2019.84553
11. Szwamel K, Kurpas D. Unmet needs in emergency department patients as an important aspect of the increasing number of hospi-talizations. Fam Med Prim Care Rev. 2017;19(3):261–269. doi:10.5114/fmpcr.2017.68753
12. Mardini M, Hashky A, Ras ZW. Personalizing patients to enable shared decision making. In: Ras ZW, Wieczorkowska A, Tsumoto S. Recom-mender Systems for Medicine and Music. Cham, Switzerland: Springer; 2021:75–90. doi:10.1007/978-3-030-66450-3_5
13. Mardini M, Ras ZW. Discovering primary medical procedures and their associations with other procedures in HCUP data. Inf Sys Front. 2020. doi:10.1007/s10796-020-10058-9
14. Ras ZW, Dardzinska A, Tsay LS, Wasyluk H. Association action rules. Paper presented at: 2008 IEEE International Conference on Data Min-ing Workshops; December 15, 2008; Pisa, Italy. doi:10.1109/ICDMW. 2008.66
15. Ras ZW, Wieczorkowska A. Action-rules: How to increase profit of a company. In: Zighed DA, Komorowski J, Żytkow J, eds. Principles of Data Mining and Knowledge Discovery. PKDD 2000. Berlin, Germany: Springer; 2002:587–592. doi:10.1007/3-540-45372-5_70
16. Tsay LS, Ras ZW. Action rules discovery: System DEAR2, method and experiments. J Exp Theor Artif. 2004;17(1–2):119–128. doi:10.1080/0952 8130512331315855
17. Agency for Healthcare Research and Quality. Healthcare Cost and Utilization Project (HCUP). https://www.hcup-us.ahrq.gov/. Accessed December 2, 2021.
18. Hajja A, Touati H, Ras ZW, Studnicki J, Wieczorkowska A. Predicting negative side effects of surgeries through clustering. In: Appice A, Ceci M, Loglisci C, Manco G, Masciari E, Ras Z, eds. New Frontiers in Mining Complex Patterns. Cham, Switzerland: Springer; 2015:41–55. doi:10.1007/978-3-319-17876-9_3
Fig. 2. Kidney transplant recommending actions
Meaning of the diagnostic codes provided in Healthcare Cost and Utilization Project (HCUP) data with Clinical Classifications Software (CCS) coding: 3 – bacterial infection; 48 – thyroid disorders; 53 – disorders of lipid metabolism; 106 – cardiac dysrhythmias; 156 – nephritis, nephrosis, renal sclerosis; 157 – acute and unspecified renal failure.
{53, 106}{-3}
{157}{-3, -48}
{106}{-53, -156}
0.61490.1136 0.5397
no recommendations
53 � -53~ � -156106 � 106
~ � 106~ � -53~ � -156
0.50.43
score
clusters
included/excluded sets
recommendations
readmissionreduction
intervention
disorder 53 can be effectively treated by lifestyle changes and drugs

Cite asYang J, Liao Y, Dai Y, Hu L, Cai Y. Prediction of prognosis in sepsis patients by the SOFA score combined with miR-150. Adv Clin Exp Med. 2022;31(1):9–15. doi:10.17219/acem/142536
DOI10.17219/acem/142536
CopyrightCopyright by Author(s) This is an article distributed under the terms of theCreative Commons Attribution 3.0 Unported (CC BY 3.0)(https://creativecommons.org/licenses/by/3.0/)
Address for correspondenceLing HuE-mail: [email protected]
Funding sourcesNone declared
Conflict of interestNone declared
Received on July 28, 2021Reviewed on September 5, 2021Accepted on September 23, 2021
Published online on October 5, 2021
AbstractBackground. The sequential organ failure assessment (SOFA) score, designed to evaluate sepsis-associated organ dysfunction in intensive care unit (ICU) patients, is associated with the prognosis of sepsis patients. MicroRNA-150 (miR-150) is one of the first miRs to be detected in patients with sepsis and other critical illnesses, and to have an association with the prognosis of critical illness and sepsis.
Objectives. To assess the predictive value of the combination of the SOFA score and miR-150 levels for the prognosis of sepsis patients.
Materials and methods. We retrospectively included 437 adult patients with sepsis who were divided into a death group (n = 138, 31.6%) and a survival group (n = 299, 68.4%), according to their survival status at the 28-day follow-up. Binary logistic regression was performed to identify independent associations. Receiver operator characteristic (ROC) curve was employed to assess the predictive values. The Z-test was used to compare the area under curve (AUC).
Results. Multivariate analysis demonstrated that miR-150 (odds ratio (OR): 0.549, 95% confidence interval (95% CI) [0.372, 0.826], p < 0.001), the SOFA score (OR: 1.216, 95% CI [1.039, 1.807], p = 0.008), age, procalcitonin (PCT), and septic shock were independently associated with 28-day mortality of sepsis patients following the adjustment for chronic renal failure, hypertension, diabetes mellitus, activated partial throm-boplastin time (APTT), serum creatinine (SCr), blood urea nitrogen (BUN), and total bilirubin (TBil). The AUC of miR-150, the SOFA score and their combination in predicting the 28-day mortality of sepsis patients was 0.762 (standard error (SE): 0.023, 95% CI [0.717, 0.808]), 0.735 (SE: 0.025, 95% CI [0.687, 0.784]) and 0.886 (SE: 0.015, 95% CI [0.857, 0.916]), respectively. The AUC of their combined prediction was significantly greater than the independent prediction (0.886 compared to 0.762, Z = 4.516, p < 0.001; 0.886 compared to 0.735, Z = 5.179, p < 0.001). The sensitivity and specificity of combination prediction were 86.2% and 80.6%, respectively.
Conclusions. The combination of the SOFA score and miR-150 could improve the prediction of prognosis in sepsis patients.
Key words: prognosis, sepsis, prediction, sequential organ failure assessment score, miR-150
Original papers
Prediction of prognosis in sepsis patients by the SOFA score combined with miR-150
Jun Yang1,B–D, Youxin Liao2,C,E, Yonghong Dai1,B,C, Ling Hu1,A,C,E,F, Yihong Cai3,A,C,E
1 Department of Critical Care Medicine, Central Hospital of Jiangjin District, Chongqing, China2 Department of Medical Administration, Central Hospital of Jiangjin District, Chongqing, China3 Department of Pediatrics, Central Hospital of Jiangjin District, Chongqing, China
A – research concept and design; B – collection and/or assembly of data; C – data analysis and interpretation; D – writing the article; E – critical revision of the article; F – final approval of the article
Advances in Clinical and Experimental Medicine, ISSN 1899–5276 (print), ISSN 2451–2680 (online) Adv Clin Exp Med. 2022;31(1):9–15

J. Yang et al. Prediction of prognosis in sepsis patients10
Background
Sepsis, defined as a life-threatening organ dysfunction, is induced by an altered systemic host response to infection.1 It is the major cause of intensive care unit (ICU) admission and is correlated with concurrent multiple organ dysfunction syndrome.2,3 Sepsis and subsequent multiple organ failure account for a large portion of morbidity and mortality in ICU patients.4,5 In spite of advances in sepsis awareness and man-agement, it still has a high mortality rate.6,7 Thus, it is critical to precisely evaluate the prognosis of patients with sepsis.
The pathogenesis of sepsis is complex, and a variety of different factors may affect its prognosis. The sequential organ failure assessment (SOFA) score, designed to evalu-ate sepsis-associated organ dysfunction in ICU patients,8 is associated with the prognosis of sepsis patients.9 How-ever, this scoring system does not include any factors as-sociated with pathophysiology of sepsis itself, and only assesses relevant clinical parameters. Established bio-markers for sepsis patients mainly included procalcitonin (PCT), C-reactive protein (CRP) and interleukin-6 (IL-6), but they are nonspecific and have a limited diagnostic value. Considerable efforts have been made to identify new biomarkers in the context of sepsis. Recently, microRNAs (miRs) have received extensive attention in sepsis research. The miRs play a crucial role in both, innate and adap-tive immunity in pathological disorders, such as bacterial infection, atherosclerosis, diabetes, and rheumatoid ar-thritis.10 Many miRs regulate proinflammatory processes in sepsis through the direct targeting of the tumor ne-crosis factor (TNF) signaling pathway. In addition, miRs can modulate the expressions of sepsis-related genes, such as TNF and IL-6, 2 genes which can themselves regulate the expression of certain miRs, demonstrating their deep involvement in the pathogenesis of sepsis. The miR-150 is one of the first to be detected in patients with sepsis and critical illness. It has previously been confirmed that miR-150 is associated with the prognosis of critical illness and sepsis.11
Objectives
Herein, we investigated whether a combination of the SOFA score and miR-150 could predict the prog-nosis of sepsis patients.
Materials and methods
Patients
A total of 487 adult patients with sepsis who were admit-ted to the Department of Critical Care Medicine of Central Hospital of Jiangjin District (Chongqing, China) according to the Sepsis-3 classification criteria,1 were retrospectively
recruited between January 2018 and June 2020. All medical and nursing data were reviewed by the consulting physi-cian, the components of the SOFA score for each system were collected and the SOFA score on day 1 following ad-mission was computed. The patients were divided into the “death group” and “survival group”, according to their survival status at the 28-day follow-up. This study con-formed to the Declaration of Helsinki and was approved by the Ethical Committee of Central Hospital of Jiangjin District, Chongqing (approval No. JJ2018017036). Writ-ten informed consent was obtained from either patients or their legal guardians.
Inclusion and exclusion criteria
Study inclusion criteria consisted of: 1) meeting the Sep-sis-3 classification criteria; 2) age ≥18 years and <90 years; and 3) completed medical and nursing data. Exclusion cri-teria included: 1) pulmonary embolism, acute myocardial infarction, cancer, trauma, and human immunodeficiency virus (HIV) infection; 2) breastfeeding or pregnancy; 3) re-cent major surgeries; and 4) patients lost to follow-up.
Detection of miR-150 expression levels using quantitative real-time polymerase chain reaction
Peripheral blood samples were collected prior to thera-peutic interventions, centrifuged at 2000 g for 10 min and then stored at −70°C until the detection of miR-150. Total RNA was extracted with TRIzol (Invitrogen, Waltham, USA). The 1st strand of miR-150 was synthesized using 2 μg total RNA through the miRNA First Strand cDNA Synthesis Tailing Reaction Kit (Sangon Biotech, Shang-hai, China). Quantitative real-time polymerase chain re-action (qRT-PCR) was conducted with a 7500 Real-Time PCR System (Applied Biosystems, Waltham, USA), us-ing iQ SYBR® Green Supermix (Bio-Rad, Hercules, USA). The U6 was used as a reference gene. The miR-150 ex-pression levels were evaluated using the 2–ΔΔCt method. The primers were synthesized by Sangon Biotech as fol-lows: 5′-TCTCCCAACCCTTGTACCAGTG-3′ for miR-150 forward, 5′-GCAAATTCGTGAAGCGTTCCATA-3′ for U6 forward and 5′-AACGAGACGACGACAGAC-3′ for the universal miR primer.
Statistical analyses
The normality of continuous variables was tested with the Kolmogorov–Smirnov test. Among them, the normally distributed variables were described using the mean ± standard deviation (SD) and compared for intergroup differences with Student’s t test. Non-normally distributed variables were described using the median (M) and interquartile range (IQR), and they were compared for intergroup differences using a Mann–Whitney U test.

Adv Clin Exp Med. 2022;31(1):9–15 11
Categorical variables were described with number and percentage (%) and compared for intergroup differences with a χ2 test. Then, binary logistic regression analysis was performed for two-sided variables, and p < 0.10 was used in univariate analysis to identify independent associa-tions. Receiver operator characteristic (ROC) curve was employed to assess the values of the SOFA score, miR-150 and their combination in predicting 28-day mortality. The ROC curve of the combination of SOFA score and miR-150 was drawn using the probability derived from binary logistic regression analysis. The Z-test was used to compare the area under curve (AUC). The Youden index was computed to determine the optimal cutoff, provid-ing the best sensitivity and specificity. Sensitivity, speci-ficity, accuracy, false positive rate (FPR), false negative rate (FNR), positive predictive value (PPV), and negative predictive value (NPV) were also computed. Statistical analysis was performed with SPSS v. 17.0 (SPSS Inc., Chi-cago, USA), and statistical significance was set at p < 0.05 for two-sided variables.
Results
Univariate analysis
Among the 487 sepsis patients, 29 (5.9%) were excluded due to incomplete medical and nursing data, 16 (3.2%) were excluded due to other serious disease or recent ma-jor surgeries, and 5 (1%) were excluded due to being lost to follow-up. Therefore, 437 patients were included and divided into the death group (n = 138, 31.6%) and survival group (n = 299, 68.4%).
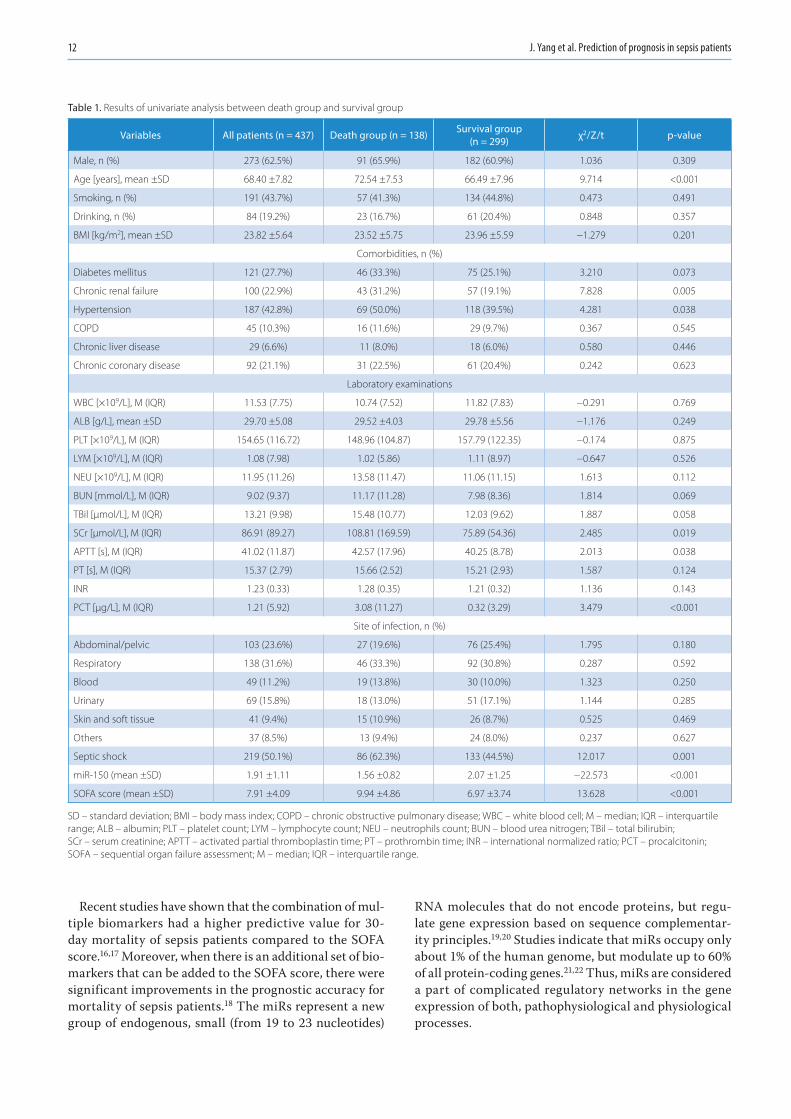
Univariate analysis (Table 1) demonstrated that the dif-ferences in age, chronic renal failure, hypertension, serum creatinine (SCr), activated partial thromboplastin time (APTT), PCT, septic shock, miR-150, and the SOFA score were statistically significant between the death group and the survival group (p < 0.05), and the differences in the re-maining variables were not statistically significant. How-ever, diabetes mellitus, blood urea nitrogen (BUN) and total bilirubin (TBil) had p-values of <0.10.
Multivariate analysis
Multivariate analysis was performed for the following variables: age, chronic renal failure, hypertension, SCr, APTT, PCT, septic shock, miR-150, the SOFA score, diabe-tes mellitus, BUN, and TBil (Table 2). These results demon-strated that miR-150 (odds ratio (OR) = 0.549, 95% confi-dence interval (95% CI) [0.372, 0.826], p < 0.001), the SOFA score (OR = 1.216, 95% CI [1.039, 1.807], p = 0.008), age, PCT, and septic shock were independently associated with the 28-day mortality of sepsis patients when the analysis is adjusted for chronic renal failure, hypertension, diabetes mellitus, APTT, SCr, BUN, and TBil.
Predictive value
The AUC of miR-150 (Fig. 1), the SOFA score and their combination (Fig. 2) in predicting 28-day mortality of sepsis patients was 0.762 (standard error (SE) = 0.023, 95% CI [0.717, 0.808]), 0.735 (SE = 0.025, 95% CI [0.687, 0.784]) and 0.886 (SE = 0.015, 95% CI [0.857, 0.916]), respectively. The AUC of miR-150 (Fig. 1) was consistent with that of 1/miR-150 (Fig. 2). The predictive power of the AUC together with the SOFA score was significantly greater than independent predictions (0.886 compared to 0.762, Z = 4.516, p < 0.001; 0.886 compared to 0.735, Z = 5.179, p < 0.001). Clinical utility indexes of miR-150, the SOFA score and their com-bination in predicting 28-day mortality of sepsis patients are demonstrated in Table 3. The AUC for combination prediction of the quick SOFA score plus miR-150 was 0.806 (SE = 0.022, 95% CI [0.763, 0.848]) (Fig. 3).
Discussion
The SOFA score, ranging from 0 to 24, is a well-known tool for evaluating patients with sepsis and septic shock. It collates the amount and severity of organ failures in 6 organs, including coagulative function, respiratory, cardiovascular, kidney, liver, and neurology systems. Higher scores are associated with higher probability of mortality. Vafaei et al. investigated the predictive values of the SOFA, Mortality in Emergency Department Sep-sis (MEDS) and Predisposition, Infection, Response and Organ Dysfunction (PIRO) scores for 30-day mortality in sepsis patients.12 Their results showed that the AUCs of the SOFA, MEDS and PIRO scores were 0.87, 0.94 and 0.83, respectively, and the MEDS score had the optimal performance in the prediction of 30-day mortality. Raith et al. found that an increase of 2 or more in the SOFA score had a higher prognostic accuracy for in-hospital mortality than the qSOFA score or the systemic inflam-matory response syndrome (SIRS) criteria.13 Liu et al. as-sessed the prognostic accuracy of the SOFA score, qSOFA score and lactate level on the mortality of sepsis patients through the public Medical Information Mart for Inten-sive Care III database (MIMIC III).14 Their results showed that the AUCs of the SOFA score, qSOFA score and lac-tate level were 0.686, 0.664 and 0.547, respectively. Kara-kike et al. evaluated the performance of the early change of SOFA score in predicting 28-day mortality of sepsis patients.9 Their results demonstrated that an early change of SOFA score was a more scalar, direct measurement tool for treatment effect of sepsis compared with traditional mortality endpoints. Iba et al. also demonstrated that the change of SOFA score was strongly associated with the 28-day sepsis mortality disseminated intravascular coagulation patients.15 In our study, the AUC of the SOFA score for predicting 28-day mortality of sepsis patients was 0.735.
J. Yang et al. Prediction of prognosis in sepsis patients12
Recent studies have shown that the combination of mul-tiple biomarkers had a higher predictive value for 30-day mortality of sepsis patients compared to the SOFA score.16,17 Moreover, when there is an additional set of bio-markers that can be added to the SOFA score, there were significant improvements in the prognostic accuracy for mortality of sepsis patients.18 The miRs represent a new group of endogenous, small (from 19 to 23 nucleotides)
RNA molecules that do not encode proteins, but regu-late gene expression based on sequence complementar-ity principles.19,20 Studies indicate that miRs occupy only about 1% of the human genome, but modulate up to 60% of all protein-coding genes.21,22 Thus, miRs are considered a part of complicated regulatory networks in the gene expression of both, pathophysiological and physiological processes.
Table 1. Results of univariate analysis between death group and survival group
Variables All patients (n = 437) Death group (n = 138) Survival group (n = 299) χ2/Z/t p-value
Male, n (%) 273 (62.5%) 91 (65.9%) 182 (60.9%) 1.036 0.309
Age [years], mean ±SD 68.40 ±7.82 72.54 ±7.53 66.49 ±7.96 9.714 <0.001
Smoking, n (%) 191 (43.7%) 57 (41.3%) 134 (44.8%) 0.473 0.491
Drinking, n (%) 84 (19.2%) 23 (16.7%) 61 (20.4%) 0.848 0.357
BMI [kg/m2], mean ±SD 23.82 ±5.64 23.52 ±5.75 23.96 ±5.59 −1.279 0.201
Comorbidities, n (%)
Diabetes mellitus 121 (27.7%) 46 (33.3%) 75 (25.1%) 3.210 0.073
Chronic renal failure 100 (22.9%) 43 (31.2%) 57 (19.1%) 7.828 0.005
Hypertension 187 (42.8%) 69 (50.0%) 118 (39.5%) 4.281 0.038
COPD 45 (10.3%) 16 (11.6%) 29 (9.7%) 0.367 0.545
Chronic liver disease 29 (6.6%) 11 (8.0%) 18 (6.0%) 0.580 0.446
Chronic coronary disease 92 (21.1%) 31 (22.5%) 61 (20.4%) 0.242 0.623
Laboratory examinations
WBC [×109/L], M (IQR) 11.53 (7.75) 10.74 (7.52) 11.82 (7.83) −0.291 0.769
ALB [g/L], mean ±SD 29.70 ±5.08 29.52 ±4.03 29.78 ±5.56 −1.176 0.249
PLT [×109/L], M (IQR) 154.65 (116.72) 148.96 (104.87) 157.79 (122.35) −0.174 0.875
LYM [×109/L], M (IQR) 1.08 (7.98) 1.02 (5.86) 1.11 (8.97) −0.647 0.526
NEU [×109/L], M (IQR) 11.95 (11.26) 13.58 (11.47) 11.06 (11.15) 1.613 0.112
BUN [mmol/L], M (IQR) 9.02 (9.37) 11.17 (11.28) 7.98 (8.36) 1.814 0.069
TBil [μmol/L], M (IQR) 13.21 (9.98) 15.48 (10.77) 12.03 (9.62) 1.887 0.058
SCr [μmol/L], M (IQR) 86.91 (89.27) 108.81 (169.59) 75.89 (54.36) 2.485 0.019
APTT [s], M (IQR) 41.02 (11.87) 42.57 (17.96) 40.25 (8.78) 2.013 0.038
PT [s], M (IQR) 15.37 (2.79) 15.66 (2.52) 15.21 (2.93) 1.587 0.124
INR 1.23 (0.33) 1.28 (0.35) 1.21 (0.32) 1.136 0.143
PCT [μg/L], M (IQR) 1.21 (5.92) 3.08 (11.27) 0.32 (3.29) 3.479 <0.001
Site of infection, n (%)
Abdominal/pelvic 103 (23.6%) 27 (19.6%) 76 (25.4%) 1.795 0.180
Respiratory 138 (31.6%) 46 (33.3%) 92 (30.8%) 0.287 0.592
Blood 49 (11.2%) 19 (13.8%) 30 (10.0%) 1.323 0.250
Urinary 69 (15.8%) 18 (13.0%) 51 (17.1%) 1.144 0.285
Skin and soft tissue 41 (9.4%) 15 (10.9%) 26 (8.7%) 0.525 0.469
Others 37 (8.5%) 13 (9.4%) 24 (8.0%) 0.237 0.627
Septic shock 219 (50.1%) 86 (62.3%) 133 (44.5%) 12.017 0.001
miR-150 (mean ±SD) 1.91 ±1.11 1.56 ±0.82 2.07 ±1.25 −22.573 <0.001
SOFA score (mean ±SD) 7.91 ±4.09 9.94 ±4.86 6.97 ±3.74 13.628 <0.001
SD – standard deviation; BMI – body mass index; COPD – chronic obstructive pulmonary disease; WBC – white blood cell; M – median; IQR – interquartile range; ALB – albumin; PLT – platelet count; LYM – lymphocyte count; NEU – neutrophils count; BUN – blood urea nitrogen; TBil – total bilirubin; SCr – serum creatinine; APTT – activated partial thromboplastin time; PT – prothrombin time; INR – international normalized ratio; PCT – procalcitonin; SOFA – sequential organ failure assessment; M – median; IQR – interquartile range.

Adv Clin Exp Med. 2022;31(1):9–15 13
Abnormal expression of miRs has been reported not only in highly modulated mechanisms such as cell death, aging and development,23 but also in the initiation of complicated diseases such as sepsis, inflammation and infection,24–27 partly because miRs can be detected in the blood and serve as biomarkers.28–30 Circulating miRs are especially stable in the conditions that would generally degrade most of RNAs. Additionally, miRs are relatively small, generally possess a less complicated chemical structure and do not undergo post-processing modifications. Therefore, circulating miRs may be superior to other types of serum-based biomarkers.31 The miR-150 belongs to part of a group of miRs including
miR-155, miR-223, miR-181, and the miR-17-92 cluster.32 The upregulation of miR-150 expression in B-cells can lead to decreased c-Myb levels and prevent the transition from pro-B to pre-B cells. At a functional level, the downregula-tion of miR-150 expression is detected in cell lines, as well as in primary leukocytes derived from human volunteers upon the lipopolysaccharides administration.33 Accordingly, mice with miR-150 knockout showed significant changes in their responses to different inflammatory stimuli,34 imply-ing a deep involvement of miR-150 in the activation process of immune cells during sepsis and inflammation. Several re-ports have identified miR-150 as a constituent of miRs panels,
Fig. 1. Receiver operator characteristic (ROC) curve of miR-150 when predicting the 28-day mortality of sepsis patients
Fig. 2. Receiver operator characteristic (ROC) curves of 1/miR-150, sequential organ failure assessment (SOFA) score and combination of miR-150 and SOFA score in predicting the 28-day mortality of sepsis patients
Table 2. Results of multivariate analysis between the death group and the survival group
Variables β SE Wald χ2 OR 95% CI p-value
miR-150 −0.227 0.081 8.763 0.549 [0.372, 0.826] <0.001
SOFA score 0.183 0.075 6.604 1.216 [1.039, 1.807] 0.008
Septic shock 0.312 0.119 5.718 2.153 [1.142, 4.219] 0.019
Age 0.135 0.068 4.237 1.194 [1.031, 1.463] 0.041
PCT 0.089 0.017 5.096 1.158 [1.022, 1.596] 0.032
Chronic renal failure 0.094 0.023 1.568 1.127 [0.904, 1.348] 0.208
Hypertension −0.075 0.012 0.204 0.913 [0.857, 1.165] 0.645
Diabetes mellitus 0.101 0.020 2.538 1.148 [0.911, 1.438] 0.107
APTT 0.090 0.010 2.314 1.096 [0.897, 1.265] 0.132
SCr 0.116 0.021 3.409 1.152 [0.917, 1.494] 0.073
BUN 0.068 0.006 1.382 1.087 [0.826, 1.197] 0.254
TBil 0.073 0.009 1.494 1.089 [0.841, 1.206] 0.220
SE – standard error; OR – odds ratio; 95% CI – 95% confidence interval; SOFA – sequential organ failure assessment; PCT – procalcitonin; APTT – activated partial thromboplastin time; SCr – serum creatinine; BUN – blood urea nitrogen; TBil – total bilirubin.
1-specificity
sens
itivi
ty
0.0
1.0
0.8
0.6
0.4
0.2
0.00.2 0.4 0.6 0.8 1.0
1-specificity
sens
itivi
ty
0.0
1.0
0.8
0.6
0.4
0.2
0.00.2 0.4 0.6 0.8 1.0
Source of the curve
1/miR150SOFA scorecombinationprediction
referenceline

J. Yang et al. Prediction of prognosis in sepsis patients14
which are deregulated in peripheral blood mononuclear cells/leukocytes of sepsis patients compared with healthy controls through microarray-based gene expression analysis.35–37 Vasi-lescu et al. demonstrated that miR-150 expression was sig-nificantly reduced in both plasma and leukocytes of patients with sepsis, which was associated with an elevated SOFA score, sepsis severity and elevated levels of proinflammatory cytokines.35 Ma et al. found that miR-150 levels were lower in 2 independent cohorts of sepsis patients than in healthy controls or patients with noninfectious systemic inflamma-tory response syndrome (SIRS).38 Roderburg et al. detected the levels of circulating miR-150 in healthy controls and a co-hort of critically ill patients.11 Their results demonstrated that miR-150 levels were decreased in patients with septic disease, but the difference was not statistically significant, suggesting that the potential of miR-150 levels was rather lim-ited in differentiating between septic and non-septic disease. Nevertheless, they found a significant association between
decreased miR-150 levels and impaired prognosis of patients with critical illness, implying that miR-150 was more suit-able to be a prognostic indicator than a diagnostic indicator. In addition, Huang et al. demonstrated that miR-150 might be correlated with the pathogenesis of neonatal sepsis through targeting BCL-11B, based on the analysis of the expression profile data of E-MTAB-4785.39
In our study, miR-150 expression levels were lower in non-survivors than in survivors, and the AUC of miR-150 expression levels applied in predicting mortality was 0.762. The combination of the SOFA score and miR-150 expres-sion levels had a higher predictive value than the SOFA score or miR-150 expression levels. The AUC was up to 0.886 with a sensitivity of 86.2% and specificity of 80.6%. In addition, we evaluated the predictive value of the quick SOFA score plus miR-150 for the 28-day mortality of sepsis patients, and the AUC was 0.806. The data lend themselves to be utilized as a possible predictive bedside test for sepsis patients in emergency departments.
Limitations
The limitations of this study mainly included a small sample size and a short follow-up time. Our next focus will be to evaluate the predictive value of the SOFA score combined with miR-150 for prognosis in sepsis patients on the basis of a large sample and a long follow-up time.
Conclusions
The combination of the SOFA score and miR-150 could improve the prediction of prognosis in sepsis patients.
ORCID iDsJun Yang https://orcid.org/0000-0002-7032-919XYouxin Liao https://orcid.org/0000-0003-2903-5728Yonghong Dai https://orcid.org/0000-0002-1668-1141Ling Hu https://orcid.org/0000-0001-8354-1707Yihong Cai https://orcid.org/0000-0001-5720-0984
References1. Singer M, Deutschman CS, Seymour CW, et al. The Third International
Consensus Definitions for Sepsis and Septic Shock (Sepsis-3). JAMA. 2016;315(8):801–810. doi:10.1001/jama.2016.0287
Table 3. Clinical utility indices of miR-150, the SOFA score and their combination in predicting 28-day mortality of sepsis patients
Predictors AUC SE p-value95% CI Best
cut-off
Sensi-tivity
Speci-ficity
Accu-racy FPR FNR PPV NPV Youden
indexlower bound
upper bound
miR-150 0.762 0.023 <0.001 0.717 0.808 1.78 76.8% 62.2% 66.8% 51.6% 14.7% 48.4% 85.3% 0.39
SOFA score 0.735 0.025 <0.001 0.687 0.784 8.85 75.4% 60.5% 65.2% 53.2% 15.8% 46.8% 84.2% 0.36
Combination of miR-150 and SOFA score
0.886 0.015 <0.001 0.857 0.916 N/A 86.2% 80.6% 82.4% 32.8% 7.3% 67.2% 92.7% 0.67
SOFA – sequential organ failure assessment; AUC – area under curve; SE – standard error; 95% CI – 95% confidence interval; FPR – false positive rate; FNR – false negative rate; PPV – positive predictive value; NPV – negative predictive value; N/A – not applicable.
Fig. 3. Receiver operator characteristic (ROC) curve of the quick sequential organ failure assessment (SOFA) score plus miR-150 in predicting the 28-day mortality of sepsis patients
1-specificity
sens
itivi
ty
0.0
1.0
0.8
0.6
0.4
0.2
0.00.2 0.4 0.6 0.8 1.0
Adv Clin Exp Med. 2022;31(1):9–15 15
2. De Backer D, Dorman T. Surviving sepsis guidelines: A continuous move toward better care of patients with sepsis. JAMA. 2017;317(8): 807–808. doi:10.1001/jama.2017.0059
3. Yao YM, Luan Y. Precision evaluation of immune status and its signif-icance in sepsis after burns or trauma [in Chinese]. Zhonghua Shao Shang Za Zhi. 2018;34(11):786–789. doi:10.3760/cma.j.issn.1009-2587. 2018.11.013
4. Lago AF, de Oliveira AS, de Souza HCD, da Silva JS, Basile-Filho A, Cla-rice Gastaldi A. The effects of physical therapy with neuromuscular electrical stimulation in patients with septic shock: Study protocol for a randomized cross-over design. Medicine (Baltimore). 2018;97(6): e9736. doi:10.1097/MD.0000000000009736
5. Venkatesh B, Finfer S, Cohen J, et al; ADRENAL Trial Investigators and the Australian–New Zealand Intensive Care Society Clinical Tri-als Group. Adjunctive glucocorticoid therapy in patients with septic shock. N Engl J Med. 2018;378(9):797–808. doi:10.1056/NEJMoa1705835
6. Leitgeb AM, Charunwatthana P, Rueangveerayut R, et al. Inhibition of merozoite invasion and transient de-sequestration by sevupa-rin in humans with Plasmodium falciparum malaria. PLoS One. 2017; 12(12):e0188754. doi:10.1371/journal.pone.0188754
7. Balejo RDP, Cortelli JR, Costa FO, et al. Effects of chlorhexidine pre-procedural rinse on bacteremia in periodontal patients: A random-ized clinical trial. J Appl Oral Sci. 2017;25(6):586–595. doi:10.1590/1678-7757-2017-0112
8. Vincent JL, Moreno R, Takala J, et al. The SOFA (Sepsis-related Organ Failure Assessment) score to describe organ dysfunction/failure. On behalf of the working group on Sepsis-related problems of the European Society of Intensive Care Medicine. Intensive Care Med. 1996;22(7):707–710. doi:10.1007/BF01709751
9. Karakike E, Kyriazopoulou E, Tsangaris I, Routsi C, Vincent JL, Gia-marellos-Bourboulis EJ. The early change of SOFA score as a prog-nostic marker of 28-day sepsis mortality: Analysis through a deriva-tion and a validation cohort. Crit Care. 2019;23(1):387. doi:10.1186/s13054-019-2665-5
10. O’Connell RM, Rao DS, Baltimore D. MicroRNA regulation of inflam-matory responses. Annu Rev Immunol. 2012;30:295–312. doi:10.1146/annurev-immunol-020711-075013
11. Roderburg C, Luedde M, Vargas Cardenas D, et al. Circulating microRNA-150 serum levels predict survival in patients with critical illness and sepsis. PLoS One. 2013;8(1):e54612. doi:10.1371/journal.pone.0054612
12. Vafaei A, Heydari K, Hashemi-Nazari SS, Izadi N, Zadeh HH. PIRO, SOFA and MEDS scores in predicting one-month mortality of sep-sis patients: A diagnostic accuracy study. Arch Acad Emerg Med. 2019; 7(1):e59. PMID:31875213
13. Raith EP, Udy AA, Bailey M, et al; Australian and New Zealand Intensive Care Society (ANZICS) Centre for Outcomes and Resource Evaluation (CORE). Prognostic accuracy of the SOFA score, SIRS criteria, and qSOFA score for in-hospital mortality among adults with suspected infec-tion admitted to the intensive care unit. JAMA. 2017;317(3):290–300. doi:10.1001/jama.2016.20328
14. Liu Z, Meng Z, Li Y, et al. Prognostic accuracy of the serum lactate level, the SOFA score and the qSOFA score for mortality among adults with sepsis. Scand J Trauma Resusc Emerg Med. 2019;27(1):51. doi:10.1186/s13049-019-0609-3
15. Iba T, Arakawa M, Mochizuki K, Nishida O, Wada H, Levy JH. Usefulness of measuring changes in SOFA score for the prediction of 28-day mor-tality in patients with sepsis-associated disseminated intravascular coagulation. Clin Appl Thromb Hemost. 2019;25:1076029618824044. doi:10.1177/1076029618824044
16. Kim H, Hur M, Moon HW, Yun YM, Di Somma S; GREAT Network. Multi-marker approach using procalcitonin, presepsin, galectin-3, and sol-uble suppression of tumorigenicity 2 for the prediction of mortality in sepsis. Ann Intensive Care. 2017;7(1):27. doi:10.1186/s13613-017-0252-y
17. Shukeri WFWM, Ralib AM, Abdulah NZ, Mat-Nor MB. Sepsis mortali-ty score for the prediction of mortality in septic patients. J Crit Care. 2018;43:163–168. doi:10.1016/j.jcrc.2017.09.009
18. Song J, Moon S, Park DW, et al. Biomarker combination and SOFA score for the prediction of mortality in sepsis and septic shock: A pro-spective observational study according to the Sepsis-3 definitions. Medicine (Baltimore). 2020;99(22):e20495. doi:10.1097/MD.0000000 000020495
19. Wu J, Ding J, Yang J, Guo X, Zheng Y. MicroRNA roles in the nucle-ar factor kappa B signaling pathway in cancer. Front Immunol. 2018; 9:546. doi:10.3389/fimmu.2018.00546
20. Vannini I, Fanini F, Fabbri M. Emerging roles of microRNAs in cancer. Curr Opin Genet Dev. 2018;48:128–133. doi:10.1016/j.gde.2018.01.001
21. Friedman RC, Farh KKH, Burge CB, Bartel DP. Most mammalian mRNAs are conserved targets of microRNAs. Genome Res. 2009;19(1):92–105. doi:10.1101/gr.082701.108
22. Krol J, Loedige I, Filipowicz W. The widespread regulation of micro-RNA biogenesis, function and decay. Nat Rev Genet. 2010;11(9): 597–610. doi:10.1038/nrg2843
23. Bandiera S, Pfeffer S, Baumert TF, Zeisel MB. miR-122-A key factor and therapeutic target in liver disease. J Hepatol. 2015;62(2):448–457. doi:10.1016/j.jhep.2014.10.004
24. Cortez MA, Bueso-Ramos C, Ferdin J, Lopez-Berestein G, Sood AK, Calin GA. MicroRNAs in body fluids: The mix of hormones and bio-markers. Nat Rev Clin Oncol. 2011;8(8):467–477. doi:10.1038/nrclinonc. 2011.76
25. Vasudevan S, Tong Y, Steitz JA. Switching from repression to activa-tion: MicroRNAs can up-regulate translation. Science. 2007;318(5858): 1931–1934. doi:10.1126/science.1149460
26. Wu S, Huang S, Ding J, et al. Multiple microRNAs modulate p21Cip1/Waf1 expression by directly targeting its 31 untranslated region. Oncogene. 2010;29(15):2302–2308. doi:10.1038/onc.2010.34
27. Roderburg C, Luedde T. Circulating microRNAs as markers of liver inflammation, fibrosis and cancer. J Hepatol. 2014;61(6):1434–1437. doi:10.1016/j.jhep.2014.07.017
28. Mitchell PS, Parkin RK, Kroh EM, et al. Circulating microRNAs as stable blood-based markers for cancer detection. Proc Natl Acad Sci U S A. 2008;105(30):10513–10518. doi:10.1073/pnas.0804549105
29. Lawrie CH, Gal S, Dunlop HM, et al. Detection of elevated levels of tumour-associated microRNAs in serum of patients with diffuse large B-cell lymphoma. Br J Haematol. 2008;141(5):672–675. doi:10. 1111/j.1365-2141.2008.07077.x
30. Chen X, Ba Y, Ma L, et al. Characterization of microRNAs in serum: A novel class of biomarkers for diagnosis of cancer and other diseases. Cell Res. 2008;18(10):997–1006. doi:10.1038/cr.2008.282
31. Wang K, Zhang S, Marzolf B, et al. Circulating microRNAs, potential biomarkers for drug-induced liver injury. Proc Natl Acad Sci U S A. 2009;106(11):4402–4407. doi:10.1073/pnas.0813371106
32. Davidson-Moncada J, Papavasiliou FN, Tam W. MicroRNAs of the immune system: Roles in inflammation and cancer. Ann N Y Acad Sci. 2010;1183:183–194. doi:10.1111/j.1749-6632.2009.05121.x
33. Schmidt WM, Spiel AO, Jilma B, Wolzt M, Müller M. In vivo pro-file of the human leukocyte microRNA response to endotoxemia. Biochem Biophys Res Commun. 2009;380(3):437–441. doi:10.1016/j.bbrc.2008.12.190
34. Shapiro NI, Trzeciak S, Hollander JE, et al. A prospective, multicenter derivation of a biomarker panel to assess risk of organ dysfunction, shock, and death in emergency department patients with sus-pected sepsis. Crit Care Med. 2009;37(1):96–104. doi:10.1097/CCM. 0b013e318192fd9d
35. Vasilescu C, Rossi S, Shimizu M, et al. MicroRNA fingerprints iden-tify miR-150 as a plasma prognostic marker in patients with sepsis. PLoS One. 2009;4(10):e7405. doi:10.1371/journal.pone.0007405
36. How CK, Hou SK, Shih HC, et al. Expression profile of MicroRNAs in gram-negative bacterial sepsis. Shock. 2015;43(2):121–127. doi:10. 1097/SHK.0000000000000282
37. Zhou J, Chaudhry H, Zhong Y, et al. Dysregulation in microRNA expression in peripheral blood mononuclear cells of sepsis patients is associated with immunopathology. Cytokine. 2015;71(1):89–100. doi:10.1016/j.cyto.2014.09.003
38. Ma Y, Vilanova D, Atalar K, et al. Genome-wide sequencing of cellular microRNAs identifies a combinatorial expression signature diagnos-tic of sepsis. PLoS One. 2013;8(10):e75918. doi:10.1371/journal.pone. 0075918
39. Huang L, Qiao L, Zhu H, Jiang L, Yin L. Genomics of neonatal sep-sis: Has-miR-150 targeting BCL11B functions in disease progression. Ital J Pediatr. 2018;44(1):145. doi:10.1186/s13052-018-0575-9


Cite asZhu C, Chen G, Yao J, Lin W. Effect of infection after liver cancer interventional therapy on T lymphocyte subsets and Toll-like receptors in peripheral blood mononuclear cells and its mechanism. Adv Clin Exp Med. 2022;31(1):17–23. doi:10.17219/acem/141499
DOI10.17219/acem/141499
CopyrightCopyright by Author(s) This is an article distributed under the terms of theCreative Commons Attribution 3.0 Unported (CC BY 3.0)(https://creativecommons.org/licenses/by/3.0/)
Address for correspondenceWenji LinE-mail: [email protected]
Funding sourcesNone declared
Conflict of interestNone declared
Received on May 27, 2021Reviewed on July 4, 2021Accepted on August 21, 2021
Published online on November 4, 2021
AbstractBackground. The T lymphocyte subset levels are an indicator used to evaluate the immune status of the body. In recent years, many studies have investigated the correlation between T lymphocyte subset levels and postoperative infection.
Objectives. To investigate the incidence of infection after liver cancer interventional therapy and its influence on T lymphocyte subset levels and toll-like receptors (TLRs).
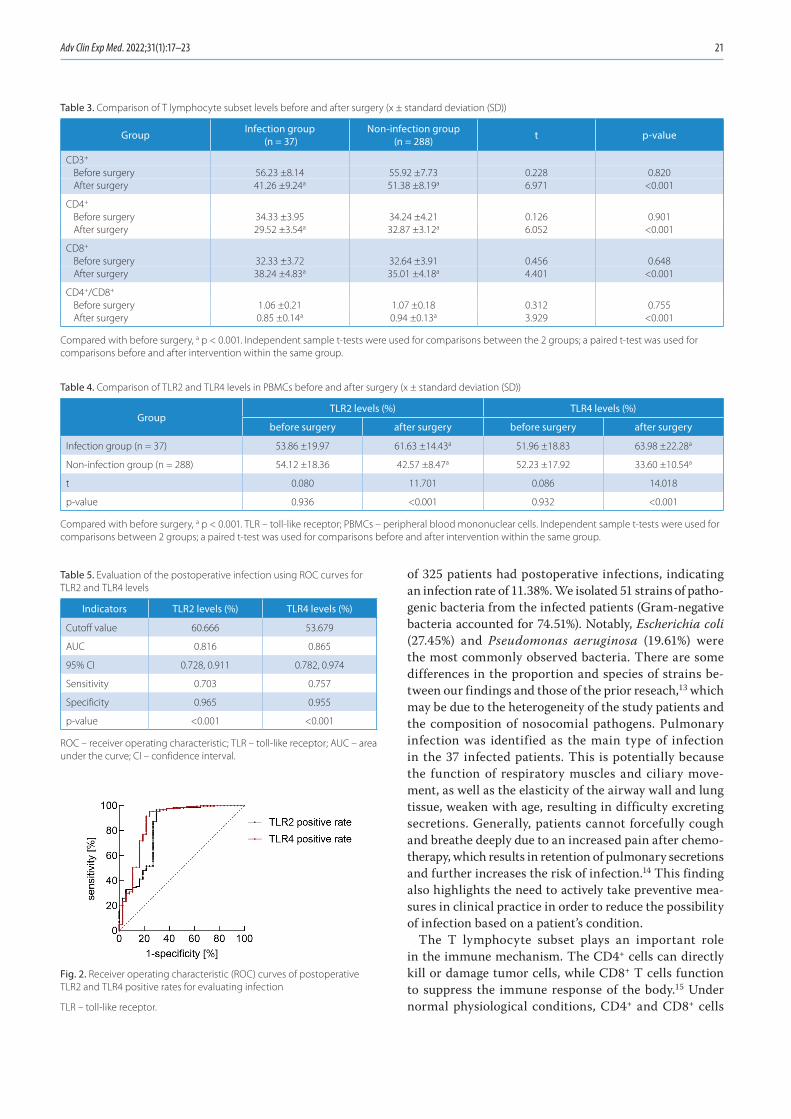
Materials and methods. A total of 325 patients with primary liver cancer receiving interventional therapy were divided into an infection group (n = 37) and a non-infection group (n = 288). The infection site and the distribution of pathogenic bacteria in the infection group were observed. The serum T lymphocyte subset level and TLR2 and TLR4 levels in peripheral blood mononuclear cells were compared. The clinical value of the postoperative TLR2 and TLR4 levels in evaluating infection was analyzed using receiver operating characteristic (ROC) curves.
Results. Among 51 strains of pathogens isolated from the infected patients, strains of Escherichia coli (27.45%) and Pseudomonas aeruginosa (19.61%) were the most commonly observed. After surgery, the levels of CD3+, CD4+ and CD4+/CD8+ decreased, while the level of CD8+ increased in both groups; the levels of TLR2 and TLR4 decreased in the non-infection group, while the levels of TLR2 and TLR4 increased in the infection group (all p < 0.05). Furthermore, the decreases and increases were more significant in the infection group than in the non-infection group (all p < 0.001). The area under the curve of postoperative TLR2 and TLR4 levels in evaluating infection were greater than 0.700 (p < 0.001).
Conclusions. Gram-negative bacteria account for the majority of infections in patients after liver cancer interventional therapy, and the main infection sites are the lung and abdomen. The infected patients show changes in T lymphocyte level and decreased immune function. The TLR2 and TLR4 can be used as auxiliary indicators to evaluate infection after surgery.
Key words: T lymphocytes, toll-like receptor, intervention, liver cancer, postoperative infection
Original papers
Effect of infection after liver cancer interventional therapy on T lymphocyte subsets and Toll-like receptors in peripheral blood mononuclear cells and its mechanism
Conghui ZhuA,C–F, Guanfeng ChenB,C, Jiadi YaoB,C, Wenji LinA,E,F
Department of Interventional Radiology, Quanzhou First Hospital Affiliated to Fujian Medical University, China
A – research concept and design; B – collection and/or assembly of data; C – data analysis and interpretation; D – writing the article; E – critical revision of the article; F – final approval of the article
Advances in Clinical and Experimental Medicine, ISSN 1899–5276 (print), ISSN 2451–2680 (online) Adv Clin Exp Med. 2022;31(1):17–23
C. Zhu et al. Infection affects T lymphocyte subset and TLR18
Introduction
Liver cancer is a common malignant tumor characterized by high morbidity and mortality.1–3 For patients with early liver cancer, surgery is the most effective treatment. However, in most cases, the tumor has progressed to the middle or ad-vanced stage at diagnosis, and patients have missed the best opportunity for surgery due to the insidious onset of symp-toms.4–6 Transhepatic arterial infusion chemotherapy, which is one of the important local treatments for liver cancer, has the advantages of minimal trauma and rapid postoperative recovery. For these reasons, it is widely used in the treatment of advanced liver cancer and shows significant effects.7 Nev-ertheless, interventional therapy itself is invasive and the im-mune function of patients is often impacted, potentially re-sulting in postoperative infection. The rate of postoperative infection is reported to be about 10–15% in patients with liver cancer.8,9 Therefore, further research on infection after liver cancer interventional therapy and biomarkers for predicting infection is clinically valuable for timely and effective preven-tion and control measures. Inflammatory response and im-mune dysfunction are the main mechanisms of postoperative infection. Infection can lead to a persistent inflammatory state, which can result in further immune dysfunction.
The T lymphocyte subset levels are an indicator used to evaluate the immune status of the body. In recent years, there have been many studies investigating the correlation be-tween T lymphocyte subset levels and postoperative infection; however, there have been few reports on infection after inter-ventional therapy for liver cancer. Toll-like receptors (TLRs), as a class of pathogen recognition receptors, can activate adaptive immunity by promoting the expression of inflam-matory factors and participate in the inflammatory response of anti-infection.10 A previous study confirmed that TLRs are closely linked to infection and that TLR levels in peripheral blood mononuclear cells (PBMCs) are increased in infected patients.10 However, the role and mechanism of TLRs in post-operative infection of liver cancer remain unclear.
Objectives
We aimed to explore the incidence of infection after liver cancer interventional therapy and the effect of infec-tion on T lymphocytes and TLR levels in order to provide a reference for the prevention and treatment of infection in liver cancer patients.
Materials and methods
Study design
This prospective study included 325 patients with pri-mary liver cancer who received interventional therapy in our hospital from July 2015 to July 2018. General data
were collected, including age, gender, body mass index (BMI), pathological type, Child–Pugh classification, site and size of lesion, clinical stage, fasting blood glucose level, and smoking and alcohol history. Each patient was as-signed to the infection group (n = 37) or non-infection group (n = 288), according to their condition. The diag-nostic criteria for infection were based on the Diagnostic Criteria for Nosocomial Infection.11 This study was con-ducted in accordance with the Declaration of Helsinki and approved by the Medical Ethics Committee of our hospital.
Inclusion and exclusion criteria
Patients were eligible for the study if they met the diag-nostic and staging criteria of hepatocellular carcinoma12; had no infection and did not take anti-infection drugs within 3 months before the intervention; received no tar-geted drug therapy, radiotherapy, chemotherapy, or other drug therapy; had no other malignant tumors; were aged ≥18 years; and provided written informed consent or consent was provided by their families.
Patients were ineligible for the study if they had complica-tions with infectious diseases before interventional surgery or had infection within 6 h after surgery; were adminis-tered immune agents or glucocorticoids within 3 months before surgery; had other underlying diseases; were not suitable for surgery; or had incomplete clinical data.
Methods
Transcatheter arterial chemoembolization
All patients were treated with transcatheter arterial chemoembolization (TACE). The chemotherapy regimens were as follows: 0.75–1.25 g of 5-fluorouracil (H31020593; Xudonghaipu Pharmaceutical Co. Ltd., Shanghai, China), 80–120 mg of cisplatin (H37021358; Qilu Pharmaceutical Co. Ltd., Jinan, China), 200 mg of oxaliplatin (H20093167; Qilu Pharmaceutical Co. Ltd.), and 80–120 mg of epirubi-cin (H20000496; Pfizer Pharmaceutical (Wuxi) Co. Ltd., Wuxi, China). A gelatin sponge (20193141731; ConvaTec Limited, Shanghai, China) was used as the embolic agent. The dosage of chemotherapeutic drugs and embolic agents depended on the tumor size and the extent of embolization.
Diagnosis of infection and identification of pathogens
Biological samples from the sites of suspected infection (e.g., abdomen, lung, blood, intestine, surgical site, uri-nary system, skin) were collected, inoculated into culture media, and cultured at a constant temperature of 37°C for 2–3 days. Subsequently, the bacteria were isolated for strain identification (MicroScan WalkAway Plus 96; Beck-man Coulter Inc., Brea, USA).

Adv Clin Exp Med. 2022;31(1):17–23 19
Measurement of T lymphocyte subset levels
Fasting venous blood (3 mL) was drawn from each pa-tient before treatment and within 6 h after treatment (be-fore the occurrence of infection). The CD3+, CD4+ and CD8+ cells in whole blood were counted with flow cytom-etry (Beckman Coulter Inc.), and the changes in the CD4+/CD8+ ratio before and after treatment were calculated. The cell counting kits were purchased from Beyotime Bio-technology Co., Ltd. (Shanghai, China).
Measurement of TLR2 and TLR4 levels in PBMCs
Fasting venous blood (3 mL) was drawn from each patient before treatment and within 6 h after treatment (before the infection). Each blood sample was divided into 2 parts: 1 was mixed with monoclonal antibodies FitC-CD14 and PE-TLR2, and the other with phosphate-buffered saline (PBS) solution. The samples were fully mixed and main-tained at 4°C for 30 min. Next, 2 mL of red blood cell lysate was added to both parts of the sample, which were mixed and allowed to stand in the dark for 20 min at room tem-perature. Then, the samples were washed twice with PBS and centrifuged to remove the supernatant. The PBS was added to adjust the concentration. The positive detection rate of TLR2 mononuclear cells was determined with flow cytometry (Beckman Coulter Inc.). The positive detection rate of TLR4 was similar to that of TLR2.
Statistical analysis
Statistical analyses were performed using SPSS v. 22.0 software (IBM Corp., Armonk, USA). The χ2 test was ad-opted for the comparison of enumeration data expressed as a ratio or percentage. The data were checked for a normal distribution using the Shapiro–Wilk test. Data that followed a normal distribution were expressed as the mean ± stan-dard deviation (x ± SD), while data that did not meet the normal distribution were expressed as a percentile. The independent sample t-test was used for the compari-sons between the 2 groups, and the paired sample t-test was applied for the comparison before and after intervention within the same group. Moreover, ROC curves were used to analyze the clinical value of postoperative TLR2 and TLR4 levels in evaluating postoperative infection. A value of p < 0.05 was considered statistically significant.
Results
Comparison of general patient characteristics
Of the 325 patients, 37 developed postoperative infection (infection rate 11.38%). There was no significant difference
in gender, age, BMI, pathological type, Child–Pugh classi-fication, site and size of lesion, clinical stage, fasting blood glucose level, and smoking and alcohol history between the 2 groups, suggesting that the 2 groups were comparable (all p > 0.05, Table 1).
Site of infection and distribution of pathogenic bacteria
Among the 37 patients with infection, the main infec-tion sites were the lung (24.32%), abdomen (21.62%), blood (16.22%), intestine (16.22%), surgical site (8.11%), urinary system (8.11%), skin (2.70%), and others (2.70%). A total of 51 strains of pathogenic bacteria were isolated from the in-fected patients. There were 38 strains of Gram-negative bacte-ria (74.51%), which were mainly Escherichia coli (27.45%) and Pseudomonas aeruginosa (19.61%), and 13 strains of Gram-positive bacteria (25.49%), which were mainly Staphylococ-cus aureus (11.76%) and coagulase-negative staphylococci (7.84%). See Fig. 1 and Table 2 for additional details.
Comparison of T lymphocyte subset levels before and after surgery
Before surgery, no significant differences were identi-fied in CD3+, CD4+, CD8+, and CD4+/CD8+ levels between the 2 groups (all p > 0.05). After surgery, the CD3+, CD4+ and CD4+/CD8+ levels were significantly decreased, while the CD8+ level was significantly increased in both groups (all p < 0.05). The CD3+, CD4+ and CD4+/CD8+ levels were lower, and the CD8+ level was higher in the infection group compared to the non-infection group (all p < 0.001) (Table 3).
Comparison of TLR2 and TLR4 levels in PBMCs before and after surgery
Before surgery, the TLR2 and TLR4 levels in PBMCs were 53.86 ±19.97% and 51.96 ±18.83% in the infection group, and 54.12 ±18.36% and 52.23 ±17.92% in the non-infection
Fig. 1. Composition of postoperative infection sites in patients after liver cancer interventional therapy (%)

C. Zhu et al. Infection affects T lymphocyte subset and TLR20
group, respectively. No significant differences were ob-served in the TLR2 and TLR4 levels in PBMCs between the 2 groups (both p > 0.05). After surgery, the TLR2 and TLR4 levels in the infection group were increased (61.63 ±14.43% and 63.98 ±22.28%, respectively; both p < 0.001), while the levels in the non-infection group were
decreased (42.57 ±8.47% and 33.60 ±10.54%, respectively; both p < 0.001). The TLR2 and TLR4 levels in the infec-tion group were significantly higher than those in the non-infection group (both p < 0.001, Table 4).
ROC curves for TLR2 and TLR4 levels
When the area under the curve (AUC) of the postop-erative TLR2 level for evaluating postoperative infection was 0.816, the cutoff value was 60.666%, with the sensitiv-ity of 0.703 and the specificity of 0.965. When the AUC of the postoperative TLR4 level for evaluating postopera-tive infection was 0.865, the cutoff value was 53.679%, with the sensitivity of 0.757 and the specificity of 0.955. See Table 5 and Fig. 2 for additional details.
Discussion
As medical technology develops, interventional therapy as a surgical treatment without laparotomy has become widely acknowledged by medical professionals for its clinical efficacy for middle-advanced liver cancer. How-ever, cellular and humoral immune function is often im-pacted in patients who receive this treatment. Further-more, the use of chemotherapeutics increases the risk of nosocomial infection. Our study showed that 37 out
Table 1. Comparison of general patient characteristics (n, x ± SD)
General data Infection group (n = 37) Non-infection group (n = 288) χ2/t p-value
Gender (n)0.09c 0.761Male 21 171
Female 16 117
Age [years] 58.7 ±5.4 58.4 ±5.6 0.340t 0.734
BMI [kg/m2] 21.63 ±1.44 21.59 ±1.51 0.152t 0.879
Pathological type (n)
0.465c 0.793Nodule type 14 102Massive type 16 117Diffused type 7 69
Child–Pugh staging (n)0.009c 0.926A 17 130
B 20 158
Lesion location (n)0.002c 0.965Left 19 149
Right 18 139
Clinical stages (n)0.352c 0.553IIb–III 30 221
IV 7 67
Fasting blood glucose [mmol/L] 4.73 ±0.31 4.79 ±0.33 1.048t 0.259
Lesion size [cm] 7.13 ±2.08 7.21 ±2.11 0.217t 0.828
Drinking history (n)0.110c 0.738Yes 17 124
No 20 164
Smoking history (n)0.260c 0.601Yes 19 135
No 18 153
SD – standard deviation; BMI – body mass index; t – using the independent sample t-test; c – using the χ2 test.
Table 2. Composition of postoperative infection pathogens identified in patients after liver cancer interventional therapy (%)
Pathogens Strain (s)
Constituent ratio (%)
Gram-negative bacteria 38 74.51
Escherichia coli 14 27.45
Pseudomonas aeruginosa 10 19.61
Klebsiella pneumoniae 4 7.84
Acinetobacter baumannii 3 5.88
Proteus vulgaris 3 5.88
Enterobacteriaceae 2 3.92
Serratia 1 1.96
Enterobacter cloacae 1 1.96
Gram-positive bacteria 13 25.49
Staphylococcus aureus 6 11.76
Coagulase-negative staphylococci 4 7.84
Enterococcus 2 3.92
Group A streptococcus 1 1.96
Adv Clin Exp Med. 2022;31(1):17–23 21
of 325 patients had postoperative infections, indicating an infection rate of 11.38%. We isolated 51 strains of patho-genic bacteria from the infected patients (Gram-negative bacteria accounted for 74.51%). Notably, Escherichia coli (27.45%) and Pseudomonas aeruginosa (19.61%) were the most commonly observed bacteria. There are some differences in the proportion and species of strains be-tween our findings and those of the prior reseach,13 which may be due to the heterogeneity of the study patients and the composition of nosocomial pathogens. Pulmonary infection was identified as the main type of infection in the 37 infected patients. This is potentially because the function of respiratory muscles and ciliary move-ment, as well as the elasticity of the airway wall and lung tissue, weaken with age, resulting in difficulty excreting secretions. Generally, patients cannot forcefully cough and breathe deeply due to an increased pain after chemo-therapy, which results in retention of pulmonary secretions and further increases the risk of infection.14 This finding also highlights the need to actively take preventive mea-sures in clinical practice in order to reduce the possibility of infection based on a patient’s condition.
The T lymphocyte subset plays an important role in the immune mechanism. The CD4+ cells can directly kill or damage tumor cells, while CD8+ T cells function to suppress the immune response of the body.15 Under normal physiological conditions, CD4+ and CD8+ cells
Table 3. Comparison of T lymphocyte subset levels before and after surgery (x ± standard deviation (SD))
Group Infection group (n = 37)
Non-infection group (n = 288) t p-value
CD3+
Before surgery 56.23 ±8.14 55.92 ±7.73 0.228 0.820After surgery 41.26 ±9.24a 51.38 ±8.19a 6.971 <0.001
CD4+
Before surgery 34.33 ±3.95 34.24 ±4.21 0.126 0.901After surgery 29.52 ±3.54a 32.87 ±3.12a 6.052 <0.001
CD8+
Before surgery 32.33 ±3.72 32.64 ±3.91 0.456 0.648After surgery 38.24 ±4.83a 35.01 ±4.18a 4.401 <0.001
CD4+/CD8+
Before surgery 1.06 ±0.21 1.07 ±0.18 0.312 0.755After surgery 0.85 ±0.14a 0.94 ±0.13a 3.929 <0.001
Compared with before surgery, a p < 0.001. Independent sample t-tests were used for comparisons between the 2 groups; a paired t-test was used for comparisons before and after intervention within the same group.
Table 4. Comparison of TLR2 and TLR4 levels in PBMCs before and after surgery (x ± standard deviation (SD))
GroupTLR2 levels (%) TLR4 levels (%)
before surgery after surgery before surgery after surgery
Infection group (n = 37) 53.86 ±19.97 61.63 ±14.43a 51.96 ±18.83 63.98 ±22.28a
Non-infection group (n = 288) 54.12 ±18.36 42.57 ±8.47a 52.23 ±17.92 33.60 ±10.54a
t 0.080 11.701 0.086 14.018
p-value 0.936 <0.001 0.932 <0.001
Compared with before surgery, a p < 0.001. TLR – toll-like receptor; PBMCs – peripheral blood mononuclear cells. Independent sample t-tests were used for comparisons between 2 groups; a paired t-test was used for comparisons before and after intervention within the same group.
Table 5. Evaluation of the postoperative infection using ROC curves for TLR2 and TLR4 levels
Indicators TLR2 levels (%) TLR4 levels (%)
Cutoff value 60.666 53.679
AUC 0.816 0.865
95% CI 0.728, 0.911 0.782, 0.974
Sensitivity 0.703 0.757
Specificity 0.965 0.955
p-value <0.001 <0.001
ROC – receiver operating characteristic; TLR – toll-like receptor; AUC – area under the curve; CI – confidence interval.
Fig. 2. Receiver operating characteristic (ROC) curves of postoperative TLR2 and TLR4 positive rates for evaluating infection
TLR – toll-like receptor.

C. Zhu et al. Infection affects T lymphocyte subset and TLR22
exist in a dynamic balance. A previous study found that the T lymphocyte subset level in patients infected after un-dergoing cesarean section was in a state of disorder, which suggests that the detection of T lymphocyte subsets plays a positive role in the prevention and treatment of postop-erative infection.16 To our knowledge, our study is the first to investigate the changes in T lymphocyte subset levels in patients with infection after liver cancer interventional surgery. We found that the CD3+, CD4+ and CD4+/CD8+ levels were significantly decreased while the CD8+ level was greatly increased in the patients, indicating that im-mune function was decreased in both infected and non-infected groups. These changes may be due to the inhibition of immune function caused by surgical trauma and stress, or postoperative immune dysfunction resulting from abnor-mal anti-tumor function in patients with liver cancer.17–20 Furthermore, the CD3+, CD4+ and CD4+/CD8+ levels were lower, and the CD8+ level was higher in the infection group compared to the non-infection group. These results are consistent with those of the previous studies about changes in T lymphocyte subsets in patients with postoperative in-fection. We believe that this difference may occur due to the fact that the postoperative infections lead to more se-vere disturbance of the immune function. This result also suggests that medical professionals should pay attention to changes in T lymphocyte subsets in patients receiving liver cancer interventional therapy, so as to provide timely and effective prevention and control measures.
Toll-like receptors form the major family of pattern rec-ognition receptors for innate immune responses. There are 11 subtypes found in humans, among which TLR2 and TLR4 are considered to be closely related to the de-velopment of liver cancer. It has been reported that TLR2 and TLR4 protein levels are significantly increased in liver cancer tissues compared with normal liver tissues.20,21 Toll-like receptors are reported to be closely related to infection and inflammatory response. They are activated in response to infection or inflammation, which promotes the expres-sion of their downstream pro-inflammatory factors and alters inflammatory signaling cascades.22 There is also evi-dence suggesting that TLR2 mainly recognizes Gram-pos-itive bacteria while TLR4 – Gram-negative bacteria.23 Our study demonstrated that the expression levels of TLR2 and TLR4 in the non-infection group decreased after surgery, while the levels in the infection group increased compared to those before surgery. These results suggest that surgical treatment can improve TLR2 and TLR4 levels in patients. However, for patients with postoperative infection, the oc-currence of infection results in a state of inflammatory response, which increases TLR2 and TLR4 levels. The re-sults also suggest that changes in TLR2 and TLR4 levels are of great clinical significance to postoperative infection. The value of postoperative TLR2 and TLR4 levels for pre-dicting postoperative infection was analyzed using ROC curves, and the results indicated that postoperative TLR2 and TLR4 levels have clinical value with high sensitivity
and specificity. Hence, we consider TLR2 and TLR4 levels after TACE to be useful biomarkers for evaluating postop-erative infection in patients with liver cancer.
Innovations
This study has the following innovations and advantages. Firstly, changes in the T lymphocyte subset level and posi-tive rates of TLR2 and TLR4 in patients with infection after liver cancer interventional therapy were investigated for the first time. Secondly, we used patient blood samples for the analyses, which were easy to collect, involved simple procedures, and had high compliance.
Limitations
This study is subject to several limitations. First, without further dynamic observation of each indicator, it is difficult to assess the relationship between the above indicators and patient prognosis. Second, this is a single-center study with a small sample size. Lastly, the constituent ratios of age, gender, age, BMI, pathological type, Child–Pugh classi-fication, clinical stage, etc. differed among the enrolled patients, and we did not conduct further subgroup analyses of patients with different characteristics. Therefore, further studies are needed to address these issues.
Conclusions
After interventional therapy for liver cancer, the main infection sites were identified as the lung and abdomen, with Gram-negative bacteria accounting for the ma-jority of infections. Furthermore, the results indicated that the T lymphocyte subset level abnormally changed in patients with infection and that TLRs are closely re-lated to the occurrence and development of postoperative infection. Postoperative TLR2 and TLR4 levels could be used as an auxiliary parameter to assess the postoperative infection risk.
ORCID iDsConghui Zhu https://orcid.org/0000-0002-3564-4151Guanfeng Chen https://orcid.org/0000-0003-3017-731XJiadi Yao https://orcid.org/0000-0002-8665-0906Wenji Lin https://orcid.org/0000-0002-9702-9824
References1. Salati U, Barry A, Chou FY, Ma R, Liu DM. State of the ablation nation:
A review of ablative therapies for cure in the treatment of hepato-cellular carcinoma. Future Oncol. 2017;13(16):1437–1448. doi:10.2217/fon-2017-0061
2. Maharajan K, Hey HWD, Tham I, et al. Solitary vertebral metastasis of primary clear cell carcinoma of the liver: A case report and review of literature. J Spine Surg. 2017;3(2):287–293. doi:10.21037/jss. 2017.06.06
3. Titano J, Noor A, Kim E. Transarterial chemoembolization and radio-embolization across Barcelona clinic liver cancer stages. Semin Intervent Radiol. 2017;34(2):109–115. doi:10.1055/s-0037-1602709

Adv Clin Exp Med. 2022;31(1):17–23 23
4. Ray CE, Battaglia C, Libby AM, et al. Interventional radiologic treat-ment of hepatocellular carcinoma: A cost analysis from the payer perspective. J Vasc Interv Radiol. 2012;23(3):306–314. doi:10.1016/j.jvir.2011.11.016
5. Nooron N, Ohba K, Takeda K, Shibahara S, Chiabchalard A. Dysreg-ulated expression of MITF in subsets of hepatocellular carcinoma and cholangiocarcinoma. Tohoku J Exp Med. 2017;242(4):291–302. doi:10.1620/tjem.242.291
6. Pinato DJ, Howell J, Ramaswami R, Sharma R. Review article: Deliv-ering precision oncology in intermediate-stage liver cancer. Aliment Pharmacol Ther. 2017;45(12):1514–1523. doi:10.1111/apt.14066
7. Kou PS, Zhang Y, Shao W, et al. Significant efficacy and well safety of apatinib in an advanced liver cancer patient: A case report and literature review. Oncotarget. 2017;8(12):20510–20515. doi:10.18632/oncotarget.14724
8. Correnti M, Raggi C. Stem-like plasticity and heterogeneity of circulat-ing tumor cells: Current status and prospect challenges in liver cancer. Oncotarget. 2017;8(4):7094–7115. doi:10.18632/oncotarget.12569
9. Chen JB, Huang J, Chen MS, et al. Transcatheter arterial chemoembo-lization (TACE) versus hepatectomy in hepatocellular carcinoma with macrovascular invasion: A meta-analysis of 1683 patients. J Cancer. 2017;8(15):2984–2991. doi:10.7150/jca.20978
10. Novák K. Functional polymorphisms in Toll-like receptor genes for innate immunity in farm animals. Vet Immunol Immunopathol. 2014; 157(1–2):1–11. doi:10.1016/j.vetimm.2013.10.016
11. Ministry of Health of the People’s Republic of China. Diagnostic crite-ria for nosocomial infections (proposed). Nat Med J Chin. 2021;5:314. doi:10.3760/oma.j.issn.0376-2491.2001.05.027
12. Ministry of Health of the People’s Republic of China. Primary liver cancer treatment specification (2011 edition). Chin Clin Oncol. 2011; 10:929–946. http://qikan.cqvip.com/Qikan/Article/Detail?id=3986 1125&from=Qikan_Search_Index. Accessed January 18, 2021.
13. Deng GL, Zeng S, Shen H. Chemotherapy and target therapy for hepa-tocellular carcinoma: New advances and challenges. World J Hepatol. 2015;7(5):787–798. doi:10.4254/wjh.v7.i5.787
14. Kim YJ, Goh PG, Moon HS, et al. Reactivation of tuberculosis in hepa-tocellular carcinoma treated with transcatheter arterial chemoem-bolization: A report of 3 cases. World J Radiol. 2012;4(5):236–240. doi:10.4329/wjr.v4.i5.236
15. Dong C. Helper T cells and cancer-associated inflammation: A new direction for immunotherapy? J Interferon Cytokine Res. 2017;37(9): 383–385. doi:10.1089/jir.2017.0012
16. Liu CY, Deng LH. Related risk factors of postoperative infections after cesarean section and the changes of T lymphocyte subsets and inter-leukin clusters levels. Chin J Fam Plan. 2020;5:660–665. http://qikan.cqvip.com/Qikan/Article/Detail?id=7102507581. Accessed January 8, 2021.
17. Kwan SW, Harris WP, Gold LS, Hebert PL. Comparative effectiveness of transarterial embolization and sorafenib for hepatocellular carci-noma: A population-based study. AJR Am J Roentgenol. 2018;210(6): 1359–1365. doi:10.2214/ajr.17.19094
18. Wu X, Chen R, Zheng WL, Hu H. Comprehensive analysis of factors affecting clinical response and short-term survival to drug-eluting bead transarterial chemoembolization for treatment in patients with liver cancer. Technol Cancer Res Treat. 2018;17:1533033818759878. doi:10.1177/1533033818759878
19. Wang H, Du PC, Wu MC, Cong WM. Postoperative adjuvant transarte-rial chemoembolization for multinodular hepatocellular carcinoma within the Barcelona Clinic Liver Cancer early stage and microvascu-lar invasion. Hepatobiliary Surg Nutr. 2018;7(6):418–428. doi:10.21037/hbsn.2018.09.05
20. Lai JL, Liu YH, Liu C, et al. Indirubin inhibits LPS-induced inflamma-tion via TLR4 abrogation mediated by the NF-kB and MAPK signal-ing pathways. Inflammation. 2017;40(1):1–12. doi:10.1007/s10753-016-0447-7
21. Mazur-Bialy AI, Pocheć E, Zarawski M. Anti-Inflammatory proper-ties of irisin, mediator of physical activity, are connected with TLR4/MyD88 signaling pathway activation. Int J Mol Sci. 2017;18(4):701. doi:10.3390/ijms18040701
22. Alarcón MML, Ruocco JF, Ferreira F, et al. Toll-Like receptor 4 and NLRP3 caspase 1- interleukin-1β-axis are not involved in colon ascen-dens stent peritonitis-associated heart disease. Shock. 2018;50(4): 483–492. doi:10.1097/shk.0000000000001059
23. Li HM, Wang X, Xu AL. Effect of paclitaxel+hirudin on the TLR4-MyD88 signaling pathway during inflammatory activation of human coronary artery smooth muscle cells and mechanistic analysis. Cell Physiol Biochem. 2018;50(4):1301–1317. doi:10.1159/000494588


Cite asGodala M, Sewerynek E, Gaszyńska E. Vitamin D status in Polish women with endocrine and osteoporotic disorders in relation to diet, supplement use and exposure to ultraviolet radiation. Adv Clin Exp Med. 2022;31(1):25–32. doi:10.17219/acem/141604
DOI10.17219/acem/141604
CopyrightCopyright by Author(s) This is an article distributed under the terms of theCreative Commons Attribution 3.0 Unported (CC BY 3.0)(https://creativecommons.org/licenses/by/3.0/)
Address for correspondenceMałgorzata GodalaE-mail: [email protected]
Funding sourcesNone declared
Conflict of interestNone declared
Received on May 31, 2021Reviewed on July 19, 2021Accepted on August 25, 2021
Published online on October 12, 2021
AbstractBackground. In Europe, the rate of 25(OH)D deficiency is considered high. Thus, it seems necessary to con-duct population-based studies to fully assess vitamin D deficiency in various groups of patients.
Objectives. To evaluate serum 25(OH)D levels and the frequency of deficiency in women in Poland with endocrine and osteoporotic disorders. The influences of diet, use of vitamin/mineral supplementation and exposure to ultraviolet (UVB) radiation on vitamin D status in women with metabolic disorders were also examined.
Materials and methods. The patient group consisted of 223 women aged 19–81 years diagnosed with endocrine and/or osteoporotic disorders. The control group consisted of 108 clinically healthy women aged 26–72 years. Serum 25(OH)D concentration was assessed using a chemiluminescent immunoassay (CLIA). An ad hoc questionnaire was used to assess the participants’ exposure to UVB radiation. Food intake was assessed using a three-day 24-hour questionnaire interview.
Results. The following groups showed significantly higher 25(OH)D levels: women taking vitamin D supple-ments compared to women not taking vitamin D supplements (29.3 ±3.2 compared to 19.5 ±3.7 ng/mL, p = 0.0024); premenopausal women compared to postmenopausal women (28.9 ±5.2 compared to 21.5 ±4.5 ng/mL, p = 0.0021); women who visited sunny countries in the last 6 months compared to women who did not (28.1 ±3.1 ng/mL compared to 24.5 ±5.3 ng/mL, p = 0.0031); and normal weight or overweight women (according to body mass index (BMI)) compared to obese women (27.4 ±4.5 ng/mL compared to 22.3 ±4.7 ng/mL, p = 0.0431). In addition, 25(OH)D concentration correlated with total dietary vitamin D intake in the patient group (R = 0.17, p = 0.0021). Of all examined food groups, fish consumption affected serum 25(OH)D levels in patients (R = 0.20, p = 0.0421) and controls (R = 0.29, p = 0.0002). Consumption of fish products contributed to statistical differences between the patient group (R = 0.17, p = 0.0072) and healthy subjects (R = 0.19, p = 0.0032).
Conclusions. The most crucial factors influencing vitamin D status in the studied women were regular fish consumption, spending holidays in sunny destinations and regular intake of vitamin D preparations.
Key words: diet, metabolic disorders, ultraviolet radiation, 25(OH)D, vitamin D status
Original papers
Vitamin D status in Polish women with endocrine and osteoporotic disorders in relation to diet, supplement use and exposure to ultraviolet radiation
Małgorzata Godala1,A–F, Ewa Sewerynek2,A,F, Ewelina Gaszyńska1,A,E,F
1 Department of Nutrition and Epidemiology, Medical University of Lodz, Poland2 Department of Endocrine Disorders and Bone Metabolism, Medical University of Lodz, Poland
A – research concept and design; B – collection and/or assembly of data; C – data analysis and interpretation; D – writing the article; E – critical revision of the article; F – final approval of the article
Advances in Clinical and Experimental Medicine, ISSN 1899–5276 (print), ISSN 2451–2680 (online) Adv Clin Exp Med. 2022;31(1):25–32

M. Godala, E. Sewerynek, E. Gaszyńska. Vitamin D nutritional status of Polish women26
Background
In light of recent research, vitamin D is recognized as more than just a factor preventing rickets and osteo-porosis. An increasing number of studies have confirmed its role in the proper functioning of the cardiovascular system and prevention of neoplastic and autoimmune diseases.1–5 The presence of vitamin D receptors (VDR) in tissues that are not involved in maintaining calcium-phosphate homeostasis proves the multidirectional activity of calcitriol.3,6,7 Thus, vitamin D is thought to participate not only in bone metabolism, but also in cell proliferation and differentiation, as well as insulin secretion. Further-more, it has pro- or anti-apoptogenic properties.8–10 Until recently, vitamin D supplementation was recommended mainly for children. However, the need to introduce vi-tamin D supplementation in adults affected by various diseases, especially during the autumn-winter period, is in-creasingly discussed in the scientific literature.9,11
Both in Europe and worldwide, the rate of 25(OH)D de-ficiency is considered high.8,10,11 This is caused by many factors including insufficient intake, insufficient exposure to sunlight, impaired cutaneous synthesis, and impaired formation of active metabolites in the liver and kidneys. Vitamin D regulates homeostasis of phosphate and calcium, and calcium intestinal absorption.3,7 It also regulates blood pressure, and its concentration is inversely correlated with plasma renin activity.12,13 Some studies have found that vitamin D may impact intracellular calcium concentration in pancreatic cells.14,15 Since calcium stimulates insulin se-cretion, vitamin D deficiency may increase the risk of diabe-tes and other carbohydrate disorders. Vitamin D is also in-volved in lipid metabolism because its deficiency increases peripheral resistance to insulin, thereby worsening the lipid profile.10,13,14 Moreover, studies have reported the decreased levels of 25(OH)D in obese patients resulting from seques-tration of vitamin D in the over developed adipose tissue.2,3,5 Overall, vitamin D deficiency is associated with metabolic disorders and cardiovascular diseases, which are signifi-cant public health problems. However, whether vitamin D deficiency is a risk factor for cardiovascular and metabolic diseases, or if their existence predisposes an individual to deficiency, remains unclear. Thus, it seems necessary to conduct population-based studies in order to fully assess vitamin D deficiency in various groups of patients.
Objectives
The aim of this study was to evaluate serum 25(OH)D levels and the frequency of deficiency in women with en-docrine and osteoporotic disorders in Poland. Moreover, the influence of diet, use of vitamin/mineral supplementa-tion and exposure to ultraviolet (UVB) radiation on vita-min D status in women with osteoporosis and endocrine disorders were examined.
Materials and methods
Patient and control groups
A total of 331 women living in the Łódź region of Poland participated in this study. The patient group consisted of 223 women aged 19–81 years (mean age: 64.6 ±12.8 years) diagnosed with endocrine and/or osteoporotic disorders, recruited from the Department of Endocrine Disorders and Bone Metabolism, Chair of Endocrinology, Medical Uni-versity of Lodz, between 2017 and 2019. The control group consisted of 108 clinically healthy women aged 26–72 years (mean age 61.4 ±11.3 years) without the above disorders.
In the patient group, osteoporosis was found in 110 (49.3%) women, endocrine disorders (including hypothy-roidism, Hashimoto inflammation and inactive nodules) were found in 53 (23.8%) women and both disorders were diagnosed in 60 (26.9%) women.
In the patient group, 26 (11.7%) women smoked cigarettes, and 173 (77.6%) took vitamin D supplements at a dose of 1000–2000 UI and a daily calcium dose of 500–600 mg for at least 3 months. In the control group, all women were non-smokers, and 31 (28.7%) took vitamin D at a dose of 1000–2000 UI without calcium for at least 3 months.
For both groups, women whose last menstrual pe-riod was at least 12 months prior to the commencement of the study were considered postmenopausal.
Biochemical tests
Biochemical tests were performed by the hospital labo-ratory. Fasting blood was collected from the ulnar vein. The obtained blood samples were used to determine total 25(OH)D using a chemiluminescent immunoassay (CLIA). A serum 25(OH)D concentration of at least 30 ng/mL was considered normal, whereas a level below 30 ng/mL was considered insufficient (deficiency).9 The 25(OH)D was assessed according to the season by dividing the year into quarters: I – January to March, II – April to June, III – July to September, and IV – October to December.
The collected blood samples were also used for the de-termination of total calcium concentration according to the Olympus Calcium Procedure (reaction of calcium ions Ca2+ with Arsenazo III complex, corrected for albu-min), and for the quantification of inorganic phosphorus using ultraviolet photometry.
Assessment of exposure to UVB radiation
An ad hoc questionnaire developed by the authors of this study was used to assess participants’ exposure to UVB radiation. The questionnaire estimated the time and the amount of sun exposure in all quarters of the year; the number of hours spent outdoors each week (8:00–16:00); and participants’ preferences for being exclusively in the sun, both in the sun and shade, or only in the shade.

Adv Clin Exp Med. 2022;31(1):25–32 27
The questionnaire also assessed the frequency of solar-ium use (within the last 3 months), the frequency of visit-ing countries with high solar exposure (within the last 6 months), skin phototype (I – always burns, does not tan; II – burns easily, tans poorly; III – burns moderately, tans moderately; IV – burns minimally, tans easily; V – rarely burns, tans profusely; VI – never burns, never tans), and use of UVB protection agents (never, rarely, often, always).
Anthropometry
All participants underwent standard anthropometric measurements. The waist-to-hip ratio (WHR) was deter-mined by dividing the waist circumference by hip circum-ference. Body mass index (BMI) was determined by divid-ing participants’ body weight (in kg) by height (in m2).
Nutrition assessment
Before the tests, food intake was assessed using a 24-hour questionnaire interview administered 3 times (2 week-days and 1 weekend day) for each participant by a trained dietician. The “Album of photographs of food products and dishes” by the National Food and Nutrition Institute in Warszawa, Poland was used to determine the normal size of the consumed portions. The average energy intake, as well as the intake of particular nutrients, was assessed using Diet v. 5.0 software (license No. 52/PD/2013; Instytut Żywności i Żywienia, Warszawa, Poland).16
In order to assess vitamin D intake over the last month, a questionnaire on the frequency of consumption of se-lected dietary products that are sources of vitamin D was used. The products were divided into 7 groups depend-ing on the content of vitamin D in a standard portion size. The number of portions consumed per week and per month was determined. The assessed food groups were: fresh and smoked fish (3–10 µg of vitamin D), fish products (10–12 µg of vitamin D), milk and milk products (0.07–0.3 µg of vitamin D), eggs (0.85 µg of vitamin D), meat and meat products (0.09–0.75 µg of vitamin D), ce-reals (0.06–0.25 µg of vitamin D), and fats (0.03–0.31 µg of vitamin D). The amount and type of supplement intake were also taken into account.
Statistical analyses
Statistical analyses were performed using STATISTICA v. 13 software (StatSoft Inc., Tulsa, USA). Results are re-ported using descriptive statistics, including mean and standard deviation (SD). For variables with nominal scales, the rate of occurrence was computed. The normality of the distribution of the variables was determined using the Shapiro–Wilk test. All analyzed variables deviated significantly from the normal distribution. The means of 2 independent groups were compared using the Mann–Whitney U test for continuous and dichotomous variables.
Spearman’s rank order correlation was used to determine the correlation between variables. To assess the risk of vi-tamin D deficiency in patients with osteoporosis or en-docrine disorders and in healthy subjects, receiver op-erating characteristic (ROC) classification models were used. A multivariate adaptive regression splines model was constructed to determine the relationship between the studied factors (vitamin D consumption, calcium and vitamin D supplement intake, consumption of fish, and normal weight/overweight/obese) and 25(OH)D concen-trations. A value of p < 0.05 was considered statistically significant.17
Ethics approval
This study was performed according to the Declara-tion of Helsinki and approved by the Bioethics Commit-tee of the Medical University of Lodz, Poland (approval No. RNN/556/10/KB). All participants provided written informed consent before participating in this study.
Results
There were no statistically significant differences re-garding age, weight, waist circumference, BMI, or WHR between the study and control groups. Similarly, there was no difference regarding UVB exposure. However, patients with osteoporotic and endocrine disorders used vitamin and mineral supplementation significantly more often than healthy women. In both groups, 1/5 of women had spent a holiday in a country with high solar exposure in the last 6 months, and 2/3 claimed to have spent more than 7 h per week outdoors in spring and summer. With regard to skin phototype, nearly 60% of women claimed that their skin burns rarely or moderately and tans moderately or easily. A small percentage of participants reported that they al-ways use UVB protective agents (Table 1).
The concentration of 25(OH)D was significantly lower in the group of women with osteoporosis and endocrine disorders compared to the control group (25.9 ±11.8 ng/mL compared to 28.1 ±9.1 ng/mL; Z = 2.1808, p = 0.0029). How-ever, the prevalence of vitamin D deficiency was not signifi-cantly different between the 2 groups (Table 1). There were significantly higher 25(OH)D levels in the following groups: women taking vitamin D supplements compared to women not taking vitamin D supplements (29.3 ±3.2 ng/mL com-pared to 19.5 ±3.7 ng/mL, Z = 3.2056, p = 0.0024); pre-menopausal women compared to postmenopausal women (28.9 ±5.2 ng/mL compared to 21.5 ±4.5 ng/mL, Z = 2.9634, p = 0.0021); women who visited sunny countries in the last 6 months compared to women who did not (28.1 ±3.1 ng/mL compared to 24.5 ±5.3 ng/mL, Z = 2.9583, p = 0.0031); and normal-weight or overweight women (based on BMI) compared to obese women (27.4 ±4.5 ng/mL compared to 22.3 ±4.7 ng/mL, Z = 3.2845, p = 0.0431). In the control

M. Godala, E. Sewerynek, E. Gaszyńska. Vitamin D nutritional status of Polish women28
Table 1. Characteristics of the study participants
CharacteristicsPatient group
n = 223Control group
n = 108 Z, p-value Mann–Whitney test
mean ±SD/n (%) mean ±SD/n (%)
Age [years] 64.6 ±12.8 61.4 ±11.3 4.2306, 0.4673
Weight [kg] 71.5 ±14.7 73.5 ±7.9 1.1365, 0.6233
Body mass index (BMI) [kg/m2] 27.8 ±5.5 26.1 ±5.8 1.4817, 0.7671
Waist circumference [cm] 88.8 ±12.9 87.2 ±7.2 1.1463, 0.5659
Pre-menopausal women, n (%) 84 (37.67) 41 (37.96) 1.0453, 0.7352
Regular vitamin D supplements users, n (%) 173 (77.6) 31 (28.7) 4.5638, <0.0001
UVB exposure
Sunny vacation during the previous 6 months, n (%) 44 (19.73) 20 (18.52) 1.3482, 0.8671
Outside during daylight >7 h/week, n (%) 151 (67.71) 79 (73.15) 0.9834, 0.9654
Summer 136 (60.99) 72 (66.67) 1.7384, 0.7694
Winter 62 (27.80) 25 (23.15) 0.9954, 0.4739
Preference, n (%)
Sun avoiders 49 (21.97) 22 (20.37) 1.2376, 0.9674
Some exposure 155 (69.51) 74 (68.52) 1.0674, 0.7698
Frequent exposure 19 (8.52) 12 (11.11) 1.1054, 0.8033
Sunbathing during previous 3 months, n (%) 5 (2.24) 4 (3.70) 0.8725, 0.6713
Skin phototype, n (%)
I–II 39 (17.49) 19 (17.59) 1.1358, 0.7474
III–IV 132 (59.19) 62 (57.41) 1.0386, 0.6704
V–VI 52 (23.32) 27 (25) 1.1079, 0.8552
Sun-protection products, n (%)
Never 70 (31.39) 34 (31.48) 1.1637, 0.8452
Rarely 59 (26.46) 28 (25.93) 0.9427, 0.7752
Often 65 (29.15) 30 (27.78) 1.0926, 0.8047
Always 29 (13.00) 16 (14.81) 0.9963, 0.9172
Dietary intake
Energy [kcal/day] 1415.7 ±447.4 2127.2 ±1182.3 4.2349, <0.0001
Fats [g/day] 53.4 ±24.3 79.3 ±57.7 3.9465, <0.0001
Proteins [g/day] 57.9 ±19.5 99.6 ±45.8 2.9836, <0.0001
Carbohydrates [g/day] 189.0 ±61.0 268.8 ±139.8 6.4326, <0.0001
Vitamin D (without supplements) [µg/day] 3.7 ±2.3 7.4 ±5.6 2.9987, <0.0001
Total vitamin D (including supplements) [µg/day] 38.2 ±15.0 21.1 ±13.6 3.9075, 0.0028
Calcium (without supplements) [mg/day] 512.5 ±278.1 690.1 ±486.0 2.9967, <0.0001
Total calcium (including supplements) [mg/day] 713.4 ±419.3 690.1 ±486.0 3.0784, <0.0001
Phosphorus [mg/day] 921.3 ±318.7 1579.6 ±764.3 4.0237, <0.0001
Groups of products
Fresh and smoked fish [portions/week] 1.2 ±0.7 2.4 ±1.1 4.2271, <0.0001
Fresh and smoked fish [µg vitamin D/week] 10.7 ±3.3 21.3 ±6.8 3.9566, <0.0001
Fish products [portions/week] 1.3 ±0.5 2.7 ±0.9 3.2874, <0.0001
Fish products [µg vitamin D/week] 13.8 ±2.9 26.8 ±5.6 4.0376, <0.0001
Serum concentration
25(OH)D total [ng/mL] 25.9 ±11.8 28.1 ±9.1 2.1808, 0.0029
25(OH)D deficiency, n (%) 149 (66.8) 68 (62.9) 0.8725, 0.8043
Parathormone [pg/mL] 54.4 ±19.1 84.4 ±12.5 2.4381, 0.0068
Calcium [mmol/L] 2.4 ±0.6 2.4 ±0.2 0.5683, 0.9269
Phosphorus [mmol/L] 1.1 ±0.5 1.3 ±0.5 0.7856, 0.4738
UVB – ultraviolet radiation; SD – standard deviation.
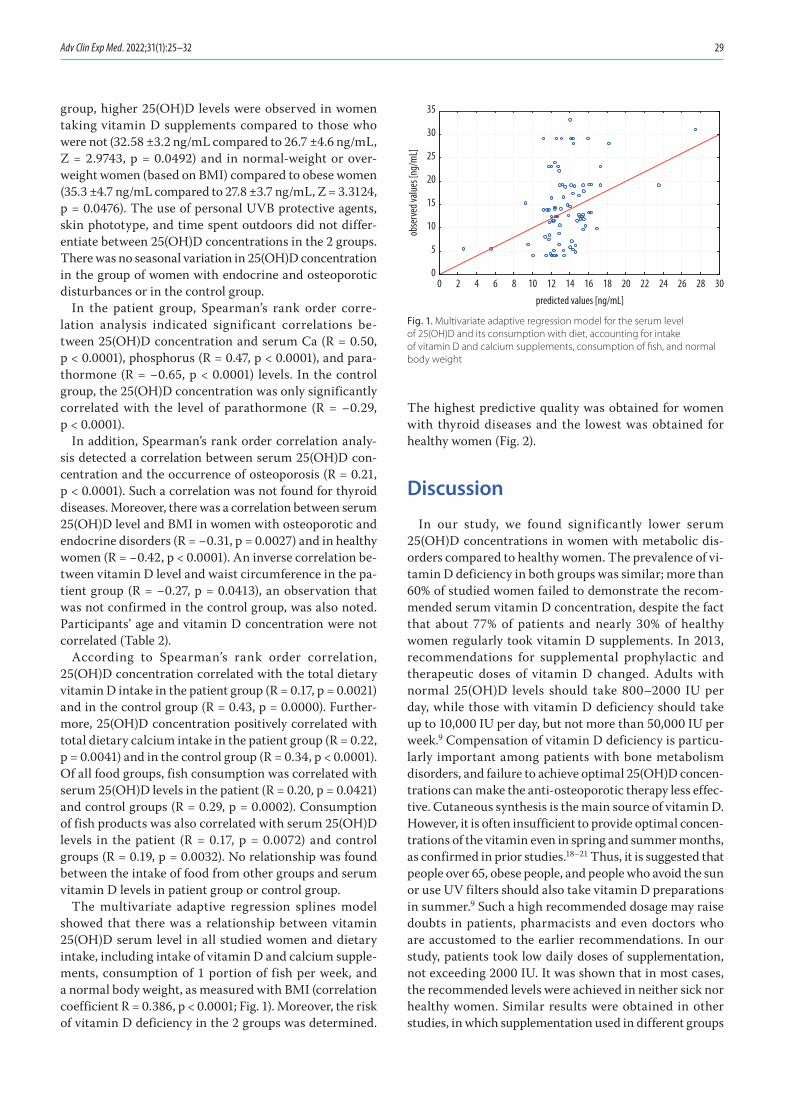
Adv Clin Exp Med. 2022;31(1):25–32 29
group, higher 25(OH)D levels were observed in women taking vitamin D supplements compared to those who were not (32.58 ±3.2 ng/mL compared to 26.7 ±4.6 ng/mL, Z = 2.9743, p = 0.0492) and in normal-weight or over-weight women (based on BMI) compared to obese women (35.3 ±4.7 ng/mL compared to 27.8 ±3.7 ng/mL, Z = 3.3124, p = 0.0476). The use of personal UVB protective agents, skin phototype, and time spent outdoors did not differ-entiate between 25(OH)D concentrations in the 2 groups. There was no seasonal variation in 25(OH)D concentration in the group of women with endocrine and osteoporotic disturbances or in the control group.
In the patient group, Spearman’s rank order corre-lation analysis indicated significant correlations be-tween 25(OH)D concentration and serum Ca (R = 0.50, p < 0.0001), phosphorus (R = 0.47, p < 0.0001), and para-thormone (R = −0.65, p < 0.0001) levels. In the control group, the 25(OH)D concentration was only significantly correlated with the level of parathormone (R = −0.29, p < 0.0001).
In addition, Spearman’s rank order correlation analy-sis detected a correlation between serum 25(OH)D con-centration and the occurrence of osteoporosis (R = 0.21, p < 0.0001). Such a correlation was not found for thyroid diseases. Moreover, there was a correlation between serum 25(OH)D level and BMI in women with osteoporotic and endocrine disorders (R = −0.31, p = 0.0027) and in healthy women (R = −0.42, p < 0.0001). An inverse correlation be-tween vitamin D level and waist circumference in the pa-tient group (R = −0.27, p = 0.0413), an observation that was not confirmed in the control group, was also noted. Participants’ age and vitamin D concentration were not correlated (Table 2).
According to Spearman’s rank order correlation, 25(OH)D concentration correlated with the total dietary vitamin D intake in the patient group (R = 0.17, p = 0.0021) and in the control group (R = 0.43, p = 0.0000). Further-more, 25(OH)D concentration positively correlated with total dietary calcium intake in the patient group (R = 0.22, p = 0.0041) and in the control group (R = 0.34, p < 0.0001). Of all food groups, fish consumption was correlated with serum 25(OH)D levels in the patient (R = 0.20, p = 0.0421) and control groups (R = 0.29, p = 0.0002). Consumption of fish products was also correlated with serum 25(OH)D levels in the patient (R = 0.17, p = 0.0072) and control groups (R = 0.19, p = 0.0032). No relationship was found between the intake of food from other groups and serum vitamin D levels in patient group or control group.
The multivariate adaptive regression splines model showed that there was a relationship between vitamin 25(OH)D serum level in all studied women and dietary intake, including intake of vitamin D and calcium supple-ments, consumption of 1 portion of fish per week, and a normal body weight, as measured with BMI (correlation coefficient R = 0.386, p < 0.0001; Fig. 1). Moreover, the risk of vitamin D deficiency in the 2 groups was determined.
The highest predictive quality was obtained for women with thyroid diseases and the lowest was obtained for healthy women (Fig. 2).
Discussion
In our study, we found significantly lower serum 25(OH)D concentrations in women with metabolic dis-orders compared to healthy women. The prevalence of vi-tamin D deficiency in both groups was similar; more than 60% of studied women failed to demonstrate the recom-mended serum vitamin D concentration, despite the fact that about 77% of patients and nearly 30% of healthy women regularly took vitamin D supplements. In 2013, recommendations for supplemental prophylactic and therapeutic doses of vitamin D changed. Adults with normal 25(OH)D levels should take 800–2000 IU per day, while those with vitamin D deficiency should take up to 10,000 IU per day, but not more than 50,000 IU per week.9 Compensation of vitamin D deficiency is particu-larly important among patients with bone metabolism disorders, and failure to achieve optimal 25(OH)D concen-trations can make the anti-osteoporotic therapy less effec-tive. Cutaneous synthesis is the main source of vitamin D. However, it is often insufficient to provide optimal concen-trations of the vitamin even in spring and summer months, as confirmed in prior studies.18–21 Thus, it is suggested that people over 65, obese people, and people who avoid the sun or use UV filters should also take vitamin D preparations in summer.9 Such a high recommended dosage may raise doubts in patients, pharmacists and even doctors who are accustomed to the earlier recommendations. In our study, patients took low daily doses of supplementation, not exceeding 2000 IU. It was shown that in most cases, the recommended levels were achieved in neither sick nor healthy women. Similar results were obtained in other studies, in which supplementation used in different groups
Fig. 1. Multivariate adaptive regression model for the serum level of 25(OH)D and its consumption with diet, accounting for intake of vitamin D and calcium supplements, consumption of fish, and normal body weight
0 2 4 6 8 10 12 14 16 18 20 22 24 26 28 30
predicted values [ng/mL]
0
5
10
15
20
25
30
35
obse
rved
value
s [ng
/mL]

M. Godala, E. Sewerynek, E. Gaszyńska. Vitamin D nutritional status of Polish women30
of patients proved to be insufficient in normalizing serum 25(OH)D levels.19,22,23
This study demonstrated a significant effect of dietary vitamin D and calcium intake on serum 25(OH)D lev-els. Vitamin D intake without supplements in the pa-tient group was 3.7 ±2.3 µg and in the control group was 7.4 ±5.6 µg, whereas the recommended intake is 15 µg. Low intake of vitamin D is common in European countries and ranges between 4 µg and 10 µg per day.24–28 Hence, recom-mendations not just on possible need for supplementation, but concerning various doses of vitamin D administered to different age groups of patients with different disor-ders, are currently widely discussed. Insufficient intake of vitamin D may result from the fact that high doses of this vitamin can be found only in a few alimentary products. In countries where there is an obligation to for-tify low-fat dairy products and margarines with vitamin D (Scandinavian countries), and in countries with a high intake of marine fish (Scandinavian and Mediterranean countries), vitamin D intake is higher than in central Eu-rope.29–32 In our study, we showed a significant increase in 25(OH)D concentrations in women consuming fish and fish products. These alimentary products are essen-tial dietary components as they are the greatest source of vitamin D.
Cutaneous synthesis provides 90% of the body supply of vitamin D.33,34 Due to a low exposure to sunlight in au-tumn and winter, supplementation is necessary to main-tain optimal serum 25(OH)D concentrations. Thus, we also evaluated participants’ exposure to ultraviolet radiation. We found that 25(OH)D concentrations did not show seasonal variation. Furthermore, factors such as time spent outdoors, use of UV protective agents and prefer-ence regarding exposure intensity did not significantly affect serum levels of 25(OH)D. In contrast, significantly higher 25(OH)D concentrations were observed in women who had spent holidays in countries with high solar ex-posure within the 6 months prior to the commencement of the study.
It is possible that brief but intense exposure of a large skin area to sunlight is a more effective method of supply-ing the body with vitamin D than supplementation. This possibility has been discussed in clinical studies evaluat-ing the effects of sun exposure on vitamin D synthesis in the skin. However, the results were often contradictory. Some authors’ results were consistent with ours, as they noted a significant increase in 25(OH)D concentration af-ter strong exposure to sunlight during holidays.33,35 Other studies failed to confirm this relationship.8,11,36 Clinical studies on the efficiency of cutaneous vitamin D synthesis
Table 2. Multivariate adaptive regression model for the serum level of 25(OH)D and its consumption with diet, accounting for the intake of vitamin D and calcium supplements, consumption of fish, and normal body mass index (BMI)
Vitamin D [ng/dL] correlation coefficient F-test df Standard error of estimate p-value
0.386 10.883 3.186 7.234 <0.0001
Vitamin D and Ca supplements intake 0.334 <0.0001
Consumption of fish [1 portion/week] 0.21 <0.0001
Normal body weight [BMI < 25 kg/m2] 0.11 <0.0001
df – degrees of freedom.
Fig. 2. Predicted prevalence of 25(OH)D deficiency in patients with different metabolic disorders
ROC – receiver operating characteristic.
ROC curvedirectional factor = 5.93
cutoff point: 0.307
0.307
0.0 0.2 0.4 0.6 0.8 1.01-specificity
0.0
0.2
0.4
0.6
0.8
1.0
sens
itivi
ty
ROC curvedirectional factor = 0.31
cutoff point: 0.564
0.564
0.0 0.2 0.4 0.6 0.8 1.01-specificity
0.0
0.2
0.4
0.6
0.8
1.0
sens
itivi
ty
ROC curvedirectional factor = 1.79
cutoff point: 0.591
0.0 0.2 0.4 0.6 0.8 1.01-specificity
0.0
0.2
0.4
0.6
0.8
1.0
sens
itivi
ty
0.591
healthy osteoporotic disorders endocrine disorders

Adv Clin Exp Med. 2022;31(1):25–32 31
showed that a single erythemal dose leads to a large increase in 25(OH)D concentrations due to the release of about 30 µg D3 from 1 m2 of body surface per day. The standard pre-exposure vitamin D concentration in healthy subjects was restored after several days. However, in patients with 25(OH)D deficiency, the increase in 25(OH)D concentra-tion after sun exposure was observed for much longer,37,38 which is consistent with the results of our study.
The effect of vitamin D concentration on calcium-phosphate metabolism is often discussed, as it is of par-ticular importance for osteoporotic patients. This study revealed an inverse relationship between 25(OH)D and parathormone levels, and a positive relationship between calcium and phosphorus levels. Increased parathormone levels and decreased vitamin D blood levels result in rapid bone turnover and decreased bone mass, which promotes the development of osteomalacia and reduces muscle strength. Vitamin D, which contributes to the reabsorp-tion of calcium from the gastrointestinal tract, enables maintenance of the calcium and phosphate balance. In ad-dition, the gut is reported to be highly adaptive depending on the amount of dietary calcium intake.8,9,11 When dietary calcium is low, the gut produces more calcium-binding protein, so calcium absorption is increased. Hypocal-cemia in turn stimulates parathyroid gland production of parathormone, which stimulates renal 1α-hydroxylase to increase synthesis of 1,25(OH)2D. Once serum calcium levels are normalized, parathormone synthesis and cal-cium absorption in the gastrointestinal tract decrease. Despite insufficient dietary calcium intake, we observed normal mean concentrations in the patient and control groups, which confirms the mechanisms described above.
The factors influencing vitamin D nutritional status in patients with metabolic disorders are complex and require further research. Undoubtedly, the nutritional status and age of participants are variables that may influ-ence the effect of sun exposure on cutaneous vitamin D synthesis. Many studies have reported lower 25(OH)D concentrations in obese subjects,39–42 which were also demonstrated in this study. Other authors reported a decrease in 25(OH)D concentration that occurred with age,20,21,25 which was not confirmed in our study. However, our study revealed an influence of menopause on vitamin D level, with a significantly lower concentra-tion of 25(OH)D in postmenopausal women. Although similar relationships have been reported in other stud-ies,20,21 it is worth mentioning that this may be a result of less efficient dermal synthesis in older people and not necessarily a result of menopause.
Despite great knowledge about the factors influenc-ing 25(OH)D concentration, the results of the present study and studies conducted by other authors confirm that the suggested amount and type of sun exposure, the amount of supplement intake and the need of vita-min D food fortification require further research, espe-cially regarding patients with metabolic disorders.
Limitations
Our study is subject to several limitations. Firstly, we could not evaluate the impact of cigarette smoking on 25(OH)D level due to the limited number of partici-pants who were current smokers. Secondly, it was not pos-sible to confirm the impact of calcium supplementation on 25(OH)D concentration in the control group, which may be important. Lastly, we were not able to assess sea-sonal changes in 25(OH)D because participants’ blood samples were only taken once.
Conclusions
The group of women with osteoporotic and endocrine disorders demonstrated vitamin D deficiency despite the intake, however insufficient, of supplements. The cru-cial factors determining vitamin D status in the patient group included regular fish consumption, spending holi-days in sunny destinations and regular intake of vitamin D supplements.
ORCID iDsMałgorzata Godala https://orcid.org/0000-0003-3579-8537Ewa Sewerynek https://orcid.org/0000-0001-9705-4264Ewelina Gaszyńska https://orcid.org/0000-0001-7568-3502
References1. Al Mheid I, Quyyumi AA. Vitamin D and cardiovascular disease. J Am
Coll Cardiol. 2017;70(1):89–100. doi:10.1016/j.jacc.2017.05.0312. Manson JE, Cook NR, Lee IM, et al. Vitamin D supplements and pre-
vention of cancer and cardiovascular disease. N Engl J Med. 2019; 380(1):33–44. doi:10.1056/NEJMoa1809944
3. Christakos S, Dhawan P, Verstuyf A, Verlinden L, Carmeliet G. Vitamin D: Metabolism, molecular mechanism of action, and pleiotropic effects. Physiol Rev. 2016;96(1):365–408. doi:10.1152/physrev.00014.2015
4. Daffara V, Verdoia M, Rolla R, et al. Impact of polymorphism rs7041 and rs4588 of vitamin D binding protein on the extent of coronary artery disease. Nutr Metab Cardiovasc Dis. 2017;27(9):775–783. doi:10. 1016/j.numecd.2017.06.002
5. Almesri N, Das NS, Ali ME, Gumaa K, Giha HA. Independent associa-tions of polymorphisms in vitamin D binding protein (GC) and vita-min D receptor (VD) genes with obesity and plasma 25OHD3 levels demonstrate sex dimorphism. Appl Physiol Nutr Metab. 2016;41(4): 345–353. doi:10.1139/apnm-2015-0284
6. Fleet JC. The role of vitamin D in the endocrinology controlling cal-cium homeostasis. Mol Cell Endocrinol. 2017;453:36–45. doi:10.1016/j.mce.2017.04.008
7. Battault S, Whiting SJ, Peltier SL, Sadrin S, Gerber G, Maixent JM. Vitamin D metabolism, functions and needs: From science to health claims. Eur J Nutr. 2013;52(2):429–441. doi:10.1007/s00394-012-0430-5
8. Płudowski P, Ducki C, Konstantynowicz J, Jaworski M. Vitamin D status in Poland. Pol Arch Med Wewn. 2016;126(7–8):530–539. doi:10.20452/pamw.3479
9. Pludowski P, Holick MF, Grant WB, et al. Vitamin D supplementation guidelines. J Steroid Biochem Mol Biol. 2018;175:125–135. doi:10.1016/j.jsbmb.2017.01.021
10. Wimalawansa SJ. Associations of vitamin D with insulin resistance, obesity, type 2 diabetes, and metabolic syndrome. J Steroid Biochem Mol Biol. 2018;175:177–189. doi:10.1016/j.jsbmb.2016.09.017
11. O’Neill CM, Kazantzidis A, Ryan MJ, et al. Seasonal changes in vitamin D-effective UVB availability in Europe and associations with popu-lation serum 25-hydroxyvitamin D. Nutrients. 2016;8(9):533. doi:10. 3390/nu8090533

M. Godala, E. Sewerynek, E. Gaszyńska. Vitamin D nutritional status of Polish women32
12. Beveridge LA, Struthers AD, Khan F, et al. Effect of vitamin D supple-mentation on blood pressure: A systematic review and meta-analy-sis incorporating individual patient data. JAMA Int Med. 2015;175(5): 745–754. doi:10.1001/jamainternmed.2015.0237
13. Pilz S, Gaksch M, Kienreich K, et al. Effects of vitamin D on blood pres-sure and cardiovascular risk factors: A randomized controlled trial. Hypertension. 2015;65(6):1195–1201. doi:10.1161/HYPERTENSIONAHA. 115.05319
14. Yoon HK. Gestational diabetes mellitus, fetal growth and vitamin D. J Bone Metab. 2017;24(33):155–159. doi:10.11005/jbm.2017.24.3.155
15. Li X, Liu Y, Zheng Y, Wang P, Zhang Y. The effect of vitamin D supple-mentation on glycemic control in type 2 diabetes patients: A system-atic review and meta-analysis. Nutrients. 2018;10(3):375. doi:10.3390/nu10030375
16. Jarosz M. Normy żywienia dla populacji polskiej. Warszawa, Poland: Instytut Żywności i Żywienia; 2012.
17. Przybyłek M, Jeliński T, Słabuszewska J, Ziółkowska D, Mroczyńska K, Cysewski P. Application of multivariate adaptive regression splines (MARSplines) methodology for screening of dicarboxylic acids cocrystal using 1D and 2D molecular descriptors. Cryst Growth Des. 2019;19(7):3876–3887. doi:10.1021/acs.cgd.9b00318
18. Kamińska S, Pikala M, Dziankowska-Zaborszczyk E, et al. Vitamin D: Dietary intake, supplementation and metabolic status of Polish adults. Int J Occup Med Environ Health. 2020;33(1):107–118. doi:10.13075 /ijomeh.1896.01400
19. Grant WB, Bhattoa HP, Boucher BJ. Seasonal variations of U.S. mortali-ty rates: Roles of solar ultraviolet-B doses, vitamin D, gene expression, and infections. J Steroid Biochem Mol Biol. 2017;173:5–12. doi:10.1016/j.jsbmb.2017.01.003
20. Kocka K, Ślusarska B, Nowicki G, et al. Level of vitamin 25 (OH) D and B group vitamins and functional efficiency among the chronically ill elderly in domiciliary care: A pilot study. Ann Agric Environ Med. 2019;26(3):489–495. doi:10.26444/aaem/105801
21. Stolarczyk A, Horvath A, Szczechura M, Kamińska M, Dziechciarz P. High prevalence of vitamin D insufficiency in community-dwell-ing postmenopausal Polish women. Prz Menopauzalny. 2014;13(5): 289–292. doi:10.5114/pm.2014.46471
22. Cashman KD, van den Heuvel EG, Schoemaker RJ, Preveraud DP, Macdonald HM, Arcot J. 25-hydroxyvitamin D as a biomarker of vita-min D status and its modeling to inform strategies for prevention of vitamin D deficiency within the population. Adv Nutr. 2017;8(6): 947–957. doi:10.3945/an.117.015578
23. Brouwer-Brolsma EM, Vaes AMM, van der Zwaluw NL, et al. Rela-tive importance of summer sun exposure, vitamin D intake, and genes to vitamin D status in Dutch older adults: The B-PROOF study. J Steroid Biochem Mol Biol. 2016;164:168–176. doi:10.1016/j.jsbmb. 2015.08.008
24. Cashman KD, Dowling KG, Skrabakova Z, et al. Vitamin D deficiency in Europe-Pandemic? Am J Clin Nutr. 2016;103(4):1033–1044. doi:10. 3945/ajcn.115.120873
25. Hilger J, Friedel A, Herr R, et al. A systematic review of vitamin D sta-tus in populations worldwide. Br J Nutr. 2014;111(1):23–45. doi:10.1017/S0007114513001840
26. Didriksen A, Burild A, Jakobsen J, Fuskevag OM, Jorde R. Vitamin D3 increases in abdominal subcutaneous fat tissue after supplemen-tation with vitamin D3. Eur J Endocrinol. 2015;172(3):235–241. doi:10. 1530/EJE-14-0870
27. Yasein N, Shroukh W, Hijjawi R. Serum vitamin D and the metabolic syndrome among osteoporotic postmenopausal female patients of a family practice clinic in Jordan. Adv Clin Exp Med. 2015;24(2):245–250. doi:10.17219/acem/41375
28. Belen E, Aykan AC, Kalaycioglu E, Sungur MA, Sungur A, Cetin M. Low-level vitamin D is associated with atrial fibrillation in patients with chronic heart failure. Adv Clin Exp Med. 2016;25(1):51–57. doi:10.17219/acem/34690
29. Macdonald HM, Mavroeidi A, Fraser WD, et al. Sunlight and dietary contributions to the seasonal vitamin D status of cohorts of healthy postmenopausal women living at northerly latitudes: A major cause for concern? Osteoporos Int. 2011;22(9):2461–2472. doi:10.1007/s00198-010-1467-z
30. Cashman KD. Food-based strategies for prevention of vitamin D defi-ciency as informed by vitamin D dietary guidelines, and consideration of minimal-risk UVB radiation exposure in future guidelines. Photo-chem Photobiol Sci. 2020;19(6):800–809. doi:10.1039/c9pp00462a
31. Chandran M, Chan Maung A, Mithal A, Parameswaran R. Vitamin D in COVID-19: Dousing the fire or averting the storm? A perspec-tive from the Asia-Pacific. Osteoporos Sarcopenia. 2020;6(3):97–105. doi:10.1016/j.afos.2020.07.003
32. Kiely M, Cashman KD. The ODIN project: Development of food-based approaches for prevention of vitamin D deficiency throughout life. Nutr Bull. 2015;40:235–246. doi:10.1111/nbu.12159
33. O’Sullivan F, Laird E, Kelly D, et al. Ambient UVB dose and sun enjoy-ment are important predictors of vitamin D status in an older pop-ulation. J Nutr. 2017;147(5):858–868. doi:10.3945/jn.116.244079
34. Neville JJ, Palmieri T, Young AR. Physical determinants of vitamin D photosynthesis: A review. JBMR Plus. 2021;5(1):e10460. doi:10.1002/jbm4.10460
35. Sieniawska J, Lesiak A, Segerbäck D, Young AR, Woźniacka A, Narbutt J. Holiday sun exposure increases level of vitamin D and thymine dim-mers in children. Forum Dermatol. 2016;2(2):73–80. https://journals. viamedica.pl/forum_dermatologicum/article/view/47992/37333. Accessed September 15, 2021.
36. Hribar M, Hristov H, Gregorič M, et al. Nutrihealth study: Seasonal variation in vitamin D status among the Slovenian adult and elderly population. Nutrients. 2020;12(6):1838. doi:10.3390/nu12061838
37. Cashman KD, Kazantzidis A, Webb AR, Kiely M. An integrated predic-tive model of population serum 25-hydroxyvitamin D for applica-tion in strategy development for vitamin D deficiency prevention. J Nutr. 2015;145(10):2419–2425. doi:10.3945/jn.115.217968
38. Makris K, Bhattoa HP, Cavalier E, et al. Recommendations on the mea-surement and the clinical use of vitamin D metabolites and vita-min D binding protein: A position paper from the IFCC Committee on bone metabolism. Clin Chim Acta. 2021;517:171–197. doi:10.1016/j.cca.2021.03.002
39. Pannu PK, Zhao Y, Soares MJ. Reductions in body weight and percent fat mass increase the vitamin D status of obese subjects: A systematic review and metaregression analysis. Nutr Res. 2016;36(3):201–213. doi:10.1016/j.nutres.2015.11.013
40. Ganji V, Tangpricha V, Zhang X. Serum vitamin D concentration ≥75 nmol/L is related to decreased cardiometabolic and inflamma-tory biomarkers, metabolic syndrome, and diabetes, and increased cardiorespiratory fitness in US adults. Nutrients. 2020;12(3):E730. doi:10.3390/nu12030730
41. Zhang R, Li B, Gao X, et al. Serum 25-hydroxyvitamin D and the risk of cardiovascular disease: Dose-response meta-analysis of prospec-tive studies. Am J Clin Nutr. 2017;105(4):810–819. doi:10.3945/ajcn. 116.140392
42. Žmitek K, Hribar M, Hristov H, Pravst I. Efficiency of vitamin D supple-mentation in healthy adults is associated with Body Mass Index and baseline serum 25-hydroxyvitamin D level. Nutrients. 2020;12(5):1268. doi:10.3390/nu12051268
Cite asKaczyńska AE, Kosiński A, Bobkowska K, et al. Clinical anatomy of the spatial structure of the right ventricular outflow tract. Adv Clin Exp Med. 2022;31(1):33–40. doi:10.17219/acem/131752
DOI10.17219/acem/131752
CopyrightCopyright by Author(s) This is an article distributed under the terms of theCreative Commons Attribution 3.0 Unported (CC BY 3.0)(https://creativecommons.org/licenses/by/3.0/)
Address for correspondenceAdam Kosiń[email protected]
Funding sourcesThis work was supported by the National Science Centre, grant No. MN-01-0412/08/212 (http://www.nauka.gov.pl/en/).
Conflict of interestNone declared
Received on October 27, 2020Reviewed on November 11, 2020Accepted on December 17, 2020
Published online on November 5, 2021
AbstractBackground. The right ventricular outflow tract (RVOT) is located above the supraventricular crest and reaches the level of the pulmonary valve. Detailed knowledge of the RVOT spatial structure and its morphology is extremely important for cardiac invasive therapeutic procedures.
Objectives. To examine the spatial structure of the RVOT using virtual models of the right ventricle (RV) interior obtained post mortem.
Materials and methods. The study was carried out using 40 adult hearts from both sexes fixed in formalin. Donors had a negative history of cardiovascular diseases. Silicone models of the interior of the RV were made and then subjected to a digital modelling procedure using the photogrammetry technique. For each 3D model of the RV, the RVOT was extracted and measurements were performed.
Results. Statistical analysis demonstrated that the dimensions of the transverse (p < 0.001) and sagittal (p = 0.002) axis at the level of the upper and lower border of the RVOT differed significantly. There was also a significant difference between the right and left height of the RVOT (p = 0.009). A clear correlation was found between the volume of the RVOT and the volume of the entire RV (r = 0.718, p < 0.001).
Conclusions. The obtained 3D models of the RVOT can help standardize the data related to RVOT archi-tecture. Furthermore, they can extend knowledge about the RVOT in the field of cardiology and improve the procedures in cardiac surgery.
Key words: photogrammetry, RVOT, right ventricle, cardiac imaging, 3D modelling
Original papers
Clinical anatomy of the spatial structure of the right ventricular outflow tract
Agata Ewa Kaczyńska1,A,C,D, Adam Kosiński1,E, Katarzyna Bobkowska2,C, Miłosz Andrzej Zajączkowski1,C, Rafał Kamiński1,E, Grzegorz Marek Piwko1,E, Marta Gleinert-Rożek1,B, Tomasz Gos3,B, Karol Karnecki3,B, Dariusz Kozłowski4,F
1 Department of Clinical Anatomy, Medical University of Gdańsk, Poland2 Faculty of Civil and Environmental Engineering, Gdańsk University of Technology, Poland3 Department of Forensic Medicine, Medical University of Gdańsk, Poland4 Department of Cardiology and Electrotherapy, Medical University of Gdańsk, Poland
A – research concept and design; B – collection and/or assembly of data; C – data analysis and interpretation; D – writing the article; E – critical revision of the article; F – final approval of the article
Advances in Clinical and Experimental Medicine, ISSN 1899–5276 (print), ISSN 2451–2680 (online) Adv Clin Exp Med. 2022;31(1):33–40

A. Kaczyńska et al. Clinical anatomy of the RVOT34
Background
The right ventricle (RV) and structures located in its area are gradually gaining more interest among research-ers. The relationship between anatomical components of the RV and various heart diseases is being increasingly recognized. There are reports in the scientific litera-ture related to the analysis of the structure and function of the RV, both for healthy hearts and those with patho-logical changes.1,2 There are also many papers that present the spatial architecture of the RV and its components. One notable study is that by Ho and Nihoyannopoulos, who comprehensively described the RV and its internal struc-tures in terms of echocardiography.1 Unfortunately, much of the available data about the context of the nomenclature of the structures within the RV are still ambiguous.
One component of the RV sparking serious controver-sies is the right ventricular outflow tract (RVOT), which is the outflow path of the blood flowing through the RV during the cardiac cycle. The RVOT area is located be-tween the pulmonary valve and the level of the upper part of the supraventricular crest.1,2
Due to its clinical significance, the RVOT is an important region for morphological studies. It has been shown that the knowledge of the shape of this area is of great importance in the context of the implantation of cardiac stimulating systems.3 Furthermore, the source of idiopathic ventricular arrhythmias is often located within the RVOT.4 Therefore, thorough knowledge of this area and the structures located in its cavity is the basis for optimizing ablation procedures for arrhythmogenic foci presented by Pytkowski et al.5
From a practical perspective, the spatial structure of the RVOT seems to be particularly important. Infor-mation obtained from 3D modelling can serve as a source of valuable and abundant data, especially in clinical as-pects. Due to modern developments in imaging techniques, cardiac visualization is becoming an essential component of the diagnostic and therapeutic process in cardiology and cardiac surgery.
Photogrammetry, which has been used in medicine for many years, is a technique that enables imaging of anatom-ical structures post mortem. In the context of the heart, photogrammetric methods are primarily aimed at under-standing the shape and size of this organ. Due to the ability to make silicone models of the heart cavities, it has also be-come possible to analyze these spaces. An additional applica-tion and major advantage of photogrammetric techniques is the ability to obtain a durable 3D model that can be pro-cessed and analyzed many times. Photogrammetry is most often associated with the use of the visible electromagnetic radiation range (which was used for the purpose of image registration in this study), although other ranges of radiation are also used, e.g. x-rays, near and mid-infrared radiation, etc.
The importance of photogrammetry in medicine has sig-nificantly increased and it is now associated with the comput-erization and digitization of many medical analysis processes.
For example, it can be used to model the requirements for 3D printing of missing or replacement structures6 or for the col-lection of objective data about the dimensions and shapes of given organs (as in the present study). A dataset collected using photogrammetry can be used for many years.
Objectives
The aim of this study was to perform manual measure-ments of RVOT dimensions and volumes based on virtual models of the RV interior obtained post mortem in order to analyze RVOT morphology.
Materials and methods
Model preparation
Observations were carried out for 40 hearts from adults aged 18–85 years (average age: 44 years) of both sexes (13 women, 27 men). All donors had a negative history of cardiovascular diseases. The hearts were fixed in for-malin solution. In order to obtain the RVOT model, 40 sili-cone internal models of the RV were first made according to the procedure described in Kaczyńska et al.7 (Fig. 1).
This study was approved by the Independent Bioethics Committee for Scientific Research at Medical University of Gdańsk, Poland (approval No. 407/2015 granted on Sep-tember 15, 2015).
Digital modelling
The obtained models were subjected to a digital model-ling procedure using photogrammetry techniques. This method uses serial photos of the physical model to trans-form it into a virtual model. For this purpose, a Sony Alpha DSLR-A300 (Sony Corp., Tokyo, Japan) camera was used with a Sony 3.5–5.6/18–70 lens (Sony Corp.), and 50 con-tinuous photos were taken of each model. Next, the photos were imported into Autodesk ReCap Photo (Autodesk Inc., San Rafael, USA), transformed into a virtual model, and then scaled. In addition, digital processing and manual RVOT measurements were made (Fig. 2).
Right ventricular outflow tract boundary determination
Before manual processing of the 3D models, macroscopic analyses of the obtained silicone models and specimens of the interior of the RV were carried out to determine the characteristic points that would be used to evaluate the RVOT boundaries. During the process of extracting the RVOT from the 3D model of the entire RV, a virtual verti-cal cut was first made, starting from the location of the su-praventricular crest – the largest indentation on the model

Adv Clin Exp Med. 2022;31(1):33–40 35
– to the apex of the RV. Next, from the first of these points, another cut was made to the left edge of the RV, where the free wall meets the septal wall. On this edge, the loca-tion of the first characteristic indentation on the model (from the pulmonary valve to the apex of the RV) was determined, which defines the lower border of the RVOT. Hearts were grouped according to the presence of indentation or no vis-ible indentation. The upper border of the RVOT was defined as the ring connecting the attachment points (commissural points) of the pulmonary valve cusps (Fig. 3A).
Manual measurements
For the obtained 40 models of the RVOT, the following measurements of the spatial structures were performed: the largest dimension in the transverse axis, at the level of the upper (a) and lower (a’) border of the RVOT; the larg-est dimension in the sagittal axis, at the level of the upper (b) and lower (b’) border of the RVOT and the right (c) and left (c’) height of the RVOT, connecting the furthest points at the upper and lower border of the RVOT (Fig. 4). The RVOT volume and the volume of the entire RV were also measured prior to extracting the RVOT.
Statistical analysis
Statistical analysis was performed using Statistica Software v. 13.1 for Windows (StatSoft Inc., Tulsa, USA). The D’Agostino’s and Pearson’s tests were used to check the normality of the distribution. The data had a normal distribution. Student’s t-test for independent samples was used to compare the RVOT measurements. This test was chosen because of the small sample size (40 hearts) and for comparing 2 groups. Pearson’s correlation analysis was performed to assess the relationship between the entire RV volume and the RVOT volume. Results with p < 0.05 were considered statistically significant.
Results
Macroscopic analysis
The RVOT was extracted from each of the forty 3D models of the RV. During the determination of the RVOT boundaries, 2 characteristic indentations were ob-served on the virtual models. The 1st indentation was
Fig. 1. Silicone model of the interior
RA – right atrium; TV – tricuspid valve; RVA – right ventricle apex; RVOT – right ventricle outflow tract; PT – pulmonary trunk; PV – pulmonary valve.
Fig. 2. Digitized silicone model
RA – right atrium; TV – tricuspid valve; RVA – right ventricle apex; RVOT – right ventricle outflow tract; PT – pulmonary trunk; PV – pulmonary valve.

A. Kaczyńska et al. Clinical anatomy of the RVOT36
the equivalent of the supraventricular crest that separated the RVOT on the model from the right atrioventricular orifice. The lowest point lying on this indentation was used to determine the virtual cut towards the apex and left margin of the RV. The 2nd indentation was on the left margin of the RV and was located as the highest point to-wards the pulmonary valve. It was used to set the 2nd point in order to determine the lower border of the RVOT (Fig. 5).
A characteristic indentation was not present only on 4 RVOT models or it was not possible to identify it (Fig. 5A). The rest 36 RVOT models had a noticeable indentation (Fig. 5B,C). After indentation analysis of the 3D models, macroscopic assessment of this structure was carried out on the specimens fixed in formalin. It was found that the structure that created the characteristic indentation on the 3D model during the process of silicone modelling is a muscular element, that connects the septal wall with
the free wall of the RV (Fig. 3B). This structure emerges below the pulmonary valve cusps, at the level of the supra-ventricular crest, and then goes downwards overlapping the free wall of the RV. Above this element, the trabecula-tion is less intense compared to the RV architecture below this structure. The macroscopic examination also revealed that the protruding element does not reach the point where the septal wall connects directly with the free wall of the RV. The structure appeared as a free bundle of muscles connect-ing both walls. Deriving a line along the supraventricular crest and the examined structure, it was found that the line along the examined element is an extension of the supra-ventricular crest, and both marked lines form an arch that curves below the pulmonary valve (Fig. 3C).
Right ventricular outflow tract dimensions and volume
The mean dimension in the transverse axis of the RVOT at the level of the upper border (a) was 23.51 mm (stan-dard deviation (SD) = 4.81 mm); the same mean dimen-sion at the level of the lower border (a’) was 28.18 mm (SD = 6.36 mm). Statistical analysis showed that the di-mension in the transverse axis differed significantly at the level of the upper and lower RVOT (Student’s t-test, p < 0.001; Fig. 6).
The obtained data indicated that this dimension, starting from the lower border to the upper one, became smaller. The mean dimension in the sagittal axis at the level of the upper border of the structure (b) was 18.24 mm (SD = 4.85 mm), while that at the level of the lower border (b’) was 14.95 mm (SD = 4.56 mm). This difference was sta-tistically significant (Student’s t-test, p = 0.002), indicating that the anteroposterior dimension of the RVOT becomes larger towards the pulmonary valve (Fig. 7).
Fig. 3. A. Setting the upper border of the right ventricle outflow tract (RVOT). The yellow asterisk indicates the attachments of the pulmonary valve cusps to the internal surface of the vessel. The line marks are the assumed upper border of the RVOT; B and C. The view of the RVOT from the perspective of the free wall. The yellow asterisk indicates the extension of the supraventricular crest that causes characteristic indentation on the 3D model. The red line marks the supraventricular crest that separates the inflow from outflow tract in the right ventricle (RV)
TV – tricuspid valve; PV – pulmonary valve.
Fig. 4. Scheme of the measurements performed for the right ventricle outflow tract (RVOT)
a – dimension in the transverse axis at the level of the upper border of the RVOT; a’ – dimension in the transverse axis at the level of the lower border of the RVOT; b – dimension in the sagittal axis at the level of the upper border of the RVOT; b’ – dimension in the sagittal axis at the level of the lower border of the RVOT; c – right border of RVOT; c’ – left border of RVOT.

Adv Clin Exp Med. 2022;31(1):33–40 37
The obtained data also allowed us to assess the right (c) and left (c’) mean height of the RVOT structure, which was 35.96 mm (SD = 6.02 mm) and 39.45 mm (SD = 5.63 mm), respectively. The difference between these measurements was statistically significant (Student’s t-test, p = 0.009) (Fig. 8). The left height (c’) of the RVOT was significantly greater than the right height (c).
The mean volume of the RVOT was 11.98 mL, which comprised 24% of the volume of the entire RV. There was a strong positive correlation between the vol-ume of the RVOT and the volume of the entire RV (r = 0.718, p < 0.001). The obtained data clearly show that
as the volume of the entire RV increases, the RVOT volume also increases (Fig. 9).
Discussion
At present, the interior of the RV is divided into 3 parts: inflow tract, trabeculated apex and outflow tract. How-ever, the existing data lack the definition of the exact border between the RVOT and the trabeculated apex of the RV. Due to conflicting data, knowledge about this area is inconsistent.
Fig. 7. Comparison of the dimension in the sagittal axis at the level of the upper (b) and lower (b’) border of the right ventricle outflow tract (RVOT). The values are given in millimeters [mm]
b – M = 18.24, standard deviation (SD) = 4.85; b’ – M = 14.95, SD = 4.56.
Fig. 6. Comparison of the dimension in the transverse axis at the level of the upper (a) and lower (a’) border of the right ventricle outflow tract (RVOT). The values are given in millimeters [mm]
a – M = 23.51, standard deviation (SD) = 4.81; a’ – M = 28.18, SD = 6.36.
Fig. 5. A view of the 3D model of the right ventricle (RV). A. No visible indentation; B and C. Visible indentation (marked with an arrow)
TV – tricuspid valve; RVA – right ventricle apex; RVOT – right ventricle outflow tract; PV – pulmonary valve.
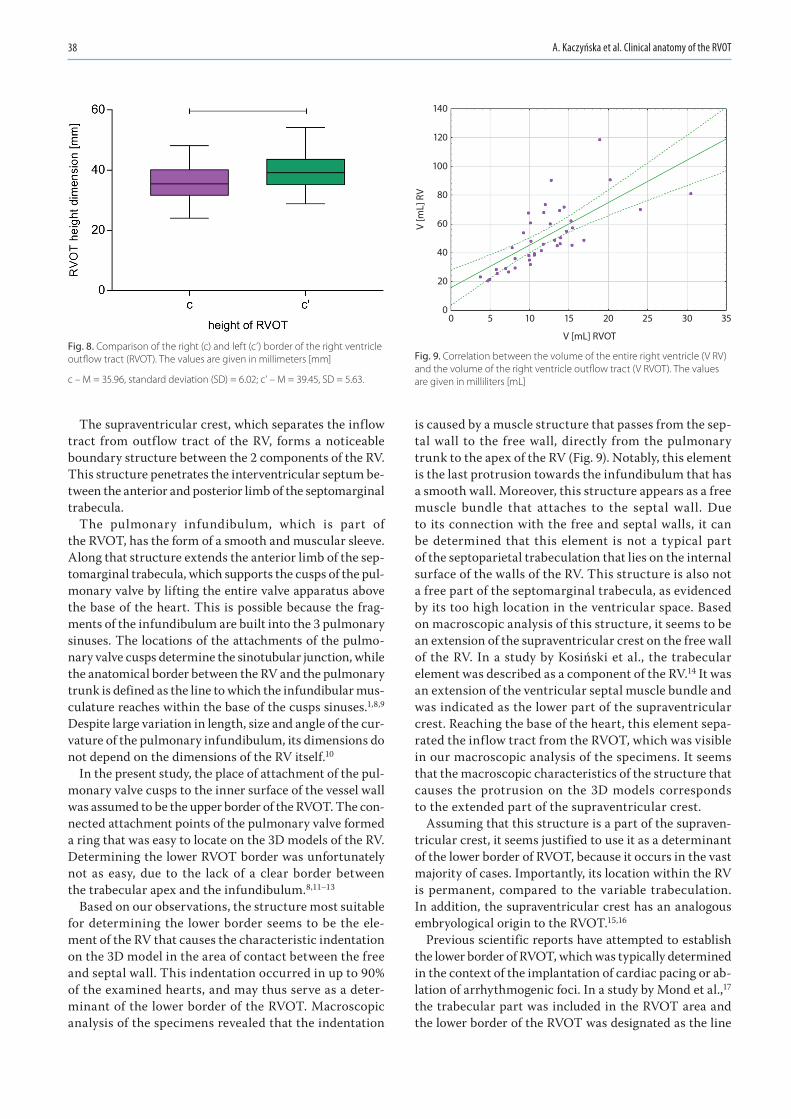
A. Kaczyńska et al. Clinical anatomy of the RVOT38
The supraventricular crest, which separates the inflow tract from outflow tract of the RV, forms a noticeable boundary structure between the 2 components of the RV. This structure penetrates the interventricular septum be-tween the anterior and posterior limb of the septomarginal trabecula.
The pulmonary infundibulum, which is part of the RVOT, has the form of a smooth and muscular sleeve. Along that structure extends the anterior limb of the sep-tomarginal trabecula, which supports the cusps of the pul-monary valve by lifting the entire valve apparatus above the base of the heart. This is possible because the frag-ments of the infundibulum are built into the 3 pulmonary sinuses. The locations of the attachments of the pulmo-nary valve cusps determine the sinotubular junction, while the anatomical border between the RV and the pulmonary trunk is defined as the line to which the infundibular mus-culature reaches within the base of the cusps sinuses.1,8,9 Despite large variation in length, size and angle of the cur-vature of the pulmonary infundibulum, its dimensions do not depend on the dimensions of the RV itself.10
In the present study, the place of attachment of the pul-monary valve cusps to the inner surface of the vessel wall was assumed to be the upper border of the RVOT. The con-nected attachment points of the pulmonary valve formed a ring that was easy to locate on the 3D models of the RV. Determining the lower RVOT border was unfortunately not as easy, due to the lack of a clear border between the trabecular apex and the infundibulum.8,11–13
Based on our observations, the structure most suitable for determining the lower border seems to be the ele-ment of the RV that causes the characteristic indentation on the 3D model in the area of contact between the free and septal wall. This indentation occurred in up to 90% of the examined hearts, and may thus serve as a deter-minant of the lower border of the RVOT. Macroscopic analysis of the specimens revealed that the indentation
is caused by a muscle structure that passes from the sep-tal wall to the free wall, directly from the pulmonary trunk to the apex of the RV (Fig. 9). Notably, this element is the last protrusion towards the infundibulum that has a smooth wall. Moreover, this structure appears as a free muscle bundle that attaches to the septal wall. Due to its connection with the free and septal walls, it can be determined that this element is not a typical part of the septoparietal trabeculation that lies on the internal surface of the walls of the RV. This structure is also not a free part of the septomarginal trabecula, as evidenced by its too high location in the ventricular space. Based on macroscopic analysis of this structure, it seems to be an extension of the supraventricular crest on the free wall of the RV. In a study by Kosiński et al., the trabecular element was described as a component of the RV.14 It was an extension of the ventricular septal muscle bundle and was indicated as the lower part of the supraventricular crest. Reaching the base of the heart, this element sepa-rated the inflow tract from the RVOT, which was visible in our macroscopic analysis of the specimens. It seems that the macroscopic characteristics of the structure that causes the protrusion on the 3D models corresponds to the extended part of the supraventricular crest.
Assuming that this structure is a part of the supraven-tricular crest, it seems justified to use it as a determinant of the lower border of RVOT, because it occurs in the vast majority of cases. Importantly, its location within the RV is permanent, compared to the variable trabeculation. In addition, the supraventricular crest has an analogous embryological origin to the RVOT.15,16
Previous scientific reports have attempted to establish the lower border of RVOT, which was typically determined in the context of the implantation of cardiac pacing or ab-lation of arrhythmogenic foci. In a study by Mond et al.,17 the trabecular part was included in the RVOT area and the lower border of the RVOT was designated as the line
Fig. 9. Correlation between the volume of the entire right ventricle (V RV) and the volume of the right ventricle outflow tract (V RVOT). The values are given in milliliters [mL]
Fig. 8. Comparison of the right (c) and left (c’) border of the right ventricle outflow tract (RVOT). The values are given in millimeters [mm]
c – M = 35.96, standard deviation (SD) = 6.02; c’ – M = 39.45, SD = 5.63.
0
V [mL] RVOT
V [m
L] R
V
140
120
100
80
60
40
20
05 10 15 20 25 30 35

Adv Clin Exp Med. 2022;31(1):33–40 39
from the highest point of the tricuspid valve towards the left edge of the heart. Based on its different electro-physiological properties, the RVOT was divided into 4 wall segments: anterior, posterior, free wall part, and ventricu-lar septum.
In order to define the optimal pacing sites in the RVOT, Lieberman et al. similarly marked the lower border of this area.3 The placement of an electrode in a specific segment of the RVOT is characterized by a different morphology of the QRS complex in electrocardiography. Thus, unify-ing the definition of the RVOT anatomical boundaries is crucial for various cardiac procedures.
In contrast to the findings of Saremi et al.8 that the size of the infundibulum, which is an element of the RVOT, is not dependent on the size of the entire RV, our re-sults showed that the volume of the RVOT is dependent on the volume of the entire RV. Thus, it can be concluded that as the RV volume of the examined hearts increases, the RVOT volume also increases. However, the specific dimensions, angles and spatial structures of the RVOT and RV may differ significantly and they require further research.
In a study by Izumo et al. using 3D transesophageal echocardiography (3D TEE), it was shown that the RVOT cross-sectional geometry is more oval than round, as previ-ously thought.18 The fact that we set the lines connecting the points placed furthest apart from each other in the sag-ittal and transverse axis, at the level of the upper and lower RVOT border, also supports this view. In addition, we showed that the transverse dimension becomes smaller towards the upper border of the RVOT while the sagittal dimension increases. The different values of these dimen-sions certainly reflect the change in the shape of the RVOT cross section. For this reason, it is necessary to carefully examine these dimensions at different levels of the RVOT sections. In addition, differences in the left and right height of the RVOT structure indicate a change in the position of its subsequent sections and their certain displacement, which may be associated with RVOT rotation.
A study by Bobkowska et al. reported that differences in measurements between physical and virtual models are negligible.19 The developed modelling procedure is characterized by intuitiveness, ease of implementation by people less experienced in photogrammetry, and good quality results. The experiments carried out by the authors indicate the possibility of obtaining better quality mod-els than those obtained using optical scanners.19 Manual photo recording allows any orientation and adjustment of the camera distance to the object. The significant advan-tages of this method justified its choice to digitize silicone models of the RV interior in the present study.
Clinical implications
Extension of knowledge about the anatomy of the RVOT using imaging and modelling techniques may contribute
to the optimization of pacemaker implantation procedures, resulting in more effective cardiac stimulation, better fixa-tion of the stimulating lead, and less frequent mechanical interaction of the device with the valvular apparatus. In pa-tients with arrhythmias within the RVOT area, better un-derstanding of RVOT morphology may help to more accu-rately localize the arrhythmogenic foci, thereby increasing the effectiveness of ablation treatment. Moreover, it may be helpful in avoiding ablation-related damage to structures located in close proximity to the RVOT.
Limitations
This research, however, is subject to several limitations. First, the study was carried out on relatively small number of hearts and thus the RVOTs, which is related to the avail-ability of specimens.
Another limitation is the disproportion between the number of hearts of both sexes, with male hearts be-ing the majority.
Additionally, the density of the silicone used in the mod-els preparation may be insufficient for modeling the small-est structures inside RV.
Conclusions
Post mortem 3D modelling of the RV interior allows for a comprehensive analysis of RVOT anatomy. We demon-strated that the RVOT diameter narrows towards the pul-monary trunk; RVOT height is not symmetrical, which may be associated with RVOT rotation; and RVOT volume is proportionate to total RV volume.
Further studies are needed to collect more data on mor-phological variants of the RVOT, especially studies based on the analysis of cross sections.
ORCID iDsAgata Ewa Kaczyńska https://orcid.org/0000-0002-7509-5839Adam Kosiński https://orcid.org/0000-0001-7507-2285Katarzyna Bobkowska https://orcid.org/0000-0003-4968-3407Miłosz Andrzej Zajączkowski https://orcid.org/0000-0002-5981-336XRafał Kamiński https://orcid.org/0000-0003-3632-0340Grzegorz Marek Piwko https://orcid.org/0000-0003-2301-6075Marta Gleinert-Rożek https://orcid.org/0000-0001-7807-4323Tomasz Gos https://orcid.org/0000-0003-0161-9270Karol Karnecki https://orcid.org/0000-0001-8386-4207Dariusz Kozłowski https://orcid.org/0000-0003-2089-0656
References1. Ho SY, Nihoyannopoulos P. Anatomy, echocardiography, and normal
right ventricular dimensions. Heart. 2006;92(Suppl 1):i2–13. doi:10. 1136/hrt.2005.077875
2. Sanz J, Sánchez-Quintana D, Bossone E, Bogaard HJ, Naeije R. Anat-omy, function, and dysfunction of the right ventricle: JACC state-of-the-art review. J Am Coll Cardiol. 2019;73(12):1463–1482. doi:10.1016/j.jacc.2018.12.076
3. Lieberman R, Grenz D, Mond HG, Gammage MD. Selective site pacing: Defining and reaching the selected site. Pacing Clin Electrophysiol. 2004;27(6 Pt 2):883–886. doi:10.1111/j.1540-8159.2004.00551.x

A. Kaczyńska et al. Clinical anatomy of the RVOT40
4. Kukla P, Sławuta A, Jastrzębski M, Gajek J, Stec S. Unusual changes in ventricular repolarization before right ventricular outflow tract arrhythmias. Am J Med Sci. 2017;353(3):311–312. doi:10.1016/j.amjms. 2016.11.009
5. Pytkowski M, Maciąg A, Sterliński M, et al. Lokalizacja ogniska aryt-mii u chorych z zaburzeniami rytmu serca pochodzącymi z drogi odpływu prawej komory. Folia Cardiol Excerpta. 2006;1(4):211–220. https://journals.viamedica.pl/folia_cardiologica/article/view/24007. Accessed September 7, 2021.
6. Liaw CY, Guvendiren M. Current and emerging applications of 3D printing in medicine. Biofabrication. 2017;9(2):024102. doi:10.1088/ 1758-5090/aa7279
7. Kaczyńska A, Kosiński A, Kamiński R, Zajączkowski M, Nowicka E, Gleinert-Rożek M. A novel approach to visualization of the right ven-tricular outflow tract. Eur J Transl Clin Med. 2019;1(2):36–40. doi:10. 31373/ejtcm/100603
8. Saremi F, Ho SY, Cabrera JA, Sánchez-Quintana D. Right ventric-ular outflow tract imaging with CT and MRI: Part 1, morphology. Am J Roentgenol. 2013;200(1):W39–W50. doi:10.2214/AJR.12.9333
9. Loukas M, Shane Tubbs R, Louis RG, et al. An endoscopic and ana-tomical approach to the septal papillary muscle of the conus. Surg Radiol Anat. 2009;31(9):701–706. doi:10.1007/s00276-009-0510-2
10. Geva T, Powell AJ, Crawford EC, Chung T, Colan SD. Evaluation of region-al differences in right ventricular systolic function by acoustic quan-tification echocardiography and cine magnetic resonance imaging. Circulation. 1998;98(4):339–345. doi:10.1161/01.cir.98.4.339
11. Keren A, Billingham ME, Popp RL. Echocardiographic recognition of paraseptal structures. J Am Coll Cardiol. 1985;6(4):913–919. doi:10. 1016/s0735-1097(85)80505-2
12. Merrick AF, Yacoub MH, Ho SY, Anderson RH. Anatomy of the muscu-lar subpulmonary infundibulum with regard to the Ross procedure. Ann Thorac Surg. 2000;69(2):556–561. doi:10.1016/s0003-4975(99) 01300-4
13. Hasdemir C, Aktas S, Govsa F, et al. Demonstration of ventricular myocardial extensions into the pulmonary artery and aorta beyond the ventriculo-arterial junction. Pacing Clin Electrophysiol. 2007;30(4): 534–539. doi:10.1111/j.1540-8159.2007.00704.x
14. Kosiński A, Nowiński J, Kozłowski D, Piwko G, Kuta W, Grzybiak M. The crista supraventricularis in the human heart and its role in the morphogenesis of the septomarginal trabecula. Ann Anat. 2007; 189(5):447–456. doi:10.1016/j.aanat.2007.01.008
15. Anderson RH, Webb S, Brown NA, Lamers W, Moorman A. Develop-ment of the heart: (3) Formation of the ventricular outflow tracts, arterial valves, and intrapericardial arterial trunks. Heart. 2003;89(9): 1110–1118. doi:10.1136/heart.89.9.1110
16. Poelmann RE, Mikawa T, Gittenberger-De Groot AC. Neural crest cells in outflow tract septation of the embryonic chicken heart: Differen-tiation and apoptosis. Dev Dyn. 1998;212(3):373–384. doi:10.1002/(SICI)1097-0177(199807)212:3<373::AID-AJA5>3.0.CO;2-E
17. Mond HG, Hillock RJ, Stevenson IH, McGavigan AD. The right ventricu-lar outflow tract: The road to septal pacing. Pacing Clin Electrophysiol. 2007;30(4):482–491. doi:10.1111/j.1540-8159.2007.00697.x
18. Izumo M, Shiota M, Saitoh T, et al. Non-circular shape of right ven-tricular outflow tract a real-time 3-dimensional transesophageal echocardiography study. Circ Cardiovasc Imaging. 2012;5(5):621–627. doi:10.1161/CIRCIMAGING.112.974287
19. Bobkowska K, Przyborski M, Kaczyńska A, Kosiński A. Digital photo-grammetry in the analysis of the ventricles’ shape and size. Paper presented at: 2017 Baltic Geodetic Congress (BGC Geomatics); 2017; Gdańsk, Poland.

Cite asBudny-Wińska J, Zimmer-Stelmach A, Pomorski M. Impact of selected risk factors on uterine healing after cesarean section in women with single-layer uterine closure: A prospective study using two- and three-dimensional transvaginal ultrasonography. Adv Clin Exp Med. 2022;31(1):41–48. doi:10.17219/acem/142519
DOI10.17219/acem/142519
CopyrightCopyright by Author(s) This is an article distributed under the terms of theCreative Commons Attribution 3.0 Unported (CC BY 3.0)(https://creativecommons.org/licenses/by/3.0/)
Address for correspondenceJoanna Budny-WińskaE-mail: [email protected]
Funding sourcesNone declared
Conflict of interestNone declared
Received on June 20, 2021Reviewed on August 11, 2021Accepted on September 22, 2021
Published online on November 4, 2021
AbstractBackground. Modern obstetrics must meet many challenges, including long-term complications resulting from the presence of a uterine niche after cesarean section.
Objectives. To assess the impact of selected risk factors on the uterine healing process after cesarean section. The uterus was closed with a single-layer continuous suture covering the entire thickness of the myometrium, excluding the decidua.
Materials and methods. A prospective, case-controlled study was carried out at 2nd Department of Gy-necology and Obstetrics, Wroclaw Medical University, Poland. Women who delivered by cesarean section at our Department were invited to undergo an ultrasonographic assessment of the cesarean section scar from 6 to 9 weeks after the procedure. In all cases, the uterus was closed with a single-layer continuous suture. The ultrasound examination of the niche was performed according to the modified Delphi protocol. The volume of the niche was calculated and a 3D model was created. The obtained data were analyzed with clinical information from the maternal medical history and the course of the pregnancy.
Results. A total of 204 patients participated in the study. Five patients had a residual myometrial thick-ness (RMT) <2.2 mm and 35 had a residual myometrial thickness to adjacent myometrial thickness ratio (RMT/AMT) ≤0.5. In 45% of women, pregnancy course was complicated by gestational diabetes mellitus (GDM), gestational hypertension and hypothyroidism. The cervical canal was colonized with pathogenic flora in 22% of women. No correlation between maternal and gestational age at delivery, presence of medical complications during pregnancy, colonization of the cervical canal, and presence of niche and its parameters were found.
Conclusions. Our study revealed that the selected risk factors, such as systemic diseases during pregnancy and in the maternal medical history, as well as the colonization of the cervical canal, have no impact on uterine scar healing in women undergoing single-layer uterine closure spanning the entire thickness of the myo-metrium, excluding the decidua.
Key words: 3D ultrasonography, cesarean scar niche, risk factors of cesarean scar niche, systemic diseases during pregnancy, single-layer suture
Original papers
Impact of selected risk factors on uterine healing after cesarean section in women with single-layer uterine closure: A prospective study using two- and three-dimensional transvaginal ultrasonography
Joanna Budny-WińskaA–D, Aleksandra Zimmer-StelmachB,C, Michał PomorskiD–F
2nd Department of Gynecology and Obstetrics, Wroclaw Medical University, Poland
A – research concept and design; B – collection and/or assembly of data; C – data analysis and interpretation; D – writing the article; E – critical revision of the article; F – final approval of the article
Advances in Clinical and Experimental Medicine, ISSN 1899–5276 (print), ISSN 2451–2680 (online) Adv Clin Exp Med. 2022;31(1):41–48

J. Budny-Wińska, A. Zimmer-Stelmach, M. Pomorski. Uterine healing after cesarean section42
Background
Modern obstetrics must meet many challenges, in-cluding the increased frequency of cesarean sections and long-term complications resulting from the presence of a uterine niche after cesarean section. Additionally, worldwide, there has been an increased incidence and prevalence of systemic diseases appearing in pregnancy, such as gestational hypertension and gestational diabetes mellitus (GDM).1,2 The another challenge for obstetricians is the increased rate of pregnancy among older women3,4 due to the sociocultural changes in family planning that leads to the postponement of maternal plans, as well as the improved availability and effectiveness of assisted reproductive methods.
The consequence of cesarean section is a scar formation within the uterine muscle. In recent years, the rate of deliv-eries by cesarean section has increased all over the world. In Poland, the rate of cesarean section is 44.8% (data from Statistics Poland for 2019). The World Health Organiza-tion (WHO) recommends an ideal cesarean section rate of 10–15% of all births. This percentage is associated with a decrease in maternal and neonatal mortality. Above this level, the increased incidence of cesarean delivery is no longer associated with reduced mortality.5
With rising cesarean rates, the incidence of cesar-ean-related iatrogenic complications is also on the rise. In cases of incomplete healing, a niche can develop within the scar.
Various imaging methods including two- and three-dimensional ultrasonography, sonohysterography, hys-terography, hysteroscopy, and magnetic resonance im-aging (MRI) can be used to assess the anterior uterine wall and to diagnose a cesarean scar niche.6–8 Despite the availability of various diagnostic methods, there are no clear diagnostic criteria for uterine niches after ce-sarean section. In 2019, the European Niche Taskforce defined a uterine niche as an indentation of at least 2 mm in the uterine myometrium at the site of the cesarean scar, assessed using transvaginal ultrasound.9 The in-cidence of uterine niches varies widely in the literature, ranging from 24% to 84%.10–13
Differences in the frequency of uterine niches result from the use of different diagnostic criteria, the time elapsed after the cesarean procedure and the diagnostic method used. The incidence is often underestimated because many women are asymptomatic and clinicians may not consider a niche as a cause of a patient’s symptoms, due to lack of awareness.8
Most of the small uterine niches after cesarean section are asymptomatic and do not pose a threat to the health or life of the patient. However, the consequences of the presence of the large and symptomatic cesarean scar niche include uterine bleeding, chronic pelvic pain, re-duced fertility, complications in subsequent pregnancies (morbidly adherent placenta, placenta previa), as well
as directly life-threatening conditions (uterine rupture, cesarean scar pregnancy).6,14–17 Additionally, cesarean scar niches may increase the risk of complications in gyneco-logical procedures such as embryo transfer and intrauter-ine device placement and removal.18,19
Due to the potentially dangerous consequences result-ing from the presence of a uterine niche after cesarean section, it is necessary to develop preventive strategies aimed at reducing the risk of isthmocele formation, and thus preventing adverse outcomes. To achieve this, it is es-sential to identify related risk factors for the formation of a uterine niche after cesarean section, and to develop appropriate diagnostic and therapeutic protocols. There-fore, in the past several years, numerous studies have been published concerning the uterine scar niche, but most of them have been performed using selected populations of symptomatic women.
Objectives
This study aimed to assess the impact of the most common risk factors in obstetrics on the uterine heal-ing process after cesarean section, using a prospectively collected and unselected population, in which the uterus was closed with a single-layer continuous suture cover-ing the entire thickness of the myometrium, excluding the decidua.
Materials and methods
Study design
This prospective descriptive study was designed to as-sess the prevalence and risk factors for improper uterine healing after cesarean delivery and niche formation. This study is a continuation of our previous research, in which we assessed the impact of mode and number of previous cesarean sections, type of uterine incision expansion, operator’s experience, uterine flexion, and stage of labor at the time of cesarean section on uterine healing.20
Setting and participants
The study was carried out at 2nd Department of Gynecol-ogy and Obstetrics, Wroclaw Medical University, Poland. The study protocol was accepted by the ethics commit-tee (approval No. KB 221/2016 and No. KB 153/2020) and all participants signed an informed consent form before participating in the study. The study was conducted in ac-cordance with the 1964 Declaration of Helsinki and its later amendments.
Women who delivered by cesarean section at our De-partment from 2017 to 2019 were invited to undergo an ultrasonographic assessment of the cesarean section

Adv Clin Exp Med. 2022;31(1):41–48 43
scar. They were recruited either before the cesarean deliv-ery (elective surgery) or within 2 days after the operation (emergency cesarean delivery). Patients who agreed to par-ticipate in the study were scheduled for the ultrasound examination from 6 to 9 weeks after the cesarean section.
Surgical technique
The cesarean section procedures were performed by various obstetricians working in our Department using a standardized manner, i.e., low transverse uterine incision with a single-layer continuous suture covering the entire thickness of the myometrium, excluding the decidua. All physicians used the same suture material (Surgicryl® 910 polyglactine-braided synthetic absorbable suture; SMI AG, St. Vith, Belgium).
Ultrasound examination
The examinations were conducted using a Voluson V8 Expert ultrasound machine (General Electric Medi-cal Systems, Chicago, USA) with a 4–9 MHz transvaginal 3D probe. All transvaginal ultrasound examinations were performed by the first author, who was blinded to clini-cal information. During the examination, the parameters of the niche were assessed and a 3D model was created. All data were saved on the internal hard drive of the ultra-sound machine. According to the international definition, a niche was defined as an indentation in the myometrium of at least 2 mm.9 All measurements were obtained on a sag-ittal view of the uterus. To standardize the ultrasound eval-uation, all examinations were performed using the modified Delphi protocol, and the exams performed prior to the pub-lication of the modified Delphi protocol were reloaded and recalculated in accordance with the guidelines.9
The following niche parameters were assessed according to the modified Delphi protocol: width (W [mm]), height (D [mm]), volume of the anechoic triangle, residual myo-metrial thickness (RMT [mm]), and adjacent myometrial thickness (AMT [mm]). Additionally, the following param-eters were calculated: the RMT/AMT ratio, the RMT/W ratio and the RMT/D ratio.
The VOCAL program was used to create 3D models and calculate the volume of the niche. The following set-tings were used: manual trace and rotation angle of 15°. The boundaries of the anechoic niche were manually outlined on the touch screen of the Voluson V8 Expert ultrasound machine.
Clinical data analysis
Clinical information, such as laboratory results, ma-ternal medical history pregnancy, and cesarean section course, was collected from the medical record and ana-lyzed after ultrasonographic assessment of the cesarean section scar.
Inclusion and exclusion criteria
The inclusion criteria were low transverse uterine inci-sion, single-layer continuous full thickness uterine closure, uneventful postoperative course and singleton pregnancy. The exclusion criteria included a vertical or inverted “T” uterine incision, congenital uterine malformations and the use of more than 3 additional hemostatic uterine sutures.
Statistical analyses
Data were collected and recorded using an Excel spread-sheet. Statistical analyses were performed using the STA-TISTICA v. 13.3 PL package (StatSoft Inc., Tulsa, USA). For quantitative variables, basic descriptive statistics were calculated (for all patients and taking into account the assumed division into groups), while the frequency of occurrence of their individual variants was calculated for qualitative variables (also taking into account the as-sumed division). The Mann–Whitney U test, post hoc comparisons for the Kruskal–Wallis analysis of variance (ANOVA) test and non-parametric Spearman’s rank cor-relation test were used in the analysis of non-parametric data. The Pearson’s χ2 test and Fisher’s exact test were used to evaluate the differences in the distributions of qualita-tive variables. The criterion for statistical significance was set at a p-value <0.05.
Results
A total of 204 patients participated in the study. The mean age was 32.25 years (standard deviation (SD) ±4.156) and the mean gestational age was 37.863 weeks (SD ±2.43). A total of 117 (57%) participants had no previous deliver-ies. Of the 204 patients, 56 (27%) had at least 1 cesarean section in the past, while 32 (16%) had at least 1 previous vaginal delivery. Eighty-two (40%) patients underwent emergency cesarean delivery and 122 (60%) underwent elective cesarean delivery. The most common reasons for elective cesarean delivery were previous cesarean delivery (40%) and breech presentation (9%). The most common reasons for emergency cesarean delivery were impending fetal asphyxia (40%) and prolonged labor (17%).
Out of all examined women, 153 were diagnosed with a niche after cesarean section (75%). Five of those patients had a RMT < 2.2 mm and 35 patients had an RMT/AMT ratio of 0.5 or less. The mean RMT value in the study group was 8.3 mm (SD ±3.37).
The course of pregnancy was uncomplicated by preg-nancy-related systemic diseases in 55% (n = 112) of women. In this group, uterine scar niches were diagnosed after cesarean section in 71% (n = 79) of patients. In contrast, in 21 patients (10%) with GDM, a uterine niche was di-agnosed after cesarean section in 91% of these women. In 11% of respondents, their pregnancy was complicated
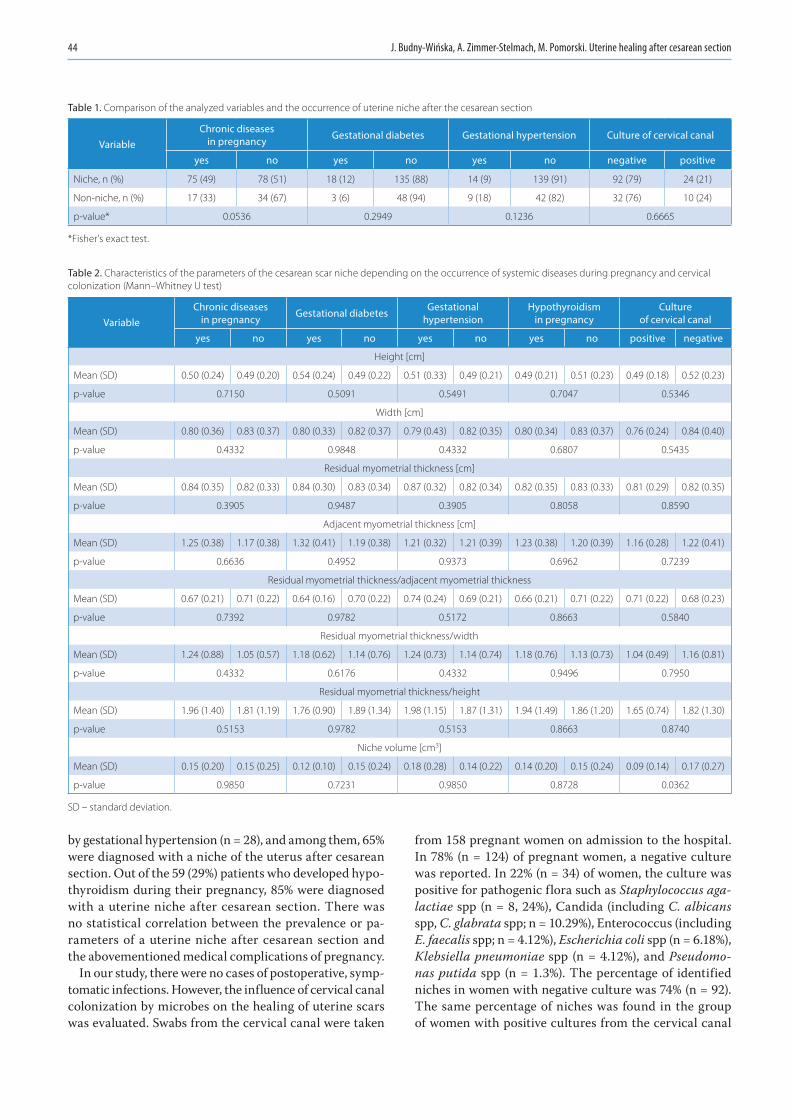
J. Budny-Wińska, A. Zimmer-Stelmach, M. Pomorski. Uterine healing after cesarean section44
by gestational hypertension (n = 28), and among them, 65% were diagnosed with a niche of the uterus after cesarean section. Out of the 59 (29%) patients who developed hypo-thyroidism during their pregnancy, 85% were diagnosed with a uterine niche after cesarean section. There was no statistical correlation between the prevalence or pa-rameters of a uterine niche after cesarean section and the abovementioned medical complications of pregnancy.
In our study, there were no cases of postoperative, symp-tomatic infections. However, the influence of cervical canal colonization by microbes on the healing of uterine scars was evaluated. Swabs from the cervical canal were taken
from 158 pregnant women on admission to the hospital. In 78% (n = 124) of pregnant women, a negative culture was reported. In 22% (n = 34) of women, the culture was positive for pathogenic flora such as Staphylococcus aga-lactiae spp (n = 8, 24%), Candida (including C. albicans spp, C. glabrata spp; n = 10.29%), Enterococcus (including E. faecalis spp; n = 4.12%), Escherichia coli spp (n = 6.18%), Klebsiella pneumoniae spp (n = 4.12%), and Pseudomo-nas putida spp (n = 1.3%). The percentage of identified niches in women with negative culture was 74% (n = 92). The same percentage of niches was found in the group of women with positive cultures from the cervical canal
Table 1. Comparison of the analyzed variables and the occurrence of uterine niche after the cesarean section
VariableChronic diseases
in pregnancy Gestational diabetes Gestational hypertension Culture of cervical canal
yes no yes no yes no negative positive
Niche, n (%) 75 (49) 78 (51) 18 (12) 135 (88) 14 (9) 139 (91) 92 (79) 24 (21)
Non-niche, n (%) 17 (33) 34 (67) 3 (6) 48 (94) 9 (18) 42 (82) 32 (76) 10 (24)
p-value* 0.0536 0.2949 0.1236 0.6665
*Fisher’s exact test.
Table 2. Characteristics of the parameters of the cesarean scar niche depending on the occurrence of systemic diseases during pregnancy and cervical colonization (Mann–Whitney U test)
Variable Chronic diseases
in pregnancy Gestational diabetes Gestational hypertension
Hypothyroidism in pregnancy
Culture of cervical canal
yes no yes no yes no yes no positive negative
Height [cm]
Mean (SD) 0.50 (0.24) 0.49 (0.20) 0.54 (0.24) 0.49 (0.22) 0.51 (0.33) 0.49 (0.21) 0.49 (0.21) 0.51 (0.23) 0.49 (0.18) 0.52 (0.23)
p-value 0.7150 0.5091 0.5491 0.7047 0.5346
Width [cm]
Mean (SD) 0.80 (0.36) 0.83 (0.37) 0.80 (0.33) 0.82 (0.37) 0.79 (0.43) 0.82 (0.35) 0.80 (0.34) 0.83 (0.37) 0.76 (0.24) 0.84 (0.40)
p-value 0.4332 0.9848 0.4332 0.6807 0.5435
Residual myometrial thickness [cm]
Mean (SD) 0.84 (0.35) 0.82 (0.33) 0.84 (0.30) 0.83 (0.34) 0.87 (0.32) 0.82 (0.34) 0.82 (0.35) 0.83 (0.33) 0.81 (0.29) 0.82 (0.35)
p-value 0.3905 0.9487 0.3905 0.8058 0.8590
Adjacent myometrial thickness [cm]
Mean (SD) 1.25 (0.38) 1.17 (0.38) 1.32 (0.41) 1.19 (0.38) 1.21 (0.32) 1.21 (0.39) 1.23 (0.38) 1.20 (0.39) 1.16 (0.28) 1.22 (0.41)
p-value 0.6636 0.4952 0.9373 0.6962 0.7239
Residual myometrial thickness/adjacent myometrial thickness
Mean (SD) 0.67 (0.21) 0.71 (0.22) 0.64 (0.16) 0.70 (0.22) 0.74 (0.24) 0.69 (0.21) 0.66 (0.21) 0.71 (0.22) 0.71 (0.22) 0.68 (0.23)
p-value 0.7392 0.9782 0.5172 0.8663 0.5840
Residual myometrial thickness/width
Mean (SD) 1.24 (0.88) 1.05 (0.57) 1.18 (0.62) 1.14 (0.76) 1.24 (0.73) 1.14 (0.74) 1.18 (0.76) 1.13 (0.73) 1.04 (0.49) 1.16 (0.81)
p-value 0.4332 0.6176 0.4332 0.9496 0.7950
Residual myometrial thickness/height
Mean (SD) 1.96 (1.40) 1.81 (1.19) 1.76 (0.90) 1.89 (1.34) 1.98 (1.15) 1.87 (1.31) 1.94 (1.49) 1.86 (1.20) 1.65 (0.74) 1.82 (1.30)
p-value 0.5153 0.9782 0.5153 0.8663 0.8740
Niche volume [cm3]
Mean (SD) 0.15 (0.20) 0.15 (0.25) 0.12 (0.10) 0.15 (0.24) 0.18 (0.28) 0.14 (0.22) 0.14 (0.20) 0.15 (0.24) 0.09 (0.14) 0.17 (0.27)
p-value 0.9850 0.7231 0.9850 0.8728 0.0362
SD – standard deviation.
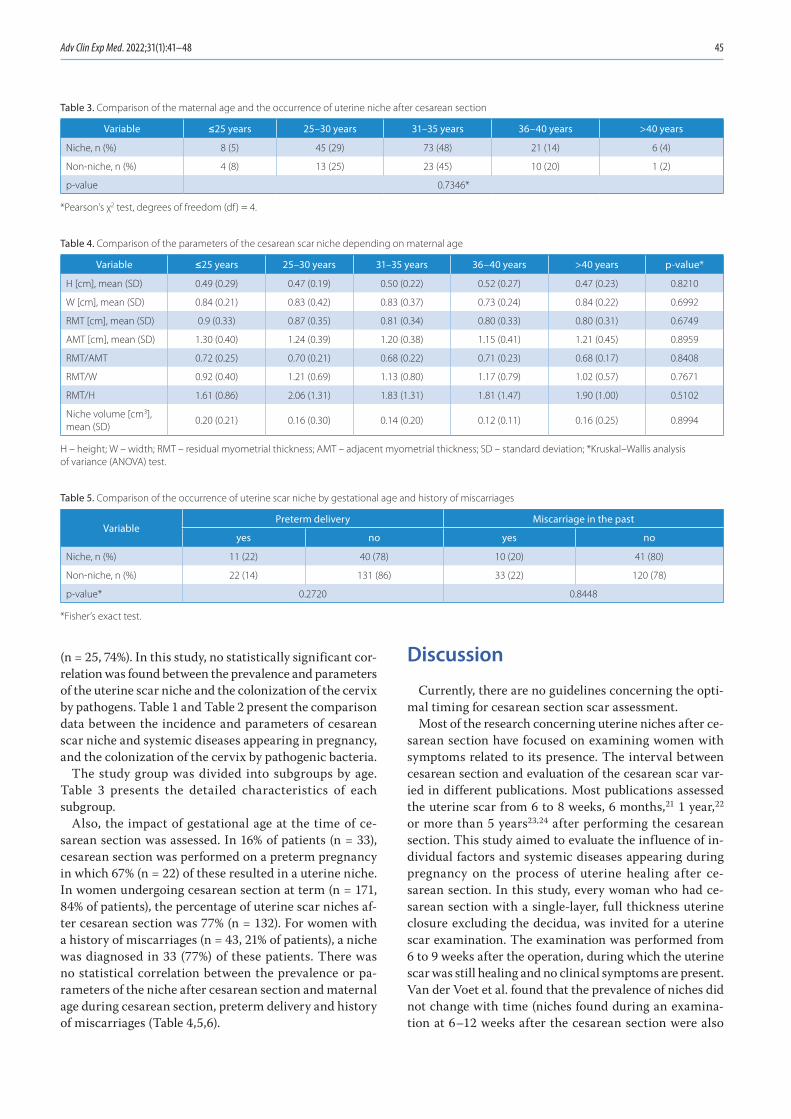
Adv Clin Exp Med. 2022;31(1):41–48 45
(n = 25, 74%). In this study, no statistically significant cor-relation was found between the prevalence and parameters of the uterine scar niche and the colonization of the cervix by pathogens. Table 1 and Table 2 present the comparison data between the incidence and parameters of cesarean scar niche and systemic diseases appearing in pregnancy, and the colonization of the cervix by pathogenic bacteria.
The study group was divided into subgroups by age. Table 3 presents the detailed characteristics of each subgroup.
Also, the impact of gestational age at the time of ce-sarean section was assessed. In 16% of patients (n = 33), cesarean section was performed on a preterm pregnancy in which 67% (n = 22) of these resulted in a uterine niche. In women undergoing cesarean section at term (n = 171, 84% of patients), the percentage of uterine scar niches af-ter cesarean section was 77% (n = 132). For women with a history of miscarriages (n = 43, 21% of patients), a niche was diagnosed in 33 (77%) of these patients. There was no statistical correlation between the prevalence or pa-rameters of the niche after cesarean section and maternal age during cesarean section, preterm delivery and history of miscarriages (Table 4,5,6).
Discussion
Currently, there are no guidelines concerning the opti-mal timing for cesarean section scar assessment.
Most of the research concerning uterine niches after ce-sarean section have focused on examining women with symptoms related to its presence. The interval between cesarean section and evaluation of the cesarean scar var-ied in different publications. Most publications assessed the uterine scar from 6 to 8 weeks, 6 months,21 1 year,22 or more than 5 years23,24 after performing the cesarean section. This study aimed to evaluate the influence of in-dividual factors and systemic diseases appearing during pregnancy on the process of uterine healing after ce-sarean section. In this study, every woman who had ce-sarean section with a single-layer, full thickness uterine closure excluding the decidua, was invited for a uterine scar examination. The examination was performed from 6 to 9 weeks after the operation, during which the uterine scar was still healing and no clinical symptoms are present. Van der Voet et al. found that the prevalence of niches did not change with time (niches found during an examina-tion at 6–12 weeks after the cesarean section were also
Table 3. Comparison of the maternal age and the occurrence of uterine niche after cesarean section
Variable ≤25 years 25–30 years 31–35 years 36–40 years >40 years
Niche, n (%) 8 (5) 45 (29) 73 (48) 21 (14) 6 (4)
Non-niche, n (%) 4 (8) 13 (25) 23 (45) 10 (20) 1 (2)
p-value 0.7346*
*Pearson’s χ2 test, degrees of freedom (df) = 4.
Table 4. Comparison of the parameters of the cesarean scar niche depending on maternal age
Variable ≤25 years 25–30 years 31–35 years 36–40 years >40 years p-value*
H [cm], mean (SD) 0.49 (0.29) 0.47 (0.19) 0.50 (0.22) 0.52 (0.27) 0.47 (0.23) 0.8210
W [cm], mean (SD) 0.84 (0.21) 0.83 (0.42) 0.83 (0.37) 0.73 (0.24) 0.84 (0.22) 0.6992
RMT [cm], mean (SD) 0.9 (0.33) 0.87 (0.35) 0.81 (0.34) 0.80 (0.33) 0.80 (0.31) 0.6749
AMT [cm], mean (SD) 1.30 (0.40) 1.24 (0.39) 1.20 (0.38) 1.15 (0.41) 1.21 (0.45) 0.8959
RMT/AMT 0.72 (0.25) 0.70 (0.21) 0.68 (0.22) 0.71 (0.23) 0.68 (0.17) 0.8408
RMT/W 0.92 (0.40) 1.21 (0.69) 1.13 (0.80) 1.17 (0.79) 1.02 (0.57) 0.7671
RMT/H 1.61 (0.86) 2.06 (1.31) 1.83 (1.31) 1.81 (1.47) 1.90 (1.00) 0.5102
Niche volume [cm3], mean (SD)
0.20 (0.21) 0.16 (0.30) 0.14 (0.20) 0.12 (0.11) 0.16 (0.25) 0.8994
H – height; W – width; RMT – residual myometrial thickness; AMT – adjacent myometrial thickness; SD – standard deviation; *Kruskal–Wallis analysis of variance (ANOVA) test.
Table 5. Comparison of the occurrence of uterine scar niche by gestational age and history of miscarriages
VariablePreterm delivery Miscarriage in the past
yes no yes no
Niche, n (%) 11 (22) 40 (78) 10 (20) 41 (80)
Non-niche, n (%) 22 (14) 131 (86) 33 (22) 120 (78)
p-value* 0.2720 0.8448
*Fisher’s exact test.

J. Budny-Wińska, A. Zimmer-Stelmach, M. Pomorski. Uterine healing after cesarean section46
present on an examination performed 1 year after cesarean section).25
Transvaginal ultrasound examination at 6–9 weeks after cesarean section allows for the identification of patients with a potential risk of abnormal uterine healing after cesar-ean section, due to a large niche that may threaten the next pregnancy or be the cause of cesarean scar syndrome. Pa-tients with a large niche and low RMT, as well as physi-cians treating them need to be aware of the risk of possible complications as soon as possible. Currently, in our clinical practice, we found many women with abnormal uterine bleeding related to the niche, who are unnecessarily treated by other doctors with oral contraceptives or invasive proce-dures such as dilatation and curettage. Moreover, women with extremely low RMT face life-threatening complica-tions in subsequent pregnancies due to the risk of scar rup-ture at 21 weeks of gestation.26 Taking into consideration the above problems and the limited knowledge gynecolo-gists have of niche-related complications, we suggest cesar-ean section scar assessment be routinely performed in all women who have undergone cesarean section at the end of puerperium.
In this study, all niches, whether classified as small or large, were assessed using two and three-dimensional ultrasound.7 Even though 2 meta-analyses have con-cluded single-layer closure to be associated with de-creased RMT in comparison to double-layer sutures, in our study group, only 2.4% of women had a RMT < 2.2 mm. An RMT < 2.2 mm is considered a risk factor for severe scar complications in subsequent pregnancies.9 Both of these meta-analyses have shown no differences in the risk of ma-ternal morbidity or long-term outcomes between single- compared to double-layer uterine closure.27,28
This study is a continuation of our previous research in which we proved there was no correlation between an operator’s experience and the prevalence and parameters of uterine niches after cesarean section.20 The lack of a rela-tionship between the operator’s experience and the forma-tion of a uterine niche after cesarean section is supported in the literature.11 It should be emphasized that all cesarean sections were performed in a standardized manner, i.e., low
transverse uterine incision with single-layer full thickness uterine closure using the same suture material.
There was also no correlation between the param-eters of the niche, incidence of niches and a woman’s age at the time of cesarean section, which is in line with other studies.29 In the study by Pomorski et al., a positive cor-relation was found between the height of the niche and the mother’s age.30 In another publication, the presence of a niche was significantly associated with younger ma-ternal age at the time of cesarean section. In this study, younger patients had cesarean section performed during the active phase of labor.31 According to some studies, per-forming cesarean section during the active phase of labor or phase II of labor increases the risk of a large niche for-mation.11,33 In our study, only 6 patients were in the active phase of labor (dilation >4 cm to full dilation of cervix) and 10 patients were in phase II of labor at the time of cesarean section. Therefore, due to the low numbers, we did not use these variables in the statistical analysis of the subgroups of maternal age.
There are conflicting reports in the literature regarding the impact of gestational age on niche formation. In our study, no relationship was found between gestational age at the time of delivery and the prevalence and parameters of the niche. This finding is supported by other studies.29,30,32 On the other hand, Vikhareva and Valentin found that de-livery before 37 weeks gestation was a predictor of large niches.33 The study by Hayakawa et al. demonstrated a posi-tive link between the gestational age of 37–41 weeks at de-livery and the presence of wedge niches.34
The influence of medical conditions associated with pregnancy on uterine niche development was analyzed. No correlation was found between GDM and the prevalence and parameters of niches. However, Antila-Långsjö et al. found GDM and higher body mass index (BMI) to be posi-tively correlated with the incidence of uterine niche after cesarean section.11 Interestingly, such a correlation has not been found for pregestational diabetes. In our study, the mean prepregnancy BMI in women diagnosed with cesarean scar niche was 27.1 (±6.1) kg/m2 compared to 25.1 (±5.3) kg/m2 in women without a niche. Consequently,
Table 6. Comparison of analyzed parameters of cesarean scar niche depending on the history of miscarriages and gestational age
VariableHistory of miscarriages Gestational age
no yes p-value* preterm delivery term delivery p-value*
H [cm], mean (SD) 0.50 (0.23) 0.50 (0.18) 0.4301 0.48 (0.24) 0.52 (0.22) 0.3757
W [cm], mean (SD) 0.80 (0.32) 0.90 (0.48) 0.3868 0.81(0.48) 0.82 (0.34) 0.3081
RMT [cm], mean (SD) 0.84 (0.34) 0.79 (0.34) 0.2912 0.89 (0.36) 0.82 (0.33) 0.2423
AMT [cm], mean (SD) 1.22 (0.39) 1.17 (0.35) 0.5697 1.23 (0.41) 1.21 (0.38) 0.8455
RMT/AMT 0.70 (0.21) 0.67 (0.87) 0.3472 0.73 (0.22) 0.69 (0.21) 0.3672
RMT/W 1.15 (0.65) 1.12 (1.01) 0.2202 1.16 (0.61) 1.14 (0.76) 0.5342
RMT/H 1.91 (1.27) 1.77 (1.40) 0.1832 2.03 (1.41) 1.86 (1.28) 0.7800
Niche volume [cm3], mean (SD) 0.13 (0.17) 0.20 (0.37) 0.9947 0.23 (0.43) 0.13 (0.17) 0.9588
H – height; W – width; RMT – residual myometrial thickness; AMT – adjacent myometrial thickness; SD – standard deviation; *Mann–Whitney U test.

Adv Clin Exp Med. 2022;31(1):41–48 47
it means that most of the women in this study were over-weight. In other studies, no correlation was found between BMI and the presence of a uterine niche.33,34
Our study also evaluated the influence of gestational hy-pertension on uterine healing. No statistically significant correlation was found between the frequency of occur-rence or parameters of a niche and the presence of ges-tational hypertension. To our knowledge, only 1 other study evaluated the effect gestational hypertension has on the incidence of uterine scar defect – and failed to show any correlation.35 Considering the influence of preg-nancy-related systemic diseases, it is impossible to ignore the influence of hypothyroidism on tissue metabolism. The correlation between hypothyroidism and a higher risk of perioperative complications has been known for a long time.36 To date, no other studies have been performed to assess the effect of hypothyroidism on uterine healing after cesarean section. In our study, no relationship was found between hypothyroidism and uterine scar niche parameters. When assessing the impact of individual diseases on uterus healing and comparing conflicting reports in the literature, it should be remembered that each population has its own individual characteristics and the incidences of GDM, gestational hypertension and hypothyroidism vary worldwide.
In our study, the effect cervical colonization by microor-ganisms has on the prevalence and parameters of a uterine niche was evaluated, because previous studies have cor-related the bacterial load of the cervix with the bacterial load within the uterine cavity.37,38 This suggests that cervi-cal microbiota may be a source of microbes for coloniza-tion of the uterine cavity and may influence the healing process of the cesarean section scar. However, our study showed no correlation between the cervical colonization and the prevalence and parameters of uterine niches after cesarean section. This may be due to the use of periopera-tive antibiotics for surgical prophylaxis. Although, further research is needed to confirm this hypothesis.
In other studies, the influence of inflammatory processes such as postpartum fever,33,35 the application of antibiot-ics during childbirth,39 perinatal and puerperal infection in the form of chorioamnionitis, postoperative wound in-fection, urinary tract infection, and endometritis34 were analyzed, but no correlation between the abovementioned variables and the prevalence of niches after cesarean sec-tion was found.
Limitations
The main limitation of our study is the lack of compari-son between a single-layer continuous uterine suture and a double-layer uterine suture closure, due to the single-layer continuous uterine suture being the standard of care at our Department. The other limitation is that we were checking the colonization of the cervical canal without uterine cavity colonization.
The etiology of a uterine niche after cesarean section is multifactorial. In our study, we evaluated a few poten-tial factors that could disturb the proper healing process of the uterus. The effect of other important individual risk factors such as BMI, corticosteroid use, previous myomec-tomy and smoking status on the prevalence and param-eters of cesarean section niche was not investigated in our study, which is a limitation.
Conclusions
Two- and three-dimensional ultrasonographic cesar-ean scar assessment revealed that the selected risk factors concerning systemic diseases during pregnancy, mater-nal medical history and colonization of the cervical canal have no impact on uterine scar healing in women with single-layer uterine closure covering the entire thickness of the myometrium, excluding the decidua.
ORCID iDsJoanna Budny-Wińska https://orcid.org/0000-0002-3094-2213Aleksandra Zimmer-Stelmach https://orcid.org/0000-0003-1114-6980Michał Pomorski https://orcid.org/0000-0002-4501-353X
References1. Anna V, van der Ploeg HP, Cheung NW, Huxley RR, Bauman AE. Socio-
demographic correlates of the increasing trend in prevalence of gesta-tional diabetes mellitus in a large population of women between 1995 and 2005. Diabetes Care. 2008;31(12):2288–2293. doi:10.2337/dc08-1038
2. Guariguata L, Linnenkamp U, Beagley J, Whiting DR, Cho NH. Global estimates of the prevalence of hyperglycaemia in pregnancy. Diabetes Res Clin Pract. 2014;103(2):176–185. doi:10.1016/j.diabres.2013.11.003
3. Johnson JA, Tough S; SOGC GENETICS COMMITTEE. Delayed child-bearing. J Obstet Gynaecol Can. 2012;34(1):80–93. doi:10.1016/S1701-2163(16)35138-6
4. Rendtorff R, Hinkson L, Kiver V, Dröge LA, Henrich W. Pregnancies in women aged 45 years and older: A 10-year retrospective analysis in Berlin. Geburtshilfe Frauenheilkd. 2017;77(3):268–275. doi:10.1055/ s-0043-100105
5. Betran AP, Torloni MR, Zhang J, et al. What is the optimal rate of cae-sarean section at population level? A systematic review of ecologic studies. Reprod Health. 2015;12:57. doi:10.1186/s12978-015-0043-6
6. Pomorski M, Fuchs T, Zimmer M. Prediction of uterine dehiscence using ultrasonographic parameters of cesarean section scar in the nonpreg-nant uterus: A prospective observational study. BMC Pregnancy Childbirth. 2014;14:365. doi:10.1186/s12884-014-0365-3
7. Ludwin A, Martins WP, Ludwin I. Evaluation of uterine niche by three-dimensional sonohysterography and volumetric quantification: Tech-niques and scoring classification system. Ultrasound Obstet Gynecol. 2019;53(1):139–143. doi:10.1002/uog.19181
8. Setubal A, Alves J, Osório F, et al. Treatment for uterine isthmocele, a pouchlike defect at the site of a cesarean section scar. J Minim Invasive Gynecol. 2018;25(1):38–46. doi:10.1016/j.jmig.2017.09.022
9. Jordans IPM, de Leeuw RA, Stegwee SI, et al. Sonographic examina-tion of uterine niche in non-pregnant women: A modified Delphi pro-cedure. Ultrasound Obstet Gynecol. 2019;53(1):107–115. doi:10.1002/ uog.19049
10. van der Voet LF, Bij de Vaate AM, Veersema S, Brölmann HA, Huirne JA. Long-term complications of caesarean section: The niche in the scar. A prospective cohort study on niche prevalence and its relation to abnormal uterine bleeding. BJOG. 2014;121(2):236–244. doi:10.1111/ 1471-0528.12542
11. Antila-Långsjö RM, Mäenpää JU, Huhtala HS, Tomás EI, Staff SM. Cesarean scar defect: A prospective study on risk factors. Am J Obstet Gynecol. 2018;219(5):458.e1–458.e8. doi:10.1016/j.ajog.2018.09.004

J. Budny-Wińska, A. Zimmer-Stelmach, M. Pomorski. Uterine healing after cesarean section48
12. Vikhareva O, Rickle GS, Lavesson T, Nedopekina E, Brandell K, Salvesen KÅ. Hysterotomy level at Cesarean section and occurrence of large scar defects: A randomized single-blind trial. Ultrasound Obstet Gynecol. 2019;53(4):438–442. doi:10.1002/uog.20184
13. Bij de Vaate AJ, van der Voet LF, Naji O, et al. Prevalence, potential risk factors for development and symptoms related to the presence of uterine niches following Cesarean section: Systematic review. Ultrasound Obstet Gynecol. 2014;43(4):372–382. doi:10.1002/uog.13199
14. Vikhareva Osser O, Valentin L. Clinical importance of appearance of cesarean hysterotomy scar at transvaginal ultrasonography in non-pregnant women. Obstet Gynecol. 2011;117(3):525–532. doi:10.1097/AOG.0b013e318209abf0
15. Kaelin Agten A, Cali G, Monteagudo A, Oviedo J, Ramos J, Timor-Tritsch I. The clinical outcome of cesarean scar pregnancies implant-ed “on the scar” versus “in the niche”. Am J Obstet Gynecol. 2017; 216(5):510.e1–510.e6. doi:10.1016/j.ajog.2017.01.019
16. Vervoort A, Vissers J, Hehenkamp W, Brölmann H, Huirne J. The effect of laparoscopic resection of large niches in the uterine caesarean scar on symptoms, ultrasound findings and quality of life: A prospective cohort study. BJOG. 2018;125(3):317–325. doi:10.1111/1471-0528.14822
17. Pomorski M, Fuchs T, Rosner-Tenerowicz A, Zimmer M. Sonographic evaluation of surgical repair of uterine cesarean scar defects. J Clin Ultrasound. 2017;45(8):455–460. doi:10.1002/jcu.22449
18. Tower AM, Frishman GN. Cesarean scar defects: An underrecognized cause of abnormal uterine bleeding and other gynecologic compli-cations. J Minim Invasive Gynecol. 2013;20(5):562–572. doi:10.1016/j.jmig.2013.03.008
19. Patounakis G, Ozcan MC, Chason RJ, et al. Impact of a prior cesar-ean delivery on embryo transfer: A prospective study. Fertil Steril. 2016;106(2):311–316. doi:10.1016/j.fertnstert.2016.03.045
20. Budny-Winska J, Zimmer-Stelmach A, Pomorski M. Two- and three-dimensional transvaginal ultrasound in assessment of the impact of selected obstetric risk factors on cesarean scar niche formation: The case-controlled study. Ginekol Pol. 2021;92(5):378–382. doi:10. 5603/GP.a2021.0024
21. Osser OV, Jokubkiene L, Valentin L. High prevalence of defects in Cesarean section scars at transvaginal ultrasound examination. Ultrasound Obstet Gynecol. 2009;34(1):90–97. doi:10.1002/uog.6395
22. Bij de Vaate AJ, Brölmann HA, van der Voet LF, van der Slikke JW, Veersema S, Huirne JA. Ultrasound evaluation of the Cesarean scar: Relation between a niche and postmenstrual spotting. Ultrasound Obstet Gynecol. 2011;37(1):93–99. doi:10.1002/uog.8864
23. Armstrong V, Hansen WF, Van Voorhis BJ, Syrop CH. Detection of cesarean scars by transvaginal ultrasound. Obstet Gynecol. 2003; 101(1):61–65. doi:10.1016/s0029-7844(02)02450-x
24. Chen HY, Chen SJ, Hsieh FJ. Observation of cesarean section scar by transvaginal ultrasonography. Ultrasound Med Biol. 1990;16(5): 443–447. doi:10.1016/0301-5629(90)90166-a
25. van der Voet LF, Jordans IPM, Brölmann HAM, Veersema S, Huirne JAF. Changes in the uterine scar during the first year after a caesare-an section: A prospective longitudinal study. Gynecol Obstet Invest. 2018;83(2):164–170. doi:10.1159/000478046
26. Pomorski M, Fuchs T, Budny-Winska J, Zimmer A, Zimmer M. Natural history of caesarean scar pregnancy. Ginekol Pol. 2019;90(6):351–352. doi:10.5603/GP.a2019.0054
27. Di Spiezio Sardo A, Saccone G, McCurdy R, Bujold E, Bifulco G, Berghella V. Risk of Cesarean scar defect following single- vs double-layer uterine closure: Systematic review and meta-analysis of random-ized controlled trials. Ultrasound Obstet Gynecol. 2017;50(5):578–583. doi:10.1002/uog.17401
28. Roberge S, Demers S, Berghella V, Chaillet N, Moore L, Bujold E. Impact of single- vs double-layer closure on adverse outcomes and uterine scar defect: A systematic review and metaanalysis. Am J Obstet Gynecol. 2014;211(5):453–460. doi:10.1016/j.ajog.2014.06.014
29. Ofili-Yebovi D, Ben-Nagi J, Sawyer E, et al. Deficient lower-segment Cesarean section scars: Prevalence and risk factors. Ultrasound Obstet Gynecol. 2008;31(1):72–77. doi:10.1002/uog.5200
30. Pomorski M, Fuchs T, Rosner-Tenerowicz A, Zimmer M. Morphology of the cesarean section scar in the non-pregnant uterus after one elective cesarean section. Ginekol Pol. 2017;88(4):174–179. doi:10.5603/ GP.a2017.0034
31. Pomorski M, Fuchs T, Rosner-Tenerowicz A, Zimmer M. Standard-ized ultrasonographic approach for the assessment of risk factors of incomplete healing of the cesarean section scar in the uterus. Eur J Obstet Gynecol Reprod Biol. 2016;205:141–145. doi:10.1016/j.ejogrb.2016.08.032
32. Yazicioglu F, Gökdogan A, Kelekci S, Aygün M, Savan K. Incomplete healing of the uterine incision after caesarean section: Is it prevent-able? Eur J Obstet Gynecol Reprod Biol. 2006;124(1):32–36. doi:10.1016/j.ejogrb.2005.03.023
33. Vikhareva Osser O, Valentin L. Risk factors for incomplete healing of the uterine incision after caesarean section. BJOG. 2010;117(9):1119–1126. doi:10.1111/j.1471-0528.2010.02631.x
34. Hayakawa H, Itakura A, Mitsui T, et al. Methods for myometrium clo-sure and other factors impacting effects on cesarean section scars of the uterine segment detected by the ultrasonography. Acta Obstet Gynecol Scand. 2006;85(4):429–434. doi:10.1080/00016340500430436
35. Pan H, Zeng M, Xu T, et al. The prevalence and risk predictors of cesar-ean scar defect at 6 weeks postpartum in Shanghai, China: A pro-spective cohort study. Acta Obstet Gynecol Scand. 2019;98(4):413–422. doi:10.1111/aogs.13505
36. Chen HY, Chen SJ, Hsieh FJ. Observation of cesarean section scar by trans-vaginal ultrasonography. Ultrasound Med Biol. 1990;16(5):443–447. doi:10.1016/0301-5629(90)90166-a
37. Chen C, Song X, Wei W, et al. The microbiota continuum along the female reproductive tract and its relation to uterine-related diseases. Nat Commun. 2017;8(1):875. doi:10.1038/s41467-017-00901-0
38. Winters AD, Romero R, Gervasi MT, et al. Does the endometrial cav-ity have a molecular microbial signature? Sci Rep. 2019;9(1):9905. doi:10.1038/s41598-019-46173-0
39. Voet LLFV, Vaate AMJB, Heymans MW, Brölmann HAM, Veersema S, Huirne JAF. Prognostic factors for niche development in the uterine caesarean section scar. Eur J Obstet Gynecol Reprod Biol. 2017;213:31–32. doi:10.1016/j.ejogrb.2017.03.039

Cite asAn L, Zhu D, Zhang X, Huang J, Lu G. Isoastilbin inhibits neuronal apoptosis and oxidative stress in a rat model of ischemia-reperfusion injury in the brain: Involvement of SIRT1/3/6. Adv Clin Exp Med. 2022;31(1):49–57. doi:10.17219/acem/142164
DOI10.17219/acem/142164
CopyrightCopyright by Author(s) This is an article distributed under the terms of theCreative Commons Attribution 3.0 Unported (CC BY 3.0)(https://creativecommons.org/licenses/by/3.0/)
Address for correspondenceGuangbao LuE-mail: [email protected]
Funding sourcesNone declared
Conflict of interestNone declared
Received on April 28, 2021Reviewed on August 12, 2021Accepted on September 12, 2021
Published online on October 14, 2021
AbstractBackground. Isoastilbin (IAB) has been shown to have antioxidative and anti-apoptotic functions. A recent study found that IAB can reduce oxidative stress in Alzheimer’s disease. However, whether the antioxidative function of IAB is also protective in other brain diseases remains unknown.
Objectives. To investigate the roles and underlying mechanisms of IAB in middle cerebral artery occlusion-reperfusion (MCAO/R) in rats.
Materials and methods. Male Wistar rats were randomly divided into 5 groups: sham group, MCAO/R group, and 3 MCAO/R groups groups administered IAB (20 mg/kg, 40 mg/kg or 80 mg/kg) once a day for 3 days. Infarction size, modified Neurological Severity Score (mNSS), oxidative stress markers, and neuronal apoptosis markers were used to assay the function of IAB.
Results. Compared with the MCAO/R group, administration of IAB reduced the infarction size and mNSS scores in MCAO/R rats. Isoastilbin also decreased the level of malondialdehyde (MDA) and enhanced the activ-ity of catalase (CAT), superoxide dismutase (SOD) and glutathione peroxidase (GSH-PX). Isoastilbin treatment attenuated MCAO/R-induced neuronal apoptosis compared with the MCAO/R group, as indicated by the re-sults of terminal deoxynucleotide transferase-mediated X-dUTP nick end (TUNEL) and western blot assays. Isoastilbin also reversed MCAO/R-induced downregulation of SIRT1/3/6 protein expression.
Conclusions. These observations suggest that IAB protects against oxidative stress and neuronal apoptosis in rats following cerebral ischemia-reperfusion (I/R) injury through the upregulation of SIRT1/3/6, indicating that IAB might be a promising therapeutic agent for cerebral I/R injury.
Key words: apoptosis, oxidative stress, isoastilbin, focal cerebral ischemia-reperfusion injury
Original papers
Isoastilbin inhibits neuronal apoptosis and oxidative stress in a rat model of ischemia-reperfusion injury in the brain: Involvement of SIRT1/3/6
Lifeng An1,B,D, Dandan Zhu2,B, Xin Zhang2,C, Jingwen Huang1,C, Guangbao Lu1,A,F
1 Jiamusi College, Heilongjiang University of Chinese Medicine, China2 Graduate School, Heilongjiang University of Chinese Medicine, Jiamusi, China
A – research concept and design; B – collection and/or assembly of data; C – data analysis and interpretation; D – writing the article; E – critical revision of the article; F – final approval of the article
Advances in Clinical and Experimental Medicine, ISSN 1899–5276 (print), ISSN 2451–2680 (online) Adv Clin Exp Med. 2022;31(1):49–57
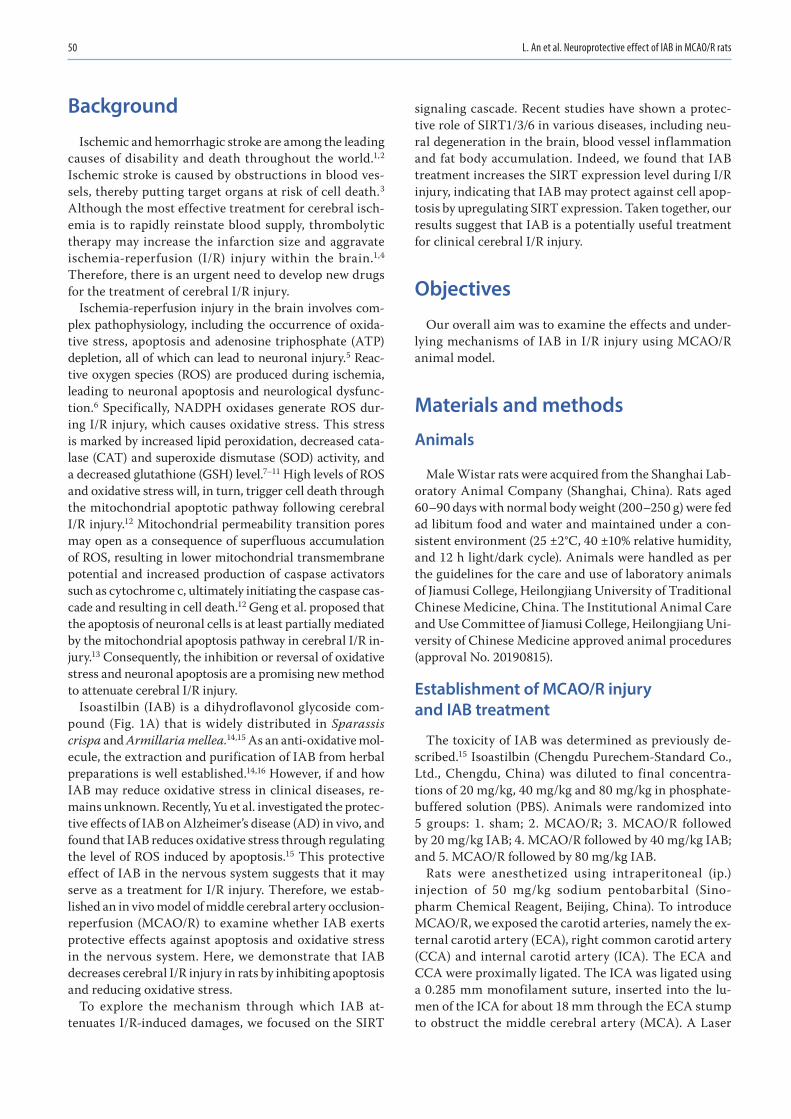
L. An et al. Neuroprotective effect of IAB in MCAO/R rats50
Background
Ischemic and hemorrhagic stroke are among the leading causes of disability and death throughout the world.1,2 Ischemic stroke is caused by obstructions in blood ves-sels, thereby putting target organs at risk of cell death.3 Although the most effective treatment for cerebral isch-emia is to rapidly reinstate blood supply, thrombolytic therapy may increase the infarction size and aggravate ischemia-reperfusion (I/R) injury within the brain.1,4 Therefore, there is an urgent need to develop new drugs for the treatment of cerebral I/R injury.
Ischemia-reperfusion injury in the brain involves com-plex pathophysiology, including the occurrence of oxida-tive stress, apoptosis and adenosine triphosphate (ATP) depletion, all of which can lead to neuronal injury.5 Reac-tive oxygen species (ROS) are produced during ischemia, leading to neuronal apoptosis and neurological dysfunc-tion.6 Specifically, NADPH oxidases generate ROS dur-ing I/R injury, which causes oxidative stress. This stress is marked by increased lipid peroxidation, decreased cata-lase (CAT) and superoxide dismutase (SOD) activity, and a decreased glutathione (GSH) level.7–11 High levels of ROS and oxidative stress will, in turn, trigger cell death through the mitochondrial apoptotic pathway following cerebral I/R injury.12 Mitochondrial permeability transition pores may open as a consequence of superfluous accumulation of ROS, resulting in lower mitochondrial transmembrane potential and increased production of caspase activators such as cytochrome c, ultimately initiating the caspase cas-cade and resulting in cell death.12 Geng et al. proposed that the apoptosis of neuronal cells is at least partially mediated by the mitochondrial apoptosis pathway in cerebral I/R in-jury.13 Consequently, the inhibition or reversal of oxidative stress and neuronal apoptosis are a promising new method to attenuate cerebral I/R injury.
Isoastilbin (IAB) is a dihydroflavonol glycoside com-pound (Fig. 1A) that is widely distributed in Sparassis crispa and Armillaria mellea.14,15 As an anti-oxidative mol-ecule, the extraction and purification of IAB from herbal preparations is well established.14,16 However, if and how IAB may reduce oxidative stress in clinical diseases, re-mains unknown. Recently, Yu et al. investigated the protec-tive effects of IAB on Alzheimer’s disease (AD) in vivo, and found that IAB reduces oxidative stress through regulating the level of ROS induced by apoptosis.15 This protective effect of IAB in the nervous system suggests that it may serve as a treatment for I/R injury. Therefore, we estab-lished an in vivo model of middle cerebral artery occlusion-reperfusion (MCAO/R) to examine whether IAB exerts protective effects against apoptosis and oxidative stress in the nervous system. Here, we demonstrate that IAB decreases cerebral I/R injury in rats by inhibiting apoptosis and reducing oxidative stress.
To explore the mechanism through which IAB at-tenuates I/R-induced damages, we focused on the SIRT
signaling cascade. Recent studies have shown a protec-tive role of SIRT1/3/6 in various diseases, including neu-ral degeneration in the brain, blood vessel inflammation and fat body accumulation. Indeed, we found that IAB treatment increases the SIRT expression level during I/R injury, indicating that IAB may protect against cell apop-tosis by upregulating SIRT expression. Taken together, our results suggest that IAB is a potentially useful treatment for clinical cerebral I/R injury.
Objectives
Our overall aim was to examine the effects and under-lying mechanisms of IAB in I/R injury using MCAO/R animal model.
Materials and methods
Animals
Male Wistar rats were acquired from the Shanghai Lab-oratory Animal Company (Shanghai, China). Rats aged 60–90 days with normal body weight (200–250 g) were fed ad libitum food and water and maintained under a con-sistent environment (25 ±2°C, 40 ±10% relative humidity, and 12 h light/dark cycle). Animals were handled as per the guidelines for the care and use of laboratory animals of Jiamusi College, Heilongjiang University of Traditional Chinese Medicine, China. The Institutional Animal Care and Use Committee of Jiamusi College, Heilongjiang Uni-versity of Chinese Medicine approved animal procedures (approval No. 20190815).
Establishment of MCAO/R injury and IAB treatment
The toxicity of IAB was determined as previously de-scribed.15 Isoastilbin (Chengdu Purechem-Standard Co., Ltd., Chengdu, China) was diluted to final concentra-tions of 20 mg/kg, 40 mg/kg and 80 mg/kg in phosphate-buffered solution (PBS). Animals were randomized into 5 groups: 1. sham; 2. MCAO/R; 3. MCAO/R followed by 20 mg/kg IAB; 4. MCAO/R followed by 40 mg/kg IAB; and 5. MCAO/R followed by 80 mg/kg IAB.
Rats were anesthetized using intraperitoneal (ip.) injection of 50 mg/kg sodium pentobarbital (Sino-pharm Chemical Reagent, Beijing, China). To introduce MCAO/R, we exposed the carotid arteries, namely the ex-ternal carotid artery (ECA), right common carotid artery (CCA) and internal carotid artery (ICA). The ECA and CCA were proximally ligated. The ICA was ligated using a 0.285 mm monofilament suture, inserted into the lu-men of the ICA for about 18 mm through the ECA stump to obstruct the middle cerebral artery (MCA). A Laser
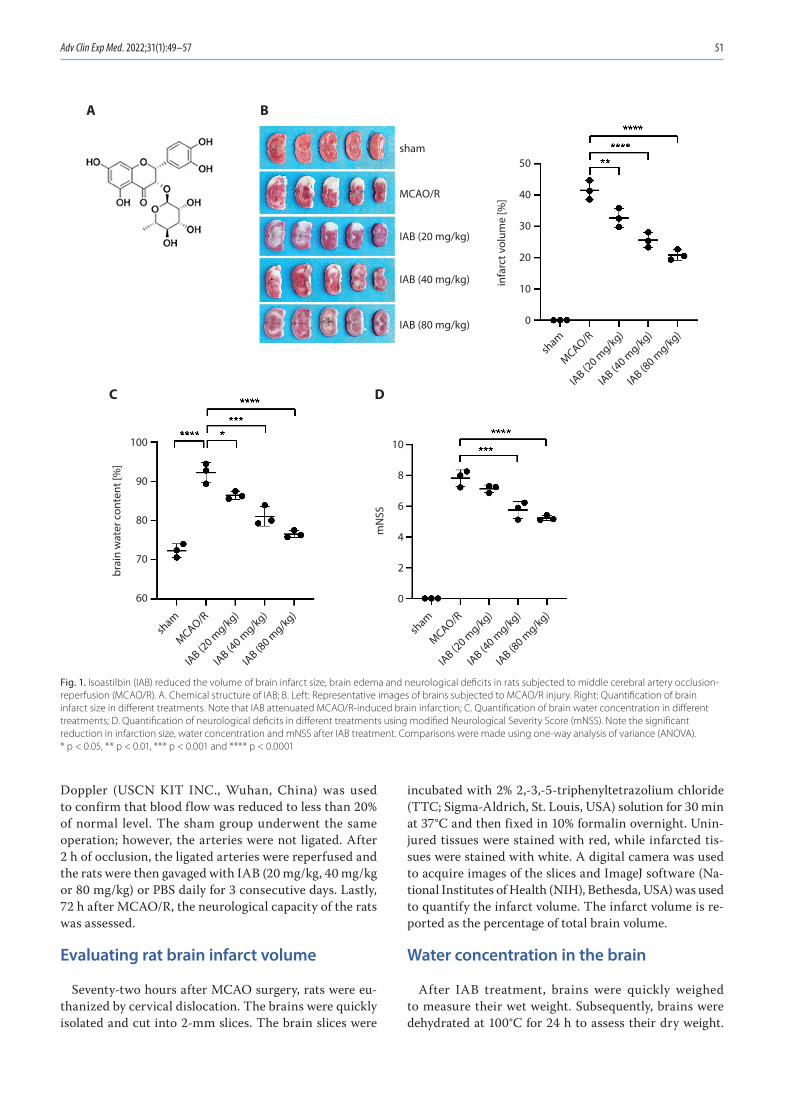
Adv Clin Exp Med. 2022;31(1):49–57 51
Doppler (USCN KIT INC., Wuhan, China) was used to confirm that blood flow was reduced to less than 20% of normal level. The sham group underwent the same operation; however, the arteries were not ligated. After 2 h of occlusion, the ligated arteries were reperfused and the rats were then gavaged with IAB (20 mg/kg, 40 mg/kg or 80 mg/kg) or PBS daily for 3 consecutive days. Lastly, 72 h after MCAO/R, the neurological capacity of the rats was assessed.
Evaluating rat brain infarct volume
Seventy-two hours after MCAO surgery, rats were eu-thanized by cervical dislocation. The brains were quickly isolated and cut into 2-mm slices. The brain slices were
incubated with 2% 2,-3,-5-triphenyltetrazolium chloride (TTC; Sigma-Aldrich, St. Louis, USA) solution for 30 min at 37°C and then fixed in 10% formalin overnight. Unin-jured tissues were stained with red, while infarcted tis-sues were stained with white. A digital camera was used to acquire images of the slices and ImageJ software (Na-tional Institutes of Health (NIH), Bethesda, USA) was used to quantify the infarct volume. The infarct volume is re-ported as the percentage of total brain volume.
Water concentration in the brain
After IAB treatment, brains were quickly weighed to measure their wet weight. Subsequently, brains were dehydrated at 100°C for 24 h to assess their dry weight.
Fig. 1. Isoastilbin (IAB) reduced the volume of brain infarct size, brain edema and neurological deficits in rats subjected to middle cerebral artery occlusion-reperfusion (MCAO/R). A. Chemical structure of IAB; B. Left: Representative images of brains subjected to MCAO/R injury. Right: Quantification of brain infarct size in different treatments. Note that IAB attenuated MCAO/R-induced brain infarction; C. Quantification of brain water concentration in different treatments; D. Quantification of neurological deficits in different treatments using modified Neurological Severity Score (mNSS). Note the significant reduction in infarction size, water concentration and mNSS after IAB treatment. Comparisons were made using one-way analysis of variance (ANOVA). * p < 0.05, ** p < 0.01, *** p < 0.001 and **** p < 0.0001
sham
infa
rct v
olum
e [%
]
50
40
30
20
10
0
mN
SS
10
8
6
4
2
0
brai
n w
ater
con
tent
[%]
100
90
80
70
60
MCAO/R
IAB (20 mg/kg)
IAB (40 mg/kg)
IAB (80 mg/kg)
sham
MCAO/R
IAB (2
0 mg/kg)
IAB (4
0 mg/kg)
IAB (8
0 mg/kg)
sham
MCAO/R
IAB (2
0 mg/kg)
IAB (4
0 mg/kg)
IAB (8
0 mg/kg)
sham
MCAO/R
IAB (2
0 mg/kg)
IAB (4
0 mg/kg)
IAB (8
0 mg/kg)
A B
C D

L. An et al. Neuroprotective effect of IAB in MCAO/R rats52
The concentration of water in the brain was calculated as: ((wet weight ‒ dry weight)/wet weight) × 100%.
Modified neurological severity score (mNSS)
Sensory, motor, balance and reflex neurological func-tions were assessed 72 h after MCAO surgery using mNSS.17 The severity of neurological deficits was ranked on a scale from 0 to 10, with a higher score indicating more severe damage to the nervous system.
Measurement of superoxide dismutase (SOD), malondialdehyde (MDA), catalase (CAT), and glutathione peroxidase (GSH-PX)
After IAB treatment, protein content was determined from brain tissues. Protein concentration of cortical ho-mogenates was determined using BCA kits (Beyotime, Shanghai, China). The SOD, MDA, CAT, and GSH-PX were detected using the corresponding kits (catalog No. A003-1, A001-3, A007, and A005; Nanjing Jiancheng Bio-engineering Institute, Nanjing, China). Briefly, the super-natant of cortical homogenate was collected. For SOD, samples were incubated with WST-8/enzyme working so-lution at 37°C for 30 min. The absorption was measured at a wavelength of 450 nm. One SOD enzymatic activ-ity unit (U) was defined as the amount of sample needed to achieve a 50% inhibition rate of WST-8 formazan dye. For MDA, samples were mixed with working solution and then heated at 100°C for 15 min. The absorption of super-natant was measured at a wavelength of 532 nm. For CAT, samples were mixed with CAT detection buffer and hydro-gen peroxide solution and then incubated at 25°C for 5 min. The absorption was detected at a wavelength of 520 nm. For GSH-PX, samples were mixed with GSH at 37°C for 5 min. The absorption of supernatant was measured at a wavelength of 412 nm. One unit (U) of enzyme activity was defined as the amount of GSH-PX in 1 mg of protein that catalyzed the consumption of 1 μmol/L GSH, while deducting the effect of the non-enzyme reaction.
Terminal deoxynucleotidyl transferase dUTP nick end labeling (TUNEL) staining
Ipsilateral hemisphere brain tissues were isolated, fixed in 4% paraformaldehyde and embedded in paraffin. Tissues were then cut into 5-μm slices and antigen exposed after 10 min of microwave heating in citrate buffer. Neuronal apoptosis was assessed using the TUNEL assay (In Situ Cell Death Detection Kit; Roche, Penzberg, Germany), accord-ing to the manufacturer’s instructions. In brief, brain slices were placed in ice-cold 4% paraformaldehyde for 30 min and then, were incubated in the dark with the TUNEL reaction mixture at 37°C for 1 h. Subsequently, the nu-clei were stained with 6-diamidino-2-phenylindole (DAPI;
Sigma-Aldrich). Samples were imaged and the apoptosis index was calculated as the number of TUNEL-positive cells divided by the total number of cells.
Western blot
Rat brain tissues were lysed using radio-immunopre-cipitation assay (RIPA) buffer (Beyotime, Dalian, China). Proteins were subjected to 12–15% sodium dodecyl sul-fate polyacrylamide gel electrophoresis (SDS-PAGE) and then transferred onto polyvinylidene fluoride (PVDF) membranes (Millipore, Billerica, USA). Membranes were blocked using 5% fat-free milk and incubated with pri-mary antibodies at 4°C overnight. Horseradish peroxidase (HRP)-conjugated secondary antibodies were subsequently incubated at room temperature for 2 h. Specific signals of labeled proteins were detected using a chemilumines-cence system. The β-actin was used to normalize the pro-tein expression levels of Bcl-2, Bax and Sirtuin (SIRT1/3/6). Images were analyzed using ImageJ software.
Statistical analyses
Data are presented as the mean ± standard deviation (SD) from 3 independent experiments. Data from each group were confirmed to follow a normal distribution using the Shapiro–Wilk test. The differences between groups were analyzed using one-way analysis of variance (ANOVA), followed by Tukey’s post hoc test using Prism v. 8 software (GraphPad Software, San Diego, USA). A value of p < 0.05 indicated statistical significance. A post hoc power analysis was performed using G*Power 3.1.9.7 soft-ware (Heinrich Heine University, Düsseldorf, Germany).
Results
Isoastilbin protects neurons from MCAO/R-induced injury
To explore if IAB protected neurons subjected to ce-rebral I/R, the concentration of water in the brain and infarct volume were analyzed. In control animals, there was no infarction and the water concentration was rela-tively low (Fig. 1B,C; sham group). After MCAO/R surgery, we observed significant increases in the infarct size and water concentration (Fig. 1B,C). Infarction and ischemic edema indicate that our approach successfully generated I/R model in rats. Interestingly, when we applied different concentrations of IAB (20 mg/kg, 40 mg/kg and 80 mg/kg) immediately after injury, we observed dose-dependent recovery of infarction and ischemic cerebral edema (Fig. 1B,C). This result suggests that IAB protects against ischemia-induced brain damage. Next, we examined cell apoptosis using the mNSS assay. As shown in Fig. 1D, sham-operated rats exhibited no obvious neurological

Adv Clin Exp Med. 2022;31(1):49–57 53
deficits, whereas MCAO/R rats showed significantly in-creased mNSS scores. Consistent with the morphologi-cal changes shown in Fig. 1B and Fig. 1C, IAB treatment significantly decreased the mNSS score of MCAO/R rats (Fig. 1D). Taken together, these results provide evidence that IAB has a neuroprotective function in an in vivo rodent model of cerebral I/R injury. Given that a higher IAB concentration had better protective effects without obvious side effects, we used 80 mg/kg for the following experiments.
Isoastilbin attenuates oxidative stress in MCAO/R rats
To assess the influence of IAB on oxidative stress, the GHS-PX, MDA, SOD, and CAT levels were assessed after IAB treatment. Due to the increase in oxidative stress, rats subjected to MCAO/R had higher levels of MDA com-pared with sham rats. This effect was attenuated by IAB treatment (Fig. 2A). Furthermore, CAT, SOD and GHS-PX levels decreased in MCAO/R rats compared to sham rats (Fig. 2B,D). Treatment with IAB elevated the levels of CAT, SOD and GHS-PX in MCAO/R rats (Fig. 2B,D), suggesting that IAB protected against cerebral I/R injury by attenuat-ing oxidative stress.
Isoastilbin inhibits neuronal apoptosis in MCAO/R rats
Next, we utilized the TUNEL assay to assess neuronal apoptosis after cerebral I/R injury. As depicted in Fig. 3A, there was an increased number of TUNEL-positive cells in MCAO/R rats, which was reduced by IAB treatment (Fig. 3A). To explore the underlying mechanisms of IAB protection, we examined the expression of the apoptosis proteins Bax and Bcl-2 using western blot. In rats subjected to MCAO/R, the expression of Bax (pro-apoptotic marker) was upregulated, while that of Bcl-2 (anti-apoptotic marker) was downregulated, compared with the sham group (Fig. 3B,C). However, IAB treatment prevented MCAO/R-induced changes (Fig. 3B,C). These results suggest that IAB inhibited neuronal apoptosis in MCAO/R rats.
Isoastilbin upregulates SIRT expression
Next, we sought to examine how IAB protects neu-rons from oxidative stress. The SIRT, a NAD+-dependent deacetylase mainly localized in mitochondria, has been found to be associated with cell survival and apoptosis, cell metabolism, and response to stress. The SIRT may activate mitochondrial signals and pathways to promote mitochon-dria proliferation and ATP generation. It also participates in inflammation, in a way that the reduction in SIRT leads to the increases in chronic inflammation factors, like NFκB and RelA/p65 activity.18–20 Interestingly, several studies have found that SIRT exerts a neural protective
effect and attenuates oxidative stress in the pathophysiol-ogy of cerebral I/R injury.21 Here, we investigated brain expression of SIRT1/3/6 in rats subjected to MCAO/R. We found that MCAO/R injury decreased the protein levels of SIRT1/3/6, while IAB treatment attenuated these effects (Fig. 4A–D). These data suggest that IAB might be protec-tive in MCAO/R rats by upregulating SIRT1/3/6 expression in protection against oxidative stress.
Discussion
Previous research has established that I/R induces apop-tosis and oxidative stress, resulting in neurologic disorders or even death.22–24 Oxidative stress is an important cause of brain reperfusion injury because during reperfusion,
Fig. 2. Isoastilbin (IAB) mitigated oxidative stress in rats subjected to middle cerebral artery occlusion-reperfusion (MCAO/R). Rats were administered IAB (80 mg/kg) after MCAO/R surgery. A. Quantification of malondialdehy-de (MDA) level in different treatments. Note that IAB treatment attenuated the MCAO/R-induced MDA increase; B. Quantification of catalase (CAT) level in different treatments; C. Quantification of superoxide dismutase (SOD) activity in different treatments; D. Quantification of glutathione peroxidase (GSH-PX) activity in different treatments. Note that CAT level, SOD activity and GHS-PX activity increased after IAB treatment. Compari-sons were made using one-way analysis of variance (ANOVA). ** p < 0.01, *** p < 0.001 and **** p < 0.0001
CAT
leve
l [nm
ol/m
g pr
otei
n]
20
15
10
5
0
MD
A le
vel [
nmol
/mg
prot
ein]
30
20
10
0
SOD
[U/m
g pr
otei
n]
80
70
60
50
40
GSH
-PX
[U/m
g pr
otei
n]
50
40
30
20
10
0
sham
MCAO/R
MCAO/R+IA
Bsh
am
MCAO/R
MCAO/R+IA
B
sham
MCAO/R
MCAO/R+IA
Bsh
am
MCAO/R
MCAO/R+IA
B
BA
DC

L. An et al. Neuroprotective effect of IAB in MCAO/R rats54
ROS concentration rises to a peak, which may potentially induce apoptosis or cell necrosis.25–28 There are several well-established markers of oxidative stress. For example, MDA, a cytotoxic compound produced by lipid peroxidation,29 is in-creased in rat cardiomyocytes after I/R damage.30 The antiox-idant enzymes SOD, CAT and GHS-PX play important roles in scavenging superoxides and preventing oxidative dam-age.31,32 Moreover, changes in the activity of these enzymes are also related to oxidative stress. Attenuating oxidative stress is a potential way of protecting tissues from I/R injury.
A recent study demonstrated that the neuroprotective effect of IAB might be due to the modulation of oxidative stress. Specifically, the study found that IAB inhibited ROS generation and induced SOD and GSH-PX to ameliorate oxidative damage in a mouse AD model.15 However, if and how IAB protects against I/R injury in brain, is not yet known. In the present study, we demonstrated that IAB successfully attenuates cerebral I/R injury by reducing the infarct volume and neurological deficits after MCAO/R injury. To test whether the effects of IAB are due to at-tenuation of ROS species, we measured several markers
of oxidative stress. Isoastilbin treatment after MCAO/R was found to decrease MDA levels, but increase CAT, SOD, and GSH-PX activity. These results suggest that the under-lying mechanism of IAB-mediated neuroprotection against I/R injury is through the reduction of oxidative stress.
Indeed, cerebral I/R is able to induce apoptosis of neu-rons.33,34 The activation of pro-apoptotic proteins (Bax and Bak) and parallel inactivation of anti-apoptotic proteins (such as Bcl-2) occurred during cerebral I/R injury. Both, Bcl-2 and Bax are found in the exterior part of the mito-chondrial membrane, and participate in the modulation of cell apoptosis.35–37 Previous studies have shown that Bcl-2 overexpression blocks neuronal death in vitro and in vivo.38 Erfani et al. found that the Bax/Bcl-2 ratio was increased during cerebral I/R injury, contributing to neuronal apopto-sis.39 Moreover, Bax upregulation and Bcl-2 downregulation were found in mice brains subjected to MCAO/R.40 In ad-dition, IAB has been found to modulate the protein ex-pression levels of both Bcl-2 and Bax to improve the redox system in mice with AD, indicating the anti-apoptotic role of IAB in this condition.15 In the present study, we showed
Fig. 3. Isoastilbin (IAB) inhibits neuronal apoptosis in rats subjected to middle cerebral artery occlusion-reperfusion (MCAO/R). A. Left: Representative images of brain tissue using TUNEL staining. Right: Quantification of TUNEL-positive cells in different treatments. MACO/R induced cell apoptosis, which was reversed by IAB treatment; B. Western blots showed increased Bax and decreased Bcl-2 protein expression after MCAO/R, which was reversed by IAB treatment; C. Quantification of the protein levels of Bcl-2 and Bax in different treatments. Comparisons were made using one-way analysis of variance (ANOVA). ** p < 0.01, *** p <0.001 and **** p < 0.0001
sham
MCAO/R
MCAO/R+IA
B
sham
MCA
O/R
MCA
O/R
+IA
B
sham
MCAO/R
MCAO/R+IA
B
sham
MCAO/R
MCAO/R+IA
Bsh
am
MCAO/R
MCAO/R+IA
B
TUN
EL p
ositi
ve c
ells
[%]
50
40
30
20
10
0
rela
tive
prot
ein
leve
l
Bax
Bcl-2
Bax
Bcl-2
β-actin
2.5
2.0
1.5
1.0
0.5
0.0
A
B C
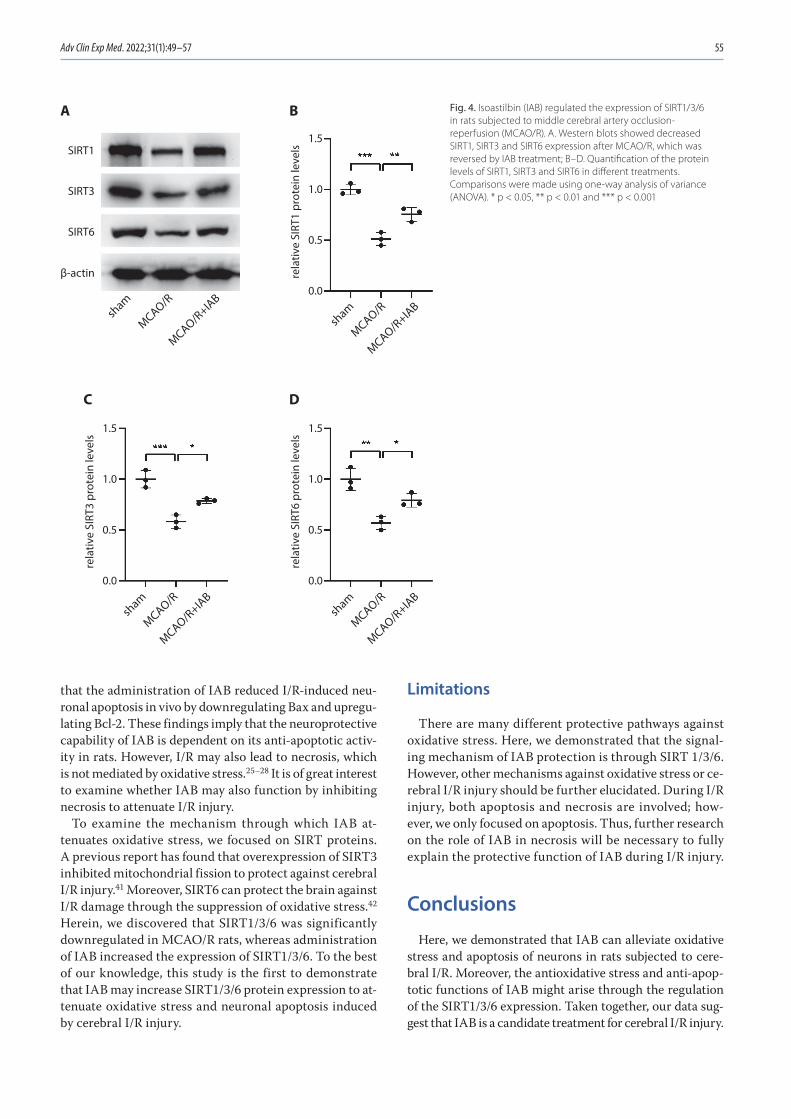
Adv Clin Exp Med. 2022;31(1):49–57 55
that the administration of IAB reduced I/R-induced neu-ronal apoptosis in vivo by downregulating Bax and upregu-lating Bcl-2. These findings imply that the neuroprotective capability of IAB is dependent on its anti-apoptotic activ-ity in rats. However, I/R may also lead to necrosis, which is not mediated by oxidative stress.25–28 It is of great interest to examine whether IAB may also function by inhibiting necrosis to attenuate I/R injury.
To examine the mechanism through which IAB at-tenuates oxidative stress, we focused on SIRT proteins. A previous report has found that overexpression of SIRT3 inhibited mitochondrial fission to protect against cerebral I/R injury.41 Moreover, SIRT6 can protect the brain against I/R damage through the suppression of oxidative stress.42 Herein, we discovered that SIRT1/3/6 was significantly downregulated in MCAO/R rats, whereas administration of IAB increased the expression of SIRT1/3/6. To the best of our knowledge, this study is the first to demonstrate that IAB may increase SIRT1/3/6 protein expression to at-tenuate oxidative stress and neuronal apoptosis induced by cerebral I/R injury.
Limitations
There are many different protective pathways against oxidative stress. Here, we demonstrated that the signal-ing mechanism of IAB protection is through SIRT 1/3/6. However, other mechanisms against oxidative stress or ce-rebral I/R injury should be further elucidated. During I/R injury, both apoptosis and necrosis are involved; how-ever, we only focused on apoptosis. Thus, further research on the role of IAB in necrosis will be necessary to fully explain the protective function of IAB during I/R injury.
Conclusions
Here, we demonstrated that IAB can alleviate oxidative stress and apoptosis of neurons in rats subjected to cere-bral I/R. Moreover, the antioxidative stress and anti-apop-totic functions of IAB might arise through the regulation of the SIRT1/3/6 expression. Taken together, our data sug-gest that IAB is a candidate treatment for cerebral I/R injury.
Fig. 4. Isoastilbin (IAB) regulated the expression of SIRT1/3/6 in rats subjected to middle cerebral artery occlusion-reperfusion (MCAO/R). A. Western blots showed decreased SIRT1, SIRT3 and SIRT6 expression after MCAO/R, which was reversed by IAB treatment; B–D. Quantification of the protein levels of SIRT1, SIRT3 and SIRT6 in different treatments. Comparisons were made using one-way analysis of variance (ANOVA). * p < 0.05, ** p < 0.01 and *** p < 0.001
sham
MCAO/R
MCAO/R+IA
Bsham
MCAO/R
MCAO/R+IA
B
sham
MCAO/R
MCAO/R+IA
Bsh
am
MCAO/R
MCAO/R+IA
B
rela
tive
SIRT
3 pr
otei
n le
vels
1.5
1.0
0.5
0.0
rela
tive
SIRT
6 pr
otei
n le
vels
1.5
1.0
0.5
0.0
rela
tive
SIRT
1 pr
otei
n le
vels
1.5
1.0
0.5
0.0
A B
C D
SIRT1
SIRT3
SIRT6
β-actin

L. An et al. Neuroprotective effect of IAB in MCAO/R rats56
ORCID iDsLifeng An https://orcid.org/0000-0002-4835-1817Dandan Zhu https://orcid.org/0000-0001-9119-9956Xin Zhang https://orcid.org/0000-0002-9496-1691Jingwen Huang https://orcid.org/0000-0001-6449-5362Guangbao Lu https://orcid.org/0000-0002-2465-8996
References1. Rossi DJ, Brady JD, Mohr C. Astrocyte metabolism and signaling dur-
ing brain ischemia. Nat Neurosci. 2007;10(11):1377–1386. doi:10.1038/nn2004
2. Ribeiro PW, Cola PC, Gatto AR, et al. Relationship between dyspha-gia, National Institutes Of Health Stroke Scale score, and predictors of pneumonia after ischemic stroke. J Stroke Cerebrovasc Dis. 2015; 24(9):2088–2094. doi:10.1016/j.jstrokecerebrovasdis.2015.05.009
3. Hu X, De Silva TM, Chen J, Faraci FM. Cerebral vascular disease and neurovascular injury in ischemic stroke. Circ Res. 2017;120(3):449–471. doi:10.1161/circresaha.116.308427
4. Tabassum R, Vaibhav K, Shrivastava P, et al. Perillyl alcohol improves functional and histological outcomes against ischemia-reperfusion injury by attenuation of oxidative stress and repression of COX-2, NOS-2 and NF-κB in middle cerebral artery occlusion rats. Eur J Pharmacol. 2015;747:190–199. doi:10.1016/j.ejphar.2014.09.015
5. Woodruff TM, Thundyil J, Tang SC, Sobey CG, Taylor SM, Arumugam TV. Pathophysiology, treatment, and animal and cellular models of human ischemic stroke. Mol Neurodegener. 2011;6(1):11. doi:10.1186/1750- 1326-6-11
6. Gonzalez-Rodriguez PJ, Xiong F, Li Y, Zhou J, Zhang L. Fetal hypoxia increases vulnerability of hypoxic-ischemic brain injury in neonatal rats: Role of glucocorticoid receptors. Neurobiol Dis. 2014;65:172–179. doi:10.1016/j.nbd.2014.01.020
7. Rodrigo R, Fernández-Gajardo R, Gutiérrez R, et al. Oxidative stress and pathophysiology of ischemic stroke: Novel therapeutic opportu-nities. CNS Neurol Disord Drug Targets. 2013;12(5):698–714. doi:10.2174/ 1871527311312050015
8. Zhang C, Ling CL, Pang L, et al. Direct macromolecular drug delivery to cerebral ischemia area using neutrophil-mediated nanoparticles. Theranostics. 2017;7(13):3260–3275. doi:10.7150/thno.19979
9. Kahles T, Luedike P, Endres M, et al. NADPH oxidase plays a central role in blood–brain barrier damage in experimental stroke. Stroke. 2007;38(11):3000–3006. doi:10.1161/strokeaha.107.489765
10. Chen H, Song YS, Chan PH. Inhibition of NADPH oxidase is neuropro-tective after ischemia-reperfusion. J Cereb Blood Flow Metab. 2009; 29(7):1262–1272. doi:10.1038/jcbfm.2009.47
11. Kapoor M, Sharma N, Sandhir R, Nehru B. Effect of the NADPH oxi-dase inhibitor apocynin on ischemia-reperfusion hippocampus inju-ry in rat brain. Biomed Pharmacother. 2018;97:458–472. doi:10.1016/j.biopha.2017.10.123
12. Yu S, Wang C, Cheng Q, et al. An active component of Achyranthes bidentata polypeptides provides neuroprotection through inhibi-tion of mitochondrial-dependent apoptotic pathway in cultured neurons and in animal models of cerebral ischemia. PLoS One. 2014; 9(10):e109923. doi:10.1371/journal.pone.0109923
13. Geng HX, Li RP, Li YG, et al. 14,15-EET suppresses neuronal apop-tosis in ischemia-reperfusion through the mitochondrial pathway. Neurochem Res. 2017;42(10):2841–2849. doi:10.1007/s11064-017-2297-6
14. Du Q, Li L, Jerz G. Purification of astilbin and isoastilbin in the extract of smilax glabra rhizome by high-speed counter-current chromatog-raphy. J Chromatogr A. 2005;1077(1):98–101. doi:10.1016/j.chroma. 2005.04.072
15. Yu H, Yuan B, Chu Q, Wang C, Bi H. Protective roles of isoastilbin against Alzheimer’s disease via Nrf2-mediated antioxidation and anti-apoptosis. Int J Mol Med. 2019;43(3):1406–1416. doi:10.3892/ijmm. 2019.4058
16. Zhou X, Xu Q, Li JX, Chen T. Structural revision of two flavanonol gly-cosides from Smilax glabra. Planta Med. 2009;75(6):654–655. doi:10. 1055/s-0029-1185360
17. Morimoto J, Yasuhara T, Kameda M, et al. Electrical stimulation enhances migratory ability of transplanted bone marrow stromal cells in a rodent ischemic stroke model. Cell Physiol Biochem. 2018; 46(1):57–68. doi:10.1159/000488409
18. Torrens-Mas M, Pons DG, Sastre-Serra J, Oliver J, Roca P. SIRT3 silenc-ing sensitizes breast cancer cells to cytotoxic treatments through an increment in ROS production. J Cell Biochem. 2017;118(2):397–406. doi:10.1002/jcb.25653
19. Nassir F, Arndt JJ, Johnson SA, Ibdah JA. Regulation of mitochondri-al trifunctional protein modulates nonalcoholic fatty liver disease in mice. J Lipid Res. 2018;59(6):967–973. doi:10.1194/jlr.M080952
20. Torrens-Mas M, Hernández-López R, Oliver J, Roca P, Sastre-Serra J. Sirtuin 3 silencing improves oxaliplatin efficacy through acetyla-tion of MnSOD in colon cancer. J Cell Physiol. 2018;233(8):6067–6076. doi:10.1002/jcp.26443
21. Hernández-Jiménez M, Hurtado O, Cuartero MI, et al. Silent informa-tion regulator 1 protects the brain against cerebral ischemic damage. Stroke. 2013;44(8):2333–2337. doi:10.1161/strokeaha.113.001715
22. Chen GY, Nuñez G. Sterile inflammation: Sensing and reacting to damage. Nat Rev Immunol. 2010;10(12):826–837. doi:10.1038/nri2873
23. Eltzschig HK, Eckle T. Ischemia and reperfusion: From mechanism to translation. Nat Med. 2011;17(11):1391–1401. doi:10.1038/nm.2507
24. Dziedzic T. Systemic inflammation as a therapeutic target in acute ischemic stroke. Expert Rev Neurother. 2015;15(5):523–531. doi:10.1586/ 14737175.2015.1035712
25. Yemisci M, Gursoy-Ozdemir Y, Vural A, Can A, Topalkara K, Dalkara T. Pericyte contraction induced by oxidative-nitrative stress impairs capillary reflow despite successful opening of an occluded cerebral artery. Nat Med. 2009;15(9):1031–1037. doi:10.1038/nm.2022
26. Chen H, Yoshioka H, Kim GS, et al. Oxidative stress in ischemic brain damage: Mechanisms of cell death and potential molecular targets for neuroprotection. Antioxid Redox Signal. 2011;14(8):1505–1517. doi:10.1089/ars.2010.3576
27. Olmez I, Ozyurt H. Reactive oxygen species and ischemic cerebro-vascular disease. Neurochem Int. 2012;60(2):208–212. doi:10.1016/j.neuint.2011.11.009
28. Guo J, Cheng C, Chen CS, et al. Overexpression of Fibulin-5 attenu-ates ischemia/reperfusion injury after middle cerebral artery occlu-sion in rats. Mol Neurobiol. 2016;53(5):3154–3167. doi:10.1007/s12035-015-9222-2
29. Qiang M, Xu Y, Lu Y, et al. Autofluorescence of MDA-modified pro-teins as an in vitro and in vivo probe in oxidative stress analysis. Protein Cell. 2014;5(6):484–487. doi:10.1007/s13238-014-0052-1
30. Hou S, Zhao MM, Shen PP, et al. Neuroprotective effect of salviano-lic acids against cerebral ischemia/reperfusion injury. Int J Mol Sci. 2016;17(7). doi:10.3390/ijms17071190
31. Adibhatla RM, Hatcher JF. Lipid oxidation and peroxidation in CNS health and disease: From molecular mechanisms to therapeutic opportunities. Antioxid Redox Signal. 2010;12(1):125–169. doi:10.1089/ars.2009.2668
32. Staroń A, Mąkosa G, Koter-Michalak M. Oxidative stress in erythro-cytes from patients with rheumatoid arthritis. Rheumatol Int. 2012; 32(2):331–334. doi:10.1007/s00296-010-1611-2
33. Aşcı S, Demirci S, Aşcı H, Doğuç DK, Onaran İ. Neuroprotective effects of pregabalin on cerebral ischemia and reperfusion. Balkan Med J. 2016;33(2):221–227. doi:10.5152/balkanmedj.2015.15742
34. Tao T, Li CL, Yang WC, et al. Protective effects of propofol against whole cerebral ischemia/reperfusion injury in rats through the inhi-bition of the apoptosis-inducing factor pathway. Brain Res. 2016;1644: 9–14. doi:10.1016/j.brainres.2016.05.006
35. Martinou JC, Youle RJ. Mitochondria in apoptosis: Bcl-2 family members and mitochondrial dynamics. Dev Cell. 2011;21(1):92–101. doi:10.1016/j.devcel.2011.06.017
36. Borner C, Andrews DW. The apoptotic pore on mitochondria: Are we breaking through or still stuck? Cell Death Differ. 2014;21(2):187–191. doi:10.1038/cdd.2013.169
37. Siddiqui WA, Ahad A, Ahsan H. The mystery of BCL2 family: Bcl-2 proteins and apoptosis. An update. Arch Toxicol. 2015;89(3):289–317. doi:10.1007/s00204-014-1448-7
38. Maes ME, Schlamp CL, Nickells RW. BAX to basics: How the BCL2 gene family controls the death of retinal ganglion cells. Prog Retin Eye Res. 2017;57:1–25. doi:10.1016/j.preteyeres.2017.01.002
39. Erfani S, Khaksari M, Oryan S, Shamsaei N, Aboutaleb N, Nikbakht F. Nampt/PBEF/visfatin exerts neuroprotective effects against isch-emia/reperfusion injury via modulation of Bax/Bcl-2 ratio and pre-vention of caspase-3 activation. J Mol Neurosci. 2015;56(1):237–243. doi:10.1007/s12031-014-0486-1

Adv Clin Exp Med. 2022;31(1):49–57 57
40. Chen L, Cao J, Cao D, et al. Protective effect of dexmedetomidine against diabetic hyperglycemia-exacerbated cerebral ischemia/reperfusion injury: An in vivo and in vitro study. Life Sci. 2019;235: 116553. doi:10.1016/j.lfs.2019.116553
41. Zhao H, Luo Y, Chen L, et al. Sirt3 inhibits cerebral ischemia-reperfu-sion injury through normalizing Wnt/β-catenin pathway and blocking mitochondrial fission. Cell Stress Chaperones. 2018;23(5):1079–1092. doi:10.1007/s12192-018-0917-y
42. Zhang W, Wei R, Zhang L, Tan Y, Qian C. Sirtuin 6 protects the brain from cerebral ischemia/reperfusion injury through NRF2 activation. Neuroscience. 2017;366:95–104. doi:10.1016/j.neuroscience.2017.09.035


Cite asGuo J, Wang Z, Xue M, et al. Metformin protects against abdominal aortic aneurysm by Atg7-induced autophagy. Adv Clin Exp Med. 2022;31(1):59–69. doi:10.17219/acem/142026
DOI10.17219/acem/142026
CopyrightCopyright by Author(s) This is an article distributed under the terms of theCreative Commons Attribution 3.0 Unported (CC BY 3.0)(https://creativecommons.org/licenses/by/3.0/)
Address for correspondenceXinqiang HanE-mail: [email protected]
Funding sourcesNone declared
Conflict of interestNone declared
Received on July 27, 2021Reviewed on August 28, 2021Accepted on September 8, 2021
Published online on October 29, 2021
AbstractBackground. Abdominal aortic aneurysm (AAA) is a pathological dilation of the abdominal aorta. It is often asymptomatic, yet it has a high susceptibility to rupture. Our previous study showed that metformin protected against the pathophysiology of AAA by reducing the activation of the PI3K/AKT/mTOR pathway.
Objectives. To investigate the potential involvement of the autophagy-related pathways in AAA and the ability of metformin to modulate these effects.
Materials and methods. The expression of autophagy-related proteins was detected with western blot in patients with AAA. Angiotensin II (Ang-II) was also used to construct an AAA model in mice and in vascular smooth muscle cells (VSMCs). The expression of Atg7 and Atg4 was determined using western blot assay. The Atg7 expression was regulated by overexpressed plasmid, siRNA (small interfering RNA), or metformin, and cell proliferation, migration, apoptosis and autophagy caused by Ang-II were examined.
Results. Autophagy-related proteins were increased in patients with AAA. The Ang-II also induced the expression of Atg7, and metformin reversed this effect both in vivo and in vitro. The suppression of Atg7 inhibited cell proliferation and cell migration, and reduced cell apoptosis and autophagy, while the overexpres-sion of Atg7 enhanced cell proliferation and migration, and induced cell apoptosis and autophagy. Furthermore, Atg7 regulated the expression of the autophagy-related protein in Ang-II treated VSMCs. The Atg7-mediated autophagy was also attenuated by metformin.
Conclusions. Metformin reduced autophagy in AAA and this effect was mediated by Atg7, suggesting that Atg7 is a potential downstream effector of metformin in protecting against the pathophysiology of AAA.
Key words: metformin, abdominal aortic aneurysm, autophagy, Ang-II, Atg7
Original papers
Metformin protects against abdominal aortic aneurysm by Atg7-induced autophagy
Jingjing Guo1,A,D,F, Zhu Wang2,A,D,F, Ming Xue3,A,D,F, Lei Mi4,B,C,E,F, Mengpeng Zhao2,B,C,E,F, Chao Ma2,B,C,E,F, Jian Wu2,B,C,E,F, Xinqiang Han2,A,D,F
1 Department of Obstetrics and Gynecology, Binzhou Medical University Hospital, China2 Department of Interventional Medicine and Vascular Surgery, Binzhou Medical University Hospital, China3 Department of Interventional Radiology, Weihai Municipal Hospital, China4 Department of General Surgery, Tai’an City Central Hospital, China
A – research concept and design; B – collection and/or assembly of data; C – data analysis and interpretation; D – writing the article; E – critical revision of the article; F – final approval of the article
Advances in Clinical and Experimental Medicine, ISSN 1899–5276 (print), ISSN 2451–2680 (online) Adv Clin Exp Med. 2022;31(1):59–69

J. Guo et al. Met protects AAA by Atg7-induced autophagy60
Background
Abdominal aortic aneurysm (AAA), a degenerative vascular disease, is a pathological dilation that can lead to a potentially fatal aortic rupture.1 Although the inci-dence of AAA has recently decreased,2 the worldwide mortality rate due to this condition has remained stable.3 Aneurysms are characterized by a decrease in the num-ber of medial smooth muscle cells (SMCs) in the aortic wall.1 An increasing number of studies have reported that the development of AAA is associated with a reduc-tion in the structural integrity of the vessel wall, which is caused by cell apoptosis and senescence in SMCs.4,5 While the histopathological features of AAA are well documented, the cellular and molecular mechanisms un-derlying the pathogenesis of AAA remain unclear, and no effective pharmacological therapy has been identified to prevent AAA. Therefore, the search for a novel thera-peutic approach remains a challenge.
Autophagy is a highly regulated process that includes the delivery of damaged organelles and cytoplasmic constituents to the lysosome for clearance.6 Autophagy-related genes (Atgs) play a critical role in the regulation of this process.7 The Atg7 is a central regulator of autoph-agy and serves as an E1-like enzyme for the ubiquitin-like proteins Atg12 and Atg8.8 The ApoE–/– mice with SMC-specific Atg7 deficiency exhibit increased plaque sizes and accelerated SMC senescence in the fibrous cap.9 Moreover, the SMC-specific deletion of Atg7 results in reduced serum-induced cell growth, increased cell death and a decreased cell proliferation rate.10 Further-more, the loss of Atg7 in SMCs exacerbates angiotensin II (Ang-II)-associated aortic remodeling.11 The disruption of autophagic f lux caused by vascular SMC (VSMC)-specific deletion of Atg7 results in defective mitophagy, an exacerbation of VSMC apoptosis and, in turn, plaque vulnerability.12 This latter observation reveals the im-portant role of autophagy in the pathogenesis of AAA. Others have reported that metformin suppresses Ang-II-induced AAA progression by inhibiting the activation of the NF-κB and STAT3 signaling pathways.13–15 The lev-els of the autophagy factors Beclin and LC3 have also been shown to be elevated in human and mouse AAA tissues.16 As the primary cellular constituent of the aorta, the loss of VSMCs through apoptosis or necroptosis is a significant distinguishing characteristic of AAA.17 Moreover, a recent study showed that autophagy plays a key role in regulating VSMC death and aortic wall ho-meostasis and repair.18
Objectives
This study aimed to investigate the potential involve-ment of autophagy-related signaling pathways in AAA and the ability of metformin to modulate these effects.
Materials and methods
Clinical samples
Clinical samples were obtained from patients and con-trols at the Shandong Provincial Hospital (Jinan, China). Detailed information on patients and sample collection has been provided in our previous study.15 The aneurys-mal wall tissues of AAA and aortic tissues from the con-trol group were lysed in RIPA buffer (ab156034; Abcam, Cambridge, UK) for western blot assays. This study was approved by the Human Research Committee of Shandong Provincial Hospital (Approval No. SZRJJ:NO.2021-160), affiliated with Shandong University. The procedures fol-lowed the Declaration of Helsinki and informed consent was obtained before conducting the experiments on hu-man subjects.
Animal model
As previously described,15 a mouse model of Ang-II-induced AAA was developed. All procedures with animals were approved by the Animal Care and Use Committee at Shandong Provincial Hospital and were conducted following institutional guidelines. A total of 30 mice (male, 8 weeks old) were randomly assigned to one of the 3 groups: AAA group (n = 10), sham group (n = 10) and AAA + metformin (Met) group (n = 10). In the AAA group, mice were infused with Ang-II (1.44 mg/kg/day, ab120183; Abcam, Cambridge, UK) for 7 or 28 days using implanted micro-osmotic pumps. Mice in the sham group received an equal volume of sa-line. In the AAA+Met group, mice were injected with Ang-II (1.44 mg/kg/day) by implanted micro-osmotic pumps, and were fed water containing metformin (100 mg/kg/day) for 7 or 28 days.
Cell culture and treatment
The VSMCs were isolated from the normal arteries of healthy rats as described previously19 and cultured in Dulbecco’s modified Eagle medium (DMEM) (10313039; Thermo Fisher Scientific, Shanghai, China), supplemented with 10% fetal bovine serum (FBS) at 37°C with 5% CO2. These VSMCs were then treated with Ang-II (1 μM), met-formin (10 mM), or a combination of siRNA or plasmid with Ang-II.
Transfection with plasmid or siRNA
The pcDNA3.1-Atg7 overexpression vector was con-structed and validated using restriction enzyme digestion and DNA sequencing analysis. The polymerase chain reac-tion (PCR) primers for amplification of Atg7 (NM_006395) were Atg7-F (5′-CGCAAATGGGCGGTAGGCGTG-3′) and Atg7-R (5′-TAGAAGGCACAGTCGAGG-3 ′ ).
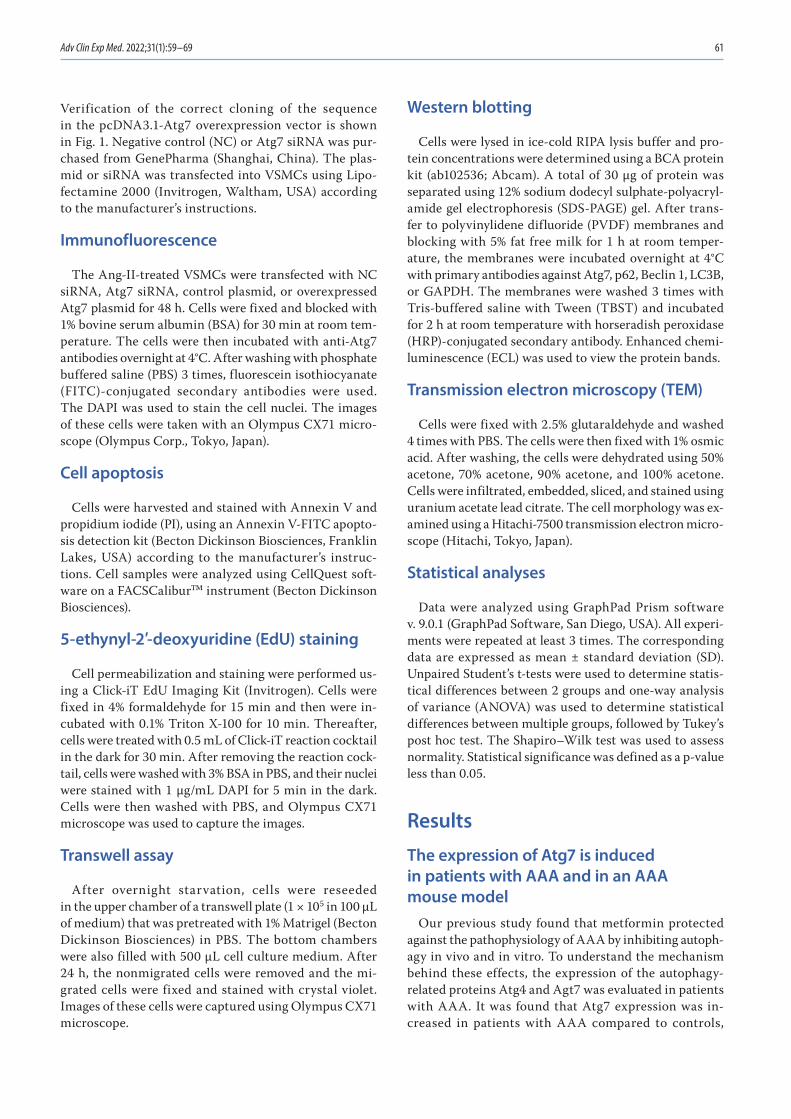
Adv Clin Exp Med. 2022;31(1):59–69 61
Verification of the correct cloning of the sequence in the pcDNA3.1-Atg7 overexpression vector is shown in Fig. 1. Negative control (NC) or Atg7 siRNA was pur-chased from GenePharma (Shanghai, China). The plas-mid or siRNA was transfected into VSMCs using Lipo-fectamine 2000 (Invitrogen, Waltham, USA) according to the manufacturer’s instructions.
Immunofluorescence
The Ang-II-treated VSMCs were transfected with NC siRNA, Atg7 siRNA, control plasmid, or overexpressed Atg7 plasmid for 48 h. Cells were fixed and blocked with 1% bovine serum albumin (BSA) for 30 min at room tem-perature. The cells were then incubated with anti-Atg7 antibodies overnight at 4°C. After washing with phosphate buffered saline (PBS) 3 times, fluorescein isothiocyanate (FITC)-conjugated secondary antibodies were used. The DAPI was used to stain the cell nuclei. The images of these cells were taken with an Olympus CX71 micro-scope (Olympus Corp., Tokyo, Japan).
Cell apoptosis
Cells were harvested and stained with Annexin V and propidium iodide (PI), using an Annexin V-FITC apopto-sis detection kit (Becton Dickinson Biosciences, Franklin Lakes, USA) according to the manufacturer’s instruc-tions. Cell samples were analyzed using CellQuest soft-ware on a FACSCalibur™ instrument (Becton Dickinson Biosciences).
5-ethynyl-2′-deoxyuridine (EdU) staining
Cell permeabilization and staining were performed us-ing a Click-iT EdU Imaging Kit (Invitrogen). Cells were fixed in 4% formaldehyde for 15 min and then were in-cubated with 0.1% Triton X-100 for 10 min. Thereafter, cells were treated with 0.5 mL of Click-iT reaction cocktail in the dark for 30 min. After removing the reaction cock-tail, cells were washed with 3% BSA in PBS, and their nuclei were stained with 1 μg/mL DAPI for 5 min in the dark. Cells were then washed with PBS, and Olympus CX71 microscope was used to capture the images.
Transwell assay
After overnight starvation, cells were reseeded in the upper chamber of a transwell plate (1 × 10⁵ in 100 μL of medium) that was pretreated with 1% Matrigel (Becton Dickinson Biosciences) in PBS. The bottom chambers were also filled with 500 μL cell culture medium. After 24 h, the nonmigrated cells were removed and the mi-grated cells were fixed and stained with crystal violet. Images of these cells were captured using Olympus CX71 microscope.
Western blotting
Cells were lysed in ice-cold RIPA lysis buffer and pro-tein concentrations were determined using a BCA protein kit (ab102536; Abcam). A total of 30 μg of protein was separated using 12% sodium dodecyl sulphate-polyacryl-amide gel electrophoresis (SDS-PAGE) gel. After trans-fer to polyvinylidene difluoride (PVDF) membranes and blocking with 5% fat free milk for 1 h at room temper-ature, the membranes were incubated overnight at 4°C with primary antibodies against Atg7, p62, Beclin 1, LC3B, or GAPDH. The membranes were washed 3 times with Tris-buffered saline with Tween (TBST) and incubated for 2 h at room temperature with horseradish peroxidase (HRP)-conjugated secondary antibody. Enhanced chemi-luminescence (ECL) was used to view the protein bands.
Transmission electron microscopy (TEM)
Cells were fixed with 2.5% glutaraldehyde and washed 4 times with PBS. The cells were then fixed with 1% osmic acid. After washing, the cells were dehydrated using 50% acetone, 70% acetone, 90% acetone, and 100% acetone. Cells were infiltrated, embedded, sliced, and stained using uranium acetate lead citrate. The cell morphology was ex-amined using a Hitachi-7500 transmission electron micro-scope (Hitachi, Tokyo, Japan).
Statistical analyses
Data were analyzed using GraphPad Prism software v. 9.0.1 (GraphPad Software, San Diego, USA). All experi-ments were repeated at least 3 times. The corresponding data are expressed as mean ± standard deviation (SD). Unpaired Student’s t-tests were used to determine statis-tical differences between 2 groups and one-way analysis of variance (ANOVA) was used to determine statistical differences between multiple groups, followed by Tukey’s post hoc test. The Shapiro–Wilk test was used to assess normality. Statistical significance was defined as a p-value less than 0.05.
Results
The expression of Atg7 is induced in patients with AAA and in an AAA mouse model
Our previous study found that metformin protected against the pathophysiology of AAA by inhibiting autoph-agy in vivo and in vitro. To understand the mechanism behind these effects, the expression of the autophagy-related proteins Atg4 and Agt7 was evaluated in patients with AAA. It was found that Atg7 expression was in-creased in patients with AAA compared to controls,

J. Guo et al. Met protects AAA by Atg7-induced autophagy62
whereas the expression of Atg4 remained unchanged (Fig. 2A). Furthermore, the expression of Beclin 1 and LC3B II/I was increased and the expression of p62 was decreased (Fig. 2A), suggesting that the autophagy is trig-gered in AAA. The Ang-II was also used to construct a mouse AAA model, and it was discovered that Ang-II induced the expression levels of Atg7, Beclin 1 and LC3B II/I, and reduced the expression of p62 (Fig. 2B). On the other hand, metformin reversed the induction of Atg7, Beclin 1 and LC3B II/I (Fig. 2B). Given that Atg7 is an essential factor for the induction of autophagy, the increased level of Atg7 might contribute to the in-duction of autophagy in AAA.
Metformin attenuates Ang-II-induced Atg7 expression
The Ang-II was used to construct an AAA model in VSMCs and the expression of autophagy-related proteins was examined. It was found that Ang-II induced the protein expression level of Atg7 (Fig. 3A) but not of Atg4. More-over, metformin reversed the induction of Atg7 (Fig. 3A). To assess the functional role of Atg7 in the AAA in vitro model (Ang-II treated VSMCs), Atg7 was overexpressed or suppressed using a plasmid or siRNA, and immuno-fluorescence (IF) was used to determine the transfection efficiency. As shown in Fig. 3B,C, the expression of Atg7 was increased or decreased by transfection.
Fig. 1. Cloning of Atg7. A. The electrophoresis results of Atg7 polymerase chain reaction (PCR) product before and after restriction endonuclease digestion; B. The vector map of pcDNA3.1-Atg7; C. The cDNA sequence of Atg7
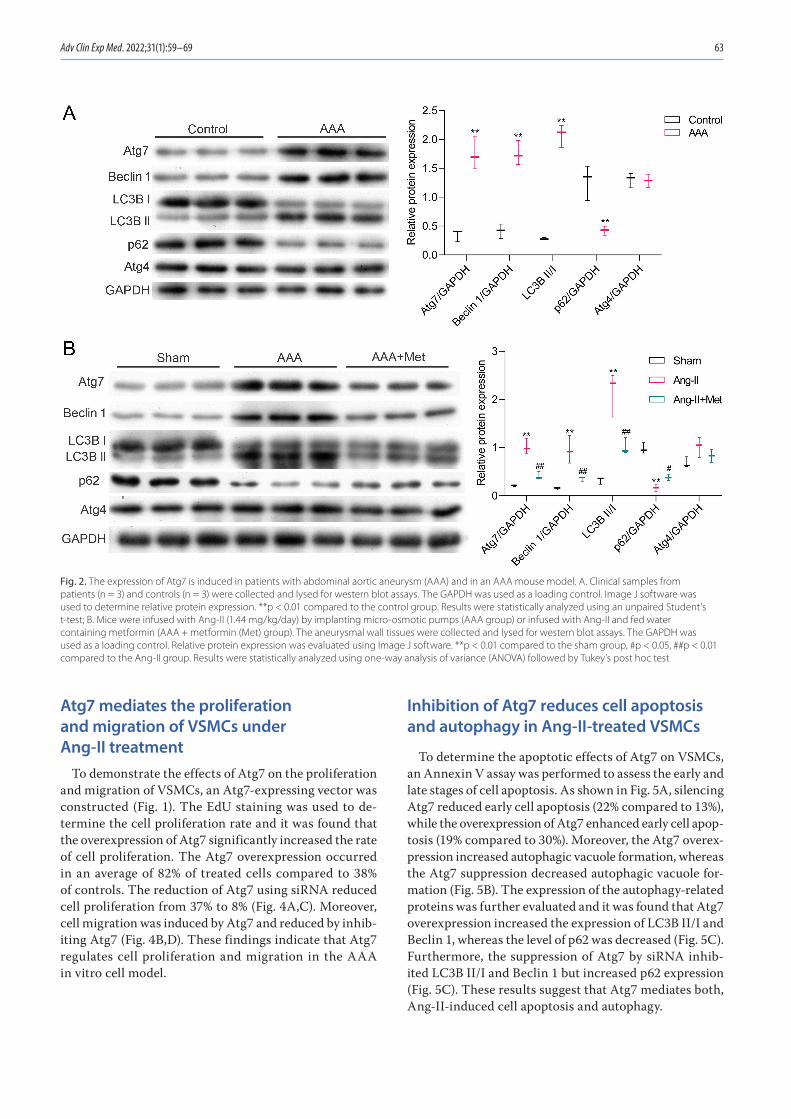
Adv Clin Exp Med. 2022;31(1):59–69 63
Atg7 mediates the proliferation and migration of VSMCs under Ang-II treatment
To demonstrate the effects of Atg7 on the proliferation and migration of VSMCs, an Atg7-expressing vector was constructed (Fig. 1). The EdU staining was used to de-termine the cell proliferation rate and it was found that the overexpression of Atg7 significantly increased the rate of cell proliferation. The Atg7 overexpression occurred in an average of 82% of treated cells compared to 38% of controls. The reduction of Atg7 using siRNA reduced cell proliferation from 37% to 8% (Fig. 4A,C). Moreover, cell migration was induced by Atg7 and reduced by inhib-iting Atg7 (Fig. 4B,D). These findings indicate that Atg7 regulates cell proliferation and migration in the AAA in vitro cell model.
Inhibition of Atg7 reduces cell apoptosis and autophagy in Ang-II-treated VSMCs
To determine the apoptotic effects of Atg7 on VSMCs, an Annexin V assay was performed to assess the early and late stages of cell apoptosis. As shown in Fig. 5A, silencing Atg7 reduced early cell apoptosis (22% compared to 13%), while the overexpression of Atg7 enhanced early cell apop-tosis (19% compared to 30%). Moreover, the Atg7 overex-pression increased autophagic vacuole formation, whereas the Atg7 suppression decreased autophagic vacuole for-mation (Fig. 5B). The expression of the autophagy-related proteins was further evaluated and it was found that Atg7 overexpression increased the expression of LC3B II/I and Beclin 1, whereas the level of p62 was decreased (Fig. 5C). Furthermore, the suppression of Atg7 by siRNA inhib-ited LC3B II/I and Beclin 1 but increased p62 expression (Fig. 5C). These results suggest that Atg7 mediates both, Ang-II-induced cell apoptosis and autophagy.
Fig. 2. The expression of Atg7 is induced in patients with abdominal aortic aneurysm (AAA) and in an AAA mouse model. A. Clinical samples from patients (n = 3) and controls (n = 3) were collected and lysed for western blot assays. The GAPDH was used as a loading control. Image J software was used to determine relative protein expression. **p < 0.01 compared to the control group. Results were statistically analyzed using an unpaired Student’s t-test; B. Mice were infused with Ang-II (1.44 mg/kg/day) by implanting micro-osmotic pumps (AAA group) or infused with Ang-II and fed water containing metformin (AAA + metformin (Met) group). The aneurysmal wall tissues were collected and lysed for western blot assays. The GAPDH was used as a loading control. Relative protein expression was evaluated using Image J software. **p < 0.01 compared to the sham group, #p < 0.05, ##p < 0.01 compared to the Ang-II group. Results were statistically analyzed using one-way analysis of variance (ANOVA) followed by Tukey’s post hoc test
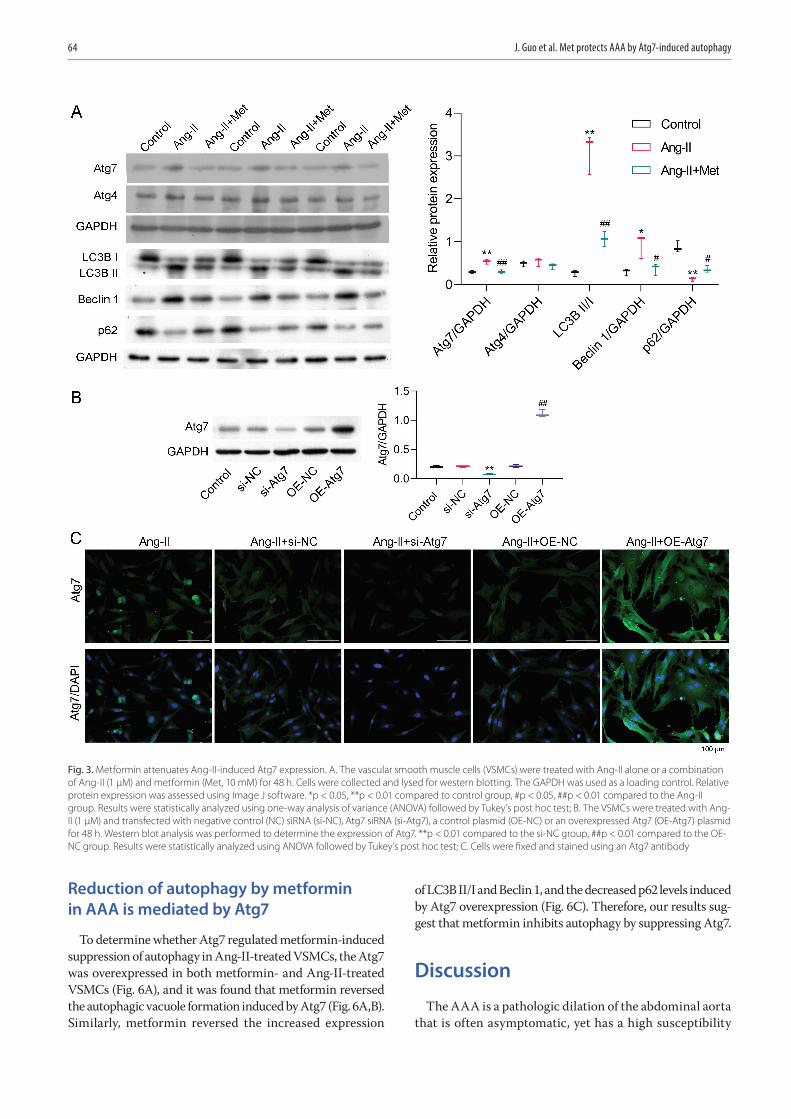
J. Guo et al. Met protects AAA by Atg7-induced autophagy64
Reduction of autophagy by metformin in AAA is mediated by Atg7
To determine whether Atg7 regulated metformin-induced suppression of autophagy in Ang-II-treated VSMCs, the Atg7 was overexpressed in both metformin- and Ang-II-treated VSMCs (Fig. 6A), and it was found that metformin reversed the autophagic vacuole formation induced by Atg7 (Fig. 6A,B). Similarly, metformin reversed the increased expression
of LC3B II/I and Beclin 1, and the decreased p62 levels induced by Atg7 overexpression (Fig. 6C). Therefore, our results sug-gest that metformin inhibits autophagy by suppressing Atg7.
Discussion
The AAA is a pathologic dilation of the abdominal aorta that is often asymptomatic, yet has a high susceptibility
Fig. 3. Metformin attenuates Ang-II-induced Atg7 expression. A. The vascular smooth muscle cells (VSMCs) were treated with Ang-II alone or a combination of Ang-II (1 μM) and metformin (Met, 10 mM) for 48 h. Cells were collected and lysed for western blotting. The GAPDH was used as a loading control. Relative protein expression was assessed using Image J software. *p < 0.05, **p < 0.01 compared to control group, #p < 0.05, ##p < 0.01 compared to the Ang-II group. Results were statistically analyzed using one-way analysis of variance (ANOVA) followed by Tukey’s post hoc test; B. The VSMCs were treated with Ang-II (1 μM) and transfected with negative control (NC) siRNA (si-NC), Atg7 siRNA (si-Atg7), a control plasmid (OE-NC) or an overexpressed Atg7 (OE-Atg7) plasmid for 48 h. Western blot analysis was performed to determine the expression of Atg7. **p < 0.01 compared to the si-NC group, ##p < 0.01 compared to the OE-NC group. Results were statistically analyzed using ANOVA followed by Tukey’s post hoc test; C. Cells were fixed and stained using an Atg7 antibody
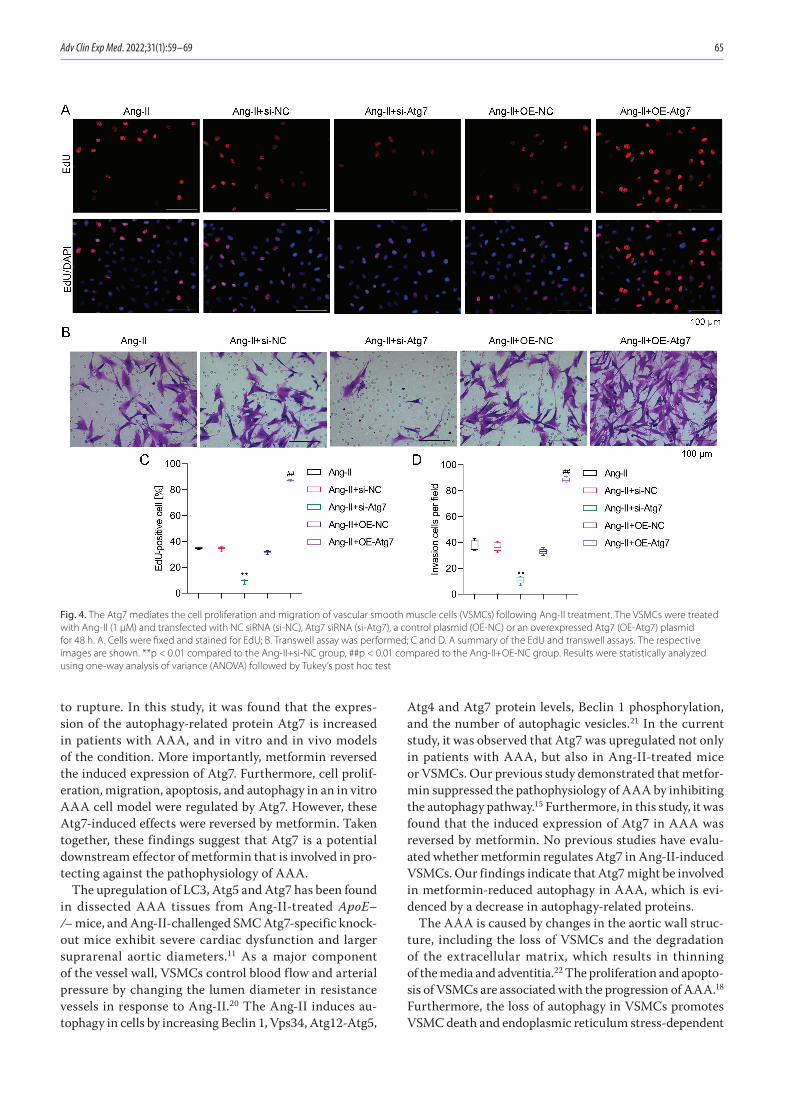
Adv Clin Exp Med. 2022;31(1):59–69 65
to rupture. In this study, it was found that the expres-sion of the autophagy-related protein Atg7 is increased in patients with AAA, and in vitro and in vivo models of the condition. More importantly, metformin reversed the induced expression of Atg7. Furthermore, cell prolif-eration, migration, apoptosis, and autophagy in an in vitro AAA cell model were regulated by Atg7. However, these Atg7-induced effects were reversed by metformin. Taken together, these findings suggest that Atg7 is a potential downstream effector of metformin that is involved in pro-tecting against the pathophysiology of AAA.
The upregulation of LC3, Atg5 and Atg7 has been found in dissected AAA tissues from Ang-II-treated ApoE–/– mice, and Ang-II-challenged SMC Atg7-specific knock-out mice exhibit severe cardiac dysfunction and larger suprarenal aortic diameters.11 As a major component of the vessel wall, VSMCs control blood flow and arterial pressure by changing the lumen diameter in resistance vessels in response to Ang-II.20 The Ang-II induces au-tophagy in cells by increasing Beclin 1, Vps34, Atg12-Atg5,
Atg4 and Atg7 protein levels, Beclin 1 phosphorylation, and the number of autophagic vesicles.21 In the current study, it was observed that Atg7 was upregulated not only in patients with AAA, but also in Ang-II-treated mice or VSMCs. Our previous study demonstrated that metfor-min suppressed the pathophysiology of AAA by inhibiting the autophagy pathway.15 Furthermore, in this study, it was found that the induced expression of Atg7 in AAA was reversed by metformin. No previous studies have evalu-ated whether metformin regulates Atg7 in Ang-II-induced VSMCs. Our findings indicate that Atg7 might be involved in metformin-reduced autophagy in AAA, which is evi-denced by a decrease in autophagy-related proteins.
The AAA is caused by changes in the aortic wall struc-ture, including the loss of VSMCs and the degradation of the extracellular matrix, which results in thinning of the media and adventitia.22 The proliferation and apopto-sis of VSMCs are associated with the progression of AAA.18 Furthermore, the loss of autophagy in VSMCs promotes VSMC death and endoplasmic reticulum stress-dependent
Fig. 4. The Atg7 mediates the cell proliferation and migration of vascular smooth muscle cells (VSMCs) following Ang-II treatment. The VSMCs were treated with Ang-II (1 μM) and transfected with NC siRNA (si-NC), Atg7 siRNA (si-Atg7), a control plasmid (OE-NC) or an overexpressed Atg7 (OE-Atg7) plasmid for 48 h. A. Cells were fixed and stained for EdU; B. Transwell assay was performed; C and D. A summary of the EdU and transwell assays. The respective images are shown. **p < 0.01 compared to the Ang-II+si-NC group, ##p < 0.01 compared to the Ang-II+OE-NC group. Results were statistically analyzed using one-way analysis of variance (ANOVA) followed by Tukey’s post hoc test

J. Guo et al. Met protects AAA by Atg7-induced autophagy66
Fig. 5. Inhibition of Atg7 reduces cell apoptosis and autophagy in Ang-II treated vascular smooth m
uscle cells (VSMCs). The VSM
Cs were treated w
ith Ang-II (1 μM) and transfected w
ith negative control (NC)
siRNA (si-N
C), Atg7 siRNA (si-Atg7), a control plasm
id (OE-N
C), or an overexpressed Atg7 (OE-Atg7) plasm
id for 48 h. A. Annexin V staining. **p <
0.01 compared to the Ang-II+
si-NC group, ##p <
0.01 compared to
the Ang-II+O
E-NC group; B. Transm
ission electron microscopy (TEM
) (the blue arrow indicates autophagic vacuoles); C. W
estern blot with the indicated antibodies. **p <
0.01 compared to the Ang-II+
si-NC group,
##p < 0.01 com
pared to the Ang-II+O
E-NC group. Results w
ere statistically analyzed using one-way analysis of variance (AN
OVA) follow
ed by Tukey’s post hoc test
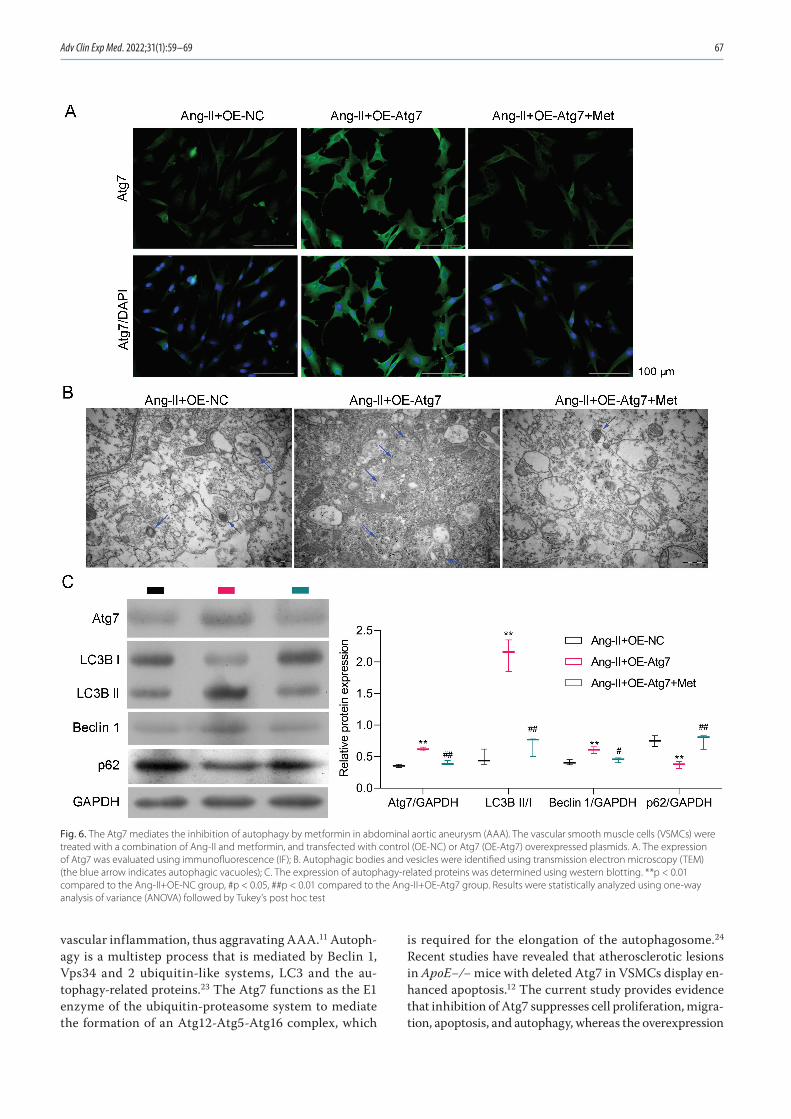
Adv Clin Exp Med. 2022;31(1):59–69 67
vascular inflammation, thus aggravating AAA.11 Autoph-agy is a multistep process that is mediated by Beclin 1, Vps34 and 2 ubiquitin-like systems, LC3 and the au-tophagy-related proteins.23 The Atg7 functions as the E1 enzyme of the ubiquitin-proteasome system to mediate the formation of an Atg12-Atg5-Atg16 complex, which
is required for the elongation of the autophagosome.24 Recent studies have revealed that atherosclerotic lesions in ApoE−/− mice with deleted Atg7 in VSMCs display en-hanced apoptosis.12 The current study provides evidence that inhibition of Atg7 suppresses cell proliferation, migra-tion, apoptosis, and autophagy, whereas the overexpression
Fig. 6. The Atg7 mediates the inhibition of autophagy by metformin in abdominal aortic aneurysm (AAA). The vascular smooth muscle cells (VSMCs) were treated with a combination of Ang-II and metformin, and transfected with control (OE-NC) or Atg7 (OE-Atg7) overexpressed plasmids. A. The expression of Atg7 was evaluated using immunofluorescence (IF); B. Autophagic bodies and vesicles were identified using transmission electron microscopy (TEM) (the blue arrow indicates autophagic vacuoles); C. The expression of autophagy-related proteins was determined using western blotting. **p < 0.01 compared to the Ang-II+OE-NC group, #p < 0.05, ##p < 0.01 compared to the Ang-II+OE-Atg7 group. Results were statistically analyzed using one-way analysis of variance (ANOVA) followed by Tukey’s post hoc test

J. Guo et al. Met protects AAA by Atg7-induced autophagy68
of Atg7 increases cell proliferation, migration, apoptosis, and autophagy. Therefore, Atg7 is an important regula-tor of proliferation, migration, apoptosis, and autophagy in Ang-II-treated VSMCs.
Metformin is a well-known drug that affects both metabo-lism and the inflammatory response, which makes it a po-tential therapeutic drug for several cardiovascular diseases.25 Multiple studies have found that metformin significantly slows the growth of AAA13,14,26 and inhibits cell growth and proliferation, leading to cell apoptosis.27 Furthermore, met-formin administration may be associated with a lower risk of AAA.28 Recently, we demonstrated that metformin pro-tects against Ang-II-induced AAA by activating the PI3K/AKT/mTOR/autophagy pathway.15 However, the molecular mechanisms involved in these effects remained unclear. In this study, using an in vitro AAA model, it was shown that metformin reverses autophagy induced by Atg7, suggesting that metformin reduces autophagy by suppressing Atg7.
Limitations
A relatively low number of clinical samples were exam-ined in the current study. Clinical samples continue to be collected and will be examined for further verification. In addition, we plan to identify the molecular mecha-nisms of Atg7-induced autophagy in in vivo rat models and in clinical samples in future studies.
Conclusions
In this study, it was found that Ang-II induced the ex-pression of Atg7 and that metformin reversed this effect. The expression of Atg7 regulated cell proliferation, mi-gration, apoptosis, and autophagy. Furthermore, Atg7 mediated the expression of autophagy-related proteins in Ang-II treated VSMCs. It was also found that metformin inhibited Atg7-induced autophagy. In conclusion, the cur-rent results revealed that the suppression of autophagy in AAA by metformin was mediated by an Atg7 central autophagy regulator. This suggests that Atg7 is a potential downstream effector of metformin in protecting against the pathophysiology of AAA.
Metformin reduces autophagy in AAA and Atg7 me-diates this effect. These findings suggest that Atg7 acts as a downstream effector of metformin in suppressing the pathophysiology of AAA (Fig. 7).
ORCID iDsJingjing Guo https://orcid.org/0000-0003-2412-8546Zhu Wang https://orcid.org/0000-0002-1753-5015Ming Xue https://orcid.org/0000-0001-6389-9314Lei Mi https://orcid.org/0000-0001-9072-3154Mengpeng Zhao https://orcid.org/0000-0001-5355-4806Chao Ma https://orcid.org/0000-0002-1602-0327Jian Wu https://orcid.org/0000-0002-2819-4498Xinqiang Han https://orcid.org/0000-0002-6224-6554
References1. Davis FM, Rateri DL, Daugherty A. Abdominal aortic aneurysm: Novel
mechanisms and therapies. Curr Opin Cardiol. 2015;30(6):566–573. doi:10.1097/HCO.0000000000000216
2. Anjum A, Powell JT. Is the incidence of abdominal aortic aneurysm declining in the 21st century? Mortality and hospital admissions for England & Wales and Scotland. Eur J Vasc Endovasc Surg. 2012;43(2): 161–166. doi:10.1016/j.ejvs.2011.11.014
3. Sidloff D, Stather P, Dattani N, et al. Aneurysm global epidemiology study: Public health measures can further reduce abdominal aortic aneurysm mortality. Circulation. 2014;129(7):747–753. doi:10.1161/ CIRCULATIONAHA.113.005457
4. Rowe VL, Stevens SL, Reddick TT, et al. Vascular smooth muscle cell apoptosis in aneurysmal, occlusive, and normal human aortas. J Vasc Surg. 2000;31(3):567–576. PMID:10709071
5. Riches K, Angelini TG, Mudhar GS, et al. Exploring smooth muscle phenotype and function in a bioreactor model of abdominal aortic aneurysm. J Transl Med. 2013;11:208. doi:10.1186/1479-5876-11-208
6. Mandhair HK, Arambasic M, Novak U, Radpour R. Molecular modula-tion of autophagy: New venture to target resistant cancer stem cells. World J Stem Cells. 2020;12(5):303–322. doi:10.4252/wjsc.v12.i5.303
7. Choi AM, Ryter SW, Levine B. Autophagy in human health and dis-ease. N Engl J Med. 2013;368(7):651–662. doi:10.1056/NEJMra1205406
8. Shimizu S. Biological roles of alternative autophagy. Mol Cells. 2018; 41(1):50–54. doi:10.14348/molcells.2018.2215
9. Grootaert MO, da Costa Martins PA, Bitsch N, et al. Defective autoph-agy in vascular smooth muscle cells accelerates senescence and pro-motes neointima formation and atherogenesis. Autophagy. 2015; 11(11):2014–2032. doi:10.1080/15548627.2015.1096485
10. Osonoi Y, Mita T, Azuma K, et al. Defective autophagy in vascu-lar smooth muscle cells enhances cell death and atherosclerosis. Autophagy. 2018;14(11):1991–2006. doi:10.1080/15548627.2018.1501132
11. Ramadan A, Singh KK, Quan A, et al. Loss of vascular smooth muscle cell autophagy exacerbates angiotensin II-associated aortic remod-eling. J Vasc Surg. 2018;68(3):859–871. doi:10.1016/j.jvs.2017.08.086
12. Nahapetyan H, Moulis M, Grousset E, et al. Altered mitochondrial quality control in Atg7-deficient VSMCs promotes enhanced apop-tosis and is linked to unstable atherosclerotic plaque phenotype. Cell Death Dis. 2019;10(2):119. doi:10.1038/s41419-019-1400-0
13. Fujimura N, Xiong J, Kettler EB, et al. Metformin treatment status and abdominal aortic aneurysm disease progression. J Vasc Surg. 2016;64(1):46–54.e8. doi:10.1016/j.jvs.2016.02.020
14. Itoga NK, Rothenberg KA, Suarez P, et al. Metformin prescription sta-tus and abdominal aortic aneurysm disease progression in the U.S. veteran population. J Vasc Surg. 2019;69(3):710–716.e3. doi:10.1016/j.jvs.2018.06.194
15. Wang Z, Guo J, Han X, et al. Metformin represses the pathophysiology of AAA by suppressing the activation of PI3K/AKT/mTOR/autophagy pathway in ApoE(–/–) mice. Cell Biosci. 2019;9:68. doi:10.1186/s13578-019-0332-9
16. Salmon M, Spinosa M, Zehner ZE, Upchurch GR, Ailawadi G. Klf4, Klf2, and Zfp148 activate autophagy-related genes in smooth muscle cells during aortic aneurysm formation. Physiol Rep. 2019;7(8):e14058. doi:10.14814/phy2.14058
Fig. 7. Schematic diagram of the suppression of Atg7-induced cell proliferation, cell migration, cell apoptosis, and autophagy by metformin in an in vitro abdominal aortic aneurysm (AAA) model

Adv Clin Exp Med. 2022;31(1):59–69 69
17. Quintana RA, Taylor WR. Cellular mechanisms of aortic aneurysm formation. Circ Res. 2019;124(4):607–618. doi:10.1161/CIRCRESAHA. 118.313187
18. Clement M, Chappell J, Raffort J, et al. Vascular smooth muscle cell plasticity and autophagy in dissecting aortic aneurysms. Arterioscler Thromb Vasc Biol. 2019;39(6):1149–1159. doi:10.1161/ATVBAHA.118. 311727
19. Wang M, Li W, Chang GQ, et al. MicroRNA-21 regulates vascular smooth muscle cell function via targeting tropomyosin 1 in arterio-sclerosis obliterans of lower extremities. Arterioscler Thromb Vasc Biol. 2011;31(9):2044–2053. doi:10.1161/ATVBAHA.111.229559
20. Gomez D, Owens GK. Smooth muscle cell phenotypic switching in atherosclerosis. Cardiovasc Res. 2012;95(2):156–164. doi:10.1093/cvr/cvs115
21. Mondaca-Ruff D, Riquelme JA, Quiroga C, et al. Angiotensin II-regu-lated autophagy is required for vascular smooth muscle cell hyper-trophy. Front Pharmacol. 2019;9:1553. doi:10.3389/fphar.2018.01553
22. Sakalihasan N, Michel JB, Katsargyris A, et al. Abdominal aortic aneu-rysms. Nat Rev Dis Primers. 2018;4(1):34. doi:10.1038/s41572-018-0030-7
23. Yin Z, Pascual C, Klionsky DJ. Autophagy: Machinery and regulation. Microb Cell. 2016;3(12):588–596. doi:10.15698/mic2016.12.546
24. Mizushima N, Noda T, Yoshimori T, et al. A protein conjugation sys-tem essential for autophagy. Nature. 1998;395(6700):395–398. doi:10. 1038/26506
25. Rena G, Lang CC. Repurposing metformin for cardiovascular dis-ease. Circulation. 2018;137(5):422–424. doi:10.1161/CIRCULATIONAHA. 117.031735
26. Golledge J, Moxon J, Pinchbeck J, et al. Association between metfor-min prescription and growth rates of abdominal aortic aneurysms. Br J Surg. 2017;104(11):1486–1493. doi:10.1002/bjs.10587
27. Ben Sahra I, Regazzetti C, Robert G, et al. Metformin, independent of AMPK, induces mTOR inhibition and cell-cycle arrest through REDD1. Cancer Res. 2011;71(13):4366–4372. doi:10.1158/0008-5472.CAN-10-1769
28. Yu X, Jiang D, Wang J, et al. Metformin prescription and aortic aneu-rysm: Systematic review and meta-analysis. Heart. 2019;105(17):1351–1357. doi:10.1136/heartjnl-2018-314639


Cite asÇopur Çiçek A, Şemen V, Aydoğan Ejder N, et al. Molecular epidemiological analysis of integron gene cassettes and tetA/tetB/tetD gene associations in Escherichia coli strains producing extended-spectrum β-lactamase (ESBL) in urine cultures. Adv Clin Exp Med. 2022;31(1):71–79. doi:10.17219/acem/142333
DOI10.17219/acem/142333
CopyrightCopyright by Author(s) This is an article distributed under the terms of theCreative Commons Attribution 3.0 Unported (CC BY 3.0)(https://creativecommons.org/licenses/by/3.0/)
Address for correspondenceAyşegül Çopur ÇiçekE-mail: [email protected]
Funding sourcesNone declared
Conflict of interestNone declared
AcknowledgementsWe thank Prof. Dr. Barış Otlu for his contribution to dendrogram analyses.
Received on May 10, 2021Reviewed on August 10, 2021Accepted on September 16, 2021
Published online on October 27, 2021
AbstractBackground. Epidemiological studies of tetracycline (TE) resistance genes and integron gene cassettes, particularly in urine samples, are limited in Turkey.
Objectives. To investigate antibiotic susceptibility profiles, extended-spectrum beta-lactamase (ESBL) positivity, tet gene types, class-I/-II integron gene cassettes, and clonal relationships among tet-resistant isolates of Escherichia coli from urine cultures of outpatients.
Materials and methods. Isolates were identified using conventional methods and the automated Vitek® 2 Compact system. Antimicrobial susceptibility was performed for 19 antibiotics. The ESBL production was performed using the Kirby–Bauer disk diffusion test. The double disk synergy test was used for confirmatory testing. Polymerase chain reaction (PCR) was used to determine the presence of class-I/-II integron gene cassettes and tetA, tetB and tetD resistance genes. The pulsed-field gel electrophoresis typing was performed to identify clonal relations.
Results. A total of 121 isolates were obtained and found to be resistant or sensitive to ampicillin and amikacin/imipenem. Resistance to ceftazidime, cefotaxime and ceftriaxone was determined to be 31.3%, 77.6% and 83.1%, respectively. Tetracycline resistance was detected in 82 isolates, mostly caused by the tetB gene. No tet gene was detected in the remaining 39 isolates. Although 64 out of 82 isolates carried a class-I integron, only 4 had a class-II integron (with sizes of 800–2900 base pairs). Furthermore, tet genes were identified with different size class-I integron gene cassettes. However, tet genes were not detected in any isolate identified with integron gene cassette II. Clonally, the isolates were found to be related in subgroups because they were community-acquired.
Conclusions. This study showed that the tetB gene is most commonly found in E. coli isolates grown in urine samples from the Turkish population.
Key words: E. coli, PFGE, tetracycline resistance, ESBL, integron gene cassettes
Original papers
Molecular epidemiological analysis of integron gene cassettes and tetA/tetB/tetD gene associations in Escherichia coli strains producing extended-spectrum β-lactamase (ESBL) in urine cultures
Ayşegül Çopur Çiçek1,A,B,D,F, Vicdan Şemen2,B,C, Nebahat Aydoğan Ejder1,C, Deniz Zehra Ulusan Gündoğdu4,B,D,E, Sema Koçyiğit Kalcan3,A,D,E, Fatma Tufan Köse4,B,C, Osman Birol Özgümüş1,D,E
1 Department of Medical Microbiology, Faculty of Medicine, Recep Tayyip Erdoğan University, Rize, Turkey2 Microbiology Laboratory, Sakarya Yenikent State Hospital, Turkey3 Laboratory of Microbiology, Rize State Hospital, Turkey4 Department of Microbiology, Rize Education and Research Hospital, Turkey
A – research concept and design; B – collection and/or assembly of data; C – data analysis and interpretation; D – writing the article; E – critical revision of the article; F – final approval of the article
Advances in Clinical and Experimental Medicine, ISSN 1899–5276 (print), ISSN 2451–2680 (online) Adv Clin Exp Med. 2022;31(1):71–79

A. Çopur Çiçek et al. Integrons/tet genes in ESBL(+) E. coli strains72
Background
Urinary tract infections (UTIs) are usually caused by Gram-negative Enterobacterales, with the most com-mon pathogens being Escherichia coli and Klebsiella pneumonia spp.1,2 Antimicrobial resistance is increasing among uropathogens and the production of β-lactamases is a major resistance mechanism.3
Tetracyclines inhibit protein synthesis by binding to the bacterial ribosome. At present, the prevalence of tetracycline (TE) resistance is increasing in bacteria isolated from both, human patients4,5 and animals.6 Re-sistance is widely disseminated in E. coli through TE re-sistance genes, such as tetA.7 A previous study found that the prevalence of TE resistance in E. coli isolates from humans increased by 0.45% per year from 1950 to 2001.5 Because of the spread of TE resistance, the use of tetra-cyclines in humans has gradually decreased. However, tetracyclines remain among the most used antibiotics in livestock production worldwide.8
Different TE resistance determinants have been dem-onstrated. They have been classified as A–E classes, being the most frequently detected genes among the Enterobac-terales family.9 Tetracycline resistance genes (tet genes) are divided into 11 classes that comprise more than 40 genes.10–12 Studies from the USA have shown that tetA is the 2nd most frequent TE resistance efflux pump in both, human and animal isolates.13 In Denmark, tetA is also the most common TE efflux pump type found in clinical isolates of E. coli.14
Integrons are genetic elements that encode antibiotic resistance determinants and have the ability to integrate or transport certain genes. They can also be transferred from one bacterium to another, as they are carried by plas-mids or transposons. This causes a strong antibiotic se-lective pressure resulting from the transfer and spread of antibiotic resistance elements.15,16
The rapid spread of TE resistance among bacteria is due to the localization of tet genes on movable genetic struc-tures such as plasmids, transposons and integrons. How-ever, there are scarcely any studies showing the relation-ships between the main tet genes and integrons.
Objectives
The present study aimed to screen the tetA, B and D genes together with class 1 and 2 integron gene cas-settes from 121 extended-spectrum β-lactamase (ESBL)-positive E. coli isolates, obtained from the urine cultures of adults. Additional aims were to determine the molecular sizes and classes of the detected integrons and the clonal relationship with pulsed-field gel electrophoresis (PFGE)among the TE resistance isolates. Studying integron gene cassettes and related resistance phenotypes will provide
important information about the mechanisms of the ac-quisition of multiple antibiotic resistance genes in clinical isolates, which then can be used to effectively guide clinical treatment.
Materials and methods
Ethical approval
The study protocol was approved by the Faculty of Medi-cine Non-invasive Studies Ethics Committee, Recep Tayyip Erdoğan University, Turkey (approval No. 40465587-050.01.04-14 and No. 2021/13), and the Rize Provincial Health Directorate (Ref. No. 64247179-799).
Sample collection and bacterial isolation/identification
Escherichia coli isolates were obtained from urine samples collected at 7 different clinics (infectious dis-eases, urology, internal medicine, emergency service, nephrology, neurology, and gynecology) between June 2017 and June 2018. All urine samples were obtained from outpatient adults aged 18–83 years. Since TE is not used in pediatric patients, the pediatric age group was not included in this study. The clinical data of the patients were retrospectively obtained from medical records and medical tables.
Samples were sent to a microbiology laboratory (Rize State Hospital, Rize, Turkey) for analysis. Clinical speci-mens were plated on eosin methylene blue (EMB)/Mac-Conkey agar for isolation. The isolates were identified using conventional methods and the automated Vitek® 2 Compact system (BioMérieux, Marcy-l’Étoile, France).
Antimicrobial susceptibility testing
Antimicrobial susceptibility experiments were performed in accordance with the Clinical and Laboratory Standards Institute (CLSI) criteria17 using both the Kirby–Bauer disk diffusion method and the automated Vitek® 2 Compact system (BioMérieux). Sensitivity to the following antibi-otics was tested: ampicillin (AMP), ampicillin/sulbactam (AMP/SAM), amoxicillin/clavulanic acid (AMC), cefazo-lin (KZ), cefotaxime (CTX), cefuroxime (CXM), cefixime (CFM), ceftriaxone (CRO), ceftazidime (CAZ), amikacin (AK), gentamicin (CN), tobramycin (TOB), ciprofloxacin (CIP), norfloxacin (NOR), imipenem (IPM), aztreonam (ATM), nitrofurantoin (F), trimethoprim/sulfamethoxa-zole (TMP/SXT), and tetracycline (TE). The E. coli ATCC 25922 (American Type Cell Culture (ATCC), Manassas, USA) was used as the quality control strain.18 Categori-cal variables are expressed in terms of frequency (n) and percentage (%).

Adv Clin Exp Med. 2022;31(1):71–79 73
Screening of extended-spectrum β-lactamase production
All isolates were screened for extended-spectrum β-lactamase (ESBL) production with the Kirby–Bauer disk diffusion test using 3 indicator cephalosporins, namely ceftazidime (30 µg), cefotaxime (30 µg), and ceftriaxone (30 µg). The test was performed by inocula-tion on a Mueller–Hinton agar plate (Merck, Darmstadt, Germany) with a sample of the tested strain. The isolates were considered to be resistant if the diameter of the in-hibition zone for ceftazidime, cefotaxime or ceftriaxone was ≤22 mm, ≤27 mm or ≤25 mm, respectively, after 18-h incubation at 37°C.18,19
Confirmation of ESBL–producing isolates
All E. coli isolates showing resistance to any of the 3 ceph-alosporins were then subjected to confirmatory testing using the double disk synergy test (DDST), according to the 2019 CLSI guidelines.18 Ceftazidime (30 µg), ce-fotaxime (30 µg), ceftriaxone (30 µg), and amoxicillin-clavulanic acid (20/10 µg) were used for ESBL detection. Amoxicillin/clavulanic acid and cephalosporin disks were placed at a distance of 20 mm from the center on lawn cultures on Muller–Hinton agar plates. The plates were in-cubated at 37°C overnight for 24 h. The zone of inhibition of cephalosporins towards the amoxicillin/clavulanic acid disk was considered to be a positive result and the isolates were interpreted as ESBL producers. Escherichia coli ATCC 25922 was used as the control.18–20
Detection of integron gene cassettes and tet genes
The presence of integron gene cassettes and tet genes was investigated with polymerase chain reaction (PCR) method (Table 1). To obtain template DNA, single colony bacterial strains were inoculated in 3 mL of Luria–Bertani (LB) broth medium (1% tryptone, 0.5% yeast extract, 0.5% NaCl, pH 7.4) at 37°C for 16 h at 200 rpm. Next, 1.5 mL
of the grown culture was used to obtain total genomic DNA using the boiling method. For PCR testing, 3 µL of the su-pernatant was used as the template DNA. The PCR was performed using the compositions and cycling parameters detailed in Table 1. The amplification products were then run in 1.2% agarose gel with a 100 base pair (bp) molecular marker (Thermo Fisher Scientific, Waltham, USA) and vi-sualized with UV light. The oligonucleotides used in PCR testing are listed in Table 1.
Molecular typing of tetA-, tetB-, and tetD-positive isolates
The PFGE typing was performed to identify the clonal re-lations among 46 isolates coding tetA, tetB and tetD. Isola-tion and deproteinization of genomic DNA were performed following a previously reported protocol with minor mod-ifications.25 Briefly, E. coli colonies on Mueller–Hinton agar were suspended in 1 mL of cell suspension solution (CSS) (100 mL of Tris-HCl, 100 mL of ethylenediaminetet-raacetic acid (EDTA) pH 8.0) and optical density (OD) was adjusted to 0.8 (590 nm). The cells were embedded in low (2%) melting agarose. Molds were prepared with the help of agarose and refrigerated at 4°C for 10 min. The prepared strain molds were mixed with cell lysis solution-1 (CLS-1) (50 mm Tris-HCl, 50 mm EDTA, pH 8.0, 2.5 mg/mL lyso-zyme, 1.5 mg/mL proteinase K) and incubated at 37°C for 1 h in a water bath. At the end of the period, CLS-1 was removed. The cell lysis solution-2 (CLS-2; 0.5 M EDTA, 1% sarcosyl, 400 µg/mL proteinase K) was placed on molds and incubated in a water bath at 55°C for 2 h. After the ly-sis step, the molds were washed 3 times, each with dH2O and 1 × TE (Tris-EDTA). After digestion of the cells and washing of the plugs, genomic DNA in the agarose plugs was restricted with 10 U of Xbal (Thermo Fisher Scien-tific) for 3 h at 37°C in an incubator. The DNA fragments were separated on 1% pulse-field certified agarose (Bio-Rad Laboratories, Nazareth, Belgium) gels run in 0.5 × Tris-borate-EDTA buffer (44.5 mM/L Tris, 44.5 mM/L boric acid, 1 mM/L EDTA (pH 8.0)) using a CHEF-DR II system (Bio-Rad Laboratories). The electrophoresis conditions
Table 1. Primers used in the amplification of tet genes and integron gene cassettes
Primer name Target gene Primer sequence (5’→3’) Amplicon size [bp]
tet(A)-1tetA
5’-GTAATTCTGAGCACTGTCGC-3’91721
tet(A)-2 5’-CTGCCTGGACAACATTGCTT-3’
tet(B)-1tetB
5’-CTCAGTATTCCAAGCCTTTG-3’39621
tet(B)-2 5’-ACTCCCCTGAGCTTGAGGGG-3’
tet(D)-1tetD
5’-AAACCATTACGGCATTCTGC-3’78722
tet(D)-2 5’-GACCGGATACACCATCCATC-3’
5’-CSclass-I integron
5’-GGCATCCAAGCAGCAAG-3’variable23
3’-CS 5’-AAGCAGACTTGACCTGA-3’
hep51class-II integron
5’-GATGCCATCGCAAGTACGAG-3’variable24
hep74 5’-CGGGATCCCGGACGGATGCACGATTTGTA-3’

A. Çopur Çiçek et al. Integrons/tet genes in ESBL(+) E. coli strains74
were 14°C at 6 V/cm2 for 18 h. The initial and final switch times were 5 s and 20 s, respectively. The gel was stained with ethidium bromide (5 mg/mL) for 30 min and pho-tographed under ultraviolet (UV) light. The DNA band profiles were analyzed using GelCompar software v. 3.0 (Applied Maths, Sint-Martens-Latem, Belgium). According to the interpretative criteria of Tenover et al., the clinical isolates were aligned according to the PFGE profiles, with profiles sharing 100% similarity grouped in clusters.26
Results
A total of 121 ESBL-positive E. coli isolates were ob-tained from the outpatients’ urine samples. These strains were biochemically characterized using an automated system, and subjected to antibiotic susceptibility testing, ESBL screening and phenotype confirmation tests. All isolates were tested for susceptibility to 19 antimicrobials. The frequency of resistance to each of the tested antibiotics is shown in Table 2.
Antibiograms showed that 121 (100%) isolates were resis-tant and sensitive to ampicillin and amikacin/imipenem, respectively. Although there was 100% resistance to am-picillin, ampicillin/sulbactam resistance was found to be 33.8%. This showed the rate of resistance against inhibitors in the isolates. Similarly, for the amoxicillin/clavulanic acid combination, the rate of resistance to the inhibitor was 12.2%. In the ESBL screening test, resistance to ceftazidime,
cefotaxime and ceftriaxone was determined to be 31.3%, 77.6% and 83.1%, respectively. All ESBL-producing strains were determined to be susceptible to amikacin and imi-penem. This result is important in terms of showing that there is no resistance to these antibiotics in outpatients. After amikacin and imipenem, the highest sensitivity was observed for nitrofurantoin. Tetracycline resistance was determined in 82 isolates (67.7%).
Among ESBL-producing E. coli isolates, those with TE resistance were selected and the presence of tet genes responsible for resistance and class-I/-II gene cassettes responsible for transferable resistance was investigated (Table 3). Among these samples (n = 46), tetA, tetD and tetB, which are responsible for TE resistance, were de-tected in 12, 4 and 30 isolates, respectively. This result showed that TE resistance in clinical E. coli samples was mostly caused by the tetB resistance gene. No tet genes were detected in the remaining 36 isolates. The integron gene cassettes were isolated in a total of 68 samples (class-I integron: n = 64; class-II integron: n = 4). The largest in-tegron gene cassette was determined as approx. 2900 bp, while the smallest integron gene cassette was determined as 800 bp. The average integron gene cassette size was around 1600 bp. The tet genes were identified together with different size class-I gene cassettes. However, the same was not true for the integron class-II gene cassettes: they were detected in 4 samples, but none of the tetA, tetB and tetD genes were detected. This result showed that TE resistance developed in isolates carrying class-II gene cassettes by a mechanism different from these 3 genes. The dendrogram was basically divided into 2 different clades. One clade consisted of 1 tetD-positive and 12 tetB-positive isolates. In the other clade, tetA, tetB and tetD were located together in different arms (Fig. 1).
Discussion
Escherichia coli isolates are present in normal hu-man fecal flora, and some strains are the most common cause of UTIs. Antimicrobial therapy is very important in the treatment of UTIs. However, the drug resistance generated specifically by ESBL-producing microorganisms results in failure in the treatment of UTIs. In the present study, ESBL production was observed to be high in E. coli isolates obtained from outpatients with symptomatic UTI and 121 of them exhibited resistance to at least 1 of the 3 in-dicator cephalosporins and identified as ESBL producers. Furthermore, 82 of the ESBL-positive isolates were TE-re-sistant and tet genes (A, B and D types) were determined in 46 of these isolates. These 3 tet genes are associated with TE efflux in Gram-negative bacilli and have been previ-ously detected in TE-resistant E. coli isolates.27 In addition, in UTIs, the tetD gene was present at the lowest rate while the tetB gene was present at the highest rate; notably, they did not occur together in any strain. We failed to detect
Table 2. Antimicrobial susceptibility ratio (%) of clinical Escherichia coli isolates (n = 121)
Antibiotic R I S
Ampicillin 100 0 0
Ampicillin/sulbactam 33.8 27.7 38.5
Amoxicillin/clavulanic acid 12.2 59.2 28.6
Cefazolin 87.7 1.5 10.8
Cefotaxime 77.6 0 22.4
Cefuroxime 87.5 0 12.5
Cefixim 87.5 6.3 6.3
Ceftriaxone 83.1 0 16.9
Ceftazidime 31.3 18.8 50
Amikacin 0 0 100
Gentamicin 44.6 0 55.4
Tobramycin 46.9 10.2 42.9
Ciprofloxacin 56.9 0 43.1
Imipenem 0 0 100
Norfloxacin 56.9 0 43.1
Aztreonam 61.5 6.2 32.3
Nitrofurantoin 7.7 4.6 87.7
Trimethoprim/sulfamethoxazole 70.8 0 29.2
Tetracycline 67.7 0 32.3
R – resistant; I – medium sensitive; S – sensitive.

Adv Clin Exp Med. 2022;31(1):71–79 75
Table 3. Antimicrobial resistance patterns and integron gene cassettes of tetracycline-positive Escherichia coli clinical isolates (n = 82)
Strain No. Unit R type Integron
[~bp] tet type
1 NP CRO, CXM, CFM, KZ, SAM, AMP, SXT 900 A
2 NR CRO, CXM, CFM, KZ, CIP, NOR, AMP, SXT 1600 A
3 NG CRO, CXM, CFM, KZ, CIP, NOR, AMP, SXT 1600 A
4 IM CRO, CXM, CFM, KZ, CIP, SAM, NOR, AMP, SXT 1600 –
5 UC CRO, CXM, CFM, KZ, CN, CIP, NOR, AMP, SXT 1700 –
6 NG CXM, CN, CIP, SAM, NOR, AMP 1700 B
7 NG AMP 800 A
8 IM CXM, AMP 800 B
9 UC CXM, KZ, CIP, NOR, AMP, SXT 1700 A
10 IM ATM, CRO, CXM, CFM, KZ, CN, CIP, SAM, NOR, AMP, SXT 1700 A
11 IDS ATM, CTX, CRO, AMP, SXT 2100 B
12 UC CN, CIP, NOR, AMP, SXT 1800 –
13 NG ATM, CXM, CFM, KZ, CIP, SAM, NOR, AMP, SXT 2900 A
14 NG ATM, CTX, CRO, SAM, AMP, SXT 1200 –
15 UC ATM, CTX, CRO, CN, SAM, AMP, SXT 1000 –
16 IM CRO, CXM, CN, CIP, NOR, AMP, SXT 800 B
17 NG CIP, SAM, NOR, AMP, SXT 1600 B
18 IM CIP, NOR, AMP, SXT 1600 B
19 IM CRO, CXM, AMP, SXT 1500 B
20 UC CRO, CXM, CFM, KZ, CIP, SAM, NOR, AMP, SXT 1500 A
21 UC ATM, CAZ, CRO, CXM, CFM, KZ, CN, CIP, SAM, NOR, AMP, SXT 1500 –
22 NG CXM, CFM, KZ, CIP, SAM, NOR, AMP, SXT 1500 A
23 NG CTX, CRO, AMC, AMP, SXT 2100 A
25 IM CRO, CXM, CFM, KZ, CIP, NOR, AMP, SXT 1600 D
26 IM CTX, CRO, AMC, AMP 1200 –
27 IM CRO, CXM, AMP, SXT 900 –
28 IM CN, CIP, NOR, AMP, SXT 1600 A
29 IM ATM, CRO, CXM, CFM, KZ, CN, CIP, NOR, AMP, SXT 1600 A
30 UC CTX, CRO, AMC, SAM, AMP, SXT 1600 –
30 ES ATM, CRO, CXM, CFM, KZ, CIP, SAM, NOR, AMP, SXT 1600 B
31 UC ATM, CAZ, CRO, CXM, CFM, KZ, CN, CIP, SAM, NOR, AMP, SXT 1600 –
32 IM ATM, CAZ, CRO, CXM, CFM, KZ, CN, CIP, SAM, NOR, SXT, AMP 1600 B
33 ES ATM, CAZ, CRO, CXM, CFM, KZ, CN, CIP, SAM, NOR, SXT, AMP 1600 B
34 UC ATM, CAZ, CRO, CXM, CFM, KZ, CIP, SAM, NOR, AMP, SXT 1100 B
35 UC ATM, CAZ, CRO, KZ, CIP, SAM, NOR, AMP 1500 B
36 UC ATM, CAZ, CRO, CXM, KZ, CN, SAM, AMP, SXT 1600 B
37 IM ATM, CAZ, CRO, CXM, CFM, KZ, CN, SAM, AMP, SXT 1600 B
38 IDS CTX, CRO, AMC, KZ, SAM, AMP, SXT 1600 B
39 IDS KZ, CIP, SAM, NOR, AMP, SXT 1600 –
40 ES CTX, CRO, AMC, ATM, CAZ, AMP 1000 –
41 UC CTX, CRO, AMC, KZ, SAM, AMP 1000 D
42 UC AMP, SXT 2200 –
43 IDS CTX, CRO, AMC, AMP, SXT 2000 –
44 IM ATM, CTX, CRO, AMP, SXT 2200 –
45 IM CRO, CXM, AMP, SXT 1000 –
46 IM ATM, CTX, CRO,AMP, SXT 1000 –
47 IDS CTX, CRO, AMC, AMP, SXT 1600 –

A. Çopur Çiçek et al. Integrons/tet genes in ESBL(+) E. coli strains76
the tet gene in the remaining 39 TE-resistant isolates. How-ever, these isolates may have harbored another resistance mechanism, i.e., different tet genes besides tetA, tetB and tetD, or enzymatic alteration or ribosomal protection.28 Ribosomal protection has been demonstrated as another mechanism of resistance to TE in the Enterobacterales family that is mediated by different tet genes.29 Both tetA
and tetB genes encode efflux mechanisms to confer resis-tance to tetracyclines, and have been previously identified as the most common TE resistance genes in E. coli of both, human and animal origin.30 It has also been reported that tetB provides additional resistance against doxycycline, in contrast to tetA which confers resistance against TE, oxytetracycline and chlortetracycline.9
Strain No. Unit R type Integron
[~bp] tet type
48 NG CIP, SAM, NOR, AMP 2000 B
49 IDS ATM, CAZ, CRO, CXM, CFM, KZ, CN, CIP, SAM, NOR, AMP, SXT 1600 –
50 IM CRO, CXM, CFM, KZ, SAM, AMP, SXT 2200 D
51 NG ATM, CRO, CXM, CFM, KZ, AMP, SXT 1600 –
52 NG CN, CIP, SAM, NOR, AMP, SXT 2000 B
53 IDS ATM, CTX, CRO, AMP, SXT 1800 B
54 NG ATM, CAZ, CRO, CXM, CFM, KZ, CN, CIP, SAM, NOR, AMP, SXT 1800 –
55 NG ATM, CAZ, CRO, CXM, CFM, KZ, CN, CIP, NOR, AMP, SXT 1900 B
56 IM ATM, CAZ, CRO, CXM, CFM, KZ, CN, CIP, SAM, NOR, AMP, SXT 1800 B
57 NP ATM, CAZ, AMP 1800 B
58 NP ATM, CAZ, CRO, CN, AMP, SXT 1800 –
59 IDS ATM, CAZ, CRO, CXM, CFM, KZ, CN, CIP, SAM, NOR, AMP, SXT 1800 –
60 UC CTX, CRO, AMC, CN, AMP, SXT 1600 B
61 IM CN, CIP, NOR, AMP, SXT 1600 –
62 UC CRO, CXM, CFM, KZ, CIP, SAM, NOR, AMP, SXT 2000 –
63 IM CRO, CXM, CFM, KZ, SAM, AMP, SXT 2200 D
64 UC ATM, CAZ, CRO, CXM, CFM, KZ, CN, CIP, SAM, NOR, AMP, SXT 1800 –
65 IM ATM, CAZ, CRO, CXM, CFM, KZ, CN, CIP, NOR, AMP, SXT, 1800 B
66 NP ATM, CAZ, CRO, CXM, CFM, KZ, CN, CIP, SAM, NOR, AMP, SXT 1900 B
67 NP AMP, SXT 1900 B
68 IDS ATM, CAZ, CN, AMP, SXT 2000p B
69 NG AMP, SXT – B
70 IDS KZ, CIP, SAM, NOR, F, AMP, SXT – –
71 NG ATM, CRO, CXM, CFM, KZ, CN, CIP, NOR, F, AMP, SXT – B
72 NG AMP, SXT – B
73 IM ATM, CAZ, AMP, SXT – –
74 UC ATM, CAZ, AMP, SXT – –
75 IM CIP, NOR, AMP – B
76 ES ATM, CRO, CXM, CFM, KZ, CN, CIP, NOR, AMP, SXT – –
77 IM CIP, NOR, AMP, SXT – –
78 UC KZ, SAM, AMP – –
79 ES ATM, CAZ, CRO, CXM, CFM, KZ, CN, AMP, SXT – –
80 ES SAM, AMP, SXT – –
81 IDS CRO, CXM, CFM, AMP, SXT – –
82 IM AMP, SXT – –
IDS – Infectious Diseases Service; UC – urology clinic; IM – internal medicine; ES – emergency service; NP – nephrology; NR – neurology; NG – gynecology; AMP – amplicillin; SAM – sulbactam; KZ – cefazolin; CTX – cefotaxime; CXM – cefuroxime; CFM – cefixime; CRO – ceftriaxone; CAZ – ceftazidime; CIP – ciprofloxacin; NOR – norfloxacin; ATM – aztreonam; SXT – sulfamethoxazole; CN – gentamicin.* tetracycline (TE) is not shown in the table because all isolates were TE-resistant. While isolates 26, 44, 46, and 47 harbored class-II integron gene cassettes, class-I gene cassettes were found in the rest of the isolates.
Table 3. Antimicrobial resistance patterns and integron gene cassettes of tetracycline-positive Escherichia coli clinical isolates (n = 82) – cont.

Adv Clin Exp Med. 2022;31(1):71–79 77
Fig. 1. Pulsed-field gel electrophoresis (PFGE) analysis of Escherichia coli isolates generated 3 major clusters (A, B and C) based on tetracycline (TE) resistance coding genes

A. Çopur Çiçek et al. Integrons/tet genes in ESBL(+) E. coli strains78
The majority of ESBL positivity and tet resistance is associated with conjugative or mobilizable elements, which partially explains their wide distribution in bacte-rial species. Gram-negative efflux determinants are nor-mally found in transposons inserted into a diverse group of plasmids from a variety of incompatibility groups. These plasmids may carry multiple antibiotic resistance genes, which confer resistance to various antibiotic families.27 Integrons cause the spread of antimicrobial drug resis-tance. Although the transport of ESBL and TE resistance on integrons was not investigated in this study, the high rate of integron gene cassette carriers has made us con-sider the possibility of transferring genes responsible for ESBL resistance. Tetracycline resistance genes may also be carried together with other antibiotic resistance genes by plasmids harbored integron gene cassettes. A selec-tive advantage for resistance genes carried on the plasmid may enhance the persistence of plasmid-bearing strains in an environment contaminated with antimicrobial com-pounds. Effective expression of tet genes in the Enterobac-teriaceae family could result in high levels of resistance to TE. We are of the opinion that this may be an important risk factor in the treatment of human infectious diseases caused by these microorganisms.
In our study, since E. coli isolates are community-acquired samples, they were not expected to be highly similar clon-ally. The PFGE was found to be effective for distinguishing isolates from each other only in subgroups according to tet type. Furthermore, it has been observed that PFGE grouped the isolates according to other genomic factors, rather than by the antibiotic resistance profile of isolates. For example, tetD-positive strains were co-resistant to CRO but they grouped in the different clades. Besides this, isolates No. 50 and 63 have exactly the same antibiotic profile but they were located on different branches, which also supports the no-tion that PFGE is independent of the resistance profile.
Limitations
Our study has 2 main limitations. Firstly, it is not a multi-institutional study. Secondly, base sequence analysis of in-tegrons could not be performed due to limited funding.
Conclusions
In summary, this is one of limited studies investigating the coexistence of tet genes and integron gene cassettes of E. coli isolates, obtained from urine samples in Turkey. The results provide data on the coexistence of integrons and tet genes in E. coli strains isolated from the outpa-tients. Studying integron gene cassettes and related re-sistance phenotypes can provide important information about the mechanisms of acquisition of multiple antibi-otic resistance genes in clinical isolates. It can be argued that uncontrolled broad-spectrum antibiotic use may be
the main reason for the development and increase of re-sistance. Furthermore, high rates of resistance may lead to a trend towards new alternatives or antibiotics that were used extensively in the past, but their use has decreased in recent years. Comprehensive studies are needed to better examine the relationship between antibiotic resistance and integron gene cassettes together with epidemiological data.
ORCID iDsAyşegül Çopur Çiçek https://orcid.org/0000-0002-3673-9670Vicdan Şemen https://orcid.org/0000-0002-1540-7968Nebahat Aydoğan Ejder https://orcid.org/0000-0001-9557-2033Deniz Zehra Ulusan Gündoğdu https://orcid.org/0000-0003-1839-3060Sema Koçyiğit Kalcan https://orcid.org/0000-0003-2933-4197Fatma Tufan Köse https://orcid.org/0000-0001-5598-5589Osman Birol Özgümüş https://orcid.org/0000-0002-9550-1646
References1. Stultz JS, Doern CD, Godbout E. Antibiotic resistance in pediatric uri-
nary tract infections. Curr Infect Dis Rep. 2016;18(2):40. doi:10.1007/s11908-016-0555-4
2. Han SB, Lee SC, Lee SY, Jeong DC, Kang JH. Aminoglycoside the-rapy for childhood urinary tract infection due to extended-spect-rum β-lactamase-producing Escherichia coli or Klebsiella pneumoniae. BMC Infect Dis. 2015;15:414. doi:10.1186/s12879-015-1153-z
3. Khoshnood S, Heidary M, Mirnejad R, Bahramian A, Sedighi M, Mirzaei H. Drug resistant gram-negative uropathogens: A review. Biomed Phar-macother. 2017;94:982–994. doi:10.1016/j.biopha.2017.08.006
4. Lanata CF, Fischer-Walker CL, Olascoaga AC, et al. Global causes of diarrheal disease mortality in children <5 years of age: A systematic review. PLoS One. 2013;8(9):72788. doi:10.1371/journal.pone.0072788
5. Liu L, Johnson HL, Cousens S, et al. Global, regional, and national causes of child mortality: An updated systematic analysis for 2010 with time trends since 2000. Lancet. 2012;379(9832):2151–2161. doi:10.1016/S0140-6736(12)60560-1
6. Huicho L, Trelles M, Gonzales F. National and sub-national under-five mortality profiles in Peru: A basis for informed policy decisions. BMC Public Health. 2006;6:173. doi:10.1186/1471-2458-6-173
7. Møller TSB, Overgaard M, Nielsen SS, et al. Relation between tetR and tetA expression in tetracycline resistant Escherichia coli. BMC Microbiol. 2016;16:39. doi:10.1186/s12866-016-0649-z
8. Qadri F, Svennerholm AM, Faruque ASG, Sack RB. Enterotoxigenic Escherichia coli in developing countries: Epidemiology, microbiol-ogy, clinical features, treatment, and prevention. Clin Microbiol Rev. 2005;18(3):465–483. doi:10.1128/CMR.18.3.465-483.2005
9. Chopra I, Roberts M. Tetracycline antibiotics: Mode of action, appli-cations, molecular biology, and epidemiology of bacterial resistance. Microbiol Mol Biol Rev. 2001;65(2):232–260. doi:10.1128/MMBR.65. 2.232-260.2001
10. Becker SL, Vogt J, Knopp S, et al. Persistent digestive disorders in the tropics: Causative infectious pathogens and reference diagnos-tic tests. BMC Infect Dis. 2013;13:37. doi:10.1186/1471-2334-13-37
11. O’Ryan GM, Ashkenazi-Hoffnung L, O’Ryan-Soriano MA, Ashkenazi S. Management of acute infectious diarrhea for children living in resource-limited settings. Expert Rev Anti Infect Ther. 2014;12(5):621–632. doi:10.1586/14787210.2014.901168
12. Ochoa TJ, Ruiz J, Molina M, et al. High frequency of antimicrobial drug resistance of diarrheagenic Escherichia coli in infants in Peru. Am J Trop Med Hyg. 2009;81(2):296–301. PMID:19635887
13. Wellington EM, Boxall AB, Cross P, et al. The role of the natural envi-ronment in the emergence of antibiotic resistance in gram-nega-tive bacteria. Lancet Infect Dis. 2013;13(2):155–165. doi:10.1016/S1473-3099(12)70317-1
14. Sengelov G, Halling-Sorensen B, Aarestrup FM. Susceptibility of Esch-erichia coli and Enterococcus faecium isolated from pigs and broiler chickens to tetracycline degradation products and distribution of tetracycline resistance determinants in E. coli from food animals. Vet Microbiol. 2003;95(1–2):91–101. doi:10.1016/s0378-1135(03)00123-8

Adv Clin Exp Med. 2022;31(1):71–79 79
15. Deng Y, Bao X, Ji L, et al. Resistance integrons: Class 1, 2 and 3 inte-grons. Ann Clin Microbiol Antimicrob. 2015;14:45. doi:10.1186/s12941-015-0100-6
16. Bennett PM. Integrons and gene cassettes: A genetic construction kit for bacteria. J Antimicrob Chemother. 1999;43(1):1–4. PMID:10381094
17. Clinical and Laboratory Standards Institute (CLSI). Performance stan-dards for antimicrobial susceptibility testing. 18th informational sup-plement, M 100. Wayne, USA: CLSI; 2008.
18. Clinical and Laboratory Standards Institute (CLSI). Performance stan-dards for antimicrobial susceptibility testing. 28th ed. Wayne, USA: CLSI; 2019.
19. Harwalkar A, Sataraddi J, Gupta S, Yoganand R, Rao A, Srinivasa H. The detection of ESBL-producing Escherichia coli in patients with symptomatic urinary tract infections using different diffusion meth-ods in a rural setting. J Infect Public Health. 2013;6(2):108–114. doi:10. 1016/j.jiph.2012.10.004
20. Falagas ME, Karageorgopoulos DE. Extended-spectrum beta-lac-tamase-producing organisms. J Hosp Infect. 2009;73(4):345–354. doi:10.1016/j.jhin.2009.02.021
21. Guardabassi L, Dijkshoorn L, Collard JM, Dalsgaard A. Distribution and in vitro transfer of tetracycline resistance determinants in clinical and aquatic Acinetobacter strains. J Med Microbiol. 2000:49(10):929–936. doi:10.1099/0022-1317-49-10-929
22. Marshall B, Tachibana C, Levy SB. Frequency of tetracycline resistance determinant classes among lactose fermenting coliforms. Antimicrob Agents Chemother. 1983;24(6):835–840. doi:10.1128/aac.24.6.835
23. Lévesque C, Piche L, Larose C, Roy PH. PCR mapping of integrons reveals several novel combinations of resistance genes. Antimicrob Agents Chemother. 1995;39(1):185–191. doi:10.1128/aac.39.1.185
24. White PA, McIver CJ, Rawlinson WD. Integrons and gene cassettes in the Enterobacteriaceae. Antimicrob Agents Chemother. 2001;45(9): 2658–2661. doi:10.1128/AAC.45.9.2658-2661.2001
25. Durmaz R, Otlu B, Koksal F, et al. The optimization of a rapid pulsed-field gel electrophoresis protocol for the typing of Acinetobacter baumannii, Escherichia coli and Klebsiella spp. Jpn J Infect Dis. 2009; 62(5):372–377. PMID:19762987
26. Tenover FC, Arbeit RD, Goering RV, et al. Interpreting chromosomal DNA restriction patterns produced by pulsed-field gel electropho-resis: Criteria for bacterial straintyping. J Clin Microbiol. 1995;33(9): 2233–2239. doi:10.1128/JCM.33.9.2233-2239.1995
27. Roberts MC. Tetracycline resistance determinants: Mechanisms of action, regulation of expression, genetic mobility, and distributi-on. FEMS Microbiol Rev. 1996;19(1):1–24. doi:10.1111/j.1574-6976.1996.tb00251.x
28. Rice LB, Bonono RA. Genetic and biochemical mechanisms of bac-terial resistance to antimicrobial agents. In: Lorian V, ed. Antibioti-cs in Laboratory Medicine. Baltimore, USA: Williams & Wilkins; 1996: 502–578.
29. Taylor DE, Chau A. Tetracycline resistance mediated by ribosomal protection. Antimicrob Agents Chemother. 1996;40(1):1–5. doi:10.1128/AAC.40.1.1
30. Dominguez E, Zarazaga M, Saenz Y, Brinas L, Torres C. Mechanis-ms of antibiotic resistance in Escherichia coli isolates obtained from healthy children in Spain. Microb Drug Resist. 2002;8(4):321–327. doi:10.1089/10766290260469589

Cite asBanaczkowska-Duda E, Bieńkowska-Tokarczyk A, Małecki M. Gene capsules as functional pharmaceutical formulations for delivery of DNA as an active substance. Adv Clin Exp Med. 2022;31(1):81–93. doi:10.17219/acem/141898
DOI10.17219/acem/141898
CopyrightCopyright by Author(s) This is an article distributed under the terms of theCreative Commons Attribution 3.0 Unported (CC BY 3.0)(https://creativecommons.org/licenses/by/3.0/)
Address for correspondenceAlicja Bieńkowska-TokarczykE-mail: [email protected]
Funding sourcesThe present study was partially supported by the National Centre for Research and Development (grant No. Strategmed1/233264/4/NCBR/2014; acronym: MentorEYE) and Medical University of Warsaw (grant No. FW29/N/20).
Conflict of interestNone declared
Received on November 25, 2020Reviewed on July 6, 2021Accepted on September 2, 2021
Published online on October 14, 2021
AbstractBackground. Capsules are solid drug forms that are well accepted by patients. Capsules usually consist of a medicinal substance with therapeutic benefits plus excipients. From a pharmaceutical point of view, DNA coding sequences can be treated as active substances.
Objectives. To develop and assess gelatin capsules containing DNA based on the methods included in the Polish Pharmacopoeia XI, as well as non-pharmacopeial methods.
Materials and methods. The mass uniformity of the obtained capsules was estimated. The stability of the DNA was verified using polymerase chain reaction (PCR) method. A study of the disintegration time of the gene capsules containing DNA mixed with lactose, and placebo capsules with lactose only was also per-formed. A dissolution test under conditions similar to the nature and specificity of the active substance (DNA) was performed. The transduction activity of the obtained capsules was assessed in cell culture conditions.
Results. The DNA and lactose-based gene capsules were obtained. The capsules were characterized by mass uniformity and stability over time. Efficient transduction of B16-F10 cancer cells with the gene product from the capsule was observed using fluorescence microscopy. Groups of green fluorescent protein-positive cells were observed in the microscope field of view.
Conclusions. The findings showed that it is possible to obtain a solid pharmaceutical form of the drug, i.e., a capsule containing DNA as an active substance. The gene capsules enabled the introduction of DNA into cells. This method may have valuable implications for increasing the availability of gene-based drugs for patients.
Key words: drug delivery, gene therapy, gene capsules, applied pharmacy
Original papers
Gene capsules as functional pharmaceutical formulations for delivery of DNA as an active substance
Edyta Banaczkowska-DudaA–D, Alicja Bieńkowska-TokarczykB–D, Maciej MałeckiA,D–F
Department of Applied Pharmacy, Faculty of Pharmacy, Medical University of Warsaw, Poland
A – research concept and design; B – collection and/or assembly of data; C – data analysis and interpretation; D – writing the article; E – critical revision of the article; F – final approval of the article
Advances in Clinical and Experimental Medicine, ISSN 1899–5276 (print), ISSN 2451–2680 (online) Adv Clin Exp Med. 2022;31(1):81–93
E. Banaczkowska-Duda, A. Bieńkowska-Tokarczyk, M. Małecki. Gene capsules for practical pharmacy82
Background
Capsules are a well-known solid dosage form of drug administration. According to the definition of Polish Pharmacopoeia XI (Ph Pol XI), capsules are solid for-mulations that have the form of a reservoir of various shapes and sizes, usually containing a single dose of ac-tive ingredient(s).1 Solid oral dosage forms, such as tab-lets and capsules, are generally the preferred method of drug delivery due to their comfort of use, low cost and high patient acceptability.2 Capsules are used to admin-ister drugs to patients suffering from various diseases, and therefore they play an important role in delivering diverse drugs.3 Studies of patients’ preferred dosage form found that more than half of patients (52.9%) pre-fer a capsule, 28.4% prefer a coated tablet, 12.7% prefer an uncoated tablet, and 3.5% prefer a soft-gel capsule. Preferences regarding capsules were significantly associ-ated with the easiest way of swallowing this drug form.4 One of the many advantages of capsules over tablets is the ability to deliver medicinal substances not only in a solid form, but also in nonaqueous liquid and semi-solid substance forms.5,6
Capsules are a form of a drug formed not only in in-dustrial settings, but also directly in pharmacies. Phar-macists’ knowledge about the physicochemical proper-ties of drugs and medicinal products is necessary for the preparation of the drug form.7 Drug prescribing is useful for practical pharmacy, since physicians do not have to be limited to the available industrial preparations. Then, the capsules can be prepared in a pharmacy, based on the physician’s prescription for an individual patient.3 Therefore, this form of drug delivery may be applicable for personalized therapy.8 Pharmacies have an educated per-sonnel and specialized equipment for drug production. Consequently, they may play an important role in clinical trials.9 Capsules containing various active substances can be prepared at a pharmacy. Compared with tablets, capsules usually contain less excipients.10 It is well-docu-mented that the composition can be limited to 1 excipient without its own pharmacological and adverse effects.1,11 An example of a known excipient is lactose (saccharum lactis, β-d-galactopyranosyl-(1-4)-d-glucopyranose), which is often used in industry and in pharmaceutical formulations. It shows a tendency to crystallize when stored at a high relative humidity; however, it is stable and nontoxic. Moreover, lactose does not interact phar-maceutically and pharmacodynamically with other drug components and improves taste.12 Although preparation of capsules is well-established, the preparation of capsules containing genes is of great interest due to their potential use in gene therapy.
Gene therapy is a treatment method based on the use of nucleic acids as active substances. The proteins en-coded by the selected gene sequences cause a therapeutic
effect.13 Currently, gene preparations are administered to patients mainly in liquid form as an injection or in-fusion of solutions or suspensions. These preparations are then administered to patients intravenously, intra-muscularly, intratumorally, intradermally, or subretinally (in ophthalmology).14 The literature has reported many experimental studies in the field of gene therapy for can-cer, metabolic and infectious diseases, and correction of congenital disorders.15 Patients’ expectations are raised by gene preparations registered for treatment. Glybera, Luxturna and Zolgensma are used in the treatment of metabolic diseases, ophthalmic diseases and neuro-degenerative disorder, respectively, and belong to the par-enteral drugs.16 Glybera is a solution for intramuscular injection that contains the following excipients: disodium phosphate anhydrous, potassium chloride, potassium di-hydrogen phosphate, sodium chloride, sucrose, and water for injection.17 Luxturna is a solution for subretinal in-jection. Before administration, it is prepared by diluting the concentrate with a solvent. Both solutions contain the same excipients: sodium chloride, sodium dihydro-gen phosphate monohydrate and dihydrate, poloxamer 188, and water for injection.18 Zolgensma is intended for intravenous infusion and, in addition to the medicinal substance, contains tromethamine, magnesium chloride, sodium chloride, poloxamer 188, hydrochloric acid, and water for injection.19 Concepts of gene therapy based on oral drug forms are detailed in experimental stud-ies. The literature describes the attempts to use micro-spheres, forms based on chitosan, modified silica, and modified micelles.20–23 The plasmid encoding interleu-kin 10 (IL-10) incorporated in microspheres has been used for the treatment of inflammatory bowel disease.20 Chitosan microparticles containing plasmid DNA have been developed.21 Oral gene delivery using poly-L-lysine modified silica nanoparticles has been attempted, and the ability of poly (allylamine) amphiphilic polymer mi-celles to deliver small interfering RNA (siRNA) through the gastrointestinal tract has been assessed.22,23 The de-scribed examples of oral gene preparations emphasize the importance of this method in experimental stud-ies in search for a new route of delivering gene therapy products. Achieving the therapeutic potential of DNA requires the development of new pharmaceutical formula-tions to enable a safe and effective administration of gene drugs.
Objectives
The aim of this study was to design gene capsules con-taining plasmid DNA (pDNA) or recombinant adeno-as-sociated virus (rAAV). The capsule formulations were then characterized by appropriate pharmaceutical and biologi-cal tests to verify their stability and activity.

Adv Clin Exp Med. 2022;31(1):81–93 83
Materials and methods
Formulation and preparation of gene capsules
Hard gelatin capsules (Eprus, Bielsko-Biała, Poland) containing genes were prepared. In accordance with the manufacturer’s recommendations for capsule capac-ity, each capsule contained 0.18 g of lactose (pure lactose monohydrate; Chempur, Piekary Śląskie, Poland) and 50 µg of the pAAV/LacZ plasmid (LacZ – β-galactosidase; Cat. No. 240071; Agilent, Santa Clara, USA) or 4 × 10⁴ genome copies (gc) rAAV/GFP (rAAV/DJ-CAG-GFP; Cat. No.7078; Vector Biolabs, Malvern, USA). Placebo hard gelatin cap-sules containing only 0.18 g of lactose were also produced. The capsules with plasmid and placebo were made with a manual capsule filling machine (Eprus), while capsules with the viral vector were prepared by hand.
Size 3 hard gelatin capsules were prepared. For the pla-cebo capsules, using an analytical balance, 18.0 g of lactose was weighed and then the powder was thoroughly ground in a mortar. The empty capsules were placed in the manual capsule filling machine using a positioner. The capsules were opened using the top plate of the capsule machine and the prepared powder mass was placed on the plate
of the capsule machine. The powder mass was gently spread into the capsules. The capsules were then closed and re-moved from the capsule filling machine. Next, the gene capsules were prepared (Fig. 1). On an analytical balance, 18.0 g of lactose was weighed and 1000 µL of 5 µg/µL pAAV/LacZ solution (50 µg of pDNA per capsule) was added and mixed gently. A larger amount of solution leads to over-wetting of the excipient and to softening and deformation of the capsule, consequently reducing its stability. The 2nd group of gene capsules contained the rAAV vector encoding the green fluorescent protein (GFP) reporter gene. For this purpose, 0.18 g of lactose was weighed into each capsule and 4 × 10⁴ gc of rAAV in 10 µL of water for injection was added.
The obtained capsules were then tested using the fol-lowing pharmacopeial methods1: uniformity of single-dose preparations, examination of disintegration time, dissolu-tion and stability tests, and transduction activity tests.
Mass uniformity of single-dose preparations
The study was performed in 5 groups of 20 gene (Table 1) and 5 groups of 20 placebo capsules (Table 2), based on the Ph Pol XI.1 The capsules were weighed on an ana-lytical balance.
Table 1. Mass uniformity of gene capsules
No.of capsule Capsule mass [g] Shell mass [g] Lactose mass [g] Deviation [g] Deviation [%]
1 0.234 0.047 0.187 0.007 1.1
2 0.234 0.049 0.185 0.005 5.6
3 0.224 0.048 0.176 −0.004 −2.2
4 0.229 0.046 0.183 0.003 2.8
5 0.226 0.048 0.178 −0.002 −1.1
6 0.234 0.048 0.186 0.006 3.3
7 0.236 0.047 0.189 0.009 5.0
8 0.225 0.048 0.177 −0.003 −1.7
9 0.210 0.047 0.163 −0.017 0.6
10 0.219 0.049 0.170 −0.010 −8.4
11 0.229 0.047 0.182 0.002 2.3
12 0.237 0.048 0.189 0.009 1.1
13 0.225 0.050 0.175 −0.005 −2.8
14 0.246 0.048 0.198 0.018 11.2
15 0.229 0.050 0.179 −0.001 −0.6
16 0.210 0.048 0.162 −0.018 −9.5
17 0.234 0.049 0.185 0.005 2.3
18 0.227 0.048 0.179 −0.001 −0.6
19 0.238 0.048 0.190 0.010 7.3
20 0.209 0.048 0.161 −0.019 −10.1
X = 0.180
A total of 20 capsules were tested (numbered 1–20); the 14th and 20th capsules exceeded the allowable deviation. X – average weight of lactose with pAAV/LacZ solution; deviation [%] – deviation expressed as a percentage of the difference from the average mass of capsules. Values in bold slightly exceeded the allowable deviation, according to Polish Pharmacopoeia XI (Ph Pol XI)1.
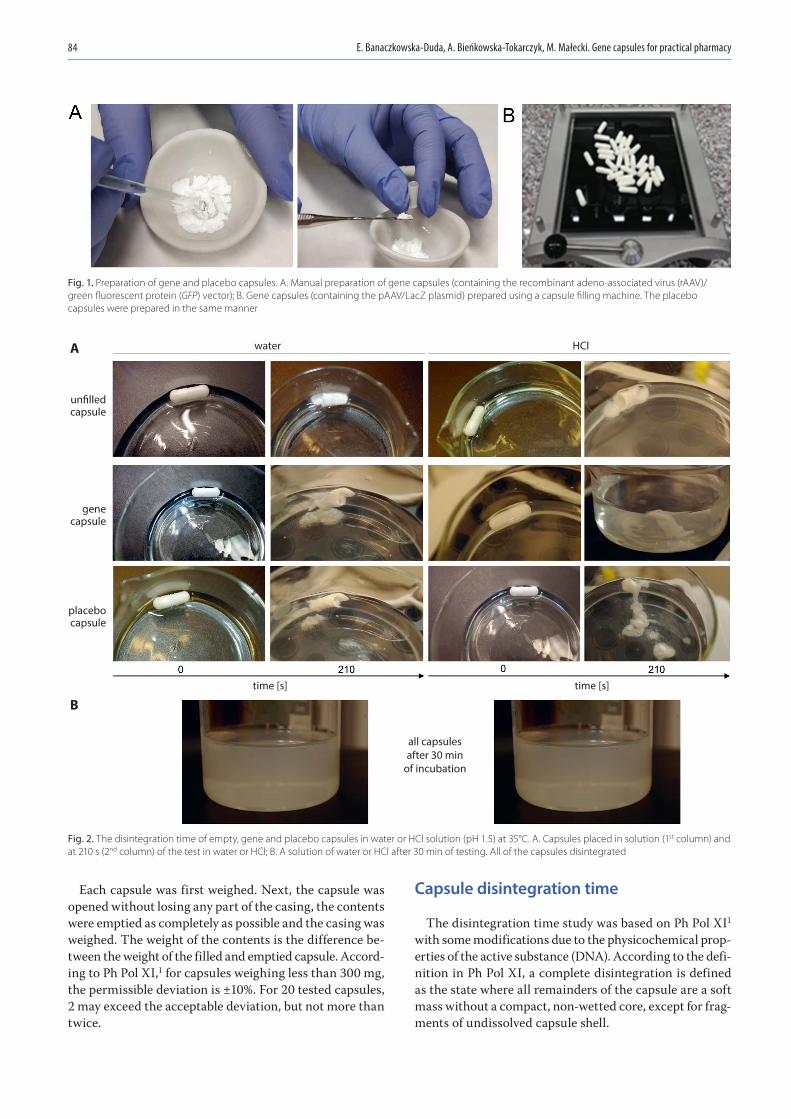
E. Banaczkowska-Duda, A. Bieńkowska-Tokarczyk, M. Małecki. Gene capsules for practical pharmacy84
Each capsule was first weighed. Next, the capsule was opened without losing any part of the casing, the contents were emptied as completely as possible and the casing was weighed. The weight of the contents is the difference be-tween the weight of the filled and emptied capsule. Accord-ing to Ph Pol XI,1 for capsules weighing less than 300 mg, the permissible deviation is ±10%. For 20 tested capsules, 2 may exceed the acceptable deviation, but not more than twice.
Capsule disintegration time
The disintegration time study was based on Ph Pol XI1 with some modifications due to the physicochemical prop-erties of the active substance (DNA). According to the defi-nition in Ph Pol XI, a complete disintegration is defined as the state where all remainders of the capsule are a soft mass without a compact, non-wetted core, except for frag-ments of undissolved capsule shell.
Fig. 2. The disintegration time of empty, gene and placebo capsules in water or HCl solution (pH 1.5) at 35°C. A. Capsules placed in solution (1st column) and at 210 s (2nd column) of the test in water or HCl; B. A solution of water or HCl after 30 min of testing. All of the capsules disintegrated
water
time [s] time [s]
all capsulesafter 30 min
of incubation
HCl
un�lled capsule
gene capsule
placebo capsule
B
A
Fig. 1. Preparation of gene and placebo capsules. A. Manual preparation of gene capsules (containing the recombinant adeno-associated virus (rAAV)/green fluorescent protein (GFP) vector); B. Gene capsules (containing the pAAV/LacZ plasmid) prepared using a capsule filling machine. The placebo capsules were prepared in the same manner
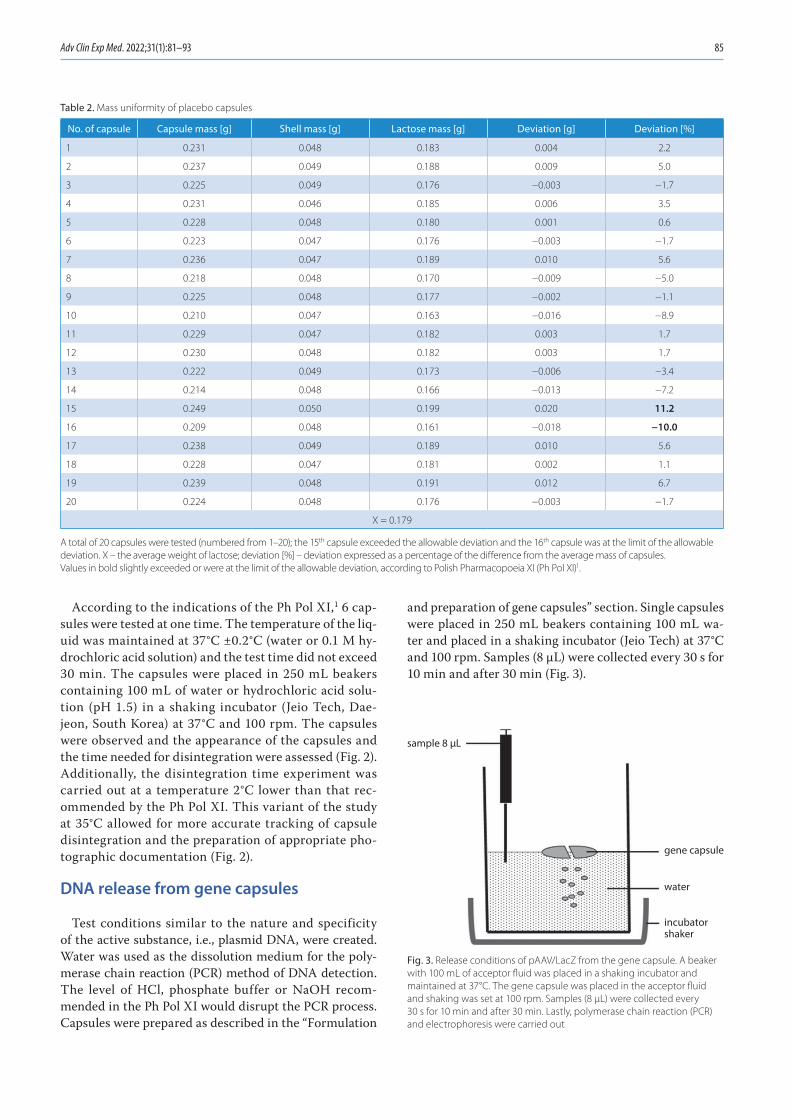
Adv Clin Exp Med. 2022;31(1):81–93 85
According to the indications of the Ph Pol XI,1 6 cap-sules were tested at one time. The temperature of the liq-uid was maintained at 37°C ±0.2°C (water or 0.1 M hy-drochloric acid solution) and the test time did not exceed 30 min. The capsules were placed in 250 mL beakers containing 100 mL of water or hydrochloric acid solu-tion (pH 1.5) in a shaking incubator (Jeio Tech, Dae-jeon, South Korea) at 37°C and 100 rpm. The capsules were observed and the appearance of the capsules and the time needed for disintegration were assessed (Fig. 2). Additionally, the disintegration time experiment was carried out at a temperature 2°C lower than that rec-ommended by the Ph Pol XI. This variant of the study at 35°C allowed for more accurate tracking of capsule disintegration and the preparation of appropriate pho-tographic documentation (Fig. 2).
DNA release from gene capsules
Test conditions similar to the nature and specificity of the active substance, i.e., plasmid DNA, were created. Water was used as the dissolution medium for the poly-merase chain reaction (PCR) method of DNA detection. The level of HCl, phosphate buffer or NaOH recom-mended in the Ph Pol XI would disrupt the PCR process. Capsules were prepared as described in the “Formulation
and preparation of gene capsules” section. Single capsules were placed in 250 mL beakers containing 100 mL wa-ter and placed in a shaking incubator (Jeio Tech) at 37°C and 100 rpm. Samples (8 µL) were collected every 30 s for 10 min and after 30 min (Fig. 3).
Table 2. Mass uniformity of placebo capsules
No. of capsule Capsule mass [g] Shell mass [g] Lactose mass [g] Deviation [g] Deviation [%]
1 0.231 0.048 0.183 0.004 2.2
2 0.237 0.049 0.188 0.009 5.0
3 0.225 0.049 0.176 −0.003 −1.7
4 0.231 0.046 0.185 0.006 3.5
5 0.228 0.048 0.180 0.001 0.6
6 0.223 0.047 0.176 −0.003 −1.7
7 0.236 0.047 0.189 0.010 5.6
8 0.218 0.048 0.170 −0.009 −5.0
9 0.225 0.048 0.177 −0.002 −1.1
10 0.210 0.047 0.163 −0.016 −8.9
11 0.229 0.047 0.182 0.003 1.7
12 0.230 0.048 0.182 0.003 1.7
13 0.222 0.049 0.173 −0.006 −3.4
14 0.214 0.048 0.166 −0.013 −7.2
15 0.249 0.050 0.199 0.020 11.2
16 0.209 0.048 0.161 −0.018 −10.0
17 0.238 0.049 0.189 0.010 5.6
18 0.228 0.047 0.181 0.002 1.1
19 0.239 0.048 0.191 0.012 6.7
20 0.224 0.048 0.176 −0.003 −1.7
X = 0.179
A total of 20 capsules were tested (numbered from 1–20); the 15th capsule exceeded the allowable deviation and the 16th capsule was at the limit of the allowable deviation. X – the average weight of lactose; deviation [%] – deviation expressed as a percentage of the difference from the average mass of capsules. Values in bold slightly exceeded or were at the limit of the allowable deviation, according to Polish Pharmacopoeia XI (Ph Pol XI)1.
Fig. 3. Release conditions of pAAV/LacZ from the gene capsule. A beaker with 100 mL of acceptor fluid was placed in a shaking incubator and maintained at 37°C. The gene capsule was placed in the acceptor fluid and shaking was set at 100 rpm. Samples (8 µL) were collected every 30 s for 10 min and after 30 min. Lastly, polymerase chain reaction (PCR) and electrophoresis were carried out
water
gene capsule
sample 8 µL
incubator shaker

E. Banaczkowska-Duda, A. Bieńkowska-Tokarczyk, M. Małecki. Gene capsules for practical pharmacy86
PCR and electrophoresis
In the present study, the gene encoding ampicillin resistance cloned into the used plasmid was amplified. Primers with the following sequence were designed: 5’ATAGTTGCCT-GACTCC3’ and 5’GTTACATCGAACTGGA3’. The reaction mixture (20 µL) contained 8 µL of collected sample, 10 µL of Master Mix 2× complete PCR buffer (Thermo Fisher Sci-entific, Waltham, USA), and 1 µL of each primer. The fol-lowing PCR thermal profile was selected: 5 min at 94.0°C; 35 cycles (30 s at 94.0°C, 30 s at 42.1°C, 40 s at 72.0°C); and 10 min at 72.0°C. After the PCR, the samples were subjected to electrophoretic separation on 1.5% agarose gel enriched with SYBR Safe (Thermo Fisher), which is a cyanine dye that binds to DNA. Gene Ruler 100 bp Plus DNA Ladder (Thermo Fisher) was used as the size marker. The separated product was visualized and photographed under UV light using a ChemiDoc MP Imaging System (Bio-Rad, Hercules, USA) (Fig. 4A). In order to assess how much of the active sub-stance (DNA) was released from gene capsule within 30 min, the brightness intensity of the bands in agarose gel was ana-lyzed using ImageJ software (National Institutes of Health
(NIH), Bethesda, USA). The values used for the calculations of the released pDNA percentage are presented in Fig. 4B.
Stability of gene capsules
A method to test the stability of hard gelatin capsules containing lactose and pAAV/LacZ was designed. The ob-tained gene capsules and placebo capsules were stored at 4°C and room temperature (RT) for 1 day, 7 days, 14 days, 30 days, 3 months, and 6 months. After the indicated times, the capsules were dissolved in 250 mL beakers containing 100 mL of water and placed in a shaking incubator at 37°C and 100 rpm. The 8-μL samples were collected and PCR was performed using 2 types of designed primers. The 1st primer pair, as in the release test, allowed the amplification of the ampicillin resistance gene, while the 2nd pair of prim-ers was complementary to the ITR LacZ coding fragment (primers annealing temperature of 54.9°C, sequences: 5’CATCTGCTGCACGCGAAGAA3’, 5’GAGGGAGTG-GCCAACTCCAT3’). The PCR products were separated with electrophoresis. These methods were described in the above section titled “PCR and electrophoresis”.
Fig. 4. Release of pAAV/LacZ from the gene capsule within 30 min. A. Agarose gel photo of electrophoretic separation after polymerase chain reaction (PCR). The pAAV/LacZ primers (Tm = 42.1°C, 35 cycles), 1.8% SYBR Safe gel, 676 bp product visualized, W – negative control, C – positive control (pAAV/LacZ), 100 bp – size marker; B. The values used for the calculations of the percentage of released plasmid DNA (pDNA); C. The percentage of released pDNA calculated by comparing the brightness of the C band (positive control) and the bands representing pDNA release within 30 min
time [min]
time [min]
rele
ased
dos
e [%
]
percentage of released pDNA
time [min]
brightness
A
B
C

Adv Clin Exp Med. 2022;31(1):81–93 87
Assessment of biological (transduction) activity of gene capsules
The transduction activity of the obtained gene cap-sules was assessed under in vitro cell culture condi-tions. The gene capsules containing DNA (rAAV/GFP) were analyzed. The experiment used the mouse mela-noma cell line B16-F10 (CRL-6475™; American Type Culture Collection (ATCC), Manassas, USA) maintained in a dedicated culture medium – Dulbecco’s modified Eagle’s medium (DMEM; Gibco, Thermo Fisher Scien-tific) – supplemented with 10% fetal bovine serum (FBS; Gibco, Thermo Fisher Scientific). A mixture of antibiotics (antibiotic-antimycotic; Gibco, Thermo Fisher Scientific) was added to the medium in an amount ensuring 1% con-centration. Melanoma cells were incubated at 37°C in air with an increased humidity and 5% CO2 concentration. The B16-F10 cells were seeded at 5 × 10⁴ on 6 cm diam-eter culture dishes in dedicated medium and incubated for 24 h under standard culture conditions. Immediately prior to transduction, DNA and placebo capsules were prepared as described in the section “Formulation and preparation of gene capsules”. Each type of prepared cap-sule was introduced into 100 mL of DMEM enriched with 2% FBS and 2% mixed antibiotics, and then shaken at 37°C and 100 rpm for 30 min. Next, the culture medium from the cells seeded 24 h earlier was replaced with medium containing the released rAAV/GFP from the gene capsules. To each plate, 6 mL of this medium was added. After 48 h of incubation under standard culture conditions, the me-dium was replaced with DMEM containing 10% FBS and 2% mixed antibiotics. After another 48 h, the medium was replaced with a fresh medium with the same com-position. On the 7th day after cell seeding, the expression of GFP in the test cells was examined using an inverted fluorescence microscope (Olympus IX53; Olympus Corp., Tokyo, Japan) with a pE-300 white light system (CoolLED, Andover, UK). Photos were taken at ×10 magnification (in the bright field and with the fluorescein isothiocyanate (FITC) filter).
Results
Assessment of mass uniformity of gene and placebo capsules
The aim of this experiment was to determine whether the prepared capsules met the requirements of the Ph Pol XI.1 Ten groups of 20 gene and placebo capsules were tested. In 7 out of the 10 groups of gene capsules and in 8 out of the 10 groups of placebo capsules, only 2 capsules exceeded the permissible deviation, but this occurred no more than 2 times. Table 1 and Table 2 present the findings for the representative gene and placebo capsules, respec-tively. As shown in Table 1, the weight of gene capsules 14 (11.2%) and 20 (−10.1%) slightly exceeded the allow-able deviation. Table 2 shows that only the weight of pla-cebo capsule 16 exceeded the deviation of ±10% (11.2%), while the weight of placebo capsule 15 was at the limit of the allowable deviation (−10.0%). Thus, the gene and placebo capsules prepared with a manual capsule filling machine met the requirements of the Ph Pol XI.1
Evaluation of capsule disintegration time
In this experiment, the disintegration time for gene, placebo and empty capsules was tested in water or hy-drochloric acid solution (pH 1.5) at 37°C. Disintegration was observed, the time of degradation was measured and the percent of disintegration consistent with the definition in the Ph Pol XI was determined.1 As shown in Table 3, at 45 s the empty capsules were disintegrated in 80%. The gene and placebo capsules disintegrated slightly faster, and the disintegration at 45 s was estimated to be 90% (Table 3). The tested capsules met the test require-ments according to the Ph Pol XI,1 as a minimum 16 out of 18 tested capsules were disintegrated. After 30 min, all tested capsules were completely dissolved (Fig. 2).
The experiment was also carried out at 35°C in order to detect the disintegration point for the capsules. An ef-fect of temperature on the disintegration rate of the cap-sules was observed: the difference of 2°C slowed disinte-gration of the capsules. The empty capsules disintegrated more slowly at the lower temperature compared to 37°C. At 210 s, they were disintegrated in 80%, while the capsules
Table 3. Disintegration time of empty, placebo and gene capsules at 37°C in water or HCl solution. The disintegration time of all capsules at 37°C was 45 s (bold)
Time [s]
Disintegration [%] at 37°C
water HCl
empty capsule placebo gene capsule empty capsule placebo gene capsule
15 20 35 30 25 45 40
30 40 60 60 50 70 70
45 80 90 90 80 90 90
1800 100 100 100 100 100 100

E. Banaczkowska-Duda, A. Bieńkowska-Tokarczyk, M. Małecki. Gene capsules for practical pharmacy88
filled with lactose or lactose with plasmid at the same time were disintegrated in 90% (Table 4, Fig. 2).
Assessment of pDNA release from gene capsules
This study was performed with gene capsules containing 50 µg of plasmid each. The analyzed samples (8 µL) were collected every 30 s for 10 min and after 30 min (Fig. 3). The PCR was performed. Then, the resulting products un-derwent electrophoretic separation in agarose gel. Plasmid release from the capsules was observed in the indicated time. After only 30 s in the sample, pAAV/LacZ was re-leased. After 30 min, the band corresponding to the pres-ence of pAAV/LacZ was also visible. Electrophoresis re-vealed that pDNA maintains the correct structure and was present in each sample. Moreover, the absence of a band in the sample marked as negative control (W) proved that the reaction was performed correctly (Fig. 4A). Addition-ally, to assess the amount of DNA released from capsules within 30 min, the brightness intensity of the bands in the agarose gel was analyzed. The brightness values
of the C band (positive control) and the other bands (show-ing release of pAAV/LacZ from the gene capsule within 30 min) were compared (Fig. 4A). After 30 min, 83% of the DNA dose contained in the capsule was observed in the acceptor fluid (Fig. 4C).
Stability of gene capsules
The aim of this experiment was to assess the stability and durability of the prepared capsules under the follow-ing conditions. The gene and placebo capsules were stored for 1 day, 7 days, 14 days, 30 days, 3 months, and 6 months at 4°C and room temperature (RT). After the stated times, the capsules were dissolved in water at 37°C. Seven cap-sules containing plasmid DNA (pAAV/LacZ) and 7 placebo capsules with only lactose were tested at each of the men-tioned time intervals at both temperatures. Next, 8 µL samples were collected and PCR was performed using the 2 designed primers. Then, the samples then underwent electrophoretic separation on 1.5% agarose gel. The active substance (pAAV/LacZ) did not degrade at the 2 tested temperatures and after the indicated times, as confirmed
Fig. 5. Stability of gene capsules after 1 day of storage at the following temperatures: A – 4°C; B – room temperature; C – placebo. Electrophoretic separation after polymerase chain reaction (PCR). The pAAV/LacZ primers (Tm = 42.1°C, 35 cycles), 676 bp product visualized, 100 bp – size marker, W – water, C – control (pAAV/LacZ). The numbers 1–7 indicate the samples collected from the 7 separately dissolved capsules
Table 4. Disintegration time of empty, placebo and gene capsules at 35°C in water or HCl solution. The disintegration time of all capsules at 35°C was 210 s (bold)
Time [s]
Disintegration [%] at 35°C
water HCl
empty capsule placebo gene capsule empty capsule placebo gene capsule
45 20 35 30 25 45 40
90 40 60 60 50 70 70
210 80 90 90 80 90 90
1800 100 100 100 100 100 100

Adv Clin Exp Med. 2022;31(1):81–93 89
by electrophoresis for each group. Figure 5 and Fig. 6 show representative images after 1 day and 6 months, respec-tively, with use of the 2 types of primers.
Transduction activity of gene capsules
The transduction efficiency of B16-F10 cells was assessed with inverted fluorescence microscopy. Cell evaluation
was performed on the 7th day of the experiment. The re-sults are shown in Fig. 7. As shown, the cells were success-fully transduced with rAAV vectors released from cap-sules. The GFP-positive (GFP+) cells were grouped. From 4 to 14 GFP+ cells were observed in the microscope field of view. Effective transduction was documented in Fig. 7, proving that the vectors carrying the reporter gene were not damaged during the overall procedure of transduction
Fig. 6. Stability of gene capsules after 6 months of storage at the following temperatures: A – 4°C; B – room temperature; C – placebo. Electrophoretic separation after polymerase chain reaction (PCR). The LacZ ITR primers (Tm = 54.9°C, 35 cycles), 436 bp product visualized, 100 bp – size marker, W – water, C – control (pAAV/LacZ). The numbers 1–7 indicate the samples collected from the 7 separately dissolved capsules
Fig. 7. The B16-F10 cell transduction with recombinant adeno-associated virus (rAAV) vectors. Photographs of representative rAAV transduced cells expressing green fluorescent protein (GFP) were taken at ×10 magnification using an inverted microscope. The GFP + cells formed groups in which 4–14 cells were observed. BF – pictures collected in bright field; FITC – pictures collected using a fluorescein isothiocyanate (FITC) filter
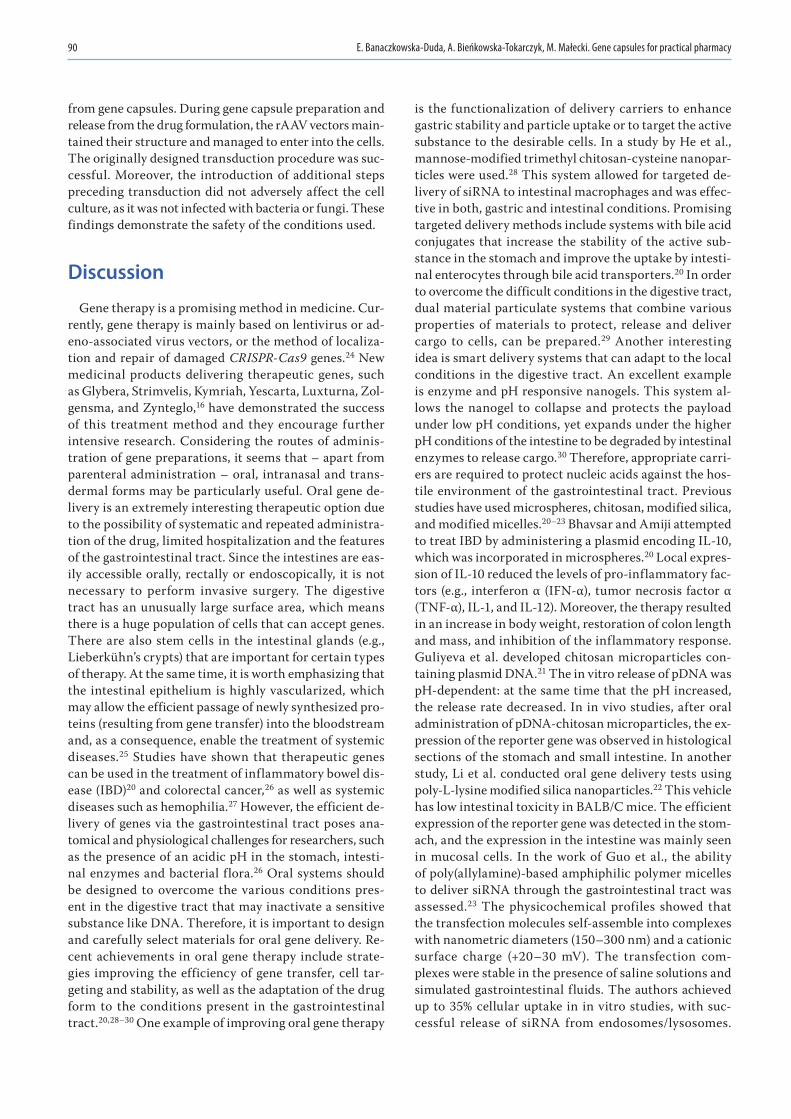
E. Banaczkowska-Duda, A. Bieńkowska-Tokarczyk, M. Małecki. Gene capsules for practical pharmacy90
from gene capsules. During gene capsule preparation and release from the drug formulation, the rAAV vectors main-tained their structure and managed to enter into the cells. The originally designed transduction procedure was suc-cessful. Moreover, the introduction of additional steps preceding transduction did not adversely affect the cell culture, as it was not infected with bacteria or fungi. These findings demonstrate the safety of the conditions used.
Discussion
Gene therapy is a promising method in medicine. Cur-rently, gene therapy is mainly based on lentivirus or ad-eno-associated virus vectors, or the method of localiza-tion and repair of damaged CRISPR-Cas9 genes.24 New medicinal products delivering therapeutic genes, such as Glybera, Strimvelis, Kymriah, Yescarta, Luxturna, Zol-gensma, and Zynteglo,16 have demonstrated the success of this treatment method and they encourage further intensive research. Considering the routes of adminis-tration of gene preparations, it seems that – apart from parenteral administration – oral, intranasal and trans-dermal forms may be particularly useful. Oral gene de-livery is an extremely interesting therapeutic option due to the possibility of systematic and repeated administra-tion of the drug, limited hospitalization and the features of the gastrointestinal tract. Since the intestines are eas-ily accessible orally, rectally or endoscopically, it is not necessary to perform invasive surgery. The digestive tract has an unusually large surface area, which means there is a huge population of cells that can accept genes. There are also stem cells in the intestinal glands (e.g., Lieberkühn’s crypts) that are important for certain types of therapy. At the same time, it is worth emphasizing that the intestinal epithelium is highly vascularized, which may allow the efficient passage of newly synthesized pro-teins (resulting from gene transfer) into the bloodstream and, as a consequence, enable the treatment of systemic diseases.25 Studies have shown that therapeutic genes can be used in the treatment of inflammatory bowel dis-ease (IBD)20 and colorectal cancer,26 as well as systemic diseases such as hemophilia.27 However, the efficient de-livery of genes via the gastrointestinal tract poses ana-tomical and physiological challenges for researchers, such as the presence of an acidic pH in the stomach, intesti-nal enzymes and bacterial flora.26 Oral systems should be designed to overcome the various conditions pres-ent in the digestive tract that may inactivate a sensitive substance like DNA. Therefore, it is important to design and carefully select materials for oral gene delivery. Re-cent achievements in oral gene therapy include strate-gies improving the efficiency of gene transfer, cell tar-geting and stability, as well as the adaptation of the drug form to the conditions present in the gastrointestinal tract.20,28–30 One example of improving oral gene therapy
is the functionalization of delivery carriers to enhance gastric stability and particle uptake or to target the active substance to the desirable cells. In a study by He et al., mannose-modified trimethyl chitosan-cysteine nanopar-ticles were used.28 This system allowed for targeted de-livery of siRNA to intestinal macrophages and was effec-tive in both, gastric and intestinal conditions. Promising targeted delivery methods include systems with bile acid conjugates that increase the stability of the active sub-stance in the stomach and improve the uptake by intesti-nal enterocytes through bile acid transporters.20 In order to overcome the difficult conditions in the digestive tract, dual material particulate systems that combine various properties of materials to protect, release and deliver cargo to cells, can be prepared.29 Another interesting idea is smart delivery systems that can adapt to the local conditions in the digestive tract. An excellent example is enzyme and pH responsive nanogels. This system al-lows the nanogel to collapse and protects the payload under low pH conditions, yet expands under the higher pH conditions of the intestine to be degraded by intestinal enzymes to release cargo.30 Therefore, appropriate carri-ers are required to protect nucleic acids against the hos-tile environment of the gastrointestinal tract. Previous studies have used microspheres, chitosan, modified silica, and modified micelles.20–23 Bhavsar and Amiji attempted to treat IBD by administering a plasmid encoding IL-10, which was incorporated in microspheres.20 Local expres-sion of IL-10 reduced the levels of pro-inflammatory fac-tors (e.g., interferon α (IFN-α), tumor necrosis factor α (TNF-α), IL-1, and IL-12). Moreover, the therapy resulted in an increase in body weight, restoration of colon length and mass, and inhibition of the inflammatory response. Guliyeva et al. developed chitosan microparticles con-taining plasmid DNA.21 The in vitro release of pDNA was pH-dependent: at the same time that the pH increased, the release rate decreased. In in vivo studies, after oral administration of pDNA-chitosan microparticles, the ex-pression of the reporter gene was observed in histological sections of the stomach and small intestine. In another study, Li et al. conducted oral gene delivery tests using poly-L-lysine modified silica nanoparticles.22 This vehicle has low intestinal toxicity in BALB/C mice. The efficient expression of the reporter gene was detected in the stom-ach, and the expression in the intestine was mainly seen in mucosal cells. In the work of Guo et al., the ability of poly(allylamine)-based amphiphilic polymer micelles to deliver siRNA through the gastrointestinal tract was assessed.23 The physicochemical profiles showed that the transfection molecules self-assemble into complexes with nanometric diameters (150–300 nm) and a cationic surface charge (+20–30 mV). The transfection com-plexes were stable in the presence of saline solutions and simulated gastrointestinal fluids. The authors achieved up to 35% cellular uptake in in vitro studies, with suc-cessful release of siRNA from endosomes/lysosomes.

Adv Clin Exp Med. 2022;31(1):81–93 91
The presented research examples emphasize the poten-tial and functionality of different substances for oral gene delivery in gene therapy.
The rAAV/GFP contains rAAV-DJ as a vector, which delivers the GFP reporter gene. The well-characterized rAAV-DJ is a recombinant mosaic vector made from the DNA of 8 AAV serotypes that efficiently transduce cells from various cancer lines. Our previous studies revealed the high transduction activity of rAAV-DJ in the B16-F10 cell line.31,32
Both viral and non-viral vectors were used in this study. Plasmids, adenoviral vectors and retroviral vectors are the most frequently used gene delivery vectors in clini-cal trials of gene therapy.33,34 The AAVs are widely used in gene therapy as vectors due to their ability to ensure long-term gene expression and the lack of pathogenic-ity; thus, they are developed for gene delivery applica-tions.31,35 The AAV vectors are currently the most com-mon type of viral vectors used in clinical trials of gene therapy.36
The aim of this study was to develop hard gelatin gene capsules based on lactose. Lactose monohydrate, popular in pharmacy recipes, was used. Lactose is a disaccharide composed of D-galactose and D-glucose linked by a β-1,4-glycosidic bond. It is nontoxic and does not have any phar-maceutical or pharmacodynamic interactions with other drug components.1,12 Lactose is the most common diluent in tablets and capsules due to its good physical stability and water solubility, availability, and cost-effectiveness.37
A manual capsule filling machine was used to pre-pare the capsules (Fig. 1), which facilitates and improves the preparation of divided powders in modern pharmacy recipes. It enables precise dosing of powder into hard gela-tin capsules without weighing individual doses. The cap-sule machine ensures maximum purity of the drug and the esthetics of the final form. In this study, 100 placebo capsules were obtained and the mass uniformity test of sin-gle-dose preparations was performed based on the Ph Pol XI.1 The results met the requirements of the Ph Pol XI, i.e., a maximum 2 of 20 capsules slightly exceeded the per-missible deviation, which for capsules weighing less than 300 mg can be ±10% (Table 1). We prepared 100 gene capsules that contained lactose and the active substance in the form of 10 µL of pAAV/LacZ solution in a concentra-tion of 5 µg/µL per capsule (50 µg pDNA/capsule). Prepara-tion of powder mass to fill the capsules containing pAAV/LacZ required care for the cleanliness of the workplace, as well as special care was required when combining the plasmid DNA with lactose. The tested gene capsules also met the requirements of the Ph Pol XI in terms of mass uniformity, i.e., a maximum 2 out of 20 gene capsules slightly exceeded the permissible deviation (Table 2).1
The capsules disintegrated, according to definition in the Ph Pol XI,1 in 45 s at 37°C and in 210 s at 35°C. The difference of 2°C slowed the disintegration of all capsules (empty, gene and placebo). According to the Ph
Pol XI, the disintegration time should not be longer than 30 min. After this time, all tested capsules were completely dissolved. The short disintegration time of the capsules al-lows quick release and a rapid effect of the active substance.
In gene therapy research, it is important to determine the transduction efficiency of gene preparations, which is associated with the mechanism of DNA release from the drug. Therefore, the gene capsules were tested for ac-tive ingredient (DNA) release. Due to the experimental form of the tested drug as well as the type and specific-ity of the active substance used in the capsules (plasmid DNA), the original changes of the test conditions were introduced. This allowed the observation of pAAV/LacZ released from the capsules (as described in the Materials and Methods section). As shown in Fig. 4, the presence of pDNA in the acceptor fluid was observed after 30 s, and DNA was detected in each of the collected samples. After 30 min, 83% of the dose contained in the capsule was observed.
To characterize the obtained gene capsules, stability ex-periments were also performed. The aim was to determine whether pAAV/LacZ in combination with lactose was stable under certain storage conditions and time. Assuming that the gene capsules are in the form of a prescription drug, pharmacists should determine their shelf life. Medicines that patients receive must have adequate quality and activ-ity in the prescribed period. In accordance with the chapter “Medicines prepared in a pharmacy” in the National Mono-graphs of Ph Pol XI, vol. 3,1 it is assumed that the maximum period of use of non-sterile solid preparations prepared with the use of prescription substances, when properly stored (temperature up to 25°C, protected from light, well-sealed containers), is not longer than 3 months.1 In our study, the active substance was not a prescribed substance. As the prepared form of the drug is experimental, it was tested for a much longer period of time. Interesting results were obtained in the stability assessment, which showed the extraordinary stability of pDNA. The released pDNA was stable for 6 months, both at a reduced temperature and RT. This is important information indicating that it is pos-sible to prepare capsules for a patient for a longer period of dosing without fear of DNA inactivation.
In the context of the therapeutic potential of designed gene capsules, an important part of this study was the transduction of B16-F10 cancer cells using the vi-ral vector from the gene capsules. The B16-F10 murine melanoma is one of the most commonly used cell lines in cancer research.38 The active ingredient in the capsules, which was used for B16-F10 cell transduction, was rAAV/GFP. The results are promising and indicate the possi-bility of introducing genes from viral vectors enclosed in a solid drug form. In vitro experiments (Fig. 7) con-firmed that the DNA released from the capsule was able to enter the cells, was expressed in the cells, and behaved as an active substance. The GFP + cells clearly confirmed the bioavailability of DNA from the capsule.

E. Banaczkowska-Duda, A. Bieńkowska-Tokarczyk, M. Małecki. Gene capsules for practical pharmacy92
Limitations
The clinical utility of our results would be enhanced if in vivo animal studies would be conducted. Addition-ally, the proposed composition of the gene capsule does not include excipients commonly used in enteral formu-lations. In future research, it would be worth considering excipients that ensure an enteral form.
Conclusions
With reference to prior works about non-viral gene carriers taken orally,20–23 this work has shown that viral vectors should be considered for the treatment of dis-eases, using orally administered gene therapy. Moreover, the performed experiments demonstrated that it is pos-sible to obtain a solid form of a gene drug that combines gene therapy with a pharmacy recipe. The obtained gene capsules demonstrate the potential of gene therapy in in-creasing the availability of gene preparations for patients.
ORCID iDsEdyta Banaczkowska-Duda https://orcid.org/0000-0002-9538-8129Alicja Bieńkowska-Tokarczyk https://orcid.org/0000-0002-7675-0428Maciej Małecki https://orcid.org/0000-0002-7078-4918
References1. Urząd Rejestracji Produktów Leczniczych. Farmakopea Polska XI. 11th ed.
Warszawa, Poland: Urząd Rejestracji Produktów Leczniczych, Wyro-bów Medycznych i Produktów Biobójczych; 2017.
2. Forough AS, Lau ETL, Steadman K, et al. A spoonful of sugar helps the medicine go down? A review of strategies for making pills easier to swallow. Patient Prefer Adherence. 2018;12:1337–1346. doi:10.2147/PPA.S164406
3. Allen LV Jr. Basics of compounding: Capsules. Int J Pharm Compd. 2016;20(2):125–134. PMID:27323424
4. Ibrahim IR, Ibrahim MI, Al-Haddad MS. The influence of consumers’ pref-erences and perceptions of oral solid dosage forms on their treatment. Int J Clin Pharm. 2012;34(5):728–732. doi:10.1007/s11096-012-9667-6
5. Gullapalli RP, Mazzitelli CL. Gelatin and non-gelatin capsule dos-age forms. J Pharm Sci. 2017;106(6):1453–1465. doi:10.1016/j.xphs. 2017.02.006
6. Sultana M, Butt MA, Saeed T, et al. Effect of rheology and poloxam-ers properties on release of drugs from silicon dioxide gel-filled hard gelatin capsules: A further enhancement of viability of liquid semi-solid matrix technology. AAPS PharmSciTech. 2017;18(6):1998–2010. doi:10.1208/s12249-016-0674-0
7. Allen LV Jr. Basics of compounding: Clinical pharmaceutics. Part 2. Int J Pharm Compd. 2016;20(6):485–493. PMID:28339388
8. Bonhoeffer B, Kwade A, Juhnke M. Alternative manufacturing con-cepts for solid oral dosage forms from drug nanosuspensions using fluid dispensing and forced drying technology. J Pharm Sci. 2018; 107(3):909–921. doi:10.1016/j.xphs.2017.11.007
9. Allen LV Jr. Basics of compounding: Clinical pharmaceutics. Part 1. Int J Pharm Compd. 2016;20(5):389–396. PMID:28339374
10. Helin-Tanninen M, Pinto J. Oral solids. In: Bouwman-Boer Y, Fenton-May V, Brun P, eds. Practical Pharmaceutics: An International Guideline for the Preparation, Care and Use of Medicinal Products. Berlin, Germany: Springer; 2015: 51–75.
11. Sznitowska M. Farmacja stosowana: technologia postaci leku. Warsza-wa, Poland: PZWL Wydawnictwo Lekarskie; 2017.
12. Darji MA, Lalge RM, Marathe SP, et al. Excipient stability in oral solid dosage forms: A review. AAPS PharmSciTech. 2018;19(1):12–26. doi:10. 1208/s12249-017-0864-4
13. Małecki M. Preparaty plazmidowe w terapii genowej. Wspolczesna Onkol. 2004;8(7):321–327. https://www.termedia.pl/Plasmid-prepara-tions-in-gene-therapy,3,2581,1,1.html. Accessed September 17, 2021.
14. Mali S. Delivery systems for gene therapy. Indian J Hum Genet. 2013; 19(1):3–8. doi:10.4103/0971-6866.112870
15. Keeler AM, ElMallah MK, Flotte TR. Gene therapy 2017: Progress and future directions. Clin Transl Sci. 2017;10(4):242–248. doi:10.1111/cts.12466
16. Shahryari A, Saghaeian JM, Mohammadi S, et al. Development and clinical translation of approved gene therapy products for genetic disorders. Front Genet. 2019;10:868. doi:10.3389/fgene.2019.00868
17. European Medicines Agency. Summary of product characteristics: Glybera. https://www.ema.europa.eu/en/documents/product-information/ glybera-epar-product-information_en.pdf. Accessed January 18, 2021.
18. European Medicines Agency. Summary of product characteristics: Luxturna. https://www.ema.europa.eu/en/documents/product-information/luxturna-epar-product-information_en.pdf. Accessed January 18, 2021.
19. European Medicines Agency. Summary of product characteristics: Zolgensma. https://www.ema.europa.eu/en/documents/product- information/zolgensma-epar-product-information_en.pdf. Accessed January 18, 2021.
20. Bhavsar MD, Amiji MM. Oral IL-10 gene delivery in a microsphere-based formulation for local transfection and therapeutic efficacy in inflammatory bowel disease. Gene Ther. 2008;15(17):1200–1209. doi:10.1038/gt.2008.67
21. Guliyeva U, Oner F, Ozsoy S, Haziroglu R. Chitosan microparticles containing plasmid DNA as potential oral gene delivery system. Eur J Pharm Biopharm. 2006;62(1):17–25. doi:10.1016/j.ejpb.2005.08.006
22. Li Z, Zhu SG, Gan K, et al. Poly-l-lysine-modified silica nanoparticles: A potential oral gene delivery system. J Nanosci Nanotechnol. 2005; 5(8):1199–1203. doi:10.1166/jnn.2005.220
23. Guo J, O’Mahony AM, Cheng WP, O’Driscoll CM. Amphiphilic poly-allylamine based polymeric micelles for siRNA delivery to the gas-trointestinal tract: In vitro investigations. Int J Pharm. 2013;447(1–2): 150–157. doi:10.1016/j.ijpharm.2013.02.050
24. Dunbar CE, High KA, Joung JK, Kohn DB, Ozawa K, Sadelain M. Gene therapy comes of age. Science. 2018;359(6372):eaan4672. doi:10.1126/science.aan4672
25. Lozier JN, Yankaskas JR, Ramsey WJ, Chen L, Berschneider H, Morgan RA. Gut epithelial cells as targets for gene therapy of hemophilia. Human Gene Ther. 1997;8(12):1481–1490. doi:10.1089/hum.1997.8.12-1481
26. O’Neill MJ, Bourre L, Melgar S, O’Driscoll CM. Intestinal delivery of non-viral gene therapeutics: Physiological barriers and preclinical models. Drug Discov Today. 2011;16(5–6):203–218. doi:10.1016/j.drudis. 2011.01.003
27. Bowman K, Sarkar R, Raut S, Leong KW. Gene transfer to hemophilia A mice via oral delivery of FVIII-chitosan nanoparticles. J Control Release. 2008;132(3):252–259. doi:10.1016/j.jconrel.2008.06.019
28. He C, Yin L, Song Y, Tang C, Yin C. Optimization of multifunctional chitosan-siRNA nanoparticles for oral delivery applications, targeting TNF-a silencing in rats. Acta Biomater. 2015;17:98–106. doi:10.1016/j.actbio.2015.01.041
29. Nurunnabi M, Lee SA, Revuri V, et al. Oral delivery of a therapeutic gene encoding glucagon-like peptide 1 to treat high fat diet-induced diabetes. J Control Release. 2017;268:305–313. doi:10.1016/j.jconrel. 2017.08.035
30. Knipe JM, Strong LE, Peppas NA. Enzyme- and pH-responsive micro-encapsulated nanogels for oral delivery of siRNA to induce TNF-a knockdown in the intestine. Biomacromolecules. 2016;17(3):788–797. doi:10.1021/acs.biomac.5b01518
31. Mao Y, Wang X, Yan R, et al. Single point mutation in adeno-asso-ciated viral vectors: DJ capsid leads to improvement for gene delivery in vivo. BMC Biotechnol. 2016;16(1):1–8. doi:10.1186/s12896- 015-0230-0
32. Czajka M, Zajkowska A, Gawlak M, Bujalska-Zadrozny M, Malecki M. Mosaic recombinant adeno-associated virus vector rAAV/DJ/CAG for targeted gene delivery to melanoma cells metastasized to the lung. Anticancer Res. 2020;40(8):4425–4444. doi:10.21873/anticanres.14448
33. Wirth T, Parker N, Yla-Herttuala S. History of gene theraphy. Gene. 2013;525(2):162–169. doi:10.1016/j.gene.2013.03.137
34. Schmeer M, Bucholtz T, Schleef M. Plasmid DNA manufacturing for indirect and direct clinical applications. Hum Gene Ther. 2017;28(10): 856–861. doi:10.1089/hum.2017.159

Adv Clin Exp Med. 2022;31(1):81–93 93
35. Kurian JJ, Lakshmanan R, Chmely WM, et al. Adeno-associated virus VP1u exhibits protease activity. Viruses. 2019;11(5):399. doi:10.3390/v11050399
36. Lotfinia M, Abdollahpour-Alitappeh M, Hatami B, Zali MR, Karimi-poor M. Adeno-associated virus as a gene therapy vector: Strategies to neutralize the neutralizing antibodies. Clin Exp Med. 2019;19(3): 289–298. doi:10.1007/s10238-019-00557-8
37. Lamešić D, Planinšek O, Lavrič Z, Ilić I. Spherical agglomerates of lac-tose with enhanced mechanical properties. Int J Pharm. 2017;516(1–2): 247–257. doi:10.1016/j.ijpharm. 2016.11.040
38. Giavazzi R, Decio A. Syngeneic murine metastasis models: B16 mela-noma. Methods Mol Biol. 2014;1070:131–140. doi:10.1007/978-1-4614-8244-4_10


Cite asCharliński G, Jurczyszyn A. Non-secretory multiple myeloma: Diagnosis and management. Adv Clin Exp Med. 2022;31(1):95–100. doi:10.17219/acem/141455
DOI10.17219/acem/141455
CopyrightCopyright by Author(s) This is an article distributed under the terms of theCreative Commons Attribution 3.0 Unported (CC BY 3.0)(https://creativecommons.org/licenses/by/3.0/)
Address for correspondenceGrzegorz CharlińskiE-mail: [email protected]
Funding sourcesNone declared
Conflict of interestNone declared
Received on May 28, 2021Reviewed on August 16, 2021Accepted on August 19, 2021
Published online on October 12, 2021
AbstractMultiple myeloma (MM) is one of the most commonly diagnosed blood cancers. One criterion for the diagnosis of MM is serum and/or urine monoclonal protein produced by clonal plasmocytes. However, about 1–2% of MM cases do not have monoclonal protein. If other diagnostic criteria are present, the possibility of a di-agnosis of non-secretory MM should be considered. As the different types of non-secretory MM depend on the underlying cause, the current definition is considered insufficient. Currently, both the diagnosis and treatment of non-secretory MM are the same as those of secretory MM. Due to the rarity of non-secretory MM, most findings are from retrospective studies on small groups of patients and case reports. The method of monitoring the effectiveness of MM treatment remains a problem, as it is usually based on the assessment of the percentage of clonal plasma cells in the bone marrow and imaging studies.
Key words: diagnosis, management, non-secretory multiple myeloma
Reviews
Non-secretory multiple myeloma: Diagnosis and management
Grzegorz Charliński1,2,A–F, Artur Jurczyszyn3,E,F
1 Department of Internal Medicine, University of Warmia and Mazury, Olsztyn, Poland2 Department of Hematology, Warmian-Masurian Cancer Center of The Ministry of The Interior and Administration’s Hospital, Olsztyn, Poland 3 Plasma Cell Dyscrasias Center, Department of Hematology, Faculty of Medicine, Jagiellonian University College of Medicine, Kraków, Poland
A – research concept and design; B – collection and/or assembly of data; C – data analysis and interpretation; D – writing the article; E – critical revision of the article; F – final approval of the article
Advances in Clinical and Experimental Medicine, ISSN 1899–5276 (print), ISSN 2451–2680 (online) Adv Clin Exp Med. 2022;31(1):95–100

G. Charliński, A. Jurczyszyn. Non-secretory multiple-myeloma96
Introduction
Multiple myeloma (MM) is a blood cancer that arises from clonal plasmocytes (CP) that accumulate in the bone marrow (BM) and, in most cases, produce monoclonal (M) protein. Infiltration of CP may occur at extramedul-lary sites and/or in peripheral blood during disease pro-gression.1 Multiple myeloma is the 2nd most frequently diagnosed hematologic malignancy and accounts for 10–15% of all blood cancers and 1–1.8% of all cancers. The incidence of MM in Europe is 4.5–6.0/100,000/year.2 According to the National Health Fund (Narodowy Fun-dusz Zdrowia (NFZ)) data, there were nearly 2600 new MM cases in Poland in 2016.3 The median age at MM diagnosis is 72 years.2 Over 90% of patients are >50 years old at MM diagnosis, while only 2% of patients are younger than 40 years.4 Currently, the median overall survival (OS) of MM patients is approx. 6 years.5 In the subgroup of pa-tients treated with high-dose (HD) chemotherapy with
autologous stem cell transplantation (ASCT), the me-dian OS is approx. 8 years.6 In comparison, it is shorter in the subgroup of patients >75 years of age and amounts to approx. 5 years.5 In 2014, the criteria for the diagnosis of MM were modified (Table 1).7 One of the primary crite-ria for the diagnosis of MM are CP that produce M-protein. This is typically M-protein of the immunoglobulin (Ig) G, IgA or free light chains (FLCs) of the kappa or lambda type, which account for 54%, 21% and 16% of all MM cases, respectively.8 Monoclonal IgD protein is found in less than 2% of MM patients. Notably, M-protein is not present in se-rum or urine in approx. 3–5% of patients meeting the cri-teria for MM diagnosis.9 These types of MM are generally referred to as non-secretory (NS) MM. The introduction of serum FLC (sFLC) as part of laboratory diagnostics has confirmed both, the prevalence and change in the defini-tion of NSMM. Currently, it is believed that approx. 2% of MM patients are diagnosed with true NSMM in which M-protein is not found by standard testing.10
Objectives
This article aims to present the current terminology and principles of diagnosis and treatment of patients with NSMM.
Methodology
Data on the diagnosis and treatment of NSMM presented in this article are based on published studies available in the PubMed online database. Based on selected key words, we identified 358 articles related to NSMM. After reviewing them, 52 full papers were included, 14 of which are included in this article. The PRISMA flow diagram is presented as Fig. 1.
Mechanisms of monoclonal protein production
The M-protein found in the serum and/or urine of pa-tients with MM may take the following forms11:
1. high concentration of whole Ig molecules composed of heavy and light chains;
2. high concentration of whole Ig molecules with an ad-ditional high concentration of light chains not associated with heavy chains;
3. free light chains in the presence of very little or even no total Ig; and
4. free heavy chains in the absence of associated light chains.
The reasons for the inhibition of M-protein produc-tion, or secretion by CP, are not fully understood. One cause of true NSMM is the loss of the ability of CP
Table 1. Revised IMWG diagnostic criteria for monoclonal gammopathy of undetermined significance, smoldering multiple myeloma and multiple myeloma itself7
Definition of monoclonal gammopathy of undetermined significance
Both criteria must be met: – serum M-protein (IgG or IgA) <3 g/dL and/or urinary <500 mg/24 h and – clonal plasmocytes (CP) in bone marrow <10%
– absence of organ damage resulting from proliferation of clonal plasmocytes or amyloidosis
Definition of smoldering multiple myeloma
Both criteria must be met: – serum M-protein (IgG or IgA) ≥3 g/dL and/or urinary ≥500 mg/24 h and/or – clonal plasmocytes in bone marrow 10–60%
– absence of organ damage resulting from proliferation of clonal plasmocytes or amyloidosis
Definition of multiple myeloma
Both criteria must be met: – clonal plasmocytes in bone marrow ≥10% or extramedullary plasmacytoma – ≥1 of the following types of organ damage resulting from CP proliferation:
– organ damage resulting from the proliferation of CP, specifically:•hypercalcemia: serum calcium >0.25 mmol/L (>1 mg/dL) higher
than upper limit of normal or >2.75 mmol (>11 mg/dL)•renal insufficiency: creatinine clearance <40 mL/min or serum
creatinine >177 µmol/L (>2 mg/dL)•anemia: hemoglobin concentration >2 g/dL below the lower limit
of normal, or a hemoglobin concentration <10 g/dL•bone lesion(s): ≥1 osteolytic lesion on skeletal radiography, CT
or PET/CT
– ≥1 of the following biomarkers of malignancy (SLiM):•clonal plasmocytes in bone marrow ≥60%• involved: uninvolved sFLCr ≥100•>1 focal lesions (≥5 mm in size) on MRI
CT – computed tomography; IgG – immunoglobulin G; IMWG – International Myeloma Working Group; M-protein – monoclonal protein; MRI – magnetic resonance imaging; PET/CT – positron emission tomography/computed tomography; sFLCr – serum free light chain ratio.

Adv Clin Exp Med. 2022;31(1):95–100 97
to initially secrete heavy chains and then light chains of Ig.12 Other possible causes and hypotheses include: the loss of the polyadenylation site necessary for extracellu-lar Ig secretion13; loss of the heavy chain V domain, which leads to the decreased secretion and increased intracellular Ig destruction14; loss of the ability to produce M-protein due to the mutation of the Ig light chain14; the secretion of heavy chains (which are considered toxic to plasmo-cytes) by plasmocytes which may promote their survival during clonal evolution in MM.15
Types of NSMM
The International Myeloma Working Group (IMWG) defines NSMM as MM in the absence of M-protein in the serum and/or urine protein immunofixation as-say.7,16 Thus, this definition does not include MM with light chains only detected with the sFLC assay.9,17 For this reason, the current definition is insufficient. As CP secretes the Ig component, cases of NSMM can be fur-ther classified into at least 2 distinct categories with subcategories18:
1. non-secretory MMs (85% of cases):
• oligo-secretory/FLC-restricted MMs: in most cases, the light chains are detected using the sFLC assay. In cases of oligo-secretory MM, serum M-protein <1.0 g/dL, urine M-protein <200 mg/24 h and sFLC values <100 mg/L are common;
• true NSMMs: CP produces M-protein, but is unable to secrete it into the extracellular space;
• false NSMMs: the immunofluorescence test shows the presence of M-protein inside CP, but no extracel-lular M-protein is found using standard laboratory tests;
2. non-producing MMs (15% of cases): no Ig production by CP is found.
Figure 2 shows the infiltration of CP in the BM of a pa-tient with NSMM.
Diagnosis and monitoring of NSMM
The diagnostic tests recommended for patients with sus-pected NSMM are the same as those recommended for patients with secreting MM. Besides diagnosing NSMM, one purpose of these tests is to identify the presence
Fig. 1. PRISMA flow diagram
PRISMA 2020 flow diagram for updated systema�c reviews which included searches of databases, registers and other sources
Records identified fromdatabases search (n = 330)
Records removed before screening:
Records removed for other reasons (n = 278)
Records screened(n = 52)
Records excluded**(n = 38)
Reports sought for retrieval(n = )
Reports not retrieved(n = )
Reports assessed for eligibility(n = )
Reports excluded:Reason 1 (n = )Reason 2 (n = )Reason 3 (n = )etc.
Records identified from:Websites (n = )Organisations (n = )Citation searching (n = )etc.
Reports assessed for eligibility(n = )
Reports excluded:Reason 1 (n = )Reason 2 (n = )Reason 3 (n = )etc.
New studies included in review(n = )Reports of new included studies(n = )
Identification of new studies via databases and registers Identification of new studies via other methods
Iden
tific
atio
nSc
reen
ing
Incl
uded
Total studies included in review(n = 4)Reports of total included studies(n = 10)
Studies included in previous version of review (n = )
Reports of studies included in previous version of review (n = )
Previous studies
Reports sought for retrieval(n = )
Reports not retrieved(n = )
Consider, if feasible to do so, reporting the number of records identified from each database or register searched (rather than the total number across all databases/registers).**If automation tools were used, indicate how many records were excluded by a human and how many were excluded by automation tools.
From: Page MJ, McKenzie JE, Bossuyt PM, et al. The PRISMA 2020 statement: An updated guideline for reporting systematic reviews. BMJ. 2021;372:n71. doi:10.1136/bmj.n71.
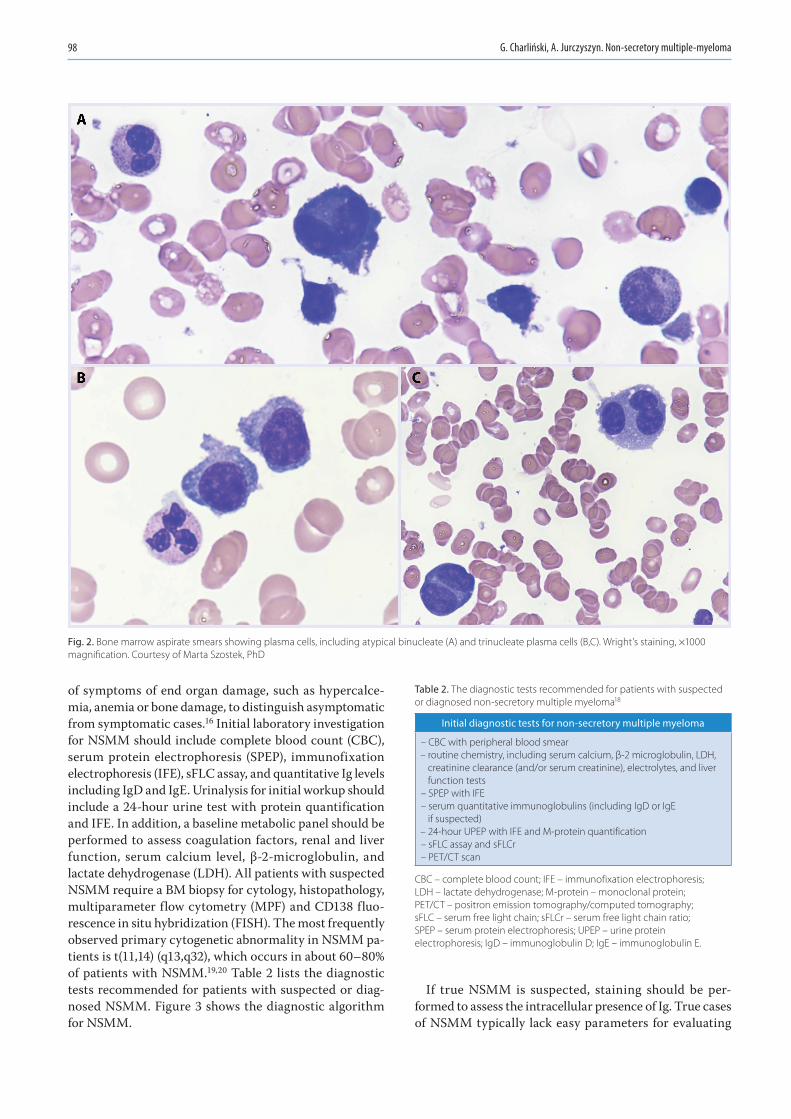
G. Charliński, A. Jurczyszyn. Non-secretory multiple-myeloma98
of symptoms of end organ damage, such as hypercalce-mia, anemia or bone damage, to distinguish asymptomatic from symptomatic cases.16 Initial laboratory investigation for NSMM should include complete blood count (CBC), serum protein electrophoresis (SPEP), immunofixation electrophoresis (IFE), sFLC assay, and quantitative Ig levels including IgD and IgE. Urinalysis for initial workup should include a 24-hour urine test with protein quantification and IFE. In addition, a baseline metabolic panel should be performed to assess coagulation factors, renal and liver function, serum calcium level, β-2-microglobulin, and lactate dehydrogenase (LDH). All patients with suspected NSMM require a BM biopsy for cytology, histopathology, multiparameter flow cytometry (MPF) and CD138 fluo-rescence in situ hybridization (FISH). The most frequently observed primary cytogenetic abnormality in NSMM pa-tients is t(11,14) (q13,q32), which occurs in about 60–80% of patients with NSMM.19,20 Table 2 lists the diagnostic tests recommended for patients with suspected or diag-nosed NSMM. Figure 3 shows the diagnostic algorithm for NSMM.
If true NSMM is suspected, staining should be per-formed to assess the intracellular presence of Ig. True cases of NSMM typically lack easy parameters for evaluating
Table 2. The diagnostic tests recommended for patients with suspected or diagnosed non-secretory multiple myeloma18
Initial diagnostic tests for non-secretory multiple myeloma
– CBC with peripheral blood smear – routine chemistry, including serum calcium, β-2 microglobulin, LDH, creatinine clearance (and/or serum creatinine), electrolytes, and liver function tests – SPEP with IFE – serum quantitative immunoglobulins (including IgD or IgE if suspected) – 24-hour UPEP with IFE and M-protein quantification – sFLC assay and sFLCr – PET/CT scan
CBC – complete blood count; IFE – immunofixation electrophoresis; LDH – lactate dehydrogenase; M-protein – monoclonal protein; PET/CT – positron emission tomography/computed tomography; sFLC – serum free light chain; sFLCr – serum free light chain ratio; SPEP – serum protein electrophoresis; UPEP – urine protein electrophoresis; IgD – immunoglobulin D; IgE – immunoglobulin E.
Fig. 2. Bone marrow aspirate smears showing plasma cells, including atypical binucleate (A) and trinucleate plasma cells (B,C). Wright’s staining, ×1000 magnification. Courtesy of Marta Szostek, PhD

Adv Clin Exp Med. 2022;31(1):95–100 99
treatment efficacy. For this reason, sensitive skeletal ex-aminations, including positron emission tomography (PET)/computed tomography (CT), are recommended. It is thought that by performing PET/CT together with BM examination, the effectiveness of the applied NSMM treatment can be objectively assessed.21 In general, monitoring the response of NSMM treatment is a challenge for both, hematologists and oncologists. The abovementioned methods are cur-rently considered the “gold standard” for monitoring re-sponses in all MM types, including BM aspiration in NSMM cases and MM tumor biopsy. The primary method used to monitor treatment response in patients with oligose-cretory MM is the sFLC assay. A more sensitive test used to assess BM cells, including CP, is MPF.22 Simultaneous BM examination with MPF and sensitive imaging (e.g., magnetic resonance imaging (MRI) or PET/CT) is currently the best way to assess the effectiveness of treatment in patients with NSMM.23,24
During induction treatment of patients with NSMM, it is recommended to repeat BM biopsy every 3–6 months and whole body PET/CT examination every 6–12 weeks, especially for cases of true NSMM. For patients who achieve remission after treatment or during maintenance treatment, it is recommended to repeat BM biopsy and PET/CT scan every 3–6 months.25
Treatment of NSMM
Considering the rarity of NSMM and the ineligibility of patients with NSMM for clinical trials, its clinical course and prognosis are not fully known. We do not have con-clusive data to suggest that the efficacy of NSMM treat-ment differs from that of secreting MM. The literature is dominated by case reports and retrospective analyses of small groups of NSMM patients. In 2020, PubMed pub-lished 8 case reports and 1 retrospective treatment analysis
of patients with NSMM. Retrospective studies investigated standard treatments for NSMM patients with conventional chemotherapy and HD chemotherapy followed by ASCT. In one of the largest retrospective studies, Chawla et al. examined the survival and prognosis of 124 patients with NSMM. The median progression-free survival (PFS) was 28.6 months and the median OS was 49.3 months. In-vestigators found that the time to progression, PFS, and OS before 2001 were all comparable to those for patients with secretory MM.26 There has been a significant im-provement in patient outcomes: median survival was 43.8 months before 2001 compared to 99.2 months for 2001–2012 (p < 0.001). For patients diagnosed in the period of 2001–2012, OS was better in NSMM cases than in secre-tory MM cases (median survival of 8.3 years vs 5.4 years, p = 0.03). There were no survival differences in patients treated with HD chemotherapy followed by ASCT.26 In a study by Kumar et al., of 110 patients with NSMM treated with ASCT, the median PFS and OS were 30 months and 69 months, respectively. Three-year PFS in NSMM and secretory MM cases was 40% and 33%, respectively (p = 0.05), while three-year OS was 66% and 61%, respec-tively (p = 0.26).27 Due to the higher occurrence of t(11,14) in NSMM, a change in treatment is expected in the near future. Studies by Smith et al.28 and Terpos et al.29 found longer survival times (PFS, OS) in patients with NSMM. The results of selected retrospective studies of patients with NSMM are presented in Table 3.
Conclusions
Non-secretory MM is a rare type of MM. We lack data to determine the prevalence of NSMM in Poland. Extrapo-lating data obtained from other countries, we can expect approx. 25–50 new NSMM cases per year in Poland.
Given the subtypes and pathogenesis of NSMM, the defi-nition of this form of MM is likely to change in the near future. Due to the difficulties in assessing the effectiveness of treatment, patients with NSMM usually do not qualify for prospective clinical trials. As a result, the available data are typically the results of retrospective studies or case reports. Currently, treatments for NSMM are the same
Table 3. Treatment outcomes of non-secretory myeloma in selected retrospective studies
ReferencesNumber
of patientswith NSMM
Median OS [months]
Median PFS [months]
Chawla et al.26 124 49.3 28.6
Kumar et al.27 110 62 30
Smith et al. 28 13 46 N/A
Terpos et al.29 6 four-year: 100% 36.1
NSMM – non-secretory multiple myeloma; OS – overall survival; PFS – progression free survival; N/A – not applicable.
Fig. 3. Algorithm for the diagnosis of non-secretory multiple myeloma
CP – clonal plasmocytes; sFLC – serum free light chain; MM – multiple myeloma; BM – bone marrow; IFX – immunofixation; Ig – immunoglobulin.
≥10% CP in BM+ SLiM biomarkers/CRAB criteria
M-protein (in IFX)
sFLC secretory MM
oligosecretory MM non-secretory MM
Ig detectable in the cytoplasm
non-producing MMtrue non-secretory MM
no
no
no
yes
yes
yes

G. Charliński, A. Jurczyszyn. Non-secretory multiple-myeloma100
as those for secretory MM. Given the higher incidence of t(11,14), we may soon see a change in the treatment for this subgroup of MM. There is undoubtedly a need for more research into this rare type of MM.
ORCID iDsGrzegorz Charliński https://orcid.org/0000-0002-0595-5864Artur Jurczyszyn https://orcid.org/0000-0001-9796-8365
References1. Kumar SK, Rajkumar SV, Kyle RA, et al. Multiple myeloma. Nat Rev Dis
Primers. 2017;3:17046. doi:10.1038/nrdp.2017.462. Palumbo A, Bringhen S, Ludwig H, et al. Personalized therapy in mul-
tiple myeloma according to patient age and vulnerability: A report of the European Myeloma Network (EMN). Blood. 2011;118(17): 4519–4529. doi:10.1182/blood-2011-06-358812
3. Narodowy Fundusz Zdrowia. Szpiczak plazmocytowy (mnogi). Ocena jakości informacyjnej rejestru kontraktowego. https://www.nfz.gov.pl/aktualnosci/aktualnosci-centrali/nowy-raport-nfz-szpiczak-plaz mocytowy,7543.html. Accessed June 29, 2021.
4. Jurczyszyn A, Nahi H, Avivi I, et al. Characteristics and outcomes of patients with multiple myeloma aged 21–40 years versus 41–60 years: A multi-institutional case-control study. Br J Haematol. 2016;175(5): 884–891. doi:10.1111/bjh.14328
5. Durie BGM, Hoering A, Abidi M, et al. Bortezomib with lenalido-mide and dexamethasone versus lenalidomide and dexamethasone alone in patients with newly diagnosed myeloma without intent for immediate autologous stem-cell transplant (SWOG S0777): A ran-domised, open-label, phase 3 trial. Lancet. 2017;389(10068):519–527. doi:10.1016/S0140-6736(16)31594-X
6. Attal M, Lauwers-Cances V, Hulin C, et al. Lenalidomide, bortezomib, and dexamethasone with transplantation for myeloma. N Engl J Med. 2017;376(14):1311–1320. doi:10.1056/NEJMoa1611750
7. Rajkumar SV, Dimopoulos M, Palumbo A, et al. International myelo-ma working group updated criteria for the diagnosis of multiple myeloma. Lancet Oncol. 2014;15(12):e538–e548. doi:10.1016/S1470-2045(14)70442-5
8. Sharma A, Binazir T, Sintow A, Lee CC, Shaharyar S, Tache J. An extreme-ly rare manifestation of multiple myeloma: An immunoglobulin D secreting testicular plasmacytoma. Cureus. 2017;9(6):e1400–e1406. doi:10.7759/cureus.1400
9. Lonial S, Kaufman JL. Non-secretory myeloma: A clinician’s guide. Oncology. 2013;27(9):924–930. PMID:24282993
10. Rajkumar SV. Multiple myeloma: 2020 update on diagnosis, risk-stratification and management. Am J Hematol. 2020;95(5):548–567. doi:10.1002/ajh.25791
11. Corso A, Mangiacavalli S. Non-secretory myeloma: Ready for a new definition? Mediterr J Hematol Infect Dis. 2017;9(1):e2017053. doi:10. 4084/MJHID.2017.053
12. Preud’Homme JL, Hurez D, Danon F, Brouet JC, Sligmann M. Intracy-toplasmic and surface-bound immunoglobulins in “nonsecretory” and Bence–Jones myeloma. Clin Exp Immunol. 1976;25(3):428–436. PMID:822974
13. Cogné M, Preud’Homme JL. Gene deletions force nonsecretory alpha-chain disease plasma cells to produce membrane-form alpha-chain only. J Immunol. 1990;145(8):2455–2458. PMID:2120331
14. Cogné M, Guglielmi P. Exon skipping without splice site mutation accounting for abnormal immunoglobulin chains in nonsecretory human myeloma. Eur J Immunol. 1993;23(6):1289–1293. doi:10.1002/eji.1830230615
15. Decourt C, Galea HR, Sirac C, Cogné M. Immunologic basis for the rare occurrence of true nonsecretory plasma cell dyscrasias. J Leukoc Biol. 2004;76(3):528–536. doi:10.1189/jlb.0803382
16. The International Myeloma Working Group. Criteria for the classifica-tion of monoclonal gammopathies, multiple myeloma, and related disorders: A report of the International Myeloma Working Group. Br J Haematol. 2003;121(5):749–757. PMID:12780789
17. Lonial S, Kaufman JL. Non-secretory myeloma: A clinician’s guide. Oncology. 2013;27(9):924–928. PMID:24282993
18. Dupuis MM, Tuchman SA. Non-secretory multiple myeloma: From biology to clinical management. Onco Targets Ther. 2016;15(9):7583–7590. doi:10.2147/OTT.S122241
19. Dimopoulos MA, Moreau P, Terpos E, et al. Multiple myeloma: EHA-ESMO Clinical Practice Guidelines for diagnosis, treatment, and follow-up. Ann Oncol. 2021;32(3):309–322. doi:10.1016/j.annonc.2020.11.014
20. Avet-Loiseau H, Garand R, Lodé L, Harousseau JL, Bataille R; Inter-groupe Francophone du Myélome. Translocation t(11;14)(q13;q32) is the hallmark of IgM, IgE, and nonsecretory multiple myeloma vari-ants. Blood. 2003;101(4):1570–1571. doi:10.1182/blood-2002-08-2436
21. Nandakumar B, Kumar SK, Dispenzieri A, et al. Cytogenetic features and clinical outcomes of patients with non-secretory multiple myeloma in the era of novel agent induction therapy. Clin Lymphoma Myeloma Leuk. 2020;20(1):53–56. doi:10.1016/j.clml.2019.09.624
22. Zamagni E, Cavo M. The role of imaging techniques in the man-agement of multiple myeloma. Br J Haematol. 2012;159(5):499–513. doi:10.1111/bjh.12007
23. Paiva B, Martinez-Lopez J, Vidriales MB, et al. Comparison of immunofix-ation, serum-free light chain, and immunophenotyping for response evaluation and prognostication in multiple myeloma. J Clin Oncol. 2011;29(12):1627–1633. doi:10.1200/JCO.2010.33.1967
24. Durie BGM, Harousseau JL, Miguel JS, et al. International uniform response criteria for multiple myeloma. Leukemia. 2006;20(9): 1467–1473. doi:10.1038/sj.leu.2404284
25. Regelink JC, Minnema MC, Terpos E, et al. Comparison of modern and conventional imaging techniques in establishing multiple myelo-ma-related bone disease: A systematic review. Br J Haematol. 2013; 162(1):50–61. doi:10.1111/bjh.12346
26. Chawla SS, Kumar SK, Dispenzieri A, et al. Clinical course and prognosis of non-secretory multiple myeloma. Eur J Haematol. 2015;95(1):57–64. doi:10.1111/ejh.12478
27. Kumar S, Perez WS, Zhang MJ, et al. Comparable outcomes in non-secretory and secretory multiple myeloma after autologous stem cell transplantation. Biol Blood Marrow Transplant. 2008;14(10):1134–1140. doi:10.1016/j.bbmt.2008.07.011
28. Smith DB, Harris M, Gowland E, Chang J, Scarffe JH. Non-secretory multiple myeloma: A report of 13 cases with a review of the litera-ture. Hematol Oncol. 1986;4(4):307–313. doi:10.1002/hon.2900040407
29. Terpos E, Apperley JF, Samson D, et al. Autologous stem cell trans-plantation in multiple myeloma: Improved survival in nonsecreto-ry multiple myeloma but lack of influence of age, status at trans-plant, previous treatment and conditioning regimen. A single-centre experience in 127 patients. Bone Marrow Transplant. 2003;31:163–170. doi:10.1038/sj.bmt.1703818
Copyright © 2022 FDOKUMEN