Bridging Principles and Mixture Classification under CLP and ...
Upload
khangminh22Category
view
1download
0
2021Sustainability ReportStock Code: 00002

2021 Performance Highlights25.1%
Non-carbon generating energy capacity (as a percentage of total capacity)
76%Percentage of operating earnings from non-carbon generating assets and transmissions, distribution and retail
44%Percentage of capital investment in non-carbon generating assets and transmissions, distribution and retail
660MWCapacity of energy storage solutions (pumped hydro and battery storage)
CLP Group
Climate resiliencestudies conducted for assets across the Group
0 Cases of customer data loss
CLP Power Hong Kong
0.21System Average Interruption Frequency Index (SAIFI) - CLPP
0.23 hours
System Average Interruption Duration Index (SAIDI) – CLPP
0.99Unplanned Customer Minutes Lost (CML) – CLPP
Customers Employees
0Fatalities – employees and contractors
>2.1mNumber of smart meters connected for customers in Hong Kong and Australia
0.07per 200,000 manhoursLost Time Injury Rate (LTIR) – employees and contractors
12.3%Women in engineering
51.6Average training hours per employee
HK$91mInvestment in innovationsto support customer solutions development
Communities
HK$15mTotal donations
1,580,000+Direct beneficiaries
30.5%Women in leadership positions
Shaping and executing the transition to net-zeroInvesting in a clean, just and fair energy transition with multi-stakeholder collaboration.
NET-ZERO
2050
Reinforcing resilience in a changing operating environmentStrengthening mitigation and adaptation measures for disruptive events in an evolving environment.
Aligning business activities with community, employee and customer expectationsMeeting changing customer expectations in the utilities sector. Being a responsible corporate citizen.
0.57 kg CO2e/kWh
CLP Group's GHG intensity
265 MWApproved or connected to grid under the Feed-in-tariff scheme in Hong Kong at the end of 2021
>15.4 GWhSales of Renewable Energy Certificates in Hong Kong
2021 Performance Highlights
CLP Holdings 2021 Sustainability Report | 2

Contents
Welcome About this Report Materiality Assessment Standard ESG disclosures
Welcome to CLPʼs 2021 Sustainability Report 4
Chairman and CEO message 5
About this Report 7
Reporting frameworks and content indices 8
Reporting scope and data verification 10
Materiality Assessment 13
The assessment process 29
Impact material topics 31
Standard ESG disclosures 33
Corporate governance 34
Safety 46
Environment and climate change 61
Asset management 80
Supply chain 92
Community 98
People 117
Customers 134
Key performance metrics 152
Glossary 160
CLP Holdings 2021 Sustainability Report | 3

Welcome to CLPʼs 2021 Sustainability Report
Welcome About this Report Materiality Assessment Standard ESG disclosures
In 2021, CLP celebrated its 120th anniversary. For more than 12 decades, CLP has shared a vision with the communities it serves, evolving from a small power plant on Chatham Road in Hong Kong, to become a leading responsible energy provider in the Asia-Pacific region.
In its long history, CLP Holdings Limited (the Group) and its communities have experienced many opportunities and challenges. 2021 provided no shortage of challenges, including the continuation of the COVID-19 pandemic, global supply chain disturbances, widening wealth gaps, increased cyber threats, and the negative impact of climate change becoming more prominent. CLP takes its responsibility seriously not simply to continue its services, but to support its many stakeholders, helping them weather these challenges and facilitate their transition to a low-carbon economy.
Despite the uncertain circumstances, the Group’s unwavering focus on creating value for shareholders, customers, employees and the wider community in the longer term continues. This year, to communicate with its stakeholders better, the Company renewed its materiality assessment.
In continuing its analysis of how megatrends impact the operating environment and long-term sustainability of its business, CLP has adopted a double-materiality approach. Financially material topics which may be of most interest to shareholders and other capital providers are discussed in the Annual Report; impact material topics which reflect positive or negative impacts on people, the environment or the economy are covered in this Sustainability Report. In addition, to address the growing interest in climate-related financial disclosures, CLP prepared a standalone Climate-related Disclosures Report for the first time.
CLP’s new reporting approach aims to help all stakeholders find the information of their interest more easily. This is one of the key steps towards a consistent and effective engagement process.
Feedback on this report is welcome, and can be sent through CLP’s online survey or via email ([email protected]). As a token of CLP's appreciation, each stakeholder who sends feedback on or before 30 June 2022 will receive four CLP Carbon Credits, which can be used to offset their own carbon footprint.
A view from above of Sihong Solar Power Station in Mainland China.
CLP Holdings 2021 Sustainability Report | 4

Welcome About this Report Materiality Assessment Standard ESG disclosures
Chairman and CEO message
“2021 has been a year of conscientious effort and commitment at CLP. We have been adapting and building our resilience to COVID-19, sustaining operational excellence and strengthening our commitment to decarbonisation.”The Honourable Sir Michael David Kadoorie, Chairman (left) and Richard Lancaster, Chief Executive Officer (right)
More than two years into the pandemic, we continued to make it our priority to look after people – our colleagues, customers and communities. Many of our markets have seen the beginning of their economic recovery from COVID-19 although a recent surge in variant cases is disrupting the course.
In the face of the pandemic and many other challenges, we remain committed to a holistic approach to addressing the interests of our different stakeholders. That’s why we have strengthened our sustainability and financial reporting by assessing the issues facing CLP from both the impact, or stakeholders’ perspective, and the financial perspective in further detail. Our Sustainability Report focuses on impact material topics affecting a wide range of our stakeholders while our Annual Report delves into financially-material topics which are more relevant to our shareholders and other capital providers.
Transitioning to net zeroOne of our stakeholders’ key interests is how we shape and execute our transition to net zero. Climate change undeniably represents a major risk to our communities and our business. Among our operating markets, Hong Kong, Mainland China, Australia, India, Thailand and Taiwan have all committed to net-zero emissions. Our strategy recognises not only our own journey to net zero, but also our ability to play a key role in supporting the decarbonisation of the communities where we operate and to leverage the opportunities presented.
In September, we unveiled our updated Climate Vision 2050 with a commitment to achieve net-zero emissions across our business by 2050. We brought forward the date of the complete phase-out of the coal-fired generation assets in our portfolio to 2040, a decade earlier than previously pledged.
CLP Holdings 2021 Sustainability Report | 5

Welcome About this Report Materiality Assessment Standard ESG disclosures
We have also set new science-based targets for 2030 and further strengthened our 2040 targets to align with what the latest climate science deems necessary to meet the goals of limiting global warming to well-below 2°C above pre-industrial levels. To pursue efforts to limit global warming to 1.5°C, we remain committed to strengthening our decarbonisation targets at least every five years.
As we race against time and move towards net zero, careful long-term planning and coordination to balance different interests as well as large-scale investments to support the transition will become ever more critical.
Reinforcing resilienceIn a changing operating environment, CLP’s efforts in reinforcing its resilience is also of foremost importance. During the year, our business continued to exercise the agility and dedication to maintain a high level of resilience against challenges such as the global pandemic, supply chain disruptions and cyber threats.
We are also gearing up to protect our assets from physical damage caused by the impacts of extreme weather conditions while continuing our investment in related risk management technology and innovative adaptation practices. Meanwhile, ongoing efforts are being made to improve the efficiency of our assets and to optimise our power grids.
For instance, in Hong Kong, we updated our climate change risk assessment of all our power generation, transmission and distribution assets in 2021 and enhanced our adaptation measures underway in our operations to keep our service highly reliable.
Furthermore, to strengthen our cyber resilience, we focused on developing a security risk management strategy to deliver holistic and coordinated protection to our operations, with the help of new technologies. A cyber monitoring centre is also planned in Shenzhen to support CLP’s efforts in capturing the growing business opportunities in the Greater Bay Area.
Creating value for stakeholdersWith an unwavering focus on our stakeholders, we have been dedicating ourselves to aligning with the expectations of our communities, employees and customers, among others. To encourage our customers to embrace low-carbon lifestyles, we continued promoting energy efficiency with a range of innovative solutions and installing smart meters across our supply areas in Hong Kong and Australia to help users better manage their electricity use.
In the corporate sector, one of our key achievements over the year was successfully developing Hong Kong’s largest battery energy storage system with the Airport Authority Hong Kong. It comprises a predictive control system for air conditioning in one of the airport’s terminals and serves as an emergency back-up power supply system.
To provide the best service we can and to keep our business thriving for years to come, support from our people is critical for our success. We spare no effort to foster agility, diversity and inclusion, maintain a healthy working environment, support our people to achieve their potential and attract talent to seize new opportunities for a net-zero, digitally-enabled future. In our Value Framework and newly launched Group Labour Standards, we also reaffirmed our commitment to respect internationally recognised human rights relevant to our operations – one of our cornerstone values.
2021 was CLP’s 120th anniversary. During the year, we took the opportunity to reinforce our long-standing commitment to Hong Kong and deepen our connections with the communities of which we have been a proud member since 1901.
Looking forward to 2022 and beyond, we are determined to work closely with our partners and the governments in our markets to support the realisation of climate targets, deliver a credible decarbonisation plan, and leverage technology to serve growing customer demand for energy solutions. Most important of all, building and organising an agile, innovative workforce with the right values and ability to thrive regardless of the external environment will come to define what CLP truly stands for as a Utility of the Future.
The Honourable Sir Michael David KadoorieChairman
Richard LancasterChief Executive Officer
Hong Kong, 28 February 2022
CLP Holdings 2021 Sustainability Report | 6

Welcome About this Report Materiality Assessment Standard ESG disclosures
CLP Holdings 2021 Sustainability Report | 7

Welcome About this Report Materiality Assessment Standard ESG disclosures
Reporting frameworks and content indices
Reporting scope and data verification
Reporting frameworks and content indicesCLP recognises the diversity of methodologies used globally to measure the sustainability performance of organisations. This report references several reporting guidelines and frameworks to ensure comparability—an approach aligned with international best practices.
Value Reporting Foundation and International Sustainability Standards Board• The establishment of the Value Reporting Foundation
(VRF), arising from the merger of the International Integrated Reporting Council (IIRC) and the Sustainability Accounting Standards Board (SASB) in June 2021, and its consolidation with the International Sustainability Standards Board (ISSB) and the Climate Disclosure Standard Board (CDSB) announced in November 2021, marked key progress towards simplification of the reporting landscape.
• VRF continues to develop disclosure requirements. For its 2021 Annual and Sustainability Reports, CLP has referenced the suite of tools currently available, namely the Integrated Thinking Principles, the Integrated Reporting Framework, and the SASB Standards for Electric Utilities & Power Generators.
Download the SASB Content Index for Electric Utilities & Power Generators
The Stock Exchange of Hong Kong's Environmental, Social and Governance (ESG) Reporting Guide• Companies listed on the Hong Kong Stock Exchange (HKEx)
are required to meet the ESG Reporting Guide disclosure obligations from financial years commencing on or after 1 July 2020. The Guide was updated in 2019 after extensive consultation conducted by HKEx.
• CLP’s Annual and Sustainability Reports have adopted the new disclosure obligations since the 2019 reporting cycle. In particular, the materiality assessment process, as outlined under the mandatory disclosure requirements, has been applied to prioritise CLP's response to the "comply or explain" provisions of the Environmental and Social Aspects of the ESG Reporting Guide.
Download the HKEx ESG Reporting Guide Content Index
Task Force on Climate-related Financial Disclosures (TCFD)• The TCFD develops voluntary, consistent climate-related
financial risk disclosure recommendations for use by companies in providing information to investors, lenders, insurers and other stakeholders. The recommendations consider the physical, liability and transition risks associated with climate change and what constitutes effective financial disclosures across industries.
• CLP has produced a standalone Climate-related Disclosures Report in accordance with the TCFD recommendations to assist stakeholders seeking climate-related information. The report references the TCFD’s latest publications, including the Guidance on Scenario Analysis for Non-Financial Companies (October 2021), Annex: Implementing the Recommendations of the Task Force on Climate-related Financial Disclosures (October 2021), and Guidance on Metrics, Targets, and Transition Plans (October 2021).
• Different organisations are developing frameworks and guidelines to facilitate TCFD disclosures, including the ISSB's Climate-related Disclosures Prototype, released in November 2021, and the HKEx's Guidance on Climate Disclosures (November 2021).
• Other guidance documents developed for electric utilities were also referenced. Most notably are those published by the World Business Council for Sustainable Development (WBCSD), where CLP is participating in several TCFD working groups. These documents include the WBCSD TCFD Electric Utilities Preparer Forum Report, published in June 2019, and Evaluating climate-related financial impacts on power utilities, published in November 2021.
Download CLP’s 2021 Climate-related Disclosures Report
CLP Holdings 2021 Sustainability Report | 8

Welcome About this Report Materiality Assessment Standard ESG disclosures
Reporting frameworks and content indices
Reporting scope and data verification
Greenhouse Gas Emissions• CLP's greenhouse gas (GHG) emissions are reported with
reference to: the World Resources Institute (WRI) / WBCSD GHG Protocol; the Intergovernmental Panel on Climate Change Guidelines for National Greenhouse Gas Inventories (2006); the International Standard for GHG Emissions ISO 14064; and relevant local statutory guidelines where applicable.
• To facilitate implementation, in 2007 CLP developed the first version of the Group-wide GHG reporting guideline which referenced the guidelines above. This reporting guideline is reviewed in accordance with CLP's practice at least every three years. In 2019, CLP enhanced its GHG disclosure to also include Scope 3 emissions.
Global Reporting Initiative (GRI)• The GRI is an international independent organisation
which provides widely used standards for sustainability reporting. CLP’s reports have reported with reference to the GRI Reporting Framework since 2007.
• This report has been prepared in accordance with the GRI Universal Standards 2021. It also reports on the GRI G4 Electric Utilities Sector Disclosures, covering key aspects of sustainability performance which are meaningful and relevant to the electric utility sector.
Download the GRI Content Index
Financial dataAll financial data in this report is consistent with the figures published in the audited financial statements of CLP's 2021 Annual Report. These financial statements were prepared in accordance with the Hong Kong Financial Reporting Standards (HKFRS) issued by the Hong Kong Institute of Certified Public Accountants (HKICPA) and the requirements of the Hong Kong Companies Ordinance (Cap.622).
CLP Holdings 2021 Sustainability Report | 9

Welcome About this Report Materiality Assessment Standard ESG disclosures
Reporting frameworks and content indices
Reporting scope and data verification
Reporting scope and data verificationGRI reference: 2-2, 2-3, 2-4
This report covers the CLP Group’s sustainability performance for the calendar year ending 31 December 2021. It is published at the same time as the CLP Annual Report. The previous CLP Sustainability and Annual Reports were published in March 2021.
CLP reviews its reporting scope regularly to ensure the material impact of the Group’s overall portfolio is covered. In 2021, there were no major changes to the reporting scopes of its ESG metrics.
CLP has continued to enhance the disclosure of ESG metrics, and the highlights are as follows:
• Health, Safety and Environment (HSE): CLP has broadened the disclosure of safety and environmental metrics to meet external reporting requirements. New disclosures include: high-consequence injuries (representing life threatening or life-altering work-related injuries), mercury emissions and a number of water metrics. Several existing safety metrics have been revised to align with international reporting practices, and additional safety metrics are now independently assured.
• Asset management: CLP has started to report the sent out of each type of renewable energy, namely solar, hydro, wind and waste-to-energy. It complements the existing disclosure on the generation capacity of the individual components of the renewable energy portfolio. Individual data points are independently assured. The total capacity and total sent out of the portfolio are also provided in the report to enable performance assessment.
• Climate Vision 2050: CLP has converted the carbon emissions intensity (kg CO2/kWh) to GHG emissions intensity (kg CO2e/kWh) to align with the updated Climate Vision 2050 targets. Disclosure on the GHG emissions of the generation and energy storage portfolio is added to provide transparency to the calculation of the Group’s GHG intensity.
See CLP Group's portfolio on its website
GRI reference: 2-5
Limited assurance is provided by PricewaterhouseCoopers (PwC) on a selected set of environmental, social and governance-related Key Performance Metrics for this report, in accordance with:
• The International Standard on Assurance Engagements 3000 (Revised), Assurance Engagements other than Audits or Reviews of Historical Financial Information, and
• In respect of GHG emissions the International Standard on Assurance Engagements 3410, Assurance Engagements on Greenhouse Gas Statements.
Download the independent assurance report
Below is the definition of the Group's boundary for each of the main categories of data included in this report. Please refer to the 2021 CLP Annual Report for more details on the entities included in the consolidated financial statements.
Governance Includes people employed by CLP entities and their subsidiaries. This also includes CLP employees who are assigned to work in joint ventures, joint operations or associates.
Finance Selected financial figures are extracted from the Annual Report and the consolidated financial statements of CLP Holdings Limited and its subsidiaries (the Group) which is in accordance with Hong Kong Financial Reporting Standards (HKFRS) issued by the Hong Kong Institute of Certified Public Accountants (HKICPA). For a detailed description of the financial reporting scope, please refer to the Significant Accounting Policies – Consolidation and Equity Accounting on pages 232-233 of the 2021 Annual Report.
People Includes people employed by CLP entities and their subsidiaries. This also includes CLP employees who are assigned to work in joint ventures, joint operations or associates.
CLP Holdings 2021 Sustainability Report | 10

Welcome About this Report Materiality Assessment Standard ESG disclosures
Reporting frameworks and content indices
Reporting scope and data verification
Safety Includes the Group's generation and energy storage portfolio, transmission and distribution infrastructure, coal mines, fuel storage facilities and offices that are:
• Majority owned by CLP or under CLP’s operational control, defined as having full authority to implement CLP’s operating policies; and
• Under construction or in operation during the reporting year.
100% of the performance data for in-scope assets is reported without adjustment based on CLP's equity share, unless otherwise stated.
Asset management
• Energy sent out, Fuel use (on an operational control basis)
Data are consolidated on an operational control basis. It includes the assets in the Group’s generation and energy storage portfolio that are:
• Majority owned by CLP or under CLP’s operational control, and where full authority is given to implement CLP’s operating policies; and
• In operation during the reporting year.
100% of the performance data for in-scope assets is reported without adjustment based on CLP's equity share, unless otherwise stated.
Environment
• Resource use, Air emissions and Environmental compliance
Includes the Group’s generation and energy storage portfolio, transmission and distribution infrastructure, coal mines and fuel storage facilities that are:
• Majority owned by CLP or under CLP’s operational control, defined as full authority to implement CLP’s operating policies;
• In operation during the reporting year; and
• Posing material impact to the environment.
100% of the performance data for in-scope assets is reported without adjustment based on CLP's equity share, unless otherwise stated.
GHG emissions
• CLP Group’s total CO2e emissions (on an equity basis)
Includes the Group’s generation and energy storage portfolio, transmission and distribution, retail and other business activities where relevant, covering GHG emissions from Scope 1, 2 and 3.
Scope 1 CO2e
Includes the Group’s generation and energy storage portfolio, transmission and distribution infrastructure, coal mines and fuel storage facilities that are:
• Owned by CLP, where assets are included on an equity basis (i.e. accounts for the data according to CLP’s equity share in the asset); and
• In operation during the reporting year.
Scope 2 CO2e
Includes the Group’s generation and energy storage portfolio, transmission and distribution infrastructure, coal mines, fuel storage facilities and offices that are:
• Owned or rented by CLP, where assets and offices are included on an equity basis (i.e. accounts for the data according to CLP’s equity share in the asset); and
• In operation during the reporting year.
Scope 3 CO2e
Includes indirect emissions (not included in Scope 2) that occur in the value chain of CLP. It includes emissions from the Scope 3 categories relevant to CLP.
CLP Holdings 2021 Sustainability Report | 11

Welcome About this Report Materiality Assessment Standard ESG disclosures
Reporting frameworks and content indices
Reporting scope and data verification
GHG emissions
• CLP Group's generation and energy storage portfolio (CO2/CO2e on an equity/ an equity plus long-term capacity and energy purchase basis)
Data are consolidated on an equity basis with two variations:
1. Equity basis includes the assets in the Group’s generation and energy storage portfolio that are:
– Owned by CLP, where assets are included on an equity basis (i.e. accounts for the data according to CLP’s equity share in the asset); and
– In operation during the reporting year.
2. Equity plus long-term capacity and energy purchase basis adds onto (1) above and includes the assets in the Group’s generation and energy storage portfolio whose capacity and energy are purchased by CLP to meet customer demand, and where:
– Purchase agreement duration is at least 5 years; and
– Capacity or energy purchase is no less than 10MW.
GHG emissions
• CLP Group's generation and energy storage portfolio (CO2/CO2e on an operational control basis)
Includes the Group’s generation and energy storage portfolio, coal mines or fuel storage facilities that are:
• Majority owned by CLP or under CLP’s operational control, defined as full authority to implement CLP’s operating policies;
• In operation during the reporting year; and
• Posing material impact to the environment.
100% of the performance data for in-scope assets is reported without adjustment based on CLP's equity share, unless otherwise stated.
Climate Vision 2050
Asset management – Generation and energy storage capacity, energy sent out
Data are consolidated on an equity basis with two variations:
1. Equity basis includes the assets in the Group’s generation and energy storage portfolio that are:
– Owned by CLP, where assets are included on an equity basis (i.e. accounts for the data according to CLP’s equity share in the asset); and
– Under construction (for generation and energy storage capacity only) or in operation during the reporting year.
2. Equity plus long-term capacity and energy purchase basis adds onto (1) above and includes the assets in the Group’s generation and energy storage portfolio whose capacity and energy are purchased by CLP to meet customer demand, and where:
– Purchase agreement duration is at least 5 years; and
– Capacity or energy purchase is no less than 10MW.
CLP Power Hong Kong GHG emissions intensity of electricity sold
Includes power generation assets involved with the delivery of electricity to CLP Power Hong Kong customers, where:
• The CO2 and CO2e emissions are from generation assets owned or controlled by CLP Power Hong Kong/ CAPCO in Hong Kong only (as nuclear power generation does not result in significant carbon emissions); and
• The kWh is from the total electricity sales for CLP Power Hong Kong.
CLP Holdings 2021 Sustainability Report | 12

Welcome About this Report Materiality Assessment Standard ESG disclosures
CLP Holdings 2021 Sustainability Report | 13

Welcome About this Report Materiality Assessment Standard ESG disclosures
The materiality matrix The assessment process Impact material topics
The materiality matrixSustainability sits at the heart of CLP’s business strategy. With a proud history of more than 120 years, CLP is committed to creating long-term value for stakeholders.
GRI reference: 3-1, 3-2
To build a Utility of the Future, CLP has the vision:
"Through its values and commitments, to work every day to grow its business and meet its strategic priorities of:
• creating a sustainable business portfolio;
• accelerating its response to climate change for the business and the communities in which it operates;
• meeting growing demand for energy solutions;
• leveraging technology to deliver leading customer experiences and enhance operating performance; and
• investing to build an agile and innovative workforce.”
Against a backdrop of an increasingly complex operating environment, CLP has conducted robust materiality assessments based on megatrends analysis since 2018. These rigorous assessments consider how megatrends impact the success of CLP’s strategy in the medium- to long-term.
In 2021, a double materiality approach was adopted to reflect the full integration of sustainability into CLP’s strategy.
The materiality matrix below summarises the relationship between megatrends, material topics and relevant sub-topics.
For optimal user experience, view the interactive materiality matrix online
Man
agin
g th
e so
cial
im
pact
of d
ecar
boni
satio
n
E2
G1
Resp
ondi
ng to
evo
lving
regu
lato
ry la
ndsc
apes
Acting as a
truste
d partner
in the cl
ean energy transit
ion
Investing in clean
electricity infrastructure
Building resilience in a changing climate
Reinforcing cyber resilience
and data protection
Developing energy-as-a-
service business models
Creating new earning
streams as other
sectors electrifyDe
ploy
ing
cust
omer
-faci
ngen
ergy
sol
utio
ns
Deep
ening
our v
alue p
ropo
sition
with th
e righ
t par
tner
s
Upholding labour standards
in the supply chain
Fostering agility,
diversity and inclusion
Attracting and retainingfuture talent
Enhancing technical and
digital capabilities
Promoting workplace
safety and wellbeing
Utility ofthe future
CLP Holdings 2021 Sustainability Report | 14

Welcome About this Report Materiality Assessment Standard ESG disclosures
The materiality matrix The assessment process Impact material topics
Double materialityCLP’s double materiality assessment prioritises financially material and impact material topics. Assessment results inform Annual Report and Sustainability Report content.
In 2018, CLP updated its approach to materiality assessment, with subsequent annual reviews conducted to confirm result validity. Topics have been updated to address the impacts of immediate challenges arising from COVID-19, geopolitics and other developments that have unfolded since.
The current assessment uses the widely-adopted reporting frameworks from the GRI Standards and the Value Reporting Foundation, and also draws from the latest thinking in sustainability disclosure, including:
• Applying Enterprise Risk Management to Environment, Social and Governance-related Risk Guidelines, published by the Committee of Sponsoring Organizations of the Treadway Commission (COSO) and the World Business Council for Sustainable Development (WBCSD) in October 2018;
• Reporting on Enterprise Value: Illustrated with a Prototype Climate-Related Financial Disclosure Standard published by CDP, CDSB, GRI, IIRC, SASB in December 2020; and
• Proposals for a Relevant and Dynamic EU Sustainability Reporting Standard-setting, published by the European Reporting Lab (EFRAG) in February 2021.
In 2021, to reflect the maturity and integration of sustainability in the Company’s strategy and global best
practice in reporting, in compiling its 2021 Annual Report and 2021 Sustainability Report, CLP applied a double materiality assessment to inform the focus of each report.
Formally proposed by the European Commission in Guidelines on Non-financial Reporting: Supplement on Reporting Climate-related Information in June 2019, the concept of “double materiality” encourages a company to judge materiality from two perspectives: firstly, the impact on the financial value of the company; and secondly, the environmental and social impact on a broad range of stakeholders. The concept also implies the need to assess the interconnectivity of the two.
The application of a double materiality assessment to CLP’s reports saw:
• Financially material topics, which create or erode enterprise value, covered in the Annual Report. The key audience is providers of financial capital.
• Impact material topics, which reflect significant positive or negative impacts on people, the environment and the economy, covered in this Sustainability Report. They address the concerns of a diverse range of stakeholders wanting to understand CLP’s positive and negative contributions to sustainable development.
These topics are summarised in the diagram below. The Annual and Sustainability Reports feature cross-references that show the interconnectedness between financial and impact material topics and CLP’s overall focus on creating value for both shareholders and wider stakeholders.
CLP Holdings 2021 Sustainability Report | 15

Welcome About this Report Materiality Assessment Standard ESG disclosures
The materiality matrix The assessment process Impact material topics
MegatrendsMegatrend analysis provides an understanding of how changes in the environment, society, governance and technology impact CLP’s strategy and operating environment, today and in the future.
Megatrends Related Material Topic(s)
Technology as enabler and disrupter
Artificial intelligence (AI), digitalisation, automation and advanced robotics are shifting the way we work, live, and interact with the world around us. The COVID-19 pandemic has accelerated this trend, with companies forced to expedite the digitalisation of their operations and customer interactions. In the utilities sector, for example, AI is driving efficiency gains, underwriting the next generation of clean energy and storage technologies, and helping deliver a better customer experience.
Pursuing growth opportunities in Hong Kong and the Greater Bay Area
Aligning business activities with community, employee and customer expectations
Building an agile and innovative workforce
Accelerating energy transition
As the world settles into a new “normal”, the transition to a clean energy future remains a priority for governments and business alike. Post COP26 in Glasgow, 153 countries put forward new or updated carbon reduction targets for 2030, bringing global net-zero commitments to 90% of the world’s economy. However, although COP26 outcomes clearly indicate accelerating pressure for climate action, government inaction and supply chain and investment uncertainty remain key risks to the rapid transition required to limit global warming to 1.5°C.
Shaping and executing the transition to net-zero
Evolving energy business models
The falling cost of renewables and the introduction of new technologies is powering the shift towards an intelligent, integrated and more decentralised energy system. Utilities are exploring new business models and capabilities in areas such as microgrids, storage, electric vehicles (EVs) and energy-as-a-service. Incumbent electric utilities face competition from non-traditional utilities including big tech, communications providers, oil companies and EV manufacturers. Each has identified opportunities to integrate energy products and services into their customer value proposition.
Pursuing growth opportunities in Hong Kong and the Greater Bay Area
Aligning business activities with community, employee and customer expectations
Deglobalisation
Sealed borders and trade disruption caused by the pandemic fuelled indications that globalisation may have peaked. There will be no easy return to the unfettered movement of people, goods, capital and ideas; COVID-19 has established a bias towards self-reliance. As the world deglobalises, regional integration grows stronger. Many nations are focused on reshoring critical manufacturing and building greater resilience in their supply chains. Businesses are facing greater regulatory and investment uncertainty as a result.
Pursuing growth opportunities in Hong Kong and the Greater Bay Area
CLP Holdings 2021 Sustainability Report | 16

Welcome About this Report Materiality Assessment Standard ESG disclosures
The materiality matrix The assessment process Impact material topics
Megatrends Related Material Topic(s)
Electrification
The demand for electricity is set to increase by more than 2.5 times by 2050, driven by urbanisation and the massive electrification of end-use sectors, such as transport and industry. Despite the increasing availability of renewable energy generation, growth is unable to match increasing demand. Increases in energy needs also creates additional strain on energy grids, especially at times of peak demand, with widespread clean electrification limited by current energy infrastructure. In IEA’s Net Zero by 2050 roadmap, the current US$260 billion annual investment in transmission and distribution grids will need to expand to US$820 billion by 2030.
Shaping and executing the transition to net-zero
Pursuing growth opportunities in Hong Kong and the Greater Bay Area
Trust and fairness
For many nations, trust in the institutions of government and media is changing. Pressure is mounting on business to address major social, environmental and technological challenges such as wealth disparity, climate change and job automation. In addition, companies are increasingly scrutinised for human rights violations in their supply chains. This shift towards a more purpose-driven approach to private enterprise is a global phenomenon and will have implications on how companies retain customers, employees and capital. Governments are also looking to adjust economic and social policies to lessen social inequality. China, for example, has announced a Common Prosperity initiative to raise living conditions for low-income workers.
Shaping and executing the transition to net-zero
Aligning business activities with community, employee and customer expectations
Climate change adaptation
Societies and economies must increase their resilience to adapt to a hotter climate. The 2022 Global Risks Report ranks extreme weather as most likely to become a critical threat to the world within the next two years, and climate action failure and extreme weather are the top 2 risks in both 2-5 year and 5-10 year horizons. COVID-19 foreshadows what the climate crisis could look like: systemic, fastmoving, and global. At worst, unmitigated global warming could result in catastrophic scenarios that outstrip any capacity to adapt. The energy sector is especially vulnerable to physical climate risks, but leading utilities will also be critical to future adaptation solutions.
Reinforcing resilience in a changing operating environment
Future of work
A rapid increase in the availability and use of digital collaboration tools is accelerating a structural shift in the way people work, communicate and organise their lives. In response, companies are paying closer attention to worker health, wellbeing and morale. In addition, the benefits of a flexible, digitalised, diverse and inclusive working environment have become increasingly clear, particularly in relation to attracting and retaining talent. However, more than 50 percent of workers currently remain tethered to physical job sites, limiting their access to the benefits of the future of work enjoyed by others.
Aligning business activities with community, employee and customer expectations
Building an agile and innovative workforce
Data privacy and security
The mass adoption of working from home has increased the number of vulnerabilities for cyber criminals to exploit. Cybercrime damage is predicted to reach US$10.5 trillion by 2025. Critical infrastructure targets such as electricity grids, power plants and dams are particularly vulnerable to attack. Data privacy is similarly in focus. Greater regulatory scrutiny, increasing incidents related to the release of personal data and changing consumer privacy expectations have forced companies to reconsider how customer data is collected and used.
Reinforcing resilience in a changing operating environment
CLP Holdings 2021 Sustainability Report | 17

Welcome About this Report Materiality Assessment Standard ESG disclosures
The materiality matrix The assessment process Impact material topics
Material topics
Shaping and executing the transition to net-zeroCLP’s growth opportunities are positioned around becoming a Utility of the Future. Key areas to address are: decarbonisation of existing assets; investment in clean electricity infrastructure; delivery of reliable energy; and acting as a trusted partner for governments, communities and customers in the transition to a just, fair and clean energy future.
Financial Materiality
Policies in most markets are moving towards the decarbonisation of economies. CLP must respond accordingly to remain competitive. Its focus is on reducing stranded asset risk for fossil fuel-powered assets, and supporting its reputation as a responsible energy provider. Investments in non-carbon assets and transition enablers are drawing increasing interest from a broad spectrum of
investors who share CLP's climate vision objectives, creating the environment for CLP to attract capital and gain support from the insurance market. Also enhanced is the Group’s attractiveness as a commercial partner for private sector and government joint ventures.
Impact Materiality
The lower emissions that result from the transition to net-zero benefit the environment, and by extension the community, through lower greenhouse gas (GHG) emissions. CLP’s investment in the utility-scale use of clean energy solutions also supports the economy by facilitating major investment in critical supply chains and infrastructure.
Key stakeholders:
• Government & regulators
• Communities
• Customers
Promoting workplace
safety and wellbeing
Man
agin
g th
e so
cial
im
pact
of d
ecar
boni
satio
n
G1
Resp
ondi
ng to
evo
lving
regu
lato
ry la
ndsc
apes
Acting as a
truste
d partner
in the cl
ean energy transit
ion
Investing in clean
electricity infrastructure
Building resilience in a changing climate
Reinforcing cyber resilience
and data protection
Developing energy-as-a-
service business models
Creating new earning
streams as other
sectors electrify
Depl
oyin
g cu
stom
er-fa
cing
ener
gy s
olut
ions
Deep
ening
our v
alue p
ropo
sition
with th
e righ
t par
tner
s
Upholding labour standards
in the supply chain
Fostering agility,
diversity and inclusion
Attracting and retainingfuture talent
Enhancing technical and
digital capabilities
MEGATRENDS
Trust and fairnessAccelerating energy transitionElectrification
CLP Holdings 2021 Sustainability Report | 18
Welcome About this Report Materiality Assessment Standard ESG disclosures
The materiality matrix The assessment process Impact material topics
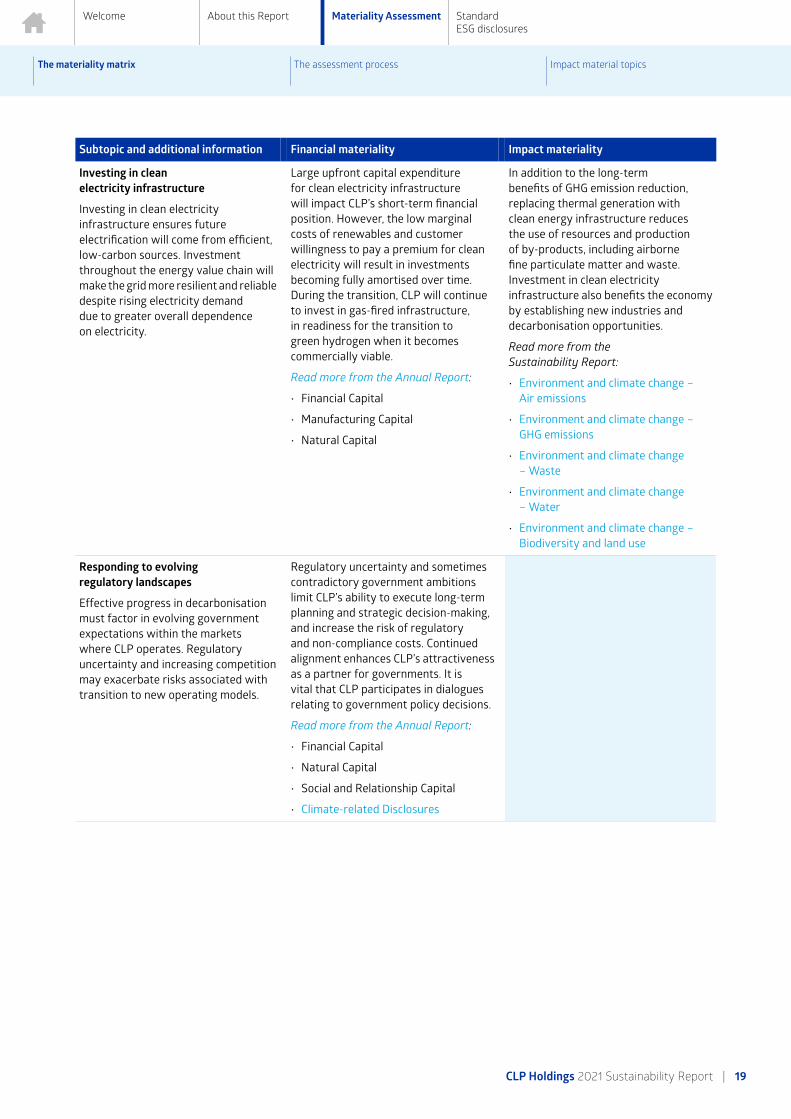
Subtopic and additional information Financial materiality Impact materiality
Investing in clean electricity infrastructure
Investing in clean electricity infrastructure ensures future electrification will come from efficient, low-carbon sources. Investment throughout the energy value chain will make the grid more resilient and reliable despite rising electricity demand due to greater overall dependence on electricity.
Large upfront capital expenditure for clean electricity infrastructure will impact CLP’s short-term financial position. However, the low marginal costs of renewables and customer willingness to pay a premium for clean electricity will result in investments becoming fully amortised over time. During the transition, CLP will continue to invest in gas-fired infrastructure, in readiness for the transition to green hydrogen when it becomes commercially viable.
Read more from the Annual Report:
• Financial Capital
• Manufacturing Capital
• Natural Capital
In addition to the long-term benefits of GHG emission reduction, replacing thermal generation with clean energy infrastructure reduces the use of resources and production of by-products, including airborne fine particulate matter and waste. Investment in clean electricity infrastructure also benefits the economy by establishing new industries and decarbonisation opportunities.
Read more from the Sustainability Report:
• Environment and climate change – Air emissions
• Environment and climate change – GHG emissions
• Environment and climate change – Waste
• Environment and climate change – Water
• Environment and climate change – Biodiversity and land use
Responding to evolving regulatory landscapes
Effective progress in decarbonisation must factor in evolving government expectations within the markets where CLP operates. Regulatory uncertainty and increasing competition may exacerbate risks associated with transition to new operating models.
Regulatory uncertainty and sometimes contradictory government ambitions limit CLP’s ability to execute long-term planning and strategic decision-making, and increase the risk of regulatory and non-compliance costs. Continued alignment enhances CLP’s attractiveness as a partner for governments. It is vital that CLP participates in dialogues relating to government policy decisions.
Read more from the Annual Report:
• Financial Capital
• Natural Capital
• Social and Relationship Capital
• Climate-related Disclosures
CLP Holdings 2021 Sustainability Report | 19

Welcome About this Report Materiality Assessment Standard ESG disclosures
The materiality matrix The assessment process Impact material topics
Subtopic and additional information Financial materiality Impact materiality
Managing the social impact of decarbonisation
CLP contributes to clean energy transition by removing emissions from its existing portfolio and accelerating the decommissioning of its legacy thermal assets. Navigating the changing fuel mix, the provision of affordable and reliable electricity to customers, and the uncertainty around long-term storage solutions presents challenges for all utilities. It is important to manage the impacts of the transition on all stakeholders.
The transition to a low carbon economy requires community support. However, some stakeholders may be unfavourably impacted by, for example, the increased energy costs brought on by the substantial investment required to adjust to the new energy model. Failure to achieve balance between decarbonisation and customer and community outcomes may damage CLP’s reputation, and its credibility as a trusted partner.
Read more from the Annual Report:
• Social and Relationship Capital
The provision of reliable, affordable electricity positively impacts customers and communities by providing an essential service. It is a service particularly important for vulnerable customers who may not be able to bear the cost of decarbonisation. Supporting a just transition for workers and communities also benefits the economy through upskilling opportunities and job creation.
Read more from the Sustainability Report:
• Customers – Access to electricity
• Customers – Availability and reliability
Acting as a trusted partner in clean energy transition
Governments, regulators, communities and customers are committing to ambitious decarbonisation agendas in each CLP market. As a provider of reliable, affordable and increasingly low-carbon energy, CLP acts as a trusted partner in the transition to a just, fair and clean energy future. This status is particularly important in Hong Kong, where CLP services most of the population and is known for its integrity.
Maintaining trusted partner status preserves CLP’s social licence and reputation, increases the attractiveness of forming joint ventures to deliver society-wide decarbonisation, and reduces regulatory risk. This position improves CLP’s ability to enter new markets, increases customer retention and improves understanding of the trade-offs between a low tariff and greener energy. It also helps CLP attract capital at lower cost, such as via green finance opportunities.
Read more from the Annual Report:
• Financial Capital
• Social and Relationship Capital
Supporting the decarbonisation agendas of key stakeholders positively impacts people, and by extension the environment, by helping reduce emissions to ensure the continued supply of reliable and affordable electricity and energy services. CLP’s role as a trusted partner in the low carbon transition also supports the economy by making energy systems more efficient and resilient, and by decoupling generation and distribution from extractive, non-renewable and polluting fossil fuels.
Read more from the Sustainability Report:
• Community – Stakeholder engagement
• Community – Public policy
• Community – Community investment
CLP Holdings 2021 Sustainability Report | 20

Welcome About this Report Materiality Assessment Standard ESG disclosures
The materiality matrix The assessment process Impact material topics
Pursuing growth opportunities in Hong Kong and the Greater Bay AreaThe different regulatory environments in each market affect CLP’s growth opportunities locally. Opportunities in Mainland China, especially in the Greater Bay Area (GBA), are significant for CLP due to the region’s large population, proximity to CLP’s home market of Hong Kong, and increasing cooperation with the GBA. CLP is working with public and private sector partners to: accelerate the clean energy transition in line with government objectives; scale up clean electricity generation to meet rising demand as other sectors electrify; and introduce new energy products and services that serve customer needs.
Financial Materiality
Electricity demand is expected to increase as specific market segments electrify, presenting opportunities for CLP to access new markets, establish partnerships in high-growth segments, and diversify earning streams. CLP operates in different geographies, allowing it to attract capital, technology and talent globally. The energy transition presents new opportunities to CLP through customer-facing solutions and expansion into high-growth market segments by providing different energy services, such as district cooling.
Promoting workplace
safety and wellbeing
Man
agin
g th
e so
cial
im
pact
of d
ecar
boni
satio
n
G1
Resp
ondi
ng to
evo
lving
regu
lato
ry la
ndsc
apes
Acting as a
truste
d partner
in the cl
ean energy transit
ion
Investing in clean
electricity infrastructure
Building resilience in a changing climate
Reinforcing cyber resilience
and data protection
Developing energy-as-a-
service business models
Creating new earning
streams as other
sectors electrify
Depl
oyin
g cu
stom
er-fa
cing
ener
gy s
olut
ions
Deep
ening
our v
alue p
ropo
sition
with th
e righ
t par
tner
s
Upholding labour standards
in the supply chain
Fostering agility,
diversity and inclusion
Attracting and retainingfuture talent
Enhancing technical and
digital capabilities
MEGATRENDS
Technology as enabler and disrupter
Evolving energy business models
Deglobalisation
Electrification
CLP Holdings 2021 Sustainability Report | 21

Welcome About this Report Materiality Assessment Standard ESG disclosures
The materiality matrix The assessment process Impact material topics
Subtopic and additional information Financial materiality
Creating new earning streams as more sectors electrify
Electricity demand is set to increase dramatically as more industry sectors electrify. CLP can enable transition to a low carbon economy by scaling up clean electricity generation to meet demand. In addition, electrification presents opportunities to expand into new parts of the energy value chain, such as energy-as-a-service and other energy management services.
Wider sector electrification will provide opportunities to access new markets and earning streams, enhancing CLP’s attractiveness to investors not only through non-carbon generation assets, but other electricity infrastructure supporting distributed and variable generation sources.
Read more from the Annual Report:
• Intellectual Capital
Deploying customer-facing energy solutions
Technological breakthroughs are enabling decentralised energy systems that empower consumers to take control of their energy needs. CLP is well positioned to support this transition by deploying customer-facing energy solutions, including EV charging stations, smart meters and battery storage. Developing decentralised energy solutions opens up new growth opportunities, while helping CLP build long-term relationships with end users.
Developing decentralised energy solutions creates opportunities for CLP to expand into new business lines and diversify revenue streams. By offering ‘high-touch’ customer solutions, such as charging stations and smart meters, CLP can raise its brand profile and build stronger customer relationships. Leveraging these opportunities allows CLP to improve its strategic resilience against new market entrants.
Read more from the Annual Report:
• Intellectual Capital
Developing energy-as-a-service business models
Residential and commercial consumers are demanding more personalised and customisable offerings from utility service providers, including how their energy is generated, allowing them to manage and monitor usage in real time. Advances in technology are enabling energy-as-a-service business models, including power purchase agreements, battery storage and charging facilities, and demand-side management. These models combine hardware and software services, giving consumers greater flexibility and choice, and promote the adoption of renewable energy sources.
Energy-as-a-service business models are expected to deliver reasonable margins, scalability, and long-term customer relationships. CLP’s earnings will be supplemented by such asset-light business models.
Read more from the Annual Report:
• Intellectual Capital
Deepening our value proposition with the right partners
The utilities sector faces challenges from regulatory changes, emerging technologies and new market entrants. Partnerships between leading utilities and new market entrants develop synergies that deliver better and more innovative customer solutions. CLP can add significant value by delivering clean energy infrastructure that can respond quickly to variability, and offer better energy optimisation solutions.
Partnerships unlock growth opportunities in high-value market segments which are beyond the traditional electric utilities value chain, such as data centres or district cooling. Conversely, businesses attempting to operate in isolation are sacrificing future growth areas, losing opportunities to deepen their value proposition and insulate themselves against new market entrants.
Read more from the Annual Report:
• Intellectual Capital
CLP Holdings 2021 Sustainability Report | 22

Welcome About this Report Materiality Assessment Standard ESG disclosures
The materiality matrix The assessment process Impact material topics
Building an agile and innovative workforceThe successful execution of CLP’s strategy depends in large part on its employees’ ability to adapt to evolving industrial, technological, and demographic trends. As a result, the Group is investing in attracting and retaining a diverse, multi-generational and digitally-adept workforce capable of swiftly navigating change and meeting customer needs. Workplace safety is another key consideration.
Financial Materiality
Fostering an agile, innovative and safe work environment increases the quality and productivity of CLP’s workforce. Enhancing technical and digital skills within the business is necessary to capture growth opportunities in China and supports the uptake of new business models. Gender and ethnic diversity also increase the likelihood of financial outperformance.
Promoting workplace
safety and wellbeing
Man
agin
g th
e so
cial
im
pact
of d
ecar
boni
satio
n
G1
Resp
ondi
ng to
evo
lving
regu
lato
ry la
ndsc
apes
Acting as a
truste
d partner
in the cl
ean energy transit
ion
Investing in clean
electricity infrastructure
Building resilience in a changing climate
Reinforcing cyber resilience
and data protection
Developing energy-as-a-
service business models
Creating new earning
streams as other
sectors electrify
Depl
oyin
g cu
stom
er-fa
cing
ener
gy s
olut
ions
Deep
ening
our v
alue p
ropo
sition
with th
e righ
t par
tner
s
Upholding labour standards
in the supply chain
Fostering agility,
diversity and inclusion
Attracting and retainingfuture talent
Enhancing technical and
digital capabilities
MEGATRENDS
Future of work
Technology as enabler and disrupter
CLP Holdings 2021 Sustainability Report | 23

Welcome About this Report Materiality Assessment Standard ESG disclosures
The materiality matrix The assessment process Impact material topics
Subtopic and additional information Financial materiality
Attracting and retaining future talent
Creating the right working environment is critical to attracting and retaining the diverse and highly-skilled talent needed to build a Utility of the Future. Employees will also need to adjust to new ways of working, such as flexible and remote work, and develop appropriate skills for an increasingly digitalised and decentralised workplace.
CLP aims to have the right capabilities to respond successfully to fast-moving trends and remain competitive. Attracting the right talent also drives organisational agility, enhances employee productivity and improves efficiency.
Read more from the Annual Report:
• Human Capital
Promoting workplace safety and wellbeing
Employees, service providers, contractors, customers and members of the public alike desire safe CLP workplaces which support psychological wellbeing and physical health.
Ensuring health, safety, and wellbeing enhances CLP employee productivity and improves business efficiency. Conversely, non-compliance increases the prospect of lawsuits and financial sanctions from industry regulators. It also damages brand, reputation and social licence.
Read more from the Annual Report:
• Human Capital
Enhancing technical and digital capabilities
CLP is recognised for its expertise in hardware and engineering. However, as digital technologies evolve, customer expectations increase. Electric utilities are under pressure to develop the technical capabilities necessary to attract and retain an increasingly sophisticated and empowered customer base.
Developing and maintaining strong technical and digital capabilities will ensure CLP can execute its business strategy. Utilities responsive to evolving customer preferences and emerging technologies, such as blockchain and batteries, have an opportunity to enhance sales and diversify revenue streams.
Read more from the Annual Report:
• Human Capital
CLP Holdings 2021 Sustainability Report | 24

Welcome About this Report Materiality Assessment Standard ESG disclosures
The materiality matrix The assessment process Impact material topics
Reinforcing resilience in a changing operating environmentCOVID-19, alongside the accelerating pace of environmental, technological, regulatory and social change, has reinforced the importance of business resilience. CLP recognises the strategic value of anticipating, withstanding and learning from disruptive events, including regulatory changes and responding to the growing threats posed by climate change and cybercrime.
Financial Materiality
Business resilience is an important component of sustainable value creation and helps protect CLP’s assets and cash flows. Negative risks associated with damage to physical assets and operations caused by global warming and cybercrime require careful management. As countries begin to plan for a post-pandemic future, CLP has a role to play in rejuvenating the economies in which it operates.
Impact materiality
Reinforcing resilience in CLP’s assets and operations underpins a stable and reliable energy supply. This benefits communities and the economy by minimising disruption.
Key stakeholders:
• Customers
• Suppliers
• Communities
• Employees
Promoting workplace
safety and wellbeing
Man
agin
g th
e so
cial
im
pact
of d
ecar
boni
satio
n
G1
Resp
ondi
ng to
evo
lving
regu
lato
ry la
ndsc
apes
Acting as a
truste
d partner
in the cl
ean energy transit
ion
Investing in clean
electricity infrastructure
Building resilience in a changing climate
Reinforcing cyber resilience
and data protection
Developing energy-as-a-
service business models
Creating new earning
streams as other
sectors electrify
Depl
oyin
g cu
stom
er-fa
cing
ener
gy s
olut
ions
Deep
ening
our v
alue p
ropo
sition
with th
e righ
t par
tner
s
Upholding labour standards
in the supply chain
Fostering agility,
diversity and inclusion
Attracting and retainingfuture talent
Enhancing technical and
digital capabilities
MEGATRENDS
Data privacy and security
Climate change adaptation
CLP Holdings 2021 Sustainability Report | 25

Welcome About this Report Materiality Assessment Standard ESG disclosures
The materiality matrix The assessment process Impact material topics
Subtopic and additional information Financial materiality Impact materiality
Building resilience in a changing climate
To ensure a reliable, affordable and sustainable supply of energy, CLP must address the challenges that natural resource constraints and extreme weather conditions pose to physical assets. While investment is needed to manage physical climate risks, innovative adaptation practices also present opportunities to create demonstrable value.
A failure to adequately address the impacts of climate change on operations could result in damage to physical assets, increasing the likelihood of supply disruption, and rising insurance costs. Some adaptation solutions offer opportunities to maximise revenue generation through increased efficiency, greater diversity of energy supply, and meeting new customer requirements.
Read more from the Annual Report:
• Manufactured Capital
• Social Capital
• Climate-related Disclosures Report
Adapting CLP’s physical assets to cope with the disruptive realities of global warming benefits the economy by maintaining a reliable energy supply, even in the face of extreme weather events. This adaptation relates not only to the Company’s own operations, but to its value chain as well.
Read more from the Sustainability Report:
• Customers – Availability and reliability
• Asset Management – Asset management system
Reinforcing cyber resilience and data protection
Threats to operational technology (OT) are especially important for companies like CLP, which provide critical infrastructure. Governments and customers are increasingly concerned about how personal information is stored, protected and used. The financial and reputational cost of a major information technology (IT) breach can be prohibitive.
A cyberattack could cause an outage of CLP’s IT systems, leak sensitive customer information or confidential company data, lead to financial losses through fines, legal damages, or ongoing credit monitoring for affected customers. A cyberattack on CLP’s OT could cause severe service interruptions resulting in wider economic impacts and significant reputational damage.
Read more from the Annual Report:
• Manufactured Capital
The importance of cyber resilience and data protection is growing as the energy industry is becoming smarter and more data is collected. Data privacy is strengthened by increasing IT system resilience, allowing normal day-to-day activities to proceed without fear or threat of cyberattack. Because of CLP’s role in providing critical infrastructure, a massive breach could significantly impact the economy by temporarily shutting essential energy services.
Read more from the Sustainability Report:
• Asset management – Security management
• Asset management – Cyber security
• Customers – Privacy
CLP Holdings 2021 Sustainability Report | 26

Welcome About this Report Materiality Assessment Standard ESG disclosures
The materiality matrix The assessment process Impact material topics
Aligning business activities with community, employee and customer expectationsAs a purpose-led business, CLP recognises its obligation to meet evolving stakeholder expectations around the positive role business plays in society. This includes empowering end users with decentralised energy solutions that meet their needs and collaborating with partners to deliver clean energy solutions that benefit customers, communities and the environment. Employee and supplier wellbeing is also a priority; CLP’s long-term success relies on its capacity to build organisational agility, diversity and inclusion and to attract and retain highly skilled talent.
Impact materiality
Business activities which meet the expectations of stakeholders benefit employees, customers, suppliers and local communities. Additionally, an economic system that respects and upholds non-financial value creation (such as social value) is likely to be fairer and more resilient over the longer term.
Key stakeholders:
• Customers
• Communities
• Employees
• Suppliers
Promoting workplace
safety and wellbeing
Man
agin
g th
e so
cial
im
pact
of d
ecar
boni
satio
n
G1
Resp
ondi
ng to
evo
lving
regu
lato
ry la
ndsc
apes
Acting as a
truste
d partner
in the cl
ean energy transit
ion
Investing in clean
electricity infrastructure
Building resilience in a changing climate
Reinforcing cyber resilience
and data protection
Developing energy-as-a-
service business models
Creating new earning
streams as other
sectors electrify
Depl
oyin
g cu
stom
er-fa
cing
ener
gy s
olut
ions
Deep
ening
our v
alue p
ropo
sition
with th
e righ
t par
tner
s
Upholding labour standards
in the supply chain
Fostering agility,
diversity and inclusion
Attracting and retainingfuture talent
Enhancing technical and
digital capabilities
MEGATRENDS
Trust and fairness
Future of work
Technology as enabler and disrupter
Evolving energy business models
CLP Holdings 2021 Sustainability Report | 27

Welcome About this Report Materiality Assessment Standard ESG disclosures
The materiality matrix The assessment process Impact material topics
Subtopic and additional information Impact materiality
Deploying customer-facing energy solutions
See detailed description under Pursuing growth opportunities in Hong Kong and the Greater Bay Area.
Supporting decentralised energy solutions benefits people by enabling flexible, reliable, and cost-effective access to clean energy. A smart energy system equipped with sensors, robots, and information and communication technology offers a greater range of services answering customers’ needs. These solutions can go beyond improving energy efficiency, benefitting the environment through reduced per capita GHG emissions.
Read more from the Sustainability Report:
• Customers – Portfolio
• Customers – Satisfaction
• Customers – Energy services and solutions
Deepening our value proposition with the right partners
See detailed description under Pursuing growth opportunities in Hong Kong and the Greater Bay Area.
As digitalisation and integration across the energy industry increases, partnerships between incumbent electricity providers and business partners, such as start-ups from other sectors, have the potential to leverage the strengths of both partners. Such partnerships can expand CLP’s clean energy services into new business lines with environmental benefits. The economy also benefits by further decoupling economic growth from carbon-intensive activities.
Read more from the Sustainability Report:
• Customers – Energy services and solutions
Promoting workplace safety and wellbeing
See detailed description under Building an agile and innovative workforce.
CLP’s strong performance in occupational health and safety benefits individuals by protecting their health, safety and wellbeing in all workplace locations. Safe operations, such as minimising the risk of COVID-19 virus transmission, also benefits the communities in which CLP operates.
Read more from the Sustainability Report:
• Safety – Occupational health and safety
Fostering agility, diversity and inclusion
CLP’s success is based in large part on the quality, morale, and productivity of its human capital. The CLP workforce benefits from a culture that is open to new ideas and ways of working, and which celebrates diversity and inclusivity in all its forms.
Organisational agility, diversity and inclusion benefits the economy by attracting talent, whether locally or from abroad, and creating higher performing businesses. Cultural openness and inclusivity benefits individuals, particularly employees, who experience higher team morale and cohesion, creating fewer opportunities for discrimination.
Read more from the Sustainability Report:
• People – Fair and ethical work practices
• People – Fostering diversity and inclusion
• People – Supporting employees to thrive in change
Attracting and retaining future talent
See detailed description under Building an agile and innovative workforce.
Creating a fit-for-purpose, flexible and digitalised working environment benefits individuals, namely employees, who experience higher levels of job satisfaction, team cohesion and productivity, and a better work-life balance.
Read more from the Sustainability Report:
• People – Talent and skills development
Upholding labour standards in the supply chain
The responsibilities of a company should not be constrained within its own operations. Moreover, human rights due diligence is a critical input in managing supply chain risks. In becoming a Utility of the Future, CLP continues to promote supply chain transparency as a competitive advantage. CLP recognises its responsibility to eliminate all forms of modern slavery and labour exploitation in its operations and throughout its supply chain.
CLP recognises suppliers as a core asset. The close collaboration that comes from these partnerships provides an opportunity to align targets, objectives and standards. Upholding high standards in labour practices has a positive impact on employees, supply chain partners and the communities in which CLP operates.
Read more from the Sustainability Report:
• Supply Chain – Responsible procurement
CLP Holdings 2021 Sustainability Report | 28

The assessment process
Welcome About this Report Materiality Assessment Standard ESG disclosures
The materiality matrix The assessment process Impact material topics
The assessment processOverview of the materiality assessment processGRI reference: 2-12, 3-1
The materiality assessment process is summarised in the diagram below, with further details outlined in this section.
Megatrends and external environment analysisContinuous analysis of its everchanging operating environment allows CLP to stay competitive and keep abreast of new developments.
Megatrends are large, transformative global forces that define the future by having a far-reaching impact on businesses, economies, industries, societies, and individuals. A megatrend is distinguished from other trends in that it cannot be stopped or significantly altered, even by powerful players such as governments.
CLP's megatrend analysis considers a range of information sources, including university research, consultant research and reports, industry surveys, media reports, government and United Nations resources, and investor reports and analysis. Currently, it has identified nine megatrends most relevant to CLP in the medium- to long-term.
The analysis also provides an understanding of how changes in the environment, society, governance and technology impact CLP’s strategy and operating environment, today and in the future. This provides clear context for reviewing environmental, social and governance (ESG) risks and opportunities, and when identifying and prioritising topics for CLP management and reporting.
Although the COVID-19 pandemic has caused significant disruption in the last two years, it was not identified as an individual megatrend. Instead, considerations were made relating to the pandemic’s contribution to, or acceleration of, other transformative global megatrends identified.
Senior management interviewsSenior management interviews provide insight into CLP’s operating environment and the business’ strengths, weaknesses, opportunities and threats.
The analysis of the interviews was instrumental to establish an internal view of which megatrends are expected to influence CLP’s operating environment and how those influences may differ over time.
The scope of interviewees was broader than previous years and included all members of the Group's senior management team, as well the Senior Director – Group Innovation and the Managing Director of CLPe. This strategy ensured the analyses considered a wide range of perspectives from different subject matters and geographies. Interviewees were invited to share their views of CLP’s strategic positioning on the megatrends which they considered most significant to CLP’s current business environment.
CLP Holdings 2021 Sustainability Report | 29

Welcome About this Report Materiality Assessment Standard ESG disclosures
The materiality matrix The assessment process Impact material topics
Identifying the material topicsA variety of internal and external sources were used to identify the topics material to CLP.
While megatrend analyses and interviews provide forward-looking insights, the materiality assessment also considers other sources – such as CLP’s strategy, company policies, and reporting disclosures by CLP and its peers – which reflect current and future prospects.
Given Company collateral has already received senior management endorsement, it is more likely to contain content material to CLP, compared to desk-based megatrends research or external stakeholder engagement.
Therefore, these sources serve as key references when identifying and shortlisting the material topics.
In identifying material topics, other external reporting frameworks and standards are also referenced, including the GRI Standards, the Integrated Reporting Framework and SASB Industry Standards outlined by the Value Reporting Foundation, as well as the Hong Kong Stock Exchange ESG Reporting Guide.
In all, a total of 19 material topics were shortlisted for prioritisation.
Prioritisation workshopA prioritisation workshop was held to determine the topics most material to CLP, from financial and impact materiality perspectives.
The Sustainability Executive Committee (SEC) considered the 19 shortlisted topics in a prioritisation workshop. In line with the concept of double materiality, the topics were considered through two lenses:
• Financial materiality: Participants ranked topics based on their capacity to create or erode CLP’s enterprise value. This included: the potential of the topic to cause disruption to CLP’s business activities; how critical the topic was to CLP’s strategy and business priorities; and the level of investor interest the topic attracted.
A detailed discussion on the financially material topics can be found in the Capitals section in the 2021 Annual Report.
Read the Capitals section
• Impact materiality: Participants were asked to rank each topic for impact materiality, relative to the other topics presented, based on impact on people, the environment and the economy.
Read more on the impact material topics
CLP Holdings 2021 Sustainability Report | 30

Impact material topics
Welcome About this Report Materiality Assessment Standard ESG disclosures
The materiality matrix The assessment process Impact material topics
Bearing in mind different stakeholder interests, CLP emphasises value creation over the long term, and does this in a way that helps serve the communities in which it operates.
GRI reference: 3-2, 201-1
One way to understand this emphasis is through the value created and distributed by CLP to different stakeholders. In 2021, 88% of the economic value generated by CLP was distributed to stakeholders, including employees, suppliers and contractors, lenders, shareholders, governments and the community at large.
As shown in the chart below, and after excluding the impairment of retail goodwill of HK$6,381 million and litigation settlement of HK$1,110 million in Australia in 2019 and 2021 respectively, this economic value distributed from the Group’s businesses has been relatively stable in the last three years.
Economic value generated and distributed by CLP: 2019 to 2021
CLP Holdings 2021 Sustainability Report | 31

Welcome About this Report Materiality Assessment Standard ESG disclosures
The materiality matrix The assessment process Impact material topics
Another way to understand how CLP creates value is through the impact materiality assessment. For instance, the positive impacts created through providing services, purchasing goods and services, creating jobs, and investing in the community. It also provides an understanding of the negative impact of CLP’s operations, including the impacts of GHG emissions and safety incidents, all of which CLP strives to minimise.
Based on discussions at the 2021 prioritisation workshop and taking into account best practices amongst peer companies and stakeholder feedback, CLP has identified three topics that currently have the most material impact on its stakeholders.
1. Shaping and executing the transition to net-zeroCLP’s growth opportunities are positioned around becoming a Utility of the Future. In pursuit of this ambition, one key area for CLP is to decarbonise its existing assets by investing in clean electricity infrastructure to ensure a reliable energy grid. The lower emissions that result from transitioning to net-zero benefit the environment and, by extension, the community. Benefits come through lowering GHG and other air emissions and reducing resource use associated with fuel extraction and transport.
While government and regulatory bodies propose new or updated carbon reduction targets, as one of the major emitters, electric utilities are expected to act as a trusted partner for governments, communities and customers in energy transition. In doing so, an electric utility must manage the social impact of decarbonisation carefully such that no stakeholder groups will have to bear disproportionate costs. Further to this, CLP seeks to support the economy by facilitating major investment in critical supply chains and infrastructure.
2. Reinforcing resilience in a changing operating environmentIn a volatile operating environment, disruption can occur at any point along CLP’s value chain, for example, in its supply chain, within the Company’s operational boundaries, or amongst customers. COVID-19, alongside the accelerating pace of environmental, technological, regulatory and social change, has reinforced the importance of business resilience.
CLP recognises the strategic value of anticipating, withstanding and learning from disruptive events. An increased severity and frequency in extreme climate events has been observed in recent years. Building resilience in a changing climate is crucial for CLP to ensure its customers can rely on an undisturbed electricity supply, and that its employees will not be exposed to unnecessary risks. As the power system is becoming more digitalised and connected, reinforcing cyber resilience and data protection shields the critical infrastructure provided by CLP against cyber threats and data breaches.
3. Aligning business activities with community, employees and customer expectationsThe time when the sole purpose of a business was to make profit is long passed. As a purpose-led business, CLP recognises its obligation to meet evolving stakeholder expectations around the positive role business can play in society.
Often these expectations are aligned with the business case that as the electricity system becomes more complex and extends beyond the traditional realms of a power utility, CLP has the opportunity to deepen its value proposition with the right partners to deploy customer-facing energy solutions. The Group recognises this expectation of forming collaborative partnerships to fast-track the delivery of energy solutions.
A company relies upon its employees to deliver its business strategy and serve its customers. A minimal expectation on a responsible employer is to promote workplace safety and well-being. As the business evolves with the changing operating environment, it is important to foster agility, diversity and inclusion and to attract and retain future talents. Together, fulfilling these expectations of the workplace will help empower employees to express innovative ideas, adopt new ways of working, and make CLP an attractive company in which they can develop their career.
The responsibilities of a company should not be constrained to its own operations. A company must consider its supply chain and ensure that labour standards are upheld in the supply chain, including the elimination of all forms of modern slavery and labour exploitation. Through exercising its purchasing power, a company must also consider its role in strengthening supplier businesses, and the benefit this has on local economies. In building a Utility of the Future, CLP recognises that an economic system that respects and upholds non-financial value creation, such as social value, is likely to be fairer and more resilient over the longer term.
CLP Holdings 2021 Sustainability Report | 32

Welcome About this Report Materiality Assessment Standard ESG disclosures
CLP Holdings 2021 Sustainability Report | 33

Corporate governance
Welcome About this Report Materiality Assessment Standard ESG disclosures
Corporate governance
Safety Environment and climate change
Asset management
Supply chain Community People Customers Key performance metrics
OverviewGood corporate governance, anti-corruption, compliance with regulations and risk management form the bedrock of a sustainable business and underlie long-term success.
CLP successfully weathered the disruption and change brought about by the COVID-19 pandemic and provided effective support to the community, thanks in part to a strong culture of operational excellence and care for its
people and communities. Robust risk management and crisis management processes also enabled the Company to use learnings from past experiences to perform at the level required during such challenging times.
To protect this bedrock, the Group continuously strives to embed good corporate governance practices in its day-to-day operations, in pursuing its vision and by implementing CLP's Value Framework .
Corporate governance framework and codeManagement approachGood corporate governance promotes and safeguards the interests of shareholders and other stakeholders. CLP is committed to maintaining a rigorous framework of corporate governance that upholds the Group’s credibility and reputation.
GRI reference: 2-15, 2-23, 2-24
Corporate governance is a matter of culture, driving CLP to continually make conscious decisions around correct behaviours. Over the years, the Company has developed and put in place a Code on Corporate Governance, Corporate Governance Framework, and comprehensive set of procedures, systems, policies and guidelines that make up the unique CLP corporate governance structure.
Download the CLP Code on Corporate Governance
The CLP Code was last updated in 2019 to reflect the requirements under the Rules Governing the Listing of Securities issued by The Stock Exchange of Hong Kong Limited (HKEx). With most of the amendments of the HKEx's amended Corporate Governance Code coming into effect on 1 January 2022, the Company will be reviewing the CLP Code to update and reflect the new requirements. The CLP Code, while embracing the terms set out within HKEx's Corporate Governance Code, goes beyond this by advancing a structure that builds on CLP’s own standards and experience.
The Board is CLP’s highest governance body and actively promotes the success of the Group by directing and supervising all of its affairs in a responsible and effective manner. Some of these responsibilities are discharged through delegation to six Board Committees. The two committees most involved in sustainability-related matters are the Sustainability Committee and the Audit & Risk Committee.
Find out more about Sustainability Governance
CLP Holdings 2021 Sustainability Report | 34

Welcome About this Report Materiality Assessment Standard ESG disclosures
Corporate governance
Safety Environment and climate change
Asset management
Supply chain Community People Customers Key performance metrics
How CLP Holdings approaches corporate governance
Year in reviewThe Board recognises that effective oversight and leadership over the affairs of the Company are critical to promoting the success of the Company.
GRI reference: 2-12
In 2021, the Board spent most of its time on strategy, followed by performance monitoring and planning, governance and risk, stakeholder engagement, and leadership and people.
The CLP Corporate Governance Report in the Annual Report discloses the Company's governance performance in detail. Below are the highlights from 2021:
• Climate Vision 2050 – Reviewed the strengthened targets and commitments in the Climate Vision 2050. The targets were formulated following a strategic review by engaging with internal and external stakeholders, including the Board, the Sustainability Committee, the Sustainability Executive Committee, relevant business units and investors.
• Material ESG Topics – Undertook a materiality assessment process to determine the material ESG topics for reporting purposes.
• Hong Kong Stock Exchange Amended Corporate Governance Code – Reviewed the new requirements and CLP's corporate governance practices on the Hong Kong Stock Exchange's amendments to the Main Board Listing Rules, which are aimed at enhancing the market’s corporate governance framework and promoting good governance amongst listed companies.
• Internal Board Survey – Conducted in the form of a questionnaire, the survey covered a broad range of topics including: Board composition and dynamics; Board meeting cycle and Board materials; Board’s focus; and oversight on a range of issues.
Read the Corporate Governance Report in the 2021 Annual Report
The Human Resources and Remuneration Committee Report covers CLP’s Remuneration Policy, including the non-financial metrics considered for executives’ remuneration.
CLP Holdings 2021 Sustainability Report | 35

Welcome About this Report Materiality Assessment Standard ESG disclosures
Corporate governance
Safety Environment and climate change
Asset management
Supply chain Community People Customers Key performance metrics
Sustainability governanceManagement approachA strong governance framework is key to ensuring that the sustainability issues CLP faces are incorporated into the corporate agenda.
GRI reference: 2-9, 2-12, 2-13, 2-14, 2-23
Sustainability is well integrated into CLP's business strategy and the CLP Board has overall responsibility for CLP’s
ESG reporting and sustainability. Sustainability governance has been embedded in the corporate governance structure throughout the Group – from Board-level committees to management-level Group functions and business units.
Two of the Board Committees, the Sustainability Committee and the Audit & Risk Committee, have separate but complementary roles in sustainability management.
Sustainability CommitteeThe Sustainability Committee holds the primary role of overseeing the management of the Group’s sustainability issues. It is supported by the Sustainability Executive Committee.
Download the Terms of Reference of the Sustainability Committee
In 2021, a key focus of the Committee’s work was overseeing the work on climate change and its impact on the Group’s strategy. The Committee held an additional meeting during the year to consider the proposed climate-related targets for CLP. The Committee also spent considerable time reviewing
the draft CLP’s Climate Vision 2050, with the objective of delivering a firm commitment to climate action in a clear and succinct manner.
The Committee had the benefit of a briefing from a leading external expert on the key outcomes of COP26; this covered the international efforts in reducing GHG emissions, the potential opportunities associated with the commitments and pledges at COP26 and the implications for the corporate sector.
Between 1 January 2021 and the date of this report, the Committee met five times (including four times in 2021 and once in 2022). The following table is a summary of how the Committee spent its time during this period.
CLP Holdings 2021 Sustainability Report | 36

Welcome About this Report Materiality Assessment Standard ESG disclosures
Corporate governance
Safety Environment and climate change
Asset management
Supply chain Community People Customers Key performance metrics
Overview of work conducted by the Sustainability Committee between 2021 and the date of this Report2021 2022
February July September November February
Climate change-related matters
Other sustainability matters – risks, opportunities and emerging issues
Sustainability reporting / indices performance
Health, safety, security and environment
Community, charitable and environmental partnerships and initiatives
The Committee will continue its focus on longer-term emerging sustainability issues concerning the Group, in particular, on climate change. It is well aware of the Group’s stakeholders’ increasing focus on sustainability and climate change issues. The Committee acknowledges the positive response to the updated decarbonisation targets under
the Climate Vision 2050 and will remain committed in ensuring the Group will remain on course in delivering on the strengthened climate targets.
Read the full Sustainability Committee Report
Audit & Risk CommitteeA key responsibility of the Audit & Risk Committee (ARC) is to maintain oversight of CLP’s financial control, risk management and internal control processes, by ensuring that adequate systems are in place and followed.
Download the Terms of Reference of the Audit & Risk Committee
Risks are managed at both the strategic and operational levels to support the long-term sustainability of growth objectives, while at the same time supporting the operational needs of the current business.
In relation to sustainability issues, the ARC is responsible for ensuring the assurance of the ESG data in the Sustainability Report is appropriate. Independent oversight is maintained through a robust internal control system, and assurance of the accuracy of metrics and reporting that follows appropriate accounting principles and reporting practices. CLP’s independent auditor is also responsible for assuring key ESG data, and their findings and observations are presented to senior management and the Board through the ARC.
Read the full Audit & Risk Committee Report
Sustainability Executive CommitteeThe Sustainability Executive Committee (SEC) has the strategic responsibility of assessing and managing sustainability issues.
The SEC is chaired by the Chief Executive Officer (CEO) as part of the role’s executive-level responsibility for economic, environmental and social matters. Set up in 2016, the SEC comprises the corporate senior management team of:
• Mr Richard Lancaster (CEO), Chairman, also Chairman of the Sustainability Committee;
• Ms Quince Chong (Chief Corporate Development Officer), also a member of the Sustainability Committee;
• Mr Nicolas Tissot (Chief Financial Officer), appointed to this position in place of Mr Geert Peeters with effect from 1 April 2021;
• Mr David Smales (Chief Operating Officer), until his resignation from CLP in December 2021;
• Mr David Simmonds (Group General Counsel & Chief Administrative Officer);
• Ms Eileen Burnett-Kant (Chief Human Resources Officer); and
• Mr Hendrik Rosenthal (Director – Group Sustainability).
Full biographies of senior management team members are set out on the Group’s website
The SEC steers the sustainability strategy of the Group and approves relevant deliverables. The CEO and CFO also hold management responsibilities for the assurance of ESG data, and jointly sign off the General Representation Letter connected with the assurance process.
CLP Holdings 2021 Sustainability Report | 37

Welcome About this Report Materiality Assessment Standard ESG disclosures
Corporate governance
Safety Environment and climate change
Asset management
Supply chain Community People Customers Key performance metrics
In 2021, the SEC convened six times, including before each Sustainability Committee meeting. These meetings provide a platform for the executive team to initiate or develop strategic sustainability projects, shape and receive progress updates on current projects and engage in strategic discussions on emerging issues.
Key themes discussed in 2021 are summarised below:
• Reviewed the carbon reduction targets under the Climate Vision 2050, and determined the ambition level for the Group;
• Provided direction on the climate scenario analysis and development of the financial model in quantifying climate-related risks and opportunities;
• Monitored the implications of local, regional and international climate policy changes to CLP;
• Reviewed and endorsed CLP’s support of carbon reduction initiatives, including the WBCSD Hydrogen Pledge;
• Reviewed the Group’s Labour Standards;
• Provided direction on how to embed sustainability into procurement practices;
• Reviewed performance on key sustainability indices and how benchmarking results can drive improvements in operational performance; and
• Prepared and developed the 2021 Sustainability Report, including materiality assessment, reporting standards and the accuracy of key metrics.
Group Sustainability DepartmentThe Director-led Group Sustainability Department regularly reports to and seeks guidance from the Sustainability Committee and SEC.
The Department is responsible for managing the implementation of the Group’s climate change strategy. This includes reporting and reviewing progress on CLP’s Climate Vision 2050 and TCFD implementation, as well as monitoring changes in stakeholder expectations and their implications to the Company.
Through its role, the Department embeds sustainability into existing operational practices and helps inform the development of the business strategy and planning processes. It monitors sustainability issues and updates the Sustainability Committee and SEC on emerging risks and opportunities. It also leads corporate sustainability reporting and identifies areas for improving operational performance.
In executing best practice, the Department is committed to developing capacity on ESG reporting and performance management as well as exchanging its experiences across organisations, sectors and countries. It supports and organises sustainability-related events and works closely with different stakeholder groups. For instance, the Department hosts Group functions and business unit meetings across regions on a regular basis to facilitate the sharing of experiences and insights on how to move sustainability forward.
CLP Holdings 2021 Sustainability Report | 38

Welcome About this Report Materiality Assessment Standard ESG disclosures
Corporate governance
Safety Environment and climate change
Asset management
Supply chain Community People Customers Key performance metrics
CASE STUDY
Enhancing sustainability oversight at regional level
CLP’s different business units are involved in different parts of the utility value chain, and they face distinct market conditions. Hence their sustainability challenges and focus also differ. With that in mind, Apraava Energy and EnergyAustralia have set up executive-level committees to enhance oversight of their sustainability topics.The Apraava Energy Sustainability Committee (the Committee) was formed in early 2021. It is comprised of six executive committee members, and is chaired by the Managing Director. It serves to promote, support and monitor the sustainable development of Apraava Energy’s businesses, as well as involvement in its communities and various stakeholders. The Committee also provides leadership and direction on long-term sustainability by enhancing ESG principles and practices in Apraava Energy’s core business operations. To support this Committee, a Sustainability Working Panel was appointed
by senior management to advise the Committee on a range of sustainability priorities.
EnergyAustralia’s Executive Sustainability Committee (the Executive Committee) was formed in December 2021 and comprises all members of EnergyAustralia’s Executive Leadership Team. It is chaired by the Managing Director. The purpose of the Executive Committee is to ensure EnergyAustralia can meet its ‘purpose’ which is to lead and accelerate the clean energy transformation for all. This includes maintaining EnergyAustralia’s trajectory towards net-zero emissions and overseeing EnergyAustralia’s broader sustainability performance. The Executive Committee will support the EnergyAustralia Holdings Board Sustainability Committee to fulfil its responsibilities under its Charter.
EnergyAustralia's Executive Health, Safety, Security and Environment Committee continues alongside this Executive Committee to provide detailed coverage of ongoing compliance and health, safety, security and environment performance targets.
CLP Holdings 2021 Sustainability Report | 39
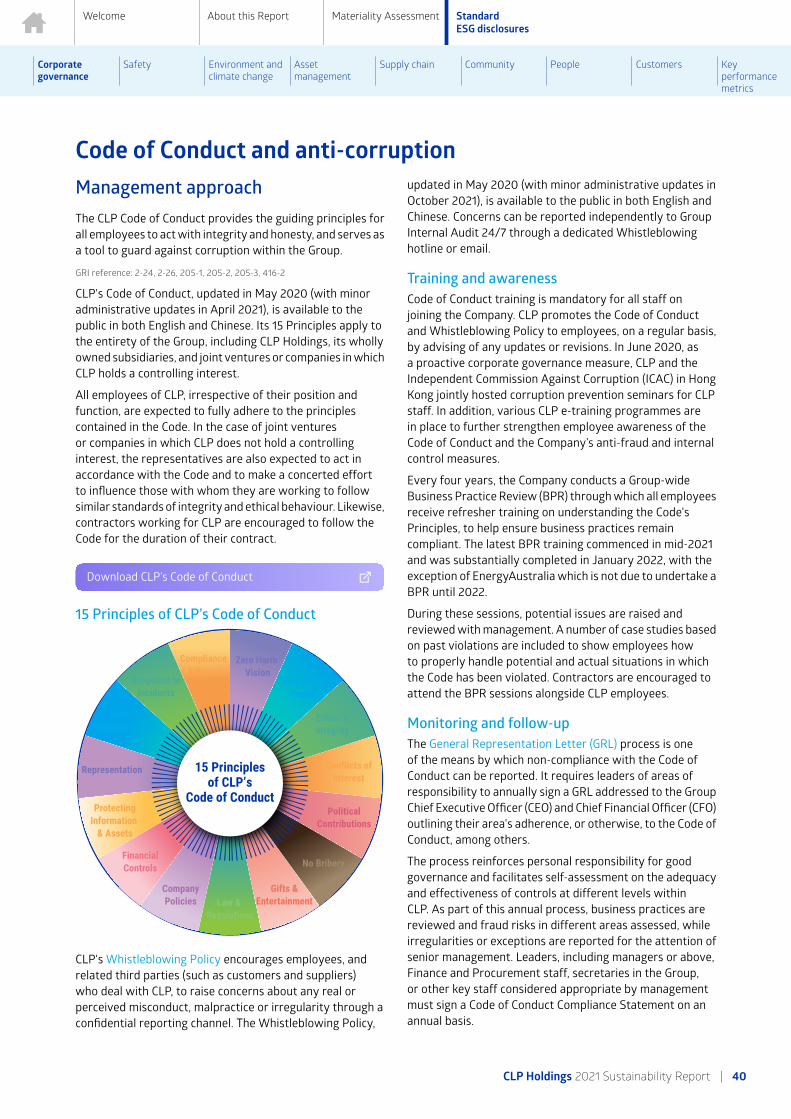
Welcome About this Report Materiality Assessment Standard ESG disclosures
Corporate governance
Safety Environment and climate change
Asset management
Supply chain Community People Customers Key performance metrics
Code of Conduct and anti-corruptionManagement approachThe CLP Code of Conduct provides the guiding principles for all employees to act with integrity and honesty, and serves as a tool to guard against corruption within the Group.
GRI reference: 2-24, 2-26, 205-1, 205-2, 205-3, 416-2
CLP's Code of Conduct, updated in May 2020 (with minor administrative updates in April 2021), is available to the public in both English and Chinese. Its 15 Principles apply to the entirety of the Group, including CLP Holdings, its wholly owned subsidiaries, and joint ventures or companies in which CLP holds a controlling interest.
All employees of CLP, irrespective of their position and function, are expected to fully adhere to the principles contained in the Code. In the case of joint ventures or companies in which CLP does not hold a controlling interest, the representatives are also expected to act in accordance with the Code and to make a concerted effort to influence those with whom they are working to follow similar standards of integrity and ethical behaviour. Likewise, contractors working for CLP are encouraged to follow the Code for the duration of their contract.
Download CLP’s Code of Conduct
15 Principles of CLP’s Code of Conduct
CLP's Whistleblowing Policy encourages employees, and related third parties (such as customers and suppliers) who deal with CLP, to raise concerns about any real or perceived misconduct, malpractice or irregularity through a confidential reporting channel. The Whistleblowing Policy,
updated in May 2020 (with minor administrative updates in October 2021), is available to the public in both English and Chinese. Concerns can be reported independently to Group Internal Audit 24/7 through a dedicated Whistleblowing hotline or email.
Training and awarenessCode of Conduct training is mandatory for all staff on joining the Company. CLP promotes the Code of Conduct and Whistleblowing Policy to employees, on a regular basis, by advising of any updates or revisions. In June 2020, as a proactive corporate governance measure, CLP and the Independent Commission Against Corruption (ICAC) in Hong Kong jointly hosted corruption prevention seminars for CLP staff. In addition, various CLP e-training programmes are in place to further strengthen employee awareness of the Code of Conduct and the Company’s anti-fraud and internal control measures.
Every four years, the Company conducts a Group-wide Business Practice Review (BPR) through which all employees receive refresher training on understanding the Code's Principles, to help ensure business practices remain compliant. The latest BPR training commenced in mid-2021 and was substantially completed in January 2022, with the exception of EnergyAustralia which is not due to undertake a BPR until 2022.
During these sessions, potential issues are raised and reviewed with management. A number of case studies based on past violations are included to show employees how to properly handle potential and actual situations in which the Code has been violated. Contractors are encouraged to attend the BPR sessions alongside CLP employees.
Monitoring and follow-upThe General Representation Letter (GRL) process is one of the means by which non-compliance with the Code of Conduct can be reported. It requires leaders of areas of responsibility to annually sign a GRL addressed to the Group Chief Executive Officer (CEO) and Chief Financial Officer (CFO) outlining their area's adherence, or otherwise, to the Code of Conduct, among others.
The process reinforces personal responsibility for good governance and facilitates self-assessment on the adequacy and effectiveness of controls at different levels within CLP. As part of this annual process, business practices are reviewed and fraud risks in different areas assessed, while irregularities or exceptions are reported for the attention of senior management. Leaders, including managers or above, Finance and Procurement staff, secretaries in the Group, or other key staff considered appropriate by management must sign a Code of Conduct Compliance Statement on an annual basis.
CLP Holdings 2021 Sustainability Report | 40

Welcome About this Report Materiality Assessment Standard ESG disclosures
Corporate governance
Safety Environment and climate change
Asset management
Supply chain Community People Customers Key performance metrics
The CLP-wide reporting system for Code of Conduct violations applies to any alleged or potential breach. Potential violations of the Code of Conduct are reported to Group Internal Audit (GIA) by employees, vendors, contractors and GIA auditors. Communications are received through means such as anonymous letters, emails or phone calls. The Group Code of Conduct Committee, which comprises of the Chief Financial Officer, Group General Counsel & Chief Administrative Officer, and Chief Human Resources Officer, reviews and endorses any disciplinary measures taken.
GIA regularly reviews compliance with the Code, and investigates any potential violations, except for those related to human resources, which are investigated by Human Resources (HR). The number of breaches of the Code and
any cases of corruption are reported annually to the Audit & Risk Committee (ARC), with the relevant data verified by a third party.
For a quicker response to Code of Conduct violations in Australia, EnergyAustralia has been delegated the responsibility of managing and acting on violations committed by EnergyAustralia employees. Under the delegation, EnergyAustralia informs the CLP Holdings ARC of cases involving senior EnergyAustralia employees.
For Apraava Energy, a separate Internal Complaints Committee has been established to handle complaints of sexual harassment at the workplace in accordance with Indian law.
Year in reviewIn 2021, 18 breaches of the Code of Conduct were reported, though none were financially or operationally material to the Group.
GRI reference: 406-1, 417-2, 417-3
The number of breaches of the Code of Conduct reduced from 25 in 2020 to 18 in 2021. None of the 18 breaches of the Code of Conduct was material to the Group’s financial statements or overall operations, nor did they involve employees at the grade level of senior manager and above. In addition, there were no convicted cases of corruption. The breaches were
managed in accordance with CLP's handling process for Code of Conduct breaches.
With regards to whistle-blowing cases, 25 cases were received in 2021 compared with 14 in 2020.
The Code of Conduct Principle breached and the confirmed cases of the past five years are shown below. Between 2017 and 2021, CLP did not have any breaches related to seven Code of Conduct principles, namely Political Contributions, No Bribery, Gift & Entertainment, Laws & Regulations, Representation, Response to Incidents, and Compliance & Report.
Code of Conduct Principles2021 2020 2019 2018 2017
Zero Harm Vision
• Includes issues regarding health and safety, and alcohol and drug abuse.
0 0 0 1 1
Respect for People
• Includes discrimination, harassment and other issues related to not respecting people.
4 8 17 7 12
Ethics and Business Integrity
• Includes unethical business behaviour related to integrity, honesty and fairness.
10 1 13 8 6
Other Principles
• Includes Conflicts of Interest, Company Policies, Financial Controls, Protecting Information & Assets, and Meeting Responsibilities.
4 16 1 4 9
Total 18 25 31 20 28
CLP Holdings 2021 Sustainability Report | 41

Welcome About this Report Materiality Assessment Standard ESG disclosures
Corporate governance
Safety Environment and climate change
Asset management
Supply chain Community People Customers Key performance metrics
Legal complianceManagement approachThe CLP Group operates in a number of different jurisdictions with different legal and regulatory requirements. Compliance with the requirements in the jurisdictions in which it operates is a basic requirement for maintaining the social licence to operate.
CLP is a law-abiding company that aspires to go beyond legal requirements and bring international best practices to its operations. Different policies and guidelines for each operational area are in place to assist CLP in ensuring compliance with the differing jurisdictional laws and regulations relating to competition, personal data and privacy, intellectual property, health, safety, the environment, as well as employment and human resources amongst others.
To maintain the highest standards of corporate governance and integrity, CLP is prepared to forego opportunity or advantage. In operating beyond compliance, CLP voluntarily follows higher standards that reflect the Company’s principles and values.
Monitoring and follow-upOne of the responsibilities of the Board-level Audit & Risk Committee (ARC) is to review and monitor the Company’s compliance with the Code of Conduct, as well as the Company’s policies on compliance with applicable legal and regulatory requirements such as the HKEx Listing Rules, the Companies Ordinance (Hong Kong) and the Securities and Futures Ordinance (Hong Kong). The ARC also reviews regulatory and legal issues. Every six months, Group Legal Affairs compiles a “CLP Group Key Regulatory and Legal
Compliance Issues Report” for the ARC, which covers key regulatory compliance issues in addition to legal cases in which CLP is a named defendant.
CLP is often confronted with changes in the legal and regulatory regimes of the various jurisdictions in which it operates. The Company closely monitors emerging regulations and ensures that it is prepared for changes.
In reviewing new and amended laws and regulations which came into effect during the 2021 reporting year, CLP identified those which had or would have a significant impact on the business and are relevant for inclusion in this report. The threshold applied for assessing inclusion is whether significant investment or expenditure was required to ensure compliance. Laws and regulations that met this threshold are outlined in the following sections of this report:
1. Emissions – air and GHG emissions, discharges into water and land, and generation of hazardous and non- hazardous waste;
2. Employment – compensation, dismissal, recruitment and promotion, working hours, rest periods, equal opportunity, diversity, anti-discrimination and other benefits and welfare;
3. Health and Safety – safe working environment and protecting employees from occupational hazards;
4. Labour Standards – prevention of child and forced labour;
5. Product Responsibility – consumer data protection and privacy; and
6. Anti-corruption – bribery, extortion, fraud and money laundering.
Year in reviewThere were no new reportable case of legal non-compliance in 2021.
SASB reference: IF-EU-550a.1; GRI reference: 2-27, 205-3, 206-1, 306-3 (2016),
411-1, 413-2, 416-2, 417-2, 417-3, 418-1, EU22, EU25
To uphold the spirit of transparency and accountability, CLP reports cases of legal non-compliance annually in the Sustainability Report. These include convicted criminal cases against CLP, and major breaches that resulted in
significant fines (greater than HK$1 million) or non-monetary sanctions. CLP’s 2021 performance is summarised below, grouped and based on the GRI Standards and the HKEx ESG Reporting Guide.
The Company is also exposed to the risk of contractual disputes and litigation in the course of its normal operations. The Group considers each instance separately in accordance with legal advice and will make provision and/or disclose information as appropriate. Refer to Note 33 – Contingent Liabilities on page 279 of the 2021 Annual Report.
CLP Holdings 2021 Sustainability Report | 42

Welcome About this Report Materiality Assessment Standard ESG disclosures
Corporate governance
Safety Environment and climate change
Asset management
Supply chain Community People Customers Key performance metrics
Legal non-complianceNumber of cases Supplementary information
Business practices Anti-corruption No reportable cases Read more in Code of Conduct and anti-corruption.
Anti-competitive behaviour No new reportable cases in 2021. There is one existing and previously reported case involving Ho-Ping Power Station in Taiwan, in which the CLP Group has a 20% equity interest
The Ho-Ping litigation is for alleged concerted action with other independent power producers (IPPs) in violation of the Taiwan Fair Trade Act. The Taiwan Fair Trade Commission (FTC) in 2013 ruled and fined nine IPPs for alleged cartel behaviour. The FTC’s decision was eventually overruled by the Taipei High Administrative Court (THAC) in October 2014. However, the FTC successfully appealed the THAC’s decision to the Supreme Administrative Court (SAC), and the case returned to the THAC for re-examination. In May 2017, the THAC ruled again in favour of Ho-Ping and rejected the FTC’s decision. In June 2018, the SAC accepted FTC’s further appeal and, for the second time, returned the case to the THAC for re-examination.
In June 2020, the THAC ruled in favour of Ho-Ping for the third time, and the FTC once again appealed to the SAC. Over the course of 2021 there was no change to the status of this litigation. Ho Ping continues to defend its position.
Employees and contractors
Employment practices No reportable cases
Labour standards (child and forced labour)
No reportable cases
Occupational health and safety
No reportable cases
Customer Customer privacy No reportable cases Read more in Customer privacy.
Product and service information and labelling and marketing information
No reportable cases
Access to electricity No reportable cases
Customer health and safety No reportable cases
Community Rights of Indigenous people No reportable cases
Environment No reportable cases Read more in Environmental regulations and compliance.
CLP Holdings 2021 Sustainability Report | 43

Welcome About this Report Materiality Assessment Standard ESG disclosures
Corporate governance
Safety Environment and climate change
Asset management
Supply chain Community People Customers Key performance metrics
Risk managementManagement approachRisk management is an integral part of all processes and the responsibility of everyone within CLP as it is critical to the long-term growth and sustainability of the Company.
GRI reference: 2-23, 205-1, 413-1
Risk Management FrameworkRisk is inherent in CLP’s operations and the markets in which the Group operates. CLP aims to identify risks early so they can be understood, managed, mitigated, transferred or avoided. This demands a proactive approach to risk management.
CLP’s risk management framework comprises four key elements:
1. Risk management philosophy;
2. Risk appetite;
3. Risk governance structure; and
4. Risk management process.
CLP’s overall risk management process is overseen by the Board through the Audit & Risk Committee. There is strong recognition that risk management is the responsibility of everyone within the Group, and cultivating and embedding a strong risk-centric culture is critical for the successful
implementation of CLP’s risk management framework. Consequently, risk management is integrated into all business and decision-making processes, including strategy formulation, business development, business planning, capital allocation, investment decisions, internal control and day-to-day operations.
CLP's risk management objectives are two-tiered:
• StrategicAt a strategic level, CLP focuses on the identification and management of the material financial and non-financial risks associated with the pursuit of its strategic and business objectives. In pursuing growth opportunities, CLP aims to optimise risk and return decisions as defined and quantified through a diligent and independent review and challenge process.
• OperationalAt an operational level, CLP aims to identify, analyse, evaluate and mitigate all operational hazards and risks. This is done to create a safe, healthy, efficient and environmentally friendly workplace for its employees and contractors. Other considerations include ensuring public safety and health, minimising environmental impact, and securing asset integrity and adequate insurance.
Read how climate-related risks are managed in the Climate-related Disclosures Report
CLP’s Risk Management Process
CLP Holdings 2021 Sustainability Report | 44

Welcome About this Report Materiality Assessment Standard ESG disclosures
Corporate governance
Safety Environment and climate change
Asset management
Supply chain Community People Customers Key performance metrics
Corporate governance dataCode of Conduct and anti-corruption
Code of Conduct 2021 2020 2019 2018 2017
Total number of breaches of Code of Conduct reported to the Audit & Risk Committee (cases) 18 25 31 20 28
Anti-corruption 2021 2020 2019 2018 2017
Convicted cases of corruption reported to the Audit & Risk Committee (cases) 0 0 0 0 0
The 2021 data shaded in orange has been independently verified by PricewaterhouseCoopers. The assurance scope of past years' data can be found in previous Sustainability Reports.
CLP Holdings 2021 Sustainability Report | 45

Safety
Welcome About this Report Materiality Assessment Standard ESG disclosures
Corporate governance
Safety Environment and climate change
Asset management
Supply chain Community People Customers Key performance metrics
OverviewCaring for people is one of the core components of CLP’s Value Framework. The continued health and safety of all parties is always a top priority for the Group.
While stakeholder expectations continually evolve, safety is fundamental; employees, contractors, customers and the communities in which CLP operates rightly expect to be free from harm while on or near CLP premises.
Health and safety is even more pertinent in today’s pandemic reality. Social distancing, temperature monitoring and enhanced hygiene measures are the new normal. Equally important is mental health and wellbeing as many individuals continue to struggle with work-from-home or other COVID-19 pandemic-related restrictions.
As expected, safety and well-being continues to be a material topic for all CLP stakeholders, with a special focus on
employees and contractors. The nature of the business potentially exposes individuals to high-risk activities. CLP is responsible for reducing risk by enacting appropriate safety measures or deploying technological solutions. CLP continually monitors the disclosure of metrics relating to customer safety and safety in nuclear plants where it has a non-majority stake.
Key stakeholders• Customers, Communities, Employees, Suppliers
Related material topics• Aligning business activities with community, employee and
customer expectations
• Promoting workplace safety and wellbeing
Health, Safety, and Environment managementManagement approachIntegrating Health, Safety and Environment (HSE) standards across the Group’s businesses and processes helps achieve the goal of safe, secure and environmentally-responsible operations.
GRI reference: 403-1, 403-2
CLP's commitment to continually improving its HSE performance for the benefit of its employees, contractors, customers and the public, remains steadfast. This covers the construction of new projects, operations and decommissioning.
With the establishment of its independent Group Security function in May 2021, CLP removed physical security from the scope of its Health, Safety, Security and Environment (HSSE) Policy, and rolled out a new integrated HSE Policy. The HSE Policy sets out the high-level expectations driving the direction of the HSE Management System (HSEMS), which the Group is currently refreshing.
Download the HSE Policy
HSEMS core components and relationship
The diagram above shows the core components of the Group's HSEMS and their inter-relationships.
CLP Holdings 2021 Sustainability Report | 46

Welcome About this Report Materiality Assessment Standard ESG disclosures
Corporate governance
Safety Environment and climate change
Asset management
Supply chain Community People Customers Key performance metrics
The HSEMS helps implement CLP's commitment to continually improving HSE performance and the requirements of the Group’s new HSE Policy. It is supported by a suite of standards with mandatory requirements, methodologies and other supporting tools.
The refresh of the HSEMS aims to:
• Establish a risk-based HSEMS to meet the objectives set out in the HSE Policy;
• Further improve clarification of mandatory requirements within the CLP HSEMS Standards;
• Enable the Group’s regional organisations to incorporate HSEMS Standards into their business programme; and
• Promote and encourage conformity to internationally accepted standards for occupational health and safety (ISO 45001) and environmental management (ISO 14001).
The transition to the refreshed system is progressing, and focuses on developing four areas of the existing HSEMS:
• Leadership and commitment;
• Planning and support;
• Operational enablers; and
• Monitoring, learning and improving.
Download the HSSE Management System Standard
Download an overview of the safety and environmental management systems of CLP’s assets
Strategies and proceduresTo support safe operations, CLP has in place a Health, Safety and Environment Improvement Strategy (HSE Improvement Strategy). It has clear objectives, focus areas and timelines, and sufficient resources to achieve its objectives, including HSE professionals and an appropriate budget.
Following the five pillars of the Group's HSE Improvement Strategy, an annual improvement programme is developed, approved and communicated to staff and contractors in each business unit. Recommendations are implemented on agreed timelines and programme process is monitored regularly. Read more in Occupational health and safety below.
Operational responsibilitiesThe Group HSSE Committee, chaired by the CEO, has the highest executive responsibility on HSSE-related issues. The Group Operations Leadership Team and the Global HSE Team conduct monthly meetings to coordinate, monitor and share knowledge and experience in HSE practices across the Group. Special focus is given to achieving an overall higher level of safety performance.
In addition, various HSE committees have been established to engage employees at the operational level. These committees also involve project partners and contractors. HSE professionals facilitate the overall engagement effort and advise on HSE matters, while the responsibility for implementing high levels of HSE standards rests with line management.
Hierarchy of operational responsibilities
CLP Holdings 2021 Sustainability Report | 47

Welcome About this Report Materiality Assessment Standard ESG disclosures
Corporate governance
Safety Environment and climate change
Asset management
Supply chain Community People Customers Key performance metrics
Occupational health and safetyManagement approachUsing the Group-wide Health, Safety and Environment (HSE) Improvement Strategy as its base, each business unit annually develops its own HSE action plan for delivery.
GRI reference: 403-1, 403-2, 403-3, 403-5, 403-7, 403-8
The CLP Group’s HSE Improvement Strategy in 2021 was based on five pillars, they are:
• Uplifting the safety culture;
• Rethinking risk;
• Involving stakeholders;
• Maintaining a healthy and engaged workforce; and
• Ensuring environmental sustainability.
Each pillar emphasises a key principle for effective HSE management. The pillars aim to uplift the Group’s safety culture across all operating regions, promote more proactive risk management, and engage employees, contractors and other key stakeholders in collectively implementing changes to improve safety performance.
Goals and targetsCLP is committed to ensuring all its activities and operations focus on the elimination of fatalities, life-changing injuries, and the occurrence of significant HSE events.
Monitoring and follow-upThe CLP Safety Performance Monitoring and Reporting Standard sets out the safety performance indicators and requirements of safety data reporting. The indicators show trends and can help identify areas which may require more attention to prevent an incident from occurring. CLP has used targeted engagements and worker insights to aide in the development of more comprehensive and effective incident prevention interventions.
Safety performance is reported internally on a monthly basis. Safety performance data and associated insights gained are collected and presented in the monthly meetings between the Group Operations Leadership Team and the Global HSE Team. The data and insights are also reported on a quarterly basis to the Group HSSE Committee, chaired by the Chief Executive Officer.
CLP’s Incident Management Standard sets out the minimum requirements for the implementation and maintenance of a safety incident management system across the Group. In the event of a major incident, the CLP Group Incident Investigation Panel (IIP) and Investigation Report Format Standard are followed. The IIP, chaired by senior members of staff from outside the business unit in which the accident occurred, conducts a thorough investigation. The IIP’s reports are critically reviewed by the Group Chief Operating
Officer and the regional Managing Director. The intention is to identify the factors contributing to the incident and the actions required to prevent a recurrence.
Training and awarenessPersonnel will only be asked to do work in areas in which they are deemed capable and competent to perform their roles. This requires the careful selection, placement, training, ongoing competency assessment and authorisation of employees, with third-party independent assessment where appropriate. A system is in place to identify and deliver the training necessary to ensure an individual's competence and knowledge in understanding the hazards, risks and control measures associated with their work.
At the asset level, there is flexibility to structure health and safety measures and design more specific approaches in providing relevant training. This includes monitoring the percentage of contractors who have undertaken this training. Safety training requirements are in all contracts and all contractors are expected to undergo safety training relevant to their duties. Spot checks are conducted to ensure compliance.
Continuous improvementThorough investigations are conducted into all incidents that have the potential to cause serious injuries. The aim is to move beyond simply looking at human error as a cause, and to understand the more complex latent conditions that contribute to incidents. CLP is committed to understanding how decisions and actions would be made by employees at a particular point in time in their work. CLP is also committed to learning from those closest to the work, to understand their challenges and identify practical improvement opportunities.
CLP is committed to ongoing efforts to find new and better ways of working by learning from investigations into incidents, as well as adopting best practices. For instance, in 2020, the Group conducted a significant overview of its operations involving underwater diving, with the express goal of reducing such activities where possible. Major progress has been made through both adopting technology and redesigning systems and equipment to reduce underwater diving. Increased use of Remote Operated Vehicles for cooling water system inspection and remote dredging equipment for cooling water system cleaning has helped to reduce both the hours and frequency of manned diving work required.
CLP Holdings 2021 Sustainability Report | 48

Welcome About this Report Materiality Assessment Standard ESG disclosures
Corporate governance
Safety Environment and climate change
Asset management
Supply chain Community People Customers Key performance metrics
Another example was the recent introduction of Human and Organisational Performance pilot programmes in some business units, providing its people with core skills to support their teams in learning and driving performance improvement. A central component of this capability lift is the formation of operational Learning Teams who actively
seek to understand and solve issues faced by those working on the frontline.
Read the 2020 case study on how robots help to eliminate diving risks
Year in reviewThe Group is pleased to report that there were no fatalities in 2021. This is the second year in a row in which the Group has been fatality-free for both employees and contractors. There was also a significant reduction in injuries on major projects.
SASB reference: IF-EU-320a.1; GRI reference: 403-4, 403-5, 403-6, 403-9,
403-10, EU17, EU18
There was an observable improvement in several key safety metrics when comparing the Group’s 2021 performance against 2020. This is summarised in the table below.
Regional safety performance (employees/contractors)
CLP Holdings Hong Kong Mainland China Australia India Total
Employees and
contractors combined
Fatalities (number) 0/0 0/0 0/0 0/0 0/0 0/0 0
Fatality rate (number per 200,000 work hours) 0.00/0.00 0.00/0.00 0.00/0.00 0.00/0.00 0.00/0.00 0.00/0.00 0.00
Days away from work injuries (number of personnel) 0/0 0/4 0/0 4/5 0/1 4/10 14
Lost time injury rate (number per 200,000 work hours) 0.00/0.00 0.00/0.07 0.00/0.00 0.18/0.40 0.00/0.03 0.05/0.08 0.07
High-consequence injuries (number of personnel) 0/0 0/0 0/0 0/0 0/1 0/1 1
Total recordable injury rate (number per 200,000 work hours) 0.13/0.22 0.02/0.14 0.00/0.08 0.45/0.97 0.00/0.41 0.14/0.29 0.23
Work-related ill health (number of personnel) – employees only 0 0 0 1 0 1 1
Lost days (number) – employees only 0 0 19 285 0 304 304
CLP Holdings 2021 Sustainability Report | 49

Welcome About this Report Materiality Assessment Standard ESG disclosures
Corporate governance
Safety Environment and climate change
Asset management
Supply chain Community People Customers Key performance metrics
Lost time injury rate and total recordable injury rate of CLP Group (employees and contractors combined)
Both lost time injury rate and total recordable injury rate have improved in 2021.
0.130.130.100.10 0.110.11 0.110.11
0.070.07
0.290.29
0.250.25
0.380.38
0.320.32
0.230.23
Lost time injury rate Total recordable injury rate
2017 2018 2019 2020 20210.00
0.15
0.30
0.45
Lost time injury rate (LTIR) by region (employees and contractors combined)
LTIR improved in all regions in 2021, except in Australia, which had an increase in LTIR due to a substantial decrease in hours worked.
per 2
00,0
00 w
ork
hour
s
0.100.10 0.090.09
0.160.16
0.090.09
0.040.040.000.00 0.000.00 0.000.00
0.150.15
0.000.00
0.480.48
0.260.26
0.110.11
0.190.19
0.260.26
0.030.030.050.05
0.000.00
0.060.060.030.03
0.000.00 0.000.00
0.180.18
0.000.00 0.000.00
Hong Kong Mainland China Australia India CLP Holdings
2017 2018 2019¹ 2020 20210
0.2
0.4
0.6
1 Starting from 2019, CLPe Solutions is reported under CLP Holdings to align with a change in internal reporting. Before that, it was reported under Hong Kong.
CLP Holdings 2021 Sustainability Report | 50

Welcome About this Report Materiality Assessment Standard ESG disclosures
Corporate governance
Safety Environment and climate change
Asset management
Supply chain Community People Customers Key performance metrics
Total recordable injury rate (TRIR) by region (employees and contractors combined)
TRIR improved in all regions in 2021, except in Australia & CLP Holdings, which noted increases in TRIR due to higher incident numbers (3 in Australia and 2 in CLPH) and decreases in total hours worked.
per 2
00,0
00 w
ork
hour
s
0.200.20 0.180.18
0.390.39
0.260.26
0.090.090.040.04 0.040.04 0.050.05
0.340.34
0.040.04
0.970.97
0.700.70
0.420.42 0.450.45
0.630.63
0.180.18 0.170.17
0.600.60
0.410.410.370.37
0.000.00 0.000.00
0.180.18
0.000.00
0.170.17
Hong Kong Mainland China Australia India CLP Holdings
2017 2018 2019¹ 2020 20210
0.2
0.4
0.6
0.8
1
1 Starting from 2019, CLPe Solutions is reported under CLP Holdings to align with a change in internal reporting. Before that, it was reported under Hong Kong.
Improving HSE managementDuring 2021, CLP businesses implemented the necessary changes set out by the 2021 HSE Improvement Strategy. The HSE Improvement Plan was assessed and refreshed for the next three-year period (2022-24), with an emphasis on becoming a learning organisation. The five pillars of the HSE
Improvement Strategy remain critical to its continuity and ongoing approach. They address the emerging needs of the business moving forward.
This year's health and safety activities against each pillar are summarised below. Information on the environmental sustainability pillar is included in the Environment section.
Uplifting the Safety Culture • At the Group level, Human and Organisational Performance & Learning Team training pilot programmes commenced in some of CLP's business units, providing staff with core skills to support their teams in learning and driving performance improvement. Central to the success of this programme is the formation of operational Learning Teams who will actively seek to understand and solve issues faced by those working on the frontline.
• EnergyAustralia continued to implement a new science-based safety programme called "Advanced Error Reduction in Organisations (AERO)". AERO provides tools to help employees understand their personality tendencies, so that they can more easily recognise and manage error traps associated with certain tasks. New Manual Handling programmes were initiated at Mount Piper and Yallourn.
• In Mainland China, Fangchenggang introduced a Safety Culture Transformation Team to uplift its safety culture and work safety through initiating a series of safety improvement programs and activities titled, “I want to be safe; I can be safe; I will be safe; Build safety together”.
CLP Holdings 2021 Sustainability Report | 51

Welcome About this Report Materiality Assessment Standard ESG disclosures
Corporate governance
Safety Environment and climate change
Asset management
Supply chain Community People Customers Key performance metrics
Rethinking Risk • Safety in Design (SiD) training, developed specifically for CLP operations and project lifecycles, commenced across the Group. Expert external facilitators upskilled selected CLP personnel with foundational best practice knowledge, in a context that supports the business. Australia's first net-zero emissions hydrogen and gas capable power plant project, Tallawarra B, was contracted and designed under SiD principles. Additionally, a series of design review workshops for megaprojects in Hong Kong utilised SiD principles.
• A bowtie risk assessment is a risk evaluation method used to demonstrate causal relationships for high-risk scenarios in a visual way, clearly articulating plausible accident scenarios that could exist. A significant number of bowtie risk assessments were conducted across the regions.
Involving Stakeholders • Involving stakeholders is a top priority of CLP’s multi-disciplinary team. Many contributors make or influence decisions that have the potential to impact workers’ safety. It is important that the interests of stakeholders are understood, and proper consultation and engagement processes are established to ensure their interests are consistent with the highest standards of safety. Work will continue to focus on establishing Human & Organisational Performance capabilities within CLP, allowing clearer visibility on work performed while leveraging frontline knowledge to find solutions.
• In Hong Kong, the team conducted a series of Safety Alignment Workshops for new contracts to align safety values and solicit safety leadership commitment from contractor partners.
• EnergyAustralia formalised an in house and online ergonomics tool called ‘Swivel’. It is specifically designed to ensure workstations (office and home-based) are ergonomically sound. In 2021, over 1,700 Swivel assessments were completed.
Maintaining a Healthy and Engaged Workforce
• 2021 continued to be challenging with the ongoing COVID-19 pandemic across the globe. Employee health and wellness was promoted through flexible working arrangements, equipment setups for remote working, regular communications, as well as health and wellbeing initiatives targeting mental and physical health awareness. Each region responded comprehensively in supporting their employees, particularly in respect to mental health and ergonomics. As such the internal CEO HSE Awards recognised all regions as winners for their committed and ongoing approach to employee health and well-being.
• This year, CLP launched its new online Health and Wellness portal, Virgin Pulse. The portal provides additional capacity to deliver targeted work-related health programmes and support other wellbeing efforts. By using the portal, employees can choose the personal wellness journey that suits them, engage with their fellow colleagues in a series of challenges and evaluate their own health risk factors.
• The Employee Assistance Programme in Mainland China supported staff and their families through multiple channels including a consultation hotline, monthly health newsletters and quarterly thematic workshops.
• At EnergyAustralia, the Employee Assistance Programme had very strong utilisation rates (>12% when annualised, above the industry average) in 2021. Virgin Pulse was also launched in Australia. To assist with the challenges of working from home with children, EnergyAustralia hosted online sessions for children and parents. These have included themes such as story time, clowns, magicians, comedians and how to get the most from home schooling. Focus on the health and wellbeing of employees continued through the EnergyAustralia “Spark” programme.
Find out how CLP supports its people during the COVID-19 pandemic from the Human Capital section in the 2021 Annual Report.
CLP Holdings 2021 Sustainability Report | 52

Welcome About this Report Materiality Assessment Standard ESG disclosures
Corporate governance
Safety Environment and climate change
Asset management
Supply chain Community People Customers Key performance metrics
CASE STUDY
Bringing flexibility and applying ingenuity to safety training
In early 2021, CLP Power launched Hong Kong’s first multi-purpose Mobile Safety Training Workshop as part of its continuous efforts to promote a world-class safety culture for the Company and energy industry.Traditionally, safety training for frontline engineering personnel is conducted in a classroom environment. The new, first-of-its-kind workshop provides the space and facilities for the hands-on practice of critical safety skills and procedures. Frontline workers were engaged in developing this industry-first workshop.
Equipped with a variety of safety training equipment, the workshop can use lighting and environmental effects to replicate actual site conditions such as confined spaces. The workshop is held in a mobile truck, allowing the flexibility of conducting the training at or close to the work site. Workers, such as those working in confined spaces or at height, can refresh their safety procedures and practices before carrying out the actual work.
More than 1,000 CLP Power engineering employees are qualified to work in confined spaces or work at height. While they are equipped with relevant professional training before they commence work, the new Mobile Safety Training Workshop enables regular state-of-the-art safety refresher training. The workshop initiative further raises CLP’s high standards for safe workplace practices.
Demonstrating confined space rescue procedures using the Mobile Safety Training Workshop.
The Mobile Safety Training Workshop allows demonstration of confined space safety procedures in a controlled environment.
CLP Holdings 2021 Sustainability Report | 53

Welcome About this Report Materiality Assessment Standard ESG disclosures
Corporate governance
Safety Environment and climate change
Asset management
Supply chain Community People Customers Key performance metrics
Safety around CLP’s networkManagement approachCustomer health and safety concerns are largely related to electromagnetic fields (EMF) arising from the CLP power system. Measurements of EMF remain well below international guidelines.
GRI reference: 416-1, 416-2
While the Group’s HSE Management System Standard sets out an overarching approach to managing the safety risks in operations, responsibility is also taken for preserving public health and safety, including for people who work or live in close proximity to electricity supply lines.
CLP operates a transmission and distribution network in Hong Kong, as well as transmission networks in Shenzhen, China and Madhya Pradesh, India. Working near electricity supply lines can pose safety concerns. The Hong Kong and Mainland China operations conduct regular construction site inspections and provide cable plans and safety talks to road work contractors and site management personnel to enhance safety awareness at all locations.
EMF arising from power systems can be of public health concerns. CLP’s power supply equipment fully complies with the guidelines issued by the International Commission on Non-Ionizing Radiation Protection. Regular EMF measurements of power supply equipment are carried out jointly with the Electrical and Mechanical Services Department of the Hong Kong Government. The measured EMF levels continue to be well below the guideline limits.
Regarding customer health and safety, CLP Power has customer service centres conveniently located in its supply areas in Hong Kong to provide assistance on product safety, as well as advise on energy efficient products, energy saving tips and other account management issues. In 2021, there were no reportable cases of CLP products affecting customer health and safety in Hong Kong.
Maintaining proper Health, Safety and Environment management practices for transmission towers is important to keep the general public safe.
CLP Holdings 2021 Sustainability Report | 54

Welcome About this Report Materiality Assessment Standard ESG disclosures
Corporate governance
Safety Environment and climate change
Asset management
Supply chain Community People Customers Key performance metrics
Nuclear safetyManagement approachCLP is the minority owner of two nuclear power stations in China. The power stations have adopted defence-in-depth principles to ensure multiple independent layers of safety protection.
SASB reference: IF-EU-540a.2
Since 1985, CLP has held a 25% equity share in the Guangdong Daya Bay Nuclear Power Station (GNPS), which provides roughly one third of the electricity supplied to CLP’s customers in Hong Kong. In 2017, CLP’s nuclear portfolio was expanded with a 17% equity investment in Yangjiang Nuclear Power Co. Ltd. which operates Yangjiang Nuclear Power Station (YNPS) in Guangdong. Nuclear power has proven to be a reliable, cost-competitive and clean source of energy. To realise the Group’s decarbonisation vision, CLP continuously seeks investment opportunities for new capacity in low-carbon energies, such as nuclear power.
Nuclear risk managementThe safe and steady operation of the two nuclear power stations remains a top priority. The defence-in-depth principle of safety is applied across the full spectrum of areas - from design, site selection, operation, radiation protection, environmental monitoring, to emergency preparedness. The safety principle of "As Low As Reasonably Achievable" (ALARA) is also applied to ensure robust radiation protection.
The two nuclear power stations have achieved good safety performance over the years. This achievement is a result of:
• Adopting best international practices, including the International Atomic Energy Agency Nuclear Safety Standards, in its operations;
• A well-trained and qualified workforce;
• Well-established safety practices and procedures; and
• Comprehensive risk analysis and mitigation.
Find out more on nuclear energy
Learn more about the contingency plan of GNPS
Nuclear waste managementGNPS follows national policy and international practices for nuclear waste management. The station stores its spent nuclear fuel on-site in dedicated storage facilities.
The back-end management of the fuel cycle remains on site for a number of years before being passed on to a service provider licensed by the Mainland Chinese Government for reprocessing. The service provider is supervised by the National Nuclear Safety Administration (NNSA) and its environmental impact is monitored by the Ministry of Ecology and Environment (MEE). The policy in Mainland China on reprocessing spent nuclear fuel is similar to that of a number of European countries.
As the minority owner of GNPS, CLP is not in a position to report on the back-end management of the fuel cycle in China, including the status of the reprocessing plants for spent fuel.
Low- to intermediate-level solid radioactive waste is packed and stored in a dedicated facility on-site on an interim basis, and is secured to prevent unauthorised access. The waste is transferred to a final repository operated by a service provider, using the shallow burial method commonly adopted in the United States, France and the United Kingdom. The operation of the off-site repository is under the supervision of the national nuclear regulator and relevant nuclear safety regulations.
Monitoring and follow-upRadiation exposure for workers is closely monitored and managed by plant operators both collectively and at an individual level as part of operating protocols. Workers incur most of their radiation dosage during planned refuelling outages, when much of the work is undertaken at the nuclear generating units. The level of radiation dosage is typically associated with the number of planned outages carried out at the units, which require inspection and maintenance activities in radiation-controlled areas.
Training and awarenessAn on-site training school provides professional training on operational procedures for nuclear sites. The training aims to enhance nuclear safety and systematically minimise human error. There is a once-every-two-years requalification mechanism to ensure operator professionalism and competency in plant operation.
In line with good business practice, GNPS has also provisioned for the expenses associated with the future decommissioning of the plant as required by relevant laws and regulations.
CLP Holdings 2021 Sustainability Report | 55
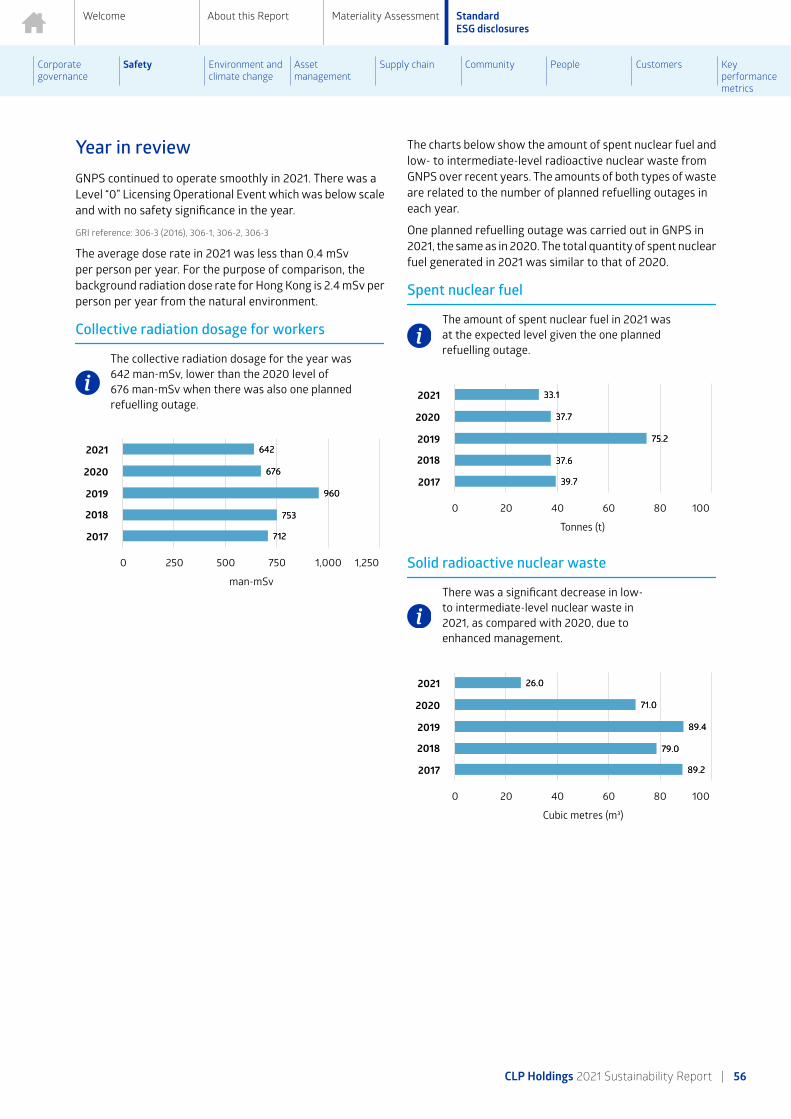
Welcome About this Report Materiality Assessment Standard ESG disclosures
Corporate governance
Safety Environment and climate change
Asset management
Supply chain Community People Customers Key performance metrics
Year in reviewGNPS continued to operate smoothly in 2021. There was a Level “0” Licensing Operational Event which was below scale and with no safety significance in the year.
GRI reference: 306-3 (2016), 306-1, 306-2, 306-3
The average dose rate in 2021 was less than 0.4 mSv per person per year. For the purpose of comparison, the background radiation dose rate for Hong Kong is 2.4 mSv per person per year from the natural environment.
Collective radiation dosage for workers
The collective radiation dosage for the year was 642 man-mSv, lower than the 2020 level of 676 man-mSv when there was also one planned refuelling outage.
man-mSv
642642
676676
960960
753753
712712
2021
2020
2019
2018
2017
0 250 500 750 1,000 1,250
The charts below show the amount of spent nuclear fuel and low- to intermediate-level radioactive nuclear waste from GNPS over recent years. The amounts of both types of waste are related to the number of planned refuelling outages in each year.
One planned refuelling outage was carried out in GNPS in 2021, the same as in 2020. The total quantity of spent nuclear fuel generated in 2021 was similar to that of 2020.
Spent nuclear fuel
The amount of spent nuclear fuel in 2021 was at the expected level given the one planned refuelling outage.
Tonnes (t)
33.133.1
37.737.7
75.275.2
37.637.6
39.739.7
2021
2020
2019
2018
2017
0 20 40 60 80 100
Solid radioactive nuclear waste
There was a significant decrease in low- to intermediate-level nuclear waste in 2021, as compared with 2020, due to enhanced management.
Cubic metres (m³)
26.026.0
71.071.0
89.489.4
79.079.0
89.289.2
2021
2020
2019
2018
2017
0 20 40 60 80 100
CLP Holdings 2021 Sustainability Report | 56

Welcome About this Report Materiality Assessment Standard ESG disclosures
Corporate governance
Safety Environment and climate change
Asset management
Supply chain Community People Customers Key performance metrics
Safety dataOccupational health and safety
Group safety performance 2021 2020 2019 2018 2017
Employees1
Fatalities (number of personnel)2,3 0 0 0 1 0
Fatality Rate (number per 200,000 work hours)4,5 0.00 0.00 0.00 0.01 0.00
Days Away From Work Injuries (number of personnel)3,6 4 12 7 11 11
Lost Time Injury Rate(number per 200,000 work hours)5,7 0.05 0.13 0.07 0.13 0.13
High-consequence Injuries (number of personnel)8 0 N/A N/A N/A N/A
Total Recordable Injury Rate(number per 200,000 work hours)5,9 0.14 0.25 0.19 0.19 0.21
Work-related Ill Health (number of personnel)3,10 1 0 0 1 0
Lost Days (number of days)11 30412 44313 46414 249 252
Contractors1
Fatalities (number of personnel)2,3 0 0 1 1 4
Fatality Rate (number per 200,000 work hours)4,5 0.00 0.00 0.01 0.01 0.03
Days Away From Work Injuries (number of personnel)3,6 10 10 19 11 16
Lost Time Injury Rate(number per 200,000 work hours)5,7 0.08 0.09 0.14 0.09 0.14
High-consequence Injuries (number of personnel)8 1 N/A N/A N/A N/A
Total Recordable Injury Rate(number per 200,000 work hours)5,9 0.29 0.37 0.52 0.29 0.36
Employees and contractors combined1
Fatalities (number of personnel)2,3 0 0 1 2 4
Fatality Rate (number per 200,000 work hours)4,5 0.00 0.00 0.00 0.01 0.02
Days Away From Work Injuries (number of personnel)3,6 14 22 26 22 27
Lost Time Injury Rate(number per 200,000 work hours)5,7 0.07 0.11 0.11 0.10 0.13
High-consequence Injuries (number of personnel)8 1 N/A N/A N/A N/A
Total Recordable Injury Rate(number per 200,000 work hours)5,9 0.23 0.32 0.38 0.25 0.29
1 The system of rules applied in recording and reporting accident statistics complies with the International Labour Organization (ILO) Code of Practice on Recording and Notification of Occupational Accidents and Diseases.
2 Refers to the number of fatalities as a result of work-related injury.3 Starting from 2021, the unit is changed from the number of cases to the number of personnel.4 Refers to the number of fatal injuries per 200,000 work hours in the year.5 Rates are normalised to 200,000 work hours, which approximately equals to the number of hours worked by 100 people in one year.6 Starting from 2021, “Days Away From Work Injuries” replaces “Lost Time Injury”. Days Away From Work Injuries refers to the number of personnel who sustains
work-related injury and is unfit to perform any work on any day after the occurrence of the injury. “Any day” is any calendar day which includes rest days, weekend days, leave days, public holidays or days after ceasing employment. It does not include the day the injury incident occurred. “Days Away From Work Injuries” excludes fatalities which were included in “Lost Time Injury”. Numbers prior to 2021 are the previously reported numbers for “Lost Time Injury”.
7 Refers to the number of Days Away From Work Injuries and Fatalities per 200,000 work hours in the year.8 Refers to the number of personnel who sustains life threatening or life-altering work-related injury. It is a subset of Days Away From Work Injuries.9 Refers to the number of Total Recordable Injuries per 200,000 work hours in the year. Total Recordable Injuries include Fatalities, Days Away From Work Injuries,
Restricted Work Injuries, and Medical Treatment Injuries.10Starting from 2021, “Work-related Ill Health” replaces “Occupational Disease”. Work-related Ill Health includes the diseases listed in the ILO List of Occupational
Diseases, work-related mental illnesses and work-related disorders. Numbers prior to 2021 are the previously reported numbers for “Occupational Disease”.11 Starting from 2021, “Lost Days” replaces “Days Lost”. “Lost Days” is the sum total of calendar days (consecutive or otherwise) after the days on which the
work-related injuries and work-related ill health occurred. “Days Lost” accounts the working days instead of calendar days. Numbers prior to 2021 are the previously reported numbers for “Days Lost”.
12 19 out of 304 days were carried forward from one incident in 2020.13 188 out of 443 days were carried forward from one incident in the past.14 158 out of 464 days were carried forward from three incidents in the past.
CLP Holdings 2021 Sustainability Report | 57

Welcome About this Report Materiality Assessment Standard ESG disclosures
Corporate governance
Safety Environment and climate change
Asset management
Supply chain Community People Customers Key performance metrics
Regional safety performance 2021 2020 20191 2018 2017
CLP Holdings2
Employees
Fatalities (number of personnel) 0 0 0 0 0
Fatality Rate (number per 200,000 work hours) 0.00 0.00 0.00 0.00 0.00
Days Away from Work Injuries(number of personnel) 0 0 0 0 0
Lost Time Injury Rate(number per 200,000 work hours) 0.00 0.00 0.00 0.00 0.00
High-consequence Injuries(number of personnel) 0 N/A N/A N/A N/A
Total Recordable Injury Rate(number per 200,000 work hours) 0.13 0.00 0.00 0.00 0.00
Work-related Ill Health (number of personnel) 0 0 0 0 0
Lost Days (number of days) 0 0 0 0 0
Contractors
Fatalities (number of personnel) 0 0 1 0 0
Fatality Rate (number per 200,000 work hours) 0.00 0.00 0.24 0.00 0.00
Days Away from Work Injuries(number of personnel) 0 0 2 0 0
Lost Time Injury Rate(number per 200,000 work hours) 0.00 0.00 0.48 0.00 0.00
High-consequence Injuries(number of personnel) 0 N/A N/A N/A N/A
Total Recordable Injury Rate(number per 200,000 work hours) 0.22 0.00 0.48 0.00 0.00
Hong Kong2
Employees
Fatalities (number of personnel) 0 0 0 0 0
Fatality Rate (number per 200,000 work hours) 0.00 0.00 0.00 0.00 0.00
Days Away from Work Injuries(number of personnel) 0 4 4 5 1
Lost Time Injury Rate(number per 200,000 work hours) 0.00 0.09 0.09 0.10 0.02
High-consequence Injuries(number of personnel) 0 N/A N/A N/A N/A
Total Recordable Injury Rate(number per 200,000 work hours) 0.02 0.21 0.19 0.15 0.08
Work-related Ill Health (number of personnel) 0 0 0 0 0
Lost Days (number of days) 0 119 246 120 47
Contractors
Fatalities (number of personnel) 0 0 0 0 4
Fatality Rate (number per 200,000 work hours) 0.00 0.00 0.00 0.00 0.07
Days Away from Work Injuries(number of personnel) 4 5 15 5 9
Lost Time Injury Rate(number per 200,000 work hours) 0.07 0.10 0.21 0.08 0.16
High-consequence Injuries(number of personnel) 0 N/A N/A N/A N/A
Total Recordable Injury Rate(number per 200,000 work hours) 0.14 0.30 0.51 0.20 0.29
CLP Holdings 2021 Sustainability Report | 58

Welcome About this Report Materiality Assessment Standard ESG disclosures
Corporate governance
Safety Environment and climate change
Asset management
Supply chain Community People Customers Key performance metrics
Regional safety performance 2021 2020 20191 2018 2017
Mainland China2
Employees
Fatalities (number of personnel) 0 0 0 0 0
Fatality Rate (number per 200,000 work hours) 0.00 0.00 0.00 0.00 0.00
Days Away from Work Injuries(number of personnel) 0 2 0 0 0
Lost Time Injury Rate(number per 200,000 work hours) 0.00 0.19 0.00 0.00 0.00
High-consequence Injuries(number of personnel) 0 N/A N/A N/A N/A
Total Recordable Injury Rate(number per 200,000 work hours) 0.00 0.19 0.10 0.00 0.00
Work-related Ill Health (number of personnel) 0 0 0 0 0
Lost Days (number of days) 19 59 0 0 0
Contractors
Fatalities (number of personnel) 0 0 0 0 0
Fatality Rate (number per 200,000 work hours) 0.00 0.00 0.00 0.00 0.00
Days Away from Work Injuries(number of personnel) 0 1 0 0 0
Lost Time Injury Rate(number per 200,000 work hours) 0.00 0.10 0.00 0.00 0.00
High-consequence Injuries(number of personnel) 0 N/A N/A N/A N/A
Total Recordable Injury Rate(number per 200,000 work hours) 0.08 0.49 0.00 0.07 0.06
Australia2
Employees
Fatalities (number of personnel) 0 0 0 1 0
Fatality Rate (number per 200,000 work hours) 0.00 0.00 0.00 0.04 0.00
Days Away from Work Injuries(number of personnel) 4 6 3 6 10
Lost Time Injury Rate(number per 200,000 work hours) 0.18 0.25 0.10 0.26 0.43
High-consequence Injuries(number of personnel) 0 N/A N/A N/A N/A
Total Recordable Injury Rate(number per 200,000 work hours) 0.45 0.46 0.31 0.44 0.60
Work-related Ill Health (number of personnel) 1 0 0 1 0
Lost Days (number of days) 285 265 218 129 205
Contractors
Fatalities (number of personnel) 0 0 0 1 0
Fatality Rate (number per 200,000 work hours) 0.00 0.00 0.00 0.06 0.00
Days Away from Work Injuries(number of personnel) 5 2 2 4 6
Lost Time Injury Rate(number per 200,000 work hours) 0.40 0.11 0.12 0.26 0.62
High-consequence Injuries(number of personnel) 0 N/A N/A N/A N/A
Total Recordable Injury Rate(number per 200,000 work hours) 0.97 0.44 0.62 1.09 1.85
CLP Holdings 2021 Sustainability Report | 59

Welcome About this Report Materiality Assessment Standard ESG disclosures
Corporate governance
Safety Environment and climate change
Asset management
Supply chain Community People Customers Key performance metrics
Regional safety performance 2021 2020 20191 2018 2017
India2
Employees
Fatalities (number of personnel) 0 0 0 0 0
Fatality Rate (number per 200,000 work hours) 0.00 0.00 0.00 0.00 0.00
Days Away from Work Injuries(number of personnel) 0 0 0 0 0
Lost Time Injury Rate(number per 200,000 work hours) 0.00 0.00 0.00 0 0.00
High-consequence Injuries(number of personnel) 0 N/A N/A N/A N/A
Total Recordable Injury Rate(number per 200,000 work hours) 0.00 0.00 0.00 0.00 0.00
Work-related Ill Health (number of personnel) 0 0 0 0 0
Lost Days (number of days) 0 0 0 0 0
Contractors
Fatalities (number of personnel) 0 0 0 0 0
Fatality Rate (number per 200,000 work hours) 0.00 0.00 0.00 0.00 0.00
Days Away from Work Injuries(number of personnel) 1 2 0 2 1
Lost Time Injury Rate(number per 200,000 work hours) 0.03 0.07 0.00 0.06 0.03
High-consequence Injuries(number of personnel) 1 N/A N/A N/A N/A
Total Recordable Injury Rate(number per 200,000 work hours) 0.41 0.46 0.68 0.19 0.20
1 Starting from 2019, CLPe Solutions has been reported under CLP Holdings to align with a change in internal reporting. Before that, it was reported under Hong Kong.
2 The system of rules applied in recording and reporting accident statistics complies with the International Labour Organization (ILO) Code of Practice on Recording and Notification of Occupational Accidents and Diseases.
Nuclear safety 2021 2020 2019 2018 2017
Workers
Collective radiation dosage for workers(man-mSv) 642 676 960 753 712
Nuclear-related waste
Spent nuclear fuel (t) 33.1 37.7 75.2 37.6 39.7
Low- to intermediate-level radioactive nuclear waste (m3) 26.0 71.0 89.4 79.0 89.2
2021 data shaded in orange has been independently verified by PricewaterhouseCoopers. The assurance scope of past years' data can be found in previous Sustainability Reports.
CLP Holdings 2021 Sustainability Report | 60

Environment and climate change
Welcome About this Report Materiality Assessment Standard ESG disclosures
Corporate governance
Safety Environment and climate change
Asset management
Supply chain Community People Customers Key performance metrics
OverviewReducing greenhouse gas (GHG) emissions by replacing thermal generation with clean energy infrastructure is the key means by which CLP will mitigate its impact on climate change.
Climate is not the sole benefactor. Replacing fossil fuel consumption offers other benefits, including the reduced use of resources such as water for cooling in thermal plants, fuel and associated fuel consumption in its extraction and transport. Production of other pollutants such as airborne particulate matter is also reduced. All bring immediate benefit to communities through reduced waste and better air quality.
Investment in clean electricity infrastructure also benefits the economy by helping establish new industries and decarbonisation opportunities in relation to biodiversity and land use.
Stringent environmental management systems are already in place on CLP generation assets throughout the asset’s life cycle, from environmental impact assessment before construction, emissions control during operations, to waste management and site rehabilitation when a plant is decommissioned. Effective management of these issues is embedded in CLP guidelines that dictate day-to-day operations and are fundamental to maintaining a licence to operate.
Key stakeholders• Government and regulators, Communities,
the Environment
Relevant material topics• Shaping and executing the transition to net-zero
• Investing in clean electricity infrastructure
Environmental managementManagement approachCLP’s Group-wide environmental management efforts align with the CLP Group Health, Safety and Environment Management System (HSEMS), which is driven by the new integrated Group HSE Policy.
GRI reference: 2-23
Strategies and proceduresThe CLP Group HSEMS provides a framework used to identify and manage significant environmental issues arising from its operations. The HSEMS requires the environmental risks associated with a project's operational life cycle to be appropriately managed.
The environmental processes covered in the HSEMS include:
• Environmental impact assessments;
• Environmental monitoring;
• Environmental Management System (EMS) development;
• Environmental due diligence; and
• Data management systems.
Learn more about CLP’s HSEMS
These processes are key elements in support of the “Ensuring Environmental Sustainability” pillar of CLP Group’s HSE Improvement Strategy for effective environmental management. The strategy aims to uplift environmental performance across all operations. Key initiatives and actions in 2021 are discussed in the following subsections.
As part of CLP’s Pre-investment Environmental Risk Assessment, environmental due diligence is conducted at the project planning stage, followed by a more detailed environmental impact assessment (EIA) if needed. Assessments of key environmental impacts such as air quality and biodiversity are conducted at the EIA stage where applicable.
CLP takes great care in conducting all EIAs and has processes in place to fulfil the requirements and recommendations stipulated in EIA reports and local regulations. Planning procedures extend beyond compliance in countries where regulations are not as stringent. For instance, CLP mandates an EIA for all major generation projects in India, even though
CLP Holdings 2021 Sustainability Report | 61

Welcome About this Report Materiality Assessment Standard ESG disclosures
Corporate governance
Safety Environment and climate change
Asset management
Supply chain Community People Customers Key performance metrics
it is not a statutory requirement for renewable energy projects in the country.
Read about how environmental aspects are considered in new projects
CLP is continuously refreshing its HSE Management System and its EMS. A refresh is currently underway. It will include specific environmental operational controls designed to systematically and continually improve the environmental performance of assets. During the transition to the refreshed HSE Management System, certain environmental standards and guidelines from the existing EMS will continue to support daily operations.
Under the HSE Management System, all power generation assets of which CLP has operational control are required to achieve third-party certification to the international standard, ISO 14001 Environmental Management Systems, within two years from commencement of operation or acquisition. In 2021, all assets in this category have successfully certified their EMS to the ISO 14001: 2015 standard.
Download the environmental management systems of CLP's assets
Monitoring and follow-upCLP recognises that the development of goals and targets helps monitor progress and drive improvements in the efficient use of environmental resources. To this end, the Group has been developing internal environmental targets for emission, waste and several water-related parameters.
An environmental monitoring process, currently applied at project level, has also been developed. It specifies how environmental conditions should be assessed and assists with the design and implementation of suitable measures.
Environmental regulations and complianceManagement approachIt is fundamental that CLP fully complies with applicable environmental laws and regulations in the jurisdictions in which it operates.
Established processes are in place to review relevant environmental laws and regulations for new investments, or other updates to existing regulations. If an incident occurs at an asset under CLP’s operational control, it is classified and recorded in a timely manner. Incidents managed through this process include notifications of any fines or prosecution from local authorities.
Year in reviewIn the year ending 31 December 2021, there were a total of nine environmental regulatory non-compliances, but none resulted in fines or prosecution.
SASB reference: IF-EU-140a.2; GRI reference: 306-3 (2016), 307-1
A table outlining the Company's environmental regulatory performance is featured below.
Environmental regulatory non-compliance and licence exceedancesEnvironmental compliance 2021 2020 2019 2018 2017
Environmental regulatory non-compliances resulting in fines or prosecutions (number)1 0 0 0 0 0
Environmental licence limit exceedances & other non-compliances (number)1 9 4 10 2 13
1 Numbers include operating assets where CLP has operational control during the calendar year. Paguthan Power Station, the power purchase agreements of which expired in December 2018, was not included in the 2019-2021 numbers.
CLP Holdings 2021 Sustainability Report | 62

Welcome About this Report Materiality Assessment Standard ESG disclosures
Corporate governance
Safety Environment and climate change
Asset management
Supply chain Community People Customers Key performance metrics
Jhajjar Power Station is one of the few plants with flue gas desulphurisation equipment installed in the northern National Capital Region in India, which enabled Jhajjar to meet the new and more stringent sulphur dioxide (SO2) emission limit introduced in February 2019. In 2021, it had four minor licence limit exceedances for SO2 due to equipment failure or malfunction. However, the units remained operational as requested by local authorities because of high electricity demand. The issues were rectified at the earliest opportunity and none of the exceedances resulted in any action by local authorities.
There were two licence limit exceedances at Mount Piper Power Station in Australia, related to total particulates emissions and surface water turbidity respectively. The New South Wales Environment Protection Authority (EPA) was notified, and corrective actions have been taken to prevent a repeat of these incidents. There were also two licence non-compliances at Mount Piper. One related to the loss of five days of environmental data associated with continuous air emissions monitoring following an equipment malfunction. After being notified, the EPA was satisfied and had no further enquiries. The other case was related to localised damage to the liner of a brine pond. The damage was detected in an adjacent monitoring bore that is used to ensure integrity of
the pond liner. Given the liner is a core element to prevent water pollution, the EPA was notified as a precautionary approach and there has been no further action. Corrective actions, such as a review of equipment efficiency and updates to the station’s environmental management plan, have been made to prevent a repeat of these incidents.
The EPA Victoria informed EnergyAustralia in February 2022 that it considered a dust complaint against the Yallourn mine in October 2021 to be a licence non-compliance. EnergyAustralia is of the view that it has met relevant obligations as the incident took place on an extremely windy and dry day while all of its operational control measures were in use at the time to minimise fugitive dust emissions. EnergyAustralia is currently liaising with the EPA for a review of the case.
Key emerging environmental regulationsDevelopments in environmental regulatory requirements continue to be closely monitored. A summary of the key upcoming environmental regulations that could affect business units are listed below. Emerging policy changes related to GHG emissions are also discussed in the Climate-related Disclosures Report.
Hong Kong • The emission allowances of CLP's power plants have been progressively tightened over time. Since 2021, there has been a new set of emission caps requiring CLP power plants to further reduce emissions by 4%, to reach a 7% reduction compared with the 2020 level. CLP Power has fully complied with these targets.
• In 2021, CLP Power concluded discussions with the Hong Kong Government on a new set of emission caps for the power stations, commencing 2026. Under the new Technical Memorandum (TM), the allowances for air emissions of sulphur dioxide (SO2), nitrogen oxides (NOx), and Respiratory Suspended Particulates (RSP) in 2026 and afterwards will be reduced by 92%, 69% and 68% respectively compared with 2010 levels.
Mainland China • In July 2021, China’s National Carbon Emissions Trading Scheme officially launched. Power generation is the first sector covered by the scheme. In October 2021, it was announced that China will put in place a "1+N" policy framework. This means it will set up one top-level policy framework and guidance, supported by various supporting measures (“N”s) in key areas and sectors. The framework will provide guidance on how to achieve its carbon peak (by 2030) and neutrality (by 2060) targets.
Australia • The EPA Victoria finalised the new licence for Yallourn Power Station in March 2021. The licence covers various environmental matters, including tightened emission limits and monitoring requirements. Yallourn is implementing measures and controls to ensure compliance with its new licence.
• In Victoria, new environmental legislation for environmental risk prevention came into effect on 1 July 2021. In compliance with the changes, a risk management and monitoring plan is required for Yallourn, Newport and Jeeralang Power Stations. Preparation is underway to complete all three plans in the first quarter of 2022.
• The Victorian Government has announced interim GHG emissions reduction targets as part of its Climate Change Strategy in May 2021. In line with the Government’s plan to transition to net-zero by 2050, EnergyAustralia also announced its Climate Change Statement in September 2021 to highlight its targets and key steps to reduce emissions.
CLP Holdings 2021 Sustainability Report | 63

Welcome About this Report Materiality Assessment Standard ESG disclosures
Corporate governance
Safety Environment and climate change
Asset management
Supply chain Community People Customers Key performance metrics
Air emissionsManagement approachAir quality remains a challenge in many of the geographies in which CLP operates. Air pollutant emissions will reduce as CLP expands its renewable and nuclear energy portfolio. Nonetheless, further emission reductions from existing thermal power stations remain high on the Group’s agenda.
Strategies and proceduresCLP’s Power Plant Air Emissions Standard stipulates that any fossil fuel-based power plant developed after October 2018, when the Standard became effective, is required to operate within CLP’s prescribed limits on sulphur dioxide (SO2), nitrogen oxides (NOx) and total particulate matter (total PM), or they must fully comply with local regulations, whichever is more stringent.
In addition to incorporating state-of-the-art air emissions mitigation measures into plant management processes, CLP
also designs new gas-fired power stations with advanced generation technologies. These new technologies produce electricity more efficiently, and assist in further lowering air pollutant emissions and greenhouse gases.
Monitoring and follow-upThe Company monitors air emissions (SO2, NOx, total PM) from facilities under its operational control using a continuous emissions monitoring system and/or stack sampling and mass-balance calculation methodologies. CLP is also cognizant of the increasing focus on mercury emissions from coal-fired power plants. For this report, CLP has estimated mercury quantities following local authority requirements where available. Otherwise, the quantities were estimated using acceptable methods. Jhajjar was not included in 2021 due to limited sampling size.
Year in reviewCLP’s total air emissions (SO2, NOx and total PM) have increased by approximately 8% to 106kt in 2021. This is a result of increased generation from coal-fired generators to meet higher electricity demands in different markets, and increased emissions from Jhajjar and Mount Piper Power Stations. In 2021, CLP experienced a 7% increase in electricity sent out.
SASB reference: If-EU-120a.1; GRI reference: 305-7
CLP has implemented different types of emission control measures in its thermal plants which are a part of normal operations. Since 1990, electricity demand in CLP Power's service area in Hong Kong has grown by over 80%, yet during the same period the Company achieved more than a 90% reduction in SO2, NOx and RSP emissions. These falls are a result of various emission reduction efforts. The selective catalytic reduction system introduced to the new 550MW gas-fired generation unit at Black Point Power Station has helped lower NOx emissions. Going forward, the same technology will be deployed in another unit of similar capacity, and will further reduce emissions after its commission, planned for 2023.
The emission control equipment for SO2 and NOx in Fangchenggang Power Station, and the installation of flue gas desulphurisation units in Jhajjar Power Station, which were fully implemented in 2019, have achieved up to a 90% reduction in SO2 emissions since 2017.
In Australia, Yallourn and Mount Piper Power Stations are implementing environmental measures including, for
Yallourn, the upgrade of its continuous emissions monitoring system (CEMS) to ensure compliance with tightened emission limits and monitoring requirements under its new licence. The CEMS will enable improved control of NOx and SO2
emissions at Yallourn. For Mount Piper, its CEMS upgrade will enable improved control of particulate emissions.
Group-level air emissions
There was an increase in total emissions in 2021 which was mainly due to increased coal-fired generation, and increased emission at Jhajjar Power Station and Mount Piper Power Station.
Kilo
tonn
es (k
t) 59.359.3 60.960.9
47.047.043.243.2 45.745.7
81.681.676.176.1
44.744.748.048.0
52.752.7
8.38.3 8.58.5 7.77.7 6.96.9 7.67.6
NOx SO₂ Total PM
2017 2018 2019 2020 20210
20
40
60
80
100
CLP Holdings 2021 Sustainability Report | 64

Welcome About this Report Materiality Assessment Standard ESG disclosures
Corporate governance
Safety Environment and climate change
Asset management
Supply chain Community People Customers Key performance metrics
WasteManagement approachCLP endeavours to reduce both the hazardous and non-hazardous waste it produces, and works with qualified parties and partners to reuse or recycle whenever possible.
Strategies and proceduresAll wastes are managed according to a waste management hierarchy (i.e. prevent, reduce, reuse, recycle, replace, treat and dispose). CLP seeks to avoid the use of hazardous materials and replace them with alternatives wherever possible. All hazardous and non-hazardous wastes are managed in accordance with local regulations, collected by licensed collectors, or sold for recycling.
At CLP’s coal-fired power stations, coal ash from coal combustion and gypsum from the flue gas desulphurisation process constitutes the majority of generation by-products. The aim is to use them as a resource for construction and other applications in line with local regulations and practices rather than dispose of them. While the volume of solid and liquid waste generated by CLP operations is relatively small, projects involving demolition and construction increased the amount of non-hazardous solid waste.
Monitoring and follow-upCLP monitors its waste generation monthly by tracking the solid and liquid forms of hazardous and non-hazardous waste produced and recycled at its facilities.
Year in reviewCLP’s non-hazardous solid waste increased to 24,481 tonnes in 2021, compared to 17,901 tonnes in 2020. The increase was mainly due to the plant facility enhancement projects at Castle Peak Power Station and Black Point Power Station in Hong Kong.
SASB reference: IF-EU-150a.1;GRI reference: 301-2, 306-1, 306-2, 306-3,
306-4, 306-5
Generation of hazardous solid waste remained comparable with 2020 while hazardous liquid waste decreased slightly in 2021, as a result of different plant maintenance activities and other remediation projects across the Group. CLP continued to recycle its hazardous and non-hazardous solid and liquid waste and, where feasible, sell by-products, such as ash and gypsum, for use in other industries.
The Group’s power stations run different programmes to manage waste, and learnings are shared internally and with contractors to raise awareness and build capacity.
Key programmes in 2021 include:
• Jhajjar Power Station: Apraava Energy achieved a 100% utilisation rate of ash generated in 2021. Apart from
its enhanced ash handling systems, Jhajjar ensured that ash utilisation contracts were in place with cement manufacturers, construction industries and various traders. Apraava also actively pursued opportunities such as using ash for brick manufacturing, as well as road construction projects.
• Jinchang Solar Power Station: The station continued the initiative for returning any damaged panels to solar panel manufacturers for their recycling. The aluminium frames, which account for a large part of the waste, are reused and other components such as silicon and silver embedded in the panels are recovered. Since 2017, over 2,000 solar panels have been returned for recycling.
• CLP Power Hong Kong: CLP actively encouraged employees to recycle and reuse. In 2021, CLP rolled out a new programme to collect additional types of plastic bottles and beverage cartons. Over 2,000 plastic bottles and 5,000 pieces of beverage cartons were collected and sent to local recyclers. Reuse of coffee grounds was also promoted, and colleagues can now collect the used coffee grounds from the pantries of CLP offices for reuse.
CLP Holdings 2021 Sustainability Report | 65

Welcome About this Report Materiality Assessment Standard ESG disclosures
Corporate governance
Safety Environment and climate change
Asset management
Supply chain Community People Customers Key performance metrics
Ash and gypsum by-products recycled or sold
Power generation at the coal-fired Jhajjar Power Station in India increased in 2021, resulting in an increase in the total amount of ash and gypsum by-product recycled or sold. The percentage of by-products recycled or sold also increased.
Kilotonnes (kt)
2,5012,501
1,7931,793
3,6673,667
2,2632,263
1,7451,745
365365
335335
438438
250250
161161
Ash Gypsum
2021
2020
2019
2018
2017
0 300 600 900 1,200 1,500 1,800 2,100 2,400 2,700 3,000 3,300 3,600 3,900 4,200
Hazardous solid waste produced and recycled
The amount of total hazardous solid waste produced and recycled in 2021 remained comparable with 2020, and was a result of different maintenance activities and other remediation projects across the Group.
Tonnes (t)
1,5241,524
1,5031,503
862862
1,4351,435
857857
520520
523523
201201
631631
469469
Hazardous solid waste produced Hazardous solid waste recycled
2021
2020
2019
2018
2017
0 200 400 600 800 1,000 1,200 1,400 1,600 1,800
Hazardous liquid waste produced and recycled
Hazardous liquid waste is mainly produced from maintenance activities. The amount produced in 2021 slightly reduced, in line with maintenance activities at each site during the year.
Kilolitres (kl)
1,0171,017
1,0911,091
1,5781,578
1,6851,685
1,4201,420
947947
1,0691,069
1,5361,536
1,6481,648
1,3841,384
Hazardous liquid waste produced Hazardous liquid waste recycled
2021
2020
2019
2018
2017
0 200 400 600 800 1,000 1,200 1,400 1,600 1,800
CLP Holdings 2021 Sustainability Report | 66

Welcome About this Report Materiality Assessment Standard ESG disclosures
Corporate governance
Safety Environment and climate change
Asset management
Supply chain Community People Customers Key performance metrics
Non-hazardous solid waste produced and recycled
Plant facility enhancements at Castle Peak Power Station and Black Point Power Station in Hong Kong produced more construction waste, leading to an overall increase in non-hazardous solid waste produced in the last two years.
Tonnes (t)
24,48124,481
17,90117,901
13,34413,344
11,47111,471
20,33420,334
4,2144,214
4,4584,458
4,9864,986
3,9903,990
3,7903,790
Non-hazardous solid waste produced Non-hazardous solid waste recycled
2021
2020
2019
2018
2017
0 2,500 5,000 7,500 10,000 12,500 15,000 17,500 20,000 22,500 25,000 27,500
Non-hazardous liquid waste produced and recycled
The total amount of non-hazardous liquid waste produced and recycled increased in 2021 as Mount Piper Power Station recycled its liquid waste left over from the 2020 outage.
Kilolitres (kl)
6565
33
5959
5252
103103
6565
33
5757
5252
103103
Non-hazardous liquid waste produced Non-hazardous liquid waste recycled
2021
2020
2019
2018
2017
0 10 20 30 40 50 60 70 80 90 100 110
CLP Holdings 2021 Sustainability Report | 67

Welcome About this Report Materiality Assessment Standard ESG disclosures
Corporate governance
Safety Environment and climate change
Asset management
Supply chain Community People Customers Key performance metrics
WaterManagement approachThe CLP Group uses seawater cooling or water re-circulation processes in its plants to minimise water consumption and environmental impacts.
SASB reference: IF-EU-140a.3; GRI reference: 303-1, 303-2
Strategies and proceduresThe quantity of water withdrawal and discharge in CLP’s operations is dominated by thermal plants using once-through seawater cooling. In this process, large quantities of seawater are used for cooling and returned to the sea with only a slight increase in water temperature. The total volume of water withdrawal and discharge is dependent on the total electricity generated.
Where freshwater is withdrawn for operations, CLP strives to reduce water use and reduce the freshwater intensity of the electricity generated. CLP’s power stations carry out a range of water conservation initiatives depending on site conditions, operational situation and age. The amount of water which can be recycled depends on factors such as location, power station design, and regulatory requirements.
Monitoring and follow-upWater concern to CLP is two-fold. On one hand, water use in its power plants may impact local water quality and scarcity. To address this concern, impact assessments are carried out at the planning stage of development projects, in accordance with local requirements. This is to ensure that any impacts associated with project construction and plant operation are managed and mitigated to an acceptable level.
On the other hand, water security is a key risk to be managed for CLP’s thermal and hydropower generation assets. Four out of seven of CLP’s thermal plants use seawater for cooling. As a result, CLP’s risk exposure to water availability is limited,
while solar farms also use water for the cleaning of solar panels, the amount required is comparatively small.
CLP assesses water risks for new projects through systematic environmental due diligence, and annually thereafter using globally recognised tools such as WRI Aqueduct. The assessment covers parameters such as water availability, water sensitivity, water stress mapping, potential competing use with other stakeholders, and the management strategies in place in each of the regions. Where a water supply risk is identified, the Company proactively engages with local stakeholders to understand their needs and with local water suppliers to mitigate or resolve the issue. The 2021 assessments across the Group indicate that current water supply regimes are stable, and the overall risk of substantive impact is minimal.
The quality of water discharges must also meet licensing and regulatory standards while maintaining CLP’s licence to operate. All of the Company’s generation assets have established an environmental management system (EMS), which is regularly audited and renewed. Under the EMS, all significant environmental aspects with potentially adverse impacts are identified, monitored, and controlled under programs which are reviewed on a regular basis. Specific emergency response plans have also been developed to prevent and address the spillage or leakage of pollutants. As a result of the water treatment processes put in place, none of CLP’s operations significantly impact their respective water receiving bodies.
To monitor efficiency of water use, CLP tracks freshwater withdrawal, discharge, and water intensity (based on electricity sent out). Internal targets are set each year to encourage continuous improvement in water management practices. CLP also participates in the CDP Water Survey to disclose and benchmark its practices with industry peers in relation to water resource management.
Year in reviewThe total water intensity of the Group’s power generation process increased slightly to 0.83m3/MWh in 2021, as compared to 0.78m3/MWh in 2020. This is mainly due to operational needs at Mount Piper Power Station.
SASB reference: IF-EU-140a.1; GRI reference: 303-3, 303-4, 303-5
CLP encourages its power stations to track their total water recycling and report this for indicative purposes. Considerable emphasis is placed on sharing initiatives across the Group to maximise the benefit of an individual power station’s efforts.
Out of CLP’s seven thermal plants, four use seawater for cooling. Mount Piper, Jhajjar and Fangchenggang power plants operate on a zero liquid discharge basis. The water is treated internally and recycled or reused in other parts of the power generation process, or for dust control or horticulture.
Examples of how water use is managed are summarised below:
• Hong Kong: The main power stations in Hong Kong are primarily reliant on seawater and process freshwater from municipal supply for cooling. The municipal water supply from the government is currently stable. Castle Peak Power Station continues to enhance monitoring and
CLP Holdings 2021 Sustainability Report | 68
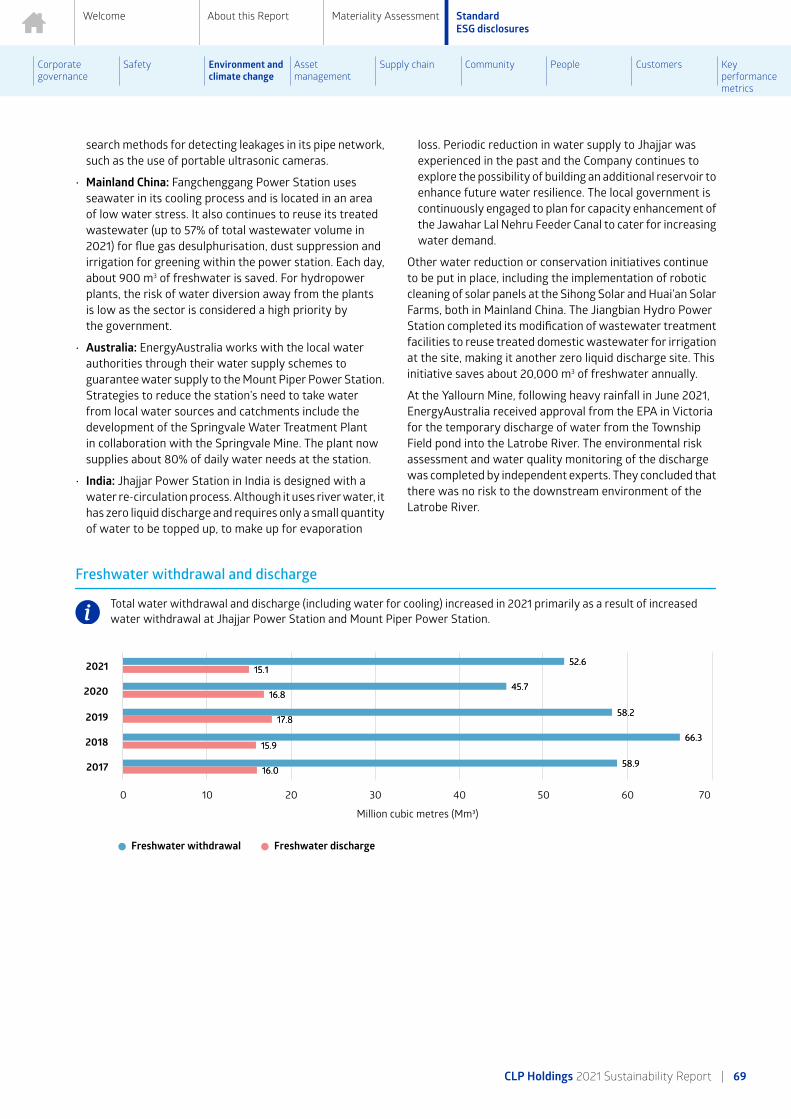
Welcome About this Report Materiality Assessment Standard ESG disclosures
Corporate governance
Safety Environment and climate change
Asset management
Supply chain Community People Customers Key performance metrics
search methods for detecting leakages in its pipe network, such as the use of portable ultrasonic cameras.
• Mainland China: Fangchenggang Power Station uses seawater in its cooling process and is located in an area of low water stress. It also continues to reuse its treated wastewater (up to 57% of total wastewater volume in 2021) for flue gas desulphurisation, dust suppression and irrigation for greening within the power station. Each day, about 900 m3 of freshwater is saved. For hydropower plants, the risk of water diversion away from the plants is low as the sector is considered a high priority by the government.
• Australia: EnergyAustralia works with the local water authorities through their water supply schemes to guarantee water supply to the Mount Piper Power Station. Strategies to reduce the station’s need to take water from local water sources and catchments include the development of the Springvale Water Treatment Plant in collaboration with the Springvale Mine. The plant now supplies about 80% of daily water needs at the station.
• India: Jhajjar Power Station in India is designed with a water re-circulation process. Although it uses river water, it has zero liquid discharge and requires only a small quantity of water to be topped up, to make up for evaporation
loss. Periodic reduction in water supply to Jhajjar was experienced in the past and the Company continues to explore the possibility of building an additional reservoir to enhance future water resilience. The local government is continuously engaged to plan for capacity enhancement of the Jawahar Lal Nehru Feeder Canal to cater for increasing water demand.
Other water reduction or conservation initiatives continue to be put in place, including the implementation of robotic cleaning of solar panels at the Sihong Solar and Huai’an Solar Farms, both in Mainland China. The Jiangbian Hydro Power Station completed its modification of wastewater treatment facilities to reuse treated domestic wastewater for irrigation at the site, making it another zero liquid discharge site. This initiative saves about 20,000 m3 of freshwater annually.
At the Yallourn Mine, following heavy rainfall in June 2021, EnergyAustralia received approval from the EPA in Victoria for the temporary discharge of water from the Township Field pond into the Latrobe River. The environmental risk assessment and water quality monitoring of the discharge was completed by independent experts. They concluded that there was no risk to the downstream environment of the Latrobe River.
Freshwater withdrawal and discharge
Total water withdrawal and discharge (including water for cooling) increased in 2021 primarily as a result of increased water withdrawal at Jhajjar Power Station and Mount Piper Power Station.
Million cubic metres (Mm³)
52.652.6
45.745.7
58.258.2
66.366.3
58.958.9
15.115.1
16.816.8
17.817.8
15.915.9
16.016.0
Freshwater withdrawal Freshwater discharge
2021
2020
2019
2018
2017
0 10 20 30 40 50 60 70
CLP Holdings 2021 Sustainability Report | 69

Welcome About this Report Materiality Assessment Standard ESG disclosures
Corporate governance
Safety Environment and climate change
Asset management
Supply chain Community People Customers Key performance metrics
Freshwater recycled volume
There was an increase in the volume of freshwater recycled in 2021, mainly due to water recycled at Jhajjar and Mount Piper Power Stations.
Million cubic metres (Mm³)
838838
736736
686686
899899
814814
Freshwater recycled
2021
2020
2019
2018
2017
0 100 200 300 400 500 600 700 800 900 1,000
Water intensity of CLP's power generation process
Water intensity (freshwater withdrawal for cooling and non-cooling purposes) increased slightly in 2021 mainly due to operational needs at Mount Piper Power Station.
m³/MWh
0.830.83
0.780.78
0.940.94
1.101.10
1.071.07
Water intensity
2021
2020
2019
2018
2017
0 0.1 0.2 0.3 0.4 0.5 0.6 0.7 0.8 0.9 1 1.1 1.2
CASE STUDY
Water conservation efforts in a water-stressed area in India
In India, water scarcity is one of the key business continuity risks for Jhajjar Power Station, which has experienced periodic water shortages in the past.To further optimise and reduce the plant’s freshwater consumption, Jhajjar implemented the following water conservation initiatives:
• Conducted water audits to develop and plan for short-term and long-term water conservation programmes; and
• Installed water meters and digitalised monitoring data to identify gaps and water-saving opportunities.
These initiatives have resulted in Jhajjar achieving a water intensity of 2.22 m3/MWh in 2021, which is well below the statutory limit of 3.50 m3/MWh set by the Central Pollution Control Board.
Jhajjar was announced the winner of the “Within the Fence” category of the 15th edition of the CII-National Awards for Excellence in Water Management in 2021. The award recognises Jhajjar’s efforts and achievement with respect to improving water use efficiencies and its integrated approach to wastewater management which includes the recycling, recovery and reuse of industrial effluents.
CLP Holdings 2021 Sustainability Report | 70
Welcome About this Report Materiality Assessment Standard ESG disclosures
Corporate governance
Safety Environment and climate change
Asset management
Supply chain Community People Customers Key performance metrics
Biodiversity and land useManagement approachThere is no one-size-fits-all approach to managing biodiversity impacts. CLP operations interact with local ecosystems in different ways, depending on factors such as location, the level of development in the vicinity and the surrounding environment.
GRI reference: 304-1, 304-2, 304-4
Goals and targetsThe Group’s goal is "no net loss of biodiversity". Targets are site-specific and depend on the different levels of regulatory controls on biodiversity, from assessment requirements through to ecological compensation. For example, in Australia, the Yallourn Mine strives for a net gain in biodiversity by offsetting disturbed areas and improving the habitat quality outside the mine perimeter in accordance with relevant local regulatory requirements.
Strategies and proceduresCLP’s internal Environmental Impact Assessment (EIA) standard mandates an environmental assessment for all new projects. During the EIA stage, CLP partners with qualified personnel to conduct a biodiversity impact assessment in
accordance with the CLP Biodiversity Impact Assessment Guideline. The Guideline applies to power generation, transmission and distribution, mines and other power-related projects, and provides a framework for a more systemic assessment of biodiversity impacts.
The Guideline takes into consideration the IUCN Red List of Threatened Species and national conservation lists of threatened species, and provides guidance on managing biodiversity risks. Any new operations that could affect the IUCN Red List of Threatened Species and a country’s national conservation list of threatened species are flagged well ahead of any investment decision.
The biodiversity impact assessment observes local legislative requirements and references the International Finance Corporation Sustainability Framework. It describes the baseline conditions, evaluates the magnitude and significance of project impacts, and investigates options for mitigation. The assessment only contemplates offsets after considering options relating to avoidance, minimisation, and restoration or rehabilitation.
See CLP's holistic approach to assessing new investments
Year in reviewCLP continued its ongoing efforts in biodiversity conservation and land remediation in 2021.
GRI reference: 304-3, EU13
BiodiversityMuch of the biodiversity work across the Group is continuous. It includes activities such as vegetation management along transmission lines in Hong Kong, and the tree management work undertaken by the Jhajjar Power Station in India.
In Hong Kong, CLP soft launched an IT system, the Predictive Vegetation Management System, for its transmission and distribution network in November. Developed by CLP, the system monitors the growth and condition of trees and vegetation that may affect overhead line operations. To further enhance its predictive ability, CLP continues a research project with the Education University of Hong Kong to develop an algorithm of vegetation growth prediction to integrate into the system. In addition, in continuing its support of the government strategy of "Right Tree in the Right Place", any trees identified as hazardous are replaced by CLP with native species to support local biodiversity.
The Marine Conservation Enhancement Fund (MCEF) and the Fisheries Enhancement Fund (FEF) were set up by the Hong Kong Offshore LNG Terminal Project in Hong Kong. Respectively, the funds have granted approximately HK$18.4M to support 14 projects and HK$8.6M to support five projects since grant applications opened in October 2020. The funded projects under MCEF relate to marine conservation, habitat restoration and rehabilitation, as well as education and ecotourism. For the FEF, the funded initiatives relate to fisheries education and tourism, enhancement of fisheries resources, and sustainable fishery development.
In Mainland China, the Xicun Solar Power Station has successfully integrated the farming of honeysuckle plants, a crop for traditional Chinese medicinal use, in its operation. This initiative has transformed the previously desert-like sandy area into cultivated farmlands and brings benefits to local farmers.
In India, the Jhajjar Power Station continues its annual effort to augment the green belt area on site. In 2021, around 10,000 saplings of native species were planted. In 2021, Apraava Energy became a member of the India Business & Biodiversity Initiative which aims to mainstream biodiversity in Indian businesses. The initiative is conceptualised by the
CLP Holdings 2021 Sustainability Report | 71

Welcome About this Report Materiality Assessment Standard ESG disclosures
Corporate governance
Safety Environment and climate change
Asset management
Supply chain Community People Customers Key performance metrics
Ministry of Environment, Forests and Climate Change, and the CII-ITC Centre of Excellence for Sustainable Development. As a pilot site under the initiative, Jhajjar will carry out a baseline biodiversity survey and assessment to identify opportunities and plan actions to improve biodiversity at the site.
In Australia, the Yallourn Mine continues to implement its Progressive Rehabilitation Plan and a Conservation Management Plan to oversee final rehabilitation. In 2021, approximately 35 hectares of progressive rehabilitation area was completed. The rehabilitation work reduces erosion and promotes water infiltration, and through seeding provides grass and native vegetation habitats. Close to 15,800 native tube stock seedlings were planted within the conservation areas at the mine site.
Land remediationIn Australia, at the Jeeralang Power Station and Newport Power Station, the remediation plan for per- and polyfluoroalkyl substances (PFAS) was finalised in 2021. PFAS are man-made chemicals found in many consumer products including firefighting equipment. The plan will guide the clean-up strategy to be deployed in 2022. Site investigation work for PFAS was also undertaken at the Tallawarra Power Station in 2021 with a monitoring programme in place, at the request of the local authority, to gather more site information.
Climate changeManagement approachClimate change is one of the most important topics affecting the energy sector. CLP’s Climate Vision 2050 sets out the blueprint of the Group’s transition to net-zero greenhouse gas emissions leading up to mid-century.
CLP is a staunch supporter of the United Nations Sustainable Development Goals (SDGs). In line with SDG 7 – Affordable and Clean Energy and SDG 13 – Climate Action, the Company recognises its responsibility as an energy company to address the risks of climate change by reducing its GHG emissions.
Launched in 2007 with a focus on the ambition to mitigate CLP’s climate impact, Climate Vision 2050 has been instrumental in informing CLP’s business strategy and guiding its investment decision-making. It is also an integral part of CLP’s broader climate strategy, which covers key considerations around climate adaptation and scenario analysis, among others. This vision will underpin CLP's long-term success as a business.
Download CLP's Climate Vision 2050: A net-zero future
CEO of CLP Holdings Limited introduces the Climate Vision 2050.
Watch CLP Group's CEO introduce the Climate Vision 2050
In 2021, CLP has published a standalone Climate-related Disclosures Report, which follows the recommendations from the TCFD and the International Sustainability Standards Board (ISSB) Climate-related Disclosures Prototype. It covers detailed discussion on CLP’s governance, strategy, risk management and metrics in relation to climate change.
Download CLP's 2021 Climate-related Disclosures Report
CLP Holdings 2021 Sustainability Report | 72

Welcome About this Report Materiality Assessment Standard ESG disclosures
Corporate governance
Safety Environment and climate change
Asset management
Supply chain Community People Customers Key performance metrics
Greenhouse gas emissionsManagement approachGreenhouse gas (GHG) emissions are one of the key metrics to track the Group’s progress in decarbonisation.
GRI reference: 302-2, 305-1, 305-2, 305-3
Greenhouse gas reporting guidelinesA Group-wide GHG Reporting Guideline was first developed in 2007 to specify the collection and compilation methodology of the Group’s GHG data. The Guideline was developed with reference to the following international standards and guidelines:
• The Greenhouse Gas Protocol: A Corporate Accounting and Reporting Standard (Revised Edition) of the World Business Council for Sustainable Development (WBCSD) and the World Resources Institute (WRI);
• The Greenhouse Gas Protocol: Corporate Value Chain (Scope 3) Accounting and Reporting Standard;
• The Greenhouse Gas Protocol: Technical Guidance for Calculating Scope 3 Emissions (Version 1);
• The 2006 Intergovernmental Panel on Climate Change (IPCC) Guidelines for National Greenhouse Gas Inventories;
• The IPCC 5th Assessment Report 2014;
• The International Standard for GHG Emissions ISO 14064-1: Greenhouse Gases; and
• Methodologies agreed with local authorities.
The CLP GHG Reporting Guideline is reviewed in accordance with CLP internal practices and updated with the latest references at least once every three years. The current Guideline was last updated in 2020.
Of note in 2021, the Fangchenggang Power Station successfully obtained the ISO 14064-1:2018 GHG Verification Statement in March, becoming the first CLP asset in Mainland China to achieve this GHG qualification and reporting standard. Also during the year, CLP Power Hong Kong updated its quantification and reporting of GHG emission inventory to follow this latest 2018 ISO standard.
CLP’s GHG emissions inventory covers six GHGs specified in the Kyoto Protocol, including carbon-dioxide (CO2), methane (CH4), nitrous oxide (N2O), hydrofluorocarbons (HFCs), and sulphur hexafluoride (SF6). Perfluorocarbons (PFCs) are also included but not used in CLP’s operations. Nitrogen trifluoride (NF3), the seventh mandatory gas added under the second Kyoto Protocol, was also considered for inclusion, but after evaluation was deemed immaterial to CLP’s operations. The GHG reporting scope definitions for GHG emissions are available here.
Focus has been given to sulphur hexafluoride (SF6), an insulating gas commonly used in switchgears and transmission lines. CLP is aware of its high global warming potential and therefore is vigilant in controlling SF6 leakage throughout the life cycle of electrical equipment, and actively exploring ways to reduce the use of SF6 in its business. For example, in Hong Kong, a trial on non-SF6 gas switchgears at distribution level has started and the readiness for use in equipment at transmission level will be further studied.
Compilation basesCLP reports the GHG emissions of its generation and energy storage portfolio on three consolidation bases to provide a comprehensive overview of its carbon footprint and progress in decarbonisation efforts. The three bases are:
• Equity basis: This includes the electricity generated by CLP’s assets. It accounts for the Scope 1 and Scope 2 GHG emissions according to CLP’s equity share in the portfolio. The equity basis reflects economic interest, indicating the extent of GHG risks and opportunities CLP has from assets in which it holds a majority or minority share.
• Equity and long-term capacity and energy purchases: This includes both electricity generated by CLP’s assets as well as the electricity purchased through capacity and energy purchase agreements. It allows stakeholders to better understand the GHG intensity of the electricity CLP delivers to customers. In addition to the GHG emissions from the equity basis, it also includes the direct GHG emissions from the generation of purchased electricity.
Purchase agreements help the Group meet local market needs and usually entail significant investment. To qualify for inclusion in this metric, these long-term capacity and energy purchase agreements must have a duration of at least five years and the equivalent capacity of 10MW or more.
• Operational control: This represents the total GHG emissions from generation assets where CLP has direct influence and control on operational matters. CLP has been disclosing the combined total Scope 1 and Scope 2 GHG emissions on this basis for over a decade, and will continue to demonstrate its long-term progress.
Conscious of emissions along the value chain, in 2019, the Company conducted a review of its Scope 3 emissions and started to disclose Scope 3 emissions to present a more comprehensive picture of its footprint along the value chain. Scope 3 emissions typically represent less than 40% of CLP’s GHG emissions.
CLP Holdings 2021 Sustainability Report | 73
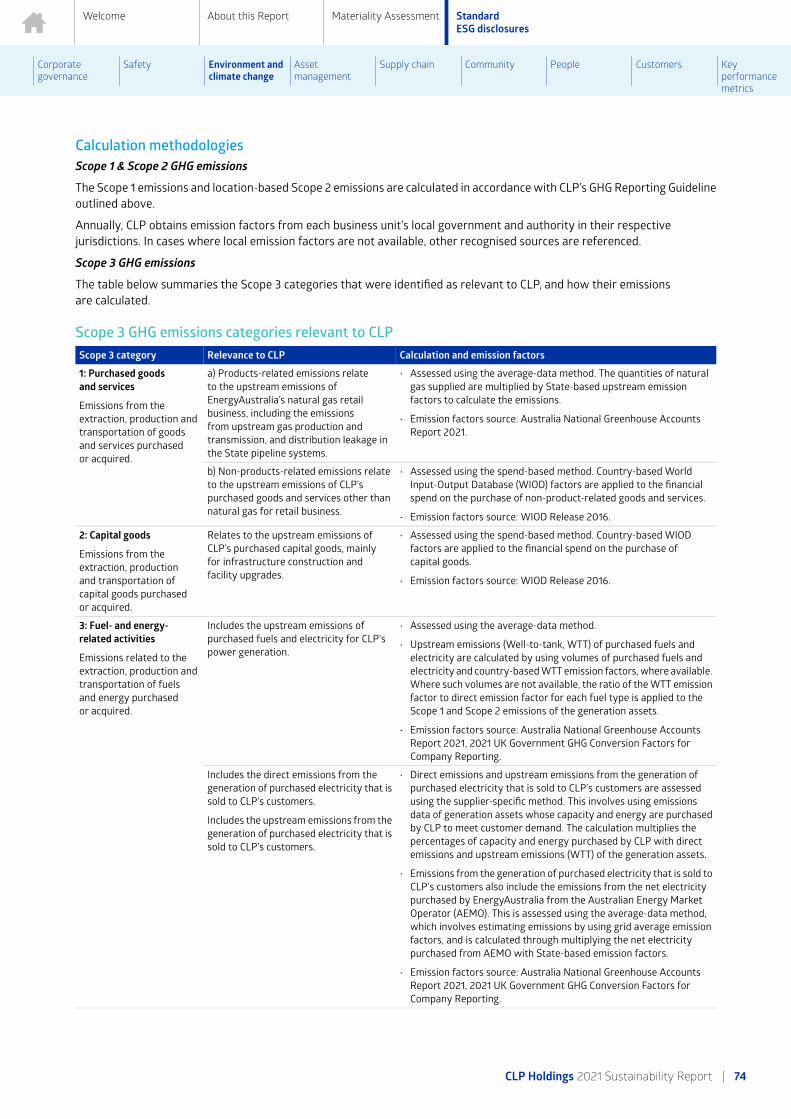
Welcome About this Report Materiality Assessment Standard ESG disclosures
Corporate governance
Safety Environment and climate change
Asset management
Supply chain Community People Customers Key performance metrics
Calculation methodologiesScope 1 & Scope 2 GHG emissions
The Scope 1 emissions and location-based Scope 2 emissions are calculated in accordance with CLP’s GHG Reporting Guideline outlined above.
Annually, CLP obtains emission factors from each business unit’s local government and authority in their respective jurisdictions. In cases where local emission factors are not available, other recognised sources are referenced.
Scope 3 GHG emissions
The table below summaries the Scope 3 categories that were identified as relevant to CLP, and how their emissions are calculated.
Scope 3 GHG emissions categories relevant to CLPScope 3 category Relevance to CLP Calculation and emission factors
1: Purchased goods and services
Emissions from the extraction, production and transportation of goods and services purchased or acquired.
a) Products-related emissions relate to the upstream emissions of EnergyAustralia’s natural gas retail business, including the emissions from upstream gas production and transmission, and distribution leakage in the State pipeline systems.
• Assessed using the average-data method. The quantities of natural gas supplied are multiplied by State-based upstream emission factors to calculate the emissions.
• Emission factors source: Australia National Greenhouse Accounts Report 2021.
b) Non-products-related emissions relate to the upstream emissions of CLP’s purchased goods and services other than natural gas for retail business.
• Assessed using the spend-based method. Country-based World Input-Output Database (WIOD) factors are applied to the financial spend on the purchase of non-product-related goods and services.
• Emission factors source: WIOD Release 2016.
2: Capital goods
Emissions from the extraction, production and transportation of capital goods purchased or acquired.
Relates to the upstream emissions of CLP’s purchased capital goods, mainly for infrastructure construction and facility upgrades.
• Assessed using the spend-based method. Country-based WIOD factors are applied to the financial spend on the purchase of capital goods.
• Emission factors source: WIOD Release 2016.
3: Fuel- and energy- related activities
Emissions related to the extraction, production and transportation of fuels and energy purchased or acquired.
Includes the upstream emissions of purchased fuels and electricity for CLP's power generation.
• Assessed using the average-data method.
• Upstream emissions (Well-to-tank, WTT) of purchased fuels and electricity are calculated by using volumes of purchased fuels and electricity and country-based WTT emission factors, where available. Where such volumes are not available, the ratio of the WTT emission factor to direct emission factor for each fuel type is applied to the Scope 1 and Scope 2 emissions of the generation assets.
• Emission factors source: Australia National Greenhouse Accounts Report 2021, 2021 UK Government GHG Conversion Factors for Company Reporting.
Includes the direct emissions from the generation of purchased electricity that is sold to CLP's customers.
Includes the upstream emissions from the generation of purchased electricity that is sold to CLP's customers.
• Direct emissions and upstream emissions from the generation of purchased electricity that is sold to CLP's customers are assessed using the supplier-specific method. This involves using emissions data of generation assets whose capacity and energy are purchased by CLP to meet customer demand. The calculation multiplies the percentages of capacity and energy purchased by CLP with direct emissions and upstream emissions (WTT) of the generation assets.
• Emissions from the generation of purchased electricity that is sold to CLP's customers also include the emissions from the net electricity purchased by EnergyAustralia from the Australian Energy Market Operator (AEMO). This is assessed using the average-data method, which involves estimating emissions by using grid average emission factors, and is calculated through multiplying the net electricity purchased from AEMO with State-based emission factors.
• Emission factors source: Australia National Greenhouse Accounts Report 2021, 2021 UK Government GHG Conversion Factors for Company Reporting.
CLP Holdings 2021 Sustainability Report | 74

Welcome About this Report Materiality Assessment Standard ESG disclosures
Corporate governance
Safety Environment and climate change
Asset management
Supply chain Community People Customers Key performance metrics
Scope 3 category Relevance to CLP Calculation and emission factors
5: Waste generated in operations
Emissions from the disposal and treatment of waste generated.
Emissions from fuel ash and gypsum as both represent the most significant waste material generated.
• Assessed using the waste-type specific method based on waste produced by type.
• Calculated through applying emission factors to quantities of fuel ash and gypsum generated at CLP’s coal-fired power stations, considering the disposal method.
• Emission factors source: 2021 UK Government GHG Conversion Factors for Company Reporting.
6: Business travel
Emissions from the transportation of employees for business-related activities.
Air travel is the most material source of emissions from business travel. While CLP offsets the emissions from air travel, the emissions continue to be included in the GHG profile.
• Assessed using the distance-based method.
• Air travel emissions for CLP’s operations in Hong Kong and Australia are directly calculated using flight distance by travel classes multiplied by corresponding emission factors. Emissions from the other regions of operations are calculated through extrapolation based on CLP’s financial spend on business travel.
• Emission factors source: 2021 UK Government GHG Conversion Factors for Company Reporting.
7: Employee commuting
Emissions from the transportation of employees between their homes and their worksites.
Relates to the emissions of CLP’s employees in commuting to offices and worksites. This typically includes emissions from automobile travel, bus travel, etc.
• Calculated through the number of CLP’s employees, estimated travel mode and average distance travelled by region.
• Emission factors source: 2021 UK Government GHG Conversion Factors for Company Reporting.
11: Use of sold products
Emissions from the end-use of products sold.
Relates to the downstream emissions of EnergyAustralia’s natural gas retail business, including the emissions from the combustion of natural gas supplied to customers.
• Calculated through multiplying the quantities of natural gas supplied to customers by State-based emission factors.
• Emission factors source: Australia National Greenhouse Accounts Report 2021.
The following categories were identified as not relevant to CLP, and hence not included in the Scope 3 emissions profile for reporting.
Scope 3 categories that are not considered relevant to CLPScope 3 category Explanation
4: Upstream transportation and distribution
Emissions from the transportation and distribution of purchased goods and services.
The emissions are covered in Category 1 as the financial spend on transportation and distribution is embedded in the financial spend on purchased goods and services.
8: Upstream leased assets
Emissions from the operation of assets leased by the reporting company, i.e. lessee.
CLP does not operate leased generation assets. The emissions of leased offices are included in CLP’s Scope 2 emissions.
9: Downstream transportation and distribution
Emissions from the transportation and distribution of products sold between operations and the end consumer, in vehicles and facilities not owned or controlled or paid for by the reporting company.
Electricity and gas are the main products of CLP. Transportation and distribution of the products does not involve vehicles and facilities not owned or controlled by the Group.
10: Processing of sold products
Emissions from the processing of intermediate products sold by downstream companies, e.g. manufacturers.
With electricity and gas being CLP's main products, they are end products without further processing requirement.
12: End-of-life treatment of sold products
Emissions from the disposal and treatment of products sold at the end of their life.
With electricity and gas being CLP's main products, there is no end-of-life treatment requirement.
13: Downstream leased assets
Emissions from the operation of assets owned by the reporting company (lessor) and leased to other entities.
Leasing is not a main business for CLP.
14: Franchises
Emissions from the operation of franchises.
CLP does not have any franchising business.
15: Investments
Emissions from the operation of investments.
CLP reports Scope 3 emissions on an equity basis. This category applies to CLP only when an operational control basis is adopted and therefore does not apply.
CLP Holdings 2021 Sustainability Report | 75

Welcome About this Report Materiality Assessment Standard ESG disclosures
Corporate governance
Safety Environment and climate change
Asset management
Supply chain Community People Customers Key performance metrics
Environment and climate change dataGRI reference: 305-1, 305-2, 305-3, 305-4
Environmental regulations and compliance
Environmental compliance 2021 2020 2019 2018 2017
Environmental regulatory non-compliances resulting in fines or prosecutions (number)1 0 0 0 0 0
Environmental licence limit exceedances & other non-compliances (number)1 9 4 10 2 13
1 Numbers include operating assets where CLP has operational control during the calendar year. Paguthan Power Station, the power purchase agreements of which expired in December 2018, was not included in the 2019-2021 numbers.
Air emissions
Air pollutants 2021 2020 2019 2018 2017
Nitrogen oxides emissions (NOx) (kt)1,2 45.7 43.2 47.0 60.9 59.3
Sulphur dioxide emissions (SO2) (kt)1,2 52.7 48.0 44.7 76.1 81.6
Particulates emissions (kt)1,2 7.6 6.9 7.7 8.5 8.3
Sulphur hexafluoride (SF6) (kt)1,2 0.004 0.003 N/A N/A N/A
Mercury (kg)1,2,3 311 N/A N/A N/A N/A
1 Numbers include operating assets where CLP has operational control during the calendar year. Paguthan Power Station, the power purchase agreements of which expired in December 2018, was not included in the 2019-2021 numbers.
2 Since 2019, numbers at asset level have been aggregated and then rounded.3 Mercury emission quantity is based on direct measurement or by calculation, as required by the local authority or by internal requirements using acceptable
methods. Jhajjar was not included because of the limited sampling size in 2021.
Waste
Waste produced and recycled 2021 2020 2019 2018 2017
Non-hazardous liquid waste (kl)1,2,3
Produced 65 3 59 52 103
Recycled 65 3 57 52 103
Non-hazardous solid waste (t)1,2,3
Produced 24,481 17,901 13,344 11,471 20,334
Recycled 4,214 4,458 4,986 3,990 3,790
Hazardous liquid waste (kl)1,2,3
Produced 1,017 1,091 1,578 1,685 1,420
Recycled 947 1,069 1,536 1,648 1,384
Hazardous solid waste (t)1,2,3
Produced 1,524 1,503 862 1,435 857
Recycled 520 523 201 631 469
1 Numbers include operating assets where CLP has operational control during the calendar year. Paguthan Power Station, the power purchase agreements of which expired in December 2018, was not included in the 2019-2021 numbers.
2 Since 2019, numbers at asset level have been aggregated and then rounded.3 Waste categorised in accordance with local regulations.
CLP Holdings 2021 Sustainability Report | 76

Welcome About this Report Materiality Assessment Standard ESG disclosures
Corporate governance
Safety Environment and climate change
Asset management
Supply chain Community People Customers Key performance metrics
By-products 2021 2020 2019 2018 2017
Ash produced (kt)1,2 3,403 2,624 3,032 3,419 3,005
Ash recycled / sold (kt)1,2 2,501 1,793 3,667 2,263 1,745
Gypsum produced (kt)1,2 367 334 441 253 156
Gypsum recycled / sold (kt)1,2 365 335 438 250 161
1 Numbers include operating assets where CLP has operational control during the calendar year. Paguthan Power Station, the power purchase agreements of which expired in December 2018, was not included in the 2019-2021 numbers.
2 Since 2019, numbers at asset level have been aggregated and then rounded.
Water
Water usage 2021 2020 2019 2018 2017
Total water withdrawal (Mm3)1,2,3 5,160.0 5,162.74 5,219.94 5,153.6 4,480.6
For cooling purpose
Water withdrawal from freshwater resources 42.5 35.1 45.7 53.3 47.6
Water withdrawal from marine water resources 5,107.4 5,117.04 5,161.74 5,087.3 4,421.7
For non-cooling purposes
Water withdrawal from freshwater resources 5.3 5.7 5.8 6.0 4.9
Water withdrawal from municipal sources 4.8 4.9 6.7 7.0 6.4
Total water discharge (Mm3)1,2,3,5 5,122.5 5,133.84 5,179.64 5,103.2 4,437.7
From cooling process
Treated wastewater to freshwater bodies 0 0 0 0 0
Water discharge to marine water bodies 5,107.4 5,117.04 5,161.74 5,087.3 4,421.7
Wastewater to other destinations 0 0 0 0.02 0.05
From non-cooling processes
Treated wastewater to freshwater bodies 11.9 13.7 14.4 12.3 12.3
Treated wastewater to marine water bodies 1.3 1.5 1.7 1.6 1.6
Wastewater to other destinations 1.9 1.6 1.7 1.9 2.0
Wastewater to sewerage 0.03 0.03 0.03 0.03 0.02
Total freshwater consumption (Mm3) 52.6 N/A N/A N/A N/A
Total water withdrawal fromwater stressed areas (Mm3) 16.5 N/A N/A N/A N/A
Total freshwater consumption fromwater stressed areas (Mm3) 16.4 N/A N/A N/A N/A
1 Numbers include operating assets where CLP has operational control during the calendar year. Paguthan Power Station, the power purchase agreements of which expired in December 2018, was not included in the 2019-2021 numbers.
2 Numbers have been subject to rounding. Any discrepancies between the total shown and the sum of the amounts listed are due to rounding.3 Since 2019, numbers at asset level have been aggregated and then rounded.4 Restated as per updated data for Newport Power Station in Australia.5 Starting from 2019, Yallourn Power Station’s “water discharged to third-parties”, which was previously reported under “wastewater to sewerage”, has been
reported under “wastewater to other destinations”.
Water intensity 2021 2020 2019 2018 2017
Water intensity of CLP's power generation process (m3/MWh)1 0.83 0.78 0.94 1.10 1.07
1 Numbers include operating assets where CLP has operational control during the calendar year. Paguthan Power Station, the power purchase agreements of which expired in December 2018, was not included in the 2019-2021 numbers.
Freshwater reused/recycled 2021 2020 2019 2018 2017
Freshwater reused/recycled volume (Mm3)1 838 736 686 899 814
1 Numbers include operating assets where CLP has operational control during the calendar year. Paguthan Power Station, the power purchase agreements of which expired in December 2018, was not included in the 2019-2021 numbers.
CLP Holdings 2021 Sustainability Report | 77

Welcome About this Report Materiality Assessment Standard ESG disclosures
Corporate governance
Safety Environment and climate change
Asset management
Supply chain Community People Customers Key performance metrics
Greenhouse gas emissions
Greenhouse gas emissions 2021 2020 2019 2018 2017
CLP Group1
Total CO2e emissions – on an equity basis (kt)2,3 65,017 62,138 71,720 N/A N/A
Scope 1 (kt)4 47,690 45,105 50,047 N/A N/A
Scope 2 (kt) 236 244 250 N/A N/A
Scope 3 (kt) 17,091 16,790 21,424 N/A N/A
Category 1: Purchased goods and services 901 1,210 1,093 N/A N/A
Category 2: Capital goods 1,488 685 1,347 N/A N/A
Category 3: Fuel- and energy-related activities 12,733 12,690 16,671 N/A N/A
Category 5: Waste generated in operations 80 63 101 N/A N/A
Category 6: Business travel 1 1 8 N/A N/A
Category 7: Employee commuting 4 2 4 N/A N/A
Category 11: Use of sold products 1,884 2,138 2,200 N/A N/A
CLP Group's generation and energy storage portfolio3,4,5
CO2 – on an equity basis (kt)6 47,574 44,987 N/A N/A N/A
CO2e – on an equity basis (kt)6 47,813 N/A N/A N/A N/A
CO2 – on an equity plus long-term capacity and energy purchase basis (kt)7,8 51,674 48,621 N/A N/A N/A
CO2e – on an equity plus long-term capacity and energy purchase basis (kt)7,8 51,941 N/A N/A N/A N/A
CO2 – on an operational control basis (kt)6 46,842 43,808 50,412 52,052 47,9219
CO2e – on an operational control basis (kt)6 47,090 44,023 50,676 52,306 48,082
1 Refers to a range of businesses, including generation and energy storage portfolio, transmission and distribution, retail and others.2 Numbers have been subject to rounding. Any discrepancies between the total shown and the sum of the amounts listed are due to rounding.3 Paguthan Power Station, the power purchase agreements of which expired in December 2018, was not included in the 2019-2021 numbers.4 In accordance with the Greenhouse Gas Protocol, WE Station, which makes use of landfill gas from waste for power generation, is not included in CLP’s Scope
1 CO2 emissions and is reported separately in the Asset Performance Statistics. Its non-CO2 GHG emissions (i.e. CH4 and N2O) are included in CLP’s Scope 1 CO2e emissions.
5 Starting from 2020, the portfolio includes energy storage assets and generation assets. Energy storage assets include pumped storage and battery storage. In previous years, the portfolio included generation assets only.
6 Numbers include Scope 1 and Scope 2 emissions..7 Numbers include assets with majority and minority shareholdings, and those under "long-term capacity and energy purchase" arrangements with CLP. Starting
from 2018, "long-term capacity and energy purchase" has been defined as a purchase agreement with a duration of at least five years, and capacity or energy purchased being no less than 10MW.
8 Numbers include Scope 1, Scope 2 and Scope 3 Category 3 emissions (direct emissions from generation of purchased electricity that is sold to CLP’s customers).9 CO2e emissions of Yallourn and Hallet Power Stations were used to calculate CO2emissions metrics in 2017 due to limited data availability.
Climate Vision 2050 2021 2020 2019 2018 2017
CLP Group – GHG emissions intensity of generation and energy storage portfolio1,2,3,4
On an equity plus long-term capacityand energy purchase basis (kg CO2e/kWh)5,6 0.57 0.57 0.63 0.66 0.697
On an equity basis (kg CO2e/kWh)8 0.65 0.66 0.71 0.74 0.807
1 The 2019-2021 numbers refer to the GHG emissions intensity (kg CO2e/kWh), in line with the updated Climate Vision 2050 targets. Numbers prior to 2019 refer to carbon emissions intensity (kg CO2/kWh), as reported in the past.
2 Starting from 2020, the portfolio includes energy storage assets and generation assets. Energy storage assets include pumped storage and battery storage. In previous years, the portfolio included generation assets only.
3 Paguthan Power Station, the power purchase agreements of which expired in December 2018, was not included in the 2019-2021 numbers.4 In accordance with the Greenhouse Gas Protocol, WE Station, which makes use of landfill gas from waste for power generation, is not included in CLP’s Scope
1 CO2 emissions and is reported separately in the Asset Performance Statistics. Its non-CO2 GHG emissions (i.e. CH4 and N2O) are included in CLP’s Scope 1 CO2e emissions.
5 Numbers include assets with majority and minority shareholdings, and those under "long-term capacity and energy purchase" arrangements with CLP. Starting from 2018, "long-term capacity and energy purchase" has been defined as a purchase agreement with a duration of at least five years, and capacity or energy purchased being no less than 10MW.
6 Numbers include Scope 1, Scope 2 and Scope 3 Category 3 emissions (direct emissions from generation of purchased electricity that is sold to CLP’s customers).7 CO2e emissions of Yallourn and Hallet Power Stations were used to calculate CO2emissions metrics in 2017 due to limited data availability.8 Numbers include Scope 1 and Scope 2 emissions.
CLP Holdings 2021 Sustainability Report | 78

Welcome About this Report Materiality Assessment Standard ESG disclosures
Corporate governance
Safety Environment and climate change
Asset management
Supply chain Community People Customers Key performance metrics
CLP Power Hong Kong – GHG emissions intensity of electricity sold1,2 2021 2020 2019 2018 2017
CO2e emissions intensity of electricity sold by CLP Power Hong Kong (kg CO2e/kWh) 0.39 0.37 0.50 0.51 0.51
CO2 emissions intensity of electricity sold by CLP Power Hong Kong (kg CO2/kWh) 0.39 0.37 0.49 0.51 0.50
1 In accordance with the Greenhouse Gas Protocol, WE Station, which makes use of landfill gas from waste for power generation, is not included in CLP’s Scope 1 CO2 emissions and is reported separately in the Asset Performance Statistics. Its non-CO2 GHG emissions (i.e. CH4 and N2O) are included in CLP’s Scope 1 CO2e emissions.
2 "Electricity sold" is the total electricity energy sold to CLP Power Hong Kong's customers before the adjustment of Renewable Energy Certificates.
Climate-related financial information
Capital investments 2021 2020 2019 2018 2017
Total capital investment incurred by asset type (HK$M(%))1,2,3 15,411 (100%) 13,022 (100%) 12,028 (100%) 12,851 (100%) N/A
Transmission, distribution and retail 5,957 (39%) 4,810 (37%) 5,229 (43%) 4,953 (39%) N/A
Coal 2,628 (17%) 3,638 (28%) 2,473 (21%) 3,040 (24%) N/A
Gas 5,639 (37%) 3,445 (26%) 3,146 (26%) 4,098 (32%) N/A
Nuclear 0 (0%) 0 (0%) 352 (3%) 0 (0%) N/A
Renewables4 860 (6%) 462 (4%) 580 (5%) 714 (5%) N/A
Others 327 (2%) 667 (5%) 248 (2%) 46 (0%) N/A
1 Numbers have been subject to rounding. Any discrepancies between the total shown and the sum of the amounts listed are due to rounding.2 Capital investment includes additions to fixed assets, right-of-use assets, investment property, intangible assets, investments in and advances to joint ventures
and associates, and acquisition of business/asset.3 On an accrual basis.4 Renewables include wind, hydro, solar and waste-to-energy. Waste-to-energy is not considered as non-carbon emitting energy. Numbers of waste-to-energy
included in renewables since 2019 are as follows: 2019 - HK$123 million; 2020 - HK$7 million; 2021 - HK$18 million.
Operating earnings 2021 2020 2019 2018 2017
Total operating earnings by asset type (HK$M(%))1 10,638 (100%) 12,374 (100%) 12,138 (100%) 15,145 (100%) 14,189 (100%)
Transmission, distribution and retail 5,612 (53%) 5,751 (46%) 5,131 (42%) 7,427 (49%) 8,392 (59%)
Coal2 1,020 (10%) 2,871 (23%) 2,503 (21%) 3,370 (22%)3,994 (28%)
Gas2 1,326 (12%) 1,510 (12%) 1,735 (14%) 1,533 (10%)
Nuclear 1,908 (18%) 1,594 (13%) 1,688 (14%) 1,720 (11%) 913 (7%)
Renewables3 519 (5%) 575 (5%) 1,016 (8%) 924 (7%) 629 (4%)
Others 253 (2%) 73 (1%) 65 (1%) 171 (1%) 261 (2%)
1 Before unallocated expenses.2 Starting from 2018, operating earnings of coal and gas have been reported separately.3 Renewables include wind, hydro, solar and waste-to-energy. Waste-to-energy is not considered as non-carbon emitting energy. Numbers of waste-to-energy
included in renewables since 2019 are as follows: 2019 - HK$5 million; 2020 - HK$8 million; 2021 - HK$10 million.
2021 data shaded in orange has been independently verified by PricewaterhouseCoopers. The assurance scope of past years' data can be found in previous Sustainability Reports.
CLP Holdings 2021 Sustainability Report | 79

Asset management
Welcome About this Report Materiality Assessment Standard ESG disclosures
Corporate governance
Safety Environment and climate change
Asset management
Supply chain Community People Customers Key performance metrics
OverviewAsset management refers to how CLP manages and utilises its assets to provide reliable, affordable and sustainable electricity services to customers and communities.
Interruptions of this service could significantly impact a region’s economy and the communities where CLP operates. The Company understands the important role it plays in providing and maintaining critical energy infrastructure.
A multi-pronged approach is taken to achieve effective asset management. Asset integrity must be optimised in its life cycle. Utilisation of different assets must be optimised in response to fluctuating demand, fuel prices and, increasingly,
significant electricity supply from renewable sources. It is also critical to safeguard operational technology (OT) and information technology (IT) systems from cyber threats. IT security is particularly important to employees and customers to ensure personal information and data privacy is adequately protected.
Key stakeholders• Customers, Suppliers, Communities, Employees
Related material topics• Reinforcing resilience in a changing operating environment
• Reinforcing cyber resilience and data protection
Asset management systemManagement approachThe Asset Management System (AMS) Standard is a framework of standardised practices across the Group which manage assets across their entire lifecycle, from the planning stage to decommissioning.
Strategies and proceduresCLP’s AMS Standard was developed in 2016 to standardise essential practices in managing assets across the Group and
ensure best practice. It accords with the ISO 55000 series of standards for asset management systems, as well as the ISO 31000 standards for risk management.
The AMS Standard is integrated into CLP’s Health, Safety and Environment (HSE) Management System and the Project Management Governance System (PMGS) Standards to manage the complete lifecycle of an asset.
The AMS contains five key stages and 10 asset management elements, as illustrated in the diagram below.
CLP Holdings 2021 Sustainability Report | 80
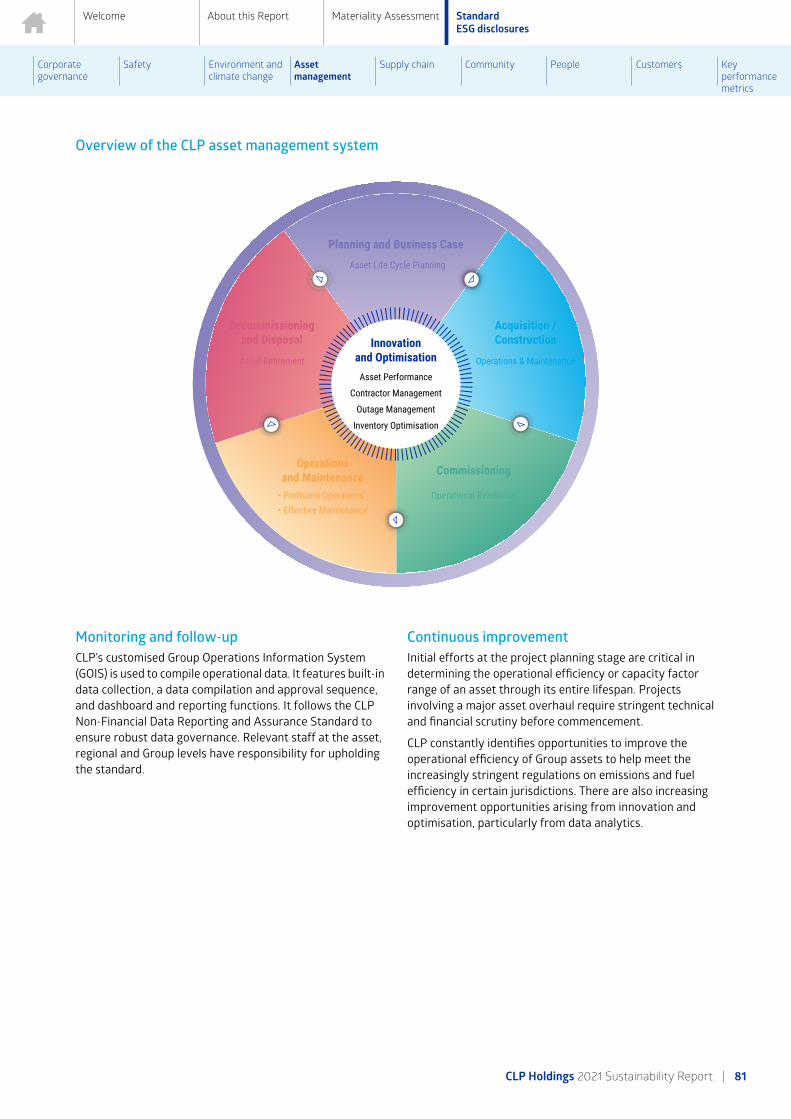
Welcome About this Report Materiality Assessment Standard ESG disclosures
Corporate governance
Safety Environment and climate change
Asset management
Supply chain Community People Customers Key performance metrics
Overview of the CLP asset management system
Monitoring and follow-upCLP’s customised Group Operations Information System (GOIS) is used to compile operational data. It features built-in data collection, a data compilation and approval sequence, and dashboard and reporting functions. It follows the CLP Non-Financial Data Reporting and Assurance Standard to ensure robust data governance. Relevant staff at the asset, regional and Group levels have responsibility for upholding the standard.
Continuous improvementInitial efforts at the project planning stage are critical in determining the operational efficiency or capacity factor range of an asset through its entire lifespan. Projects involving a major asset overhaul require stringent technical and financial scrutiny before commencement.
CLP constantly identifies opportunities to improve the operational efficiency of Group assets to help meet the increasingly stringent regulations on emissions and fuel efficiency in certain jurisdictions. There are also increasing improvement opportunities arising from innovation and optimisation, particularly from data analytics.
CLP Holdings 2021 Sustainability Report | 81
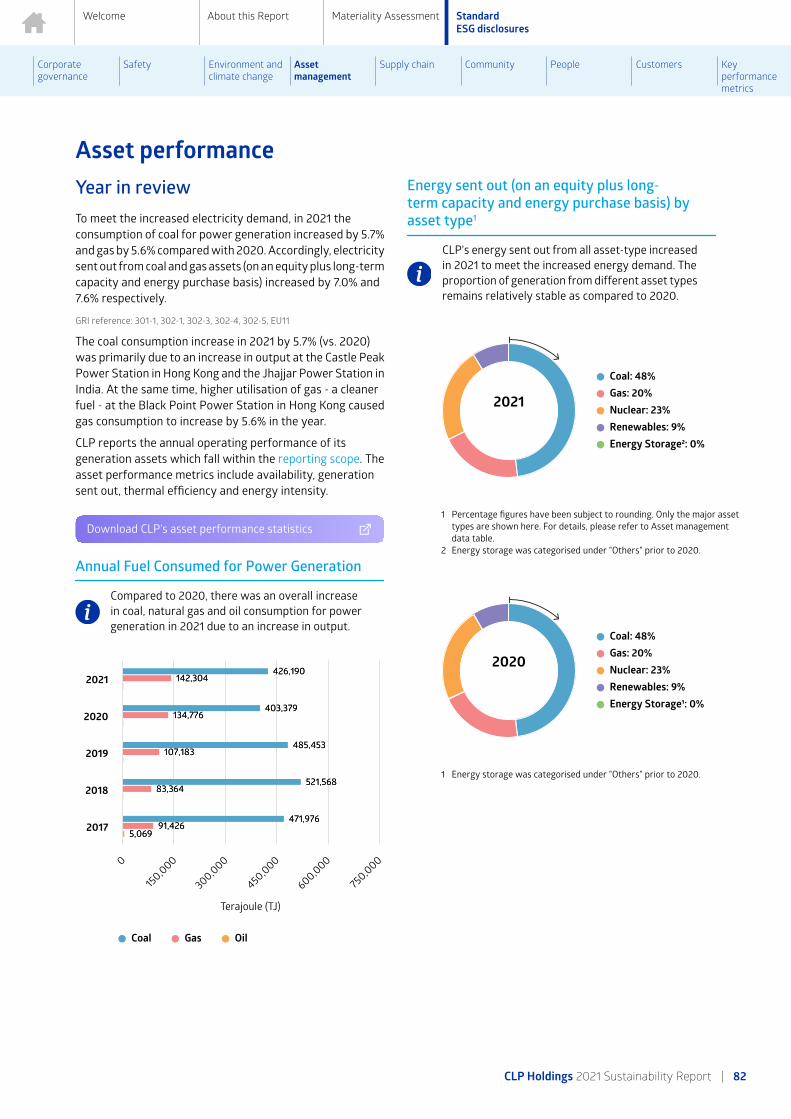
Welcome About this Report Materiality Assessment Standard ESG disclosures
Corporate governance
Safety Environment and climate change
Asset management
Supply chain Community People Customers Key performance metrics
Asset performanceYear in reviewTo meet the increased electricity demand, in 2021 the consumption of coal for power generation increased by 5.7% and gas by 5.6% compared with 2020. Accordingly, electricity sent out from coal and gas assets (on an equity plus long-term capacity and energy purchase basis) increased by 7.0% and 7.6% respectively.
GRI reference: 301-1, 302-1, 302-3, 302-4, 302-5, EU11
The coal consumption increase in 2021 by 5.7% (vs. 2020) was primarily due to an increase in output at the Castle Peak Power Station in Hong Kong and the Jhajjar Power Station in India. At the same time, higher utilisation of gas - a cleaner fuel - at the Black Point Power Station in Hong Kong caused gas consumption to increase by 5.6% in the year.
CLP reports the annual operating performance of its generation assets which fall within the reporting scope. The asset performance metrics include availability, generation sent out, thermal efficiency and energy intensity.
Download CLP’s asset performance statistics
Annual Fuel Consumed for Power Generation
Compared to 2020, there was an overall increase in coal, natural gas and oil consumption for power generation in 2021 due to an increase in output.
Terajoule (TJ)
426,190426,190
403,379403,379
485,453485,453
521,568521,568
471,976471,976
142,304142,304
134,776134,776
107,183107,183
83,36483,364
91,42691,426
2,7172,7172,2432,2432,6202,6203,8073,807
5,0695,069
Coal Gas Oil
2021
2020
2019
2018
2017
0
150,000
300,000
450,000
600,000
750,000
Energy sent out (on an equity plus long-term capacity and energy purchase basis) by asset type1
CLP's energy sent out from all asset-type increased in 2021 to meet the increased energy demand. The proportion of generation from different asset types remains relatively stable as compared to 2020.
2021
Coal: 48%Gas: 20%Nuclear: 23%Renewables: 9%Energy Storage²: 0%
1 Percentage figures have been subject to rounding. Only the major asset types are shown here. For details, please refer to Asset management data table.
2 Energy storage was categorised under "Others" prior to 2020.
2020
Coal: 48%Gas: 20%Nuclear: 23%Renewables: 9%Energy Storage¹: 0%
1 Energy storage was categorised under "Others" prior to 2020.
CLP Holdings 2021 Sustainability Report | 82

Welcome About this Report Materiality Assessment Standard ESG disclosures
Corporate governance
Safety Environment and climate change
Asset management
Supply chain Community People Customers Key performance metrics
Security managementManagement approachSecurity management helps us protect CLP’s people, property, information and reputation against security risks.
Strategies and proceduresCLP’s management of security is informed by the CLP Risk Management Framework, with oversight from the Board. The Group Security Policy was updated in 2021 to define the overarching approach taken to minimise risk to people, including employees, contractors, customers and the public, and to manage other business risks to acceptable levels.
The policy covers the following areas:
• Integrated and centralised organisation and governance: Group Security is an integrated department which covers all relevant lines of security activity within the Company, operating independently of the IT and OT governing organisations.
• Policies, standards and guidelines: a suite of documents provides guidance on how to manage and monitor risks in line with recognised industry standards.
• Understanding the threats: Ensuring decisions related to the application of security measures are appropriately informed and wherever possible, intelligence driven.
• Communications and awareness: Continuously enhancing the security awareness and knowledge of employees and contractors with the objective of encouraging security-positive behaviour.
• Technical domain: Ensuring that robust operational detection and response tools are developed, applied and maintained.
• Liaison: Maintaining constructive and trusted relationships with external stakeholders such as national cyber security agencies and industry bodies to ensure speedy and effective cooperation when the need arises.
CLP’s approach to security is best understood using the diagram below.
There are five separate but co-dependent lines of activity, all of which are protected (to a lesser or greater extent) by cyber and physical security measures. These lines of activity are:
• Information: Data is stored in both hard and electronic formats. The confidentiality, integrity and availability of this data needs to be protected
• Operational Technology (OT): Hardware and software that detects, monitors or controls physical devices (such as a turbine) at CLP assets, needs to be protected
• Information Technology (IT): The IT used to store, retrieve, transmit, and manipulate data or information needs to be protected
• Personnel: Staff employed by CLP, both at the workplace and travelling for business, must be safe, and
• Brand: CLP’s image, identity and associated reputation needs to be protected.
CLP security measures are robust and scalable. Taken together, they provide comprehensive, layered and flexible protection.
CLP's approach to security
Operational responsibilitiesThe Group Security team was established in 2020 to ensure cyber and physical security capabilities and efforts complement each other. It is led by the Senior Director – Group Security, who is a highly experienced cyber security leader. This role reports directly to the Group Chief Operating Officer. The team offers an in-house capability across the full range of security skillsets. Drawing on internal security professionals and recruiting from wider industry, the Group Security function is separate from both the IT and the Health, Safety & Environment (HSE) departments.
Regular reports are provided to the Board’s Audit & Risk Committee (ARC). At CLP, one of the key responsibilities of the ARC is to seek assurance that adequate risk management is in place and followed, and that appropriate remedial action is taken where needed.
Read the Audit & Risk Committee’s report
CLP Holdings 2021 Sustainability Report | 83

Welcome About this Report Materiality Assessment Standard ESG disclosures
Corporate governance
Safety Environment and climate change
Asset management
Supply chain Community People Customers Key performance metrics
Physical securityManagement approachThe fundamental – and highly effective – form of security is physical security which is applied appropriately to all of CLP's assets. Enhanced measures are used to protect sensitive locations such as data centres, control rooms, and transmission and distribution sites.
GRI reference: 410-1
Strategies and proceduresPhysical security refers to the physical measures designed to safeguard people, to prevent unauthorised access to equipment, facilities, material and documents, and to safeguard them against a security incident. It covers physical barriers (e.g. fences), security lighting, physical access control and surveillance systems.
A body of work has been developed to assist all regions and their assets in establishing or revising their security management documentation. These documents are aligned with international standards for security and contain best practices derived from across the Group.
• The CLP Physical Security Standard lays down the minimum standard of physical security measures expected at every asset owned and/or operated by CLP, regardless of location or role.
• The CLP Physical Security Guideline provides practical guidance on the security requirements expected of all business units, in line with the Group Security Policy and Physical Security Standard. For instance, it includes guidelines on how to identify potential areas of weakness, develop appropriate security countermeasures, as well as prepare a security response plan.
• The CLP Security Vulnerability Assessment Guideline is the flagship document that lays down the process of evaluating the security status of any CLP site. Using a risk-based approach and in close collaboration with the operator, it provides a comprehensive security “health check” covering threats, areas of weakness and offers solutions.
• CLP’s Security Due Diligence for Project Design & Construction or Site Acquisition has been developed to support projects in the early stages of an acquisition or a build. Based on the premise that early identification of potential problems can reduce risk and the cost of retrospective correction, all projects undergo this process, regardless of size.
• The CLP Business Travel Risk Management Plan seeks to minimise the security, medical and health risks faced by employees engaged in business travel. On behalf of the Group, Group Security leads on business travel security in close cooperation with Group HR and Finance.
Training and awarenessCLP security staff have a key role in preventing harm to staff and the wider public. All in-house security staff are required to comply with CLP’s Code of Conduct at all times and receive Code of Conduct training on an annual basis. In addition to training on national regulations and site-specific requirements, contract security staff receive induction training on CLP’s policies including: ensuring a harassment-free workplace; minimum wage guidelines; and measures preventing discrimination in the workplace. This induction training must be completed before personnel are granted access to their assigned workplace sites.
For a second successive year, business travel has all but stopped in response to the COVID-19 pandemic. More effort continues to be made in keeping staff across the Group informed on the rapidly changing travel situation and border closures across CLP's portfolio countries and other key destinations, as well as providing bespoke advice to those who have needed it.
CLP Holdings 2021 Sustainability Report | 84

Welcome About this Report Materiality Assessment Standard ESG disclosures
Corporate governance
Safety Environment and climate change
Asset management
Supply chain Community People Customers Key performance metrics
Cyber securityManagement approachCLP has enhanced its cyber security governance, built internal capacity in the area and improved its information protection.
Strategies and proceduresCyber security refers to the need to protect CLP’s IT and OT systems:
• Operational Technology (OT) is the hardware and software that detects, monitors or controls physical devices (such as a turbine) at CLP assets.
• Information Technology (IT) is the technology used to store, retrieve, transmit, and manipulate data or information.
Cyber security incidents are unique in that the attack occurs in a virtual space and may not cause immediate disruption, as in the case of data leaks, making them difficult to detect or trace. As the workplace and operations are increasingly digitalised, electronic devices could become vulnerable to cyberattacks. It is therefore of utmost importance to improve the security culture within CLP and empower business units and regions to employ suitable technologies and processes to protect the Company’s assets and systems.
To this end, policies are in place to promote good security practice across the business:
• The CLP Group Information Security Policy sets out the four key information security principles of confidentiality, integrity, availability and regulatory compliance. With reference to ISO/IEC 27002:2013 Information Technology Security Techniques - Code of practice for information security controls, a set of Group-level policies have been developed. Regional standards and procedures have been developed from these policies and tailored to suit the context and local regulations of the business unit.
• The CLP Group Operational Technology Cyber Security Policy defines how to develop, implement and maintain appropriate safeguards to ensure the delivery of critical infrastructure services by CLP. One key focus relates to detection and response in cases of OT cyber security events, and to establish recovery capability on the OT systems.
With the policies and systems in place, an independent assurance team within the Group Security Department helps verify that the measures are followed consistently and that associated cyber security risks are suitably mitigated. The department’s evidence-based reporting provides an important feedback loop that enables the Company to pursue continuous improvement. In addition, the team helps project managers and business leaders understand cyber security risks in the context of CLP’s business, and offers guidance on risk mitigation strategies.
Training and awarenessPeople are another focus in cyber defence. Every employee and associate of the Group is an important cyber defence asset. They need to be equipped with relevant knowledge and vigilance.
CLP recognises the critical need to continually adapt and enhance its security posture to defend its operations against a complex and dynamic threat spectrum. Insight into the capability and intent of cyber attackers will help CLP develop situational awareness and give direction on what measures need to be taken to mitigate associated risks. Continual effort is given to raising cyber security awareness, training and education amongst employees to help them practise good “cyber hygiene”.
The Group has been further developing its cyber intelligence and security awareness capability throughout the year. There has been an enhanced understanding of threat actors and their techniques, ensuring, for example, that the business gets the option to prioritise software patching or to introduce other mitigation measures in a timely and effective manner. Security awareness activities at the employee level have included: simulated phishing emails, internal broadcast campaigns, briefings, videos and a popular cyber-gamified competition.
Monitoring and follow-upCLP continually monitors its IT systems and networks and seeks out threats to its OT systems. Advances in cyber security technologies have helped improve the detection of cyber security breaches. If suspicious activity is discovered in the IT or OT network environments, immediate action is taken to investigate it and, if necessary, isolate the threat and lead the recovery action.
CLP Holdings 2021 Sustainability Report | 85

Welcome About this Report Materiality Assessment Standard ESG disclosures
Corporate governance
Safety Environment and climate change
Asset management
Supply chain Community People Customers Key performance metrics
Year in reviewThe governance and organisation established in 2020 has provided a solid foundation for CLP to further strengthen its cyber security capability.
Throughout 2021, a coherent risk assessment matrix has been adopted to better measure and allow greater scrutiny of cyber risks in different business units.
Thorough reviews were conducted to help the Company identify areas for improvement. One study assessed CLP’s cyber security awareness and capacity, and highlighted the importance of deep cyber intelligence expertise. The other focused on areas for improvement in relation to incident response. These studies brought attention to the need for continual improvement and CLP has started to implement the recommendations, which will continue in the coming year.
Enhancing technology is another area of focus. Working together with IT and OT colleagues across the regions, vulnerability scanning tools and OT active response capabilities have been enhanced. With fine tuning and operator experience improving all the time, there have been fewer false positive notifications. In addition, to help different functions utilise the potential of cloud services, checklists and technical guidelines were developed to help them select the right vendors without compromising cyber integrity.
It is unlikely that cyber threats will be eliminated fully and CLP needs to stay vigilant at all times. Since power systems are considered critical infrastructure, different jurisdictions are also enacting more stringent regulations on cyber security in relation to critical infrastructure. Notably, in Mainland China, the PRC Data Security Law (DSL) became effective in September 2021. It sets up a framework that classifies data collected and stored in Mainland China based on its potential impact on Chinese national security and regulates its storage and transfer depending on the data’s classification level. Regulations on implementation of the DSL are under development. The Australian government also introduced the Security Legislation Amendment (Critical Infrastructure) Act 2021. Relevant business units have reviewed their information systems and business practices, to determine whether there is any compliance action that needs to be taken.
Cyber security continues to be one of CLP's top-tier risks and is regularly assessed and reported to senior management through the risk management process. In spite of further anticipated regulatory changes, and the fact that cyber security skillsets are scarce and recruitment is fiercely competitive, CLP will continue to seek to uplift its capacity in the area of process, people and technology, and to on-board the expertise required to spearhead the effort.
Read more from the 2021 Audit & Risk Committee Report
CLP Holdings 2021 Sustainability Report | 86
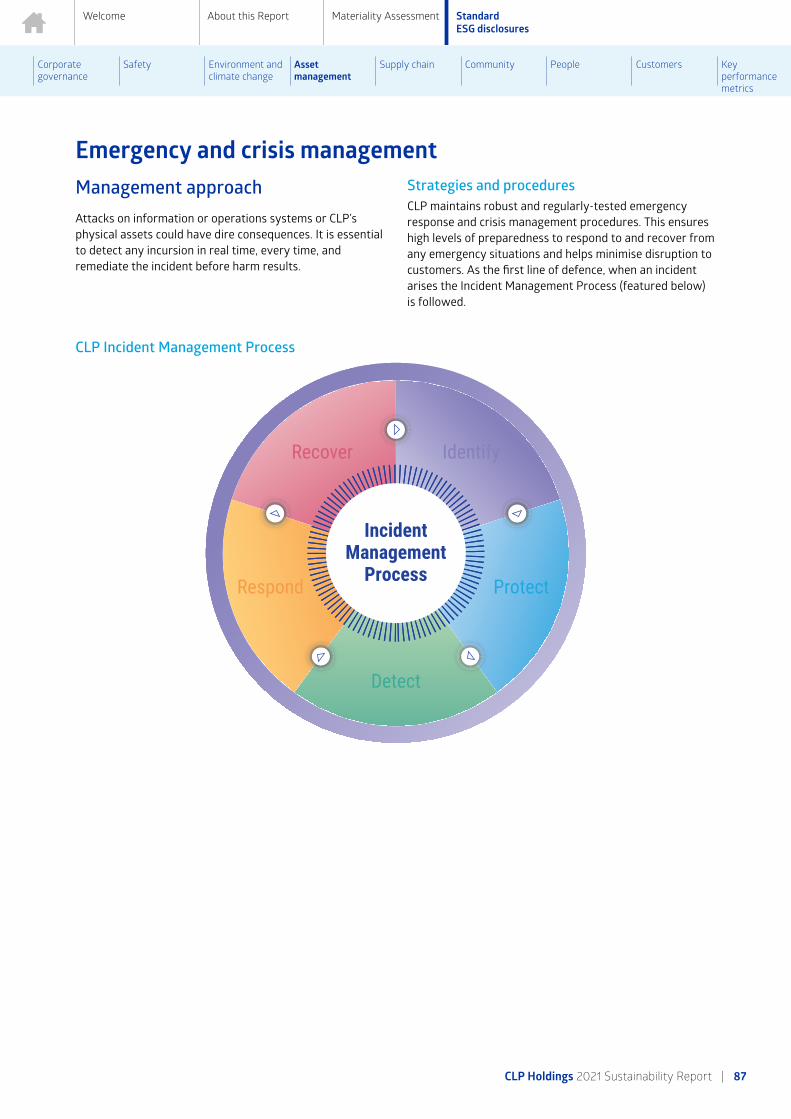
Welcome About this Report Materiality Assessment Standard ESG disclosures
Corporate governance
Safety Environment and climate change
Asset management
Supply chain Community People Customers Key performance metrics
Emergency and crisis management Management approachAttacks on information or operations systems or CLP’s physical assets could have dire consequences. It is essential to detect any incursion in real time, every time, and remediate the incident before harm results.
Strategies and proceduresCLP maintains robust and regularly-tested emergency response and crisis management procedures. This ensures high levels of preparedness to respond to and recover from any emergency situations and helps minimise disruption to customers. As the first line of defence, when an incident arises the Incident Management Process (featured below) is followed.
CLP Incident Management Process
CLP Holdings 2021 Sustainability Report | 87

Welcome About this Report Materiality Assessment Standard ESG disclosures
Corporate governance
Safety Environment and climate change
Asset management
Supply chain Community People Customers Key performance metrics
Crisis Management PlanThe Group Crisis Management Plan is in place to help respond to emergencies and crises that may cause business disruptions. The Plan is continually reviewed and enhanced to ensure it is in line with operational changes or the broader operating context. It provides a platform for the effective handling of a crisis at the Group level. The plan:
• Outlines crisis management organisation, roles, responsibilities, procedures and processes;
• Specifies the tools needed to ensure the collective response is well planned, well executed, and fully integrated across the organisation;
• Describes the relationship and interface between the handling of regional- and Group-level crises; and
• Details the processes that govern internal and external communications during emergencies and crises; ensuring the people responsible for managing a crisis have the necessary information to carry out their responsibilities and that key stakeholders are informed.
The Group-level plan is supported at regional level by Regional Crisis Management Plans which mirror the Group document but are tailored for each region. In addition, detailed emergency response plans have been developed for each asset. These plans are designed to be used by first responders and asset managers.
Details on CLP’s Crisis Management & Emergency Response Structure are outlined in the diagram below.
Training and awarenessAs specified in both Group and regional publications, emergency response drills are conducted at least annually at all Group sites, with smaller scale drills taking place more often. Group and Regional Crisis Management Plans are reviewed at least every three years. Regional crisis management exercises are conducted annually as part of the internal peer review process.
CLP Crisis Management & Emergency Response Structure
CLP Holdings 2021 Sustainability Report | 88

Welcome About this Report Materiality Assessment Standard ESG disclosures
Corporate governance
Safety Environment and climate change
Asset management
Supply chain Community People Customers Key performance metrics
Year in reviewCLP continues to enhance its crisis management capability to ensure the organisation can respond promptly and orderly when an incident occurs.
Crisis managementFrom a crisis management perspective, the emphasis of the Company has been on maintaining and enhancing capability. Initiatives of the year included:
• Adopting cloud-based technology for CLP’s Crisis Communications Billboard (CCB) to better facilitate incident management
• Reviewing and improving notification and communication tools
• At Group level, conducting crisis management communications and administrative drills to ensure that the equipment and procedures are functional and fully understood by the operators.
CASE STUDY
Crisis management in action during the Dali earthquake
On 21 May 2021, a 6.4-magnitude earthquake struck Dali City, Yunnan Province, where Yang_er Hydro Power Station and Xicun Solar Power Station are located. The epicentre was approximately 18km from Yang_er Hydro.Following the earthquake, the assets’ emergency management processes and the Emergency Management Team (EMT), which covers both sites, were activated to manage the incident. Key tasks included evacuation of personnel, mobilisation of emergency supplies, commissioning of temporary facilities to substitute those prone to landslide risk and constantly communicating with China Region headquarters in Hong Kong and the local government. All staff and contractors were reported as safe.
There was some minor damage sustained, mainly to buildings at the Yang_er Hydro plant, but no damage was
reported for the Xicun Solar Farm which was farther away from the epicentre. Operations at both plants returned to normal within 10 days after thorough inspections were carried out. The lessons learnt from this event have been analysed to improve future protection and emergency response measures.
About 1 month's emergency reserve of food at Xicun Solar Plant.
CLP Holdings 2021 Sustainability Report | 89

Welcome About this Report Materiality Assessment Standard ESG disclosures
Corporate governance
Safety Environment and climate change
Asset management
Supply chain Community People Customers Key performance metrics
Asset management dataSASB reference: IF-EU-000.B, IF-EU-000.D, IF-EU-000.E; GRI reference: EU1, EU2
Asset management
Fuel use 2021 2020 2019 2018 2017
Coal consumed (for power generation) (TJ)1 426,190 403,379 485,453 521,568 471,976
Gas consumed (for power generation) (TJ)1 142,304 134,776 107,183 83,364 91,426
Oil consumed (for power generation) (TJ)1 2,717 2,243 2,620 3,807 5,069
1 Numbers include operating assets where CLP has operational control during the calendar year. Paguthan Power Station, the power purchase agreements of which expired in December 2018, was not included in the 2019-2021 numbers.
Generation and energy storage capacity 2021 2020 2019 2018 2017
On an equity basis
Total generation and energy storage capacity by asset type (MW(%))1,2 20,018 (100%) 19,691 (100%) 19,238 (100%) 19,108 (100%) 19,395 (100%)
Coal 10,795 (53.9%) 10,765 (54.7%) 10,765 (56.0%) 10,765 (56.3%) 11,401 (58.8%)
Gas 4,666 (23.3%) 4,600 (23.4%) 4,194 (21.8%) 4,147 (21.7%) 3,434 (17.7%)
Nuclear 1,600 (8.0%) 1,600 (8.1%) 1,600 (8.3%) 1,600 (8.4%) 1,600 (8.2%)
Wind3 1,747 (8.7%) 1,521 (7.7%) 1,521 (7.9%) 1,521 (8.0%) 1,941 (10.0%)
Hydro3 489 (2.4%) 489 (2.5%) 489 (2.5%) 489 (2.6%) 489 (2.5%)
Solar3 499 (2.5%) 499 (2.5%) 451 (2.3%) 369 (1.9%) 321 (1.7%)
Waste-to-energy3 7 (0.0%) 7 (0.0%) 7 (0.0%) 7 (0.0%) N/A
Energy Storage 5 (0.0%) 0 (0.0%) N/A N/A N/A
Others 210 (1.0%) 210 (1.1%) 210 (1.1%) 210 (1.1%) 210 (1.1%)
On an equity plus long-term capacity and energy purchase basis
Total generation and energy storage capacity by asset type (MW(%))1,2,4 25,108 (100%) 24,752 (100%)5 24,015 (100%) 23,705 (100%) 24,554 (100%)
Coal 12,027 (47.9%) 11,997 (48.5%) 11,997 (50.0%) 11,997 (50.6%) 12,633 (51.4%)
Gas 5,813 (23.2%) 5,717 (23.1%) 5,139 (21.4%) 5,084 (21.4%) 5,322 (21.7%)
Nuclear 2,685 (10.7%) 2,685 (10.8%) 2,685 (11.2%) 2,685 (11.3%) 2,488 (10.1%)
Wind6 2,331 (9.3%) 2,105 (8.5%)5 2,049 (8.5%) 1,982 (8.4%) 2,401 (9.8%)
Hydro6 489 (1.9%) 489 (2.0%) 489 (2.0%) 489 (2.1%) 489 (2.0%)
Solar6 793 (3.2%) 793 (3.2%) 745 (3.1%) 558 (2.4%) 321 (1.3%)
Waste-to-energy6 10 (0.0%) 10 (0.0%) 10 (0.0%) 10 (0.0%) N/A
Energy Storage 660 (2.6%) 655 (2.6%) N/A N/A N/A
Others 300 (1.2%) 300 (1.2%) 900 (3.7%) 900 (3.8%) 900 (3.7%)
1 Numbers have been subject to rounding. Any discrepancies between the total shown and the sum of the amounts listed are due to rounding.2 Starting from 2020, a new "Energy Storage” asset category is added, under which pumped storage and battery storage are included. In previous years, assets
under the “Others” category included oil-fired generation assets and pumped storage.3 Renewables include wind, hydro, solar and waste-to-energy. The total capacity of renewables on an equity basis is 2,743 MW (13.7%) in 2021.4 Numbers include assets with majority and minority shareholdings, and those under "long-term capacity and energy purchase" arrangements with CLP. Starting
from 2018, "long-term capacity and energy purchase" has been defined as a purchase agreement with a duration of at least five years, and capacity or energy purchased being no less than 10MW.
5 Restated as per updated data for Power Purchase Agreement (PPA) of Waterloo Wind Farm in Australia.6 Renewables include wind, hydro, solar and waste-to-energy. The total capacity of renewables on an equity plus long-term capacity and energy purchase basis
is 3,624 MW (14.4%) in 2021.
CLP Holdings 2021 Sustainability Report | 90

Welcome About this Report Materiality Assessment Standard ESG disclosures
Corporate governance
Safety Environment and climate change
Asset management
Supply chain Community People Customers Key performance metrics
Energy sent out 2021 2020 2019 2018 2017
On an equity basis
Total energy sent out by asset type (GWh(%))1,2,3 73,113 (100%) 68,699 (100%) 70,949 (100%) N/A N/A
Coal 42,002 (57.4%) 39,438 (57.4%) 44,596 (62.9%) N/A N/A
Gas 13,233 (18.1%) 12,390 (18.0%) 9,979 (14.1%) N/A N/A
Nuclear 12,302 (16.8%) 11,192 (16.3%) 10,888 (15.3%) N/A N/A
Wind4 2,959 (4.0%) 2,886 (4.2%) 2,924 (4.1%) N/A N/A
Hydro4 1,668 (2.3%) 1,879 (2.7%) 1,758 (2.5%) N/A N/A
Solar4 922 (1.3%) 898 (1.3%) 805 (1.1%) N/A N/A
Waste-to-energy4 27 (0.0%) 15 (0.0%) 0 (0.0%) N/A N/A
Energy Storage 0 (0.0%) 0 (0.0%) N/A N/A N/A
Others 0 (0.0%) 1 (0.0%) 0 (0.0%) N/A N/A
On an equity plus long-term capacity and energy purchase basis
Total energy sent out by asset type (GWh(%))1,2,3,5,6 91,183 (100%) 85,949 (100%)7 88,573 (100%) 100% 100%
Coal 43,995 (48.2%) 41,118 (47.8%) 48,512 (54.8%) 60% 61%
Gas 18,461 (20.2%) 17,157 (20.0%) 13,073 (14.8%) 12% 15%
Nuclear 20,962 (23.0%) 19,923 (23.2%) 19,400 (21.9%) 20% 15%
Wind8 4,611 (5.1%) 4,445 (5.2%)7 4,474 (5.0%)
8% 9%Hydro8 1,668 (1.8%) 1,879 (2.2%) 1,758 (2.0%)
Solar8 1,524 (1.7%) 1,522 (1.8%) 1,467 (1.7%)
Waste-to-energy8 38 (0.0%) 22 (0.0%) 0 (0.0%) N/A N/A
Energy Storage -75 (-0.1%) -118 (-0.1%) N/A N/A N/A
Others 1 (0.0%) 1 (0.0%) -109 (0.1%) 0% 0%
On an operational control basis
Total energy sent out (GWh)3 62,967 58,918 N/A N/A N/A
1 Numbers and percentage figures have been subject to rounding. Any discrepancies between the total shown and the sum of the amounts listed are due to rounding.
2 Starting from 2020, a new "Energy Storage” asset category has been added, under which pumped storage and battery storage are included. In previous years, assets under the “Others” category included oil-fired generation assets and pumped storage.
3 Paguthan Power Station, the power purchase agreements of which expired in December 2018, was not included in the 2019-2021 number.4 Renewables include wind, hydro, solar and waste-to-energy. The total sent out of renewables on an equity basis is 5,576 GWh (7.6%) in 2021.5 Numbers include assets with majority and minority shareholdings, and those under "long-term capacity and energy purchase" arrangements with CLP. Starting
from 2018, "long-term capacity and energy purchase" is defined as a purchase agreement with a duration of at least five years, and capacity or energy purchased being no less than 10MW.
6 Only percentages are available for the years 2017-18.7 Restated as per updated data for Power Purchase Agreement (PPA) of Waterloo Wind Farm in Australia.8 Renewables include wind, hydro, solar and waste-to-energy. The total sent out of renewables on an equity plus long-term capacity and energy purchase basis
is 7,840 GWh (8.6%) in 2021.
2021 data shaded in orange has been independently verified by PricewaterhouseCoopers. The assurance scope of past years' data can be found in previous Sustainability Reports.
CLP Holdings 2021 Sustainability Report | 91

Supply chain
Welcome About this Report Materiality Assessment Standard ESG disclosures
Corporate governance
Safety Environment and climate change
Asset management
Supply chain Community People Customers Key performance metrics
OverviewThe success of a business depends on a range of factors beyond its operational boundaries. One key factor is its supply chains.
CLP recognises suppliers as a core asset as it relies on the equipment, fuel and other resources they provide to successfully generate and deliver electricity and services to customers. Well-managed and optimised supply chains support cost control, improve business outcomes and define a competitive advantage.
Due to its interconnected and interdependent nature, strong supply chain management is necessary to protect CLP, suppliers, customers and communities from the potential knock on effects of any changes in the operating environment. For customers, they may include reliability of CLP’s energy supply. For CLP, the potential knock on effects include regulatory and reputational risks arising from increasing expectations. In particular, companies are expected to understand – and manage – the risks of child or forced labour in its supply chains.
The need for close collaboration requires the alignment of CLP’s targets and objectives with those of its business partners. Through its spend with suppliers, CLP contributes to economies and local communities by creating jobs. It can also positively augment suppliers’ practices through partnership and collaboration and, if appropriate, mandate higher standards of safety, environmental protection and labour practices.
Key stakeholders• Customers, Suppliers, Communities
Related material topics• Reinforcing resilience in a changing operating environment
• Aligning business activities with community, employee and customer expectations
• Upholding labour standards in the supply chain
Supply chain management Management approachProcurement and supply chain management are an integral part of CLP’s business operations. CLP procurement professionals aim to develop and implement effective supply market strategies to acquire quality products and services, reduce supply chain risks, realise Group-wide synergies and deliver optimised supply chain value to stakeholders.
Strategies and proceduresAn updated version of CLP's Group Procurement Standard (GPS) was released in early 2022 after a thorough review and internal engagement. With safety as an overarching value, the framework has five dimensions which serve as a guide towards world-class procurement practices, they are:
• Corporate strategy and guiding principles
• Business value outcomes
• Future-fit structures and collaboration
• People and technology
• Change management.
The GPS supports the continuous improvement of functional practice and capability across the Group. For each dimension, the GPS defines levels of practice from “basic” to “advanced”. Each business unit assesses their required level of functional capability to support their business outcomes, and then develops a plan from their current level of practice towards leading practices.
CLP Holdings 2021 Sustainability Report | 92

Welcome About this Report Materiality Assessment Standard ESG disclosures
Corporate governance
Safety Environment and climate change
Asset management
Supply chain Community People Customers Key performance metrics
CLP's Group Procurement Standard
Procurement commitments comply with CLP policies, including:
• CLP’s Value Framework;
• CLP Procurement Values and Principles, which highlight the procurement department's mission, governance, commitment and strategies;
• The CLP Group Responsible Procurement Policy Statement which highlights the Company's requirements and expectations of suppliers; and
• Other procurement policies that govern daily CLP operations.
These day-to-day operations are also guided by CLP’s Whistleblowing Policy and Harassment-Free Workplace Policy. CLP encourages all suppliers to uphold the principles outlined in these policies.
Procurement is actively involved in supporting category and project steering committees, including supporting an appropriate level of oversight and governance in procurement decision-making. In addition, procurement commitments are made with reference to clearly defined regional Company Management Authority Manuals.
Monitoring and follow-upCLP designs fit-for-purpose sourcing strategies to select suppliers who will best meet its requirements and deliver value at an acceptable level of risk. Typically, supplier selections are conducted through competitive tendering and based on an assessment of the supplier’s ability to meet quality, health and safety, environment, delivery, innovation, sustainability and cost requirements. CLP ensures its
contracts safeguard stakeholder interests, and reflect supplier commitments and obligations, including legal and regulatory compliance, and the safeguarding of intellectual property rights, data confidentiality and security.
The Procurement Leadership Team, comprising each Region’s heads of procurement, oversees aggregated future procurement needs, supply market opportunities and risks, and the development of procurement strategies. Procurement and business unit personnel work in close partnership to review the market and assess the performance of incumbent suppliers. There is an emphasis on monitoring sustainability risks, covering the areas of human rights/modern day slavery, environment and community. The information informs the formulation of the sourcing strategies and provides enhanced insights of the supply market. This collaboration has increased CLP’s ability to negotiate and manage risk and supplier relationships, and has resulted in tangible commercial benefits for each business.
CLP segments contracted suppliers into tiers. This helps determine the appropriate level of governance and engagement. Segmentation is reviewed annually based on relative contract value and potential business impact, including risks in relation to supply chain and sustainability.
Quarterly risk assessments are conducted in line with the Corporate Risk Framework for strategic suppliers with high business criticality and spend value. Heatmaps assist in determining the likelihood of failure events and their potential impact on the business. The assessment is conducted in conjunction with supplier risk management and supplier relationship management processes. Risk mitigation
CLP Holdings 2021 Sustainability Report | 93

Welcome About this Report Materiality Assessment Standard ESG disclosures
Corporate governance
Safety Environment and climate change
Asset management
Supply chain Community People Customers Key performance metrics
plans are developed to address identified risks related to delivery performance, supply disruptions and business continuity, and sustainability within the supply chain. Regular meetings with suppliers are conducted to discuss the progress of mitigation plans and explore opportunities for further improvement.
Continuous improvementThrough year-round operational, business and executive reviews, CLP enhances its Supplier Relationship Management process for strategic suppliers. The reviews consistently measure each strategic supplier’s delivery performance, drive continuous improvements and alignment.
CLP continues to review past performance, future business needs, as well as technology and innovation roadmaps
regularly with suppliers. While supplier performance is measured under a structured framework, suppliers are also invited to provide feedback to CLP. This approach provides candid two-way communication and continuous improvements in the long run. Specific focus and supplier input on technology roadmaps and innovation also strengthens CLP for future challenges.
For example, as a result of the review process, a talent development programme was rolled out in CLP Power in 2021. It provided comprehensive training modules, including topics on category management and sustainable procurement, to uplift the capabilities of the procurement team in Hong Kong. It will continue in 2022 on other topics.
Year in reviewAll suppliers contracted for critical projects were subject to sustainability risk assessments, representing 67% of total procurement project spend.
GRI reference: 204-1, 308-1, 308-2, 407-1, 408-1, 409-1, 412-1, 414-1
CLP defines critical projects by considering their importance to business operations, sustainability risks and contract value.
Suppliers of critical projects are assessed on their sustainability practices through various tools, including self-declared questionnaires, proposal evaluation, site visits, and where subcontracting is involved, audits on subcontractors’ capability to meet the project's requirements.
In 2021, all critical projects awarded were subject to sustainability risk assessments. These critical projects represented 67% of total procurement projects by value, as compared with 94% in 2020 and 71% in 2019. The relatively high percentage in 2020 was attributed mainly to one-off capital projects in Hong Kong.
In 2021, the Group sourced products and services from 5,659 suppliers to the total amount of HK$44.0 billion – 58%1 of this total was spent on local suppliers based in the respective Hong Kong, Mainland China, India and Australia markets. Charts on the number of suppliers by region and the spend per region are shown below.
Number of suppliers by region
CLP has the highest number of active suppliers in Australia.
1,9421,942
1,2161,216
1,0251,025
1,1971,197
6767
112112
9898
22
Australia
Mainland China
Hong Kong
India
Others(Asia Pacific)
Europe
America
Rest of the world
0 500 1,000 1,500 2,000
1 The calculation methodology of the proportion of spending on local suppliers was revised in 2021 to better reflect the local spent by each of CLP's business unit. In 2020, spending on local suppliers accounted for 60% of the total spent.
CLP Holdings 2021 Sustainability Report | 94
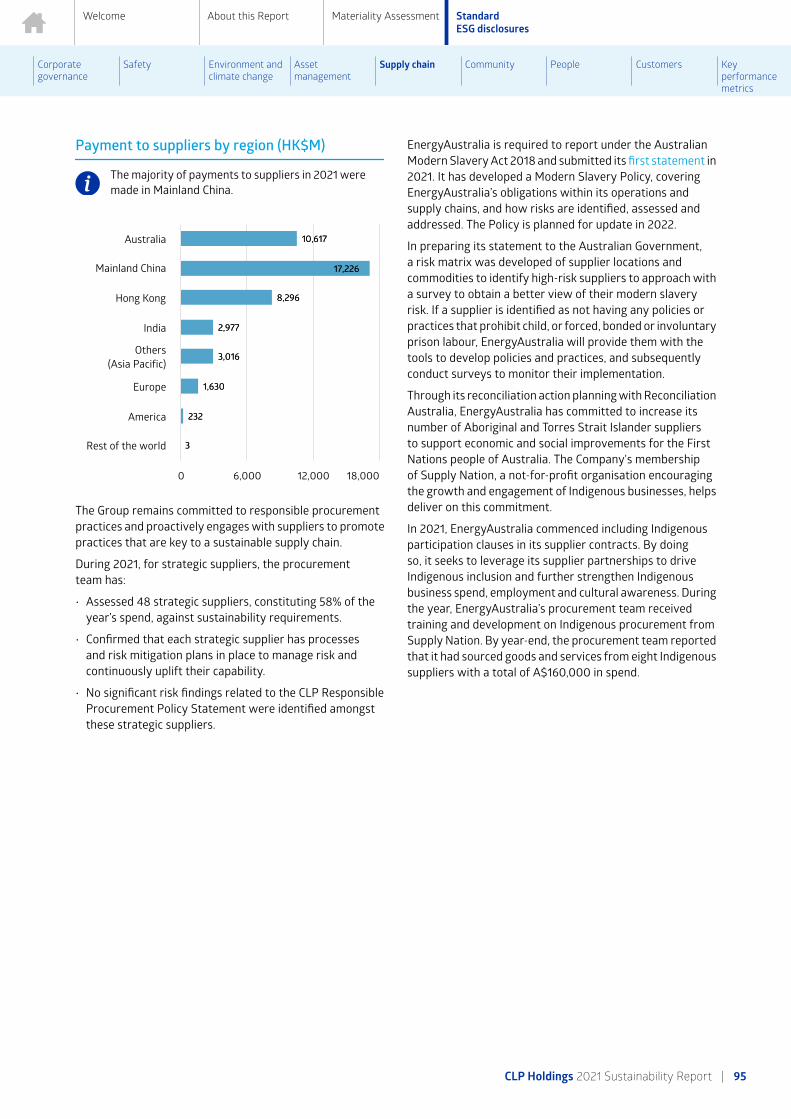
Welcome About this Report Materiality Assessment Standard ESG disclosures
Corporate governance
Safety Environment and climate change
Asset management
Supply chain Community People Customers Key performance metrics
Payment to suppliers by region (HK$M)
The majority of payments to suppliers in 2021 were made in Mainland China.
10,61710,617
17,22617,226
8,2968,296
2,9772,977
3,0163,016
1,6301,630
232232
33
Australia
Mainland China
Hong Kong
India
Others(Asia Pacific)
Europe
America
Rest of the world
0 6,000 12,000 18,000
The Group remains committed to responsible procurement practices and proactively engages with suppliers to promote practices that are key to a sustainable supply chain.
During 2021, for strategic suppliers, the procurement team has:
• Assessed 48 strategic suppliers, constituting 58% of the year’s spend, against sustainability requirements.
• Confirmed that each strategic supplier has processes and risk mitigation plans in place to manage risk and continuously uplift their capability.
• No significant risk findings related to the CLP Responsible Procurement Policy Statement were identified amongst these strategic suppliers.
EnergyAustralia is required to report under the Australian Modern Slavery Act 2018 and submitted its first statement in 2021. It has developed a Modern Slavery Policy, covering EnergyAustralia’s obligations within its operations and supply chains, and how risks are identified, assessed and addressed. The Policy is planned for update in 2022.
In preparing its statement to the Australian Government, a risk matrix was developed of supplier locations and commodities to identify high-risk suppliers to approach with a survey to obtain a better view of their modern slavery risk. If a supplier is identified as not having any policies or practices that prohibit child, or forced, bonded or involuntary prison labour, EnergyAustralia will provide them with the tools to develop policies and practices, and subsequently conduct surveys to monitor their implementation.
Through its reconciliation action planning with Reconciliation Australia, EnergyAustralia has committed to increase its number of Aboriginal and Torres Strait Islander suppliers to support economic and social improvements for the First Nations people of Australia. The Company's membership of Supply Nation, a not-for-profit organisation encouraging the growth and engagement of Indigenous businesses, helps deliver on this commitment.
In 2021, EnergyAustralia commenced including Indigenous participation clauses in its supplier contracts. By doing so, it seeks to leverage its supplier partnerships to drive Indigenous inclusion and further strengthen Indigenous business spend, employment and cultural awareness. During the year, EnergyAustralia’s procurement team received training and development on Indigenous procurement from Supply Nation. By year-end, the procurement team reported that it had sourced goods and services from eight Indigenous suppliers with a total of A$160,000 in spend.
CLP Holdings 2021 Sustainability Report | 95

Welcome About this Report Materiality Assessment Standard ESG disclosures
Corporate governance
Safety Environment and climate change
Asset management
Supply chain Community People Customers Key performance metrics
Responsible procurement Management approachCLP’s Responsible Procurement Policy Statement (RePPS) outlines the Group’s expectations of its suppliers, and their suppliers and subcontractors.
GRI reference: 2-24, 407-1, 414-2
The expectations outlined in the RePPS are based on four pillars:
1. Legal compliance;
2. Respect for people, including a safe working environment, good employment practices, no discrimination and no use of child labour or forced labour;
3. Ethics and business conduct, including transparency in business processes, a high standard of business conduct and no conflicts of interest; and
4. Environmental stewardship, including the efficient use of resources, the responsible disposal of waste and the monitoring of environmental performance to improve over time.
Download the Responsible Procurement Policy Statement
Separately, EnergyAustralia has developed a Supplier Code of Conduct and supplier portal. The Code reflects the essence of the Group's RePPS. It includes a whistleblowing service that suppliers may contact directly or anonymously to raise any concerns. The Code has been added to supplier contract precedents and EnergyAustralia Purchase Order Terms and Conditions.
Download EnergyAustralia's Supplier Code of Conduct
Operational responsibilitiesCLP contract terms and conditions outline specific sustainability requirements and expectations in terms of business ethics. Suppliers are encouraged to align with the principles stated in the RePPS and are expected to adopt similar standards and practices when doing business with the Company.
The CLP team leading responsible procurement engages with key internal and external stakeholders to promote procurement practices aimed at reducing environmental, social and governance (ESG) risks and enhancing supplier capabilities to meet CLP’s sustainability expectations.
Strategies and proceduresCLP takes a risk-based approach to responsible procurement across the procurement lifecycle. ESG risks are identified and evaluated regularly at category, project and supplier levels
against each of the four responsible procurement pillars. This evaluation considers:
• Country-specific risks;
• Product/service-specific risks;
• Industry/category-specific risks;
• Legal and regulatory compliance risks;
• Labour practices and sub-contracting risks;
• Health and safety risks;
• Governance and business conduct risks;
• Environmental risks; and
• Brand and reputational risks.
Specifically, the risk assessment aims to help CLP manage ESG issues, such as labour practices, human rights, modern slavery, child labour, harassment, safety, environment, subcontractor management and anti-bribery along the value chain. The risk assessment results provide insights into sourcing strategy development for categories and risk mitigation for strategic suppliers.
Training and developmentCLP regularly conducts workshops for contractors to uplift their safety and environmental awareness and capability. To enhance professional development of contractor staff, workshops and training on procurement practices and supplier relationship management are conducted.
Year in reviewCLP is strengthening its Responsible Procurement Framework and enhancing visibility of supplier sustainability risk, as part of its current three-year Procurement and Supply Chain Management Sustainability Plan.
Under the current plan, a review of CLP’s Responsible Procurement Policy Statement is underway. The review considers best practices in responsible procurement and stakeholder expectations, and assesses the Company’s current practices against them. This will help CLP update its commitments in alignment with its business objectives, and clearly communicate its sustainability expectations to suppliers conducting business with the Company.
The other project in progress aims to enhance the visibility of the sustainability risk profile of CLP’s supplier base. The project seeks to introduce a supplier assessment which takes into account their industry and geography. All active suppliers will be assessed to identify sustainability risk hotspots. This will inform further actions, including possible support to improve supplier sustainability performance. The proposed assessment process is targeted for launch in the coming year.
CLP Holdings 2021 Sustainability Report | 96

Welcome About this Report Materiality Assessment Standard ESG disclosures
Corporate governance
Safety Environment and climate change
Asset management
Supply chain Community People Customers Key performance metrics
Supply chain dataGRI reference: 2-6
Supply chain management
Supplier distribution 2021 2020 2019 2018 2017
Total suppliers by region (number) 5,659 5,777 6,362 5,721 5,536
Australia 1,942 2,216 2,215 1,986 1,941
Mainland China 1,216 1,142 1,166 1,011 995
Hong Kong 1,025 1,013 1,000 950 899
India 1,197 1,134 1,704 1,476 1,443
Others (Asia Pacific) 67 70 77 84 70
Europe 112 121 118 129 112
America 98 78 77 78 69
Rest of the world 2 3 5 7 7
Payment to suppliers 2021 2020 2019 2018 2017
Total payment to suppliers by region (HK$M) 43,997 36,544 36,746 39,183 30,868
Australia 10,617 8,526 8,356 9,410 7,184
Mainland China 17,226 15,577 11,603 10,339 8,343
Hong Kong 8,296 8,501 8,888 8,917 7,264
India 2,977 1,999 3,104 4,597 2,527
Others (Asia Pacific) 3,016 960 3,093 4,363 4,467
Europe 1,630 753 1,234 1,170 830
America 232 221 458 380 241
Rest of the world 3 5 10 7 12
CLP Holdings 2021 Sustainability Report | 97

Community
Welcome About this Report Materiality Assessment Standard ESG disclosures
Corporate governance
Safety Environment and climate change
Asset management
Supply chain Community People Customers Key performance metrics
OverviewCLP provides electricity services which play an essential part in modern life. It also creates jobs and supports the economy through its investment in infrastructure, operations and its supply chain.
By making its electricity generation cleaner, CLP can create broader benefits to communities and their living environments through, for example, better air quality and reduced use of resources.
One of CLP’s major contributing factors to its greenhouse gas (GHG) footprint is emissions from electricity generation using fossil fuels. CLP’s mission is to be a responsible energy provider, and the communities in which it operates rightly expect the Company to play an active role in addressing the climate emergency. Such an expectation prevails in CLP’s Hong Kong home market, where electricity generation accounts for almost two-thirds of the city’s GHG emissions.
To that end, and in addition to decarbonising its electricity generation, CLP offers a range of new services and other supporting programmes with an objective to improve energy efficiency. The Company also promotes energy conservation to the public, participates in industry organisations and contributes to informed discussions on the transition to a low carbon economy.
Key stakeholders• Communities, Government and regulators, Customers
Related material topics• Shaping and executing the transition to net-zero
• Acting as a trusted partner in the clean energy transition
Stakeholder Engagement FrameworkManagement approachCLP is committed to open, transparent and timely communication with its stakeholders. This is delivered through the CLP Stakeholder Engagement Framework.
GRI reference: 2-16, 2-29, 207-3, 413-1
Strategies and proceduresCLP’s Stakeholder Engagement Framework provides open and transparent channels for stakeholder input, and a review and consideration process where concerns about CLP's business are responded to in a timely manner.
While each business unit develops its own project-specific engagement plan depending on their needs, in developing the plan the below framework is followed:
1. Aligning engagement objectives with business objectives
2. Mapping issues and concerns
3. Identifying relevant stakeholders: CLP's business activities involve a diverse range of stakeholders. In addition to regular communications with stakeholders (such as email updates, information kits, and video
stories), key stakeholder groups for each project are identified and prioritised based on issues mapping and how the stakeholders will be impacted, and their influence on the success of the business.
4. Developing a communications and engagement plan: CLP is using a wide range of easily accessible public engagement channels both formal and informal, such as surveys, focus groups, briefings, visits, events, roadshows and online channels, to enable it to receive concerns, interest or feedback at any time during the year. Drawing on past experiences, the channels for each project are selected based on the nature of the projects, and the effective means to reach the identified stakeholders.
5. Conducting engagement activities
6. Capturing feedback and reporting on outcomes: To address stakeholders’ views and concerns and identify areas for improvement in a timely manner, the effectiveness of CLP’s approach to stakeholder engagement is captured through a number of measures. They include stakeholder feedback, outcomes following engagement, media monitoring and analysis, brand perception ratings, and recognition and awards.
CLP Holdings 2021 Sustainability Report | 98
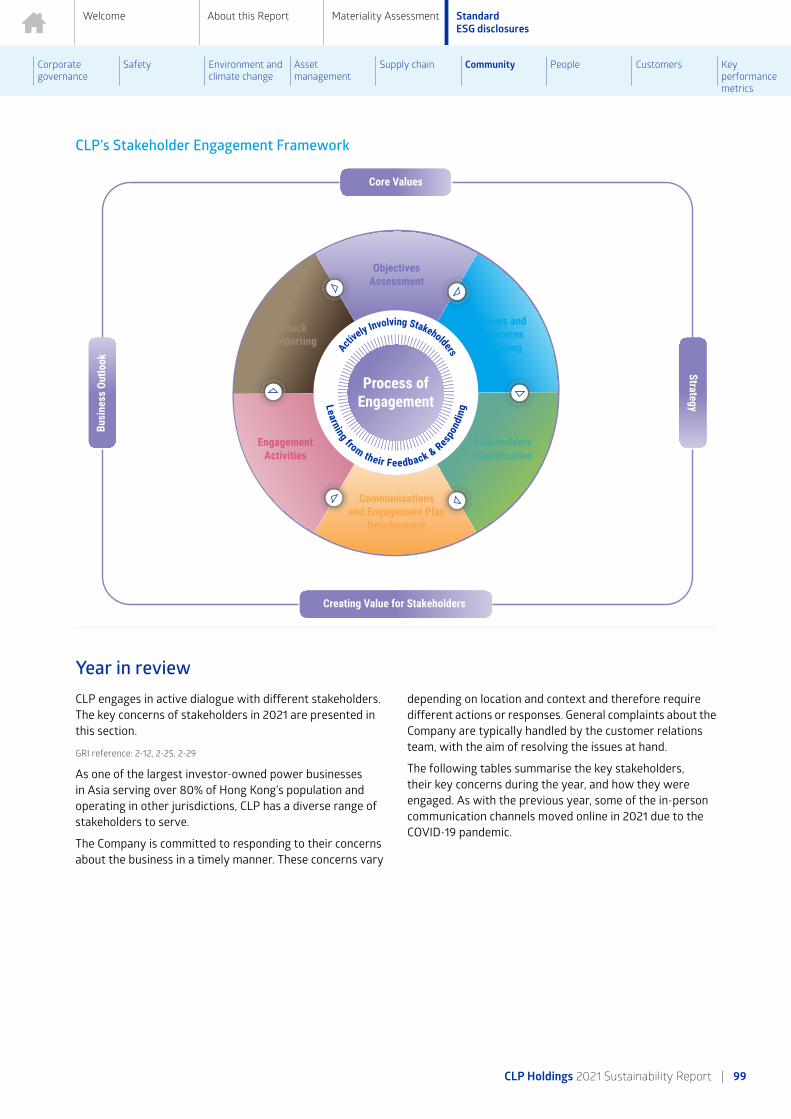
Welcome About this Report Materiality Assessment Standard ESG disclosures
Corporate governance
Safety Environment and climate change
Asset management
Supply chain Community People Customers Key performance metrics
CLP’s Stakeholder Engagement Framework
Year in reviewCLP engages in active dialogue with different stakeholders. The key concerns of stakeholders in 2021 are presented in this section.
GRI reference: 2-12, 2-25, 2-29
As one of the largest investor-owned power businesses in Asia serving over 80% of Hong Kong’s population and operating in other jurisdictions, CLP has a diverse range of stakeholders to serve.
The Company is committed to responding to their concerns about the business in a timely manner. These concerns vary
depending on location and context and therefore require different actions or responses. General complaints about the Company are typically handled by the customer relations team, with the aim of resolving the issues at hand.
The following tables summarise the key stakeholders, their key concerns during the year, and how they were engaged. As with the previous year, some of the in-person communication channels moved online in 2021 due to the COVID-19 pandemic.
CLP Holdings 2021 Sustainability Report | 99

Welcome About this Report Materiality Assessment Standard ESG disclosures
Corporate governance
Safety Environment and climate change
Asset management
Supply chain Community People Customers Key performance metrics
Lenders, investors and shareholders
Key Concerns / Interests in 2021 Engagement ChannelsRelevant sections for response details
• Decarbonisation actions under the updated CLP Climate Vision 2050
• Progress on energy transition across the portfolio
• Potential adoption of new technology to facilitate decarbonisation
• Regional business opportunities and development
• Impact of COVID-19 on liquidity, financing strategies and risk management
• Dividend policy and dividend prospects
• CLP's business sustainability, financial and operational strategies and performance
• Capital allocation and business opportunities across different regions
• Cash flow, financial and debt management, capital structure
• Board refreshment and diversity
• Annual General Meeting
• Annual and Interim Results Analyst Briefings and webcasts
• CLP Group website
• CLP Investor Relations App
• Annual and Interim Reports
• Annual Sustainability Report
• Climate Action Finance Report
• Announcements, circulars, presentations and media releases
• Direct engagement in the form of meetings, roadshows, response to information requests, letters and correspondence for ESG-related matters
• Outreach engagement following release of CLP’s updated Climate Vision 2050 ahead of COP26
Financial material topics are covered in:
• 2021 CLP Annual Report
• 2021 Climate-related Disclosures Report
• Climate Vision 2050: A Net-Zero Future
Governments and regulators
Key Concerns / Interests in 2021 Engagement ChannelsRelevant sections for response details
• Hong Kong – Scheme of Control Agreement, Development Plan implementation, tariff review, auditing review and long-term decarbonisation strategy
• Mainland China – Carbon emissions, safety, reliability and emergency readiness
• India – National Action Plan on Climate Change, power purchase agreements (PPA) and tariffs
• Australia – Reliability, affordability, system security, support for customers in financial hardship, market design, carbon emissions and integration of renewable energy, modern slavery in operations and supply chains
• Regular working meetings
• Regular performance reporting
• Written responses to public consultations and direct liaison with governments, regulators and relevant parties
• EnergyAustralia Modern Slavery Statement
• EnergyAustralia Energy Charter Disclosures
• Safety
• Asset management
• Customers
• Supply chain
Refer to the CLP Information Kit for responses relating to CLP Power Hong Kong
Suppliers and contractorsKey Concerns / Interests in 2021 Engagement Channels Relevant sections for
response details
• Contractors’ safety
• Temporary manpower payments
• Regular supplier management meetings and engagements (from operational to senior management)
• Safety workshops to engage contractors to uplift their safety awareness and capability
• Periodical supplier performance evaluations
• Safety
• Supply chain
CLP Holdings 2021 Sustainability Report | 100

Welcome About this Report Materiality Assessment Standard ESG disclosures
Corporate governance
Safety Environment and climate change
Asset management
Supply chain Community People Customers Key performance metrics
EmployeesKey Concerns / Interests in 2021 Engagement Channels Relevant sections for
response details
• Safety performance
• Competitive remuneration and benefits
• Career development opportunities
• Gender diversity and equal opportunity
• Employees’ health and wellbeing, in particular during the COVID-19 pandemic
• Employee engagement and safety culture surveys
• Employee feedback channels (via online forms, suggestion boxes, townhall meetings, etc.)
• Regular management communications and roadshows
• Two-way consultations (e.g. joint consultative committees in Hong Kong)
• Training and development programmes, including professional development and access to engineering qualifications
• Employee newsletters and broadcasts
• Company intranet portal, internal webinars and other communication channels facilitating cross-regional cooperation
• Discussion with trade union representatives in locations where collective bargaining power is recognised
• Employee Assistance Programmes including counselling services and workshops
• People
• Safety
Residential, commercial and industrial customers, electricity boards, grid companiesKey Concerns / Interests in 2021 Engagement Channels Relevant sections for
response details
• Energy prices, affordability, reliability and availability
• Tariff adjustment, management and competitiveness
• Energy efficiency, conservation and demand side management
• Customer experience
• Customer privacy
• Renewable energy offerings to customers
• India – Market entry and management of corporate PPAs for renewable energy
• Australia – Payment support to customers due to the impact of COVID-19 lockdowns
• Working groups, e.g. Customer Consultative Group, local customer advisory committees, SME consultative groups and industry groups
• Customer / partner forums and webinars
• Visits to assets
• Customer satisfaction surveys and feedback forms
• Customer Service Centres and Customer Interaction Centre
• Online service portals
• Direct / personalised communications through account managers
• Participation in government schemes
• 2021 Climate-related Disclosures Report
• Customers
CLP Holdings 2021 Sustainability Report | 101

Welcome About this Report Materiality Assessment Standard ESG disclosures
Corporate governance
Safety Environment and climate change
Asset management
Supply chain Community People Customers Key performance metrics
Community groups, legislators, NGOs, industry and professional organisations, academiaKey Concerns / Interests in 2021 Engagement Channels Relevant sections for
response details
• Employment opportunities and career development, particularly for young people
• Assistance to people in need during the economic downturn and COVID-19
• Community engagement and investment programmes related to education, empowerment of women, healthcare access, poverty alleviation, social inclusion, diversity and eliminating energy poverty
• Energy efficiency and conservation
• Climate change: carbon neutrality by 2050 and renewable energy development
• Progress on key new development projects and initiatives
• Hong Kong – Future fuel mix, supply reliability, fuel cost and tariff level, responses to social incidents and public sentiment, popularisation of electric vehicles, development of the green economy, and CLP’s role as a corporate citizen
• Mainland China – Business development and the associated impacts on local communities and carbon emissions
• Australia – Contribution to the local economy, the environmental impact of operations, future fuel mix and supply reliability, and the lifespan of power stations
• Working committees, advisory committees, panels and meetings
• Seminars, lectures, workshops and online classes
• Public / community events and programmes, including the CLP Power Distribution Box Beautification Project, and partnerships on various initiatives
• Community investment programmes
• Awards and scholarships
• Promotion through mass media and social media, including educational videos
• One-on-one meetings
• Community perception surveys
• Virtual events
• 2021 Climate-related Disclosures Report
• Environment and climate change
• Community
• Asset management
• Customers
• People
CLP Holdings 2021 Sustainability Report | 102

Welcome About this Report Materiality Assessment Standard ESG disclosures
Corporate governance
Safety Environment and climate change
Asset management
Supply chain Community People Customers Key performance metrics
CASE STUDY
Engaging stakeholders on Hong Kong’s offshore wind future
CLP Power is considering the development of Hong Kong’s first offshore wind farm, further reducing the carbon intensity of CLP's electricity generation.Stakeholder engagement is important for major projects to help CLP solicit stakeholder support and understand their concerns.
For the potential Hong Kong Offshore Wind Farm (HKOWF) infrastructure project, CLP sought to inform the Hong Kong public on the potential and feasibility of developing offshore wind energy through a variety of engagement activities. Coverage of the project and technological advancements in wind power appeared in local dailies and online news portals. Educational animations with
information on the project were released on social media platforms.
As part of the project’s environmental permit requirements, CLP Power formed a stakeholder liaison group of concerned parties, including representatives from environmental groups, academics, fisheries, NGOs, and local communities, who convene on a regular basis to exchange opinions on different aspects of the project.
CLP Power has been exploring the HKOWF project since 2009. Recent technological advances have increased the project’s viability. If approved by government, construction is expected to commence in the middle of this decade.
Visit the HKOWF project website
The case for wind in Hong KongWATCH NOW
CLP Holdings 2021 Sustainability Report | 103

Welcome About this Report Materiality Assessment Standard ESG disclosures
Corporate governance
Safety Environment and climate change
Asset management
Supply chain Community People Customers Key performance metrics
Public policyManagement approachCLP is committed to supporting the long-term development of the communities it serves, and contributing to the development of sound government energy policies and laws that balance social, economic and environmental needs.
GRI reference: 2-28, 415-1
CLP’s policy is to remain politically neutral and to avoid making political contributions. The Company participates in a range of industry and professional bodies to discuss the major issues deemed important to the energy sector's
ongoing viability and success, in particular climate change and energy.
Download CLP's Policy on Making Political Contributions
Joining an organisation as a member is reviewed by the respective Public Affairs teams based on business objectives and engagement purposes. All membership proposals are subject to the final approval of senior management of the Group or the business unit.
Year in reviewFor public policy developments which apply to the electric utility industry, CLP develops carefully considered positions and seeks to provide input to support government’s decision-making process.
GRI reference: 2-28, 201-4, 415-1
By bringing its industry expertise to the table, CLP can add value to the discussion on how best to structure rules for the energy industry going forward, as both technology and public demand evolves.
CLP’s responses to major public policy consultations – in addition to the Group-wide positions on critical issues such as climate change – are published and accessible on the Company's websites. For example:
• CLP Power’s pledge to fully support the Hong Kong Government’s “Hong Kong’s Climate Action Plan 2050” announced in 2021. The plan outlines long- and medium-term net-zero carbon emission targets and new measures for Hong Kong’s long-term decarbonisation strategy. This will help Hong Kong achieve carbon neutrality before 2050.
• EnergyAustralia participated in a range of reform processes run by State bodies and the national market institutions that relate to a number of reforms related to the clean energy transition, including the creation of renewable energy zones and essential energy system services.
EnergyAustralia has been the beneficiary of Government largesse as part of Tallawarra B and Yallourn:
• The Company approached the Victorian Government with the plan to retire Yallourn and transition to cleaner energy in a way that does not leave the workforce or the community behind. The plan involves Yallourn power station retiring in mid-2028, a multimillion-dollar package to support Yallourn workforce, and a commitment to build Australia’s first four-hour utility-scale battery of 350MW capacity by 2026 in the Latrobe Valley.
• EnergyAustralia is expanding its existing Tallawarra power station in the Illawarra region, following an agreement reached (A$83 million) with the Government of New South Wales. Through the agreement, Tallawarra B will become Australia’s first net-zero emissions hydrogen and gas capable power plant, with Scope 1 greenhouse gas emissions from the power station offset over its operational life.
None of CLP's other businesses receive any significant government financial assistance.
CLP also supports and actively participates in a range of organisations to enable the Company to keep abreast of different stakeholders’ views, navigate policy uncertainties and shape informed policy making.
CLP Holdings 2021 Sustainability Report | 104

Welcome About this Report Materiality Assessment Standard ESG disclosures
Corporate governance
Safety Environment and climate change
Asset management
Supply chain Community People Customers Key performance metrics
The table below outlines the total amount CLP has contributed to organisations which influences public policy. The contribution is made through paying membership fees, making donations, providing sponsorships and giving input
to policy position papers. The large increase in 2021 was due to significant contributions to COVID-19 relief programmes in India during the year.
Contributions to different types of organisations (HK$M)Types of organisation (HK$M) 2021 2020 2019
Lobbying, interest representation or similar 0 0 0
Local, regional or national political campaigns, organisations or candidates 0 0 0
Trade associations or tax-exempt groups (e.g. think tanks)1 14.12 8.90 8.04
Others (e.g. spending related to ballot measures or referendums) 0 0 0
1 Includes contributions to professional organisations that seek to influence policies in the form of membership, donation or sponsorship.
As part of CLP's ongoing engagements, the Company's participation focuses in organisations active in climate change and broader energy market policies.
Following is a list of organisations to which CLP devotes significant resources through membership, sponsorship
and other contributions, including active participation by senior management. CLP has contributed annually over HK$250,000, in cash or equivalent, over the last three years to the organisations listed below (in alphabetical order).
Organisation Description of organisation CLP contributions and engagement
Australian Energy Council (AEC)
The AEC represents 20 major electricity and downstream natural gas businesses operating in the competitive wholesale and retail energy markets.
EnergyAustralia’s Managing Director is Chair of the AEC. EnergyAustralia is also an active participant in its various working groups which cover a range of competitive energy market issues. These include reviews of wholesale market operation, competitive retail markets and emissions reduction policies.
Business Council of Australia (BCA)
The BCA is a CEO-led industry association, representing more than 100 of Australia’s largest businesses. It supports transitioning to a more carbon efficient economy with a goal of net-zero emissions by 2050.
The BCA advocates for a national, bipartisan energy and climate change framework that can deliver against reliability, affordability and sustainability objectives, consistent with EnergyAustralia’s position.
Business Environment Council (BEC)
An independent, charitable organisation established by the business sector in Hong Kong, the BEC promotes environmental excellence by advocating for the uptake of clean technologies and practices.
The CLP CEO has been a Director of BEC since 2012 and is currently Chairman of its Board of Directors. CLP actively participates in or sponsors events, public consultations and working groups organised by BEC. It is also a signatory of the BEC Low Carbon Charter and the Power Up Coalition.
Confederation of Indian Industry (CII)
The CII is a not-for-profit and industry-led organisation. It works to create and sustain an environment conducive to the development of India, partnering Industry, Government and civil society, through advisory and consultative processes. It works closely with Government on policy issues, interfacing with thought leaders, and enhancing efficiency, competitiveness and business opportunities for industry.
Apraava Energy has been a member of CII for more than a decade. Its Managing Director is the Co-Chairman of CII National Committee on Power, and its COO is currently a member of the India CEO Forum for Clean Air, which is under the CII National Initiative: Cleaner Air Better Life. Through these initiatives, Apraava Energy plays an active role in representing the power sector in India on issues that concerns them.
CLP Holdings 2021 Sustainability Report | 105

Welcome About this Report Materiality Assessment Standard ESG disclosures
Corporate governance
Safety Environment and climate change
Asset management
Supply chain Community People Customers Key performance metrics
Organisation Description of organisation CLP contributions and engagement
Energy Transitions Commission (ETC)
The ETC supports energy system transition by showing what it will take to create credible, accelerating transitions towards universal, clean energy systems across the world. It aims to inform decision-makers in both the public and private sectors and support leaders to undertake more rapid deployment of low and zero-carbon solutions.
Having joined in August 2018, the CLP CEO is one of a diverse group of leaders from the public, private and NGO sectors in the ETC.
Free Electrons An accelerator programme for electric utilities, Free Electrons enables startups to work closely with utilities to develop digital solutions to overcome challenges arising from the increase of renewable energy and decentralisation of energy systems.
CLP first participated in Free Electrons during 2018, and has identified collaboration opportunities through the programme. In 2021, CLP hosted a sprint module in a virtual format amid international travel restrictions. The 2021 programme has attracted applications from close to 800 start-up companies around the world.
World Business Council for Sustainable Development (WBCSD)
A global, CEO-led organisation of over 200 businesses, WBCSD is working to accelerate the transition to a sustainable world. It targets the realisation of its Sustainable Development Goals through six work programmes including Circular Economy, Cities & Mobility, Climate & Energy, Food & Nature, People & Society, and Redefining Value.
CLP is participating in various initiatives, such as through Climate & Energy Program Board membership and participation in the TCFD Electric Utilities Preparer Forum, the Energy Solutions Project, the Natural Climate Solutions Project and the Redefining Value Programme.
Chief Executive Officer Richard Lancaster (second from right) shares his insights into business sustainability leadership at the ReThink HK 2021 conference, co-organised by the Business Environment Council.
CLP Holdings 2021 Sustainability Report | 106

Welcome About this Report Materiality Assessment Standard ESG disclosures
Corporate governance
Safety Environment and climate change
Asset management
Supply chain Community People Customers Key performance metrics
Community investmentManagement approachCLP strives to build and maintain the trust of the communities in which it operates. ‘Doing the right thing’ is foundational to both the Company’s values and social licence to operate.
The Group is committed to contributing to programmes which support healthy, resilient and sustainable community development over the short and long term. In line with the CLP Group Community Initiatives, Sponsorship and Donation Policy on community engagement, the Company aims to:
• Support projects or programmes that reflect the needs and expectations of local communities and are sensitive to prevailing cultures, traditions and values;
• Support projects or programmes that are systematically managed with clearly identified objectives and expected outcomes;
• Engage in long-term partnerships with credible international, national, regional and local community organisations, non-governmental organisations and charities;
• Support projects or programmes that offer an opportunity for CLP’s employees to be involved; and
• Regularly evaluate the outcomes and impacts of the contributions.
Download the CLP Group Community Initiatives, Sponsorship and Donation Policy
Strategies and proceduresCLP’s community investment strategy is guided by the CLP Group Community Initiatives, Sponsorship and Donation Policy, which sets out principles and directions in the implementation of community initiatives across all business units and functions. The policy, alongside the Company’s corporate governance and internal control measures, as well as a standardised online reporting platform, aim to facilitate a coherent and transparent approach in the assessment, design, review and reporting of CLP’s community activities. This helps ensure resources are effectively deployed to serve the community’s needs in a timely manner.
The strategy focuses on four key areas: Community Wellbeing, Environment, Education and Development, and Arts and Culture. Each business unit implements the strategy according to local conditions and community needs.
CLP’s Community Initiative Approach
CLP Holdings 2021 Sustainability Report | 107

Welcome About this Report Materiality Assessment Standard ESG disclosures
Corporate governance
Safety Environment and climate change
Asset management
Supply chain Community People Customers Key performance metrics
Monitoring and follow-upCLP understands that community needs evolve over time. The policy is reviewed every three years to ensure it aligns with the Company’s development and changes in the external environment.
Different socio-economic impact measurement tools that evaluate the social impact of community initiatives have
been benchmarked. The most suitable tools are used to review the effectiveness of CLP's community initiatives.
CLP has a standardised online reporting system for reviewing and reporting its community initiatives. The system is designed to enhance the overall effectiveness and efficiency of these initiatives by aggregating data on themes, partners, spending, beneficiaries, volunteer hours and impacts.
Year in reviewCLP Power launched a series of community support programmes in 2021, offering community funding of more than HK$160 million.
GRI reference: 201-1, 203-1, 203-2
After a record year of charitable giving during the first year of the COVID-19 pandemic (2020) and a stronger focus on community support programmes, the number of direct donations to charitable and other purposes decreased from HK$27 million in 2020 to HK$15 million in 2021. However, CLP recognises the adverse impacts of the pandemic continued to affect communities. Hence many of the assistance and relief programmes launched in 2020 were extended and new ones initiated.
In respect of the four pillars under the CLP Group Community Initiatives, Sponsorship and Donation Policy – Community Wellbeing, Environment, Education and Development, and Arts and Culture – community spending remained focused upon environmental topics. In addition, the focus on youth across all four pillars continued. Select case studies are featured in this section to showcase these programmes.
In 2021, CLP’s community programmes have directly benefitted more than 1,580,000 people, an increase from more than 918,000 in 2020. This year, the community wellbeing pillar accounted for 63% of direct beneficiaries. The CLP Retail and Catering Coupons Programme was a major programme during the year, and had an extensive reach across the Hong Kong community.
2021 2020 2019 2018 2017
Direct beneficiaries 1,580,000+ 918,000+ 615,000+ 730,000+ 439,000+
Organisations benefitted1 232 263 401 434 451
1 Organisations benefitted include professional bodies, academic institutes, NGOs and community groups.
Beneficiaries by theme
Of the more than 1,580,000 beneficiaries in 2021, 63% benefitted from CLP's community wellbeing initiatives. The significant increase in beneficiaries resulted thanks to CLP’s Retail and Catering Coupons Programme.
2021
Environment: 23.9%Education andDevelopment: 13%CommunityWellbeing: 63%Arts and Culture: 0.1%
2020¹
Environment: 8.3%Education andDevelopment: 26.5%CommunityWellbeing: 65%Arts and Culture: 0.2%
1 2020 data has been restated to show one decimal point.
CLP Holdings 2021 Sustainability Report | 108

Welcome About this Report Materiality Assessment Standard ESG disclosures
Corporate governance
Safety Environment and climate change
Asset management
Supply chain Community People Customers Key performance metrics
As pandemic restrictions were eased in certain regions, the number of volunteer hours contributed increased significantly in 2021, though the number of community programmes implemented was fewer. The amount donated by CLP for charitable and other community purposes decreased to HKD$15 million. Community spending by theme and geography is summarised in the charts below.
2021 2020 2019 2018 2017
Amount donated for charitable and other purposes (HK$M)1 15.09 27.00 20.98 18.31 14.47
Volunteer hours (hours)1 16,541 10,973 20,015 23,661 19,945
Programmes implemented (number) 443 468 663 695 647
1 Numbers have been subject to rounding.
Community spending by theme
The largest percentage of community spending was directed to environment initiatives (47%), followed by community wellbeing initiatives (45%).
2021
Environment: 47%Education andDevelopment: 5%CommunityWellbeing: 45%Arts and Culture: 1%CommunityEngagement: 2%
2020
Environment: 57%Education andDevelopment: 11%CommunityWellbeing: 28%Arts and Culture: 2%CommunityEngagement: 2%
Community spending by region
The largest percentage of community spending was directed to Hong Kong (91%).
2021
Hong Kong: 91%MainlandChina: 1%India: 6%Australia: 2%
2020
Hong Kong: 84%MainlandChina: 2%India: 9%Australia: 5%
Since its launch in 2018, the Workplace Giving programme of EnergyAustralia has received strong support from the majority of employees, who continue to donate up to 1% of their salaries to charity partners. EnergyAustralia reached its first A$1 million donations in May 2021 within the first three years of the programme, faster than any Australian business. The programme was recognised at Workplace Giving Australia’s 2021 awards for excellence, taking gold for best overall program (large organisation) as well as the gold award for best innovation. More information about the achievements can be found here.
Find out more on local community initiatives at EnergyAustralia
Read more on each business unit's community programmes in the Annual Report
CLP Holdings 2021 Sustainability Report | 109

Welcome About this Report Materiality Assessment Standard ESG disclosures
Corporate governance
Safety Environment and climate change
Asset management
Supply chain Community People Customers Key performance metrics
CASE STUDY
All round community support during the pandemic
The COVID-19 pandemic continues to adversely affect different sectors of society. CLP Power rolled out a range of targeted initiatives to address the needs of the communities of Hong Kong.Although schools have resumed face-to-face classes, a combination of that and e-learning has become a new normal as the COVID-19 pandemic continues to disrupt normal life. This has been a challenge for less well-off families unable to afford online learning equipment for their children or lacking the computer skills to support them.
To address this digital divide, CLP Power collected 100 second-hand computer notebooks in good condition and donated them to underprivileged families through the Hong Kong Single Parents Association and the Hong Kong Computer Society. CLP volunteers also provided computer training for parents and children caught on the wrong side of the digital divide.
Ms Zeng Xu-yun (middle) and her child are delighted to receive a computer donated by CLP Power. Ms Zeng said she appreciated the guidance of CLP volunteers at a workshop which has given her the confidence to play a part in her child’s e-learning.
Beyond donating used laptops to underprivileged families, more than 2,300 anti-virus goody bags were distributed to underprivileged people and virtual visits to seniors in elderly homes and day care centres were arranged. A food drive was also held across various CLP premises. Around 990 kg of food was collected by CLP volunteers in five days, equivalent to 2,367 meals, and donated to a local food bank for distribution to those in need. These initiatives are a continuation of CLP volunteers' pandemic support since 2020. CLP Power won four awards in the Hong Kong Construction Industry Volunteer Award Scheme, recognising CLP Power’s initiatives in caring for the community using technology and creativity during the pandemic.
Due to a surge of COVID-19 infections at construction sites in early 2021, CLP donated 10,000 bottles of hand sanitiser to frontline workers through a community organisation that serves labourers of public utilities.
Furthermore, to support Hong Kong households and businesses struggling under the pandemic, CLP Power dedicated more than $80 million from the CLP Community Energy Saving Fund for a six-month CLP Retail and Catering Coupons programme. Coupons were given to each of the nearly 800,000 households, including residential customers with low electricity consumption, elderly customers who are qualified for concessionary tariffs, and 10,000 tenants of subdivided units. The coupons could be used in more than 2,800 participating outlets during the six-month period. The programme received a very positive response and will be relaunched in 2022.
CLP also recognises vaccination as an effective means to protect the community and a vital tool to end the pandemic. In order to encourage more Hong Kong residents to get vaccinated against COVID-19, CLP sponsored vaccination lucky draws hosted by the Hong Kong General Chamber of Commerce and The Chinese Manufacturers Association, and donated over HK$0.8 million to charities for the vaccinations received by Hong Kong-based employees and their family members.
CLP Holdings 2021 Sustainability Report | 110
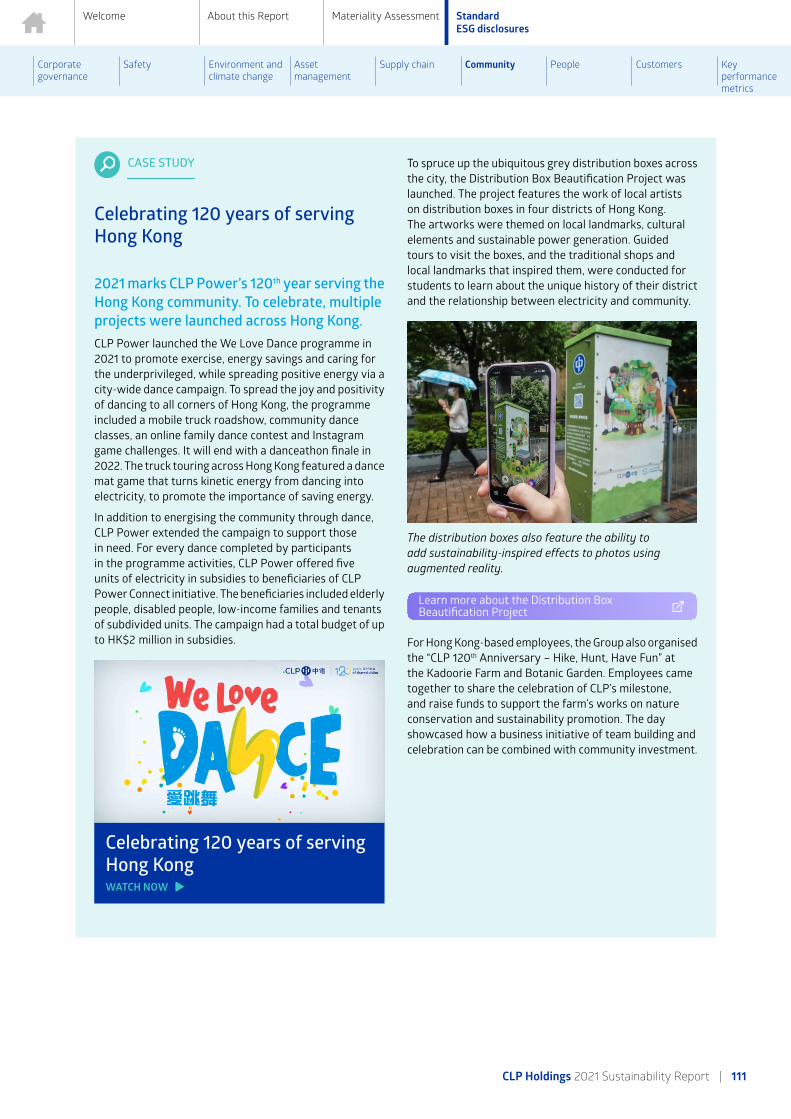
Welcome About this Report Materiality Assessment Standard ESG disclosures
Corporate governance
Safety Environment and climate change
Asset management
Supply chain Community People Customers Key performance metrics
CASE STUDY
Celebrating 120 years of serving Hong Kong
2021 marks CLP Power’s 120th year serving the Hong Kong community. To celebrate, multiple projects were launched across Hong Kong.CLP Power launched the We Love Dance programme in 2021 to promote exercise, energy savings and caring for the underprivileged, while spreading positive energy via a city-wide dance campaign. To spread the joy and positivity of dancing to all corners of Hong Kong, the programme included a mobile truck roadshow, community dance classes, an online family dance contest and Instagram game challenges. It will end with a danceathon finale in 2022. The truck touring across Hong Kong featured a dance mat game that turns kinetic energy from dancing into electricity, to promote the importance of saving energy.
In addition to energising the community through dance, CLP Power extended the campaign to support those in need. For every dance completed by participants in the programme activities, CLP Power offered five units of electricity in subsidies to beneficiaries of CLP Power Connect initiative. The beneficiaries included elderly people, disabled people, low-income families and tenants of subdivided units. The campaign had a total budget of up to HK$2 million in subsidies.
Celebrating 120 years of serving Hong KongWATCH NOW
To spruce up the ubiquitous grey distribution boxes across the city, the Distribution Box Beautification Project was launched. The project features the work of local artists on distribution boxes in four districts of Hong Kong. The artworks were themed on local landmarks, cultural elements and sustainable power generation. Guided tours to visit the boxes, and the traditional shops and local landmarks that inspired them, were conducted for students to learn about the unique history of their district and the relationship between electricity and community.
The distribution boxes also feature the ability to add sustainability-inspired effects to photos using augmented reality.
Learn more about the Distribution Box Beautification Project
For Hong Kong-based employees, the Group also organised the “CLP 120th Anniversary – Hike, Hunt, Have Fun” at the Kadoorie Farm and Botanic Garden. Employees came together to share the celebration of CLP’s milestone, and raise funds to support the farm’s works on nature conservation and sustainability promotion. The day showcased how a business initiative of team building and celebration can be combined with community investment.
CLP Holdings 2021 Sustainability Report | 111

Welcome About this Report Materiality Assessment Standard ESG disclosures
Corporate governance
Safety Environment and climate change
Asset management
Supply chain Community People Customers Key performance metrics
CASE STUDY
Providing opportunities to young people
Fresh graduates and career starters face many challenges nowadays, including economic downturns resulting from the pandemic. Across its business areas, CLP is keeping up its efforts to address the needs of local youth and give support in collaboration with various partners.In Hong Kong, Vocational and Professional Education and Training (VPET) plays a vital role in broadening the learning opportunities of school leavers and in-service personnel. In collaboration with the Vocational Training Council (VTC), in 2020 CLP Power launched the CLP Award for VPET Students. The award assists VPET-enrolled students with financial needs to allow them to continue their studies. The VPET programmes offer higher diploma training in electrical engineering, mechanical engineering, environmental engineering, computer and electronic engineering, and environmental protection and management.
A member of CLP’s Graduate Trainee Programme in training to become a power engineer.
On a yearly basis, the CLP Community Energy Saving Fund (CESF) will allocate HK$1.5 million to the award, providing a subsidy of HK$20,000 to each eligible student
and benefitting a total of 75 students in each cohort. Awardees also have opportunities to join CLP’s seminars and the summer internship programme to gain a deeper understanding of careers in electricity, engineering and environment. The award not only provides training opportunities to these students in the energy sector, but also helps nurture a new generation of talent for Hong Kong's power engineering industry.
In 2021, CLP Power extended its Graduate Internship Programme to a second year, offering internships to recent university graduates for a 12-month period. The programme covers a wide range of projects suitable for university graduates from different disciplines, such as business, engineering, environmental affairs and information technology. In 2021, 56 graduate interns joined CLP in Hong Kong to gain work experience.
Providing opportunities to young peopleWATCH NOW
In Mainland China, CLP's youth initiatives included:
• Supporting 812 students from 34 schools under the CLP Support-a-Student Programme.
• Funding to upgrade facilities at three schools in Sichuan with more than 800 students benefitting from the CLP Support-a-School Programme.
• The launch of the Guangxi Ethnic Minority Community Project to improve the study environment and school facilities for youngsters from ethnic minorities, and also to equip local women from ethnic minorities with skillsets to bring sustainable income to their families.
CLP Holdings 2021 Sustainability Report | 112

Welcome About this Report Materiality Assessment Standard ESG disclosures
Corporate governance
Safety Environment and climate change
Asset management
Supply chain Community People Customers Key performance metrics
CASE STUDY
All-in-one ecosystem solution for smart elderly homes
There is a need for elderly home operators to reduce repetitive manual work and enhance energy saving while providing better quality of life for their elderly residents.
In view of this, CLP Power took a proactive role to work with stakeholders to explore solutions. The result was an all-in-one elderly home management system integrating six smart functions: Smart Energy Management, Smart Cooking, Smart Environment, Smart Health, Smart Entertainment, and Smart Safety. Forward Living, a newly-built private elderly home, is currently piloting the system.
One-stop ecosystem solutions for elderly homesWATCH NOW
CLP Holdings 2021 Sustainability Report | 113

Welcome About this Report Materiality Assessment Standard ESG disclosures
Corporate governance
Safety Environment and climate change
Asset management
Supply chain Community People Customers Key performance metrics
CASE STUDY
Incorporating the art of Traditional Owners at EnergyAustralia’s new headquarters
EnergyAustralia’s new headquarters at Two Melbourne Quarter (2MQ), in the heart of the city, boasts the latest technology and sustainable, cutting-edge design. Though it is not all about the new and futuristic. The office also respects the past and present Traditional Owners of the land it occupies, the Wurundjeri Woi-Wurrung peoples of the Kulin nation.EnergyAustralia’s main reception area, on level 19, features the embossed word ‘Wominjeka’ which means ‘Welcome’ in the Wurundjeri and Dja Dja Wurrung languages of Melbourne/Naarm and central Victoria. The centrepiece of the new headquarters is the artwork titled Wominjeka Wurundjeri-al Biik-u (Welcome to Wurundjeri Country) on the office’s hub floor, created by artist Mandy Nicholson, a Wurundjeri, Dja Dja Wurrung and Ngurai Illam Wurrung woman.
“The work represents the six layers of Wurundjeri country: Dharangalk Biik (Cosmos), Wurru wurru Biik (Sky Country), Murnmut Biik (Wind Country), Baanj Biik (Water Country), Biik-dui (On Country), and Biik-ut (Below Country),” said Mandy. “Another way to keep our culture alive is through art and raising the awareness that our connection to country has never faded.”
Consultation with Traditional Owners early in the design process of the headquarters has resulted in an interior that has culture at the forefront for all to see and learn from. The consulted elders, Aunty Gail Smith and Aunty Julieanne Axford, are passionate about their heritage and proud to share their wealth of knowledge.
Social Performance Lead at EnergyAustralia, Jade Torcasio said, “We wanted to speak with Traditional Owners in
the very early stages of this project and explain our plans, and to listen to Traditional Owners on their own cultures, stories and aspirations. The outcome is a mutual agreement on how we recognise and show respect to their cultures and continue their work in keeping it alive by incorporating it into the way we work.”
The initiative is part of EnergyAustralia’s commitment to increase engagement and participation with Aboriginal and Torres Strait Islander peoples, cultures and communities, in line with its Reconciliation Action Plan launched in 2017.
Visit here to find out more
Artist Mandy Nicholson working on the mural in its early stages.
CLP Holdings 2021 Sustainability Report | 114

Welcome About this Report Materiality Assessment Standard ESG disclosures
Corporate governance
Safety Environment and climate change
Asset management
Supply chain Community People Customers Key performance metrics
Community dataContributions to public policies
Contributions to public policies
Types of organisations (in HK$M) 2021 2020 2019 2018 2017
Lobbying, interest representation or similar 0 0 0 N/A N/A
Local, regional or national political campaigns, organisations or candidates 0 0 0 N/A N/A
Trade associations or tax-exempt groups (e.g. think tanks)1 14.12 8.90 8.04 N/A N/A
Others (e.g. spending related to ballot measures or referendums) 0 0 0 N/A N/A
1 Includes contributions to professional organisations that seek to influence policies in the form of membership, donation or sponsorship.
Community investment
Programmes 2021 2020 2019 2018 2017
Community programmes implemented (number) 443 468 663 695 647
Spending 2021 2020 2019 2018 2017
Community spending by theme (%)1
Education and Development 5 11 18 19 13
Community Wellbeing 45 28 9 22 23
Environment 47 57 68 50 41
Arts and Culture 1 2 2 3 9
Community Engagement 2 2 3 6 14
Community spending by region (%)1
Hong Kong 91 84 81 77 81
Mainland China 1 2 1 1 2
Australia 2 5 10 14 9
India 6 9 8 8 8
1 Numbers have been subject to rounding. Any discrepancies between the total shown and the sum of the amounts listed are due to rounding.
Donations 2021 2020 2019 2018 2017
Amount donated for charitable and other purposes (HK$M)1 15.09 27.00 20.98 18.31 14.47
1 Numbers have been subject to rounding.
Time and expertise contributed 2021 2020 2019 2018 2017
Volunteer hours from CLP staff and family members (hours)1 16,541 10,973 20,015 23,661 19,945
Skill-based (%)2,3 0.4 0.8 0.5 2.4 3.9
Non skill-based (%)2,4 99.6 99.2 0.5 97.6 96.1
1 Numbers have been subject to rounding.2 Numbers have been subject to rounding. 2017-2020 data was restated to show one decimal place. Any discrepancies between the total shown and the sum of
the amounts listed are due to rounding.3 Refers to volunteering work that requires electrical engineering skills or licenses.4 Refers to hands-on, generic services that do not require professional electrical engineering skills or licenses.
CLP Holdings 2021 Sustainability Report | 115

Welcome About this Report Materiality Assessment Standard ESG disclosures
Corporate governance
Safety Environment and climate change
Asset management
Supply chain Community People Customers Key performance metrics
Beneficiaries 2021 2020 2019 2018 2017
Beneficiaries (number)
Direct beneficiaries 1,580,000+ 918,000+ 615,000+ 730,000+ 439,000+
Organisations benefitted1 232 263 401 434 451
Beneficiaries by theme (%)2
Education and Development 13.0 26.5 63.1 68.6 42.5
Community Wellbeing 63.0 65.0 20.3 20.3 35.4
Environment 23.9 8.3 16.1 10.4 20.5
Arts and Culture 0.1 0.2 0.5 0.7 1.6
1 Includes professional bodies, academic institutes, NGOs and community groups.2 Numbers have been subject to rounding. 2017-2020 data was restated to show one decimal place. Any discrepancies between the total shown and the sum of
the amounts listed are due to rounding.
CLP Holdings 2021 Sustainability Report | 116

People
Welcome About this Report Materiality Assessment Standard ESG disclosures
Corporate governance
Safety Environment and climate change
Asset management
Supply chain Community People Customers Key performance metrics
OverviewCLP’s almost 18,000 employees and contractors contribute their energy, talent and shared values to customers, investors and stakeholders every day. CLP has long recognised that caring for people is integral to its success.
CLP strives to act as a responsible employer, meeting the expectations of the people that work for it – directly or indirectly – and the wider community. This means providing people with fair and decent work; safe, healthy, and productive work environments; long-term work; and support to achieve their full potential. It also means developing young people and ensuring everyone who works at CLP is treated fairly, with respect.
In transitioning to net-zero and taking advantage of the prospects that spring from the greater integration of Hong Kong into the Greater Bay Area, CLP will create
new job opportunities directly and throughout its value chain, delivering economic value to communities across Asia Pacific. CLP also seeks to address broader social issues and create social value by fostering diversity and inclusion, promoting fair and ethical work practices, and strengthening employees’ wellbeing and resilience to enable them to thrive in the changes brought by energy transition.
Key stakeholders• Employees, Community, Suppliers
Related material topics• Fostering agility, diversity and inclusion
• Attracting and retaining future talent
• Aligning business activities with community, employee, and customer expectations
Workforce size and mixCLP engaged close to 18,000 employees and contractors on a full-time equivalent basis at the end of 2021.
GRI reference: 2-7, 2-8
The number of total employees rose, primarily due to recovery of activity in the second year of the pandemic. Utilisation of service contractors was slightly higher than in 2020, primarily reflecting skilled jobs created in Hong Kong and Mainland China to support decarbonisation projects, and a planned major overhaul of the Jhajjar Power Station in India.
To support growth, CLPe Solutions' new energy business in Hong Kong implemented a programme to offer permanent positions with enhanced pay and benefits to selected fixed-term contract staff, and to enhance pay and benefits for remaining contract staff. CLP Power in Hong Kong also offered more permanent roles to selected labour supply workers following a strategic review of the use of labour hire.
CLP Holdings 2021 Sustainability Report | 117

Welcome About this Report Materiality Assessment Standard ESG disclosures
Corporate governance
Safety Environment and climate change
Asset management
Supply chain Community People Customers Key performance metrics
Employees and contractors by regionEmployees Contractors Total
Average FTE
(a)Permanent
%Fixed-term contract %
Labour supply
(b)
Service contractor
(c)Contractors
sub-total
Total workforce(a)+(b)+(c)
Contractors in total
workforce %
Hong Kong 4,704.8 83.5 16.5 1,153.5 4,049.3 5,202.8 9,907.6 52.5%
Mainland China 620.0 75.6 24.4 23.5 552.5 576.0 1,196.0 48.2%
Australia 2,281.4 95.1 4.9 101.1 1,266.9 1,368.0 3,649.4 37.5%
India 430.9 97.4 2.6 51.8 2,712.8 2,764.6 3,195.5 86.5%
Group total1 8,037.3 87.0 13.0 1,329.9 8,581.5 9,911.3 17,948.6 55.2%
1 Numbers have been subject to rounding. Any discrepancies between the total shown and the sum of the amounts listed are due to rounding.
Fair and ethical work practicesManagement approachCore to the people agenda, and to delivering CLP’s strategy, is ensuring that the Group complies with all local laws and regulations and demonstrates respect for all its people, together with values-based management in addressing broader social issues.
GRI reference: 2-23, 2-25, 2-30, 401-2, 402-1, 407-1, 408-1, 409-1
Standards and proceduresCLP’s human resources policies and procedures are intended to ensure compliance with all local laws and regulations in relation to compensation and dismissal, recruitment and promotion, working hours, rest periods, equal opportunity, diversity, non-discrimination and harassment, and those covering benefits and welfare in the markets in which it operates. CLP takes immediate action to investigate and address any suspected breaches or issues that are brought to its attention.
Beyond compliance, CLP recognises its responsibility to respect human rights at work, as laid out in international principles, standards, and laws. CLP is a signatory of the World Business Council for Sustainable Development’s (WBCSD) Call to Action for Business Leadership on Human Rights, and of the Good Employer Charter established by the Labour Department of Hong Kong, pledging to be an employee-oriented employer implementing good human resource management practices.
Human rights and labour standards
In addition to local legal compliance, CLP respects internationally recognised human rights relevant to its operations and requires its business partners and suppliers to do the same. The commitment to upholding human rights is outlined in CLP’s Group Labour Standards, which reference the United Nations Guiding Principles on Business and Human Rights and other international standards and set company-wide minimum standards on critical working conditions and the basic rights of employees in the
workplace. CLP’s commitment is also integrated in its Value Framework and Responsible Procurement Policy Statement. EnergyAustralia has a Supplier Code of Conduct and, from 2021, commenced reporting annually on the risks of modern slavery in its operations and supply chains, as well as actions taken to address those risks.
Discrimination and Harassment
CLP aims to provide work environments that are free of harassment or discrimination on the basis of gender, physical or mental state, race, nationality, religion, age, family status or sexual orientation; or any other attribute recognised by the laws of the country in which the Company operates.
Use of temporary and contractor labour
CLP uses temporary labour for work that is time-bound or during peak activities and engages labour employed by third parties for non-core work and / or work requiring specialist skills. CLP is committed to taking a responsible approach to managing the costs and risks of its contingent workforce. This includes considering whether there is an optimal balance between the insourcing and outsourcing of capabilities and ensuring that the working hours and remuneration of workers employed by contractors are fair and reasonable.
Fair wages
CLP complies fully with any local legal requirements with respect to minimum wage, and in practice, its remuneration and benefits for permanent staff often significantly exceed local legal requirements. It is not Group policy or market practice to provide the same employment benefits to temporary staff as for regular permanent staff, however benefits for temporary staff are competitive with local market practice and meet or exceed local legal requirements. CLP monitors pay carefully to ensure that it is competitive and rewards employees for individual and company performance. Core employee benefits are reviewed regularly to ensure they are fit for purpose and sustainable.
CLP Holdings 2021 Sustainability Report | 118

Welcome About this Report Materiality Assessment Standard ESG disclosures
Corporate governance
Safety Environment and climate change
Asset management
Supply chain Community People Customers Key performance metrics
Supporting people to speak up and acting on reports of wrongdoing
CLP’s businesses each have an employee grievance procedure in place that reflects the CLP Value Framework and any applicable local legal requirements. In the case of any employee having concerns, established procedures are followed to address grievances. These procedures ensure fairness and independence in the investigation process, and respect for the confidentiality of the parties involved. CLP’s Whistleblowing Policy is publicly accessible, enabling employees and related third parties to raise concerns about any irregularity through a confidential channel.
Monitoring and follow-upCLP’s Value Framework and Group Labour Standards set a common framework of principles. Detailed policies in each country are fully compliant with local legislation. Regular refresher training is organised for employees on key topics such as refreshers on CLP's Code of Conduct and business practice review, the harassment-free workplace policy, and others.
CLP prohibits the employment of child labour or forced labour in any of its operations. The steps it takes to prevent such practices includes stringent checking and control procedures in selection and on-boarding processes.
Each year, CLP uses independent external consultants to benchmark remuneration and benefits with relevant recruitment markets. Decisions on remuneration are subject to the corporate governance process and the approval of the Board Human Resources & Remuneration Committee to ensure a balance between the interests of both employees and shareholders as key stakeholders.
CLP carries out independent audits of its human resources policies and procedures to proactively identify any risks of legal non-compliance and take remedial action if such risks are identified. Immediate action is taken to investigate and address any suspected breaches or issues that are brought to the Company’s attention.
Read more on breaches of the CLP Code of Conduct
Year in reviewCLP furthered its efforts in working ethically and fairly, launching the Group Labour Standards, and receiving continued external recognition of its wages and retirement policies and practices.
GRI reference: 201-3
CLP’s Group Labour Standards were launched in early 2021. The Standards outline CLP’s commitment to international principles and conventions and provide more detail on how CLP delivers on these commitments through company-wide minimum standards on critical working conditions including fair and decent work and working hours, and the basic rights of employees in the workplace. Following launch, the standards were embedded into procurement requirements for labour hire suppliers in Hong Kong and tracking and monitoring of temporary manpower supply resources has been strengthened.
CLP did not identify any operation or supplier as having a significant risk of child labour, young workers exposed to hazardous work or forced or compulsory labour in 2021. There was no breach of laws and regulations in relation to child and forced labour across CLP in 2021. Additionally, no Group operation was identified in which the right to exercise freedom of association and collective bargaining was violated or at significant risk.
The Fair Wage Network awarded Fair Wage Certificates to CLP’s Hong Kong businesses in recognition of their wage policies, practices and progress made in the two years since the last award with respect to the employment status of technician trainees and pay and grade progression opportunities for technical staff.
Recognising its efforts to provide sustainable retirement benefits, CLP again received the Good Mandatory Provident Fund (MPF) Employer Award for the seventh consecutive year, e-Contribution Awards, and won the Best All-round MPF Employer Award from the MPF Schemes Authority in Hong Kong. CLP also received an award for the Best ORSO (Occupational Retirement) Scheme in the 2021 Best of the Best Country Awards granted by Asia Asset Management.
CLP Holdings 2021 Sustainability Report | 119

Welcome About this Report Materiality Assessment Standard ESG disclosures
Corporate governance
Safety Environment and climate change
Asset management
Supply chain Community People Customers Key performance metrics
CASE STUDY
Reinforcing labour standards and employment practices with suppliers
CLP continued its efforts in embedding respect for human rights in the workplace by launching its Group Labour Standards in 2021. The Standards apply to all aspects of business operations and are integrated across Group and local policies and processes.In preparing to implement the Standards in Hong Kong, CLP defined overtime work for emergency and non-emergency circumstances, enacted guidelines on rest breaks and work shifts, and implemented review mechanisms for
overtime work exceeding maximum working hours under exceptional situations (e.g., extreme weather conditions such as typhoons). Processes were implemented to improve record capture for both employees and labour hire staff. These are monitored continuously to avoid excessively long working hours and potential adverse impacts on employee health.
CLP is progressively introducing the Standards to Hong Kong suppliers providing contingent labour, with managed transition during the pandemic to ensure supplier sustainability. By the end of 2021, Standards had been embedded in over 30 supplier agreements and guidelines on monitoring working hours were extended to labour hires.
CLP conducts regular reviews on the use of contingent labour and processes to improve the record keeping of overtime work have also been implemented. These reviews and measures ensure CLP’s commitments are integrated into day-to-day operations.
CLP Holdings 2021 Sustainability Report | 120

Welcome About this Report Materiality Assessment Standard ESG disclosures
Corporate governance
Safety Environment and climate change
Asset management
Supply chain Community People Customers Key performance metrics
Talent and skills developmentManagement approachCLP’s ability to transition to a zero-carbon, digitally enabled future requires systematic organisation development and adoption of the capabilities required to compete effectively in key markets.
GRI reference: 404-2, 404-3
CLP has a comprehensive training and development framework in place, aligned to business objectives, to help people to perform competently in their current roles and prepare them for future business challenges and opportunities. CLP also invests in wider development for young people and to build future energy industry capability that is inclusive and accessible to all.
Standards and proceduresCLP’s strategic talent and leadership development approach seeks to attract, retain, and develop a diverse, multi-generational workforce, develop new skills, and share talent effectively across the portfolio of businesses. Internal development efforts are supplemented by external recruitment for new-to-CLP skills focused on innovation, digital and renewables capabilities.
Investing in youth and early careers
Addressing future skills needs, and ensuring adequate talent supply to the evolving energy industry, requires significant investment in promoting and encouraging young people to join CLP, and accelerating development in their early careers. CLP provides opportunities to young people in Hong Kong through mentoring programmes, partnerships with local and overseas institutions to offer work placements to secondary and tertiary-level students, internships for fresh graduates across a range of disciplines, technical apprenticeships and its Graduate Trainee Programme. The CLP Power Academy in Hong Kong offers programmes to provide an alternative to school leavers and working adults to pursue careers in the energy industry. CLP also participates in youth development schemes such as the Hong Kong SAR Government’s Greater Bay Area Youth Employment Scheme. In Mainland China, CLP supports local technicians and engineers to attain professional engineering qualifications.
Sustaining core skills and developing new skills for the future
Skills and safety training are provided to develop technical and functional competencies and behaviours. All CLP employees participate in an annual performance and development cycle. This provides ongoing feedback and coaching conversations, clarity in terms of expectations, understanding of how they contribute to CLP’s objectives, and support for individual development needs. Through this process, CLP also recognises and rewards individual performance and success. Employees are provided the
opportunity for continuous learning and skill-building via online and face-to-face learning resources and programmes and can access company support for employee-initiated self-development.
Developing leaders for a Utility of the Future
CLP's strategy requires a diverse leadership team, with the resilience, agility, stakeholder management and change leadership skills to position CLP for growth, and high-quality succession leadership roles. CLP remains committed to filling most leadership roles internally.
Strategic, general management and talent development programmes are used to develop future leaders, with programmes delivered internally (in Hong Kong through the CLP Learning Institute and Power Academy) and in partnership with leading academic institutions including the International Institute for Management Development (IMD), the Ivey Business School, Tsinghua School of Economics and Management, Chatham House and the École Polytechnique Fédérale de Lausanne (EPFL). Expert briefings and workshops are conducted on the latest global economic, political and technological trends including energy transition, digital disruption, wellbeing and resilience.
Monitoring and follow-upCLP conducts regular talent and capability reviews, underpinned by people analytics, focused on both general management and engineering streams. These reviews monitor and follow up on actions to address current and future gaps and opportunities, including the progress of development programmes, recruitment campaigns, initiatives to strengthen gender diversity and cross-business assignments. The effectiveness of this approach is measured against a range of key performance indicators, including retention of key talent, turnover, diversity and employee engagement measures, using developed people analytics tools. The Board Human Resources & Remuneration Committee reviews talent and capability progress annually.
Despite the challenges of recruitment and delivering training during the COVID-19 pandemic, CLP increased its investment in youth development, core skills training, leadership development programmes, as well as investing in the training systems and frameworks needed to become a Utility of the Future.
Find out how CLP resources for energy transition and growth
CLP Holdings 2021 Sustainability Report | 121

Welcome About this Report Materiality Assessment Standard ESG disclosures
Corporate governance
Safety Environment and climate change
Asset management
Supply chain Community People Customers Key performance metrics
Fostering diversity and inclusionManagement approachCLP believes that a diverse workforce and an inclusive culture support high performance and CLP’s ability to operate effectively in the many communities in which it operates. To this end, CLP has set targets to encourage more women into the workforce, and policies to support employees to balance work and home-life commitments.
Considering the nature of CLP’s business and the markets in which it operates, CLP has set addressing gender diversity as a Group-wide priority to ensure a sustainable workforce in the face of demographic trends, and to deliver a wider, positive social and economic contribution. Formal, aspirational Group-wide gender diversity targets have been set, reflecting UN Sustainable Development Goals:
• Women in Leadership target: To achieve gender balance in leadership positions by 2030 against a 2016 baseline of 22%;
• Women in Engineering target: For 30% of engineers to be female by 2030 compared to a 2016 baseline of 9%;
• Ensuring equal pay for work of equal value is maintained in all CLP Group businesses, that any gender pay equity gap is eliminated, and that CLP meets all relevant local compliance and disclosure standards.
Standards and proceduresCLP is a signatory to the International Energy Agency’s "Equal by 30" initiative, a commitment by public and private sector organisations to work towards gender equality in the energy sector by 2030, and to the Women’s Empowerment Principles established by the UN Global Compact and UN Women in India. Local Diversity and Inclusion Councils operate in Hong Kong, India and Australia to drive the Company's efforts on diversity.
CLP’s human resources policies encourage the retention of employees through initiatives including flexible work arrangements, maternity leave, and other family-friendly policies and benefits. CLP’s recruitment processes are designed to be fair and non-discriminatory. In Hong Kong, this process follows the Equal Opportunities Commission Code of Practice, and includes the use of consistent selection criteria. In other parts of the Group, CLP complies with local legislation and codes of practice on recruitment. When conducting senior level searches, CLP also requires external recruitment firms to identify candidates with diverse backgrounds, in line with the Group's values.
Monitoring and follow-upGender progress is reviewed as part of regular general management and engineering talent reviews. The Board Human Resources & Remuneration Committee reviews progress against gender diversity targets annually. CLP also conducts regular reviews to identify any gender pay gaps and ensures equal pay for work of equal value.
Year in reviewManagement has continued to leverage a variety of targeted programmes and activities to drive improved outcomes in diversity and inclusion.
GRI reference: 202-1, 202-2, 405-2
Against the targets, Women in Leadership increased to 30.5% (2020: 27.3%), while Women in Engineering increased to 12.3% (2020: 11.5%). Female representation in the Hong Kong Engineering Graduate intake increased from 19% in 2020 to 30% in 2021. Most women hired had participated in either CLP’s Female Engineering Student Mentoring Programme or had received an Engineering Study Award to support their final-year studies. Additionally, the 2021 Student Mentoring Programme ran virtually with 36 students.
Focus on ensuring strong female participation in development programmes continued with women representing over 30% of participants in senior leadership programmes, and 40% of participants in mid-level programmes. CLP’s Group-wide Female Engineering Network Programme, aimed at developing early to mid-career engineers, also continued.
Independent gender pay equity analysis for Hong Kong payroll, based on UK disclosure requirements, continued to show a reverse gender pay gap for both hourly pay and bonuses, due to a higher proportion of women in professional and managerial roles. Additionally, CLP was recognised for its support to the Hong Kong Equal Opportunities Commission Racial Diversity and Inclusion Charter for Employers.
CLP Holdings 2021 Sustainability Report | 122

Welcome About this Report Materiality Assessment Standard ESG disclosures
Corporate governance
Safety Environment and climate change
Asset management
Supply chain Community People Customers Key performance metrics
Across the Group, EnergyAustralia refreshed and relaunched its Diversity and Inclusion strategy aiming to build a more consistent and measured approach to embed diversity and inclusion. Its LGBTIQ+ community network Prism was recognised with Silver Status at the 2021 Australian Workplace Equality Index Awards. Organisational awareness and understanding of Aboriginal and Torres Strait Islander culture continued to be built through education and training events. Apraava Energy established a local Diversity and Inclusion Council to create a roadmap for its activities and to accelerate progress.
Female Representatives in CLP
% o
f fem
ales
Total employeesGroup Executive Committee (GEC)Women in LeadershipWomen in Engineering
2018 2019 2020 20210
10
20
30
40
2018 2019 2020 2021
Total employees 23.9% 26.0% 26.0% 26.3%
Group Executive Committee (GEC) 28.6% 35.7% 35.7% 30.8%
Women in Leadership 22.9% 24.2% 27.3% 30.5%
Women in Engineering 10.9% 11.4% 11.5% 12.3%
CLP Holdings 2021 Sustainability Report | 123

Welcome About this Report Materiality Assessment Standard ESG disclosures
Corporate governance
Safety Environment and climate change
Asset management
Supply chain Community People Customers Key performance metrics
CASE STUDY
Strengthening diversity, equity and inclusion in Apraava Energy
Apraava Energy aspires to be a leader in diversity, equity and inclusion amongst energy companies in India. Over the years, measured steps have been taken to progress the diversity and inclusion agenda.Over the past 12 months, Apraava has strengthened its commitment, becoming a signatory of the Women’s Empowerment Principles, and constituting a local Diversity and Inclusion Council to accelerate progress. The Council
sponsored the creation of a Diversity and Inclusion roadmap intended to increase female representation across the business, drawing on employee feedback from surveys, focus group discussions and visioning exercises. Awareness sessions on unconscious bias were conducted, as well as an independent third-party assessment of pay equity and diversity and inclusion employment practices which reaffirmed that Apraava is well placed amongst its peers.
CLP Holdings 2021 Sustainability Report | 124
Welcome About this Report Materiality Assessment Standard ESG disclosures
Corporate governance
Safety Environment and climate change
Asset management
Supply chain Community People Customers Key performance metrics
Supporting employees to thrive in changeManagement approachCLP is committed to an engaged and high-performing workforce, and to supporting all its people to thrive in the changes brought by energy transition.
GRI reference: 401-2, 401-3, 404-2
This is achieved through a long-term focus on maintaining strong working relationships with employees and their representatives, providing flexible working arrangements and benefits to support employees through all life stages, strengthening their wellbeing and resilience, and providing support and reskilling to employees whose jobs are affected by the transition to net-zero or other business restructuring.
Standards and proceduresOffering flexible working
CLP aims to support employees through all life stages, from young people starting their careers to retirement. CLP recognises that people at different life stages may benefit from different working arrangements and promotes family-friendly leave policies and flexible working arrangements. CLP also offers a range of leave options to help its people achieve a good work-life balance, including parental and adoption leave, volunteering and study leave. In response to the COVID-19 pandemic, CLP has accelerated implementation of new ways for employees to connect virtually and perform their roles more flexibly, including flexible work policies and collaboration tools.
Investing in health, wellbeing, and strengthening resilience
CLP provides comprehensive support for physical, social, financial and emotional wellbeing and is working towards attaining ISO 45003:2021 certification for psychological health and safety at work from the International Organisation of Standardisation. Confidential employee assistance programmes are also offered to assist employees who may encounter work or personal issues and need professional support.
Keeping everyone informed and engaged
CLP’s employee relations approach focuses on establishing and maintaining strong working relationships with employees, being proactive in consulting on any workplace changes, and providing opportunities for employees to raise concerns. CLP employees have the right to join organisations and professional bodies of their choice. CLP respects and fully complies with all legal requirements with regards to union membership and collective bargaining. In Australia, CLP engages in collective bargaining with approximately 800 employees via certified enterprise bargaining agreements approved by the independent workplace relations tribunal, the Fair Work Commission. These agreements cover most terms and conditions of employment, including notice periods, provisions for consultation and dispute resolution.
Supporting employees and communities affected by energy transition or restructuring
Comprehensive support is provided to employees whose jobs are affected by business change or restructuring. This includes support tailored to individual needs, including training and skills development, career planning, assistance for redeployment and financial counselling. It also includes engaging actively with local stakeholders from employee representative organisations to local educational institutions to ensure that study opportunities are developed to help meet both the needs of its people, and the region’s new and emerging industries.
Monitoring and follow-upCLP uses independent external consultants to conduct regular employee engagement surveys to understand employees’ views. Surveys were conducted across its Hong Kong, Mainland China and EnergyAustralia workforces in 2020 with high response rates and improved employee engagement scores.
In Hong Kong, joint consultative committees have been established which act as an additional channel of communication between the Company and the employees’ selected representatives. Employee benefits are regularly benchmarked to ensure that appropriate support is provided.
Find out how CLP supports employees to thrive in change
CLP Holdings 2021 Sustainability Report | 125
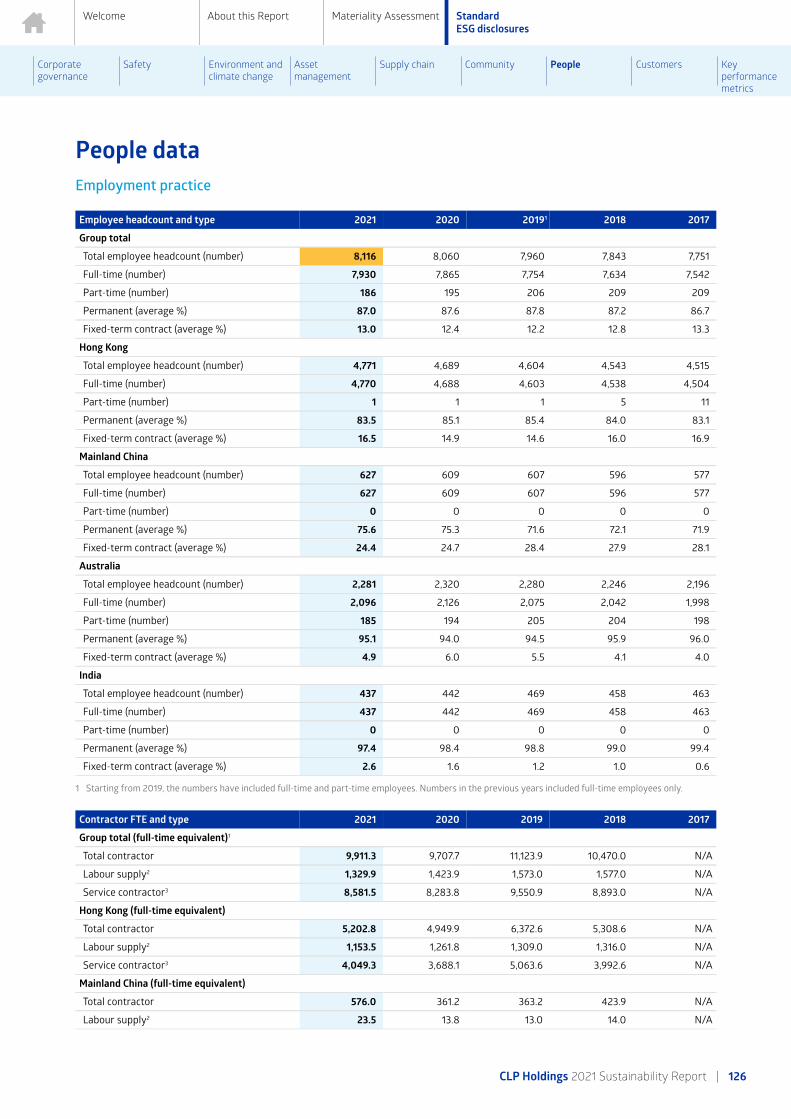
Welcome About this Report Materiality Assessment Standard ESG disclosures
Corporate governance
Safety Environment and climate change
Asset management
Supply chain Community People Customers Key performance metrics
People dataEmployment practice
Employee headcount and type 2021 2020 20191 2018 2017
Group total
Total employee headcount (number) 8,116 8,060 7,960 7,843 7,751
Full-time (number) 7,930 7,865 7,754 7,634 7,542
Part-time (number) 186 195 206 209 209
Permanent (average %) 87.0 87.6 87.8 87.2 86.7
Fixed-term contract (average %) 13.0 12.4 12.2 12.8 13.3
Hong Kong
Total employee headcount (number) 4,771 4,689 4,604 4,543 4,515
Full-time (number) 4,770 4,688 4,603 4,538 4,504
Part-time (number) 1 1 1 5 11
Permanent (average %) 83.5 85.1 85.4 84.0 83.1
Fixed-term contract (average %) 16.5 14.9 14.6 16.0 16.9
Mainland China
Total employee headcount (number) 627 609 607 596 577
Full-time (number) 627 609 607 596 577
Part-time (number) 0 0 0 0 0
Permanent (average %) 75.6 75.3 71.6 72.1 71.9
Fixed-term contract (average %) 24.4 24.7 28.4 27.9 28.1
Australia
Total employee headcount (number) 2,281 2,320 2,280 2,246 2,196
Full-time (number) 2,096 2,126 2,075 2,042 1,998
Part-time (number) 185 194 205 204 198
Permanent (average %) 95.1 94.0 94.5 95.9 96.0
Fixed-term contract (average %) 4.9 6.0 5.5 4.1 4.0
India
Total employee headcount (number) 437 442 469 458 463
Full-time (number) 437 442 469 458 463
Part-time (number) 0 0 0 0 0
Permanent (average %) 97.4 98.4 98.8 99.0 99.4
Fixed-term contract (average %) 2.6 1.6 1.2 1.0 0.6
1 Starting from 2019, the numbers have included full-time and part-time employees. Numbers in the previous years included full-time employees only.
Contractor FTE and type 2021 2020 2019 2018 2017
Group total (full-time equivalent)1
Total contractor 9,911.3 9,707.7 11,123.9 10,470.0 N/A
Labour supply2 1,329.9 1,423.9 1,573.0 1,577.0 N/A
Service contractor3 8,581.5 8,283.8 9,550.9 8,893.0 N/A
Hong Kong (full-time equivalent)
Total contractor 5,202.8 4,949.9 6,372.6 5,308.6 N/A
Labour supply2 1,153.5 1,261.8 1,309.0 1,316.0 N/A
Service contractor3 4,049.3 3,688.1 5,063.6 3,992.6 N/A
Mainland China (full-time equivalent)
Total contractor 576.0 361.2 363.2 423.9 N/A
Labour supply2 23.5 13.8 13.0 14.0 N/A
CLP Holdings 2021 Sustainability Report | 126

Welcome About this Report Materiality Assessment Standard ESG disclosures
Corporate governance
Safety Environment and climate change
Asset management
Supply chain Community People Customers Key performance metrics
Contractor FTE and type 2021 2020 2019 2018 2017
Service contractor3 552.5 347.4 350.2 409.9 N/A
Australia (full-time equivalent)
Total contractor 1,368.0 1,926.5 1,856.2 1,785.0 N/A
Labour supply2 101.1 83.1 172.5 167.0 N/A
Service contractor3 1,266.9 1,843.4 1,683.7 1,618.0 N/A
India (full-time equivalent)
Total contractor 2,764.6 2,470.1 2,531.9 2,952.5 N/A
Labour supply2 51.8 65.2 78.5 80.0 N/A
Service contractor3 2,712.8 2,404.9 2,453.4 2,872.5 N/A
1 Numbers have been subject to rounding. Any discrepancies between the total shown and the sum of the amounts listed are due to rounding.2 Labour supply refers to manpower supplied by contractor companies under labour supply agreements. Reporting is based on quarterly averages.3 Estimated service contractor full-time equivalent (FTE) is calculated based on the number of manhours incurred and region-specific average weekly working
hours since 2019. Numbers in 2018 are re-stated to reflect region-specific working hours instead of weekly hours of 48 for all regions.
Voluntary staff turnover rate 2021 2020 20191 2018 2017
Hong Kong (%)2,3 4.6 3.1 2.4 2.3 1.9
By age group
Below 30 7.4 6.3 4.4 5.9 2.3
30-39 5.6 4.3 4.9 4.3 3.2
40-49 5.2 2.6 1.9 1.7 2.0
50 and above 3.0 1.8 1.1 1.1 1.2
By gender
Male 4.4 2.5 1.8 1.7 1.6
Female 5.4 5.4 4.9 5.0 3.3
Mainland China (%)2,3 2.3 1.3 2.0 4.7 3.0
By age group
Below 30 6.7 1.4 8.4 16.4 8.8
30-39 1.9 2.9 1.9 5.2 3.3
40-49 2.5 0.5 0.5 1.5 1.5
50 and above 0.0 0.0 0.0 0.0 0.0
By gender
Male 2.1 1.4 2.4 4.1 2.4
Female 2.9 0.9 0.0 7.5 5.3
Australia (%)2,3 16.1 7.7 12.9 13.6 13.8
By age group
Below 30 25.5 13.6 19.3 18.6 22.7
30-39 19.0 7.4 14.2 15.2 13.0
40-49 11.2 6.2 11.5 10.5 10.6
50 and above 13.1 7.1 8.3 10.6 10.5
By gender
Male 16.4 7.1 12.6 12.3 12.9
Female 15.7 8.5 13.4 15.6 15.1
India (%)2,3 6.9 4.7 6.6 5.6 3.5
By age group
Below 30 12.5 5.6 7.4 6.4 4.6
30-39 7.5 5.7 9.3 7.2 3.4
40-49 4.8 4.7 2.9 2.9 3.0
50 and above 5.1 0.0 0.0 2.5 2.9
CLP Holdings 2021 Sustainability Report | 127

Welcome About this Report Materiality Assessment Standard ESG disclosures
Corporate governance
Safety Environment and climate change
Asset management
Supply chain Community People Customers Key performance metrics
Voluntary staff turnover rate 2021 2020 20191 2018 2017
By gender
Male 6.6 4.3 6.4 5.6 3.2
Female 9.4 7.4 7.5 5.7 6.0
1 Starting from 2019, the numbers have included full-time and part-time employees. Numbers in the previous years included full-time employees only.2 Voluntary staff turnover refers to employees leaving the organisation voluntarily and does not include dismissal, retirement, company-initiated termination or
end of contract.3 Includes permanent employees except for Mainland China, which includes both permanent and fixed-term contract employees due to local
employment legislation.
New hire 2021 2020 20191 2018 2017
Group total (number) 1,029 711 857 965 835
By age group
Below 30 342 237 309 N/A N/A
30-39 402 241 300 N/A N/A
40-49 204 145 158 N/A N/A
50 and above 81 88 90 N/A N/A
By gender
Male 686 515 552 619 540
Female 343 196 305 346 295
Hong Kong (number) 524 408 348 307 292
By age group
Below 30 208 172 157 N/A N/A
30-39 187 125 121 N/A N/A
40-49 93 69 48 N/A N/A
50 and above 36 42 22 N/A N/A
By gender
Male 368 308 239 200 208
Female 156 100 109 107 84
Mainland China (number) 45 29 43 47 60
By age group
Below 30 24 10 16 N/A N/A
30-39 16 10 25 N/A N/A
40-49 4 8 2 N/A N/A
50 and above 1 1 0 N/A N/A
By gender
Male 37 25 36 41 49
Female 8 4 7 6 11
Australia (number) 433 255 423 582 435
By age group
Below 30 106 53 116 N/A N/A
30-39 182 93 138 N/A N/A
40-49 103 67 104 N/A N/A
50 and above 42 42 65 N/A N/A
By gender
Male 260 166 242 352 241
Female 173 89 181 230 194
CLP Holdings 2021 Sustainability Report | 128

Welcome About this Report Materiality Assessment Standard ESG disclosures
Corporate governance
Safety Environment and climate change
Asset management
Supply chain Community People Customers Key performance metrics
New hire 2021 2020 20191 2018 2017
India (number) 27 19 43 29 48
By age group
Below 30 4 2 20 N/A N/A
30-39 17 13 16 N/A N/A
40-49 4 1 4 N/A N/A
50 and above 2 3 3 N/A N/A
By gender
Male 21 16 35 26 42
Female 6 3 8 3 6
1 Starting from 2019, the numbers have included full-time and part-time employees. Numbers in the previous years included full-time employees only.
Employees eligible to retire within the next five years 2021 2020 20191 2018 2017
Group total (%)2 14.6 14.5 13.9 16.4 15.1
Hong Kong (%)2 20.1 20.4 19.5 20.0 18.6
Mainland China (%)2 15.1 13.4 14.5 13.2 10.6
Australia (%)2,3 6.6 5.7 5.4 12.8 12.2
India (%)2 5.0 5.1 4.8 4.0 2.4
1 Starting from 2019, the numbers have included full-time and part-time employees. Numbers in the previous years included full-time employees only.2 The percentages given refer to permanent employees within each region, who are eligible to retire within the next five years.3 There is no mandatory retirement age in Australia. Since 2019, the retirement age assumption has been adjusted from 60 to 65 to reflect local norms, which led
to a significantly lower percentage compared to previous years. Numbers in previous years adopting the adjusted retirement age for Australia are as follows: 2017-Australia: 4.8% / Group total: 12.9%; 2018-Australia: 4.6% / Group total: 14.0%.
Talent and skills for the future
Technical trainees intake 2021 2020 20191 2018 2017
Group total (number) 89 79 75 85 117
Male 71 68 64 67 89
Female 18 11 11 18 28
Hong Kong (number) 66 66 61 66 76
Male 52 58 51 50 63
Female 14 8 10 16 13
Mainland China (number) 0 0 4 8 7
Male 0 0 4 7 6
Female 0 0 0 1 1
Australia (number) 17 13 10 11 28
Male 16 10 9 10 17
Female 1 3 1 1 11
India (number) 6 0 0 0 6
Male 3 0 0 0 3
Female 3 0 0 0 3
1 Starting from 2019, the numbers have included full-time and part-time employees. Numbers in the previous years included full-time employees only.
Average training hours per employee 2021 2020 20191 2018 2017
Group total (hours) 51.6 42.5 40.1 46.1 46.9
By gender (hours)
Male 58.2 47.7 44.8 51.6 52.4
Female 33.3 27.6 26.8 28.5 29.5
By professional category (hours)
CLP Holdings 2021 Sustainability Report | 129
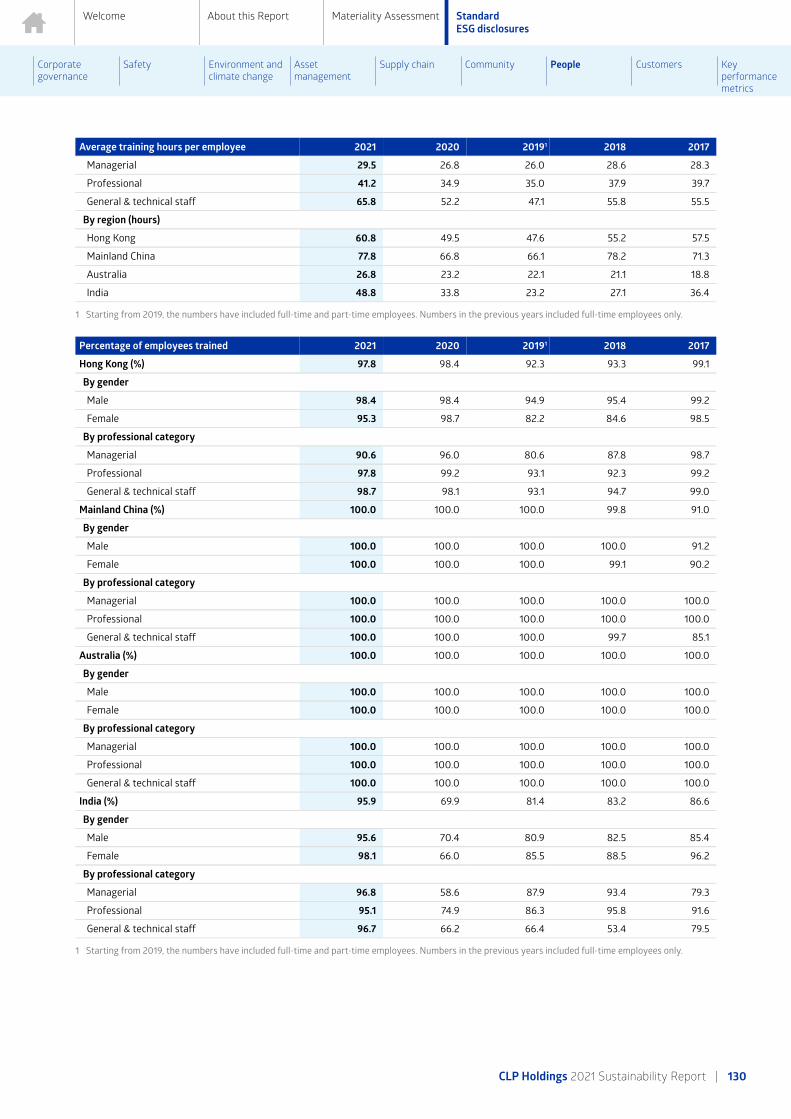
Welcome About this Report Materiality Assessment Standard ESG disclosures
Corporate governance
Safety Environment and climate change
Asset management
Supply chain Community People Customers Key performance metrics
Average training hours per employee 2021 2020 20191 2018 2017
Managerial 29.5 26.8 26.0 28.6 28.3
Professional 41.2 34.9 35.0 37.9 39.7
General & technical staff 65.8 52.2 47.1 55.8 55.5
By region (hours)
Hong Kong 60.8 49.5 47.6 55.2 57.5
Mainland China 77.8 66.8 66.1 78.2 71.3
Australia 26.8 23.2 22.1 21.1 18.8
India 48.8 33.8 23.2 27.1 36.4
1 Starting from 2019, the numbers have included full-time and part-time employees. Numbers in the previous years included full-time employees only.
Percentage of employees trained 2021 2020 20191 2018 2017
Hong Kong (%) 97.8 98.4 92.3 93.3 99.1
By gender
Male 98.4 98.4 94.9 95.4 99.2
Female 95.3 98.7 82.2 84.6 98.5
By professional category
Managerial 90.6 96.0 80.6 87.8 98.7
Professional 97.8 99.2 93.1 92.3 99.2
General & technical staff 98.7 98.1 93.1 94.7 99.0
Mainland China (%) 100.0 100.0 100.0 99.8 91.0
By gender
Male 100.0 100.0 100.0 100.0 91.2
Female 100.0 100.0 100.0 99.1 90.2
By professional category
Managerial 100.0 100.0 100.0 100.0 100.0
Professional 100.0 100.0 100.0 100.0 100.0
General & technical staff 100.0 100.0 100.0 99.7 85.1
Australia (%) 100.0 100.0 100.0 100.0 100.0
By gender
Male 100.0 100.0 100.0 100.0 100.0
Female 100.0 100.0 100.0 100.0 100.0
By professional category
Managerial 100.0 100.0 100.0 100.0 100.0
Professional 100.0 100.0 100.0 100.0 100.0
General & technical staff 100.0 100.0 100.0 100.0 100.0
India (%) 95.9 69.9 81.4 83.2 86.6
By gender
Male 95.6 70.4 80.9 82.5 85.4
Female 98.1 66.0 85.5 88.5 96.2
By professional category
Managerial 96.8 58.6 87.9 93.4 79.3
Professional 95.1 74.9 86.3 95.8 91.6
General & technical staff 96.7 66.2 66.4 53.4 79.5
1 Starting from 2019, the numbers have included full-time and part-time employees. Numbers in the previous years included full-time employees only.
CLP Holdings 2021 Sustainability Report | 130

Welcome About this Report Materiality Assessment Standard ESG disclosures
Corporate governance
Safety Environment and climate change
Asset management
Supply chain Community People Customers Key performance metrics
Diversity and inclusion
Gender distribution of Group Executive Committee (GEC) members 2021 2020 2019 2018 2017
Male (%)1 69.2 64.3 64.3 71.4 69.2
Female (%)1 30.8 35.7 35.7 28.6 30.8
1 Includes Executive Director (Chief Executive Officer).
Gender distribution of employees 2021 2020 20191 2018 2017
Group total (%)2
Male 73.7 74.0 74.0 76.1 76.2
Female 26.3 26.0 26.0 23.9 23.8
Hong Kong (%)
Male 78.3 79.3 79.4 80.1 81.0
Female 21.7 20.7 20.6 19.9 19.0
Mainland China (%)
Male 83.6 82.9 82.5 82.2 80.6
Female 16.4 17.1 17.5 17.8 19.4
Australia (%)2
Male 58.7 58.4 57.9 62.6 61.4
Female 41.3 41.6 42.1 37.4 38.6
India (%)
Male 87.6 88.0 88.3 88.6 88.8
Female 12.4 12.0 11.7 11.4 11.2
1 Starting from 2019, the numbers have included full-time and part-time employees. Numbers in the previous years included full-time employees only.2 Data of other gender identities is tracked. It is statistically insignificant and is not separately disclosed.
Gender distribution by region and professional category 2021 2020 20191 2018 2017
Hong Kong (%)
Managerial - male 71.1 74.4 75.7 75.6 74.5
Managerial - female 28.9 25.6 24.3 24.4 25.5
Professional - male 74.5 75.7 75.2 76.7 78.0
Professional - female 25.5 24.3 24.8 23.3 22.0
General & technical staff - male 83.1 83.3 83.5 83.5 83.9
General & technical staff - female 16.9 16.7 16.5 16.5 16.1
Mainland China (%)
Managerial - male 77.8 84.8 78.9 76.5 73.3
Managerial - female 22.2 15.2 21.1 23.5 26.7
Professional - male 85.0 84.3 85.2 84.4 85.0
Professional - female 15.0 15.7 14.8 15.6 15.0
General & technical staff - male 82.9 81.9 81.0 81.1 78.2
General & technical staff - female 17.1 18.1 19.0 18.9 21.8
Australia (%)
Managerial - male 61.4 63.8 68.6 72.4 73.0
Managerial - female 38.6 36.3 31.4 27.6 27.0
Professional - male 56.8 55.9 54.5 57.6 56.1
Professional - female 43.2 44.1 45.5 42.4 43.9
General & technical staff - male 61.1 61.4 61.0 67.1 65.1
General & technical staff - female 38.9 38.6 39.0 32.9 34.9
CLP Holdings 2021 Sustainability Report | 131
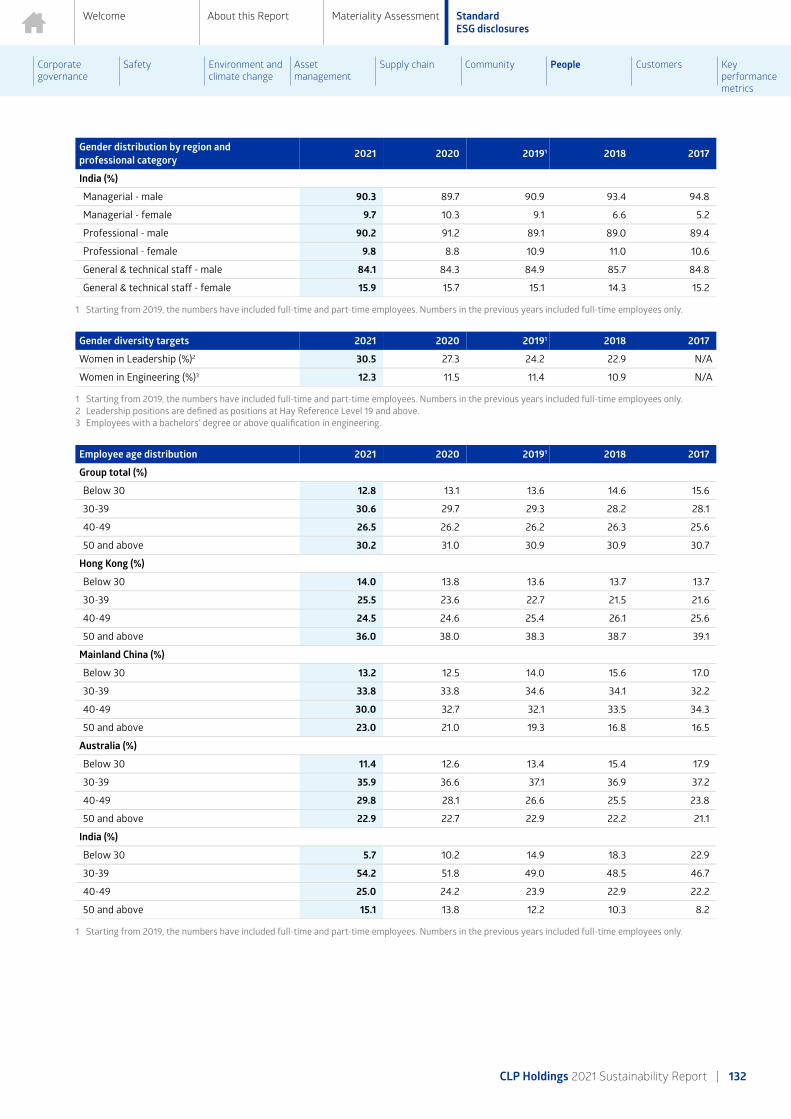
Welcome About this Report Materiality Assessment Standard ESG disclosures
Corporate governance
Safety Environment and climate change
Asset management
Supply chain Community People Customers Key performance metrics
Gender distribution by region and professional category 2021 2020 20191 2018 2017
India (%)
Managerial - male 90.3 89.7 90.9 93.4 94.8
Managerial - female 9.7 10.3 9.1 6.6 5.2
Professional - male 90.2 91.2 89.1 89.0 89.4
Professional - female 9.8 8.8 10.9 11.0 10.6
General & technical staff - male 84.1 84.3 84.9 85.7 84.8
General & technical staff - female 15.9 15.7 15.1 14.3 15.2
1 Starting from 2019, the numbers have included full-time and part-time employees. Numbers in the previous years included full-time employees only.
Gender diversity targets 2021 2020 20191 2018 2017
Women in Leadership (%)2 30.5 27.3 24.2 22.9 N/A
Women in Engineering (%)3 12.3 11.5 11.4 10.9 N/A
1 Starting from 2019, the numbers have included full-time and part-time employees. Numbers in the previous years included full-time employees only.2 Leadership positions are defined as positions at Hay Reference Level 19 and above.3 Employees with a bachelors' degree or above qualification in engineering.
Employee age distribution 2021 2020 20191 2018 2017
Group total (%)
Below 30 12.8 13.1 13.6 14.6 15.6
30-39 30.6 29.7 29.3 28.2 28.1
40-49 26.5 26.2 26.2 26.3 25.6
50 and above 30.2 31.0 30.9 30.9 30.7
Hong Kong (%)
Below 30 14.0 13.8 13.6 13.7 13.7
30-39 25.5 23.6 22.7 21.5 21.6
40-49 24.5 24.6 25.4 26.1 25.6
50 and above 36.0 38.0 38.3 38.7 39.1
Mainland China (%)
Below 30 13.2 12.5 14.0 15.6 17.0
30-39 33.8 33.8 34.6 34.1 32.2
40-49 30.0 32.7 32.1 33.5 34.3
50 and above 23.0 21.0 19.3 16.8 16.5
Australia (%)
Below 30 11.4 12.6 13.4 15.4 17.9
30-39 35.9 36.6 37.1 36.9 37.2
40-49 29.8 28.1 26.6 25.5 23.8
50 and above 22.9 22.7 22.9 22.2 21.1
India (%)
Below 30 5.7 10.2 14.9 18.3 22.9
30-39 54.2 51.8 49.0 48.5 46.7
40-49 25.0 24.2 23.9 22.9 22.2
50 and above 15.1 13.8 12.2 10.3 8.2
1 Starting from 2019, the numbers have included full-time and part-time employees. Numbers in the previous years included full-time employees only.
CLP Holdings 2021 Sustainability Report | 132

Welcome About this Report Materiality Assessment Standard ESG disclosures
Corporate governance
Safety Environment and climate change
Asset management
Supply chain Community People Customers Key performance metrics
Average length of service 2021 2020 20191 2018 2017
Number of years
Hong Kong 15.4 16.3 16.8 17.3 17.5
Mainland China 12.3 12.0 11.4 13.7 13.7
Australia 7.4 7.1 5.2 4.9 5.2
India 8.1 7.6 7.2 6.8 6.1
1 Starting from 2019, the numbers have included full-time and part-time employees. Numbers in the previous years included full-time employees only.
2021 data shaded in orange has been independently verified by PricewaterhouseCoopers. The assurance scope of past years' data can be found in previous Sustainability Reports.
CLP Holdings 2021 Sustainability Report | 133

Customers
Welcome About this Report Materiality Assessment Standard ESG disclosures
Corporate governance
Safety Environment and climate change
Asset management
Supply chain Community People Customers Key performance metrics
OverviewAs a purpose-led business, CLP recognises its obligation to meet the evolving expectations around the positive role businesses can play in society.
Customer expectations were once much simpler – they wanted access to a reliable power supply at an affordable price. While this still holds true, customer expectations have evolved and become manifold.
As general awareness of environmental impacts and climate change increases, many customers prefer their energy supply to have a lower environmental footprint, particularly in carbon intensity. Technology has empowered customers to exercise choice on where they source their electricity and how to seek ways to improve energy efficiency. In response, CLP has rolled out a range of customer-facing energy solutions, including those related to choice and efficiency.
Evolving smart energy systems, equipped with sensors, robots and sophisticated information and communication technology, create a new range of services that address customers’ needs beyond simply energy supply.
The flip side of a smarter, more-connected, data-rich energy system is concern over data privacy. A breach of CLP’s information technology could lead to public exposure of confidential customer details. Further, as CLP provides critical infrastructure, a breach of CLP’s operational technology could significantly impact a region’s economy and customer health and well-being through the temporary disruption of essential energy services.
The importance of cyber security and data privacy to protect customers' personal data and operation integrity cannot be underrated. It is vital that CLP continues to review its cyber resilience so customers can proceed with their day-to-day activities without fear of data leaks or supply disruption through cyberattack.
Key stakeholders• Customers, Government and regulators, Communities, the
Environment, Suppliers
Related material topics• Shaping and executing the transition to net-zero
– Managing the social impact of decarbonisation
• Aligning business activities with community, employee and customer expectations
– Deploying customer-facing energy solutions
– Acting as a trusted partner in the clean energy transition
• Reinforcing resilience in a changing operating environment
– Reinforcing cyber resilience and data protection
CLP Holdings 2021 Sustainability Report | 134

Welcome About this Report Materiality Assessment Standard ESG disclosures
Corporate governance
Safety Environment and climate change
Asset management
Supply chain Community People Customers Key performance metrics
Customer portfolioYear in reviewCLP operates retail businesses in Hong Kong and Australia, where the local market structures, regulatory requirements, electricity demand, customer preferences and cultural norms differ significantly. Overall, the number of customer accounts in both countries remained stable in 2021, with continued gradual growth reported in Hong Kong from the residential sector.
SASB reference: IF-EU-000.A; GRI reference: EU3
CLP Power Hong Kong is the sole electricity provider for Kowloon, the New Territories and most of the outlying islands of Hong Kong. It serves close to 2.7 million retail customers
and about 80% of Hong Kong’s population. Total electricity sales for 2021 were 35,355 GWh, with all sales coming from Hong Kong customers.
While Hong Kong is perceived by some as a mature market, there is still a growing demand for electricity. This is largely driven by a number of territory-wide development and infrastructure projects, as well as new local railway infrastructure projects that will improve mobility in Hong Kong. In addition, as Hong Kong is targeted as a prime location for data centres, there is a need to ensure highly reliable power supplies to support and facilitate the development of the energy-intensive data centre industry.
Hong Kong customer breakdown
The number of customer accounts continued to grow gradually over the last five years, mainly from the residential sector.
Number of customer accounts
Commercial Manufacturing Residential Infrastructure and public services
2021
2020
2019
2018
2017
0 500,000 1,000,000 1,500,000 2,000,000 2,500,000 3,000,000
Hong Kong customer breakdown(number of customer accounts) 2021 2020 2019 2018 2017
Commercial 210,821 208,150 206,792 206,073 203,891
Manufacturing 17,427 17,540 17,575 17,966 18,650
Residential 2,369,217 2,333,901 2,301,200 2,265,151 2,228,438
Infrastructure and public services 113,956 112,245 110,841 107,893 104,543
CLP Holdings 2021 Sustainability Report | 135
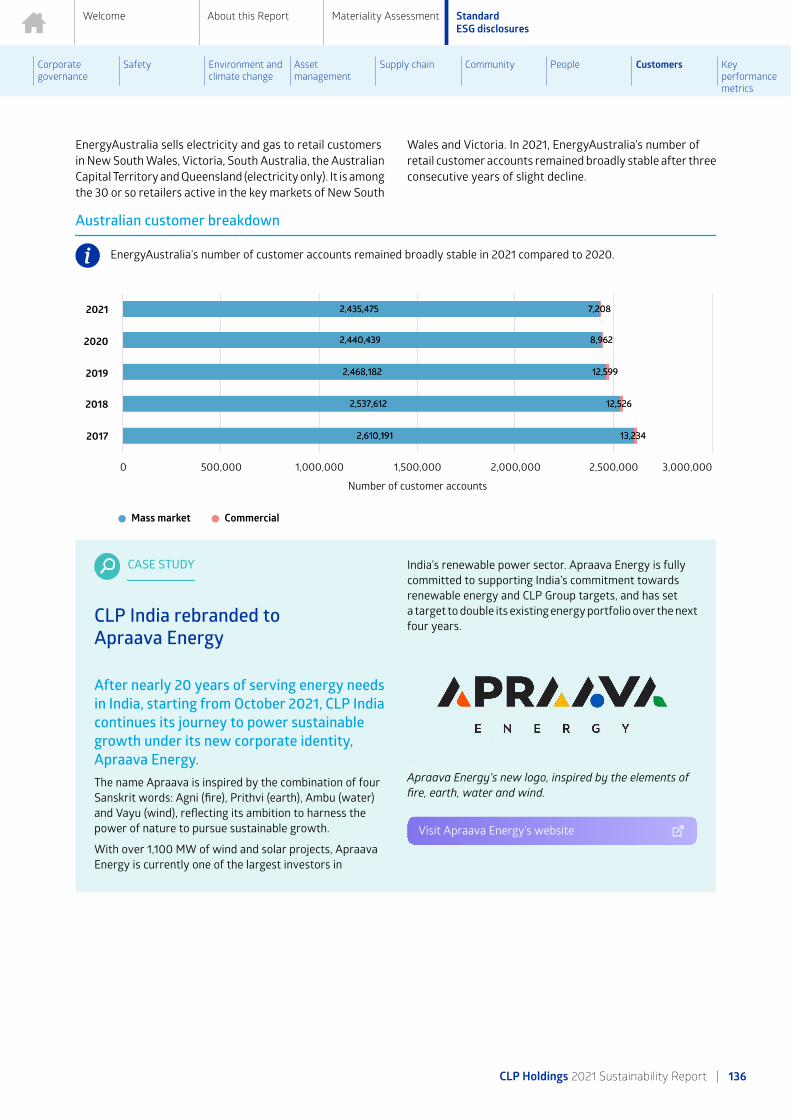
Welcome About this Report Materiality Assessment Standard ESG disclosures
Corporate governance
Safety Environment and climate change
Asset management
Supply chain Community People Customers Key performance metrics
EnergyAustralia sells electricity and gas to retail customers in New South Wales, Victoria, South Australia, the Australian Capital Territory and Queensland (electricity only). It is among the 30 or so retailers active in the key markets of New South
Wales and Victoria. In 2021, EnergyAustralia’s number of retail customer accounts remained broadly stable after three consecutive years of slight decline.
Australian customer breakdown
EnergyAustralia’s number of customer accounts remained broadly stable in 2021 compared to 2020.
Number of customer accounts
2,435,4752,435,475
2,440,4392,440,439
2,468,1822,468,182
2,537,6122,537,612
2,610,1912,610,191
7,2087,208
8,9628,962
12,59912,599
12,52612,526
13,23413,234
Mass market Commercial
2021
2020
2019
2018
2017
0 500,000 1,000,000 1,500,000 2,000,000 2,500,000 3,000,000
CASE STUDY
CLP India rebranded to Apraava Energy
After nearly 20 years of serving energy needs in India, starting from October 2021, CLP India continues its journey to power sustainable growth under its new corporate identity, Apraava Energy.The name Apraava is inspired by the combination of four Sanskrit words: Agni (fire), Prithvi (earth), Ambu (water) and Vayu (wind), reflecting its ambition to harness the power of nature to pursue sustainable growth.
With over 1,100 MW of wind and solar projects, Apraava Energy is currently one of the largest investors in
India’s renewable power sector. Apraava Energy is fully committed to supporting India’s commitment towards renewable energy and CLP Group targets, and has set a target to double its existing energy portfolio over the next four years.
Apraava Energy's new logo, inspired by the elements of fire, earth, water and wind.
Visit Apraava Energy’s website
CLP Holdings 2021 Sustainability Report | 136

Welcome About this Report Materiality Assessment Standard ESG disclosures
Corporate governance
Safety Environment and climate change
Asset management
Supply chain Community People Customers Key performance metrics
Access to electricityManagement approachAccess, in the context of electricity supply, is the ability to use an affordable and reliable electricity supply. CLP understands that electricity services are essential and strives to make them available to all.
Across the Group, services are in place that ensure most challenges, including language, culture, literacy, financial situation or disability, do not prevent people from accessing and using the Company’s products and services.
Special arrangements are in place for customers facing financial difficulties to avoid having to disconnect their electricity supply. In Hong Kong, CLP Power offers a Braille bill to assist those who are visually impaired. In Australia, EnergyAustralia provides interpreter services for those with a first language other than English, and also offers hearing-impaired and vision-impaired billing services.
Year in reviewVarious subsidy schemes and hardship programmes in Hong Kong and Australia continued to relieve the hardship suffered by those in need and safeguard their access to electricity.
SASB reference: IF-EU-240a.3; GRI reference: EU27
Hong KongCLP understands that although the tariff level in Hong Kong is reasonable and competitive, when compared to other major metropolitan cities around the world, it could potentially be a financial burden to vulnerable groups.
During 2021, in supporting residential customers, CLP Power offered a total of HK$26 million in electricity subsidies to around 50,000 households in need through the ongoing CLP Power Connect Programme. It pledged a further HK$50 million for 2022. Under the programme, CLP Power also provided subsidies for the landlords of subdivided units to carry out rewiring works, and install individual electricity meters for tenants of subdivided units, to improve the safety of the units and electricity usage tracking. The programme was launched in January 2019, and at the end of 2021, 34 subdivided units were rewired with 116 individual electricity meters installed.
Disconnections for CLP Power Hong Kong
The total number of disconnections for Hong Kong retail businesses was 4,943 cases in 2021, a similar level to 2020 with 4,999 cases.
Number of disconnections
2021
2020
2019
2018
2017
0 1,000 2,000 3,000 4,000 5,000 6,000 7,000 8,000 9,000
Disconnections for CLP Power Hong Kong (number) 2021 2020 2019 2018 2017
● 0 - 2 days 105 98 4,333 6,319 7,426
● 3 - 7 days 796 506 170 225 255
● 8 - 31 days 2,251 2,274 101 168 192
● ≥ 32 days 1,791 2,121 39 10 15
CLP Holdings 2021 Sustainability Report | 137

Welcome About this Report Materiality Assessment Standard ESG disclosures
Corporate governance
Safety Environment and climate change
Asset management
Supply chain Community People Customers Key performance metrics
AustraliaEnergyAustralia recognises that all customers need to be able to access its products and services fairly and equally. Through its Energy Charter, EnergyAustralia commits to working together to improve affordability and to support customers experiencing vulnerable circumstances.
Download EnergyAustralia’s Energy Charter 2021 disclosure
2021 was another challenging year for Australian customers due to the COVID-19 pandemic lockdowns and floods on the east coast in March 2021. This saw a significant increase in both residential and business customers experiencing financial difficulties and seeking support, many for the first time in New South Wales. Victorian customers required ongoing support due to being in lockdown for 267 days between March 2020 and October 2021.
In response to the pandemic, from March to December 2021, EnergyAustralia helped residential customers experiencing difficult financial situations by putting in place over 254,000 payment plans and granting more than 237,000 payment extensions.
For customers impacted by long-term financial hardship, assistance is available under the EnergyAssist hardship programme. The programme helps customers by offering tailored payment plans, payment matching and debt waivers, as well as energy efficiency education to ensure that customers are well-informed for making decisions. EnergyAustralia monitors the number of customers on the programme, their debt levels and the number of successful completions. In 2021, 38,827 account holders entered the programme and 9,755 account holders left the programme after successfully completing their payment commitments. This represents a graduation rate of 27%, slightly lower than 33% in 2021.
EnergyAustralia’s business customers were some of the first to access tailored support. In consultation with customers, specialist EnergyAustralia business advisers devised payment schedules, offered free standard disconnections and reconnections, advised on lowering energy consumption and provided guidance on government energy relief subsidies.
Rapid Business Assist, a programme launched in 2020 to support SMEs facing financial uncertainty, continued in 2021. In consultation with customers, specialist EnergyAustralia business advisers customise payment schedules, offer free standard disconnections and reconnections, advise on lowering energy consumption, and provide guidance on government energy relief subsidies.
In 2021, the programme provided more than 16,000 payment extensions and over 2,600 payment plans for business customers. Small business suppliers were moved to 14-day payment terms to support their cash flow.
Read more on EnergyAustralia’s Hardship Policy
Find out about the assistance provided by EnergyAustralia during COVID-19
CLP Holdings 2021 Sustainability Report | 138

Welcome About this Report Materiality Assessment Standard ESG disclosures
Corporate governance
Safety Environment and climate change
Asset management
Supply chain Community People Customers Key performance metrics
Availability and reliabilityManagement approachAvailability and reliability of electricity supply are two key performance metrics that track CLP's ability to meet its commitments to customers.
GRI reference: EU10
Goals and targetsFor generation assets, CLP monitors the availability factor in terms of the amount of time that an asset is able to produce full load equivalent electricity over a certain period, divided by the amount of time in that period. Typical values range from 70% to 90%, and CLP aims to maintain an availability range of 90% and above for newer assets.
Targets for each asset are set annually and included in the business plan. Performance is reported on a weekly basis to senior management. Any significant performance variance is analysed and corrective action is taken where appropriate.
Strategies and proceduresWhile CLP has generation businesses across the Asia-Pacific region, Hong Kong is the only location where the business is vertically integrated. In other words, it provides generation, transmission and distribution of power, as well as retail services. CLP Power Hong Kong is regulated by the Hong Kong Government under a Scheme of Control (SoC) Agreement framework that requires the Company to forecast electricity demand and plan for investment to provide a safe and reliable electricity supply to customers. In Hong Kong, CLP uses various measures to maintain high supply availability and reliability. These measures include:
• Upgrading generation and network facilities to meet new electricity demand;
• Maintaining sufficient generating capacity to meet forecast demand as well as planned and unforeseen outages;
• Presenting an additional and economically viable gas supply option that can offer energy security through access to competitive gas supplies from global markets using Floating Storage and Regasification Unit (FSRU) technology;
• Adopting advanced technology, such as smart grid, and implementing demand-side management measures to reduce demand growth and improve utilisation of existing assets;
• Improving the quality of the power supply to minimise voltage dips; and
• Enhancing power systems to minimise the impact of adverse weather.
Across the Group, CLP promotes organisational learning and the building of technological capacities to ensure availability and reliability. Insights learned from regional experiences are shared amongst functions to plan for a consistent management framework. This practice facilitates better portfolio management and reduces risks to the Group’s operations as a whole.
Transmission networkTo cope with the territorial development of Hong Kong, CLP reviews future transmission network developments annually in accordance with: the latest system maximum demand forecast; area load growth; infrastructure development; and generation development.
Annual maintenance and improvement programmes have been developed for major transmission assets based on the analysis of current conditions and performance of the assets, levels of investment and risk.
The power supply network is most exposed to damage from extreme climate events, potentially leading to service disruptions. In response, CLP continues to improve the reliability of its power supply network through a range of measures.
Find out more in the 2021 Climate-related Disclosures Report
In India, Apraava Energy has adopted the philosophy of predictive and corrective maintenance of its transmission assets. This includes pre-emptive check-ups and assessments on operational clearances, ensuring assets are well structured and maintained with proper setup, hardware and security. Frequent patrolling is carried out for conducting assessments on landscape and assets. The results are used to identify defects and plan for shutdowns if needed.
Apraava Energy has started using a mobile application for the real-time tracking of site patrols to shorten the response time for rectifications, if required. Thermo vision cameras aid the team in reaching the site with defects through heat mapping. The use of drones for site patrolling is under planning, while a ground team will be retained at strategic locations to allow them to attend to damages when required.
With the operations and maintenance strategy in place, Apraava Energy has achieved 100% availability of electricity to customers since its acquisition in November 2019.
CLP Holdings 2021 Sustainability Report | 139

Welcome About this Report Materiality Assessment Standard ESG disclosures
Corporate governance
Safety Environment and climate change
Asset management
Supply chain Community People Customers Key performance metrics
Year in reviewIn Hong Kong, CLP maintained its world-class supply reliability of over 99.999%. This is a higher rating than that experienced by other major international cities such as London, New York and Sydney.
SASB reference: IF-EU-550a.2; GRI reference: EU4, EU12, EU26, EU28,
EU29, EU30
CLP’s transmission and distribution network in Hong Kong serves about 80% of the population of the city and close to 100% of the population in the Company’s service area. At the end of 2021, CLP Power had approximately 1,140km of overhead and 15,257km of underground circuits at medium or higher voltage. In addition, there were 237 primary and 15,204 secondary substations operating in Hong Kong. As of 2021, the average network loss for the past five years was 3.61%, slightly lower than the five-year average of 3.69% reported in 2020.
To arrive at these percentages, a set of universally recognised supply reliability performance indicators is used from the Institute of Electrical and Electronics Engineers standard (IEEE 1366-2012) to monitor system performance. CLP’s performance against these indicators is reported annually to the Hong Kong Government.
Comparison of reliability levels between cities
Unp
lann
ed c
usto
mer
min
utes
lost
per
yea
r
1.01.0 1.61.6
1414 1414
2929
CLP Power
Singapore
Sydney (CBD)
London
New York0
5
10
15
20
25
30
35
1 2019-2021 average for CLP Power.2 2018-2020 average for all cities.3 There are no overhead lines in Singapore
Supply reliability performance indicators and results for CLP Power Hong KongIndicator Result
System Average Interruption Frequency Index (SAIFI)
The average number of supply interruptions for each customer served. Both planned and unplanned interruptions are included.
• The three-year average SAIFI (2019-2021) was 0.21, meaning customers experienced a power interruption approximately once in five years during this period. This was slightly higher than last year’s three-year rolling average.
System Average Interruption Duration Index (SAIDI)
The average duration of interruptions each customer may encounter in a given year.
• The three-year average SAIDI (2019-2021) was 0.23 hours, including both planned and unplanned interruptions. This was lower than last year’s three-year rolling average.
Unplanned Customer Minutes Lost (Unplanned CML)
The average duration of unplanned power interruptions per customer in a given year. These outages occur without prior notice, and happen as a result of various factors such as weather events, third-party damage to the network and equipment faults.
• The three-year rolling average (2019-2021) of unplanned CML was about 0.99 minutes, which was lower than the 9.77 minutes recorded in 2020. About 8.85 minutes of unplanned CML was due to the severe impact of Super Typhoon Mangkhut in September 2018, without which the 2020 performance would have been about 0.92 minutes. CLP Power maintains a world-class supply reliability of over 99.999% in Hong Kong, which is higher than other major international cities as shown in the diagram above.
CLP Holdings 2021 Sustainability Report | 140

Welcome About this Report Materiality Assessment Standard ESG disclosures
Corporate governance
Safety Environment and climate change
Asset management
Supply chain Community People Customers Key performance metrics
Customer satisfactionManagement approachCLP is committed to providing quality service and value to customers. This includes meeting regulatory requirements and delivering on customer service pledges.
GRI reference: 417-1
Strategy and proceduresCLP customers can access information on products and services in a timely and efficient manner through a number of communication channels, such as a welcome pack for all new customers, information on the CLP Power Hong Kong websites and CLP Mobile App, as well as the EnergyAustralia websites and Mobile Apps.
CLP also strives to effectively respond to customer needs and preferences. All escalated cases are studied thoroughly to appropriately resolve the issues customers have raised.
EnergyAustralia has over two million conversations with customers every year, either over the phone or via digital service channels. It also engages with more than 100,000 individuals, businesses and stakeholders annually through formal research to help shape business decisions, products and services.
Monitoring and follow-upTo gauge customer feedback about retail services and performance, customer satisfaction surveys are conducted regularly.
In Hong Kong, an external market research consultant conducts an annual telephone survey. The customer satisfaction score considers overall satisfaction towards CLP and a relative rating against an ideal utility in Hong Kong. The score is benchmarked against the public utilities in the energy sector and other public service organisations.
In addition to the number of calls and complaints received, EnergyAustralia also measures customer satisfaction through its Strategic Net Promoter Score (NPS). Customer satisfaction is measured monthly via an online NPS survey sent to a representative group of customers. The Transactional Net Promoter Score is also used to track customer satisfaction in relation to specific customer interactions, providing more direct feedback to frontline staff.
Year in reviewCLP has continued to maintain a high level of customer satisfaction during the COVID-19 pandemic. The frontline teams have continued to maintain essential support and ensure the reliability of power supply and customer service.
GRI reference: 417-3
Hong KongIn 2021, CLP Power’s customer satisfaction score dropped slightly, though remained on par with other public service organisations.
During the pandemic, CLP Power has successfully communicated the benefits of smart meters to customers. By the end of 2021, CLP Power was on schedule to have rolled out over 1.2 million smart meters. The insights gained through customer use of smart meters allows the Company to create more focused products and services that better match customer needs.
CLP Power Hong Kong customer satisfaction score
CLP Power's customer satisfaction score dropped slightly in 2021, though remained on par with other public service organisations.
Score
7373
7474
7272
7373
7171
7474
7474
7373
7373
7171
7373
7474
7373
7373
7171
CLPAll public utilities in the energy sectorPublic service organisations
2021
2020
2019
2018
2017
0 20 40 60 80
CLP Holdings 2021 Sustainability Report | 141

Welcome About this Report Materiality Assessment Standard ESG disclosures
Corporate governance
Safety Environment and climate change
Asset management
Supply chain Community People Customers Key performance metrics
AustraliaWhile customers have continued to experience the impact of COVID-19 on their day-to-day lives, EnergyAustralia has demonstrated its continued commitment to its customers by focusing on the quality of service they receive. Enhancements to the EnergyAustralia app have seen more than 110,000 downloads in 2021 providing a new channel for customers to interact aligned to their preferences, which has helped drive a 10% reduction in call volumes.
Complaint volumes continued to decline, with total complaints received declining by 14% from the 2020 figure. This result was brought about by continued improvements in internal and external dispute resolution practices, and operational interventions to address key billing complaint drivers.
Complaints received by EnergyAustralia
The focus on billing complaint drivers and improving dispute resolution is reflected in the decrease in number of complaints received.
14,64314,643
17,04917,049
20,93720,937
23,39023,390
29,18029,180
Number of complaints
2021
2020
2019
2018
2017
0 10,000 20,000 30,000 40,000
EnergyAustralia has been measuring its Strategic Net Promoter Score (SNPS) to assess customer engagement since 2012. This is measured monthly via an online survey, which is sent to a representative group of customers. The Transactional Net Promoter Score (TNPS) is also used to track customer satisfaction in relation to specific customer interactions, providing more direct feedback for frontline staff. EnergyAustralia’s TNPS has increased steadily in the past three years. This reflects better quality interactions and customers valuing the extra support EnergyAustralia offered.
EnergyAustralia's Transactional Net Promoter Score
Score
23.523.5
27.427.4
28.528.5
2019
2020
2021
0 10 20 30
CLP Holdings 2021 Sustainability Report | 142

Welcome About this Report Materiality Assessment Standard ESG disclosures
Corporate governance
Safety Environment and climate change
Asset management
Supply chain Community People Customers Key performance metrics
Customer privacyManagement approachUnder the CLP Code of Conduct, every employee must safeguard the Company’s assets and the resources entrusted to the Company’s care, including customer information, against loss, theft or misuse.
GRI reference: 418-1
In Hong Kong, the Personal Data (Privacy) Ordinance (PDPO) governs the protection of personal data of individuals. The Data Protection Principles in the PDPO frame CLP Power’s obligations (as a data user) relating to the collection, accuracy, retention, use and security of personal data, and a customer’s right to access their personal data.
EnergyAustralia has obligations under the Privacy Act 1988 to ensure that personal information is appropriately used, handled and managed. Under the Privacy Act, there are mandatory data breach reporting obligations. EnergyAustralia is required to report notifiable data breaches that are likely to result in serious harm to individuals to the Office of the Australian Information Commissioner (OAIC) and to the affected customers.
Throughout 2021, the Australian Competition and Consumer Commission (ACCC) continued consulting with the energy sector on the Consumer Data Right (CDR). The CDR will give customers the right to share their transaction, usage and product data with service competitors and comparison services, if they choose to do so. Under the customer's direction, EnergyAustralia will be obligated to provide data to accredited third parties. Comparable obligations have already commenced in the Australian banking sector. This reform is anticipated to be in force within the energy sector by mid to late 2022.
Strategy and proceduresThe CLP Privacy Principles set out the Company’s commitment and approach to protecting personal data.
All employees must follow CLP procedures, practices and local regulations in relation to personal data privacy. The Group preserves the confidentiality of the personal data provided to it in accordance with the CLP Privacy Policy Statement, which was updated with effect from 1 November 2018. The CLP Privacy Policy Statement demonstrates the Company’s approach to protecting personal data and is applicable to everyone across its entire operations who handles personal data.
In addition, business units with operations in Hong Kong must implement and abide by the CLP Personal Data Protection Compliance Manual (2021 version) which sets out CLP’s data protection compliance framework, including its governance structure and the corporate data protection officer’s roles and responsibilities. This manual also provides guidance on the protection and use of personal data. Adherence to policies and procedures regarding privacy and data protection are further embedded in CLP’s Code of Conduct and the compliance management procedures of the Code.
Monitoring and follow-upAcross the Group, CLP monitors and documents any complaints related to breaches of customer privacy and the loss of customer data. In addition to the CLP Personal Data Protection Compliance Manual, the Customer & Business Development Unit has a written guideline for handling customer data incidents. The guideline includes the classification and assessment of the scope and severity of a data incident, reporting roles and responsibilities, and the incident response strategy and checklist. The Corporate Data Protection Officer also retains a record of data incidents and follow-up actions.
Learn how CLP responds to cyber security incidents
EnergyAustralia has developed and maintains a Data Breach Response Plan which is implemented by a Data Breach Response Team. The plan outlines the strategy for assessing, managing, containing and reporting data breaches within required timeframes and outlines roles and responsibilities. It is enacted each time a potential data breach is identified.
CLP Holdings 2021 Sustainability Report | 143

Welcome About this Report Materiality Assessment Standard ESG disclosures
Corporate governance
Safety Environment and climate change
Asset management
Supply chain Community People Customers Key performance metrics
Training and awarenessIn further reinforcing CLP rules to protect customer information, a key focus has been the prevention of unauthorised disclosures to malicious attackers or impersonators. Specific awareness activities, including communications, quality assurance assessment, coaching and additional training for frontline staff, were carried out during the year. Company-wide communications, employee training and briefing sessions with leadership were also conducted to ensure all staff understand current privacy and data management obligations. A Data Breach Response Plan is in place. It establishes a Data Breach Response Team to ensure the business has the capability and procedures in place to respond swiftly to such incidents.
Customer privacy may be compromised as a result of a cyber security incident, or by the mishandling of customer information by employees. Following the compulsory e-learning programme on data protection for all employees in 2020, the e-training was mandated in 2021 for all
new joiners, Legal Review Committee meetings, as well as all data protection officers and record managers. Within individual business units, CLP runs data protection awareness programmes through briefings, posters, case studies, quiz games and refreshers. Industry threats are continuously reviewed with a view to strengthening controls on managing and monitoring networks, systems and mobile devices, data loss and suspicious cyber activities. CLP also regularly reinforces the need for timely reporting of potential privacy incidents.
At EnergyAustralia, customer privacy remains the focus of briefing sessions with leadership, enterprise-wide communications and employee training to ensure all staff are up-to-date with current privacy and data management. Specific awareness activities (including communications, further training, quality assurance assessments and coaching) for frontline staff took place in 2020. This has further reinforced rules to protect customer information.
Year in reviewIn 2021, both CLP Power in Hong Kong and EnergyAustralia reported no cases of customer data loss.
GRI reference: 418-1
CLP Power had no customer data loss cases reported in 2021. It had two privacy data incidents related to employee matters. One of these incidents was reported to the Privacy Commissioner for Personal Data who is pursuing this matter with the employee and the employee’s previous company directly with no further action required by CLP Power.
In 2021, CLP Power was awarded the Gold Certificate in the Privacy-Friendly Awards from the Office of the Privacy Commissioner for Personal Data (PCPD), Hong Kong, in recognition of its performance in the protection of personal data. PCPD carried out an inspection on CLP Power in 2021, and positively recognised seven aspects of CLP’s practices considered to be exemplary for the public utility industry.
In 2021, a notifiable data breach associated with an email containing private information sent incorrectly to an EnergyAustralia customer’s old email account was reported to the Office of the Australian Information Commissioner. The breach did not result in any penalty or sanction and EnergyAustralia has been working with the customer on a solution to the matter.
The Personal Information Protection Law (PIPL) became effective in China in November 2021. It is Mainland China’s first comprehensive legislation regulating the protection of personal information. While CLP China is not involved in the consumer market, it has considered the PIPL and related implementation regulations, and is in the process of developing compliance actions including changes to human resources policies and the transmission of human resources-related data to Hong Kong.
CLP Holdings 2021 Sustainability Report | 144

Welcome About this Report Materiality Assessment Standard ESG disclosures
Corporate governance
Safety Environment and climate change
Asset management
Supply chain Community People Customers Key performance metrics
Energy services and solutionsManagement approachThrough close customer engagement, the application of new technology and increased customer awareness of energy consumption, CLP is now offering a suite of sustainability products to meet different customer needs.
Strategy and proceduresDrawing on CLP’s long expertise in the power industry, residential and business customers and the community at large are being encouraged to use energy more efficiently and change their behaviour so that they can save more energy and help protect the environment.
CLP aims to change people’s habits and encourage them to conserve energy through:
• Equipping customers with tools and technical support;
• Supporting enablers to make greater energy efficiency possible;
• Providing customers with information and energy-saving tips; and
• Educating the public.
Goals and targetsThe CLP Power Customer Service Quality Policy includes a commitment to support customers in using CLP products and services more efficiently and effectively.
In Hong Kong, CLP Power is regulated by the Scheme of Control (SoC) Agreement, in which the current SoC (2018-2033) refines the list of energy saving and demand side management goals and targets covered in the previous SoC (2008-2018). The SoC (2018-2033) includes:
1. Performance targets for the energy audit and energy saved from the energy audits. Under the current SoC, targets are set at about four times the rate of previous targets. This will see 600 energy audits available to business customers a year with total electricity saved expected to reach 48GWh each year.
2. Demand response programmes offered to commercial and industrial customers to lower the overall system
demand, resulting in a lower requirement for investment in new generation units in the long-term. The target for this initiative is to achieve a reduction of up to 60MW from the demand peak.
3. A new five-year energy saving target. CLP must achieve at least 4% of energy savings on the basis of the average annual sales within a five-year period in order to earn incentives issued under the SoC. More incentives will be given if the energy saving reaches 5%.
Read more on CLP Power’s SoC performance
Year in reviewIn addition to its obligations under the SoC, throughout the year CLP continued to offer a range of customer-facing solutions and energy services to meet customers’ evolving expectations.
GRI reference: 2-6, 302-5
CLP's investment and venture portfolio continued to support the Company in developing its energy businesses, generating opportunities in growth markets and delivering strategic value. CLP exercises a prudent portfolio management approach through in-depth analysis and proactive management. In 2021, the Group invested HK$91 million, compared with HK$78 million in 20202, in creating a portfolio that consists of venture capital funds based in key innovation hubs, joint ventures with Other Sources Energy Group, which has a proven investment track record in clean energy technologies in Israel, as well as direct equity investments in various companies.
Other channels that CLP has adopted to enhance its service offerings included technology licensing, supporting accelerator programmes such as FreeElectrons, and partnering and co-creating customer-facing solutions with suppliers, customers or other partners. These efforts have helped CLP develop a suite of end-to-end products and services along the electric utilities value chain. They are summarised in the tables below.
2 2020 figure was restated.
CLP Holdings 2021 Sustainability Report | 145

Welcome About this Report Materiality Assessment Standard ESG disclosures
Corporate governance
Safety Environment and climate change
Asset management
Supply chain Community People Customers Key performance metrics
Enabling low-carbon electricity supply Updates in 2021
Decentralised renewable energy / rooftop solar
To support the decentralisation of energy and growth of renewables, CLP offers private renewable energy solutions via feed-in tariffs and rooftop solar.
• The Feed-in Tariffs (FiT) Scheme in Hong Kong allows customers to install a solar and/or wind power renewable energy system on their premises and connect the system to the CLP grid to earn FiT payments.
• The Solar Plus Plan and Solar Home Bundle are solar feed-in-tariff schemes for Australian customers based in New South Wales. Under the Solar Plus Plan customers had premium solar panels, an inverter and Tesla Powerwall installed for $0 upfront on a seven-year plan. Customers pay a low flat rate for the electricity used throughout the period, and will own the system outright at the end of the seven-year period.
• Since the FiT Scheme's commencement in mid-2018, and as at the end of 2021, CLP Power has received over 18,600 applications. Around 90% of the applications, representing a total capacity of around 265MW, have been approved. More than 12,100 applications have been completed and connected to the grid.
• The FiT Scheme has attracted customers from a variety of sectors including business and industry, schools, and both urban households and village houses.
• The Solar Plus Plan pilot was open for New South Wales customer applications between June and October 2020, and EnergyAustralia has now installed all of the systems for eligible customers.
Corporate Power Purchasing Agreements (PPAs)
Businesses wishing to increase their direct renewable energy availability may elect to enter Power Purchasing Agreements with CLP. The PPAs provide customers with the most credible and efficient provision of available clean energy.
• With increasing market demand, CLP proactively engages with customers in the large property sector to support their renewable energy conversion journey.
Using electricity more widely for transport and industry Updates in 2021
Electric vehicle infrastructure
• To further support green motoring and electrification in Hong Kong – a long-term government policy objective set out in the Hong Kong Roadmap on Popularisation of Electric Vehicles – CLP Power extended its free charging service for its electric vehicle (EV) charging stations until the end of 2022.
• CLP Power’s Eco Charge 2.0 EV Power Supply Support service supports applicants who are interested and qualified in applying for funding for EV charging-enabled infrastructure in the car parks of private residential blocks under the government’s EV-charging at Home Subsidy Scheme.
• In 2016, CLP Power formed Smart Charge (HK) Limited, a joint venture with HKT to provide a one-stop service for electric vehicle charging.
• CLP continued to provide free EV charging services at more than 50 locations to encourage the expansion of green motoring in Hong Kong.
• Since the Eco Charge 2.0 service was launched in November 2020, CLP Power has completed preliminary assessments for around 94% of the 451 applications received by the end of 2021 from owners of private buildings and estate managers, covering around 119,000 parking bays. Professional advice were provided to support applicants.
• To date, Smart Charge has designed, installed, and currently manages EV charging infrastructure in residential car parks in Hong Kong that covers a combined total of almost 10,000 car spaces.
• There are over 360 charging stations at the Company's premises in Hong Kong to support greater EV adoption across CLP operations. EnergyAustralia's EV charging facilities have also expanded to include the Newport Power Station in addition to head office and the Yallourn and Mount Piper power stations.
CLP Holdings 2021 Sustainability Report | 146

Welcome About this Report Materiality Assessment Standard ESG disclosures
Corporate governance
Safety Environment and climate change
Asset management
Supply chain Community People Customers Key performance metrics
Improving energy efficiency Updates in 2021
Energy audits
CLP provides a free energy audit and various consulting services to commercial and industrial (C&I) customers to help them understand their energy needs and identify potential avenues to reduce their energy use and operating costs.
• CLP Power conducted more than 600 energy audits and offered energy saving advice to C&I customers in 2021.
• In 2021, C&I customers saved around 50GWh of electricity from energy audits.
• CLP Power quadrupled the number of energy audits from 150 to 600 a year under the current SoC, and in 2021 exceeded the annual total electricity saved target of 48GWh.
Energy efficiency improvement
Buildings continue to contribute significantly to Hong Kong’s energy demand, becoming major pain points for customers. CLP offers various subsidies to support customers’ energy-saving retrofitting works.
• The CLP Eco Building Fund provides subsidies for energy efficiency improvement works for residential, commercial and industrial buildings.
• The CLP Electrical Equipment Upgrade Scheme for business customers provides subsidies to customers, especially SMEs, to replace or upgrade their lighting and air-conditioners to more energy-efficient models.
• Eco Building Fund funding was increased to HK$100 million a year with an annual target to provide subsidies to 400 residential blocks and C&I buildings to carry out improvement works to enhance the energy efficiency of communal areas of buildings. The initiative aims to save 48GWh of energy per year.
• Since the Electrical Equipment Upgrade Scheme launched in 2019, and as at the end of 2021, over HK$53 million has been offered to subsidise C&I customers for replacing or upgrading more energy efficient electrical equipment.
Cooling-as-a-service
Building cooling systems are usually the largest power consumer in a building. CLP provides targeted solutions, via chiller retrofitting and replacement services, cooling-as-a-service and district cooling solutions, to further increase the energy efficiency of buildings.
• In August 2021, CLP China obtained its first centralised cooling system business customer in the Greater Bay Area. CLP China will provide upgrading works for the centralised cooling system of the Guangzhou Po Park Shopping Plaza. Alongside the modification of the cooling system, equipment and design, CLP will operate and maintain the cooling system for approximately 14.5 years (from 1 November 2021). Commissioning of the project is planned for completion in January 2022.
• After its success in 2020, more customers have adopted the SEC Chiller Optimisation Solution. Using data collected from environmental sensors and with reference to equipment conditions, chiller settings are continuously adjusted to ensure environmental conditions are optimised. The solution has been adopted in several projects in Hong Kong and Mainland China. As part of the cooling-as-a-service project in the GBA, the solution was also deployed at a large retail complex in Chengdu, where 16% of energy use was saved.
Peak demand management
To facilitate long-term reliability of electricity supply, CLP works with customers to manage electricity demand and incentivise reduced consumption during peak demand events.
• Demand Response programmes are offered to commercial, industrial and selected residential customers in Hong Kong in order to lower the overall system demand, resulting in a lower requirement for investments in new generation units in the long-term.
• EnergyAustralia’s PowerResponse comprises a residential demand response programme and a contracted demand response programme for commercial customers. PowerResponse secures energy capacity which can be called upon within short timeframes for situations when availability in the national electricity market falls to critical levels.
• In Hong Kong, peak power demand was reduced by over 70MW thanks to the activation of CLP Power's demand response programme on 27 July, when electricity demand reached a new peak of 7,477MW. More than 30,000 of CLP Power's commercial, industrial and residential customers were incentivised as part of the programme.
• By the end of December 2021, EnergyAustralia’s demand response contracted capacity was over 186MW.
• More than 346,000 residential customers are part of the PowerResponse programme.
• Free Saturdays was launched in November 2020 for eligible New South Wales customers to sign up to online. The trial was promoted during the whole of 2021.
CLP Holdings 2021 Sustainability Report | 147

Welcome About this Report Materiality Assessment Standard ESG disclosures
Corporate governance
Safety Environment and climate change
Asset management
Supply chain Community People Customers Key performance metrics
Improving energy efficiency Updates in 2021• EnergyAustralia’s Free Saturdays is a new residential
electricity trial plan available to New South Wales smart meter customers. The plan provides eligible customers with free energy on Saturdays for a year in lieu of traditional discounts.
Energy management technology
Innovations in technology will continue to play a large role in improving energy management and efficiency. CLP links customers to a host of solutions and products to monitor, optimise, and automate their energy usage and consumption patterns.
• Launched in 2019, CLP’s Smart Energy Connect (SEC) is a platform designed to accelerate the adoption of energy management solutions and digital energy innovations. SEC launched different Energy Connect (EC) Solutions including EC Building, EC Campus and EC Workspace to cater to different customers' needs:
1. The EC Building solution is a set of energy management solutions for building level systems, helping building owners and facility management teams enhance building management by conducting asset health monitoring, optimising energy usage and automating system operations.
2. The EC Campus solution focuses on addressing both the energy saving and educational needs of schools where a range of IoT sensors may be deployed on premises, while the solutions and data can be used to support STEM education needs.
3. The EC Workspace solution helps users save energy in large office environments by automating the usage of electrical equipment based on environmental data provided by various sensors.
• A mass rollout of smart meters to all CLP Power Hong Kong customers, from 2018 to 2025, supports Hong Kong’s transformation into a Smart City.
• Echo Group supports the Company’s large commercial, industrial and business customers achieve their saving targets and environmental benefits through specialist solar and LED products.
• ResponsePro provides commercial and industrial customers with advance notice and flexibility on whether they participate in demand response events. Participating customers are rewarded with a fixed rate per kWh.
• Sales of smart energy technologies increased by 92% year-on-year on the SEC platform, which continues to expand its energy management solutions portfolio.
• In 2021, SEC launched Building Portfolio, which enables the user to manage energy and water consumption of multi-buildings in a single, customisable platform. Its AI and analytics platform is deployed across multiple buildings to help identify equipment faults, energy saving potential, and to streamline the work of facility managers. It is also an effective tool for measuring and verifying the quantitative benefits of energy conservation measures. Building Portfolio was adopted by one of Hong Kong's key developers in 2021.
• More than 10 schools adopted the EC Campus Solution in 2021. The data collected also provides users with actionable insight on energy use patterns. For example, indoor environment data helps to identify inefficient air-conditioners and signal the need to replace them.
• CLP Power's customers’ conventional meters are being upgraded to smart meters in phases from November 2018 to 2025. Despite a shortfall in the supply of new meters resulting from the global supply chain disruption, over 1.2 million smart meters were connected by the end of 2021. This represents over 40% of customer accounts in Hong Kong. CLP Power’s goal of replacing all customers’ conventional electricity meters by 2025 remains unchanged. In Australia, over 900,000 EnergyAustralia customers now have smart meters installed.
Energy data and analytics
CLP provides a variety of energy consumption analysis tools and complementary products to help customers make smarter energy management decisions and realise energy savings across the board.
• At EnergyAustralia, PurchasePro is a self-service web portal that gives large business customers greater control over their energy. Customers can purchase an agreed load progressively by quarter rather than commit to a price at a single point in time.
• Approximately a third of EnergyAustralia’s C&I customer load is now transacted on PurchasePro.
• As at the end of 2021, 55% of EnergyAustralia's business and residential customers have registered for My Account. In 2021, over 322,000 unique users accessed the EnergyAustralia App.
• Over 2,400 C&I customers in Hong Kong use Smart Energy Online to manage their energy consumption and improve their energy efficiency.
CLP Holdings 2021 Sustainability Report | 148

Welcome About this Report Materiality Assessment Standard ESG disclosures
Corporate governance
Safety Environment and climate change
Asset management
Supply chain Community People Customers Key performance metrics
Improving energy efficiency Updates in 2021
Mobile apps and online platforms are user-friendly ways for customers to track their electricity consumption.
• The CLP Power Mobile App in Hong Kong, and My Account and the EnergyAustralia App in Australia, are improving CLP’s engagement with its customers. The apps provide an easy-to use interface for customers to understand their energy usage and estimate upcoming bill payments.
• Smart Energy Online is an online assessment and/or management tool for C&I customers in Hong Kong. Similarly, the real-time web-based energy tool, InsightsPro, is available for C&I customers of EnergyAustralia to access contract information, consumption and cost data in real-time to optimise their business' energy spend and use.
• Over 1,100 EnergyAustralia customers now have access to InsightsPro.
Offsetting emissions that can't be otherwise avoided Updates in 2021
Renewable Energy Certificates (RECs)
In Hong Kong, RECs offer an alternative way for customers to support local clean energy generation. The RECs represent the environmental attributes of electricity produced by local renewable energy sources, generated or purchased by CLP.
• Since the launch of the RECs in January 2019, over 24GWh of RECs have been sold to businesses such as data centres, banks, hotels and restaurants, as well as residential customers. In 2021, close to 15.4GWh units of REC were sold, a significant increase from 5.4GWh units from the prior year.
• A commitment to purchase over 150GWh over a period of 10 years was made by Hang Seng Bank in early 2022, the largest and longest commitment since the launch of the REC programme.
CLP Carbon Credits
Carbon credits represent carbon emissions avoided as a result of emissions reduction projects. CLP encourages its customers and businesses to use carbon credits to offset their unavoidable emissions. It also collaborates with numerous industries to deliver carbon offset initiatives, including carbon neutral office renovation and operation, and a carbon neutral voyage program.
• Carbon credits sales achieved a record high in 2021. The number of CLP Carbon Credits from CLP's wind and solar projects in India sold in 2021 was equivalent to the offset of 1.4 million kt CO2e.
Energy Attribute Certificates (EACs)
In Australia, EACs provide customers with certified renewable energy. They support a customer’s renewables development and serve as an option to reduce their Scope 2 emissions when decentralised renewables are not a viable option.
• PureEnergy from EnergyAustralia helps customers purchase accredited green energy which feeds into the grid on their behalf.
• The Go Neutral Programme allows residential customers to opt in to fully offset the carbon emissions associated with their home electricity usage, at no added cost to them.
• Business Carbon Neutral helps business customers offset their electricity emissions for a flat fee.
• Around 2,000 EnergyAustralia customers have chosen a GreenPower government accredited PureEnergy option for their electricity supply.
• As at the end of 2021, EnergyAustralia has over 338,000 customers choosing to have their energy use offset, and over 2.8 million tonnes of carbon dioxide have been offset to date.
• EnergyAustralia now has the largest Climate Active certified offset offering in the Australian energy sector, and the second largest in the country.
CLP Holdings 2021 Sustainability Report | 149

Welcome About this Report Materiality Assessment Standard ESG disclosures
Corporate governance
Safety Environment and climate change
Asset management
Supply chain Community People Customers Key performance metrics
Customers dataSASB reference: IF-EU-000.A, IF-EU-000.B; GRI reference: EU3
Customer portfolio
CLP Power Hong Kong 2021 2020 2019 2018 2017
Total Hong Kong customers (number) 2,711,421 2,671,836 2,636,408 2,597,083 2,555,522
Commercial 210,821 208,150 206,792 206,073 203,891
Manufacturing 17,427 17,540 17,575 17,966 18,650
Residential 2,369,217 2,333,901 2,301,200 2,265,151 2,228,438
Infrastructure and public services 113,956 112,245 110,841 107,893 104,543
EnergyAustralia 2021 2020 2019 2018 2017
Total Australian customers (number) 2,442,683 2,449,401 2,480,781 2,550,138 2,623,425
Commercial and industrial 7,208 8,962 12,599 12,526 13,234
Mass market 2,435,475 2,440,439 2,468,182 2,537,612 2,610,191
Availability and reliability
CLP Power Hong Kong 2021 2020 2019 2018 2017
System Average Interruption Frequency Index [SAIFI]1 0.21 0.19 0.17 0.19 0.18
System Average Interruption Duration Index [SAIDI] (hours)1 0.23 0.39 0.42 0.46 0.34
Unplanned Customer Minutes Lost [CML] (minutes)1 0.99 9.772 10.133 10.294 1.57
1 The numbers are derived by calculating the average of data from the most recent three years. For example, the figures under year 2021 are the 3-year averages of data from 2019 to 2021.
2 The 2018-2020 average would have been about 0.9 minutes without the severe impact of Mangkhut in September 2018.3 The 2017-2019 average would have been about 1.3 minutes without the severe impact of Mangkhut in September 2018.4 The 2016-2018 average would have been about 1.44 minutes without the severe impact of Mangkhut in September 2018.
Access to electricity
CLP Power Hong Kong 2021 2020 2019 2018 2017
Total disconnections for Hong Kong retail business (number) 4,943 4,999 4,643 6,722 7,888
0 - 2 days 105 98 4,333 6,319 7,426
3 - 7 days 796 506 170 225 255
8 - 31 days 2,251 2,274 101 168 192
≥ 32 days 1,791 2,121 39 10 15
Customer satisfaction
CLP Power Hong Kong 2021 2020 2019 2018 2017
Customer satisfaction score
CLP 73 74 72 73 71
All public utilities in the energy sector 74 74 73 73 71
Public service organisations 73 74 73 73 71
CLP Holdings 2021 Sustainability Report | 150
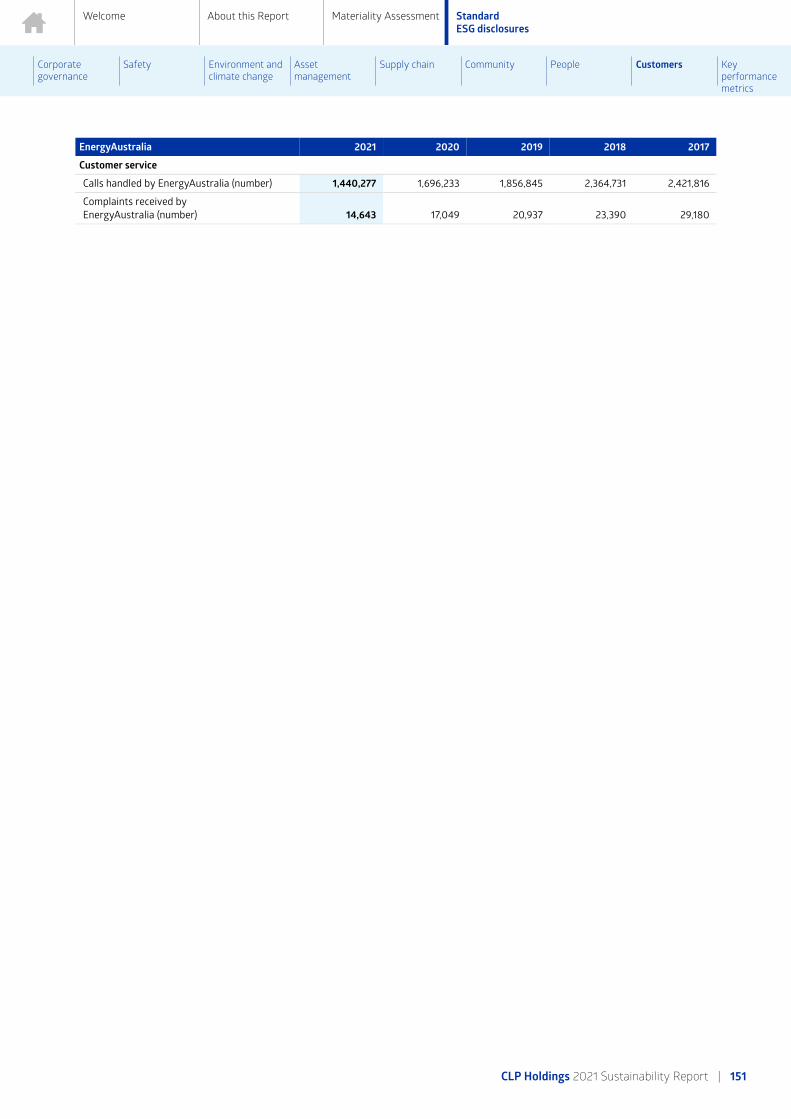
Welcome About this Report Materiality Assessment Standard ESG disclosures
Corporate governance
Safety Environment and climate change
Asset management
Supply chain Community People Customers Key performance metrics
EnergyAustralia 2021 2020 2019 2018 2017
Customer service
Calls handled by EnergyAustralia (number) 1,440,277 1,696,233 1,856,845 2,364,731 2,421,816
Complaints received by EnergyAustralia (number) 14,643 17,049 20,937 23,390 29,180
CLP Holdings 2021 Sustainability Report | 151

Key performance metrics
Welcome About this Report Materiality Assessment Standard ESG disclosures
Corporate governance
Safety Environment and climate change
Asset management
Supply chain Community People Customers Key performance metrics
CLP continually improves by managing, monitoring and reporting its ESG performance. These tables present a quantitative overview of the Group's 2021 financial and non-financial performance. The disclosures are selected from the GRI Standards, The Hong Kong Stock Exchange's ESG Reporting Guide, SASB Standards for Electric Utilities and ISSB's Climate-related Disclosures Prototype, as well as other key performance data.
Detailed discussion of these metrics can be found in the corresponding Standard ESG Disclosures sections.
The 2021 data shaded in orange has been independently verified by PricewaterhouseCoopers. The assurance scope of past years' data can be found in previous Sustainability Reports.
Read the reporting scope
Download the independent assurance statement
Governance 2021 2020 2019 2018 2017 GRI/HKEx/SASB/ISSB
Convicted cases of corruption reported to the Audit & Risk Committee (cases)
0 0 0 0 0 GRI 205-3 / HKEx B7.1
Breaches of Code of Conduct reported to the Audit & Risk Committee (cases) 18 25 31 20 28
Financial information 2021 2020 2019 2018 2017 GRI/HKEx/SASB/ISSB
Total capital investment incurred by asset type (HK$M(%))1,2,3 15,411 (100%) 13,022 (100%) 12,028 (100%) 12,851 (100%) N/A ISSB 13-e
Transmission, distribution and retail 5,957 (39%) 4,810 (37%) 5,229 (43%) 4,953 (39%) N/A
Coal 2,628 (17%) 3,638 (28%) 2,473 (21%) 3,040 (24%) N/A
Gas 5,639 (37%) 3,445 (26%) 3,146 (26%) 4,098 (32%) N/A
Nuclear 0 (0%) 0 (0%) 352 (3%) 0 (0%) N/A
Renewables4 860 (6%) 462 (4%) 580 (5%) 714 (5%) N/A
Others 327 (2%) 667 (5%) 248 (2%) 46 (0%) N/A
Total operating earnings by asset type (HK$M(%))5 10,638 (100%) 12,374 (100%) 12,138 (100%) 15,145 (100%) 14,189 (100%)
Transmission, distribution and retail 5,612 (53%) 5,751 (46%) 5,131 (42%) 7,427 (49%) 8,392 (59%)
Coal6 1,020 (10%) 2,871 (23%) 2,503 (21%) 3,370 (22%)3,994 (28%)
Gas6 1,326 (12%) 1,510 (12%) 1,735 (14%) 1,533 (10%)
Nuclear 1,908 (18%) 1,594 (13%) 1,688 (14%) 1,720 (11%) 913 (7%)
Renewables7 519 (5%) 575 (5%) 1,016 (8%) 924 (7%) 629 (4%)
Others 253 (2%) 73 (1%) 65 (1%) 171 (1%) 261 (2%)
CLP Holdings 2021 Sustainability Report | 152

Welcome About this Report Materiality Assessment Standard ESG disclosures
Corporate governance
Safety Environment and climate change
Asset management
Supply chain Community People Customers Key performance metrics
Financial information 2021 2020 2019 2018 2017 GRI/HKEx/SASB/ISSB
Economic value generated, distributed and retained (HK$M)
GRI 201-1
Economic value generated
Revenue 83,959 79,590 85,689 91,425 92,073
Share of profits of non-wholly owned entities8 1,129 1,608 1,828 1,509 609
Economic value distributed
Fuel costs 18,506 15,753 16,712 17,187 15,473
Other operating costs9 39,922 35,774 48,654 43,604 46,325
Staff expenses10 5,107 4,844 4,535 4,449 4,195
Finance costs11 1,774 1,875 2,033 2,107 2,278
Dividends 7,832 7,832 7,782 7,630 7,352
Taxes12 1,720 2,529 2,189 3,565 2,094
Donations 15 27 21 18 14
Economic value retained13 10,212 12,564 5,591 14,374 14,951
1 Numbers have been subject to rounding. Any discrepancies between the total shown and the sum of the amounts listed are due to rounding.2 Capital investment includes additions to fixed assets, right-of-use assets, investment property, intangible assets, investments in and advances to joint ventures
and associates, and acquisition of business/asset. 3 On an accrual basis.4 Renewables include wind, hydro, solar and waste-to-energy. Waste-to-energy is not considered as non-carbon emitting energy. Numbers of waste-to-energy
included in renewables since 2019 are as follows: 2019 - HK$123 million; 2020 - HK$7 million; 2021 - HK$18 million.5 Before unallocated expenses.6 Starting from 2018, operating earnings of coal and gas are reported separately.7 Renewables include wind, hydro, solar and waste-to-energy. Waste-to-energy is not considered as non-carbon emitting energy. Numbers of waste-to-energy
included in renewables since 2019 are as follows: 2019 - HK$5 million; 2020 - HK$8 million; 2021 - HK$10 million.8 Includes share of results (net of income tax) from joint ventures and associates netted with earnings attributable to other non-controlling interests, which
represented CLP's share of economic value created together with its business partners.9 Includes impairment provision/reversal and other charges. In particular, amount included litigation settlement of HK$1,110 million and impairment of retail
goodwill of HK$6,381 million in Australia in 2021 and 2019 respectively.10Another HK$1,402 million (2020: HK$1,386 million) of staff costs incurred were capitalised.11 Finance costs are netted with finance income and include payments made to perpetual capital securities holders. In addition, finance costs of HK$317 million
(2020: HK$306 million) were capitalised.12 Represents current income tax but excludes deferred tax for the year.13 Represents earnings attributable to shareholders (before depreciation, amortisation and deferred tax) for the year retained.
Safety 2021 2020 2019 2018 2017 GRI/HKEx/SASB/ISSB
Fatalities (number of personnel)1,2,3 GRI 403-2 / HKEx B2.1Fatalities - employees only 0 0 0 1 0
Fatalities - contractors only 0 0 1 1 4
Fatalities - employees and contractors combined 0 0 1 2 4
Fatality Rate(number per 200,000 work hours)1,4,5
GRI 403-2 / HKEx B2.1 /
SASB IF-EU-320a.1
Fatality Rate - employees only 0.00 0.00 0.00 0.01 0.00
Fatality Rate - contractors only 0.00 0.00 0.01 0.01 0.03
Fatality Rate - employees and contractors combined 0.00 0.00 0.00 0.01 0.02
CLP Holdings 2021 Sustainability Report | 153

Welcome About this Report Materiality Assessment Standard ESG disclosures
Corporate governance
Safety Environment and climate change
Asset management
Supply chain Community People Customers Key performance metrics
Safety 2021 2020 2019 2018 2017 GRI/HKEx/SASB/ISSB
Days Away From Work Injuries (number of personnel)1,3,6
GRI 403-2
Days Away From Work Injuries - employees only 4 12 7 11 11
Days Away From Work Injuries - contractors only 10 10 19 11 16
Days Away From Work Injuries - employees and contractors combined 14 22 26 22 27
Lost Time Injury Rate(number per 200,000 work hours)1,5,7
Lost Time Injury Rate - employees only 0.05 0.13 0.07 0.13 0.13
Lost Time Injury Rate - contractors only 0.08 0.09 0.14 0.09 0.14
Lost Time Injury Rate - employees and contractors combined 0.07 0.11 0.11 0.10 0.13
High-consequence Injuries(number of personnel)1,8
GRI 403-9
High-consequence Injuries - employees only 0 N/A N/A N/A N/A
High-consequence Injuries - contractors only 1 N/A N/A N/A N/A
High-consequence Injuries - employees and contractors combined 1 N/A N/A N/A N/A
Total Recordable Injury Rate(number per 200,000 work hours)1,5,9
GRI 403-2 / SASB IF-
EU-320a.1Total Recordable Injury Rate - employees only 0.14 0.25 0.19 0.19 0.21
Total Recordable Injury Rate - contractors only 0.29 0.37 0.52 0.29 0.36
Total Recordable Injury Rate - employees and contractors combined 0.23 0.32 0.38 0.25 0.29
Work-related Ill Health(number of personnel)1,3,10
GRI 403-10 / HKEx B2.1
Work-related Ill Health - employees only 1 0 0 1 0
Lost Days (number of days)1,11 GRI 403-2 / HKEx B2.2Lost Days - employees only 30412 44313 46414 249 252
1 The system of rules applied in recording and reporting accident statistics complies with the International Labour Organization (ILO) Code of Practice on Recording and Notification of Occupational Accidents and Diseases.
2 Refers to the number of fatalities as a result of work-related injury.3 Starting from 2021, the unit is changed from the number of cases to the number of personnel.4 Refers to the number of fatal injuries per 200,000 work hours in the year.5 Rates are normalised to 200,000 work hours, which approximately equals to the number of hours worked by 100 people in one year.6 Starting from 2021, “Days Away From Work Injuries” replaces “Lost Time Injury”. Days Away From Work Injuries refers to the number of personnel who sustains
work-related injury and is unfit to perform any work on any day after the occurrence of the injury. “Any day” is any calendar day which includes rest days, weekend days, leave days, public holidays or days after ceasing employment. It does not include the day the injury incident occurred. “Days Away From Work Injuries” excludes fatalities which were included in “Lost Time Injury”. Numbers prior to 2021 are the previously reported numbers for “Lost Time Injury”.
7 Refers to the number of Days Away From Work Injuries and Fatalities per 200,000 work hours in the year.8 Refers to the number of personnel who sustains life threatening or life-altering work-related injury. It is a subset of Days Away From Work Injuries.9 Refers to the number of Total Recordable Injuries per 200,000 work hours in the year. Total Recordable Injuries include Fatalities, Days Away From Work Injuries,
Restricted Work Injuries, and Medical Treatment Injuries.10Starting from 2021, “Work-related Ill Health” replaces “Occupational Disease”. Work-related Ill Health includes the diseases listed in the ILO List of Occupational
Diseases, work-related mental illnesses and work-related disorders. Numbers prior to 2021 are the previously reported numbers for “Occupational Disease”.11 Starting from 2021, “Lost Days” replaces “Days Lost”. “Lost Days” is the sum total of calendar days (consecutive or otherwise) after the days on which the
work-related injuries and work-related ill health occurred. “Days Lost” accounts the working days instead of calendar days. Numbers prior to 2021 are the previously reported numbers for “Days Lost”.
12 19 out of 304 days were carried forward from one incident in 2020.13 188 out of 443 days were carried forward from one incident in the past.14 158 out of 464 days were carried forward from three incidents in the past.
CLP Holdings 2021 Sustainability Report | 154

Welcome About this Report Materiality Assessment Standard ESG disclosures
Corporate governance
Safety Environment and climate change
Asset management
Supply chain Community People Customers Key performance metrics
Environment 2021 2020 2019 2018 2017 GRI/HKEx/SASB/ISSB
Resource Use & Emissions1,2,3
Nitrogen oxides emissions (NOx) (kt) 45.7 43.2 47.0 60.9 59.3 GRI 305-7 / HKEx
A1.1 /SASB IF-
EU-120a.1Sulphur dioxide emissions (SO2) (kt) 52.7 48.0 44.7 76.1 81.6
Particulates emissions (kt) 7.6 6.9 7.7 8.5 8.3
Sulphur hexafluoride (SF6) (kt) 0.004 0.003 N/A N/A N/A
Non-hazardous liquid waste (kl)4
GRI 306-2 / HKEx A1.4
Produced 65 3 59 52 103
Recycled 65 3 57 52 103
Non-hazardous solid waste (t)4
Produced 24,481 17,901 13,344 11,471 20,334
Recycled 4,214 4,458 4,986 3,990 3,790
Hazardous liquid waste (kl)4 GRI 306-2 / HKEx A1.3Produced 1,017 1,091 1,578 1,685 1,420
Recycled 947 1,069 1,536 1,648 1,384
Hazardous solid waste (t)4
Produced 1,524 1,503 862 1,435 857
Recycled 520 523 201 631 469
Ash (kt) SASB IF-EU-150a.1Produced 3,403 2,624 3,032 3,419 3,005
Recycled and sold 2,501 1,793 3,667 2,263 1,745
Gypsum (kt)
Produced 367 334 441 253 156
Recycled and sold 365 335 438 250 161
Total water withdrawal (Mm3)5 5,160.0 5,162.76 5,219.96 5,153.6 4,480.6 GRI 2-4,
303-3 /HKEx A2.2 /
SASB IF-EU-140a.1
For cooling purpose
Water withdrawal from freshwater resources 42.5 35.1 45.7 53.3 47.6
Water withdrawal from marine water resources 5,107.4 5,117.06 5,161.76 5,087.3 4,421.7
For non-cooling purposes
Water withdrawal from freshwater resources 5.3 5.7 5.8 6.0 4.9
Water withdrawal from municipal sources 4.8 4.9 6.7 7.0 6.4
CLP Holdings 2021 Sustainability Report | 155

Welcome About this Report Materiality Assessment Standard ESG disclosures
Corporate governance
Safety Environment and climate change
Asset management
Supply chain Community People Customers Key performance metrics
Environment 2021 2020 2019 2018 2017 GRI/HKEx/SASB/ISSB
Total water discharge(Mm3)5,7 5,122.5 5,133.86 5,179.66 5,103.2 4,437.7 GRI 2-4,
303-4
From cooling process
Treated wastewater to freshwater bodies 0 0 0 0 0
Water discharge to marine water bodies 5,107.4 5,117.06 5,161.76 5,087.3 4,421.7
Wastewater to other destinations 0 0 0 0.02 0.05
From non-cooling processes
Treated wastewater to freshwater bodies 11.9 13.7 14.4 12.3 12.3
Treated wastewater to marine water bodies 1.3 1.5 1.7 1.6 1.6
Wastewater to other destinations 1.9 1.6 1.7 1.9 2.0
Wastewater to sewerage 0.03 0.03 0.03 0.03 0.02
Environmental compliance1,2 GRI 2-27
Environmental regulatory non-compliances resulting in fines or prosecutions (number)
0 0 0 0 0
Environmental licence limit exceedances & other non-compliances (number)
9 4 10 2 13
1 Numbers include operating assets where CLP has operational control during the calendar year.2 Paguthan Power Station, the power purchase agreements of which expired in December 2018, was not included in the 2019-2021 numbers.3 Since 2019, numbers at the asset level have been aggregated and then rounded.4 Waste categorised in accordance with local regulations.5 Numbers have been subject to rounding. Any discrepancies between the total shown and the sum of the amounts listed are due to rounding.6 Restated as per updated data for Newport Power Station in Australia.7 Starting from 2019, Yallourn Power Station’s “water discharged to third-parties”, which was previously reported under “wastewater to sewerage”, has been
reported under “wastewater to other destinations”.
GHG emissions 2021 2020 2019 2018 2017 GRI/HKEx/SASB/ISSB
CLP Group1
Total CO2e emissions – on an equity basis (kt)2,3 65,017 62,138 71,720 N/A N/A GRI 305-1,
305-2,305-3 /
HKEx A1.2 /SASB IF-
EU-110a.1,IF-EU-110a.2 /
ISSB 13-a
Scope 1 (kt)4 47,690 45,105 50,047 N/A N/A
Scope 2 (kt) 236 244 250 N/A N/A
Scope 3 (kt) 17,091 16,790 21,424 N/A N/A
Category 1: Purchased goods and services 901 1,210 1,093 N/A N/A
Category 2: Capital goods 1,488 685 1,347 N/A N/A
Category 3: Fuel- and energy-related activities 12,733 12,690 16,671 N/A N/A SASB IF-
EU-110a.2
Category 5: Waste generated in operations 80 63 101 N/A N/A
Category 6: Business travel 1 1 8 N/A N/A
Category 7: Employee commuting 4 2 4 N/A N/A
Category 11: Use of sold products 1,884 2,138 2,200 N/A N/A
CLP Holdings 2021 Sustainability Report | 156

Welcome About this Report Materiality Assessment Standard ESG disclosures
Corporate governance
Safety Environment and climate change
Asset management
Supply chain Community People Customers Key performance metrics
GHG emissions 2021 2020 2019 2018 2017 GRI/HKEx/SASB/ISSB
CLP Group's generation andenergy storage portfolio3,4,5
CO2 – on an equity basis (kt)6 47,574 44,987 N/A N/A N/A GRI 305-1, 305-2 /
HKEx A1.2CO2e – on an equity basis (kt)6 47,813 N/A N/A N/A N/A
CO2 – on an equity plus long-term capacity and energy purchase basis (kt)7,8
51,674 48,621 N/A N/A N/A
CO2e – on an equity plus long-term capacity and energy purchase basis (kt)7,8
51,941 N/A N/A N/A N/A
CO2 – on an operational control basis (kt)6 46,842 43,808 50,412 52,052 47,9219
CO2e – on an operational control basis (kt)6 47,090 44,023 50,676 52,306 48,082
Climate Vision 2050
CLP Group – GHG emissions intensity of generation and energy storage portfolio3,4,5,10
GRI 305-4 / HKEx A1.2 /
ISSB 15
On an equity plus long-term capacity and energy purchase basis(kg CO2e/kWh)7,8
0.57 0.57 0.63 0.66 0.699
On an equity basis (kg CO2e/kWh)6 0.65 0.66 0.71 0.74 0.809
CLP Power Hong Kong – GHG emissions intensity of electricity sold4,11
CO2e emissions intensity of electricity sold by CLP Power Hong Kong (kg CO2e/kWh)
0.39 0.37 0.50 0.51 0.51
CO2 emissions intensity of electricity sold by CLP Power Hong Kong (kg CO2/kWh)
0.39 0.37 0.49 0.51 0.50
1 Refers to a range of businesses, including generation and energy storage portfolio, transmission and distribution, retail and others.2 Numbers have been subject to rounding. Any discrepancies between the total shown and the sum of the amounts listed are due to rounding.3 Paguthan Power Station, the power purchase agreements of which expired in December 2018, was not included in the 2019-2021 numbers.4 In accordance with the Greenhouse Gas Protocol, WE Station, which makes use of landfill gas from waste for power generation, is not included in CLP’s Scope
1 CO₂ emissions and is reported separately in the Asset Performance Statistics. Its non-CO₂ GHG emissions (i.e. CH4 and N2O) are included in CLP’s Scope 1 CO₂e emissions.
5 Starting from 2020, the portfolio includes energy storage assets and generation assets. Energy storage assets include pumped storage and battery storage. In previous years, the portfolio included generation assets only.
6 Numbers include Scope 1 and Scope 2 emissions.7 Numbers include assets with majority and minority shareholdings, and those under "long-term capacity and energy purchase" arrangements with CLP. Starting
from 2018, "long-term capacity and energy purchase" has been defined as a purchase agreement with a duration of at least five years, and capacity or energy purchased being no less than 10MW.
8 Numbers include Scope 1, Scope 2 and Scope 3 Category 3 emissions (direct emissions from generation of purchased electricity that is sold to CLP’s customers).9 CO₂e emissions of Yallourn and Hallet Power Stations were used to calculate CO2emissions metrics in 2017 due to limited data availability.10The 2019-2021 numbers refer to the GHG emissions intensity (kg CO2e/kWh), in line with the updated Climate Vision 2050 targets. Numbers prior to 2019 refer
to carbon emissions intensity (kg CO2/kWh), as reported in the past.11 "Electricity sold" is the total electricity energy sold to CLP Power Hong Kong's customers before the adjustment of Renewable Energy Certificates.
Asset management 2021 2020 2019 2018 2017 GRI/HKEx/SASB/ISSB
Generation and energy storage capacity by asset type (MW(%))1,2
GRI 2-4 /ISSB 13
Total generation and energy storage capacity - on an equity basis
20,018 (100%) 19,691 (100%) 19,238 (100%) 19,108 (100%) 19,395 (100%)
Coal 10,795 (53.9%) 10,765 (54.7%) 10,765 (56.0%) 10,765 (56.3%) 11,401 (58.8%)
Gas 4,666 (23.3%) 4,600 (23.4%) 4,194 (21.8%) 4,147 (21.7%) 3,434 (17.7%)
CLP Holdings 2021 Sustainability Report | 157

Welcome About this Report Materiality Assessment Standard ESG disclosures
Corporate governance
Safety Environment and climate change
Asset management
Supply chain Community People Customers Key performance metrics
Asset management 2021 2020 2019 2018 2017 GRI/HKEx/SASB/ISSB
Nuclear 1,600 (8.0%) 1,600 (8.1%) 1,600 (8.3%) 1,600 (8.4%) 1,600 (8.2%)
Wind3 1,747 (8.7%) 1,521 (7.7%) 1,521 (7.9%) 1,521 (8.0%) 1,941 (10.0%)
Hydro3 489 (2.4%) 489 (2.5%) 489 (2.5%) 489 (2.6%) 489 (2.5%)
Solar3 499 (2.5%) 499 (2.5%) 451 (2.3%) 369 (1.9%) 321 (1.7%)
Waste-to-energy3 7 (0.0%) 7 (0.0%) 7 (0.0%) 7 (0.0%) N/A
Energy Storage 5 (0.0%) 0 (0.0%) N/A N/A N/A
Others 210 (1.0%) 210 (1.1%) 210 (1.1%) 210 (1.1%) 210 (1.1%)
Total generation and energy storage capacity - on an equity plus long-term capacity and energy purchase basis4
25,108 (100%) 24,752 (100%)5 24,015 (100%) 23,705 (100%) 24,554 (100%)
Coal 12,027 (47.9%) 11,997 (48.5%) 11,997 (50.0%) 11,997 (50.6%) 12,633 (51.4%)
Gas 5,813 (23.2%) 5,717 (23.1%) 5,139 (21.4%) 5,084 (21.4%) 5,322 (21.7%)
Nuclear 2,685 (10.7%) 2,685 (10.8%) 2,685 (11.2%) 2,685 (11.3%) 2,488 (10.1%)
Wind6 2,331 (9.3%) 2,105 (8.5%)5 2,049 (8.5%) 1,982 (8.4%) 2,401 (9.8%)
Hydro6 489 (1.9%) 489 (2.0%) 489 (2.0%) 489 (2.1%) 489 (2.0%)
Solar6 793 (3.2%) 793 (3.2%) 745 (3.1%) 558 (2.4%) 321 (1.3%)
Waste-to-energy6 10 (0.0%) 10 (0.0%) 10 (0.0%) 10 (0.0%) N/A
Energy Storage 660 (2.6%) 655 (2.6%) N/A N/A N/A
Others 300 (1.2%) 300 (1.2%) 900 (3.7%) 900 (3.8%) 900 (3.7%)
Energy sent out by asset type (GWh(%))1,7,8
GRI 2-4 /SASB IF-
EU-000.D / ISSB 13
Total energy sent out - on an equity basis 73,113 (100%) 68,699 (100%) 70,949 (100%) N/A N/A
Coal 42,002 (57.4%) 39,438 (57.4%) 44,596 (62.9%) N/A N/A
Gas 13,233 (18.1%) 12,390 (18.0%) 9,979 (14.1%) N/A N/A
Nuclear 12,302 (16.8%) 11,192 (16.3%) 10,888 (15.3%) N/A N/A
Wind9 2,959 (4.0%) 2,886 (4.2%) 2,924 (4.1%) N/A N/A
Hydro9 1,668 (2.3%) 1,879 (2.7%) 1,758 (2.5%) N/A N/A
Solar9 922 (1.3%) 898 (1.3%) 805 (1.1%) N/A N/A
Waste-to-energy9 27 (0.0%) 15 (0.0%) 0 (0.0%) N/A N/A
Energy Storage 0 (0.0%) 0 (0.0%) N/A N/A N/A
Others 0 (0.0%) 1 (0.0%) 0 (0.0%) N/A N/A
Total energy sent out - on an equity plus long-term capacity and energy purchase basis4,10
91,183 (100%) 85,949 (100%)5 88,573 (100%) 100% 100%
GRI 2-4 /SASB IF-
EU-000.B / ISSB 13
Coal 43,995 (48.2%) 41,118 (47.8%) 48,512 (54.8%) 60% 61%
Gas 18,461 (20.2%) 17,157 (20.0%) 13,073 (14.8%) 12% 15%
Nuclear 20,962 (23.0%) 19,923 (23.2%) 19,400 (21.9%) 20% 15%
Wind11 4,611 (5.1%) 4,445 (5.2%)5 4,474 (5.0%)
8% 9%Hydro11 1,668 (1.8%) 1,879 (2.2%) 1,758 (2.0%)
Solar11 1,524 (1.7%) 1,522 (1.8%) 1,467 (1.7%)
Waste-to-energy11 38 (0.0%) 22 (0.0%) 0 (0.0%) N/A N/A
Energy Storage -75 (-0.1%) -118 (-0.1%) N/A N/A N/A
Others 1 (0.0%) 1 (0.0%) -109 (-0.1%) 0% 0%
Total energy sent out (GWh) - on an operational control basis
62,967 58,918 N/A N/A N/ASASB IF-
EU-000.D / ISSB 13
CLP Holdings 2021 Sustainability Report | 158

Welcome About this Report Materiality Assessment Standard ESG disclosures
Corporate governance
Safety Environment and climate change
Asset management
Supply chain Community People Customers Key performance metrics
Asset management 2021 2020 2019 2018 2017 GRI/HKEx/SASB/ISSB
Fuel use8,12
Coal consumed (for power generation) (TJ) 426,190 403,379 485,453 521,568 471,976 GRI 302-1 / HKEx
A2.1
Gas consumed (for power generation) (TJ) 142,304 134,776 107,183 83,364 91,426
Oil consumed (for power generation) (TJ) 2,717 2,243 2,620 3,807 5,069
1 Numbers have been subject to rounding. Any discrepancies between the total shown and the sum of the amounts listed are due to rounding.2 Starting from 2020, a new "Energy Storage” asset category is added, under which pumped storage and battery storage are included. In previous years, assets
under the “Others” category included oil-fired generation assets and pumped storage.3 Renewables include wind, hydro, solar and waste-to-energy. The total capacity of renewables on an equity basis is 2,743 MW (13.7%) in 2021.4 Numbers include assets with majority and minority shareholdings, and those under "long-term capacity and energy purchase" arrangements with CLP. Starting
from 2018, "long-term capacity and energy purchase" is defined as a purchase agreement with a duration of at least five years, and capacity or energy purchased being no less than 10MW.
5 Restated as per updated data for Power Purchase Agreement (PPA) of Waterloo Wind Farm in Australia.6 Renewables include wind, hydro, solar and waste-to-energy. The total capacity of renewables on an equity plus long-term capacity and energy purchase basis
is 3,624 MW (14.4%) in 2021.7 Starting from 2020, a new "Energy Storage” asset category is added, under which pumped storage and battery storage are included. In previous years, assets
under the “Others” category included oil-fired generation assets and pumped storage.8 Paguthan Power Station, the power purchase agreements of which expired in December 2018, was not included in the 2019-2021 numbers.9 Renewables include wind, hydro, solar and waste-to-energy. The total sent out of renewables on an equity basis is 5,576 GWh (7.6%) in 2021.10Only percentages are available for the years 2017-18.11 Renewables include wind, hydro, solar and waste-to-energy. The total sent out of renewables on an equity plus long-term capacity and energy purchase basis
is 7,840 GWh (8.6%) in 2021.12 Numbers include operating assets where CLP has operational control during the calendar year.
People 2021 2020 20191 2018 2017 GRI/HKEx/SASB/ISSB
Total employees by region (number) 8,116 8,060 7,960 7,634 7,542 GRI 2-7 /HKEx B1.1Hong Kong 4,771 4,689 4,604 4,538 4,504
Mainland China 627 609 607 596 577
Australia 2,281 2,320 2,280 2,042 1,998
India 437 442 469 458 463
Total employees eligible to retire within the next five years (%)2 14.6 14.5 13.9 16.4 15.1 GRI EU15
Hong Kong 20.1 20.4 19.5 20.0 18.6
Mainland China 15.1 13.4 14.5 13.2 10.6
Australia3 6.6 5.7 5.4 12.8 12.2
India 5.0 5.1 4.8 4.0 2.4
Voluntary staff turnover rate (%)4,5 GRI 401-1 / HKEx B1.2Hong Kong 4.6 3.1 2.4 2.3 1.9
Mainland China 2.3 1.3 2.0 4.7 3.0
Australia 16.1 7.7 12.9 13.6 13.8
India 6.9 4.7 6.6 5.6 3.5
Average training hours per employee (hours) 51.6 42.5 40.1 46.1 46.9 GRI 404-1 /
HKEx B3.2
1 Starting from 2019, the numbers have included full-time and part-time employees. Numbers in the previous years included full-time employees only.2 The percentages given refer to permanent employees within each region, who are eligible to retire within the next five years.3 There is no mandatory retirement age in Australia. Since 2019, the retirement age assumption has been adjusted from 60 to 65 to reflect local norms, which led
to a significantly lower percentage compared to previous years. Numbers in previous years adopting the adjusted retirement age for Australia are as follows: 2017 - Australia: 4.8% / Group total: 12.9%; 2018 - Australia: 4.6% / Group total: 14.0%.
4 Voluntary staff turnover refers to employees leaving the organisation voluntarily and does not include dismissal, retirement, company-initiated termination or end of contract.
5 Includes permanent employees except for Mainland China, which includes both permanent and fixed-term contract employees due to local employment legislation.
The 2021 data shaded in orange has been independently verified by PricewaterhouseCoopers. The assurance scope of past years' data can be found in previous Sustainability Reports.
CLP Holdings 2021 Sustainability Report | 159

Glossary
Welcome About this Report Materiality Assessment Standard ESG disclosures
Air emissions The emission of air pollutants such as sulphur dioxide (SO2), nitrogen oxides (NOx) and particulate matter (PMs).
Availability The fraction of a given operating period in which a generating unit is available without outages and capacity reductions. This is also known as the Equivalent Availability Factor.
Baseload An operating regime of power generation at a reasonably constant rate to serve continuous system load, and not designed to respond to peak demands or emergencies.
Capacity purchase Additional third-party owned power generation capacity contracted by CLP under long-term agreements to meet customer demand. Some of these agreements may confer CLP rights to use the generation assets and exercise dispatch control as if they belonged to the Group.
Capital investments Includes additions to fixed assets, right-of-use assets and intangible assets, investments in and advances to joint ventures and associates, and acquisition of business.
Carbon credit A carbon credit is a tradeable instrument which represents either: (a) a permit which gives the holder the right to emit one tonne of carbon dioxide or equivalent greenhouse gas (tCO2e) into the atmosphere; or (b) a certificate from a project that represents the removal or avoidance of one tCO2e from the atmosphere. CLP Carbon Credits (https://www.clpcarboncredits.com) are generated from renewable energy sources and can be used to offset carbon emissions generated by governments, organisations or individuals.
Carbon neutral When the greenhouse gas emissions associated with an activity or entity are balanced by carbon removal elsewhere, such as carbon credits, carbon sinks or storage, and renewable energy certificates.
Climate Action Finance Framework (CAFF)
Launched in 2017, CAFF supports the transition to a low-carbon economy by attracting socially responsible, sustainable financings, and to support CLP’s investments that reduce the carbon content of energy generated and increase the efficiency of energy usage. The CAFF formalises and governs project evaluation, management of proceeds and reporting for Climate Action Finance Transactions, including bonds, loans and other forms of finance.
Climate Vision 2050 CLP’s Climate Vision 2050 sets out the blueprint of the Group’s transition to net-zero greenhouse gas emissions leading up to mid-century. Launched in 2007 with a focus on the ambition to mitigate CLP’s climate impact, Climate Vision 2050 has been instrumental in informing CLP’s business strategy and guiding its investment decision-making.
Combined-cycle gas turbine (CCGT)
A technology used in gas-fired generation to enable significantly higher efficiency by utilising residual heat from gas turbine exhaust to run steam turbine and generating additional electricity.
Decarbonisation Decarbonisation of the power sector primarily refers to the reduction in the greenhouse gas emissions from electricity generation, and providing lower-carbon energy services and solutions to customers. At CLP it is measured by the reduction in carbon intensity, which is expressed in kilograms of carbon dioxide per kilowatt hour of electricity sent-out.
Decentralised generation / distributed generation
Refers to electrical generation and storage performed by a variety of technologies of a smaller scale located close to the load they serve. In contrast, centralised generation is the large-scale generation of electricity serving multi-loads connected to the transmission network.
Demand response Demand response programmes encourage participating customers to commit to short-term reductions in electricity demand, helping energy suppliers to keep the grid running optimally during high load periods.
Digitalisation The application of new information technologies including artificial intelligence and data analytics to help electric utilities develop new customer-centric services and improve operations.
Distributed energy Distributed energy includes power generated from sources such as solar panels and wind turbines located close to the users, as well as controllable loads or storage such as electric vehicles and batteries.
CLP Holdings 2021 Sustainability Report | 160
Welcome About this Report Materiality Assessment Standard ESG disclosures
Electricity sent-out Gross electricity generated by a power plant less self-generated auxiliary power consumption, measured at the connecting point between generating unit and transmission line.
Energy-as-a-service Evolution in the business strategy of energy companies to provide a more diverse range of value-adding energy services and solutions such as consultancy, energy management and distributed energy resources to customers, in addition to basic utility services.
Energy purchase Electricity purchased by CLP to meet customer demand under long-term agreements from power plants not owned by CLP, and without existing capacity purchase agreements with the Group.
Energy security The uninterrupted availability of energy sources.
Energy transition Transformation of the global energy sector from fossil-fuel based energy systems to low- or zero-carbon sources.
Energy transition enablers
Non-generation products or services that facilitate the energy transition, including energy storage, transmission and distribution, electric vehicle charging points and smart meters, amongst others.
Equity basis An approach set out by the GHG Protocol Corporate Standard for an organisation to consolidate GHG emissions for the purpose of accounting and reporting GHG emissions. On this basis, the organisation accounts for GHG emissions from operations according to its equity share in the operations.
Feed-in Tariff (FiT) Payable by Hong Kong power companies under the SoC agreement to purchase electricity from approved renewable energy projects. Find out more at https://www.clp.com.hk/en/business/low-carbon-solutions/renewable-energy/feed-in-tariff-business
Flue gas desulphurisation (FGD) facility
Equipment used to remove sulphur oxides from the combustion gases of a boiler plant before discharge to the atmosphere.
Generation capacity The maximum amount of power that a generator is rated to produce. Also known as installed capacity or nameplate capacity.
Greenhouse gas (GHG) The emission of gases that contribute to the greenhouse effect causing a changing climate. CLP’s GHG emissions inventory covers the six GHGs specified in the Kyoto Protocol. Nitrogen trifluoride (NF3), the seventh mandatory gas added under the second Kyoto Protocol was deemed immaterial to CLP’s operations after an evaluation.
The GHG Protocol Corporate Standard classifies an organisation’s GHG emissions into three ‘Scopes’. Scope 1 emissions are direct emissions from owned or controlled sources. Scope 2 emissions are indirect emissions from the generation of purchased energy. Scope 3 are indirect emissions (not included in Scope 2) that occur in the value chain of the organisation.
Megatrends Large, transformative global forces that define the future by having a far-reaching impact on business, economies, industries, societies and individuals. A megatrend is distinguished from other trends in that it cannot be stopped or significantly altered, even by powerful actors such as governments.
Megatrend analysis is an important tool for companies aiming to drive sustainable growth as competition increases and new disruptive ideas and concepts affect entire industries.
Microgrids Localised networks with generation, energy storage and load entities, that can operate in tandem with an existing grid or independently. They can potentially be deployed to meet the energy needs of remote areas cost-effectively, foregoing the expenses of transmission grids.
National Electricity Market (NEM)
Australia’s NEM is a wholesale spot market connecting six regional market jurisdictions – Queensland, New South Wales, the Australian Capital Territory, Victoria, South Australia, and Tasmania.
Net-zero greenhouse gas emissions
When greenhouse gas emissions are reduced, and the residual emissions is balanced by the removal of an equivalent amount of greenhouse gases from the atmosphere.
Non-carbon energy/non-carbon emitting energy
Energy from power sources that add no extra carbon to the atmosphere, such as wind, solar, hydro and nuclear energy. It does not include waste-from-energy and other forms of biomass.
Operational control basis
An approach set out by the GHG Protocol Corporate Standard for an organisation to consolidate GHG emissions for the purpose of accounting and reporting GHG emissions. On this basis, the organisation
CLP Holdings 2021 Sustainability Report | 161

Welcome About this Report Materiality Assessment Standard ESG disclosures
accounts for 100 percent of the GHG emissions from operations over which it has operational control, but does not account for GHG emissions from operations in which it owns an interest but has no control.
Offtake A long-term agreement to purchase electricity from another generator. See capacity purchase.
Particulate matter (PM) Microscopic solids or liquid droplets in the air.
Peaking plant A power generating station that is normally used to produce extra electricity during peak load times.
Phase out coal-fired generation capacity
In CLP’s context, phasing out coal-fired generation capacity refers to: (a) the retirement and closure of a coal-fired power asset; (b) the move away from a build-operate-transfer coal-fired project before the end of the contract term or according to the terms of the project; or (c) the divestment from a coal-fired asset.
Photovoltaic panels Photovoltaic (PV) panels convert the sun’s energy into DC electricity.
Power Purchase Agreement (PPA)
A long-term electricity supply agreement specifying deliverables such as the capacity allocation, the quantity of electricity to be supplied and financial terms.
Pumped storage A method used for large-scale storage of power. During non-peak times, electricity is used to pump water to a reservoir. During peak times, the reservoir releases water for hydroelectric generation.
Renewable energy Energy that is generated from renewable resources, which are naturally replenished on a human timescale, including sunlight, geothermal heat, wind, tides, water, waste-to-energy and various forms of biomass.
Renewable Energy Certificates (RECs)
In Hong Kong, RECs represent all the environmental attributes associated with electricity produced by local renewable sources in Hong Kong including solar, wind and waste-to-energy power projects, purchased or generated by CLP Power Hong Kong.
Scheme of Control Agreement (SoC)
The SoC with the Hong Kong Government provides a regulatory framework for the city’s electricity industry, enabling CLP Power Hong Kong to operate its facilities and plan new investments to meet the electricity demand of customers, as well as environmental objectives.
Science-based target A target for greenhouse gas reductions that is in line with the goals of the Paris Agreement to limit global temperature increase to well below 2°C above pre-industrial levels and pursue efforts to limit warming to 1.5°C.
Start-up accelerator A programme that offers support, including financing and mentorship, to facilitate the development of start-up companies.
Sustainable Development Goals (SDGs)
The 17 SDGs, adopted by all United Nations Member States in 2015, are the blueprint to achieve a better and more sustainable future for all. Find out more on https://sustainabledevelopment.un.org.
Utilisation Gross generation by a power plant unit in a given period as a fraction of the gross maximum generation. Also known as Gross Capacity Factor.
Waste-to-energy A form of renewable energy generation using waste such as landfill gas.
CLP Holdings 2021 Sustainability Report | 162
CLP Holdings Limited中電控股有限公司
8 Laguna Verde Avenue Hung Hom, Kowloon, Hong Kong Tel: (852) 2678 8111 Fax: (852) 2760 4448
www.clpgroup.com Stock Code: 00002
Copyright © 2022 FDOKUMEN