African Rural Labour and the World Bank: An Alternative Perspective
Upload
khangminh22Category
view
0download
0
2020Coping withthe COVID-19 Pandemic

W e s t A f r i c a E c o n o m i c O u t l o o k 2 0 2 0
ii
Copyright © 2020 African Development Bank
African Development Bank Group
Avenue Joseph Anoma
01 BP 1387 Abidjan 01
Côte d'Ivoire
www.afdb.org
The opinions expressed and arguments employed herein do not necessarily reflect the official views
of the African Development Bank, its Boards of Directors, or the countries they represent. This
document, as well as any data and maps included, are without prejudice to the status of or sovereignty
over any territory, to the delimitation of international frontiers and boundaries, and to the name of any
territory, city, or area.
Cover design by the African Development Bank based on images from Shutterstock.com©
ISBN 978-9973-9847-4-6 (print)
ISBN 978-9973-9848-4-5 (electronic)
You may copy, download, or print this material for your own use, and you may include excerpts from
this publication in your own documents, presentations, blogs, websites, and teaching materials,
as long as the African Development Bank is suitably acknowledged as the source and copyright
owner.

W e s t A f r i c a E c o n o m i c O u t l o o k 2 0 2 0
ACKNOWLEDGEMENTS
The West Africa Regional Economic Outlook 2020 was prepared in the Vice Presidency for
Economic Governance and Knowledge Management, under the supervision and general direction
of Charles Leyeka Lufumpa, Acting Vice President and Chief Economist.
The preparation of the Outlook was led by Emmanuel Pinto Moreira, Director, Country Economics
Department, with a core team consisting of Anthony Simpasa and Ferdinand Bakoup, Lead
Economist for the Nigeria Country Department and Lead Economist for West Africa, respectively.
Tricia Baidoo provided excellent administrative and logistical support to this work.
The macroeconomic part of the report was prepared by Anthony Simpasa with contributions from
Robert Asogwa and Adora Osaka Onyekachukwu. Andre-Marie Taptue led preparation of the
thematic part of the report with contribution from Prof William Boateng (University of Ghana, Legon)
and Audrey Verdier-Chouchane, Lead Economist for North Africa. Prof Léonce Ndikumana (University
of Massachusetts at Amherst) and David A. Robalino (American University of Beirut, Lebanon) served
as peer reviewers. Useful contributions and comments were also received from Country Economists
in West Africa: Theo Awamzam, Kelvin Banda, Olivier Beguy, Bumi Camara, Issiaka Coulibaly, Simone
Cuiabano, Jean Marie Vianney Dabire, Kalidou Diallo, Hamaciré Dicko, Elisabeth Diatou Diouf,
Khadidiatou Gassama, Wolassa Lawisso Kumo, Olivier Manlan, Joel Muzima, Ameth Saloum Ndiaye,
Rachidi Kotchoni, Ibrahim Sawadogo.
The data appearing in the report were compiled by the Statistics Department led by Charles Leyeka
Lufumpa, Director and Louis Kouakou, Manager of the Economic and Social Statistics Division.
The cover of the report is based on a general design by Laetitia Yattien-Amiguet and Justin Kabasele
of the Bank’s External Relations and Communications Department. The African Development Bank
Language Services Department ensured the translation of the report into French.
iii


TABLE OF CONTENTS
ACKNOWLEDGEMENTS
TABLE OF CONTENTS
LIST OF TABLES
LIST OF BOXES
LIST OF ANNEXES
LIST OF FIGURES
LIST OF ACRONYMS
EXECUTIVE SUMMARY
PART I: RECENT MACROECONOMIC DEVELOPMENTSAND OUTLOOK
1.1 Global Macroeconomic Trends and Developments
1.2 Recent Macroeconomic Developments in West Africa
1.2.1 Growth performance and drivers
1.2.2 Inflationary pressures have receded but could build as impact of COVID-19 deepens
1.2.3 Fiscal positions have improved but lower revenues amidst coronavirus and spending pressures could reverse the gains
1.2.4 Public debt vulnerabilities could heighten in West Africa due to effect of COVID-19 pandemic
1.2.5 Current account deficits to remain pressured under COVID-19 outbreak, weakening countries’ resilience to external shocks
1.2.6 Private capital flows could reverse as global uncertainty heightens amidst COVID-19 impact
1.2.7 Outward looking West African countries likely to record negative trade balances as coronavirus hits key export markets
1.2.8 The ECOWAS regional single currency: Importance and challenges
1.2.9 Poverty and Inequality
iii
v
vii
vii
vii
vii
X
Xiii
1
1
2
2
8
10
13
14
15
17
20
24
v

1.3 Outlook for Growth and Potential Transmission Channels of the COVID Pandemic on West African Economies
1.3.1 Lower commodity prices will have asymmetric effects in the region
1.3.2 Reduced trade will slow down pace of growth in West Africa
1.3.3 Small economies will suffer the most from lower tourism inflows
1.3.4 Volatility of financial markets could limit absorption of shock
1.3.5 Central banks’ actions should ensure inflation remains in check
1.4 Conclusion and Policy Recommendations
1.4.1 Policies to address persistent supply side bottlenecks
1.4.2 Policies to boost domestic revenues and tackle accumulation of public debt
1.4.3 Deepening regional integration in West Africa
PART II: SKILLS DEVELOPMENT AND EDUCATION FORTHE WORKFORCE OF THE FUTURE IN WEST AFRICA
2.1 Overview of population and labor market dynamics
2.1.1 Situation of the labor market
2.1.2 Situation of the labor market
2.2 Technological development for the future of work
2.2.1 Demand for digital services
2.2.2 ICT and productive capacity
2.2.3 Digitization and automation of the workforce of future
2.3 Education and skills development
2.3.1 Trends and patterns of education
2.3.2 Quality of education
2.3.3 Human capital dimension in the labor market
2.4 Financing education and skills development in West Africa
2.4.1 Public financing of education and skills development
2.4.2 Household spending on education
2.4.3 Financing education and skills development by private institutions
2.4.4 Education financing from international sources
2.4.5 Expenditure and education outcome
2.5 Conclusion and policy recommendation
AnnexesReferences
24
26
26
26
26
27
28
29
29
30
33
33
33
34
42
42
45
46
48
48
50
53
62
62
63
64
65
66
67
70
73
vi

W e s t A f r i c a E c o n o m i c O u t l o o k 2 0 2 0
Table 1
Table 2
Table 3
Table 4
Table 5
Table 6
Table 7
Table 8
Risk of Debt Distress for West African Countries
Intra-ECOWAS Trade
Initial assessment of macroeconomic impact of the COVID-19 pandemic in West Africa
Selected actions by central banks against the COVID-19 pandemic
Unemployment and Labor Market Conditions
Unemployment, Informality, and underemployment (percentage of total employment)
Cumulative dropout rate to the last grade, general education
Returns to education
LIST OF TABLES
Box 1
Box 2
Box 3
Implication of Nigeria’s land border closure on the economy
West Africa regional integration and the African Continental Free Trade Area
Skills and business performance in West Africa
LIST OF BOXES
Annex 1
Annex 2
Annex 3
Annex 4
Annex 5
Trend and projection of the working age population by region
Trend and projection of youth population (15-34) by region
Trend of working age population by country 1990-2050 (thousands)
Digital adoption index
Installed industrial robots per 10,000 employees in manufacturing, 2017
LIST OF ANNEXES
vii

W e s t A f r i c a E c o n o m i c O u t l o o k 2 0 2 0
Figure 1
Figure 2
Figure 3
Figure 4
Figure 5
Figure 6
Figure 7
Figure 8
Figure 9
Figure 10
Figure 11
Figure 12
Figure 13
Figure 14
Figure 15
Figure 16
Figure 17
Figure 18
Figure 19
Figure 20
Figure 21
Figure 22
Figure 23
Figure 24
Figure 25
Figure 26
Real GDP growth, 2011-2021 (percent)
Contribution to regional output growth in West Africa (percent), 2014-2019
Per capita GDP growth, by country, 2011-2021 (percent)
Sectoral contribution to real GDP growth in West Africa (percent), 2015-2019
Manufacturing activity in West Africa, 2000-2018
Demand side contribution to real GDP growth in West Africa (percentage), 2015-2019
Consumer price inflation in West Africa, 2011-2021 (percent)
Fiscal stance classification (number of countries)
Overall budget balance (percent of GDP)
Total external debt (percent of GDP)
Current account balance (percent of GDP)
Capital Flows to West Africa
Percent share of West Africa trade in total trade, 2018
Global rice imports (selected countries), 2018
Primary Convergence Criteria
Intra-regional merchandise Trade, Africa and other regions (1995-2018)
Intra-Africa Exports as percentage of total exports of the product (1995-2018)
Population dynamics in West Africa
Labor force participation rate (percent) in 2019
Employment classification by region and countries in West Africa (% share), 2019
Employment distribution by education in West Africa, 2019
Skills in regions and countries in West Africa (percent of total employment), 2019
Employment distribution by sector in West Africa (percent), 2019
Employment distribution by economic sector (percent of total employment), 2019
Unemployment rates by age 2012-2018
Unemployment and education
LIST OF FIGURES
viii

W e s t A f r i c a E c o n o m i c O u t l o o k 2 0 2 0
Figure 27
Figure 28
Figure 29
Figure 30
Figure 31
Figure 32
Figure 33
Figure 34
Figure 35
Figure 36
Figure 37
Figure 38
Figure 39
Figure 40
Figure 41
Figure 42
Figure 43
Figure 44
Figure 45
Figure 46
Figure 47
Figure 48
Figure 49
Figure 50
Mobile cellular subscriptions and internet using by country
Adults with a mobile money account (percent)
Have made or received digital payment
Fixed broadband subscriptions (per 100 people)
ICT enabled increase in capital services (growth in percent), 2018
Percent of time spent in task that could be automated
Mean years of schooling for 25+years by gender for West Africa 2010-2017
School enrolment rates for West African Countries 2010-2018 (percent)
Harmonized test scores
Learning-adjusted years of schoolings as percent of expected years of school
Vocational students (percent of total secondary school) 2010-2017
Graduates in STEM, 2010-2018 (percent)
Incidence of education mismatch in West and other African countries
Incidence of skills mismatch in West and other African countries
Investments in the four elements of human capital by country
Human capital index by country
Firms identifying inadequately educated workforce as a major constraint (percent)
Projection of employment by skilling (percent)
Projection of (a) high skill and (b) medium skill jobs in West Africa (percent)
Government expenditure on education as a percent of total public spending and GDP
Distribution of Education budget by levels
Household expenditure as a percent of total education expenditure
Share of private involvement in primary and secondary levels 2010-2018
Efficiency of education spending
ix

W e s t A f r i c a E c o n o m i c O u t l o o k 2 0 2 0
AfCFTA
ASME
BCEAO
CBR
CFA franc
CPI
ECOWAS
ETLS
ECI
FDI
FOW
GDP
GTP
HCI
HERQA
IADC
ICT
ILO
ILOSTAT
IMF
MDGs
OECD
OSH
PCI
SADC
SAPZ
African Continental Free Trade Area
American Society of Mechanical Engineers
West African regional central bank
Central Bank Rate
West African franc currency
Consumer Price Indices
Economic Community of West African States
ECOWAS Trade Liberalization Scheme
Economic Complexity Index
Foreign Direct Investment
Future of Work
Gross Domestic Product
Growth and Transformation Plan
Human Capital Index
Higher Education and Relevance Quality Agency
International Association of Drilling Contractors
Information and Communications Technology
International Labour Organization
International Labour Organization Statistics Database
International Monetary Fund
Millennium Development Goals
Organization for Economic Co-operation and Development
Occupational Safety and Health
Product Complexity Index
Southern African Development Community
Special Agro-Industrialization Processing Zones
LIST OF ACRONYMS
x
W e s t A f r i c a E c o n o m i c O u t l o o k 2 0 2 0
SME
SDGs
STEM
TVET
UIS
UN
UNDP
UNESCO
UNICEF
U.S
USD
WABICI
WAEMU
WAMZ
WEF
Small and medium sized enterprises
Sustainable Development Goals
Science, Technology, Engineering and Mathematics
Technical and Vocational Education and Training
UNESCO Institute for Statistics
United Nations
United Nations Development Programme
United Nations Educational, Scientific and Cultural Organization
United Nations Children’s Fund
United States
United States Dollar
West African Business and Investment Climate Improvement
West African Economic and Monetary Union
West African Monetary Zone
World Economic Forum
xi


W e s t A f r i c a E c o n o m i c O u t l o o k 2 0 2 0
EXECUTIVE SUMMARY
Prior to the outbreak of the COVID-19 pandemic, West Africa region was poised to expand by 4.0 percent in 2020.
The magnitude of socioeconomic impact of the COVID-19 pandemic on countries in West Africa may not be known
with certainty as the situation remains fluid. However, early assessment suggests that the prospect for initial growth
projection is now evidently remote. Thus, under a conservative baseline scenario, the economy is now projected to
contract by -2.0 percent in 2020, 6 percentage points below the projected growth rate prior to the pandemic. Real
output could fall by as much as -4.3 percent in a worst-case scenario with prolonged duration and depth of the spread of
the COVID-19 pandemic until the end of 2020. Growth in the region will be affected through a combination of channels,
including decline in commodity prices, low financial flows, reduced tourism earnings and heightened volatility in financial
markets. Deceleration in output growth will be reflected in negative growth in per capita income of 4.3 percent with the
attendant social ramifications.
The sharp decline in commodity prices, especially oil and metals, will propagate fiscal and external account imbalances,
stoking a build-up of public debt. Countries that depend on oil for foreign exchange and fiscal revenues such as Nigeria
and Ghana, will face limited fiscal space. Net oil importing countries could benefit from lower oil prices, but with under-
performance in revenues, amplified by the COVID-19 pandemic, the average fiscal balance could range from -6.3 percent
of GDP in the baseline scenario, widening to as much as -7.2 percent of GDP under the worst-case scenario assuming
a prolonged weakened economic setting and severe contraction in revenues.
Under such a fiscally constrained environment, countries in the region may be compelled to cut capital expenditure while
relying on external sources and domestic borrowing to finance the deficits. Uncertainty in global capital markets may
however raise financing costs, which could exacerbate debt vulnerabilities, especially in countries already at high risk of debt
distress. The potential for those classified to be at moderate risk of debt distress to slip into high indebtedness is high.
The earlier projected low inflation prior to the outbreak of the coronavirus may be elusive as government and central
banks move to cushion their economies from impact of the COVID-19 pandemic through expansionary monetary and
fiscal policies. Constraints on productive capacity due to widespread lockdown and restrictions and rise in imported
food inflation due to disruption in trade logistics and exchange rate depreciation in major economies will amplify
inflationary effects of looser monetary and fiscal policies. Thus, under a baseline scenario, average inflation is projected
to increase by about 2.2 percentage points to 10.7 percent in 2020 and could be elevated to about 11.4 percent,
should the pandemic persist until the end of 2020.
The outbreak of the COVID-19 pandemic is likely to aggravate external imbalances across the region. Overall current
account deficit for the West Africa region is forecast at 5.0 percent of GDP assuming impact of the pandemic tapers off
by the third quarter of 2020 but could widen further to about 6.0 percent of GDP under a worst-case scenario should
the pandemic persist until end of the year.
xiii

W e s t A f r i c a E c o n o m i c O u t l o o k 2 0 2 0
West Africa’s outward trade orientation and product concentration limits opportunities for intra-regional trade, which
stands at about 8.5 percent of total trade for the region. This exposes the region to external shocks, including the
COVID-19 pandemic, which has dislocated global supply chains. With intra-regional trade significantly low, opportunities
for market substitution to cushion the impact of the virus on West Africa are limited.
The outbreak of the COVID-19 pandemic came at a time when West African economies were consolidating gains from
sustained implementation of prudent macroeconomic policies and growth was picking up in slower economies. Despite
this, the unravelling effect of the coronavirus should be seen as an opportunity for the region to implement policies that
will address the health dimension of the crisis as well as build resilience against future threats to growth and macro-
economic stability. Specifically, countries in the region could consider the following policy recommendations:
• Implementation of structural reforms to accelerate economic transformation and diversification, especially in the
lagging economies of the region, whilst maintaining the growth momentum for fast growing ones.
• Establishing a credible debt consolidation strategy with focus on improving fiscal transparency across West Africa is
essential. Importantly, fresh debt should be deployed in productive projects that can generate revenue streams for
self-amortization to avoid inter-generational debt burden. Development partners should proactively engage with the
authorities at national and regional level in designing appropriate financing packages that recognize the limited fiscal
space obtainable in the region.
• Crucially, improving domestic revenue mobilization is essential in creating the much-needed fiscal space for
infrastructure and other poverty reducing spending priorities without seeking recourse to external debt and inflationary
financing by central banks. Measures to strengthen domestic revenues range from improvement of taxpayer
identification and rationalization of corporate investment tax exemptions to integration of electronic systems for
tax and customs administration that enhance compliance and enforcement of tax payments.
• Beyond economic policies, countries in the region should bolster their health care systems and increase funding
to train and equip frontline health workers. Importantly, enhancing healthcare preparedness and building early
surveillance and preventive mechanisms is crucial in saving lives. A coordinated regional approach may be more
effective than fragmented country level interventions to avoid the spread of infections across borders.
Labor force participation rate for the working population has consistently declined since the beginning of the millennium
from 64.2 percent in 2000 to 58.5 percent in 2019 and is expected to further decline to 58.2 percent in 2022. The
decline is reflected in lower wage employment existing alongside high informal employment across the region.
Increasing demand for digital services in West Africa has the potential to transform the region’s labor market and move
people out of informal activities into more productive, sustainable wage employment. However, despite the increase in
access to such technologies as internet services, West Africa remains digitally under connected. Only Cabo Verde,
Côte d’Ivoire, Ghana, Nigeria and Senegal, have higher internet penetrations than the African average of 25.4 percent
but much lower than the global average of 58 percent.
With the current low index on human capital development, ranging from 0.32 to 0.44, the region’s next generation
workforce could lose between 56 percent and 68 percent of its ability and quality, which could affect adaptation to
technology. This has implications on the future of work, shaped by the fourth industrial revolution (4IR).
xiv

W e s t A f r i c a E c o n o m i c O u t l o o k 2 0 2 0
Although West African countries have made improvements in school enrolment achieved over the last two decades,
retention rates remain low. The inability of pupils to stay in school and successfully complete their primary education
remains a challenge for most countries in the region. The cumulative dropout rate to the last grade of primary and lower
secondary education is above 25 percent in majority of countries. In some cases – Benin, Liberia and Sierra Leone– it
exceeds 50 percent.
Dropping out of school limits the number of students transitioning to tertiary education with outcomes in science,
technology, engineering and mathematics (STEM) especially more severe. Most countries in the region have less than
20 percent of tertiary graduates in STEM. Yet demand for these skills is increasing and will define the future of work.
The skills mismatch in the region shows up in low human capital development, a constraint in adapting to new techno-
logies and innovating to compete globally.
Policies to improve skills for the work of the future in West Africa need to, inter alia, encompass the following:
• Accelerating improvements in digital infrastructure and creating opportunities for skills development and
entrepreneurship to enable creation of new jobs defined by the 4IR.
• Creating incentives for private sector investment in skills development and support education systems to adopt
technology driven programs, placing emphasis on quality rather than quantity in order to prepare graduates for the
job market. Learning should be a continuous process to create lifelong skills key to maintaining a productive work
force that is abreast with the new and changing labor market.
• As automation and digitization shapes the structure of work with the potential to displace a section of the workforce,
governments are required to formulate and implement labor market and human development policies for skills
upgrading to insulate workers from disruptions resulting from constant technological change.
• Scaling up public expenditure in education, and importantly, ensuring that resources are efficiently allocated is critical
to improving quality and outcomes. Partnering with global technology companies can also create avenues for
research and development to boost skills development for the future. For instance, Google’s Artificial Intelligence
Research Lab in Accra, Ghana, provides valuable lessons for such partnerships.
xv


1
W e s t A f r i c a E c o n o m i c O u t l o o k 2 0 2 0
RECENTMACROECONOMIC
DEVELOPMENTSANDOUTLOOK
1.1 GLOBAL MACROECONOMICTRENDS AND DEVELOPMENTS
Average global growth declined from 3.6 percent in 2018 to
3.0 percent in 2019. In the advanced economies, growth fell
from 2.3 percent in 2018 to 1.7 percent in 2019. In the wake
of the coronavirus (COVID-19) pandemic, the International
Monetary Fund (IMF) projects that world output will contract
by -3 percent, sharply down from earlier growth forecast
of 2.5 percent in January 2020 prior to the outbreak of the
pandemic. The contraction in global output reflects broad-
based fragility of the world economy induced by outbreak
of the COVID-19 pandemic, with unimaginable cascading
and disruptive effects to human life.
The initial lockdown in key production areas in China followed
by widespread disruptions across the world as the epicenter
shifted to Europe and the United States (U.S), has had a
devastating impact on international supply chains and curtailed
movement of people, goods and services. As a result, economic
growth in advanced economies is projected at -6.1 percent with
Italy and Spain, two countries in Europe most affected by the
pandemic, contracting by the largest magnitude of -9.1 and -8.0
percent, respectively. The U.S economy, with rapidly increasing
jobless claims, is projected to shrink by about -6 percent.
In emerging market and developing economies, output is
projected to contract by -1.0 percent in 2020. This projection
reflects sharply deceleration from 3.7 percent growth posted
in 2019. The projected smaller negative growth also remains
uncertain and depends on pace of recovery in China and
effectiveness of a raft of stimulus measures and policy
adjustments adopted in advanced countries to shore up
their economies against the adverse impact of the COVID-19
pandemic.
In Africa, GDP growth for 2019 was estimated at 3.2 percent.
While some countries have posted growth of 7 percent and
above (Côte d’Ivoire, Ethiopia, Rwanda), the performance of
three of the continent’s largest economies (Nigeria, South
Africa and Angola) has been sluggish. These economies
account for about 40 percent of continental output and a
slowdown in either of them translates directly into lower
average growth for Africa.
The sharp decline in price of oil is likely to exacerbate fiscal
and external imbalances in countries that depend on it
for foreign exchange and revenues. For instance, Nigeria’s
marginal gains in the aftermath of the 2016 recession may
be reversed while continued fragility of the Angolan and South
African economies will deepen further. The efficacy of fiscal
and monetary policy measures instituted by Nigeria and other
countries to tackle the effect of the COVID-19 pandemic will
largely depend on the speed with which additional supportive
structural policies are deployed to enhance private sector
response to the stimuli.
PART 1

2
1.2 RECENT MACROECONOMIC DEVELOPMENTS IN WEST AFRICA
1.2.1 Growth and drivers
After the slowdown in 2016 on the weight of Nigeria’s
economic recession, growth in West Africa picked up was
far from uniform across the region. Average growth for the
region was estimated at 3.6 percent in 2019, 0.2 percentage
points higher than the preceding year. This growth mirrored
global growth and performance in other regions of Africa
(Figure 1). West Africa has consistently been the third fastest
growing region in Africa, lagging behind East Africa and
North Africa, although it has seen growth accelerate in more
countries than in other regions, over the past two years. The
lag stems largely from the slowdown in Nigeria, whose
weight in regional growth overshadows the fastest growing
economies. This dominance was evident during the 2016
recession in Nigeria, when average regional growth dipped
to 0.8 percent from an average of 5.8 percent recorded
during 2011-2015. The same pattern is likely to be replicated
as the impact of the COVID-19 pandemic buffets the
Nigerian economy, pushing it into a deeper recession, more
than other countries in the region. Overall, the resilience of
the region has been tested by the widespread impact of
the COVID-19 pandemic, which has affected even the
fastest growing economies through shrinkage in trade and
investment flows, sharp decline in commodity prices, loss
in tourism flows, and overwhelmed the health and social
sectors. Thus, what seemed a purely health has morphed
into a deep economic and social crisis of unimaginable
proportions. Thus, in 2020, average regional growth is likely
to shrink by between -2.0 percent under a conservative
baseline scenario, assuming the COVID-19 pandemic
dissipates within the third quarter of 2020 and -4.3 percent
should the pandemic linger on for the rest of the year.
W e s t A f r i c a E c o n o m i c O u t l o o k 2 0 2 0
-8.0
-6.0
-4.0
-2.0
0.0
2.0
4.0
6.0
2011-2017 2018 2019(e) 2020(p) 2021(p) 2020(p) 2021(p) 2020(p) 2021(p)
Actual Pre-COVID-19 COVID-19 Baseline COVID-19 Worst Case
Central Africa East Africa North Africa Southern Africa West Africa Africa
Figure 1: Real GDP growth, 2011-2021 (percent)
Source: Computed using data from AfDB Statistics Dept.
(a) West Africa versus other regions of Africa

3
W e s t A f r i c a E c o n o m i c O u t l o o k 2 0 2 0
-8.0-6.0-4.0-2.00.02.04.06.08.010.0
2011-2017 2018 2019(e) 2020(p) 2021(p) 2020(p) 2020(p) 2021(p)
Actual Pre-COVID-19 COVID-19 Baseline COVID-19 Worst Case
Benin Burkina Faso Cabo Verde Côte d'Ivoire The Gambia
Ghana
Guinea Guinea-Bissau Liberia Mali Niger
Senegal Nigeria Sierra Leone Togo
2021(p)
Source: Computed using data from AfDB Statistics Dept.
West African countries can generally be classified into
four groups, depending on the pace of growth and how
each will be affected by the COVID-19 pandemic. Group I
countries comprising Benin, Burkina Faso, Côte d’Ivoire,
Ghana, Guinea, Niger and Senegal consistently posted
faster annual average growth rate of 5 percent or higher
from 2017-2019. These countries account for about 26
percent of the region’s GDP. In Group II, comprising Liberia
and Nigeria, growth has been sluggish and is likely to remain
depressed, due to slower recovery from the recession that
both countries suffered in 2016 and the impact of the
COVID-19 pandemic which could exacerbate fragility of
growth in these economies. As noted above, Nigeria’s
significant contribution to regional GDP particularly implies
that the weakness in its economy directly translates into a
decline in average growth for West Africa. This dominance
can be observed in Group II economies’ contribution to
regional growth (Figure 2).
-1.80
-0.40
1.00
2.40
3.80
5.20
6.60
2014 2015 2016 2017 2018 2019
Group I Group II Group III Group IV
Figure 2: Contribution to regional output growth in West Africa (percent), 2014-2019
Source: Computed using data from AfDB Statistics Dept.
(b) Real GDP by country in West Africa

4
W e s t A f r i c a E c o n o m i c O u t l o o k 2 0 2 0
-2.5 -1.6 -0.8 0.0 0.8 1.6 2.5 3.3 4.1 4.9 5.7
2011-2017 2018 2019 (e) 2020 (p) 2021 (p)
Ghana Côte d'Ivoire Benin Cabo Verde
Senegal Burkina Faso Guinea Sierra Leone Togo Niger Guinea-Bissau The Gambia
Mali West Africa Nigeria Liberia
Figure 3: Per capita GDP growth, by country, 2011-2021 (percent)
In between the two polar ends are groups of countries
that have either improved their performance or experienced
high volatility in real GDP growth and the COVID-19 pandemic
is likely to aggravate this volatility. Group III, with growth
improvement from less than 5 percent in 2017 to 5 percent
or higher in 2019 comprises Cabo Verde, The Gambia and
Togo. However, these small economies accounted for only
0.2 percentage points of the region’s overall GDP growth
in 2019. The last, Group IV, comprising Guinea Bissau, Mali
and Sierra Leone, is characterized by fluctuating growth
rates. Countries in this group experienced a slowdown in
GDP growth in 2018 before rising to 5 percent in 2019 and
contributed less than 0.2 percentage points to the region’s
growth. The political impasse in Guinea Bissau, the insurgency
in northern Mali and political transition in Sierra Leone, with
the attendant uncertainty, partly explain the observed output
volatility in these countries. Growth could slowdown further
with the outbreak of the coronavirus.
Growth in real GDP has not kept pace with population growth
and will remain more depressed, weighed down by effects of
the COVID-19 pandemic. This will lead to severe contraction in
real GDP per capita, down for the earlier estimate (see Figure
3). Whereas maintaining higher output growth whilst keeping
population growth under control is critical to inclusive growth,
redistribution of the gains from higher growth is fundamental to
achieving inclusive growth. The service sector is the main driver
of growth on the supply side in West Africa, exceeding manu-
facturing and agriculture. The service sector continues to
dominate in terms of contribution to average real GDP growth
rate in West Africa. Except for a few countries, the service
sector accounts for more than half of GDP.
The shares of agriculture and industry have either been
declining or remained relatively stagnant. Structural transfor-
mation in West Africa, and Africa more generally, has been
unconventional as evidenced by transition from agriculture to
services. The missing link of improved manufacturing and
industrialization more broadly, highlights unsustainability of
this transformation model (Barrett, et al., 2017; Rodrik, 2016).
Figure 4 (a) shows that in 2018, the service sector contributed
1.6 percentage points to growth, and in 2019, the rate
expanded to 2.1 percentage points. At country level, Figure
4 (b) shows that the services sector contributed 3 percentage
points or higher to real GDP growth in eleven of the 15 countries
in West Africa.
Source: Statistics Department, AfDB.

5
W e s t A f r i c a E c o n o m i c O u t l o o k 2 0 2 0
Figure 4: Sectoral contribution to real GDP growth in West Africa (percent), 2015-2019
Source: Statistics Department, AfDB.
1.0 0.9 1.1
-0.0
0.9 0.51.1
1.6 2.1
-0.5
0.0
0.5
1.0
1.5
2.0
2.5
3.0
3.5
4.0
Average 2015-17 2018 2019
Agriculture Industry Services GDP growth
4.0
3.5
3.0
2.5
2.0
1.50
1.10.
2.1.6
0 9 .5
.1
Avera
1.0
0.5
0.0
-0.5
0
0 02age 2015-17
0 0-0.0
Agriculture Industry
0.
202018
0.9
Services GDP gro
.5
019
wth
-10.0-8.0-6.0-4.0-2.00.02.04.06.08.0
10.0
Beni
nBu
rkin
a Fa
soCa
bo V
erde
Côte
d’Iv
oire
The
Gam
bia
Ghan
aGu
inea
Guin
ea-B
issau
Libe
riaM
ali
Nig
erN
iger
iaSe
nega
lSi
erra
Leo
neTo
goBe
nin
Burk
ina
Faso
Cabo
Ver
deCô
te d
’Ivoi
reTh
e Ga
mbi
aGh
ana
Guin
eaGu
inea
-Biss
auLi
beria
Mal
iN
iger
Nig
eria
Sene
gal
Sier
ra L
eone
Togo
Beni
nBu
rkin
a Fa
soCa
bo V
erde
Côte
d’Iv
oire
The
Gam
bia
Ghan
aGu
inea
Guin
ea-B
issau
Libe
riaM
ali
Nig
erN
iger
iaSe
nega
lSi
erra
Leo
neTo
go
Average 2015-17 2018 2019
Agriculture Industry Services
(a) Regional Average
(b) At country level

6
The largest contribution of the service sector was 4.5 percentage
points in Ghana followed by Togo and Benin with 4.4 and 4.2
percentage points, respectively. Liberia recorded the lowest
contribution of -0.5 percentage points, and in Nigeria, the
region’s major economy, services contribution to real GDP growth
was 1.4 percentage points. The contribution of the services
sector to growth exceeded that from industry and agriculture
for majority of countries. The largest contribution from industry
sector of 3 percentage points was recorded in Mali and in
agriculture, it was 2.1 percentage points in Burkina Faso, one of
the most agrarian economies in West Africa. Given dominance
of the service sector, the impact of the COVID-19 pandemic –
notably on tourism and retail and trade, weighed down by travel
restrictions and/or lockdowns, will likely manifest itself in deep
output contraction. For instance, in Cabo Verde, where tourism
contributes more than 40 percent to GDP, the fall in tourist
arrivals by 500,000 could affect both growth and revenues.
Industrialization, and especially manufacturing, should be the
bedrock of the competitiveness of West African economies.
However, the industrial sector is currently not sufficiently
diversified to produce a wide variety of intermediate and
finished products or create sustainable jobs. Growth in
West African countries remains mainly concentrated in
retail trade and other low-productivity services. According to
Haile (2018), growth in Benin, Burkina Faso and Côte d’Ivoire
has not been propped up by sector productivity improvements
and there is little labor movement to higher productivity
manufacturing sector, while the low productivity service
sector has expanded disproportionately. West Africa’s
structural transformation towards non-tradeable services
as against tradeable manufacturing may have been fueled
by the commodities boom, and may not be sustainable
(Rodrick, 2016).
Figure 5 shows that the contribution of manufacturing in overall
industry has been declining relative to other industries as well
as in comparison to agriculture and services. Importantly,
only two countries (Côte d’Ivoire and Nigeria) produce more
than 80 percent of total regional manufacturing output. With
the low contribution of manufacturing sector in key measures
of economic diversification, achieving the regional vision of
accelerated industrialization and competitiveness is likely to
remain a challenge for West Africa.
W e s t A f r i c a E c o n o m i c O u t l o o k 2 0 2 0
0.0
10.0
20.0
30.0
40.0
50.0
60.0
Agriculture Services Manufacturing Other industry
Industry
Sectoral employment (% total employment) Value added (% of GDP)
2000 2006 2012 2018
Figure 5: Manufacturing activity in West Africa, 2000-2018
Source: Statistics Department, AfDB.

7
Strong household consumption is a key driver of growth in
West African countries. Household consumption remains
the principal contributor to growth in many West African
countries (Figure 6). Private consumption is buoyed by
macroeconomic stability and growing size of the middle
class. Household consumption was highest in smaller
economies. In Guinea Bissau, household consumption
contributed more than 6 percentage points to growth, the
highest in the region in 2019. The Gambia, Mali and Burkina
Faso followed with more than 5 percentage points. In The
Gambia, continued political stability underpinned growing
consumer sentiment.
Private consumption in Nigeria, the largest economy in the
region, remains subdued since the recession of 2016, as
unemployment soared, exceeding 23 percent overall and
nearly 30 percent for the youth from the third quarter of 2018.
Rising inflation also eroded purchasing power of the country’s
middle class. Nigeria has 18.6 million middle class population.
Contrastingly, the re-emergence of the middle class in Côte
d’Ivoire since the end of the war is fueling growth in consumer
spending and estimates show that from 2019 and 2030,
the spending power of the middle class in the country will
increase by about 154 percent.
The impact of the COVID-19 pandemic on livelihoods
could reduce the purchasing power of both low and
middle-income households in West Africa. Countries in the
region have imposed lockdowns and restrictions in varying
proportions, ranging from complete shutdown of economic
hubs during the initial months of the pandemic outbreak,
in case of Nigeria and Ghana, to more nominal restrictions
of night movements largely affecting entertainment services,
for instance in Côte d’Ivoire. This supply shock has adverse
implications on productive capacity, supply chains and
logistics and, hence trade and will translate into general fall
in household income for both formal and informal sector
workers. Women and youth, who are mostly engaged in the
informal sector, and facing lockdowns, will be disproportionately
impacted by the decline in income generating capacity during
the COVID-19 pandemic crisis.
Only few countries in West Africa recorded positive contribution
of net exports to growth. Côte d’Ivoire, Ghana, Nigeria and
Sierra Leone lifted the region’s growth through improvements
in exports as majority of other countries in the region posted
contraction in net exports. Côte d’Ivoire posted percentage
point gains from net exports while the contribution of net
exports to real GDP growth ranged from 2.5 percentage
points in Ghana to 3.3 percentage points in Nigeria and
nearly 4 percentage points in Sierra Leone. Nigeria benefited
from the combination of rebound in oil exports and import
contraction due to ban on certain items and strict enforcement
of border closure against its neighbors, the conduit for most
imported rice and other cereals. The impact of the coronavirus
is likely to depress net exports contribution, especially for
countries dependent on primary commodities, whose prices
have fallen sharply.
W e s t A f r i c a E c o n o m i c O u t l o o k 2 0 2 0

8
The contribution of investment demand to growth has been
strongest in countries with large public infrastructure projects
and foreign direct investment, especially in extractive sectors.
Much of the investment occurred in the three countries of the
region, Côte d’Ivoire, Ghana and Nigeria, which incidentally,
also contributed the most to household consumption
spending. In the wake of the coronavirus, both public and
private investment are likely to decline in the short-to-medium
term, with adverse impact on growth. Public infrastructure
investment will be dampened by growing fiscal imbalances
as countries grapple with decline in revenues.
The spread of COVID-19 pandemic is expected to affect
capital expenditure from the budget and subdue foreign
direct investment in the region. Nigeria has already cut its
capital expenditure by 20 percent while in Senegal, the
economic slowdown in China and European Union, which
account for 70 percent of total FDI to the country, could affect
government’s efforts to fully operationalize the Special
Economic Zone through the “Triangle of Prosperity” project.
Other countries in the region could face similar impacts,
depending on the duration of the pandemic and the nature of
policy response to mitigate the impact, especially on domestic
investment demand.
Inflationary pressures in West Africa moderated in 2018 and
2019 but the impact of COVID-19 pandemic could reverse
the gains. Average inflation in West Africa fell to 8.5 percent
in 2019 from 9.4 percent the previous year, a decline for the
second consecutive year (Figure 7a). Inflation is generally
lower in the WAEMU region than in the non-WAEMU group
of countries (Figures 7b and c). In the former group, it
averaged less than 1 percent in 2019 compared with 10
percent in the non-WAEMU region.
The ease in inflationary pressures in 2018 and 2019 largely
reflects downward movements in food prices and low pass
through effects due to the relatively more stable exchange
rates. In the WAEMU countries (Burkina Faso, Niger and
W e s t A f r i c a E c o n o m i c O u t l o o k 2 0 2 0
Beni
nBu
rkin
a Fas
oCa
bo V
erde
Côte
d'Iv
oire
The G
ambi
aGh
ana
Guin
eaGu
inea
-Biss
auLib
eria
Mali
Nige
rNi
geria
Sene
gal
Sierra
Leon
eTo
goW
est A
frica
Beni
nBu
rkin
a Fas
oCa
bo V
erde
Côte
d'Iv
oire
The G
ambi
aGh
ana
Guin
eaGu
inea
-Biss
auLib
eria
Mali
Nige
rNi
geria
Sene
gal
Sierra
Leon
eTo
goW
est A
frica
Beni
nBu
rkin
a Fas
oCa
bo V
erde
Côte
d'Iv
oire
The G
ambi
aGh
ana
Guin
eaGu
inea
-Biss
auLib
eria
Mali
Nige
rNi
geria
Sene
gal
Sierra
Leon
eTo
goW
est A
frica
Investment Nets Exports
-10.0
-5.0
0.0
5.0
10.0
15.0
Average 2015-2017 2018 2019
Figure 6: Demand side contribution to real GDP growth in West Africa (percentage), 2015-2019
Source: Statistics Department, AfDB.

9
W e s t A f r i c a E c o n o m i c O u t l o o k 2 0 2 0
Figure 7: Consumer price inflation in West Africa, 2011-2021 (percent)
Source: Computed using data from Statistics Department, AfDB.
Benin) a combination of lower fiscal deficit and improved
agriculture production helped keep inflation in check. Inflation
in Burkina Faso fell to -3.2 percent in 2019 from 2.0 percent
the previous year while Niger posted 1.5 percent inflation,
down from 2.7 percent in 2018. In Benin, inflation was recorded
at negative one percent, due to oversupply of agriculture
products following the border closure imposed by Nigeria to
curb rice smuggling from that country. Benin is a transit point
for imported rice into Nigeria.
In the non-WAEMU region, the decline in inflation in countries
such as The Gambia benefitted from lower prices of rice, the
country’s major import commodity. Inflation in Liberia fell
marginally in 2019 to 21.7 percent from 23.5 percent, the
previous year on the back of relatively lower global prices of
oil and rice, two of the country’s major imports.
With the outbreak of the COVID-19 pandemic, the gains on
inflation may not be sustained due to constraints on productive
capacity and the rise in imported food prices as disruption in
logistics is likely to hamper trade flows. Depreciations in exchange
rates may also fuel inflationary pressures. Under a baseline
scenario, average inflation is projected to increase to 10.7 percent
from 8.5 percent in 2019 and the earlier pre-COVID-19 projected
decline to 8.8 percent in 2020 and could hit double digit figure
under the more pessimistic worst-case scenario.
-3-4
-2-1012345
BeninBurkina Faso
Côte d'IvoireGuinea-Bissau
MaliNiger
SenegalTogo
Actual Pre-COVID-19 COVID-19 Worst Case
COVID-19Baseline
2011
-201
7
2018
2019
(e)
2020
(p)
2021
(p)
2020
(p)
2021
(p)
2020
(p)
2021
(p)
(b) WAEMU Countries
Cabo VerdeThe Gambia
GhanaGuinea
LiberiaNigeria
Sierra Leone
2011
-201
7
2018
2019
(e)
2020
(p)
2021
(p)
2020
(p)
2021
(p)
2020
(p)
2021
(p)
Actual Pre-COVID-19 COVID-19 Worst Case
COVID-19Baseline
05
1015202530
(c) Non-WAEMU Countries
Benin Burkina Faso Cabo Verde Côte d'Ivoire The Gambia GhanaGuinea Guinea-Bissau Liberia Mali Nigeria NigerSenegal Sierra Leone Togo West Africa
-5
0
5
10
15
20
25
30
2011-2017 2018 - 2020 (p) 20121 (p) 2020 (p) 20121 (p) 2020 (p) 20121 (p)2019 (e)
Actual Pre-COVID-19 COVID-19 Baseline COVID-19 Worst Case

10
W e s t A f r i c a E c o n o m i c O u t l o o k 2 0 2 0
84
7 8 8 10
3 3
611
8 6 65
12 12
1 0 0 1 1
2015
2016
2017
2018
2019
2020
(Pre
-CO
VID)
2020
(CO
VID-
Base
line)
2020
(CO
VID-
Wor
st
Case
)
Figure 8: Fiscal stance classification (number of countries)
Source: Computed using data from Statistics Department, AfDB.
Fiscal consolidation remains a key challenge in many countries
in West Africa. As Figure 8 shows, the number of countries
with improved fiscal position and those with weaker or stable
fiscal balances remained unchanged in 2019 relative to the
previous year. On average however, the fiscal deficit (as a
percentage of GDP) widened to 4.6 in 2019 from 4.2 percent
in 2018 but there are country level differences in performance.
Prior to the outbreak of the COVID-19 pandemic, the overall
fiscal deficit for the region was projected to narrow to 4.1 percent
of GDP in 2020. However, the impact of the pandemic on
several countries has completely altered this prospect.
All except three countries, are likely to experience severe
deterioration in their fiscal position (see also Figure 9). Thus,
the average fiscal deficit is projected to widen to 6.3 percent
of GDP under the baseline scenario and could deteriorate to
more than 7 percent assuming constrained economic growth
and severe contraction in revenues as the pandemic persists
to end 2020. Cabo Verde will be the most affected, largely
due to contraction in tourism earnings. As a result, the
number of countries with weaker fiscal positions will double
from 6 in 2019 to 12 in 2020 both under a baseline or
worst-case scenarios, with the latter exhibiting a larger fiscal
contraction. With such constrained fiscal situation, countries’
performance with respect to the ECOWAS convergence
criteria of a fiscal deficit of 3 percent of GDP or lower will
therefore remain elusive in majority of countries. Only Benin,
The Gambia, Guinea and Togo, are likely to meet the criteria
under the baseline scenario, with Togo the only country to
have consistently met the target for three consecutive years
since 2018 (see Figure 9). Assuming the pandemic persists
for much longer period (worst-case scenario), no country in
the region is likely to meet the convergence criteria.

11
W e s t A f r i c a E c o n o m i c O u t l o o k 2 0 2 0
-10.0-9.0-8.0-7.0-6.0-5.0-4.0-3.0-2.0-1.00.0
Benin
Burkina F
aso
Cabo Verde
Côte d’Ivoire
The Gambia
Ghana
Guinea
Guinea-Biss
auLib
eria MaliNige
r
Nigeria
Senega
l
Sierra
Leone
Togo
2019 (e) Pre-COVID-19 2020 (p) COVID-19 Baseline 2020 (p) COVID-19 Worst Case 2020 (p)
Figure 9: Overall budget balance (percent of GDP)
Source: Statistics Department, AfDB.
Since many countries in West Africa finance their budgets
through tax revenues, the deterioration in economic activity
will severely affect revenue performance. Coupled with the
challenges of reducing recurrent expenditure, particularly on
wages and salaries in order to preserve workers’ purchasing
power during the period of the pandemic, the fiscal imbalance
could be prolonged. In Ghana, tax revenues account for about
79 percent of the budget, but wages and other personnel
compensations as well as interest cost and statutory contri-
butions consume more than half of the budget. In Liberia,
wages and salaries account for about 70 percent of the
national budget.
Yet domestic revenue mobilization in West Africa remains low
and dominated by taxes, averaging less than 8 percent of
GDP across the region. Only Cabo Verde has a revenue-
to-GDP ratio above 20 percent. In Burkina Faso, Senegal
and Togo, this figure is about 18 percent. Nigeria’s non-
oil revenues account for less than 4 percent of GDP, the
lowest in West Africa. Weak compliance and enforcement
are blamed for low yield of non-oil revenues in Nigeria. Under
a COVID-19 stressed economic and health environment,
countries in the region may be compelled to cut capital
expenditure even further while recurrent spending assumes
priority. For instance, facing mounting revenue shortfalls,
Nigeria announced a reduction in capital and non-essential
expenditure by about 20 percent.
With revenues sharply depressed amidst rising spending
pressures, all countries in West Africa will increasingly rely
on external sources (and domestic borrowing for some) to
finance their fiscal deficits but the uncertainty in global capital
markets may raise financing costs. In Cabo Verde, government
plans to cover the fiscal deficit through a combination of
concessional loans which currently account for about 75
percent of the public debt. The country also plans to issue
bonds to commercial banks and other private creditors.
About 83 percent of Ghana’s deficit was financed by
proceeds from Eurobonds in 2019, while Senegal’s fiscal
deficit of 3.7 percent was fully financed by external loans.
In contrast, Nigeria suspended the USD22 billion external
borrowing plan due to deteriorated macroeconomic situation

12
W e s t A f r i c a E c o n o m i c O u t l o o k 2 0 2 0
and country’s credit rating downgrade into non-investment
grade, which could raise financing costs in international
capital markets. Instead, the revenue shortfall will be covered
through increased threshold for domestic borrowing as well
as access to crisis financing facilities by multilateral development
financial institutions. The IMF approved Nigeria’s request for
USD3.4 billion in emergency financial assistance from the
Rapid Financing Instrument to help the country address the
severe economic shock of the COVID-19 pandemic and its
attendant adverse impact on oil prices, and hence revenues.
Nigeria also requested USD1 billion from the Crisis Response
Facility of the African Development Bank. In addition, ten1 of
the 15 countries in West Africa are expected to benefit from
the IMF’s COVID-19 grant-based debt service relief to enable
them channel their otherwise financial obligations to the
IMF towards essential medical and health expenditures. This
moratorium could reduce the short-term debt vulnerability of
the beneficiary countries.
Key sources of domestic revenues – commodity exports and
tourism will be subdued as the impact of the coronavirus
takes its toll. Revenues in Nigeria could fall as much as 45
percent due to the slump in oil exports, while Ghana could
lose as much as half of its USD4.4 billion projected oil export
revenues. Cabo Verde, which generates 50 percent of its
revenues from tourism, is projected to record a decline in
tourism arrivals as the epicenter of the COVID-19 pandemic
hits Europe and United Kingdom, the key source markets
for the country’s tourism sector. The Gambia will equally be
1 Benin, Burkina Faso, The Gambia, Guinea, Guinea-Bissau, Liberia, Mali, Niger, Sierra Leone, and Togo.
0.0
20.0
40.0
60.0
80.0
100.0
120.0
140.0
2015 2017 2019 (e)
Benin
Burkina F
aso
Cabo Verde
Côte d’Ivoire
The Gambia
Ghana
Guinea
Guinea-Biss
auLib
eria MaliNige
r
Nigeria
Senega
l
Sierra
Leone
Togo
West Afric
a
Figure 10: Total external debt (percent of GDP)
Source: Statistics Department, AfDB.

13
W e s t A f r i c a E c o n o m i c O u t l o o k 2 0 2 0
affected by fall in tourism revenues, further aggravating its
fiscal situation. The fall in revenues will impair fiscal space
available for other expenditures, including spending on social
services and fighting insurgency across the Sahel belt
covering 12 of the 15 countries in West Africa.2 As high as
86 percent of pensioners in Cabo Verde could be impacted
by lower spending on social services but only 2.7 percent
of the population will be affected in Burkina Faso, which is
however affected by rising insecurity, and could see a spike
in military expenditure.
The average external debt to GDP ratio in West Africa
has increased steadily over the past decade. Total external
debt rose from 20 percent of GDP in 2015 to 28.8 percent
in 2017 and further to 31.1 percent in 2019 (Figure 10).
However, the regional average masks significant country
differences in debt profile. Total external debt was highest in
Cabo Verde at 113.8 percent of GDP, but Senegal recorded
the single largest increase in the proportion of Total external
debt, by more than 15 percentage points from 55.8 percent
in 2015 to an estimated 71.7 percent in 2019, fueled by
high public financing needs, especially for infrastructure
development. Senegal spends about a third of its revenues
on servicing public debt. Between 2015 and 2019, the
proportion of Liberia’s public debt more than doubled from
16.4 percent to 32.4 percent of GDP. Overall, Cabo Verde has
the highest share of debt to GDP, estimated at 104.4 percent
in 2019. Although this was lower than the 116.4 percent in
2017, it highlights the country’s vulnerability to economic
shocks, including the expected decline in tourism revenues
triggered by the outbreak of the COVID-19 pandemic. Apart
from Cabo Verde, only Ghana and Burkina Faso recorded
declines in their debt to GDP ratios.
Public debt for several countries is from concessional
sources (Niger, Cabo Verde, Burkina Faso). However,
a few countries have also issued Eurobonds to meet
their financing needs. With economic conditions markedly
weakened in the wake of the COVID-19 pandemic, the cost
of issuing debt for stressed economies may be significantly
higher, particularly in countries already experiencing slower
growth. In Nigeria, one of only two slowest growing economies
and largest portfolio of Eurobonds, the yield on its 10-year
note maturing in January 2021 was trading at 12.787 percent
as at end-March 2020 from 7.00 percent at issue and 3.172
at end of December 2019. The downgrade of its credit
rating by Fitch and Standard and Poors, could further push
yields higher.
The rise in public debt has already pushed countries to the
brink of debt distress. According to the November 2015
debt assessment published by the IMF, four countries were
at low risk of debt distress. By August 2019, the number
of countries at moderate and high risk of debt distress
had increased. The Gambia, which in 2015 was classified as
being at moderate risk, had descended into a situation of
debt distress. Table 1 shows the debt status of all countries
over the two periods. The debt moratorium grated to the ten
countries in West Africa by the IMF is likely to ease the burden
of their debt repayment during the period of the COVID-19
pandemic.
2 This includes part of Benin, Burkina Faso, Côte d’Ivoire, The Gambia, Guinea, Guinea Bissau, Liberia, Mali, Niger, Nigeria, Senegal and Togo.

14
W e s t A f r i c a E c o n o m i c O u t l o o k 2 0 2 0
Table 1: Risk of Debt Distress for West African Countries
August 2019
Low risk Moderate risk High risk Debt distress
Low risk Benin, Liberia, Nigeria, Senegal*
November2015
Moderate riskBurkina Faso, Côte d’Ivoire, Guinea, Guinea-Bissau, Mali, Niger, Togo
Cabo Verde,Sierra Leone
The Gambia
High risk Ghana
Debt distress
Source: IMF Sustainability Analysis Database.
Notes: *December 2019 DSA; updated in April 2020 changed the level of debt distress from low to moderate.
West Africa has experienced persistent current account
imbalances for more than a decade. The current account
deficit rose sharply from an average of -0.7 percent of GDP
during 2011-2017 to about -4.4 percent in 2019. The current
account has been in deficit in the region’s smaller economies,
especially those experiencing marked external imbalances.
For instance, The Gambia, Guinea, Liberia, Niger and Sierra
Leone, recorded double digit deficits since 2011, averaging
-18.5 percent of GDP among them (see Figure 11). External
accounts are projected to weaken across the region due to
the COVID-19 pandemic associated risk aversion, which
could lead to a reversal in foreign capital flows.
The deficit is projected to widen to an average of 5 percent
of GDP in 2020 under a baseline scenario, with potential
to overshoot to 5.9 percent, should the impact of the
pandemic persist for the rest of 2020. The surplus will
be eroded on shrinking oil exports and possible reversal
in capital flows. Liberia and Sierra Leone have not
fully recovered from the devastating effect of the Ebola
crisis and the outbreak of the COVID-19 pandemic further
aggravates the external imbalance. In The Gambia, growth
in tourism spending was zero in 2018 and 2019 and under
the baseline scenario the current account deficit will almost
double to -10 percent of GDP due to contraction in tourism
activity induced by the coronavirus. In Niger, the widening
deficit is linked to diminished export earnings mainly from
uranium.

15
W e s t A f r i c a E c o n o m i c O u t l o o k 2 0 2 0
Benin
Burkina F
aso
Cabo Verde
Côte d'Ivoire
The Gambia
Ghana
Guinea
Guinea-Biss
auLib
eriaMali
Niger
Nigeria
Senega
l
Sierra
Leone
Togo
West Afric
a
2011-2017 2018 2019(e)
Pre-COVID-19 2020 (p) COVID-19 Baseline 2020 (p) COVID-19 Worst Case 2020 (p)
-30
-25
-20
-15
-10
-5
0
5
Figure 11: Current account balance (percent of GDP)
Source: Statistics Department, AfDB.
The pattern of private external capital flows to West Africa
has been mixed, reflecting differences in local conditions.
After a slump in 2016, remittances have recovered by nearly
9 percent year-on-year, reaching USD34 billion in 2018 from
USD31.2 billion in 2017 (Figure 12). In absolute terms, Nigeria
received USD24.3 billion in diaspora remittances in 2018,
becoming the largest recipient in Africa and sixth among
lower middle-income countries (Ratha 2019). Nigeria also
remains the regional leader with over 70 percent of total
remittance inflows to West Africa. However, as key source
markets – U.S and Europe, face high prospects of economic
recessions due to the COVID-19 pandemic, Nigeria could
experience a decline in remittances. Ghana and Senegal
follow at a distance with 10.4 percent and 7 percent share of
remittances to the region, respectively. Within West Africa,
disruptions in economic activities due to the COVID-19
pandemic is likely to affect flows of remittances across the
region. For instance, economic slowdown in Côte d'Ivoire,
a large source market for remittances across the French
speaking West Africa, could impact remittances to such
countries as Burkina Faso, Mali, Senegal, and even Nigeria.
Foreign direct investment (FDI) has been on a downward
trend, declining by as much as 10.4 percent between 2017
and 2018. This trend could continue and even deepen
due to the impact of the pandemic. Nigeria and Ghana are
the top destinations for FDI in West Africa although their
share has declined in recent years and might shrink further.
In 2019, both countries accounted for 52.5 percent (Ghana
-31.5 percent and Nigeria-21percent) of total FDI inflows.
Nigeria has surrendered its top position to Ghana.

16
W e s t A f r i c a E c o n o m i c O u t l o o k 2 0 2 0
0
5 000
10 000
15 000
20 000
25 000
30 000
35 000
40 000
2010 2011 2012 2013 2014 2015 2016 2017 2018
Figure 12: Capital Flows to West Africa
Source: Statistics Department, AfDB.
FDI and remittances inflows to West Africa (USD million)
The focus of FDI is increasingly changing from the hydrocarbon
sector towards investment in critical infrastructure and non-oil
energy projects. To this end, some flagship projects have
emerged in the region. In Senegal for instance, there was
commencement of a USD340 million Lekela power wind
farm in 2018 (Fitch Solutions, 2019) while in Benin, Belgium’s
Antwerp Port Authority has invested in the upgrade of the
Cotonou Port. Similarly, Aluminium Corporation of China
(Chinalco) and Rio Tinto are sponsoring the construction of a
new iron ore export terminal in Guinea while that country’s
flagship USD1.4 billion bauxite project by Guinea Alumina
Corporation will catapult it into the global bauxite market.
China Harbour Engineering Company (CHEC) is involved
in the financing and building of eight West African ports (Fitch
Solutions, 2019). The lockdown in China due to outbreak of
the COVID-19 pandemic, which has rapidly spread to Europe
and North America, presents challenges for countries in the
region to sustain capital flows from these major source
markets. Foreign direct investment is therefore likely to decline
while already commissioned projects might be delayed.

17
West African trade is increasingly extra-regional rather than
internally within ECOWAS. China, Europe Union and the U.S
account for about 43 percent of West Africa exports and
57.9 percent of the region’s imports (see Figure 13).
However, as Table 2 shows, intra-regional trade in ECOWAS
averaged about 11 percent of total ECOWAS trade and it
has continued to decline since 2016. Low intra-regional
trade reflects production and export concentration in primary
commodities whose market is mainly with third countries.
Exported products from the region include woven cotton
and oily seeds (Mali), calcium phosphate, crude oil (Nigeria
and Ghana) and cocoa beans (Côte d’Ivoire and Ghana).
Concentration of exports into few commodities exposes
countries in the region to symmetric terms of trade shocks.
W e s t A f r i c a E c o n o m i c O u t l o o k 2 0 2 0
0.020.040.060.080.0
100.0
Benin
Burkina F
aso
Cabo Verde
Côte d’Ivoire
The GambiaGhan
a
Guinea
Guinea-Biss
auLib
eria MaliNige
r
Nigeria
Senega
l
Sierra
Leone
Togo
EU USA China Africa Others
0.020.040.060.080.0
100.0
Benin
Burkina F
aso
Cabo Verde
Côte d’Ivoire
The GambiaGhan
a
Guinea
Guinea-Biss
auLib
eriaMaliNige
r
Nigeria
Senega
l
Sierra
Leone
Togo
EU USA China Africa Others
Figure 13: Percent share of West Africa trade in total trade, 2018
Source: Statistics Department, AfDB.
ExportsImports
Table 2: Intra-ECOWAS Trade
2011 2012 2013 2014 2015 2016 2017 Average
Intra- ECOWAS Trade (USD billions) 24.4 23.0 26.1 21.7 18.1 21.7 17.6 21.8
Intra ECOWAS Trade (percent of total trade) 9.4 10.1 12.7 9.8 12.1 11.5 8.4 10.6
Intra ECOWAS exports (percent of total exports) 10.0 8.0 11.8 9.8 13.6 11.9 8.1 10.5
Intra ECOWAS imports (percent of total imports) 8.8 12.0 13.7 9. 10.7 11.1 8.8 10.6

18
With such outward trade orientation and product concentration,
the dislocation in global supply chains created by the COVID-19
lockdown could severely impact export revenues for most
West African countries. For instance, due to COVID-19 out-
break, expected total proceeds from oil exports in Ghana are
estimated to decrease to USD2.2 billion from USD 4.4 billion
originally projected. Nigeria’s oil exports could fall by as much
as 50 percent in 2020. In Côte d’Ivoire, a projected decline
in cocoa production coupled with lower global demand in
2020 may lead to slowdown in West Africa’s second largest
economy. With intra-regional trade significantly low due to
product concentration and weak regional logistical infrastructure,
opportunities for market substitution are limited. This is further
aggravated by unilateral actions to restrict imports by some
countries (see Box 1 on Nigeria’s border closure). This will
severely weaken the region’s trade balance unless there is an
offsetting effect from imports. West African imports constitute
mainly of machinery and transport equipment used in local
manufacturing and extractive industries. Disruptions to global
markets for such imports could slow down productive activity
in the region. This could in turn have implications for local
production and jobs and livelihoods. Although ECOWAS’
trade policy was designed to promote commerce and trade
within the region, trade remains limited among member states.
W e s t A f r i c a E c o n o m i c O u t l o o k 2 0 2 0

19
W e s t A f r i c a E c o n o m i c O u t l o o k 2 0 2 0
Box 1: Implication of Nigeria's land border closure on the economy
In August 2019, Nigeria imposed temporary border closures with its neighbors. This action was justified by the argumentthat it will curb smuggling and dumping of goods and insecurity along Nigeria’s land borders. Large quantities of imported goods (especially rice) are re-exported from Benin into Nigeria. Figure 14 shows that Benin with a populationof 11 million persons is ranked 6th while Niger is 84th in global rice imports. In contrast, Nigeria with its large populationranks in 148th positionin global importation of rice. Benin’s top ranking can be attributed to re-exporting of rice to Nigeria.Nearly all the country’s imported rice from Thailand and Indonesia finds its way into the Nigerian market, includingthrough informal means because of Nigeria’s porous borders with its neighbors and disparities in national taxes andtariffs. For instance, import taxes against extra-ECOWAS third parties are generally lower in Benin than in Nigeria. In addition, Nigeria imposes an import tariff of 10 percent and a levy of 60 percent (effectively 70 percent) on importedrice compared to 7 percent and 5 percent for Benin and Cameroon, respectively.
Besides rice, poultry products, used motor vehicles(aged more than 15 years), ammunitions and firearms arealso prohibited entry into Nigeria. However, smugglerstend to devise various means to circumvent officialdetection by adopting illegal channels of border entryinto Nigeria. Not surprisingly therefore, the reaction tothe border closure has been mixed. Proponents of the border closure argue that the action is inevitableto protect local producers from illegal rice and otherimports that depress prices and crowd out domesticsupply. Those against the action claim Nigeria’s unilateral border closure to resolve a trade problemcould create incentives for retaliatory measures,which may undermine commitments to the ECOWASTrade Liberalization Scheme (ETLS) and efforts towards deepening integration in the context of theAfrican Continental Free Trade Agreement (AfCFTA)both of which advocate for free movement of persons,capital, goods and services (see Box 2 on the benefitsand costs of the AfCFTA). The action taken to closethe border is one of the challenges ECOWAS needsto resolve using established formal dispute resolutionmechanisms.
Data on the effects of the border closure are hard to find, not least because the policy has only been in effect for a fewmonths. However, advocates point to several economic benefits. These include an increase in famers’ income giventhe surge in consumption of import substitutes and savings by government in terms of subsidy due to the reduction inexports of Nigeria’s subsidized (by 20 percent) fuel to Benin. Critics argue there are explicit and implicit costs. For instance, Nigerian exporters through land borders to West African countries have been adversely affected as such products as sesame and cocoa have been trapped and experienced long clearance delays. This has resulted in majorloss in their principal source of income. Many Nigerian and Beninese farmers have also suffered significant losses oftheir farm produce stuck at the border. Local manufacturers are adversely affected owing to their inability to importsome necessary intermediate goods passing through land borders. Consumers of the major staple crop (rice) in Nigeriaare also feeling the negative consequences of the closure due to the inflated prices of local rice. From August – December 2019, food inflation rose by 1.5 percentage points (ppts), more than double the increase in core inflation(0.65 ppts). Although the food basket comprises many commodities, it is expected that the increase in prices of importsubstitutes traded across land borders was partly responsible. Given the ripple effect of the border closure on the Nigerian economy and that of its West African neighbors, harmonization of taxes/tariffs may be necessary while curbingof smuggling activities should be pursued through established regional trade mechanisms. Importantly, there is a needto build capacity for customs officials and investment in digital technology across the land borders to enhance detectionof illegal trade in prohibited products.
6.54.94.9
4.23.9
3.83
2.82.8
2.71.8
0.70.2
0.02
Benin
Niger
Nigeria
020406080100120140160
China Iran
Saudi ArabiaIndonesia
USA Benin
Philippines
Iraq UAE Côte d’Ivoire
GhanaCameroon
NigerNigeria
Share of world rice imports (%) World ranking (right axis)
Source: http://www.worldstopexports.com/rice-imports-by-country/
Figure 14: Global rice imports (selected countries),2018

20
W e s t A f r i c a E c o n o m i c O u t l o o k 2 0 2 0
Success of the ECOWAS single currency (ECO) will depend on
sound macroeconomic fundamentals rather than political
expedience. After more than three decades of discussions,
major decisions were recently taken by the ECOWAS to
launch a single currency in 2020. These decisions include
the following: the single currency will be called the ECO and
it will follow a flexible exchange rate regime, the Central Bank
will be called the Central Bank of West Africa and it will follow
a federal model and the monetary policy framework will
be based on inflation targeting. Also, in preparation for the
launch of the ECO, the countries of the WAEMU in December
2019 announced major reforms of the CFA Franc arrangement.
These reforms include the change of the name of the CFA
Franc to ECO, the withdrawal of the representative of France
from the management and decision-making bodies of the
WAEMU, the closure of the CFA Franc operations account at
the French treasury.
The WAEMU reforms aim to facilitate its integration into the
ECOWAS monetary union (ECOWAS 2019). The 21 December
2019 ECOWAS Summit of Heads of State and Government
reviewed the progress towards the establishment of the Monetary
Union and urged the various committees to ensure the take-off
of ‘ECO’ by 2020. Under the revised roadmap, implementation
of the single currency is to follow a gradual approach (variable
geometry principle), thus allowing countries that meet the
convergence criteria to start using the currency as others
catch up on their performance compliance. There is need for
improved performance by all countries on the convergence
criteria (see Figure 15) and strengthened implementation of the
revised roadmap for the introduction of the single currency.
The importance of a single regional currency lies in its
appeal in promoting regional trade and economic growth,
and in uniting people of the region around a common goal.
However, this appeal will depend on sound macroeconomic
performance which provide buffers to absorb external
shocks (Masson and Pattillo, 2001). Internal and external
imbalances – lax fiscal policy and galloping inflation and
low international reserves may be at variance with single
currency, especially under a pegged regime. The low
inflation performance in the CFA franc is owed in part to
the currency’s peg to the euro, which imposes greater
policy discipline.
Under a flexible exchange rate system, the proposed regional
monetary authority would have to establish monetary
framework to anchor inflation expectations. One candidate
would be inflation targeting (IT) framework, which provides
some degree of discretion and flexibility in the conduct
of monetary policy. A major criticism of the IT regime under
a floating exchange rate system is that it might tie the
hands of a regional central bank, and therefore end up
delivering cost of discretion rather than benefits of flexibility
(Mussa, et al., 2000).
Thus, optimality of the exchange rate arrangement to
govern the ECO will depend on sound fiscal and monetary
policies and strength of supportive institutional architecture.
Importantly, participating countries will have to assess the
balance of costs and benefits of the single currency and
type of exchange rate arrangement that suits the unique
regional economic diversity. The credibility of a regional
central bank, free from political influence, is important in
providing an unambiguous ‘anchor’ for objective monetary
policy.

21
W e s t A f r i c a E c o n o m i c O u t l o o k 2 0 2 0
Figure 15: Primary Convergence Criteria
Source: Computed using data from ECOWAS Macroeconomic Convergence Reports.
-505
10152025
CountryBenin
Burkina F
aso
Cabo Verde
Côte d’Ivoire
The Gambia
Ghana
Guinea
Guinea-Biss
auLib
eria MaliNige
r
Nigeria
Senega
l
Sierra
Leone
Togo
2010 2014 2017 2018
-20.0-15.0-10.0
-5.00.05.0
Benin
Burkina F
aso
Cabo Verde
Côte d’Ivoire
The Gambia
Ghana
Guinea
Guinea-Biss
auLib
eriaMaliNige
r
Nigeria
Senega
l
Sierra
Leone
Togo
2010 2014 2017 2018
2010 2014 2017 2018
-20.00.0
20.040.060.080.0
100.0
Benin
Burkina F
aso
Cabo Verde
Côte d’Ivoire
The GambiaGhan
a
Guinea
Guinea-Biss
auLib
eriaMaliNige
r
Nigeria
Senega
l
Sierra
Leone
Togo
0.02.04.06.08.0
10.012.014.0
Benin
Burkina F
aso
Cabo Verde
Côte d’Ivoire
The Gambia
Ghana
Guinea
Guinea-Biss
auLib
eria MaliNige
r
Nigeria
Senega
l
Sierra
Leone
Togo
2010 2014 2017 2018
Average inflation target(<= 10%)
Fiscal deficit target(<= 3% of GDP)
Central Bank financing of budget deficit(<=10%)
Gross International reserves(>= 3 months imports cover)

22
W e s t A f r i c a E c o n o m i c O u t l o o k 2 0 2 0
Box 2: West Africa regional integration and the African Continental Free Trade Area
The African Continental Free Trade Area (AfCFTA) waslaunched in March 2018 by the African Union (AU). Asat end-2019, all the 54 AU member countries had signed the consolidated text establishing the Agreementof the AfCFTA, while 29 had deposited instruments ofratification. The creation of the AfCFTA paves way forthe effective removal of trade impediments withinAfrica and between Africa and the rest of the world.The AfCFTA establishes a single market for goods andservices with unhindered flow of capital and people.Through industrial transformation and enhanced competitiveness, the agreement seeks to deepen integration among member states and overcome thechallenges posed by existing overlapping economiccommunities and free trade agreements within thecontinent. According to estimates by the African Development Bank (AfDB, 2019), implementation ofPhase I of the AfCFTA will yield an increase of USD2.8billion in real income while intra-African trade couldgrow by 15 percent. Deeper integration (Phase II) haspotential to increase real income by 13-fold. These benefits depend on elimination of import duties andreduction of non-tariff barriers.
Africa trades more with the rest of the world than with itself due to low level of integration (Figure 16). Intra-Africa trade asshare of total trade is only 15.3 percent, about three times lower than intra-regional trade in the Americas (47 percent) andmore than four times lower than that for Asia (61 percent) and Europe (67 percent). Large disparity between intra-Africatrade and the continent’s trade with the world is more pronounced in raw agricultural commodities. More than 90 percentof Africa’s traded raw agricultural products are exported outside the continent, leaving less than 10 percent for intra-Africatrade. In contrast, relative to other product categories, intra-Africa trade in manufactured products, especially agro-basedmanufactures, is appreciably higher (Figure 17). Since 2010, Africa-to-Africa exports of agro-based manufactured productsranged between 40 and 43 percent of total agro-based exports of the continent.
With the operationalization of the AfCFTA, trade integration is expected to leverage economies of scale, drive industria-lization, diversify exports, create jobs, and spur welfare in Africa. Removal of tariffs, non-tariff barriers, regulatory differences and harmonization of divergent sanitary and phytosanitary standards could attract new investments fromwithin and outside the continent. This will trigger increased production and productivity. Undoubtedly, realization of theobjectives of the agreement would require increase in trade financing and complementary investment in infrastructureto bridge the deficit. Africa’s infrastructure financing gap ranges from USD68 billion - USD108 billion per annum acrossall dimensions of infrastructure (AfDB, 2018).
Africa’s participation in global value chains can be enhanced through increased manufacturing and processing. At leastone-third of the Africa’s exports in manufactured goods remain within the continent (Figure 17). However, limited manufacturing and processing capacity has suppressed the contribution of this sector. The relatively large industrialshare in GDP is explained by economic activities in the extractive sectors. Manufacturing shares remain below 15 percentwith significant variation across regions and countries. In West Africa, the share of manufacturing in the region’s GDPis below the African average and has remained between 9 and 12 percent of GDP over the last decade. Consequently,the continent’s participation in GVCs is concentrated in the low-rewarding extractive activities.
0.0%10.0%20.0%30.0%40.0%50.0%60.0%70.0%80.0%
1995 2000 2005 2010 2015 2018
Africa Americas Asia Europe
Figure 16: Intra-regional metchandise Trade, Africa and other regions (1995-2018)
Source: http://www.worldstopexports.com/rice-imports-by-country/

23
W e s t A f r i c a E c o n o m i c O u t l o o k 2 0 2 0
In Africa, manufacturing share of GDP and geographicalproximity to relatively more endowed economies arestrong determinants of the level of trade integration.This implies that the AfCFTA could bring more gains to African economies that are able to scale up manu-facturing activities and harness opportunities offered by a larger continental market. The ECOWAS regionranks 7th among eight economic communities in the Trade dimension of the 2016 Regional IntegrationIndex of the African Development Bank. The extent of gains from implementation of the AfCFTA will depend on a country or region’s initial level of integration. While the benefit of the AfCFTA is expectedto accrue to all regions of Africa, those with low initiallevels of integration would potentially gain more as they become integrated with the rest of the continentand trade more amongst each other. Similarly, the benefits of the AfCFTA are expected to be larger forcountries that are initially less integrated due to lack of access or limited capacity to participate in global value chain.
The AfCFTA could have an immediate impact on trade in agricultural goods as West Africa is both a major importer ofprocessed agricultural goods and producer of raw agricultural commodities. In 2018, trade in food items between WestAfrica and the rest of the world was worth more than USD30 billion. Over 60 percent of the region’s food imports ori-ginated from outside the African continent. In the same year, receipts from food export to the rest of the world wereworth nearly USD10 billion. Removal of tariff and non-tariff barriers could stimulate investment in production, distribution,and processing of agricultural products to meet domestic needs of the region as well as increase exports to generateforeign exchange outside primary commodities. When realized, these advances could accelerate progress towards theattainment of several United Nations Sustainable Development Goals, including those related to eradication of povertyand hunger, and improvement in health, education and gender equality.
Concentration of trade in few extractive commodities have been a major source of macroeconomic instability in WestAfrica. Over 90 percent of the region’s exports constitute receipts from oil, cocoa and gold. In the past decades, spellsof price booms and busts have triggered adverse economic conditions with implications for prolonged macroeconomicinstability. These adverse shocks have derailed efforts to translate gains from price booms into sustainable developmentoutcomes. Similarly, production and trade concentration in few commodities that generate bulk of foreign exchangehas diverted focus from development of other sectors. The AfCFTA offers a possibility to diversify production and exportsand lay the foundation for growth and employment creation in the region.
The AfCFTA could contribute to improved trade statistics and encourage formalization of businesses. At most borderposts, informality and smuggling are means of avoiding costly tariffs. Fortunately, most of the locally produced goodsand services traded by small scale businesses would qualify for tariff reduction under the AfCFTA. The operationalizationof the AfCFTA Agreement could therefore lead to a significant increase in the number of small businesses, and the volume of trade by small and medium size enterprises.
Finally, an effectively operationalized the AfCFTA will create more jobs and improve the livelihood of women and youngpeople. Increased demand for goods arising from a larger market will attract investment and create jobs for youngpeople outside agriculture. Given that women account for a significant share of informal traders in West Africa, theAfCFTA is expected to improve living conditions of many women traders in the region.
05
1015202530354045
1995 2000 2005 2010 2015 2017 2018
Agric raw materials All Products
Manufactured goods Agro-based Manufactures
Figure 17: Intra-Africa Exports as percentage of total exports of the product (1995-2018)
Source: http://www.worldstopexports.com/rice-imports-by-country/

24
W e s t A f r i c a E c o n o m i c O u t l o o k 2 0 2 0
Inclusive growth in West Africa has been elusive due to
high levels of informality, high unemployment and persistent
underemployment. On average, the informal economy
accounts for about 50 percent of national output, over
80 percent of employment and 90 percent of new jobs.
High rate of informality results in a broad range of structural
issues, including low productivity and vulnerability to shocks
which collectively perpetuate income inequality and poverty.
About 43 percent of West Africans live below USD 1.90 a day,
and unemployment, especially among the youth, remains.
High degree of informality has been exacerbated by persistent
insecurity across the Sahel belt especially in Burkina Faso,
Mali, Niger and Nigeria.
The ILO statistics for 2019 show that unemployment rates in
selected economies (Ghana: 13.7%, Nigeria: 19.6%, Cabo
Verde: 23.3% and Mali: 24.4%) were higher than the global
average of 12.8%. The low unemployment reported for Niger:
0.4%, Togo: 2.5%, Côte d’Ivoire: 3.4% and Benin: 4.0% mask
high informal employment and underemployment in the region.
Inequality is also high, with the Gini coefficient ranging from
0.3 in Mali to 0.5 in Guinea Bissau with median of 0.4. West
African countries are amongst the bottom 25% countries of
the human development scale consisting of 173 countries.
Economic growth alone may be insufficient to reduce poverty
and inequality in the region. However, the sources and
distribution of gains from that growth matter for poverty
reduction and inclusiveness. Estimates by the AfDB suggest
that in West Africa, only Côte d’Ivoire and Togo experienced
an increase in incisiveness of growth between the sub-
periods, that is, 2000-2005 and 2010 – 2017 (AfDB, 2020). In
contrast, although growth was pro-poor and inclusive in the
first subperiod for Ghana, Liberia, and Niger, it was neither
pro-poor nor inclusive in the latter period. In general, West
African countries are predominantly agrarian and with the high
rate of informality, opportunities in the formal wage sector are
limited, which has precluded citizens’ participation in the
gains from higher growth recorded over the past decade.
Thus, the proportion of working poor to total population tends
to be high, ranging from 13 percent in Cabo Verde to as high
as 81 percent in Guinea Bissau. Besides Cabo Verde, only
Ghana has a share of working poor below 20 percent, which
may also explain the country’s inclusiveness of growth during
2000-2005, although this was not sustained.
With such poor social conditions, amplified by the outbreak
of COVID-19 pandemic, achieving the SDGs across the
region remains a challenge as households and workers are
locked out of their daily survival means. Given the large size
of the informal sector, the widespread lockdowns across
West Africa could impact on the region’s 43% poor people.
The proportion of the population that could slip into poverty
will vary by country and actual estimates may not be known
with certainty due to paucity of data and fluidity of the spread
of the COVID-19 pandemic. However, countries such as
Nigeria with the largest population of about 200 million and
poverty rate of 53.5% could experience significant number of
people slipping into poverty. Closure of businesses in Guinea
could also exacerbate the number of the working poor from
the current 80% of the labor force. Similarly, other countries
e.g., Ghana and Nigeria, that imposed full or partial lock-
downs to curb spread of the COVID-19 pandemic, could
experience deterioration in social conditions due to erosion
in income earning opportunities.
1.3 OUTLOOK FOR GROWTHAND POTENTIAL TRANSMISSIONCHANNELS OF THE COVID PANDEMICON WEST AFRICAN ECONOMIES
The outbreak of the COVID-19 pandemic, first officially reported
on 31st December 2019 in Wuhan, China has created human
and economic catastrophe. Tens of thousands of lives have
been lost and hundreds of thousands of infected people
globally face an uncertain future due to the absence of a

25
W e s t A f r i c a E c o n o m i c O u t l o o k 2 0 2 0
vaccine. In West Africa, statistics published by the Johns
Hopkins University3 show rapidly rising cases of infected
persons and deaths. As the West Africa region has memories
of the Ebola virus in 2014, especially in the worst hit countries -
Guinea, Liberia and Sierra Leone - tackling COVID-19 could
draw from lessons gained during the Ebola crisis.
As of April 2020, Europe and the United States had emerged
as the new epicenters of the COVID-19 pandemic after
China seemingly managed to slow down the spread of
the virus. The deepening crisis is stoking fears of a global
recession. The magnitude of socio-economic impact of
the pandemic on ECOWAS may not be known with certainty
in this early stage of assessment due to the fluidity of the
pandemic. However, the growth outlook for the region is
leaning towards the downside with marginal recovery in 2021,
depending on severity of thecrisis (see Table 3). The rapid
spread of the coronavirushas adversely affected West Africa’s
main export markets and sources of imports, foreign direct
investment, tourism and remittances and created uncertainty
in financial markets. Furthermore, the rout in commodity
markets, disruptions in travel and tourism due to cancellations
of flights and accommodation, and country-level lockdowns,
which have disrupted economic activity, suggest that the risk
and impact of the COVID-19 pandemic on growth is likely to
be significant.
3 https://www.arcgis.com/apps/opsdashboard/index.html#/bda7594740fd40299423467b48e9ecf6
Table 3: Initial assessment of macroeconomic impact of the COVID-19 pandemic in West Africa
Indicator 2018 2019 (e)
Without COVID-19scenarios
(January 2020 projections)
COVID-19 shock scenarios(April 2020 revised projections)
With COVID-19(Baseline)
With COVID-19(Worst-Case)
2020(p) 2021(p) 2020(p) 2021(p) 2020(p) 2021(p)
Real GDP growth 3.4 3.6 4.0 4.1 -0.2 2.5 -4.3 1.7
CPI inflation 9.4 8.5 8.8 8.1 10.4 8.4 18.0 16.0
Budget balance % GDP -4.2 -4.6 -4.1 -4.0 -6.3 -5.2 -7.2 -6.2
Current account % GDP -1.0 -4.4 -1.8 -1.6 -5.0 -3.8 -5.9 -4.7
Source: AfDB Statistics Department.
Common scenario assumptions:
1. Baseline scenario: Spread of COVID-19 tapers off in third quarter of 2020.
2. Worst-case scenario: Spread of COVID-19 tapers off in fourth quarter of 2020.

26
W e s t A f r i c a E c o n o m i c O u t l o o k 2 0 2 0
Commodity prices were already on the downward trend
prior to outbreak of the COVID-19 pandemic but the
decline has accelerated since the beginning of 2020.
Sharper global economic downturn will drive prices further
lower, posing risks to commodity dependent countries in
West Africa. For instance, the sharp fall in price of oil to
below USD30 per barrel by end-April 2020, has trimmed
export earnings with severe implications on budget and
foreign reserves for oil dependent Nigeria and Ghana.
Nigeria has already revised its macroeconomic outlook
to reflect constrained funding from oil exports. For oil
importing countries in the region, lower oil prices could
create savings on the budget and bolster the current
account position. These asymmetric effects highlight
diversity of countries in the region. Overall, the effect of
lower revenues on Nigeria’s fiscal and current account
positions in 2020 will outweigh any possible gains in other
countries, translating into widening of the fiscal and current
account deficits under both the baseline and worst-case
scenarios, as observed above.
Coupled with low commodity prices, especially for oil and
minerals, continued lower demand could severely impact
export revenues for West African countries. For instance, due
to the COVID-19 pandemic, expected total proceeds from oil
exports in Ghana are estimated to decrease to USD2.2 billion
from USD4.4 billion originally projected. Nigeria’s oil exports
could fall by as much as 90 percent in 2020. In Côte d’Ivoire,
a projected decline in cocoa production coupled with lower
global demand in 2020 may lead to slowdown in West
Africa’s second largest economy. Unless there is an offsetting
effect from contraction in imports, this could severely weaken
the region’s external balance position. West African imports
constitute mainly machinery and transport equipment used
in local manufacturing and extractive industries. Disruptions
to global markets for such imports could constrict productive
activity in the region, which is likely to be amplified by the
lockdowns. This will in turn have implications for local
production, jobs and livelihoods.
Tourism is an important source of foreign exchange for small
countries in West Africa with Europe and the United States
as the source markets. A sharp slowdown in these countries
will depress tourist earnings and harm small economies
dependent on tourism for foreign exchange. For instance, in
Cabo Verde, tourism revenues account for about 50 percent
of export earnings and nearly 70 percent of total fiscal
revenues while in The Gambia, tourism revenues contribute
approximately two thirds to total fiscal revenues. Tourism in
Senegal represents about 7 percent of GDP but with the
COVID-19 pandemic affecting several European countries
(23 percent of tourists are from Europe), revenues from the
sector are currently at risk. The authorities in Senegal already
announced many cancellations of reservations for seminars
and other international meetings, including the famed NBA
African Basketball Championship.
Continued volatility in major global capital markets has stoked
risk aversion towards emerging market assets. The relatively
more integrated mature African economies could experience
capital reversals. In West Africa, Côte d’Ivoire, Ghana, Nigeria
and Senegal, are especially at higher risk. The sharp fall in oil
price, which fueled rapid decline in foreign exchange reserves
by about USD3.3 billion from January – March 2020 (average
of USD1.1 billion per month) and rising capital outflows,
forced the central bank of Nigeria to devalue the currency
from N307/USD to N360/USD, with the parallel market
surging to more than N400/USD. This action highlighted the
cost of uncertainty and its impact on overall macroeconomy
performance. The CFA franc depreciated by 1.8 percent
against the US dollar over the same period. By end-March
2020, the all share market capitalization of the Nigeria stock
exchange had lost almost 20 percent while that of the West
African regional bourse dipped by about 17 percent.

27
W e s t A f r i c a E c o n o m i c O u t l o o k 2 0 2 0
The favorable growth outlook in the region will be supported
by the easing of inflation pressures. Annual average inflation
is expected to remain in single digits, dropping to 8.8 percent
in 2020 and to 8.1 percent the following year. The gains
are likely to be driven by an improved performance in the
six members of the West African Monetary Zone (WAMZ),
namely The Gambia, Ghana, Guinea, Liberia, Nigeria, and
Sierra Leone. Although still high, inflation in Liberia, Nigeria
and Sierra Leone is projected to decline in the medium term,
reflecting a combination of supply and demand side factors.
The projected decline in inflation in Nigeria may be offset
by the recent increase in the minimum wage. The continued
border closure could also accelerate the rise in food inflation.
Monetary expansion and fiscal restraint will therefore be
critical to offsetting supply induced inflationary pressures.
Inflation in the WAEMU countries will remain low, although it
is expected to edge marginally higher in 2020. A combination
of two factors may drive the rise in inflation: pass-through
effects of the depreciation of the CFA franc against the US
dollar and some country specific supply side factors, including
volatility in food prices as local farmers are driven away by the
insurgency in Burkina Faso, Mali and Niger.
Some central banks have complemented fiscal measures
with monetary policy actions to cushion the impact of the
COVID-19 pandemic on their economies. Table 4 summarizes
the key policy measures. These measures try to balance
between actions to stimulate the economy and the stated
objectives of maintaining price and financial system stability.
However, the efficacy of these actions will depend on the
strength of the transmission mechanism through which central
banks action affect the real economy. In most developing
economies, including countries in West Africa, structural
rigidities limit the effectiveness of monetary policies.
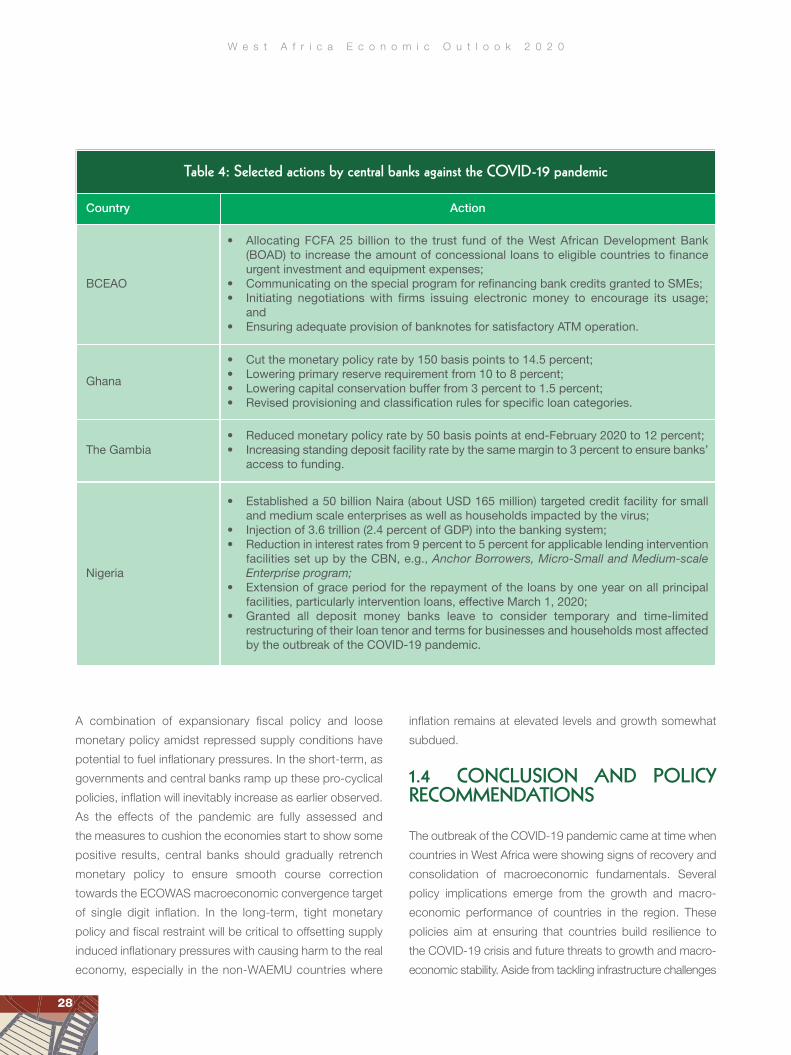
28
W e s t A f r i c a E c o n o m i c O u t l o o k 2 0 2 0
A combination of expansionary fiscal policy and loose
monetary policy amidst repressed supply conditions have
potential to fuel inflationary pressures. In the short-term, as
governments and central banks ramp up these pro-cyclical
policies, inflation will inevitably increase as earlier observed.
As the effects of the pandemic are fully assessed and
the measures to cushion the economies start to show some
positive results, central banks should gradually retrench
monetary policy to ensure smooth course correction
towards the ECOWAS macroeconomic convergence target
of single digit inflation. In the long-term, tight monetary
policy and fiscal restraint will be critical to offsetting supply
induced inflationary pressures with causing harm to the real
economy, especially in the non-WAEMU countries where
inflation remains at elevated levels and growth somewhat
subdued.
1.4 CONCLUSION AND POLICY RECOMMENDATIONS
The outbreak of the COVID-19 pandemic came at time when
countries in West Africa were showing signs of recovery and
consolidation of macroeconomic fundamentals. Several
policy implications emerge from the growth and macro-
economic performance of countries in the region. These
policies aim at ensuring that countries build resilience to
the COVID-19 crisis and future threats to growth and macro-
economic stability. Aside from tackling infrastructure challenges
Table 4: Selected actions by central banks against the COVID-19 pandemic
Country Action
BCEAO
• Allocating FCFA 25 billion to the trust fund of the West African Development Bank (BOAD) to increase the amount of concessional loans to eligible countries to finance urgent investment and equipment expenses;
• Communicating on the special program for refinancing bank credits granted to SMEs; • Initiating negotiations with firms issuing electronic money to encourage its usage;
and• Ensuring adequate provision of banknotes for satisfactory ATM operation.
Ghana
• Cut the monetary policy rate by 150 basis points to 14.5 percent;• Lowering primary reserve requirement from 10 to 8 percent; • Lowering capital conservation buffer from 3 percent to 1.5 percent; • Revised provisioning and classification rules for specific loan categories.
The Gambia• Reduced monetary policy rate by 50 basis points at end-February 2020 to 12 percent; • Increasing standing deposit facility rate by the same margin to 3 percent to ensure banks’
access to funding.
Nigeria
• Established a 50 billion Naira (about USD 165 million) targeted credit facility for small and medium scale enterprises as well as households impacted by the virus;
• Injection of 3.6 trillion (2.4 percent of GDP) into the banking system;• Reduction in interest rates from 9 percent to 5 percent for applicable lending intervention
facilities set up by the CBN, e.g., Anchor Borrowers, Micro-Small and Medium-scale Enterprise program;
• Extension of grace period for the repayment of the loans by one year on all principal facilities, particularly intervention loans, effective March 1, 2020;
• Granted all deposit money banks leave to consider temporary and time-limited restructuring of their loan tenor and terms for businesses and households most affected by the outbreak of the COVID-19 pandemic.

29
W e s t A f r i c a E c o n o m i c O u t l o o k 2 0 2 0
and short-term measures adopted by central banks, other
key specific, mainly structural, policy recommendations below
may be pursued:
• Implementation of structural reforms is key to unleashing
productivity, especially in the lagging economies of the
region, whilst maintaining the growth momentum for fast
growing ones. For instance, the domestication and actual
implementation of the ECOWAS Trade Liberalization
Scheme, especially removal of non-tariff barriers, will
stimulate intra-regional trade and growth. Furthermore,
easing of restrictions in national labor markets would
also allow intra-regional movement of talent to ease the
skills shortage in deficit countries. Additional measures
could include allowing greater competition in the final
goods sector by removing or rationalizing subsidies.
• West Africa should create a uniform framework for
improving the business environment at national level
and across borders to attract investors to the region. This
can be implemented under the West African Business and
Investment Climate Improvement project supported by
the World Bank.
• The ECOWAS region should implement Special Agro-
Industrialization Processing Zones (SAPZs) to drive
agro-led industrialization and value chain development.
This will raise agricultural productivity and stimulate
industrial activity.
• Scaling up of taxpayer identification, rationalizing tax
exemptions and integrating the electronic systems for tax
and customs administration could enhance compliance and
enforcement and improve collection of domestic revenues.
In Nigeria, implementation of taxpayer identification
increased the number of identified taxpayers from 10 million
in 2015 to 19 million in 2018, thus broadening the tax
base. Mainstreaming the large informal economy in the
region into the development process will also help in
broadening the tax net.
• For resource dependent economies, increasing the
surveillance of the mining sector revenues and refine
legal codes governing mineral taxation to reduce
regulatory uncertainty and increases transparency in
line with international best practices. Burkina Faso has
proved that such measures can strengthen revenue
collection from the mining sector by introducing several
tax regime changes at the exploration and exploitation
phases. A 20 percent capital gains tax was also imposed
on the transfer of mining titles.
• Liberalization of fuel pricing to curb rent seeking. Sierra
Leone and other countries who have liberalized pricing of
fuel and abolishment of fuel subsidies provide valuable
lessons in this regard. Broaden the coverage of the Treasury
Single Accounts to all agencies of government has the
added benefits of institutionalizing transparency in a
country’s revenue collection.
• Fiscal positions in the region are already overstretched
and countries are building up the debt. This is likely
to be exacerbated by spending pressures to cushion
the impact of COVID-19. A credible debt consolidation
strategy with focus on improving fiscal transparency
across West Africa is essential. Importantly, any new
debt should be deployed in productive projects with
revenue streams for self-amortization to avoid inter-
generational debt burden. Development partners should
proactively engage with the authorities at national and
regional level in designing appropriate financing packages
that recognize the limited fiscal space obtaining in the
region. To this end, the IMF’s COVID-19 grant-based debt
service relief would ease the burden of debt repayments
on beneficiary countries in the region. Other multilateral
development institutions, including the AfDB are providing
financing to countries severely affected by the COVID-19
pandemic.

30
W e s t A f r i c a E c o n o m i c O u t l o o k 2 0 2 0
• As the region prepares to introduce a single currency,
participating member countries should aim at creating
institutional mechanisms to foster macroeconomic stability.
Thus, policy governing implementation should not be
dictated by political expedience but by sound macro-
economic fundamentals reflecting the genuine pursuit of the
regional integration agenda. Building credible institutions,
including the regional central bank and fiscal agencies
will be essential for the viability of the single currency.


33
W e s t A f r i c a E c o n o m i c O u t l o o k 2 0 2 0
2.1 OVERVIEW OF POPULATIONAND LABOR MARKET DYNAMICS
The West Africa region is endowed with a burgeoning youth
population that can strategically be harnessed for employment
and economic growth. In 1950, the region’s population stood
at almost 71 million and by 2000, had more than tripled to more
than 230 million. It is estimated at more than 400 million in 2020
and projected to reach 800 million by 2050 (Figure 18a). The
share of youth population (15 to 34 years) is projected to rise
from 33 percent of total population in 1950 to a 35 percent in 2050
(Figure 18b). Youth and working age population are increasing
in all countries in West Africa region (see Annexes 1 and 2).
By 2050, it is estimated that Nigeria, Niger and Ghana will
have the largest proportion of working age populations. At
the bottom of the list is Cabo Verde, Guinea Bissau and The
Gambia where the working age population will barely exceed
3 million (Annex 3). The region will need to create decent jobs to
forestall irregular migration and insecurity crisis mainly affecting
the youth. The Sahel belt in West Africa region is characterized
by multiplicity of fragility factors, which have adversely affected
the region’s labor market dynamics and livelihoods.
PART2SKILLSDEVELOPMENTAND
EDUCATIONFORTHEWORKFORCE
OFTHEFUTUREINWESTAFRICA
70 874
234 749
401 862
796 495
0100,000200,000300,000400,000500,000600,000700,000800,000900,000
1950 2000 2020 2050
42
44
43
35
33
33
34
35
25
22
23
30
0 20 40 60 80 100 120
1950
2000
2020
2050
< 15 years 15-34 years 35+ years
Figure 18: Population dynamics in West Africa
Figure 18a: West Africa's population (thousands) Figure 18b: Population distribution by age groups
Source: United Nations World Population Prospects 2019.

34
W e s t A f r i c a E c o n o m i c O u t l o o k 2 0 2 0
0 10 20 30 40 50 60 70 80 90
Senegal
Nigeria
Côte d’Ivoire
Sierra Leone
The Gambia
Cabo Verde
Guinea
Burkina Faso
Ghana
Mali
Benin
Niger
Guinea-Bissau
Liberia
Togo
Figure 19: Labor force participation rate (percent) in 2019
Source: ILOSTAT, ILO.
The labor market in West Africa is characterized by
declining labor force participation yet low unemployment
mainly disguised in high informal employment. The
labor force participation rate for the population of 15 years
and above has consistently declined since the beginning
of the millennium from 64.2 percent in 2000 to 58.5 percent
in 2019 and is expected to further decline to 58.2 percent
in 2022. By implication, inactivity in the region has been
increasing from 36 percent to 41.5 percent and over
the same period, the size of the labor force in West
Africa expanded consistently from 84.5 million in 2000
to 130 million in 2019 in absolute terms. This represents
a 53.6 percent increase over two decades. Togo has
the highest proportion of active population at 79 percent
against 46 percent in Senegal, the lowest in the region
(Figure 19).
Informal employment is highly pervasive in West Africa as well
as other regions of Africa, wage employment constituting less
than one-fifth of total employment. North and Southern Africa
had the highest rates of wage employment at 63 percent and
83 percent, respectively while in Central and East Africa it
represented 21 percent of total employment. In contrast,
West Africa had the highest rate of self-employment at
64 percent against 63 percent in Central Africa, 51 percent
in East Africa and less than 28 percent in North and Southern
Africa.

35
Figure 20 also shows that Cabo Verde has the highest
proportion (61 percent) of the workforce engaged in wage
employment. Senegal is a distant second with a little more
than one third of the workforce employed in the wage sector.
Niger and Guinea have less than 10 percent of the workforce
engaged in wage employment. The type of employment is
correlated with the level of education. Countries with less than
basic education have the highest proportion of the population
in self-employment. For instance, in Mali, Niger and Burkina
Faso, the proportion of workers with low education stood at
nearly 80 percent (Figure 21). Cabo Verde has the least share
of the employed with less than basic education. In general,
low level of education is reflected in informal and other vulne-
rable employment. The level of education also translates into
the type of occupation of employment (skilled and unskilled).
West Africa has the third highest share of low skilled jobs
(52.9 percent) behind Central and East Africa and the third
highest in terms of high skill jobs (18.0 percent) after Southern
and North Africa (Figure 22). Across countries, more than
50 percent of the employed are engaged in low skill jobs.
W e s t A f r i c a E c o n o m i c O u t l o o k 2 0 2 0
0.010.020.030.040.050.060.070.080.090.0
100.0
Wes
t Afr
ica
Cent
ral A
fric
a
Sout
hern
Afr
ica
Nor
th A
fric
a
East
Afr
ica
Cabo
Ver
de
Sene
gal
Côte
d’Iv
oire
The
Gam
bia
Ghan
a
Guin
ea-B
issau
Libe
ria
Nig
eria
Mal
i
Togo
Burk
ina
Faso
Sier
ra L
eone
Beni
n
Guin
ea
Nig
er
African regions West African countries
Wage Employment Self-Employment Others
Figure 20: Employment classification by region and countries in West Africa (% share), 2019
Source: Constructed from ILOSTAT data.

36
W e s t A f r i c a E c o n o m i c O u t l o o k 2 0 2 0
0.0 10.0 20.0 30.0 40.0 50.0 60.0 70.0 80.0 90.0 100.0
Cabo VerdeSenegal
Côte d’IvoireThe Gambia
GhanaLiberiaNigeria
MaliTogo
Burkina FasoSierra Leone
BeninNiger
<Basic Basic Intermediate Advanced
Figure 21: Employment distribution by education in West Africa, 2019
Source : Constructed from ILOSTAT data.
0.0
20.0
40.0
60.0
80.0
100.0
120.0
Wes
t Afr
ica
Cent
ral A
fric
a
Sout
hern
Afr
ica
Nor
th A
fric
a
East
Afr
ica
Cabo
Ver
de
Sene
gal
Côte
d’Iv
oire
The
Gam
bia
Ghan
a
Guin
ea-B
issau
Libe
ria
Nig
eria
Mal
i
Togo
Burk
ina
Faso
Sier
ra L
eone
Beni
n
Guin
ea
Nig
er
African regions Countries in West Africa
Low skilled Medium skilled High skilled
Figure 22: Skills in regions and countries in West Africa (percent of total employment), 2019
Source : Constructed from ILOSTAT data.

37
W e s t A f r i c a E c o n o m i c O u t l o o k 2 0 2 0
Given the large proportion of the labor force in informal,
non-wage low skilled employment, agriculture is the main
source of jobs for most countries in West Africa. However,
for a significant part of the region, spanning the entire Sahel
belt, effects of climate change and conflict over land and
pasture have adversely affected productivity and food security.
Nonetheless, the agriculture sector accounts for 42.7 percent
of total employment (largely subsistence and informal), followed
by services (mainly retail and wholesale trade, motor vehicle
repairs) representing 19.5 percent. Employment in manufac-
turing stands at 8.6 percent while other services accounted
for 14.3 percent (Figure 23).
Although agriculture still accounts for a sizable proportion of
employment in West Africa, over the last 30 years some
countries have experienced a gradual shift in jobs from the
agriculture sector to services while in other countries, the
sectoral distribution of employment has not changed. In
Burkina Faso where the shift is more pronounced, the share
of employment in agriculture declined from around 90 percent
in 1991 to less than 30 percent in 2019 (Figure 24).
42.7
8.6
1.2
19.5
4.4
2.8
3.1
3.4
14.3
0 5 10 15 20 25 30 35 40 45
Agriculture
Manufacturing
Mining and quarrying
Wholesale and retail trade
Indu
stry
Services
Figure 23: Employment distribution by sector in West Africa (percent), 2019
Source: ILOSTAT.

38
W e s t A f r i c a E c o n o m i c O u t l o o k 2 0 2 0
0.010.020.030.040.050.060.070.080.090.0
100.0
Agric
ultu
re
Indu
stry
Serv
ices
Agric
ultu
re
Indu
stry
Serv
ices
Agric
ultu
re
Indu
stry
Serv
ices
Agric
ultu
re
Indu
stry
Serv
ices
Benin Burkina Faso Cabo Verde Côte d’Ivoire
1991 2000 2010 2019
Agric
ultu
re
Indu
stry
Serv
ices
Agric
ultu
re
Indu
stry
Serv
ices
Agric
ultu
re
Indu
stry
Serv
ices
Agric
ultu
re
Indu
stry
Serv
ices
The Gambia Guinea-BissauGuineaGhana
1991 2000 2010 2019
0.010.020.030.040.050.060.070.080.0
Agriculture
Indu
stry
Services
Agriculture
Indu
stry
Services
Agriculture
Indu
stry
Services
Agriculture
Indu
stry
Services
Liberia NigeriaNigerMali
1991 2000 2010 2019
0.010.020.030.040.050.060.070.080.090.0
Agric
ultu
re
Indu
stry
Serv
ices
Agric
ultu
re
Indu
stry
Serv
ices
Agric
ultu
re
Indu
stry
Serv
ices
Senegal TogoSierra Leone
1991 2000 2010 2019
0.010.020.030.040.050.060.070.080.0
Source: AfDB Statistics Dept.
Employment by sector, % of total employment
Employment by sector, % of total employment
Employment by sector, % of total employment
Employment by sector, % of total employment
Figure 24: Employment distribution by economic sector (percent of total employment), 2019

39
Contrary to the general pattern across the region, Burkina Faso
recorded an increase in industry employment with the bulk of
the gains coming from the agriculture sector. Employment in
industry more than tripled from less than 10 percent in 1991 to
almost 30 percent in 2019. Meanwhile, employment in services
moved from 10 percent to 40 percent over the same period. In
Benin, Cabo Verde, Côte d’Ivoire, Mali, Nigeria, and Senegal,
jobs have shifted from the agriculture sector to services, the
industry sector remains stable, an unconventional path of
structural transformation. In The Gambia, Guinea Bissau, Liberia
and Niger, the employment structure has not changed over
the past three decades. In Ghana, the services sector has
absorbed all jobs from agriculture. Industry sector only captured
some of the gains in employment in 2019.
Unemployment appears very low in West African countries,
even by regional standards (Table 5). Average unemployment
for the region is estimated at 5.4 percent in 2020, a marginal
increase from slightly below 5 percent average recorded
between 1991 and 2010. However, low unemployment is
masked in high underemployment and informal employment
as most workers are engaged in non-wage and informal self-
employment activities (Table 6). Methodological differences
could also be responsible for under-reporting of unemploy-
ment. People may be reporting self-employment in house-
hold enterprises and activities such as street-vending and
other informal activities as employment. Under conditions of
high informality, unemployment is expected to be low and
vice versa.
W e s t A f r i c a E c o n o m i c O u t l o o k 2 0 2 0
Table 5: Unemployment and Labor Market Conditions
5a: Unemployment in Africa (regional averages)
Region 1991 2000 2010 2020*
Central Africa 7.6 8.1 5.4 5.1
East Africa 5.1 5.3 4.9 3.8
North Africa 13.5 15.4 12.2 11.7
Southern Africa 27.8 29.6 24.5 26.8
West Africa 3.7 4.5 4.4 5.4
5b: Labor market indicators in Western Africa
Labor force participation 15+ 62.6 61.8 60.5 59.9
Unemployment rate, 15+ 3.7 4.5 4.5 5.4
Employment growth 15+ 2.8 2.7 2.6 3.0
Labor productivity growth -2.5 1.3 4.4 2.0
Source: ILO Estimates, 2018.
*Projection.

40
In some countries, such as Benin, Liberia, Mali, Niger,
Senegal, and Togo, the informal sector accounts for
more than 90 percent of employment. This starkly
contrasts with low unemployment reported in these
countries. In Cabo Verde, the least informal economy
in the sub-region, almost 64 percent of employment
is informal, and the unemployment rate exceeds 12 percent
(Table 6).
W e s t A f r i c a E c o n o m i c O u t l o o k 2 0 2 0
Despite the seemingly reported low unemployment,
the youth (15-24 years) are more affected than adults
in the region. In Mali, Niger and Sierra Leone, youth
(15-24 years) unemployment rates are more than three
times higher than those for the adults, and in Benin,
Cabo Verde, Ghana and Nigeria, their unemployment
rates are more than twice as high as those for adults
(Figure 25).
Table 6: Unemployment, Informality, and underemployment (percentage of total employment)
Unemployment rate,2018
Informalemployment
Time-related underemployment
Benin 2.1 96.8 (2011) 37.3 (2010)
Burkina Faso 6.1
Cabo Verde 12.3 63.8 (2015) 7.5 (2017)
Côte d'Ivoire 2.6 86.7 (2017) 14.7 (2018)
Ghana 6.7 88.8 (2015) 13.1 (2017)
The Gambia 8.9 76.5 (2012) 8.1 (2012)
Liberia 2.0 93.4 (2014) 23.6 (2014)
Mali 9.6 94.9 (2016) --
Niger 0.3 95.4 (2011) --
Nigeria 6.0
Senegal 6.5 93.4 (2015) 9.6 (2011)
Sierra Leone 4.3 -- 10.4 (2014)
Togo 1.7 95.1 (2014) 3.6 (2015)
Source: ILO Estimates, 2018.
Notes: -- not available; figures in brackets are latest years for reported data.

41
The rise in unemployment, especially among the youth, does
not necessarily reflect absence of education. Rather, it may
be due to the mismatch between available opportunities and
supply of requisite skills. As Figure 26 shows, unemployment
in selected countries in West Africa has increased with the
level of education. High unemployment among the educated
labor force may emanate from the long periods educated
people take in searching for jobs matching their reservation
wage Compared to less educated individuals whose
reservation wage is lower and who cannot afford prolonged
unemployment, most educated people can stay unemployed
for more than one month while searching for a job. This is
because educated people tend to be from households
with relatively high income or gain the most from continued
searching for employment until they find a job that meets their
expectations (AfDB, 2019).
W e s t A f r i c a E c o n o m i c O u t l o o k 2 0 2 0
0
5
10
15
20
25
30
Cabo Verde
Senega
l
Côte d’Ivoire
The Gambia
Ghana
Guinea-Biss
auLib
eria
Nigeria
*Mali
Togo
Burkina F
aso
Sierra
Leone
Benin
GuineaNige
r
15-24 25+
Figure 25: Unemployment rates by age 2012-2018
Source: Constructed from ILOSTATS.
*Unemployment much lower than estimates reported by the National Bureau of statistics of Nigeria of 29.1 percent youth unemployment in
2018 Q3.

42
In Mali, unemployment rate increases with education. Only
the Master's level and above slightly reduces it. In Senegal,
unemployment systematically increases with education, from
primary to master’s degree. With limited or no access to
formal employment, the less educated labor force clearly
has no option than to settle with informal agriculture and
non-technical jobs which do not require any formal education
and thus have a high degree of informality, particularly among
less educated people in the sub-region (Baah-Boateng,
2013; 2015).
2.2 TECHNOLOGICAL DEVELOPMENTFOR THEFUTURE OF WORK
Structural transformation in West Africa is necessary to
enhance the region’s labor productivity. However, the expansion
of the services sector over the past three decades largely
reflects lack of structural transformation in the traditional
sense, namely, the growing importance of manufacturing
against shrinking contribution to of agriculture output and
employment. Therefore, the shift to relatively non-productive
services sector is but a shelter for those unable to find
employment opportunities in the formal economy.
Technology has the potential to augment the abilities and pro-
ductivity of workers at all skills levels. Due to multiple applications,
the demand for technology services is increasing worldwide.
In West Africa, demand is also increasing for digital services.
Demand for digital services such as mobile cellular, internet,
mobile and other digital payments is increasing in west Africa.
In 2007, the number of mobile cellular subscriptions per 100
people exceeded 40 only in The Gambia. Ten years later, it was
40 in Niger and had exceeded that threshold in all other countries
(Figure 27). In countries like The Gambia, Côte d’Ivoire, Ghana,
Mali, Cabo Verde and Senegal, the number of mobile cellular
subscriptions per 100 people exceeded 100 largely because
individuals often subscribe to multiple networks. While mobile
penetration has increased over the last few years, roaming
prices offered by the over 20 mobile operators in the ECOWAS
W e s t A f r i c a E c o n o m i c O u t l o o k 2 0 2 0
0
5
10
15
20
25
30
35
40
45
CaboVerde
Senegal Côted’Ivoire
Ghana Liberia Nigeria Mali Togo SierraLeone
Niger
Figure 26: Unemployment and education
Source: ILO Estimates, 2018.

43
are highly heterogeneous across countries, unpredictable
and prohibitive. In 2019, countries in ECOWAS region
reinforced their commitments to remove roaming charges
across the region starting in January 2020. The goal of this
ECOWAS Roaming Initiative is to enhance revenue generation
along corridors and remove barriers to communication for
subscribers within the region. As of April 2020, implementation
of this initiative had not taken off in several countries.
Yet, mobile cellular service offers the opportunity to
access internet services and make mobile based financial
transactions. Accordingly, access to the internet has risen
sharply in each country between 2007 and 2017. In 2007,
less than 10 percent of the population had access to
the internet. By 2017, only three countries – Sierra Leone,
Liberia, and Guinea Bissau – had less than 10 percent
access to internet.
W e s t A f r i c a E c o n o m i c O u t l o o k 2 0 2 0
Despite the increase in access to internet services, West
Africa remains digitally under connected relative to global
average of 58 percent. Only Cabo Verde, Côte d’Ivoire,
Ghana, Nigeria and Senegal, have higher internet penetrations
than the African average of 25.4 percent. Although the advent
of broadband access has stimulated demand for digital
services, there are significant cross-country differences in
financial inclusion. For instance, Côte d’Ivoire (24 percent),
Ghana (13 percent), and Mali (12 percent) have the
highest figures for mobile money accounts (Figure 28).
From 2014-2017, demand for mobile accounts has increased
in all countries. In particular, the increase was higher
in Burkina Faso, Togo, Benin, and Sierra Leone where the
percentage of adults with mobile accounts in 2014 was
less than 5 percent. In 2017, the figure had more than
doubled.
0
20
40
60
80
100
120
140
160
2007 2017
The GambiaCôte d’IvoireGhanaMaliCabo VerdeSenegalGuineaMauritaniaBurkina FasoSierra LeoneTogo 0
10
20
30
40
50
60
70
2007 2017
Cabo VerdeSenegalCôte d’IvoireNigeriaGhanaBeninThe GambiaGuineaBurkina FasoMali
Figure 27: Mobile cellular subscriptions and internet using by country
Source: World Development Indicators, 2018.
Mobile cellular subscriptions (per 100 people) Individuals using Internet (% of population)

44
The use of digital technology for payment also varies
across countries and may depend on access to a mobile
money account. In Nigeria, the proportion of population
using digital payments declined between 2014 and 2017.
This period coincided with the country’s severe macro-
economic imbalances, capped by the economic recession
in 2016. In contrast, the rest of the region experienced
a significant increase. For instance, in Ghana, the proportion
of population having made or received digital payments
doubled from 25 percent to 50 percent. In Benin, Burkina
Faso and Togo the increase was more than threefold
(Figure 29).
W e s t A f r i c a E c o n o m i c O u t l o o k 2 0 2 0
0%
5%
10%
15%
20%
25%
30%
35%
40%
45%
Ghana Côted’Ivoire
BurkinaFaso
Senegal Mali Togo Liberia Benin Guinea SerraLeone
Niger Nigeria
2014 2017
Figure 28: Adults with a mobile money account (percent)
Source: Global Findex database.
0.0
10.0
20.0
30.0
40.0
50.0
60.0
Ghana BurkinaFaso
Côte d’Ivoire
Togo Mali Nigeria Benin Liberia Guinea SierraLeone
Niger
2014 2017
Figure 29: Have made or received digital payment
Source: World Bank Global Findex database.

45
Nigeria is the only country with low access to mobile money
accounts, yet, it has a relatively high proportion of population
using digital payments. This is because of widespread
and relatively inexpensive access to online banking services
in Nigeria, which makes mobile money accounts less
attractive for financial transactions. In 2019, each of the 10
largest commercial banks in Nigeria offered online banking
services and a smart phone application, with some of the
smaller institutions also increasing their footprint (World
Bank, 2019). The applications allow users to undertake
various transactions such as payment of bills, purchase
of mobile phone credit and make transfers. Some micro
and small companies also offer e-commerce, digital savings
and lending, and create new value by innovative uses
of data and integrating financial services with other digital
products.
W e s t A f r i c a E c o n o m i c O u t l o o k 2 0 2 0
Although subscription to mobile phones has increased
access to mobile enabled internet, fixed broadband
subscriptions still lag behind. Between 2012 and 2017,
the percentage of fixed broadband subscriptions was just
1 percent across the region. Cabo Verde, which had the
highest subscription rate of nearly 4 percent recorded a
decline to under 3 percent (Figure 30). Due to limited access
to broadband to enhance full utilization of the internet, a
great number of people and businesses are excluded from
the digital world.
Globally, Europe is the highest ranked in broadband tech-
nology with more than 20 subscriptions per 100 people,
followed by Latin America and the Caribbean, Asia and lastly
Africa (AfDB et al., 2018). Yet, ICT can enhance productive
capacity in the region. For instance, in 2018, growth of capital
services provided by ICT was highest in Côte d’Ivoire followed
by Niger and Senegal (Figure 31). Only in Nigeria has growth
in capital services provided by ICT services recorded a
decline. Fixed broadband infrastructure, a prerequisite for
deployment of digital technologies remains a major constraint
in the region. To ensure that the region is digitally enabled,
countries should invest in infrastructure to bridge the digital
0.00
0.50
1.00
1.50
2.00
2.50
3.00
3.50
4.00
4.50
2012 2017
Cabo Verde
Senegal
Togo
Côte d’Ivoire
Benin
Mali
Ghana
Liberia
The Gambia
Figure 30: Fixed broadband subscriptions (per 100 people)
Source: World Development Indicators, 2018.

46
divide and create an enabling regulatory environment for
technological adoption and adaptation to local conditions.
Considering the importance of digitization in driving business
growth and improving public service delivery, increasing
the level of digital literacy of the workforce could contribute
positively to productive knowledge.
Technological innovation, and especially the 4IR has the
potential to change the skills for the future to disrupt the
development narrative. Estimates by the World Economic
Forum (2016) suggest that 65 percent of children
entering primary school today will ultimately work in
new type of jobs and functions that currently do not
exist. Technological trends such as the Fourth Industrial
Revolution (4IR) will create new cross-functional roles
for which employees will need technical, social and
analytical skills.
This technological revolution, characterized by new technologies
including artificial intelligence, cloud computing, robotics,
3-D printing, the internet of things, and advanced wireless
technologies, are already gaining global traction and creating
development impact. For West Africa and the rest of the
continent, the 4IR could revitalize the development potential.
Technological revolution can stimulate productivity through
adoption of labor-saving technology. Whereas digitization and
automation facilitate faster growth of businesses and the
economy, it has implications for jobs, particularly for the low
skilled workforce, which can only be addressed through
education, training and skill upgrading. Figure 32 lists the
percentage of time spent in tasks that could be automated.
W e s t A f r i c a E c o n o m i c O u t l o o k 2 0 2 0
9.8
16.5
2.9
9.1
13.9
-2.3
11.1
-5.0
0.0
5.0
10.0
15.0
20.0
Burkina Faso Côte d’Ivoire Ghana Mali Niger Nigeria Senegal
Figure 31: ICT enabled increase in capital services (growth in percent), 2018
Source: The Conference Board, Total Economy Database.

47
W e s t A f r i c a E c o n o m i c O u t l o o k 2 0 2 0
More than half of time spent on activities such as accom-
modation and food services, manufacturing, agriculture,
transport and warehousing, retail trade and mining, most of
which are labor intensive, can be automated. On the other
hand, less than 40 percent of time in high-skilled occupations
such as administration, health care and social services,
information, professional, and management and education
services can be automated. The overall implication is that, a
greater share of high skilled tasks cannot be automated
because the skills required to perform the task cannot easily
be substituted. On the other hand, low skilled and mechanical
tasks have close substitutes and a greater proportion of tasks
could be eliminated by automation and digitization. Thus, the
extent to which the future of West Africa’s labor market would
be shaped by the 4IR depends largely on the nature and
structure of the labor market and the activities that can easily
be substituted by automation and digitization.
There is a job-creating effect of the 4IR, mostly in the
services sector, which would absorb middle and high skilled
labor. For instance, online talent platforms across the
Middle East and North Africa have the potential to create
significant benefits by moving people from informal to formal
jobs, increasing workforce participation and additional hours
worked of those formerly under-employed or inactive, and
shortening the duration of job searches (World Economic
Forum, 2017). The potential new jobs that would emerge
from the 4IR characterized by automation and digitization
are the very high-end jobs related to the development of
new products and services using ICTs and automation as
well as low-middle-end jobs through digital platforms from
e-commerce to micro-work. The 4IR could also create new
activities or jobs through development of value chains, mainly
in agriculture, facilitated by new technologies. Essentially,
sustainability of work in the future labor market, ruled by
0 10 20 30 40 50 60 70 80
Figure 32: Percent of time spent in task that could be automated
Source: McKinsey via Bridgewater Associates.

48
automation and digitization, depends on investment in quality
education and training characterized by digital and non-
routine analytical and socio-emotional skills.
West Africa has made strides in digitization relative to East
and Central Africa but lags behind North and Southern
Africa. Ghana ranks higher on the Digital Adoption Index (DAI)
in the 8th position in Africa behind four Southern Africa
and three North African countries (Annex 4). Niger, the lowest
ranked nation in West Africa, is only better than the average
country in Central African Republic. In West Africa, the DAI
ranges from a low of 0.16 for Niger to a high of 0.45 for
Ghana. In terms of automation, no country in West Africa
is listed among those using robots in manufacturing.
Automation is a key feature of 4IR, which underscores the
future of work and Africa remains at the bottom of the
automation pyramid. South Africa (ranked 33rd) is the only
African country listed among the top 42 countries in the
world in terms of density of robotic workers (Annex 5). West
African countries are further behind, underscoring the extent
of catching up required.
In 2017, South Africa had 28 installed industrial robots
per 10,000 employees in manufacturing compared with 710
for the top country globally, South Korea. Almost all robot
installations in Africa prior to 2017 were in South Africa. The
first time more than 100 units were recorded for other African
countries in 2017 and all were concentrated in North Africa,
with Moroccan automotive industry accounting for about 75
percent of the installations. According to the automation
readiness index, the most advanced country in the continent in
the robotization process is one of the least prepared globally
for the age of intelligent automation (EIU 2017).
2.3 EDUCATION AND SKILLS DEVELOPMENT
The education system in West Africa is not poised to
take advantage of the technological revolution, especially
with respect to 4IR. School enrolment has improved over
the last two decades. However, the average number of years
of schooling remains low with significant cross-country
variations (Figure 33). These variations are also evidence in
terms of school enrolment (Figure 34). Six out of 14 countries
have primary enrolment rates of at least 90 percent. Smaller
countries – Sierra Leone and The Gambia – have nearly
universal coverage at primary level. This follows improved
funding at this level, as well as abolition of user fees to
increase access to primary education. At less than 60
percent, enrolment ratios in Mali and Liberia are the lowest.
At the secondary level, six of the 15 countries – Liberia,
Niger, Mali, Burkina Faso, Guinea and Senegal – have lower
than the West African average of 37.9 percent secondary
school enrolment ratio. At the tertiary level, only five out of 13
countries for which data are available – Benin, Cabo Verde,
Ghana, Togo and Senegal – have enrolment rate higher than
the regional average of 12.6 percent, which by international
standards is critically low.
W e s t A f r i c a E c o n o m i c O u t l o o k 2 0 2 0

49
W e s t A f r i c a E c o n o m i c O u t l o o k 2 0 2 0
0 10 20 30 40 50 60 70 80
Burkina FasoMali
NigerGuinea
SenegalThe GambiaSierra Leone
BeninLiberia
Côte d’IvoireTogo
Cabo VerdeGhana
Both Male Female
Figure 33: Mean years of schooling for 25+years by gender for West Africa 2010-2017
Source: Constructed from UIS.UNESCO.
0 10 20 30 40 50 60 70 80 90 100
LiberiaMali
NigeriaNiger
SenegalGuinea
Burkina FasoGhana
Côte d’IvoireCabo Verde
TogoBenin
The GambiaSierra Leone
Figure 34: School enrolment rates for West African Countries 2010-2018 (percent)
Source: Constructed from World Development Indicators.
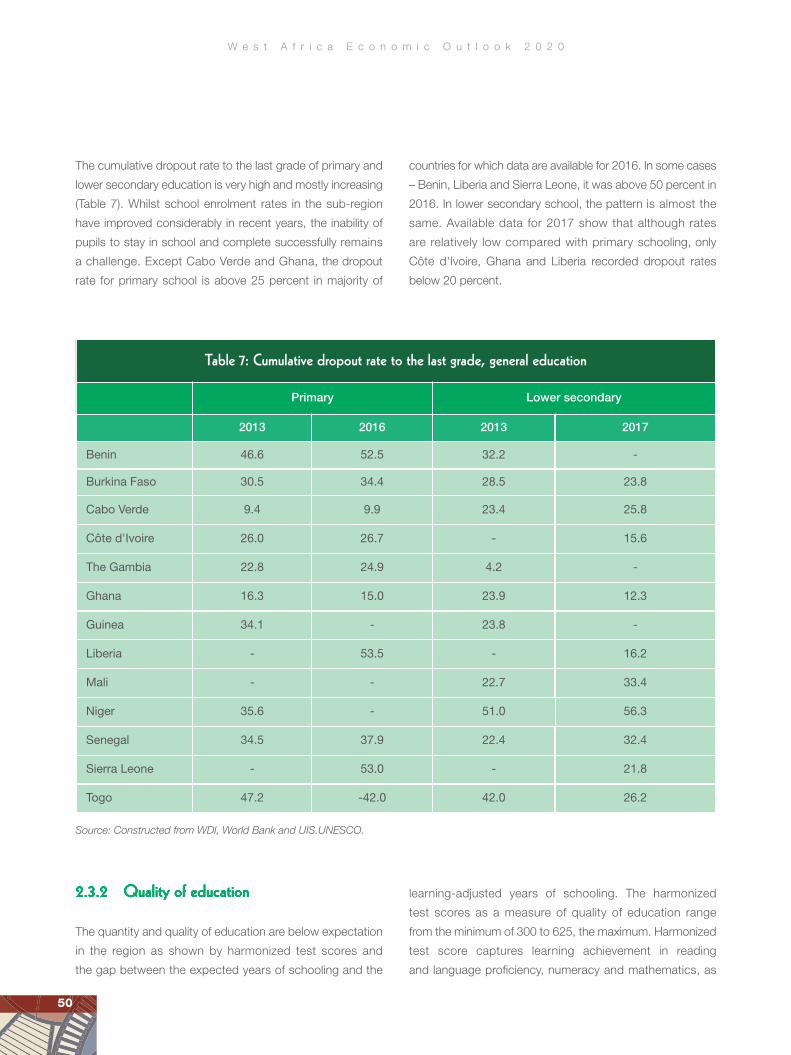
50
The cumulative dropout rate to the last grade of primary and
lower secondary education is very high and mostly increasing
(Table 7). Whilst school enrolment rates in the sub-region
have improved considerably in recent years, the inability of
pupils to stay in school and complete successfully remains
a challenge. Except Cabo Verde and Ghana, the dropout
rate for primary school is above 25 percent in majority of
countries for which data are available for 2016. In some cases
– Benin, Liberia and Sierra Leone, it was above 50 percent in
2016. In lower secondary school, the pattern is almost the
same. Available data for 2017 show that although rates
are relatively low compared with primary schooling, only
Côte d'Ivoire, Ghana and Liberia recorded dropout rates
below 20 percent.
W e s t A f r i c a E c o n o m i c O u t l o o k 2 0 2 0
The quantity and quality of education are below expectation
in the region as shown by harmonized test scores and
the gap between the expected years of schooling and the
learning-adjusted years of schooling. The harmonized
test scores as a measure of quality of education range
from the minimum of 300 to 625, the maximum. Harmonized
test score captures learning achievement in reading
and language proficiency, numeracy and mathematics, as
Table 7: Cumulative dropout rate to the last grade, general education
Primary Lower secondary
2013 2016 2013 2017
Benin 46.6 52.5 32.2 -
Burkina Faso 30.5 34.4 28.5 23.8
Cabo Verde 9.4 9.9 23.4 25.8
Côte d'Ivoire 26.0 26.7 - 15.6
The Gambia 22.8 24.9 4.2 -
Ghana 16.3 15.0 23.9 12.3
Guinea 34.1 - 23.8 -
Liberia - 53.5 - 16.2
Mali - - 22.7 33.4
Niger 35.6 - 51.0 56.3
Senegal 34.5 37.9 22.4 32.4
Sierra Leone - 53.0 - 21.8
Togo 47.2 -42.0 42.0 26.2
Source: Constructed from WDI, World Bank and UIS.UNESCO.

51
well as scientific knowledge and understanding in
computation (World Bank, 2018). Figure 35 shows
that Niger, Ghana, and Mali are close to the minimum.
Even countries above the minimum are still far below the
maximum. Senegal, Guinea, and Burkina Faso had the
highest harmonized test score of 412, 408 and 404
respectively. Senegal and Guinea were ranked 7th and 8th
in the region.
W e s t A f r i c a E c o n o m i c O u t l o o k 2 0 2 0
The learning-adjusted years of school children between 4
and 17 years is equally far below the expected years of
school (Figure 36). In Niger, Ghana, and Mali where the quality
of education is already low, the learning adjusted years of
schooling quantity is less than 50 percent of the requirement.
The highest performing countries are Senegal, Burkina
Faso, Guinea, and Benin, with more than 60 percent of
the learning-adjusted years of schooling. These countries also
scored higher on harmonized test scores. Although quantity
does not guarantee quality, at the minimum, increased
years of schooling, it provides an opportunity to assess
performance overtime and redress any challenges that
learners may be facing during their study. To be effective,
this should be supported by other interventions, including
increased funding allocation to education and prudent
management of resources, improved training of teachers,
invest in physical infrastructure to reduce class overcrowding
and improve contact between teachers and learners. A total
transformation of the education system is also required,
focusing on equity and fairness and ensuring the curriculum
meets the needs of the emerging economies, characterized
by technological revolution.
0100200300400500600700
Niger
Ghana
Mali
Sie
rra Le
one
The Gambia
Côte d’Ivoire
Burkina F
aso
Nigeria
Liberia
Togo Benin
Guinea
Senega
l
Harmonized Test Scores Maximum Minimum
Maximum, 625
Minimum, 300
Figure 35: Harmonized test scores
Source: Human capital database 2018.

52
W e s t A f r i c a E c o n o m i c O u t l o o k 2 0 2 0
0.0 10.0 20.0 30.0 40.0 50.0 60.0 70.0
Senegal
Burkina Faso
Togo
The Gambia
Nigeria
Mali
Niger
Figure 36: Learning-adjusted years of schooling as percent of expected years of school
Source: Human capital database 2018.
0 10 20 30 40 50 60
Tanzania
Sudan
Senegal
Ghana
Cabo Verde
Benin
Guinea
Burkina Faso
Côte d’Ivoire
Liberia
Togo
The Gambia
Niger
Mali
Ethiopia
Egypt
Angola
Figure 37: Vocational students (percent of total secondary school) 2010-2017
Source: Constructed from WDI, World Bank.

53
Technical and Vocational Education and Training (TVET) is
low in West Africa. The low level and low quality of technical
and vocational education in West Africa partly account
for the weakness in human capital in the region. Mali, with
the highest TVET in West Africa trails Angola, Egypt and
Ethiopia while Senegal, with the lowest share of TVET is
only better than Sudan and Tanzania (Figure 37). With the
exception of Mali, whose share of TVET in total secondary
school enrolment is 41 percent, the share in other countries
in West Africa for which data are available is less than a
third. Four countries (i.e. Benin, Cabo Verde, Ghana and
Senegal) have less than 10 percent share of TVET education.
The low share in West Africa partly reflects societal stigma-
tization of TVET as a second-class education preparing
its beneficiaries for manual labor rather than mental work.
Evidence shows that in countries where share of TVET is
high, there appears to have been little increase in employment
opportunities or better returns to individual incomes (Bennell,
2000). Indeed, low quality of TVET education does not appear
to improve labor productivity (ACET, 2014. As a result, there
is generally lack of expansion and uptake of TVET (Oketch,
2007) and hence the quality of students admitted into TVET
and the quality of delivery continues to be poor.
Demand for skills in the region is changing, oriented towards
technology-biased skills in response to technological trans-
formations. According to the World Economic Forum, across
all regions of the world, digital, marketing and talent-related
professions dominate the list of roles that have experienced
upward hiring trends alongside software engineers, data
analysts and human resources specialists (World Economic
Forum, 2018). However, education systems in West Africa
are not adapting to these trends.
W e s t A f r i c a E c o n o m i c O u t l o o k 2 0 2 0
0
10
20
30
40
50
60
The Gambia Burkina Faso Benin Niger Cabo Verde Ghana
Figure 38: Graduates in STEM, 2010-2018 (percent)
Source: Constructed from UIS, UNESCO.

54
Over the period 2010-2018, the share of tertiary graduates
in science, technology, engineering and mathematics (STEM)
has been very low (Figure 38). Apart from The Gambia, the
remaining five countries for which data are available have less
than 20 percent of tertiary graduates. Yet skills demand in
these areas is increasing. The quest for structural transfor-
mation in West Africa hinges largely on the ability of the
region’s countries to develop skilled workforce to drive the
transformation agenda and take up high-skill job opportunities.
In the global economy driven by technology and innovation,
acquisition of highly valued skills is a prerequisite for more
productive and decent employment. As ILO (2019) notes,
gaining skills that are valued in the labor market increases
the chances of finding a decent job in a world where skills,
technology, and innovation are shaping the demand for labor.
Underdevelopment in many African countries is not only
due to lack of capital but also reflects inadequate knowledge
and skills to enhance productivity. The ability for West African
countries to exploit abundant natural resource endowment
for economic transformation hinges on the development
of skills and technical knowhow.
Education and skills mismatch
One major reason behind the weak labor market effect of
formal education is the divergence between formal education
or skills requirement of the job and what jobseekers possess,
referred to as education and/or skill mismatch. According to
(Leuven and Oosterbeek, 2011), education (or qualification)
mismatch is measured by the difference between the actual
level of education (or qualification) and the required education
level for the job. As noted above, there is a generally higher
incidence of under-education among countries in West Africa
as compared to their peers in other parts of Africa (Figure 39).
Benin has the highest proportion of under-educated youth
workers among nine selected countries in Africa. In contrast,
West African countries have lower incidence of overeducation
in relative to their peers elsewhere in Africa. Although over-
education is relatively low, the educated youth in West Africa
lack the requisite skills. Thus, under-skilling is more pervasive
than over-skilling, reflecting the low quality of education
discussed above (see also Figure 40). Two countries – Benin
and Liberia – have a high incidence of under-skilling, only
better than Madagascar.
W e s t A f r i c a E c o n o m i c O u t l o o k 2 0 2 0
0 10 20 30 40 50 60 70 80ZambiaEgypt
TanzaniaMadagascar
LiberiaTogo
UgandaMalawiBenin
0 5 10 15 20 25Uganda
TogoBeninCongo
MadagascarLiberiaMalawi
TanzaniaEgypt
Zambia
Figure 39: Incidence of education mismatch in West and other African countries
Source: Computed based on ILOSTAT.
Undereducation (% of employed youth) Overeducation (% of employed youth)

55
W e s t A f r i c a E c o n o m i c O u t l o o k 2 0 2 0
0 5 10 15 20 25 30 35 40 45Egypt
ZambiaCongoTogo
MalawiTanzaniaUgandaLiberiaBenin
Madagascar
0 5 10 15 20 25 30 35 40UgandaBeninLiberia
MadagascarTogo
ZambiaCongoMalawi
TanzaniaEgypt
Figure 40: Incidence of skills mismatch in West and other African countries
Source: Computed based on ILOSTAT.
Skills enhancement is predicated on the potential return
from additional year of investment in acquiring the skill.
The private returns on education reflects earnings from
an additional year of investment made in schooling. The
private return to education is generally low in West Africa
although the figures exhibit cross-country variations in the
region (Table 8). For another year of schooling, the return to
education varies from 4.1 in Sierra Leone to 14.6 in Niger.
In most countries, the return to education is higher for
women than for men at the primary and secondary education,
except in The Gambia and Niger with lower returns at the
primary level. For tertiary education, the return to education
is higher for women than for men in Côte d’Ivoire, Ghana,
Nigeria, Senegal, and Sierra Leone, and the inverse in the
rest of the countries. Overall, these statistics lend credence
to the push for more investment that benefits women to
improve gender inclusion in education. In sum, 5 out of 9
countries for which data are available for primary, secondary
and tertiary level, returns to schooling are highest for tertiary
level, followed by primary level and then secondary level.
Under-skilling (% of youth workers) Over-skilling (% of youth workers)

56
W e s t A f r i c a E c o n o m i c O u t l o o k 2 0 2 0
The skills mismatch in the region also shows up in the human
capital development, measured by the Human Capital
Index (HCI). The HCI is a composite statistic generated
from four elements of human capital: capacity, development,
deployment and know-how (World Economic Forum, 2016).
Capacity captures the percentage of the population that
has achieved at least primary education and the proportion
of the population with the basic level of literacy and numeracy.
Apart from Nigeria and Ghana, other countries were below
40 percent, suggesting a constraint for such countries in
adapting to new technologies and to innovate and compete
globally. The development element captures formal education
of the next-generation workforce and continued upskilling
and reskilling of the current workforce. Based on available
statistics, many countries in West Africa perform better on the
‘development’ dimension of HCI than on the capacity element.
Ten countries were above 40 percent but still below 60
percent (Figure 41).
Table 8: Returns to education
Country Year Another
year of
schooling
Primary Secondary Tertiary
Male Female Total Male Female Total Male Female Total
Burkina Faso 2003 12.2 12.2 12.8 12 10.9 17.6 12.2 27.6 12.5 19.6
Côte d'Ivoire 2008 11.3 7.7 19.4 12.6 10.9 14.1 12.1 21.9 31 24.9
The Gambia 1998 9.1 9.6 1.5 9.4 5.3 19.4 8.6 22.7 4.5 18.1
Ghana 2012 12.5 - 2.3 2.7 6.5 11 8.8 26.6 34.8 28.7
Guinea 1994 6.3 19.4 24.4 19.5 - 0.5 - 10.4 4.4 8.8
Mali 1994 13 14.3 39.5 21.2 11.1 16.1 12.4 18.8 17.9 19.3
Niger 2011 14.6 40.5 25.7 38.7 - 11.6 6.3 35.8 28.3 29.7
Nigeria 2003 10.1 12.5 30.6 16.6 6.1 8.2 6.8 12.1 13.7 13
Senegal 2011 11.8 7.6 27.3 9.8 5.6 10.1 6.5 19.3 26.3 21.8
Sierra Leone 2011 4.1 3.2 9.5 5.5 3.9 7 4.4 3.8 1.9 3.5
Togo 2011 12.2 2.8 11.6 15 5.7 12.1 8.2 - - -
Source: Montenegro and Patrinos (2014).

57
The ‘deployment’ dimension measures the number of people
that can participate actively in the workforce as well as how
successful segments of population such as women, youth
and older people, are able to contribute to the economy.
Sub-Saharan African countries have limited capacity but
high deployment, through the quantity of labor deployed in
the economy and the skills gained in informal learning. This
element exceeds 60 percent in many West African countries,
reflecting high labor force participation, low gender gap
and low rates of unemployment. The ‘know-how’ element
concerns the breadth and depth on the use of specialized
skills at work and includes economic complexity, share of
medium-skilled and high-skilled employment and availability
of skilled employees. Although this element exceeds 40
percent in many countries in the region, it does not attain
60 percent in any of them. This implies that employers’
perceptions about availability of the ease of filling vacancies
is not favorable.
With the poor performance on the constituent elements
of the HCI in West Africa, it is not surprising that none of the
countries in the region exceeded 0.45 on the composite
measure. Indeed, overall human capital appears to be very
weak across the region, with the index ranging from 0.32 to
0.44 (Figure 42). Ghana, the best ranked country in West
Africa in 2018, was in 116th place among 157 countries in the
list. This was followed respectively by Senegal (121th), Togo
(122th), Benin (127th), and The Gambia (130th) while Liberia
(153th), Mali (154th), and Niger (155th) were ranked in the
bottom tier. The implication of the HCI range for West Africa
W e s t A f r i c a E c o n o m i c O u t l o o k 2 0 2 0
0 10 20 30 40 50 60 70 80 90
Benin
Côte d’Ivoire
The Gambia
Ghana
Guinea
Liberia
Mali
Nigeria
Senegal
Sierra Leone
Capacity Development Deployment Know-how
Figure 41: Investments in the four elements of human capital by country
Source: Global Human Capital Report, 2017.

58
is that countries in the region are currently leveraging less
than 55 percent of their human capital, which represents
the knowledge and skills individuals possess to enable them
add value in the economy. With such little knowledge
and skills, it is unlikely that individuals will be able to take
advantage of the 4IR unless the education system is deeply
transformed. Some countries also have a wide HCI gender
gap.
W e s t A f r i c a E c o n o m i c O u t l o o k 2 0 2 0
Skills development for the future labor market
The low level of human capital in West Africa has implications
for the region’s capability to embrace and benefit from the
4IR in terms of employment. One of the disadvantages of the
education system in West Africa is that there is less focus
on practical application in the curricula. Instead, the delivery
of education places too much emphasis on certificate
acquisition rather than the practical content. As a result,
graduates exit the education system without acquiring the
requisite skills needed for the job market. Indeed, investors
cite lack of skills as a binding constraint to private sector
investment in Africa. Box 3 shows that a lack of skills is a
hindrance to business development.
0
20
40
60
80
100
120
140
160
180
0.000.050.100.150.200.250.300.350.400.450.50
Ghana
Senega
lTogo
Benin
The Gambia
Guinea
Burkina F
aso
Côte d’Ivoire
Sierra
Leone
Nigeria
Liberia Mali
Niger
Figure 42: Human capital index by country
Source: Global Human Capital Report, 2017.

59
W e s t A f r i c a E c o n o m i c O u t l o o k 2 0 2 0
Box 3: Skills and business performance in West Africa
An underqualified workforce is a major constraint for businesses. This concern has been echoed by more than 79 percentof global business leaders in the PWC’s 22nd Annual Global CEO Survey published in January 2019 (PwC 2019). Thepicture is even more distressing among African business leaders as the figure reached 87 percent, and 45 percent of respondents were “extremely concerned”. Lack of skills was also perceived to have multiple consequences on businesses, notably: (i) inability to innovate effectively; (ii) increased potential to undermine quality standards and customer experience; and (iii) danger of missing growth targets. This evidence bears significant impact on economicgrowth, especially in West Africa region where most firms operating in countries such as Benin, Burkina Faso, CaboVerde, Côte d’Ivoire, Mali, Niger and Togo have consistently identified an inadequately educated workforce as a majorconstraint to business (Figure 43).
The quality of the labor force, especially in a job applicant’s core skills (e.g. science, technology, engineering and mathematics) and the mismatch between education supply and the needs of the current and prospective labor market,are among the priority constraints that need to be addressed going forward. Efforts to address this deficiency have notyielded enough results. Notably, technical and vocational education and training (TVET) systems in West Africa tend todiffer significantly from country to country, both in terms of structure and functioning. Often these are not well integratedinto the education system and do not meet job market demands (Akoojee, 2016). In fact, the UNESCO database onTVET reveals the great inequity in access to TVET training across countries in the region. For example, the percentageof students enrolled on TVET training as a share of total secondary enrolment levels is relatively high in Niger (32.7 percent),Togo (18.9 percent), Liberia (17.6 percent), Côte d’Ivoire (11.7 percent), The Gambia (11 percent); and Nigeria (10.1percent). In contrast, Guinea Bissau and Sierra Leone evidence levels below 1 percent, in part due to their protractedinstitutional and political fragility. A better articulation between general TVET course diversity and supply is especiallyimportant in the context of the region.
Outside TVET, the region’s tenuous security situation has adversely affected delivery of quality education in countriesaffected by internal conflict. The massive closure of schools in conflict zones in Burkina Faso, Mali, Nigeria and Nigerhas virtually decimated already poor education systems in these countries. The consequences of these closures willhave medium and long-term implications on skills and human capital development more generally.
010
20
30
40
50
60
Cabo Verde (2
009)
Mali (2
016)
Burkina F
aso (2
009)
Côte d’Ivoire
(2016)
Benin (2016)
Niger (2
017)
Togo (2
016)
The Gambia
(2019)
Ghana (
2013)
Guinea (2013)
Liberia
(2016)
Sierra
Leone (2
017)
Guinea-Biss
au (2
006)
Senega
l (2014)
Nigeria
(2014)
Figure 43: Firms identifying inadequately educated workforce as a major constraint (percent)
Source: World Development Indicators/World Bank 2019. Enterprise Surveys.
Figures in parathesis correspond to the latest year in which survey data is available.
Percent of firms identifying an inadequately educated workforce as a major constraint (%)

60
In countries of West Africa, the proportion of working age
population is projected to increase in the next 30 years.
For those with secondary education, it is projected to grow
from 51 percent in 2020 to 70 percent by 2050 while for
tertiary education it will increase from 9 percent to 16 percent.4
This expansion means that the labor force could shift from
low skill occupations to the mostly medium skilled jobs and
to a lesser extent the high skilled occupations. As Figure 44
shows, the share of medium skilled occupations is projected
to rise from 29.5 percent to 36.1 percent between 2020
and 2050 against a 2.7 percentage increase in the share of
high skilled occupations from 18.3 percent to 21 percent.
In contrast, low skill jobs are projected to shrink by about
10 percentage points from 52.2 percent to 42.9 percent in
three decades. The increase in medium and high-skilled
jobs reflects growing realization to expand skills base
across countries in West Africa in order to narrow the skills
mismatch.
W e s t A f r i c a E c o n o m i c O u t l o o k 2 0 2 0
Ghana is projected to record the largest increase in the
share of high skilled occupations from 13 percent in 2020
to 20.6 percent in 2050, followed by Nigeria with a 3.2
percentage gain from 31.2 percent to 34.4 percent over the
same period (Figure 45a). Four countries – Côte d’Ivoire,
Mali, Benin and Guinea are projected to have high skilled
occupations in total employment rise by 2.7 to 2.1 percentage
points, whilst Togo and Niger will manage to expand by 1.6
and 1.2 percentage points, with the least appreciation of 0.7
percentage points projected to happen in Burkina Faso. For
medium skill jobs, the projected highest increase will be in
Ghana from 53 percent to 66 percent over a 30-year period,
0%10%20%30%40%50%60%70%80%90%
100%
2020202120222023202420252026202720282029203020312032203320342035203620372038203920402041204220432044204520462047204820492050
Low skill job Medium-skill job High-skill job
Figure 44: Projection of employment by skilling (percent)
Source: UIS.UNESCO and WDI, World Bank.
4 Source: Global Projection – IIASA, https://ourworldindata.org/projections-of-future-education

61
followed by Côte d’Ivoire and Guinea (Figure 45b). Nigeria,
the regional largest labor market is projected to experience a
rise of 5.4 percentage points from 27.9 percent to 33.3 percent
increase in medium skill occupation. In effect, investment in
the quality of education with emphasis on STEM and non-
routine analytical and social skills will be critical for the labor
force in the region to benefit from a shift from low skilled to
medium and high skilled jobs.
W e s t A f r i c a E c o n o m i c O u t l o o k 2 0 2 0
Figure 45: Projection of (a) high skill and (b) medium skill jobs in West Africa (percent)
Source: Computed from ILOSTAT.
0.0
5.0
10.0
15.0
20.0
25.0
30.0
35.0
40.0
2020202220242026202820302032203420362038204020422044204620482050
Nigeria
Ghana
Côte d’Ivoire
Benin
Guinea
Togo
Mali
Niger
Burkina Faso
(a) High skill jobs
2020202220242026202820302032203420362038204020422044204620482050
0.0
10.0
20.0
30.0
40.0
50.0
60.0
70.0
Ghana
Côte d’Ivoire
Nigeria
Guinea
Benin
Mali
Togo
Niger
Burkina Faso
(b) Medium skill jobs

62
2.4 FINANCING EDUCATION ANDSKILLS DEVELOPMENT IN WESTAFRICA
As in many developing countries, public expenditure accounts
for a sizable proportion of total education financing in West
Africa. It ranges from a high of at least 5 percent of GDP in
Cabo Verde, Côte d’Ivoire and Senegal to just 2 percent of
GDP in The Gambia, Guinea, Guinea Bissau and Liberia (Figure
46). In terms of budget commitment to education, Sierra Leone
has the highest share of education spending of 30 percent
compared to 7 percent for Liberia. Sierra Leone has a free
education policy for primary and secondary school aimed at
increasing access. In Senegal and Ghana, public spending of
education accounts for about a fifth of government expenditure
compared to a maximum of 19 percent in other countries
in the region. In terms of allocation, the largest share of
government expenditure on education generally goes to basic
education, followed by secondary education. Figure 47 shows
that basic education accounts for the largest share of the
education budget in 10 of the fourteen West African countries
for which data are available while in Cabo Verde, Liberia and
Ghana, the largest education budget is for secondary school.
Like Sierra Leone, Ghana also has also put in place a free
primary education policy.
W e s t A f r i c a E c o n o m i c O u t l o o k 2 0 2 0
0 10 15 20 25 30 30 35The Gambia
Guinea-BissauGuineaLiberia
NigerMali
Burkina FasoBenin
GhanaSierra Leone
TogoSenegal
Côte d’IvoireCabo Verde
Figure 46: Government expenditure on education as a percent of total public spending and GDP
Source: UIS.UNESCO and WDI, World Bank.

63
W e s t A f r i c a E c o n o m i c O u t l o o k 2 0 2 0
0 10 20 30 40 50 60 70 80 90 100
Ghana
Liberia
Sierra Leone
Senegal
Cabo Verde
Mali
Côte d’Ivoire
Niger
Benin
The Gambia
Burkina Faso
Guinea
Togo
Guinea-Bissau
Primary Secondary Other
Figure 47: Distribution of Education budget by levels
Source: UIS, UNESCO and WDI.
On average, households account for about 30 percent of total
education financing in Africa, according to ICP expenditure
data. Within the West Africa region, household spending
on education as a share of total education spending
varies widely across countries. The variation ranges from a
high of 82 percent in Ghana to a low of about 6 percent in
Cabo Verde (Figure 48). Household education financing
in five countries – The Gambia, Ghana, Guinea Bissau,
Liberia and Sierra Leone - is higher than the African
average.

64
W e s t A f r i c a E c o n o m i c O u t l o o k 2 0 2 0
Private sector financing of education and training takes
different forms and is stronger at secondary than primary
school level (Figure 49). It includes provision of scholarships
and other support to students as part of the corporate
social responsibilities as well as financing of on-the-job
training. Private institutions are also involved directly in
the provision of education and training in the education
sector. Private schools are often owned and funded
by non-state actors, notably charity and faith-based
organizations/institutions, communities and profit oriented
institutions. Essentially, the contribution of private education
and skills development providers is quite significant, reflecting
growing demand for private education as quality of education
in public schools has deteriorated owing to dwindling
funding.
0
10
20
30
40
50
60
70
80
90
Cabo Verde
Burkina F
aso
Senega
l
Côte d’Ivoire Mali
BeninNige
rTogo
Guinea
Nigeria
Guinea-Biss
au
The Gambia
Liberia
Sierra
Leone
Ghana
Africa
Figure 48: Household expenditure as a percent of total education expenditure
Source: Computations based on AfDB statistics and World Development Indicators.

65
West Africa’s education and skill development is characterized
by a large financing gap and often rely on external support.
Out of USD14.8 billion total external education financing
recorded in 2017, 36 percent was to Africa. International
financing of education is quite significant in some West African
countries. For instance, international partners contribute more
than 25 percent of the education budget in Burkina Faso and
Mali. Available statistics from the OECD (Organisation of
Economic Cooperation and Development) suggest that in
2013-2014, 34 percent of aid to education was for post-
secondary schooling. Allocation for basic education was
26 percent. Secondary school education and education
policy, administration and management each accounted for
15 percent, whilst 10 percent was for improving education
facilities, training and research. Two West African countries
– Nigeria and Senegal - were listed among the main recipients
of aid (in absolute terms) to education in developing countries.5
The International Development Association (IDA) of the World
Bank is the main source of aid to education in Nigeria,
accounting for about 62 percent of total aid to education
whilst the bulk of aid to Senegal’s education (53.7 percent)
comes from multiple donors. France contributed a little
over a quarter of aid to education in Senegal compared to
less than 2 percent of aid to education of Nigeria in 2014.
Between them, the United States and Germany accounted
for less than 3 percent of aid to education in Senegal and
about 5 percent for Nigeria.
W e s t A f r i c a E c o n o m i c O u t l o o k 2 0 2 0
0 10 20 30 40 50 60 70
Cabo Verde
Sierra Leone
Niger
Benin
Ghana
Nigeria
Senegal
Togo
Guinea
Burkina Faso
Mali
Côte d’Ivoire
Liberia
Secondary Primary
Figure 49: Share of private involvement in primary and secondary levels 2010-2018
Source: Computations based on AfDB statistics and World Development Indicators.
5 https://www.oecd.org/dac/financing-sustainable-development/development-finance-topics/aid-to-education-data.pdf

66
The quality of education delivery varies across countries and
there are large disparities in amount of resources allocated to
the education sector vis-à-vis the realized outcomes. Senegal
rank among the top countries in the region in terms of
proportion of education expenditure to GDP. Increases in
education spending could generate positive distributional
outcomes (Ahmed et al. 2017).
The efficiency of government expenditure on education
can be assessed based on quality and quantity of education.
Figure 50 displays education-spending efficiency across the
five sub-regions in Africa at the primary and secondary level
as well as country level analysis for West Africa. Figure 50
(regional comparison) shows that West Africa lags North,
East and Southern Africa, in the efficiency of government
education spending with scores of 55 percent and 35 percent
at primary and secondary level, respectively. West Africa
performed only better than Central Africa, the least efficient
in terms of government education spending. Figure 50
(efficiency frontier) shows education outcomes (secondary
school enrolment) relative to amount spent. Apart from Benin,
Cabo Verde, The Gambia, Ghana and Togo, all countries
were below the continental average. In addition, where current
expenditure levels may justify higher outcomes (e.g. Niger and
Senegal), this is not yet the case, thus hinting at persistent
inefficiency in public spending on education. This calls for
investment and policies to ensure greater educational efficiency
to stimulate equitable growth.
W e s t A f r i c a E c o n o m i c O u t l o o k 2 0 2 0
Teacher salaries account for a major component of the
education budget in many countries. However, teacher
motivation in terms of salaries is often singled out as one of
the key reasons why quality teachers are not attracted and
retained, and this results in low quality of teachers in West
African countries.
0
10
20304050
607080
Southern North East West Central
Primary Secondary
78
67 6455
32
68
43 46
35
17
0102030405060708090
100
1.5 2.5 3.5 4.5 5.5 6.5 7.5
Cabo Verde
Burkina Faso
Benin
Niger
Togo
LiberiaSierra Leone
Nigeria
Figure 50: Efficiency of education spending
Source: Constructed from UIS.UNESCO and data from Statistics Dept., AfDB.
(a) Regional Comparison (b) Education efficiency frontier of countriesin West Africa

67
Inadequate teachers translate into overcrowded classrooms,
one of the major causes of poor foundational development
of students and a general deficit in skills needed for the
changing labor market. To ensure achievement of desirable
educational outcomes in terms of quality and quantity to meet
the skills needs of the labor market in the future requires a
policy effort in terms of addressing shortages of teachers.
Some countries in West Africa have embraced the policy
of free education particularly at the primary level to boost
enrolment. The justification of this move emanates from
financing constraints of many poor households, which tend
to deprive children in such households of the chance to
benefit from education.
In most West African countries, education is subsidized
up to college level. Ghana has extended free education
from basic level (primary and junior high school) to senior
high school since 2017, resulting in significant increase in
secondary school enrolment. The government has also been
implementing school-feeding programs at the basic level
over the last 15 years. Like Ghana, Nigeria also runs a school
feeding program, that has helped improve school attendance.
These programs raise issues of sustainability, given the limited
public budgetary resources. Other concerns relate to inefficient
allocation of resources and poor targeting of the subsidy
education. While acknowledging that quality education in
right quantity is important to ensure the region plugs into
the 4IR, allocation of public resources must be informed on
efficiency grounds.
2.5 CONCLUSION AND POLICY RECOMMENDATIONS
The youthful population in West Africa is increasing but is
affected by deficit of technological and vocational skills.
Demand for digital services is also increasing yet the education
system remains ill equipped to prepare workers with the skills
needed for the job market. The current wave of technological
change will undoubtedly have a disruptive impact on the
labor market in West Africa, although the pace of change
will vary within countries and across countries. To adapt to
the change, countries need to make investment in improving
the education system. Importantly, investment must be
targeted at upskilling and reskilling the existing workforce and
for emerging cohorts of the youthful population.
Technology can be used to enhance effectiveness and
increasing productivity of services. In the agriculture sector,
agro-industrialization technology can be used across the
value chain for creating markets and facilitating the creation
of jobs.
As automation and digitization shake the structure of
work with potential to displace a section of the workforce,
governments are required to formulate and implement
labor market and human development policies that would
protect workers and insulate them from any shakeup resulting
from the constant technological change. Economic, human
capital and labor market policies ought to be designed
to meet the needs and requirements of the changing
labor market.
The skills employers seek are changing rapidly from manual
to analytical and interactive tasks shaped mainly by rapid
spread of ICTs. However, supply of such skills is not
increasing commensurately, especially in STEM subjects.
Governments should create incentives for private sector
investment in infrastructure that promotes STEM education.
This will help improve the quality of education as well as
ensure synergy between industry and academia and
promotion of critical thinking that would make young people
adaptable to the changing world of work.
Preparing young people for the future of work should not be
oblivious to the importance of soft and cognitive skills. This
includes skills in effective communication and innovation.
Where formal training for such skills may not be cost effective,
the nonformal option may be explored to enhance on the job
skills development in these areas.
Beyond teaching and training, research and development are
key to boosting innovation especially with the advent of 4IR.
Thus, to align training with the 41R, countries must invest
in digital infrastructure and in technical education to ensure
graduates are competitive in a future global labor market that
W e s t A f r i c a E c o n o m i c O u t l o o k 2 0 2 0

68
is being shaped by automation and digitization of processes
and functions.
Instructors should devote some time to working in industries
while practitioners need to contribute to curricula design in
order to improve quality of education. A policy that mandates
instructors to teach and assess students in terms of critical
thinking and avoids a one-size-fits-all assessment system
could contribute to improving the quality of education.
Measures to improve incentives for teachers would improve
morale, thereby address the high incidence of absenteeism
to avert declining education outcomes.
W e s t A f r i c a E c o n o m i c O u t l o o k 2 0 2 0


70
W e s t A f r i c a E c o n o m i c O u t l o o k 2 0 2 0
Source: United Nations, World Population Prospects.
ANNEXES
0
100
200
300
400
500
600
1950
1955
1960
1965
1970
1975
1980
1985
1990
1995
2000
2005
2010
2015
2020
2025
2030
2035
2040
2045
2050
East Africa Central Africa Southern Africa North Africa West Africa
Annex 1: Trend and projection of the working age population by region
1950
1955
1960
1965
1970
1975
1980
1985
1990
1995
2000
2005
2010
2015
2020
2025
2030
2035
2040
2045
2050
0
50
100
150
200
250
300
350
East Africa Central Africa Southern Africa North Africa West Africa
Annex 2: Trend and projection of youth population (15-34) by region

71
W e s t A f r i c a E c o n o m i c O u t l o o k 2 0 2 0
0
2 000
4 000
6 000
8 000
10 000
12 000
14 000
16 000
1990 1995 2000 2005 2010 2015 2020 2025 2030 2035 2040 2045 2050
Cabo Verde
Guinea-Bissau
The Gambia
Liberia
Sierra Leone
Togo
Benin
1990 1995 2000 2005 2010 2015 2020 2025 2030 2035 2040 2045 2050
Guinea
Senegal
Mali
Burkina Fasso
Côte d’Ivoire
Ghana
Niger
0
5 000
10 000
15 000
20 000
25 000
30 000
35 000
40 000
0
50 000
100 000
150 000
200 000
250 000
300 000
1990 1995 2000 2005 2010 2015 2020 2025 2030 2035 2040 2045 2050
Annex 3: Trend of working age population by country 1990-2050 (thousands)
Source: ILOSTAT.
Nigeria

72
W e s t A f r i c a E c o n o m i c O u t l o o k 2 0 2 0
0.00 0.10 0.20 0.30 0.40 0.50 0.60 0.70Central African Republic (47)
Niger (46)Guinea (44)
Benin (42)Burkina Faso (40)
Liberia (39)Togo (38)
Guinea-Bissau (33)Sierra Leone (30)
Mali (29)Senegal (17)
The Gambia (16)Nigeria (13)
Cabo Verde (10)Ghana (8)
Botswana (7)Egypt (6)
Morocco (5)Tunisia (4)
Seychelles (3)
South Africa (1)
Annex 4: Digital adoption index
Source: World Bank https://www.worldbank.org/en/publication/wdr2016/Digital-Adoption-Index.
33102834
97137161172200
308322
658710
0 100 200 300 400 500 600 700 800
CountryIndia (44)Rusia (45)Brazil (39)
South Africa (33)Malaysia (29)
China (23)France (13)
Canada (13)Netherlands (12)United States (7)
Japan (4)Germany (3)
Singapore (2)South Korea (1)
Annex 5: Installed industrial robots per 10,000 employees in manufacturing, 2017
Source: International Federation of Robotics.

73
W e s t A f r i c a E c o n o m i c O u t l o o k 2 0 2 0
REFERENCES
ACET. 2014. Growth with Depth. African Transformation Report, Accra: African Centre for Economic Transformation.
AfDB. 2018. Africa Economic Outlook 2018. Abidjan: African Development Bank.
AfDB. 2019. Africa Economic Outlook 2019. Abidjan: African Development Bank.
AfDB. 2020. African Development Bank 2020. Abidjan: African Development Bank.
2019. “Creating Decent Jobs: Strategies, Policies and Instruments.” Policy Research Document 2. Abidjan: African DevelopmentBank.
AfDB; ADB; EBRD; IDB. 2018. The Future of Work: Regional Perspectives. African Development Bank, Asian DevelopmentBank, European Bank for Reconstruction and Development, Inter-American Development Bank.
Ahmed, S.A, M Bussolo, M Cruz, D.S Go, and I Osorio-Rodarte. 2017. “Global Inequality in a More Educated World.” Policy
Research Working Paper No., 8135. Washington, DC: World Bank.
Akoojee, S. 2016. “Developmental TVET Rhetoric in Action: The White Paper for Post-School Education and Training in SouthAfrica.” International Journal for Research in Vocational Education and Training 3 (1): 1-15.
Baah-Boateng, W. 2013. “Determinants of Unemployment in Ghana.” African Development Review 21 (4): 385-399.
Baah-Boateng, W. 2015. “Unemployment in Ghana: A Cross Sectional Analysis from Demand and Supply Perspectives.” African
Journal of Economics and Management Studies 6 (4): 402-415.
Barrett, C. B., L. Christiaensen, M. Sheahan, and Shimeles. 2017. “On the structural transformation of rural Africa.” Journal of
African Economies 26 (s1): i11–i35.
ECOWAS. 2019. “Fifty-Sixth Ordinary Session of the ECOWAS Authority of the Heads of State and Government.” Final
Communique. Abuja: Economic Commission for West African States (ECOWAS), 21 December.
EIU. 2017. “Rebooting supply chains: Shorter, smarter and more sustainable .” London: The Economist Intelligence Unit.
Fitch Solutions. 2019. “Africa Monitor: West Africa.” Vol. 24. July-August.
Haile, F. 2018. “Structural change in West Africa: a Tale of gain and loss.” Policy Research Working Paper No. WPS 8336.Washington DC: World Bank.
ILO. 2019. “World Employment and Social Outlook: Trends 2019.” Geneva: International Labor Organization.
Leuven, E, and H Oosterbeek. 2011. Overeducation and Mismatch in the Labour Market. Vol. 4, edited by E Leuven and H Oosterbeek, 283-326.
Masson, P, and C. Pattillo. 2001. “Monetary Union in West Africa (ECOWAS): Is It Desirable and How Could It Be Achieved?”IMF Occasional Paper 204. Washington DC: International Monetary Fund (IMF).

74
W e s t A f r i c a E c o n o m i c O u t l o o k 2 0 2 0
Montenegro, C. E, and H. A Patrinos. 2014. “Comparable Estimates of Returns to Schooling Around the World.” Washington,DC: World Bank, Washington.
Mussa, M, E Jadresić, A Swoboda, P Mauro, P Masson, and A. Berg. 2000. “Exchange Rate Regimes in an Increasingly Integrated World Economy.” IMF Occasional Paper 193. Washington DC: International Monetary Fund (IMF).
Oketch, M.O. 2007. “To vocationalise or not to vocationalise? Perspectives on current trends and issues in technical and vocational education and training (TVET) in Africa.” International Journal of Educational Development 27 (2): 220-234.
PwC. 2019. “22nd CEO Survey.” PriceWaterhouseCoopers.
2019. “Strength from abroad: The economic power of Nigeria’s diaspora.” Lagos: PriceWaterhouseCoopers.
Ratha, D. 2019. Migration and Remittances: Recent Developments and Outlook. Washington D.C: World Bank.
Rodrik, D. 2016. “Premature deindustrialization. Journal of economic growth.” Journal of economic growth 21 (1): 1-33.
World Bank. 2019. Nigeria: Digital Economy Diagnostic Report. Washington, DC: World Bank.
World Bank. 2018. The Human Capital Project. Washington, DC: World Bank.
World Economic Forum. 2017. The Future of Jobs and Skills in the Middle East and North Africa: Preparing the Region for the
Fourth Industrial Revolution. Geneva: World Economic Forum.
World Economic Forum. 2018. The Future of Jobs Report. Insight Report, Geneva: World Economic Forum.
World Economic Forum. 2016. The Future of Jobs: Employment, Skills and Workforce Strategy for the Fourth Industrial
Revolution. Geneva: World Economic Forum.
World Economic Forum. 2016. The Global Human Capital Report. Geneva: World Economic Forum.
Copyright © 2022 FDOKUMEN


![Topic Wise Question Bank of Modern India [1979-2020]](https://static.fdokumen.com/doc/165x107/631acb4bc51d6b41aa04f944/topic-wise-question-bank-of-modern-india-1979-2020.jpg)