2019 Solid Waste Data Update October 2020 - Mass.gov
11
Charles D. Baker Governor Karyn E. Polito Lieutenant Governor Kathleen A. Theoharides Secretary Martin Suuberg Commissioner This information is available in alternate format. Contact Michelle Waters-Ekanem, Director of Diversity/Civil Rights at 617-292-5751. TTY# MassRelay Service 1-800-439-2370 MassDEP Website: www.mass.gov/dep Printed on Recycled Paper 2019 Solid Waste Data Update October 2020
-
Upload
khangminh22 -
Category
Documents
-
view
0 -
download
0
Transcript of 2019 Solid Waste Data Update October 2020 - Mass.gov

Charles D. Baker Governor Karyn E. Polito Lieutenant Governor
Kathleen A. TheoharidesSecretary
Martin SuubergCommissioner
This information is available in alternate format. Contact Michelle Waters-Ekanem, Director of Diversity/Civil Rights at 617-292-5751.
TTY# MassRelay Service 1-800-439-2370 MassDEP Website: www.mass.gov/dep
Printed on Recycled Paper
2019 Solid Waste Data Update
October 2020
1
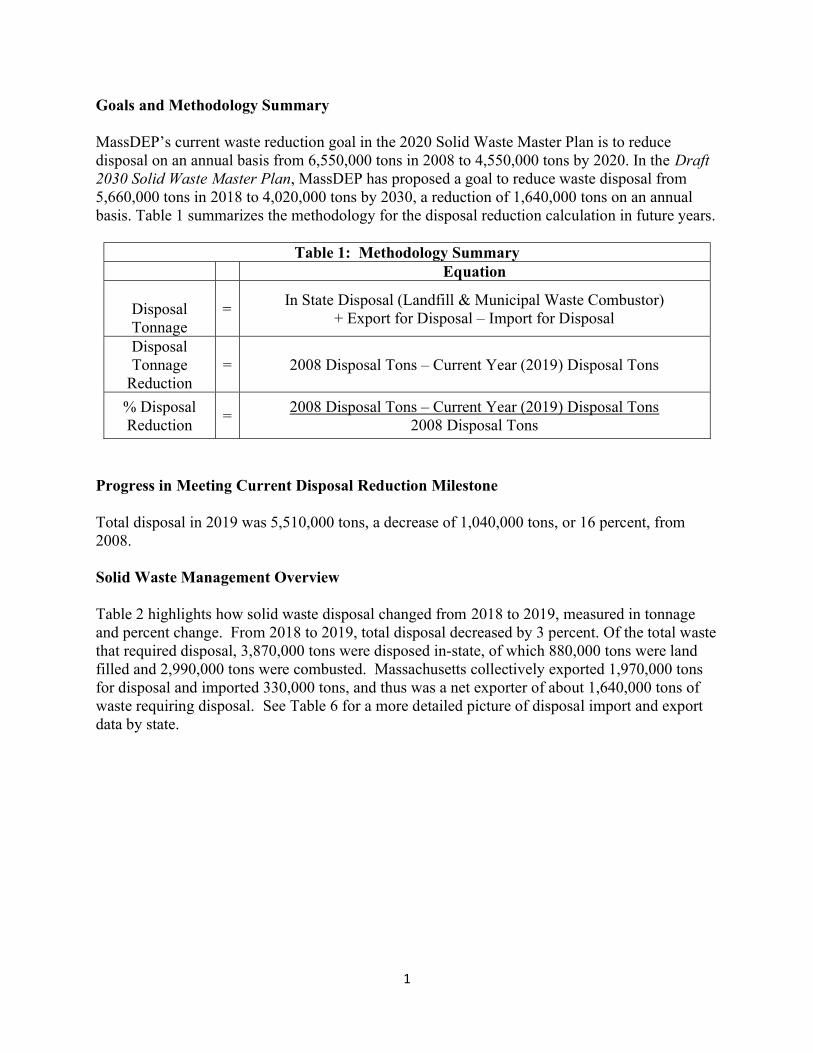
Goals and Methodology Summary MassDEP’s current waste reduction goal in the 2020 Solid Waste Master Plan is to reduce disposal on an annual basis from 6,550,000 tons in 2008 to 4,550,000 tons by 2020. In the Draft 2030 Solid Waste Master Plan, MassDEP has proposed a goal to reduce waste disposal from 5,660,000 tons in 2018 to 4,020,000 tons by 2030, a reduction of 1,640,000 tons on an annual basis. Table 1 summarizes the methodology for the disposal reduction calculation in future years.
Table 1: Methodology Summary Equation
Disposal Tonnage
= In State Disposal (Landfill & Municipal Waste Combustor)
+ Export for Disposal – Import for Disposal
Disposal Tonnage
Reduction = 2008 Disposal Tons – Current Year (2019) Disposal Tons
% Disposal Reduction
= 2008 Disposal Tons – Current Year (2019) Disposal Tons
2008 Disposal Tons
Progress in Meeting Current Disposal Reduction Milestone Total disposal in 2019 was 5,510,000 tons, a decrease of 1,040,000 tons, or 16 percent, from 2008. Solid Waste Management Overview Table 2 highlights how solid waste disposal changed from 2018 to 2019, measured in tonnage and percent change. From 2018 to 2019, total disposal decreased by 3 percent. Of the total waste that required disposal, 3,870,000 tons were disposed in-state, of which 880,000 tons were land filled and 2,990,000 tons were combusted. Massachusetts collectively exported 1,970,000 tons for disposal and imported 330,000 tons, and thus was a net exporter of about 1,640,000 tons of waste requiring disposal. See Table 6 for a more detailed picture of disposal import and export data by state.
2
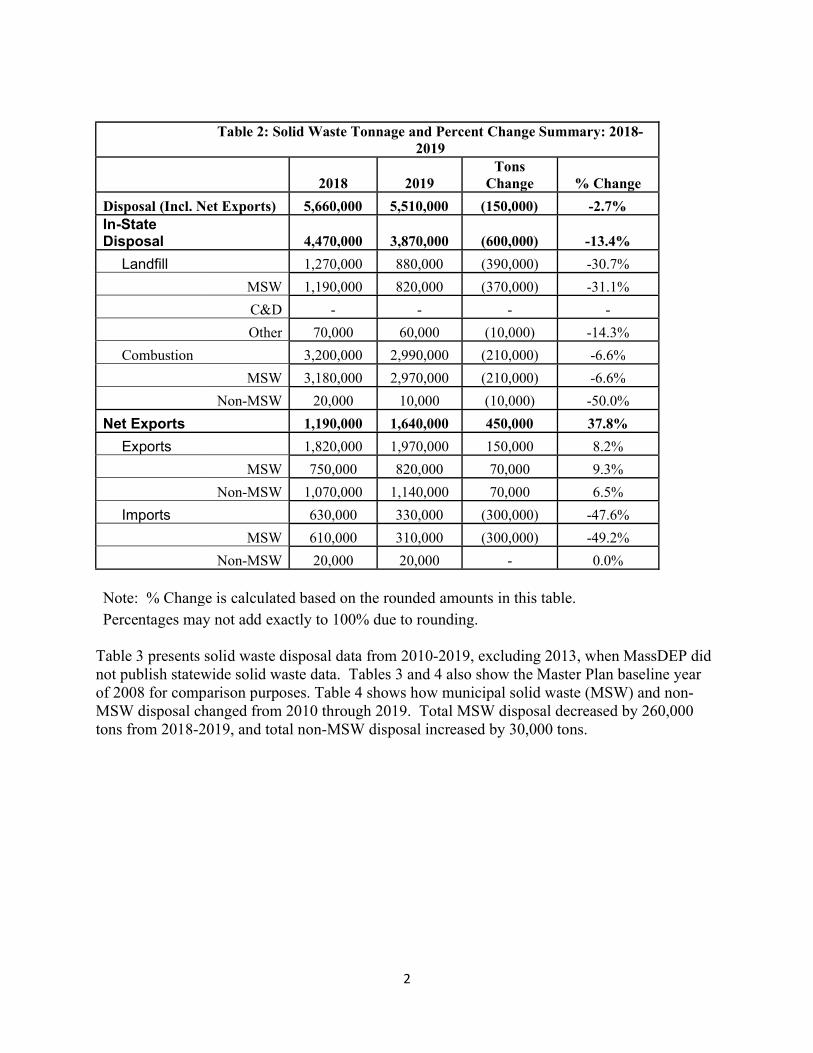
Table 3 presents solid waste disposal data from 2010-2019, excluding 2013, when MassDEP did not publish statewide solid waste data. Tables 3 and 4 also show the Master Plan baseline year of 2008 for comparison purposes. Table 4 shows how municipal solid waste (MSW) and non-MSW disposal changed from 2010 through 2019. Total MSW disposal decreased by 260,000 tons from 2018-2019, and total non-MSW disposal increased by 30,000 tons.
Table 2: Solid Waste Tonnage and Percent Change Summary: 2018-
2019
2018 2019 Tons
Change % Change
Disposal (Incl. Net Exports) 5,660,000 5,510,000 (150,000) -2.7% In-State Disposal 4,470,000 3,870,000 (600,000) -13.4%
Landfill 1,270,000 880,000 (390,000) -30.7%
MSW 1,190,000 820,000 (370,000) -31.1%
C&D - - - -
Other 70,000 60,000 (10,000) -14.3%
Combustion 3,200,000 2,990,000 (210,000) -6.6%
MSW 3,180,000 2,970,000 (210,000) -6.6%
Non-MSW 20,000 10,000 (10,000) -50.0%
Net Exports 1,190,000 1,640,000 450,000 37.8%
Exports 1,820,000 1,970,000 150,000 8.2%
MSW 750,000 820,000 70,000 9.3%
Non-MSW 1,070,000 1,140,000 70,000 6.5%
Imports 630,000 330,000 (300,000) -47.6%
MSW 610,000 310,000 (300,000) -49.2%
Non-MSW 20,000 20,000 - 0.0% Note: % Change is calculated based on the rounded amounts in this table. Percentages may not add exactly to 100% due to rounding.

3
2010 2011 2012 2014 2015 2016 2017 2018 2019Disposal 5,430,000 5,610,000 5,400,000 5,520,000 5,510,000 5,610,000 5,720,000 5,660,000 5,510,000
Landfill 1,560,000 1,650,000 1,700,000 1,560,000 1,380,000 1,330,000 1,310,000 1,270,000 880,000MSW 1,280,000 1,390,000 1,380,000 1,380,000 1,260,000 1,170,000 1,140,000 1,190,000 820,000C&D 120,000 70,000 100,000 50,000 50,000 70,000 70,000 0 0
Other 170,000 190,000 220,000 130,000 70,000 90,000 110,000 70,000 60,000Combustion 3,180,000 3,260,000 3,210,000 3,270,000 3,250,000 3,190,000 3,180,000 3,200,000 2,990,000
MSW 3,170,000 3,250,000 3,210,000 3,260,000 3,250,000 3,170,000 3,140,000 3,180,000 2,970,000Non-MSW 10,000 10,000 0 0 10,000 20,000 30,000 20,000 10,000
Net Exports 690,000 700,000 490,000 690,000 880,000 1,090,000 1,230,000 1,190,000 1,640,000Exports 1,270,000 1,340,000 1,050,000 1,190,000 1,380,000 1,560,000 1,790,000 1,820,000 1,970,000
MSW 690,000 630,000 510,000 460,000 620,000 680,000 820,000 750,000 820,000Non-MSW 580,000 710,000 540,000 730,000 760,000 880,000 970,000 1,070,000 1,140,000
Imports 580,000 640,000 560,000 490,000 500,000 460,000 570,000 630,000 330,000MSW 440,000 390,000 420,000 460,000 460,000 420,000 540,000 610,000 310,000
Non-MSW 140,000 240,000 150,000 40,000 50,000 40,000 20,000 20,000 20,000
Table 3 Solid Waste Disposal 2010-2019 (all data in tons)
Table 4 MSW and NON MSW Disposal 2010-2019
2010 2011 2012 2014 2015 2016 2017 2018 2019% change vs
2018
Total Disposal (Tons) 5,440,000 5,620,000 5,390,000 5,510,000 5,510,000 5,620,000 5,720,000 5,650,000 5,490,000 -0.03
MSW 4,700,000 4,880,000 4,680,000 4,640,000 4,670,000 4,600,000 4,560,000 4,510,000 4,300,000 -0.05Non-MSW 740,000 740,000 710,000 870,000 840,000 1,020,000 1,160,000 1,140,000 1,190,000 0.04
4
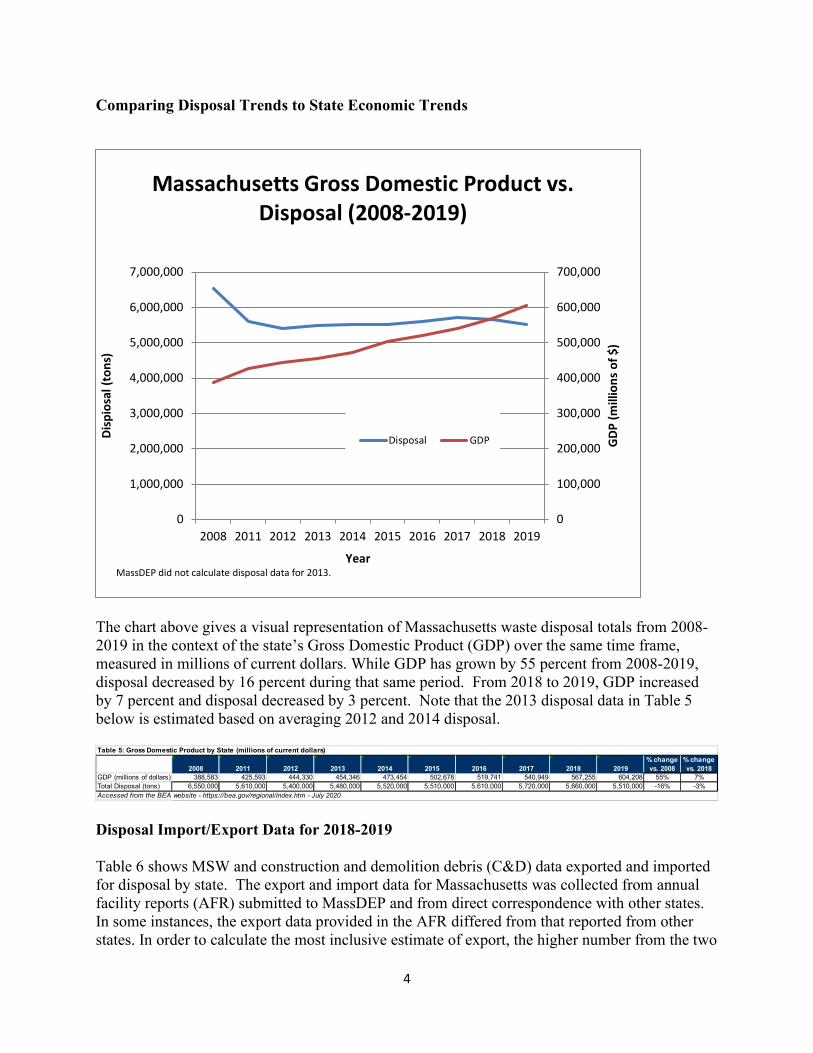
Comparing Disposal Trends to State Economic Trends
The chart above gives a visual representation of Massachusetts waste disposal totals from 2008-2019 in the context of the state’s Gross Domestic Product (GDP) over the same time frame, measured in millions of current dollars. While GDP has grown by 55 percent from 2008-2019, disposal decreased by 16 percent during that same period. From 2018 to 2019, GDP increased by 7 percent and disposal decreased by 3 percent. Note that the 2013 disposal data in Table 5 below is estimated based on averaging 2012 and 2014 disposal.
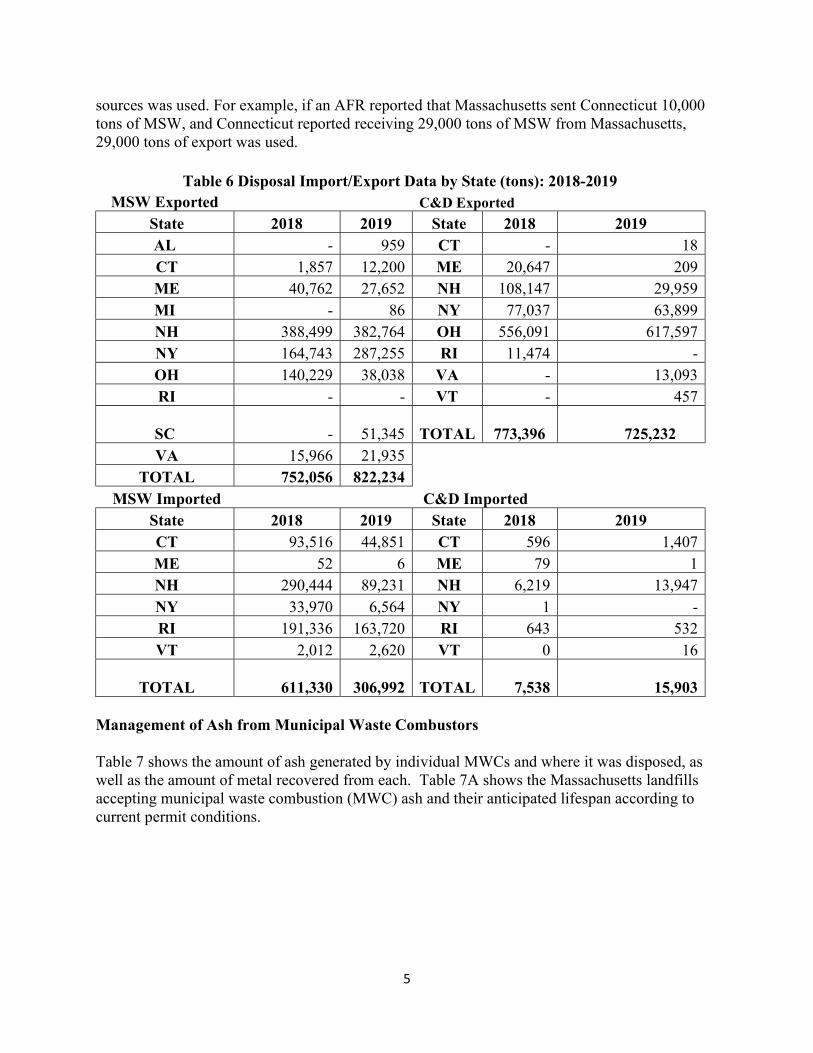
Disposal Import/Export Data for 2018-2019 Table 6 shows MSW and construction and demolition debris (C&D) data exported and imported for disposal by state. The export and import data for Massachusetts was collected from annual facility reports (AFR) submitted to MassDEP and from direct correspondence with other states. In some instances, the export data provided in the AFR differed from that reported from other states. In order to calculate the most inclusive estimate of export, the higher number from the two
0
100,000
200,000
300,000
400,000
500,000
600,000
700,000
0
1,000,000
2,000,000
3,000,000
4,000,000
5,000,000
6,000,000
7,000,000
2008 2011 2012 2013 2014 2015 2016 2017 2018 2019
GD
P (m
illio
ns o
f $)
Dis
pios
al (t
ons)
Year
Massachusetts Gross Domestic Product vs. Disposal (2008-2019)
Disposal GDP
MassDEP did not calculate disposal data for 2013.
2008 2011 2012 2013 2014 2015 2016 2017 2018 2019% change vs. 2008
% change vs. 2018
GDP (millions of dollars) 388,583 425,593 444,330 454,346 473,454 502,678 519,741 540,949 567,255 604,208 55% 7%Total Disposal (tons) 6,550,000 5,610,000 5,400,000 5,480,000 5,520,000 5,510,000 5,610,000 5,720,000 5,660,000 5,510,000 -16% -3%Accessed from the BEA website - https://bea.gov/regional/index.htm - July 2020
Table 5: Gross Domestic Product by State (millions of current dollars)
5
sources was used. For example, if an AFR reported that Massachusetts sent Connecticut 10,000 tons of MSW, and Connecticut reported receiving 29,000 tons of MSW from Massachusetts, 29,000 tons of export was used.
Table 6 Disposal Import/Export Data by State (tons): 2018-2019 MSW Exported C&D Exported
State 2018 2019 State 2018 2019 AL - 959 CT - 18 CT 1,857 12,200 ME 20,647 209 ME 40,762 27,652 NH 108,147 29,959 MI - 86 NY 77,037 63,899 NH 388,499 382,764 OH 556,091 617,597 NY 164,743 287,255 RI 11,474 - OH 140,229 38,038 VA - 13,093 RI - - VT - 457
SC - 51,345
TOTAL 773,396 725,232 VA 15,966 21,935
TOTAL 752,056 822,234 MSW Imported C&D Imported
State 2018 2019 State 2018 2019 CT 93,516 44,851 CT 596 1,407 ME 52 6 ME 79 1 NH 290,444 89,231 NH 6,219 13,947 NY 33,970 6,564 NY 1 - RI 191,336 163,720 RI 643 532 VT 2,012 2,620 VT 0 16
TOTAL 611,330 306,992
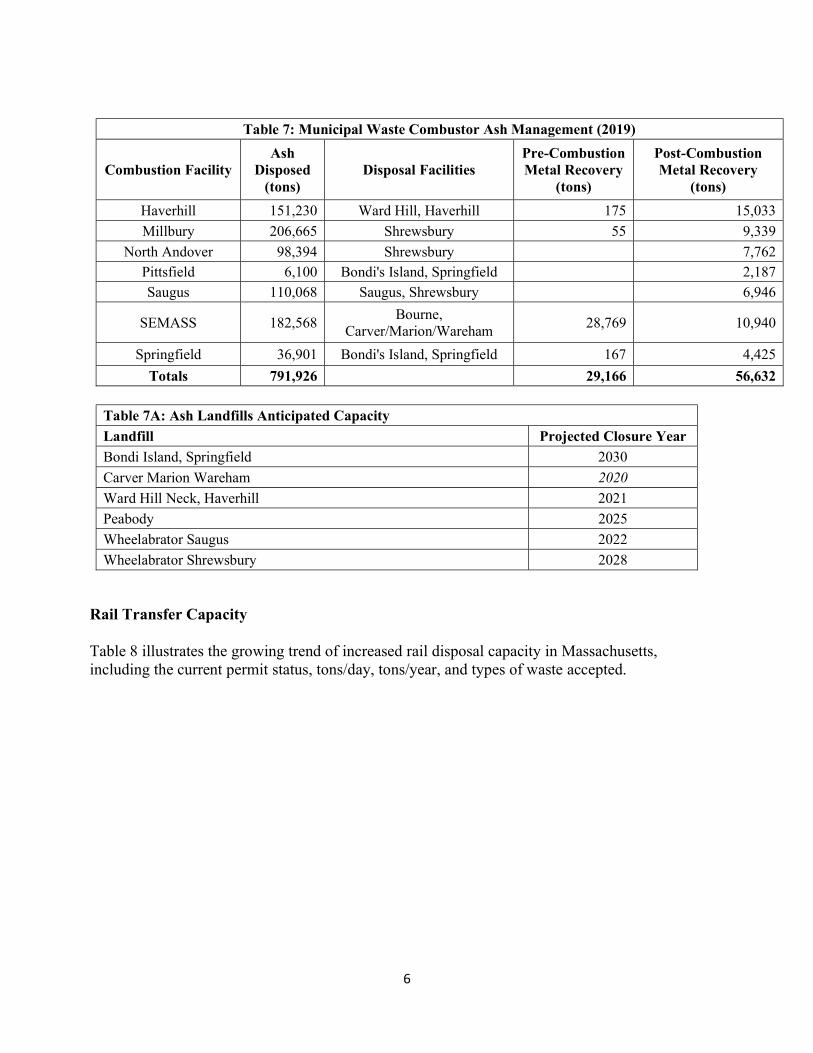
TOTAL 7,538 15,903 Management of Ash from Municipal Waste Combustors Table 7 shows the amount of ash generated by individual MWCs and where it was disposed, as well as the amount of metal recovered from each. Table 7A shows the Massachusetts landfills accepting municipal waste combustion (MWC) ash and their anticipated lifespan according to current permit conditions.
6
Table 7A: Ash Landfills Anticipated Capacity
Landfill Projected Closure Year
Bondi Island, Springfield 2030
Carver Marion Wareham 2020
Ward Hill Neck, Haverhill 2021
Peabody 2025
Wheelabrator Saugus 2022
Wheelabrator Shrewsbury 2028
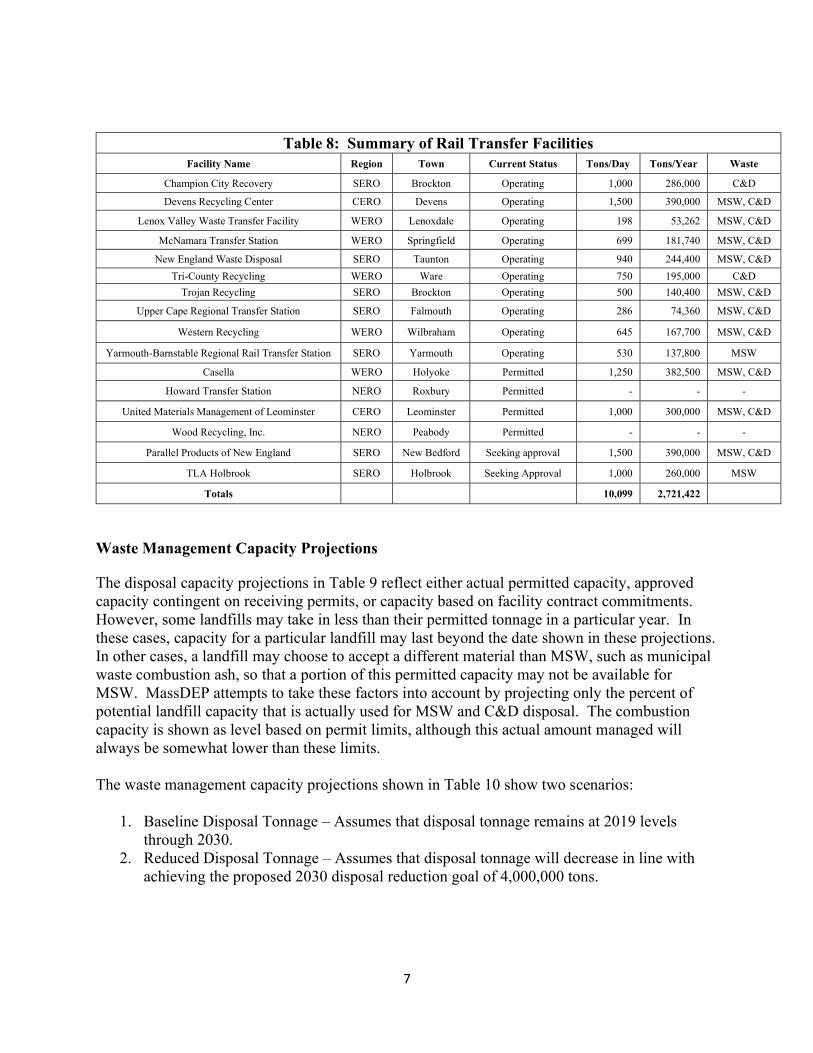
Rail Transfer Capacity Table 8 illustrates the growing trend of increased rail disposal capacity in Massachusetts, including the current permit status, tons/day, tons/year, and types of waste accepted.
Table 7: Municipal Waste Combustor Ash Management (2019)
Combustion Facility Ash
Disposed (tons)
Disposal Facilities Pre-Combustion Metal Recovery
(tons)
Post-Combustion Metal Recovery
(tons)
Haverhill 151,230 Ward Hill, Haverhill 175 15,033
Millbury 206,665 Shrewsbury 55 9,339
North Andover 98,394 Shrewsbury 7,762 Pittsfield 6,100 Bondi's Island, Springfield 2,187 Saugus 110,068 Saugus, Shrewsbury 6,946
SEMASS 182,568 Bourne,
Carver/Marion/Wareham 28,769 10,940
Springfield 36,901 Bondi's Island, Springfield 167 4,425
Totals 791,926 29,166 56,632
7
Table 8: Summary of Rail Transfer Facilities Facility Name Region Town Current Status Tons/Day Tons/Year Waste
Champion City Recovery SERO Brockton Operating 1,000 286,000 C&D
Devens Recycling Center CERO Devens Operating 1,500 390,000 MSW, C&D
Lenox Valley Waste Transfer Facility WERO Lenoxdale Operating 198 53,262 MSW, C&D
McNamara Transfer Station WERO Springfield Operating 699 181,740 MSW, C&D
New England Waste Disposal SERO Taunton Operating 940 244,400 MSW, C&D
Tri-County Recycling WERO Ware Operating 750 195,000 C&D
Trojan Recycling SERO Brockton Operating 500 140,400 MSW, C&D
Upper Cape Regional Transfer Station SERO Falmouth Operating 286 74,360 MSW, C&D
Western Recycling WERO Wilbraham Operating 645 167,700 MSW, C&D
Yarmouth-Barnstable Regional Rail Transfer Station SERO Yarmouth Operating 530 137,800 MSW
Casella WERO Holyoke Permitted 1,250 382,500 MSW, C&D
Howard Transfer Station NERO Roxbury Permitted - - -
United Materials Management of Leominster CERO Leominster Permitted 1,000 300,000 MSW, C&D
Wood Recycling, Inc. NERO Peabody Permitted - - -
Parallel Products of New England SERO New Bedford Seeking approval 1,500 390,000 MSW, C&D
TLA Holbrook SERO Holbrook Seeking Approval 1,000 260,000 MSW
Totals 10,099 2,721,422
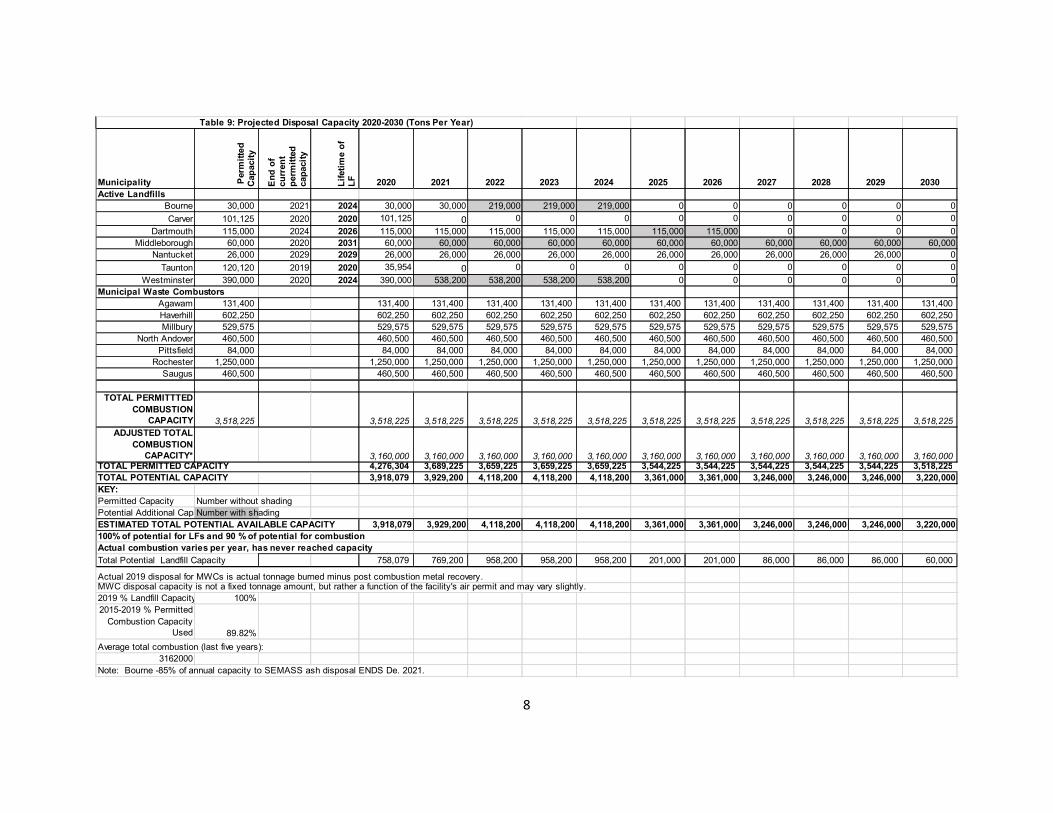
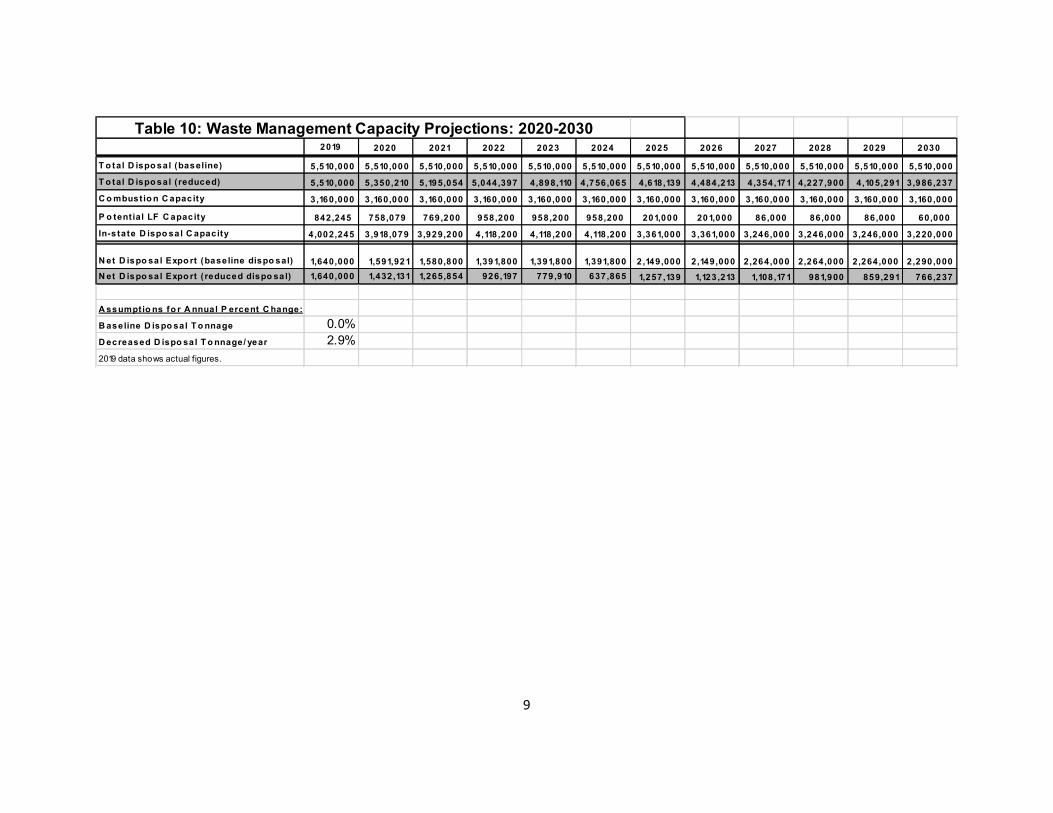
Waste Management Capacity Projections
The disposal capacity projections in Table 9 reflect either actual permitted capacity, approved capacity contingent on receiving permits, or capacity based on facility contract commitments. However, some landfills may take in less than their permitted tonnage in a particular year. In these cases, capacity for a particular landfill may last beyond the date shown in these projections. In other cases, a landfill may choose to accept a different material than MSW, such as municipal waste combustion ash, so that a portion of this permitted capacity may not be available for MSW. MassDEP attempts to take these factors into account by projecting only the percent of potential landfill capacity that is actually used for MSW and C&D disposal. The combustion capacity is shown as level based on permit limits, although this actual amount managed will always be somewhat lower than these limits. The waste management capacity projections shown in Table 10 show two scenarios:
1. Baseline Disposal Tonnage – Assumes that disposal tonnage remains at 2019 levels through 2030.
2. Reduced Disposal Tonnage – Assumes that disposal tonnage will decrease in line with achieving the proposed 2030 disposal reduction goal of 4,000,000 tons.
8
Municipality Per
mit
ted
C
apac
ity
En
d o
f cu
rren
t p
erm
itte
d
cap
acit
y
Lif
etim
e o
f L
F 2020 2021 2022 2023 2024 2025 2026 2027 2028 2029 2030Active Landfills
Bourne 30,000 2021 2024 30,000 30,000 219,000 219,000 219,000 0 0 0 0 0 0
Carver 101,125 2020 2020 101,125 0 0 0 0 0 0 0 0 0 0
Dartmouth 115,000 2024 2026 115,000 115,000 115,000 115,000 115,000 115,000 115,000 0 0 0 0Middleborough 60,000 2020 2031 60,000 60,000 60,000 60,000 60,000 60,000 60,000 60,000 60,000 60,000 60,000
Nantucket 26,000 2029 2029 26,000 26,000 26,000 26,000 26,000 26,000 26,000 26,000 26,000 26,000 0
Taunton 120,120 2019 2020 35,954 0 0 0 0 0 0 0 0 0 0
Westminster 390,000 2020 2024 390,000 538,200 538,200 538,200 538,200 0 0 0 0 0 0Municipal Waste Combustors
Agawam 131,400 131,400 131,400 131,400 131,400 131,400 131,400 131,400 131,400 131,400 131,400 131,400 Haverhill 602,250 602,250 602,250 602,250 602,250 602,250 602,250 602,250 602,250 602,250 602,250 602,250 Millbury 529,575 529,575 529,575 529,575 529,575 529,575 529,575 529,575 529,575 529,575 529,575 529,575
North Andover 460,500 460,500 460,500 460,500 460,500 460,500 460,500 460,500 460,500 460,500 460,500 460,500 Pittsfield 84,000 84,000 84,000 84,000 84,000 84,000 84,000 84,000 84,000 84,000 84,000 84,000
Rochester 1,250,000 1,250,000 1,250,000 1,250,000 1,250,000 1,250,000 1,250,000 1,250,000 1,250,000 1,250,000 1,250,000 1,250,000 Saugus 460,500 460,500 460,500 460,500 460,500 460,500 460,500 460,500 460,500 460,500 460,500 460,500
TOTAL PERMITTTED COMBUSTION
CAPACITY 3,518,225 3,518,225 3,518,225 3,518,225 3,518,225 3,518,225 3,518,225 3,518,225 3,518,225 3,518,225 3,518,225 3,518,225 ADJUSTED TOTAL
COMBUSTION CAPACITY* 3,160,000 3,160,000 3,160,000 3,160,000 3,160,000 3,160,000 3,160,000 3,160,000 3,160,000 3,160,000 3,160,000
TOTAL PERMITTED CAPACITY 4,276,304 3,689,225 3,659,225 3,659,225 3,659,225 3,544,225 3,544,225 3,544,225 3,544,225 3,544,225 3,518,225 TOTAL POTENTIAL CAPACITY 3,918,079 3,929,200 4,118,200 4,118,200 4,118,200 3,361,000 3,361,000 3,246,000 3,246,000 3,246,000 3,220,000KEY:Permitted Capacity Number without shading Potential Additional CapacityNumber with shadingESTIMATED TOTAL POTENTIAL AVAILABLE CAPACITY 3,918,079 3,929,200 4,118,200 4,118,200 4,118,200 3,361,000 3,361,000 3,246,000 3,246,000 3,246,000 3,220,000100% of potential for LFs and 90 % of potential for combustionActual combustion varies per year, has never reached capacityTotal Potential Landfill Capacity 758,079 769,200 958,200 958,200 958,200 201,000 201,000 86,000 86,000 86,000 60,000
Actual 2019 disposal for MWCs is actual tonnage burned minus post combustion metal recovery.MWC disposal capacity is not a fixed tonnage amount, but rather a function of the facility's air permit and may vary slightly. 2019 % Landfill Capacity used 100%2015-2019 % Permitted
Combustion Capacity Used 89.82%
Average total combustion (last five years): 3162000
Note: Bourne -85% of annual capacity to SEMASS ash disposal ENDS De. 2021.
Table 9: Projected Disposal Capacity 2020-2030 (Tons Per Year)
9
2019 2020 2021 2022 2023 2024 2025 2026 2027 2028 2029 2030
T o tal D ispo sal (baseline) 5 ,510,000 5 ,510,000 5,510,000 5,510 ,000 5,510,000 5,510 ,000 5 ,510,000 5,510,000 5 ,510,000 5,510,000 5,510,000 5,510 ,000
T o tal D ispo sal (reduced) 5 ,510,000 5 ,350,210 5,195,054 5,044 ,397 4,898,110 4,756 ,065 4,618,139 4,484 ,213 4,354,171 4,227,900 4,105,291 3,986 ,237
C o mbustio n C apacity 3 ,160,000 3 ,160,000 3,160,000 3,160 ,000 3,160,000 3,160 ,000 3 ,160,000 3,160,000 3 ,160,000 3,160,000 3,160,000 3,160 ,000
P o tential LF C apacity 842,245 758,079 769,200 958,200 958,200 958,200 201,000 201,000 86,000 86,000 86,000 60,000
In-s tate D ispo sal C apacity 4 ,002,245 3 ,918,079 3,929,200 4,118 ,200 4,118,200 4,118 ,200 3 ,361,000 3 ,361,000 3,246,000 3,246,000 3,246,000 3,220 ,000
N et D ispo sal Expo rt (base line dispo sal) 1,640,000 1,591,921 1,580,800 1,391,800 1,391,800 1,391,800 2 ,149,000 2,149,000 2,264,000 2,264,000 2,264,000 2,290 ,000
N et D ispo sal Expo rt ( reduced dispo sal) 1,640,000 1,432 ,131 1,265,854 926,197 779,910 637,865 1,257,139 1,123 ,213 1,108,171 981,900 859,291 766,237
A ssumptio ns fo r A nnual P ercent C hange:
B aseline D ispo sal T o nnage 0.0%D ecreased D ispo sal T o nnage/ year 2.9%2019 data shows actual figures.
Table 10: Waste Management Capacity Projections: 2020-2030
10
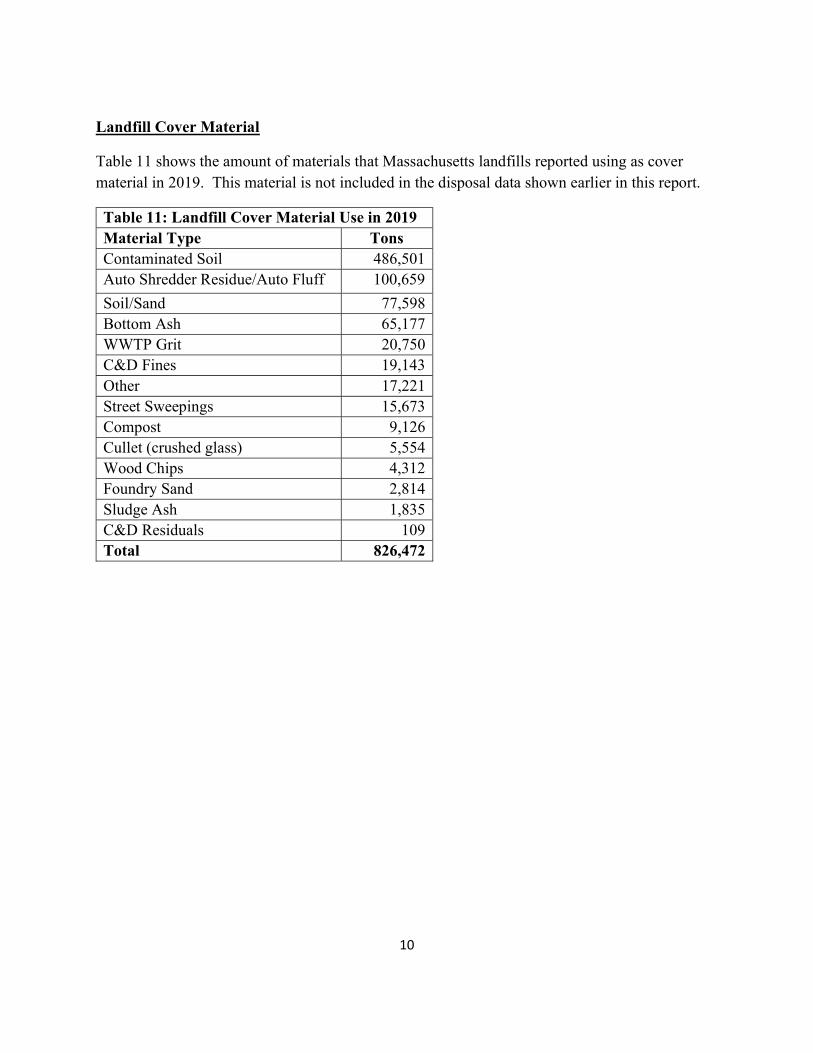
Landfill Cover Material
Table 11 shows the amount of materials that Massachusetts landfills reported using as cover material in 2019. This material is not included in the disposal data shown earlier in this report.
Table 11: Landfill Cover Material Use in 2019 Material Type Tons Contaminated Soil 486,501 Auto Shredder Residue/Auto Fluff 100,659
Soil/Sand 77,598 Bottom Ash 65,177 WWTP Grit 20,750 C&D Fines 19,143 Other 17,221 Street Sweepings 15,673 Compost 9,126 Cullet (crushed glass) 5,554 Wood Chips 4,312 Foundry Sand 2,814 Sludge Ash 1,835 C&D Residuals 109 Total 826,472