2019 Major Timber Processing Facilities in British Columbia
55
2019 Major Timber Processing Facilities in British Columbia Ministry of Forests, Lands, Natural Resource Operations and Rural Development
-
Upload
khangminh22 -
Category
Documents
-
view
0 -
download
0
Transcript of 2019 Major Timber Processing Facilities in British Columbia

2019 Major Timber Processing Facilities in British Columbia Ministry of Forests, Lands, Natural Resource Operations and Rural Development

2
Foreword
This edition of the Major Primary Timber Processing Facilities in British Columbia summarizes the activity of timber
processing facilities operating in 2019. It covers sawmills, veneer/plywood/OSB/panel mills, pulp/paper mills, chip mills,
pellet mills, shake and shingle mills, and utility pole/pole/post mills. For those firms producing more than one product,
each product is listed in the corresponding section of this report. However, information about secondary manufacturing
facilities (e.g., remanufacturing or millwork) operating in the province is beyond the scope of this report.
Information contained in this report was gathered through the 2019 and earlier surveys of individual processing
facilities. If survey responses were not provided, the Ministry of Forests, Lands, Natural Resource Operations and Rural
Development (Ministry) staff might use trade publications and corporate annual reports to make estimates. In some
cases, the Ministry staff provided estimates based on their knowledge of operations and information reported in
previous years, as well as production information for selected forest products from Statistics Canada.
This report is available free of charge online at
https://www2.gov.bc.ca/gov/content/industry/forestry/competitive-forest-industry/forest-industry-economics/fibre-
mill-information/major-timber-processing-facilities-survey
Please note that all remaining errors are the responsibility of the Economic Services Branch. Your comments could be
sent to the contact information on the website or by mail to the following address:
Economic Services Branch
Ministry of Forests, Lands, Natural Resource
Operations and Rural Development
PO Box 9514, STN PROV GOVT
3rd FL, 545 Superior Street
Victoria BC V8V 1T7

3
Acknowledgements
The co-operation of mill personnel who responded to the 2019 BC Mill List
Survey is gratefully acknowledged.
The important roles played by the Ministry’s district scaling officers in
verifying local mill information and the Ministry’s contractor Lynnette Stork in
computer programming are also acknowledged.
We highly acknowledge the significant contribution made by Jason Xiao with
GeoBC for developing mill maps.
The survey and analysis were conducted by Jiali (Julie) Leng and Anshul
Dhankher. This report was reviewed by Teresa Zhuang. Additional support was
provided by Leila Bautista, Sergey Tsynkevych, Alex Barnes, Margret
Waldstein, Erika Carswell, and Stephen Davis.

4
Contents
Introduction ............................................................................................................................................................................ 8
Primary Log Supply and Demand in BC ................................................................................................................................... 8
Log Supply ........................................................................................................................................................................... 8
Log Demand ........................................................................................................................................................................ 8
Lumber Recovery Factor ................................................................................................................................................... 10
Fibre Used by Pulp, Pellet, and Panel Mills ....................................................................................................................... 11
Provincial Chip Supply and Demand ..................................................................................................................................... 12
Coast .............................................................................................................................................................................. 14
South ............................................................................................................................................................................. 14
North ............................................................................................................................................................................. 14
Time-Series Analysis .............................................................................................................................................................. 15
Lumber Mills ...................................................................................................................................................................... 15
Number of Mills, Output, and Input .............................................................................................................................. 15
Average Capacity, Capacity Utilization, and Lumber Recovery Factor .......................................................................... 15
Veneer and Plywood Mills................................................................................................................................................. 21
Number of Mills, Output, Input, Capacity Utilization, and Recovery ............................................................................ 21
Pulp and Paper Mills.......................................................................................................................................................... 25
Number of Mills, Capacity, Input, Output, and Capacity Utilization ............................................................................. 25
Pellet Mills ......................................................................................................................................................................... 31
Number of Mills, Capacity, Average Capacity, Output, Input, and Utilization .............................................................. 31
Shake and Shingle Mills ..................................................................................................................................................... 34
Number of Mills, Capacity, Input, Output, and Utilization............................................................................................ 34
Related References ............................................................................................................................................................... 37
Appendix ............................................................................................................................................................................... 38
Lumber Mills .................................................................................................................................................................. 39
Pulp and Paper Mills ...................................................................................................................................................... 44
Veneer, Plywood, OSB, and Other Panel Mills .............................................................................................................. 46
Chip Mills ....................................................................................................................................................................... 48
Pellet Mills ..................................................................................................................................................................... 50
Pole, Utility Pole, and Post Mills .................................................................................................................................... 52
Shake and Shingle Mills ................................................................................................................................................. 54

5
List of Figures
Figure 1: Total Primary Log Use – 55.3 million m³ - 2019 ....................................................................................................... 9
Figure 2: Estimated Product Recovery from Lumber Mills – 2019 ....................................................................................... 11
Figure 3: Fibre Flows Among Primary Timber Processing Facilities in BC – 2019 ................................................................. 12
Figure 4: Provincial Chip Supply and Demand – 2017 to 2019 ............................................................................................. 13
Figure 5: Coast Lumber Mills (at least 40 Million Board Feet) Capacity, Output, and Log Input ......................................... 18
Figure 6: Interior Lumber Mills (at Least 40 Million Board Feet) Capacity, Output, and Log Input ..................................... 18
Figure 7: BC Lumber Mills (at Least 40 Million Board Feet) Number of Mills and Average Capacity ................................... 19
Figure 8: BC Lumber Mills (at Least 40 Million Board Feet) Capacity Utilization.................................................................. 19
Figure 9: BC Lumber Mills (at Least 40 Million Board Feet) Lumber Recovery Factor ......................................................... 20
Figure 10: BC Veneer Mills Capacity, Output, and Log Input ................................................................................................ 23
Figure 11: BC Veneer Mills - Number of Mills and Average Capacity ................................................................................... 23
Figure 12: BC Veneer Mills Capacity Utilization .................................................................................................................... 24
Figure 13: BC Veneer Mills Recovery Factor ........................................................................................................................ 24
Figure 14: BC Pulp Mills Output Capacity and Ownerships .................................................................................................. 27
Figure 15: BC Pulp Mills Capacity, Output, and Input ........................................................................................................... 28
Figure 16: BC Pulp Mills Capacity Utilization ........................................................................................................................ 28
Figure 17: BC Paper Mills Output Capacity and Ownerships ................................................................................................ 29
Figure 18: BC Paper Mills Capacity and Output .................................................................................................................... 30
Figure 19: BC Paper Mills Capacity Utilization ...................................................................................................................... 30
Figure 20: BC Pellet Mills Capacity, Output, and Fibre Input ................................................................................................ 33
Figure 21: BC Pellet Mills Capacity Utilization ...................................................................................................................... 33
Figure 22: Number of Shake and Shingle Mills ..................................................................................................................... 35
Figure 23: BC Shake and Shingle Mills Capacity, Output, and Log Input .............................................................................. 35
Figure 24: BC Shake and Shingle Mills Capacity Utilization .................................................................................................. 36
Figure 25: Administrative Areas and Natural Resource District Boundaries in 2019 ........................................................... 38

6
List of Tables
Table 1: Estimated BC Log Use and Log Availability – 2019 .................................................................................................... 9
Table 2: Estimates of Product Recovery from Lumber Mills – 2019 ..................................................................................... 10
Table 3: BC Chip Supply and Demand (000 BDUs) - 2017 to 2019 ........................................................................................ 13
Table 4: BC Lumber Mill Statistics for Mills with the Estimated Annual Capacity of at Least 40 Million Board Feet ........... 17
Table 5: BC Veneer Mill Summary Statistics for Mills with Annual Log Consumption of at Least 25,000 Cubic Metres ..... 22
Table 6: BC Pulp and Paper Mill Summary Statistics ............................................................................................................ 26
Table 7: BC Pellet Mill Summary Statistics ............................................................................................................................ 32
Table 8: Lumber Mills with Capacity at Least 40 Million Board Feet - 2019 ......................................................................... 40
Table 9: Lumber Mills with Capacity Less than 40 Million Board Feet – 2019 ..................................................................... 42
Table 10: Pulp and Paper Mills – 2019 .................................................................................................................................. 45
Table 11: Veneer, Plywood, OSB, and Panel Mills – 2019 .................................................................................................... 47
Table 12: Chip Mills - 2019 .................................................................................................................................................... 49
Table 13: Pellet Mills – 2019 ................................................................................................................................................. 51
Table 14: Post, Utility Pole, and Pole Mills – 2019 ................................................................................................................ 53
Table 15: Shake and Shingle Mills – 2019 ............................................................................................................................. 55

7
Abbreviations for Products CHP Chip PLE Pole LBR Lumber PLT Pellet LVL Laminated Veneer Lumber PLY Plywood OSB Oriented Strand Board PNL Panel PLP Pulp PST Fence Post PPR Paper UTI Utility Pole SS Shake and Shingle VNR Veneer

8
Introduction
This report provides summary statistics derived from the 2019 and earlier mill surveys, and selected analyses of these
statistics. Fibre supply and fibre use in the province are examined through a series of charts and tables. These are
followed by time-series statistics for lumber mills, veneer mills, pulp/paper mills, pellet mills, and shake and shingle
mills. The final sections provide lists of major timber processing facilities (mills) operating in British Columbia (BC) in
2019.
Each year, surveys are sent to mill representatives. Based on their responses, mills are classified as a) open with
responses, b) presumed open without responses, c) did not operate at all during the year (temporary or indefinite
closures), or d) closed (permanently). Statistics in this report are derived from mills in categories a) and b). Mills that
have announced permanent closures during 2019 are categorized as a) for 2019. The actual impact of those
permanent mill closures in 2019 will be reported in the next year's report.
Please note that some historical information in this report has been adjusted to reflect the latest information
received from our mill contacts or regional staff and therefore, may differ from the information published in previous
reports.
Primary Log Supply and Demand in BC
Log Supply
• In 2019, about 54 million cubic metres of timber was harvested from Crown, private, and federal land, representing
a 21% decrease from the 2018 level of 68 million cubic metres. This decline was primarily driven by the provincial
allowable annual cut (AAC) reduction, weak market conditions, insect damage (e.g., mountain pine beetle, spruce
beetle), and wildfires that peaked in the past two years. 73% of the provincial total harvest came from the Interior,
and the rest from the Coast.
• BC also import a small amount of logs from the United States. The volume of imported logs increased by 47%, from
82,487 cubic metres in 2018 to 121,366 cubic metres in 2019.
Log Demand
• Logs harvested in BC are widely used by various types of major timber processing facilities in the province. Surplus
logs are shipped to other jurisdictions.
• As shown in Table 1, the overall log consumption decreased by 14%, from 64 million cubic meters in 2018 to 55
million cubic meters in 2019. The decline was seen in all major types of mills:
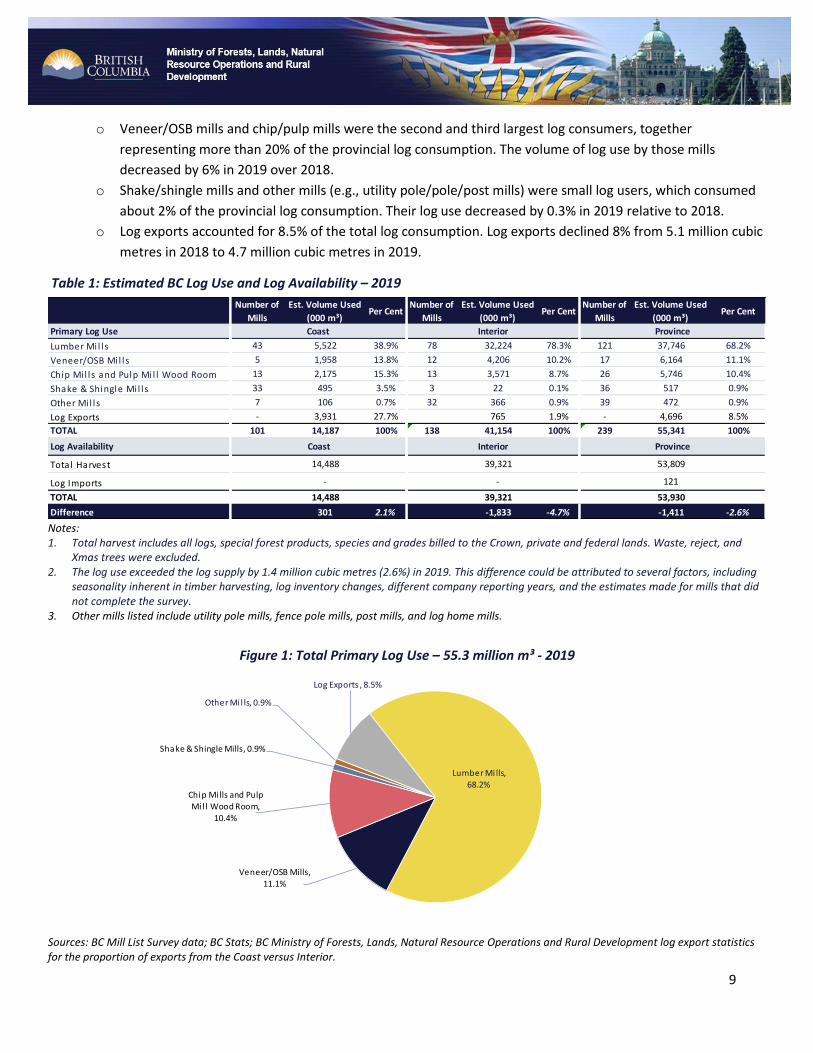
o Sawmills were the primary log consumers, accounting for 68% of the total log consumption. 121 sawmills1
consumed 37.8 million cubic metres of logs in 2019, representing a decrease of 17% from 2018.
1 If a mill did not respond to the survey in 2019 and there was no historical information for this mill, we assume the mill “Did Not Operate (DNO)” in 2019.
9
o Veneer/OSB mills and chip/pulp mills were the second and third largest log consumers, together
representing more than 20% of the provincial log consumption. The volume of log use by those mills
decreased by 6% in 2019 over 2018.
o Shake/shingle mills and other mills (e.g., utility pole/pole/post mills) were small log users, which consumed
about 2% of the provincial log consumption. Their log use decreased by 0.3% in 2019 relative to 2018.
o Log exports accounted for 8.5% of the total log consumption. Log exports declined 8% from 5.1 million cubic
metres in 2018 to 4.7 million cubic metres in 2019.
Table 1: Estimated BC Log Use and Log Availability – 2019
Notes: 1. Total harvest includes all logs, special forest products, species and grades billed to the Crown, private and federal lands. Waste, reject, and
Xmas trees were excluded. 2. The log use exceeded the log supply by 1.4 million cubic metres (2.6%) in 2019. This difference could be attributed to several factors, including
seasonality inherent in timber harvesting, log inventory changes, different company reporting years, and the estimates made for mills that did not complete the survey.
3. Other mills listed include utility pole mills, fence pole mills, post mills, and log home mills.
Figure 1: Total Primary Log Use – 55.3 million m³ - 2019
Sources: BC Mill List Survey data; BC Stats; BC Ministry of Forests, Lands, Natural Resource Operations and Rural Development log export statistics for the proportion of exports from the Coast versus Interior.
Number of
Mills
Est. Volume Used
(000 m³)Per Cent
Number of
Mills
Est. Volume Used
(000 m³)Per Cent
Number of
Mills
Est. Volume Used
(000 m³)Per Cent
Primary Log Use
Lumber Mi l l s 43 5,522 38.9% 78 32,224 78.3% 121 37,746 68.2%
Veneer/OSB Mi l l s 5 1,958 13.8% 12 4,206 10.2% 17 6,164 11.1%
Chip Mi l l s and Pulp Mi l l Wood Room 13 2,175 15.3% 13 3,571 8.7% 26 5,746 10.4%
Shake & Shingle Mi l l s 33 495 3.5% 3 22 0.1% 36 517 0.9%
Other Mi l l s 7 106 0.7% 32 366 0.9% 39 472 0.9%
Log Exports - 3,931 27.7% 765 1.9% - 4,696 8.5%
TOTAL 101 14,187 100% 138 41,154 100% 239 55,341 100%
Log Availability
Total Harvest 14,488 39,321 53,809
Log Imports - - 121
TOTAL 14,488 39,321 53,930
Difference 301 2.1% -1,833 -4.7% -1,411 -2.6%
Coast Interior Province
Coast Interior Province
Lumber Mi lls, 68.2%
Veneer/OSB Mills, 11.1%
Chip Mi lls and Pulp Mi l l Wood Room,
10.4%
Shake & Shingle Mills, 0.9%
Other Mi l ls, 0.9%
Log Exports , 8.5%
10
Lumber Recovery Factor
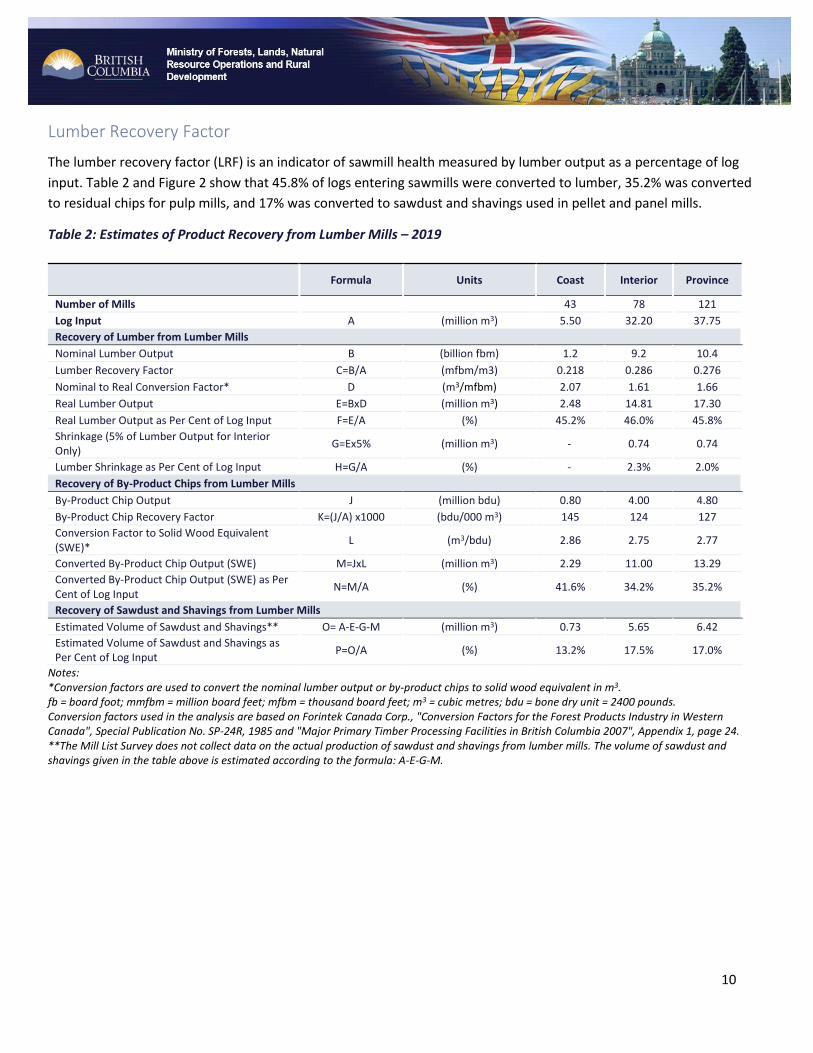
The lumber recovery factor (LRF) is an indicator of sawmill health measured by lumber output as a percentage of log
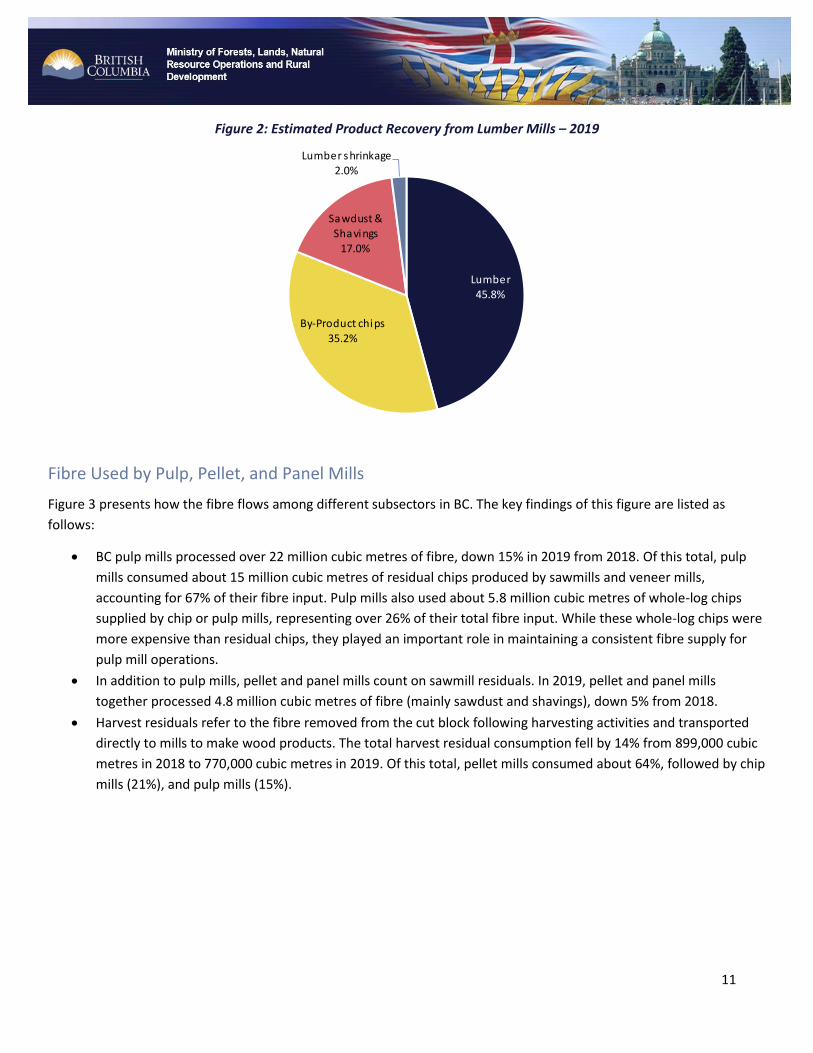
input. Table 2 and Figure 2 show that 45.8% of logs entering sawmills were converted to lumber, 35.2% was converted
to residual chips for pulp mills, and 17% was converted to sawdust and shavings used in pellet and panel mills.
Table 2: Estimates of Product Recovery from Lumber Mills – 2019
Formula Units Coast Interior Province
Number of Mills 43 78 121
Log Input A (million m3) 5.50 32.20 37.75
Recovery of Lumber from Lumber Mills
Nominal Lumber Output B (billion fbm) 1.2 9.2 10.4
Lumber Recovery Factor C=B/A (mfbm/m3) 0.218 0.286 0.276
Nominal to Real Conversion Factor* D (m3/mfbm) 2.07 1.61 1.66
Real Lumber Output E=BxD (million m3) 2.48 14.81 17.30
Real Lumber Output as Per Cent of Log Input F=E/A (%) 45.2% 46.0% 45.8%
Shrinkage (5% of Lumber Output for Interior Only)
G=Ex5% (million m3) - 0.74 0.74
Lumber Shrinkage as Per Cent of Log Input H=G/A (%) - 2.3% 2.0%
Recovery of By-Product Chips from Lumber Mills
By-Product Chip Output J (million bdu) 0.80 4.00 4.80
By-Product Chip Recovery Factor K=(J/A) x1000 (bdu/000 m3) 145 124 127
Conversion Factor to Solid Wood Equivalent (SWE)*
L (m3/bdu) 2.86 2.75 2.77
Converted By-Product Chip Output (SWE) M=JxL (million m3) 2.29 11.00 13.29
Converted By-Product Chip Output (SWE) as Per Cent of Log Input
N=M/A (%) 41.6% 34.2% 35.2%
Recovery of Sawdust and Shavings from Lumber Mills
Estimated Volume of Sawdust and Shavings** O= A-E-G-M (million m3) 0.73 5.65 6.42
Estimated Volume of Sawdust and Shavings as Per Cent of Log Input
P=O/A (%) 13.2% 17.5% 17.0%
Notes: *Conversion factors are used to convert the nominal lumber output or by-product chips to solid wood equivalent in m3. fb = board foot; mmfbm = million board feet; mfbm = thousand board feet; m3 = cubic metres; bdu = bone dry unit = 2400 pounds. Conversion factors used in the analysis are based on Forintek Canada Corp., "Conversion Factors for the Forest Products Industry in Western Canada", Special Publication No. SP-24R, 1985 and "Major Primary Timber Processing Facilities in British Columbia 2007", Appendix 1, page 24. **The Mill List Survey does not collect data on the actual production of sawdust and shavings from lumber mills. The volume of sawdust and shavings given in the table above is estimated according to the formula: A-E-G-M.
11
Figure 2: Estimated Product Recovery from Lumber Mills – 2019
Fibre Used by Pulp, Pellet, and Panel Mills
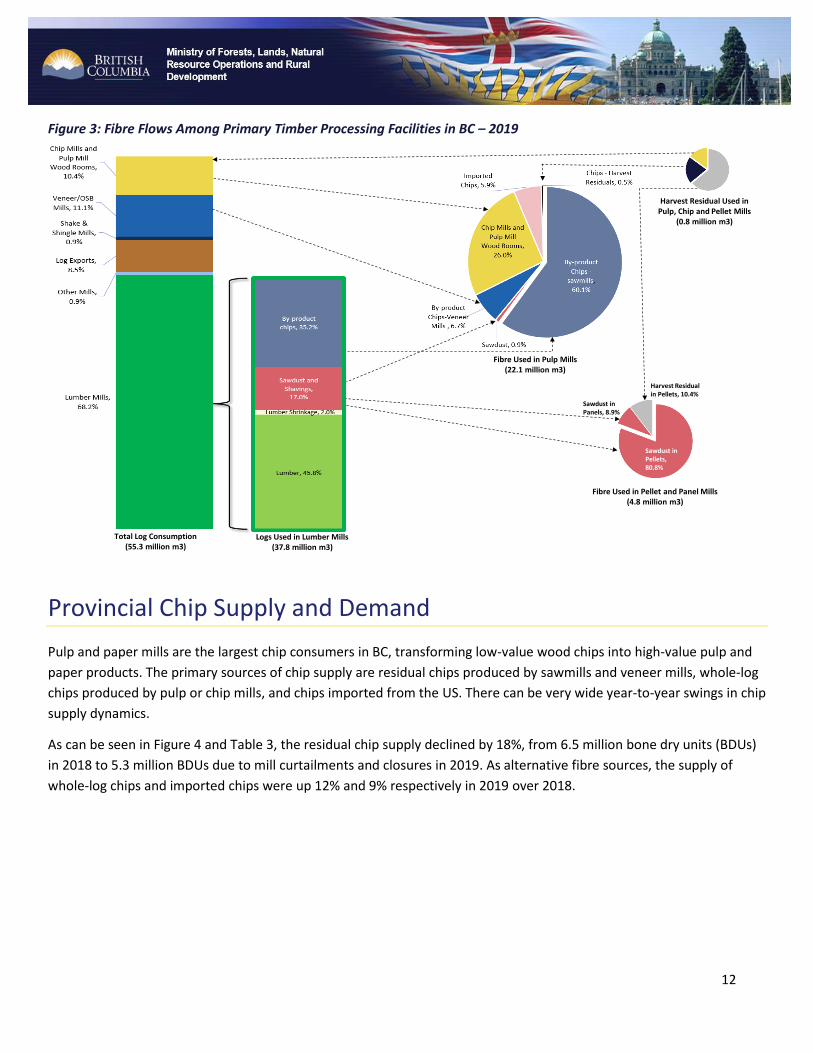
Figure 3 presents how the fibre flows among different subsectors in BC. The key findings of this figure are listed as
follows:
• BC pulp mills processed over 22 million cubic metres of fibre, down 15% in 2019 from 2018. Of this total, pulp
mills consumed about 15 million cubic metres of residual chips produced by sawmills and veneer mills,
accounting for 67% of their fibre input. Pulp mills also used about 5.8 million cubic metres of whole-log chips
supplied by chip or pulp mills, representing over 26% of their total fibre input. While these whole-log chips were
more expensive than residual chips, they played an important role in maintaining a consistent fibre supply for
pulp mill operations.
• In addition to pulp mills, pellet and panel mills count on sawmill residuals. In 2019, pellet and panel mills
together processed 4.8 million cubic metres of fibre (mainly sawdust and shavings), down 5% from 2018.
• Harvest residuals refer to the fibre removed from the cut block following harvesting activities and transported
directly to mills to make wood products. The total harvest residual consumption fell by 14% from 899,000 cubic
metres in 2018 to 770,000 cubic metres in 2019. Of this total, pellet mills consumed about 64%, followed by chip
mills (21%), and pulp mills (15%).
Lumber 45.8%
By-Product chips35.2%
Sawdust & Shavings
17.0%
Lumber shrinkage2.0%
12
Figure 3: Fibre Flows Among Primary Timber Processing Facilities in BC – 2019
Total Log Consumption (55.3 million m3)
Logs Used in Lumber Mills (37.8 million m3)
Fibre Used in Pellet and Panel Mills (4.8 million m3)
Harvest Residual Used in Pulp, Chip and Pellet Mills
(0.8 million m3)
Fibre Used in Pulp Mills (22.1 million m3)
Sawdust in Pellets, 80.8%
Sawdust in Panels, 8.9%
Harvest Residual in Pellets, 10.4%
Provincial Chip Supply and Demand
Pulp and paper mills are the largest chip consumers in BC, transforming low-value wood chips into high-value pulp and
paper products. The primary sources of chip supply are residual chips produced by sawmills and veneer mills, whole-log
chips produced by pulp or chip mills, and chips imported from the US. There can be very wide year-to-year swings in chip
supply dynamics.
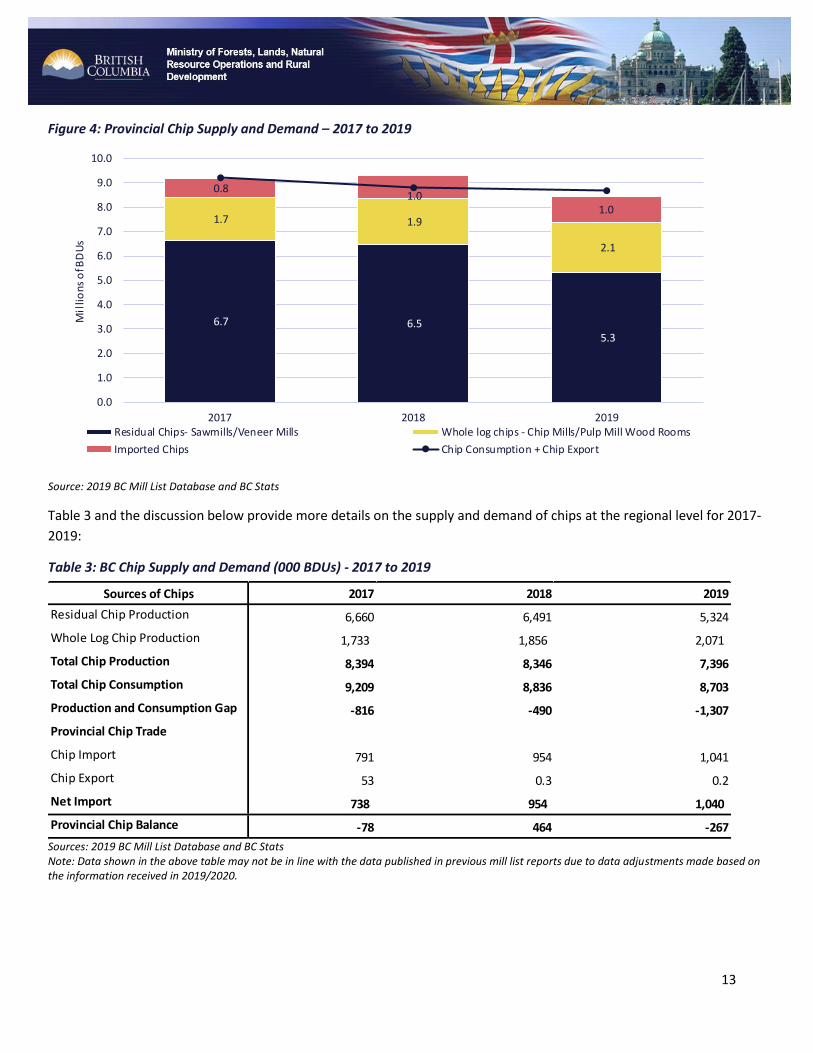
As can be seen in Figure 4 and Table 3, the residual chip supply declined by 18%, from 6.5 million bone dry units (BDUs)
in 2018 to 5.3 million BDUs due to mill curtailments and closures in 2019. As alternative fibre sources, the supply of
whole-log chips and imported chips were up 12% and 9% respectively in 2019 over 2018.
13
Figure 4: Provincial Chip Supply and Demand – 2017 to 2019
Source: 2019 BC Mill List Database and BC Stats
Table 3 and the discussion below provide more details on the supply and demand of chips at the regional level for 2017-
2019:
Table 3: BC Chip Supply and Demand (000 BDUs) - 2017 to 2019
Sources: 2019 BC Mill List Database and BC Stats Note: Data shown in the above table may not be in line with the data published in previous mill list reports due to data adjustments made based on the information received in 2019/2020.
6.7 6.5 5.3
1.7 1.9
2.1
0.8 1.0
1.0
0.0
1.0
2.0
3.0
4.0
5.0
6.0
7.0
8.0
9.0
10.0
2017 2018 2019
Mil
lions
of B
DU
s
Residual Chips- Sawmills/Veneer Mills Whole log chips - Chip Mills/Pulp Mill Wood Rooms
Imported Chips Chip Consumption + Chip Export
Sources of Chips 2017 2018 2019
Residual Chip Production 6,660 6,491 5,324
Whole Log Chip Production 1,733 1,856 2,071
Total Chip Production 8,394 8,346 7,396
Total Chip Consumption 9,209 8,836 8,703
Production and Consumption Gap -816 -490 -1,307
Provincial Chip Trade
Chip Import 791 954 1,041
Chip Export 53 0.3 0.2
Net Import 738 954 1,040
Provincial Chip Balance -78 464 -267

14
Coast
• Coastal pulp mills mainly consumed residual chips and whole-log chips produced on the Coast or purchased from the
Southern Interior. Some of them consumed chips imported from the US. Paper Excellence's four pulp mills in
Crofton, Port Alberni, Powell River and Port Mellon, as well as Harmac in Nanaimo, were major chip consumers in
this area.
• In 2017-19, this area saw a decrease in the residual-chip supply and an increase in whole-log/imported chips. The
eight-month strike at Western Forest Products (WFP), which began in the second quarter of 2019, reduced the
supply of chips in this area. With the potential reduction of AAC and further sawmill closures in the Interior, chip-
supply constraints for coastal pulp mills are likely to increase. Coastal pulp mills will rely more on whole-log and
imported chips.
South
• Like the Coast, pulp/paper mills in the Southern Interior relied on residual chips, whole-log chips, and imported chips
to make their products. Most chips in this area were consumed by Domtar, Paper Excellence’s Skookumchuk Pulp,
Mercer’s Celgar, West Fraser’s Quesnel River Pulp, and Cariboo Pulp and Paper.
• Strong demand for wood chips from coastal pulp mills has resulted in competition for residual chips in this area. A
significant shortfall of chips relative to the regional demand was identified in 2019.
North
• Pulp/paper mills in the North rely on residual chips and whole-log chips to make their products. Most chips in this
area were consumed by four Canfor pulp mills (three in Prince George and one in Taylor), and one Paper
Excellence’s pulp mill in Mackenzie.
• In 2017-2019, this area saw a reduced supply of residual chips, which was partially offset by the increased supply of
whole-log chips. A surplus was seen in 2019 but expected to decrease as a result of the potential AAC reduction,
sawmill curtailments/closures, and the competitive use of chips (e.g., pellet mills) in the North.

15
Time-Series Analysis
Lumber Mills
Lumber is made from logs of varying species and qualities, which are processed in sawmills into standardized
dimensions or specialty products. Lumber is usually classified into two main groups, including rough and finished.
Rough lumber is used mainly in construction applications or is an intermediate processing stage for other mills to
further process. Finished lumber adds value to rough lumber and is produced in various grades and sizes.
According to Statistics Canada, the sawmill sector generated sales of $4.7 billion in 2019, accounting for 50% of the
total wood product manufacturing sales.
However, like other natural resource sectors, there are several factors that can lead to unpredictable changes in
lumber supply, demand and prices. From Q4 2018 until 2019, several sawmills curtailed or reduced their production
because of weak market conditions, high costs, and the strike at WFP. As a result, BC’s total lumber product sales
decreased by 30% in 2019 compared to 2018. BC’s lumber exports also decreased by 15%, and the decline was
experienced in all major export markets, including the US, China, and Japan.
The following section presents summary statistics from 2000 onward for sawmills with an annual capacity at least 40
million board feet per year:
Number of Mills, Output, and Input
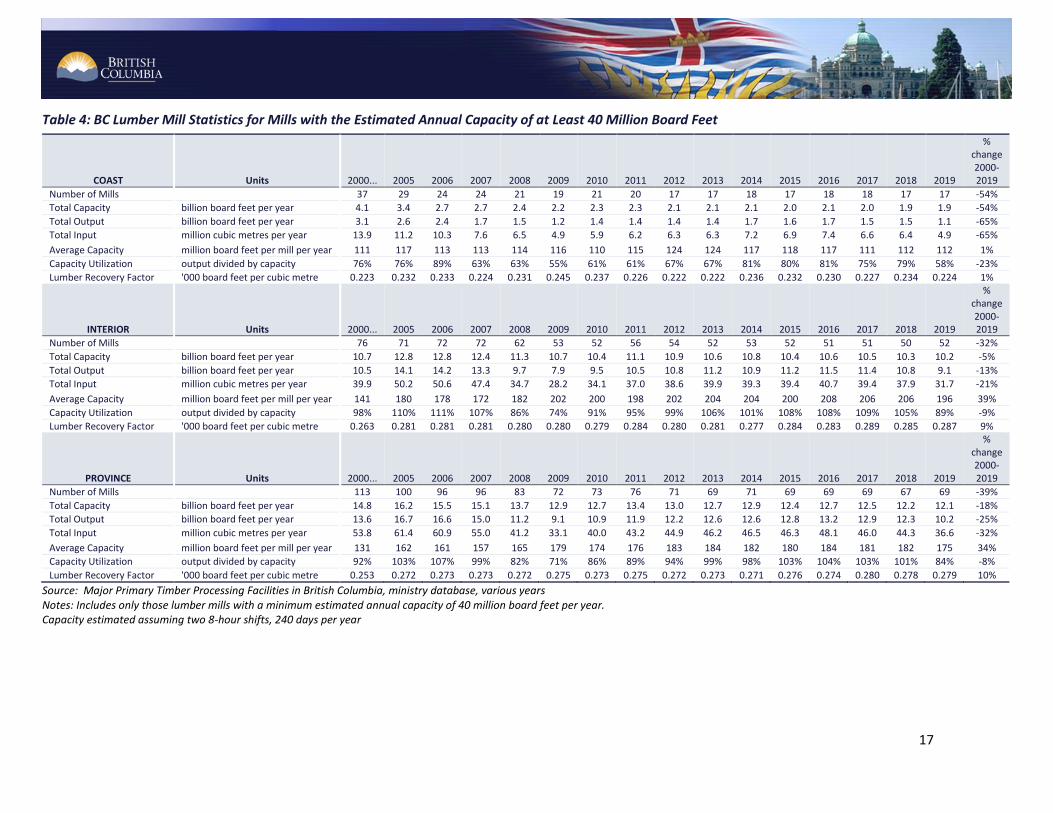
• In 2019, there were 69 sawmills in BC with an annual capacity of at least 40 million board feet per year. 17 of them
were on the Coast and 52 of them were in the Interior.
• In 2019, the top five lumber producers were Canfor, West Fraser, Tolko, Interfor, and WFP. Regionally, WFP was the
largest producer, accounting for 31% of the total coastal sawmill capacity. Canfor was the largest producer in the
Interior, representing 31% of the total Interior sawmill capacity.
• Starting from Q4 2018, several major lumber producers, including the top five companies, announced a series of
curtailments of their BC plants, which affected sawmill production and log consumption. Specifically,
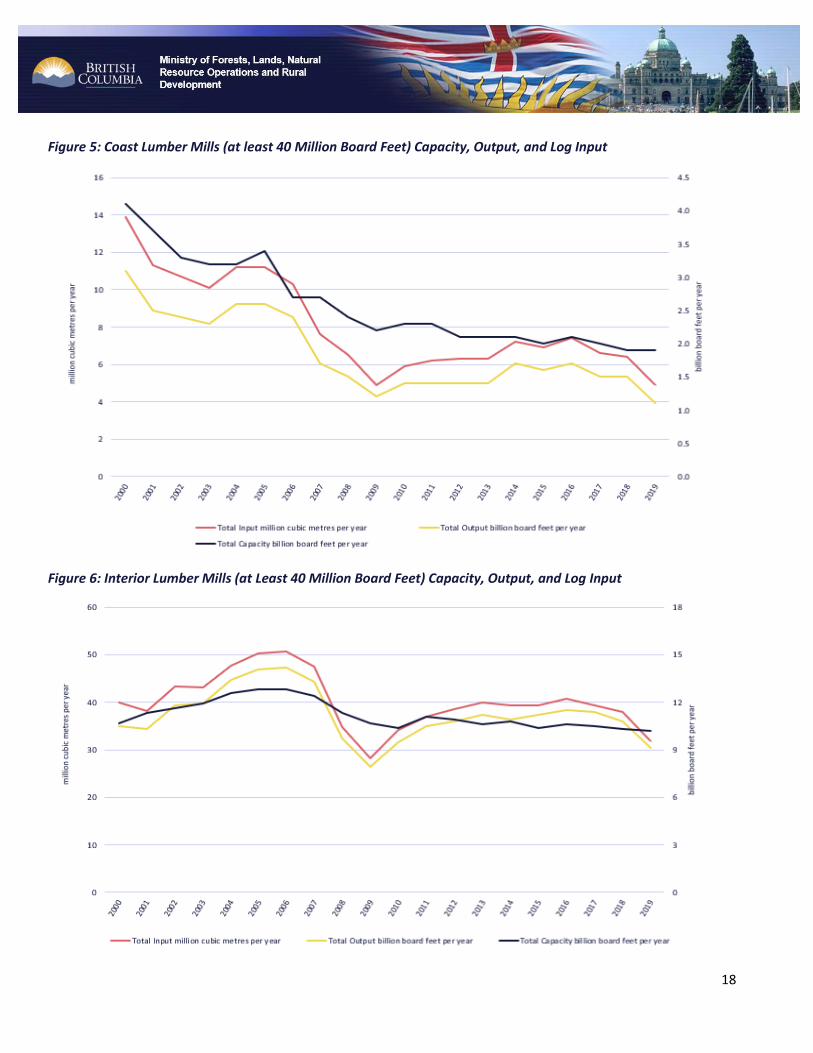
o On the Coast, the total lumber capacity declined by 5% in 2019 compared to 20182. Total outputs and inputs
decreased by 27% and 23% respectively in 2019 over 2018.
o In the Interior, the total lumber capacity was down 1% and total inputs and outputs fell by more than 15% in
2019 from 2018.
Average Capacity, Capacity Utilization, and Lumber Recovery Factor
• The average annual capacity reflects the sawmill size. In 2019, the average annual capacity of Interior sawmills was
196 million board feet, compared to 112 million board feet on the Coast.
2 The sawmill capacity refers to the maximum level of output that a sawmill can sustain to make lumber products. There will be a one-year delay for the survey to
capture the impact of the capacity reduction resulted from the permanent mill closure in 2019. If a sawmill permanently closed in 2019, the survey continued to
consider this mill as an active plant in 2019 and thus no change was made to its 2019 output capacity.

16
• The capacity utilization rate is an important indicator in evaluating sawmill operating efficiency. As shown in Table 4,
capacity utilization rates for coastal sawmills were lower than Interior sawmills. Interior sawmills generally operated
on a two-shift or higher basis, due to the commodity nature of their products. In addition, Interior producers had to
reduce unit production costs with higher levels of production. Coastal sawmills usually operated on a one-shift basis,
depending on the unique supply of logs and the demand for their products. Weak market conditions led to lower
operating rates in the Interior and on the Coast. The strike at WFP further reduced the capacity utilization rate on
the Coast. In 2019, the capacity utilization was 58% on the Coast an 89% in the Interior.
• Another key mill performance indicator is the lumber recovery factor. The computer-optimized log and lumber
scanning technology helped sawmills reduce fibre and value losses and therefore improved the recovery factor for
the Interior mills from 1990 to 2003. However, this upward trend ended as mills switched to processing the
mountain pine beetle (MPB)-impacted logs from 2004 to 2013. From 2014 onwards, the Interior recovery has
improved due to the reduction of MPB-impacted logs and the closures of inefficient mills.
17
Table 4: BC Lumber Mill Statistics for Mills with the Estimated Annual Capacity of at Least 40 Million Board Feet
COAST Units 2000... 2005 2006 2007 2008 2009 2010 2011 2012 2013 2014 2015 2016 2017 2018 2019
% change 2000-2019
Number of Mills 37 29 24 24 21 19 21 20 17 17 18 17 18 18 17 17 -54%
Total Capacity billion board feet per year 4.1 3.4 2.7 2.7 2.4 2.2 2.3 2.3 2.1 2.1 2.1 2.0 2.1 2.0 1.9 1.9 -54%
Total Output billion board feet per year 3.1 2.6 2.4 1.7 1.5 1.2 1.4 1.4 1.4 1.4 1.7 1.6 1.7 1.5 1.5 1.1 -65%
Total Input million cubic metres per year 13.9 11.2 10.3 7.6 6.5 4.9 5.9 6.2 6.3 6.3 7.2 6.9 7.4 6.6 6.4 4.9 -65%
Average Capacity million board feet per mill per year 111 117 113 113 114 116 110 115 124 124 117 118 117 111 112 112 1%
Capacity Utilization output divided by capacity 76% 76% 89% 63% 63% 55% 61% 61% 67% 67% 81% 80% 81% 75% 79% 58% -23%
Lumber Recovery Factor '000 board feet per cubic metre 0.223 0.232 0.233 0.224 0.231 0.245 0.237 0.226 0.222 0.222 0.236 0.232 0.230 0.227 0.234 0.224 1%
INTERIOR Units 2000... 2005 2006 2007 2008 2009 2010 2011 2012 2013 2014 2015 2016 2017 2018 2019
% change 2000-2019
Number of Mills 76 71 72 72 62 53 52 56 54 52 53 52 51 51 50 52 -32%
Total Capacity billion board feet per year 10.7 12.8 12.8 12.4 11.3 10.7 10.4 11.1 10.9 10.6 10.8 10.4 10.6 10.5 10.3 10.2 -5%
Total Output billion board feet per year 10.5 14.1 14.2 13.3 9.7 7.9 9.5 10.5 10.8 11.2 10.9 11.2 11.5 11.4 10.8 9.1 -13%
Total Input million cubic metres per year 39.9 50.2 50.6 47.4 34.7 28.2 34.1 37.0 38.6 39.9 39.3 39.4 40.7 39.4 37.9 31.7 -21%
Average Capacity million board feet per mill per year 141 180 178 172 182 202 200 198 202 204 204 200 208 206 206 196 39%
Capacity Utilization output divided by capacity 98% 110% 111% 107% 86% 74% 91% 95% 99% 106% 101% 108% 108% 109% 105% 89% -9%
Lumber Recovery Factor '000 board feet per cubic metre 0.263 0.281 0.281 0.281 0.280 0.280 0.279 0.284 0.280 0.281 0.277 0.284 0.283 0.289 0.285 0.287 9%
PROVINCE Units 2000... 2005 2006 2007 2008 2009 2010 2011 2012 2013 2014 2015 2016 2017 2018 2019
% change 2000-2019
Number of Mills 113 100 96 96 83 72 73 76 71 69 71 69 69 69 67 69 -39%
Total Capacity billion board feet per year 14.8 16.2 15.5 15.1 13.7 12.9 12.7 13.4 13.0 12.7 12.9 12.4 12.7 12.5 12.2 12.1 -18%
Total Output billion board feet per year 13.6 16.7 16.6 15.0 11.2 9.1 10.9 11.9 12.2 12.6 12.6 12.8 13.2 12.9 12.3 10.2 -25%
Total Input million cubic metres per year 53.8 61.4 60.9 55.0 41.2 33.1 40.0 43.2 44.9 46.2 46.5 46.3 48.1 46.0 44.3 36.6 -32%
Average Capacity million board feet per mill per year 131 162 161 157 165 179 174 176 183 184 182 180 184 181 182 175 34%
Capacity Utilization output divided by capacity 92% 103% 107% 99% 82% 71% 86% 89% 94% 99% 98% 103% 104% 103% 101% 84% -8%
Lumber Recovery Factor '000 board feet per cubic metre 0.253 0.272 0.273 0.273 0.272 0.275 0.273 0.275 0.272 0.273 0.271 0.276 0.274 0.280 0.278 0.279 10%
Source: Major Primary Timber Processing Facilities in British Columbia, ministry database, various years Notes: Includes only those lumber mills with a minimum estimated annual capacity of 40 million board feet per year. Capacity estimated assuming two 8-hour shifts, 240 days per year
18
Figure 5: Coast Lumber Mills (at least 40 Million Board Feet) Capacity, Output, and Log Input
Figure 6: Interior Lumber Mills (at Least 40 Million Board Feet) Capacity, Output, and Log Input

19
Figure 7: BC Lumber Mills (at Least 40 Million Board Feet) Number of Mills and Average Capacity
Figure 8: BC Lumber Mills (at Least 40 Million Board Feet) Capacity Utilization

20
Figure 9: BC Lumber Mills (at Least 40 Million Board Feet) Lumber Recovery Factor
21
Veneer and Plywood Mills
Veneer is produced as a thin sheet of wood of uniform thickness by peeling or slicing logs, requiring higher grade logs
with no branches. Veneer can be used in making plywood or other engineered wood products such as laminated
veneer lumber (LVL). Plywood is produced by gluing and compressing together three or more sheets of veneer, with
the grain of alternate sheets usually laid crosswise.3 Plywood is used primarily as a load-bearing component of
platform-frame-constructed buildings such as single-family and multi-family housing. It is also used in wall sheathing,
flooring, and roofing applications.
According to Statistics Canada, the veneer, plywood, and engineered wood product manufacturing generated $500
million of GDP ($2012), representing 23 % of the total GDP generated by all forestry, logging, and support activities in
BC.
However, like the lumber sector, the veneer and plywood industry has been impacted by the fibre supply constraints
and soft market conditions in the past two years. As a result, the total manufacturing sales generated by the veneer,
plywood, and engineered wood product manufacturing fell by 27%, from $2.6 billion in 2018 to $1.9 billion in 2019.
The following section presents summary statistics from 2000 onward for veneer mills that used more than 25,000
cubic metres of logs per year:
Number of Mills, Output, Input, Capacity Utilization, and Recovery
• In 2019, there were 12 veneer mills operating in the province, that used more than 4.6 million cubic metres of logs
per year. Three of them were on the Coast and nine in the Interior.4 Of these, seven veneer mills had on-site
plywood operations.
• Figure 10 shows that veneer mill outputs and inputs have climbed steadily in the last 10 years, but declined slightly
in 2019 (3% and 2%, respectively).
• Unlike the lumber sector, most BC veneer producers focus on the domestic market. Given the high demand in the
domestic construction sector, most veneer mills operate on a three-shift per day basis. Even in the challenging year
of 2019, most veneer mills still ran more than two-shifts per day, resulting in a 147% capacity utilization rate.
• Figure 13 shows that the average recovery factor declined steadily in 2013-16 and rebounded in 2017-18. In 2019,
the recovery factor was just 1% lower than in 2018, indicating stable input quality.
3 Source: Statistics Canada: https://strategis.ic.gc.ca/app/scr/sbms/sbb/cis/definition.html?code=32121&lang=eng 4 Small mills using an average of less than 25,000 m3 of logs per year were not included in these statistics.

22
Table 5: BC Veneer Mill Summary Statistics for Mills with Annual Log Consumption of at Least 25,000 Cubic Metres
Source: Major Primary Timber Processing Facilities in British Columbia, ministry database, various years Notes: Output Capacity is estimated based on two 8-hour shifts, 240 days per year. Small mills using an average of less than 25,000 cubic metres of logs per year are not included in these statistics.
Units 2000... 2005 2006 2007 2008 2009 2010 2011 2012 2013 2014 2015 2016 2017 2018 2019
% change
2000-2019
Number of Mi l l s 16 17 16 15 13 12 10 11 11 11 11 11 12 12 12 12 -25%
Total Capacity (bi l l ion square feet 3/8" bas is ) 2.0 2.6 2.5 2.3 2.0 1.9 1.8 2.0 1.7 1.7 1.7 1.7 1.9 1.9 2.0 1.9 -5%
Total Output (bi l l ion square feet 3/8" bas is ) 2.6 3.7 3.3 2.9 2.3 1.9 2.0 2.2 2.2 2.4 2.4 2.5 2.8 2.9 2.9 2.8 8%
Total Log Input (mi l l ion cubic metres) 4.4 6.3 5.7 5.1 4.0 3.4 3.6 3.8 3.6 3.8 3.9 4.1 4.9 4.8 4.7 4.6 5%
Average Capacity (mi l l ion square feet per mi l l ) 125 153 156 153 154 158 180 182 155 155 155 155 158 158 167 158 27%
Average Log Input (thousand cubic metres per mi l l ) 275 371 356 340 308 283 360 345 327 345 355 373 408 400 392 383 39%
Capacity Uti l i zation (output divided by capacity) 130% 142% 132% 126% 115% 100% 111% 110% 129% 141% 141% 147% 147% 153% 145% 147% 13%
Recovery Factor (square feet per cubic metre log input) 591 587 579 569 575 559 556 579 611 632 615 610 571 604 617 609 3%

23
Figure 10: BC Veneer Mills Capacity, Output, and Log Input
Figure 11: BC Veneer Mills - Number of Mills and Average Capacity

24
Figure 12: BC Veneer Mills Capacity Utilization
Figure 13: BC Veneer Mills Recovery Factor

25
Pulp and Paper Mills
Pulp and paper mills produce various products, including newsprint, household tissues, dissolving pulp for the rayon
production, and green energy. In BC, the main pulp products are bleached softwood kraft pulp (BSK) and chemi-
thermo-mechanical pulp (CTMP). The main paper product is newsprint.
According to Statistics Canada, the pulp and paper manufacturing sector generated sales of $4.9 billion in 2019,
accounting for over 34% of total forest sector manufacturing sales.
BC’s pulp and paper export value declined by 23%, from $4.3 billion in 2018 to $3.3 billion in 20195. China accounted
for 63% of the total value, followed by the US (11%), and Japan (6%).
Number of Mills, Capacity, Input, Output, and Capacity Utilization
Pulp Mills
• In 2019, there were 15 pulp mills operating in BC with five mills on the Coast, and 10 mills in the Interior.
• In March 2019, Paper Excellence completed its purchase of three pulp/paper mills (Port Alberni, Powell River, and
Crofton) from Catalyst Paper. As a result, Paper Excellence became the largest pulp producer, representing 36% of
the provincial pulp capacity. Canfor and Mercer6 were the second-and third-largest pulp producers, representing
27% and 13% of the total capacity.
• As shown in Figure 14, 34% of the provincial capacity was on the Coast, 31% was in the North, and 35% was in the
South.
• Lumber mill curtailments due to weak lumber markets in 2019 resulted in reduced residual chips available to pulp
mills. In addition, the eight-month labour dispute at WFP aggravated the fibre supply situation. As a result, major
pulp producers had temporary curtailments. The total pulp production and total fibre input decreased by 4% and
1.5%, respectively in 2019 from 2018. Pulp mills capacity utilization rate also dropped 2% to 94% of their capacity in
2019. Pulp mill curtailments resulted in reduced capacity utilization. Table 6 shows that pulp mills operated at 94%
of their capacity in 2019, down 2% from 2018.
• The hog fuel consumption also declined by 13%, from 5.3 million cubic metres in 2018 to 4.7 million cubic metres in
2019.7
Paper Mills
• In 2019, there were five paper mills operating in BC with four of them operating on pulp mill sites.
• As shown in Figure 17, 86% of the provincial capacity was on the Coast and 14% in the Northern Interior.
• The rise of electronic media resulted in a decline of paper-based communication products. Figure 18 illustrates that
the total capacity and output of paper mills have continued to decline over the past decade.
• As illustrated in Figure 19, the capacity utilization has stayed above 85% from 2010 onward. The increase in capacity
utilization between 2016 and 2018 was mainly driven by the capacity reduction in this sector. In 2019, the capacity
utilization rate was 83% (less than 100%), suggesting that paper mills operated with less than three shifts per day.
5 Source: Statistics Canada 6 Partial ownership was included in the calculation of pulp company’s capacity share 7 The number of firms reported their hog fuel consumption is believed to be below the actual number.

26
Table 6: BC Pulp and Paper Mill Summary Statistics
Pulp Mills Units 2000... 2005 2006 2007 2008 2009 2010 2011 2012 2013 2014 2015 2016 2017 2018 2019
% change 2000-2019
Number of Pulp Mills 23 22 21 21 19 19 18 18 18 16 16 17 15 15 15 15 -35%
Total Capacity (million tonnes) 7.84 7.42 7.42 6.84 6.36 6.33 5.96 6.02 5.87 5.66 5.64 5.85 5.21 5.17 5.26 5.15 -34%
Total Output (million tonnes) 7.56 7.09 7.08 6.51 5.85 5.27 5.49 5.76 5.80 5.50 5.63 5.69 5.20 5.18 5.05 4.84 -36%
Total Fibre Input (million bone dry units) 13.44 12.36 11.79 10.96 10.12 8.87 8.29 10.13 9.65 9.29 9.62 9.59 9.08 9.21 8.84 8.70 -35%
Average Capacity (thousand tonnes) 341 337 353 326 335 333 331 334 326 354 352 344 348 345 350 343 1%
Average Fibre Input (thousand bone dry units) 584 562 562 522 532 467 461 563 536 581 601 564 606 614 589 580 -1%
Capacity Utilization 96% 96% 95% 95% 92% 83% 92% 96% 99% 97% 100% 97% 100% 100% 96% 94% -2%
Paper Mills Units 2000... 2005 2006 2007 2008 2009 2010 2011 2012 2013 2014 2015 2016 2017 2018 2019
% change 2000-2019
Number of Paper Mills 11 11 11 9 9 8 6 6 6 5 6 6 5 5 5 5 -55%
Total Capacity (million tonnes) 3.27 2.98 3.19 2.86 2.84 2.52 1.52 1.52 1.57 1.38 1.61 1.49 1.26 1.24 1.14 1.20 -63%
Total Output (million tonnes) 3.17 3.02 3.04 2.55 2.42 2.03 1.49 1.48 1.49 1.30 1.48 1.29 1.15 1.15 1.14 0.99 -69%
Average Capacity (thousand tonnes) 297 271 290 318 315 315 253 253 261 275 268 248 252 249 228 239 -19%
Capacity Utilization 97% 101% 95% 89% 85% 81% 98% 98% 95% 94% 92% 87% 91% 92% 100% 83% -14%
Source: Major Primary Timber Processing Facilities in British Columbia, ministry database, various years Note: Output Capacity is estimated based on three 8-hour shifts, 345 days per year.

27
Figure 14: BC Pulp Mills Output Capacity and Ownerships

28
Figure 15: BC Pulp Mills Capacity, Output, and Input
Figure 16: BC Pulp Mills Capacity Utilization
0
2
4
6
8
10
12
14
16
Total Fibre Input (million bone dry units) Total Capacity (million tonnes) Total Output (million tonnes)

29
Figure 17: BC Paper Mills Output Capacity and Ownerships

30
Figure 18: BC Paper Mills Capacity and Output
Figure 19: BC Paper Mills Capacity Utilization
31
Pellet Mills
Wood pellets are made from compacting fibre (e.g., sawdust and shavings) into desired pellet diameter and length.
Pellets are predominantly made from sawmill residuals.
Pellet markets include heating pellet markets and industrial wood pellet markets. The demand for heating pellets
depends on weather and other fuel prices. The demand for industrial wood pellets is driven by policies that reduce
carbon emissions and generate renewable energy in most provinces and territories. Many countries have
announced policies to support the use of renewable energy for electricity generation, with more expected to follow.
BC is currently one of the most important suppliers of industrial wood pellets in the world. BC’s ability to source
abundant and competitively priced sawmill residuals has enabled the province to lead the way. In 2019, the
province exported 2.14 million tons of wood pellets valued at $388 million. The UK (67%) was the top destination by
weight, followed by Japan (26%) and other countries (7%).8
Number of Mills, Capacity, Average Capacity, Output, Input, and Utilization
• The BC wood pellet industry has grown rapidly since 2005. The number of pellet mills has more than doubled, rising
from five in 2005 to 13 in 2019. In 2019, Pinnacle Renewable Energy Group (Pinnacle) was the largest producer with
seven plants operating in the Interior, representing 46% of the provincial capacity9. Sinclar’s Premium Pellet,
Canfor, and Pacific BioEnergy together accounted for 37% of the total capacity. Pinnacle and West Fraser’s new
plant in Smithers began its operation in Q4 2018. This facility operated at full capacity in 2019, adding at least
95,000 tonnes10 of production capacity to the province.
• Pellet mills in BC are larger than those in other Canadian jurisdictions.11 In 2019, the average annual capacity of BC
pellet mills was 178,000 tonnes, three times that of eastern Canada (average capacity of 50,000 tonnes).
• While long-term demand is expected to remain strong, short-term disruptions can affect the market for pellet
producers. Like the pulp and paper sector, pellet producers count on sawmill residuals to maintain their operating
rates. With the decreased supply of sawmill residuals as a result of 2018/19 sawmill curtailments, the provincial
pellet production decreased by 1.4% and the average capacity utilization decreased by 8% in 2019 over 2018
(Figure 20 and Figure 21).
8 Source: 2019 Economic State of the BC Forest Sector 9 Partial ownership was included in the calculation of the pellet company’s capacity share. 10 Production capacity was estimated based on the company's reported shift capacity in 2019 and a standard operating schedule applied by the Ministry. This estimate may differ from the mill’s actual operation or from information published elsewhere. 11 Wood pellet association

32
Table 7: BC Pellet Mill Summary Statistics
Source: Major Primary Timber Processing Facilities in British Columbia, ministry database, various years Note: Output Capacity is estimated based on three 8-hour shifts, 345 days per year. Historical data may be adjusted to reflect the new information received in 2019.
Units 2005 2006 2007 2008 2009 2010 2011 2012 2013 2014 2015 2016 2017 2018 2019
% change 2005-2019
Number of Mills 5 8 8 9 9 11 11 11 11 12 14 14 13 13 13 160%
Total Capacity (million tonnes) 0.36 0.81 0.99 1.07 0.96 1.31 1.99 1.67 1.69 1.77 2.05 2.22 2.13 2.17 2.31 542%
Total Output (million tonnes) 0.36 0.39 0.41 0.79 0.76 1.11 1.36 1.64 1.68 1.65 1.80 2.06 2.08 2.12 2.09 481%
Total Input (million bone dry units) 0.41 0.44 0.47 0.81 0.68 1.13 1.28 1.37 1.58 1.62 1.73 1.92 1.95 1.87 1.93 371%
Average Capacity (000s tonnes) 72 101 124 119 107 119 181 152 154 148 146 159 164 167 178 147%
Capacity Utilization (output divided by capacity) 100% 48% 41% 74% 79% 85% 68% 98% 99% 93% 88% 93% 98% 98% 90% -10%
Recovery Factor (Tonnes of output per tonne of bone-dry input) 0.88 0.89 0.87 0.98 1.12 0.98 1.06 1.20 1.06 1.02 1.04 1.07 1.07 1.13 1.08 23%

33
Figure 20: BC Pellet Mills Capacity, Output, and Fibre Input
Figure 21: BC Pellet Mills Capacity Utilization

34
Shake and Shingle Mills
The wood shake and shingle industry comprises mills that produce premium residential roofing and siding products.
In BC, Western Red Cedar is the material of choice because it offers several unique features, including ease of
installation, low maintenance, durability, and earthy colours. While both shake and shingles can be used for roofs and
walls, shakes tend to be used more for roofs because they are usually thicker than shingles. The main roofing product
types include hand-split and re-sawn shakes as well as taper-sawn shakes. Besides, various sidewall shingle products
are produced in BC.12 The usual commercial unit of measurement for shake and shingles is a “square,” the quantity
required to cover 100 square feet of surface area.
Although the shake and shingle sector is relatively small, it generates significant sales revenue for the BC economy.
According to Statistics Canada, the total manufacturing sales for shake and shingle products were $660 million in
2019. The province exported $161-million shake and shingle products to foreign countries. The US was the largest
market (89%), with the next market being the UK (3%). Within the US, Massachusetts was the largest market,
followed by New York, Oregon, and Connecticut.13
Number of Mills, Capacity, Input, Output, and Utilization
• Figure 22 shows that shakes and shingles have been produced by fewer companies each year since 2000. The
number of mills declined from 51 in 2000 to 37 in 2019.
• While shake and shingle mills were in all parts of the province where Western Red Cedar was found, most of the
production was located on the Coast. In 2019, 33 shake and shingle producers operated on the Coast,
accounting for 98% of the provincial capacity. Four producers operated in the Interior, accounting for 2% of the
total capacity. Of these, small private companies with less than 50 employees accounted for more than 75% of
the total capacity.
• The decrease in the number of shingle and shingle mills reduced production capacity. As shown in Figure 23, the
total capacity decreased by 55% from 3.7 million squares in 2000 to 1.7 million squares in 2019. 14
• Mill capacity declines were accompanied by input and output decreases. Figure 23 shows that the total output
dropped by 51%, from 1.5 million squares in 2000 to 751,000 squares in 2019. The total input (primarily cedar)
fell by 50%, from one million cubic metres in 2000 to 517,000 cubic metres in 2019.
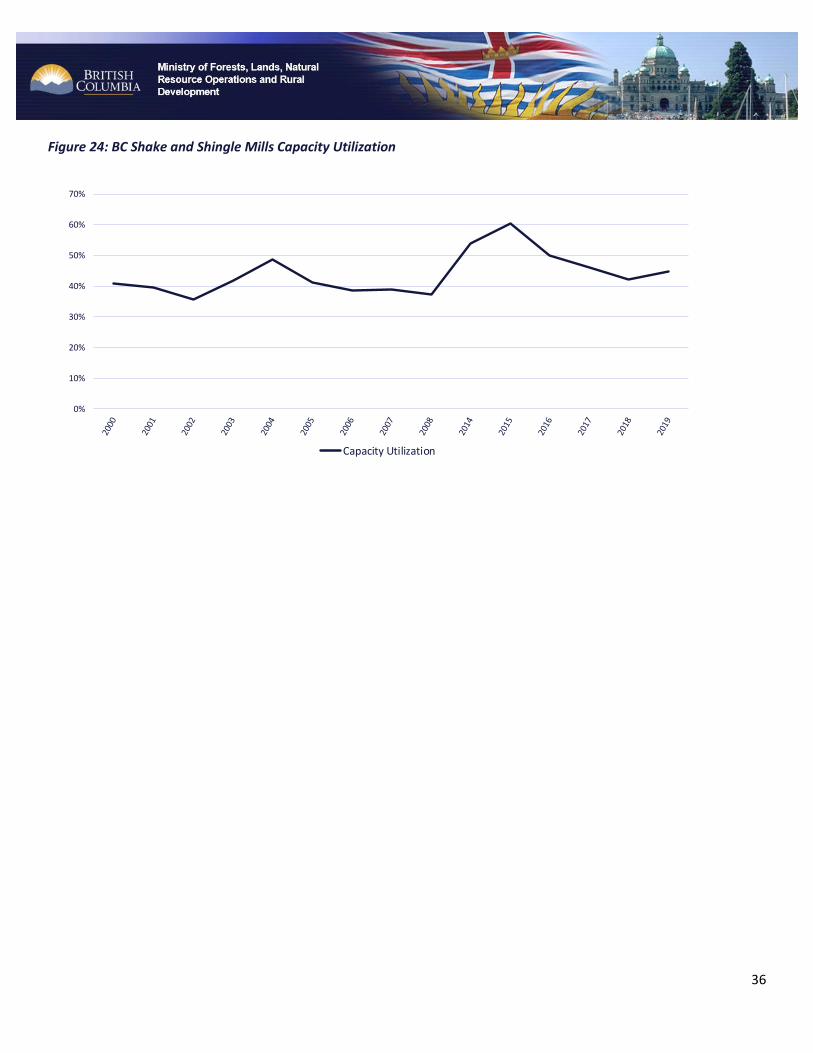
• Figure 24 shows that capacity utilization has fluctuated between 30% and 60%. As the cedar log supply declines,
the competition for those logs has caused supply tightness for shake and shingle producers, resulting in low
capacity utilization (less than 50%) in the past three years.
12 Source: The BC Cedar Shake and Shingle 13 Source: BC Stats 14 The Ministry did not survey shake and shingle mills in 2009-2013

35
Figure 22: Number of Shake and Shingle Mills
Figure 23: BC Shake and Shingle Mills Capacity, Output, and Log Input
2000 2001 2002 2003 2004 2005 2006 2007 2008 2014 2015 2016 2017 2018 2019
0
10
20
30
40
50
60
Nu
mb
er o
f Mil
ls
0.0
0.5
1.0
1.5
2.0
2.5
3.0
3.5
4.0
Total Input (million m3) Total Output (million squares) Total Capacity (million squares)
36
Figure 24: BC Shake and Shingle Mills Capacity Utilization
0%
10%
20%
30%
40%
50%
60%
70%
Capacity Utilization

37
Related References
British Columbia Ministry of Forests, Lands, Natural Resource Operations and Rural Development. (2020). 2019
Economic State of the BC Forest Sector.
Cedar Shake and Shingle Bureau
Industry Canada. Canadian Industry Statistics
www.ic.gc.ca/eic/site/cis-sic.nsf/eng/home
Industry, Science and Technology Canada. (1991). Wood Shakes and Shingles.
http://publications.gc.ca/site/archivee-archived.html?url=http://publications.gc.ca/collections/collection_2020/isde-
ised/c21/C21-31-113-1991-eng.pdf
Forintek Canada Corporation. (1985). Conversion factors for the forest products industry in Western Canada.
Pulp and Paper Product Council
www.pppc.org
PWC Canada. (2019). British Columbia’s Forest Industry and the Regional Economics.
https://www.cofi.org/wp-content/uploads/FINAL-COFI-Regional-Economic-Impact-Study_Final_March2019-2.pdf
Wood Pellet Association of Canada
http://www.pellet.org/

38
Appendix
Figure 25: Administrative Areas and Natural Resource District Boundaries in 2019

39
Lumber Mills
Lumber mills are presented in two separate tables, one for those with an estimated annual capacity of at least 40 million
board feet of lumber, and one for those below.
The annual capacity reported in the following tables is estimated based on the same standard operating assumption for
each mill (i.e. number and length of shifts and days per year as described below). The actual mill production can be
higher or lower than the estimated capacity, if a mill runs on a different operating schedule than assumed here.
Therefore, while capacity provides guidance on mill output, it is not a measure of the actual production level of the mill.
For more information, please contact [email protected].
Notes:
1. The estimated annual capacity is established on a standardized operation of 240 days per year, two 8-hour shifts
per day. The actual mill operation may vary from this schedule.
2. Administrative areas and natural resource districts were applied (see Figure 25 for details).
3. The List of Lumber Mills is available as an Excel spreadsheet online at
https://www2.gov.bc.ca/gov/content/industry/forestry/competitive-forest-industry/forest-industry-
economics/fibre-mill-information/major-timber-processing-facilities-survey
40
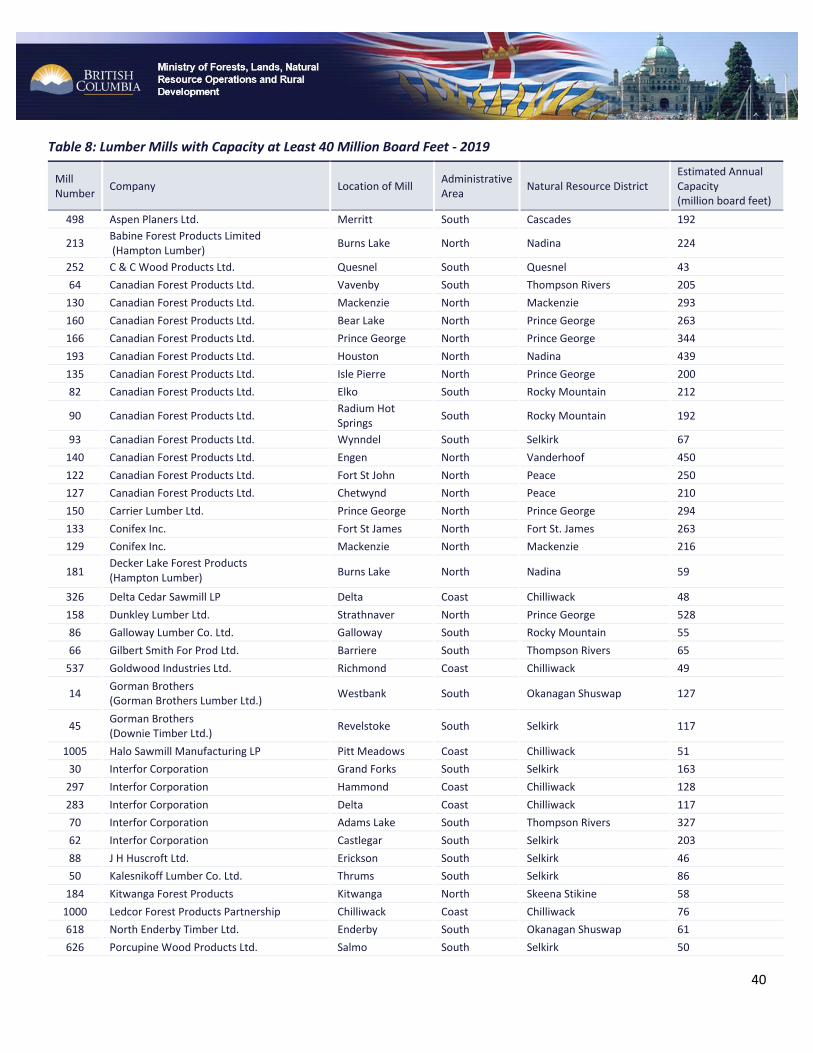
Table 8: Lumber Mills with Capacity at Least 40 Million Board Feet - 2019
Mill Number
Company Location of Mill Administrative Area
Natural Resource District Estimated Annual Capacity (million board feet)
498 Aspen Planers Ltd. Merritt South Cascades 192
213 Babine Forest Products Limited (Hampton Lumber)
Burns Lake North Nadina 224
252 C & C Wood Products Ltd. Quesnel South Quesnel 43
64 Canadian Forest Products Ltd. Vavenby South Thompson Rivers 205
130 Canadian Forest Products Ltd. Mackenzie North Mackenzie 293
160 Canadian Forest Products Ltd. Bear Lake North Prince George 263
166 Canadian Forest Products Ltd. Prince George North Prince George 344
193 Canadian Forest Products Ltd. Houston North Nadina 439
135 Canadian Forest Products Ltd. Isle Pierre North Prince George 200
82 Canadian Forest Products Ltd. Elko South Rocky Mountain 212
90 Canadian Forest Products Ltd. Radium Hot Springs
South Rocky Mountain 192
93 Canadian Forest Products Ltd. Wynndel South Selkirk 67
140 Canadian Forest Products Ltd. Engen North Vanderhoof 450
122 Canadian Forest Products Ltd. Fort St John North Peace 250
127 Canadian Forest Products Ltd. Chetwynd North Peace 210
150 Carrier Lumber Ltd. Prince George North Prince George 294
133 Conifex Inc. Fort St James North Fort St. James 263
129 Conifex Inc. Mackenzie North Mackenzie 216
181 Decker Lake Forest Products (Hampton Lumber)
Burns Lake North Nadina 59
326 Delta Cedar Sawmill LP Delta Coast Chilliwack 48
158 Dunkley Lumber Ltd. Strathnaver North Prince George 528
86 Galloway Lumber Co. Ltd. Galloway South Rocky Mountain 55
66 Gilbert Smith For Prod Ltd. Barriere South Thompson Rivers 65
537 Goldwood Industries Ltd. Richmond Coast Chilliwack 49
14 Gorman Brothers (Gorman Brothers Lumber Ltd.)
Westbank South Okanagan Shuswap 127
45 Gorman Brothers (Downie Timber Ltd.)
Revelstoke South Selkirk 117
1005 Halo Sawmill Manufacturing LP Pitt Meadows Coast Chilliwack 51
30 Interfor Corporation Grand Forks South Selkirk 163
297 Interfor Corporation Hammond Coast Chilliwack 128
283 Interfor Corporation Delta Coast Chilliwack 117
70 Interfor Corporation Adams Lake South Thompson Rivers 327
62 Interfor Corporation Castlegar South Selkirk 203
88 J H Huscroft Ltd. Erickson South Selkirk 46
50 Kalesnikoff Lumber Co. Ltd. Thrums South Selkirk 86
184 Kitwanga Forest Products Kitwanga North Skeena Stikine 58
1000 Ledcor Forest Products Partnership Chilliwack Coast Chilliwack 76
618 North Enderby Timber Ltd. Enderby South Okanagan Shuswap 61
626 Porcupine Wood Products Ltd. Salmo South Selkirk 50

41
183 ROC Holdings Terrace North Coast Mountain 116
454 S & R Sawmills Ltd. Surrey Coast Chilliwack 223
750 Sigurdson Forest Products Williams Lake South Cariboo Chilcotin 72
137 Sinclar Group (Apollo Forest Products Ltd.)
Fort St James North Fort St. James 125
149 Sinclar Group (Lakeland Mills Ltd)
Prince George North Prince George 154
144 Sinclar Group (Nechako Lumber Co.)
Vanderhoof North Vanderhoof 240
100 Teal-Jones Group (J.S. Jones)
Surrey Coast Chilliwack 192
539 Teal-Jones Group (Stag Timber Ltd.)
Surrey Coast Chilliwack 72
396 Terminal Forest Products Ltd. Vancouver Coast Chilliwack 49
540 Terminal Forest Products Ltd. Richmond Coast Chilliwack 245
103 Tolko Industries Ltd. Williams Lake South Cariboo Chilcotin 140
98 Tolko Industries Ltd. Quesnel South Quesnel 119
107 Tolko Industries Ltd. Williams Lake South Cariboo Chilcotin 170
20 Tolko Industries Ltd. Lavington South Okanagan Shuswap 263
67 Tolko Industries Ltd. Kelowna South Okanagan Shuswap 192
68 Tolko Industries Ltd. Armstrong South Okanagan Shuswap 197
31 Vaagen Fibre Canada Midway South Selkirk 123
191 West Fraser Mills Ltd. Smithers North Skeena Stikine 259
114 West Fraser Mills Ltd. Williams Lake South Cariboo Chilcotin 145
95 West Fraser Mills Ltd. 100 Mile House South 100 Mile House 230
532 West Fraser Mills Ltd. LeJac North Vanderhoof 262
214 West Fraser Mills Ltd. Clinton South 100 Mile House 214
113 West Fraser Mills Ltd. Quesnel South Quesnel 420
552 West Fraser Mills Ltd. Chetwynd North Peace 294
320 Western Forest Products Cowichan Bay Coast South Island 128
528 Western Forest Products Port Alberni Coast South Island 134
546 Western Forest Products Duke Point Coast South Island 90
442 Western Forest Products Ladysmith Coast South Island 158
376 Western Forest Products Ladysmith Coast South Island 86
393 Western Forest Products Chemainus Coast South Island 61
29 Weyerhaeuser Company Ltd. Princeton South Cascades 210
42
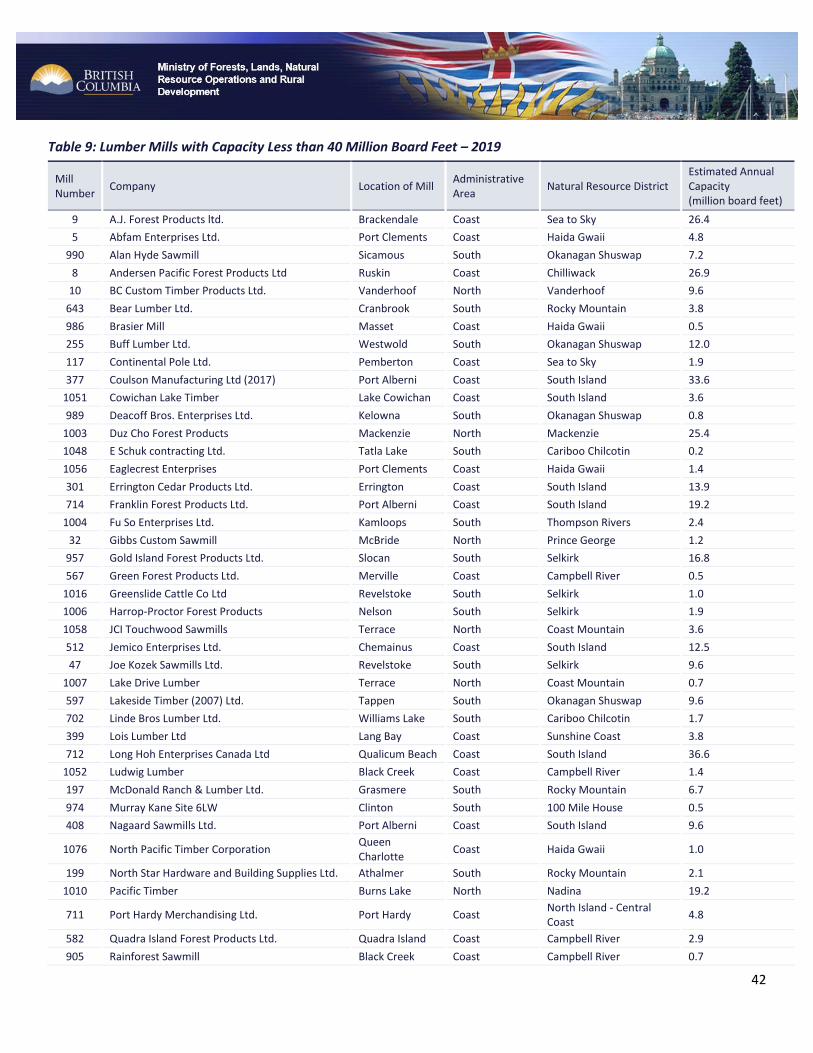
Table 9: Lumber Mills with Capacity Less than 40 Million Board Feet – 2019
Mill Number
Company Location of Mill Administrative Area
Natural Resource District Estimated Annual Capacity (million board feet)
9 A.J. Forest Products ltd. Brackendale Coast Sea to Sky 26.4
5 Abfam Enterprises Ltd. Port Clements Coast Haida Gwaii 4.8
990 Alan Hyde Sawmill Sicamous South Okanagan Shuswap 7.2
8 Andersen Pacific Forest Products Ltd Ruskin Coast Chilliwack 26.9
10 BC Custom Timber Products Ltd. Vanderhoof North Vanderhoof 9.6
643 Bear Lumber Ltd. Cranbrook South Rocky Mountain 3.8
986 Brasier Mill Masset Coast Haida Gwaii 0.5
255 Buff Lumber Ltd. Westwold South Okanagan Shuswap 12.0
117 Continental Pole Ltd. Pemberton Coast Sea to Sky 1.9
377 Coulson Manufacturing Ltd (2017) Port Alberni Coast South Island 33.6
1051 Cowichan Lake Timber Lake Cowichan Coast South Island 3.6
989 Deacoff Bros. Enterprises Ltd. Kelowna South Okanagan Shuswap 0.8
1003 Duz Cho Forest Products Mackenzie North Mackenzie 25.4
1048 E Schuk contracting Ltd. Tatla Lake South Cariboo Chilcotin 0.2
1056 Eaglecrest Enterprises Port Clements Coast Haida Gwaii 1.4
301 Errington Cedar Products Ltd. Errington Coast South Island 13.9
714 Franklin Forest Products Ltd. Port Alberni Coast South Island 19.2
1004 Fu So Enterprises Ltd. Kamloops South Thompson Rivers 2.4
32 Gibbs Custom Sawmill McBride North Prince George 1.2
957 Gold Island Forest Products Ltd. Slocan South Selkirk 16.8
567 Green Forest Products Ltd. Merville Coast Campbell River 0.5
1016 Greenslide Cattle Co Ltd Revelstoke South Selkirk 1.0
1006 Harrop-Proctor Forest Products Nelson South Selkirk 1.9
1058 JCI Touchwood Sawmills Terrace North Coast Mountain 3.6
512 Jemico Enterprises Ltd. Chemainus Coast South Island 12.5
47 Joe Kozek Sawmills Ltd. Revelstoke South Selkirk 9.6
1007 Lake Drive Lumber Terrace North Coast Mountain 0.7
597 Lakeside Timber (2007) Ltd. Tappen South Okanagan Shuswap 9.6
702 Linde Bros Lumber Ltd. Williams Lake South Cariboo Chilcotin 1.7
399 Lois Lumber Ltd Lang Bay Coast Sunshine Coast 3.8
712 Long Hoh Enterprises Canada Ltd Qualicum Beach Coast South Island 36.6
1052 Ludwig Lumber Black Creek Coast Campbell River 1.4
197 McDonald Ranch & Lumber Ltd. Grasmere South Rocky Mountain 6.7
974 Murray Kane Site 6LW Clinton South 100 Mile House 0.5
408 Nagaard Sawmills Ltd. Port Alberni Coast South Island 9.6
1076 North Pacific Timber Corporation Queen Charlotte
Coast Haida Gwaii 1.0
199 North Star Hardware and Building Supplies Ltd. Athalmer South Rocky Mountain 2.1
1010 Pacific Timber Burns Lake North Nadina 19.2
711 Port Hardy Merchandising Ltd. Port Hardy Coast North Island - Central Coast
4.8
582 Quadra Island Forest Products Ltd. Quadra Island Coast Campbell River 2.9
905 Rainforest Sawmill Black Creek Coast Campbell River 0.7

43
271 Rouck Brothers Sawmill Ltd. Lumby South Okanagan Shuswap 3.8
731 SCG Forest Inc. Courtenay Coast Campbell River 2.4
480 Schapol Logging Ltd. Enderby South Okanagan Shuswap 19.2
23 Shannon Lumber Ltd. Chilliwack Coast Chilliwack 9.6
917 Sheraton Sawmill Burns Lake North Nadina 8.0
654 SpikeTop Cedar Ltd. Port Hardy Coast North Island - Central Coast
0.5
24 Suncoast Industries Inc Sechelt Coast Sunshine Coast 19.2
1023 Take to heart Specialty Wood Product Revelstoke South Selkirk 0.7
1054 Tanu Wood Products Enterprises Skidegate Coast Haida Gwaii 2.4
96 Thomson Bros. Lumber Co. Ltd. Courtenay Coast Campbell River 4.8
979 Woodco Management Ltd Barriere South Thompson Rivers 28.8

44
Pulp and Paper Mills
Pulp and paper mills are listed in this section. For integrated mills, pulp capacity includes pulp that is used internally to
produce paper, and pulp that is shipped from the mill site as market pulp.
The annual capacity reported in these tables is estimated based on the same standard operating assumption for each
mill (number and length of shifts and days per year as described below). The actual mill production can be higher or
lower than the estimated capacity, if a mill runs on a different operating schedule than assumed here. Therefore, while
capacity provides guidance on mill output, it is not a measure of the actual production level of the mill. For more
information, please contact [email protected].
Notes:
1. The estimated annual capacity is established on a standardized operation of 345 operating days per year, 24
hours per day. Actual operations may vary from this schedule.
2. Administrative areas and natural resource districts were applied (see Figure 25 for details).
3. The List of Pulp and Paper Mills is available as an Excel spreadsheet online at
https://www2.gov.bc.ca/gov/content/industry/forestry/competitive-forest-industry/forest-industry-
economics/fibre-mill-information/major-timber-processing-facilities-survey

45
Table 10: Pulp and Paper Mills – 2019
Mill Number
Company Location of Mill Product Administrative Area
Natural Resource District
Estimated Annual Capacity (thousand tonnes)
960 Canadian Forest Products Ltd. (Intercontinental Pulp)
Prince George PLP North Prince George 324
500 Canadian Forest Products Ltd. (Prince George Pulp and Paper)
Prince George PLP North Prince George 316
335 Canadian Forest Products Ltd. (Taylor Pulp Mill)
Taylor PLP North Peace 209
503 Canadian Forest Products Ltd. (Northwood Pulp Mill)
Prince George PLP North Prince George 541
2 Domtar Kamloops PLP South Thompson Rivers 380
488 Harmac Pacific (Nanaimo Forest Products)
Nanaimo PLP Coast South Island 372
501 Mercer (Mercer Celgar Limited Partnership)
Castlegar PLP South Selkirk 477
487 Paper Excellence Group Port Alberni PLP Coast South Island 169
483 Paper Excellence Group Crofton PLP Coast South Island 607
505 Paper Excellence Group Mackenzie PLP North Mackenzie 181
486 Paper Excellence Group Powell River PLP Coast Sunshine Coast 252
1 Paper Excellence Group (Skookumchuck Pulp)
Skookumchuk PLP South Rocky Mountain 255
484 Paper Excellence Group (Howe Sound)
Port Mellon PLP Coast Sunshine Coast 372
553 West Fraser (Quesnel River Pulp)
Quesnel PLP South Quesnel 344
497 West Fraser and Mercer (Cariboo Pulp & Paper)
Quesnel PLP South Quesnel 349
500 Canadian Forest Products Ltd. (Prince George Pulp and Paper)
Prince George PPR North Prince George 169
491 Kruger Products LP New Westminster PPR Coast Chilliwack 56
483 Paper Excellence Group Crofton PPR Coast South Island 377
486 Paper Excellence Group Powell River PPR Coast Sunshine Coast 306
487 Paper Excellence Group Port Alberni PPR Coast South Island 290
46
Veneer, Plywood, OSB, and Other Panel Mills
(Listed Alphabetically by Product)
Mills producing veneer, plywood, OSB and other types of panel are listed in this section. For mills that produce both
market veneer and plywood, veneer capacity includes market veneer and the veneer that is used within the mill to
manufacture plywood. Panel mills that use wood residuals to produce panels or do not have log-processing capability
are also listed in this report.
The annual capacity reported in these tables is estimated based on the same standard operating assumption for each
mill (number and length of shifts and days per year as described below). The actual mill production can be higher or
lower than the estimated capacity, if a mill runs on a different operating schedule than assumed here. Therefore, while
capacity provides guidance on mill output, it is not a measure of the actual production level of the mill. For more
information, please contact [email protected].
Notes:
1. The estimated annual capacity of veneer mills and plywood mills is based on a standardized operation of 240
days per year, two 8-hour shifts per day. For OSB and other panel mills, the estimated annual capacity is based
on a standardized operation of 345 days per year, three 8-hour shifts per day. Actual operations may vary from
these schedules.
2. Administrative areas and natural resource districts were applied (see Figure 25 for details).
3. The List of Veneer, Plywood, OSB and Panel Mills is available as an Excel spreadsheet online at
https://www2.gov.bc.ca/gov/content/industry/forestry/competitive-forest-industry/forest-industry-
economics/fibre-mill-information/major-timber-processing-facilities-survey

47
Table 11: Veneer, Plywood, OSB, and Panel Mills – 2019
Mill Number
Company Location of Mill Product Administrative Area
Natural Resource District
Estimated Annual Capacity (million sq. ft, 3/8" basis)
411 Norbord Inc. 100 Mile House OSB South 100 Mile House 440
942 Peace Valley OSB Fort St John OSB North Peace 727
650 Louisiana Pacific Canada Ltd. Dawson Creek OSB North Peace 280
84 Louisiana Pacific Canada Ltd. Golden PLY South Selkirk 126
112 West Fraser Mills Ltd. Quesnel PLY South Quesnel 235
109 Aspen Planers Ltd. Savona PLY South Thompson Rivers 121
1042 Thompson River Veneer Products Ltd. Kamloops PLY South Thompson Rivers 115
105 West Fraser Mills Ltd. Williams Lake PLY South Cariboo Chilcotin 219
394 Tolko Industries Ltd. Heffley Creek PLY South Thompson Rivers 187
68 Tolko Industries Ltd. Armstrong PLY South Okanagan Shuswap 267
12 Gorman Brothers (Canoe Forest Products Ltd.)
Canoe PLY South Okanagan Shuswap 139
478 Richmond Plywood Corp. Ltd. Richmond PLY Coast Chilliwack 165
113 West Fraser Mills Ltd. Quesnel PNL South Quesnel 207
105 West Fraser Mills Ltd. Williams Lake VNR South Cariboo Chilcotin 137
244 Coastland Wood Industries Ltd. Nanaimo VNR Coast South Island 213
68 Tolko Industries Ltd. Armstrong VNR South Okanagan Shuswap 192
51 Atco Wood Products Fruitvale VNR South Selkirk 121
84 Louisiana Pacific Canada Ltd. Golden VNR South Selkirk 138
394 Tolko Industries Ltd. Heffley Creek VNR South Thompson Rivers 182
112 West Fraser Mills Ltd. Quesnel VNR South Quesnel 113
35 Tolko Industries Ltd. Lumby VNR South Okanagan Shuswap 168
34 B C Veneer Products Ltd Surrey VNR Coast Chilliwack 2.1
478 Richmond Plywood Corp. Ltd. Richmond VNR Coast Chilliwack 108
115 Aspen Planers Ltd. Lillooet VNR South Cascades 134
1044 Harwood Lumber Maple Ridge VNR Coast Chilliwack 0.3
508 CIPA Lumber Co. Ltd. Annacis Island VNR Coast Chilliwack 216
12 Gorman Brothers (Canoe Forest Products Ltd.)
Canoe VNR South Okanagan Shuswap 154
Note: Small mills using less than 25,000 cubic metres of logs per year were also included in the above list.

48
Chip Mills
Only mills that produce wood chips as a primary product are listed in this section.
The annual capacity reported in these tables is estimated based on the same standard operating assumption for each
mill (number and length of shifts and days per year as described below). The actual mill production can be higher or
lower than the estimated capacity, if a mill runs on a different operating schedule than assumed here. Therefore, while
capacity provides guidance on mill output, it is not a measure of the actual production level of the mill. For more
information, please contact [email protected].
Notes:
1. The estimated annual capacity is based on a standardized operation of 240 days per year, two 8-hour shifts per
day. Actual operations may vary from this schedule.
2. Administrative areas and natural resource districts were applied (see Figure 25 for details).
3. The List of Chip Mills is available as an Excel spreadsheet online at
https://www2.gov.bc.ca/gov/content/industry/forestry/competitive-forest-industry/forest-industry-
economics/fibre-mill-information/major-timber-processing-facilities-survey

49
Table 12: Chip Mills - 2019
Mill Number Company Location of Mill Administrative Area
Natural Resource District Estimated Annual Capacity (Thousand BDUs)
1002 BC Ecochips Ltd Okanagan Falls South Okanagan Shuswap 144
252 C & C Wood Products Ltd. Quesnel South Quesnel 4
446 Campbell River Fibre Ltd. Campbell River Coast Campbell River 90
166 Canadian Forest Products Ltd. Prince George North Prince George 552
1 Canadian Forest Products Ltd. Skookumchuk South Rocky Mountain 127
924 Chips Ahoy Fibre Supply Mission Coast Chilliwack 144
1082 Coastland Wood Industries Nanaimo Coast South Island N/A
345 DCT Chambers Trucking Ltd. Chemainus Coast South Island 463
356 East Fraser Fibre Co Ltd. Mackenzie North Mackenzie 220
1013 Karlite Manufacturing Ltd. Cowichan Bay Coast South Island 182
1075 Ledcor Clinton Clinton South 100 Mile House N/A
1000 Ledcor Forest Products Partnership Chilliwack Coast Chilliwack 109
1050 North Island Chipping Ltd. Port McNeill Coast North Island - Central Coast 54
1021 Pacific Bioenergy Quesnel South Quesnel 132
937 Pacific Fibre Port Mellon Coast Sunshine Coast 120
952 River City Fibre Kamloops South Thompson Rivers 553
183 ROC Holdings Terrace North Coast Mountain 91
1083 Teal Cedar Products Ltd Nanaimo Coast South Island N/A
18 Terminal Forest Products Ltd. Langdale Coast Sunshine Coast 34
68 Tolko Industries Ltd. Armstrong South Okanagan Shuswap 38
394 Tolko Industries Ltd. Heffley Creek South Thompson Rivers 96
1001 Valiant Log Sort Ltd. Port Coquitlam Coast Chilliwack 96
409 West Coast Chip Plant Vancouver Coast Chilliwack 236
113 West Fraser Mills Ltd. Quesnel South Quesnel 181

50
Pellet Mills
Mills producing wood pellets for bioenergy are listed in this section.
The annual capacity reported in these tables is estimated based on the same standard operating assumption for each
mill (number and length of shifts and days per year as described below). Actual mill production can be higher or lower
than the estimated capacity, if a mill runs on a different operating schedule than assumed here. Therefore, while
capacity provides guidance on mill output, it is not a measure of the actual production level of the mill. For more
information, please contact [email protected].
Notes:
1. The estimated annual capacity of pellet mills is based on a standardized operation of 345 days per year, three 8-
hour shifts per day. Actual operations may vary from these schedules.
2. Administrative areas and natural resource districts were applied (see Figure 25 for details).
3. The List of Pellet Mills is available as an Excel spreadsheet online at
https://www2.gov.bc.ca/gov/content/industry/forestry/competitive-forest-industry/forest-industry-
economics/fibre-mill-information/major-timber-processing-facilities-survey
‘
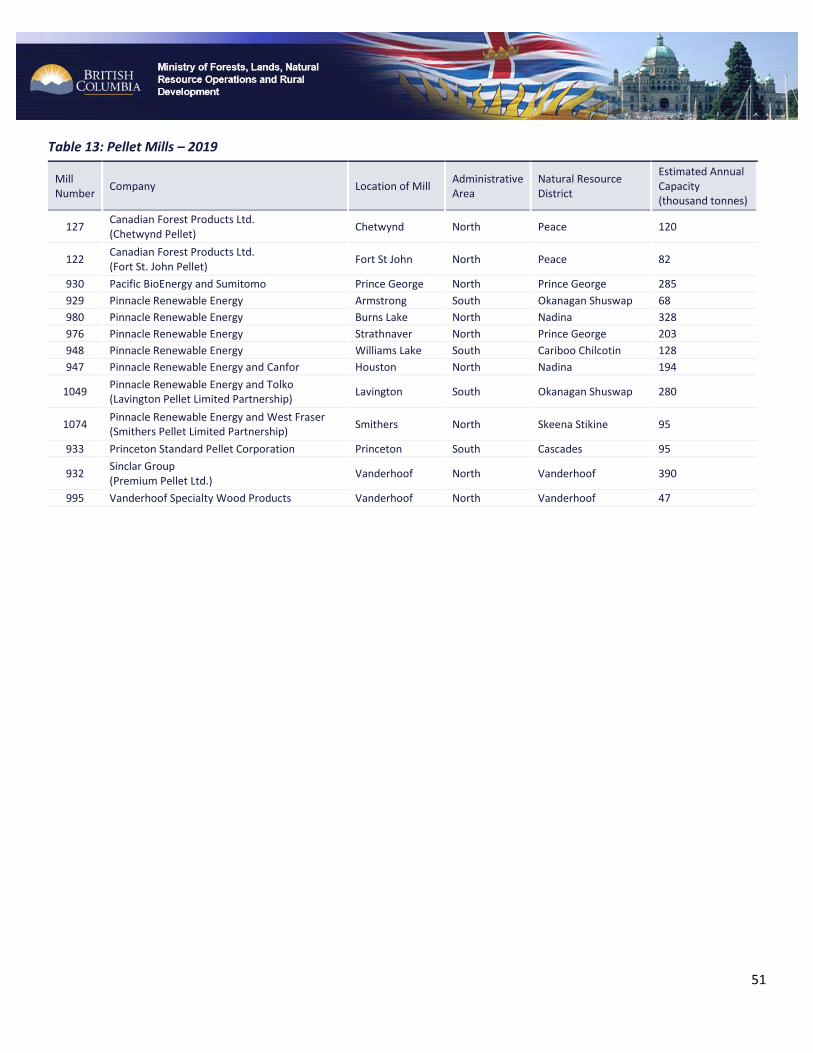
51
Table 13: Pellet Mills – 2019
Mill Number
Company Location of Mill Administrative Area
Natural Resource District
Estimated Annual Capacity (thousand tonnes)
127 Canadian Forest Products Ltd. (Chetwynd Pellet)
Chetwynd North Peace 120
122 Canadian Forest Products Ltd. (Fort St. John Pellet)
Fort St John North Peace 82
930 Pacific BioEnergy and Sumitomo Prince George North Prince George 285
929 Pinnacle Renewable Energy Armstrong South Okanagan Shuswap 68
980 Pinnacle Renewable Energy Burns Lake North Nadina 328
976 Pinnacle Renewable Energy Strathnaver North Prince George 203
948 Pinnacle Renewable Energy Williams Lake South Cariboo Chilcotin 128
947 Pinnacle Renewable Energy and Canfor Houston North Nadina 194
1049 Pinnacle Renewable Energy and Tolko (Lavington Pellet Limited Partnership)
Lavington South Okanagan Shuswap 280
1074 Pinnacle Renewable Energy and West Fraser (Smithers Pellet Limited Partnership)
Smithers North Skeena Stikine 95
933 Princeton Standard Pellet Corporation Princeton South Cascades 95
932 Sinclar Group (Premium Pellet Ltd.)
Vanderhoof North Vanderhoof 390
995 Vanderhoof Specialty Wood Products Vanderhoof North Vanderhoof 47

52
Pole, Utility Pole, and Post Mills
Mills producing poles, utility poles, and posts are listed in this section.
The annual capacity reported in these tables is estimated based on the same standard operating assumption for each
mill (number and length of shifts and days per year as described below). The actual mill production can be higher or
lower than the estimated capacity, if a mill runs on a different operating schedule than assumed here. Thus, while
capacity provides guidance on mill output, it is not a measure of the actual production level of the mill. For more
information, please contact [email protected].
Notes:
1. The estimated annual capacity is based on a standardized operation of 240 days per year, one 8-hour shift per
day, although actual mill operations may vary from this schedule.
2. Administrative areas and natural resource districts were applied (see Figure 25 for details).
3. The List of Pole and Post Mills is available as an Excel spreadsheet online at
https://www2.gov.bc.ca/gov/content/industry/forestry/competitive-forest-industry/forest-industry-
economics/fibre-mill-information/major-timber-processing-facilities-survey

53
Table 14: Post, Utility Pole, and Pole Mills – 2019
Mill Number
Company Location of Mill Product Administrative Area
Natural Resource District
Estimated Annual Capacity (thousand pieces)
498 Aspen Planers Ltd. Merritt PLE South Cascades N/A
250 Nicola Post and Rail Ltd. Merritt PLE South Cascades 120
677 Pacific Inland Pole & Piling Ltd. Nakusp PLE South Selkirk N/A
498 Aspen Planers Ltd. Merritt PST South Cascades 480
390 Box Lake Lumber Prod Ltd Nakusp PST South Selkirk 480
997 Cedar 3 Products McBride PST North Prince George 480
1080 Cedar Valley Specialty Valemount PST North Prince George 5
250 Nicola Post and Rail Ltd. Merritt PST South Cascades 720
739 Panhandle Forest Products Lumberton PST South Rocky Mountain 720
232 Princeton Wood Preservers Ltd Princeton PST South Cascades 960
188 Bell Pole and Lumber ULC Rossland UTI South Selkirk 6
659 Brisco Wood Preservers Ltd. Brisco UTI South Rocky Mountain 24
556 Chinook Forest Products Ltd. Courtenay UTI Coast Campbell River N/A
117 Continental Pole Ltd. Pemberton UTI Coast Sea to Sky 13
40 Gorman Brothers (Lumby Pole)
Lumby UTI South Okanagan Shuswap 29
181 Hampton Lumber Mills Canada Ltd. Burns Lake UTI North Nadina 10
999 Otter Point Timber Ltd. Ladysmith UTI Coast South Island 10
48 Stella Jones Inc. Revelstoke UTI South Selkirk 48
637 Stella-Jones Inc. Prince George UTI North Prince George 48
648 Stella-Jones Inc. Galloway UTI South Rocky Mountain 49
222 Stella-Jones Inc. Haney UTI Coast Chilliwack 18

54
Shake and Shingle Mills
Mills producing shake and shingles are listed in this section.
The annual capacity reported in these tables is estimated based on the same standard operating assumption for each
mill (number and length of shifts and days per year as described below). The actual mill production can be higher or
lower than estimated capacity, if a mill runs on a different operating schedule than assumed here. Thus, while capacity
provides guidance on mill output, it is not a measure of the actual production level of the mill. For more information,
please contact [email protected].
Notes:
1. The measurement unit is thousand roofing squares (thousand squares). A roofing square is approximately 100
square feet.
2. Estimated annual capacity is based on a standardized operation of 240 days per year, two 8-hour shifts per day.
Actual mill operations may vary from this schedule.
3. Administrative areas and natural resource districts were applied (see Figure 25 for details).
4. The List of Shake and Shingle Mills is available as an Excel spreadsheet online at
https://www2.gov.bc.ca/gov/content/industry/forestry/competitive-forest-industry/forest-industry-
economics/fibre-mill-information/major-timber-processing-facilities-survey

55
Table 15: Shake and Shingle Mills – 2019
Mill Number
Company Location of Mill Administrative Areas
Natural Resource District Estimated Annual Capacity (thousand squares)
1026 A.K. Cedar Products Ltd. Abbotsford Coast Chilliwack 3.4
673 Anbrook Industries Ltd. Pitt Meadows Coast Chilliwack 57.6
688 Best Quality Cedar Products Ltd Maple Ridge Coast Chilliwack 132.0
706 Bill Little Contracting Ltd Campbell River Coast Campbell River 2.9
449 Campbell River Shake and Shingle Co Ltd Campbell River Coast Campbell River 22.8
1028 Cape Scott Cedar Products Ltd. Mill Holberg Coast North Island - Central Coast 22.1
1029 Cedar Valley Specialty Cuts Vancouver Coast Chilliwack 4.8
385 Clearbrook Shake & Shingle Ltd. Abbotsford Coast Chilliwack 6.7
1081 Coleman Road Shingle Ltd Port Alberni Coast South Island N/A
315 Comox Valley Shakes (2019) Ltd. Campbell River Coast Campbell River 52.6
638 Confederate Shake & Shingle Ltd. Youbou Coast South Island 19.2
69 Copper Mountain Cedar Products Terrace North Coast Mountain 3.8
1062 G & R Cedar (2009) Ltd. Chilliwack Coast Chilliwack 28.8
587 G & R Cedar Ltd. Matsqui Coast Chilliwack 48.0
399 Goat Lake Forest Products Powell River Coast Sunshine Coast 38.4
1030 Golden Ears Shingle Ltd. Mission Coast Chilliwack 12.5
72 Imperial Shake Co Ltd Maple Ridge Coast Chilliwack 144.0
1071 Island Cedar Products Matsqui Coast Chilliwack N/A
321 J & D Shake and Cedar Mill Ltd. Duncan Coast South Island 72.0
583 Madewell Cedar Inc. Mission Coast Chilliwack 103.2
1033 Pacific Cedar Port Alberni Coast South Island 7.2
1034 Pacific Chalet Ltd. Powell River Coast Sunshine Coast 2.4
1009 Pendragon-Goldwood Industries Ltd Gold River Coast Campbell River 38.4
460 Port McNeill Shake & Shingles (2007) Ltd. Port McNeill Coast North Island - Central Coast 19.2
266 Premium Cedar Products Ltd. Ruskin Coast Chilliwack 91.2
1036 Riverside Shingle Products Ltd. Errington Coast South Island 11.5
455 S & W Forest Products Ruskin Coast Chilliwack 144.0
591 Serpentine Cedar Ltd. Fort Langley Coast Chilliwack 11.5
612 Silver Creek Premium Products Mission Coast Chilliwack 225.6
1061 Star Lumber Canada Ltd. Mission Coast Chilliwack 43.2
1039 Stave Lake Cedar Mills (1992) Inc. Maple Ridge Coast Chilliwack 78.2
902 Taylor Contracting Ltd. Zeballos Coast Campbell River 11.5
585 Teal cedar products Revelstoke South Selkirk 19.2
1070 Valley Cedar Shake Products Ltd. Abbotsford Coast Chilliwack N/A
691 W. Boyes Shake and Shingle Ltd. 150 Mile House South Cariboo Chilcotin 14.4
464 Waldun Forest Products Ltd. Ruskin Coast Chilliwack 187.2