2018 - yearbook - Centre for Affordable Housing Finance Africa
294
HOUSING FINANCE IN AFRICA A review of Africa’s housing finance markets October 2018 Published by the Centre for Affordable Housing Finance in Africa 2018 YEARBOOK
-
Upload
khangminh22 -
Category
Documents
-
view
0 -
download
0
Transcript of 2018 - yearbook - Centre for Affordable Housing Finance Africa

HOUSING FINANCE IN AFRICAA review of Africa’s housing finance markets
October 2018
Published by the Centre for Affordable Housing Finance in Africa
2018YEARBOOK

The Centre for Affordable Housing Finance in Africa
Physical Address: 158 Jan Smuts Ave, Johannesburg, South Africa
Postal Address: PO Box 72624, Parkview, 2122, South Africa
Tel: +27 11 447 9581 | Website: www.housingfinanceafrica.org
Copyright © Centre for Affordable Housing Finance in Africa, 2018. All rights reserved.
The mission of the Centre for Affordable Housing Finance in Africa (CAHF) is to make Africa’s housing finance markets work, with special attentionon access to housing finance for the poor. We pursue this mission through the dissemination of research and market intelligence, supporting cross-sector collaborations and a market-based approach. The overall goal of our work is to see an increase of investment in affordable housing andhousing finance throughout Africa: more players and better products, with a specific focus on the poor. CAHF is a not-for-profit company. Our corefunders are FSD Africa, and Agence Française de Developpement (AfD).
Acknowledgements
This publication represents the combined effort of people from all over the African continent, either as authors, reviewers or organisations sharinginformation. Sincere gratitude is due to everyone involved for their contributions and insights. Individual country and regional profiles were writtenand/or updated by:
71point4 – Jess Robey (eSwatini, SADC region)A5 Consulting – Carlson Ifughe (Cameroon, CEMAC region)Abel K. Walendom (Chad)Alhaji Abdoulie Mattar Touray (The Gambia)Amira Osman (Sudan)Anna-Maria Shija Mugasa (Tanzania)Christian-Lambert Nguena (Central African Republic) Daniel Phiri and Kecia Rust (Zambia)Development Workshop Angola – Allan Cain (Angola)Dr. Grace Lubaale (Somalia)Dr. Moses Muthinja (Eritrea, Djibouti)Dr. Antje Ilberg (Rwanda)Duncan Kayiira (Burundi, South Sudan, Uganda, EAC region)Econo-Markets Consultancy – Montle Phuthego (Botswana)Federico Cabrillo (Mozambique)Frank Nkulu Mulunda Banze (Gabon)GTM Africa Investment Holdings – Aqualine Suliali (Mauritania,Zimbabwe)Hansa Helli (Morocco)Harris Harjan (Comoros, Mauritius, Seychelles)Jean Philippe Ado (Congo Republic)
Jess Robey and Joy Juwaheer (Madagascar)Jess Robey and Laverne Buya-Kamara (Sierra Leone)Jess Robey and Patrick Chikoti (Malawi) Joachim Boko (Benin, Mali, Togo)Alison Tshangana and Kecia Rust (South Africa)Kecia Rust and Dr Moses Muthinja (Kenya)Kgomotso Tolamo (Equatorial Guinea)Leon Katambwe (DRC, Guinea Bissau)Mathew Ndote (Liberia)Mikhaela Donaldson (Cabo Verde, Sao Tome and Principe) Prime-Stat SVC Ltd - Kwadwo Ohene Sarfoh, Joseph Ayitio, SamuelBiitir Banle and Godwin Kavaarpuo (Ghana) Roland Igbinoba (Nigeria)S&M Consulting Services – Mathabo Makuta (Lesotho)Shakrah Sadou (Burkina Faso, Côte d’Ivoire, Niger, Libya, Senegal,UEMOA region)Sireena Ramparsad (Namibia)Tesfalem Tesfaye (Ethiopia)Youssouf Keita (Guinea)Zeinab Sayed (Egypt and North Africa region)
To this growing team of housing finance experts, we are grateful for your insights and enthusiasm for this project, and very happy to have you allas part of our team. The Yearbook would not have been possible without your input.
Thanks are extended to the CAHF team for their tireless work: Jean Philippe Ado, Raisa Cole, Thandiwe Dhlamini, Vanessa Khosa, Miriam Maina,Nonhlanhla Mathibela, Kuda Mativenga, Manitha Nadasan, Alfred Namponya, Pamela Lulama Nqini, Venolia Rabodiba, and Juliette Rey. Alison Tshanganaand Olivier Vidal edited the English and French versions respectively, while Kecia Rust wrote the overview essay.
Further thanks are extended to those who assisted in providing inputs and information or reviewing profiles: Keith Lockwood, David Gardner,Sireena Ramparsad, Seeta Shah, Benedito Murambire (FSD Mozambique), Chii Akporji (Nigeria Mortgage Refinance Company), Vidhee Garg(Affordable Housing Institute), Emma Harrington (Reall) and Abdelkader Benbrahim (African Development Bank).
Layout and production:
June Wegerle, June Viljoen Print Consultancy | +27 11 700 3850
Copyediting:
Janet Wilhelm and Reg Rumney
The opinions expressed in this Yearbook are those of the authors and do not necessarily reflect the official position of CAHF’s funders. Any
errors of omission or interpretation remain with the Centre for Affordable Housing Finance in Africa. We welcome your comments:
Alison Tshangana, Email: [email protected]

1
Cities are complex systems, and across Africa, are growing at a rapid rate unprecedented in
urban history. The agglomeration of activity offers an incredible opportunity for
development. At the same time, the confluence of efforts to promote financial inclusion,
urban development, infrastructure investment, and macroeconomic policy attention create
a uniquely enabling environment for the growth of housing in particular. Examples of
innovation can be found along each link in the housing value chain, as government, the
private sector, households and communities find their places in the housing ecosystem.
In 2018, we can see:
n Innovative land readjustment strategies that maximise the opportunity to be
found in existing well-located land, supporting improved land assembly.
n Blockchain technology that is making land titling a reality in many markets.
n Improved track records in public private partnerships that bring together private
sector capacity with public land holdings to service land and make it accessible to low
income earners.
n Inner city refurbishments and backyard rental that maximise urban
infrastructure, sidestepping municipal constraints that hinder greenfields housing
development.
n The development of smaller, more affordable units for entry-level homebuyers. The cheapest unit built by a private developer in 2018 was a 16m2 bedsitter,
costing US$11 500, in Kenya.
n The growth and development of mortgage loan products that recognisemarket niches: incremental housing construction, borrowers with informalincomes, green housing, and entry-level resale.
n Technological innovation that connects the links in the housing supply chain to
support more effective, household-level home improvements.
n Local, niche market innovations that are creating replicable examples of
sustainable, affordable housing markets.
Each of these innovations is identifying a market niche and then working with the
opportunities provided by new technologies, adaptive experience, and entrepreneurial
curiosity to develop real products and services that are essentially creating brand new
markets. Innovation along the value chain and at the local level is making headway and
creating precedent that is bankable.

2
The 9th edition of the Housing Finance in Africa Yearbook covers 54 African countries and five regions – produced in both English and French versions.Targeted at housing finance practitioners, investors, developers, researchers and government officials, the 2018 Yearbook provides an up-to-date review ofpractice and developments in housing finance and delivery in Africa, reflecting the dynamic change and growth evident in the market of each country overthe past year. By highlighting the potential investment opportunities available in each country context, the Yearbook helps practitioners find one anotheras they strive to participate in, and advance, the sector.
While the general aim of the Yearbook is to offer a broad overview of housing finance and housing development in Africa linked to local contexts, specialemphasis is placed on the key challenge of housing affordability and access to finance at the low end of the market. These profiles emphasise the criticalneed for housing and housing finance solutions that are explicitly targeted at the income profiles of the majority of the population, for whom mostcommercially-developed residential property is out of reach. That is what makes this publication unique: no other source provides this type of updatedinformation, focused on residential property, and targeted at the affordable market.
This year we have refined our approach to ensure more rigorous citations underpinning the information in each profile, to allow readers to understandthe available data sources and locate those references should they require further details. The emphasis this year is on local datasets and initiatives to buildlocal databases of information for each of the 54 countries. Invariably, some information had to be sourced from international datasets, given that somecountries still face a serious challenge with regard to publicly available data on property markets and housing finance.
Across this continent, the general lack of reliable, available data stunts market growth and, too often, drives investment away. This lack of available updatedinformation in many African countries is exactly why we produce this publication. By providing a source of reliable market intelligence into the sectorthrough the publication of the Yearbook, CAHF aims to boost the affordable housing and housing finance markets. The goal of all CAHF’s work is to seean increase in investment in affordable housing and housing finance throughout Africa: more players and more responsive products, with a specific focuson the poor.
While the Yearbook is largely a desktop study, the approach uses in-country expertise and technical surveys. Using CAHF’s research as baseline material,further information on more recent developments was accessed from media reports, practitioner websites and CAHF’s wide networks. In some instances,primary research was undertaken by in-country industry experts. Of course, the Yearbook is not comprehensive; however, it is intended as an introductionand broad overview, to spark interest for more in-depth investigation into housing and housing finance markets in African economies.
The publication is thus a work in progress, and input from readers on its usefulness, suggestions, corrections and additions, are all welcome. CAHF invitesreaders to provide comment and share their experiences on what they are doing in housing finance in Africa. We aim to make the Yearbook an inclusive,relevant and accurate source of on-the-ground intelligence on housing and housing finance markets.
At the same time, we recognise that the Yearbook cannot include everything. For this reason, CAHF releases further information electronically throughoutthe year on its website www.housingfinanceafrica.org – including articles on country developments and interactive dashboards allowing comparison acrosscountries. Examples include: our Mortgage Affordability Calculator which calculates mortgage and housing affordability in Africa using data obtained fromthe Yearbook process, and our Housing Finance Laws and Policies in Africa dashboard which is a useful resource for understanding the respective regulatoryenvironments that influence the health of housing finance markets in each country.
We hope the Yearbook proves a valuable resource and look forward to hearing from you.
Alison Tshangana, EditorCentre for Affordable Housing Finance in AfricaEmail: [email protected] 2018
Foreword

3
Africa Housing Finance Yearbook 2018
Overview 11Explaining the indicators 36Regions 40
Central Africa 40East Africa 44North Africa 48Southern Africa 52West Africa 56
Country profiles 61Algeria 61Angola 65Benin 69Botswana 73Burkina Faso 77Burundi 81Cabo Verde (Cape Verde) 85Cameroon 89Central African Republic 93Chad 97Comoros 101Congo Republic 105Cote d' Ivoire 109Democratic Republic of Congo 113Djibouti 117Egypt 121Equatorial Guinea 125Eritrea 129eSwatini 133Ethiopia 137Gabon 141The Gambia 145Ghana 149Guinea 153Guinea-Bissau 157Kenya 161Lesotho 165Liberia 169Libya 173Madagascar 177Malawi 181Mali 185Mauritania 189Mauritius 193Morocco 197Mozambique 201Namibia 205Niger 209Nigeria 213Rwanda 217São Tomé and Príncipe 221Senegal 225Seychelles 229Sierra Leone 233Somalia 237South Africa 241South Sudan 245Sudan 249Tanzania 253Togo 257Tunisia 261Uganda 265Zambia 269Zimbabwe 273
Contents

4
AbbreviationsBBD Benin Development Bank
BBS Botswana Building Society
BCA Banco Comercial do Atlântico
BCB Bank Credit Bujumbura, Burundi
BCC Central Bank of Comoros
BCC Congolese Central Bank
BCDC Banque Commerciale du Congo
BCDF Bureau communal du domaine et du foncier (Communal Domain and Land Bureaus)
BCEAO Banque Centrale Des Etats de l’Afrique de l’Ouest
BCIMR Banque pour le Commerce et l'Industrie – Mer Rouge, Dijoubiti
BCM Central Bank of Mauritania
BCR Bank Commerciale du Rwanda
BCRG Central Bank of the Republic of Guinea
BCEAO Banque Centrale des États de l' Afrique de l'Ouest(Central Bank of West African States)
BCSTP Central Bank of Sao Tome and Principe
BCV Banco de Cabo Verde
BDM Banque de Development du Mali
BEA Banque El Ammane pour le Developpement de l’Habitat
BEA Banque Exterieure d’Algerie
BEAC Banque des Etats d’Afrique Centrale (Bank of Central African States), Cameroon
BESA Banco Espirito Santo Angola
BFA Banco de Fomento, Angola
BFI Banks and Financial Institutions
BFM Banky Foiben’i Madagasikara, Madagascar
BFV-SG BFV-Société Générale
BGD Gabonese Development Bank
BGF Bank Financing and Management, Burundi
BHB Benin Housing Bank
BHBF Housing Bank of Burkina Faso (Banque de l’Habitat du Burkina Faso)
BHC Botswana Housing Corporation
BHC Bank for Housing and Construction, Ghana
BHM Banque de l'Habitat du Mali (Mali Housing Bank)
BHR Banque de l’Habitat du Rwanda (Rwanda Housing Bank)
BHS Banque de l'Habitat du Senegal
BHT Banque de l’Habitat du Tchad
BIAC Banque Internationale pour l’Afrique au Congo
BIAT Arab Bank of Tunisia
BIC Banco Internacional de Crédito BICIA-BBanque Internationale pour le Commerce, l’Industire etl’Agriculture du Burkina, Burkina Faso
BICIGUI Banque Internationale pour le Commerce et l’Industrie de Guinée
BIM Banque Internationale du Mali
BIMR Banque Indosuez Mer Rouge
BIP Bank for Innovation and Partnership, BIP
BISTP Banco Internacional de São Tomé e Príncipe
BK Banque de Kigali (Bank of Kigali), Rwanda
BMOI Banque Malgache de L'ocean Indien, Madagascar
BMS Banque Malienne de Solidarité
BNA Banco Nacional de Angola
BNA Banque Nationale d’Algerie
BNDA Banque Nationale de Developpement Agricole
BNDE National Bank for Economic Development, Burundi
BNG Building New Ground, South African housing programme
AADL Lease to own programme, Algeria
AAHDE Addis Ababa Housing Development Enterprise
ACF African Capitalisation Fund, Malawi
ACI Agence de Cession Immobilière (Land Development Agency), Mali
ACSI Amhara Credit & Savings Institution, Ethiopia
ACTB A Call to Business, Sierra Leone
ADC Arrêté de Consession Definitive, Cote d’Ivoire
ADEHASO Association pour le Développement de Habitat Social, Guinea
AFD Agence Française de Développement (French Development Agency)
AfDB African Development Bank
AFH Agence Foncière d’Habitation’, Tunisia
AFRICOM Africa Command, Djibouti
AFT Agenda for Transformation, Liberia
AGETIP Agence de Gestion des Travaux d’Intérêt Public, Benin
AGETU Agency for the Equipment of Urban Land (Agence d’Equipement des Terrains Urbains), Togo
AGOA African Growth and Opportunity Act
AH Amiscus Horizon company, The Gambia
AIB African Investment Bank
ALCB African Local Currency Bond Fund
AMU Arab Maghreb Union
AMT Akiba Mashinani Trust
ANALOGH Agence Nationale d’Appui au Logement et al’Habitat,Madagascar
ANAMIF Central Bank of the Republic of Guinea (BCRG) and the NationalAgency for Microfinance
ANAT National Land Development Agency, Mauritania
ANC African National Congress, South Africa
ANCFCC Agence Nationale de la Conservation Foncière, du Cadastre et dela Cartographie, Tunisia
ANDF National Agency for Domain and Land (Agence nationale du domaine et du foncier), Benin
ANGT Agence National de Grand Travaux, Gabon
ANUTTC Agence National de l’Urbanisme, des Travaux Toppographique etdu Cadastre, Gabon
APBEF Association professionnelle des banques et établissementsfinanciers du Mali
APIM Association des promoteurs immobiliers du Mali
APIMA Angolan Association of Real Estate Professionals
APIP Agence pour la Promotion des Investissements Privés, Guinea
ARRU Agency for Urban Rehabilitation, Tunisia
ASODEV Action pour la Solidarité et le Développement, DRC
ASSOAL Solidarity Actions of Support to Organisations SupportingFreedom, Cameroon
ATM Automated teller machine
ATUSWA Amalgamated Trade Union of Swaziland
AU African Union
AU-STC no.8 African Union Specialized Technical Committee no.8 on PublicService, Local Government, Urban Development andDecentralization
BAD Algerian Bank of Development
BaDEx Bonds and derivatives exchange
BADR Banque de l’Agriculture et du Developpement Rural, Algeria
BAI Banco Africano de Investimento
BAIC Banque africaine pour l’investissement et le commerce
BANCOBU Commercial Bank of Burundi
BASE Banking Association of South Africa
BBCI Burundi Bank for Commerce and Investment

5
Africa Housing Finance Yearbook 2018
BNR National Bank of Rwanda
BOA Bank of Africa
BOAD Banque Ouest Africaine de Développement(West African Development Bank)
BoG Bank of Ghana
BoM Bank of Mauritius
BoN Bank of Namibia
BOT Build, operate and transfer model
BoT Bank of Tanzania
BoZ Bank of Zambia
Bpd Barrels-per-day
BRB Bank of the Republic of Burundi
BRD Banque Rwandaise de Développement (Rwanda Development Bank)
BSB Botswana Savings Bank
BSCA Sino-Congolese Bank for Africa
BSIC Sahelo-Saharan Bank for Commerce and Investment
BSL Bank of Sierra Leone
BTCGA Banco Totta Caixa Geral Angola
BTD Togolese Development Bank
BTCI Banque Togolaise pour le Commerce et l’Industrie
BUCECO Burundi Cement Company
BVMAC Bourse des Valeurs Mobilieres deL’Afrique Centrate, Tunisia
BVMT Tunisian stock exchange
CABS Central African Building Society, Zimbabwe
CAGR Compound Annual Growth Rate
CAMCCUL Cameroon Cooperative Credit Union League
CAPEC Savings and Cooperative Union, Mauritania
CAPMAS Central Agency for Public Mobilization and Statistics
CAR Central African Republic
CBB Construction and Business Bank, Ethiopia
CBE Central Bank of Egypt
CBE Commercial Bank of Eritrea
CBE Commercial Bank of Ethiopia
CBG Central Bank of The Gambia
CBK Central Bank of Kenya
CBL Central Bank of Lesotho
CBL Central Bank of Liberia
CBL Central Bank of Libya
CBN Central Bank of Nigeria
CBOS Central Bank of Sudan
CBR Central Bank Rate
CBR Correspondent Banking Relationships
CBS Central Bank of Somalia
CCI Centre for Community Initiatives, Tanzania
CCL Centre for Housing Construction (Centre de la Construction et du Logement), Togo
CCODE Centre for Community Organisation and Development, Malawi
CDMH Compte de Mobilisation pour l’Habitat, Cote d’Ivoire
CDN Crédit du Niger (a commercial bank in Niger)
CDS City Development Strategy
CEGECI Centre for the Management of Cities(Le Centre de Gestion des Cités)
CEMAC Communauté Économique et Monétaire de l'Afrique Centrale (Economic and Monetary Community of Central Africa, EMCCA)
CENFRI Centre for Financial Regulation and Inclusion
CEN-SAD Community of Sahelo-Saharan states
CFA francs Communauté Financière Africaine (currency in West Africa)
CFM Construction Finance Mortgage, Sierra Leone
C-GIDD Canback Global Income Distribution Database
CGAP Consultative Group to Assist the Poor
CGD Dreal Group
CHF Common Humanitarian Fund
CIASA Microfinance Unit, Credit and Information Scoring Agency
CIF Climate Investment Fund, Madagascar
CIF Land registration certificate, Djibouti
CIS Collective Investment Schemes
CLIFF Community Led Infrastructure Funding Facility
CMA Common Monetary Area
CMCA Crédit Mutuel de Centrafrique
CMH Companhia Mocambicana de Hidrocarbonetos
CMP Common Market Protocol
CMU Couverture Maladie Universelle (universal health coverage)
CMS Credit Mutuel du Senegal
CNEC Caisse Nationale d'Epargne et de Crédit de Djibouti
CNEL Savings and Loans Bank, Tunisia
CNEP Caisse National d’ Épargne de Prévoyance (National Savings andProvidence Fund – one of the state-owned banks), Algeria
CNL Caisse Nationale Du Logement, Algeria
CNSS National Social Security Fund, Togo
CNT Confederation Nigerienne du Travail
CNTB National Commission on Land and Other Assets
CNTG National Confederation of Guinea Workers
COBAC Commission Bancaire d'Afrique Centrale (Central African Banking Commission)
CoK City of Kigali
CofO Certificate of Occupancy, Nigeria
COMESA Common Market for Eastern and Southern Africa
COSUMAF Commission de Surveillance du Marché Financier de l'AfriqueCentrale
CPA Comprehensive Peace Agreement, South Sudan
CPEC Caisse Populaire d'Epargne et de Crédit, Dijibouti
CPI Corruption Perceptions Index
CPI Construction Price Index
CPI Consumer Price Index
CPIA Country Performance and Institutional Assessment, World Bank
CPLP Comunidade dos Países de Língua Portuguesa / Community of Portuguese Speaking Countries
CPS Contribution Pension Scheme
CRB Credit Reference Bureau, Ghana, Malawi, South Sudan, SierraLeone and Zambia
CREFOGA Credit Foncier of Gabon
CREPMF Conseil Regional de l’epargne publique et des marches financiers(Regional Council of Savings Public and Financial Markets)
CRG Central Bank of Guinea
CRI Collateral replacement indemnity
CRJE China Railway Jianchang Engineering
CRRH Caisse Regionale de Refinancement Hypothecaire (Regional Mortgage Refinance Fund), WAEMU
CRRH-UEMOA Caisse Regional de Refinancement Hypothecaire-UEMOA
CRM Retirement Fund of Mali
CRS Corporate Social Responsibility Fund
CRT Togolese Pension Fund
CSPM Construction Stage Payment Mortgage, Sierra Leone
CTA Construction technical assistance
CVE Cabo Verdean Escudo
DAHSP Decent and Affordable Housing Subsidy Programme

6
DBN Development Bank of Namibia
DBI World Bank’s Doing Business Indicators
DFI Development Finance Institution
DFID Department for International Development
DID Développement International Desjardins
DISED National Department of Statistics and Population Studies, Djibouti
DNHU National Directorate for Housing and Urbanization
DRC Democratic Republic of Congo
DTI Debt to Income ratio
DUAT Direito de Uso de Aproveitamento da Terra (right to use and benefit from land), Mozambique
EAC East African Community
EAMU East African Community Monetary Union
EBH Elgin, Brown & Hamer, Namibia
EBS Electronic Banking Services company
ECAM Enquête Camerounaise auprès des Ménages, or Householdsurvey, Cameroon
ECB European Central Bank
ECF Enhanced Credit Facility
ECF Extended Credit Facility
ECOSAT Encadrement des Constructions sociales et aménagement desterrrains, (Framework for social engineering and landmanagement), Burundi
ECOWAS Economic Community of West African States
EDH Enterprise Development Holdings
EDPRS Economic Development and Poverty Reduction Strategy, Rwanda
EEDC Egypt Economic Development Conference
EFINA Enhancing Financial Innovation & Access
EFSA Egyptian Financial Supervisory Authority
EGTI Empresa Gastora de Terrenos Infra-estruturados
EHFC Egyptian Housing Finance Company
EIB European Investment Bank, Madagascar
EITI Extractive Industries Transparency Initiative
EIU Economic Intelligence Unit
eMI Engineering Ministries, Congo
EMRC Egyptian Mortgage Refinance Company
EMSL Ecobank Micro Finance Institution, Sierra Leone
ENDE National Strategy for Development
EPS Expanded Polystyrene
EPZ Export processing zones
ERN Eritrean Nakfa
EU European Union
EUR Euro
FAEU Fonds d'Amenagement et d'Equipement Urbain (Urban Development and Equipment Fund), Burundi
FAMF Federação das Associações de Microfinanças em Cabo Verde
FAMI PICOS Associação de Apoio às Iniciativas de Autopromoção Familiar
FBS Finance Building Society
FDH Housing Fund, Djibouti
FDI Foreign direct investment
FCPB La Faitiere des Caisse populaires, Burkina Faso
FECECAM Fédération des Caisses d’Epargne et de Crédit Agricole Mutuel
FEDEP Federal Urban Poor
FES Swaziland National Fire and Emergency Services
FFH Fundo de Fomento de Habitação (Housing Promotion Fund), Mozambique
FFH Housing Development Fund
FGCMPI Real Estate Development Guarantee Fund, Algeria
FGH Mortgage Guarantee Fund
FGHM Fonds de Garantie Hypothecaire du Mali (Mali Mortgage Guarantee Fund)
FGL Fonds de Garantie pour le Logement, Gabon
FGS Federal Government of Somalia
FHA Federal Housing Authority, Nigeria
FHC Federal Housing Corporation
FHRL FMBN Home Renovation Loan
FHSE Foundation for Rural Housing, Uganda
FINCA Foundation for International Community Assistance
FIP Finance and Investment
FLISP Finance Linked Individual Subsidy Programme, South Africa
FMBN Federal Mortgage Bank of Nigeria
FMO Nederlandse Financierings-Maatschappij voor Ontwikkelingslanden (Netherlands Development Finance Company)
FNB First National Bank
FNFI National Inclusive Finance Fund(Fonds National de la Finance Inclusive), Togo
FNHU National Fund for Habitat and Urban Planning, Guinea
FNM National Microfinance Fund, Congo
FOGARIM Guarantee Fund for mortgages for low or seasonal income groups,Morocco
FONERWA Rwanda’s Green fund
FOPROLOS Fonds pour la Promotion des Logements aux Salariés
Forex Foreign exchange
FPHU Fund for the Promotion of Urban Housing, Burundi
FSC Financial Sector Charter, in South Africa and Namibia
FSDH Special Fund for Housing Development (Fonds Special de Developpement de l’Habitat), Togo
FSDIP Financial Sector Development Implementation Plan
FSDP Financial Sector Development Program, Rwanda
FSH Fonds de Soutien à l’Habitat (Fund for housing support)
FSH Mortgage Securitization Fund
FSL Funded by ARC International and Micro Africa Limited
FSP Financial Service Providers, Niger
FSRA Financial Services Regulatory Authority
FSVs Forced sale values
FTA Free Trade Area
FUCEC Faîtière des Unités Coopératives d’Epargne et de Crédit, Togo
FVIT Low Real Estate Value - Faible Valeur Immobilière Totale -programme
GARI Fonds Africain de Garantie des Investissements Privés en Afriquede l’Ouest
GBS Gambia Bureau of Statistics
GDP Gross domestic product
GELIS Ghana Enterprise Land Information
GH₵ Ghanaian Cedi
GHL Ghana Home Loans
GICA Groupe Industriel des Ciments d’Algérie
GIPF Government Institutions Pension Fund
GIZ Deutsche Gessellschaft für Internationale Zusammenarbeit (GermanSociety for International Cooperation)
Global Findex Global Financial Inclusion Database
GLS Government Loan Scheme
GNDI Gross National Disposable Income
GNI Gross National Income
GNC General National Congress, Libya
GOAC Guernsey Overseas Aid Commission

7
Africa Housing Finance Yearbook 2018
GoG Government of Guinea
GoM Government of Morocco
GoTG Government of The Gambia
GRET Groupe de Recherches et d’Échanges Technologiques,Mauritania
GREDA Ghana Real Estate Developers Association
GRI Global Real Estate Institute
GSF Guarantee and Subsidy Fund, Egypt
GSMA Groupe Speciale Mobile Association
GTP Growth and Transformation Plan, Ethiopia
GVA Gross value add
HBS Household Budget Survey
HCBE Housing and Commerce Bank of Eritrea
HCF Housing Finance Company, Seychelles
HCP Haut Commissariat au Plan, Guinea
HDA Housing Development Agency, South Africa
HDI Human Development Index
HDR Human Development Report
HFB Housing Finance Bank, Uganda
HFC Home Finance Company of the Gambia Limited
HFC Home Finance Company, Sierra Leone
HFC Housing Finance Company
HFCU Housing Finance Company of Uganda
HfH Habitat for Humanity
HfHI Habitat for Humanity International
HfHU Habitat for Humanity, Uganda
HFP Housing Finance Project
HIB Housing and Infrastructure Board, Libya
HIFSA Old Mutual’s Housing Impact Fund, South Africa
HIV/AIDS Human Immunodeficiency Virus / Acquired Immune DeficiencySyndrome
HMCS His Majesty's Correctional Services, Swaziland
HMF Housing microfinance
HMFF Housing Microfinance Fund
HOFINET Housing Finance Information Network
HSB Housing and Savings Bank, Ethiopia
HSDB Human Settlements Development Bank, South Africa
HRC Human Rights Council
HRW Human Rights Watch
HUD Sub-Committee on Human Settlement and Urban Development,Lesotho
IAS International Accounting Standards
IBS International Bank of Somalia
ICF Investment Climate Facility
ICT Information and Communications Technology
IDA International Development Association
IDB Islamic Development Bank
IDBZ Infrastructure Development Bank of Zimbabwe
IDP Internally Displaced Person
IFAD International Fund for Agricultural Development
IFC International Finance Corporation
IFH Imobiliaria Fundiaria e Habitat (Social Housing Company)
IFRS International Financial Reporting Standards
IGAD Intergovernmental Authority on Development
IGC International Growth Centre
IHDP Integrated Housing Development Programme, Ethiopia
IHP Institutional Housing Project, Swaziland
IHPS Integrated Household Panel Survey, Malawi
IHS International Housing Solutions
ILMIS Integrated Land Management Information System
IMF International Monetary Fund
INE National Statistics Institute
INEP Instituto Nacional de Estudos e Pesquisa National Institute forStudies and Research
INPS National Institute of Social Welfare, Mali
INSS National Social Security Institution, Burundi
IOG Ismail Omar Guelleh (Foundation)
IOM International Organization for Migration
IOR-ARC Indian Ocean Rim Association for Regional Cooperation
IOSCO International Organisation of Securities Commissions
IPS Instalment Purchase Scheme
IRS Integrated Resort Scheme, Mauritius
ISKAN National Land Development, Housing Development and RealEstate Promotion and Management Corporation, Mauritania
KBA Kenya Bankers Association
KBA-HPI Kenya Bankers Association's Housing Price Index
KBRR Kenya Banks’ Reference Rate
KCB Kenya Commercial Bank
KfW Kreditanstalt für Wiederaufbau (German Reconstruction Loan Corporation)
KNBS Kenya National Bureau of Statistics
KSHDF Khartoum State Housing and Development Fund
KYC Know Your Customer, South Sudan
LAA Land Administration Authority
LAP Land Administration Project
LAVIMS Land Administration Valuation and Information ManagementSystem
LBDI Liberian Bank for Development and Investment
LDC Least developed country
LEDFC Liberia Enterprises Development Finance Company
LEL Livret d’épargne lodgement, Algeria
LEP Livret d’épargne populaire, Algeria
LFS Labour Force Survey, Liberia
LHLDC Lesotho Housing and Land Development Corporation
LIC Low income country
LIS Lands Information system
LISGIS Institute of Statistics and Geo-Information Services, Liberia
LLO Local Land Offices, Madagascar
LNBTP National Laboratory and Public Works, Gabon
LNG Liquefied Natural Gas
LOUAF Loi d’Orientation sur l’Urbanisme et l’Aménagement Foncier,Niger
LPA Commercial housing, Algeria
LPB Lesotho Post Bank
LPL Public rental housing, Algeria
LPP Logement Public Promotionnel, the assisted housing programme,Algeria
LSC Land, Services and Citizenship, Ghana
LTV Loan-to-value (ratio)
LUSE Lusaka Stock Exchange
LWF Lutheran World Federation
MASOWE Maseru South West
MCA Millennium Challenge Account, Lesotho
MCB Mauritius Commercial Bank
MCC Millennium Challenge Corporation, Sierra Leone

8
NBS National Building Society, Zimbabwe
NBS New Building Society, Malawi
NBM National Bank of Malawi
NCR National Credit Regulator
NDB National Development Bank
NDP National Development Plan
NDP National Development Plan, Chad
NDP4 4th National Development Plan, Namibia
NDP11 11th National Development Plan, Botswana
NEF National Empowerment Foundation, Mauritius
NEMA National Environmental Management Authority, Kenya
NESDP National Economic and Social Development Plan
NFHR National Fund for Housing and Reconstruction
NGO Non-governmental organisation
NHA National Housing Authority, Zambia
NHA National Housing Authority, Liberia
NHAC National Housing Advisory Committee
NHAG Namibian Housing Action Group
NHBT National Housing Bond Trust, Zambia
NHC National Housing Corporation, Kenya and Tanzania
NHCC National Housing and Construction Company
NHDC National Housing Development Company, Mauritius
NHE National Housing Enterprise, Namibia
NHF National Housing Fund, Gabon
NHF National Housing Fund, Nigeria
NHFC National Housing Finance Corporation
NHP National Housing Programme, Egypt
NHS National Housing Strategy
NHSDP National Housing Sector Development Policy
NIDP National Indicative Development Plan
NIESV Nigerian Institute of Estate Surveyors and Valuers
NIMP National Infrastructure Master Plan
NIPA National Investment Promotion Agency
NIPC Nigeria Investment Promotion Commission
NLC National Land Commission Kenya
NMB National Microfinance Bank, Tanzania
NMRC Nigerian Mortgage Refinance Corporation
NOCAL National Oil Company of Liberia
NOCIBE Nouvelle Cimenterie du Bénin – NOCIBE)
NPL Non-performing loan
NREC National Real Estate Company
NRIS National Registration and Identification System
NSDP National Strategic Development Plan, Lesotho
NSA Namibia Statistics Agency
NSIA Nigeria Sovereign Investment Authority
NSSA National Social Security Authority, Zimbabwe
NSSF National Social and Security Fund, Uganda
NST National Strategy for Transformation, Rwanda
NUA New Urban Agenda
NUCA New Urban Communities Authority, Egypt
OAD Banque Ouest Africaine de Développement (West African Development Bank)
OBM Opportunity Bank of Malawi
ODA Official development assistance
ODOC Operation Domaniale Concerted, Madagascar
OHADA Organisation for the Harmonisation of Business Law in Africa
MCIB Public Credit Bureau, Mauritius
MDG Millennium Development Goal
MDGS III Malawi Growth and Development Strategy
MDI Microfinance Deposit-taking Institution
MENA Middle East and North Africa Region
MFB Microfinance banking
MFC Mortgage Finance Company
MFE Microfinance Establishments
MFF Mortgage Finance Fund
MFI Microfinance Institution
MFSDS Financial Sector Development Strategy 2013–2022, Mozambique
MGC Matekane Group of Companies
MHC Malawi Housing Corporation
MHC Mauritius Housing Company
MHDP Mass Housing Development Programme
MHID Ministry for Housing and Infrastructure Development, Zambia
MHPV Ministère de l’Habitat et de la politique de la ville, Guinea
MHU Ministry of Housing and Urban Development, Algeria
MHU Ministry of Housing and Utilities, Libya
MIH Ministry of Infrastructure and Housing
MINDAF Ministry of State Property and Land Tenure, Cameroon
MININFRA Rwanda Ministry of Infrastructure
MIX Microfinance Information Exchange
MLF Mortgage Liquid Facility
MLSP Mass Land Servicing Programme
MLWE Ministry of Lands, Water and the Environment, Eritrea
MMA Mobile money agent
MMC Maseru Municipal Council
MMF Money market fund
MMM Maison Marocaine Moderne
MoHS Ministry of Housing and Settlements, Algeria
MOLG/MOLGC Ministry of Local Government and Chieftainship, Lesotho
MoPED Ministry of Planning and Economic Development, Sierra Leone
MOPH Ministério das Obras Públicas e Habitação, Mozambique
MOU Memorandum of Understanding
MPD Movement for Democracy
MPR Monetary Policy Rate
MRLGHD Ministry of Regional and Local Government, Housing and RuralDevelopment
MSB Malawi Savings Bank
MSMEDF Micro Small and Medium Enterprises Development Fund, Nigeria
MTB Money Transfer Business
MTEF Medium Term Expenditure Framework
MTO Money Transfer Operators
MTSP Money Transfer Service Provider
MUCODEC Mutuelle Congolaise d'Epargne et de Crédit(Congolese Savings and Loans Mutual)
MWFL Mortgage Warehouse Funding Limited
NACHU National Cooperative Housing Union, Kenya
NAMFISA Namibia Financial Institution Supervisory Authority
NAPSA National Pension Scheme Authority, Zambia
NASSIT National Social Security and Insurance Trust, Sierra Leone
NASSCORP National Social Security and Welfare Corporation
NBFIRA Non-Banking Financial Institution Authority, Botswana, Ghana
NBBL Norwegian Federation of Co-operative Housing Associations
NBE National Bank of Ethiopia
NBS National Bureau of Statistics

9
Africa Housing Finance Yearbook 2018
RTGS Real Time Gross Settlement
SACCO Savings and Credit Co-operative
SACU South African Customs Union
SADC Southern African Development Community
SALHOC Sierra Leone Housing Corporation
SANEF Shared Agent Network Expansion Facilities
SAPES Scheme to Attract Professionals for Emerging Sectors, Mauritius
SARB South African Reserve Bank
SBM State Bank of Mauritius
SBS Swaziland Building Society
SDFN Shack Dwellers Federation of Namibia
SDGs Sustainable Development Goals
SDI Shack / Slum Dwellers International
SEC Securities and Exchange Commission, Ghana
SEIMAD Madagascar include Societe d’Equipement Immobilierde Madagascar
SEM Stock Exchange of Mauritius
SETU Societe d’Equipement des Terrains Urbains (Society of Urban Land Equipment), Togo
SEZs Special Economic Zones, Congo republic
SGBB Societe Generale de Banque au Burkina
SGBG Société Générale des Banques en Guinée
SHA Smart Homes Africa
SHC State Housing Company, Ghana
SHDC Seychelles Housing Development Corporation
SHHA Self Help Housing Agency, Botswana
SIAB Société Inter-Africaine de Banque, Togo
SIC Société Immobilière du Cameroun (Cameroon Real Estate Corporation)
SID Société Immobilière de Djibouti
SIDA Swedish International Development Cooperation Agency
SIFMA-SA Societe Fonciere et Immobiliere du Mali
SiHA Single Housing Agency, Botswana
SIP Société Immobilière Publique (National Real Estate Company), Burundi
SIPIM Societe ivoirienne de promotion immobilière
SIPO Strategic Indicative Plan for the Organ (on Defence, Politics and Security) (SADC)
SLCB Sierra Leone Commercial Bank
SITO Société Immobilière TogolaiseSLBStandard Lesotho Bank
SLIEPA Sierra Leone Investment and Export Promotion Agency
SMB State Bank of Mauritius
SMCP Savings and Micro-Credit Programme, Eritrea
SME Small and medium-sized enterprise
SNDP Somali National Development Plan
SNEC National Water Supply Company of Cameroon
SNC Societe Nigerienne de Cimenterie, Niger
SNEN Syndicat National des Enseignants du Niger
SNHB Swaziland National Housing Board
SNHIS Sistema Nacional de Habitacao de Interesse Social (National System of Housing for Social Interests)
SnHLM National Society of Low-Rent Housing
SNI National Building Society, Gabon
SNI Societe Nationale Immobiliere, Gabon
SNL Swazi Nation Land
SNMG Salaire National Minimum Garantit, Algeria
SNPF Swaziland National Provident Fund
SNPSF National Post and Financial Services Institution
OHLM Office des habitats à loyers moderes
OIBM Opportunity International Bank of Malawi
OMH Office Malien de l'Habitat (Mali Housing Agency)
OMV Open market value
OPIC Overseas Private Investment Corporation, South Africa
OTC Office de Topographie et de Cadastre
OTR Office Togolais des Recettes
PABS Pan African Building Society
PACIE Industrial and Energy Competitiveness Support Programme
PAGE Programme to Accelerate Growth and Employment, The Gambia
PAMF Première Agence de MicroFinance, Madagascar
PAICV African Party for the Independence of Cabo Verde
PAIFAR-B Financial Inclusion in Burundi
PCU Project coordination unit
PDES Economic Social Development plan, Niger
PDU Urban Development Programme, Mauritania
PEBEC Presidential Enabling Business Environment Council, Nigeria
PEDS The Sustainable Development Strategic Plan 2017-2021
PEEDU Projet d'eau, d'électricité et de développement urbain (Water, Electricity, and Urban Development Project)
PGE Programme Général de l’Etat
PMB Primary Mortgage Banks
PMC Property Management Corporation
PMI Primary Mortgage Institution
PNAT National Land Use Plan
PNEI National Pact for Industrial Emergence, Morocco
PND National Development Plan, Chad
PNDES Plan National de Développement Economique et Social, Guinea
PNHU National Urbanism and Housing Programme
PNRLR National Programme for the Resorbing of Rudimentary Lodging
POHI Public Officers Housing Initiative
PoS Point of Sale
PPC Pretoria Portland Cement
PPHPZ Peoples’ Process on Housing and Poverty in Zambia
PPP Public-private partnership
RCB Rokel Commercial Bank, Sierra Leone
RCPB Réseau des Caisses Populaires du Burkina
RDP Reconstruction and Development Programme, South Africa
REALL Real Equity for All (formerly Homeless International)
REC Regional Economic Community
RECCU Renaissance Cooperative Credit Unions, Cameroon
REDAN Real Estate Development Association of Nigeria
REIT Real Estate Investment Trust
REPI Real Estate Price Index, Morocco
RHA Rwanda Housing Authority
RHB Rwanda Housing Bank
RHLF Rural Housing Loan Fund, South Africa
RI Index Roland Igbinoba House Price Index
RISDP Regional Indicative Strategic Development Plan (SADC)
RNHC National Network of Inhabitants of Cameroon
RNP National Postal Service
ROA Return on Assets
ROE Return on Equity
ROSCA Rotating, Savings and Credit Associations
RSNDP Revised Sixth National Development
RSP Royal Swaziland Police
RSSB Rwanda Social Security Board

10
SNT The Société des transports de Tunis
SOCOGIB Société de Construction et de Gestion Immobilière du Burkina
SOCOGIM Société de Construction et de Gestion Immobilière, Benin
SOCOGIM Real Estate Construction and Management Company Mauritania
SOFIA Société Financière Africaine de Crédit
SONA State Insurance company, Democratic Republic of Congo
SONAPI Société Nationale de l’Aménagement et de la PromotionImmobilièr (National Society for Planning and Real EstateDevelopment), Guinea
SONUCI Société Nationale d’Urbanisme et de Construction Immobilière,Niger
SOPROFIM Land and Real Estate Promotion Corporation
SORAZ Société de raffinage de Zinder, Niger
SPI Societé de Promotion Immobiliere, Mali
SPLM South People’s Liberation Movement, South Sudan
SPROLS Société de Promotion des Logements Sociaux, Tunisia
SRA Swaziland Revenue Authority
SREA Somalia Real Estate Association
SREP Scaling Up Renewable Energy in Low Income CountriesProgramme, Madagascar
SRH Société de Refinancement Hypothécaire (Mortgage RefinancingCompany), Algeria
SSA Sub-Saharan Africa
SSFR Social Security Fund of Rwanda
SSHFC Social Security and Housing Finance Corporation, Gambia
SSNIT Social Security and National Insurance Trust
SSP Sector Strategic Plan
SSX Swaziland Stock Exchange
STP Sao Tome and Principe
STZC Zhen Gwei Technique Congo
TIPEEG Targeted Intervention Programme for Employment and EconomicGrowth, Namibia
TMB Trust Merchant Bank, DRC
TMRC Tanzania Mortgage Refinancing Company
TOP Temporary occupation certificate holders, Djibouti
PROM Togolese Sponsorship Corporation (Societe Togolaise dePromotion)
UAE United Arab Emirates
UCA Uganda Co-operative Alliance
UDP Urban Development Project
UEAC Union Economique de l’Afrique Central(Central African Economic Union)
UEMOA West African Economic Monetary Union
UN United Nations
UNCDF United Nations Capital Development Fund
UNCHS United Nations Centre for Human Settlements
UNDP United Nations Development Programme
UNECA United Nations Economic Commission for Africa
UNICEF United Nations Children’s Fund
UNSMIL United Nations Support Mission in Libya
UOB Urwego Opportunity Bank
USA United States of America
USAID United States Agency for International Development
USD (US$) United States Dollar
UTB Union Togolaise de Banque
VAT Value added tax
VSB Villes sans bidonvilles programme, Guinea
WAEMU West African Economic and Monetary Union
WALR Weighted average lending rates
VSB Villes sans bidonvilles programme, Guinea
WAEMU West African Economic and Monetary Union
WALR Weighted average lending rates
WAMZ West African Monetary Zone
WCF Workmen’s Compensation Fund
WHC Watumishi Housing Company
WHPI Women’s Housing Plan Initiative, Nigeria
ZAMFI Zimbabwe Association of Microfinance Institutions
ZAMCO Zimbabwe Asset Management Corporation
ZHPPF Zimbabwe Homeless and Poor People’s Federation
ZIMASSET Zimbabwe Agenda for Sustainable Socio-Economictransformation
ZINAHCO Zimbabwe National Association of Housing Cooperatives
ZNBS Zambia National Building Society
ZSIC Zambia State Insurance Corporation

11
Africa Housing Finance Yearbook 2018
Overview
1 “Massive Small” is an idea promoted by Kelvin Campbell, an architect and urban designer based in London, UK. The Massive Small Collective “believes that incremental bottom-up initiative supported by an enabling top-down policy andintervention provides our best chance at creating thriving cities.” See https://www.massivesmall.org (Accessed 13 Oct 2018).
2 In 2015 and 2016, CAHF undertook a benchmarking study to consider comparative costs involved in constructing a “standard” 55m2 house in fifteen countries. CAHF put together a generic Bill of Quantities, including almost 400separate cost items across five main cost elements: land, infrastructure, compliance, construction (including labour) and other development costs. This was shared with Quantity Surveyors in 15 countries, who were invited to develop aquotation for constructing 20 such units in a greenfields project in two cities in their country. It must be noted that the “standard” house is not representative of what is available in each market, but is rather used as a mechanism forcomparing cost differences across markets. The final price ranged widely, from US$63 241 in Nairobi, Kenya, through to US$26 750 in Dar es Salaam, Tanzania. See the data on our dashboard: CAHF (2017). Benchmarking HousingConstruction Costs in Africa. http://housingfinanceafrica.org/dashboards/benchmarking-housing-construction-costs-africa/ (Accessed 10 Oct 2018).
3 See Casa Minha’s website. https://www.casaminha.co for an overview of the project. (Accessed 10 Oct 2018).4 See Kasaine, Adam (2018). Letshego Kenya Limited. Presentation to the Habitat for Humanity and Terwilliger Centre for Innovation in Shelter, Housing Finance Forum, in Uganda, 11-12 July 2018.
https://www.habitat.org/sites/default/files/documents/Letshego.pdf (Accessed 10 Oct 2018).5 See Melana Housing Partnerships (2017). Video. https://www.youtube.com/watch?v=Jipj4XbwrMI for an overview of their model. Also see: Indlu (2018). https://www.indluliving.com (Both accessed 10 Oct 2018).6 See iBuild Home Loan’s website. http://www.ibuildhomeloans.com (Accessed 14 Oct 2018).7 See uMaStandi’s website. https://umastandi.co.za (Accessed 10 Oct 2018).
Land assembly / acquisition
In most countries, the assembly and acquisition of well-located land is a key factor
in the feasibility of affordable housing development. Comparing “standard” house
prices across 15 countries, CAHF found that in Kampala, Uganda, and Dakar,
Senegal, land comprises more than 25 percent of the purchase price of a
“standard” 55m2 home on a 120m2 plot of land.2 The comparative cost of the
land was found to be highest in Nairobi, at US$15 229 for 120m2 in a 20-unit
development, comprising 23 percent of the overall house price. Land costs include
the registration costs, planning approval costs, and overall land purchase price,
whether traditional or freehold tenure. In Nairobi, the major cost was the land
itself. In Dakar, the cost of registration comprised nine percent of the overall land
cost. In Kampala, planning approval comprised five percent of overall land costs.
In Douala, Cameroon, where the price of a 120m2 plot of land in a 20 unit
development was relatively low at US$4 316, registration costs comprised
43 percent of the total land cost.
In Maputo, Mozambique, Casa Minha has addressed the question of land
acquisition by working with a centrally-located low income settlement. Residents
have existing land rights (DUATs, in Mozambique) but their homes are of very
poor quality and in some cases, are only shacks. Using a “land readjustment”
Land assembly /acquisition
Title / tenure
Bulk Infrastructure
House construction
Sales & transfer
Maintenance & ongoing
improvements
Social and economicinfrastructure
approach, Casa Minha has negotiated with local residents in the settlement to
build two formal, 2-3 storey houses on each plot. In terms of the arrangement,
Casa Minha then sells the one house on the open market, targeting entry-level
hospital workers, labourers, etc. The other house is sold for a much reduced price
to the original DUAT holder, free of the land cost and leveraged by the proceeds
from the sale of the other half of their land that went into the development of
the open market house. Residents have the option to participate in the scheme
or not, as Casa Minha develops on a plot-by-plot basis, densifying and formalising
the inner city suburb.3
Other examples of a form of “land readjustment” involve the development of
backyard rental accommodation. In Kenya, Letshego Kenya Limited finances
incremental construction of rental accommodation as a microenterprise loan, on
the back of a future rental income stream.4 In South Africa, Indlu,5 iBuild Home
Loans,6 and uMaStandi7 provide finance and other support towards the
construction of formal rental accommodation in the backyards of their borrower’s
properties. In all cases, local landowners are actively leveraging existing, well-
located land in support of improved housing affordability and housing investment
opportunities.
Cities are complex systems, and across Africa, are growing at a rapid rate
unprecedented in urban history. While the scale and pressure of urbanisation is
overwhelming, this agglomeration of activity offers an incredible opportunity for
development. At the same time, the confluence of efforts to promote financial
inclusion, urban development, infrastructure investment, and macroeconomic policy
attention create a uniquely enabling environment for the growth of housing in
particular. As government, the private sector and households and communities
themselves find their places in the housing ecosystem, innovation is being found
along each link in the housing value chain.
Lenders, investors, builders and suppliers are getting much better at identifying
and targeting niche markets. If not yet a move away from the attraction of large-
scale, massive developments, we can see increasing attention towards the notion
of “massive small”: the opportunity to be found in the connected results of many
small projects and initiatives at the local level that together add up to something
big.1 From a recognition of backyard rental and inner city refurbishment as viable
housing supply streams, to the development of underwriting standards for
borrowers in the informal economy, to the financing of incremental housing
construction at scale, to the use of blockchain technology to improve titling
efficiencies, innovation along the value chain and at the local level is making
headway and creating precedent that is bankable.
Innovation along the value chain
CAHF has been exploring the housing value chain across Africa for years, making
the point that the chain is only as strong as its weakest link and highlighting the
challenges as they arise along the chain. Standing out this year, across the
continent, and in specific local contexts, is evidence of innovation along the value
chain in virtually every link.

12
Title / tenure
A related but distinct challenge relates to land titling and secure tenure
arrangements that are acceptable to lenders. Mortgage markets across Africa are
small because without having been formally titled, land cannot be secured, or
because the land registration process is cumbersome and time-consuming. In
Ghana, for example, anecdotes suggest that the land titling and registration process
takes between one and three years to complete.8 A key problem, also in other
countries, is the existence of multiple ownership claims on land plots. In other
countries, administrative bottlenecks (South Africa) or overlapping jurisdictions
(Mauritania) further delay the awarding of title deeds. The insecurity this creates
can cause formal builders and housing finance institutions to withdraw their
participation from such areas.
The development of blockchain technology is being considered in the creation of
digital land registries, with initiatives in Ghana, Kenya, Zambia and Rwanda already
underway, and further considerations being given to Tanzania, Nigeria, and
Ethiopia.9 In Ghana, Bitland10 is working towards mapping the entire country on
a distributed digital ledger, formally documenting customary land rights. In Zambia,
Overstock’s Medici Land Governance11 has partnered with the land ministry to
build a blockchain land titling programme. In both cases, the hope is that once
tenure is formally noted and legally recognised, banks will be able to grant loans
and issue mortgages against the property.
Bulk infrastructure
Moving along the value chain, the availability of bulk and connector infrastructure
for new residential developments is a critical component, the absence of which
very often undermines the affordability of housing delivered. When municipalities
cannot deliver the water, sanitation, transport and energy requirements for a
development, developers either wait, or deliver this themselves, costing their
investment into the eventual price of the unit. In a case in Zimbabwe, original
costings which did not anticipate the Harare municipality’s inability to deliver on
infrastructure meant that the developer had to decrease the number of units
delivered, thereby increasing the unit price. Inaccessible land then meant that the
developer had to build a US$3.4 million road to make the project work.12
Similarly, in Kenya, developers often have to provide infrastructure themselves and
this limits the affordability of the end-product. In Angola, lack of infrastructure is
a serious factor in deterring developers from engaging in low-cost housing.
In some countries, public-private partnerships are successfully addressing the
problem. In Zimbabwe, Old Mutual and local lender CABS have supported the
development of 1 082 serviced stands in a public private partnership with the
Bulawayo local authority. Recognising the fiscal constraints of the government, the
private sector financed the servicing of the stands provided by the city, and then
offered these for sale on terms to households who were registered with the City
Council for access to affordable housing.13 A small initiative, this nonetheless offers
insights into the possibility for a pension fund to offer the long-term financial
capacity for an initiative when the public sector is unable to participate.
Municipalities are also exploring various land-based financing initiatives to support
their capital requirements for infrastructure investment. Interesting examples can
be found in Ethiopia, Nigeria, Kenya, Côte d’Ivoire, South Africa and elsewhere,
where the municipality uses its land asset and leverages the developer’s interest
in the higher-value housing market, to impose development charges that finance
their investment in infrastructure in lower-value areas.14 USAID’s WASH-FIN15
programme has been exploring other PPP arrangements in Kenya, Senegal and
South Africa, focusing on a capacity-building approach to create sustainable
business models that leverage public investment with private capital by reducing
risk and building municipal creditworthiness.
Social and economic infrastructure
The availability of infrastructure also relates to the last link in the chain: social and
economic infrastructure. Inner city regeneration initiatives create an opportunity
to leverage and build further on existing infrastructure: social, economic and
engineering, while delivering new affordable housing opportunities. Although
poorly recognised in policy, the rental housing market is an important component
of urban housing markets – and is already found in most inner cities. Research
Other householdsAbidjan rentersOther urban rentersRural renters
Other householdsDakar renters Other urban rentersRural renters
Other householdsDar es Salaam rentersOther urban rentersRural renters
Other householdsKampala rentersOther urban rentersRural renters
CÔTE D’IVOIRE SENEGAL TANZANIA UGANDA
TOTAL HOUSEHOLDS: 6 203 580HOUSEHOLDS RENTING: 1 805 800 (29%)
TOTAL HOUSEHOLDS: 1 590 692HOUSEHOLDS RENTING: 319 100 (20%)
TOTAL HOUSEHOLDS: 8 444 035HOUSEHOLDS RENTING: 1 542 000 (18%)
TOTAL HOUSEHOLDS: 6 756 913HOUSEHOLDS RENTING: 790 350 (11%)
ENV 2015 WB Listening to Senegal 2014 Household Budget Survey 2011/12 National Panel Survey 2013/14
13%
13%
71%
3%
14%
5%
80%
1%
7%7%
82%
4%2% 5%
89%
4%
8 CAHF (2018). Africa Housing Finance Yearbook 2018: Ghana.9 Mwanza, K and H Wilkins (2018). African startups bet on blockchain to tackle land fraud. Reuters. 16 Feb 2018. https://www.reuters.com/article/us-africa-landrights-blockchain/african-startups-bet-on-blockchain-to-tackle-land-fraud-
idUSKCN1G00YK (Accessed 10 Oct 2018).10 See Bitland’s website for an overview: http://bitlandglobal.com (Accessed 10 Oct 2018).11 Kanali, N (2018). Zambia announces plans to build a blockchain land titling program. 9 Aug 2018. https://africabusinesscommunities.com/tech/tech-news/zambia-announces-plans-to-build-a-blockchain-land-titling-program/ (Accessed
10 Oct 2018).12 Gorelick, J (2018). Making Cities Work: Accessing Finance from a Variety of Funding Sources for Infrastructure Expansion and Upgrades: Water, Sanitation & Hygiene Finance (WASH-FIN).
http://www.marcusevansdocs.com/Doc/events/24435/Jeremey%20Gorelick.pdf (Accessed 10 Oct 2018).13 Kazunga, O (2018). Old Mutual unveils 1082 serviced stands. Chronicle. 9 Mar 2018. https://www.chronicle.co.zw/old-mutual-unveils-1-082-serviced-stands/ (Accessed 10 Oct 2018).14 Graham, N (2016). Financing Infrastructure for Housing Developments: Case studies from Sub-Saharan Africa. Case Study Series 4. February 2016. http://housingfinanceafrica.org/app/uploads/CAHF-Case-Study-4_Infrastructure-
Financing.pdf (Accessed 15 Oct 2018).15 The Water, Sanitation, and Hygiene Finance (WASH-FIN) programme of USAID is run by Tetra Tech. See http://www.tetratech.com/en/projects/water-sanitation-and-hygiene-finance-wash-fin (Accessed 12 Oct 2018).
Source: 71point4 (2018). Focus notes: Understanding & Quantifying Rental Markets in Africa: Uganda, Tanzania, Côte d’Ivoire and Senegal. http://housingfinanceafrica.org/projects/rental-housing-in-africa/(Accessed 15 Oct 2018).

Africa Housing Finance Yearbook 2018
conducted in this past year by CAHF found that the majority of most city
populations are renters, and that rental tenure makes up a significant proportion
of national housing markets.16 This highlights an important opportunity: much of
the existing rental is in areas with existing infrastructure. This can be usefully
leveraged towards improved affordable housing, that is also well-located – an
opportunity to be recognised by investors.
In South Africa, TUHF Pty Ltd17 is a commercial property financier that targets
small-scale landlords who refurbish existing inner city residential stock.
Underwriting mortgages on the basis of projected future rental income, TUHF
can offer loans to entrepreneurs who demonstrate residential rental management
capacity. For those who lack sufficient equity to make the loan feasible, TUHF has
established the Intuthuko Equity Fund which provides equity to previously
disadvantaged individuals. In TUHF’s 15 years of operation, it has financed the
refurbishment and delivery of 33 037 units in 598 buildings, across 128 inner city
areas in South Africa, working with 350 entrepreneurs of whom 52 percent are
previously disadvantaged individuals. TUHF’s loan book of R2 767 billion (US$190
million) achieved a 15 percent return on its investment in 2018.
Housing construction
In most countries across the continent, the housing construction process is
constrained by limited capacity in the development sector, and the absence or
high cost of developer finance. This results in small housing projects, financed with
up-front cash payments that limit affordability. The Affordable Housing Fund in
Rwanda seeks to address this, by providing a guarantee facility for developers,
producers of local construction materials and other investors in housing targeted
at middle and low income earners. The Rwf206 billion (US$232.8 million) fund
was established in July 2017, and according to some reports, seeks to halve the
cost of housing for the target market.18
A Real Estate Investment Trust (REIT) is another construction financing and rental
investment mechanism that has been growing across the continent. Research
undertaken by CAHF found 36 REITs in five countries.19 Of these, eleven had a
residential portfolio with two being residential-only REITs. These REITs manage a
combined property value of US$22.7 billion. In Ghana, the HFC REIT has a
diversified portfolio that includes residential, with a value of US$1.8 million. In
Nigeria, Union Homes Hybrid REIT focuses explicitly on residential property, while
Skye Shelter Fund, Sun Trust Hybrid, and UPDC are all diversified REITs that include
residential components. Watumishi Housing Company is a residential-only REIT
in Tanzania, focusing on the development of housing for civil servants. Of the 29
REITs in South Africa, five include residential as part of their diversified portfolios.
In 2016, Transcend was established as a specialised REIT focused on expanding a
portfolio of strategic residential properties. The REIT is listed on the AltX Board
of the Johannesburg Stock Exchange, and includes a portfolio of 2 472 units across
South Africa. As it and other REITs report into the market, they are establishing
a track record that will catch the attention of investors looking for new
opportunities.
13
16 See focus notes on the rental markets in Senegal, Uganda, Tanzania and Côte d’Ivoire on http://housingfinanceafrica.org/projects/rental-housing-in-africa/ (Accessed 13 Oct 2018).17 See TUHF’s website: http://www.tuhf.co.za (Accessed 10 Oct 2018).18 Tumwebaze, P (2018). Why more real estate developers have embraced affordable housing. The New Times. 20 March 2018. https://www.newtimes.co.rw/section/read/231190 (Accessed 12 Oct 2018).19 See CAHF’s dashboard with data on REITs in five countries: http://housingfinanceafrica.org/dashboards/residential-real-estate-investment-trusts-in-africa-findings-in-5-countries/ (Accessed 12 Oct 2018). 20 Suraya’s Encasa@Mombasa Rd project includes 85 bedsitter units (Encasa 1) for KSh 1.155 million and 120 studio apartments of 20m2 (Encasa 2) for KSh 1.76 million. See http://www.suraya.co.ke/wp-
content/uploads/2015/03/[email protected] (Accessed 12 Oct 2018).21 Shah, S (2018). CAHF Benchmarking Research: How can we use CAHF study to spur Kenyan housing sector? Presentation given on 30 August 2018. http://housingfinanceafrica.org/app/uploads/Seeta-Shah-CAHF-Presentation-
Aug-2018-v3.pdf (Accessed 12 Oct 2018).22 See Skat (undated). Modern Brick Construction Systems: A catalogue of affordable solutions made in Rwanda. Third edition. http://madeingreatlakes.com/wp-content/uploads/2017/07/CAT-MODERN-BRICK-SOLUTIONS-Draft-
Third-Edition-Beta-Version2.pdf (Accessed 12 Oct 2018). It appears that the Rwf 8 million price does not include land.23 See Zambian Home Loans website: http://www.zambianhomeloans.com/solutions/construction-mortgage/ (Accessed 12 Oct 2018).24 See iBuild’s website: https://www.ibuild.global (Accessed 12 Oct 2018).
Another constraint relating to housing construction is the cost of the units once
built – often too expensive for the majority of households, even when they have
some affordability for credit. Increasingly, however, developers are more deliberate
in their targeting, recognising and responding to affordability constraints with the
development of innovative products. A 16m2 unit developed by Suraya in Nairobi,
Kenya, is targeted at the entry-level market of young professionals and sells for
KSh1.155 million (US$11 170).20 Another example from Kenya is being explored
by Global Property Advice plc, which has developed a semi-detached, 38m2 one
bedroom unit for US$10 000, excluding the land cost.21 GPA offers a minimum
delivery of 50 units, and can deliver within four weeks. The product is targeted at
the housing cooperative sector where land and servicing may already have been
secured. In Rwanda, Skat Consulting has designed 43m2 two-bedroomed housing
units at a cost of Rwf8 million (US$9 042).22
Annually, CAHF asks the contributing authors to this Yearbook to identify the
cheapest newly built house by a private developer in their country. The price they
identify defines where the market is currently targeted – that is, what is currently
being built – rather than what is possible. From this rough view of the market, it
appears as though more and more developers are improving their targeting and
building lower-cost, smaller properties.
No matter how promising, however, such developments are still few and far
between. Even more conventional developments, which might start with entry-
level housing at about US$20 000, are scarce. As a result, most households still
build their housing themselves. To this end, Zambian Home Loans (ZHL) has an
interesting product, supporting households who have embarked on their own,
independent housing construction process and run out of cash. Recognising that
households often build their homes incrementally, ZHL offers a construction
mortgage to finance construction increments.23 With this, they hope to leverage
the existing housing investments made by middle income households, achieving
lower loan-to-value ratios and accelerating the housing construction process.
Maintenance and ongoing improvementsGiven its prevalence among both low and higher income markets, incremental is
an important form of housing provision that is increasingly being recognised and
supported with innovative products. To date, the challenge has been in realising
scale from what are essentially individual-unit, slowly constructed developments.
Again, new technologies offer interesting opportunities. With pilots in Kenya and
South Africa, and intentions to expand into Nigeria and Zambia in the short term,
iBuild Global24 aggregates scale through an app that households and suppliers can
access on their cellphones. Backed up with a database of small-scale contractors,
building material suppliers, and other service providers in the incremental housing
sector, the app allows households to issue calls for quotation, receive multiple
proposals, and evaluate these on the basis of both price and contractor track record.
Holding all of this activity on a single platform, the iBuild database can assess both
demand and supply, so that investors and financiers can scope the market and
identify opportunities for engagement. For lenders, the app provides a payment
gateway that ensures their loans are used for housing purposes. In South Africa,
Yomane25 also offers a payment gateway that enables closed-loop payments.

14
constrained by macroeconomic factors which contribute towards high interest
rates, and short payment terms. In Malawi, for example, the mortgage rate sits at
25.5 percent, repayable over ten years. In most countries, interest rates are over
10 percent per annum. An analysis of high interest rates across various jurisdictions
found four determining factors: high policy interest rates (where the “risk free”
rate on short term government borrowing sets a benchmark for mortgage rates);
high maturity premiums due to the unwillingness of lenders to issue long term
loans; high credit risk premiums which reflect weaknesses in the legal, regulatory
and institutional environment; and limited utilisation of the collateral value by real
estate, reflecting new, slow-churn residential property markets.28
In an effort to support the wider policy and institutional transformation necessary
to enable mortgage market development, the World Bank has been working with
Central Banks in Egypt, Tanzania, Nigeria and West Africa to create mortgage
liquidity facilities. These institutions seek to increase the availability of long-term
funding so that lenders become confident to lend over longer terms. By creating
a standardised mortgage approach, and drawing lenders in as shareholders
together with the government, they reduce the unknowns and help investors
better assess and manage risk. This is expected to reduce the cost of funding,
which then contributes to a reduced lending rate, making housing loans more
affordable. Having been in existence for over 10 years (Egypt’s facility was
established in 2006; the most recent facility is the Nigeria Mortgage Refinance
Company, established in 2013), the track record of these existing four facilities has
varied, and highlights the complexities in making affordable housing finance work.
Another interesting niche impacting on the housing construction, maintenance,
and ongoing improvements links in the chain is “green”. LafargeHolcim has been
working hard in this space, and, in Zambia, partnered with BancABC and Zambia
National Building Society to disburse housing microfinance loans towards the
construction of green housing, using Habiterra blocks. The programme aligns with
ILO Zambia Green Jobs Programme.26 LafargeHolcim has also entered into a
joint venture with CDC to establish 14Trees, an initiative to create
environmentally-friendly, affordable green building solutions. Behind the name is
Lafarge’s Durabric brick, which is produced from a mixture of earth and cement,
compressed in a mould, and left to cure without firing. It is estimated that by
avoiding the firing process of traditional brick-making, the Durabric brick saves up
to 14 trees per house.27 In Malawi, 14Trees has sold about one million Durabric
bricks since 2016. Increasingly, it is likely that investment capital will come with a
green requirement. At the same time, the Durabric uses less cement than is used
in traditional cement blocks – an important consideration given how expensive
cement is in some countries.
Sales and transferOnce the house is built, it becomes part of a market in which houses are assets
that can be sold and bought, appreciating (or depreciating, as the case may be) in
value, stimulating household level investment and creating a diversity of supply
that is highly responsive to personal demand. The sales and transfer link in the
value chain relies critically on the availability of end-user finance – whether
mortgage or non-mortgage. In many countries, access to housing finance is
25 See Yomane’s website: https://www.yomane.com (Accessed 12 Oct 2018).26 CAHF (2018). Yearbook: Zambia profile.27 See Durabric’s website: https://www.durabric.com (Accessed 12 Oct 2018).28 Fuchs, M (2018). Working Paper: Lowering the high interest rate cost of housing finance in Africa. http://housingfinanceafrica.org/documents/working-paper-lowering-the-high-interest-rate-cost-of-housing-finance-in-africa/
(Accessed 12 Oct 2018).
200 000
150 000
100 000
50 000
0
300
250
200
150
100
50
0
PRICE OF THE CHEAPEST, NEWLY BUILT HOUSE BY A FORMAL DEVELOPER: 2017 AND 2018
Source: CAHF Survey, 2018
Hous
e si
ze (m
2 )Pr
ice
of c
heap
est h
ouse
(US$
)
Guin
ea-B
issa
uM
adag
asca
rEr
itrea
Ango
laDj
ibou
tiSã
o To
mé
and
Prín
cipe
Zam
bia
Ethi
opia
Swaz
iland
Seyc
helle
sBo
tsw
ana
Moz
ambi
que
Chad
Liby
aSo
uth
Suda
nGa
bon
Com
oros
Mau
ritiu
sEq
uato
rial G
uine
aBu
rund
iCa
bo V
erde
Tuni
sia
Mau
ritan
iaAl
geria
Suda
nSo
uth
Afric
aM
ali
Cent
ral A
frica
n Re
publ
icGh
ana
Dem
ocra
tic R
epub
lic o
f Con
goUg
anda
Cote
d'Iv
oire
Nam
ibia
Rwan
daCa
mer
oon
Mal
awi
Sier
ra L
eone
Gam
bia
Guin
eaZi
mba
bwe
Sene
gal
Tanz
ania
Nige
riaLe
soth
oBe
nin
Egyp
t, Ar
ab R
epub
licM
oroc
coNi
ger
Togo
Keny
aBu
rkin
a Fa
soLi
beria
Som
alia
Cong
o, R
epub
lic
House size 2017 House size 2018 n House price 2017 n House price 2018

15
Africa Housing Finance Yearbook 2018
There are plans underway to launch a Kenya Mortgage Refinance Company
(KMRC) in 2019.29 According to the World Bank, a key focus of this facility will
be on the savings and credit cooperative (SACCO) lending market. In reviewing
the Kenyan housing finance market, the World Bank found that less than ten
percent of all housing credit in Kenya comes in the form of mortgages from the
banking sector, with the remainder coming from SACCOs and housing
cooperatives.30 Kenya’s SACCO and housing cooperative sector offers useful
insights into how the savings of low and moderate-income households might be
aggregated in support of a capital base that can then be leveraged to support
housing lending. Already, housing cooperatives such as NACHU have established
developer expertise and strong relationships with their members in the delivery
of affordable housing. A key challenge, however, will be to strengthen SACCOs
themselves so that they can sustainably receive and manage the liquidity that will
enable their members to borrow funds for housing.31
Of course, mortgage liquidity facilities are not a panacea – and it is clear that they
will only serve a minority of the population needing finance for housing. For this,
the establishment of the EMRC,32 TMRC,33 NMRC,34 CRRH35 and now the
pending KMRC, might appear to be a rather expensive effort – unless it is
leveraged beyond its target to stimulate the entire affordable housing sector,
29 Speech by the Mr Henry Rotich, EGH, Cabinet Secretary for the National Treasury and Ministry of Planning: Stakeholder Engagement on the Formation of the Kenya Mortgage Refinance Company (KMRC). 4 April 2018 at HotelIntercontinental. http://www.treasury.go.ke/phocadownload/speeches2018/LSPEECH%20CS%20STAKEHOLER%20ENGAGEMENT%20ON%20KENYA%20MORTGAGE%20%20REFINANCE%20COMPANY.pdf (Accessed 12 Oct 2018).
30 World Bank Group (2017). Kenya Economic Update, April 2018, No. 17: Policy Options to Advance the Big 4. World Bank, Nairobi. https://openknowledge.worldbank.org/handle/10986/29676 (Accessed 12 Oct 2018).31 Wood, D (2018). The Role of Savings and Credit Cooperatives in Kenya’s housing finance sector. http://housingfinanceafrica.org/app/uploads/case-study-NO-12-formated.pdf (Accessed 12 Oct 2018).32 See the Egyptian Mortgage Refinance Company’s website: http://www.emrc-online.com (Accessed 12 Oct 2018).33 See the Tanzania Mortgage Refinance Company’s website: http://www.tmrc.co.tz (Accessed 12 Oct 2018).34 See the Nigeria Mortgage Refinance Company’s website: http://nmrc.com.ng (Accessed 12 Oct 2018).35 See the Caisse Régionale de Refinancement Hypothécaire’s website: http://crrhuemoa.org (Accessed 12 Oct 2018).
enabling conversation at the policy and regulatory levels while creating market
certainty around which the private sector can then innovate. This does appear to
be the case in Tanzania, where the Central Bank has actively engaged in the impact
of its activities more broadly on the housing sector, and new attention has been
drawn to the need for construction finance to create the supply that would lead
to demand for mortgages that the TMRC would then fund. Similarly in Nigeria,
the establishment of the NMRC appears to have stimulated a much wider array
of interventions that is not limited to the delivery of mortgage loans.
In South Africa, a key constraint to mortgage lending at the bottom end of the
market has been household affordability – only an estimated 34 percent of the
urban population can afford what is the cheapest newly built house by a private
developer (about US$24 000). This assumes, however, that a household would
have equity for a deposit – an unlikely possibility given South Africa’s savings rate
and the likelihood that entry-market households are first time homebuyers.
Lenders are therefore beginning to explore supply in the resale market of
government-subsidised housing.36 These are tiny mortgages: sometimes as small
as US$7 000, but they create an entry to the property market for a low income
household, and critically, realise the asset value of government-subsidised housing
by creating equity for the seller of the house they purchase. In this, the lender is
MORTGAGE TO GDP vs. PREVAILING MORTGAGE INTEREST RATE AND TERM
Source: CAHF Research, October 2018
Mor
tgag
e to
GDP
(%) a
nd M
ortg
age
inte
rest
rate
(%)
Mortgage loan term
(years)
35
30
25
20
15
10
5
0
◆ Mortgage Interest Rate (%) n Mortgage loan term (years)
35%
30%
25%
20%
15%
10%
5%
0%
Sout
h Af
rica
(Sou
th A
frica
n Re
serv
e Ba
nk 2
018)
Com
oros
(201
5)Ca
bo V
erde
(Wor
ld B
ank
2018
)M
aurit
ius
(201
8)Ch
ad (2
018)
Ango
la (2
018)
Mau
ritan
ia (2
018)
Mal
i (20
17)
Mor
occo
(IM
F 20
15)
Cong
o De
m. R
ep. (
Wor
ld P
opul
atio
n Re
view
201
8)Bo
tsw
ana
(Eco
nsul
t Bot
swan
a 20
17)
Djib
outi
(Cen
tral B
ank
of D
jibou
ti 20
16)
Libe
ria (2
018)
Leso
tho
(201
8)Gh
ana
(Ban
k of
Gha
na 2
018)
Tuni
sia
(Bad
ev e
t. Al
. 201
8)Ni
geria
(201
8)Zi
mba
bwe
(Hofi
net 2
014)
Cam
eroo
n (2
018)
Tanz
ania
(Ban
k of
Tan
zani
a 20
18)
Zam
bia
(201
8)Ug
anda
(201
8)Se
yche
lles
(Cen
tral B
ank
of S
eych
elle
s 20
18)
Equa
toria
l Gui
nea
(201
8)Ke
nya
(Cen
tral B
ank
of K
enya
201
6)Na
mib
ia (2
018)
Buru
ndi (
Banq
ue d
e la
Rép
ubliq
ue d
u Bu
rund
i 201
7)Al
geria
(201
7)M
alaw
i (Ho
finet
201
4)Rw
anda
(201
8)Ni
ger (
2018
)M
ozam
biqu
e (2
018)
Sene
gal (
2017
)To
go (B
adev
et.
Al. 2
017)
Cent
ral A
frica
n Re
publ
ic (2
016)
Liby
a (2
018)
Swaz
iland
Suda
nSo
uth
Suda
nSo
mal
iaSi
erra
Leo
neSã
o To
mé
and
Prín
cipe
Mad
agas
car
Guin
ea-B
issa
uGu
inea
Gam
bia
Gabo
nEt
hiop
iaEr
itrea
Egyp
t Ara
b Re
p.Co
te d
'Ivoi
reCo
ngo
Rep.
Burk
ina
Faso
Beni
n

16
thinking more broadly about a ladder of connected property transactions where
the bottom rungs are what make activity higher up possible, rather than about a
more simple collection of disparate transactions. To enable this approach, lenders
are having to reconsider the lending criteria and what constitutes mortgageable
stock. The market is no longer plain vanilla. Its products therefore demand an
equivalent diversity.
The same applies to the diversity of the borrower, and here too, lenders are
innovating to expand their reach. Given the nature of labour markets across the
continent, many prospective borrowers have informal incomes. While they may
have affordability to repay a mortgage, the source of their income, or the frequency
of its payment contradicts standard underwriting requirements. To address this,
the Nigeria Mortgage Refinance Company has developed uniform mortgage
underwriting standards for the informal sector in Nigeria.37 The standards
determine that informal sector borrowers are “self-employed professionals, self-
employed non-professionals, and Owner/Managers and employees of small and
micro enterprises without formal records.” Credit worthiness is proven with
evidence of consistent, good payment – such as for utility bills and school fees; as
well as with letters of reference; and a demonstration of affordability given payment
patterns. The participation of co-borrowers is governed by a set of rules and the
maximum loan amount is set at N50 million (US$138 000). The loan requires
significant borrower equity: properties valued at above N2 million (US$5 000)
require a 35 percent deposit.
In Sierra Leone, the problem has been somewhat different: it is not just that
borrowers are informally employed – but they are still unbanked. Only twenty
percent of the Sierra Leone population is banked, and there is only one credit
bureau representing about one percent of the population. This makes lending
virtually impossible – and yet, there is clearly demand for housing that must
somehow be financed. To overcome the gap, blockchain technology is being used
to stimulate financial inclusion with the creation of a national ID system.38 The
system will provide both a formal identification system, as well as a mechanism
for capturing credit histories, which together will make more households targetable
for lenders seeking to extend their loan product range into housing.
Each of these innovations is identifying a market niche and then working with the
opportunities provided by new technologies, adaptive experience, and
entrepreneurial curiosity to develop real products and services that are essentially
creating brand new markets. In South Africa, for example, the recognition that
government-subsidised housing stock older than 8 years might form part of
housing supply, creates the possibility for an estimated 21860 new mortgage clients
in the major metros per annum.39 Already, South Africa’s housing construction
sector accounts for an estimated 2 percent of GDP (including intermediate inputs).
Enabling a resale market that builds a lower rung on the housing ladder will
stimulate new build supply one rung up, adding further to the impact on GDP. As
market participants innovate, they create new markets, and stimulate more
opportunity. The logic applies more generally as well: if US$20 000 units were
available for sale across Africa, this would create the potential of 7.3 million more
clients than if the entry level housing unit were US$30 000. And if the Suraya
bedsitter unit being delivered for approximately US$11 500 in Kenya were
available across Africa, this could create 15million more clients who couldn’t afford
a US$20 000 unit. This would still leave another 26.7 million potential borrowers
who could afford more than US$5 000 but not quite US$11500 – a potential
market for housing microfinance, or incremental construction. And so on. The
opportunity in niche market targeting is the creation of new markets.
Policy and political willGovernments are increasingly becoming aware of this opportunity. The impact of
housing on the economy – on macroeconomic growth and job creation, as well
as on the potential for financial intermediation and the ongoing sustainability of
cities – is as significant as the very clear need to address the poor housing and
slum conditions that persist for the majority of urban residents.
In Kenya, housing has become part of the current President’s “Big Four” plan for
his term of office. President Kenyatta has committed to increasing housing supply,
with a promise of 500 000 affordable housing units by 2022. To achieve this,
government departments are actively engaging in policy and fiscal reform in
support of more effective and affordable housing delivery. Their efforts are
mirrored in the private sector, where the Kenya Property Developers Association
has set up an Affordable Housing Task Force to compile its members’ advocacy
positions for government.40 These efforts will no doubt streamline Kenya’s housing
delivery value chain and improve the prospects for affordable housing delivery. At
the same time, they provide hope that spreads beyond Kenya’s borders: that
affordable housing is a possibility – a viable investment opportunity. Similar
attention is being given to housing by governments in South Africa, Tanzania,
Ethiopia, Nigeria, Côte d’Ivoire – indeed, in very many governments, housing is
becoming a subject of attention not just by the housing department, but by the
Central Bank.
The World Bank Group’s Doing Business Indicators offer a useful proxy forpolicy attention in the housing space, in their annual review of registeringproperty. While not explicitly about residential property (the indicatorconsiders the transfer of a small warehouse), comparing national scoresbetween 2012 and 2018 show welcome progress in a number of countries.Rwanda, Morocco, Burundi, Côte d’Ivoire, Lesotho, Guinea-Bissau, Senegal,Sierra Leone, and to a lesser extent Kenya, Guinea, Egypt and Togo, all showan improvement in the number of days it takes to register a commercialproperty in 2018 vs. the number of days it took in 2012. Costs have comedown in Rwanda, Mauritius, Comores, Côte d’Ivoire, Niger, Chad, Guinea,Guinea-Bissau, Congo Republic, Senegal, Nigeria (Lagos), Benin, and Togo.However, in Somalia, Gabon, Namibia, South Sudan and Botswana, theregistration of property has become more expensive or more time-consuming.
Another interesting indicator for an enabling environment is the cost of astandard 50kg bag of cement. Where cement is imported, high cement costsreflect high foreign exchange rates, or poor macroeconomic fundamentals.The high cost of a bag of cement might also highlight a poor roadsinfrastructure, a potential warning sign for the prospects of affordable housing.Wide fluctuations in price, such as in South Sudan, Burundi, Eritrea, mightreflect policy uncertainty or instability.
36 South Africa has a national housing subsidy scheme that is targeted at households earning less than R3 500 (US$242) per month. To date, it is estimated that upwards of 2.95 million such houses have been built. Qualifying beneficiariesreceive freehold title to a basic, entry-level subsidised house for free. In terms of the Housing Act, subsidised houses cannot be sold on the open market for the first eight years following transfer. With 1.9 million subsidised houses havingbeen formally transferred to qualifying beneficiaries since the programme started in 1994 (the remainder form part of what is known as the “titling backlog”), a sizeable proportion of this stock is now available for trade in the resale market.
37 NMRC (2018). Uniform Mortgage Underwriting Standards for the Informal Sector. Published January 2018. http://nmrc.com.ng/wp-content/uploads/2018/03/uniform_underwriting_standards_for_the_informal_sector_0318_1.pdf(Accessed 13 Oct 2018).
38 Jones, M (2018). UN & Kiva launch blockchain-based ID system for citizen loans in Sierra Leone. The Block. Blockchain Technology News. 28 Sept 2018. https://www.blockchaintechnology-news.com/2018/09/28/un-kiva-launch-blockchain-based-id-system-for-citizen-loans-in-sierra-leone/ (Accessed 10 Oct 2018).
39 This assumes a churn of 2.58 percent per annum: the SA deeds registry includes an estimated 1.9 million government-subsidised houses. Of these, 951 850 are in the major metros, and of these, 847 292 are older than eight years,making them eligible for trade on the resale market. The average churn rate for the entire residential property market in SA is 2.58 percent. Applying this to eligible government-subsidised stock in the major metros suggests the potentialfor 21 860 new mortgage loans (and in all likelihood, customers) per annum. (Data sourced from Lightstone at end December 2017).
40 CAHF (2018). Yearbook: Kenya profile.

US$50
45
40
35
30
25
20
15
10
5
0
PRICE OF A 50KG BAG OF CEMENT, 2010 – 2018 (US$)
Source: CAHF Research 2010-2018
Sout
h Su
dan
Buru
ndi
Eritr
ea
Cent
ral A
frica
n Re
publ
ic
DRC
Zam
bia
Togo
Zim
babw
e
Nige
ria
Mal
awi
Rwan
da
Tanz
ania
Alge
ria
Leso
tho
Cam
eroo
n
Ethi
opia
Beni
n
Ango
la
Liby
a
Seyc
helle
s
eSw
atin
i
Ugan
da
Mor
occo
Egyp
t
Gam
bia
Ghan
a
Mal
i
Suda
n
Sout
h Af
rica
Libe
ria
Burk
ina
Faso
Keny
a
Tuni
sia
Com
oros
Mau
ritiu
s
Nam
ibia
Sene
gal
Mad
agas
car
Som
alia
Chad
Nige
r
Bots
wan
a
Moz
ambi
que
Gabo
n
Sier
ra L
eone
Cote
d'Iv
oire
Mau
ritan
ia
Guin
ea B
issa
u
Guin
ea
Equa
toria
l Gui
nea
Cape
Ver
de
Cost
of c
emen
t (US
$)
201820172016201520142013201220112010
17
Africa Housing Finance Yearbook 2018
300
250
200
150
100
50
0
20
15
10
5
0
NUMBER OF DAYS, AND COST OF REGISTERING A COMMERCIAL PROPERTY: 2012 vs 2018
Source: World Bank Doing Business Indicators http://www.doingbusiness.org/
Days
to re
gist
er p
rope
rty 2
018
Cost
as
% o
f pro
perty
val
ue 2
018
n Days to register property 2012 n Days to register property 2018 l Cost as % of property value 2012 Cost as % of property value 2018
Rwan
daSu
dan
Mau
ritiu
seS
wat
ini
Cabo
Ver
deM
oroc
coBu
rund
iEq
uato
rial G
uine
aSo
uth
Afric
aBo
tsw
ana
Mal
iCo
mor
osCô
te d
'Ivoi
reSe
yche
lles
Nige
rZi
mba
bwe
Dem
ocra
tic R
epub
lic o
f Con
goDj
ibou
tiTu
nisi
aM
ozam
biqu
eUg
anda
Leso
tho
Chad
Guin
eaLi
beria
Zam
bia
Ghan
aGu
inea
-Bis
sau
Mau
ritan
iaSo
uth
Suda
nEt
hiop
iaNa
mib
iaSã
o To
mé
and
Prín
cipe
Alge
riaCo
ngo,
Rep
.Se
nega
lSi
erra
Leo
neKe
nya
Gam
bia,
The
Burk
ina
Faso
Tanz
ania
Mal
awi
Cent
ral A
frica
n Re
publ
icEg
ypt,
Arab
Rep
ublic
Nige
ria _
Lag
osEr
itrea
Cam
eroo
nM
adag
asca
rGa
bon
Beni
nSo
mal
iaAn
gola
Togo

18
*Note: Different market segments will engage in different housing processes involving different value chains and different finance moments – this diagram is purely illustrative.
41 Wood, D (2018). The Housing Investment Landscape in the Southern African Development Community. www.housingfinanceafrica.org (forthcoming).42 The Central Bank of Kenya conducts an annual Residential Mortgage Market Survey and reports on this in its annual bank supervision report. See
https://www.centralbank.go.ke/uploads/banking_sector_annual_reports/873911276_2017%20Annual%20Report.pdf . The Bank of Tanzania produces quarterly mortgage market updates in cooperation with the Tanzania MortgageRefinance Company. See https://www.bot.go.tz/Adverts/Tanzania%20Mortgage%20Market%20Update%2030%20June%2018%20-Revised%20Draft.pdf (Both accessed 14 Oct 2018).
It is all still rather opaque, however. CAHF has worked hard to extract housing
investment data from the portfolios of investors – banks, microfinance institutions,
pension funds, private equity investors, DFIs, governments, and so on – and for
the SADC region has identified 327 separate investments. We are also currently
working on a similar tracker for North and West Africa, and for East and Central
Africa. The data is drawn from annual reports, websites, interviews, and news
reports; there is no single source. This has the effect of each investment being a
singular event. Without the benefit of trends analysis, investors’ ability to
understand and quantify risk is therefore undermined, and return expectations
get amplified to accommodate the uncertainty.
Perhaps the most critical intervention that governments, as well as DFIs, can make
in support of greater investment in affordable housing, therefore, is in data.
Governments can use their regulatory function to require focused reporting on
loan origination, performance and impact; on investment targets, use of funds and
investment performance; on market performance of housing once delivered, and
so on. In Kenya and Tanzania, the Central Bank regularly reports on mortgage
market development.42 This should be a standard practice of all Central Banks
and a key part of their regulatory function. Capital markets authorities should
Investor responsivenessStill, there is progress. Investors have been watching the emerging innovation, noting this moment of political and policy will, and responding with efforts of their own to
maximise the opportunities as they emerge. The housing value chain intersects with the housing financing chain on the basis of market certainty – as innovation appears in
each link along the chain, investors look for ways to leverage that success in terms of their own strategies up the financing chain. Policy-makers can direct investor attention
to specific niches by creating certainty in the policy and economic context. and by taking steps to highlight and publicise those opportunities.
CAHF has found that in the past ten years, the top twenty investments committed
into housing in the SADC region was more than US$8 819 million. Development
Finance Institutions (DFIs) play an important role in facilitating these investments
into the markets: the largest investor by far has been the African Development Bank,
with a 14 percent share of the total invested.41 Beyond that, however, the diversity
of investors is interesting. Government employee pension funds have been
increasing their participation, and while international investors (notably the Chinese,
but also European) are prevalent, there has also been a growing number of private
sector local investors, suggesting a domestic appetite for housing investments.
Investments in the SADC region are primarily equity (47.55 percent) and debt
(50.14 percent). The top equity investment focus (36 percent of all equity
investments in housing in the SADC region) is housing construction, followed by
housing microlending (30 percent), housing finance (23 percent) and support for
the financial sector (11 percent). The majority of debt allocations are for housing
microlending (35 percent), followed by support for the financial sector (20 percent),
housing construction (16 percent), housing finance (15 percent), infrastructure
(12 percent), and slum upgrading (2 percent). The primary focus of technical
assistance allocations is on slum upgrading (49 percent).
Fun
ding
inst
rum
ents
Fin
ance
inst
rum
ents
Ho
usin
g de
liver
y va
lue
chai
n (f
orm
al &
info
rmal
)
Investors/creditors: private equity, pension funds, insurance companies, development financeinstitutions, wholesale debt, etc. National or
municipal tax base
Capital markets
National or municipal tax base
Public sector agencies / banks / pension funds / non-bank financial institutions / guarantors developers / rental housing institutions / etc.
Financemoment
Financemoment
Financemoment
Financemoment
Financemoment
Financemoment
Financemoment
Construction / developer financing
Municipal land and infrastructure financing Supply-side subsidies
Guarantees or insurance
Municipal orcommunity financing
Private sector financingEnd-user financing (mortgage / non-mortgage) and savings
Land assembly /acquisition
Title / tenure
Bulk Infrastructure
House construction
Sales & transfer
Maintenance & ongoing
improvements
Social and economicinfrastructure
Demand-side subsidies
Housing delivery value chain
Hous
ing
finan
cing
cha
in

19
Africa Housing Finance Yearbook 2018
Name Investor categoryApprox investments
(2008-2017) US$ millions
Typical instrument
1 African Development Bank DFI 1 280.33 Debt
2 Government Employees Pension Fund, South Africa Pension Fund 792.00 Debt
3 European Investment Bank (EIB) DFI 791.08 Debt
4 Overseas Private Investment Corporation (OPIC) DFI 759.40 Debt
5 International Finance Corporation (IFC) DFI 653.31 Debt & Equity
6 Rabobank Bank 631.90 Equity
7 CITIC Limited Private Company 607.00 Equity
8 Henan Guoju Private Company 456.00 Equity
9 Sinomach Private Company 420.00 Debt
10 Capricorn Investment Holdings Publicly Listed Company 400.07 Equity
11 Zambian Government Government 364.73 Equity
12 China EXIM Bank Bank 328.00 Debt
13 Government Institutions Pension Fund, Namibia Pension Fund 255.57 Equity
14 World Bank/ International Development Association (IDA) DFI 195.15 Debt
15 National Housing Finance Corporation (NHFC), South Africa Government 181.48 Equity
16 Industrial and Commercial Bank of China Limited (ICBC) Bank 157.00 Debt
17 National Pension Scheme Authority, NAPSA Zambia Pension Fund 154.83 Equity
18 Helios Credit Partners Private Equity 140.00 Debt & Equity
19 Commonwealth Development Corporation (CDC) DFI 131.89 Debt & Equity
20 Sun Share Investments PPP w Government Private Company 120.00 Equity
Total 8 819.74
TABLE 1: TOP 20 INVESTORS IN HOUSING AND HOUSING FINANCE IN THE SADC REGION, BY US$ MILLIONS INVESTED
Source: CAHF Research
similarly report on the progress of investments in residential real estate, segmenting
by target market, to assist investors in making their decisions. DFIs and other
impact investors who seek to promote the development of the affordable housing
sector should explicitly track the progress of their investments, and use their
investments to insist on transparency so that the key fundamentals are well-known
and understood in the investment community. Supply-side tracking is also
important: the nature and progress of incremental housing construction, the size
and structure of the rental market, the structure and performance of public private
partnerships, and so on. This will be a primary effort of CAHF as we move
forward into the next phase of our work.
In summary, innovation along the housing value chain is clearly evident, expressed
in local niche markets and across the continent. We can leverage this experience
and replicate it in other contexts if we track it, creating baseline information that
highlights new opportunities for the investor interest that is clearly there. This is
a job for the entire housing sector.

20
0% 100%
% urban
Proportion of urban households who might affordthe cheapest (in US$) newly built house by a privatedeveloper, given current mortgage financingarrangements.
AlgeriaUS$27 311
79%
AngolaUS$84 388
10%
BeninUS$15 321
9%
BotswanaUS$54 052
20%
Burkina FasoUS$9 444
35%
BurundiUS$31 668
1%
CameroonUS$20 615
4%
Cabo VerdeUS$29 751
30%
Central African RepublicUS$23 099
3%
ChadUS$51 538
1%
Congo, Rep.n/a
Cote d'IvoireUS$21 474
46%
Congo, Dem. Rep.US$21 889
2%
Egypt, Arab Rep.US$14 966
89%
Equatorial GuineaUS$35 240
64%
EthiopiaUS$62 500
1%
GabonUS$37 650
70%
GambiaUS$20 338
3%
GhanaUS$22 727
7%
GuineaUS$19 194
3%
KenyaUS$11 170
51%
LesothoUS$16 142
18%
LiberiaUS$7 778
0%
LibyaUS$49 286
27%
MadagascarUS$149 538
1%
Guinea BissauUS$1 692 414
3%
MalawiUS$20 540
1%
MaliUS$23 326
2%
MauritaniaUS$29 002
3%
MauritiusUS$35 362
94%
MoroccoUS$14 433
95%
MozambiqueUS$51 913
1%
NamibiaUS$21 053
48%
Niger US$12 884
2%
NigeriaUS$16 351
39%
RwandaUS$21 046
4%Sao Tomé and PríncipeUS$69 078
1%
Sierra LeoneUS$20 506
8%
SudanUS$27 143
68%
TanzaniaUS$17 034
3%
ZimbabweUS$18 000
25%
ZambiaUS$68 421
8%
UgandaUS$21 540
4%
TunisiaUS$14 433
95%
South SudanUS$43 233
3%
South AfricaUS$26 466
34%
SenegalUS$ 17 179
64%
SeychellesUS$55 147
55%
PERCENT URBAN HOUSEHOLDS WHO CAN AFFORD CHEAPEST NEWLY BUILT HOUSE (2018)
TogoUS$12 025
23%
EritreaUS$84 406
2%Djibouti
US$77 28812%
eSwatiniUS$57 368
34%
US$ exchange rate (28 July 2018).
SomaliaUS$1 730
n/a
SeychellesUS$35 699
16%
Understanding HousingAffordability
Housing affordability is a function
of three things: household
income, the price of the house
and the terms of the finance.
Across Africa, the confluence of
low urban household incomes,
high mortgage interest rates, and
short tenors results in very low
housing affordability. There are
very few countries where the
cheapest newly built house by a
formal developer serves the
majority of the urban population.
In Kenya, a 16m2 bedsitter unit
delivered by Suraya Properties is
offered for sale at approximately
US$11 500. If this property were
available across the continent,
financeable by local mortgages,
what percentage of the urban
population might afford to enter
the property market?
Clearly the challenge is not just
about smaller, cheaper units. It is
also about improved macro-
economic conditions that reduce
the cost (and increase the
availability) of mortgage finance,
and enable a wider population to
access affordable housing. And,
while finance subsidies might
address affordability in the short
term, however, these are unlikely
to be sustainable. The affordable
housing challenge is also about
creating the economic, policy
and regulatory conditions for the
supply of non-mortgage housing
finance that support incremental
housing processes: in very many
places, this is all that households
will be able to afford.
The national household income
distributions illustrated in the
following pages use data from
the Canback Global Income
Distribution Database, 2017
consumption data for household
in PPP$.
0% 100%
% urban
Proportion of urban households who might afford aUS$11 500 house, given current mortgage financingarrangements
Algeria99%
Angola53%
Benin9%
Botswana78%
Burkina Faso16%
Burundi12%
Cameroon15%
Cabo Verde62%
Central African Republic7%
Chad5%
Congo, Rep.2%
Cote d'Ivoire46%
Congo, Dem. Rep.2%
Egypt, Arab Rep.99%
Equatorial Guinea96%
Ethiopia2%
Gabon97%
Gambia8%
Ghana22%
Guinea3%
Kenya51%
Lesotho39%
Liberia1%
Libya99%
Madagascar4%
Guinea Bissau18%
Malawi1%
Mali12%
Mauritania40%
Mauritius100%
Morocco95%
Mozambique1%
Namibia76%
Niger 9%
Nigeria39%
Rwanda10%
Sao Tomé and Príncipe71%
Sierra Leone20%
Sudan96%
Tanzania8%
Zimbabwe44%
Zambia17%
Uganda12%
Tunisia90%
South Sudan3%
South Africa55%
Senegal64%
Seychelles99%
PERCENT URBAN HOUSEHOLDS WHO CAN AFFORD A US$11 500 HOUSE (2018)
Togo23%
Eritrea56%
Djibouti93%
eSwatini94%
US$ exchange rate (28 July 2018).

Africa Housing Finance Yearbook 2018
21
PPP$40 001 – PPP$10 000 000
PPP$23 001 – PPP$40 000
PPP$12 001 – PPP$23 000
PPP$8 001 – PPP$12 000
PPP$5 001 – PPP$8 000
PPP$3 601 – PPP$5 000
PPP$2 401 – PPP$3 600
PPP$1 601 – PPP$2 400
PPP$801 – PPP$1 600
<PPP$800
AFRICAAnnual income profile for rural and urban households based on consumption (PPP$)
No. of households (thousands)Rural Urban
30 000 20 000 10 000 0 10 000 20 000 30 000
An explanation of the approach used to compare housing affordability in different African countries
The task of comparing housing affordability across different African countries is made more difficult because the cost of houses, and the incomes used topay for them, are usually denominated in the local currency of the countries included in the analysis. For this reason, previous editions of this Yearbookconverted relevant elements of the affordability calculations into a single, internationally-accepted currency – the United States dollar – using prevailingmarket exchange rates. However, some countries have fixed or pegged official exchange rate systems that operate in conjunction with parallel or “blackmarket” rates that often provide a more accurate reflection of economic fundamentals. For example, at the start of 2018, Angola had an official exchangerate of approximately Kz165/US$ and a parallel market rate of more than Kz400/US$. Those importers able to import at the official rate had a substantialadvantage over those that had to use the parallel market.
In addition, exchange rate movements are seldom consistent with inflation differentials, and market exchange rates tend to be far more volatile over timethan both house prices and incomes expressed in local currency terms. This is especially true of countries – of which there are a number of examples inAfrica – with comparatively narrow export bases whose currencies are unduly affected by the prevailing prices of their primary export commodities oninternational markets. Nigeria is a good example of this. Between May 2016 and May 2017, the Naira weakened against the US dollar by more than58 percent, but over the same period inflation in Nigeria was more than 16 percent while in the United States it was less than 2 percent. To reflectrelative purchasing power, the Naira should only have weakened against the US dollar by approximately 14 percent. If house prices in Nigeria moved intandem with consumer prices over this period, they would have increased by 16.3 percent in local currency, but in US dollar terms they would havedropped by 27 percent. In the subsequent twelve months (May 2017 to May 2018), the Naira weakened by a further 14 percent against the US dollarwhile the inflation differential between the two countries dropped to just under 9 percent. In local currency terms, house prices would have increasedby 11.6 percent if they matched CPI inflation, but in US dollar terms they would have dropped by a further 2 percent.
Because of the distortions that the use of prevailing market exchange rates can give rise to, it was decided to convert the affordability calculations in thisYearbook into international purchasing power parity (PPP) dollars. A PPP dollar is a notional currency that reflects the rate at which the currency ofone country would have to be converted into that of another country to buy the same amount of goods and services in each country. Consistent useof PPP dollars over time will not only significantly reduce the volatility that was inherent in the previous US$-based calculations, but will also provide amore accurate reflection of the relative affordability of housing in each of the African countries included in the analysis – both in a particular year, and overtime. Comparing the relative affordability of housing across different African countries will also be more accurate and meaningful.
The housing affordability calculations in this Yearbook make use of the average costs of an affordable housing unit in each country, prevailing minimumdownpayment requirements and mortgage rates, typical mortgage terms and the distribution of household incomes in both urban and rural areas. Thehouse costs, downpayment and household incomes are all valued in PPP dollars using exchange rates calculated by the World Bank.
A further refinement in this Yearbook is that the estimates of household income are based on declared household expenditure (or consumption), ratherthan declared incomes. Household expenditure data takes account of informal income and is generally regarded as a more accurate measure becausesurvey respondents are less inclined to undercount their expenditure than they are their incomes. Note that affordability calculations based on householdconsumption may not translate into mortgage access. Lenders still need to learn how to underwrite for informal incomes and are more likely to determinemortgage affordability on the basis of formal wage income.
CAHF uses the Canback Global Income Distribution Database (CGIDD) to calculate the affordability graphs in this Yearbook. For more information, orto download the data directly, visit www.cgidd.com
Keith Lockwood
The cost of the cheapest newly built house by a private developer is reflected here in PPP$, to enable cross-country comparisons.Local currency costs are reflected in the country profiles.

22
PPP$40 001 – PPP$10 000 000
PPP$23 001 – PPP$40 000
PPP$12 001 – PPP$23 000
PPP$8 001 – PPP$12 000
PPP$5 001 – PPP$8 000
PPP$3 601 – PPP$5 000
PPP$2 401 – PPP$3 600
PPP$1 601 – PPP$2 400
PPP$801 – PPP$1 600
<PPP$800
- - - Average annual household income needed for the cheapest newly built house by a formal developer, 2017 Average annual household income using expenditure, 2017 (PPP$)
ALGERIAAnnual income profile for rural and urban households based on consumption (PPP$)
No. of households (thousands)
PPP$31 813
PPP$27 243
Rural Urban2 000 1 500 1 000 500 0 500 1 000 1 500 2 000
PPP$40 001 – PPP$10 000 000
PPP$23 001 – PPP$40 000
PPP$12 001 – PPP$23 000
PPP$8 001 – PPP$12 000
PPP$5 001 – PPP$8 000
PPP$3 601 – PPP$5 000
PPP$2 401 – PPP$3 600
PPP$1 601 – PPP$2 400
PPP$801 – PPP$1 600
<PPP$800
- - - Average annual household income needed for the cheapest newly built house by a formal developer, 2017 Average annual household income using expenditure, 2017 (PPP$)
ANGOLAAnnual income profile for rural and urban households based on consumption (PPP$)
No. of households (thousands)
PPP$16 858
PPP$110 204
Rural Urban800 600 400 200 0 200 400 600 800
PPP$40 001 – PPP$10 000 000
PPP$23 001 – PPP$40 000
PPP$12 001 – PPP$23 000
PPP$8 001 – PPP$12 000
PPP$5 001 – PPP$8 000
PPP$3 601 – PPP$5 000
PPP$2 401 – PPP$3 600
PPP$1 601 – PPP$2 400
PPP$801 – PPP$1 600
<PPP$800
- - - Average annual household income needed for the cheapest newly built house by a formal developer, 2017 Average annual household income using expenditure, 2017 (PPP$)
BENINAnnual income profile for rural and urban households based on consumption (PPP$)
No. of households (thousands)
PPP$10 543
PPP$22 244
Rural Urban250 200 150 100 50 0 50 100 150 200 250
PPP$40 001 – PPP$10 000 000
PPP$23 001 – PPP$40 000
PPP$12 001 – PPP$23 000
PPP$8 001 – PPP$12 000
PPP$5 001 – PPP$8 000
PPP$3 601 – PPP$5 000
PPP$2 401 – PPP$3 600
PPP$1 601 – PPP$2 400
PPP$801 – PPP$1 600
<PPP$800
- - - Average annual household income needed for the cheapest newly built house by a formal developer, 2017 Average annual household income using expenditure, 2017 (PPP$)
BOTSWANAAnnual income profile for rural and urban households based on consumption (PPP$)
No. of households (thousands)
PPP$42 749
PPP$20 817
Rural Urban80 60 40 20 0 20 40 60 80
Population: 42 091 478
Urbanisation rate: 2.26%
Cost of cheapestnewly built house:
3 031 490 DZDPPP$101 050
Urban householdsthat could afford thishouse with finance:
79.15%
1 PPP$: 30 Algerian dinar
Population: 29 784 193
Urbanisation rate: 4.99%
Cost of cheapestnewly built house:
14 000 000 AOAPPP$129 271
Urban householdsthat could afford thishouse with finance:
9.66%
1 PPP$: 108.3 Kwanza
Population: 11 175 692
Urbanisation rate: 3.77%
Cost of cheapestnewly built house:
8 900 000 CFAPPP$41 843
Urban householdsthat could afford thishouse with finance:
8.97%
1 PPP$: 212.7 CFA franc
Population: 2 024 787
Urbanisation rate: 2.30%
Cost of cheapestnewly built house:
556 740 BWPPPP$123 720
Urban householdsthat could afford thishouse with finance:
19.97%
1 PPP$: 4.5 Pula

PPP$40 001 – PPP$10 000 000
PPP$23 001 – PPP$40 000
PPP$12 001 – PPP$23 000
PPP$8 001 – PPP$12 000
PPP$5 001 – PPP$8 000
PPP$3 601 – PPP$5 000
PPP$2 401 – PPP$3 600
PPP$1 601 – PPP$2 400
PPP$801 – PPP$1 600
<PPP$800
- - - Average annual household income needed for the cheapest newly built house by a formal developer, 2017 Average annual household income using expenditure, 2017 (PPP$)
BURKINA FASOAnnual income profile for rural and urban households based on consumption (PPP$)
No. of households (thousands)
PPP$9 598
PPP$8 530
Rural Urban600 400 200 0 200 400 600
PPP$40 001 – PPP$10 000 000
PPP$23 001 – PPP$40 000
PPP$12 001 – PPP$23 000
PPP$8 001 – PPP$12 000
PPP$5 001 – PPP$8 000
PPP$3 601 – PPP$5 000
PPP$2 401 – PPP$3 600
PPP$1 601 – PPP$2 400
PPP$801 – PPP$1 600
<PPP$800
- - - Average annual household income needed for the cheapest newly built house by a formal developer, 2017 Average annual household income using expenditure, 2017 (PPP$)
BURUNDIAnnual income profile for rural and urban households based on consumption (PPP$)
No. of households (thousands)
PPP$7 125
PPP$40 749
Rural Urban500 400 300 200 100 0 100 200 300 400 500
PPP$40 001 – PPP$10 000 000
PPP$23 001 – PPP$40 000
PPP$12 001 – PPP$23 000
PPP$8 001 – PPP$12 000
PPP$5 001 – PPP$8 000
PPP$3 601 – PPP$5 000
PPP$2 401 – PPP$3 600
PPP$1 601 – PPP$2 400
PPP$801 – PPP$1 600
<PPP$800
- - - Average annual household income needed for the cheapest newly built house by a formal developer, 2017 Average annual household income using expenditure, 2017 (PPP$)
CABO VERDEAnnual income profile for rural and urban households based on consumption (PPP$)
No. of households (thousands)
PPP$13 624
PPP$31 122
Rural Urban25 20 15 10 5 0 5 10 15 20 25
PPP$40 001 – PPP$10 000 000
PPP$23 001 – PPP$40 000
PPP$12 001 – PPP$23 000
PPP$8 001 – PPP$12 000
PPP$5 001 – PPP$8 000
PPP$3 601 – PPP$5 000
PPP$2 401 – PPP$3 600
PPP$1 601 – PPP$2 400
PPP$801 – PPP$1 600
<PPP$800
- - - Average annual household income needed for the cheapest newly built house by a formal developer, 2017 Average annual household income using expenditure, 2017 (PPP$)
CAMEROONAnnual income profile for rural and urban households based on consumption (PPP$)
No. of households (thousands)
PPP$18 986
PPP$34 334
Rural Urban800 600 400 200 0 200 400 600 800
Population: 19 193 382
Urbanisation rate: 5.54%
Cost of cheapestnewly built house:
5 500 000 XOF PPP$26 328
Urban householdsthat could afford thishouse with finance:
34.93%
1 PPP$: 208.9 CFA franc
Population: 10 864 245
Urbanisation rate: 5.64%
Cost of cheapestnewly built house:
54 757 890 BIFPPP$76 275
Urban householdsthat could afford thishouse with finance:
0.73%
1 PPP$:717.9 Burundi
franc
Population: 560 899
Urbanisation rate: 1.97%
Cost of cheapestnewly built house:
2 912 634 CVEPPP$63 318
Urban householdsthat could afford thishouse with finance:
29.70%
1 PPP$:46 Cape Verdean
Escudo
Population: 24 994 885
Urbanisation rate: 3.63%
Cost of cheapestnewly built house:
12 000 000 XAFPPP$52 632
Urban householdsthat could afford thishouse with finance:
4.42%
1 PPP$: 228 CFA franc
23
Africa Housing Finance Yearbook 2018

24
PPP$40 001 – PPP$10 000 000
PPP$23 001 – PPP$40 000
PPP$12 001 – PPP$23 000
PPP$8 001 – PPP$12 000
PPP$5 001 – PPP$8 000
PPP$3 601 – PPP$5 000
PPP$2 401 – PPP$3 600
PPP$1 601 – PPP$2 400
PPP$801 – PPP$1 600
<PPP$800
- - - Average annual household income needed for the cheapest newly built house by a formal developer, 2017 Average annual household income using expenditure, 2017 (PPP$)
CENTRAL AFRICAN REPUBLICAnnual income profile for rural and urban households based on consumption (PPP$)
No. of households (thousands)
PPP$4 963
PPP$25 985
Rural Urban120 100 80 60 40 20 0 20 40 60 80 100 120
PPP$40 001 – PPP$10 000 000
PPP$23 001 – PPP$40 000
PPP$12 001 – PPP$23 000
PPP$8 001 – PPP$12 000
PPP$5 001 – PPP$8 000
PPP$3 601 – PPP$5 000
PPP$2 401 – PPP$3 600
PPP$1 601 – PPP$2 400
PPP$801 – PPP$1 600
<PPP$800
- - - Average annual household income needed for the cheapest newly built house by a formal developer, 2017 Average annual household income using expenditure, 2017 (PPP$)
CHADAnnual income profile for rural and urban households based on consumption (PPP$)
No. of households (thousands)
PPP$8 587
PPP$109 002
Rural Urban500 400 300 200 100 0 100 200 300 400 500
PPP$40 001 – PPP$10 000 000
PPP$23 001 – PPP$40 000
PPP$12 001 – PPP$23 000
PPP$8 001 – PPP$12 000
PPP$5 001 – PPP$8 000
PPP$3 601 – PPP$5 000
PPP$2 401 – PPP$3 600
PPP$1 601 – PPP$2 400
PPP$801 – PPP$1 600
<PPP$800
- - - Average annual household income needed for the cheapest newly built house by a formal developer, 2017 Average annual household income using expenditure, 2017 (PPP$)
COMOROSAnnual income profile for rural and urban households based on consumption (PPP$)
No. of households (thousands)
PPP$20 476
PPP$35 096
Rural Urban30 20 10 0 10 20 30
PPP$40 001 – PPP$10 000 000
PPP$23 001 – PPP$40 000
PPP$12 001 – PPP$23 000
PPP$8 001 – PPP$12 000
PPP$5 001 – PPP$8 000
PPP$3 601 – PPP$5 000
PPP$2 401 – PPP$3 600
PPP$1 601 – PPP$2 400
PPP$801 – PPP$1 600
<PPP$800
- - - Average annual household income needed for the cheapest newly built house by a formal developer, 2017 Average annual household income using expenditure, 2017 (PPP$)
CONGO REPUBLICAnnual income profile for rural and urban households based on consumption (PPP$)
No. of households (thousands)
PPP$5 240
Rural Urban120 100 80 60 40 20 0 20 40 60 80 100 120
Population: 5 625 118
Urbanisation rate: 2.73%
Cost of cheapestnewly built house:
13 445 760 XAFPPP$40 077
Urban householdsthat could afford thishouse with finance:
3.27%
1 PPP$: 335.5 CFA franc
Population: 14 649 076
Urbanisation rate: 3.77%
Cost of cheapestnewly built house:
30 000 000 XAFPPP$149 328
Urban householdsthat could afford thishouse with finance:
1.44%
1 PPP$: 200.9 CFA franc
Population: 813 912
Urbanisation rate: 2.73%
Cost of cheapestnewly built house:
15 000 000 KMFPPP$66 348
Urban householdsthat could afford thishouse with finance:
15.61%
1 PPP$:226 Comorian
franc
Population: 5 396 963
Urbanisation rate: 3.02%
Cost of cheapestnewly built house:
n/a
Urban householdsthat could afford thishouse with finance:
n/a
1 PPP$:578 Central
African francs

25
Africa Housing Finance Yearbook 2018
PPP$40 001 – PPP$10 000 000
PPP$23 001 – PPP$40 000
PPP$12 001 – PPP$23 000
PPP$8 001 – PPP$12 000
PPP$5 001 – PPP$8 000
PPP$3 601 – PPP$5 000
PPP$2 401 – PPP$3 600
PPP$1 601 – PPP$2 400
PPP$801 – PPP$1 600
<PPP$800
- - - Average annual household income needed for the cheapest newly built house by a formal developer, 2017 Average annual household income using expenditure, 2017 (PPP$)
COTE D'IVOIREAnnual income profile for rural and urban households based on consumption (PPP$)
No. of households (thousands)
PPP$17 584
PPP$15 091
Rural Urban800 600 400 200 0 200 400 600 800
PPP$40 001 – PPP$10 000 000
PPP$23 001 – PPP$40 000
PPP$12 001 – PPP$23 000
PPP$8 001 – PPP$12 000
PPP$5 001 – PPP$8 000
PPP$3 601 – PPP$5 000
PPP$2 401 – PPP$3 600
PPP$1 601 – PPP$2 400
PPP$801 – PPP$1 600
<PPP$800
- - - Average annual household income needed for the cheapest newly built house by a formal developer, 2017 Average annual household income using expenditure, 2017 (PPP$)
DEMOCRATIC REPUBLIC OF CONGOAnnual income profile for rural and urban households based on consumption (PPP$)
No. of households (thousands)
PPP$5 996
PPP$21 961
Rural Urban3 000 2 000 1 500 1 000 500 0 500 1 000 1 500 2 000 3 000
PPP$40 001 – PPP$10 000 000
PPP$23 001 – PPP$40 000
PPP$12 001 – PPP$23 000
PPP$8 001 – PPP$12 000
PPP$5 001 – PPP$8 000
PPP$3 601 – PPP$5 000
PPP$2 401 – PPP$3 600
PPP$1 601 – PPP$2 400
PPP$801 – PPP$1 600
<PPP$800
- - - Average annual household income needed for the cheapest newly built house by a formal developer, 2017 Average annual household income using expenditure, 2017 (PPP$)
DJIBOUTIAnnual income profile for rural and urban households based on consumption (PPP$)
No. of households (thousands)
PPP$19 290
PPP$39 075
Rural Urban40 30 20 10 0 10 20 30 40
PPP$40 001 – PPP$10 000 000
PPP$23 001 – PPP$40 000
PPP$12 001 – PPP$23 000
PPP$8 001 – PPP$12 000
PPP$5 001 – PPP$8 000
PPP$3 601 – PPP$5 000
PPP$2 401 – PPP$3 600
PPP$1 601 – PPP$2 400
PPP$801 – PPP$1 600
<PPP$800
- - - Average annual household income needed for the cheapest newly built house by a formal developer, 2017 Average annual household income using expenditure, 2017 (PPP$)
EGYPT, ARAB REP.Annual income profile for rural and urban households based on consumption (PPP$)
No. of households (thousands)
PPP$34 601
PPP$21 964
Rural Urban6 000 4 000 2 000 0 2 000 4 000 6 000
Population: 24 294 750
Urbanisation rate: 3.72%
Cost of cheapestnewly built house:
12 500 000 CFAPPP$52 062
Urban householdsthat could afford thishouse with finance:
19.45%
1 PPP$: 244.8 CFA franc
Population: 84 260 069
Urbanisation rate: 5.10%
Cost of cheapestnewly built house:
32 400 000 CDFPPP$42 414
Urban householdsthat could afford thishouse with finance:
2.45%
1 PPP$:180.1 Congolese
franc
Population: 865 267
Urbanisation rate: 1.67%
Cost of cheapestnewly built house:
13 734 000 DJFPPP$140 000
Urban householdsthat could afford thishouse with finance:
11.91%
1 PPP$:98.1 Djiboutian
franc
Population: 97 200 000
Urbanisation rate: 4.31%
Cost of cheapestnewly built house:
220 000 EGPPPP$70 968
Urban householdsthat could afford thishouse with finance:
89.09%
1 PPP$:3.1 Egyptian
pound

- - - Average annual household income needed for the cheapest newly built house by a formal developer, 2017 Average annual household income using expenditure, 2017 (PPP$)
EQUATORIAL GUINEAAnnual income profile for rural and urban households based on consumption (PPP$)
PPP$40 001 – PPP$10 000 000
PPP$23 001 – PPP$40 000
PPP$12 001 – PPP$23 000
PPP$8 001 – PPP$12 000
PPP$5 001 – PPP$8 000
PPP$3 601 – PPP$5 000
PPP$2 401 – PPP$3 600
PPP$1 601 – PPP$2 400
PPP$801 – PPP$1 600
<PPP$800
- - - Average annual household income needed for the cheapest newly built house by a formal developer, 2017 Average annual household income using expenditure, 2017 (PPP$)
ESWATINIAnnual income profile for rural and urban households based on consumption (PPP$)
No. of households (thousands)
PPP$26 762
PPP$60 066
Rural Urban50 40 30 20 10 0 10 20 30 40 50
PPP$40 001 – PPP$10 000 000
PPP$23 001 – PPP$40 000
PPP$12 001 – PPP$23 000
PPP$8 001 – PPP$12 000
PPP$5 001 – PPP$8 000
PPP$3 601 – PPP$5 000
PPP$2 401 – PPP$3 600
PPP$1 601 – PPP$2 400
PPP$801 – PPP$1 600
<PPP$800
- - - Average annual household income needed for the cheapest newly built house by a formal developer, 2017 Average annual household income using expenditure, 2017 (PPP$)
ETHIOPIAAnnual income profile for rural and urban households based on consumption (PPP$)
No. of households (thousands)
PPP$7 596
PPP$97 612
Rural Urban5 000 4 000 3 000 2 000 1 000 0 1 000 2 000 3 000 4 000 5 000
Population: 1 367 254
Urbanisation rate: 1.89%
Cost of cheapestnewly built house:
763 000 SZLPPP$149 608
Urban householdsthat could afford thishouse with finance:
34.43%
1 PPP$: 5.1 Lilangeni
Population: 105 350 020
Urbanisation rate: 4.64%
Cost of cheapestnewly built house:
1 400 000 ETBPPP$153 846
Urban householdsthat could afford thishouse with finance:
0.55%
1 PPP$: 9.1 Ethiopian birr
PPP$40 001 – PPP$10 000 000
PPP$23 001 – PPP$40 000
PPP$12 001 – PPP$23 000
PPP$8 001 – PPP$12 000
PPP$5 001 – PPP$8 000
PPP$3 601 – PPP$5 000
PPP$2 401 – PPP$3 600
PPP$1 601 – PPP$2 400
PPP$801 – PPP$1 600
<PPP$800No. of households (thousands)
PPP$10 517
PPP$28 613
50 40 30 20 10 0 10 20 30 40 50
Population: 1 300 000
Urbanisation rate: 4.28%
Cost of cheapestnewly built house:
20 513 058 XAFPPP$88 801
Urban householdsthat could afford thishouse with finance:
64.15%
1 PPP$: 231 CFA franc
PPP$40 001 – PPP$10 000 000
PPP$23 001 – PPP$40 000
PPP$12 001 – PPP$23 000
PPP$8 001 – PPP$12 000
PPP$5 001 – PPP$8 000
PPP$3 601 – PPP$5 000
PPP$2 401 – PPP$3 600
PPP$1 601 – PPP$2 400
PPP$801 – PPP$1 600
<PPP$800
- - - Average annual household income needed for the cheapest newly built house by a formal developer, 2017 Average annual household income using expenditure, 2017 (PPP$)
ERITREA Annual income profile for rural and urban households based on consumption (PPP$)
No. of households (thousands)
PPP$11 092
PPP$67 110
Rural Urban250 200 150 100 50 0 50 100 150 200 250
Population: 5 918 919
Urbanisation rate: 3.90%
Cost of cheapestnewly built house:
1 265 248 ERNPPP$213 364
Urban householdsthat could afford thishouse with finance:
1.85%
1 PPP$: 5.9 Nakfa
26

27
Africa Housing Finance Yearbook 2018
PPP$40 001 – PPP$10 000 000
PPP$23 001 – PPP$40 000
PPP$12 001 – PPP$23 000
PPP$8 001 – PPP$12 000
PPP$5 001 – PPP$8 000
PPP$3 601 – PPP$5 000
PPP$2 401 – PPP$3 600
PPP$1 601 – PPP$2 400
PPP$801 – PPP$1 600
<PPP$800
- - - Average annual household income needed for the cheapest newly built house by a formal developer, 2017 Average annual household income using expenditure, 2017 (PPP$)
GABONAnnual income profile for rural and urban households based on consumption (PPP$)
No. of households (thousands)
PPP$20 511
PPP$24 963
Rural Urban150 100 50 0 50 100 150
PPP$40 001 – PPP$10 000 000
PPP$23 001 – PPP$40 000
PPP$12 001 – PPP$23 000
PPP$8 001 – PPP$12 000
PPP$5 001 – PPP$8 000
PPP$3 601 – PPP$5 000
PPP$2 401 – PPP$3 600
PPP$1 601 – PPP$2 400
PPP$801 – PPP$1 600
<PPP$800
- - - Average annual household income needed for the cheapest newly built house by a formal developer, 2017 Average annual household income using expenditure, 2017 (PPP$)
GAMBIA, THEAnnual income profile for rural and urban households based on consumption (PPP$)
No. of households (thousands)
PPP$10 496
PPP$36 594
Rural Urban40 30 20 10 0 10 20 30 40
PPP$40 001 – PPP$10 000 000
PPP$23 001 – PPP$40 000
PPP$12 001 – PPP$23 000
PPP$8 001 – PPP$12 000
PPP$5 001 – PPP$8 000
PPP$3 601 – PPP$5 000
PPP$2 401 – PPP$3 600
PPP$1 601 – PPP$2 400
PPP$801 – PPP$1 600
<PPP$800
- - - Average annual household income needed for the cheapest newly built house by a formal developer, 2017 Average annual household income using expenditure, 2017 (PPP$)
GHANAAnnual income profile for rural and urban households based on consumption (PPP$)
No. of households (thousands)
PPP$15 851
PPP$61 438
Rural Urban1 500 1 000 500 0 500 1 000 1 500
PPP$40 001 – PPP$10 000 000
PPP$23 001 – PPP$40 000
PPP$12 001 – PPP$23 000
PPP$8 001 – PPP$12 000
PPP$5 001 – PPP$8 000
PPP$3 601 – PPP$5 000
PPP$2 401 – PPP$3 600
PPP$1 601 – PPP$2 400
PPP$801 – PPP$1 600
<PPP$800
- - - Average annual household income needed for the cheapest newly built house by a formal developer, 2017 Average annual household income using expenditure, 2017 (PPP$)
GUINEAAnnual income profile for rural and urban households based on consumption (PPP$)
No. of households (thousands)
PPP$14 337
PPP$19 667
Rural Urban400 300 200 100 0 100 200 300 400
Population: 2 025 137
Urbanisation rate: 2.48%
Cost of cheapestnewly built house:
21 916 150 CFAPPP$94 793
Urban householdsthat could afford thishouse with finance:
34.37%
1 PPP$: 231.2 CFA franc
Population: 2 100 568
Urbanisation rate: 3.93%
Cost of cheapestnewly built house:
947 743 GMDPPP$72 347
Urban householdsthat could afford thishouse with finance:
3.27%
1 PPP$: 13.1 Dalasi
Population: 29 400 000
Urbanisation rate: 3.41%
Cost of cheapestnewly built house:
100 000 GHSPPP$66 667
Urban householdsthat could afford thishouse with finance:
7.37%
1 PPP$: 1.5 Ghanaian cedi
Population: 13 050 000
Urbanisation rate: 3.64%
Cost of cheapestnewly built house:
180 000 000 GNFPPP$53 159
Urban householdsthat could afford thishouse with finance:
12.33%
1 PPP$:3 386.1 Guinean
franc

28
PPP$40 001 – PPP$10 000 000
PPP$23 001 – PPP$40 000
PPP$12 001 – PPP$23 000
PPP$8 001 – PPP$12 000
PPP$5 001 – PPP$8 000
PPP$3 601 – PPP$5 000
PPP$2 401 – PPP$3 600
PPP$1 601 – PPP$2 400
PPP$801 – PPP$1 600
<PPP$800
- - - Average annual household income needed for the cheapest newly built house by a formal developer, 2017 Average annual household income using expenditure, 2017 (PPP$)
GUINEA-BISSAUAnnual income profile for rural and urban households based on consumption (PPP$)
No. of households (thousands)
PPP$8 693
PPP$2 168 955
Rural Urban35 30 25 20 15 10 5 0 5 10 15 20 25 30 35
PPP$40 001 – PPP$10 000 000
PPP$23 001 – PPP$40 000
PPP$12 001 – PPP$23 000
PPP$8 001 – PPP$12 000
PPP$5 001 – PPP$8 000
PPP$3 601 – PPP$5 000
PPP$2 401 – PPP$3 600
PPP$1 601 – PPP$2 400
PPP$801 – PPP$1 600
<PPP$800
- - - Average annual household income needed for the cheapest newly built house by a formal developer, 2017 Average annual household income using expenditure, 2017 (PPP$)
KENYAAnnual income profile for rural and urban households based on consumption (PPP$)
No. of households (thousands)
PPP$16 472
PPP$38 286
Rural Urban2 000 1 500 1 000 500 0 500 1 000 1 500 2 000
PPP$40 001 – PPP$10 000 000
PPP$23 001 – PPP$40 000
PPP$12 001 – PPP$23 000
PPP$8 001 – PPP$12 000
PPP$5 001 – PPP$8 000
PPP$3 601 – PPP$5 000
PPP$2 401 – PPP$3 600
PPP$1 601 – PPP$2 400
PPP$801 – PPP$1 600
<PPP$800
- - - Average annual household income needed for the cheapest newly built house by a formal developer, 2017 Average annual household income using expenditure, 2017 (PPP$)
LESOTHOAnnual income profile for rural and urban households based on consumption (PPP$)
No. of households (thousands)
PPP$13 435
PPP$18 006
Rural Urban80 60 40 20 0 20 40 60 80
PPP$40 001 – PPP$10 000 000
PPP$23 001 – PPP$40 000
PPP$12 001 – PPP$23 000
PPP$8 001 – PPP$12 000
PPP$5 001 – PPP$8 000
PPP$3 601 – PPP$5 000
PPP$2 401 – PPP$3 600
PPP$1 601 – PPP$2 400
PPP$801 – PPP$1 600
<PPP$800
- - - Average annual household income needed for the cheapest newly built house by a formal developer, 2017 Average annual household income using expenditure, 2017 (PPP$)
LIBERIAAnnual income profile for rural and urban households based on consumption (PPP$)
No. of households (thousands)
PPP$2 911
PPP$382 991
Rural Urban200 150 100 50 0 50 100 150 200
Population: 1 913 442
Urbanisation rate: 3.41%
Cost of cheapestnewly built house:
985 153 921 XOFPPP$3 975 601
Urban householdsthat could afford thishouse with finance:
3.11%
1 PPP$: 247.8 CFA franc
Population: 46 600 000
Urbanisation rate: 4.20%
Cost of cheapestnewly built house:
1 155 000 KESPPP$24 316
Urban householdsthat could afford thishouse with finance:
50.57%
1 PPP$:47.5 Kenyan
shilling
Population: 2 264 063
Urbanisation rate: 3.50%
Cost of cheapestnewly built house:
214 694 LSLPPP$42 939
Urban householdsthat could afford thishouse with finance:
17.78%
1 PPP$: 5 Loti
Population: 4 853 516
Urbanisation rate: 3.24%
Cost of cheapestnewly built house:
1 200 000 LRDPPP$670 803
Urban householdsthat could afford thishouse with finance:
0.01%
1 PPP$: 0.6 Liberian dollar

29
Africa Housing Finance Yearbook 2018
PPP$40 001 – PPP$10 000 000
PPP$23 001 – PPP$40 000
PPP$12 001 – PPP$23 000
PPP$8 001 – PPP$12 000
PPP$5 001 – PPP$8 000
PPP$3 601 – PPP$5 000
PPP$2 401 – PPP$3 600
PPP$1 601 – PPP$2 400
PPP$801 – PPP$1 600
<PPP$800
- - - Average annual household income needed for the cheapest newly built house by a formal developer, 2017 Average annual household income using expenditure, 2017 (PPP$)
LIBYAAnnual income profile for rural and urban households based on consumption (PPP$)
No. of households (thousands)
PPP$19 048
PPP$33 095
Rural Urban400 300 200 100 0 100 200 300 400
PPP$40 001 – PPP$10 000 000
PPP$23 001 – PPP$40 000
PPP$12 001 – PPP$23 000
PPP$8 001 – PPP$12 000
PPP$5 001 – PPP$8 000
PPP$3 601 – PPP$5 000
PPP$2 401 – PPP$3 600
PPP$1 601 – PPP$2 400
PPP$801 – PPP$1 600
<PPP$800
- - - Average annual household income needed for the cheapest newly built house by a formal developer, 2017 Average annual household income using expenditure, 2017 (PPP$)
MADAGASCARAnnual income profile for rural and urban households based on consumption (PPP$)
No. of households (thousands)
PPP$7 875
PPP$402 236
Rural Urban1 000 800 600 400 200 0 200 400 600 800 1 000
PPP$40 001 – PPP$10 000 000
PPP$23 001 – PPP$40 000
PPP$12 001 – PPP$23 000
PPP$8 001 – PPP$12 000
PPP$5 001 – PPP$8 000
PPP$3 601 – PPP$5 000
PPP$2 401 – PPP$3 600
PPP$1 601 – PPP$2 400
PPP$801 – PPP$1 600
<PPP$800
- - - Average annual household income needed for the cheapest newly built house by a formal developer, 2017 Average annual household income using expenditure, 2017 (PPP$)
MALAWIAnnual income profile for rural and urban households based on consumption (PPP$)
No. of households (thousands)
PPP$6 279
PPP$84 460
Rural Urban1 000 800 600 400 200 0 200 400 600 800 1 000
PPP$40 001 – PPP$10 000 000
PPP$23 001 – PPP$40 000
PPP$12 001 – PPP$23 000
PPP$8 001 – PPP$12 000
PPP$5 001 – PPP$8 000
PPP$3 601 – PPP$5 000
PPP$2 401 – PPP$3 600
PPP$1 601 – PPP$2 400
PPP$801 – PPP$1 600
<PPP$800
- - - Average annual household income needed for the cheapest newly built house by a formal developer, 2017 Average annual household income using expenditure, 2017 (PPP$)
MALIAnnual income profile for rural and urban households based on consumption (PPP$)
No. of households (thousands)
PPP$14 233
PPP$54 138
Rural Urban600 400 200 0 200 400 600
Population: 6 374 616
Urbanisation rate: 1.55%
Cost of cheapestnewly built house:
69 000 LYDPPP$115 000
Urban householdsthat could afford thishouse with finance:
7.92%
1 PPP$: 0.6 Libyan dinar
Population: 25 570 895
Urbanisation rate: 4.44%
Cost of cheapestnewly built house:
465 975 000 MGAPPP$517 061
Urban householdsthat could afford thishouse with finance:
1.30%
1 PPP$:901.2 Malagasy
ariary
Population: 19 209 248
Urbanisation rate: 3.80%
Cost of cheapestnewly built house:
15 000 000 MWKPPP$72 957
Urban householdsthat could afford thishouse with finance:
1.37%
1 PPP$:205.6 Malawian
kwacha
Population: 18 541 980
Urbanisation rate: 4.84%
Cost of cheapestnewly built house:
13 577 850 XOFPPP$62 571
Urban householdsthat could afford thishouse with finance:
2.33%
1 PPP$: 217 CFA franc

30
PPP$40 001 – PPP$10 000 000
PPP$23 001 – PPP$40 000
PPP$12 001 – PPP$23 000
PPP$8 001 – PPP$12 000
PPP$5 001 – PPP$8 000
PPP$3 601 – PPP$5 000
PPP$2 401 – PPP$3 600
PPP$1 601 – PPP$2 400
PPP$801 – PPP$1 600
<PPP$800
- - - Average annual household income needed for the cheapest newly built house by a formal developer, 2017 Average annual household income using expenditure, 2017 (PPP$)
MAURITANIAAnnual income profile for rural and urban households based on consumption (PPP$)
No. of households (thousands)
PPP$13 368
PPP$38 153
Rural Urban150 100 50 0 50 100 150
PPP$40 001 – PPP$10 000 000
PPP$23 001 – PPP$40 000
PPP$12 001 – PPP$23 000
PPP$8 001 – PPP$12 000
PPP$5 001 – PPP$8 000
PPP$3 601 – PPP$5 000
PPP$2 401 – PPP$3 600
PPP$1 601 – PPP$2 400
PPP$801 – PPP$1 600
<PPP$800
- - - Average annual household income needed for the cheapest newly built house by a formal developer, 2017 Average annual household income using expenditure, 2017 (PPP$)
MAURITIUSAnnual income profile for rural and urban households based on consumption (PPP$)
No. of households (thousands)
PPP$18 359
PPP$36 334
Rural Urban100 80 60 40 20 0 20 40 60 80 100
PPP$40 001 – PPP$10 000 000
PPP$23 001 – PPP$40 000
PPP$12 001 – PPP$23 000
PPP$8 001 – PPP$12 000
PPP$5 001 – PPP$8 000
PPP$3 601 – PPP$5 000
PPP$2 401 – PPP$3 600
PPP$1 601 – PPP$2 400
PPP$801 – PPP$1 600
<PPP$800
- - - Average annual household income needed for the cheapest newly built house by a formal developer, 2017 Average annual household income using expenditure, 2017 (PPP$)
MOROCCOAnnual income profile for rural and urban households based on consumption (PPP$)
No. of households (thousands)
PPP$8 595
PPP$25 035
Rural Urban1 500 1 000 500 0 500 1 000 1 500
PPP$40 001 – PPP$10 000 000
PPP$23 001 – PPP$40 000
PPP$12 001 – PPP$23 000
PPP$8 001 – PPP$12 000
PPP$5 001 – PPP$8 000
PPP$3 601 – PPP$5 000
PPP$2 401 – PPP$3 600
PPP$1 601 – PPP$2 400
PPP$801 – PPP$1 600
<PPP$800
- - - Average annual household income needed for the cheapest newly built house by a formal developer, 2017 Average annual household income using expenditure, 2017 (PPP$)
MOZAMBIQUEAnnual income profile for rural and urban households based on consumption (PPP$)
No. of households (thousands)
PPP$6 274
PPP$149 909
Rural Urban1 000 500 0 500 1 000
Population: 4 568 285
Urbanisation rate: 3.20%
Cost of cheapestnewly built house:
10 371 229 MROPPP$100 789
Urban householdsthat could afford thishouse with finance:
2.89%
1 PPP$: 102.9 Ouguiya
Population: 1 265 309
Urbanisation rate: -0.17%
Cost of cheapestnewly built house:
1 220 000 MURPPP$74 847
Urban householdsthat could afford thishouse with finance:
93.73%
1 PPP$:16.3 Mauritian
rupee
Population: 35 230 036
Urbanisation rate: 2.10%
Cost of cheapestnewly built house:
140 000 MADPPP$40 000
Urban householdsthat could afford thishouse with finance:
95.48%
1 PPP$:3.5 Moroccan
dirham
Population: 29 668 834
Urbanisation rate: 3.81%
Cost of cheapestnewly built house:
3 301 650 MZNPPP$155 738
Urban householdsthat could afford thishouse with finance:
1.26%
1 PPP$:21.2 Mozambican
metical

31
Africa Housing Finance Yearbook 2018
PPP$40 001 – PPP$10 000 000
PPP$23 001 – PPP$40 000
PPP$12 001 – PPP$23 000
PPP$8 001 – PPP$12 000
PPP$5 001 – PPP$8 000
PPP$3 601 – PPP$5 000
PPP$2 401 – PPP$3 600
PPP$1 601 – PPP$2 400
PPP$801 – PPP$1 600
<PPP$800
- - - Average annual household income needed for the cheapest newly built house by a formal developer, 2017 Average annual household income using expenditure, 2017 (PPP$)
NAMIBIAAnnual income profile for rural and urban households based on consumption (PPP$)
No. of households (thousands)
PPP$21 716
PPP$24 530
Rural Urban80 60 40 20 0 20 40 60 80
PPP$40 001 – PPP$10 000 000
PPP$23 001 – PPP$40 000
PPP$12 001 – PPP$23 000
PPP$8 001 – PPP$12 000
PPP$5 001 – PPP$8 000
PPP$3 601 – PPP$5 000
PPP$2 401 – PPP$3 600
PPP$1 601 – PPP$2 400
PPP$801 – PPP$1 600
<PPP$800
- - - Average annual household income needed for the cheapest newly built house by a formal developer, 2017 Average annual household income using expenditure, 2017 (PPP$)
NIGERAnnual income profile for rural and urban households based on consumption (PPP$)
No. of households (thousands)
PPP$6 741
PPP$21 477
Rural Urban1 000 800 600 400 200 0 200 400 600 800 1 000
PPP$40 001 – PPP$10 000 000
PPP$23 001 – PPP$40 000
PPP$12 001 – PPP$23 000
PPP$8 001 – PPP$12 000
PPP$5 001 – PPP$8 000
PPP$3 601 – PPP$5 000
PPP$2 401 – PPP$3 600
PPP$1 601 – PPP$2 400
PPP$801 – PPP$1 600
<PPP$800
- - - Average annual household income needed for the cheapest newly built house by a formal developer, 2017 Average annual household income using expenditure, 2017 (PPP$)
NIGERIAAnnual income profile for rural and urban households based on consumption (PPP$)
No. of households (thousands)
PPP$21 235
PPP$30 120
Rural Urban6 000 4 000 2 000 0 2 000 4 000 6 000
PPP$40 001 – PPP$10 000 000
PPP$23 001 – PPP$40 000
PPP$12 001 – PPP$23 000
PPP$8 001 – PPP$12 000
PPP$5 001 – PPP$8 000
PPP$3 601 – PPP$5 000
PPP$2 401 – PPP$3 600
PPP$1 601 – PPP$2 400
PPP$801 – PPP$1 600
<PPP$800
- - - Average annual household income needed for the cheapest newly built house by a formal developer, 2017 Average annual household income using expenditure, 2017 (PPP$)
RWANDAAnnual income profile for rural and urban households based on consumption (PPP$)
No. of households (thousands)
PPP$10 746
PPP$33 458
Rural Urban4 000 3 000 2 000 1 000 0 1 000 2 000 3 000 4 000
Population: 2 280 716
Urbanisation rate: 4.25%
Cost of cheapestnewly built house:
280 000 NADPPP$42 424
Urban householdsthat could afford thishouse with finance:
48.02%
1 PPP$:6.6 Namibian
dollar
Population: 21 477 348
Urbanisation rate: 5.35%
Cost of cheapestnewly built house:
7 500 000 XOFPPP$34 642
Urban householdsthat could afford thishouse with finance:
1.73%
1 PPP$: 216.5 CFA franc
Population: 198 000 085
Urbanisation rate: 4.94%
Cost of cheapestnewly built house:
5 000 097 NGNPPP$48 686
Urban householdsthat could afford thishouse with finance:
38.92%
1 PPP$:102.7 Nigerian
naira
Population: 10 515 973
Urbanisation rate: 5.57%
Cost of cheapestnewly built house:
17 500 000 RWFPPP$57 246
Urban householdsthat could afford thishouse with finance:
4.46%
1 PPP$:305.7 Rwandan
franc

32
PPP$40 001 – PPP$10 000 000
PPP$23 001 – PPP$40 000
PPP$12 001 – PPP$23 000
PPP$8 001 – PPP$12 000
PPP$5 001 – PPP$8 000
PPP$3 601 – PPP$5 000
PPP$2 401 – PPP$3 600
PPP$1 601 – PPP$2 400
PPP$801 – PPP$1 600
<PPP$800
- - - Average annual household income needed for the cheapest newly built house by a formal developer, 2017 Average annual household income using expenditure, 2017 (PPP$)
SÃO TOMÉ AND PRÍNCIPEAnnual income profile for rural and urban households based on consumption (PPP$)
No. of households (thousands)
PPP$13 235
PPP$69 718
Rural Urban12 10 8 6 4 2 0 2 4 6 8 10 12
PPP$40 001 – PPP$10 000 000
PPP$23 001 – PPP$40 000
PPP$12 001 – PPP$23 000
PPP$8 001 – PPP$12 000
PPP$5 001 – PPP$8 000
PPP$3 601 – PPP$5 000
PPP$2 401 – PPP$3 600
PPP$1 601 – PPP$2 400
PPP$801 – PPP$1 600
<PPP$800
- - - Average annual household income needed for the cheapest newly built house by a formal developer, 2017 Average annual household income using expenditure, 2017 (PPP$)
SIERRA LEONEAnnual income profile for rural and urban households based on consumption (PPP$)
No. of households (thousands)
PPP$15 811
PPP$57 328
Rural Urban300 250 200 150 100 50 0 50 100 150 200 250 300
Population: 208 818
Urbanisation rate: 3.33%
Cost of cheapestnewly built house:
1 508 364 000 STDPPP$121 022
Urban householdsthat could afford thishouse with finance:
1.34%
1 PPP$: 12 463.6 Dobra
Population: 7 092 113
Urbanisation rate: 3.90%
Cost of cheapestnewly built house:
150 000 000 SLLPPP$62 670
Urban householdsthat could afford thishouse with finance:
7.52%
1 PPP$:2 393.5 SierraLeonean leone
PPP$40 001 – PPP$10 000 000
PPP$23 001 – PPP$40 000
PPP$12 001 – PPP$23 000
PPP$8 001 – PPP$12 000
PPP$5 001 – PPP$8 000
PPP$3 601 – PPP$5 000
PPP$2 401 – PPP$3 600
PPP$1 601 – PPP$2 400
PPP$801 – PPP$1 600
<PPP$800
- - - Average annual household income needed for the cheapest newly built house by a formal developer, 2017 Average annual household income using expenditure, 2017 (PPP$)
SENEGALAnnual income profile for rural and urban households based on consumption (PPP$)
No. of households (thousands)
PPP$18 890
PPP$13 744
Rural Urban300 250 200 150 100 50 0 50 100 150 200 250 300
Population: 15 858 567
Urbanisation rate: 3.62%
Cost of cheapestnewly built house:
10 000 000 XOFPPP$45 106
Urban householdsthat could afford thishouse with finance:
63.66%
1 PPP$: 221.7 CFA franc
PPP$40 001 – PPP$10 000 000
PPP$23 001 – PPP$40 000
PPP$12 001 – PPP$23 000
PPP$8 001 – PPP$12 000
PPP$5 001 – PPP$8 000
PPP$3 601 – PPP$5 000
PPP$2 401 – PPP$3 600
PPP$1 601 – PPP$2 400
PPP$801 – PPP$1 600
<PPP$800
- - - Average annual household income needed for the cheapest newly built house by a formal developer, 2017 Average annual household income using expenditure, 2017 (PPP$)
SEYCHELLESAnnual income profile for rural and urban households based on consumption (PPP$)
No. of households (thousands)
PPP$33 946
PPP$36 848
Rural Urban8 7 6 5 4 3 2 1 0 1 2 3 4 5 6 7 8
Population: 95 843
Urbanisation rate: 1.83%
Cost of cheapestnewly built house:
750 000 SCRPPP$102 740
Urban householdsthat could afford thishouse with finance:
55.13%
1 PPP$:7.3 Seychellois
rupee

33
Africa Housing Finance Yearbook 2018
PPP$40 001 – PPP$10 000 000
PPP$23 001 – PPP$40 000
PPP$12 001 – PPP$23 000
PPP$8 001 – PPP$12 000
PPP$5 001 – PPP$8 000
PPP$3 601 – PPP$5 000
PPP$2 401 – PPP$3 600
PPP$1 601 – PPP$2 400
PPP$801 – PPP$1 600
<PPP$800
- - - Average annual household income needed for the cheapest newly built house by a formal developer, 2017 Average annual household income using expenditure, 2017 (PPP$)
SOMALIAAnnual income profile for rural and urban households based on consumption (PPP$)
No. of households (thousands)
PPP$3 153
Rural Urban500 400 300 200 100 0 100 200 300 400 500
Population: 15 100 000
Urbanisation rate: 4.06%
Cost of cheapestnewly built house:
39 970 000 SOSPPP$ n/a
Urban householdsthat could afford thishouse with finance:
n/a
1 PPP$: n/a
PPP$40 001 – PPP$10 000 000
PPP$23 001 – PPP$40 000
PPP$12 001 – PPP$23 000
PPP$8 001 – PPP$12 000
PPP$5 001 – PPP$8 000
PPP$3 601 – PPP$5 000
PPP$2 401 – PPP$3 600
PPP$1 601 – PPP$2 400
PPP$801 – PPP$1 600
<PPP$800
- - - Average annual household income needed for the cheapest newly built house by a formal developer, 2017 Average annual household income using expenditure, 2017 (PPP$)
SOUTH SUDANAnnual income profile for rural and urban households based on consumption (PPP$)
No. of households (thousands)
PPP$10 075
PPP$119 254
Rural Urban300 250 200 150 100 50 0 50 100 150 200 250 300
- - - Average annual household income needed for the cheapest newly built house by a formal developer, 2017 Average annual household income using expenditure, 2017 (PPP$)
Population: 12 575 714
Urbanisation rate: 4.02%
Cost of cheapestnewly built house:
2 135 700 SSPPPP$309 522
Urban householdsthat could afford thishouse with finance:
2.87%
1 PPP$:6.9 South
Sudanese pound
PPP$40 001 – PPP$10 000 000
PPP$23 001 – PPP$40 000
PPP$12 001 – PPP$23 000
PPP$8 001 – PPP$12 000
PPP$5 001 – PPP$8 000
PPP$3 601 – PPP$5 000
PPP$2 401 – PPP$3 600
PPP$1 601 – PPP$2 400
PPP$801 – PPP$1 600
<PPP$800
SUDANAnnual income profile for rural and urban households based on consumption (PPP$)
No. of households (thousands)
PPP$11 583
PPP$19 685
Rural Urban1 400 1 200 1 000 800 600 400 200 0 200 400 600 800 1 000 1 200
Population: 41 511 526
Urbanisation rate: 3.17%
Cost of cheapestnewly built house:
190 000 SDGPPP$46 341
Urban householdsthat could afford thishouse with finance:
67.69%
1 PPP$:4.1 Sudanese
pound
PPP$40 001 – PPP$10 000 000
PPP$23 001 – PPP$40 000
PPP$12 001 – PPP$23 000
PPP$8 001 – PPP$12 000
PPP$5 001 – PPP$8 000
PPP$3 601 – PPP$5 000
PPP$2 401 – PPP$3 600
PPP$1 601 – PPP$2 400
PPP$801 – PPP$1 600
<PPP$800
- - - Average annual household income needed for the cheapest newly built house by a formal developer, 2017 Average annual household income using expenditure, 2017 (PPP$)
SOUTH AFRICAAnnual income profile for rural and urban households based on consumption (PPP$)
No. of households (thousands)
PPP$19 186
PPP$24 057
Rural Urban2 000 1 500 1 000 500 0 500 1 000 1 500 2 000
Population: 57 730 000
Urbanisation rate: 1.99%
Cost of cheapestnewly built house:
352 000 ZARPPP$57 705
Urban householdsthat could afford thishouse with finance:
34.38%
1 PPP$:6.1 South African
Rand
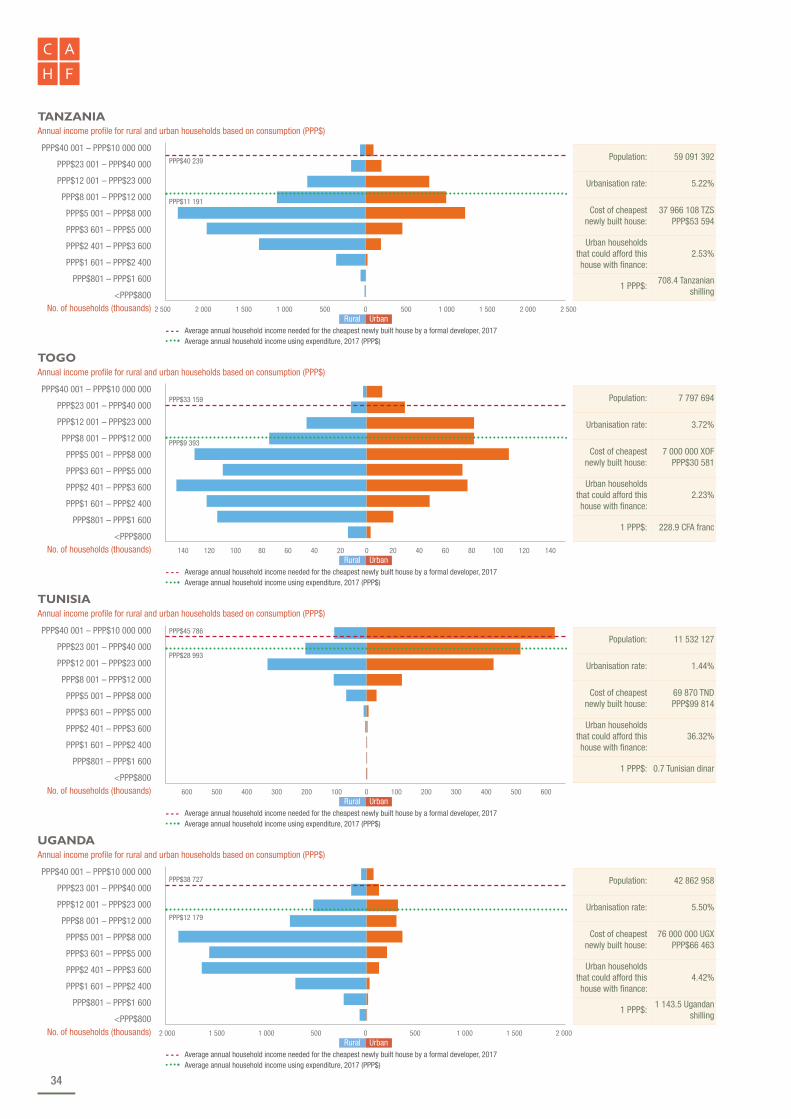
34
PPP$40 001 – PPP$10 000 000
PPP$23 001 – PPP$40 000
PPP$12 001 – PPP$23 000
PPP$8 001 – PPP$12 000
PPP$5 001 – PPP$8 000
PPP$3 601 – PPP$5 000
PPP$2 401 – PPP$3 600
PPP$1 601 – PPP$2 400
PPP$801 – PPP$1 600
<PPP$800
- - - Average annual household income needed for the cheapest newly built house by a formal developer, 2017 Average annual household income using expenditure, 2017 (PPP$)
TANZANIAAnnual income profile for rural and urban households based on consumption (PPP$)
No. of households (thousands)
PPP$11 191
PPP$40 239
Rural Urban2 500 2 000 1 500 1 000 500 0 500 1 000 1 500 2 000 2 500
PPP$40 001 – PPP$10 000 000
PPP$23 001 – PPP$40 000
PPP$12 001 – PPP$23 000
PPP$8 001 – PPP$12 000
PPP$5 001 – PPP$8 000
PPP$3 601 – PPP$5 000
PPP$2 401 – PPP$3 600
PPP$1 601 – PPP$2 400
PPP$801 – PPP$1 600
<PPP$800
- - - Average annual household income needed for the cheapest newly built house by a formal developer, 2017 Average annual household income using expenditure, 2017 (PPP$)
UGANDAAnnual income profile for rural and urban households based on consumption (PPP$)
No. of households (thousands)
PPP$12 179
PPP$38 727
Rural Urban2 000 1 500 1 000 500 0 500 1 000 1 500 2 000
Population: 59 091 392
Urbanisation rate: 5.22%
Cost of cheapestnewly built house:
37 966 108 TZSPPP$53 594
Urban householdsthat could afford thishouse with finance:
2.53%
1 PPP$:708.4 Tanzanian
shilling
Population: 42 862 958
Urbanisation rate: 5.50%
Cost of cheapestnewly built house:
76 000 000 UGXPPP$66 463
Urban householdsthat could afford thishouse with finance:
4.42%
1 PPP$:1 143.5 Ugandan
shilling
PPP$40 001 – PPP$10 000 000
PPP$23 001 – PPP$40 000
PPP$12 001 – PPP$23 000
PPP$8 001 – PPP$12 000
PPP$5 001 – PPP$8 000
PPP$3 601 – PPP$5 000
PPP$2 401 – PPP$3 600
PPP$1 601 – PPP$2 400
PPP$801 – PPP$1 600
<PPP$800
- - - Average annual household income needed for the cheapest newly built house by a formal developer, 2017 Average annual household income using expenditure, 2017 (PPP$)
TOGOAnnual income profile for rural and urban households based on consumption (PPP$)
No. of households (thousands)
PPP$9 393
PPP$33 159
Rural Urban140 120 100 80 60 40 20 0 20 40 60 80 100 120 140
Population: 7 797 694
Urbanisation rate: 3.72%
Cost of cheapestnewly built house:
7 000 000 XOFPPP$30 581
Urban householdsthat could afford thishouse with finance:
2.23%
1 PPP$: 228.9 CFA franc
PPP$40 001 – PPP$10 000 000
PPP$23 001 – PPP$40 000
PPP$12 001 – PPP$23 000
PPP$8 001 – PPP$12 000
PPP$5 001 – PPP$8 000
PPP$3 601 – PPP$5 000
PPP$2 401 – PPP$3 600
PPP$1 601 – PPP$2 400
PPP$801 – PPP$1 600
<PPP$800
- - - Average annual household income needed for the cheapest newly built house by a formal developer, 2017 Average annual household income using expenditure, 2017 (PPP$)
TUNISIAAnnual income profile for rural and urban households based on consumption (PPP$)
No. of households (thousands)
PPP$45 786
PPP$28 993
Rural Urban600 500 400 300 200 100 0 100 200 300 400 500 600
Population: 11 532 127
Urbanisation rate: 1.44%
Cost of cheapestnewly built house:
69 870 TNDPPP$99 814
Urban householdsthat could afford thishouse with finance:
36.32%
1 PPP$: 0.7 Tunisian dinar

35
Africa Housing Finance Yearbook 2018
PPP$40 001 – PPP$10 000 000
PPP$23 001 – PPP$40 000
PPP$12 001 – PPP$23 000
PPP$8 001 – PPP$12 000
PPP$5 001 – PPP$8 000
PPP$3 601 – PPP$5 000
PPP$2 401 – PPP$3 600
PPP$1 601 – PPP$2 400
PPP$801 – PPP$1 600
<PPP$800
- - - Average annual household income needed for the cheapest newly built house by a formal developer, 2017 Average annual household income using expenditure, 2017 (PPP$)
ZAMBIAAnnual income profile for rural and urban households based on consumption (PPP$)
No. of households (thousands)
PPP$12 881
PPP$184 634
Rural Urban400 300 200 100 0 100 200 300 400
PPP$40 001 – PPP$10 000 000
PPP$23 001 – PPP$40 000
PPP$12 001 – PPP$23 000
PPP$8 001 – PPP$12 000
PPP$5 001 – PPP$8 000
PPP$3 601 – PPP$5 000
PPP$2 401 – PPP$3 600
PPP$1 601 – PPP$2 400
PPP$801 – PPP$1 600
<PPP$800
- - - Average annual household income needed for the cheapest newly built house by a formal developer, 2017 Average annual household income using expenditure, 2017 (PPP$)
ZIMBABWEAnnual income profile for rural and urban households based on consumption (PPP$)
No. of households (thousands)
PPP$10 130
PPP$13 650
Rural Urban600 400 200 0 200 400 600
Population: 17 094 130
Urbanisation rate: 4.23%
Cost of cheapestnewly built house:
650 000 ZMWPPP$185 714
Urban householdsthat could afford thishouse with finance:
8.49%
1 PPP$:3.5 Zambian
kwacha
Population: 16 913 261
Urbanisation rate: 2.44%
Cost of cheapestnewly built house:
18 000 ZBNPPP$36 000
Urban householdsthat could afford thishouse with finance:
24.66%
1 PPP$:0.5 Zimbabwean
Bond notes

36
Investor interest in housing in Africa has grown substantially in recent years. Driven, in part, by new market opportunities created by economic growth, investorsare looking for specific initiatives on which to place their bets. Data across much of Africa is scarce, however, especially so for the housing and housing financesectors. As investors struggle to assess market risk and opportunity with precision, they either shift their sights to more easily dimensioned investments outsidethe housing sector, or price for the inability to fully determine risk, ultimately narrowing the affordability of the housing output. Better data would stimulate increasedinvestment and enhance housing affordability. The World Bank’s Open Data platform has made a tremendous difference, but still, very little data explores thenature, status and performance of residential property markets. The Housing Finance Information Network (HOFINET) is a global data gathering initiative, whichthe Centre for Affordable Housing Finance in Africa is proud to support, and it includes data for a number of African countries.
In this Yearbook, each of the country profiles includes a set of indicators, drawn from various sources, including the African Economic Outlook database, the WorldBank’s various databases, and UNDP’s International Human Development Indicators. In addition, we present CAHF’s own data, collected by our country specialistsand a host of local data sources on key delivery and affordability indicators. In some cases, figures from different sources may differ for the same data point, whichin itself highlights the challenges and difficulties faced in the sector with regard to obtaining accurate, updated information for some countries. To this end, CAHFcontinues to improve the data situation and build the baseline of information available to housing finance practitioners to encourage greater investment and enablebetter decision-making. Please visit our website www.housingfinanceafrica.org for details on our progress, or contact us directly.
As this has been a desktop study, the reporting is limited by the data and sources available. While every effort has been made to overcome these shortcomings,there will always be more information and nuance to add to the picture. In some cases, where the current status is not conclusive, both perspectives have beenoffered. In other cases, data tables necessarily have a blank spot where the data is not available. Future editions of this Yearbook will strive to overcome these dataand information shortcomings. As always, comments are welcome.
Explaining the indicators
Indicator name Description Primary source Additional comments
Main urban centre The capital city of the country and any other large city. Collected by CAHF
Exchange rate
The rate for all currencies to the US dollar. For each country, theexchange rate used varies according to when the profile waswritten - generally between the months of July and September2018. Note, however, that exchange rates can fluctuate widely.
Coinmillwww.coinmill.com
Dates for the exchange rate to the US dollarare provided in the Key Figures table at thebeginning of each country profile.
Purchase Power Parity(PPP$) exchange rate
According to the International Monetary Fund (IMF), PPP is therate at which the currency of one country would have to beconverted into that of another country to buy the same amount ofgoods and services in each country. See explanation on PPP onpage 21.
World Bank, International ComparisonProgram databasehttps://data.worldbank.org/indicator/PA.NUS.PPP
Inflation
Inflation, as measured by the consumer price index, reflects theannual percentage change in the cost to the average consumer ofacquiring a basket of goods and services that may be fixed orchanged at specified intervals, such as yearly.
IMF World Economic Outlook (April 2018) https://www.imf.org/external/datamapper/PCPIPCH@WEO/OEMDC/
Highly reliable data, periodically updated andsourced from primary sources, nationalstatistical offices, World Bank and otherreliable sources.
Population
The number of all residents regardless of legal status orcitizenship – except for refugees not permanently settled in thecountry of asylum, who are generally considered part of thepopulation of their country of origin. The values are mid-yearestimates, drawn from the World Bank World DevelopmentIndicators.
World Bank World Development Indicatorshttp://data.worldbank.org
In some cases, we have used data fromother sources, including national statisticaloffices, or central banks.
World Bank World Development Indicators isa highly recommended economic datasource. Data in this databank is sourcedfrom national statistical offices and WorldBank surveys. Highly reliable and periodicallyupdated.
Urban population size
The number of people living in urban areas as defined by nationalstatistical offices. It is calculated using World Bank populationestimates and urban ratios from the United Nations WorldUrbanisation Prospects.
Population growth rateRate of growth of population, measured mid-year, from one yearto another.
Urbanisation rate The rate of increase in the country’s urban population as definedby national statistical offices, expressed as a percentage.

37
Africa Housing Finance Yearbook 2018
Indicator name Description Primary source Additional comments
Percentage of totalpopulation belowNational Poverty Line
Nation-specific estimates of the percentage of the populationfalling below the national poverty line are generally based onsurveys of sub-groups, with the results weighted by the numberof people in each group. Definitions of poverty vary considerablyamong nations. For this reason, some countries have establishednational poverty lines that better reflect the reality of poverty intheir own local economies.
Central Intelligence Agency: The WorldFactbookhttps://www.cia.gov/library/publications/the-world-factbook
Highly reliable data, periodically updated andsourced from primary sources, nationalstatistical offices, World Bank and otherreliable sources.
Unemployment rate (%)
Percentage of the labour force that is without work but availablefor and seeking employment. The number typically does notinclude discouraged job seekers.
GDP (Current US$)
The sum of all value added, or simply the gross value of output,by all resident producers in the respective country’s economywithout making deductions for the depreciation of assets or fordepletion and degradation of natural resources, plus any producttaxes and minus any subsidies not included in the value of theproducts.
World Bank World Development Indicators http://data.worldbank.org
In some cases, we have used data fromother sources, including national statisticaloffices, or central banks.
World Bank World Development Indicators isa highly recommended economic datasource. Data in this databank is sourcedfrom national statistical offices and WorldBank surveys. Highly reliable andperiodically updated.
GDP growth rateannual
The annual percentage growth in GDP at market prices based onconstant local currency. Aggregates are based on constant 2005US dollars. The GDP growth rate measures the growth in theeconomy.
GDP per capita(Current US$)
Gross domestic product (GDP) divided by the mid-year population.Provides a rough indication of the residents’ standard of living,but misses the important factor of inequality. It must therefore beread together with the Gini Coefficient and the percent of thepopulation living below the poverty line.
GNI per capita, Atlasmethod (current US$)
Gross national income, converted to US dollars using the WorldBank Atlas method, divided by the mid-year population. GNIincludes the sum of value added by all resident producers plusany product taxes (less subsidies) not included in the valuation ofoutput plus net receipts of primary income (compensation ofemployees and property income) from abroad. To smoothfluctuations in prices and exchange rates, a special Atlas methodof conversion is used by the World Bank. Some argue that it is abetter measure of the standard of living than GDP per capita.
Gini co-efficient
Index measuring levels of inequality in a country, based on theextent to which the distribution of income or consumptionexpenditure among the population deviates from a perfectly equaldistribution. A Gini index of 0 represents perfect equality, while anindex of 100 implies perfect inequality. The data relates to variousyears, depending on when the calculation was done for aparticular country.
World Bank Povcal toolhttps://data.worldbank.org/indicator/SI.POV.GINI
In some cases, we have used data fromnational statistical offices, or centralbanks.
PovcalNet is an interactive computationaltool that allows you to replicate thecalculations made by the World Bankresearchers in estimating the extent ofabsolute poverty in the world. PovcalNetalso allows you to calculate the povertymeasures under different assumptions. Datais collected by World Bank at different yearsfor each country.
HDI (Global Rankingand Index)
The Human Development Index is a summary measure of averageachievement in key dimensions of human development includinglife expectancy, education, and per capita income indicators. TheHDI is the geometric mean of normalised indices for each of thethree dimensions used to rank countries. The index score isdrawn from the UN Development Programme. The global rankingis out of 187 countries.
UN Development Programmehttp://hdr.undp.org/en/statistics
The HDI was created to emphasise thatpeople and their capabilities should be theultimate criteria for assessing thedevelopment of a country, not economicgrowth alone. Annual surveys and reportsare published by the UNDP HumanDevelopment Report Office (HDRO).
Deeds registry
Is there a government office that maintains the public record ofland rights in a country? Its existence enables propertytransactions, and is a pre-condition of a functioning mortgagemarket. A key challenge in many countries is the formalregistration of land to enable mortgage lending, and the creationof an electronic deeds registry database.
Collected annually by CAHF’scountry profile authors.
CAHF collects this information annually byemail questionnaires, through consultantsworking on profiles and sometimes fromonline sources.

38
Indicator name Description Primary source Additional comments
Lending Interest Rate
Prevailing interest rate in the country, charged as a percentage ofthe loan amount, that usually meets the short- and medium-termfinancing needs of the private sector. While the rate offered willdiffer from one lender to the next, and be adjusted to thecreditworthiness of borrowers and objectives of the loan, thenumber offered is indicative of the state of lending in the country.
World Bank World Development Indicatorshttp://data.worldbank.org
In some cases, we have used data fromother sources, including national statisticaloffices, or central banks.
World Bank World Development Indicators isa highly recommended economic datasource. Data in this databank is sourcedfrom national statistical offices and the WorldBank surveys. Highly reliable andperiodically updated.
Mortgage interest rate
The rate of interest charged on a mortgage loan to purchase aproperty. Coupled with the mortgage term and the loan to valueratio, this determines loan affordability and the percentage of thepopulation that can afford to participate in the housing marketunassisted. The mortgage interest rate is usually linked to prime,and is influenced by the central bank rate in the country. The ratewe’ve chosen is the benchmark for the nation. Pricing for risk,mortgage lenders vary the rate per customer depending on theirrisk profile.
Collected annually by CAHF’s countryprofile authors. In some cases, we haveused data from national statistical offices,or central banks and Statista.comhttps://www.statista.com/statistics/789843/mortgage-interest-rates-africa-by-country/
CAHF collects this information annually byemail questionnaires, through consultantsworking on profiles and sometimes fromonline sources. Although very important, thesamples used are usually very small andtherefore, this data should be used only asindicative values.
Mortgage term(years)
Given the size of the loan, mortgage terms are generally long, andcan be anywhere up to 30 years. Generally, mortgage termsacross the African continent vary from five to 20 years.
Downpayment
The initial payment the borrower makes to secure their rights topurchase a property. It is often required by a lender todemonstrate the borrower’s own financial commitment, and isrepresented as a percentage of the purchase price of theproperty.
Mortgage book as apercentage of GDP
The value of mortgages outstanding in a country as a percentageof GDP. Often regarded as a rough measure of the size of themortgage market in a country relative to the size of the economy.
Various sources – central banks, WorldBank research.
Data is sourced from central banks of thecountries reported.
Estimated number ofmortgages
The number of mortgages issued by financial institutions in therespective country. Collected annually by CAHF’s country
profile authors.
CAHF collects this information annually byemail questionnaires, through consultantsworking on profiles and sometimes fromonline sources. Number of mortgage
providersNumber of institutions that are granting mortgages.
Price to rent ratio incity centre and outsidecity centre
The average house price divided by the average yearly rent price.This ratio provides a comparison between owning and rentingproperties in certain cities. In some cities, the ratio could varydrastically depending on location. Of course, this data is skewedtowards the high income, formal market, but is nonethelessindicative of what is formally available.
Numbeo online property databasehttp://www.numbeo.com/property-investment/
Numbeo is the world’s largest database ofuser contributed data about cities andcountries worldwide. This data fills in veryimportant data gaps in the property market.However, sources should be used carefullyand in limited circumstances, unlesssubstantiated by other sources.
This year, CAHF has initiated a project tobetter understand the rental data available incountries across Africa. See:http://housingfinanceafrica.org/projects/rental-housing-in-africa/
Gross rental yield incity centre and outsidecity centre
The amount of annual rent collected, expressed as a percentageof the total cost of the rental property. The ratio is used tocompare properties in different locations against each other.Rental yields also signify the rate of return from investing in rentalproperty. The yield may differ significantly between propertieswithin city centre and away from the city centre. Again, the datais skewed towards the high income, formal market.
Construction aspercent of GDP
The value added by the construction industry as a percentage ofthe gross domestic product in the current year.
Trading Economicshttps://tradingeconomics.com/country-list/gdp-from-construction
In some cases, we have used data fromother sources, including national statisticaloffices, or central banks.
World Bank World Development Indicators isa highly recommended economic datasource. Data in this databank is sourcedfrom national statistical offices and the WorldBank surveys. Highly reliable and periodicallyupdated.

39
Africa Housing Finance Yearbook 2018
Indicator name Description Primary source Additional comments
Cost of a standard50kg bag of cement
This is a rough indicator of the relative cost of construction acrosscountries.
Collected annually by CAHF’s countryprofile authors.
CAHF collects this information annually byemail questionnaires, through consultantsworking on profiles and sometimes fromonline sources. Although very important, thesamples used are usually very small andtherefore, this data should be used only asindicative values.
Price of the cheapest,newly built house by aformal developer orcontractor
The price of the cheapest, newly built housing unit, by a formaldeveloper. The indicator does not tell us how many of thesehouses are built annually, and only provides an indication of thecheapest house under construction in that particular year. It isindicative of the target of the construction industry.
Size of the cheapest,newly built house by aformal developer (m2)
This indicator contextualises the indicator on price, and can alsobe a proxy for the typical, minimum size of a housing unit thatformal developers are prepared to build.
Minimum stand or plotsize for residentialproperty (m2)
Minimum size of a residential plot in the respective country.
Ease of DoingBusiness Rank
Ease of Doing Business ranks economies from 1 to 190, with firstplace being the best. A high numerical rank means that theregulatory environment is not conducive to business operations.The index averages the country's percentile rankings on 10 topicscovered in the World Bank Doing Business Survey, conductedannually. The ranking on each topic is the simple average of thepercentile rankings on its component indicators. Property-relatedindicators are for commercial, not residential property, but arenonetheless a useful indicator.
World Bank Doing Business Survey http://www.doingbusiness.org
Highly reliable data, periodically updated andsourced from primary sources, nationalstatistical offices, World Bank and otherreliable sources.
Number of proceduresto register property
Part of the Doing Business survey, this represents the number ofprocedures required for a business to secure rights to acommercial property.
Time to registerproperty
Part of the Doing Business survey, this represents the number ofcalendar days needed for businesses to secure rights to acommercial property.
Cost to registerproperty as percent ofproperty value
Part of Doing Business survey, this represents the average costincurred by a business to secure rights to a commercial property,expressed as a percentage of the property value.
Number of householdsper income bracket(used to inform theaffordability graphs onpages 21 – 35)
Provides the average income profile for the respective country permarket segment identified, for both rural and urban areas. Theintent is to understand affordability and illustrate market potentialat each market segment.
Canback Global Income DistributionDatabase (C-GIDD) 2018www.cgidd.com
This database contains selectedmacroeconomic data series which presentsthe analysis and projections of economicdevelopments at the global level, updatedannually. Data on rural and urban householdincome profiles was collected based oncustomised market segmentation.
Urban households thatcan afford thecheapest newly builthouse given prevailingmortgage terms
The indicative number of households in urban areas that couldafford the cheapest newly built house by a formal developer in therespective country given the lending terms available. Calculatedusing the ‘Price of the cheapest, newly built house by a formaldeveloper or contractor’ indicator against the lending terms’indicators (mortgage interest rate, term, downpayment) for eachcountry where data is available and counted per market incomesegment for the urban household split. This indicator is a veryrough estimate of housing affordability, assuming the availabilityof mortgage finance and of sufficient housing supply.
CAHF calculations
CAHF collects this information annually byemail questionnaires, through consultantsworking on profiles and sometimes fromonline sources. The calculation should betreated as indicative with the intention ofillustrating the case of affordability in therespective country.

1000
K80
0K60
0K40
0K20
0K0K
Cen
tral
Afr
ica
GDP
per c
apita
, 201
8
PPP$
40 0
01+
PPP$
2300
1 –
PPP$
40 0
00
PPP$
12 0
01 –
PPP$
23 0
00
PPP$
8 00
1 –
PPP$
12 0
00
PPP$
5 00
1 –
PPP$
8 00
0
PPP$
3 60
1 –
PPP$
5 00
0
PPP$
240
1 –
PPP$
3 60
0
PPP$
1 60
1 –
PPP$
2 40
0
PPP$
801
–PP
P$1
600
<PP
P$80
0
Annu
al in
com
e pr
ofile
for r
ural
and
urb
an h
ouse
hold
s, 20
18An
nual
hou
seho
ld in
com
es e
stim
ated
usi
ng e
xpen
ditu
re (P
PP$)
Rura
lUr
ban
Tota
l of 1
0.4m
hous
ehol
ds in
the
Cent
ral A
fric
an re
gion
5.6m
rura
l hou
seho
lds
4.9m
urb
an h
ouse
hold
s
Cam
eroo
nCe
ntra
l Afri
can
Repu
blic
Chad
Cong
o Re
publ
icEq
uato
rial
Guin
eaGa
bon
São
Tom
é an
d Pr
ínci
pe
Num
ber o
f mor
tgag
e pr
ovid
ers
n/a
n/a
14
5n/
a8
Estim
ated
num
ber o
f mor
tgag
esn/
an/
an/
an/
an/
an/
an/
a
Mor
tgag
e in
tere
st ra
te
20%
15%
8%20
%15
%2.
9%12
%
Dow
npay
men
t 20
%30
%25
%n/
a50
%20
%n/
a
Mor
tgag
e te
rm (y
ears
)20
75
1220
2515
0%of
cou
ntrie
s in
the
regi
on h
ave
avai
labl
e in
form
atio
n on
num
ber o
f mor
tgag
es.
Cam
eroo
nCe
ntra
l Afri
can
Repu
blic
Chad
Cong
o Re
publ
icEq
uato
rial G
uine
aGa
bon
São
Tom
é an
d Pr
ínci
pe
100s
qm50
sqm
120s
qmn/
a45
sqm
15
0sqm
110s
qm
US$
exch
ange
rate
(28
July
201
8)58
2.1
582.
158
2.1
582.
158
2.1
582.
121
835
.6
% U
rban
who
mig
ht a
fford
hou
segi
ven
prev
ailin
g m
ortg
age
term
s4.
4%3.
3%1.
4%n/
a64
.2%
34.4
%1.
3%XAF 12 000 000US$21 600
XAF 13 445 760US$24 000
XAF 30 000 000US$55 000
n/a
XAF 20 513 058US$36 254
XAF 21 916 150US$41 500
STD 1 508 364 000US$72 000
Wor
ld B
ank
Doin
g Bu
sine
ss ra
nkin
gs
on s
elec
ted
indi
cato
rs, 2
018
Wor
ld B
ank
Doin
g Bu
sine
ss g
loba
l ran
k, 2
018
Hous
e pr
ice
(US$
)
200K
400K
600K
800K
1000
K
Pric
e an
d si
ze o
f the
che
apes
t new
ly b
uilt
hous
e by
a p
rivat
e de
velo
per,
2018
Cam
eroo
n5.
0mCh
ad3.
0m
Cent
ral
Afric
anRe
publ
ic0.
9m
Cong
o, R
ep.
0.9m
Equa
toria
lGu
inea
Sour
ce: C
anba
ck G
loba
l Inc
ome
Dist
ribut
ion
Data
base
(C-G
IDD)
.ht
tps:
//ww
w.c
gidd
.com
/
0 50 100
150
200
Dealing with construction permits
The
Doin
g Bu
sine
ss in
dica
tors
pro
vide
com
preh
ensi
vean
d co
mpa
rativ
e gl
obal
dat
a tra
ckin
g bu
sine
ssre
gula
tion
envi
ronm
ents
ove
r tim
e. A
hig
h ea
se o
fdo
ing
busi
ness
rank
ing
mea
ns th
at th
e re
gula
tory
envi
ronm
ent i
n th
at e
cono
my
is m
ore
cond
uciv
e to
the
star
ting
and
oper
atio
n of
a lo
cal fi
rm.
The
indi
cato
rs fo
r dea
ling
with
con
stru
ctio
n pe
rmits
and
regi
ster
ing
a pr
oper
ty b
oth
rela
te to
com
mer
cial
prop
erty
. How
ever
, no
sim
ilar i
ndic
ator
s fo
r res
iden
tial
prop
erty
cur
rent
ly e
xist
.
Cam
eroo
nUS
$1 4
46
Cong
o, R
ep.
US$1
658
Gabo
nUS
$7 2
21
Chad
US$6
70
São
Tom
é an
dPr
ínci
peUS
$1 3
05
Equa
toria
l Gui
nea
US$9
850
Sour
ce: W
orld
Ban
k on
line
data
base
. ht
tps:
//dat
a.w
orld
bank
.org
Mor
tgag
e le
ndin
g, 2
018
Num
ber o
f hou
seho
lds,
2018
Sour
ce: C
AHF
2018
des
ktop
sur
veys
and
cou
ntry
exp
erts
.
Regi
ster
ing
a co
mm
erci
al p
rope
rty
Sour
ce: W
orld
Ban
k Do
ing
Busi
ness
Indi
cato
rs -
http
://w
ww
.doi
ngbu
sine
ss.o
rg/
200
180
160
140
120
100
8060
4020
0
Cent
ral A
fric
an R
epub
licUS
$418
Cam
eroo
n (1
63)
Gabo
n (1
67)
São
Tom
é an
d Pr
ínci
pe (1
69)
Equa
toria
l Gui
nea
(173
)
Cong
o, R
ep. (
179)
Chad
(180
)
CAR
(184
)
Gabo
n0.
4m
Sour
ces:
Mor
tgag
e te
rms,
hou
se p
rices
& s
izes
from
CAH
F 20
18 s
urve
ys. H
ouse
hold
& in
com
e da
ta d
raw
n fro
m C
-GID
D (C
anba
ck G
loba
l Inc
ome
Dist
ribut
ion
Data
base
).So
urce
: Can
back
Glo
bal I
ncom
e Di
strib
utio
n Da
taba
se (C
-GID
D).
http
s://w
ww
.cgi
dd.c
om/

Africa Housing Finance Yearbook 2018
41
The Economic and Monetary Community of Central Africa, EMCCA (CEMAC)n The CEMAC parliament; andn The Court of Justice in place in N’Djamena since 2000. It has a judicial and
audit function.
The region has a population of over 52 million spread over 3.02 million km2.5 Halfof the population live in Cameroon and 65 percent are below 25 years of age.The average population growth rate is 2.2 percent. The combined 2016 GDP ofUS$195 billion remained stagnant and inflation remains low. The short-termgrowth outcome of the region is weak (-0.5 percent in 2017) due to reducedpublic spending and further declines in oil production.6 Security concerns broughtabout by Boko Haram and civil unrest in the CAR, the flow of refugees, moneylaundering, and drought are additional threats to the region’s GDP growth.7
Cameroon, CAR and Gabon grew their real GDP thanks to timber, agricultureexports and construction and services. The GDP is projected to grow to2.7 percent in 2018.
Cameroon is the largest economy in the region, with half of the region’s totalfinancial assets.8 The mineral wealth includes gold, diamond, natural gas, oil, bauxite,aluminium, manganese and uranium. Other export products include naturalrubber, tobacco, cocoa, coffee, sugar, and bananas. Due to inadequate privateinvestment, there has been little exploitation of resources, except for oil and timber.Crude oil is an important resource for these countries, apart from the CAR, whichis not an oil exporter, and it accounts for 87 percent of the community’s exports.9
Timber is the community’s second largest export product. All six countriescontinue to try to diversify their economies into tourism, agro production, financialservices, mining, and petrochemicals to reduce dependency on oil revenues.
The countries in the region are about 52 percent urbanised. Gabon has thehighest level of urbanisation at 87.2 percent, with 59 percent of the populationliving in Libreville and Port Gentil. The rate of urbanisation in the region is2.7 percent.
Access to financeThe formal financial system across CEMAC countries is not well-developed. It isdominated by commercial banks and in some countries, large microfinanceinstitutions (MFIs). The banking system currently comprises 52 active commercialbanks with Cameroon having the most banks in the region.10 The banking sectorcontribution to the financing of the economy is small and half of the sector’s assetsare controlled by three banks per country and the other half by foreign banks.Access to finance is hampered by weak credit infrastructure and domestic creditis low at 15 percent of GDP in CAR and Cameroon, 14 percent in Gabon,11 percent in the Republic of Congo and six percent in Chad.11 This is due tomultiple factors including: asymmetry of information, weak collateral and insolvencyframeworks, and the absence of credit history records, for the majority of firmsand people, which would allow them to apply for competitive interest rates.
Bank branches and ATMs are mostly concentrated in the urban and semi-urbanareas.12 Financial inclusion is limited and only 15 percent of adults hold bankaccounts.13 Borrowing from family or friends is the common source of credit:88 percent in Gabon, and 84 percent in Cameroon.14 Very few banks providemedium-term and long-term credit, such as the Gabonese Development Bank,the National Investment Company (in Gabon and Cameroon), Afrilands First Bank(Cameroon), and SOCOFIN in Congo Republic. The state plays an importantrole in the financial sector. For example, it controls two of the nine banks in Gabonand has a stake in most of the others.
The mortgage finance market is insignificant and non-existent in some countries.It is still in its infancy in Cameroon, Gabon and Congo. Mortgage finance is mostlygranted by government agencies, government-controlled banks and a few largecommercial banks. Most of the beneficiaries are government employees. Only avery small percentage of private sector employees can access mortgage financefrom commercial banks. This percentage is most likely going to increase due toongoing efforts by real estate companies in partnership with local commercialbanks to extend end-user financing opportunities to the growing middle class. Toincrease access to finance in Gabon, the government has helped to set up a growthand development fund to support small and medium enterprises and promote
OverviewThe Economic and Monetary Community of Central Africa (CommunautéÉconomique et Monétaire de l'Afrique Centrale, CEMAC) is made up ofCameroon, Central African Republic (CAR), Chad, Congo Republic, Gabon, andEquatorial Guinea. Its objective is to promote sustainable development of itsmember countries and to create a single market that will help promote sub-regional integration through the formation of a monetary union, with the CentralAfrican CFA franc (XAF) as a common currency.1
CEMAC was created in 1994 and became operational after the treaty’s ratificationin 1999 in N’Djamena, Chad. The headquarters of the community are in Bangui,the capital of the Central African Republic. Because of the potential benefits thatthe free movement of goods and people across borders will bring to economicgrowth and social cohesion in the sub-region, the leaders of the countries in theregion are making progress towards the creation of a single market and thefacilitation of the free movement of people. The President of CEMAC announcedin Douala in February 2018 that the free movement of people and goods in theregion is real, and that the only obstacle is security.2 This obstacle will be overcomewith a biometric CEMAC passport. Greater integration and stronger regionalinstitutions will improve the competitiveness of the region and support growth,according to a recent IMF report on the region.3 Also, the merger of the twostock exchanges in the region is recommended by a World Bank study. In theopinion of financial experts, the existence of the two stock exchanges does notallow a liquid and efficient market for securities in the sub-region. Because theyconsidered competition between the exchanges is detrimental to the sub-region,the authorities decided in November 2017 to merge them.4
The treaty that specified the legal and institutional arrangements of CEMACcreated the following four specialised institutions, each of which is regulated by aseparate legal convention:
n Central African Economic Union (Union Economique de l’Afrique Central –UEAC) with an Executive Secretariat based in Bangui, CAR. The CustomsUnion is one of the central pillars of CEMAC. It has established a regime fortrade between the countries and with other countries. Trade inside thecommunity has been duty-free since 1998;
n The Central African Monetary Union (Union Monétaire de l’AfriqueCentrale), specifies the responsibilities of the central bank, Banque des Etatsd’Afrique Centrale (BEAC) and the Central African Banking Commission(COBAC). COBAC sets regulations and carries out on-site and off-sitesupervision of the region’s banks and finance houses. BEAC is a single centralbank for the region and there is a single currency (CFA franc, XAF) anddefined criteria for macroeconomic convergence. It regulates the sectorthrough its regional banking commission, COBAC, which shares responsibilitywith the national Ministries of Finance for licensing new banks and regulatingmicrofinance institutions.

42
private investment. In the CAR, government has committed to support financialsector development and improve access to credit by: improving the legal andjudiciary system to serve commercial matters; increasing bank capital; and adoptinga microfinance sector development strategy. In Equatorial Guinea, a nation-wideATM and credit card network and the creation of a credit fund and a governmentdebt market is in place.
The informal sector and a large percentage of the middle class and lower incomegroups get housing finance from different forms of MFIs. There are over 800 MFIsin the region serving almost 1.8 million members.15 The microfinance sector hasemerged in Gabon with few regulated and registered MFIs covering a growingsegment of the population, and a substantial number of unregulated andunregistered MFIs. In Chad, the MFI sector still plays a marginal role in the financialsystem and is virtually unregulated. Government is regulating and improving accesswith a new microfinance strategy. Links with the traditional, formal banking sectorare weak and the consolidation of micro lenders is not enough to allow formeaningful regulation and oversight, or the development of strong links with thebanking sector. However, BEAC, through COBAC, has developed a strategy forcontrolling the informal financial sector. COBAC, jointly with the Ministries ofFinance of all six countries, now regulates the MFI sector in all six countries. Accessto credit improved through amendments to the Uniform Act on SecuredTransactions of the Organisation for the Harmonization of Business Law in Africa,known by its French acronym OHADA. The amendments broaden the range ofassets that can be used as collateral (including future assets), extend the securityinterest to the proceeds of the original asset, and introduce the possibility of out-of-court enforcement. Capital markets are almost non-existent due to thecoexistence of two competing stock exchanges; insurance and pension sectorsremain underdeveloped.16
AffordabilityIn the CEMAC region, the state is officially the largest employer, offering averagemonthly salaries ranging from XAF75 000 (US$134) to XAF300 000 (US$536).Though rapidly growing, the formal private sector is still small. Most people areinvolved in the informal sector in subsistence agriculture and small to minor-scaletrading, with a high percentage of people living under the poverty line. Thesepeople cannot afford to finance their homes through existing bank fundinginstruments. The microfinance sector has the potential to play a more significantrole, however inadequate supervision of the sector remains a problem.17
Construction costs in the urban and semi-urban areas are high and increasing. Itcan cost up to XAF5 million (US$8 926) to build a standard three-bedroom housein the main urban areas. This is mainly because of the high costs of inputs such ascement, sand, plates, iron, finishing and decorations. In Cameroon, the governmenthas set up local production facilities for some of the inputs to help bring downthe cost. It has also set up an agency to develop and promote the use of localmaterials for construction. There are also private sector investors who have setup factories to manufacture and distribute building materials, which will potentiallyreduce input costs. These materials are exported to other CEMAC countries. Inthe rural areas, the construction costs are lower as most of the houses built aresemi-standard and sub-standard, with local materials such as sun-dried bricks madefrom clay.
Rental costs in the urban and semi-urban centres are also high. There is a hugedisparity in rental costs between the CEMAC countries in the main urban areas.While it costs on average XAF125 000 (US$223) a month to rent a standardthree-bedroom house in the main urban areas in Cameroon, it is not the case inLuanda, N’djamena Libreville and Brazzaville, which are the sixth, eighth, 18th and19th most expensive cities in the world for expatriates.18 It costs up to US$6 500to US$8 500 a month for a standard three-bedroom apartment in these cities. InBrazzaville, it may cost up to US$3 420 for a standard three-bedroom in the citycentre or up to US$1 134 outside the centre.19
Housing supplyThe number of new housing units that enter the market annually for rental andpurchase for ownership does not meet the demands of the increasingly urbanisedpopulation and the growing middle and upper-class population. The growingeconomies in the region have swelled a middle class that needs to be housed inthe urban and semi-urban areas. A third of the Gabonese population lives in the
capital Libreville,20 and 70 percent of the Congolese population in the capitalBrazzaville,21 both cities with huge housing backlogs. Cameroon, CAR, Chad andEquatorial Guinea are increasingly urbanised. The demand for housing continuesto increase without a corresponding increase in supply.22
The current stock of housing units is produced mainly through incremental self-construction, government agencies, and private developers. There are an increasingnumber of international housing companies and developers from the USA, Canada,France, China and South Africa who are going into these markets using a Build,Operate and Transfer model. The poor live in sub-standard accommodation, oftenon land that is not well-serviced with poor infrastructure, such as no access topaved roads, no regular and clean water, no electricity and sewage disposal facilities.
There are ongoing efforts by governments to increase housing supply. For instance,the government of Italy through a partnership with the government of Cameroonplans to construct 10 000 houses in Mbankomo, Yaoundé; the local ministerforesees the construction of houses in Bonapriso, Douala.23 With the newly setup cement factories in Cameroon that also aim to service these markets, the costof cement is decreasing, which may help to increase supply of new affordablehousing units.24 Also, under the Cameroon government project, some 1 500 lowcost houses have been built by Chinese companies in Olembe, Mbanga Mwang,Baffoussam, Bamenda, Limbe and Sangmelima. The city council’s housing project“Cite des cinquantenaires” in Djoungoulou has constructed 500 houses.25
Together with international partners, the government of Gabon is building a newcity called Libreville 2, which is 27km from the city of Libreville. With a totalinvestment of US$352 million, the new city will house 20 000 people and will helpdecongest the current city of Libreville. Green Planet Holdings is involved in anaffordable housing project close to Libreville, while companies such as SCIHM2GEhave set up in Equatorial Guinea and are involved in real estate propertyinvestment, development and management.
International oil and construction companies such as Total and ExxonMobil havedriven the demand for high quality residential units in Malabo and Bata, EquatorialGuinea. There has been a great deal of new home building in Malabo II andreserved government residential areas in the east of the city. Mainly expatriateslive in these new areas as they are expensive and not affordable to the averagelocal middle-class person. The central Klemat area in N’djamena, which is nearthe presidential palace, is also an important residential district with newdevelopments. In Gabon, Congo and CAR, the new housing developments aredriven by demand for high quality housing by expatriate communities and thegrowing middle class. In Gabon, the new government policy of urban rehabilitationand construction will see the government invest in and build housing for Gabonesecitizens with the help of local and international partners.26 A great deal of socialhousing is being built in Gabon, with Libreville’s northern suburb of Angondje beingdesignated by government as a key area for social housing development. Thissituation has improved with the recent interest and activity of new developers inthe region.
Property market and opportunitiesIn all the CEMAC countries, land is owned by the state, but private ownership ofland for private and commercial use is encouraged to boost economic activity.While the real estate market is growing in some of the CEMAC countries such asCameroon, Gabon and Equatorial Guinea, it is still almost non-existent in CAR.The growth in the property market in the region has been driven mostly bygrowth in the energy and construction sectors, which led to an increase in demandand increased house prices for both ownership and rental.
According to the World Bank 2018 Doing Business Report, the cost of registeringproperty as a percentage of the property value in the region is highest inCameroon (19 percent) and lowest in Gabon (10.5 percent). The cost for theother countries is 11 percent (CAR), 12.5 percent (Eq. Guinea), 12.9 percent(Chad) and 16.1 percent (Congo Rep). The time it takes to register property is102 days (Gabon), 86 days (Cameroon), 75 days (CAR), 55 days (Congo Rep),44 days (Chad), and 23 days (Equatorial Guinea). The residential property markethas seen a decline in some countries mainly because of the slowdown in economicgrowth. This has led to a decline in rental prices in some countries such as theCongo Republic, as well as slower growth in prices in other countries.

Africa Housing Finance Yearbook 2018
43
Policy and regulationGovernments in the CEMAC countries are now trying to put in place reformsthat would address the constraints in this sector. The main constraints are in theareas of land ownership and property registration (getting land title certificates),access to serviced land, construction and development, and the availability offinance and access to credit.27 According to the World Bank’s 2018 DoingBusiness Report, when compared to the 2017 report, most of the countries inthe region have made progress on ease of doing business, issuing constructionpermits, access to credit, and registering property, with improved rankings.
The Republic of Congo, Gabon and Chad made transferring property less costlyby lowering the property transfer tax rate. Gabon made dealing with constructionpermits faster by streamlining the process and increased transparency by publishingregulations related to construction online free of charge.28 It made paying taxescostlier for companies by reducing the depreciation rates for some fixed assets.Cameroon improved its credit information system by passing regulations thatprovide for the establishment and operation of a credit registry database.29 Thecountry made dealing with construction permits more complex by introducinginspection and notification requirements. Government also decentralised theprocess of obtaining building permits and by introducing strict time limits forprocessing the application and issuing the certificate of conformity. This willimprove access to credit.
All the CEMAC governments are signatories to the OHADA Uniform Act onSecured Transactions, which broadened the scope of assets that can be used ascollateral thereby helping to increase access to finance. As the CEMACgovernments continue to introduce reforms on land administration, construction,property registration and access to housing finance, more opportunities will becreated in the sector in every area of the value chain. The government ofCameroon has taken the step of providing sovereign guarantees to privatedevelopers. Reforms and policies should also focus on tapping into the potentialof MFIs. Gabon has a new policy of urban renewal and construction.
OpportunitiesHuge opportunities exist for residential high end and middle/low income housingin all areas of the value chain – real estate development, construction, finance andreal estate management services. This is mainly because of economic reforms, thestrong demand for natural resources from emerging and developed economies, agrowing middle class, increasingly urbanised populations, a huge housing backlog,and a large diaspora seeking to invest in real estate. There are also growingopportunities for retail, commercial and industrial real estate in the urban andsemi-urban areas. The prospects for the property market are excellent and someglobal property development companies are taking advantage of existingopportunities in the region.
SourcesCameroon Report (2018). Low Cost Houses to Solve Housing Problems inCameroon. https://cameroon-report.com/english/low-cost-houses-to-solve-housing-problems-in-cameroon/ (Accessed 19 September 2018).
Cemnet (2018). Cameroon to Build Fifth Cement Plant.https://www.cemnet.com/News/story/164397/cameroon-to-build-fifth-cement-plant.html (Accessed 19 September 2018).
First initiative (2017). Microfinance and Financial Consumer Protection in theCEMAC Region. https://www.firstinitiative.org/projects/microfinance-and-financial-consumer-protection-cemac-region (Accessed 17 September 2018).
The International Monetary Fund (2017). IMF Country Report 17/176.CEMAC. Staff Report on the Common Policies in Support of MemberCountries Reform Programs.https://www.imf.org/en/Publications/SPROLLs/Central-African-Economic-and-Monetary-Community-Reports (Accessed 17 September 2018).
The International Monetary Fund (2017). IMF Country Report No. 17/389.CEMAC. Common Policies of Member Countries, and Common Policies inSupport of Member Countries Reform Programs-Press Release; Staff Report;and Statement by the Executive Director.https://www.imf.org/en/Publications/SPROLLs/Central-African-Economic-and-Monetary-Community-Reports (Accessed 17 September 2018).
Journal du Cameroun (2018). Free Movement of People and Goods a Reality.https://www.journalducameroun.com/en/free-movement-of-people-goods-a-reality-cemac-president/ (Accessed 17 September 2018).
Mercer (2018). Mercer’s Annual Cost of Living Survey Finds Asian, European,And African Cities Most Expensive Locations for Employees.https://www.mercer.com/newsroom/cost-of-living-2018.html (Accessed19 September 2018).
Numbeo (2018). Cost of Living in Brazzaville. https://www.numbeo.com/cost-of-living/in/Brazzaville-Congo (Accessed 19 September 2018).
The Oxford Business Group (nda). Making Great Strides Investments areForging ahead Despite Recent Challenges.https://oxfordbusinessgroup.com/overview/making-great-strides-investments-are-forging-ahead-despite-recent-challenges (Accessed 19 September 2018).
The World Population Review (2018). Gabon Population.http://worldpopulationreview.com/countries/gabon-population/cities/ (Accessed19 September 2018).
The World Population Review (2018). Republic of Congo Population.http://worldpopulationreview.com/countries/republic-of-the-congo-population/(Accessed 19 September 2018).
The World Bank (2018). Dealing with Construction Permits.http://www.doingbusiness.org/en/data/exploretopics/dealing-with-construction-permits/reforms (Accessed 19 September 2018).
The World Bank (2018). Strengthening the Capacity of Regional FinancialInstitutions in the CEMAC Region. PID/ISDS.http://documents.worldbank.org/curated/en/390661522173803460/text/Project-Information-Document-Integrated-Safeguards-Data-Sheet-Strengthening-the-Capacity-of-Regional-Financial-Institutions-in-the-CEMAC-Region-P161368.txt(Accessed 17 September 2018).
World Bank Doing Business Report (2015). Business Reforms in Getting Credit.http://www.doingbusiness.org/en/reforms/overview/topic/getting-credit(Accessed 19 September 2018).
The World Data (nda). CEMAC Economies and Monetary Community ofCentral Africa. https://www.worlddata.info/alliances/cemac-economic-and-monetary-community-of-central-africa.php (Accessed 17 September 2018).
1 The World Bank (2018). Strengthening the Capacity of Regional Financial Institutions in the CEMAC Region.PID/ISDS. Pg. 2.
2 Journal du Cameroun (2018). Free Movement of People and Goods a Reality. 3 The International Monetary Fund (2017). IMF Country Report No. 17/176. Central African Economic and
Monetary Community (CEMAC). Staff Report on the Common Policies in Support of Member CountriesReform Programs. Pg. 2.
4 The World Bank (2018). Pg. 3.5 The World Data (nda). CEMAC Economies and Monetary Community of Central Africa.6 The International Monetary Fund (2017). IMF Country Report No. 17/389. Central African Economic and
Monetary Community (CEMAC). Common Policies of Member Countries, and Common Policies in Supportof Member Countries Reform Programs-Press Release; Staff Report; and Statement by the Executive Director.Pg. 2.
7 The World Bank (2018). Pg. 2.8 Cameroon contributes up 40 percent of the region’s GDP, Gabon 19 percent, Equatorial Guinea 13 percent,
Chad 14 percent, Republic of Congo 11 percent and CAR 2 percent.9 The World Bank (2018). Pg. 1. Equatorial Guinea depends on it for 70 percent of its GDP; Congo,
65 percent; Gabon, 20 percent; Chad, 40 percent; and Cameroon, less than 10 percent in 2017.10 The World Bank (2018). Pg. 3.11 Ibid.12 For example, in the CAR that has the smallest financial sector in the region, bank branches and ATMs are
mostly concentrated in only three towns with 71 percent of total branches located in the capital Bangui.
13 World Bank (2018). Global Findex Database 2017. https://globalfindex.worldbank.org/#data_sec_focus 14 The World Bank (2018). Pg. 5.15 The World Bank (2018). Pg. 3. With Cameroon having the most MFIs, followed by Chad, Congo, Central
African Republic, Gabon and Equatorial Guinea respectively.16 The World Bank (2018). Pg. 3.17 First initiative (2017). 18 Mercer (2018). 19 Numbeo (2018). Cost of Living in Brazzaville.20 The World Population Review (2018). Gabon Population. 21 The World Population Review (2018). Republic of the Congo Population. 22 Conclusion drawn up from the analysis of the housing supply per country (Cameroon, Central African
Republic, Chad, Congo Republic, Equatorial Guinea and Gabon) available in the CAHF yearbook 2017.23 Cameroon Report (2018). 24 Cemnet (2018). 25 Cameroon Report (2018). 26 The Oxford Business Group (nda). 27 Conclusion drawn up from the analysis of the housing supply per country (Cameroon, Central African
Republic, Chad, Congo Republic, Equatorial Guinea and Gabon) available in the CAHF yearbook 2017.28 The World Bank (2018). Dealing with Construction Permits. 29 World Bank Doing Business Report (2015). Business Reforms in Getting Credit.

11m
10m
9m8m
7m6m
5m4m
3m2m
lm0
Sour
ce: C
anba
ck G
loba
l Inc
ome
Dist
ribut
ion
Data
base
(C-G
IDD)
.ht
tps:
//ww
w.c
gidd
.com
/
East
Afr
ica
GDP
per c
apita
, 201
8
PPP$
40 0
01+
PPP$
2300
1 –
PPP$
40 0
00
PPP$
12 0
01 –
PPP$
23 0
00
PPP$
8 00
1 –
PPP$
12 0
00
PPP$
5 00
1 –
PPP$
8 00
0
PPP$
3 60
1 –
PPP$
5 00
0
PPP$
240
1 –
PPP$
3 60
0
PPP$
1 60
1 –
PPP$
2 40
0
PPP$
801
–PP
P$1
600
<PP
P$80
0
Annu
al in
com
e pr
ofile
for r
ural
and
urb
an h
ouse
hold
s, 20
18An
nual
hou
seho
ld in
com
es e
stim
ated
usi
ng e
xpen
ditu
re (P
PP$)
Rura
lUr
ban
Tota
l of 6
0.4m
hous
ehol
ds in
the
East
Afr
ica
regi
on
45.4
m ru
ral h
ouse
hold
s14
.9m
urb
an h
ouse
hold
sBuru
ndi
Com
oros
Djib
outi
Eritr
eaEt
hiop
iaKe
nya
Rwan
daSo
mal
iaTa
nzan
iaUg
anda
Num
ber o
f mor
tgag
e pr
ovid
ers
55
n/a
n/a
435
10n/
a31
6
Estim
ated
num
ber o
f mor
tgag
es1
500
n/a
n/a
n/a
n/a
24 0
8560
000
n/a
4 20
95
000
Mor
tgag
e in
tere
st ra
te
16%
11%
7%9.
5%16
%13
%16
.76%
7.5%
17%
18%
Dow
npay
men
t 20
%20
%20
%n/
a10
%10
%20
%n/
a10
%15
%
Mor
tgag
e te
rm (y
ears
)20
10
2025
1525
1520
1025
Only
50%
of c
ount
ries
in th
e re
gion
hav
e av
aila
ble
info
rmat
ion
on n
umbe
r of m
ortg
ages
.
Buru
ndi
Com
oros
Djib
outi
Eritr
eaEt
hiop
iaKe
nya
Rwan
daSo
mal
iaTa
nzan
iaUg
anda
n/a
150s
qmn/
a12
5sqm
94sq
m20
0sqm
80sq
mn/
a60
sqm
60sq
m
US$
exch
ange
rate
(28
July
201
8)1
729.
142
0.2
177.
715
.022
.410
3.4
831.
523
099
.02
228.
93
528.
3
% U
rban
who
mig
ht a
fford
hou
segi
ven
prev
ailin
g m
ortg
age
term
s0.
7%15
.6%
11.9
%1.
9%
0.6%
50.6
%4.
5%n/
a2.
5%4.
4%
Wor
ld B
ank
Doin
g Bu
sine
ss ra
nkin
gs
on s
elec
ted
indi
cato
rs, 2
018
Wor
ld B
ank
Doin
g Bu
sine
ss g
loba
l ran
k, 2
018
1m2m
3m4m
5m6m
7m8m
9m10
m11
m
Ethi
opia
19.8
m
Tanz
ania
11.9
m
Keny
a11
.0m
Ugan
da9.
1m
Rwan
da2.
7m
Buru
ndi
1.9m
Eritr
ea
Sour
ce: C
anba
ck G
loba
l Inc
ome
Dist
ribut
ion
Data
base
(C-G
IDD)
.ht
tps:
//ww
w.c
gidd
.com
/
0 50 100
150
200
Dealing with construction permitsRw
anda
(41)
Keny
a (8
0)
Ugan
da (1
22)
Tanz
ania
(137
)
Djib
outi
(154
)
Com
oros
(158
)
Ethi
opia
(161
)
Buru
ndi (
164)
Eritr
ea (1
89)
Som
alia
(190
)
The
Doin
g Bu
sine
ss in
dica
tors
pro
vide
com
preh
ensi
vean
d co
mpa
rativ
e gl
obal
dat
a tra
ckin
g bu
sine
ssre
gula
tion
envi
ronm
ents
ove
r tim
e. A
hig
h ea
se o
fdo
ing
busi
ness
rank
ing
mea
ns th
at th
e re
gula
tory
envi
ronm
ent i
n th
at e
cono
my
is m
ore
cond
uciv
e to
the
star
ting
and
oper
atio
n of
a lo
cal fi
rm.
The
indi
cato
rs fo
r dea
ling
with
con
stru
ctio
n pe
rmits
and
regi
ster
ing
a pr
oper
ty b
oth
rela
te to
com
mer
cial
prop
erty
. How
ever
, no
sim
ilar i
ndic
ator
s fo
r res
iden
tial
prop
erty
cur
rent
ly e
xist
.
Ethi
opia
US$7
67
Keny
aUS
$1 5
07
Eritr
eaUS
$514
Som
alia
US$5
00
Ugan
daUS
$604
Rwan
daUS
$774
Tanz
ania
US$9
00
Djib
outi
US$1
930
Sour
ce: W
orld
Ban
k on
line
data
base
. ht
tps:
//dat
a.w
orld
bank
.org
Mor
tgag
e le
ndin
g, 2
018
Num
ber o
f hou
seho
lds,
2018
Sour
ce: C
AHF
2018
des
ktop
sur
veys
and
cou
ntry
exp
erts
.
Regi
ster
ing
a co
mm
erci
al p
rope
rty
Sour
ces:
Mor
tgag
e te
rms,
hou
se p
rices
& s
izes
from
CAH
F 20
18 s
urve
ys. H
ouse
hold
& in
com
e da
ta d
raw
n fro
m C
-GID
D (C
anba
ck G
loba
l Inc
ome
Dist
ribut
ion
Data
base
).
Sour
ce: W
orld
Ban
k Do
ing
Busi
ness
Indi
cato
rs -
http
://w
ww
.doi
ngbu
sine
ss.o
rg/
200
180
160
140
120
100
8060
4020
0
Com
oros
US$7
97
Som
alia
2.5m BIF 54 757 890
US$31 000
KMF 15 000 000US$35 685
DJF 13 734 000US$76 300
ERN 1 265 248US$82 606
ETB 1 400 000US$51 395
KES 1 155 000US$11 500
RWF 17 500 000US$19 768
SOS 39 970 000US$70 000
TZS 37 966 107US$16 705
UGX 76 000 000US$20 000
Pric
e an
d si
ze o
f the
che
apes
t new
ly b
uilt
hous
e by
a p
rivat
e de
velo
per,
2018
Hous
e pr
ice
(US$
)
Buru
ndi
US$3
20

Africa Housing Finance Yearbook 2018
45
The East African CommunityAccess to financeThe six-member states of the EAC are generally well-served by formal financialinstitutions including commercial banks and microfinance institutions. In addition,large sections of both the rural and urban populace are members of savings andcredit co-operatives (SACCOs). An important component of the improving levelsof financial inclusion across the region relate to the development of mobile moneyservices. Safaricom in Kenya, Vodafone in Tanzania as well as MTN in Uganda andRwanda have introduced initiatives that enable subscribers to transfer funds, saveand access small loans from their cellphones. In addition, the agent banking modelrecently implemented in Uganda, has gained momentum, with over 2 000 bankagents now in operation. Commercial banks, with approval from the Bank ofUganda, now appoint bank representatives from existing local businesses such assupermarkets, pharmacies, fuel stations and mobile money outlets to providebanking services in unserved areas of the country.6 With the implementation ofsuch initiatives, the proportion of the region’s population accessing financial serviceswill most likely increase from 44 percent in 2011 to 75 percent by 2022.7
In Uganda, banks faced a challenging business environment with low credit growthin 2017, which rose by only 1.5 percent,8 far lower than the 6.1 percent growthrecorded in the previous year. This marginal growth is attributable to sloweconomic recovery following the 2016 general elections. However, in the secondhalf of 2017, indicators showed that domestic economic activity started to pickup, driven by an enabling monetary policy, public investments, increasing growthin consumption and improved agricultural productivity. There has been a notablerise in private sector credit (PSC), largely driven by a drop in interest rates. Creditgrowth by sector indicated that mortgage, construction and real estate, trade andcommerce, household, agriculture and manufacturing continue to account for thebulk of private sector credit, constituting more than 70 percent of the total loanstock. The growth in credit also followed a period of general improvement in loanperformance as evidenced by the reduction of the non-performing loan ratio from10.5 percent in December 2016 to 5.6 percent in December 2017.9
Similarly, the banking industry in Kenya recorded a 2.6 percent rise in lendingactivities, from Ksh2 390.4 billion (US$23 904 million) in the third quarter of 2017to Ksh2 452.7 billion (US$24 527 million) in the fourth quarter of 2017. Theincrease in gross loans and advances was largely attributable to growth in the realestate, manufacturing, trade, household, energy as well as building and constructionsectors of the economy.10
Despite posting marginal growth figures for the larger part of 2017, the majorityof commercial banks in the region remained adequately capitalised during the year.In Burundi, the return to relative stability in the political arena culminated in amarginal 8.211 percent rise in total loans by BIF795 480 million (US$454 million)for the period to December 2017 compared to BIF735 126 million (US$420million) rise for the one-year period to December 2016. This marginal rise inprivate sector credit was recorded on the back of an 18.2 percent rise in totalbanking sector assets to BIF2 164.7 billion (US$1 236 million) in December 2017from BIF1 834.9 billion (US$1 048 million) in 2016, highlighting the banks’preference for low-risk government securities as opposed to the highly riskyprivate sector in an era of a fragile investment climate.
In Tanzania, the mortgage market registered a growth of 6 percent for the year2017, compared to a growth rate of 16 percent in 2016. The market alsowitnessed the entry of three new mortgage lenders increasing the total numberof lenders to 31. The new entrants in 2017 were Letshego Bank (T) Limited, YetuMicrofinance Bank PLC, and Mufindi Community Bank Ltd. The aggregatemortgage loan portfolio grew by a marginal 6.4 percent to TZS 344.84 billion(US$152 million) in December 2017, up from TZS 324.08 billion (US$142 million)in December 2016. The mortgage market in Tanzania is still dominated by fivetop lenders, who together command approximately 60 percent of the mortgageportfolio. Stanbic Bank commands 18 percent of the mortgage market share,followed by Bank M (16 percent), CRDB Bank (11 percent), Azania Bank(8 percent) and Commercial Bank of Africa (7 percent).12
OverviewThe East African Community (EAC) economy achieved significant growth in 2017and the first half of 2018. The average GDP growth rate of 5.9 percent for theregion in 2017 was forecast to continue into 2019.1 This was significantly higherthan the Sub-Saharan Africa growth performance of 1.6 percent average GDPgrowth recorded in 2017.2 This growth has been attributed to the macro-economic stability driving accelerated public and private investment in severalsectors including public infrastructure, oil and gas, agriculture and the financialsector. Kenya is the first country in the region to produce oil exports. Thecountry’s production unit was commissioned in June 2018 and the first 2 000barrels were shipped to Mombasa port for export. Uganda is steadily investingin public transportation infrastructure and an airport construction project isalready underway in the oil-rich region of Hoima where a US$4 billion (Ush15.12trillion) refinery project is planned. Commencement of commercial oil extractionis likely to trigger large-scale developments in several sectors including housingand housing finance to cater for the accommodation needs of a growing, oil-linkedlabour force.
The region also noted a considerable decline in inflation rates in 2017, largelyattributable to a good harvest and stable exchange rates. Headline inflationdeclined in the fourth quarter of 2017 from 7.5 percent to 5 percent in Kenya,5.4 percent to 4 percent in Uganda, 5.1 to 4.5 percent in Tanzania, 3.9 to2.2 percent in Rwanda and from 14.3 percent to 14.2 percent in Burundi. Therelative decline in inflation resulted in a reduction in lending rates across thebanking sectors with the exception of Burundi and South Sudan, where supply-side challenges continued to plague their financial sectors, due to fragile politicalcontexts. Declining inflation rates have resulted in significant housing sectordevelopment in Uganda, Kenya and Tanzania. Low interest rates have also resultedin a rising demand for housing units. Central banks in the region have consistentlyreduced the benchmark Central Bank Rate (CBR) to illustrate their commitmentto private sector-led growth in the region. The central banks of Rwanda, Kenya,Tanzania and Uganda maintained their policy rates at 6.0 percent, 10 percent,12 percent and 10 percent respectively in the fourth quarter of 2017. 2018 sawfurther decreases in interest rates to 5.5 percent in Rwanda, 9.5 percent in Kenya,9 percent in Tanzania and 9 percent in Uganda.3
Across the region, financial institutions continue to rely on customer deposits astheir main source of funding. In Kenya, customer deposits accounted for72.7 percent of the banking sector’s total liabilities and shareholders’ funds at theend of the fourth quarter of 2017, an increase from 71.9 percent recorded in thethird quarter of 2017.4 Although still strong, the total loan-to-deposit liability valuefor Uganda declined to 64.1 percent in December 2017 from the four-yearaverage of 74.2 percent.5 This was the result of subdued demand for credit arisingout of slow growth in economic activities for the larger part of 2017, except thelast quarter in which there was rebound economic activity across the region.

46
AffordabilityHousing affordability continues to be a challenge across the region, with three tofour-bedroom housing units priced at approximately US$50 000 (Ush200 millionin Uganda,13 Ksh5 million in Kenya14 and Tzs115 million in Tanzania15), far out ofreach of the majority. In Rwanda, Burundi and South Sudan, the average price ofhousing units is above US$60 000 due to a high reliance on imported constructionmaterials. These figures make housing inaccessible to the large majority of EastAfrican households.
Despite the slow growth rates posted by key trading partners in the East Africanregion, attempts have been made in Uganda, Kenya, Tanzania and Rwanda toincrease affordability of housing units. Burundi and South Sudan have mademarginal, to no progress towards improving affordability, largely as a result ofpersistent political instability. However, a general reduction in the policy interestrates across the region should result in a reduction in the interest rate costs ofhousing finance over the medium term. Interest rates on mortgages have tendedto be sticky and less affected by improvements in the reduction of NPL-drivencosts. Most lenders consider the AAA mortgage loans’ portfolio as relatively lowrisk and therefore not a key contributor to the general performance of the loanbook. Additionally, because of the low risk grading for the portfolio, the pricing ofmortgage loans is usually at the bottom of the bank’s loan pricing tariff guide,leaving relatively less room for adjustments even in the face of general reductionsin the central banks’ policy rate.
In Uganda, the July 2017 amendment of the Income Tax Act provided for taxbreaks on interest payments towards mortgages. Mortgage interest paymentshave been established as a tax deductible, incentivising investment in housing.
In Kenya, small and medium enterprises have been disproportionately affected bythe law on interest rate capping. This is believed to be a consequence of tightlending criteria, with banks gravitating towards so-called safer borrowers whoordinarily attract low interest rate charges. This includes government officials andlarge corporations rather than small, ostensibly riskier individual borrowers.Interest rate caps have affected the profitability of commercial lenders with someexperiencing a drop in revenue of up to 25 percent.16 As a reaction to thisshortfall, several banking institutions in Kenya have resorted to cost reductionmeasures including closing branches and cutting jobs to offset the decline. Priorto the introduction of the cap, Kenyan banks charged an average 18 percent onloans.17 This has now declined to an average of 14 percent.
Housing supplyAcross the region, housing backlogs are growing. The government in Kenya hasestimated an urban housing need of 150 000 dwellings a year, against formalproduction of about 30 000 units annually.18 In Tanzania, the annual housing deficitis estimated at 200 000 units.19 Uganda, has a housing deficit of 1.6 million units,comprising an estimated 1.4 million units in rural areas and 210 000 units in urbancentres.20 Rwanda’s annual housing deficit is estimated at 34 000 units.21 Thecapital cities of Nairobi, Kampala, Kigali and Bujumbura have each embarked onslum upgrading projects to provide decent residential housing estates, clean waterand sanitation.
Against this background, there are some noteworthy efforts towards bettertargeted, affordable housing delivery. In Uganda, companies such as ComfortHomes and Universal Multipurpose Enterprises launched their first one-bedroomapartment projects at Ush70 million (US$18 667) per unit. For both developers,the projects were highly successful, and all units were sold before constructionwas complete. They have since established the second phase of the two projectswith a 23 percent increment in offer price at Ush86 million (US$22 933). Mostof the purchasers of these residential units appear to be investors, however, whooffer the units for rent. Rental charges for one-bedroom apartments isapproximately Ush400 000 (US$105) per month. Additionally, developers aredelivering two-bedroom apartments at a sale price of Ush165 million (US$44 000)and three-bedroom apartments at Ush200 million (US$53 333).22 Most of theseprojects are situated within a radius of 10 kilometers from Kampala city centre.Comfort Homes Uganda delivered their first phase of low-cost homes in Gayaza(16 kilometres from Kampala City) at Ush47 000 000 (US$12 434) per unit andall apartments were sold out within six months of launching the project. Buyersare increasingly relying on home loan finance to fund the purchase of housing,illustrated in the rise in lending in the sector.
In Kenya, the Ministry of Transport, Infrastructure, Housing and UrbanDevelopment announced plans to enable the construction of 500 000 affordablehousing units over the next five years as part of the government’s four flagshipprojects. Phase 1 includes the delivery of 30 000 units in Nairobi using governmentland to reduce the delivery cost and boost affordability.23 Eighty percent of theunits will be priced between Ksh800 000 (US$8 000) and Ksh1 million(US$10 000). The remaining 20 percent of the units will be demarcated for socialhousing, consisting of urban slum upgrades and costing an average of Ksh650 000(US$6 500). Government-owned land in the five urban areas of Nairobi, Nakuru,Eldoret, Kisumu and Mombasa have been targeted for developments under variouspublic private partnerships.
The Rwandan government has financed the delivery of housing through theDevelopment Bank of Rwanda (BRD). The Rwandan government plans to deliver15 000 housing units by 2024 with an investment of US$250 million through BRDfor project development and an additional US$150 million for end-user financefrom the World Bank for on-lending through commercial banks to supportmortgages.24 These banks will offer housing loans at a concessional rate of10 percent as opposed to the market rate of 19 percent per annum. TheRugarama project in Nyarugenge is a 2 674 housing unit project which will bedeveloped on 42 hectares of land, at a cost of US$131 million. The Kimisangeaproject will consist of 150 housing units and cost US$60 million. There are anadditional 800 housing units in Busanza-Kicukiro district being delivered byCommunity Housing Limited (CHL). BRD is partnering with Bank of Africa tokick-start construction of the Ndera project by the fourth quarter of 2018. At acost of US$68 million and an area of 18.6 hectares, the project is planned to takea phased approach with the first phase costing US$12.4 million. About 15kilometres from Kigali in the Gasabo district, the project is expected to becompleted by September 2019. The units will include two and three bedroomsapartments, constructed in several four story apartment blocks. The projecttargets households with an income of between Rwf261 000 (US$301) and Rwf1.2million (US$1 398) a month. To achieve this, the project will have a strict screeningprocess to ensure that the project units are not taken over by high income earners.Additionally, only 5 percent downpayment will be required from qualifying buyers.Eighty percent of the units will be delivered at a relatively affordable price rangeof between Rwf27 million (US$31 468) and Rwf35 million (US$40 792), whilethe remaining 20 percent will be priced higher for middle and high incomeearners.25
In Tanzania, the National Housing Company (NHC) has several major projects inDar-es-Salaam. This includes the Mwongozo Housing Estate located in GezauloleKibamboni which consists of 216 two to three bedroom houses. The NHC hasalso been involved in the sale of undeveloped land to prospective developers. Thecorporation has offered over 300 serviced plots for sale in the Mateves area closeto Arusha catalyst for the development of satellite cities.26
Property marketsPrices of residential properties in the EAC region have continued to rise, and insome cities, doubled after a five-year period. In Tanzania, new residentialneighbourhoods have emerged around Dodoma when the country’sadministrative capital shifted to the area in 2017. Similarly, new areas havedeveloped from the Kanombe airport towards the administrative capital of Kigali.In Kampala the construction of the Entebbe - Kampala highway has had a directimpact on the spatial growth pattern of the area.
A notable trend in Kampala has been the transformation of the formerly residentialneighbourhoods of Kololo, Nakasero, Ntinda, Bugolobi, Kamwokya, Makerere,Nakawa, Kireka and others into commercial areas. Residential houses in theseneighbourhoods have been modified and converted into office buildings andeateries.
Policy and regulationA number of key regulatory reforms have affected housing and housing finance inthe region. In Kenya, President Uhuru Kenyatta set affordable housing as one ofkey focus areas with a promise to deliver 500 000 new housing units by 2022.Towards this, the President signed an amendment to the Income Tax Act toestablish an Affordable Housing Relief set at 15 percent of the gross emoluments.Prospective first-time home owners of affordable housing are now exempted frompaying 15 percent tax on emoluments up to Ksh 108 000 (US$1 080). The

Africa Housing Finance Yearbook 2018
47
amendment also doubled the tax deduction for depositors investing in HomeOwnership Savings Plan (HOSP) schemes from Ksh48 000 (US$480) per annumto Ksh96 000 (US$ 960) per annum. In the same vein, the Stamp Duty Act27 wasamended to exempt first-time home buyers under the affordable housing schemefrom stamp duty. The tax is charged on the market value of the property at therate of four percent in urban areas and two percent in rural areas and must bepaid to the Kenya Revenue Authority (KRA) within 30 days of concluding theproperty sales and transfer agreement.
Uganda has also amended its Income Tax Act to allow for tax relief on mortgageinterest payments. It is hoped that such initiatives will enhance affordability ofhousing and housing related finance. Additionally, a 2016 amendment to theFinancial Institutions Act (2004) created a regulatory environment for agentbanking, Islamic banking, and bank assurance. It is hoped that such initiatives willsupport the financial inclusion agenda. More specifically, agent banking now enablesborrowers to access disbursed loans at agent outlets nearest to their premisesand also enables them repay installments through the same agent outlets. In lessurban environments where the average distance to the nearest financial servicespoint is 12 to 22 kilometers, the introduction of agent banking regulations is awelcome addition to the expansion of financial services.
OpportunitiesAll six countries in the EAC have similar challenges relating the supply of affordablehousing. Demand for housing and appropriate housing finance products remainextremely high, but affordability is constrained by inadequate supply, and highinterest rates on housing-related facilities. While the monetary authorities in therespective countries have achieved strong gains in reducing interest rate cost ofhousing finance from 22 – 25 percent in 2011 to the current 15 – 19 percent,these rates are still high. The reliance on bank deposits creates an opportunityfor long-term investors to partner with financial institutions for increasedaffordability of loan products. Additionally, the establishment of mortgage refinancefacilities would go a long way in encouraging commercial banks to enter themortgage space by providing liquidity to these institutions. Within the region, theTanzania Mortgage Refinance Company has been instrumental in growing themortgage market, increasing the number of mortgage lenders from three to 31over a six-year period. A similar “Kenya Mortgage Refinance Company” is beingdeveloped in Kenya, and discussions have also been held in Uganda and Rwandaalong these lines. These initiatives signal Central Bank attention to the housingsector in the region, and very real opportunities for growth.
Additional sourcesBanque de la République du Burundi. Annual Report 2016.https://www.brb.bi/en/content/annual-report (Accessed 18 Sept 2018).
Sow, Marima (2015). “Foresight Africa 2016: Urbanization in the Africancontext.” 30 Dec 2015. Brookings Institute. www.brookings.edu/blog/africa-in-focus/2015/12/30/foresight-africa-2016-urbanization-in-the-african-context/(Accessed 30 August 2018).
1 African Development Bank (2018). East Africa Economic Outlook 2018.https://www.afdb.org/fileadmin/uploads/afdb/Documents/Publications/2018AEO/African-Economic-Outlook-2018-East-Africa.pdf (Accessed 23 Sept 2018).
2 African Development Bank (2018). Southern Africa Economic Outlook 2018.https://www.afdb.org/fileadmin/uploads/afdb/Documents/Publications/2018AEO/African_Economic_Outlook_2018_Southern-Africa.pdf (Accessed 23 Sept 2018).
3 Central Bank websites: Bank of Uganda (www.bou.or.ug); Bank of Tanzania (www.bot.go.tz); National Bank ofRwanda (www.bnr.rw); Bank of Burundi (www.brb.bi); Central Bank of Kenya (www.centralbank.go.ke/)
4 Central Bank of Kenya (2018). Monthly Economic Indicators – January 2018.https://www.centralbank.go.ke/uploads/monthly_economic_indicators/955854010_MEI%20Jan%202018%20Final.pdf (Accessed 23 Sept 2018). Pg. 8.
5 Bank of Uganda (2017). Annual supervision report – December 2017/Issue No. 8.https://www.bou.or.ug/bou/bou-downloads/asr/2017/Dec/Annual-Supervision-Report-2017.pdf (Accessed23 Sept 2018). Pg. 12.
6 National Financial Inclusion Strategy 2017-2022 – Uganda (October 2017). Pg. 9-12 and Pg. 34.https://www.bou.or.ug/bou/bou-downloads/publications/special_pubs/2017/National-Financial-Inclusion-Strategy.pdf (Accessed 16 Sept 2018).
7 Ibid. Pg. 5.8 Bank of Uganda (2017). Annual supervision report – December 2017/Issue No. 8.
https://www.bou.or.ug/bou/bou-downloads/asr/2017/Dec/Annual-Supervision-Report-2017.pdf (Accessed23 Sept 2018) Pg. 12.
9 Bank of Uganda (2017). Annual supervision report – December 2017/Issue No. 8.https://www.bou.or.ug/bou/bou-downloads/asr/2017/Dec/Annual-Supervision-Report-2017.pdf (Accessed23 Sept 2018). Pg. 12.
10 Central Bank of Kenya (2018). Bank Supervision Annual Report - December 2017.https://www.centralbank.go.ke/uploads/banking_sector_annual_reports/873911276_2017%20Annual%20Report.pdf (Accessed 23 Sept 2018).
11 National Bank of Burundi (2017). Monthly Bulletin (December 2017).https://www.brb.bi/sites/default/files/BM%20N°%2012%202017_English%20site_0.pdf (Accessed 23 Sept2018). Pg. 11.
12 Tanzania Mortgage Refinance Company Limited (2017). Tanzania Mortgage Market Update – 31 December2017. http://www.tmrc.co.tz/index.php/highlights/view/tanzania-mortgage-market-update-31-december-2017(Accessed 16 Sept 2018).
13 Interviews with developer firms (July 2018).14 Kenya Ministry of Housing and Urban Development statistics (April 2018). Also: Munda, Constant (2018).
“State says house to cost Sh1.5m in ‘Big Four’ plan.” 5 April 2018. Business Daily Africa.https://www.businessdailyafrica.com/economy/State-says-house-to-cost-Sh1-5m-in---Big-Four--plan/3946234-4374094-g0myb0/index.html
15 Interview with key developer (August 2018).16 Njini, Felix (2017). Kenya's Largest Bank Expects Rate-Cap Removal in Second Half. 11 May 2017. Bloomberg.
https://www.bloomberg.com/news/articles/2017-05-11/kenya-s-largest-bank-sees-rate-cap-being-removed-in-second-half (Accessed 16 Sept 2018). And Mwaniki, Charles (2017). Big banks suffer biggest blow in interestrates cap. 27 Nov 2017. Business Daily. www.businessdailyafrica.com/markets/marketnews/Big-banks-suffer-biggest-blow-interest-rates-cap/3815534-4204212-serw37z/index.html
17 Central Bank of Kenya (March 2018). The Impact of Interest Rate Capping on the Kenyan Economy – Draftfor Comments. www.centralbank.go.ke/wp-content/uploads/2018/03/Interest-Rate-Caps_-March-2018final.pdf (Accessed 16 Sept 2018). Pg.10.
18 Ngugi, Brian (2018). Uhuru’s plan to cut rents, home prices in Nairobi. 20 April 2018. Business Daily Africa.www.businessdailyafrica.com/news/Uhuru-plan-to-cut-rents--home-prices-in-Nairobi/539546-4489832-v9v4jc/index.html (Accessed 21 August 2018).
19 Tanzania Invest (2018). Tanzania real estate. www.tanzaniainvest.com/construction/realestate (Accessed21 August 2018).
20 Uganda Ministry of Lands, Housing and Urban Development – National Housing Policy (May 2016).http://mlhud.go.ug/wp-content/uploads/2015/10/National-Housing-Policy-May-2016.pdf (Accessed 23 Sept2018). Pg.5.
21 Planet Consortium (2012). Housing Market Demand, Housing Finance, and Housing Preferences for the Cityof Kigali – Final Report. Planet Consortium. 29 June 2012. www.kigalicity.gov.rw/fileadmin/Template/Documents/reports/1._Executive_Summar_Synopsis_Housing_Demand_study.PDF (Accessed 30 Aug 2018).
21 Interviews with key developer firms (July 2018).23 Otuki, Neville (2018). How State plans to deliver 500,000 homes in five years. 20 April 2018. Business Daily
Africa. https://www.businessdailyafrica.com/economy/How-State-plans-to-deliver-500-000-homes-in-five-years/3946234-4490336-yrvk8cz/index.html (Accessed 30 August 2018).
24 Mwai, Collins (2018). BRD explains its new housing project. 29 August 2018. The New Times.https://www.newtimes.co.rw/news/brd-housing-project (Accessed 23 Sept 2018)
25 Tabaro, Jean de la Croix (2018). “You Could Be Eligible for a House in Kigali”. 16 July 2018. KT Press.http://ktpress.rw/2018/07/you-could-be-eligible-for-a-house-in-kigali/ (Accessed 31 August 2018).
26 National Housing Corporation (2018). Safari City. http://www.thesafaricity.com/about-us.php (Accessed20 August 2018).
27 Lang’at, Patrick (2018). “Homeowners can now enjoy 15pc tax relief.” 19 July 2018. Daily Nation.https://www.nation.co.ke/news/Homeowners-can-now-enjoy-15pc-tax-relief/1056-4670354-j3ofo0z/index.html (Accessed 20 August 2018).
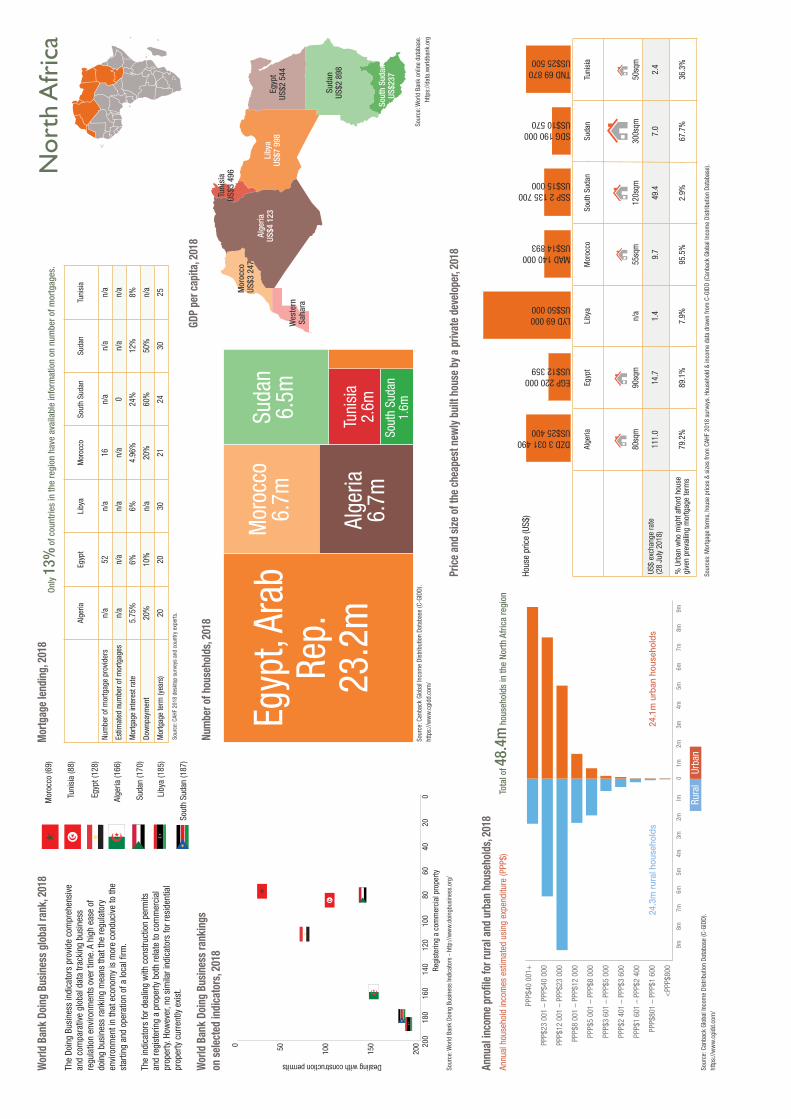
9m8m
7m6m
5m4m
3m2m
lm0
Sour
ce: C
anba
ck G
loba
l Inc
ome
Dist
ribut
ion
Data
base
(C-G
IDD)
.ht
tps:
//ww
w.c
gidd
.com
/
Nor
th A
fric
a
GDP
per c
apita
, 201
8
PPP$
40 0
01+
PPP$
2300
1 –
PPP$
40 0
00
PPP$
12 0
01 –
PPP$
23 0
00
PPP$
8 00
1 –
PPP$
12 0
00
PPP$
5 00
1 –
PPP$
8 00
0
PPP$
3 60
1 –
PPP$
5 00
0
PPP$
240
1 –
PPP$
3 60
0
PPP$
1 60
1 –
PPP$
2 40
0
PPP$
801
–PP
P$1
600
<PP
P$80
0
Annu
al in
com
e pr
ofile
for r
ural
and
urb
an h
ouse
hold
s, 20
18An
nual
hou
seho
ld in
com
es e
stim
ated
usi
ng e
xpen
ditu
re (P
PP$)
Rura
lUr
ban
Tota
l of 4
8.4m
hous
ehol
ds in
the
Nort
h Af
rica
regi
on
24.3
m ru
ral h
ouse
hold
s24
.1m
urb
an h
ouse
hold
s
Alge
riaEg
ypt
Liby
aM
oroc
coSo
uth
Suda
nSu
dan
Tuni
sia
Num
ber o
f mor
tgag
e pr
ovid
ers
n/a
52n/
a16
n/a
n/a
n/a
Estim
ated
num
ber o
f mor
tgag
esn/
an/
an/
an/
a0
n/a
n/a
Mor
tgag
e in
tere
st ra
te
5.75
%6%
6%4.
96%
24%
12%
8%
Dow
npay
men
t 20
%10
%n/
a20
%60
%50
%n/
a
Mor
tgag
e te
rm (y
ears
)20
2030
2124
3025
Only
13%
of c
ount
ries
in th
e re
gion
hav
e av
aila
ble
info
rmat
ion
on n
umbe
r of m
ortg
ages
.
Alge
riaEg
ypt
Liby
aM
oroc
coSo
uth
Suda
nSu
dan
Tuni
sia
80sq
m90
sqm
n/a
55sq
m12
0sqm
300s
qm50
sqm
US$
exch
ange
rate
(28
July
201
8)11
1.0
14.7
1.4
9.7
49.4
7.0
2.4
% U
rban
who
mig
ht a
fford
hou
segi
ven
prev
ailin
g m
ortg
age
term
s79
.2%
89
.1%
7.9%
95.5
%2.
9%67
.7%
36.3
%
Wor
ld B
ank
Doin
g Bu
sine
ss ra
nkin
gs
on s
elec
ted
indi
cato
rs, 2
018
Wor
ld B
ank
Doin
g Bu
sine
ss g
loba
l ran
k, 2
018
1m2m
3m4m
5m6m
7m8m
9m
Egyp
t, Ar
abRe
p.23
.2m
Mor
occo
6.7m
Suda
n6.
5m
Alge
ria6.
7mSo
uth
Suda
n1.
6mSo
urce
: Can
back
Glo
bal I
ncom
e Di
strib
utio
n Da
taba
se (C
-GID
D).
http
s://w
ww
.cgi
dd.c
om/
0 50 100
150
200
Dealing with construction permitsM
oroc
co (6
9)
Tuni
sia
(88)
Egyp
t (12
8)
Alge
ria (1
66)
Suda
n (1
70)
Liby
a (1
85)
Sout
h Su
dan
(187
)
The
Doin
g Bu
sine
ss in
dica
tors
pro
vide
com
preh
ensi
vean
d co
mpa
rativ
e gl
obal
dat
a tra
ckin
g bu
sine
ssre
gula
tion
envi
ronm
ents
ove
r tim
e. A
hig
h ea
se o
fdo
ing
busi
ness
rank
ing
mea
ns th
at th
e re
gula
tory
envi
ronm
ent i
n th
at e
cono
my
is m
ore
cond
uciv
e to
the
star
ting
and
oper
atio
n of
a lo
cal fi
rm.
The
indi
cato
rs fo
r dea
ling
with
con
stru
ctio
n pe
rmits
and
regi
ster
ing
a pr
oper
ty b
oth
rela
te to
com
mer
cial
prop
erty
. How
ever
, no
sim
ilar i
ndic
ator
s fo
r res
iden
tial
prop
erty
cur
rent
ly e
xist
.
Alge
riaUS
$4 1
23
Tuni
sia
US$3
496
Suda
nUS
$2 8
98
Mor
occo
US$3
247
Wes
tern
Saha
ra
Sout
h Su
dan
US$2
37
Egyp
tUS
$2 5
44
Sour
ce: W
orld
Ban
k on
line
data
base
. ht
tps:
//dat
a.w
orld
bank
.org
Mor
tgag
e le
ndin
g, 2
018
Num
ber o
f hou
seho
lds,
2018
Sour
ce: C
AHF
2018
des
ktop
sur
veys
and
cou
ntry
exp
erts
.
Regi
ster
ing
a co
mm
erci
al p
rope
rty
Sour
ces:
Mor
tgag
e te
rms,
hou
se p
rices
& s
izes
from
CAH
F 20
18 s
urve
ys. H
ouse
hold
& in
com
e da
ta d
raw
n fro
m C
-GID
D (C
anba
ck G
loba
l Inc
ome
Dist
ribut
ion
Data
base
).
Sour
ce: W
orld
Ban
k Do
ing
Busi
ness
Indi
cato
rs -
http
://w
ww
.doi
ngbu
sine
ss.o
rg/
200
180
160
140
120
100
8060
4020
0
DZD 3 031 490US$25 400
EGP 220 000US$12 359
LYD 69 000US$50 000
MAD 140 000US$14 893
SSP 2 135 700US$15 000
SDG 190 000US$10 570
TND 69 870US$25 500
Pric
e an
d si
ze o
f the
che
apes
t new
ly b
uilt
hous
e by
a p
rivat
e de
velo
per,
2018
Hous
e pr
ice
(US$
)
Liby
aUS
$7 9
98
Tuni
sia
2.6m
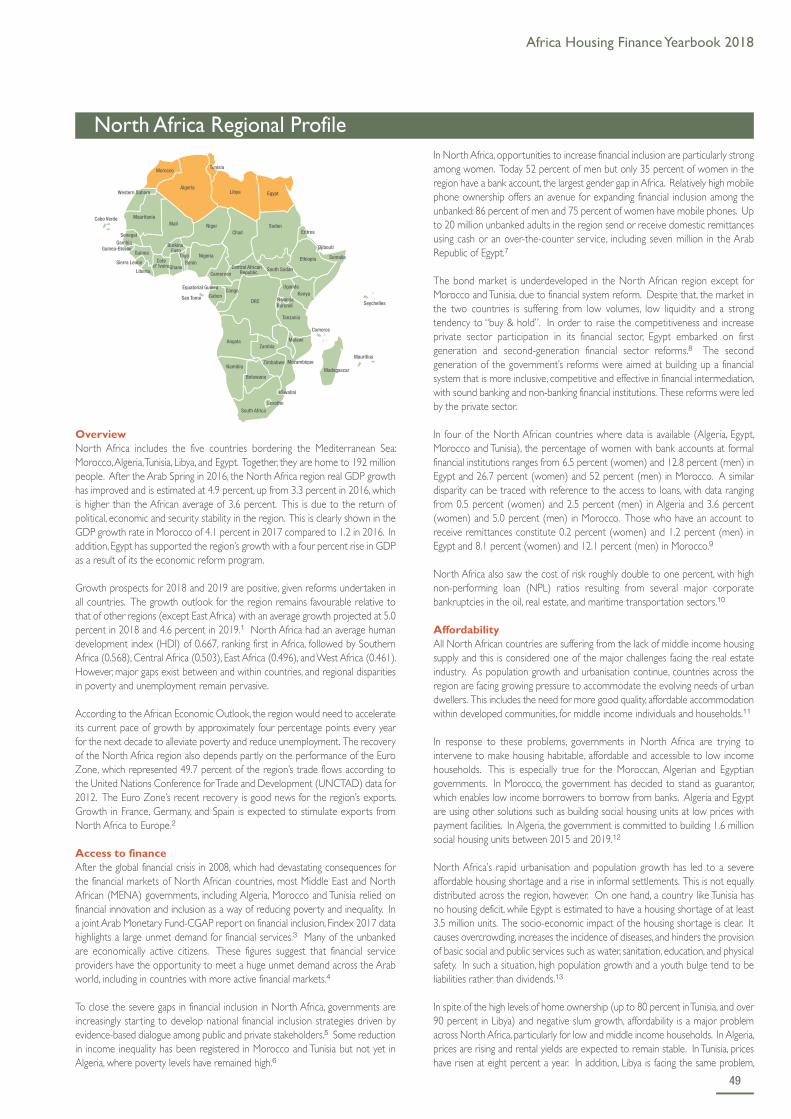
Africa Housing Finance Yearbook 2018
49
North Africa Regional ProfileIn North Africa, opportunities to increase financial inclusion are particularly strongamong women. Today 52 percent of men but only 35 percent of women in theregion have a bank account, the largest gender gap in Africa. Relatively high mobilephone ownership offers an avenue for expanding financial inclusion among theunbanked: 86 percent of men and 75 percent of women have mobile phones. Upto 20 million unbanked adults in the region send or receive domestic remittancesusing cash or an over-the-counter service, including seven million in the ArabRepublic of Egypt.7
The bond market is underdeveloped in the North African region except forMorocco and Tunisia, due to financial system reform. Despite that, the market inthe two countries is suffering from low volumes, low liquidity and a strongtendency to “buy & hold”. In order to raise the competitiveness and increaseprivate sector participation in its financial sector, Egypt embarked on firstgeneration and second-generation financial sector reforms.8 The secondgeneration of the government’s reforms were aimed at building up a financialsystem that is more inclusive, competitive and effective in financial intermediation,with sound banking and non-banking financial institutions. These reforms were ledby the private sector.
In four of the North African countries where data is available (Algeria, Egypt,Morocco and Tunisia), the percentage of women with bank accounts at formalfinancial institutions ranges from 6.5 percent (women) and 12.8 percent (men) inEgypt and 26.7 percent (women) and 52 percent (men) in Morocco. A similardisparity can be traced with reference to the access to loans, with data rangingfrom 0.5 percent (women) and 2.5 percent (men) in Algeria and 3.6 percent(women) and 5.0 percent (men) in Morocco. Those who have an account toreceive remittances constitute 0.2 percent (women) and 1.2 percent (men) inEgypt and 8.1 percent (women) and 12.1 percent (men) in Morocco.9
North Africa also saw the cost of risk roughly double to one percent, with highnon-performing loan (NPL) ratios resulting from several major corporatebankruptcies in the oil, real estate, and maritime transportation sectors.10
AffordabilityAll North African countries are suffering from the lack of middle income housingsupply and this is considered one of the major challenges facing the real estateindustry. As population growth and urbanisation continue, countries across theregion are facing growing pressure to accommodate the evolving needs of urbandwellers. This includes the need for more good quality, affordable accommodationwithin developed communities, for middle income individuals and households.11
In response to these problems, governments in North Africa are trying tointervene to make housing habitable, affordable and accessible to low incomehouseholds. This is especially true for the Moroccan, Algerian and Egyptiangovernments. In Morocco, the government has decided to stand as guarantor,which enables low income borrowers to borrow from banks. Algeria and Egyptare using other solutions such as building social housing units at low prices withpayment facilities. In Algeria, the government is committed to building 1.6 millionsocial housing units between 2015 and 2019.12
North Africa’s rapid urbanisation and population growth has led to a severeaffordable housing shortage and a rise in informal settlements. This is not equallydistributed across the region, however. On one hand, a country like Tunisia hasno housing deficit, while Egypt is estimated to have a housing shortage of at least3.5 million units. The socio-economic impact of the housing shortage is clear. Itcauses overcrowding, increases the incidence of diseases, and hinders the provisionof basic social and public services such as water, sanitation, education, and physicalsafety. In such a situation, high population growth and a youth bulge tend to beliabilities rather than dividends.13
In spite of the high levels of home ownership (up to 80 percent in Tunisia, and over90 percent in Libya) and negative slum growth, affordability is a major problemacross North Africa, particularly for low and middle income households. In Algeria,prices are rising and rental yields are expected to remain stable. In Tunisia, priceshave risen at eight percent a year. In addition, Libya is facing the same problem,
OverviewNorth Africa includes the five countries bordering the Mediterranean Sea:Morocco, Algeria, Tunisia, Libya, and Egypt. Together, they are home to 192 millionpeople. After the Arab Spring in 2016, the North Africa region real GDP growthhas improved and is estimated at 4.9 percent, up from 3.3 percent in 2016, whichis higher than the African average of 3.6 percent. This is due to the return ofpolitical, economic and security stability in the region. This is clearly shown in theGDP growth rate in Morocco of 4.1 percent in 2017 compared to 1.2 in 2016. Inaddition, Egypt has supported the region’s growth with a four percent rise in GDPas a result of its the economic reform program.
Growth prospects for 2018 and 2019 are positive, given reforms undertaken inall countries. The growth outlook for the region remains favourable relative tothat of other regions (except East Africa) with an average growth projected at 5.0percent in 2018 and 4.6 percent in 2019.1 North Africa had an average humandevelopment index (HDI) of 0.667, ranking first in Africa, followed by SouthernAfrica (0.568), Central Africa (0.503), East Africa (0.496), and West Africa (0.461).However, major gaps exist between and within countries, and regional disparitiesin poverty and unemployment remain pervasive.
According to the African Economic Outlook, the region would need to accelerateits current pace of growth by approximately four percentage points every yearfor the next decade to alleviate poverty and reduce unemployment. The recoveryof the North Africa region also depends partly on the performance of the EuroZone, which represented 49.7 percent of the region’s trade flows according tothe United Nations Conference for Trade and Development (UNCTAD) data for2012. The Euro Zone’s recent recovery is good news for the region’s exports.Growth in France, Germany, and Spain is expected to stimulate exports fromNorth Africa to Europe.2
Access to financeAfter the global financial crisis in 2008, which had devastating consequences forthe financial markets of North African countries, most Middle East and NorthAfrican (MENA) governments, including Algeria, Morocco and Tunisia relied onfinancial innovation and inclusion as a way of reducing poverty and inequality. Ina joint Arab Monetary Fund-CGAP report on financial inclusion, Findex 2017 datahighlights a large unmet demand for financial services.3 Many of the unbankedare economically active citizens. These figures suggest that financial serviceproviders have the opportunity to meet a huge unmet demand across the Arabworld, including in countries with more active financial markets.4
To close the severe gaps in financial inclusion in North Africa, governments areincreasingly starting to develop national financial inclusion strategies driven byevidence-based dialogue among public and private stakeholders.5 Some reductionin income inequality has been registered in Morocco and Tunisia but not yet inAlgeria, where poverty levels have remained high.6

50
with significant undersupply which is hampering affordability. The Libyan governmentis responding to an estimated shortage of approximately 350 000 units with large-scale residential projects to the value of US$11 billion in the pipeline. Furthermore,the cost of formal housing in Egypt exceeds the payment capacity of the majorityof households. Although 2017 has witnessed a positive boost in market trends,Egypt’s population of over 90 million requires an additional 175 000 to 200 000housing units a year to cater for population growth and the housing shortage of3.5 million units. While there are 5.6 million vacant units nationwide, theseproperties are beyond the purchasing power of low and middle income groups.14
Housing supplyThe North Africa region is suffering from a significant and growing shortage ofmiddle income housing resulting in both economic and social challenges. Thereasons for the shortage of affordable and adequate housing can be tracedthroughout the steps of the housing delivery value chains. Lack of urban planningand adequate building standards are causing a shortage of urban land, resulting inhigh prices and urban sprawl. Unresponsive and mismatched regulations createmarket failures that prevent the housing market from functioning properly astheory would suggest. An overreliance on imported building materials, andmonopoly pricing in some cases, contribute to very high prices. The dominanceof small- and medium-sized developers and artisanal construction methods withlow capacity lengthens construction time, lowers quality, increases constructioncosts, and limits the supply of housing. Lack of financing for developers and housingcustomers, along with high financing costs for those that qualify for loans, add tothe overall housing costs. All these issues are amplified by inadequate institutionaland regulatory frameworks and poor governance. This constitutes an environmentnot conducive for reaping the demographic dividend.15
In Morocco the legacy deficit was estimated in 2010 at the time of the newgovernment housing policy at 840 000 units or some 13 percent of the housingstock. That estimate ignores rural vacancies. Considering the scale of urban-ruralmigration, the World Bank estimates that over one million households will need ahome in urban Morocco within the next five years. According to the 2014 census,Tunisia has eliminated its quantitative housing deficit and now has 580 000 morehousing units than households, hence a 17.7 percent national vacancy rate. Thesevacancies reflect houses that are too dilapidated to be livable, second homes, unitsbought as a mere refuge investment, or left vacant for fear of rent controls. It isthus reasonable to assume a much lower surplus or even zero, as most of thevacant stock may not be put to housing use. Tunisian housing needs dependstrongly on the household size and further rural-urban migration assumptions.16
This shortage threatens the long-term stability of the region. Governments acrossthe region have acknowledged the seriousness of this problem and haveimplemented a range of policies to tackle the shortage. However, most of theseinitiatives are at the early stage of implementation and further efforts are neededto ensure the successful delivery of more affordable projects.
Property marketsA lack of private land supply is the main constraint In North Africa. Land is abottleneck in the supply chain and the main cause of high real estate prices in theregion. Privately held land in Algeria, Libya and to a certain degree, Egypt, is a rarecommodity relative to demand, which tends to magnify the pressure on pricesand encourage speculation. Rigid land development regulations and complexregistration procedures for titles have led to a scarcity of legally developable landand have contributed to the region’s affordable housing shortfall. Most countriesin North Africa ranked poorly in terms of property registration in the World Bank’s2018 Doing Business Report, with Morocco (86th), Tunisia (93th), Algeria (163rd),Egypt (119th), and Libya (187th) performing worst.
Urban informal settlements have been permitted to develop in Morocco whilethey are rare in Egypt. In Egypt, however, many urban multi-storey buildings werebuilt outside formal processes and without permits during the years following the2011 revolution, in particular on the outskirts of Cairo. Urban renewal policiesthat formalise informal settlements are most active in Tunisia and Morocco whileEgypt has created high hurdles for action on formalisation. In Morocco the activegovernment has yielded important results not only in the quantity of availablehousing, but also in the quality of the stock. Between 2004 and 2014, accordingto census results, the share of rural Moroccan households with access to electricityand running water has doubled (38 percent and 55 percent respectively in 2014).
The share of urban households living in slums, precarious or substandard homesreached a peak at 8.2 percent in 2004 with 420 000 units, declining to 5.6 percentin 2014. In Tunisia, the ratio of the statistically defined “rudimentary dwellings” hasdeclined from almost 24 percent in 1975 to 4.9 percent in 1989 and to 0.3 percentin the 2009 census. However, the quality of the urban housing stock has beendeteriorating due to the lack of proper maintenance. This is caused by severalfactors, including the absence of formal property titles in the traditional medinas,the poor management of the social housing and the insufficient returns of rentalinvestment. Moreover, informal housing still represents an estimated 25 percentof the housing stock, and holds a significant share of the new construction in urbanareas.17 Furthermore, roughly 20 private commercial banks in Tunisia have housingloan programmes for individuals, mainly targeting middle and upper income families.The average interest for mortgages from commercial banks is now 7.78 percent.Banks are allowed to issue mortgages of up to 25 years in duration but are obligedto fix the rates for mortgages which last more than 15 years, which makes financingthem difficult. As a result most mortgages are for 15 years or less.18
There are many reasons behind informality in North African countries. Some ofthese drivers are poorly enforced regulations, shortages in housing supply, the lackof affordability, rapid urbanisation, low income and focusing on high luxury units.Most property markets in North Africa have limited international integration, soare somewhat shielded from international financial dynamics. Morocco is theexception, with its markets being much more open to foreign direct investment.As a result, Morocco experienced the impact of the global financial crisis and slow-down in the Euro-Zone to a greater extent. To help policy-makers and investorsmonitor these dynamics and develop resilience in the property market, Moroccowas the first country in the region to introduce a real estate price index that isformulated quarterly by the Central Bank and National Land Agency.
Policy and regulationHousing remains at the forefront of the agenda for most North Africangovernments. The link between affordable housing, economic development andsocial inclusion has been clearly recognised, particularly as many protests across theregion have been linked to poor living conditions caused by failures in housing policy.
North Africa’s real estate and construction industry has undergone significantdevelopment over the last five years, offering interesting opportunities foreconomic operators across the industry, from lenders to contractors, sub-contractors, engineering and architectural firms. Remarkably, this trend is enduringdespite the turmoil ensuing from the civil war in Libya, which has put a halt to aseries of construction projects in that country, and the upheaval of Arab Springand its aftermath. For instance, Algeria has launched a series of projects for theconstruction of public infrastructure, such as ports, roads, telecommunications andtransport facilities, public housing projects and the development of renewableenergies in an effort to diversify its power production by reducing reliance onfossil fuels and to promote economic development.
Another example of this trend is Egypt, which has embarked on large constructionprojects, including the excavation of a second shipping lane along part of the SuezCanal worth in excess of USD 8 billion, the creation of a new administrative capitalcity 45km east of Cairo that will house five million people and create 1.7 millionnew jobs, the construction of a major tourist resort on the Mediterranean coastnear Alexandria, and several projects in the renewable energy sector. Similarprojects have also been launched in Morocco and Tunisia. The construction andreal estate industry in North Africa has thus proved its resilience and is in fullexpansion. Foreign contractors and sub-contractors are also faced with labourmarket regulations imposing restrictions and quotas on the hiring of expatriatepersonnel in favor of local workers (e.g. the mandatory domestic-to-foreignworker ratio under Egyptian law). Constraints of this kind can prove burdensomefor contractors and sub-contractors that need specialised manpower that maynot be available in the local labour market. It is thus important to identify businessstructures that may be totally or partially exempt from such constraints.19
Many North African governments fail to formulate and implement low incomehousing policies that stimulate diversified tenure, and to encourage the public, co-operative housing and sometimes private corporate housing institutions that couldbundle the demand. The exception here is Morocco, which systematically supportslow-cost housing supply. Finally, the lack of empowerment of the demand-side

Africa Housing Finance Yearbook 2018
51
contributes to supply-side dysfunctionality and uniformity. Morocco’s direct taxsupport measures stimulated both the delivery of affordable housing and theemergence of a low-cost developer market. However, the model is currentlyapproaching its limits due to the oversupply it created in a number of cities; a lackof diversification of building designs and incongruence between house price limitsand local construction.
In Tunisia, the public sector, which was responsible for 60 percent of the productionin the 1970s, today represents a mere one percent. Currently, 80 percent of newhomes are self-built in progressive mode, with a growing proportion that is builtinformally. The government is trying to address this imbalance by reviving someof the proactive housing policy of the past. A set of agencies have been createdto stimulate or develop new housing, including for social housing (SNIT), for otherrental solutions (SPROLS), and for the acquisition of land banks and thedevelopment of urban land ‘Agence Foncière d’Habitation’ (AFH). Tunisia alsoplans to enhance the social housing sector under a special programme ‘ProgrammeSpécial de Logement Populaire,’ which aims at replacing or renovating 10 000dwellings in substandard conditions and building 20 000 social housing units to besold to low income households, with large financial support from the State. Inaddition, fiscal incentives are provided for specific purposes, such as student housingand rental investment for low income tenants.
Relative to other countries in the region, Morocco offers a positive legal and financialenvironment for mortgage lending, in particular a reliable – but incomplete –property registration system, as well as mortgage execution mechanisms that aremore expedient (i.e. 12 to 18 months for the judicial process) than in many othercountries. Amendments to the land law have been passed (law 14-07 of November24, 2011) which make the initial registration of customary or informally heldproperties compulsory. This affects areas where the government, through the landadministration agency ‘Agence Nationale de la Conservation Foncière, du Cadastreet de la Cartographie’ (ANCFCC), deems the formalisation of rights a priority.20
The housing sector in North Africa still tends to be over-regulated with the publicsector playing a primary role. Home ownership is prioritised over rental oralternative tenure options, which has resulted in small rental markets. However,there is growing interest in lease-to-own programmes, such as those being usedand expanded in Algeria as a response to difficulties in accessing mortgage finance.
OpportunitiesThe North African region needs to have more social housing programmes andgive incentives for contractors to build middle income housing. In addition, housingpolicies need to be shifted from supply-side support to direct demand-sidesubsidies, although the allocation of government-owned land remains critical toachieving low-cost levels. Furthermore, the high level of linkages with other sectorsmeans that investments in housing yield high benefits throughout the economy.
Given the environment of low oil prices, governments are focusing more ondifferent sectors such as urban construction and utilities. An increasing populationand urbanisation are driving many of the construction projects in the region. Thedemand for infrastructure and housing is growing in highly urbanised countriessuch as Algeria and in densely populated cities such as Cairo. To improve the livesof urban dwellers, create jobs, and enhance productivity, North African countriesneed to reduce the housing backlog. Because of its extensive linkages withmanufacturing, the financial sector, and other service subsectors, residential housingconstruction in developing countries is very labor-intensive and has high outputmultiplier effects. To address bottlenecks in the sector, better urban planning withadapted building codes, efficient regulation with reduced procedures and costs,improved governance, and better coordination between stakeholders will benecessary. Moreover, capacity building and financing for small and medium-sizeddevelopers can improve their productivity and their ability to deliver large-scalehousing programmes.
Additional sourcesAfrican Development Bank (2013). The African Development Bank Group inNorth Africa: Resilient Growth and Integration.https://www.afdb.org/fileadmin/uploads/afdb/Documents/Publications/The_AfDB_Group_in_North_Africa_2013.pdf (Accessed 25 Sept 2018).
United Nations Development Programme (2018). Human Development Index.http://hdr.undp.org/en/content/human-development-index-hdi (Accessed17 September 2018).
UN-HABITAT (2012). The State of Arab Cities. https://unhabitat.org/books/the-state-of-arab-cities-2012-challenges-of-urban-transition/ (Accessed 17September 2018).
World Bank Group (2018). Doing Business 2018: Reforming to create jobs.Region Profile of Middle East and North Africa (MENA).http://www.doingbusiness.org/content/dam/doingBusiness/media/Profiles/Regional/DB2018/MENA.pdf (Accessed 25 Sept 2018).
World Economic Forum (2017). The Africa Competitiveness Report 2017.https://www.weforum.org/reports/africa-competitiveness-report-2017(Accessed 5 Sept 2018).
Websiteswww.theafricareport.com/www.iut.nuwww.afribiz.infowww.economonitor.comwww.libya-businessnews.comwww.hofinet.comhttp://www.mfw4a.org/
1 African Development Bank Group (2018). North Africa Economic Outlook 2018.https://www.afdb.org/fileadmin/uploads/afdb/Documents/Publications/2018AEO/African-Economic-Outlook-2018-North-Africa.pdf (Accessed 16 Sept 2018).
2 African Development Bank Group (2018). North Africa Economic Outlook 2018.https://www.afdb.org/fileadmin/uploads/afdb/Documents/Publications/2018AEO/African-Economic-Outlook-2018-North-Africa.pdf (Accessed 16 Sept 2018).
3 The Word Bank. Global Findex Database 2017. https://globalfindex.worldbank.org/ (Accessed 5 Sept 2018). 4 Chehade, N (2017). To the Future and Back: Financial Inclusion in the Arab World. 13 March 2017. CGAP
http://www.cgap.org/blog/future-and-back-financial-inclusion-arab-world/ (Accessed 20 July 2017).5 Matthias Range and Atilla Kaiser-Yücel (2016). “Better Understanding the Demand for Islamic Microfinance.”
16 Sept 2016. CGAP. http://www.cgap.org/blog/better-understanding-demand-islamic-microfinance (Accessed5 July 2018).
6 Neaime, S (2018). Financial inclusion, financial stability and inequality. 30 Jan 2018. The forum, ERF Policy Portal.https://theforum.erf.org.eg/2018/01/29/financial-inclusion-financial-stability-inequality/ (Accessed 16 Sept 2018).
7 The World Bank (2018). “Financial Inclusion on the Rise, But Gaps Remain, Global Findex Database Shows”19 April 2018. http://www.worldbank.org/en/news/press-release/2018/04/19/financial-inclusion-on-the-rise-but-gaps-remain-global-findex-database-shows (Accessed 9 July 2018)
8 African Financial Markets Initiative. North Africa Overview. https://www.africanbondmarkets.org/en/country-profiles/north-africa/ (Accessed 9 July 2018).
9 Africa Platform for Development Effectiveness-NEPAD. Overview of Access to Finance. http://www.africa-platform.org/overview-access-finance (Accessed 23 July 2018).
10 Chironga, Mutsa et. al. (February 2018). Roaring to life: Growth and innovation in African retail banking.Mckinsey & Company. https://www.mckinsey.com/~/media/mckinsey/industries/financial%20services/our%20insights/african%20retail%20bankings%20next%20growth%20frontier/roaring-to-life-growth-and-innovation-in-african-retail-banking-web-final.ashx (Accessed 6 Sept 2018).
11 JLL. Progress and Priorities: Middle Income Housing in the Middle East and North Africa. http://www.jll-mena.com/mena/en-gb/research/middle-income-housing-report (Accessed 6 Sept 2018).
12 The Africa Report (2013). “Africa’s Social Housing: Homes for all.” 2 October 2013.http://www.theafricareport.com/North-Africa/africas-social-housing-homes-for-all.html (Accessed 20 July 2018).
13 The Africa Competitiveness Report 2017. World Economic Forum (Accessed 7 July 2018).14 Khaled, F. (2018). “A Good Year for Real Estate.” 1 January 2018. Egypt Today.
http://www.egypttoday.com/Article/3/39037/A-Good-Year-for-Real-Estate (Accessed 22 July 2018).15 Ibid. 16 Dübel, H and Hassler, O (2016). Housing Finance in the Middle East and North Africa. SANAD Housing
Finance Study. http://www.finpolconsult.de/mediapool/16/169624/data/Housing_Finance/Middle_East/SANAD_Fund_for_MSME_Housing_Finance_in_the_MENA_Region.pdf (Accessed 16 Sept 2018).
17 Dübel, H and Hassler, O (2016). Housing Finance in the Middle East and North Africa. SANAD HousingFinance Study. http://www.finpolconsult.de/mediapool/16/169624/data/Housing_Finance/Middle_East/SANAD_Fund_for_MSME_Housing_Finance_in_the_MENA_Region.pdf (Accessed 16 Sept 2018).
18 Global Property Guide. “Tunisia property prices rising, but fears of terrorism have hit tourism.” 20 March 2017.https://www.globalpropertyguide.com/Middle-East/Tunisia/Price-History (Accessed 18 July 2018).
19 Bicciato, R. and Melchionda, L. (2016). Common problems and possible solutions in real estate and constructionin North Africa. 15 September 2016. African Law and Business. https://www.africanlawbusiness.com/news/6695-common-problems-and-possible-solutions-in-real-estate-and-construction-in-north-africa (Accessed 6 Sept 2018).
20 Dübel, H. and Hassler, O. (2016). Housing Finance in the Middle East and North Africa. SANAD HousingFinance Study.

AOA 14 000 000US$56 860
BWP 556 740US$54 210
CDF 32 400 000US$20 000
LSL 214 694US$14 615
MGA 465 975 000US$50 000
MWK 15 000 000US$20 657
MUR 1 220 000US$35 382
MZN 3 301 650US$55 000
NAD 280 000US$20 896
SCR 750 000US$55 535
ZAR 352 000US$23 327
SZL 763 000US$50 000
ZMW 650 000US$65 000'
ZWD 18 000US$18 000
5m4m
3m2m
lm0
Sour
ce: C
anba
ck G
loba
l Inc
ome
Dist
ribut
ion
Data
base
(C-G
IDD)
.ht
tps:
//ww
w.c
gidd
.com
/
Sout
hern
Afr
ica
GDP
per c
apita
, 201
8
PPP$
40 0
01+
PPP$
2300
1 –
PPP$
40 0
00
PPP$
12 0
01 –
PPP$
23 0
00
PPP$
8 00
1 –
PPP$
12 0
00
PPP$
5 00
1 –
PPP$
8 00
0
PPP$
3 60
1 –
PPP$
5 00
0
PPP$
240
1 –
PPP$
3 60
0
PPP$
1 60
1 –
PPP$
2 40
0
PPP$
801
–PP
P$1
600
<PP
P$80
0
Annu
al in
com
e pr
ofile
for r
ural
and
urb
an h
ouse
hold
s, 20
18An
nual
hou
seho
ld in
com
es e
stim
ated
usi
ng e
xpen
ditu
re (P
PP$)
Rura
lUr
ban
Tota
l of 6
0.2m
hous
ehol
ds in
the
Sout
hern
Afr
ica
regi
on
32.7
m ru
ral h
ouse
hold
s27
.5m
urb
an h
ouse
hold
s
,
Angola
Botswana
DRC
Lesotho
Madagascar
Malawi
Mauritius
Mozambique
Namibia
Seychelles
South Africa
eSwatini
Zambia
Zimbabwe
Num
ber o
f mor
tgag
e pr
ovid
ers
5n/
a6
3n/
an/
a20
43n/
a1
n/a
n/a
917
Estim
ated
num
ber o
f mor
tgag
esn/
a17
500
vn/
an/
an/
an/
a60
0n/
an/
a2
387
796
n/a
n/a
n/a
Mor
tgag
e in
tere
st ra
te
25.6
4%8.
42%
14%
11.8
7%19
%36
%5.
50%
30%
11.5
0%7.
9%10
%8%
31%
12%
Dow
npay
men
t 20
%10
%n/
a15
%n/
an/
a10
%20
%0%
10%
10%
n/a
20%
25%
Mor
tgag
e te
rm (y
ears
)20
2515
2020
1030
2020
2020
n/a
2025
Only
21%
of c
ount
ries
in th
e re
gion
hav
e av
aila
ble
info
rmat
ion
on n
umbe
r of m
ortg
ages
.
Angola
Botswana
DRC
Lesotho
Madagascar
Malawi
Mauritius
Mozambique
Namibia
Seychelles
South Africa
eSwatini
Zambia
Zimbabwe
60sq
m67
sqm
85sq
m40
sqm
n/a
75sq
m50
sqm
65sq
mn/
a15
0qm
40sq
mn/
a70
sqm
150s
qm
US$
exch
ange
rate
(28
July
201
8)16
5.9
10.3
1 48
0.2
13.3
3 11
6.1
730.
334
.563
.613
.313
.613
.313
.39.
51.
0
% U
rban
who
mig
ht a
fford
hou
segi
ven
prev
ailin
g m
ortg
age
term
s9.
7%20
.0%
2.5%
17.8
%1.
3%1.
4%93
.7%
1.3%
48.0
%55
.1%
34.4
%34
.4%
8.5%
24.7
%
Wor
ld B
ank
Doin
g Bu
sine
ss ra
nkin
gs
on s
elec
ted
indi
cato
rs, 2
018
Wor
ld B
ank
Doin
g Bu
sine
ss g
loba
l ran
k, 2
018
Hous
e pr
ice
(US$
)
1m2m
3m4m
5m
Pric
e an
d si
ze o
f the
che
apes
t new
ly b
uilt
hous
e by
a p
rivat
e de
velo
per,
2018
Sout
h Af
rica
15.6
m
Cong
o, D
em. R
ep.
12.7
m
Moz
ambi
que
7.1m
Mal
awi
4.1m
Sour
ce: C
anba
ck G
loba
l Inc
ome
Dist
ribut
ion
Data
base
(C-G
IDD)
.ht
tps:
//ww
w.c
gidd
.com
/
0 50 100
150
200
Dealing with construction permitsM
aurit
ius
(25)
Bots
wan
a (8
1)
Sout
h Af
rica
(82)
Zam
bia
(85)
Seyc
helle
s (9
5)
Leso
tho
(104
)
Nam
ibia
(106
)
Mal
awi (
110)
eSw
atin
i (11
2)
Moz
ambi
que
(138
)
Zim
babw
e (1
59)
Mad
agas
car (
162)
Ango
la (1
75)
DRC
(182
)
The
Doin
g Bu
sine
ss in
dica
tors
pro
vide
com
preh
ensi
vean
d co
mpa
rativ
e gl
obal
dat
a tra
ckin
g bu
sine
ssre
gula
tion
envi
ronm
ents
ove
r tim
e. A
hig
h ea
se o
fdo
ing
busi
ness
rank
ing
mea
ns th
at th
e re
gula
tory
envi
ronm
ent i
n th
at e
cono
my
is m
ore
cond
uciv
e to
the
star
ting
and
oper
atio
n of
a lo
cal fi
rm.
The
indi
cato
rs fo
r dea
ling
with
con
stru
ctio
n pe
rmits
and
regi
ster
ing
a pr
oper
ty b
oth
rela
te to
com
mer
cial
prop
erty
. How
ever
, no
sim
ilar i
ndic
ator
s fo
r res
iden
tial
prop
erty
cur
rent
ly e
xist
.
DRC
US$4
34
Seyc
helle
sUS
$15
504
Zim
babw
eUS
$1 0
80Bo
tsw
ana
US$7
781
Moz
ambi
que
US$4
16
Mau
ritiu
sUS
$10
547
Mad
agas
car
US$4
49
Zam
bia
US$1
510
Sour
ce: W
orld
Ban
k on
line
data
base
. ht
tps:
//dat
a.w
orld
bank
.org
Mor
tgag
e le
ndin
g, 2
018
Num
ber o
f hou
seho
lds,
2018
Sour
ce: C
AHF
2018
des
ktop
sur
veys
and
cou
ntry
exp
erts
.
Regi
ster
ing
a co
mm
erci
al p
rope
rty
Sour
ces:
Mor
tgag
e te
rms,
hou
se p
rices
& s
izes
from
CAH
F 20
18 s
urve
ys. H
ouse
hold
& in
com
e da
ta d
raw
n fro
m C
-GID
D (C
anba
ck G
loba
l Inc
ome
Dist
ribut
ion
Data
base
).
Sour
ce: W
orld
Ban
k Do
ing
Busi
ness
Indi
cato
rs -
http
://w
ww
.doi
ngbu
sine
ss.o
rg/
200
180
160
140
120
100
8060
4020
0
Ango
la6.
0m
Mad
agas
car
5.6m
Zam
bia
3.3m
Ango
laUS
$4 1
70
Nam
ibia
US$5
555 So
uth
Afric
aUS
$6 1
61
eSw
atin
iUS
$3 3
34
Leso
tho
US$1
181M
alaw
i US
$338
Africa Housing Finance Yearbook 2018
53
Southern African Development Community (SADC)in 2017, while the Comoros and Malawi registered double digit fiscal deficits in thesame year. In 2017, South Africa’s fiscal deficit increased to 4.5 percent of GDP, upfrom 4.1 percent in 2016.8 As the region’s largest economy,9 South Africa’s poorfiscal performance remains a risk to SADC’s overall macroeconomic performance.
In terms of government debt, the four countries (Angola, Seychelles, Mozambiqueand Zimbabwe) exceeded the regional government debt to GDP target of 60percent in 2017. Mozambique and Zimbabwe are considered to be in “debtdistress” with debt-to-GDP ratios sitting at 102 percent and 78 percentrespectively, while Zambia is considered to be in “high risk of debt distress” witha ratio of 62 percent in 2017.10
A key challenge faced by most SADC countries is the need to diversify theireconomies away from commodity-led sectors to higher-productivity sectors suchas manufacturing and services, particularly to allow SADC to benefit from its tradeagreements. Data from the United Nations Conference on Trade andDevelopment (UNCTD) indicates that 11 of the 16 SADC member countriesare categorised as having “low economic diversification”, while the remaining four(South Africa, Namibia, Tanzania and Mauritius) are classified as having “mediumeconomic diversification”.11
The European Union (EU) remains SADC’s largest trading partner with totalexports in 2016 reaching US$42 billion, while total imports into SADC was US$35billion. The top three exports from SADC included gold, diamonds and oil.12 SixSADC member countries benefit from their membership to the EconomicPartnership Agreement (EPA) signed in 2016. The EPA provides Botswana,Lesotho, Mozambique, Namibia, South Africa and eSwatini guaranteed access tothe EU market without any duties or quotas. Angola also has the option to jointhe EPA at a later stage.13 This free trade agreement offers significant potential toboost member countries long-term macroeconomic performance.
In terms of the potential for future foreign investment into SADC, Rand MerchantBank (RMB) Annual Investment Attractiveness Index provides a good measure ofthis. The RBM Investment Attractive Index looks at both the economic activityand operating environment in a country and scores countries from 1 to 10 (with10 being the best). Based on the 2017 index, South Africa is the most attractiveSADC country to invest in with a score of 6.3, followed by Tanzania (5.6) andBotswana (5.4). The SADC member countries that score the lowest on the indexinclude Comoros (2.7), Zimbabwe (3.0) and eSwatini (3.5).
Despite being an attractive economy, South Africa’s sluggish growth, politicaluncertainty and poor performing state-owned enterprises continue to weakenthe country’s sovereign ratings and, as of 2018, the country remains off the list ofinvestment grade countries. However, of the four countries in Africa that haveinvestment-grade ratings, three are in SADC including Botswana, Mauritius andNamibia.14
South Africa also dropped in the Global Competitiveness report in 2017/18dropping 14 places to 61st out of 137 countries. Mauritius maintains its position asthe most competitive economy in SADC and Sub-Saharan Africa with an overallposition of 45 out of 137. Madagascar was the most improved economy in 2017/18having increased seven positions to 121st out of 137. This improvement was largelydriven by Madagascar’s improved macroeconomic performance in recent years.15
With a young, increasing mobile and urban population, future prospects for theSADC region rest on its ability to tap into the entrepreneurial spirit of the urbanyouth. This was one of the key messages of the 38th Ordinary Summit of theHeads of State and Government of the Southern African DevelopmentCommunity (SADC) which took place in Namibia in August 2018. As the outgoingchair, President Cyril Ramaphosa stressed the importance of creating a conduciveenvironment for public sector investment, prioritising infrastructure developmentfor the benefit of all member states and investing in the region’s youth. 16
Access to financeAccording to a 2018 RMB report, access to finance is the single biggest problemfor doing business in seven of the 16 SADC member countries including: the
OverviewThe Southern African Development Community (SADC) has its origins in theSouthern African Development Coordination Conference (SADCC) which wasestablished in 1980. In 1992, the member states signed the declaration and treatyestablishing SADC as a replacement to the SADCC. Currently SADC has 16 memberstates: Angola, Botswana, Democratic Republic of Congo (DRC), Lesotho, Madagascar,Malawi, Mauritius, Mozambique, Namibia, Seychelles, South Africa, eSwatini, UnitedRepublic of Tanzania, Zambia, Zimbabwe and the newest member, Comoros.
The vision of SADC is for a regional community in which the people of SouthernAfrica can realise economic well-being, improved living standards and quality oflife, freedom, social justice, peace and security. SADC’s mission is to “promotesustainable and equitable economic growth and socio-economic development throughefficient productive systems, deeper co-operation and integration, good governance, anddurable peace and security, so that the region emerges as a competitive and effectiveplayer in international relations and the world economy”.1
In 2017, SADC had a total population of approximately 343 million people makingup 32 percent of Sub-Saharan Africa’s population.2 In the same year, 42 percentof the population were residing in urban areas, while the average urban populationgrowth rate across the region was 3.3 percent.3
While still low, the average real GDP growth rate across SADC increased to 2.2percent in 2017, up from 1.7 percent in 2016. Within SADC, Tanzania recordedthe highest real GDP growth rate in 2017 at 6.0 percent, followed by Seychelles at4.2 percent, and Madagascar and Malawi at 4.0 percent respectively. Namibiarecorded negative growth in the same year (-1.2 percent), while eSwatini(Swaziland) registered near zero growth at 0.2 percent.4 The following factorscontributed to the region’s growth in 2017: improved weather conditions acrossmost parts of the region leading to increased agriculture output; the recovery ofcommodity prices; and an improved global economic outlook.5 However majorchallenges still exist for most member countries, including but not limited to, theeconomic policy and political uncertainty in South Africa leading to weakenedbusiness confidence and investment, structural and fiscal constraints in Angola drivenby their reliance on the oil price, as well as a challenging business environment inZimbabwe as a result of the country’s political transition.6 Despite this, economicgrowth in SADC is expected to increase in the short-term with real GDP growthforecasted to be 3.0 percent in 2019. This is lower than the forecasted growth forSub-Saharan Africa at 3.7 percent. In addition, SADC predicts that none of themember states will reach the regional target of 7 percent growth in the short tomedium term.7
Long-term growth prospect across the region remain subdued due to several factors,most notably the high fiscal deficits and growing debt levels in many member states.In 2017, SADC’s fiscal deficit as a percentage of GDP increased to 5.0 percent, upfrom 4.5 percent in 2016. Botswana was the only country to register a fiscal surplus

54
Democratic Republic of Congo (DRC), Lesotho, Malawi, Namibia, Seychelles,Zambia and Zimbabwe.17 While there are intentions for regional financialintegration, the 16 member states currently function as independent economieswith their own independent financial systems. However, efforts to improve theflow of money between member states have made good progress.
The SADC Integrated Regional Electronic Settlement System (SIRESS), establishedin 2013, facilitates intra-SADC transactions without the need for an externalclearinghouse. This has generated significant cost and time efficiencies fortransactions within the region. Furthermore, with the recent development toinclude US dollars as currency in the SIRESS, transactions are said to become evenfaster. The SIRESS system is reported to have reduced the intra-SADC transactiontime from approximately two to three days, to just 24 hours.18 This project, whichis run by the SADC Banking Association, forms part of a greater strategy toimprove regional cooperation in the finance and investment sectors and is in linewith the region’s Protocol on Finance and Investment.
A further effort by the region aimed at mobilising much-needed funds forinfrastructure development projects is the proposed SADC Regional DevelopmentFund (SADC-RDF). Members states are reported to have signed the agreementin 2016, although as at June 2018 there were still calls for some countries to signand complete the agreement by depositing the necessary funds in the RDF.19
Operationalising the SADC-RDF will be a major step forward towards decreasingthe infrastructure financing gap on the continent which the African DevelopmentBank estimates is between US$67.6 and US$107.5 billion per annum. However,concerns about member states’ ability to contribute funds remain.20
The banking sector is highly concentrated across the region. South African bankstend to dominate with most of the major South African based banks operatingsubsidiaries across SADC. For example, Standard Bank operates in all SADCcountries, except for the Comoros, Madagascar and Seychelles. First NationalBank (FNB) operates in Botswana, Lesotho, Namibia, eSwatini Tanzania,Mozambique and Zambia. While ABSA also operates in Botswana, Mozambique,Zambia, Seychelles, Tanzania, Mauritius and Namibia.
According to IMF data, banking sector assets as a percentage of GDP varyconsiderably across the region from over 300 percent in the case of Mauritius toless than 50 percent in four member states (Comoros, Lesotho, eSwatini andZambia). A significant risk to the regional banking sector is the rise in non-performing loans in many member states – most notably in Angola with non-performing loans (NPLs) reaching over 25 percent in 2017 and Tanzania andZambia with over 10 percent NPLs to total loans.21
Levels of financial inclusion also vary across the region. According to the latestavailable data (FinScope 2015) 66 percent of adults in the region are financiallyincluded amounting to approximately 83.5 million people. Mauritius has thehighest percentage of financially-included adults at 90 percent, followed by SouthAfrica at 86 percent and the lowest is Mozambique with 40 percent. While only36 percent of adults are banked across SADC member states, this is a significantincrease from 24 percent in 2011, indicating progress in financial inclusion in theregion. Still, exclusion rates are high at 34 percent (41.9 million people), hamperingaccess to credit from formal institutions. Twelve percent of adults rely on informalmechanisms and 18 percent use formal non-bank products/services. Of the 83.4million adults who are financially included in the region, 53 percent say they haveaccess to, and use, credit products.
The Findex survey explores use of loans for housing (whether they are securedor unsecured was not specified in the questionnaire). According to the latestsurvey (2017), the proportion of adults over the age of 15 that had an outstandinghome loan in the SADC region ranged from 12.9 percent in Mauritius to 1.9percent in the Democratic Republic of Congo. The proportion of adults with anoutstanding housing loan in Botswana decreased from 9.6 percent in 2014 to 3.0percent in 2017.22 This follows a general decrease in commercial bank lending tohouseholds in the country.
Mortgage markets across the region are in part constrained due to high interestrates. In at least five member states, interest rates on mortgage loans exceed 20percent per annum.23 Mauritius and Botswana charge the lowest interest ratesat 5.5 percent and 8.8 percent respectively.
Among other areas for improvement, improving access to formal credit is a keypriority of the SADC Financial Inclusion Strategy for the period 2016 to 2021.Current barriers to credit market development in the region, and financial inclusionmore broadly, include small capital markets, limited and/or unreliable borrowerinformation, and lack of collateral or assets, among other reasons.24
AffordabilityWith persistent poverty across the region, affordability remains a constraint tohousing supply and delivery. According to IMF data, the Seychelles has the highestGDP per capita in the SADC region at US$16 427 while Mozambique has thelowest at US$472. Mauritius, Botswana and South Africa have the second, thirdand fourth highest GDP per capita in the SADC region, respectively.25
While inflation rates across SADC vary considerably, they are typically high whichfurther affects households’ purchasing power. The average annual regional inflationrate, measured by the harmonised consumer price indices (HCPI), was recorded at9.3 percent in February 2018, with 11 states recording rates below the regionalaverage.26 Angola, DRC, Malawi and Mauritius recorded rates higher than theregional average. The DRC recorded the highest annual inflation rate of 51.9 percentas at February 2018, while Zambia recorded a rate of -1 percent over the sameperiod.
Providing access to affordable, well-located housing remains a major challengeacross the SADC region. The prices of the cheapest newly built houses by aprivate developer in the SADC region range from approximately US$14 615 inLesotho to US$65 000 in Zambia. eSwatini, Madagascar, Seychelles, Botswana,Angola, Namibia and Zambia have some of the least affordable houses with theprice of a newly built house starting at US$50 000.27
Housing supplyLarge housing deficits exist across the SADC region with demand far outweighinghousing supply and delivery. In the Democratic Republic of Congo, the housingbacklog is estimated to be close to four million housing units, while three millionunits are required in Tanzania. Zimbabwe is estimated to need 20 years to clearthe backlog of over one million houses, while Zambia needs to build 46 000 unitsper year until 2030 to clear their backlog.
In an effort to clear the backlog, deliver affordable housing and improve the livingconditions of the poor, a number of initiatives are taking place.28 Some of theseefforts are focused on specific segments of the market, such as civil servants. Twoexamples in this regard include the Watumishi Housing Company (WHC) inTanzania and the Institutional Housing Project (IHP) in eSwatini. By April 2018, theWHC in Tanzania is reported to have delivered 631 housing units out of a total of50 000 units promised under the Public Servants Housing Scheme, while 390housing units are reported to have been completed under the IHP in eSwatini.
Public sector support for affordable housing delivery also continues in somecountries. For example, in Namibia, the City of Windhoek has pledged US$11million to build 1 200 housing units and in Mauritius the government has set asidea budget in 2018-29 for the construction of 1 000 low cost housing units.However, in some countries, such as the DRC, there remains little governmentsupport for low income housing.
South Africa still has the most comprehensive subsidised housing programme,however given the large expenditure required and the country’s low growthprospects, the programme is widely viewed as unsustainable in the long term.Given South Africa’s experience, it is unsurprising that the recent announcementby Zimbabwe’s new ruling party to deliver 1.5 million houses by 2023 has beenmet with scepticism.
NGOs continue to play a major role in the development of improved livingconditions in the region. One example is Habitat for Humanity’s work in Lesotho.The organisation is reported to have helped over 2 700 households in the country.Many other organisations are also continuing their good work across the regionincluding UK-based Reall, which has recently approved housing and improvedsanitation projects in Zimbabwe, among others. Private sector development ofaffordable housing still remains relatively low across the region, though there is agrowing awareness of the gap market and its opportunities, particularly incountries such as South Africa.

Africa Housing Finance Yearbook 2018
55
Policy and regulationThe SADC Protocol on Finance and Investment (FIP) remains the key instrumentto facilitate regional integration and aims at making the SADC region an attractivedestination for FDI and regional investment. The FIP’s key strategies in this regardinclude the harmonisation of tax policies, macroeconomic convergence in theregion, liberalisation of capital and current accounts, as well as alignment of theCentral Bank’s policies amongst other issues.
While not legally-binding, another noteworthy agreement among SADC memberstates is the Regional Indicative Strategic Development Plan (RISDP) for the period2015 to 2020. The RISDP sets out the key priorities and specific objectives ofSADC and focuses on four key areas: industrial development, market integration,infrastructure in support of regional integration, and peace and security cooperation. In addition, the SADC Industrialisation Strategy and Roadmap 2015 – 2065,approved in 2015, seeks to achieve economic transformation by encouragingregional integration and economic and technological transformation throughenhancing its competitive and comparative advantages. This has direct implicationsfor housing and human settlement development as increased employment-generating activity will increase demand for housing. Furthermore, diversifying theeconomy and increasing production rates will create an attractive investordestination. This will in turn spur demand for accommodation.
Several member states’ housing policies require attention in order for their housingmarkets to develop further. In addition, policy and regulatory bodies requireimproved capacity to manage their land and housing markets efficiently. For example,Zimbabwe faces numerous challenges with housing despite having relatively updated,progressive housing policies and laws. This stems from inadequate institutionalcapacity to support the country’s housing laws.29 Zambia provides another examplewhere delays in the approval of the Draft Land and National Urbanisation Policy actas a barrier to the implementation of a nation-wide housing delivery programme.However, many countries have implemented reforms that have a direct impact onthe housing market, as noted in more detail below.
Property market and opportunitiesAccording to the World Bank Doing Business Index, fifteen out of 16 countriesimproved their position between 2016 and 2018. South Africa was the onlycountry in the SADC region to decrease its position over the same period. Malawiis one of the most improved countries in the ranking, jumping 31 positions to110th since 2016. During the year, Malawi operationalised a new credit bureau,Credit Data CRB, and established rules for bankruptcy procedures, whichcontributed to its success in the ranking. The country also halved the fees chargedby the city council to process building plan approvals.
Several member states also implemented reforms to their credit sector. eSwatiniadopted the Consumer Credit Act 2016 guaranteeing borrowers’ right to inspecttheir own data, while Zambia strengthened access to credit by adopting a newMovable Property Act and by setting up a new collateral registry. Madagascarconsolidated microfinance and bank credit registries, expanding the number ofborrowers in the registry to more than 5 percent of the adult population, whileZimbabwe launched a new credit registry but discontinued credit scoring. Othercountries implemented changes, both positive and negative, to the building permit
and property registration process. Mauritius reduced the time to provide a sewageconnection and eliminated the transfer tax and registration duty, implementing acomplaint mechanism and publishing service standards, making it easier to transferproperty. Angola made dealing with construction permits easier by improving itssystem for building permit applications, while the Seychelles improved the qualityof its land administration system by digitizing its maps and introducing a complaintmechanism. Tanzania implemented a one-stop shop which streamlines the buildingpermit process, but also increased the land and property registration fee. Botswanamade registering property (temporarily) more difficult by reducing the efficiencyof its Registrar of Deeds as it implements the computerisation of manual records,while the Democratic Republic of Congo made dealing with construction permitsmore expensive by revising the formula to assess building permit fees.
Chinese-owned firms still dominate the construction and real estate sector inAfrica. According to RMB’s Where to Invest in Africa Report, Chinese firms accountfor approximately 50 percent of Africa’s internationally contracted constructionand real estate projects with annual revenues in Africa estimated at US$40billion.30 Overall, 40.6 percent of all foreign direct investment in Africa wasdirected towards the real estate, construction and hospitality sectors.31 Rankedby amount invested, three SADC countries, namely Angola, South Africa andMozambique, were listed in the top 10 receivers of FDI in 2016.32
Real Estate Investment Trusts (REITs) are still gaining momentum in SADC countriessuch as South Africa and Zambia and Tanzania. A REIT acts as an investment vehiclethat aggregates diverse sources of funding from international and institutionalinvestors through to individuals, and channels the funds into real estate portfolioscomprising of mortgages and/or large developments. REITs offer investors a morediverse real estate investment package than the alternative option of investing inan individual project. South Africa has at least 25 publicly traded REITs with a totalmarket capitalisation of over US$20 billion in 2018.33 In 2017, the marketcapitalisation of Tanzania’s REIT was US$40 million. While REITs have typicallyfocused more on commercial developments, residential-specific REITs are emergingand creating an opportunity to diversify ‘risky’ housing investment portfolios.34
With renewed focused on growing private sector investment by creatingconducive environments for businesses to flourish, increasing inter-regional trade,routing out corruption and strengthening judicial and oversight systems, SADCmember states maintain their commitment to driving economic developmentacross the region. In addition, the focus on operationalising the SADC RegionalDevelopment Fund in the near future shows promise for infrastructure developmentacross the region. This in turn should create a more attractive environment forfuture investors. Still, the region faces major macroeconomic challenges, morespecifically high levels of debt and growing fiscal deficits. This, among otherchallenges, presents risks for future public sector investments aimed at alleviatingthe large (and growing) housing backlogs and the sub-standard living conditionscharacteristic of the region’s urban centres.
Websiteswww.doingbusiness.org www.finmark.org.za www.saiia.org.za www.sadc.intwww.tralac.org
1 SADC (2012). SADC Mission. https://www.sadc.int/about-sadc/overview/sadc-mission/ (Accessed 3 October 2018).
2 The World Bank (2018). World Development Indicators.http://databank.worldbank.org/data/reports.aspx?source=world-development-indicators# (Accessed 1 October 2018).
3 Ibid. 4 IMF (2018). Regional Economic Outlook. Sub-Saharan Africa. April 2018.
https://www.imf.org/~/media/Files/Publications/REO/AFR/2018/May/pdf/sreo0518.ashx (Accessed 1 October 2018). Pg. 93.
5 United Nations Economic and Social Council (2018). Recent economicand social conditions in Southern Africa in 2017, and prospects for 2018.https://www.tralac.org/documents/news/2195-recent-economic-and-social-conditions-in-southern-africa-in-2017-and-prospects-for-2018-uneca-september-2018/file.html (Accessed 1 October 2018). Pg. 4.
6 United Nations Economic and Social Council (2018). Pg. 5.7 United Nations Economic and Social Council (2018). Pg. 4. 8 IMF (2018). Pg. 101. 9 According to the World Bank Development Indicators, in 2017, South
Africa contributed 51 percent of SADC’s overall GDP figures.10 IMF (2018). Pg. 11 & 104. 11 RMB (2018). Where to invest in Africa 2018. https://www.rmb.co.za/where
-to-invest-in-africa-2018-edition/ (Accessed 1 October 2018). Pg. 59.12 Tralac (2018). Trade Data Analysis. EU-Africa trading relationship.
https://www.tralac.org/resources/our-resources/11938-european-union-africa-trading-relationship.html (Accessed 1 October 2018).
13 European Commission (2018). Southern African DevelopmentCommunity (SADC). http://ec.europa.eu/trade/policy/countries-and-regions/regions/sadc/ ( Accessed 1 October 2018).
14 RMB (2018). Where to invest in Africa 2018. https://www.rmb.co.za/where-to-invest-in-africa-2018-edition/ (Accessed 1 October 2018).
15 World Economic Forum (2018). Global Competitiveness Report2017/18. http://reports.weforum.org/global-competitiveness-index-2017-2018/sub-saharan-africa/ (Accessed 1 October 2018).
16 Tralac (2018). SADC should push for industrial growth: Ramaphosa.https://www.tralac.org/news/article/13376-sadc-should-push-for-industrial-growth-ramaphosa.html (Accessed 2 October 2018).
17 RMB (2018). Pgs. 137 – 163. 18 Majaha, D. (2018). SADC moves towards multi-currency regional
payment system. 18 August 2018. https://www.tralac.org/news/article/13372-sadc-moves-towards-multi-currency-regional-payment-settlement-system.html (Accessed 1 October 2018).
19 Trade Law Centre (Tralac) (2018). SADC Committee of Ministers ofFinance and Investment meet in Johannesburg. 11 July 2018.https://www.tralac.org/news/article/13251-sadc-committee-of-ministers-of-finance-and-investment-meets-in-johannesburg (Accessed 1 October 2018).
20 Markowitz, C. (2018). Operationalising the SADC Regional DevelopmentFund. July 2018. http://saiia.org.za/wp-content/uploads/2018/08/GA_Th1_PB-markowitz-wentworth-grobbelaar_20180716.pdf (Accessed2 October 2018).
21 IMF (2018). Regional Economic Outlook. Sub-Saharan Africa. Pg. 13.
22 The World Bank (2018). Global Financial Inclusion. http://databank.worldbank.org/ data/reports.aspx?source=global-financial-inclusion#(Accessed 2 October 2018).
23 Includes Angola, Democratic Republic of Congo, Malawi, Zambia, andTanzania. See respective country profiles for data sources.
24 SADC (2016). SADC Financial Inclusion Strategy.http://finmark.org.za/wp-content/uploads/2018/07/160312-FI-strategy-SADC-final-updated-sources.pdf (Accessed 2 October 2018).
25 IMF (2018). IMF DataMapper. https://www.imf.org/external/datamapper/NGDPDPC@WEO/OEMDC/ADVEC/WEOWORLD (Accessed2 October 2018).
26 SADC (2018). SADC Hamonised Consumer Price Indices.https://www.sadc.int/files/2415/2396/0574/SADC_HCPI_February_2018.pdf (Accessed 2 October 2018).
27 Data from respective country profiles.28 For more details and source information on specific profiles, refer to the
respective country profiles29 See Zimbabwe country profile for more information.30 RMB (2018). Pg. 86. 31 Ernst and Young (2017). EY’s Attractiveness Program Africa
https://www.ey.com/Publication/vwLUAssets/ey-africa-attractiveness-report/$FILE/ey-africa-attractiveness-report.pdf (Accessed 2 October 2018). Pg. 22.
32 RMB (2018). Pg. 81.33 SA REIT Association (2018). Monthly Chart Book September 2018.
http://www.sareit.com/docs/chartbooks/2018/09/Chartbook_Sep_2018.pdf (Accessed 2 October 2018).

8m7m
6m5m
4m3m
2mlm
0
Sour
ce: C
anba
ck G
loba
l Inc
ome
Dist
ribut
ion
Data
base
(C-G
IDD)
.ht
tps:
//ww
w.c
gidd
.com
/
Wes
t Afr
ica
GDP
per c
apita
, 201
8
PPP$
40 0
01+
PPP$
2300
1 –
PPP$
40 0
00
PPP$
12 0
01 –
PPP$
23 0
00
PPP$
8 00
1 –
PPP$
12 0
00
PPP$
5 00
1 –
PPP$
8 00
0
PPP$
3 60
1 –
PPP$
5 00
0
PPP$
240
1 –
PPP$
3 60
0
PPP$
1 60
1 –
PPP$
2 40
0
PPP$
801
–PP
P$1
600
<PP
P$80
0
Annu
al in
com
e pr
ofile
for r
ural
and
urb
an h
ouse
hold
s, 20
18An
nual
hou
seho
ld in
com
es e
stim
ated
usi
ng e
xpen
ditu
re (P
PP$)
Rura
lUr
ban
Tota
l of 7
2.9m
hous
ehol
ds in
the
Wes
t Afr
ica
regi
on
37.2
m ru
ral h
ouse
hold
s35
.7m
urb
an h
ouse
hold
s
70000
80000
Benin
Burkina Faso
CapeVerde
Cote d' Ivoire
Gambia
Ghana
Guinea
Guinea Bissau
Liberia
Mali
Mauritania
Niger
Nigeria
Senegal
SierraLeone
Togo
Num
ber o
f mor
tgag
e pr
ovid
ers
71
5n/
a4
15n/
an/
a1
9n/
a1
611
n/a
n/a
Estim
ated
num
ber o
f mor
tgag
es4
000
974
116
469
n/a
n/a
n/a
n/a
n/a
300
452
n/a
174
24 4
1440
000
n/a
2 92
3
Mor
tgag
e in
tere
st ra
te
8.47
%6%
14.5
%8.
38%
20%
28.7
%2.
5%11
%13
.33%
9%8%
10.5
%19
.5%
7.62
%22
%n/
a
Dow
npay
men
t n/
an/
a20
%n/
a40
%20
%33
%n/
a30
%n/
a35
%n/
a25
%n/
a40
%n/
a
Mor
tgag
e te
rm (y
ears
)7
15
2025
1020
215
86
109
2015
155
Only
56%
of c
ount
ries
in th
e re
gion
hav
e av
aila
ble
info
rmat
ion
on n
umbe
r of m
ortg
ages
.
Benin
Burkina Faso
Cape Verde
Cote d' Ivoire
Gambia
Ghana
Guinea
GuineaBissau
Liberia
Mali
Mauritania
Niger
Nigeria
Senegal
Sierra Leone
Togo
40sq
mn/
an/
an/
a49
sqm
54sq
m90
sqm
85sq
m19
4sqm
n/a
n/a
n/a
62sq
m65
sqm
n/a
32sq
m
US$
exch
ange
rate
(28
July
201
8)58
0.9
582.
497
.958
2.1
46.6
4.4
9 37
7.8
582.
115
4.3
582.
135
7.6
582.
130
5.8
582.
17
315.
158
2.1
% U
rban
who
mig
ht a
fford
hou
segi
ven
prev
ailin
g m
ortg
age
term
s9.
0%34
.9%
29.7
%19
.5%
3.3%
7.4%
12.3
%3.
1%0.
0%2.
3%2.
9%1.
7%38
.9%
63.7
%7.
5%2.
2%
Wor
ld B
ank
Doin
g Bu
sine
ss ra
nkin
gs
on s
elec
ted
indi
cato
rs, 2
018
Wor
ld B
ank
Doin
g Bu
sine
ss g
loba
l ran
k, 2
018
Hous
e pr
ice
(US$
)
1m2m
3m4m
5m6m
7m8m
9m10
m
Pric
e an
d si
ze o
f the
che
apes
t new
ly b
uilt
hous
e by
a p
rivat
e de
velo
per,
2018
Nige
ria40
.7m
Ghan
a7.
4mCo
ted'
Ivoi
re4.
5m
Nige
r3.
5m
Mal
i3.
1m
Burk
ina
Faso
3.0m
Togo
1.3m
Beni
n2.
0mGu
inea
1.9m
Sene
gal
1.8m
Sierra Leone1.3m
Sour
ce: C
anba
ck G
loba
l Inc
ome
Dist
ribut
ion
Data
base
(C-G
IDD)
.ht
tps:
//ww
w.c
gidd
.com
/
0 50 100
150
200
Dealing with construction permitsGh
ana
(120
)
Cabo
Ver
de (1
27)
Côte
d'Iv
oire
(139
)
Sene
gal (
140)
Mal
i (14
3)
Nige
r (14
4)
Nige
ria (1
45)
Gam
bia
(146
)
Burk
ina
Faso
(148
)
Mau
ritan
ia (1
50)
Beni
n (1
51)
Guin
ea (1
53)
Togo
(156
)
Sier
ra L
eone
(160
)
Libe
ria (1
72)
Guin
ea-B
issa
u (1
76)
The
Doin
g Bu
sine
ss in
dica
tors
pro
vide
com
preh
ensi
vean
d co
mpa
rativ
e gl
obal
dat
a tra
ckin
g bu
sine
ssre
gula
tion
envi
ronm
ents
ove
r tim
e. A
hig
h ea
se o
fdo
ing
busi
ness
rank
ing
mea
ns th
at th
e re
gula
tory
envi
ronm
ent i
n th
at e
cono
my
is m
ore
cond
uciv
e to
the
star
ting
and
oper
atio
n of
a lo
cal fi
rm.
The
indi
cato
rs fo
r dea
ling
with
con
stru
ctio
n pe
rmits
and
regi
ster
ing
a pr
oper
ty b
oth
rela
te to
com
mer
cial
prop
erty
. How
ever
, no
sim
ilar i
ndic
ator
s fo
r res
iden
tial
prop
erty
cur
rent
ly e
xist
.
Libe
ria0.
9m
Mau
ritan
ia0.
8m
Guinea-Bissau Gambia
Mau
ritan
iaUS
$1 3
70M
ali
US$8
24Ni
ger
US$3
78
Nige
riaUS
$2 4
12
Burk
ina
Faso
US$6
70
Sene
gal
US$1
033
Cote
d'Iv
oire
US$1
662
Cabo
Ver
deUS
$3 2
09
Gam
bia
US$4
83
Guin
ea-B
issa
uUS
$723
Sier
ra L
eone
US$4
99Be
nin
US$8
30To
goUS
$617
Guin
eaUS
$824
Libe
riaUS
$456
Ghan
aUS
$1 6
41
Sour
ce: W
orld
Ban
k on
line
data
base
. ht
tps:
//dat
a.w
orld
bank
.org
Mor
tgag
e le
ndin
g, 2
018
Num
ber o
f hou
seho
lds,
2018
Sour
ce: C
AHF
2018
des
ktop
sur
veys
and
cou
ntry
exp
erts
.
Regi
ster
ing
a co
mm
erci
al p
rope
rty
Sour
ces:
Mor
tgag
e te
rms,
hou
se p
rices
& s
izes
from
CAH
F 20
18 s
urve
ys. H
ouse
hold
& in
com
e da
ta d
raw
n fro
m C
-GID
D (C
anba
ck G
loba
l Inc
ome
Dist
ribut
ion
Data
base
).
Sour
ce: W
orld
Ban
k Do
ing
Busi
ness
Indi
cato
rs -
http
://w
ww
.doi
ngbu
sine
ss.o
rg/
200
180
160
140
120
100
8060
4020
0
XOF 8 900 000US$15 495
XOF 5 500 000US$9 565
CVE 2 912 634US$30 900
XOF 12 500 000US$21 739
GMD 947 743US$20 991
GHS 100 000US$22 624
GNF 180 000 000US$20 000
XOF 985 153 921US$74 217
LRD 1 200 000US$15 000
XOF 13 577 850US$23 639
MRO 10 371 229US$29 172
XOF 7 500 000US$13 047NGN 5 000 097US$16 351
XOF 10 000 000US$17 392
SLL 150 000 000US$18 000XOF 7 000 000US$12 146

Africa Housing Finance Yearbook 2018
57
The West African Economic and Monetary Union WAEMU (UEMOA)priority with each member state driving an ambitious housing programme. Thecurrent economic dynamism of the union is an asset for modernising theconstruction and housing sectors of the economy. Reforms in the financial sectorand business environment also serve to promote mortgage activities and developthe property market.
According to the Central Bank of the Union, (Banque Centrale Des Etats del’Afrique de l’Ouest, or BCEAO), the economic drive initiated since 2012 withinthe WAEMU has been maintained in 2017, thanks to the gradual improvement ofthe international and internal economic environment of the member states. Atthe international level, the union has benefited from the revival of activities inNigeria, the main trading partner of some of these states.4 The steady pace ofgrowth in the union is due to public and private infrastructure investment,productivity in the construction and building sectors, booming agriculture, a betterbusiness climate, and improvement in the broader socio-political climate. RealGDP growth was 6.7 percent in 2017.5
Economic growth is expected to continue because of good agricultural harvests,execution of some regional and national socioeconomic infrastructure, andimprovement in the political stability of some of the member countries, particularlythose countries with forthcoming elections. Insecurity in the northern part ofMali, northeast of Niger, and terrorist attacks in Cote d’Ivoire and Burkina Fasoare of great concern, however. The union has minimized the average annualinflation rate to 0.8 percent in 2017.6
Access to financeBanque Centrale des Etats de l’Afrique de l’Ouest (BCEAO) is a unique centralbank for the eight countries and governs the financial institutions across the union.The BCEAO headquarters are in Dakar, Senegal, and each country hosts a nationalagency. The formal financial system of the union is developing, and the bankingnetwork is growing. Three new banks and three financial institutions were addedto the network in 2017, making a total of 126 banks and 18 financial institutionsoperating in the union by the end of 2017.7 The three new banks were establishedrespectively in Burkina Faso, Cote d’Ivoire and Senegal. Most of the bankingactivities are concentrated in three to six commercial banks in the majority of thecountries. Although the banking rate in the union remains one of the lowest inthe world, access to banking services in the last decade has significantly increasedand the number of banks and micro-finance institutions has grown. According toBCEAO, at the end of June 2017, there were 623 microfinance institutions in theUnion, with 4 853 branches, CFA 1 216.1 billion (US$2.1 billion) deposits, 13.6 milliondepositors and CFA 1 142.2 billion (US$1.98 billion) worth of loans.8
BCEAO continues its efforts in promoting financial inclusion and diversifyingfinancial instruments by promoting new products among which are leasing,participative finance (SUKUK) and modernising the banking information system(digital banking).
The housing finance market in UEMOA countries is under-developed. Few long-term mortgage vehicles exist; those that do belong to government. Only a fewof the member countries have mortgage banks. These include: Banque de l’Habitatdu Bénin, created in 2003 with operations starting in 2004; Banque de l’Habitatdu Burkina Faso, created in 2005; Banque de l’Habitat de Côte d’Ivoire, created in1994; Banque de l’Habitat du Mali created in 1996; Banque de l’Habitat du Nigercreated in 2010 and not yet operating; and Banque de l’Habitat du Senegal (BHS)created in 1979. BHS is the most active of the mortgage banks of the union andrepresents 50 percent of the demand for mortgages authorised in 2014 and 30percent of the disbursed loans (CFA 60.4 billion; US$105 million).9 (More recentdata is not available.) The bank continues to maintain its leadership position in theunion by diversifying its sources of financing and innovating its products. InOctober 2017 BHS and ECOWAS Bank for Investment and Development signeda CFA 7 billion (US$12.2 million) credit for boosting housing production in Senegal.
The average interest rate in the union in 2013 was 7.44 percent; Senegal had thelowest rate at 6.81 percent.10 The average interest rate in the union is 7.53percent since December 2017.11
OverviewThe West African Economic and Monetary Union (Union Economique etMonétaire Ouest Africaine, UEMOA) is a regional organisation of eight WestAfrican countries, namely Benin, Burkina Faso, Cote d’Ivoire, Guinea Bissau, Mali,Niger, Senegal and Togo. They share the same currency, the West African franc(CFA Franc), monetary policies, and French as an official language, with Portuguesefor Guinea Bissau. The objective of the union is to promote regional economicintegration and create a common market. Benin, Cote d’Ivoire, Guinea Bissau,Senegal and Togo are on the coast of West Africa whereas Burkina Faso, Mali andNiger are landlocked countries. The climate ranges from warm and humid on thesouthern coast to dry and hot in the semi-arid countries.
The economy is predominantly agricultural. Cocoa, coffee, timber, cotton, onions,sesame seeds, peanuts, gum arabic and cashew nuts are among the cash cropsproduced and exported by the union. All member states have somemanufacturing activities, especially in the agro-industries, but in an embryonic stage.Currently, each member state has a development programme to promoteindustrialisation to modernise the existing agro-industries and develop logisticsinfrastructure to facilitate access to the rural zones where most of the agriculturalactivities are concentrated. Cote d’Ivoire, which represents the largest economyof the union, has some agro-industries. Niger, Mali, and Burkina Faso have miningindustries, with uranium, gold and petroleum in Niger ; gold in Mali and BurkinaFaso; phosphate in Togo and Senegal; and iron in Benin. Animal rearing is still inthe traditional mode, but it promises to be a significant economic activity ifmodernised. This includes milk and dairy produce, meat production for localconsumption and export, tannery and hides, and skin industries. Other activitiesare artisanal mining of minerals used in construction - artisanal fishing and artisanalfood transformation and cosmetics. These activities represent a massive potentialto be developed and industrialised.
Prior to 2010, on average, the populations of the coastal countries mostly lived inthe urban areas, compared to the landlocked countries where the population isprimarily rural. Both population growth and urbanisation within each country isaccelerating at one of the fastest rates in the world. The average urban populationof the union has practically doubled, from 19.8 percent of the total population in1975 to 39.2 percent in 2016.1 In some of the urban centres, particularly inAbidjan, the capital of Cote d’Ivoire, the annual urbanisation rate is 4.6 percent.The fastest growing urban areas include Abidjan, Dakar, Lomé, Cotonou, Bamako,Niamey, Bissau and Ouagadougou. Approximately 110 million people currentlylive in the union; over the next 20 years another 100 million will be born.2 Mostof them will reside in urban areas.3
As a result of decentralisation and democratisation, cities are emerging from ruraltowns, and capital cities are undergoing modernisation, with a number of infra-structure projects underway in practically all the member states of the union.Other projects include industrialization and transportation; housing remains a

58
A study by BCEAO in 2014 demonstrated that housing loans as of percentage oftotal loans disbursed between 2005 and 2012 was very low (less than2 percent).12 Analysing the union data between 2013 and 2017, housing loans asof percentage of total loans disbursed still remain low.13 To promote mortgageactivities and access to mortgages, a regional mortgage institution, Caisse Regionalde Refinancement Hypothecaire-UEMOA (CRRH-UEMOA), was created in 2010by the BCEAO, Banque Ouest Africaine de Dévelopment (BOAD) and ConseilRégional de l’épargne Publique et des Marches Financiers. The mission of theinstitution is to promote easy access to long-term financing to its membercommercial banks to enable them to finance housing loans. The total capital ofCRRH-UEMOA as of 31 December 2017 is CFA 8 993 970 000 (US$15 641 687),41.73 percent of which belongs to financial institutions and 64.9 percent tocommercial banks, 17.16 percent to BOAD, the majority shareholder, and 13.90percent to International Finance Corporation, the second major shareholder. TheCRRH headquarters are in Lomé, Togo. The regional institution’s goal is topromote mortgage development urgently needed in the UEMOA countries. InFebruary 2017 CRRH signed an agreement of CFA 1.25 billion (US$2.175 million)with the International Finance Corporation, IFC and BOAD, making the IFC thesecond largest institutional shareholder in CRRH-UEMOA.
CRRH-UEMOA, as expected, is reinforcing the capacity of commercial banks,unleashing construction activities, fostering housing development, generatinginvestments, employment opportunities and raising incomes, as currently illustratedby the increase in the number of members’ banks (shareholders), now 54, and itssuccess in bringing in IFC as a shareholder in 2017. It is expected that CRRH-UEMOA’s success in mobilising funds will accelerate the development of mortgageactivities in the union.
Among the institution’s 2017 activities was a workshop entitled “Financing ofAffordable Housing in UEMOA” (Etudes Sur le Financement Du LogementAbordable dans l’UEMOA) held in February 2017. The workshop formulatedrecommendations relevant to boosting production of decent and affordablehouses, producing relevant information for the development of effective policies,and improving urban and land management. Among the recommendations toboost supply are the creation of liquidity funds for affordable housing and capacity-building of construction professionals.
Furthermore, at country level, the governments of all the member states continueto promote housing finance through different mechanisms, among which are theestablishment of mortgage banks, housing development agencies, and fiscalincentives for private companies and developers. Some commercial banks andmembers of CRRH-UEMOA are now promoting housing loans to individuals.
AffordabilityDespite the union’s economic growth, affordability is still a challenge and dependson each country’s economic environment. The population of the union is estimatedat 110 million; approximately 43 million live below the extreme poverty line andhave little or no capacity to finance their homes.14 To tackle these affordabilitychallenges, some initiatives are being implemented, including plans to secure fundsat competitive prices in the financial markets. The creation of CRRH-UEMOA hasfacilitated access to financing for its members to improve banking conditions formortgage loans. Although average interest rates dropped from 9.78 percent in2005 to 7.44 percent in 201315 and 8.04 percent in 2017,16 these are still relativelyhigh compared to other countries. In October 2017, CRRH-UEMOA, BOAD andthe World Bank signed a project of US$155 million to support the developmentof affordable housing finance in the union. According to the World Bank, the
project will solve the problem of the chronic shortage of housing across the unionby expanding access to long-term housing finance for households with modestand irregular incomes.
Approximately 800 000 housing units are needed every year to take care of thechronic shortage.17 Yet UEMOA banks only issued approximately 15 000 newmortgages per year – an insignificant fraction of the estimated needs. The projectwill facilitate 50 000 new mortgages and leverage greater amounts of investmentfrom the private sector.18
To boost affordability, each member state has a series of housing projects andprovides fiscal incentives to foreign and local investors. These incentives areintended to promote local small and medium enterprises, and include mutual fundsfor housing in Senegal, the allocation of free land, fiscal incentives and propertyregistration reforms in all the member states of the union. Other measures includethe promotion of industrialisation of local resources, leading to new cementfactories being established, and old factories upgraded, in Senegal, Benin and Coted’Ivoire.
These efforts have had some impact on the price of cement, which has been onthe rise since early 2018.19 A 50kg bag of cement at CFA4 500 (US$7.83) fiveyears ago cost on average CFA3 450 (US$6.00) in 2018 and suddenly went up toCFA4 000 in July 2018 in Benin. Prices went down in Senegal to CFA2 900(US$5.04) and is now going up to CFA3 250 (US$ 5.65). Prices in other countriesare on the rise: Cote d’Ivoire and Mali CFA4 500 (US$7.85); and Burkina Faso andNiger CFA5 000 (US$8.70); and Togo CFA4 000 (US$6.96). Prices differ fromone country to another and sometimes within the country depending on thegeographical location.
In addition to individual state measures, the union has adopted common measures,including reinforcement of the capacity of mortgage banks, the promotion ofsavings for housing, and mortgage guarantees. Nevertheless, there is a need tosupport the private sector to develop the construction industry and make housingfinance affordable for the majority of the population in the UEMOA countries.
Housing supplyRates of housing supply differ from one country to the other but overall this isstill dominated by incremental, self-construction and informal entrepreneurship.Most of the supply is produced by informal entrepreneurs. Some of the upper-middle class can use government housing development agency services and tosome extent, private developers. On the whole, the upper and middle class livein residential zones, while the poor live in slums. Little data on the stock of housesin the union is available.
In every UEMOA country, the housing supply is insufficient to meet demand. Ashas been noted, high population growth rates of the eight countries mean thepopulation will more than double over the next 20 years, with most of thenewcomers adding to the urban population.20 The housing deficit in the union isestimated at 3.5 million units.21 To face this challenge, some of the presidentshave established ambitious housing programmes as part of their presidentialcampaigns. Alhassan Ouattara of Cote d’Ivoire announced a programme of 50 000houses for five years at a rate of 10 000 houses a year ; the number has changedover time, increasing to 60 000 in 2012, and to 150 000 to be delivered by 2020.Issoufou Mahamadou of Niger has promised more than 40 000 houses all overNiger. Other promised housing numbers are for Mali 50 000, Guinea Bissau 1 000,and Benin 10 000.
Despite considerable efforts, the programmes are not yet fully implemented. InCote d’Ivoire, a total of 46 developers, 42 domestic and four foreign, have signedup to build projects under the programme, with a combined 72 social housingprojects in progress as of January 2016. Among the developers were SociétéIvoirienne de Construction et de Gestion Immobilière. They teamed up withpartners from Benin, China, South Africa, and the Netherlands to build 20 000units around Abidjan. Two Moroccan construction groups – Addoha and Alliances– were reportedly between them building 19 000 affordable homes in and aroundAbidjan, with the first units planned to be completed in July 2015. However inspite of the various projects, construction has been proceeding at a slower pacethan expected, with less than 10% of the target completed as of the end of 2015.22
Total UEMOA loans and home loans 2013-2017 (CFA and US$ billions)
2013 2014 2015 2016 2017Total loans
CFA billions 9 210.00 10 708.90 11 976.40 12 376.80 12 376.80
US$ billions 16.03 18.63 20.84 21.54 22.43
Housing loans
CFA billions 203.70 181.20 136.50 261.70 288.0
US$ billions 0.35 0.32 0.24 0.46 0.50
Home loans as share of total loans
2.18% 1.72% 1.15% 2.14% 2.22%
Source: BCEAO (July 2018). Rapport sur les conditions de banque dans l’UEMOA, En 2017. Tables 2-9.

Africa Housing Finance Yearbook 2018
59
In addition to presidential programmes, all member states have ambitious housingprogrammes and innovative solutions for the deficit, such as the creation of newurban zones in Senegal and Burkina Faso, and the construction of 20 000 rent-to-own houses (lodgement location-vente) in Benin and 1 000 houses in GuineaBissau. As of 2015, most commercial banks of the union have been offeringhousing loans and private developers are offering various housing schemes.23 Thisis attributed to the union’s economic growth, and the support of CRRH-UEMOA.Nevertheless, the gap between the supply and the demand persists.
Union member governments are focusing their efforts on improving the businessenvironment and sourcing foreign investment to develop urban infrastructure andhousing. To this end, the UEMOA is initiating a series of investment forums tosource diversified investors. The result is illustrated through the different housingprogrammes under construction in the entire union and the progressaccomplished by some of the states as measured in the 2018 World Bank DoingBusiness Report. For example, Benin ranks 46 out of 190 countries in dealingwith construction permits: 13 procedures and 88 days for obtaining a constructionpermit, compared to the sub-Saharan average of 147.5 days. It is expected thatthe result of the efforts and the success of CRRH-UEMOA will favour thedevelopment of mortgage activities and boost housing supply across the union.
Policy and regulationThere have been reforms in land administration, but the registration of propertiesto obtain full ownership rights – Titre Foncier – remains a challenge in all UEMOAcountries. In 2016, the CRRH-UEMOA proposed to undertake a regional studyof the different regulations concerning full ownership rights in all its membercountries with the aim of proposing a unique framework to be recognised andaccepted by all the member states. There is no further information regarding thestudy to date.
One of the recommendations to CRRH-UEMOA during the February 2017workshop on affordable housing finance within UEMOA was to promote a landand real estate observatory to the UEMOA Commission to provide necessaryinformation for the development of effective policies and improvement of urbanand land management. To date the observatory has not been established. Otherrecommendations concern: investment in slum upgrading and basic infrastructurefor the poor; promoting accessibility to housing finance by reducing the cost ofconstruction; increasing the maturity term of housing loans; and a lower interestrate. Creation of an Affordable Liquidity Fund within the CRRH-UEMOA that willinitiate and support growth of affordable housing finance in the union wasproposed.24
The 2018 World Bank Doing Business Report indicates that some of the reformsimplemented by some member countries are yielding results.25 For example,Cote d’Ivoire and Burkina Faso obtained good scores in dealing with constructionpermits among the member countries of the Union, however some difficultiespersist, one of which is the high cost of construction. The recommendation is toimprove regulations on urban planning and construction and access to land.26 Thiswill have a great impact on the procedures and delays associated with obtaininga construction permit.
Additional updated information is difficult to obtain. However, CRRH-UEMOAhas been busy mobilising funds and hopefully in the future it will provide necessaryinformation for the development of effective policies.
Property market and opportunitiesUEMOA countries are witnessing social and economic changes, primarily due tothe economic boom, political and economic reforms, and the development ofinfrastructure such as roads, highways and secondary roads and telecom-munications, and increased investment. This has facilitated improved access torural areas, resulting in high demand for land and properties. Decentralisation andthe high demand for land and roads are accelerating the urbanisation of villagesaround the capitals and other internal cities. Incentives are also stimulating localand foreign investors to participate in the development of housing and other urbaninfrastructure.
Each member state has housing on the priority list of its agenda and thegovernment is promoting public private partnerships for housing developmentand fiscal incentives for businesses. Investment interests from foreign countriesboth in and outside Africa are present in all the member states of the union.Dangote Group has plans to produce cement in Niger,27 and the Adoha Group,a Moroccan group in housing development, is now present in Cote d’Ivoire andSenegal.28
In summary, UEMOA’s property market is promising. The market is practicallyuntapped and there is demand for all sectors of the market, industrial, hospitality,commercial, offices, and residential, fuelled by the rate of urbanisation. The union’srapid urbanisation is aggravating housing deficits, thus increasing interest in theresidential market, especially housing for lower income groups. The yield oninvestment according to Knight Frank is in the range of 7-9 percent, one of thehighest in the world. Various development programmes, such as urbaninfrastructure, electrification of new cities and rural areas, and housing as well asthe rate of urbanisation and the population growth rate (both high), are indicatorsof opportunities for the housing finance and housing development sectors,especially in the low income bracket.
Additional sourcesAfrican Development Bank Group. African Economic Outlook: 2018.https://www.afdb.org/en/knowledge/publications/african-economic-outlook/(Accessed 26 Sept 2018).
BCEAO (2018). Rapport sur les conditions de banque dans l’UEMOA - 2017.14 August 2018. https://www.bceao.int/fr/publications/rapport-sur-les-condition-de-banque-dans-luemoa-2017 (Accessed 11 Sept 2018).
International Monetary Fund (April 2017). IMF Country Report N°.17/99 WestAfrican Economic and Monetary Union. http://www.imf.org/en/Publications/CR/Issues/2917/04/26/West-African-Economic-and-Monetary-Union-Common-Policies-of-Member-Countries-Press-elease-44867 (Accessed 7 September 2018).
Websiteswww.afdb.org www.africaneconomicoutlook.orgwww.bhci.ci www.bhs.snhttp://crrhuemoa.org/ www.uemoa.int
1 Updated data for 2017 and 2018 is not available.2 The World Bank Group. “Press Release: World Bank Group Supports Access to Affordable Housing Finance in
West Africa.” 13 October 2017. https://www.worldbank.org/en/news/press-release/2017/10/13/world-bank-group-supports-access-to-affordable-housing-finance-in-west-africa (Accessed 15 August 2018).
3 Banque Centrale Des Etats de l’Afrique de l’Ouest (BCEAO)(2014). Notes d’Analyse sur les Conditions deFinancement Bancaire de l’Habitat dans les pays de l’UEMOA. https://www.bceao.int/fr/publications/note-danalyse-sur-les-conditions-de-financement-bancaire-de-lhabitat-dans-les-pays-de (Accessed 11 Sept 2018).
4 BCEAO (2017). Rapport Annuel de la BCEAO 2017. https://www.bceao.int/sites/default/files/2018-07/Rapport_annuel_2017.pdf (Accessed 11 Sept 2018). Pg. 15.
5 Ibid.6 BCEAO (2017). Rapport Annuel de la BCEAO 2017.7 BCEAO (July 2018). Rapport sur les conditions de banque dans l’UEMOA, En 2017. https://www.bceao.int/fr/
publications/rapport-sur-les-conditions-de-banque-dans-luemoa-2017 (Accessed 7 Sept 2018).8 BCEAO (2017). Rapport Annuel de la BCEAO 2017. Pg. 30. 9 BCEAO (2014). Note d’Analyse sur les conditions de Financement Bancaire de l’Habitat dans les pays de
l’UEMOA. Pg. 5.10 BCEAO (2014). Note d’Analyse sur les Conditions de Financement Bancaires de l’Habitat dans l’UEMOA. Pg. 16. 11 BCEAO (2018). Rapport sur les conditions de banques dans l’UEMOA. Tables 1.2.2.12 BCEAO (2014). Note d’Analyse sur les Conditions de Financement Bancaires de l’Habitat dans l’UEMOA. Pg. 5. 13 BCEAO (2018). Rapport sur les conditions de banques dans l’UEMOA. 14 The World Bank Group. “Press Release: World Bank Group Supports Access to Affordable Housing Finance in
West Africa.” 13 October 2017.15 BCEAO (2014). Notes d’Analyse sur les Conditions de Financement Bancaire de l’Habitat dans les pays de
l’UEMOA.
16 BCEAO (2018). Rapport sur les conditions de banques dans l’UEMOA. Pg. 13.17 The World Bank Group. “Press Release: World Bank Group Supports Access to Affordable Housing Finance in
West Africa.” 13 October 2017.18 Ibid.19 Senenews (2018). “Hausse du prix de la tonne de ciment : Les industries de cimenteries ajoutent 5.000f à la
tonne.” 30 May 2018. https://www.senenews.com/actualites/hausse-du-prix-de-la-tonne-de-ciment-les-industries-de-cimenteries-ajoutent-5-000f-a-la-tonne_234759.html (Accessed 11 Sept 2018).
20 The World Bank Group. “Press Release: World Bank Group Supports Access to Affordable Housing Finance inWest Africa.” 13 October 2017.
21 Olivia Caldwell. Affordable Housing Institute (2 March 2017). Etats des Lieux Logement Abordable dansl’UEMOA. http://crrhuemoa.org/wp-content/uploads/2017/03/Etats-des-Lieux-Logement-abordable-dans-1%E2%80%99UEMOA_OLIVIA-CALDWEL.pdf (Accessed 15 August 2018).
22 Oxford Business Group (2016). “La Côte d’Ivoire s’attaque au déficit de logements.” 29 June 2016.https://oxfordbusinessgroup.com/news/la-cote-divoire-sattaque-au-deficit(de-logements (Accessed 2 August 2018).
23 Institutional advertisements in local media. 24 Olivia Caldwell, Affordable Housing Institute (2 March 2017). Etats des Lieux Logement Abordable dans
l’UEMOA.25 Burkina Faso improved its score in dealing with construction, ranking 53rd out of 190 countries. 26 Simon Walley. (The World Bank-IFC) Financement du Logement Abordable Dans l-UEMOA Atelier Lomé 28
février 2017. 27 Jeune Afrique. “Dangote veut construire une cimenterie au Niger.” 17 Oct 2013.
http://www.jeuneafrique.com/15570/economie/dangote-veut-construire-une-cimenterie-au-niger/ (Accessed7 September 2018).
28 Ciments de l’Afrique. http://www.cimaf-ci.com/qui-sommes-nous/ (Accessed 7 Sept 2018).

60

Africa Housing Finance Yearbook 2018
6161
Algeria
OverviewWith a population of 42 million living on 2 381 000 km2, the People’s DemocraticRepublic of Algeria is the largest country in Africa. In 2018, the urban populationis estimated at 71.8 percent while the population growth rate stands at 1.67percent, a slight decrease from 1.84 percent and 1.75 percent in 2016 and 2017respectively.1
The country has experienced fluctuating economic growth rates over the pastdecade. The average annual GP growth rate from 2007 to 2017 was 3 percent.2
The peak was achieved in 2014 at 3.8 percent. This was followed by a sharpdecrease in economic growth to 2.1 percent in 2017. The World Bank forecastsimproved growth prospects for Algeria in 2018 as the government implementsnew public investments.3 However, despite this improvement, economic growthis expected to fall short of the 2 percent threshold for 2019/2020. This is due tothe limited impact of oil prices on the real sector with price fluctuations in oilprices mostly impacting on public and external accounts.4 Despite this outlook,the 2017 Finance Law banks on a 3.9 percent growth rate with increased taxationto compensate for the shortfall in oil and gas revenues.5
GNI per capita has risen steadily since 2000, reaching a peak of DZD604 097(US$5 520) in 2013. However, this fell to DZD532 962 (US$4 870) in 2015, anddropped further to DZD465 211 (US$3 960) in 2017 due to low oil prices.6
Inflation decreased to 5.5 percent in 2017 from an annual average of 6.4 percentin 2016.
With a two thirds share of public revenues and 95 percent of export earnings,the petroleum industry plays a pivotal role in Algeria’s economy. Global oil priceshave increased in 2017, improving the country’s fiscal and external balances. Priorto 2017, government’s current account deficit had grown from 4.3 percent of GDPin 2014 to 16.4 percent of GDP in 2016.7 However the current account deficitdecreased to an estimated 9.8 percent of GDP in 2017. The 2018 projectionsare showing an expected deficit of 5.6 percent of GDP.8 The government’s budgetis expected to improve as a result of fiscal consolidation although there aregrowing seigniorage concerns. Algeria’s fiscal deficit doubled from 7 percent ofGDP in 2015 to 15 percent of GDP in 2016. Tight control of overspending willhopefully see the fiscal deficit decline to less than a projected 5 percent in 2017and under 1 percent by 2019. Despite these positive developments, governmentreserves continue to decrease: to DZD10 572 billion (US$90 billion) in May 2018,and expected to drop to DZD9 985 billion (US$85 billion) by the end of 2018.9
Overall, government’s fiscal consolidation comes with significant trade-offs in theeconomy. In the real sector, government has reduced its spending on equipmentby approximately 28 percent, while some capital projects which were approvedin the 2014-2019 budget have now been halted. This reduces the government’scapacity to deliver on its large-scale social housing programmes. Theseprogrammes remain an urgent priority as housing is a significant social andeconomic issue for many Algerians. According to the real estate portal Lkeria.com,the average price to rent an apartment between 60-100m2 in Algiers isDZD60 000 (US$548) per month, more than three times the National MinimumWage Guaranteed (Salaire National Minimum Garantie, SNMG) which is onlyDZD18 000 (US$164) per month.
Access to financeSix state-owned banks dominate the banking system in Algeria: Banque Exterieured’Algerie (BEA); Banque Nationale d’Algerie (BNA); Banque de l’Agriculture etdu Developpement Rural (BADR); CNEP Bank; BDL Bank; and CPA Bank - whichcontrols almost 90 percent of banking assets and 80 percent of all loans and
KEY FIGURES
Main urban centresAlgiersOran
Exchange rate: 1 US$ = [a] 24 Aug 2018PPP Exchange rate (Local currency/PPP$) 1 Algerian dinar = [b]Inflation 2016 [c] | Inflation 2017 [c] | Inflation 2018 [c]
119.35 Algerian dinar30.006.4 | 5.59 | 7.4
Population [d] | Urban population size [e]Population growth rate [e] | Urbanisation rate [f]Percentage of the total population below National Poverty Line [f]Unemployment rate 2006 [f]
42 091 478 | 30 852 3361.67% | 2.26%23.0%11.7%
GDP (Current US$) 2017 [b] | GDP growth rate annual 2017 [b]GDP per capita (Current US$) 2017 [b]GNI per capita (Current US$) 2017 [b]Gini co-efficient [g]HDI global ranking 2015 [h] | HDI country index score 2015 [h]
US$170 371 million | 1.70%US$4 123US$3 96027.6083 | 0.418
Is there a deeds registry? Number of residential properties that have a title deed Lending interest rate [i]Mortgage interest rate [j] | Mortgage term (years) [j]Downpayment [k]Mortgage book as a percentage of the GDPEstimated number of mortgages Price to Rent Ratio in City Centre [i] | Outside City Centre [i]Gross Rental Yield in City Centre [i] | Outside City Centre [i]Construction as a % of GDP 2017 [l]
Yesn/a8.00%5.75% | 2020%n/an/a36.04 | 33.872.77% | 2.05%3.00%
What is the cost of standard 50kg bag of cement? [m]What is the price of the cheapest, newly built house by a formaldeveloper or contractor? (Local currency) [m]What is the price of the cheapest, newly built house by a formaldeveloper or contractor? (US$) [m]What is the size of this house (m2)? [m]What is the average rental price for this unit (US$)? [m]What is the minimum stand or plot size for residential property?
US$7.16
3 031 490 Algerian dinar
US$25 40080m2
US$27080m2
Ease of Doing Business Rank [n]Number of procedures to register property [n]Time to register property (days) [n]Cost to register property (as % of property value) [n]
1661055 days15.90%
NB: Figures are for 2018 unless stated otherwise.
[a] Xe.com[b] World Bank World Development Indicators[c] IMF World Economic Outlook Database[d] Worldpopulationreview.com[e] Worldometers[f] Indexmundi[g] Knoema.com[h] UNDP Development Indicators[i] CEICdata.com[j] Numbeo[k] Arab Bank Algeria[l] Trading Economics[m] CAHF Yearbook 2017[n] World Bank Doing Business
62
continues to play a key role in the financing of government-prioritised projects.The government banks are interconnected with five major finance companies:Algerian Bank of Development (BAD); SOFINANCE (created in affiliation withBAD); FINALEP; SRH; and SALEM.10 The central bank, Bank of Algeria, alsooversees 14 privately-owned banks, nine non-bank financial institutions and 23insurance companies.
Overall, the banking sector has consistently increased lending although there areconcerns that fiscal consolidation may reduce banks cashflows thus reducing theirintermediation capacity in the future. Domestic credit to the private sector hasincreased rapidly over the past years, rising from 44.5 percent of GDP in 2015 to66.8 percent of GDP in 2017. Outstanding bank loans reached DZD8 000 billion(US$73 billion) in 201711 (45 percent of GDP). Housing finance is still anunderdeveloped sector, despite the liquidity of the banking sector. However, accessto finance is increasing due to government programmes that offer subsidisedmortgages, the Rural Housing Programme and the Assisted Housing Programme(LPA). Households who build or improve their house in a rural area can benefitfrom a subsidised interest rate on their mortgage through the Rural HousingProgramme. The LPA programme also facilitates home ownership with a subsidisedloan for households who acquire a new housing unit in a multi-family complex.Euromonitor reported a 16.3 percent expansion in the number of householdsaccessing a mortgage in 2017.12 Nevertheless, access to credit is difficult due tothe lack of credit bureaus and registries. Commercial real estate finance in Algeriarepresents a larger share of total bank lending than retail housing finance.
State-owned banks make up nearly all mortgage loans, more than 60 percent ofwhich are attributable to the Caisse National d’Épargne de Prévoyance (CNEP).Housing finance products are offered at a rate of 8 percent and for terms rangingfrom 20 – 40 years. The maximum loan-to-value ratio for non-governmentprogrammes is capped at 70 percent of the total unit cost. The government offersup-front downpayment assistance for households qualifying for social housingprogrammes, amounting to a maximum of 20 percent of the value of the unit.
The level of non-performing loans (NPLs) has been very high in the past, althoughit has decreased from 21 percent in 2009 to 11.4 percent in 2016. This figure isstill higher than the 9.8 percent NPLs achieved in 2015. Until now, rather thanrepossessing homes, most NPLs have usually been restructured, either throughswaps for T-bonds (in public sector banks) or rescheduling repayment schedules,the costs of which have been absorbed by the state. FINALEP and SALEM, arealso dealing with refinancing on homes, leasing equipment to developing businesses,or re-establishing loans to start-up businesses.13
A mortgage refinancing facility was created in 1997, known as Société deRefinancement Hypothecaire (SRH), whose goal was to improve bankingintermediation for housing finance and promote the use of secondary financialmarkets to facilitate access to long-term finance for mortgage loans. SRH wasinitially capitalised with a fund of DZD5.7 billion (US$52.3 million) held at thetreasury, and DZD1.4 billion (US$12.5 million) of its own funds. The SRH facilitywas complemented by the Law n° 06-05 on the securitisation of mortgages thatcame into force in 2006. The objective of the legislation was to free up capital tosupport banks to fund housing construction, yet the expansion of secondarymortgage markets has been limited by the lack of development of primarymortgage markets and historically high rates of NPLs. In 2016, SRH announcedthat it was exploring a bond issuance to diversify its financial resources and reducereliance on the Treasury for funding.
The main institution providing microfinance services is Algérie Poste, which wasset up as a government corporation in 2002 to provide both postal and financialservices. There are no specialised housing microfinance products, but Algérie Posteoffers two types of savings accounts for housing, the livret d’épargne logement (LEL)with two percent interest, and the livret d’épargne populaire (LEP) with 2.5 percentinterest. Algérie Poste acts as a service branch for 4.1 million CNEP accounts,Algeria's largest housing finance lender.
In addition to Algérie Poste, there are approximately 15 major non-governmentalorganisations (NGOs) working in the country with Touiza being the major NGOproviding services to small enterprises and entrepreneurs since 1962.14
AffordabilityThe World Bank forecasts that 10 percent of the total population might fall backunder the poverty threshold in 2020 due to growth of the unemployment rate(10.5 percent in September 2016, reaching 12 percent in 2018), slower GDPgrowth and higher inflation. Therefore housing affordability is a critical issue andthe cause of substantial social unrest. While the supply of housing for high incomeand expatriate buyers appears to be sufficient, there is a distinct undersupply ofaffordable housing for the bottom 60 percent of the population. It is thereforeextremely difficult for low and middle income households to access housing onthe private market.
In 2017, the average price per square meter of an apartment in Algiers wasDZD220 000 (US$2 008), a 20 percent increase compared to 2016. The priceper square meter of an apartment in secondary cities such as Boumerdès, Blida,Tipaza, Béjaïa and Oran was DZD130 000 (US$1 187).15 In 2015, the ONSreported the average annual income was DZD 39 200 (US$358). Despite the 4percent increase from 2014, the average earnings of private sector workers(DZD32 100; US$ 293) are below that of public sector employees (DZD 54 700;US$500).
While Algeria has a relatively low rate of inequality with a Gini coefficient of 36.06(2010), the price of housing remains beyond the means of most households.According to a 2017 study by the real estate portal Lkeria.com, average rents havedecreased between 2016 and 2017 in at least 10 provinces, including in: Boumerdaswhich has seen reductions by 20 percent – from DZD39 500 (US$335) in 2016to DZD32 000 (US$271); Tizi Ouzou which has seen reductions by 20 percentfrom DZD35 000 (US$297) in 2016 to DZD27 600 (US$234) in 2017; Tipazawhich has seen 16 percent reductions; Skikda 16 percent reductions; Sidi Bel Abbas8 percent reductions; and Bejaia 8 percent reductions. On the other hand, rentalprices in the bigger cities such as Algiers and Oran remained stable. The reductionin rental is mainly attributed to public housing programmes delivered during thisperiod, but is also due to various relocation operations.
Housing policy is focussed on building a large amount of very low-cost rental andsubsidised housing units, yet government supply is not able to respond to demand.Population growth at 1.9 percent per annum, and an urbanisation rate of 2.7percent per annum in 2015, are fuelling new demand for housing units in cities,with 70 percent of the total population living in cities. Waiting lists are long andthe downpayment on homes can also be prohibitive. For households to qualifyfor the middle income housing programme (Agence de l'Amélioration et duDéveloppement du Logement (AADL) lease-to-own programme), a personalcontribution of DZD700 000 – DZD1 million (US$6 390 – US$9 128) is requiredup front.16
Housing supplyEuromonitor estimates that the mortgage market will grow by approximately16 percent in 2017, making it the second fastest growing mortgage market inAfrica.17 This however does not address the shortages in the housing market.There are approximately 500 000 precarious dwellings and at least two millionunits are in poor condition, having been constructed prior to independence in1962. Annual supply is estimated at 80 000 dwellings, while annual demand isestimated at 300 000 units.
The state is the major supplier of housing, delivering 165 000 housing units peryear, and 2.2 million housing units over 14 years. However, with less means at theirdisposal, households also account as another main house provider.18 In 2014, theMinistry of Housing and Settlements (MoHS) announced a target of 1.6 millionunits from 2015 - 2019 with an estimated cost of DZD6 123 billion (US$56 billion)for social housing, part of the government’s five-year investment plan (2015-2019).By 2017, only 693 000 units of the 1.2 million units planned were actually built.Lengthy administrative processes and disputes over some project sites andmismanagement of funds contributed to the shortfall, with the number ofcompletions per annum falling below 100 000 units. Moreover, serious deficiencieshave been reported about the units under construction such as the lack of technicalinspection, delivery delays, unfulfilled commitments, and manufacturing defects.19
There have been initiatives to ‘clean up’ informal settlements with the slumeradication project Résorption de l’Habitat Précaire, a programme that includedslum upgrading, redevelopment or resettlement. Started in 1999, with a World

Africa Housing Finance Yearbook 2018
63
Bank loan of US$150 million, this programme initially identified 65 target sites,accounting for 30 390 inadequate units, housing 172 000 residents. In July 2014,this programme gained a further commitment of US$90 million from the newgovernment for the improvement of inadequate units. As a result, between June2014 and May 2016, 39 000 families were relocated to new units, with 9 000households participating in government programmes to build their new homes,and the rest being allocated public rental housing. The Algiers province securedanother 180 hectares to allocate to new affordable housing projects of all types,including lease-to-own, public rental and subsidised for-sale units.20
In September 2017, the government has reactivated the Promotional HousingHelped (LPA) programme under the scrutiny of the Minister of HousingAbdelwahid Temmar. The Promotional Housing Helped (LPA) is tailored formiddle income households. The project involves the construction of new housingby a private developer according to specific techniques; and financial terms bothfrom the client and the State.21 The building of 12 400 housing units in the capitalbegan in November 2017 under the rent-to-own housing project monitored byl’Agence d’Amélioration et de Développement du Logement (AADL). The sitesare respectively in Baba Hassen (construction of 2 400 units and 3 000 units) andin Douera (construction of 3 746 units and 3 254 units). The first project will bedelivered by Atlas, a Turkish developer, while the remainder have been allotted toCSCEC, a Chinese developer within a timeframe of 30 months.22
Property marketsLimited land availability has severely restricted the growth of the formal real estatemarket. The state is the primary owner of land and only very limited amountsare made accessible to private individuals or developers. Homeownership is high,due to the cultural importance of owning a home, yet low supply has pushed upprices beyond the affordability threshold of many households. As a result, therental market is growing.
There is a deeds registry, although the land registration system is cumbersome andunclear. Algeria has continued to maintain a low ranking of 163th in the 2018 WorldBank Doing Business report for registering property, with 10 procedures taking anaverage of 55 days, and costing 7.1 percent of the property value.23 In 2016, Algeriamade dealing with construction permits easier by eliminating the legal requirementto provide a certified copy of property title when applying for a building permit. In2017, Algeria went a step further and imposed deadlines for construction permitapplications, considerably reducing processing times. Algeria moved up 42 positionsin the construction permits ranking and is now ranked 77th out of 190. The processincludes 17 procedures and takes an estimated 130 days.
A 5 percent transfer fee is charged on the transaction of immovable property,plus a 1 percent registration fee. The government has attempted to increase thesupply of land by offering a tax rebate if the land is sold for housing. However,this measure has primarily benefitted high income groups, and is regressive in thatthe higher the purchase price, the larger the tax rebate.
Most households rely on public housing programmes. Other strategies of theurban poor include self-building on informally-squatted government land andbuying units in the informal market. Due to the enormous price gaps betweenthe private property market and affordable housing developed by the state, manyof the social housing units are quickly released into a thriving black market, wheretitle transfer is not formally registered.
Policy and regulationIn October 2017, the government stressed that housing and infrastructuredevelopment are key priorities, and the 2018 budget will see an 8 percent increasefrom 2017 in funding allocated to social transfers, including social housing. In theFinance Law of 2018, DZD384.9 billion was allocated to housing.
The government has five types of housing programmes, each targeted at differentgroups. The demand for all these programmes far exceeds the supply. Allocationprocedures have come under scrutiny for mismanagement.
Funding for these programs has been problematic in 2017. State-owned bankspromised DZD1 200 billion (US$11 billion) in 2013 to finance the government’shousing programmes26 but have only disbursed DZD150 billion (US$1.38 billion)for the completion of two housing projects: 100 000 units in 2013 and 80 000units in 2015. Additionally, between January and May 2017, foreign companieshalted construction works for LPP, social housing, the AADL, and the ruralprogramme due to DZD120 billion (US$1.1 billion) in unpaid receivables. Thisresulted in the delivery of 164 000 housing units being disrupted.27 The state-owned banks, CPA and CNEP, refused to pay the Chinese and Turkish companiesresponsible for the construction due to liquidity constraints,28 and in May 2017,the CNL had to disburse DZD134 billion (US$1.22 billion) to pay off arrears.
However, a reorganisation of the sector is underway. The government is exploringthe possibility of creating a Housing Bank (Banque de l’Habitat) with jointadministration under the CNEP and CNL.29 This new organisation would seebanks as mortgage providers, and the CNL providing construction finance throughthe Banque de l’Habitat.
OpportunitiesThe outlook for growth in the Algerian housing finance sector remains largelypositive, given the development of a stronger legal framework for mortgages anda growing number of banks who are offering varied housing finance options.Although the improved fiscal and external balances and growth prospectsappeared to have paved the way for the uninterrupted rollout of housing projects,the implementation of large scale projects is now uncertain as the governmentfailed to pay some of the project implementers on time due to budgetaryconstraints and low reserves.
There are positive developments in the housing sector which point to keyopportunities in the future. The Groupe Industriel des Ciments d’Algérie (GICA)
PPP$40 001 – PPP$10 000 000
PPP$23 001 – PPP$40 000
PPP$12 001 – PPP$23 000
PPP$8 001 – PPP$12 000
PPP$5 001 – PPP$8 000
PPP$3 601 – PPP$5 000
PPP$2 401 – PPP$3 600
PPP$1 601 – PPP$2 400
PPP$801 – PPP$1 600
<PPP$800
- - - Average annual household income needed for the cheapest newly built house by a formal developer, 2017 Average annual household income using expenditure, 2017 (PPP$)
ALGERIA
Annual income profile for rural and urban households based on consumption (PPP$)
No. of households (thousands)
PPP$31 813
PPP$27 243
Rural Urban2 000 1 500 1 000 500 0 500 1 000 1 500 2 000
Population: 42 091 478
Urbanisation rate: 2.26%
Cost of cheapestnewly built house:
3 031 490 DZDPPP$101 050
Urban householdsthat could afford thishouse with finance:
79.15%
1 PPP$: 30 Algerian dinar
Source https://www.cgidd.com/

64
group is planning to increase its annual production to 20 million tons of cementby 2019-2020 with the expansion of three factories and the creation of two newones in Sigus and Béchar.30 Furthermore, the government continues to placegreat importance on rental housing by shifting housing delivery emphasis fromthe provision of public housing towards the facilitation of privately-developedaffordable housing. The government also intends to facilitate private developmentof homeownership programmes financed through long-term mortgage loans.Public and private partnerships are expected to compensate for decreasingbudgets for the housing sector.
Additional sourcesAlgerian Government (2014). National Report on Housing for Habitat III.http://habitat3.org/wp-content/uploads/National-Report-Africa-Algeria-Final-in-English.pdf (Accessed 19 Sept 2018).
Belkalem, M., Laghouati, S., Ghorbal, Y., & Larbi, A. (2006). The 2006 GlobalSecuritisation Guide: Algeria, Morocco and Tunisia.
Bellal, T. (2009). Housing Supply in Algeria: Affordability Matters Rather ThanAvailability. Algiers: University of Setif.
Euromonitor International (2014). World Consumer Income and ExpenditurePatterns: 14th Edition.
Hassler, O. (2011). Housing and Real Estate Finance in Middle East and NorthAfrican Countries. World Bank. http://siteresources.worldbank.org/INTMNAREGTOPPOVRED/Resources/MENAFlagshipHousingFinance.pdf(Accessed 18 Sept 2018).
International Monetary Fund (2014). Algeria: Financial System StabilityAssessment, IMF Country Report No. 14/161. https://www.imf.org/external/pubs/ft/scr/2014/cr14161.pdf (Accessed 19 Sept 2018).
IMF (2016). World Economic Outlook. http://www.imf.org/en/publications/weo(Accessed 17 July 2017).
IMF (2017). Algeria, Selected Issues, IMF Country Report No. 17/142,file:///Z:/Clients/079%20CAHF/079_4%20Country%20Profiles/04_Project%20Work/Algeria/00_Old/cr17142.pdf (Accessed 20 July 2017).
Lohoues, H. and Benbahmed, T. (2017). Algeria Profile 2017, African EconomicOutlook 2017, Entrepreneurship and industrialisation.
Oxford Business Group (2014). The Report: Algeria 2014.
United Nations Human Rights Council (2012). Report of the SpecialRapporteur on Adequate Housing.
The World Bank (2017). Doing Business 2017, Equal Opportunity for All.http://www.doingbusiness.org/~/media/WBG/DoingBusiness/Documents/Annual-Reports/English/DB17-Report.pdf (Accessed 18 July 2017).
World Bank (2017). World Development Indicators.http://databank.worldbank.org/data/reports.aspx?source=2&country=DZA,(Accessed 17 July 2017).
Websiteswww.cgap.org www.cnl.gov.dzwww.lkeria.com www.mhuv.gov.dzwww.ons.dz www.srh-dz.orgwww.letempsdz.com/ www.mdipi.gov.dz/www.agenceecofin.com , www.mhuv.gov.dz www.lkeria.com www.algerieeco.comwww.euromonitor.com www.etd.fcla.edu
Target Group by income
Income Level (DZD)
Income Level(US$) Programme
Rent
alpr
ogra
mm
e
<1.5 SNMG24 < 24 000 < 220Public Rental Housing: For households earning less than 1.5 times the minimum wage, in which construction is entirely publicallyfinanced on government land and rent is extremely low, at approximately DZD1 095 – DZD2 300 (US$10–US$21) per month. Tomake the allocation more transparent, the government has created a scoring system for applicants.25
Hom
e O
wne
rshi
p pr
ogra
mm
es
(Aid
e à
l'acc
essio
n à
la pr
oprié
té) 1 – 6 SNMG 18 000 – 108 000 165 – 9850 The Rural Housing Programme: A household receives a subsidy of DZD 700 000 – DZD 1 million (US$6 390 – US$9 128)
for home improvement or new home construction, which is disbursed as progress is made.
1.5 – 6 SMIG 24 000 – 108 000 220 – 985AADL (Agence de l'Amélioration et du Développement du Logement): Introduced in 2001, AADL operates a lease-to-own programme for households with little downpayment capacity. Small up-front payments are required for entry, and then thelease is guaranteed 100 percent by the state on a zero interest basis.
1.5 – 6 SMIG 24 000 – 108 000 220 – 985LPA (Logement Promotionnel Aidé): The Assisted Housing Programme: Started in 2010, the LPA aims to facilitate homeownership for households earning up to six times the minimum wage. There is an up-front grant of either DZD 395 000 (US$3 600)or DZD 702 000 (US$6 400) to assist with downpayments and subsidised loan finance with interest rates of 1 to 3 percent.
Civil Servants NA N/A Government Employees are also offered low-cost finance, at 1 percent for a house up to approximately DZD8.1 million (US$80 000)for senior staff, and DZD5.5 million (US$50 000) for others.
1 Worldometers (2018). Population of Algeria 2018. http://www.worldometers.info/world-population/algeria-population/ (Accessed 18 Sept 2018).
2 World Bank. World Development Indicators Databank. http://databank.worldbank.org/data/reports.aspx?source=2&country=DZA (Accessed 25 July 2018).
3 World Bank (2018). Algeria’s Economic Outlook 2018. https://www.worldbank.org/en/country/algeria/publication/economic-outlook-april-2018 (Accessed 25 July 2018).
4 African Development Bank Group (2018). Algeria Economic Outlook. https://www.afdb.org/en/countries/north-africa/algeria/algeria-economic-outlook/ (Accessed 25 July 2018).
5 Bakermckenzie.com (2017). Algeria: The 2017 Finance Law | Insight | Baker McKenzie. 1 Jan 2017.http://www.bakermckenzie.com/en/insight/publications/2017/01/the-2017-finance-law/ (Accessed 2 Aug 2017).
6 World Bank. World Development Indicators Databank. 7 Oxford Business Group (2018). The Report: Algeria. https://oxfordbusinessgroup.com/algeria-2017 (Accessed
25 July 2018).8 Oxford Business Group (2018).9 Reuters (2017). “Algeria foreign reserves to stay over $100 bln this year PM.” 6 March 2017.
http://af.reuters.com/article/algeriaNews/idAFL5N1GJ42S (Accessed 20 July 2017).10 Chamberlain, Elaine (2015). Microfinance in Algeria, Tunisia and Lebanon. Thesis submitted at the University of
Central Florida, Orlando, Florida. http://etd.fcla.edu/CF/CFH0004831/Chamberlain_Elaine_L_201504_BA.pdf(Accessed 30 July 2018). Pg. 23.
11 Bank of Algeria (2017). Quarterly Statistical Bulletin, n° 37, March 2017. http://www.bank-of-algeria.dz/pdf/Bulletin_37e.pdf (Accessed 18 Sept 2018).
12 Euromonitor website, 2017. http://www.euromonitor.com/13 Chamberlain (2015). Pg 24.14 Chamberlain (2015). Pg 22. 15 EuroAlgeria (2017). "Immobilier, combien coûte un appartement en Algérie?" Euro Algérie. 11 January 2017.
http://www.euroalgerie.org/2017/01/11/immobilier-combien-coute-un-appartement-en-algerie/ (Accessed18 Sept 2018).
16 Liberté Algérie (2011). "L’habitat précaire résorbé et la crise du logement allégée d’ici 2014." 21 June 2011.http://www.liberte-algerie.com/actualite/les-effets-dannonces-des-pouvoirs-publics-93416/print/1 (Accessed8 August 2017).
17 Euromonitor (2018). Top three mortgage growth markets. https://blog.euromonitor.com/2017/03/top-3-mortgage-growth-markets-2017-egypt-algeria-nigeria.html (Accessed 25 July 2018).
18 Grim, Nordine (2017). « Construction et accès au logement: La fin de l’état providence. » 13 May 2017. AlgérieEco. https://www.algerie-eco.com/2017/05/13/construction-acces-logement-fin-de-letat-providence/ (Accessed30 July 2018).
19 Ministry of Housing and Urban Planning (2016). “Programme LSP: 11 promoteurs immobiliers sur la liste noire.”April 2016. http://www.mhuv.gov.dz/Pages/DetailActualite.aspx?a=460 (Accessed 19 Sept 2018).
20 World Bank (2018). Doing Business: Algeria. http://www.doingbusiness.org/data/exploreeconomies/algeria#getting-credit (Accessed 19 Sept 2018).
21 Lkeria (2018). “LPA Algérie le Nouveau Prix 2018." 2 April 2018. https://www.lkeria.com/Logement-Promotionnel-Aide-LPA-LSP.php (Accessed 30 July 2018).
22 Ministère de l’Habitat, de l’Urbanisme et de la Ville (2017). "Les travaux de réalisation de 12.400 logements dansla capitale ont été lancés mardi dans le cadre du programme de logements de la formule de location-ventesupervisé par l'Agence d'amélioration et de développement du logement (AADL).” 7 November 2017.http://www.mhuv.gov.dz/Pages/DetailActualite.aspx?a=498 (Accessed 30 July 2018).
23 The World Bank. (2017). Doing Business 2017: Equal Opportunity for All. http://www.doingbusiness.org/~/media/WBG/DoingBusiness/Documents/Annual-Reports/English/DB17-Report.pdf (Accessed 18 July 2017).
24 National minimum wage guaranteed (SalaireNational Minimum Garanti).25 The scoring system gives preference to families based on their income, current living situation, and familial
situation, and improves transparency. Specific issues to resolve are the verification of applicants’ eligibility. Aswaitlists are managed locally, there can be duplication of applications across regions, people may already ownproperty, or move to precarious housing in shantytowns simply to qualify for government assistance. In addition,there are challenges around fraudulent identification documents and false accommodation certificates.
26 Agence Ecofin (2013). “Algérie : les banques publiques vont financer la construction de 300 000 logements pour12 milliards €." 14 May 2013. http://www.agenceecofin.com/investissement/1405-10882-algerie-les-banques-publiques-vont-financer-la-construction-de-300-000-logements-pour-12-milliards (Accessed 19 July 2017).
27 Ministry of Housing and Urban Planning Press Release, May 2017.28 Le Temps (2017). "Règlement des impayés des entreprises du bâtiment: Lorsque Tebboune se dit impuissant."
18 May 2017. https://www.letempsdz.com/index.php/132-actualite/190286-r%C3%A8glement-des-impay%C3%A9s-des-entreprises-du-batiment-lorsque-tebboune-se-dit-impuissant (Accessed 8 August 2017).
29 TSA (2017). "Tebboune, le CPA et la « Banque de l’habitat". 4 July 2017. https://www.tsa-algerie.com/tebboune-le-cpa-et-la-banque-de-lhabitat/ (Accessed 20 July 2017).
230 Ministry of Industry Press Release (2017). “Ciment : baisse sensible des prix grâce aux mesures prises parMonsieur le Ministre de l’Industrie et des Mines.” 12 July 2017. http://www.mdipi.gov.dz/?Ciment-baisse-sensible-des-prix (Accessed 19 Sept 2018).

Africa Housing Finance Yearbook 2018
65
households by lowering the threshold to a nominal initial deposit. By 2018, 52.3percent of the Angolan adult population held bank accounts. However, access tocredit remains difficult with Angola registering in the bottom five percent ofcountries for that indicator in the 2018 World Bank Doing Business Report, witha score of 183.7
The post-war construction boom has resulted in a growing interest in themortgage market and several large banks have started offering loans for housing.For example, Standard Bank offers average loans of about US$210 000 with atypical loan-to-value at origination of 70 percent. Banks in Angola rarely extendunsecured credit. If they do, it is highly collateralised (125 percent) in the form ofproperty, or dollar deposits from the borrower.8 The lack of credit informationand national identification systems to gauge the creditworthiness of prospectiveborrowers means that collateral is required for nearly all loans. Banks have actuallyreduced credit access for clients since 2014, justifying their reluctance with theincreasing percentage of loan defaults and a reported decrease in client demand.The emphasis of bank efforts appears to be to capture deposits, which they investin treasury bills issued by the National Bank of Angola, earning interest at up to24 percent annually, often indexed to the US Dollar. Commercial banks have
OverviewAngola’s economy is highly concentrated around the oil industry, which comprisesabout a third of its GDP and around 95 percent of exports, despite the globaldownturn and decrease in oil prices.1 Oil revenues and oil-backed loans haveallowed for large-scale state investments in the construction and rehabilitation ofpublic infrastructure, including the implementation of an ambitious housingprogramme to meet the country’s massive housing deficit, which is growing rapidlyin a context of rapid urbanisation. Currently Angola is said to be one of the fastesturbanising countries in Africa with more than 62 percent of its population living incities.2
After 38 years in office, Jose Eduardo dos Santos stepped down as president inAugust 2017. João Lourenço was elected as his successor. President Lourençohas begun to implement reforms in his initial year in office. His ambitious agendaincludes fighting corruption, eliminating nepotism, diversifying and opening up theeconomy, and promoting the private sector. While the new government hadinitially intended to continue major infrastructure projects, some of these weredelayed or suspended as a result of budget cuts3 when the magnitude of the debtof over US$40 billion inherited from the previous regime became apparent.
While the housing programme over the last decade has contributed to an increaseof the country’s housing stock through the state-led construction of new townsor centralidades, it has failed to create an enabling environment for housingdevelopment by the private sector, cooperatives and citizens. For the majority ofAngolans, informal and incremental self-built housing remains the predominantmethod of housing development. The new government’s decentralisation reformsand promised revision of planning and land legislation offer some optimism for animprovement in the real estate environment.
Access to financeThe Angolan banking sector is now the third largest in Sub-Saharan Africa (SSA)after Nigeria and South Africa.4 As of April 2018, there were 29 commercialbanks5 authorised to operate in the country.6 The Angolan banking sector hasmounted a campaign in recent years to increase its client base, with the objectiveof capturing savings. The Bankita programme, launched by the Banco Nacional deAngola (BNA) in partnership with most of the commercial banks that operate inAngola, is an effort to improve access to banking services among low income
AngolaKEY FIGURES
Main urban centresLuandaHuambo
Exchange rate: 1 US$ = [a] 24 Aug 2018PPP Exchange rate (Local currency/PPP$) 1 Kwanza = [b]Inflation 2016 [c] | Inflation 2017 [c] | Inflation 2018 [c]
250.41 Kwanza108.319.85 | 30.51 | 2.78
Population [b] | Urban population size [b] Population growth rate [d] | Urbanisation rate [b]Percentage of the total population below National Poverty LineUnemployment rate 2017 [c]
29 784 193 | 13 575 0393.30% | 4.99%36.6%20%
GDP (Current US$) 2017 [b] | GDP growth rate annual 2017 [b]GDP per capita (Current US$) 2017 [b]GNI per capita (Current US$) 2017 [b]Gini co-efficient 2017 [h]HDI global ranking 2005 [i] | HDI country index score 2005 [i]
US$124 209 million | 0.72%US$4 170US$3 33058.6150 | 0.533
Is there a deeds registry? Number of residential properties that have a title deed Lending interest rate Mortgage interest rate | Mortgage term (years)DownpaymentMortgage book as a percentage of the GDPEstimated number of mortgages Price to Rent Ratio in City Centre [j] | Outside City Centre [j]Gross Rental Yield in City Centre [j] | Outside City Centre [j]Construction as a % of GDP 2015 [c]
Yesn/a29.67%25.64% | 20 years20%n/an/a18.09 | 5.35.53% | 18.86%15.57%
What is the cost of standard 50kg bag of cement? What is the price of the cheapest, newly built house by a formaldeveloper or contractor? (Local currency)What is the price of the cheapest, newly built house by a formaldeveloper or contractor? (US$) What is the size of this house (m2)? What is the average rental price for this unit (US$)? What is the minimum stand or plot size for residential property?
US$12
14 000 000 Kwanza
US$56 86060m2
US$500250m2
Ease of Doing Business Rank [k]Number of procedures to register property [k]Time to register property (days) [k]Cost to register property (as % of property value) [k]
1757190 days2.90%
NB: Figures are for 2018 unless stated otherwise.
[a] Xe.com [b] World Bank World Development Indicators[c] Trading Economics[d] Statista.com[e] Angola 2014 Census[f] World Population Review[g] Development Workshop[h] UNICEF [i] UNDP Human Development Reports[j] Numbeo[k] World Bank Doing Business

66
earned substantial profits of up to 40 percent in 2017, the only sector of theAngolan economy not to show a decline.
Angola’s non-bank financial sector remains small, with the combined assets ofinsurance, pension funds and microcredit institutions being equivalent to only twopercent of GDP. Nevertheless, the increase in the number of non-bankinginstitutions in the past year was significant. As of 2018, Angola counted 40authorised microfinance institutions (MFIs) and four credit cooperatives.9
However, the penetration rate of MFIs remains low, with little more than 30 000active clients. Of the MFIs currently registered with the BNA, KixiCredito remainsthe only institution reporting up to date information with MIX Market, an onlinesource of microfinance performance data and analysis.10
KixiCredito is the largest non-bank microfinancier, launched by local non-governmental organisation Development Workshop Angola. In 2017, KixiCreditohad a staff of almost 300 and 22 000 clients with 21 branches in 17 of Angola’s18 provinces. With the devaluation of Angola’s currency against the US Dollar,the value of KixiCredito’s gross loan portfolio reduced to US$10 million fromUS$15 million in 2015.11 In addition to microfinance for small business, it alsooffers a housing microfinance product called KixiCasa. The product enables groupsof three to five people to access 36-month loans from US$1 000 to US$6 000.In 2012, the Community-Led Infrastructure Finance Facility provided a line offinancing for a new social housing project in Huambo province through theprovision of end-user finance for incremental housing by KixiCasa. These loansput the construction of a three to four-bedroom house with a total cost of up toUS$30 000 in different loan cycles within reach of low income households.12
AffordabilitySixty-two percent of the Angolan population is urban; the median age is 18 yearsand the average household has five members. The basic living income requiredfor an Angolan family is estimated to be Kz13 9400 (US$555)13 a month. Themonthly minimum wage, while remaining unchanged in Angolan currency atKz15 003, has lost value and buying power due to its devaluation from aboutUS$90 to US$6014, but skilled private sector employees generally earn over20 times more than those in the lowest income bracket.15 For expatriate oilcompany employees, this income is even higher, with employers generally pickingup the bill for accommodation. The Angolanisation of petroleum sectoremployment has resulted in significant reduction of demand for expatriate housing.Although high-end housing prices have fallen by approximately 30 percent since2016,16 Mercer’s annual survey found in 2018 that Luanda was still the sixth mostexpensive city globally and the most expensive African city.17
By 2017, the cost of a new two-bedroom apartment of about 180m2 indowntown Luanda reached US$4500/m2. An existing two-bedroom apartmentwent for about US$3000/m2, or US$500 000 per unit, while a three-bedroomhouse of about 190m2 in a residential compound in the suburb of Luanda Sul costUS$570 000 per unit or US$3 000/m2.18 A lack of public transport means thatmany residents who have moved to the suburbs rely on costly private transport,effectively adding to their household costs.
In 2009, the Angolan government created a Housing Development Fund (FFH)(Decree 54/09 of 2009) to support the financing of social housing for low incomehouseholds. However, the portfolio of the FFH remains limited to providingsubsidised loans for public servants in state housing projects. Loans are extendedfor up to 30 years with a three percent interest rate. To facilitate access to otherprospective inhabitants, in 2013 the government launched subsidised rent-to-buyschemes, now managed through Imogestin, a public-private partnership real-estatecompany, open to those with formal employment, a national identity card and atax-payer card. Apartments in these projects were initially priced betweenUS$125 000 and US$200 000 a unit. These schemes reduced apartment pricesto US$80 000 for a three bedroom apartment through 20-year mortgages witha three percent interest rate and monthly payments of the equivalent of US$390which was fixed in national currency at the 2017 rate. This brought ownershipwithin the reach of early career professionals and mid-level civil servants earningover US$1 000 a month. However, government housing projects, while highlysubsidised, still remain unaffordable for low income households. By 2018 asignificant proportion of clients of the rent-to-buy schemes have lost their capacityto make their monthly payments and have entered into default. Imogestin, thecontract holder, has not been authorised to carry out repossessions.
Housing supply Luanda’s housing stock consists largely of a dilapidated urban core of colonial-erabuildings surrounded by sprawling slums. Several government housing projectswere developed for low income households and public servants. These includedprojects such as Kilamba, Zango, Panguila and Nova Vida in Luanda. However,rapid urbanisation has meant that these projects contributed little to overcomingthe housing deficit, estimated by the Ministry of Urbanisation at 1.2 million unitsin 2012.19 According to Angola’s National Statistics Institute,20 as much as90.9 percent of the urban population reported living in inappropriate conditionswith limited access to sanitation, water and electricity.
The 2008 pre-election announcement that the State aimed to produce one millionhomes under the slogan “My Dream, My Home” (Meu Sonho, Minha Casa), wasformally adopted in 2009 as the National Urbanism and Housing Programme(PNHU) (Resolution 20/09 of 2009), the implementation of which is ongoing, withan extended timeframe beyond 2012. The most successful element of theprogramme, up until 2016, had been the delivery of state-built housing, with almost152 000 units having been delivered through financing from the state budget.21
This includes the construction of new urban centres such as the “new city” ofKilamba, including the centralidades of Sequele (formerly known as Cacuaco),Capari, Km 44 and Condomínio Vida Pacífica (Zango), all financed by oil-backedcredit lines and built by Chinese companies on the outskirts of Luanda and othercities throughout the country. In 2018, as previously funded housing continues tobe released in the new urban centres, project plans continue to be announced,but budget restrictions have halted the programme.
By 2018 the PNHU has delivered a total of 218 418 houses including those builtthrough state-funded public-private partnerships and cooperatives. While theGovernment has expressed satisfaction with the work being done, it was admittedthat external infrastructure, including the lack of water and sanitation connections,remains a concern involving various ministries.22 The role of the private sector inthe housing programme has been limited due to their reluctance to invest theirown capital, given the high material and administrative costs of construction, thelack of a unified, functioning and up-to-date property registration system and legalguarantees to allow banks to recover assets on defaulted housing loans. As aresult, the private sector has focused on the development of high-end housing, or,in state-financed projects, limiting its role to that of contractor and/or manager.
Despite the identification of housing cooperatives as one of the key actorsresponsible for housing delivery, legislation to regulate the activities of cooperativeswas only adopted in 2015 (Law 23/15 of 2015). To date, there are still only a fewactive housing cooperatives in Angola, and these have experienced difficulties withregard to infrastructure provision, land titling, default in payments by members,and reduced interest in the cooperative model, in the face of state housing projects.So far, housing cooperatives have built 12 000 out of 80 000 originally plannedunits. Although assisted self-help building was meant to be the largest componentof housing delivery under the government’s housing programme, it has receivedthe least resources: 131 624 plots have been distributed, mainly to accommodateresettled people, but little progress has been made in large-scale land titling,infrastructure provision or housing finance for low income households. Hence,self-built stock continues to be predominantly informal. Over 20 000 units werebuilt at the same time through social production, outside the PNHU, and usinglargely informal market mechanisms, almost matching the Government’s deliveryof housing.23 While much of the Government’s housing programme wascontracted to international firms from China, Israel and Brazil, the social productionof housing created a significant amount of employment. The National HousingDirectorate estimates that 1.22 jobs are created by each house constructed.
The Angolan government has created a state-owned land management companyEmpresa Gastora de Terrenos Infra-estruturados (EGTI). The public company’sprimary mandate is to carry out a more rational and economic driven process ofurbanisation in the country.24 EGTI was expected to earn US$773 million by 2020just by selling land in two towns built from scratch in Luanda Province.25 EGTIwas also awarded management authority of the new land in Luanda and 20 otherreal estate developments in various parts of the country. EGTI has been formallyawarded musseque/slum land with a high real estate value appropriated fromformer residents in the Sambizanga district in the heart of Luanda. The domesticconstruction and the local building material sectors remain underdeveloped. Asa result, foreign firms and imported building materials dominate the market, making
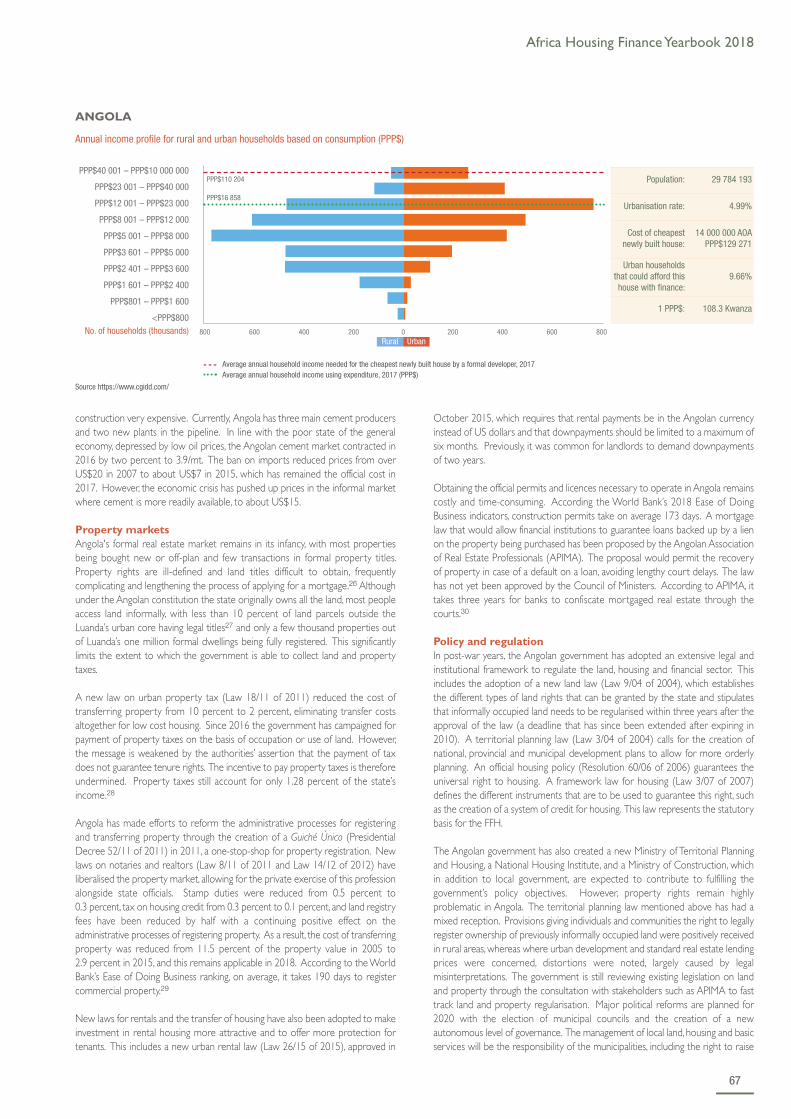
Africa Housing Finance Yearbook 2018
67
construction very expensive. Currently, Angola has three main cement producersand two new plants in the pipeline. In line with the poor state of the generaleconomy, depressed by low oil prices, the Angolan cement market contracted in2016 by two percent to 3.9/mt. The ban on imports reduced prices from overUS$20 in 2007 to about US$7 in 2015, which has remained the official cost in2017. However, the economic crisis has pushed up prices in the informal marketwhere cement is more readily available, to about US$15.
Property marketsAngola's formal real estate market remains in its infancy, with most propertiesbeing bought new or off-plan and few transactions in formal property titles.Property rights are ill-defined and land titles difficult to obtain, frequentlycomplicating and lengthening the process of applying for a mortgage.26 Althoughunder the Angolan constitution the state originally owns all the land, most peopleaccess land informally, with less than 10 percent of land parcels outside theLuanda’s urban core having legal titles27 and only a few thousand properties outof Luanda’s one million formal dwellings being fully registered. This significantlylimits the extent to which the government is able to collect land and propertytaxes.
A new law on urban property tax (Law 18/11 of 2011) reduced the cost oftransferring property from 10 percent to 2 percent, eliminating transfer costsaltogether for low cost housing. Since 2016 the government has campaigned forpayment of property taxes on the basis of occupation or use of land. However,the message is weakened by the authorities’ assertion that the payment of taxdoes not guarantee tenure rights. The incentive to pay property taxes is thereforeundermined. Property taxes still account for only 1.28 percent of the state’sincome.28
Angola has made efforts to reform the administrative processes for registeringand transferring property through the creation of a Guiché Único (PresidentialDecree 52/11 of 2011) in 2011, a one-stop-shop for property registration. Newlaws on notaries and realtors (Law 8/11 of 2011 and Law 14/12 of 2012) haveliberalised the property market, allowing for the private exercise of this professionalongside state officials. Stamp duties were reduced from 0.5 percent to0.3 percent, tax on housing credit from 0.3 percent to 0.1 percent, and land registryfees have been reduced by half with a continuing positive effect on theadministrative processes of registering property. As a result, the cost of transferringproperty was reduced from 11.5 percent of the property value in 2005 to2.9 percent in 2015, and this remains applicable in 2018. According to the WorldBank’s Ease of Doing Business ranking, on average, it takes 190 days to registercommercial property.29
New laws for rentals and the transfer of housing have also been adopted to makeinvestment in rental housing more attractive and to offer more protection fortenants. This includes a new urban rental law (Law 26/15 of 2015), approved in
October 2015, which requires that rental payments be in the Angolan currencyinstead of US dollars and that downpayments should be limited to a maximum ofsix months. Previously, it was common for landlords to demand downpaymentsof two years.
Obtaining the official permits and licences necessary to operate in Angola remainscostly and time-consuming. According the World Bank’s 2018 Ease of DoingBusiness indicators, construction permits take on average 173 days. A mortgagelaw that would allow financial institutions to guarantee loans backed up by a lienon the property being purchased has been proposed by the Angolan Associationof Real Estate Professionals (APIMA). The proposal would permit the recoveryof property in case of a default on a loan, avoiding lengthy court delays. The lawhas not yet been approved by the Council of Ministers. According to APIMA, ittakes three years for banks to confiscate mortgaged real estate through thecourts.30
Policy and regulationIn post-war years, the Angolan government has adopted an extensive legal andinstitutional framework to regulate the land, housing and financial sector. Thisincludes the adoption of a new land law (Law 9/04 of 2004), which establishesthe different types of land rights that can be granted by the state and stipulatesthat informally occupied land needs to be regularised within three years after theapproval of the law (a deadline that has since been extended after expiring in2010). A territorial planning law (Law 3/04 of 2004) calls for the creation ofnational, provincial and municipal development plans to allow for more orderlyplanning. An official housing policy (Resolution 60/06 of 2006) guarantees theuniversal right to housing. A framework law for housing (Law 3/07 of 2007)defines the different instruments that are to be used to guarantee this right, suchas the creation of a system of credit for housing. This law represents the statutorybasis for the FFH.
The Angolan government has also created a new Ministry of Territorial Planningand Housing, a National Housing Institute, and a Ministry of Construction, whichin addition to local government, are expected to contribute to fulfilling thegovernment’s policy objectives. However, property rights remain highlyproblematic in Angola. The territorial planning law mentioned above has had amixed reception. Provisions giving individuals and communities the right to legallyregister ownership of previously informally occupied land were positively receivedin rural areas, whereas where urban development and standard real estate lendingprices were concerned, distortions were noted, largely caused by legalmisinterpretations. The government is still reviewing existing legislation on landand property through the consultation with stakeholders such as APIMA to fasttrack land and property regularisation. Major political reforms are planned for2020 with the election of municipal councils and the creation of a newautonomous level of governance. The management of local land, housing and basicservices will be the responsibility of the municipalities, including the right to raise
Source https://www.cgidd.com/
PPP$40 001 – PPP$10 000 000
PPP$23 001 – PPP$40 000
PPP$12 001 – PPP$23 000
PPP$8 001 – PPP$12 000
PPP$5 001 – PPP$8 000
PPP$3 601 – PPP$5 000
PPP$2 401 – PPP$3 600
PPP$1 601 – PPP$2 400
PPP$801 – PPP$1 600
<PPP$800
- - - Average annual household income needed for the cheapest newly built house by a formal developer, 2017 Average annual household income using expenditure, 2017 (PPP$)
ANGOLA
Annual income profile for rural and urban households based on consumption (PPP$)
No. of households (thousands)
PPP$16 858
PPP$110 204
Rural Urban800 600 400 200 0 200 400 600 800
Population: 29 784 193
Urbanisation rate: 4.99%
Cost of cheapestnewly built house:
14 000 000 AOAPPP$129 271
Urban householdsthat could afford thishouse with finance:
9.66%
1 PPP$: 108.3 Kwanza

68
local taxes, fees, make budgets and control finances. It is expected thatmunicipalisation will provide an incentive to local real estate markets when landcadastres and fiscal matters will be locally administered.
OpportunitiesAlthough subsidised state-led housing construction remains a government priority,budget constraints resulting from the global economic downturn continue to limitthe extent to which the government is able to invest in housing development.Prospective legal reforms in land and property, including the approval of a draftlaw on mortgages that would allow financial institutions to acquire liens on realestate, should facilitate private sector investment, and also generate tax revenueswhich can be allocated to further develop the housing sector.
So far the lower income segment of the population remains virtually untouchedby housing finance and development initiatives, in spite of the existence of theFFH and a legislative regime which regulates cooperatives and microfinanceinstitutions. Hopes for a post-war peace dividend, electoral promises and the largestate investments in housing has produced high expectations with a significantdemand from those at the “bottom of the pyramid” who have been bypassed bythe PNHU. Evidence that people are prepared to invest their own savings throughthe social production of housing have demonstrated that there is a significantunmet potential for investment by households themselves. Best practices andinnovations developed by players such as KixiCrédito offer demonstrations onhow opportunities can be built on and further expanded.
Additional sourcesAbacus (2015). Property market report Angola.https://media.egorealestate.com/ORIGINAL/1cc5/3565b98c-6424-4ea6-92e8-3e66f1271cc5.pdf. (Accessed 19 August 2018).
ANGOP, Angola: BIC Bank joins BODIVA (27 April 2016)http://www.angop.ao/angola/pt_pt/noticias/economia/2016/3/17/Angola-BIC-torna-membro-BODIVA,2ab57a96-12f3-4735-9642-84ebfa3847a7.html.(Accessed 19 August 2018).
ANGOP. Securities code in place since 31 August. 4 September 2015.http://www.angop.ao/angola/en_us/noticias/economia/2015/8/36/Securities-code-place-since-August,0de19499-b2fa-4fbd-af5b-3c3c05e9a210.html.(Accessed 19 August 2018).
Development Workshop (2016). Angola’s housing sectors: understandingmarket dynamics, performance, and opportunities.http://www.housingfinanceafrica.org/document/angolas-housing-sectors-understanding-market-dynamics-performance-and-opportunities/. (Accessed19 August 2018).
Expresso (2015). Negócio imobiliário angolano em queda livre 20 September2015. https://expresso.sapo.pt/economia/2015-09-20-Negocio-imobiliario-angolano-em-queda-livre-#gs.qTREIME. (Accessed 19 August 2018).
Knight Frank (2018) Africa Report 2017/18.https://content.knightfrank.com/research/155/documents/en/africa-report-201718-4576.pdf. (Accessed 2 September 2018).
LUSA (2017). Dívida pública angolana financia nova Empresa Gestora deTerrenos Infraestruturados - 03 August 2017.https://www.dn.pt/lusa/interior/divida-publica-angolana-financia-nova-empresa-gestora-de-terrenos-infraestruturados-8682554.html. (Accessed 19 August2018).
National Institute of Statistics (2015). Inquérito Integrado sobre o Bem Estar daPopulação (IBEP) 2008-09. Luanda, August 2010.Development WorkshopAngola, Report on the Housing Finance Roundtable Strategies for a sustainablesector in the face of an economic crisis (25 September 2015).
National Institute of Statistics (INE). Recenseamento Geral da População eHabitação. Resultados definitivos (March 2016).
Websites:www.24.sapo.pt/www.angop.ao/www.bna.ao/www.cemnet.com/www.consumidorbancario.bna.ao/www.datatopics.worldbank.org/financialinclusion/country/angola http://www.dw.angonet.org/www.observador.pt/www.opais.co.ao/www.themix.org/mixmarket/countries-regions/angolawww.slideshare.net/DevelopmentWorkshopAngola/
1 The World Bank (2018). The World Bank in Angola. http://www.worldbank.org/en/country/angola/overview2 ANGOP (2017). “Angola among fastest urbanization in Africa.” 26 April 2017. http://m.portalangop.co.ao/angola/en_us/noticias/sociedade/2017/3/17/Angola-among-fastest-urbanisation-rates-Africa-minister,9eeb5f47-5bc9-4216-9df7-
561f034fda05.html (Accessed 28 Aug 2018).3 LazardNet (2018). Emerging Markets Sovereign Outlook: Angola. http://www.lazardnet.com/us/emd/docs/sp0/9709/EmergingMarketsSovereign-Angola (Accessed 28 Aug 2018).4 KPMG (2015). Angola banking survey. https://www.kpmg.com/PT/en/IssuesAndInsights/Documents/bank-ao-2015-en.pdf5 http://www.capitalmarketsinafrica.com/angola (Accessed 19 August 2018).6 Banco Nacional de Angola (2018). Lista de instituições financeiras autorizadas, as of 18 May 2018. http://www.bna.ao/Conteudos/Artigos/lista_artigos_medias.aspx?idc=142&idsc=834&idl=1 (Accessed 19 August 2018).7 The World Bank (2018). Doing Business in Angola. http://www.doingbusiness.org/reports/globalreports/~/media/giawb/doing%20business/documents/profiles/country/AGO.pdf (Accessed 19 August 2018).8 Export.gov (2017). Angola Country Commercial Guide, 7/7/2017. https://www.export.gov/article?series=a0pt0000000PAt9AAG&type=Country_Commercial__kav (Accessed 19 August 2018).9 Banco Nacional de Angola (2018).10 The MIX Market (2018). Angola Country Profile. https://www.themix.org/mixmarket/countries-regions/angola (Accessed 19 August 2018).11 The MIX Market (2018). KixiCredito Data. https://www.themix.org/mixmarket/profiles/kixicredito 12 Development Workshop (2016). Strategies for a sustainable sector in the face of an economic crisis. http://housingfinanceafrica.org/app/uploads/Strategies-for-a-sustainable-sector-in-the-face-of-an-economic-crisis_Angola.pdf 13 Trading Economics (2018). Angola - Economic Indicators. https://tradingeconomics.com/angola/indicators (Accessed 19 August 2018).14 Trading Economics (2018). Angola Minimum Wages. https://tradingeconomics.com/angola/minimum-wages 15 Centro de Estudos e Investigação Científica (CEIC) (2015). Relatório Económico Annual 2014. Luanda: Universidade Católica de Angola. http://www.ceic-ucan.org/wp-content/uploads/2017/02/RELATORIO_ECON_2015.pdf (Accessed
19 August 2018).16 Martins Chambassuco (2018). Expansao 09 February 2018. 17 Mercer (2018). “Mercer’s annual cost of living survey finds Asian, European, and African cities most expensive locations for employees.” https://www.mercer.com/newsroom/cost-of-living-2018.html (Accessed 1 September 2018)18 Knight Frank (2018). Africa Report 2017/18. https://content.knightfrank.com/research/155/documents/en/africa-repor. -201718-4576.pdf (Accessed 2 September 2018).19 Ministerio do Urbanismo e Habitacao (2015). Programa de Habitacao Social em Angola. http://www.slideshare.net/DevelopmentWorkshopAngola/programa-de-habita. -social-em-angola (Accessed 19 August 2018).20 National Institute of Statistics (2010). Inquérito Integrado sobre o Bem Estar da População(IBEP) 2008-09. Luanda, August 2010.21 Government of Angola (2016). Angolan National Report for Habitat III. http://habitat3.org/wp-content/uploads/Angola-Habitat-III-Final-Report-English.pdf (Accessed 19 August 2018).22 Construction review online (2016). Government of Angola working to provide social housing to population, October 3, 2016. Government of Angola working to provide social housing to population.
https://constructionreviewonline.com/ (Accessed 19 August 2018).23 Development Workshop (2008). Direito à Cidade em Angola e a Produção Social de Habitat - 28 March 2018. http://www.dw.angonet.org/forumitem/direito-cidade-e-produa-o-social-de-habitat-024 LUSA (2017). Dívida pública angolana financia nova Empresa Gestora de Terrenos Infraestruturados - 03 August 2017. https://www.dn.pt/lusa/interior/divida-publica-angolana-financia-nova-empresa-gestora-de-terrenos-infraestruturados-
8682554.html. 25 Paulo Cunha/LUSA (2017). ‘Imobiliária’ do Estado angolano quer vender 710 milhões em terrenos em Luanda. http://observador.pt/2017/03/30/imobiliaria-do-estado-angolano-quer-vender-710-milhoes-em-terrenos-em-luanda/.
(Accessed 19 August 2018).26 Export.gov (2017). Angola Country Commercial Guide, 7/7/2017. https://www.export.gov/article?series=a0pt0000000PAt9AAG&type=Country_Commercial__kav 27 Development Workshop (2011). “The Case of Angola: Strengthening Citizenship through Upgrading of Informal Settlements Cross Country Initiative.” Final Synthesis Report TF 0901110 presented to the World Bank, Luanda 30 June
2011.28 Development Workshop (2017). Angola’s new housing finance reforms. http://www.dw.angonet.org/sites/default/files/20170115_-_blog_on_new_angolan_housing_financial_reforms_1.pdf 29 The World Bank (2018). Country Profile.30 APIMA (2012). Diagnstico do sector imobilirio em Angola. http://www.slideshare.net/DevelopmentWorkshopAngola/financeiro-da-habitao-workshop-diagnstico-sector-imobilirio-em-angola-associao-de-profissionais-imobilirios-de-angola-
apima-01-junho-2012 (Accessed 19 August 2018).

Africa Housing Finance Yearbook 2018
69
Access to financeThe country’s financial sector is concentrated in commercial banks; other sectorsare still in their infancy. At the end of 2017, there were 16 banks4 with about 202branches and 312 ATM machines, for approximately 11 million inhabitants.5 InDecember 2017, loans disbursed were estimated at CFA 1 215 billion (US$2.12billion),6 a slight increase from its 2016 level. Access to credit as measured bycredit to the economy was 22 percent of GDP in 2015 and 25 percent in 2016.7
Lending rates remain moderate, but are among the highest in the region, averaging8.5 percent in 2013. Digital finance is making its way in the financial landscapewith the support of the United Nations Capital Development Fund’s MobileMoney for the Poor programme covering Benin and three other African countries.Mobile money grew by 19 percent between 2016 and 2017.8 Despite thecreation in 2010 of the CRRH-UEMOA, lack of long-term financing remains themain reason for the low provision of long-term credit. Ambitious reforms wereadopted in 2016 by the central bank (the Central Bank of West African States –BCEAO) to strengthen bank supervision (transition to Basel II and III, consolidatedsupervision, tightening of single exposure limit), and to strengthen liquidityrequirements and incentivise banks to seek long-term funding.
Housing finance has been growing over the past decade, driven mainly by bankswith donors, such as the West African Development Bank and the IslamicDevelopment Bank showing some interest through the financing of the
OverviewBenin is a small country in the West African Economic and Monetary Union(WAEMU). Benin’s economy also depends significantly on that of its giant eastneighbour, Nigeria, its main trade partner, especially for re-exportation.
Economic growth has slowed down over the past four years, with a decrease from6.5 percent in 2014 to 5.2 percent in 2015, and four percent in 2016,1 mainly dueto a slowdown in economic activity in Nigeria. GDP growth for 2017 reached5.5 percent and is projected to reach 6.1 percent in 2018 and 6.5 percent in2019.2 This is mainly due to key public finance management reforms. Also,activities in the cotton production sub-sector have improved particularly since the2016-2017 season, with a record production of 451 000 tons in 2016, and anexpected new record of more than 500 000 tons in 2018. Inflation was kept lowat 0.6 percent, but poverty remains a serious concern, as four in 10 householdswere living below the poverty line in 2015 (the latest figure available). Benin’spublic finance is recovering from severe stress because of the 2015-2017 recessionin Nigeria, and changes in trade policy in Nigeria, which significantly reduced re-exportation taxes on rice and several imported products (including second-handcars) transiting through Benin.
According to the 2013 general Census, Benin’s population has reached 10.5 million.This figure is projected to have increased to 11.2 million in 2017, while the urbanpopulation reached 47 percent of the total population in 2017 and grows at asteady 3.77 percent a year.3
The newly elected President’s promise to develop a new housing programmetook shape, with the preparation of a CFA 347 billion (US$604 million) housingprogramme covering 16 cities and towns, with the goal of delivering 20 000housing units by 2021. Also, in line with its Africa Housing Strategy, in October2017, the World Bank Group signed the Financial Agreement for a regional projectto expand access to long-term affordable housing finance in WAEMU. Theagreement secured a US$130 million loan and US$25 million grant for the benefitof under-served households, through a partnership with the Cuisse Régionale deRefinancement Hypothécaire de l'UEMOA (CRRH-UEMOA), a regional mortgagerefinancing facility, and the West African Development Bank (BOAD). Thisrepresents a major development in the housing finance sector in the country andthe region.
BeninKEY FIGURES
Main urban centresPort-NoveCotonou
Exchange rate: 1 US$ = [a] 10 Sept 2018PPP Exchange rate (Local currency/PPP$) 1 CFA franc = [b]Inflation 2016 [b] | Inflation 2017 [b] | Inflation 2018 [b]
574.39 CFA franc212.70-0.8 | 0.6 | 3.00
Population [b] | Urban population size [b]Population growth rate [c] | Urbanisation rate [b]Percentage of the total population below National Poverty Line 2015 [c]Unemployment rate [c]
11 175 692 | 5 011 9632.75% | 3.77%
40.10%0.73%
GDP (Current US$) 2017 [a] | GDP growth rate annual 2017 [b]GDP per capita (Current US$) 2017 [b]GNI per capita (Current US$) 2017 [b]Gini co-efficient 2015 [b]HDI global ranking [d] | HDI country index score [d]
US$9 273 million | 5.58%US$830US$82947.80167 | 0.485
Is there a deeds registry? Number of residential properties that have a title deed [e] Lending interest rate [f] Mortgage interest rate [f] | Mortgage term (years) [f]DownpaymentMortgage book as a percentage of the GDPEstimated number of mortgages [f] Price to Rent Ratio in City Centre | Outside City Centre Gross Rental Yield in City Centre | Outside City Centre Construction as a % of GDP
yes40 0006.07%8.47% | 7n/an/a539n/a | n/an/a | n/an/a
What is the cost of standard 50kg bag of cement? What is the price of the cheapest, newly built house by a formaldeveloper or contractor? (Local currency)What is the price of the cheapest, newly built house by a formaldeveloper or contractor? (US$) What is the size of this house (m2)? What is the average rental price for this unit (US$)? What is the minimum stand or plot size for residential property?
US$5.75
8 900 000 CFA franc
US$15 49540m2
US$44150m2
Ease of Doing Business Rank [g]Number of procedures to register property [g]Time to register property (days) [g]Cost to register property (as % of property value) [g]
1514120 days3.50%
NB: Figures are for 2018 unless stated otherwise.
[a] Coinmill.com[b] World Bank World Development Indicators[c] Benin - National Institute of Statistics and Economic Analysis[d] World Bank Open Data[e] UNDP Development Indicators (2015)[f] Benin Ministry of Economics and Finance[g] Central Bank of West African States[h] World Bank Doing Business

70
government housing programme. Most housing loans are provided in two formsto individuals with regular employment who use their salaries as collateral:medium-term construction material loans, and group lending. The medium-termconstruction material loans are granted to individuals at an interest rate of 10.5percent to 11 percent, and a repayment term from three to five years. The grouplending products are usually granted to private organisations or to parastatals todistribute to their employees, where the organisation is responsible for repaymentof the loans. Products such as consumption loans (with a two-year maximumterm) or equipment loans up to CFA 5 million (US$8 705) on average (with afive-year maximum term), are often used as housing finance, and often for homeimprovements.
Some banks have designed specific housing finance products, such as the housingsavings plan of Ecobank Benin, which provides access to housing loans for saverswith relatively lower interest rates. Ecobank and other commercial banks are alsodeveloping creative partnerships with local construction material wholesalers orretailers to offer housing finance products. In 2015, Ecobank partnered withconstruction material retail firm Batimat to offer up to CFA 10 million in loans inconstruction materials. In return, the firm offers a 20 percent rebate on materialspurchased in its shops. In 2012, Bank of Africa Benin launched, in partnership withthe Benin Housing Bank (BHB), the housing loan, a new product specificallytargeted at those looking for long-term housing finance. The term of this loan cango up to 20 years, with an interest rate as low as 6.5 percent and is secured by afirst order mortgage on the house for which the loan is requested. In general,individuals with no regular income (especially from the informal sector, whichmakes up to 65 percent of the Benin economy, and 90 percent of the labourforce) are excluded from the housing finance sector.
The first of its kind in the country, BHB was founded in 2004 by a public privatepartnership between the government and private stakeholders, including the Bankof Africa, to provide solutions for the demand for housing finance in the country.The BHB was capitalised at CFA 5 billion (US$8.7 million) with the Bank of AfricaGroup as the main shareholder at 77 percent. It was expected to provide 50percent of its loans to affordable housing projects. Unfortunately, after a littlemore than a decade of operation, the BHB has been absorbed by the BMCE Bankof Africa Group.
Lending rates offered by banks in Benin are among the highest in the WAEMUregion. In 2013 the average interest rate was around 8.5 percent, down from2012. This confirms the downward tendency noticed in recent years (as low as6.5 percent for long-term loans) as the macroeconomic and political environmentremain stable and competition increases in the banking sector.
A study by BCEAO in 2014 estimated that the average term for a housing loanwas around 86 months at an interest rate of 8.47 percent a year, and an averageloan size of CFA five million (US$8 705).9
The savings culture of the Beninese has driven the growth of microfinance, makingit a significant player in the country’s financial system. As of December 2017, thereare 6610 registered microfinance institutions networks. A sampling of 14 micro-finance institutions representing 90 percent of these networks showed that theyhad 473 service points, and were serving 1 937 338 million clients, for a totaldeposit of CFA 102 218 million (US$177.96 million) and a total outstanding debtof CFA 125 458 million (US$218.42 million).11 The Fédération des Caissesd’Epargne et de Crédit Agricole Mutuel (FECECAM) is the biggest network,gathering more than 80 percent of clients. The penetration rate of microfinancereached in Benin is high, at more than 85 percent.
Since its creation in 2010, CRRH-UEMOA has regularly mobilised resources onthe regional financial market through bonds. Total resources mobilised reachedCFA 132 billion with the successful conclusion of its seventh bonds in November2017. CRRH-UEMOA has recently attracted interest from development partners,especially the World Bank Group, and signed a US$155 million financial agreementwith the BOAD, the CRRH-UEMOA and the WAEMU Commission. US$130million of the proceeds of the agreement will be go to the CRRH-UEMOA torefinance banks in the WAEMU economic space, for them to improve access toaffordable housing finance, including for low and non-regular income households.The expected effect of this financing is to increase the maturity period of
mortgages up to 15-20 years, and lower interest rates to around seven percent ayear. In February 2017, the CRHH-UEMOA signed the first CFA 3.75 billion(US$3 million) agreement with the International Finance Corporation (IFC) andBOAD, positioning IFC as the second main institutional shareholder of the CRRH-UEMOA. A second agreement for US$9 million was concluded later in 2017,which allowed IFC to acquire CRRH-UEMOA bonds, as a way to attract privateinvestments up to US$500 million, through the new Maximize Financing forDevelopment approach of the World Bank Group.
AffordabilityAffordability remains a serious issue since incomes are relatively low comparedto housing unit prices. The cheapest properties cost about CFA 8.9 million(US$15 495)12 for houses built under the Government Affordable HousingProgram, or 18 times the per capita gross national income estimated at US$820in 2017. However, in 2016, a new actor entered the housing construction market,and is driving prices down. Global Service Immo, a private firm, is now offering toconstruct basic one-bedroom units for as low as CFA 2 million (US$3 482)13 forthose who already own a piece of land. It is expected that this new trend willcontinue in the future, all things being equal. Global Service Immo also offersempty plots for sale across the country.
Unfortunately, and in the absence of adequate public policy, affordability of housingis exacerbated by rapid escalations in land prices, especially in newly urbanisedareas. Speculation also drives prices up, with more intermediaries positioningthemselves between property owners and buyers. Increasing land prices havedriven lower and middle income people to move further from the inner city towhere they can afford land. The minimum plot size for residential property inurban areas is 250m2.
Cement prices, which dropped to as low as CFA 3 300 (US$5.75) for a 50kg bagin 2017 increased to CFA 4 500 (US$7.83), before dropping again to CFA 3 450(US$6.01) recently. However, the price of other construction materials has notchanged much. A standard sheet of corrugated iron costs US$5.40.
Housing supplyDespite the absence of reliable information on the demand for housing in Benin,it is obvious that housing supply is way below the demand. The Ministry of LivingEnvironment and Sustainable Development estimates the overall housing demandat about 320 000 units between 2010 and 2020. There are four majorcontributors to meet the demand for housing and increase the housing stock inthe country – households through self-construction using imported as well aslocal materials, government agencies, public private partnerships, and privatedevelopers.
The presence of formal developers is minimal. Major formal housing supply wasspearheaded over the past years by the government’s 10 000 Affordable HousingUnits Programme, which was planned over the whole country. The first phase ofthe programme was supposed to deliver 2 100 units between 2008 and 2011,with the support of BHB and the Atlantique Bank, as well as a few selected privatedevelopers. However, a 2017 evaluation by the Ministry of Living Environmentand Sustainable Development showed that, after eight years of implementation,of the 2 100 units planned for the first phase, only 893 were completed and sold,while 650 were never completed.
Learning from the failure of the previous programme, government launched in2017 a new 20 000 housing unit programme over the period 2017-2021 for atotal of CFA 347 billion (US$604 million). The new programme covers 16 citiesand towns all over the country, with the city of Abomey-Calavi hosting 11 500 orabout 60 percent of the programme. The government has already signed apartnership with Polimeks, a Turkish company, to deliver the housing units by theset deadline. The new programme will deliver exclusively F4 (three-bedroomunits) in a combination of standalone units and apartment complexes, costingbetween CFA 15.7 million (US$27 333) for the apartment units and CFA 19.2million (US$33 427) for standalone housing units. The programme is specificallytargeted at middle income households, for example civil servants. Futurehomeowners on the programme can pay back their properties over 17 yearsthrough mortgages to be negotiated with commercial banks and insurance

Africa Housing Finance Yearbook 2018
71
companies, which are part of a complex partnership to be set up. The overallmanagement of the programme is entrusted to the newly created LivingEnvironment Agency (Agence du Cadre de Vie) and a new joint-stock company.In 2018, the government secured CFA 66 billion from the Islamic Developmentand the West African Development Bank to finance the programme.
Other actors in the housing supply chain in Benin include the Executing Agencyof Public Interest Works in Benin (Agence de Gestion des Travaux d’Intérêt Public,or AGETIP-Benin) with its development programme, Villa de l’Atlantique, a 120housing unit development costing between CFA 76 million and CFA 126 million(US$138 610 to US$229 790). AGETIP is also active in the production and thesale of new empty serviced plots in the cities of Cotonou and Abomey-Calavi,costing between CFA 2 000 (US$3.48) and CFA 20 000 (US$34.82) a squaremeter. As mentioned, Global Service Immo is also a private company specialisingin the production and sale of empty plots.
Property marketsIn Benin, property markets are dominated by the trade of empty plots betweenindividuals and businesses. However, most land belongs to individuals who cantrade them as they wish. Until recently, trade of land has taken place in a contextin which there is neither a deeds registry, nor a cadastre. Land titling is thus amajor challenge, despite the numerous efforts deployed by the government overthe past years to improve land security. However, the new government, underthe leadership of the National Agency for Domains and Land (Agence nationaledu domaine et du foncier – ANDF) put in place steps to create a national cadastreand strengthen the deeds registry. But for now, the quality of land administrationis rated at 6.5 compared to a regional average of 8.6 on a 0-30 scale by the 2018Doing Business Report, according to which Benin ranks 127 out of 190 countrieson the registering a property indicator. It currently takes an average of 120 daysand four procedures, and costs 3.5 percent of the property value to register aproperty in Benin. Property registration fees have been abolished on privateproperties since 2016.
Trade of built housing units is limited, with only a few high-end units (built inpreparation for the Community of Sahelo-Saharan States summit in 2008) on themarket. A few private actors are positioning themselves in the property marketlandscape, with their speciality being the brokering of empty plots (exclusivelybetween private owners) and a few houses: Global Services Immo, Immo-Benin,Benin-Immo, Dommus Immo and West Coast Property are a few examples ofthose actors which advertise plots to sell or rent on their regularly updatedwebsites. While Benin-Immo operates mostly in Cotonou and its surroundings,Global Service Immo covers the whole country with its activities. Global ServiceImmo is gaining recognition for selling only secured properties. West CoastProperty, which has international span, specialises in the trade of high-end luxuryapartments and houses in and around Cotonou.
The sale of the first units made available through the government’s 10 000affordable housing units programme started in 2012. Since then, the 893completed units have been sold, some through leasing. The main problem remainsaffordability, even for civil servants who find it difficult to afford the required 30percent downpayment.
Even though the Benin culture encourages homeownership, the rental segment isstill dominant in the property market, with prices increasing, especially in urbanareas where the demand for housing is very high. Rental housing prices are alsodriven up by land speculation. Over the past years, for example, land prices havegone up by more 50 percent.
Policy and regulationBenin has several policies and regulations in place to support land developmentand housing. Among the most important are: (i) the 2005 National Housing Policywhich led to the creation of the Benin Housing Bank; (ii) the 2002 National LandUse Planning Policy with the objectives of promoting land use planning and therational management of resources, as well as strengthening basic infrastructure atthe local level; (iii) the 2013 Land Code; and most recently (iv) the 2016 SpatialPlanning Framework Law aiming at better organising spatial planning which mayopen up opportunities for new developments in the coming years. The 2013Land Code, along with its implementing Decrees, represent a significant develop-ment of the regulatory environment in Benin. The 2013 Land Code reorganisedland property rights and put an end to the legal dualism inherited from the colonialera, creating a unified land tenure system. The Act also created two major agenciesin the institutional architecture of land administration: ANDF and the LandCompensation Fund (Fonds de dédommagement foncier) under the Ministry ofFinance.
Communes (local governments) were also empowered on land administrationwith the enactment of decentralised organisations for land administration, amongwhich are the Commune’s Land Administration Commissions and the CommunalDomain and Land Bureaus (Bureau Communal du Domaine et du Foncier –BCDF). As of July 2017, 14 out of 77 BCDF were created to cover all the country.This will help Communes to fully exercise their prerogatives in land administrationas devolved by the decentralisation laws. Among areas covered by these decreesare the shared property rights for high-rise buildings, modalities for the divisionand reunion of property rights, arrangements for exercising the right of first refusaland leasing of preempted or expropriated buildings. The ANDF is specificallytasked with the mission of developing a transparent, accessible and up-to-datenational land management information system. These are important for theprotection of property rights in the Republic of Benin.
The 2016 government continued along the same line of strengthening theregulatory and policy framework through a number of measures aiming at: (i)encouraging the formalisation of property transactions; (ii) facilitating assettransfers; (iii) revitalising the property market; (iv) facilitating access to bank credits;
PPP$40 001 – PPP$10 000 000
PPP$23 001 – PPP$40 000
PPP$12 001 – PPP$23 000
PPP$8 001 – PPP$12 000
PPP$5 001 – PPP$8 000
PPP$3 601 – PPP$5 000
PPP$2 401 – PPP$3 600
PPP$1 601 – PPP$2 400
PPP$801 – PPP$1 600
<PPP$800
- - - Average annual household income needed for the cheapest newly built house by a formal developer, 2017 Average annual household income using expenditure, 2017 (PPP$)
BENIN
Annual income profile for rural and urban households based on consumption (PPP$)
No. of households (thousands)
PPP$10 543
PPP$22 244
Rural Urban250 200 150 100 50 0 50 100 150 200 250
Population: 11 175 692
Urbanisation rate: 3.77%
Cost of cheapestnewly built house:
8 900 000 CFAPPP$41 843
Urban householdsthat could afford thishouse with finance:
8.97%
1 PPP$: 212.7 CFA franc
Source https://www.cgidd.com/

72
(v) developing the Benin mortgage market; and (vi) eliminating the undervaluationof properties. Likewise, a first revision was introduced to the 2013 Land Code inMay 2017 to clarify some of its provisions and ease its implementation. One ofthe most important changes pertains to the replacement of the certificate of landownership by the title deed, which is more aligned with the Organization for theHarmonization of Business Law in Africa (OHADA) Treaty.
OpportunitiesBenin is one of the most stable democracies in Africa, with a strongmacroeconomic environment and solid institutions and regular elections since1990. People in Benin take pride in owning their house. The governmentestimated the demand for housing at about 320 000 units for the period 2010-2020 and has taken steps to respond to such demand by initiating several housingprogrammes in the past. Unfortunately, these programmes failed to deliver ontheir promises. The new government, which took office in April 2016,demonstrates the same commitment and has launched an ambitious programmewith the goal of delivering 20 000 economic and social housing units by 2021. Thegovernment has also taken significant steps to strengthen land security andproperty rights by, among other things: (i) revising the 2013 Land Code tostrengthen land titling; (ii) taking several measures to ease land propertyregistration which is now free of charge; (iii) improving the institutional framework,with the creation of new institutions for land administration (the ANDF), includingat the decentralised level (the BCDFs); and (iii) launching the development of anational cadastre under the administration of the ANDF.
At the regional level, access to housing finance will improve with the launching ofUS$150 million International Development Association (IDA)-funded project,which will increase access to housing finance for households with modest revenues.Despite these new developments, Benin’s real estate developers’ market is still inneed of intervention. The housing development market in Benin is almostuntapped, thus presenting opportunities for developers and financiers, especiallyin a context where the government is under pressure to mobilise the requiredresources and deliver 20 000 economic and social housing units in the next 30months.
SourcesAfrican Development Bank (2018). African Economic Outlook 2018: BeninCountry Profile.
BCEAO (2015). Note d’analyse sur les conditions de financement de l’habitatdans les pays de l’UEMOA.
BCEAO (2017). edenpub.bceao.int/ (Accessed 20 August 2018).
BCEAO (2018). Annuaire Statistique 2017. BCEAO: Dakar, August 2018.
BCEAO (2018). Principaux Indicateurs des SFD de l’UMOA au 31 mars 2018.BCEAO: Dakar, Mars 2018. https://www.bceao.int/sites/default/files/2018-04/Indicateurs%20%C3%A0%20fin%20d%C3%A9cembre%202017.pdf(Accessed 20 August 2018).
BCEAO (2018). Annuaire des Banques et Etablissements Financiers de l’UMOA2017. BCEAO: Dakar, Août 2018. https://www.bceao.int/sites/default/files/2018-08/Annuaire%20des%20banques%20et%20%C3%A9tablissements%20financiers%20de%20l%27UMOA%202017.pdf (Accessed 20 August 2018).
Boko, J. (Unpublished 2011). Access to Housing Finance in Africa: Exploring theIssues. (No 15. Benin Republic). Study commissioned by FinMark Trust withsupport from the African Union for Housing Finance.
Finclusion.org (2018). Benin. finclusionlab.org/country/Benin (Accessed19 August 2018).
Global Service Immo (2018). “Villas modernes de type F2 – 40 m2”.http://www.globalserviceimmo.com/images/VILLAS_F2_de_40m_2.pdf(Accessed 20 August 2018).
United Nations, Department of Economic and Social Affairs, Population Division(2017). World Population Prospects: The 2017 Revision.
World Bank (2018). Doing Business 2018: Reforming to Create Jobs.Washington, DC.
Websiteswww.bceao.int simaubenin.com www.gcitt.com www.benin-immo.org www.globalserviceimmo.com www.immobenin.com www.wcphouseresort.comwww.beninfoncier.bj andf.bj/index.php
1 AfDB (2018). African Economic Outlook 2018: Benin Country Profile. Pg. 2. 2 AfDB (2018). African Economic Outlook 2018: Benin Country Profile. Pg. 128.3 United Nations, Department of Economic and Social Affairs, Population Division (2017). World Population Prospects: The 2017 Revision.4 Only the Bank of Africa and Benin Housing Bank formally offer mortgages. However, several of them offer products close to mortgages. 5 BCEAO (2018). Annuaire des Banques et Etablissements Financiers de l’ UMOA 2017. BCEAO: Dakar, Août 2018. Also author’s compilations and calculations.6 All conversion of CFA Francs to US$ are based on the conversion rate of US$ 1 = CFA Francs 574.39, as of 19 August 2018 on coinmill.com. 7 BCEAO (2017). edenpub.bceao.int/ (Accessed 20 August 2018). Also author’s calculation.8 Finclusion.org (2018). 9 BCEAO (2015). Note d’analyse sur les conditions de financement de l’habitat dans les pays de l’UEMOA. Pgs. 12, 15 and 17.10 This excludes affiliated micro savings institutions.11 BCEAO (2018). Principaux Indicateurs des SDF de l’UMOA au 31 décembre 2017. BCEAO: Dakar, Mars 2018. 12 The government has changed the prices once in 2011. Since then those prices remained the same to keep them “affordable” to low income households.13 Global Service Immo (2018). “Villas modernes de type F2 – 40 m2”.

Africa Housing Finance Yearbook 2018
73
Commercial banks in Botswana are small by international standards. There are10 commercial banks, namely, Barclays, Standard Chartered, Stanbic, First NationalBank, Bank Gaborone, Bank of Baroda, Capital Bank, BancABC, State Bank of Indiaand Bank of India. In addition, there are two other deposit-taking institutions,including a statutory bank, the Botswana Savings Bank (BSB), and the BotswanaBuilding Society (BBS), and a non-deposit taking development finance institution,the National Development Bank (NDB). Most of the banks, as well as BSB, BBSand NDB, offer long-term residential mortgages.
The average interest rate on household mortgages from banks is 8.81 percent,and the average down payment required is 10 percent of the value. Mortgagesare available for up to 25 years, or up to the age of 60 years. Mortgages aretypically provided at an interest rate of prime to prime plus six percent (the primerate is currently 6.5 percent).
Annual growth in commercial bank credit fell from 6.9 percent in 2015 to5.4 percent in 2016, before falling further to 5.1 percent in 2017, mainly due to a
OverviewBotswana is a country in Southern Africa, with a population of just over two millionpeople. It mainly depends on mining and natural resources, especially diamondsand tourism. In the past, Botswana has been one of the fastest growing economiesin the region. The global financial crisis of 2008/09 had a major impact ondiamonds and other exports, leading to a contraction in GDP of 7.7 percent in2009. However, the economy recovered and grew on average by 6.9 percent ayear from 2010-2014. In 2015, the economy contracted by 1.7 percent due toweak diamond sales, but recovered in 2016, recording real growth of 4.3 percent,supported by improvements in diamond sales. The economy is forecast to growby 4.7 and 5.3 percent in 2017/18 and 2018/19 respectively.
Inflation remained low in 2017, finishing the year at 3.0 percent, which is the lowerend of the Bank of Botswana’s inflation objective range of 3.0 to 6.0 percent. Tohelp boost growth, the bank rate was reduced by 50 basis points in October2017 from 5.5 percent to 5.0 percent. This is expected to help boost economicgrowth. Two major developments in 2017 were the launch of the Vision 2036,which succeeds Vision 2016, and the launch of the Botswana SustainableDevelopment Goals (SDGs). Vision 2036 is aligned to the SDGs and bothdocuments aim for a Botswana with decent, affordable housing and economicopportunities for all. Thus, the implementation of programmes and policies aimedat achieving the objectives of Vision 2036 and SDGs is expected to improve theperformance of the property market in Botswana.
Botswana is increasingly urbanised, with approximately 65 percent of thepopulation living in settlements officially classified as urban, and almost a quarterliving in the greater Gaborone area.
Access to financeAccess to finance in Botswana is relatively high by African standards but consideredlow globally. This is especially so considering the country’s relatively high levels ofGDP per capita (US$7 674 in 2017). According to the third FinScope surveyundertaken in Botswana in 2014,1 68 percent of the population was financiallyserved, using either formal and/or informal products, while 50 percent of thepopulation was formally banked, and 24 percent was financially excluded (not usingeither formal or informal financial products). This notwithstanding, a 2017 studysuggests that Botswana is among the African countries with high access to finance.2
BotswanaKEY FIGURES
Main urban centresGaboroneFrancistown
Exchange rate: 1 US$ = [a] 12 Jul 2018PPP Exchange rate (Local currency/PPP$) 1 Pula = [b]Inflation 2016 [a] | Inflation 2017 [a] | Inflation 2018 [a]
10.27 Pula4.502.7 | 3.1 | 3.1
Population [c] | Urban population size [c]Population growth rate [c] | Urbanisation rate 2017 [b]Percentage of the total population below National Poverty Line [d]Unemployment rate [c]
2 024 787 | 1 214 8722.00% | 2.30%16.30%18.0%
GDP (Current US$) 2017 [a] | GDP growth rate annual 2017 [a]GDP per capita (Current US$) 2017 [c]GNI per capita (Current US$) 2017 [b]Gini co-efficient 2017 [b]HDI global ranking 2017 [d] | HDI country index score 2017 [d]
US$17 538 million | 2.3%US$7 781US$6 82061.00108 | 0.700
Is there a deeds registry? Number of residential properties that have a title deed Lending interest rate [e]Mortgage interest rate [e] | Mortgage term (years) [e]Downpayment [e]Mortgage book as a percentage of the GDP [f]Estimated number of mortgages [f]Price to Rent Ratio in City Centre | Outside City Centre Gross Rental Yield in City Centre | Outside City Centre Construction as a % of GDP [c]
Yesn/a8.42%8.42% | 2510%8.00%17 500n/a | n/an/a | n/a7.50%
What is the cost of standard 50kg bag of cement? What is the price of the cheapest, newly built house by a formaldeveloper or contractor? (Local currency) [g]What is the price of the cheapest, newly built house by a formaldeveloper or contractor? (US$) [g]What is the size of this house (m2)? [g]What is the average rental price for this unit (US$)? [g]What is the minimum stand or plot size for residential property?
US$5.36
556 740 Pula
US$54 21067m2
US$340400m2
Ease of Doing Business Rank [h]Number of procedures to register property [h]Time to register property (days) [h]Cost to register property (as % of property value) [h]
81427 days5.00%
NB: Figures are for 2018 unless stated otherwise.
[a] Bank of Botswana[b] World Bank World Development Indicators[c] Statistics Botswana[d] UNDP Development Indicators[e] First National Bank Botswana[f] Econsult Botswana - 2017 Economic Review[g] Botswana Housing Corporation[h] World Bank Doing Business
Member organisations of the African Union for Housing Finance (AUHF):Botswana Building SocietyBotswana Housing Corporation

74
decline in growth of lending to households. As at December 2016, the share ofhousehold credit in total private commercial bank credit was 60.1 percent. Bankmortgage lending to households grew by 5.3 percent in 2017, down from5.5 percent in 2016. There are an estimated 17 000 mortgages from banks inBotswana, with an average size of approximately P750 000 (US$75 000), plusanother 5 500 from BBS. The banks have been keen to extend mortgage lendingand compete on loan-to-value ratios, sometimes offering more than 100 percentto provide a contribution to property transfer fees and minimise the depositrequired from borrowers.
On the supply side, growth in loanable funds has been weak in recent years, whichsuppressed credit growth through tighter lending conditions. The slowdown inmortgage lending appeared to be consistent with other indications for slowergrowth in incomes.
In a sign of slowing growth in the banking sector, the ratio of commercial bankassets to nominal GDP declined from 53 percent in 2015 to 48 percent in 2016,and declined further to 46.3 percent in 2017.
Government assists Botswana citizens to purchase or develop properties byguaranteeing 25 percent of each mortgage delivered through the BBS. In addition,government employees can obtain housing loans from BSB.
Botswana has a large microlending industry, which provides short- to medium-term loans, mostly to those employed in the public sector. Although there arecases when loans from microlenders have been used to purchase land, such loanshave generally been used to finance consumer spending, education expenses andemergencies. The largest microlender is Letshego, which has expanded from itsBotswana base to 10 other African countries. There is no specialised housingmicrofinance. However, Letshego has a dedicated housing finance scheme, incollaboration with Debswana, a major mining company, which offers loans fromP80 000 (US$7 804) upwards, repayable over 10 years at an interest rate of17 percent.
Botswana has a large pensions sector, with total assets equivalent to approximately45 percent of GDP, almost as large as those of the banking sector. Approximately62 percent of pension fund assets are held offshore. Pension-backed housing loansare legally permissible; however, the industry is rather conservative and in practicedoes not provide members with housing loans or allow third party loans securedby pensions.
AffordabilityTwenty percent of adults in Botswana do not earn an income, while another thirdearn less than P500 (US$48.7) a month.3 Approximately half of urban households(49 percent) have only one income earner; in 28 percent of households there aretwo income earners, and in 15 percent there are three or more income earners.Approximately eight percent of urban households and 13 percent of ruralhouseholds have no income earners.
The most recent nationwide household income and expenditure survey, carriedout in 2009/10, showed that approximately 50 percent of households then had amonthly consumption expenditure of P1 600 (at that time, approximatelyUS$240) or less. Using a benchmark that housing costs should not exceed40 percent of household income, and updating these survey results to reflectgrowth and inflation to 2017, an average household can afford to spendapproximately P1 067 (US$104) a month on housing – meaning that half of allhouseholds can afford less than this. Even if formal mortgages were available tosuch households, there is no affordable property that is available to them – or atleast not property that would be acceptable security to mortgage lendinginstitutions. Mortgages from banks and other formal financial institutions wouldonly be relevant to the top 25 percent of the income distribution. Banks alsoprefer to finance the purchase of ready-built structures rather than providing loansfor housing construction.
Housing affordability for households in the lower 50 percent of the incomedistribution is a major challenge in Botswana. Such households cannot afford amodern, completed house, even at the lower end of the market, and hence arerestricted to informal or semi-formal, incremental housing.
Hence government support for low income housing is a crucial issue, and variousforms of subsidies are provided. These include the Home Improvement Loan,Turnkey Housing, the Integrated Poverty Alleviation and Housing programme, thePublic Officers Housing Initiative (POHI), the Instalment Purchase Scheme (IPSTenant Purchase Scheme) and Youth Housing (all under the Ministry ofInfrastructure and Housing (MIH). In addition, the Self-Help Housing Agency(Ministry of Local Government) provides subsidised serviced plots. Of particularinterest is the Youth Housing Scheme which provides high-density and multi-residential units for the youth and first-time homeowners earning between P3 000(US$292) and P7 000 (US$682.50). The first 750 units are currently beingconstructed in Gaborone.
Home improvement loans are made available by government to low andmoderate income households (those earning between P367 (US$35.7) andP4 300 (US$419) a month), up to a value of P60 000 (US$5 850), repayable over20 years at P250 (US$24.2) a month, interest free. Repayment on this loan hasnot been good, however, and the capacity to enforce repayment is limited. Giventhe high level of subsidy entailed, demand is high, and supply is limited by theavailability of funding (approximately 1 000 loans are available each year).
Government also provides housing through the turnkey scheme. The standarddwelling is a “two and a half ” house, comprising two rooms (bedroom/living room),toilet/bathroom and a cooking area, including basic electrical fittings and runningwater. Beneficiaries receive an interest-free loan of P90 000 (US$8 780.5),repayable at P375 (US$36.5) a month over a period of 20 years. The houses areconstructed by the government-owned Botswana Housing Corporation (BHC)at a cost to government of P123 000 (US$12 000). Income qualification criteriaare the same as for the home improvement loan, and applicants should alreadyown a residential plot. The initial subsidy of P33 000 (US$3 219) plus the interestfree nature of the loan means that the effective subsidy rate is very high. Thenumber of turnkey housing loans provided by government is limited toapproximately 1 000 a year countrywide, and the waiting list is currently 4 452.There are calls to increase the value of this facility, in part due to increases inconstruction costs.
Under the Integrated Poverty Alleviation and Housing Programme, low incomehouseholds are assisted to establish brick making projects and can use the moneyearned and skills learnt from these projects to construct their own houses. Otherinitiatives to provide housing for low income households include the DestituteHousing Programme and the President’s Housing Appeal. These initiatives are alltargeted at remote area communities or settlements.
The MIH has commissioned a national housing needs assessment to guide futurehousing provision and policy, which was expected to be completed before theend of 2017. The results of this assessment are yet to be made public.
Housing supplyAccording to the 2011 Population and Housing Census, traditional housing unitsdecreased from 64 percent to 13 percent of the total between 1991 and 2011.Most Batswana traditionally maintained three residences – in a village/city/town,at the “lands” (for arable agriculture) and at the cattle post; however, the coreresidence is in the villages or cities/towns. The type of housing structure is evenchanging at the lands and cattle post, mostly because of the durability of thematerials used for a modern house.
According to the Population and Housing Census there were 550 846 housingunits in Botswana in 2011. Out of these, 357 567 were in urban areas and 193 379in rural areas. The average household size in Botswana has been declining overthe years, from 5.5 in 1981 to 3.7 in 2011; many are single member households(27.8 percent).
The BHC, established in 1971, is the primary housing developer in Botswana.Historically it provided for the housing needs of government, local authorities andthe general public by providing rental housing, although in recent years it has alsobeen offering houses for sale. BHC has a large estate of flats and town houses,with a mix of high, medium and low income houses spread throughout the country,with concentrations in Gaborone and Francistown. BHC’s smallest housingproduct is a 58m2 house on a plot of 400m2 or larger. Such a house would typically

Africa Housing Finance Yearbook 2018
75
be priced from P600 000 (US$58 422) upwards. BHC suggests that the minimummortgage instalment for such a house is P5 500 (US$536), which means that ahousehold would have to earn at least P13 750 (approximately US$1 317) amonth for this to be affordable – which would imply a household in the top10 percent of the national income distribution. The rentals charged by BHC fortenanted accommodation are subsidised – as a matter of government policy –but even so, BHC properties are still more suited to the formally employed thanlow income households.
In April 2012, the BHC’s mandate was expanded to operate as government’s singlehousing authority. As a result, BHC is now also responsible for the constructionof turnkey housing units and is in charge of implementing the POHI, the IPS andYouth Housing. In 2017, a total of 1 924 houses were started by BHC and1 889 delivered. The highest number of houses delivered was turnkey houses at1 376 houses followed by POHI at 177. About 372 IPS houses were started in2016, however, they have not been delivered. The IPS targets the youth and middleincome groups with monthly incomes of P3 000 (US$292.5) to P7 000(US$682.5).
Besides the BHC, few private sector developers are providing housing for sale.Indicative prices are that building costs for a 60m2 house would be betweenP4 000 and P5 000 a m2 (US$390-US$487), with a total cost of P240 000-P300 000 (US$23 414-US$29 268). The cost of land servicing (providing basicroads, water, electricity and water-borne sewerage connections) varies by location,but is typically in the range of P200-P300 (US$19.5-US$29.3) a m2. However,housing provision by private developers is typically aimed at upper middle andhigh income households, with incomes of P10 000 (US$975) a month or more.
Homeownership is important to Batswana, and the 2011 Census data shows that57 percent of housing units were owner-occupied. Most of the remainder wererented privately, but approximately a quarter of rented accommodation wasprovided by government or its agencies.
Land tenure in Botswana is divided into three types: (i) freehold; (ii) state land; and(iii) tribal land. Freehold land can be freely bought and sold (although with somerestrictions on the purchase of freehold agricultural land by non-citizens). Whilestate land and tribal land cannot be bought and sold, leasehold tenure is available.State land leases are freely marketable, while tribal land leases are generally onlyavailable to citizens. Every Botswana citizen is entitled to a residential plot ontribal land. Such plots are available either free (for unserviced land) or at a heavilysubsidised price (for serviced land); for instance, a serviced Self Help HousingAgency plot in urban areas is sold for P15-P22 a m2, compared to a servicing costof approximately P350 a m2. In addition, citizens are entitled to free land foragricultural purposes. This system means that there are very few, if any, landlessBatswana. However, not all land is equal, and there is excess demand for subsidisedresidential plots in or around urban areas, especially close to Gaborone, whereas
residential plots are readily available in smaller and more distant villages. TribalLand is administered by statutory Land Boards. The (theoretical) availability ofsubsidised land means there are long waiting lists for tribal plots in peri-urbanareas. However, this does not necessarily represent genuine demand for housingplots, rather the fact that those who are lucky enough to obtain such plots canre-sell them at a substantial profit. In fact, many of land applications are forspeculative purposes, where plots are sold once an allocation is made.
In addition to the BHC, there are also private developers, the biggest beingPremier Properties, Universal Estates, Sheldon Properties and Time Projects. Forexample, Time Projects reports that the company purchased 55ha of land in theearly 1990s in the south of Gaberone and designed the residential suburb knownas Kgale View thereon.4 The project was completed within budget and substantiallyahead of schedule. Time Projects installed the infrastructure for 800 plots andconstructed 400 houses purchased by government. Private sector housing waslater developed on the remaining 400 plots. The contribution of privatedevelopers to the supply of housing in Botswana is summarised by a 2013 studyby University of Pretoria scholars, which concludes that the performance of privatedevelopers has been generally good with annual turnover of those companiesinterviewed averaging between P5 million(US$47 000) and P10 million(US$98 000).5
Property marketsMost residential property is built for owner occupation. However, residentialproperty has also been seen as a good investment by both commercial investorsand individuals. There is a significant build-to-let market, extending from high cost(upmarket) housing down to small, low cost, one-room accommodation forindividuals. Commercial investors provide only upmarket accommodation,whereas individuals operate across the entire spectrum. High rates of rural-urbanmigration and rising urbanisation have fuelled the demand for rentedaccommodation. Buying and selling property is still relatively unusual. Accordingto the 2009/10 Botswana Core Welfare Indicators Survey, 50 percent ofhouseholds lived in self-built accommodation, while 42.5 percent lived in rental orinstitutional accommodation. Only 3.3 percent of households lived in a housethat they had bought. The small number of residential mortgages – approximately17 000 in 2016, out of approximately 500 000 households in the country – reflectsthe limited size of the formal property market. Secondary property markets arelimited by the shortage of stock that can be mortgaged, a preference for self-builtaccommodation (which sometimes is not of an adequate standard to bemortgaged), as well as more generally by slowing economic growth and the highrate of unemployment. At present there is no comprehensive nationwide landand property registry.
In an effort to increase tenure security and support enhanced access to mortgagefinance, the government is implementing a nationwide land registration system,the Land Administration Procedures Capacity and Systems, to improve information
PPP$40 001 – PPP$10 000 000
PPP$23 001 – PPP$40 000
PPP$12 001 – PPP$23 000
PPP$8 001 – PPP$12 000
PPP$5 001 – PPP$8 000
PPP$3 601 – PPP$5 000
PPP$2 401 – PPP$3 600
PPP$1 601 – PPP$2 400
PPP$801 – PPP$1 600
<PPP$800
- - - Average annual household income needed for the cheapest newly built house by a formal developer, 2017 Average annual household income using expenditure, 2017 (PPP$)
BOTSWANA
Annual income profile for rural and urban households based on consumption (PPP$)
No. of households (thousands)
PPP$42 749
PPP$20 817
Rural Urban80 60 40 20 0 20 40 60 80
Population: 2 024 787
Urbanisation rate: 2.30%
Cost of cheapestnewly built house:
556 740 BWPPPP$123 720
Urban householdsthat could afford thishouse with finance:
19.97%
1 PPP$: 4.5 Pula
Source https://www.cgidd.com/

76
on land and property ownership. All plots in tribal land have been surveyed anddata capturing is ongoing. Different land boards nationwide are at different stagesof completing data capture.
Policy and regulationSeveral reforms have taken place to improve the land administration system. Inthe 2017 Doing Business review, Botswana improved in getting constructionpermits, which had previously been subject to lengthy processes and delays. It’sDistance to Frontier improved by 0.7 points from 72.20 in 2017 to 72.27 in 2018.The adoption of the 2015 Land Policy also helped with land transfers andconversion from tribal to common law land as required for mortgage lending. Theprinciple of “one person one plot” was revived, to improve the distribution of landownership. This meant an individual is only entitled to be allocated a plot once bythe land boards on tribal land (although they can purchase additional land on theopen market). Botswana has several policies and acts for land management andadministration. The main policies are the National Settlement Policy (1998), theNational Policy on Housing (2000), Revised National Policy for Rural Development(2002) and Land Policy (2015). The only recent Act related to land and housingis the Sectional Titles Act (2003), which provides for the division of buildings intosections for the acquisition of separate ownership of building blocks.
OpportunitiesBotswana has a relatively stable, well-managed economy that has shown significantgrowth over the past few years. Finance for self-built housing still offers significantprospects for growth, due to this being the preferred method of building, evenamong the middle and higher income categories. Mortgage lending has beenincreasing, and while there is limited demand given low income levels, it also haspotential for growth, given the introduction of new programmes such as theimplementation of SDGs and the eleventh National Development Plan (NDP 11).Interest rates are low by historical standards, which assists with access tomortgages. However, most households will never be able to access conventionalmortgage finance, and there is potential to explore and develop microfinanceopportunities. In addition, the implementation of the NDP 11, SDGs, Vision 2036and the performance of private developers also provide impetus for broadereconomic growth and that of the housing sector.
The state has recognised the need to reform in key areas, such as landadministration, and is also meeting the costs of land servicing in many areas. Thereis demand for student accommodation and low cost housing in urban areas dueto the high levels of urbanisation. However, the overriding issue will continue tobe affordability; most households are not able to afford formal housing and areunattractive customers for formal financial institutions. Hence, the majority of lowincome housing is incremental, self-built or informally built, and is contingent onaccess to free unserviced land or subsidised serviced land. In this situation, thedemands on government to provide housing subsidies in one form or anotherare high, and potentially very expensive, and hence need to be provided on arational, analytically sound basis. At present, access to subsidised housing isdetermined by various rationing mechanisms, but there is a need for a moreefficient mechanism to deliver targeted housing subsidies.
SourcesBabajide Fowowe (2017). Access to Finance and Firm Performance: Evidencefrom African Countries, Review of Development Finance, Volume 7, Issue 1, June2017. Pgs. 6-17.https://www.sciencedirect.com/science/article/pii/S1879933717300106(Accessed 20 Aug 2018).
Bank of Botswana (2016). Annual Report. Bank of Botswana.
Bank of Botswana (2018). Botswana Financial Statistics.http://www.bankofbotswana.bw/assets/uploaded/BFS%20JUNE%202018%20WEBPAGE_1.xls (Accessed 12 July 2018).
Botswana Housing Corporation (2017). Annual Report.http://www.bhc.bw/sites/default/files/BHC%20Annual%20Report_2017%20%28web%29.pdf (Accessed 16 August 2018).
Econsult Botswana Economic Review (2015). “Housing Finance in Botswana”.http://housingfinanceafrica.org/app/uploads/Econsult-Review-2015-2nd-quarter-final.pdf (Accessed 10 July 2018).
Government of Botswana (2015). Botswana Land Policy 2015. GovernmentPrinters.
Government of Botswana (2016). Vision 2036 - Achieving Prosperity for All.Government Printers.
Government of Botswana (2016). National Development Plan 11 (April 2017 –March 2023). Government Printers.
Mutsonziwa, K, Motsomi A, and Khumalo J. (2014). “FinScope Consumer SurveyBotswana 2014.” http://www.finmark.org.za/wp-content/uploads/2015/07/Brochure_FS_Botswana_2014_Consumer1.pdf(Accessed 10 July 2018).
Non-Bank Financial Institutions Regulatory Authority. (2017). Annual Report.https://www.nbfira.org.bw/annual-report-2017-0 (Accessed 11 July 2018).
Statistics Botswana (2011). 2011 Population and Housing Census.http://www.statsbots.org.bw/sites/default/files/2011%20Population%20and%20Housing%20Census%20%28Results%29.pdf (Accessed 10 July 2018).
1 FinMark Trust released the results of its third FinScope Consumer Botswana 2014 survey results on 14 July 2015. The FinScope Survey, developed by FinMark Trust, is a research tool to assess financial access in a country and to identifythe constraints that prevent financial service providers from reaching the financially under- and unserved people.
2 Babajide Fowowe (2017). 3 Mutsonziwa, K, Motsomi A, and Khumalo J (2015). 4 Time Projects (2018). Building Botswana for 30 years. https://www.time.co.bw 5 Kachepa S, Pienar J, and Boshoff D (2013). “Urban Housing Provision In Botswana: A Critical Analysis of Gaborone”, 2nd Virtual International Conference on Advanced Research in Scientific Fields, University of Pretoria.

Africa Housing Finance Yearbook 2018
77
Senegal and Togo). The financial sector of Burkina Faso is dominated by 13commercials banks and five credit institutions as reported by BCEAO in 2018.8
Access to finance in the country is improving - almost 43 percent of the country’spopulation over the age of 15 have a bank account, compared to 14 percent in2014. Twelve percent have savings and 10 percent have loans as stated in GlobalFindex 2018.9 There are 62 Financial Service Providers listed on the MIX Market,an online repository of microfinance performance data and analysis, with US$232million worth of loans dispersed to 204 000 active borrowers, US$280 milliondeposits and 1.434 million depositors in 2018. La Faitiere des Caisse populairesor Réseau des Caisses Populaires du Burkina (RCPB) remains the leader with agross loan portfolio of US$175.5 million, gross deposits of US$253.15 million,80 700 active borrowers and 1 159 190 depositors.10
The Housing Bank of Burkina Faso (Banque de l’Habitat du Burkina Faso, or BHBF)started operating in 2006; it was created to facilitate access to housing finance forlow and middle income earning households. At the end of 2016, BHBF’sshareholding was as follows: national institutions represented 49.5 percent,international institutions 25.33 percent, and other private banks held 25.11 percent.The bank offers two types of mortgages for public and private sector workers:
OverviewBurkina Faso is a landlocked country in West Africa and is a member of the WestAfrican Economic and Monetary Union (UEMOA). It has a population of 20.2million people1 and is one of the least urbanised countries in the world. BurkinaFaso is recovering from a turbulent political and social environment, which slowedthe rate of economic growth in 2014-2015. The country’s economic prospectsfor 2017 and 2018 are good. The real growth rate is estimated at 6.7 percent in2017 and 6.6 percent in 2018 due to a major public investment programme inthe 2016-2020 National Economic and Social Development Plan (NESDP) orPlan National Du Développement Economique Et Social (PNDES) which coversenergy, hydro-agricultural development, roads and telecommunication. Inflation isexpected to remain below 2 percent in 2018-2019 and higher prices forcommodities are projected to boost the economy. Strong political support forpublic investment programmes under the PNDES will contribute to a robusteconomic recovery.2 Notwithstanding these prospects, there are socio-politicalthreats due to terrorist activities, which are a challenge to the national budget.The economic prospects depend on the ability of the government to fosterpolitical peace, ensure institutional stability, and curtail threats from religiousextremists especially after a series of terrorist attacks in 2016 and 2017.3
Nevertheless, Burkina Faso’s cities are growing. The urbanisation rate is estimatedat 31.5 percent in 2016 with an urban population that grows twice as fast as thenational population. Some 62 percent of the population live in the regions ofOuagadougou and Bobo-Doulaso, resulting in the growing shortage of housingand the proliferation of squatter housing.4 According to the National Institute ofstatistics, more than 72 percent of households live in unplanned areas.5 Inequalitypersists, and poverty remains high although the poverty rate decreased from 46.7percent in 2009 to 40.1 percent in 2014.6 This is a challenge that Burkina NESDPis addressing. Th Plan aims to improve the living environment, access to water,sanitation and good quality energy services. Planned and controlled access todecent housing and public buildings is guaranteed for all.7 Currently, thegovernment is accelerating construction of 40 000 units of social housing, andpromoting structural reforms to improve the business environment and increaseaccess to finance, particularly housing finance.
Access to financeBurkina Faso is part of the Central Bank of West African States (BCEAO), whichincludes seven other countries (Benin, Côte d'Ivoire, Guinea Bissau, Mali, Niger,
Burkina FasoKEY FIGURES
Main urban centres Ouagadougou
Exchange rate: 1 US$ = [a] 21 Sept 2018PPP Exchange rate (Local currency/PPP$) 1 CFA franc = [b]Inflation 2016 [c] | Inflation 2017 [c] | Inflation 2018 [c]
556.98 CFA franc208.90-0.25 | 0.40 | 2.00
Population 2017 [b] | Urban population size 2017 [b]Population growth rate 2017 [b] | Urbanisation rate 2017 [b]Percentage of the total population below National Poverty Line 2009 [d]Unemployment rate [e]
19 193 382 | 6 048 0272.89% | 5.54%
40.10%6.3%
GDP (Current US$) 2017 [b] | GDP growth rate annual 2017 [b]GDP per capita (Current US$) 2017 [b]GNI per capita (Current US$) 2017 [b]Gini co-efficient 2014 [c]HDI global ranking 2015 [f] | HDI country index score 2015 [f]
US$12 873 million | 6.74%US$670US$61035.30185 | 0.402
Is there a deeds registry? Number of residential properties that have a title deed Lending interest rate [b]Mortgage interest rate [g] | Mortgage term (years)DownpaymentMortgage book as a percentage of the GDPEstimated number of mortgages [g]Price to Rent Ratio in City Centre | Outside City CentreGross Rental Yield in City Centre | Outside City Centre Construction as a % of GDP
n/an/a5.30%6% | 15n/an/a974n/a | n/an/a | n/an/a
What is the cost of standard 50kg bag of cement? [h]What is the price of the cheapest, newly built house by a formaldeveloper or contractor? (Local currency) [i]What is the price of the cheapest, newly built house by a formaldeveloper or contractor? (US$) [i]What is the size of this house (m2)? What is the average rental price for this unit (US$)? What is the minimum stand or plot size for residential property?
US$10.12
5 500 000 CFA franc
US$9 565n/aUS$500200m2
Ease of Doing Business Rank [j]Number of procedures to register property [j]Time to register property (days) [j]Cost to register property (as % of property value) [j]
148467 days12.00%
NB: Figures are for 2018 unless stated otherwise.
[a] Coinmill.com[b] World Bank World Development Indicators[c] IMF World Economic Outlook Database[d] Central Intelligence Agency (CIA) World Factbook[e] Trading Economics[f] UNDP Development Indicators[g] Central Bank of West African States[h] CAHF Yearbook 2017[i] Agence Ecofin[j] World Bank Doing Business

78
social housing loans (Prêt Immobilier Social) and ordinary housing loans (PrêtImmobilier Ordinaire). They both allow borrowers to purchase land and/or tobuild a home. The Social Housing Loan has some specific requirements: very lowmonthly revenue equal or less than CFA 200 (US$348); a reduced interest rateof 5 percent; and a maturity of up to 20 years. To qualify, the borrower must bea client of BHBF. Borrowers are required to provide a 10 percent downpaymentof the property value and dispose of regular and sufficient revenue forreimbursement. For the ordinary housing loan, the maturity is shorter (15 years)with the possibility of supervising the project and technical assistance from BHBF.The borrowers must have regular and sufficient revenue for reimbursement andpay 20 percent downpayment of the value of the property. The average mortgagedistributed in 2013 cost CFA 48 745 000, the average bond term was 7.8 yearsand the average interest rate was 6.73 percent.11
By 2016, all the commercial banks in Burkina Faso had introduced mortgagefinance in their portfolios as was done by RCPB,12 the biggest microfinanceinstitution in the country. Currently RCPB offers a housing finance product called“Crédit Immobilier”.
Although commercial banks and RCPB offer mortgage products, access remainslimited because the majority of Burkinabes do not have bank accounts and thecommercial banks dispose of short term deposits while mortgages require longterm deposits. The creation of a regional mortgage refinance fund called CaisseRégionale de Refinancement Hypothécaire (CRRH), by UMEOA, is contributingto the development of mortgage activities in the country.
AffordabilityHousing affordability is a major concern for the people and government of BurkinaFaso given the deficit of supply and the economic status of most of the populationwho earn less than US$3.10 a day. The government has, through the nationaldevelopment plan (PNDES), initiated an ambitious housing programme to boosthousing production and employment and stimulate the country’s economicgrowth. Currently only about 14.5 percent of households, representing the well-off population, have access to property in the main cities with most housingdelivery and finance products designed for their needs. However, lower incomehouseholds struggle. To be eligible for government-subsidised housing, a personmust earn between one to eight times the minimum wage for employees in theformal sector, CFA 30.648 (US$ 53).13 Government-subsidised housing is deliveredat the minimum housing standard defined by ministerial decree as includingresidential space of at least 9m2 and some sanitary provision. This costsapproximately CFA 5.5 million (US$9 565),14 but even this is out of reach formost low income households.
The new housing programme, according to M. Maurice Dieudonne Bonanet, theminister responsible for housing, is intended to improve the present situation byoffering a variety of decent and affordable houses for different categories of thepopulation.15 The programme involves 40 000 units to be constructed all overthe country in 351 urban and rural communities. The 40 000 units is in additionto the ongoing project of 14 000 units in Basinko. All Burkinabe including thediaspora are entitled if the criteria of eligibility is met.16
The government expects that the different housing projects and other economicreforms will have a positive impact on the national economy, improve theeconomic status of the majority and boost affordability.
Housing supplyInformal settlements have been growing in Burkina Faso’s main cities, illustratingan undersupply in housing, especially for lower income households. Thegovernment estimates that housing demand is growing by 8 000 units a year inOuagadougou and 6 000 units a year in the country’s second largest city, BoboDioulasso.17 An analysis from 2014 national census and housing surveydemonstrated that 72 percent of households live in unplanned areas. 77 percentof households live in dwellings made of precarious materials.18
The government has been a key promoter of housing delivery for many decades.The Centre for the Management of Cities (Le Centre de Gestion des Cités, orCEGECI) was originally established in 1987 with a mandate to implement thegovernment’s housing objectives. In 2000, this mandate was extended to include
the actual delivery of housing. In 2014 CEGECI was empowered to effectivelycontrol the delivery schedule of government-subsidised houses and the supply ofelectricity and water, and social amenities such as health and recreation centres.The Construction and Real Estate Management Company (Société deConstruction et de Gestion Immobilière du Burkina, or SOCOGIB) was alsoestablished by government, but was privatised in 2001. SOCOGIB still carries onwith its mission to develop land, construct housing, sell and let accommodationand manage properties, and provides technical advice on home improvements.Housing constructed by SOCOGIB, can be considered high quality and comeswith a 10-year warranty on the floor, walls and roof.
Since 2008, the government has developed a multi-year social housingprogramme.19 The delivery target is 10 000 subsidised houses. The programmeinvolves experimentation with local building materials to improve affordability whilemaintaining quality. The programme is funded entirely by the state, with 75 percentof the total delivery cost funded by the Housing Bank and the remaining 25percent funded by CEGECI. To be eligible, a household must not own a plot or ahouse, must have an account at the Housing Bank, and must have worked for lessthan 15 years. Eligible households enter a raffle and names are drawn for thehouses that are available. In July 2013, a draw was held for 1 500 houses deliveredas part of the programme. As from 2014, the programme has gained largepublicity in Cote d’Ivoire where there is a sizeable community of Burkinabenationals (as Burkinabe diaspora is also eligible).
In an effort to improve affordability, the government initiated a series of projectsamong which are the construction of 14 000 affordable houses to accommodate84 000 people in Bassinko, a village situated 15 kilometres from Ouagadougou.Other measures are to accelerate the implementation and completion of all on-going projects which did not meet their delivery schedule. To this end CEGECI,the public institution that implements the government housing objectives, ismandated by the government to take over the management of all the governmenthousing projects and to assure the distribution of the completed houses to theirbeneficiaries.
The government is accelerating the development of the new urban pole ofBassinko. The 14 000 houses mentioned previously will be constructed by differentprivate companies. These companies include: Societe Immobiliere Wend-Pangawhich is building 300 units of one to three bedrooms, prices range from FCFA5.5 million to FCFA 7.5 million (US$9 570 to US$13 050); and CGE Immobilierwhich has a programme of 1 232 units consisting of social, economic, mediumstanding houses ranging from FCFA 8.5 million to FCFA 25.5 million (US$14 790to US$44 370) built on 300 m2 each. The Bassinko project is the second largesthousing project after the “projet de zone commercial and administrative, ZACA”in the heart of city of Ouagadougou, the capital. Eight developers are alreadyimplementing the programme, including P&N Burkina Faso, a subsidiary of P&NHolding Group, a Spanish real estate development company. P&N is producing1 000 bioclimatic houses that range in prices from the minimum FCFA 7.5 million(US$13 050) to maximum of FCFA 12 million (US$20 880). The houses are socialand economic houses with land awarded by the government to the developers;water, and sewage and electricity connection are also provided by the government.The houses are commercialised through the Bank of Habitat and participatingcommercial banks. To date 4 500 have been delivered by different developers inBassinko and the government has invested FCFA 85 billion (US$147.9 million) toupgrade amenities such as land, services, water and electricity installation, roadsand sewage.20
In 2017 the government initiated a new programme of 40 000 houses andapartments in different main cities and urban communities.21 The programme’smain objective is to boost production and affordability. The programme isestimated to total FCFA 348.5 billion (US$606.4 million). The subscription wasfrom 5 April to May 2017.22
The innovation of the programme is that subscription is done online butsubscribers from the communities without internet can register with their citycouncil or community council – this has allowed the reality of need to bemeasured. There have been more than 100 000 subscriptions for more than40 000 units. In May 2018 the government announced that 15 000 servicedplots and 1 260 units out of the 40 000 are ready to be distributed. Eligible

Africa Housing Finance Yearbook 2018
79
households are invited to register for a raffle which will take place in 2018.Registration started on 22 May 2018 and ended 2 June 2018. The units are mainly(Type F3) two bedrooms, one living room, and one bathroom. The price is FCFA7.5 million (US$13 050).23
Property marketsLaw No 014/96/ADP of 23 May 1996 (J.O 1996 NO32) regulates the real estatedevelopment business in Burkina Faso. According to the government of BurkinaFaso, the sector has been growing at a rate of 7.5 percent per year since 2009.
There is no formal market for real estate. Informal developers dominate themarket although there is an emergence of private formal developers. In mostcases, private developers act in partnership with the government to participate inthe construction of different ongoing housing programmes in the country.Although there has been an improvement in accessibility, housing programmes stilltarget primarily Burkinabe senior civil servants and those employed by the formalprivate sector as illustrated by the criteria of obtaining housing loans from banks.Houses developed by the formal sector come with a certificate of ownershipwhich ensures security of tenure.
The rental market is not regulated in Burkina Faso; as a result, a lot of speculationoccurs, especially in the low income zones. A room in a multi-room house in thepopular zone such as Karpala or Patte d’oie goes for FCFA 25 000 – FCFA 40 000(US$44-US$70). A villa in a residential zone costs FCFA 350 000 (US$609) anda luxurious villa costs approximately FCFA 2 000 000 (US$3 480). There is astrong rental market in Ouagadougou although Burkinabes prefer to behomeowners. Purchasing or building a house is not accessible to an averageBurkinabe.
Property prices have risen steadily over the past decade especially in Ougadougouand other urban centres, given an increase in the demand for houses due to therate of urbanisation, growth of non-governmental organisations and otherdevelopment agencies present in Burkina Faso. The growth is projected tocontinue and offers opportunities for the different sectors of real estate,commercial, residential, and industrial.
According to the 2018 World Bank Doing Business Report, Burkina Faso ranksrelatively high in the Dealing with Construction Permits index. The countryimproved its score again and ranked 53rd out of 190 countries, a relatively goodscore in the UEMOA member states. It takes 67 days and four procedures toregister a property in Burkina Faso, and costs 12.1 percent of the property value(above the Sub-Saharan average of 8 percent).
Policy and regulationBurkina Faso’s policy framework dates from the early 1990s, with the adoption ofa new constitution in 1991 and a decentralisation policy in 1995. The nationalpolicy framework, commonly called (RAF) “reorganisation agraire et fonciere”, was
created by “la loi du 23 mai 1996” and enacted by national decree on 6 February1997. Some 49 urban and 350 rural administrative entities were created in thisprocess. In 2009, a national policy on housing and urban development was enactedwith a 10-year plan of action, to 2018. The policy puts an urbanisation strategy atthe centre of its economic growth plans, and explicitly addresses the potential forreal estate development to contribute towards growth. Part Three of the strategyaims to ensure access to comfortable housing for every citizen. The policy aimsto raise awareness of the responsibilities of the private sector as well as to assisthouseholds in building their own housing.
Law NO 103-2015/CNT (Loi N°-103-2015/CNT portant bail d’habitation privéau Burkina Faso)24 proposed during the transition was aimed at regulating theprice of rents; however the law remained non-applicable since 2015. Consideringthe rate of speculation and increases in rental amounts, public opinion is puttingpressure on the government to enact the law by ministerial decree accordinglyand ensure its application.25 The following are other laws with relevance to thehousing sector:
n Law No 014/96/ADP of 23rd of May 1996: Puts an urbanisation strategy inthe centre of the country’s economic growth plans, and explicitly addressesthe potential for real estate development to contribute towards growth.
n Law No 057-2008/AN of 20 November 2008: Promotes real estatedevelopment in the country and regulates property development activities.
n Law 034-2009 (Regime Foncier Rural) Rural Land Tenure: Officially recognisedcustomary rights of land and transfers the management to the localauthorities.
n Law N° 17-2006/AN: Defines the code for urbanisation planning andconstruction in Burkina Faso.
OpportunitiesThe establishment of the Department of Housing and Urbanisation, andconsequently of the Housing Bank of Burkina Faso in 1995, demonstrated thecommitment of government to promote the housing sector and to championhousing for low income earners. The country offers immense opportunities forhousing development, especially for affordable housing, given the economic statusof most of the population. The law 057 of November 2008,26 which promotesand regulates property development activities, is an advantage for developers anda tool for the government to encourage national informal practitioners toformalise and seize the opportunities offered by the government in massconstruction of affordable houses. The different ongoing housing programmesand the latest programme of 40 000 units launched in April 2017 by thegovernment are also opportunities for local and foreign investors and developers.This is a positive sign for housing development and housing finance in BurkinaFaso.
Despite its status as a heavily-indebted country, Burkina Faso has enjoyed stronggrowth in the past few years, largely because of political stability, good
- - - Average annual household income needed for the cheapest newly built house by a formal developer, 2017 Average annual household income using expenditure, 2017 (PPP$)
BURKINA FASO
Annual income profile for rural and urban households based on consumption (PPP$)
Source https://www.cgidd.com/
PPP$40 001 – PPP$10 000 000
PPP$23 001 – PPP$40 000
PPP$12 001 – PPP$23 000
PPP$8 001 – PPP$12 000
PPP$5 001 – PPP$8 000
PPP$3 601 – PPP$5 000
PPP$2 401 – PPP$3 600
PPP$1 601 – PPP$2 400
PPP$801 – PPP$1 600
<PPP$800No. of households (thousands)
PPP$9 598
PPP$8 530
Rural Urban600 400 200 0 200 400 600
Population: 19 193 382
Urbanisation rate: 5.54%
Cost of cheapestnewly built house:
5 500 000 XOF PPP$26 328
Urban householdsthat could afford thishouse with finance:
34.93%
1 PPP$: 208.9 CFA franc

80
macroeconomic management and a diversifying economy. The country isrecovering from political instability since it has organised a peaceful and successfulpresidential and legislative election and the democratic institutions of the countryare in place. Economic prospects for the future are promising with theimplementation of the PNDES and a growth forecast for 6.6 percent in 2018.27
The country needs modern commercial outlets, offices and industrial buildingsbecause of an emerging private sector dominated by small and mediumenterprises. There is also the need to satisfy the demand for affordable and upscaleresidential units for renting. All these needs are opportunities. The Sub-Saharanregion according to Knight Frank offers relatively high yields on real estate.28
In summary, if there is political stability and economic growth, the country’s housingopportunities are promising for the following reasons: a huge demand of affordablehouses to satisfy, an accelerating rate of urbanisation, an increase in middle classrevenues and an ambitious government housing programme.
Additional sourcesAfrican Development Bank (2018). African Economic Outlook 2018.https://www.afdb.org/fileadmin/uploads/afdb/Documents/Publications/African_Economic_Outlook_2018_-_EN.pdf (Accessed 16 Sept 2018).
Government Information Service (2013). Enjeux politiques des lotissements auBurkina Faso : dans la dynamique d’une bonne gouvernance foncière publiée lemardi 8 octobre 2013.
Burkina Faso Ministère de l’Habitat et de l’Urbanisme (2008). Politiquenationale de l’habitat et du développement urbain.
BCEAO (2016). Annuaire des Banques et Etablissement Financiers de l’UEMOA.
BCEAO (2017). Rapport Annuel de la BCEAO 2017.https://www.bceao.int/sites/default/files/2018-07/Rapport_annuel_2017.pdf(Accessed 11 Sept 2018). Pg. 15.
World Bank (2018). Doing Business: Burkina Faso.http://documents.worldbank.org/curated/en/618741509607914341/pdf/120832-WP-PUBLIC-DC18-BFA.pdf (Accessed 27 Sept 2018).
1 Institut national de statistique et de la démographie. www.insd.bf (Accessed 23 Aug 2018).2 African Development Bank (2018). African Economic Outlook 2018.
https://www.afdb.org/fileadmin/uploads/afdb/Documents/Publications/African_Economic_Outlook_2018_-_EN.pdf (Accessed 16 Sept 2018). Pg. 130.
3 Ibid.4 Burkina Faso (2016-2020). Plan National Du Développement Economique Et Social, PNDES. Pg.6.5 Institut national de statistiques et de la démographie (INSD) (2015). Enquête multisectorielle continue (EMC).
Habitat, assainissement Et accès a l’eau potable. http://www.insd.bf/n/contenu/enquetes_recensements/Enq_EMC/Habitat_Assainissement_et_Acces_a_eau.pdf (Accessed 10 Sept 2018).
6 World Bank Data (2018). Burkina Faso. https://data.worldbank.org/country/burkina-faso?view=chart(Accessed 22 Aug 2018).
7 Burkina Faso (2016-2020). Plan National Du Développement Economique Et Social, PNDES. Pg.6.8 BCEAO (July 2018). Rapport sur les conditions de banque dans l’UEMOA, En 2017.
https://www.bceao.int/fr/publications/rapport-sur-les-conditions-de-banque-dans-luemoa-2017 (Accessed7 Sept 2018). Tableau 2.
9 World Bank (2018). The Little Data Book on Financial Inclusion 2018.https://openknowledge.worldbank.org/handle/10986/29654 (Accessed 18 Sept 2018). Pg. 38.
10 Mix (2018). Burkina Faso. https://www.themix.org/mixmarket/countries-regions/burkina-faso (Accessed24 Aug 2018).
11 BCEAO (2014). Notes d’Analyse sur les Conditions de Financement Bancaire de l’Habitat dans les Pays del’UEMO. 31 Oct 2014. https://www.bceao.int/fr/publications/note-danalyse-sur-les-conditions-de-financement-bancaire-de-lhabitat-dans-les-pays-de (Accessed 16 Sept 2018). Tables 2 and 3.
12 Reseau des Caisses populaires du Burkina (2018). “Nos produits d'épargne.”https://www.rcpb.bf/en/produits-services/produits-d-epargne (Accessed 10 Sept 2018).
13 Labourepresse (2017). “Burkina Faso : mécanismes de calcul du montant de la pension retraite à la CNSS."28 June 2017. http://www.laborpresse.net/burkina-faso-mecanismes-de-calcul-du-montant-de-la-pension-retraite-a-la-cnss/ (Accessed 10 Sept 2018).
14 Happy in Africa! (2017). “Burkina Faso : des logements pour tous.” 28 Oct 2017.https://happyinafrica.com/business-fr/burkina-faso-logements (Accessed 10 Sept 2018).
15 Ibid.16 Les Echos du Faso (2017). “Programme de construction de 40 000 logements: 27 198 burkinabè se sont
déjà inscrits.” 21 April 2017. http://lesechosdufaso.net/programme-de-construction-de-40-000-logements-27-198-burkinabe-se-sont-deja-inscrits/ (Accessed 10 Sept 2018).
17 Ministère de l’Urbanisme et de l’Habitat: 10 000 logements (2018). http://www.mhu.gov.bf/index.php/2014-09-18-15-34-51/nos-projets/10-000-logements (Accessed 11 Sept 2018).
18 Institut national de statistiques et de la démographie (INSD) (2015). Enquête multisectorielle continue(EMC). Habitat, assainissement Et accès a l’eau potable.
19 Lefaso.net (2017). “Urbanisation et habitat au Burkina : Le ministre Dieudonné Maurice Bonanet fait le pointde la politique étatique.” 11 Dec 2017. http://lefaso.net/spip.php?article80893 (Accessed 16 Sept 2018).
20 Happy in Africa! (2017). “Burkina Faso : des logements pour tous.” 28 Oct 2017.21 “Entretien avec le ministre de l’urbanisme et de l’habitat: Relever le défi du logement au Burkina.” 5 Jan 2018.
http://www.me.bf/fr/content/entretien-avec-le-ministre-de-l%E2%80%99urbanisme-et-de-l%E2%80%99habitat-relever-le-d%C3%A9fi-du-logement-au (Accessed 10 Sept 2018).
22 “Du 5 avril au 5 mai 2017 lancement de la campagne de souscription pour les 40.000 logements.” 3 April2017. https://www.faso-actu.net/actualites/du-5-avril-au-5-mai-2017-lancement-de-la-campagne-de-souscription-pour-les-40-000-logements (Accessed 10 Sept 2018).
23 Ibid.24 La Voix du Juriste (2018). “Burkina Faso:Du bail à usage d’habitation, que faut-il savoir?" 25 Jan 2018.
https://lavoixdujuriste.com/tag/loi-n103-2015-cnt/ (Accessed 10 September).25 Mutations (2018). “Loi sur le Bail locatif: Place à la bataille de l’application.” 25 June 2018.
http://mutationsbf.info/loi-bail-locatif-place-a-bataille-de-lapplication/ (Accessed 8 Sept 2018).26 Lefaso.net (2018). “Promotion immobilière : Le cadrage d’un secteur d’avenir.” 30 Sept 2010.
http://lefaso.net/spip.php?article38730 (Accessed 10 Sept 2018).27 African Development Bank (2018). African Economic Outlook 2018. Pg. 130.28 Knight Frank (2018). Africa Report 2017/18: Real Estate Market in a Continent of Growth and Opportunity.

Africa Housing Finance Yearbook 2018
81
2018 with an expansionary fiscal policy financed by domestic borrowing. Withlimited external borrowing options, Burundi carries a heavy debt burdenamounting to 47.6 percent of total public debt to GDP in 2016, slightly decliningto 41 percent in 2017 because of improved domestic revenue collection. Thisimprovement has also been reflected in the current account deficit standing at10.8 percent of GDP in 2017, down from 11.8 percent in 2016.
This general improvement in economic performance is also reflected in the growthof private sector credit to business entities and households. There has been a10.9 percent growth in banking sector loans from BIF 731 099.6 million in March2017, to BIF 810 749.5 million in March 2018.5
Although the increase in private sector credit is significant in real terms, the period2017 to 2018 witnessed a drop in the share of private sector loans in the totalbanking assets portfolio from 39.4 percent to 35.8 percent at the end of March2018. The preference for most lenders has been an uptake of governmentsecurities because of a higher credit risk associated with private sector projectsduring fragile political periods. Indeed, there was a notable increase in thedeterioration of loan portfolio quality across housing-related finance and othersectors. General banking assets impairment increased from 20.8 percent in March2017 to 22.1 percent in March 2018. Over the same period, overdue loansincreased by 17.9 percent, from BIF 152 027.7 million to BIF 179 260.5 million inMarch 2018.6
OverviewBurundi’s economy has seen slowed growth because of civil strife arising from the2015 disputed election of President Pierre Nkurunziza. There has been aslowdown in economic activity in agriculture, which contributes more than40 percent of national output and employs close to 90 per cent of the population.Real per capita GDP declined by 1.6 percent in 2016 and the economy contractedby 1.3 percent in 2017. The agricultural exports of coffee and tea, which accountfor over 60 percent of total exports, have also declined in value because of lowproduction. Specifically, the 2017-2018 coffee season produced 15 824 tons ofthe expected 20 000 tons.1 Foreign aid from donor agencies including theEuropean Union was withdrawn because of accusations of human rights violations.This points the country towards increased reliance on domestic tax collection andmodest revenues from coffee and tea exports.
Several reforms were implemented in 2017, leading to higher than budgeted taxrevenue with the intent of boosting local revenue mobilisation. These revenuecollection measures include a fuel and mobile phone tax increment. In addition,government spending relating to recurrent and capital expenditure was restrained.This has led to the narrowing of the fiscal deficit to approximately 5.7 percent ofGDP in 2017 from 6.1 percent in 2016.2 This deficit was largely financed throughthe issuance of government treasury bills.
The economy is expected to grow 1.9 percent in 2018 from an estimated 0.5percent in 20173 with a boost provided by the May 2018 political referendumthat re-affirmed the continuity of relative peace by approving constitutionalamendments that scrapped the presidential term limits, paving way for theanticipated peaceful elections of 2020.
The return to political calmness presents a foundation upon which renewedgrowth efforts can be built. This growth will be supported by a rise in governmentspending for defence, energy, agriculture and infrastructure projects. The 2018/19national budget was approved in June 2018 indicating an increment in spendingfrom BIF 1.32 trillion in 2017 to BIF 1.4 trillion ($795 million) for the 2018/19financial year.4 About 81 percent of the budget will be sourced internally, and thefiscal deficit is expected to reduce to BIF 164 billion, down from BIF 174 billion in2017. The country’s inflation rate rose from 5.6 percent in 2016 to 16.6 percentin 2017. This was mainly due to a rise in food and fuel costs, with food inflationrecorded at 22.7 percent over the same period. Inflation is expected to rise in
BurundiKEY FIGURES
Main urban centresBujumburaRuyigi
Exchange rate: 1 US$ = [a] 8 Aug 2018PPP Exchange rate (Local currency/PPP$) 1 Burundi franc = [b]Inflation 2016 [c] | Inflation 2017 [c] | Inflation 2018 [c]
1781.45 Burundi franc717.95.6 | 16.6 | 12.7
Population [b] | Urban population size [b]Population growth rate [b] | Urbanisation rate [b]Percentage of the total population below National Poverty Line [d]Unemployment rate [d]
10 864 245 | 13 76 1743.18% | 5.64%65%7%
GDP (Current US$) 2017 [b] | GDP growth rate annual 2017 [b]GDP per capita (Current US$) 2017 [b]GNI per capita (Current US$) 2017 [b]Gini co-efficient [b]HDI global ranking 2017 [e] | HDI country index score 2017 [e]
US$3 478 million | 0.52%US$320US$29038.6180 | 0.417
Is there a deeds registry? Number of residential properties that have a title deed Lending interest rate Q3 2016 [a] Mortgage interest rate | Mortgage term (years)DownpaymentMortgage book as a percentage of the GDPEstimated number of mortgages Price to Rent Ratio in City Centre | Outside City Centre Gross Rental Yield in City Centre [e] | Outside City Centre [e]Construction as a % of GDP
Yesn/a16.43%16% | 20 years20%n/a1 500n/a | n/a36% | 57%n/a
What is the cost of standard 50kg bag of cement? What is the price of the cheapest, newly built house by a formaldeveloper or contractor? (Local currency)What is the price of the cheapest, newly built house by a formaldeveloper or contractor? (US$) What is the size of this house (m2)? What is the average rental price for this unit (US$)? What is the minimum stand or plot size for residential property?
US$25
54 757 890 Burundi franc
US$31 00060m2
US$500250m2
Ease of Doing Business Rank [f]Number of procedures to register property [f]Time to register property (days) [f]Cost to register property (as % of property value) [f]
164523 days3.10%
NB: Figures are for 2018 unless stated otherwise.
[a] Bank of the Republic of Burundi[b] World Bank World Development Indicators[c] IMF World Economic Outlook Database[d] Central Intelligence Agency (CIA) World Factbook[e] UNDP Human Development Reports[f] World Bank Doing Business
82
The impairment rate of loans in the construction sector was15.3 percent and thetourism and hotel sector hit a record 38.8 percent. This was significantly higherthan the impairment rate in the agriculture and trade sectors, which recorded10.9 percent and 15.3 percent respectively. Against this background, lenders havebeen cautious about lending to the private sector and have increased their interestin treasury securities, increasing their share of these government securities from24.9 percent in March 2017 to 31.6 percent in March 2018.
Access to financeAccess to financial services continues to be a key development challenge inBurundi with only 12.5 percent of the country’s adult population operatingaccounts in formal financial institutions. This low level of financial inclusion in thecountry is attributed to lower incomes, low levels of financial education as well aslimited coverage of financial institutions in areas outside the capital city ofBujumbura. To improve this, the government of Burundi signed a US$24.9 milliongrant agreement with the International Fund for Agricultural Development (IFAD)in October 2017 with the objective of enhancing the availability of financial servicesin rural areas where demand far outstrips supply. Key beneficiaries of the grantwill be the most vulnerable groups, including women and young people.
The Financial Inclusion in Burundi (PAIFAR-B) project is expected to aid a total of99 200 Burundian rural households in 17 provinces. The total cost of the projectis US$38.6 million, including a US$24.9 million Debt Sustainability Frameworkgrant from IFAD. The project will be co-financed by the Government of Burundi(US$2.6 million) and by the project beneficiaries (US$2.1 million). The agreementaims to provide access to financial and other diversified services, and to foster theemergence of a wide range of income-generating enterprises, with a focus onassisting the rural poor. The project will be implemented through several partnersincluding the Bank of the Republic of Burundi for regulatory issues, as well as theprivate banking sector for managing funds and refinancing the microfinanceestablishments (MFEs).
The MFEs will finance the small-scale farmers, traders, processors, craftsmen andthe cooperatives working in the agricultural and non-agricultural rural sector. Theproject will also help strengthen the Bank of the Republic of Burundi’s microfinancetechnical capacity. The MFEs will also be in position to provide a more completerange of services that are adapted to the needs of rural communities, and tosustainably expand their scope in rural areas.
The banking system has continued to stabilise with an 18 percent rise in the totalbalance sheet of banking sector assets between December 2016 and December2017, mainly due to a rise in total deposits and private sector credit. Total depositsrose by 23.2 percent over the same period, thereby enabling banks to create moreassets on the loan side. The rise in deposits was supplemented by Central Bankrefinancing, which increased by 93.9 percent between December 2016 andDecember 2017.
The sector assets were largely comprised of credit to the private sector and creditto government through treasury securities. Private sector credit constituted 36.8percent of total bank lending while the banking sector holding of governmentsecurities was to the tune of 29.7 percent of the total banking assets in December2017. The rise in the domestic Public Sector Borrowing Requirement (PSBR)translated into a 46.9 percent increment in the value of commercial banks’ lendingto government against a modest 8.2 percent rise in credit to the private sectorover the same period. The observed banks’ preference to increase the low riskgovernment securities’ holding against private sector credit partly indicates theirlevel of confidence in the economy influenced by a sluggish return to politicalnormalcy.
The cautious approach to credit approval for the private sector could be attributedto the increase in credit risk arising from low productivity, slow economic growthand a less favourable trading environment. Indeed, non-performing loans increasedfrom 18.9 percent to 19.8 percent between December 2016 and December 2017.Banks have continued to write off loss loans, even in 2018, to bring the non-performing loan figure down to 12.3 percent. In line with the regulatoryrequirements, loan loss impairment provisions have significantly risen for tourism,housing and hostel facilities over the year.
The mortgage market in Burundi is still dominated by three financial institutions.Burundi Bank of Commerce and Investment, Ecobank Burundi and KCB Bank offermortgage facilities alongside the second-tier Fund for Promotion of Urban Housingand the National Bank for Economic Development. These lenders offer housingand real estate loans ranging between BIF 500 000 (US$282.4) for small homeimprovement facilities and BIF 50 million (US$28 243.8) for home constructionfinance. On average, the tenure allowed ranges between 4 and 20 years. Interestrates on housing loans have been relatively high, averaging between 16 percentand 19 percent. Medium-term mortgages (maturing in two to seven years)account for 13.6 percent of the total stock of loans granted by the institutions inMarch 2018, rising marginally from 12.5 percent in March 2017.
Overall, the housing loan portfolio in the country has increased by 17.5 percentfrom BIF 94.2 billion (US$53.2 million) in March 2017 to BIF 110.5 billion(US$62.42 million) in March 2018. This is attributable to the emerging gain inconfidence as a result of the country’s slowly returning peaceful political state.Owing to the collateralized nature of lending to the housing sector, banks havepreferred housing loans as a relatively safer investment avenue compared to thebusiness sector during this era of slow gains in political and economic stability.
Affordability Burundi’s GDP per capita is estimated at US$320.1 in 2017, positioning thecountry as the poorest in the world.7 For the past five years, Burundi hasconsistently been ranked as a low human development country, with a HumanDevelopment Index of 0.417 in 2017. With an agrarian economy and strugglingindustrial and services sector, the affordability of housing finance has beensignificantly affected.
The escalation of inflation and interest rates has pushed several households outof the housing affordability bracket. In the fourth quarter of 2017, the lendinginterest rate on outstanding loans slightly increased to 16.16 percent from 16.13percent the previous quarter. This is compared to 16.77 percent recorded in thefourth quarter of 2016. Similarly, the interest rate on new loans slightly increasedto 17.17 percent in December 2017 from 17.14 in December 2016.8 The lendinginterest rate has remained high, averaging 17.32 percent over the first quarter of2018, compared to 16.43 percent recorded in December 2017. The rise in lendinginterest rates can be partly attributed to the increased credit risk from the lenders’perspective as evidenced by the upward movement of non-performing loans to16.8 percent in March 2018 against 14.1 percent recorded in December 2017.9
Worryingly, the loan loss category of non-performing loans has risen sharply to42.3 percent of overdue loans from the previous year of 34.9 percent. Bankstherefore continue to write off the loss loans, affecting their profitability and abilityto extend further credit to this growing economy.
Owing to the slow return to political and economic normalcy in Burundi,commercial banks have been increasing their asset holdings in treasury bills whichare considered less risky than most personal or business loans. This effectivelyreduces the volume of funds available for incremental home construction throughpersonal unsecured loans taken by retail borrowers. With the growth rate in percapita terms remaining modest over 2017 and 2018, the poverty incidence isprojected to increase to 84.1 percent in 2018 from 65 percent in 2017.10
Burundi suffers from low household incomes that greatly affect affordability forhousing units and eligibility for housing finance in the country. Modest incomehouseholds earning between BIF 4 000 (US$3.3) and BIF50 000 (US$42) perweek constitute 81 percent of the working population. Sadly, the country’s highannual population growth of 3.2 percent and the youthfulness of the populationunderline a demographic challenge for the country’s undeveloped housing andhousing finance sector/industry.
Given that the average monthly net salary (after tax) for Burundians is US$64.98,it is unlikely that low income earners can afford a two-bedroom house, at aboutUS$25 000 on the property market. Regrettably, prospective individual developerswould struggle to put up a similar two-bedroom house at the lower side ofUS$15 000. Acquiring a mortgage will also be an uphill task for most Bujumburalow income earners, given the mortgage interest rate is at an average 16 percentand their incomes are below the minimum BIF 1 million required by banks to offermortgage finance. Less than 0.1 percent of the population earn above BIF 1 million.

Africa Housing Finance Yearbook 2018
83
For those in the middle and high income brackets (above BIF 1.5 million), theaverage mortgage taken up from financial institutions is about US$30 000. Throughsubsidies from the government and development partners such as Habitat forHumanity, complemented by beneficiaries (in-kind contribution), 39 460 house-holds were able to purchase a dwelling and use rehabilitated social facilities. Withthe political situation easing, another 1 000 households have been aided by theSwedish International Development Cooperation Agency (SIDA) to return totheir communities following the decommissioning and closure of four displacementcamps in Burundi. A decommissioning process began in January 2018 to improvethe living conditions of internally displaced persons (IDPs) in the camps of MushAsha I and Mushasha II, Giada and Cashi. The International Organization forMigration (IOM), with the support of SIDA, provided aid aimed at enablingdisplaced households to transition from the camps. The support includedconstruction of semi-permanent shelters and the provision of rental support tothe affected households. Several households that had been displaced by floodsand other natural disasters were key beneficiaries of this programme. Theprogramme was structured to involve the government, IOM and local householdsas stakeholders.
Households earlier displaced from rental units were offered rental support whilethose with land titles in relatively safer areas were provided with transitional shelter.Households without land and without clear income sources to support rentalpayments were provided with transitional shelter on plots provided by thegovernment of Burundi. To support settlements in the new areas, all householdswere provided with aid packages containing blankets, mosquito nets and floormats among other household items. To boost their income-earning potential,households earmarked for rental support were also provided with agricultural kitsin the areas of Gautama and Rumonge province, along the shores of LakeTanganyika. In this province, 159 housing units were built at sites for resettlementof households from the decommissioned camps. It is hoped that the agriculturalkit initiative will complement other projects, such as the IFAD-funded project, toboost rural productivity, enhance household income and work towards povertyalleviation.
Notably, however, more than 500 000 families are still internally displaced or likelyto return from abroad without homes to go to and income sources to supporttheir livelihoods. There is therefore an urgent need for additional housing solutionsfor the internally displaced in Burundi. A related challenge to affordable housingis the need for appropriately packed financing solutions. IDPs have no significantincome sources and are unable to attract lenders. Grant and concessional financecould be an alternative to conventional financing options in Burundi.
Housing supplyDelivery of new housing unit stock in Burundi is still below the demand in theaffordable housing space. The country has had a few private developersindividually setting up an average of five housing units for sale over the past year.These developers normally target the middle to high-end income earners for
housing units constructed in areas including Kavuma, Mboza, Byenzi, Mutanga,Rohero, Bwiza, Nyakabiga and Nyamitanga.
The challenge of large-scale delivery of housing units remains as no singledeveloper has the capacity to deliver projects of more than 30 units. The sluggishreturn to a stable political state has not favoured regional developers due to theabsence of a vibrant services sector that would attract a labour force with strongsalaried income to rely on for downpayments. The government has also notrealised its goal of setting up housing units for civil servants, mainly because ofbudgetary constraints. A new 10-year national strategic plan (2018 - 2027) waslaunched on 2 July 2018 with renewed focus on consolidating independence andreducing reliance on external parties for development support.
Across the East African region, recent delivery of housing units has mainly beenthrough the construction of high-rise apartments sold off with condominium titles.Although this approach tends to be costlier than the construction of ground-basedbungalows, most developers have preferred the high-rise structures because ofsignificant land-use efficiencies realised through such settlements. Burundi presentsa unique challenge in making its legal framework support the creation ofcondominium titles.
High interest rates and immature mortgage markets in Burundi have hamperedsales volumes. Interest rates have remained high at 16.5 percent, impedingaffordability for low income households. Banks are reluctant to finance developersbecause of the difficulties in off-loading stocks of houses, given the low level ofincomes and the weakness of developers (with respect to cash flow analysis andmarketing budgeting). This has led to a stagnation of development projects,particularly in the mid-market segment. The exception is high-end residentialproperty sales. For example, the civil servants housing project, of about 2 000units, by Biz Planners, has been on halt since 2014. Each house was planned atUS$30 000.
Construction costs are relatively high as most of the building materials such ascement, steel bars and roofing iron sheets are imported, and overland transportcosts are relatively high. For instance, the cost of a 50kg bag of cement is US$25compared to US$8.9 for the same 32.5 grade 50kg bag in Uganda. For thedelivery of housing units, this high cost translates into over US$31 000 for a one-bedroom structure compared to US$20 000 for a similar unit in Uganda.
Furthermore, the poor quality of construction in commercial as well as residentialspace has resulted in lesser take-up of such properties, leading to dead supplystock in the market. For example, 27 three-bedroom houses, by Agglobu Ltd, havebeen on the market for over three years. The houses cost between US$205 000and US$225 000.
To respond to the need for more housing units, a new and attractive social housingproject – the New Rugo – has been kickstarted with a blend of modern and
PPP$40 001 – PPP$10 000 000
PPP$23 001 – PPP$40 000
PPP$12 001 – PPP$23 000
PPP$8 001 – PPP$12 000
PPP$5 001 – PPP$8 000
PPP$3 601 – PPP$5 000
PPP$2 401 – PPP$3 600
PPP$1 601 – PPP$2 400
PPP$801 – PPP$1 600
<PPP$800
- - - Average annual household income needed for the cheapest newly built house by a formal developer, 2017 Average annual household income using expenditure, 2017 (PPP$)
BURUNDI
Annual income profile for rural and urban households based on consumption (PPP$)
No. of households (thousands)
PPP$7 125
PPP$40 749
Rural Urban500 400 300 200 100 0 100 200 300 400 500
Population: 10 864 245
Urbanisation rate: 5.64%
Cost of cheapestnewly built house:
54 757 890 BIFPPP$76 275
Urban householdsthat could afford thishouse with finance:
0.73%
1 PPP$:717.9 Burundi
franc
Source https://www.cgidd.com/
84
traditional building style. It combines the tenets of traditional design and modernparameters to achieve social housing concepts that cut across the low income tomiddle income markets.
The Rugo is the traditional Burundi and Rwanda house and is the backbone ofthe New Rugo project. New Rugo is mainly a low-cost housing project that drawsits inspiration from vernacular solutions. It typically comprises three houses thatcan be valued independently at an average price in the region of US$35 000. Withlow-cost technologies and cultural appropriateness, the developed housing isaimed at empowering fragile communities in Burundi.
Property marketsEighty percent of the property market in Burundi is residential. Bujumbura, thecapital city, has traditionally been occupied by nearly 50 percent non-Burundianswho are mostly nationals of neighbouring countries such as Tanzania, theDemocratic Republic of Congo, and Uganda, as well as Europe.
Monthly rent for 85m2 furnished accommodation in a prime area in Bujumbura isestimated at about BIF 3 million a month. A 45m2 furnished studio in a similararea is estimated at about BIF 0.5 million. The cost of utilities (heating, electricity,and gas) for one month in a 45m2 studio is BIF 100 000 per person. Yet, theaverage monthly income for a renting household is about BIF 45000.
The market space for land, residential, and commercial real estate in Burundiremains both underdeveloped and depressed. The country suffers from a dearthof real estate listing agencies. Most agencies available are based in neighbouringcountries including Kenya and Rwanda. Property valuation firms are also in shortsupply. Knight Frank in Uganda has been the leading provider of real estatevaluation services in Burundi for a long time. Large-scale construction projectsare dominated by foreign firms, most of which are from China. The country’sproperty market is still in its infancy. There are a limited number of marketparticipants on the supply side, largely due to low levels of market demand asdetermined by the low income levels of more than 60 percent of the country’spopulation.
Targeted construction and delivery of low-priced housing units would beappropriate in such a market. However, in the absence of appropriately positioneddevelopers and sizeable government incentives, delivery of affordable housing mayremain unachievable in the short to medium term. Additionally, a reduction inbudget support and foreign aid has incapacitated the government and decreasedits ability to build support infrastructure for the housing sector in terms of energyand transport facilities. With half of the country’s budget slashed because ofreduced foreign aid, government investments for housing infrastructure are likelyto be affected, translating into slow growth in property markets in the country.
Policy and regulationBurundi’s National Urban Planning and Housing Policy provides the regulatoryframework for the management of water, environment, land and urbandevelopments. The policy was introduced with the core objectives of promotinga coordinated management of the environment, sound management of land, water,forests, and air, and the preservation of ecological balance.
The policy is intended to promote social development and allow each Burundianto have access to high-quality housing and basic services. In formulating this policy,the government intended to create an enabling framework for the developmentof 855 hectares of land and the construction of 26 000 homes annually. In addition
to the policy, the government issued a decree in January 2014 on the structure ofthe National Commission on Land and Other Assets (CNTB). The CNTB,established in 2006, is authorised to resettle refugees who return and to resolveland disputes. Since its inception, over 38 000 cases have been handled anddetermined. The commission has been instrumental in determining landownership and therefore housing developments on such land for the past decade.
OpportunitiesThe 2018 referendum in Burundi re-affirmed the continuity of relative peace, amuch-need foundation on which the national 10-year strategic plan and VisionBurundi 2025 are to be built. The three core objectives of installation of goodgovernance within the rule of law, development of a strong and competitiveeconomy, and improvement of the living conditions of the people of Burundi, allentrenched in the Vision 2025 are supportive of a conducive housing investmentclimate and improved income levels to provide effective demand for new housingunits.
Initiatives towards actualising some of the objectives have already commencedwith construction and renovation of elementary schools, a move aimed at raisingthe literacy rate through universal primary education to reduce the adult illiteracyrate to under 20 percent and create skilled professionals through modernisingagricultural production alongside the development of a strong service industry.
With such developments in place, it is envisaged that by 2025, the rate ofeconomic growth will have reached an average of 10 percent and this will translateinto a perceptible increase in incomes to US$720 per capita and poverty will bereduced by 50 percent. Development of a vibrant financial sector will be criticalin ensuring availability of the relevant credit and insurance support to the rapidlygrowing economy. International investors will, however, be cautious in theirapproach as the country prepares for the next general elections in 2020.
Additional sourcesBank of the Republic of Burundi (2018). Annual Report, April 2018.https://www.brb.bi/en (Accessed 6 Aug 2018).
Bank of the Republic of Burundi (2018). Quarterly Note, March 2018.https://www.brb.bi/en (Accessed 2 Aug 2018).
Bank of the Republic of Burundi (2018). Quarterly Report, March 2018.https://www.brb.bi/sites/default/files/MPC%20Q-1-2018%20cor.pdf (Accessed2 Aug 2018).
Bank of the Republic of Burundi (2018). Private sector credit data.https://www.brb.bi/en/content/money-and-credit (Accessed 2 Aug 2018).
International Monetary Fund (2018). Burundi and the IMF. 28 June 2018.https://www.imf.org/external/country/BDI/index.htm?type=42 (Accessed 6 Aug2018).
The World Bank (2018). Country Report: Burundi.https://data.worldbank.org/country/burundi (Accessed 2 Aug 2018).
1 Uwimana, Diane (2018). “Burundi: Coffee harvest campaign to be run until August 5”. 27 July 2018. IWACU English News. http://www.iwacu-burundi.org/englishnews/burundi-coffee-harvest-campaign-to-be-run-until-august-5/ (Accessed2 Aug 2018). Also Bank of the Republic of Burundi(2018). Real Sector. https://www.brb.bi/en/content/real-sector (Accessed 2 Aug 2018).
2 World Bank Macro Poverty Outlook Report – Burundi (2018). http://pubdocs.worldbank.org/en/708231492188151479/mpo-bdi.pdf (Accessed 02 August 2018). Pg.1.3 World Bank Macro Poverty Outlook Report – Burundi (2018). Pgs. 1-2.4 Reuters (2017). “Burundi expects econ growth, spending to pick up in 2018.” 13 December 2017. https://af.reuters.com/article/africaTech/idAFL8N1OD4C1 (Accessed 2 Aug 2018).5 Bank of the Republic of Burundi (2018). Monthly Bulletin, March 2018. https://www.brb.bi/sites/default/files/BM%20N%C2%B0%2003%202018_English.pdf (Accessed 3 Aug 2018). Pg. 16.6 Bank of the Republic of Burundi (March 2018). Monetary Policy Committee Report - Quarter 1. https://www.brb.bi/sites/default/files/MPC%20Q-1-2018%20cor.pdf (Accessed 4 Aug 2018). Pg. 25.7 World Bank (2018). World Development Indicators: Burundi. http://databank.worldbank.org/data/source/world-development-indicators (Accessed 20 Sept 2018).8 Ibid. Pg. 21.9 Ibid. Pg. 25.10 World Bank Macro Poverty Outlook Report – Burundi (2018). Pgs. 1-2.11 International Organization for Migration (2018). “Press release: 5000 displace Burundians move to long-term housing as four displacement camps close”. 29 March 2018. https://www.iom.int/news/5000-displaced-burundians-move-long-
term-housing-four-displacement-camps-close (Accessed 6 Aug 2018).

Africa Housing Finance Yearbook 2018
85
lack of economies of scale, a necessary dependence on imports for constructionmaterials, and recent economic performance.12
Access to financeThe Cabo Verdean finance sector is dominated by banks, which are liquid but riskaverse.13 The banking sector is highly concentrated,14 with more than 85 percentof total financial sector assets, with two of seven licensed banks, Banco Comercialdo Atlântico (BCA), and Caixa Económica de Cabo Verde, dominating the credit anddeposit markets with a combined market share of almost 70 percent. Bankliabilities are primarily deposits from residents, migrants, and government.15
Banking institutions within Cabo Verde grapple with low asset quality, lowprofitability, and limited capital buffers. Following the global economic downturnand the subsequent impact on tourism and real estate, the level of non-performingloans (NPLs) increased to 15.5 percent of total loans as of the end of 2016. Theaverage return on assets from 2011-16 was only 0.3 percent, and capital was only7.7 percent of total assets at end-2016, varying across the banks, with someexperiencing capital constraints.16 In March 2017, the BCV had to respond tothe insolvency of the state-owned bank (Novo Banco) which was established in2010 to support MSME finance and low-income housing, resulting in the BCV
OverviewLocated 500km off the west coast of Africa, Cabo Verde is an archipelago of 10islands, only nine of which are inhabited.1 It is a relatively stable multipartydemocracy with a recognised record for good governance2 and a highly sensitiveeconomic outlook constrained by limited resources, making the country highlysusceptible to external shocks and reliant on public spending, international aid, thediaspora, and tourism.3 According to the National Statistics Institute (INE), in 2017the national economy experienced its fastest growth since 2011 (3.8 percent),growing to 3.9 percent.
The local currency Cabo Verdeans Escudo (CVE) is pegged to the Euro. In supportof the state fiscal policy, tax reforms have been introduced, including tax exemptionduring the start-up period of a business as well as tax incentives provided toemigrants, to further encourage private and economic investment initiatives.4 Theeconomy is highly dependent on tourism, accounting for 47 percent of exportedgoods and services.5 There is a projected rise in foreign direct investment (FDI)and an expected expansion in the manufacturing and catering sectors over thenext three years.6 The Sustainable Development Strategic Plan 2017-2021 (PEDS)is intended to support and drive medium-term economic diversification,stimulating economic transformation and diversification,7 improving resilience toclimate change, and strengthening regional integration within the EconomicCommunity of West African States.8
Despite attempts to strengthen the economy, government debt has increasedfrom 57 percent in 2008 to 125.3 percent of GDP in 2018, with a projectedincrease to roughly 142 percent in 2020.9 Government intends to alter the trendsby mobilising domestic resources, maximising public expenditure through increasedefficiency and decreasing public enterprise debts from state-owned enterprisessuch as the Cabo Verde Airlines and Imobiliaria Fundiaria e Habitat (IFH) SocialHousing Company, the combined debts of which are close to 20 percent of theGDP.10
The inflation rate estimated at 1.1 percent in 2017 is expected to rise to twopercent by 2019.11 The central bank, Banco de Cabo Verde (BCV), has slowlyundertaken an expansionary monetary policy, reducing reserve levels and thecentral bank lending rate in a bid to boost the rate of inflation and economicgrowth. There is limited data around the mortgage contribution toward theeconomy, however it is constrained by the performance of the finance sector, the
Cabo Verde (Cape Verde)KEY FIGURES
Main urban centres Praia
Exchange rate: 1 US$ = [a] 13 Jul 2018PPP Exchange rate (Local currency/PPP$) 1 Cape Verdean Escudo = [b]Inflation 2016 [c] | Inflation 2017 [c] | Inflation 2018 [d]
94.26 Cape Verdean Escudo
46-1.40 | 0.80 | 1.10
Population [e] | Urban population size [e] Population growth rate [e] | Urbanisation rate [e]Percentage of the total population below National Poverty Line [d]Unemployment rate [d]
560 899 | 368 5111.33% | 1.97%27.00%12.20%
GDP (Current US$) 2017 [b] | GDP growth rate annual 2017 [b]GDP per capita (Current US$) 2017 [b]GNI per capita (Current US$) 2017 [b]Gini co-efficient 2017 [d]HDI global ranking 2016 [f] | HDI country index score 2016 [f]
US$1 754 million | 3.89%US$3 209US$2 99047.2122 | 0.648
Is there a deeds registry? Number of residential properties that have a title deed Lending interest rate Mortgage interest rate [g] | Mortgage term (years) [g]DownpaymentMortgage book as a percentage of the GDPEstimated number of mortgages Price to Rent Ratio in City Centre [g] | Outside City Centre [g]Gross Rental Yield in City Centre [g] | Outside City Centre [g]Construction as a % of GDP
Yes114 46916.43%14.5% | 20 years20.00%n/an/a13.46 | 16.677.43% | 6.00%n/a
What is the cost of standard 50kg bag of cement? [h]What is the price of the cheapest, newly built house by a formaldeveloper or contractor? (Local currency) [h]What is the price of the cheapest, newly built house by a formaldeveloper or contractor? (US$) What is the size of this house (m2)? What is the average rental price for this unit (US$)? What is the minimum stand or plot size for residential property?
US$8.212 912 634 Cape VerdeanEscudo
US$30 900n/an/an/a
Ease of Doing Business Rank [i]Number of procedures to register property [i]Time to register property (days) [i]Cost to register property (as % of property value) [i]
127622 days20.00%
NB: Figures are for 2018 unless stated otherwise.
[a] Coinmill.com[b] World Bank World Development Indicators[c] Knoema.com[d] Trading Economics[e] Central Intelligence Agency (CIA) World Factbook[f] UNDP Development Indicators[g] Numbeo[h] CAHF Yearbook 2017[i ] World Bank Doing Business

86
revoking Novo Banco’s license in June 2017. In order to diminish future risks, theBCV is strengthening its banking supervision capacity, increasing the frequency ofon-site audits, and urging banks and corporates to recognise and address NPLswhile rebuilding capital buffers.17
Within Cabo Verde, access to finance is a significant constraint. Domestic creditto the private sector has dropped as banks increased the share of their assetsdeposited with the BCV and lent to the government and State-Owned Enterprises(SOEs). This reflects both a higher risk aversion by banks and the lack of viableinvestment opportunities: in 2015 there were only 189 commercial bankborrowers per 1 000 adults. Finance costs are on average high, with lending ratesof approximately 10 percent for loans of up to one year. Following previous failedattempts at monetary easing, the BCV introduced more aggressive monetarystimulus measures in 2017, which saw the reduction of the benchmark interestrate from 3.50 to 1.50 percent. In general, the cost-to-income ratios, given thearchipelago’s lack of economies of scale, are very high (an average of 69 percentover the last five years), indicating room for improvement in banking sectorefficiency.18
With an approximate client base of 50 000, the microfinance sector remainssmall.19 The sector has limited penetration and visibility. Studies indicate thatabout 75 percent of the unemployed population eligible for financial servicesoffered by microfinance institutions (MFIs) are unaware of either MFIs in generalor the services they offer.20
BCA, the largest bank in the country, provides mortgages for up to CVE 30 million(US$316 000) for terms up to 30 years. BCA offers both fixed and variable ratemortgages: the nominal fixed rate is between 8 and 11.5 percent and the nominalvariable rate has a floor of 7.7 percent, is based on BCA index rate, and has arange of 3.5 percent.21 This translates into an effective rate of 12.04 percent fora variable rate mortgage and 12.3 percent for a fixed rate mortgage, comparedto the 15.11 percent offered for consumer loans. BCA also charges a feeequivalent to 3.5 percent of the mortgage value, which is not capped but is at aminimum CVE 20 000 (US$210). Caixa offers mortgages for up to 30 years andcharges a fee of 1.26 percent of the mortgage, which must be at least CVE 10 000(US$105).22 The nominal interest rate on mortgages is 10.75 percent, equivalentto an effective rate of 11.4 percent. For loans to purchase land, Caixa offers anominal interest rate of 9 percent on a sixty-month loan. Banco Interatlântico(BI) offers mortgages to purchase or construct a house at 90 percent of propertyvalue.23 Banco Internacional de Cabo Verde offers mortgages for terms up to25 years, with a loan-to-value ratio of up to 70 percent. First-time home buyersare exempt from taxes on the interest portion of mortgage repayments.24
The credit market is inhibited by the absence of a credit bureau to regulate andmonitor the sector, however there have been substantial legal and systematicreforms intended to strengthen efficiency and private sector growth, providing anoptimistic outlook for the financial sector.25
Affordability There is economic disparity within Cabo Verde, with 179 909 people making up33 percent of the total population living in absolute poverty, of whom 54 395 arein extreme poverty, and of which 54 percent are women.26 The unemploymentrate sits at 12.2 percent as at 2017, down from 15 percent in 2016.27
On average an apartment within the city centre costs CVE 89 000 (US$936) persquare meter. Comparably purchasing outside the centre, the per square meteraverage is CVE 65 000 (US$684). The rental market for a one-bedroomapartment in the city centre is CVE 29 000 (US$305) and outside the city centrethe average is CVE 18 333 (US$193).28 The affordability of housing is howeverreflected in the fact that the average net monthly income is CVE 27 500 (US$289)so the lowest affordable rental would be 66 percent of an average income.29
The BCA mortgage calculator works on monthly repayments for a mortgageworth CVE 2 million (US$21 039), over a term of 30 years and an interest rateof 11.5 percent, at CVE 19 000 (US$200).30 Considering that generally it isadvised that no more than a third of income is spent on housing, the householdwould have to earn CVE 60 000 (US$631) a month, or CVE 720 000 (US$7 574)a year to afford a 30m2 one-bedroom apartment.
Housing supplyA component of the PEDS, which has yet to be completed, is focused on anassessment of the housing situation within Cabo Verde, intended to review thebasic and extended housing deficit as well as the definition of a new nationalhousing policy. In Cabo Verde, only 1.4 percent of households live in non-traditional housing, which includes shanties. Most, 98.6 percent, live in independenthousing or apartments. In general households have electricity, piped water andsanitation facilities, and at least two out of three households occupy and own theirown dwellings, (with the largest numbers among the poor); 72 out of every 100poor households occupy homes that they own, as compared to 63 percent ofnon-poor households.31
The core issue within the Cabo Verdean housing sector is less about access andmore in relation to quality. There is a pressing need to address housing insecurityin relation to the degradation of housing, especially in rural areas. Nationally 49 outof every 100 households live in homes with roof problems and 52 out of every100 have infiltration and moisture problems in their walls. This situation isparticularly serious among the poor, as 64 out of every 100 people live in houseswith roof infiltration problems and 65 out of every 100 dwellings have problemswith infiltration and moisture in the walls, the costs of repairs often beyond themeans of most households.32
Despite the relatively low percentage of households living in informal settlements,with an urban population of around 68 percent, there is a concern around theproliferation of housing which has no access to water or sanitation services. Inresponse to this growing trend, UN Habitat and the Ministry of Environment,Housing and Territorial Planning have initiated the Participatory Slum UpgradingProgramme (PSUP) intended to strengthen community, city and national keystakeholders’ capacities in participatory slum upgrading, particularly in the selectedcities of Praia, Pedra Badejo and Espargos. The project was initiated in 2008 andcompleted in 2015. It received US$135 000 in funding to build intergovernmentaland organisational partnerships and develop strategies for tackling the physicaland social inequalities inherent in the identified areas. Thus far there is no evidenceto suggest that it has translated into any built developments.33
The INE survey data shows that 78.6 percent of households live in free-standinghouses, compared to 20 percent who live in apartments. In terms of buildingmaterials, 84.4 percent of residents live in units that are constructed out ofreinforced concrete, while 50 percent of residents have cement floors and 48.8percent have mosaic flooring.34 The majority of the houses have three rooms ordivisions. A few have five or more.
There have been attempts to encourage social and sustainable development goals.For example, in 2009 the Sistema Nacional de Habitacao de Interesse Social (SNHIS)(National System of Housing for Social Interests) was launched, informally knownas Casa Para Todos (Houses for All). The programme was intended to reduce thenational housing deficit standing at 40 776 dwellings in terms of quantity and afurther 66 013 dwellings in relation to the quality.35
The subprograms of SNHIS included: Habitar CV which intended to deliver 8 496housing units, Pro Habitar expected to build 1 000 homes in rural areas, andReabilitar aimed at rehabilitating 16 000 households.36 The Casa Para Todosprogramme was however marred by scandal. In 2016 it was revealed thatalthough 83 percent of the EUR 200 million (US$234 699 964) credit line fromthe Portuguese government funding the program through the IFH had been spent,less than half of the proposed target of dwellings had been completed. Furtherthe IFH was reported to be in technical bankruptcy, with a debt of roughly CVE 2billion (US$0.21 billion). Assessments by the IMF have made recommendationfor “deepening fiscal consolidation efforts” and accelerating the restructuring ofSOEs, thereby eliminating the need for government support for bodies such asthe IFH. This is seen as a mechanism for increasing the speed of growth in creditto the private sector, thus boosting investor confidence and accelerating medium-term growth, cutting public debt, and reducing the risk of external debt distress.37
However, the SNHIS, which was enshrined in legislation in 2010 and updated in2014, continues today to provide an interest rate subsidy for mortgages.
Property marketsCabo Verde has an efficient property registration system. Registering a propertytakes 22 days, the same as OECD high income countries and more efficient than

Africa Housing Finance Yearbook 2018
87
the regional average of 59.3 days, and costs 2.3 percent of the property value,below both the OECD (4.2 percent) and Sub-Saharan Africa (7.8 percent) rates.38
The country has a functional deeds registry, which takes between one and threedays to obtain a certificate proving ownership of a property at a cost of CVE 1 130(US$11.89) and seven days to register a new public deed with the propertyregistry at a cost of CVE 24 150 (US$254). Act 9 Decree of law 10/2010 specifiesthe law governing the Conservatoria do Registo Predial (Land Registry), for whichthere is an electronic database, and which does not yet include all properties inCabo Verde. The database can be checked for mortgages on the property, butthere is no electronic record on cadastral information.39
There are a number of established estate agents offering rentals and propertiesat a wide variety of price points. They are relatively formal and operate on CaboVerde’s larger islands. However, they are largely focused on catering tointernational demands, which are seen as a means of adding to the economy. Tofurther grow this sector, permanent residence permits are issued to foreignnationals who acquire properties worth a minimum of EUR 80 000 (US$94 000)in municipalities where GDP per capita is lower than the national average and formore than to EUR 120 000 (US$141 000) where GDP per capita is higher thanthe national average. The policy includes the exemption of Single Property Taxfor the property involved as well as a further 50 percent reduction in the tax dueover the next 10 years. Further, retired resident card holders with incomesgenerated outside Cabo Verde are exempt from Personal Income Tax.40
Property development and investment is dominated by, and caters to, the luxuryand resort development portfolio. This supports the objectives of the governmentto foster economic stability and FDI, however there is hardly any detailedinformation around the actual delivery of affordable, low-cost or social housing.The housing market is driven and dominated by the expatriate and tourism sector.Furthermore, the financial burden of the ineffective IFH on the government reflectsa poorly operated mechanism for housing programme development.
Policy and regulationThe reforms pursued by the government since the economic slowdown havebeen extensive and varied. On the regulatory side, new laws have been passedfor the financial sector (Lei n. 61/VIII/2014 and Lei n. 62/VIII/2014) and microfinancesector (Lei n. 83/VIII/2015), and for urban planning (Lei n. 60/VIII/2014) and areunder consideration for a deposit guarantee fund and land use management.
Law 83/VIII/2015, relates to MFIs, allowing for three types: deposit-taking,community savings and credit cooperatives, and financial intermediaries for thediaspora.41 The establishment of the law was expected to increase the numberof commercial MFIs in a sector that has been largely driven by the non-profitsector. There are five MFI’s registered under the BCV,42 of which the Associaçãode Apoio às Iniciativas de Autopromoção Familiar, the Association to Support FamilySelf-Improvement Initiatives, is the only MFI providing loans for housing, although
more detailed information as to the specific nature of these loans and conditionswas not available.
The rental market is regulated, allowing for a maximum increase of rent by8.3 percent a year. The tenant has the right to reject a suggested rental increaseand terminate the rental agreement with one month notice if this happens. Inaddition, if the contract does not explicitly stipulate future possible rental increases,the landlord may not raise rentals for a period of five years. Landlords are notallowed to demand more than a month’s rental upfront and can only evict a tenantwith permission from a court. The rental legislation is Decree-Law 47.344, of25 November 1966, as amended by Decree-Law 12-C/97, of 30 June 1997.
Another important regulation is the requirement for tax clearance to be issuedto purchase property, as the municipality will only transfer the deed once propertytaxes are paid. All transfers involve site inspections by municipalities. In 2013,Cabo Verde introduced tax incentives for large investments, and in 2014, itcommenced with the digitisation of its deeds registry.
OpportunitiesCabo Verde faces the enormous challenge of building an economy with a highlevel of sustainable and inclusive growth to overcome key constraints, structuralvulnerabilities, external dependence, unemployment, poverty, inequality in incomedistribution, and reduced opportunities for emigration and consequent drop inremittances, on which there is high reliance.43 The country is constrained bynatural vulnerabilities related to its volcanic origin, its island-made nature, itslocation in the Sahel region, scarcity of rainfall and lack of mineral resources.44
Any real development opportunities which could be explored will be constrainedby Cabo Verde’s small territorial, demographic and economic size and its isolationfrom the African continent.
The financial sector is risk averse and as such leans more toward a selectproportion of the economy and foreign nationals looking to purchase secondhomes. The high-end housing market revolves around an encouragement ofspending within the tourism sector and developing stock to cater for furthergrowth in that market.
Given the geography and high cost of construction due to a dependence onimports, a large-scale housing development is unlikely to be an effective solution.Through more extensive studies on the status of housing within the affordableand low income sector, it may be found necessary to reinforce subsidies andfunding support programmes for the refurbishment and maintenance of existing,degrading stock and a means of reinforcing the access to services in less formalsettlements. The core opportunities for housing development should also befocused or localised around the urban centers, where there is a growing demandfor housing supply at this level.
PPP$40 001 – PPP$10 000 000
PPP$23 001 – PPP$40 000
PPP$12 001 – PPP$23 000
PPP$8 001 – PPP$12 000
PPP$5 001 – PPP$8 000
PPP$3 601 – PPP$5 000
PPP$2 401 – PPP$3 600
PPP$1 601 – PPP$2 400
PPP$801 – PPP$1 600
<PPP$800
- - - Average annual household income needed for the cheapest newly built house by a formal developer, 2017 Average annual household income using expenditure, 2017 (PPP$)
CABO VERDE
Annual income profile for rural and urban households based on consumption (PPP$)
No. of households (thousands)
PPP$13 624
PPP$31 122
Rural Urban25 20 15 10 5 0 5 10 15 20 25
Population: 560 899
Urbanisation rate: 1.97%
Cost of cheapestnewly built house:
2 912 634 CVEPPP$63 318
Urban householdsthat could afford thishouse with finance:
29.70%
1 PPP$:46 Cape Verdean
Escudo
Source https://www.cgidd.com/

88
SourcesAfrican Development Bank Group (2018). Cabo Verde Economic Outlook.https://www.afdb.org/en/countries/west-africa/cabo-verde/cabo-verde-economic-outlook/ (Accessed 31 July 2018).
African Development Bank (2014). Cabo Verde Country Strategy Paper 2014-2018. https://www.afdb.org/fileadmin/uploads/afdb/Documents/Project-and-Operations/2014-2018_-_Cape_Verde_Country_Strategy_Paper.pdf (Accessed31 July 2018).
BCA (2018). Crédito Habitação.http://www.bca.cv/Servicos/Simuladores/Credito.aspx?sidc=0&idc=339&idl=1(Accessed 31 July 2018).
BCV (2016). Financial Stability Report.http://www.bcv.cv/SiteCollectionDocuments/2017/Financial%20Stability%20Report%202016.pdf (Accessed 31 July 2018).
Banco de Cabo Verde (2018). Monetary Policy Report April 2018.http://www.bcv.cv/SiteCollectionDocuments/2018/RPM_ABRIL%20VI%202018.pdf (Accessed 23 August 2018).
Banco de Cabo Verde (2016). Relatório de Estabilidade Financeira 2016.
Banco Comercial do Atlântico (BCA) (2017). Folheto de Comissoes eDespesas e Folhetos de Taxas.Caixa.
Banco Internacional de Cabo Verde (n.d). Crédito à Habitação BI Casa.
Caixa Económica de Cabo Verde (Caixa) (2017). Precário: Entrada em Vigo: 02de Maio de 2017.
Coface (2018). Economic Studies and Country Risks - Cabo Verde.http://coface.org/Economic-Studies-and-Country-Risks/Cape-Verde (Accessed31 July 2018).
Development Initiatives (2017). Country Profiles - Cape Verdehttp://data.devinit.org/pdf/20170331/Cape-Verde.pdf (Accessed 1 August2018). Pg. 4.
Doing Business (2018). Ease of Doing Business in Cape Verde.http://www.doingbusiness.org/data/exploreeconomies/cabo-verde (Accessed31 July 2018).
Fouda, L. M (2018). IMF Press Release No. 18/27 IMF Staff Completes 2018Article IV Discussions with Cabo Verde.https://www.imf.org/en/News/Articles/2018/01/26/pr1827-imf-staff-completes-2018-article-iv-discussions-with-cabo-verde (Accessed 31 July 2018).
Global Property Guide (2017). Cape Verde's tourism boom to continue.https://www.globalpropertyguide.com/Africa/Cape-Verde (Accessed 10 Sept2018).
Instituto Nacional de Estastica (2016). Familias e Condições de Vida_IMC2016.
National Directorate of Planning (2018). Sustainable Development Goals-Voluntary National Report on the Implementation of the 2030 Agenda forSustainable Development.https://sustainabledevelopment.un.org/content/documents/19580Cabo_Verde_VNR_SDG_Cabo_Verde_2018_ING_final_NU_280618.pdf (Accessed2 September 2018).
Nshimyumuremyi, A. (2018). African Economic Outlook Cabo Verde.https://www.afdb.org/fileadmin/uploads/afdb/Documents/Generic-Documents/country_notes/Cabo_Verde_country_note.pdf (Accessed 31 July2018).
Numbeo (2018). Cost Of Living. https://www.numbeo.com/cost-of-living/country_result.jsp?country=Cape+Verde (Accessed 31 July 2018).
Making Finance Work for Africa (2018). Cape Verde – Financial Sector Profile.https://www.mfw4a.org/index.php?id=283 (Accessed 31 July 2018).
Oricco, I. (2015). O Microcrédito Em Cabo Verde: Importância do Microcréditona Criação de Negócios Locais na Ilha De Santiago. Dissertação, InstitutoPolitecnico do Lisboa.
Trading Economics (2018). Cabo Verde Indicators.https://tradingeconomics.com/cape-verde/indicators (Accessed 31 July 2018).
UN Habitat (2018). Cape Verde. https://unhabitat.org/cape_verde/ (Accessed2 September 2018).
The World Bank (2017). Cabo Verde: Access to Finance for MSMEs (P163015).http://documents.worldbank.org/curated/en/825171511262268770/pdf/Project-Information-Document-Integrated-Safeguards-Data-Sheet-Cabo-Verde-Access-to-Finance-for-MSMEs-P163015-Sequence-No-00.pdf (Accessed 2 September2018).
The World Bank (2018). Overview.http://www.worldbank.org/en/country/caboverde/overview (Accessed 31 July2018).
1 The World Bank (2018). Overview.http://www.worldbank.org/en/country/caboverde/overview (Accessed31 July 2018).
2 African Development Bank (2014). Cabo Verde Country StrategyPaper 2014-2018.https://www.afdb.org/fileadmin/uploads/afdb/Documents/Project-and-Operations/2014-2018_-_Cape_Verde_Country_Strategy_Paper.pdf(Accessed 31 July 2018). Pg. 4.
3 Coface (2018). Economic Studies and Country Risks- Cabo Verde.http://coface.org/Economic-Studies-and-Country-Risks/Cape-Verde.(Accessed 31 July 2018).
4 Corface (2018).5 African Development Bank Group (2018). Cabo Verde Economic
Outlook. https://www.afdb.org/en/countries/west-africa/cabo-verde/cabo-verde-economic-outlook/ (Accessed 31 July 2018).
6 African Development Bank Group (2018).7 Nshimyumuremyi, A. (2018). African Economic Outlook Cabo Verde.
https://www.afdb.org/fileadmin/uploads/afdb/Documents/Generic-Documents/country_notes/Cabo_Verde_country_note.pdf (Accessed31 July 2018). Pg. 2.
8 Nshimyumuremyi, A. (2018). Pg. 2.9 Trading Economics (2018). Cabo Verde Indicators.
https://tradingeconomics.com/cape-verde/indicators (Accessed 31 July2018).
10 African Development Bank Group (2018).11 Ibid.12 Nshimyumuremyi, A. (2018).13 The World Bank (2017). Cabo Verde: Access to Finance for MSMEs
(P163015).http://documents.worldbank.org/curated/en/825171511262268770/pdf/Project-Information-Document-Integrated-Safeguards-Data-Sheet-Cabo-Verde-Access-to-Finance-for-MSMEs-P163015-Sequence-No-00.pdf(Accessed 2 September 2018). Pg. 5.
14 Banco de Cabo Verde (2016b). Relatório de Estabilidade Financeira2016. Pg.23.
15 The World Bank (2017). Pg. 5.16 Ibid.17 Nshimyumuremyi, A. (2018). Pg. 6.18 The World Bank (2017). Pg.5.19 Making Finance Work for Africa (2018). Cape Verde – Financial Sector
Profile. https://www.mfw4a.org/index.php?id=283 (Accessed 31 July2018).
20 Making Finance Work for Africa (2018).21 Banco Comercial do Atlântico (BCA) (2017). Pg. 37.22 Caixa Económica de Cabo Verde (Caixa) (2017). Precário: Entrada em
Vigo: 02 de Maio de 2017. Pg.62.23 Banco Interatlântico (BI). (n.d.) Crédito à Habitação BI Casa.24 Ibid.25 Doing Business (2018).
http://www.doingbusiness.org/data/exploreeconomies/cabo-verde(Accessed 31 July 2018).
26 National Directorate of Planning (2018). Voluntary National Report onThe Implementation of The 2030 Agenda For Sustainable Development.https://sustainabledevelopment.un.org/content/documents/19580Cabo_Verde_VNR_SDG_Cabo_Verde_2018_ING_final_NU_280618.pdf(Accessed 2 September 2018). Pg. 8.
27 National Directorate of Planning (2018). Pg. 14.28 Numbeo (2018). Cost Of Living. https://www.numbeo.com/cost-of-
living/country_result.jsp?country=Cape+Verde (Accessed 31 July2018).
29 Numbeo (2018).30 BCA (2018). Crédito Habitação.
http://www.bca.cv/Servicos/Simuladores/Credito.aspx?sidc=0&idc=339&idl=1 (Accessed 31 July 2018).
31 National Directorate of Planning (2018). Pg. 88.32 Ibid.
33 UNHabitat (2018). Cape Verde. https://unhabitat.org/cape_verde/(Accessed 2 September 2018).
34 Instituto Nacional de Estastica (INE) (2016).35 Global Property Guide (2017). Cape Verde's tourism boom to
continue. https://www.globalpropertyguide.com/Africa/Cape-Verde36 Global Property Guide (2017).37 Fouda, L. M (2018). IMF Press Release No. 18/27 IMF Staff Completes
2018 Article IV Discussions with Cabo Verde.https://www.imf.org/en/News/Articles/2018/01/26/pr1827-imf-staff-completes-2018-article-iv-discussions-with-cabo-verde (Accessed31 July 2018).
38 Doing Business (2018).39 Doing Business (2018). 40 Global Property Guide (2017).41 Oricco, I. (2015). O Microcrédito Em Cabo Verde: Importância do
Microcrédito na Criação de Negócios Locais na Ilha De Santiago.Dissertação, Instituto Politecnico do Lisboa. Pg. 64.
42 BCV (2018). Supervision of Micro Finance- Registered Institutions.http://www.bcv.cv/vEN/supervision/supervisionofmicrofinance/registeredinstitutions/Paginas/Instituicoesinscritas.aspx (Accessed 2 September2018).
43 National Directorate of Planning (2018). Sustainable DevelopmentGoals - Voluntary National Report on the Implementation of the 2030Agenda for Sustainable Development.https://sustainabledevelopment.un.org/content/documents/19580Cabo_Verde_VNR_SDG_Cabo_Verde_2018_ING_final_NU_280618.pdf.(Accessed 2 September 2018). Pg.8.
44 National Directorate of Planning (2018). Pg. 8.

Africa Housing Finance Yearbook 2018
89
agricultural, forestry and pastoral production are increasing. The mining industryhas huge potential with new deposits continuously discovered, creating newopportunities for construction and the provision of subsidised, affordable housing.Major industries include petroleum production and refining, aluminium production,food processing, light consumer goods, textiles, lumber and ship repairs. However,huge investments in infrastructure and enhancement of the business environmentare required to increase this sector’s value. This is being addressed by thegovernment with ongoing projects to increase electricity supply through theconstruction of new hydroelectricity power plants and incentives to encourageprivate sector investment in specific manufacturing sectors such as the deep seaport in Kribi and the Lom Pangar hydropower project. A natural gas-poweredelectricity generating plant has also been opened to diversify the energy sector.Growth in this sector and the increasing investments in infrastructure will enablethe expansion of the residential real estate market.
The services sector is dynamic and dominated by transport, business and mobiletelecommunications, construction, retail trading, hotel and catering and the financialservices industry. The growth of these sectors alongside a growing middle classpresents new opportunities for subsidised affordable housing and housing financegiven the current inadequate end-user housing finance opportunities.
OverviewCameroon is the dominant economy and most significant market in the Economicand Monetary Community of Central Africa (Communauté Économique etMonétaire de l'Afrique Centrale, or CEMAC) because of the size of its economyand its growing population. It is located in Central Africa and shares a border withChad, Central Africa Republic, Equatorial Guinea, Gabon and Nigeria.1 It is a lowto middle income country with a population of just below 25 million people, andan annual 2017 population growth rate of 2.62 percent.2
Cameroon was colonised by Britain and France. French Cameroon becameindependent in 1960 as the Republic of Cameroon. The following year, Britishtrust territory of Southern Cameroons voted to merge with French Cameroonto form the Federal Republic of Cameroon. In 1972, a new constitution replacedthe federation with a unitary state, the United Republic of Cameroon.3 The nameof the country was later changed by presidential decree to The Republic ofCameroon. Southern Cameroon is currently engaged in a protracted battle withthe government of Cameroon as it seeks to separate from the rest of the country.If these tensions do not ease, they could lead to a civil war in the country.
Cameroon’s economy – CEMAC’s engine for agricultural/industrial productionand commercial services – saw a slowdown in economic activity and growth in2017 due to a sharp decline in oil production and the unrest in the two English-speaking regions of the country. Economic growth is projected to reach fourpercent in 2018 mainly due to the start of natural gas production and constructionwork for the upcoming Africa Cup of Nations tournament.4 Cameroon achievedan improved ranking of 163 in the 2018 Doing Business Report for ease of doingbusiness.5 Economic growth, increasing local and foreign direct investments, anda growth in population have created a growing middle class with a strong demandfor products and services, including housing.
Modest oil and other mineral resources as well as favourable agricultural conditionsprovide Cameroon with one of the best-endowed primary commodity economiesin Sub-Saharan Africa. It has the most diverse economy in the CEMAC region witha vision to become an upper middle income economy by 2035.6 According tothe World Bank, for this vision to be realised, it will have to increase productivity,unleash the potential of its private sector and grow its GDP by eight percentbetween 2015 to 2035. As part of its industrialisation efforts, efforts to develop
CameroonKEY FIGURES
Main urban centresYaoundeDouala
Exchange rate: 1 US$ = [a] 25 Jul 2018PPP Exchange rate (Local currency/PPP$) 1 CFA = [b]Inflation 2016 [c] | Inflation 2017 [c] | Inflation 2018 [c]
560.24 Central African CFA228.000.87 | 0.64 | 1.14
Population [d] | Urban population size [d] Population growth rate [d] | Urbanisation rate [d]Percentage of the total population below National Poverty Line [e]Unemployment rate [b]
24 994 885 | 14 097 1152.6% | 3.63%37.50%4.3%
GDP (Current US$) 2017 [b] | GDP growth rate annual 2017 [b]GDP per capita (Current US$) 2017 [b]GNI per capita (Current US$) 2017 [b]Gini co-efficient [f]HDI global ranking [g] | HDI country index score [g]
US$34 799 million | 3.18%US$1 446US$1 36046.50153 | 0.518
Is there a deeds registry? Number of residential properties that have a title deed Lending interest rate [d] Mortgage interest rate [h] | Mortgage term (years) [h]DownpaymentMortgage book as a percentage of the GDPEstimated number of mortgages Price to Rent Ratio in City Centre | Outside City Centre Gross Rental Yield in City Centre | Outside City Centre Construction as a % of GDP [i]
Yesn/a13.50%20% | 2020%n/an/an/a | n/an/a | n/a3.40%
What is the cost of standard 50kg bag of cement? What is the price of the cheapest, newly built house by a formaldeveloper or contractor? (Local currency)What is the price of the cheapest, newly built house by a formaldeveloper or contractor? (US$) What is the size of this house (m2)? What is the average rental price for this unit (US$)? What is the minimum stand or plot size for residential property?
US$7.00
12 000 000 Central African CFA
US$21 600100m2
US$36050m2
Ease of Doing Business Rank [j]Number of procedures to register property [j]Time to register property (days) [j]Cost to register property (as % of property value) [j]
163586 days19.00%
NB: Figures are for 2018 unless stated otherwise.
[a] Coinmill.com[b] World Bank World Development Indicators[c] Statista.com[d] Central Intelligence Agency (CIA) World Factbook[e] Trading Economics[f] Indexmundi[g] UNDP Development Indicators[h] Banque Internationale du Cameroun Pour l'Epargne et le Crédit[i] African Development Bank
90
Access to financeThough Cameroon’s financial system is the largest in the CEMAC region, it is stillin its infancy. There are 14 commercial banks and 412 licensed microfinanceinstitutions (MFIs),7 as well as non-banking financial establishments and foreignexchange bureaus. There is also the Douala Stock Exchange.8 The banking sectoris highly concentrated in the main urban areas and dominated by foreigncommercial banks. Banks readily lend to government, multinationals and businessesbut neglect retail and small businesses. Cameroon has a large unbanked populationas only 15 percent of the population bank with commercial banks. Somecommercial banks provide some housing-related finance in the way of mortgageloans.
According to the 2018 Doing Business Report, Cameroon’s ranking significantlyimproved to 68th in the ease of getting credit.9 Mobile banking is increasingfinancial accessibility with companies such as MTN and Orange offering this service.
The Bank of Central African States (Banque des Etats d’Afrique Centrale/BEAC)regulates the banking and MFI sectors through the Central African BankingCommission (COBAC). Both COBAC and the Ministry of Finance and Budgetlicense banks, and there are special regulations for small-scale credit co-operatives.The system is bank-centred, and the commercial banks in the country mainly fulfiltraditional banking functions, with a tendency to prefer dealing with large,established companies, government and medium to high net-worth individuals.The long-term credit market remains underdeveloped. The distribution of banksis heavily skewed towards the main urban and semi-urban centres, with a significantpart of the semi-urban and rural parts of the country denied access to formalbanking facilities. This is a gap that MFIs are exploiting.
Access to housing finance is very low, available mainly to government employeesthrough the government agency, Crédit Foncier du Cameroun. Only about fivepercent of Cameroonians have access to mortgage finance from the formal privatebanking system. The government continues to inject more funds into CréditFoncier, and has instituted reforms such as providing financial guarantees andbroadening assets that can be used as collateral to make it easier to access housingfinance. Property developers and private equity funds with money are gettinginto local partnerships to provide end-user financing for housing. A fewpartnerships are already in place: Ecobank and Credit Foncier du Cameroun,10
and China Development Bank and Afriland First Bank,11 which help provide end-user financing to individuals to buy or build houses. Title deeds are attached toonly a small percentage of land because implementing the legal provisions on landownership has been impeded by jurisdictional disputes as well as the high cost oftitle deeds. In 2012, Cameroon made amendments to the Organisation for theHarmonisation of Business Law in Africa (OHADA) Uniform Act on SecuredTransactions that broadened the range of assets that can be used as collateral,making it easier for people to access finance.
Microfinance is mainly managed by associations, or savings and credit institutionsand co-operatives. The licensed establishments have many branches across thecountry, a growing client base, and total savings of more than US$1 billion.12
About half of the MFIs belong to the largest network of MFIs, the CameroonCooperative Credit Union League (CamCCUL). While MFIs have becomeincreasingly important, their development has been hampered by a looseregulatory and supervisory framework. The conditions to carry out microfinanceactivities are defined at the sub-regional level by CEMAC.
Liquidity is a problem, and many MFIs are only able to satisfy a third of theircustomers at any time, depending on their credit requirements. To address theliquidity issue and to make more funds available to finance activities, includingproviding housing finance, the government has established a wholesale fund,financed by the African Development Bank (AfDB). The fund is worth CFA21 billion (US$40 million) and has helped to usher in financial reforms.
Under Article 5 of the governing regulations, an MFI may be classified as categoryone, two or three.13 Category one are co-operative institutions that providesavings opportunities exclusively to members, cannot seek profits and exist solelyto empower their members. Category two are profit-seeking MFIs that offersavings and credit facilities to the public. Category three MFIs are profit-seekingand provide credit services to the public but do not accept savings.
The most popular credit institution is called njangi by English-speaking people andtontines by French-speaking people. This rotating savings model is usually madeup of people of the same social class, same community or same cultural affiliationwho have similar incomes or who engage in similar activities. Two types arecommonly used for housing purposes: rotating funds, and savings and loans funds.
Rotating funds involve groups of individuals who come together on a regular basiswith agreed fixed sums of money that is interest-free. At each meeting, a lumpsum is given to one of the group members. The member who receives the moneyis agreed in advance by consensus among the group, and the number of membersdetermines the loan period. A slightly different rotating savings model, made upof individuals with different income brackets, is more flexible. The money collectedis auctioned and those who have not yet received a loan may bid for it. The personwith the highest bid gets the loan.
Savings and loan funds allow members to contribute more than the agreed regularsum of money into a savings fund that is then loaned to other members in needwith interest of 10 percent to 15 percent. The saver may withdraw the moneybut only after sufficient notification has been given to the association. This moneyearns interest for the saver.
AffordabilityThe unemployment rate in Cameroon is 4.214 percent as of 2017, withunderemployment reported to be about 76 percent, which may worsen giventhe current socioeconomic and political situation in the country. The populationbelow the poverty line is reported to be 37.5 percent as of 2014. The nationalGini-index is 46.5 suggesting relatively high levels of inequality.15 Cameroon hasa Human Development Index value of 0.556.16 This puts the country in theMedium Human Development category. Most people (70 percent) earn anincome or survive in the informal economy through subsistence agriculture andsmall, micro and medium-scale businesses. The formal private sector is not welldeveloped, employing a very small percentage of the labour force. Thegovernment, through its agencies and parastatals, is the largest formal sectoremployer. The average monthly income per household in the formal public sectoris CFA 150 000 (US$270), which is slightly lower than the average income perhousehold in the private sector at CFA 175 000 (US$315). Average rental pricesfor three-bedroom accommodation range from CFA 60 000 (US$108) toCFA 125 000 (US$225) on average in urban and semi-urban areas respectively.Most families receive monthly remittance from the growing population in thediaspora. Remittance inflows from the diaspora into Cameroon continue toincrease. In 2016, the value for personal remittances received in US dollars wasestimated at 242 billion.17 These funds are used primarily for the basic needs offamilies back in Cameroon and to fund projects for those in the diaspora.
Building costs are high. It is difficult to build houses with uniform standards at acost accessible to lower and middle income people. This has led to a discrepancybetween production costs and purchasing power. Government has helped toreduce housing production costs to make housing more affordable by establishinggovernment agencies such as Maetur to encourage the use of local materials andto reduce the price of land and inputs such as cement and sand. It has alsostepped up funding for government agencies in this sector. Companies such asQuality Habitat Corp have set up factories to manufacture building materials, whichshould reduce cost of inputs. The government is also rolling out affordable housingprojects across the country. Individuals provide 20 percent as their equityinvestment upfront and take a loan for the remaining 80 percent, which thegovernment guarantees.18 Though at a very slow pace, this is helping to improveaccess to quality housing as individuals in the private and informal sectors are alsobeneficiaries.
Housing supplyWith a population growth rate of 2.62 percent19 and an urbanisation growth rateof 3.63 percent,20 in 2017 Cameroon is 56.4 percent21 urbanised. The challengeis to provide housing for this growing and urbanising population, almost half ofwhich live in informal dwellings and settlements. The opportunity is to establishpartnerships across the housing value chain to meet the increasing demand forhigh-end and affordable housing in urban, semi-urban and rural areas of thecountry. In 2014, an estimated 55 percent of households owned their own homes,33 percent were tenants and 11 percent were accommodated free of charge.22
As the middle class grows, and rate of urbanisation increases, there is a shift from

Africa Housing Finance Yearbook 2018
91
ownership towards rentals especially for first time or new entrants in the urbanand semi-urban areas.
Despite ongoing efforts towards increasing housing supply, Cameroon’s housingbacklog is still significant. Government, private companies and individual investors(both local and in the diaspora) are looking to overcome the growing deficit ofmore than 100 000 units a year through ongoing investments in housing. A fewyears ago, the government estimated that up to one million homes needed to bebuilt within a 10-year period to adequately house the growing population. Ofthese, 300 000 are needed in the main cities of Douala and Yaoundé. Demandfor housing in the lower and upper ends of the market increases by up to10 percent annually. Government is using a public private partnership approachin projects to build new social housing units countrywide.
The housing market is not well developed. The main players include the state-owned Cameroon Real Estate Corporation (Société Immobilière du Cameroun/SIC), founded in October 1952 as a centrally funded company in charge of socialhousing and developing the real estate market for government. It works inpartnership with local and foreign private construction companies to handle large-scale projects and train the local workforce. SIC aims to build 100 000 new housesby 2022, 50 000 of which have already been built.23 Crédit Foncier du Cameroun,a building and loan association, is the top mortgage bank and provides funds forsocial housing to individuals and developers. The National Investment Corporationof Cameroon (Société Nationale d'Investissement du Cameroun) investsgovernment funds in profitable projects in different sectors.
Maetur acquires and develops land, which is sold to willing buyers at affordableprices. Mipromalo, the local material promotion authority, develops local materialsfor use by construction companies to reduce the cost of inputs and cost ofhousing. The three new cement companies established in 2015 have helped toincrease the supply of cement, currently estimated at 3.5 million tonnes a year,short of the required domestic demand estimated at five million tonnes a year.
The number of private developers is increasing. Options for Homes in Cameroon,a local subsidiary of a Canadian Housing company, is involved in a mixed-usedevelopment in the coastal city of Limbe aimed at high income earners. Phases Iand II, a total of 102 units of its current development, have been completed andsold out. Phase III of the project will be completed by the end of 2018.24 QualityHabitat Corp, a Cameroon subsidiary of a US-based company, has a plan to build2 000 houses annually. MG Constructions, a builder and property developer, hastwo major developments in the heart of Yaoundé and also in Douala, to becompleted by September 2019.25 Individuals (both locally and in the diaspora)are also heavily investing in housing, building standalone houses, mini cites and smallestates. Most private developers build and sell houses to the upper middle incomeand high-end market through the BOT (Build, Operate and Transfer) model.Private developers also partner with municipalities and communities to buildaffordable housing.
There are institutional problems, and although Cameroon has developed catalyticreal estate institutions, they suffer from dwindling public finance. New strategiesare urgently needed for the effective functioning of these institutions. Governmenttogether with its partners (local councils, energy utility company Eneo, the NationalWater Supply Company of Cameroon, SIC and Crédit Foncier), launched a projectin Douala and Yaoundé in 2009 to build 10 000 houses for low and middle incomeearners.26 This project is now completed. There are many new housing units builtby individuals entering the market for ownership and rental.
Phase I of a city council of Douala project which started in 2012 to build morethan 1 000 social, affordable and private houses along with community, commercial,retail and leisure facilities in the Mbanga-Japoma area of the Douala III council, ata cost of CFA 122.23 billion (US$220 million), is complete. It consists of50 buildings, comprising 300 apartments with one parlour and four bedrooms,and 700 apartments with one sitting room and three bedrooms. The city councilof Douala also has a project to deliver 2 500 affordable houses in Bonamatoumbe,with Phase I complete and Phase II ongoing.27
Government policy has placed more emphasis on homeownership. However, agrowing proportion of the population especially in the urban and semi-urban areasare seeking rental housing, while there is a huge shortage of rental housing units.Government has recognised the benefits of regulating and supporting rentalmarkets to complement ownership.
Property marketsThe formal real estate market is concentrated in urban and peri-urban areas suchas Yaoundé, Douala and Limbe, and churn is concentrated in the middle-to-highervalue market. Fifty-three percent of people own their own homes, which is mostlyself-built while 30 percent are tenants. Both housing for ownership and rental isin high demand. Despite the focus on ownership, there are increasingopportunities for rental accommodation. Because supply increasingly lags behinddemand, there is a constant minimum 10 percent year-on-year increase in houseprices for rental. On average, it takes up to one month to find qualityaccommodation in Douala, Yaoundé and other main cities. This time has notdecreased even with the increasing number of new housing units on the market.A growing number of real estate companies are providing buying/rental/management services to clients. On average, it can cost up to CFA 125 000(US$225) a month to rent a standard three-bedroom house in Douala andYaoundé. This amount is about 20 percent cheaper in the smaller cities such asBuea, Limbe, and Bamenda. It costs up to CFA 10 million (US$17 885) to build astandard three-bedroom house, excluding the cost of land in the main cities likeDouala and Yaoundé. This cost is about the same and can even be more expensivein the smaller cities due to input costs. The cost of standard inputs increases thefurther away from Douala as most of the standard inputs are imported ormanufactured around the main cities. The cost can be cheaper in the smaller citiesdepending on the inputs used. The average size of a standard three-bedroomhouse is 300m2. The cost of a serviced 500m2 piece of land in the urban areas is
PPP$40 001 – PPP$10 000 000
PPP$23 001 – PPP$40 000
PPP$12 001 – PPP$23 000
PPP$8 001 – PPP$12 000
PPP$5 001 – PPP$8 000
PPP$3 601 – PPP$5 000
PPP$2 401 – PPP$3 600
PPP$1 601 – PPP$2 400
PPP$801 – PPP$1 600
<PPP$800
- - - Average annual household income needed for the cheapest newly built house by a formal developer, 2017 Average annual household income using expenditure, 2017 (PPP$)
CAMEROON
Annual income profile for rural and urban households based on consumption (PPP$)
No. of households (thousands)
PPP$18 986
PPP$34 334
Rural Urban800 600 400 200 0 200 400 600 800
Population: 24 994 885
Urbanisation rate: 3.63%
Cost of cheapestnewly built house:
12 000 000 XAFPPP$52 632
Urban householdsthat could afford thishouse with finance:
4.42%
1 PPP$: 228 CFA franc
Source https://www.cgidd.com/
92
CFA five million (US$9 000). This cost drops in smaller cities such as Buea, Limbeand Bamenda.
There is a deeds registry but accurate figures on the number of deeds is notavailable. With an ease to register property rank of 176, it takes 86 days to registerproperty, and the cost to register is 19 percent of the property value with fiveprocesses to register the property.28
Policy and regulationThe national housing policy in Cameroon has evolved through three discernibleperiods: 1950-1976; 1977-2003/4; and 2004 to date.29 During the first phase,emphasis was on direct construction of houses by the government. During thesecond phase, emphasis and focus shifted from housing as shelter to developingthe total housing environment including providing and improving housing servicesand infrastructure. The current policy phase is focused on reassessing the habitatagenda. Emphasis is on construction of social infrastructural amenities andprovision/upgrading of basic services in informal settlements in partnership withlocal and international private sector partners.
Land tenure is still characterised by the coexistence of a traditional or customaryland tenure system, and a modern land tenure system. A land reform programmewas introduced in 1974 to unify the legal land systems used. Since then, OrdinanceNo. 74/1 and 74/2 of 6 July 1974 established rules governing land tenure and statelands respectively, and laws and decrees to amend and implement them. Law No.85/09 of 4 July 1985 relates to expropriation for public purposes and conditionsof compensation and constitutes the regulatory framework for cadastral surveyand land management. Decree No. 2005/178 of 27 May 2005 organises theMinistry of State Property and Land Tenure, while Decree 2005/481 of16 December 2005 amends and supplements some provisions of Decree No.76/165 of 27 April 1976, which lays down conditions for obtaining land certificates.These constitute the institutional framework for the implementation of landlegislation. The delay in implementing this framework is the main reason for thechaotic nature of land reform and the fact that title deeds are attached to only avery small percentage of land.
A credit registry database was established through legislation. This is improvingthe credit information system. Government also passed legislation that requiresinspection and notification before construction permits are issued. Governmenthas decentralised the process of obtaining building permits with a time limit of90 days. This is yet to be achieved as it still takes up to 135 days to obtain abuilding permit.
OpportunitiesCameroon’s housing sector continues to attract investment as there is a hugeneed for housing in all segments of the market and housing value chain. Privatecompanies such as Options for Homes in Africa, Quality Habitat Corporation,Cameroon Property Company, MG Constructions and Ottiz Real Estate as wellas an increasing number of individuals both local and in the diaspora are investingin the sector. Organised communities, NGOs and government at all levels(municipal, provincial, national) are also investing in the sector, mainly to providesocial housing. The government continues to implement reforms recommendedby the AfDB. Better regulation is making it easier for people to get title deeds for
their land, enhancing security of tenure and additional investment. Financial marketreforms are continuously being implemented to play an enabling role in developingthe housing sector. These reforms have helped to alleviate the problems relatedto the lack of serviceable land, delays in issuing construction permits and propertyregistration, undeveloped capital markets and an unresponsive banking sector.Government should continue with reforms, including building standards, productinnovation and financial stability to help realise the potential of the sector andenable it to play a more significant role in housing finance and housingdevelopment.
With economic growth, a huge and increasing housing backlog in all segments ofthe housing market, growing middle and upper classes, increasing capital inflowsfrom Cameroonians in the diaspora and other international investors, increasedlocal investment and better legislation and reforms, the housing market is destinedfor sustainable growth. As a result of the social, economic and political situationin the mainly English-speaking part of the country, there has been a slowdown incurrent and new projects as individuals and institutional investors are discouragedfrom further investments.
Despite the demand for up-market housing and the current focus of developerson the high-end housing market as a result of affordability and easier access tofinance, there is still a shortage of prime real estate. There are also new andemerging developers who are focusing on the middle class and lower incomegroups, as this presents the biggest opportunity for development and financingnow and in the future.
Additional sourcesAh-Yohoo (2018). “Strategic Position – Gateway to CEMAC Region.”http://ahyohoo.com/5-reasons-to-invest-in-cameroon-today/strategic-position-gateway-to-cemac-region (Accessed 11 Sept 2018).
African Development Bank Group (2018). Cameroon Economic Outlook.https://www.afdb.org/en/countries/central-africa/cameroon/cameroon-economic-outlook/ (Accessed 11 Sept 2018).
Afriland First Group (2018). “Afriland First Bank Cameroun signe un accord-cadre de 26 milliards FCFA avec la China Development Bank.”http://www.afrilandfirstgroup.com/index.php/fr/actualite-medias/5002-afriland-first-bank-cameroun-signe-un-accord-cadre-de-26-milliards-fcfa-avec-la-china-development-bank (Accessed 11 Sept 2018).
Djoumessi, E. (2009). Financial Development and Economic Growth: AComparative Study between Cameroon and South Africa.
Fotabong, A.L. (2012). The Microfinance Market of Cameroon: Analysing Trendsand Current Developments.
Ofeh, M.A. and Zangue Nguekeu J. (2017). Financial Performances ofMicrofinance Institutions in Cameroon: Case of CamCCUL Ltd. InternationalJournal of Economics and Finance. Vol 9. No. 4.
Websiteshttp://www.beincameroon.com/en/ www.minhdu.gov.cm www.cameroonpropertyagent.com www.cemac.int www.creditfoncier.cm www.habitatcameroon.comwww.investiraucameroun.com/ https://www.sni.cm/index.php?lang=fr www.statistics-cameroon.org
1 The World Bank (2018). The World Bank in Cameroon.http://www.worldbank.org/en/country/cameroon/overview (Accessed 10 Sept 2018).
2 Ibid.3 Central Intelligence Agency (CIA) (2018). World Factbook: Cameroon.
https://www.cia.gov/library/publications/the-world-factbook/geos/cm.html (Accessed 15 Sept 2018).4 Reuters (2018). “IMF says Cameroon's economic growth to rise to 4 percent in 2018.” 7 July 2018.
https://uk.reuters.com/article/cameroon-economy-imf/imf-says-cameroons-economic-growth-to-rise-to-4-percent-in-2018-idUKL8N1U308M (Accessed 15 Sept 2018).
5 World Bank (2018). Doing Business: Reforming to create jobs. http://russian.doingbusiness.org/~/media/WBG/DoingBusiness/Documents/Annual-Reports/English/DB2018-Full-Report.pdf (Accessed 11 September 2018).
6 Republic of Cameroon (February 2009). Cameroun Vision 2035.www.camerounenmarche.com/download/?lang=fr&strMode=getDoc&id=31 (Accessed 15 Sept 2018).
7 Koigi, Bob (2017). “Cameroon: 412 microfinance institutions greenlighted to operate in 2017.” 18 Jan 2017.Africa Business Communities. https://africabusinesscommunities.com/news/cameroon-412-microfinance-institutions-greenlighted-to-operate-in-2017.html (Accessed 15 Sept 2018).
8 Ministry of Finance. http://www.minfi.gov.cm/index.php/en/component/content/category/images/documents/Depenses_de_l_etat_par_chapitre_section_article_et_paragraphe/38-state%20expenditure%20per%20budgetary%20head%20section%20article%20and%20paragraph.pdf
9 World Bank (2018). Doing Business: Reforming to create jobs. 10 Credit Focier du Cameroun (2016). www.credit foncier.cm11 Afriland First Group (2014). www.afrilandfirstgroup.com.
12 ResearchGate (March 2017). Financial Performances of Microfinance Institutions in Cameroon: Case ofCamCCUL Ltd. https://www.researchgate.net/publication/315912196_Financial_Performances_of_MicrofinanceInstitutions_in_Cameroon_Case_of_CamCCUL_Ltd (Accessed 11 Sept 2018).
13 Ibid.14 Trading Economics (2018). https://tradingeconomics.com/cameroon/indicators15 Ibid.16 UNDP (2018). Human Development Indices and Indicators: 2018 Statistical Update Briefing note for countries
on the 2018 Statistical Update: Cameroon. http://hdr.undp.org/sites/all/themes/hdr_theme/country-notes/CMR.pdf (Accessed 15 Sept 2018).
17 Indexmundi (2017). https://www.indexmundi.com/facts/cameroon/indicator/BX.TRF.PWKR.CD.DT 18 Cameroon Real Estate Corporation (2017). https://www.sic.cm/index.php/fr/19 The World Bank (2018). The World Bank in Cameroon.20 Central Intelligence Agency (CIA) (2018). World Factbook: Cameroon.21 Ibid.22 SECPE Investments Inc. https://www.secpeinvestments.com/cameroon-real-estate/23 Cameroon Real Estate Corporation (2017). 24 Options International: Cameroon. www.optionsinternational.net/cameroon 25 Be in Cameroon (2016). http://www.beincameroon.com/en/26 Ministry of Economy, Planning and Regional Development: Cameroon Growth and Employment Strategy Paper
(2010).27 Business in Cameroon (2018). www.businessincameroon.com28 World Bank (2018). Doing Business: Reforming to create jobs.29 African Development Bank (2009). Cameroon: Diagnostic Study for Modernisation of the Land and Survey Sectors.

Africa Housing Finance Yearbook 2018
93
However, the country is undergoing an internationally supervised transitioninvolving several constitutional referendums as well as presidential andparliamentary elections.
Economic recovery which began in 2014, though uncertain at the start, isstrengthening gradually, with a real GDP growth rate that reached 4.5 percent in2017.1 This improvement is embedded in the recovery of the extractive sector,which surged by 22.8 percent following the partial suspension of the KimberleyProcess. Inflationary pressures, which were strong during the crisis, should lessenin 2017 and 2018 thanks to the recovery of transport in the Douala-Banguicorridor and to improved food supply. The inflation rate, which was as high as11.6 percent in 2014, was expected to gradually ease from an average of5.6 percent in 2015, to 4.7 percent in 2016 and 3.8 percent in 2017. CAR beinga member of Banque des états de l’Afrique Centrale (BEAC) which is the regionalcentral bank, lowered its benchmark interest rate by 50 basis points to an all-timelow of 2.45 percent in 2015. This loose monetary policy is likely to be transmittedto the country’s financial institutions.
Access to finance The 2018 World Bank Global Findex data report of Demirgüç-Kunt et al. (2018)shows that the percentage of the population who affirm having an account (bythemselves or together with someone else) at a bank or another type of financial
OverviewThe Central African Republic (CAR) lies landlocked at the heart of the Africancontinent. Aside from abundant land, CAR is well endowed with natural resourcessuch as timber, gold and diamonds.
Of the total population (5 625 118) in 2017, 32.45 percent is between 25 and54 years (male 913 363 and female 912 096). The urban population of CARincreased from 20.1 percent in 1960 to 40.65 percent of the total population in2017, growing at an average annual rate of urbanisation of 2.73 percent, higherthan the 2.12 percent total population growth rate. Subsistence agriculture,together with forestry and mining, remains the backbone of the economy:approximately 60 percent of the population lives in outlying areas, with the resultthat the agricultural sector generates more than half of GDP. Timber and diamondsaccount for most export earnings, followed by cotton.
Economic development faces hurdles which include the CAR's non-coastalgeography, poor transportation system, largely unskilled work force, and a longhistory of misdirected macroeconomic policies. Distribution of income isparticularly unequal. Despite the numerous grants from France and theinternational community, it has only been able to meet humanitarian needs. Since2009, the IMF and the government have worked hand in hand to institute reformsthat have resulted in some improvement in budget transparency, but otherproblems remain. International aid includes a three-year extended credit facilityvalued at US$116 million by the IMF. Also in late 2016, the World Bank approveda US$20 million grant to restore basic fiscal management, improve transparency,and assist with economic recovery. Participating in the Kimberley Process, acommitment to remove conflict diamonds from the global supply chain, partlylifted the ban on diamond exports from CAR in 2015. Gross Domestic Producthas failed to recover to its pre-2013 levels due to the continuous insecurity.
Since the end of 2012, CAR has been facing an increasingly complex political andhumanitarian crisis. Intensified armed opposition to the central government by acoalition of armed movements called Séléka resulted in a coup d’état in March2013, which was accompanied by numerous human rights violations and largeareas controlled by armed groups (80 percent of the territory). By the end of2013, one fifth of the population (one million persons) were displaced. At least1.2 million people have been forced from their homes. One in four people areeither internally displaced or have sought refuge in neighbouring countries. In2017, the number of internally displaced people increased by 70 percent.
Central African RepublicKEY FIGURES
Main urban centres Bangui
Exchange rate: 1 US$ = [a] 1 Aug 2018PPP Exchange rate (Local currency/PPP$) 1 CFA = [b]Inflation 2016 [c] | Inflation 2017 [c] | Inflation 2018
560.24 Central African CFA335.54.70 | 3.80 | n/a
Population [d] | Urban population size Population growth rate [d] | Urbanisation rate [d]Percentage of the total population below National Poverty Line 2014 [e]Unemployment rate [b]
5 625 118 | 2 283 7972.12% | 2.73%
56%6%
GDP (Current US$) [f] | GDP growth rate annual [f]GDP per capita (Current US$) 2017 [b]GNI per capita (Current US$) 2017 [b]Gini co-efficient 2010 [b]HDI global ranking 2016 [g] | HDI country index score 2016 [g]
US$2 000 million | 4.0%US$418US$39056.2188 | 0.352
Is there a deeds registry? Number of residential properties that have a title deed Lending interest rate Mortgage interest rate | Mortgage term (years)DownpaymentMortgage book as a percentage of the GDPEstimated number of mortgages Price to Rent Ratio in City Centre | Outside City Centre Gross Rental Yield in City Centre | Outside City Centre Construction as a % of GDP
Yesn/a2.95%15% | n/an/an/an/an/a | n/an/a | n/an/a
What is the cost of standard 50kg bag of cement? What is the price of the cheapest, newly built house by a formaldeveloper or contractor? (Local currency)What is the price of the cheapest, newly built house by a formaldeveloper or contractor? (US$) What is the size of this house (m2)? What is the average rental price for this unit (US$)? What is the minimum stand or plot size for residential property?
US$17
13 445 760 Central African CFA
US$24 00050m2
US$40050m2
Ease of Doing Business Rank [h]Number of procedures to register property [h]Time to register property (days) [h]Cost to register property (as % of property value) [h]
184575 days11.00%
NB: Figures are for 2018 unless stated otherwise.
[a] Xe.com[b] World Bank World Development Indicators[c] African Development Bank[d] Indexmundi[e] United Nations statistics[f] International Monetary Fund[g] UNDP Development Indicators[h] World Bank Doing Business

94
institution or report personally using a mobile money service in the past12 months has increased between 2011 and 2017. In general 14 percent,independently of age, level of education, level of income or gender, have an account.However, the percentage of respondents who report having an outstanding loan(by themselves or together with someone else) from a bank or another type offinancial institution to purchase a home, an apartment, or land is 5 percent; thisrate is 7 percent for the labour force (age more than 15), 2 percent for thepopulation out of the labour force (age more than 15), 6 percent for men,5 percent for women, 5 percent for the young adults (age between 15 and 24),5 percent for older adults (age more than 25), 5 percent for those with primaryeducation or less, 5 percent for those with secondary education or more,5 percent for the poorest 40 percent, 6 percent for the richest 60 percent and3 percent for the rural area. According to these most recent statistics, men receivemore housing loans than women, the labour force receives more loans than theout-of-labour force population and the richest receive more loans than thepoorest in CAR.
CAR is primed to establish a housing bank; leading officials of Shelter Africa Center,a real estate and housing firm based in Nairobi, Kenya are posing the possibility ofestablishing a bank for housing, according to a publication on APA news website.2
This is the result of a recent meeting between the company’s leading officials andthe Minister of Housing to find solutions to the difficulties of state officials withoutdecent housing. Shelter Africa intends to explore avenues for financing projectsthat involve the construction of social housing in the Central African Republic, toput an end to the crisis in the country’s housing industry. However, the Ministerwarned that for such a housing scheme to become a reality, the country has toreturn to lasting peace and security.3
Almost no housing finance instruments are available. The housing financelandscape remains underdeveloped, offering many opportunities for thedevelopment of this sub-sector. A few banks, such as Ecobank Centrafrique andthe Sahelo-Saharan Bank for Investment and Commerce, offer housing credit (overa maximum fifteen-year term) and credit for equipment (for a maximum of threeyears) to individuals at an interest rate of between 8.5 percent and 17 percent ayear, plus value-added tax (VAT), for up to CFA 50 million (US$85 280) for creditfor equipment and without maximum amount for housing credit. These loans aresecured by first-order mortgages on the concerned properties and are in generalsupplied to public and private administration workers. Additionally, according tothe World Bank database on housing finance provided by Badev et al. (2014),4
the minimum income required for a prudent mortgage in CAR is US$13 894 andonly 0.5 percent of the population can afford this; the access to the mortgagemarket is therefore challenging for almost all of the population.
In 2011 and 2012, government officials from the Ministry of Urban Developmentand Housing undertook several exchange visits to Senegal and Morocco to learnfrom these countries in view of creating a housing bank. Plans were to create ahousing bank named the Central African Housing Bank (Banque de l'Habitat dela Centrafrique), and a housing promotion agency (Agence Centrafricaine dePromotion de l'Habitat). The Housing Promotion Agency was created in 2009and fully staffed in 2011. However, the creation of the Central African HousingBank was never ratified.
As part of the Central African Economic and Monetary Community (CEMAC),CAR shares a common currency with other member states and delegatesmonetary policy to the BEAC. The financial sector is regulated by two regionalregulatory authorities named COSUMAF (Commission de Surveillance du MarchéFinancier de l'Afrique Centrale) to regulate financial institutions and COBAC(Commission Bancaire d'Afrique Centrale) to administer, regulate, and supervisecountries’ member banks; additionally, there is a Division of Financial Control atthe Ministry of Finance and Budget, which works as a national authority for financialinstitutions.
CAR made progress in providing access to finance until the last political crisis againdisrupted efforts. CAR's financial sector is the smallest in the CEMAC region andaccounts for only 17.6 percent of GDP; it is thus largely underdeveloped and playsonly a limited role in supporting economic growth. In addition to the BEACNational Office, the system currently comprises four commercial banks, holdingapproximately 93 percent of the total financial system's assets in addition to twomicrofinance institutions (MFIs), two post office banks, three insurance companies,
and a social security fund. Other financial institutions are largely absent from thecountry's financial system, and their development remains hampered by weakmarket infrastructure as well as the lack of the necessary legal, judicial, prudential,and regulatory frameworks. While the sector has seen some moderate expansionin recent years, financial intermediation levels are amongst the lowest in the world,and credit to the economy, which was 15 percent of GDP in 2014, representedonly 12.9 percent of GDP in 2017; and the main sectors benefitting from bankloans in the same year are trade (20 percent), transport and communications(16 percent), forestry (12 percent) and other services (28 percent).
Access to housing-related financial products remains a major challenge. Due toeconomic and security concerns, financial institutions, and particularly banks andMFIs, have largely consolidated their business in Bangui, the capital of the country.Bank branches and ATMs are mostly concentrated in three towns, with 71 percentof total branches located in Bangui. Coverage of banking services as measured bythe number of branches per 100 000 adults was only 0.96 percent in 2013.Ecobank Centrafrique is the most extensive banking company, with branches ineach of the main urban centers. Ecobank has 12 branches all over the country,although eight of these are located in Bangui. The post office is in charge of thepostal savings bank, primarily serving as a channel for salary payments to civilservants, a minimal percentage of whom hold a savings account. According to thelatest getting-credit indicator of the World Bank’s Doing Business Report (2018),CAR is ranked 142 out of 190 countries. About 5.7 percent of the populationholds a bank account and only 0.5 percent have outstanding loans, while only1 percent has access to MFIs. Low levels of mobile penetration also dampen thepotential expansion of access to financial services through mobile technology.
Between 2007 and 2011, UNCDF, UNDP, the CAR Government and variousplayers of the microfinance sector launched a four-year US$4 million programmenamed Programme d'Appui à l'Emergence d'un Secteur Financier Inclusif enRépublique Centrafricaine. The aim is to support the emergence of an inclusivefinancial sector in order to give the poor and low income population access tosustainable financial products and services provided by microfinance institutionsoperating in a sustainable legal and institutional framework. At the beginning of2010 there were only five licensed MFIs, comprising 31 branches and 32 000clients. Crédit Mutuel de Centrafrique is the most important MFI network in theCAR, with a gross loan portfolio of US$3.9 million shared by 6 109 accountowners, and deposits amounting to US$8.8 million in 2013. The Société FinancièreAfricaine de Crédit (SOFIA), another MFI, began operations in March 2009, andby end 2014 had 330 borrowers with total loans of US$0.24 million; however,during the same year, the SOFIA deposits amount was higher (US$3.25 million),highlighting the issue of financial access in CAR.
Affordability Affordability is of great concern in the CAR housing sector. The high cost ofbuilding materials, low incomes of Central Africans, and the general political andeconomic volatility make owning a house a mere dream for the average citizen.In 2017, a simple one-bedroom housing unit with a modern toilet costs on averageCFA 13.9 million (US$24 000). Compared to the average monthly income ofonly CFA 20 844 (US$36), the cost of a one-bedroom house represents 576times monthly revenue. It is obvious that only a tiny proportion of the CentralAfrican population can access formal housing.
The urban population rate was 40.65 percent in 2017 (with a forecast of 61.6percent in 2050). This increasing housing demand on one hand combined withthe very small proportion of the CAR population which can access formal housingon the other hand highlights the issue of housing affordability and the urgent needfor a clear policy to solve the issue.
A large number of Internally Displaced Persons (IDPs) occupy rental units(estimates are around 70 percent). Unsurprisingly, the main challenge for thisgroup of IDPs has been the inability to pay rent, having lost their livelihoods. InCarnot and Sibut the monthly rent varied between CFA 2 895 to 5 790 (US$5.27-US$10.54) while in Bangui this could be anything between CFA 52 110 to 579 000(US$94.9-US$1 054.47), depending on the size of the house and the mainpurpose of renting.
In 2017 a standard 50kg bag of cement cost as much as CFA 10 000 (US$18.21).Other building materials such as a standard iron bar and a sheet of corrugated

Africa Housing Finance Yearbook 2018
95
iron cost between CFA 2 000 (US$3.64) and CFA 8 500 (US$15.48), andCFA 5 000 (US$9.1) and CFA 20 000 (US$36.42), respectively. A majordevelopment in the housing sector in 2012 was the completion of the only cementmanufacturing plant in the country, realised with Indian investment. It wasexpected that the price of a standard 50kg bag of cement bag could drop toCFA 7 500 (US$13.66). However, the CAR’s energy problems will have to besolved first, and given the recent political crisis, it is not clear when this plant willhelp meet expectations.
Housing supplyThe recent political and security crisis has particularly damaged the prospects ofthe development of good standardised towns and cities. A government projectis underway to redesign urban/housing development and planning in Bangui, withthe main aim of bringing structure to its breakneck urbanisation and establishinga sustainable healthy housing environment. Since the emergence of the crisis, alarge portion of CAR’s housing stock has been pillaged, burnt or destroyed. TheUnited Nations High Refugee Commissariat estimates that at least 170 houses inBangui’s 8th district and 900 in the 5th district have been partially or completelydestroyed since December 2013. In Begoua, just north of Bangui, an estimated800 houses have been partially or completely destroyed. It is estimated that 100houses were partially or completely destroyed in Sibut town.
Even though the CAR Ministry of Housing has initiated and/or is implementingseveral projects, the recurring crises that the country experienced, has seriouslyinhibited the willingness of many international companies to build housing in CAR.For example, in 2011, the Ministry of Housing received funding from Celtel –Africa,a housing finance structure based in Nairobi, Kenya, to build 300 housing units ontwo sites, one in the neighbourhood Boy-Rabe (Bangui) and the other in the villageon the road Kozobilo Boali. Unfortunately, this last project has not beencompleted. Additionally, the Morocco kingdom has financed the construction of100 housing in Sakaï locality; however, even if the project is financed at 70 percent,the deadline has passed and the housing is not available.
Property marketsThe 1964 Land Code classifies land as being either within the public or the privatedomain of the state. The public domain is defined as all natural and artificialresources that, by their very nature, should be publicly managed for the benefit ofthe population. They are inalienable and cannot be traded commercially, forinstance waterways, classified parks, lakes and railways. The private domain of thestate is defined as all unregistered land, landholdings acquired by the state and theexercise of eminent domain. Obtaining ownership rights over land in the privatedomain of the state is possible. This requires, however, that land be registered(and in most cases developed). The process for registering private property,culminating in the attainment of a title deed, is considered costly and timeconsuming. According to the World Bank’s 2018 Doing Business Report, it takes75 days and 5 procedures, and costs on average 11.1 percent of the propertyvalue to register a property, resulting in a ranking of 169th out of 190 countries for
registry of property. This, as well as the government’s weak land administrationand management capacity in most parts of the country, explains the fact that only0.1 percent of land has been registered. Between 1899, when the title deed wasintroduced, and July 2012 only 8 579 title deeds had been issued according to theland registry at the Ministry of Finance, the majority of which were for propertiesin Bangui and other urban areas. Homeowners in rural areas frequently onlyentered into verbal agreements regarding their ownership, often with involvementof a chief. The inclusion of unregistered land in the private domain of the state istherefore a very significant feature of CAR’s land tenure system. Ownership ofregistered property can be transferred via purchase, inheritance and lease.
The real estate market in the Central African Republic is almost non-existent, asthere are no real estate operators in the country. As most houses are self-built,when owners want to sell they advertise in the newspapers or announce theirintention informally within their social networks.
Policy and regulation CAR’s legal system is based on the French civil law system. As with other branchesof government in CAR, the judiciary suffered from decades of insecurity and poorgovernance. Prior to the current crisis, several key legislative documents, such asthe Family Law (Code de la Famille) and the 1964 Land Code were under revision.Due to the events of late 2012 and early 2013 until today, these review processeshave not been concluded and other housing strategies and plans have been sidelined.
The decree explaining the organisation and functioning of the Ministry of Housingstipulates the construction, management and promotion of administrative housingas its main directive. Other officials indicated that the focus on housing providedfor civil servants would remain. The Ministry of Urbanism allocates and managesCAR’s land. It allocates land, to, for instance, private parties but also to biggerprojects such as housing schemes. The Ministry also manages the country’scadastre, provides technical expertise to assess and demarcate land, determinescriteria for the development of land and issues construction permits and titledeeds.
The technical aspect of the cadastre is complemented by the Ministry of Financeand Budget, which takes care of the financial side of land registration. It also housesthe land registration office (known as the Office of Domaines). This means thatonce the land registration office has issued a title deed, the related files aretransferred to and stored at the Ministry of Finance and Budget.
In addition to the existing regulation frameworks governing the housing sector,some recent policies have been implemented including:
n In 2017, the CAR introduced a new conciliation procedure for companies infinancial difficulties and a simplified preventive settlement procedure for smallcompanies in order to made resolving insolvency easier.
PPP$40 001 – PPP$10 000 000
PPP$23 001 – PPP$40 000
PPP$12 001 – PPP$23 000
PPP$8 001 – PPP$12 000
PPP$5 001 – PPP$8 000
PPP$3 601 – PPP$5 000
PPP$2 401 – PPP$3 600
PPP$1 601 – PPP$2 400
PPP$801 – PPP$1 600
<PPP$800
- - - Average annual household income needed for the cheapest newly built house by a formal developer, 2017 Average annual household income using expenditure, 2017 (PPP$)
CENTRAL AFRICAN REPUBLIC
Annual income profile for rural and urban households based on consumption (PPP$)
No. of households (thousands)
PPP$4 963
PPP$25 985
Rural Urban120 100 80 60 40 20 0 20 40 60 80 100 120
Population: 5 625 118
Urbanisation rate: 2.73%
Cost of cheapestnewly built house:
13 445 760 XAFPPP$40 077
Urban householdsthat could afford thishouse with finance:
3.27%
1 PPP$: 335.5 CFA franc
Source https://www.cgidd.com/
96
n Poverty Reduction and Growth Strategy (2011-2015): Over this period thegovernment aims to undertake the following housing interventions: createdecent housing for the population, provide the population with marked-outbuilding plots, and implement city planning systems. On this last objective,the country has received strong support from the African Development Bank,which will support Bangui’s City Development Strategy (CDS). The CDS was,however, not yet drafted before the crisis engendered by the March 2013coup d’état, and as a result, the current political situation is very likely to delaythe achievement of these goals.
Opportunities There is a huge need for cost-effective housing in all segments of the marketbecause of the high prices of building materials. Also, with the completion of thenew cement plant, which is expected to lower the price of cement, the effectivedemand for housing should increase over the coming years, while affordability isexpected to grow too. The outlook for growth in the current reconstructionperiod is high. This includes huge housing accumulation, growing middle and upperclasses, increased capital inflows from CAR citizens in the diaspora and otherinternational investors, increased local investment and better legislation andreforms. Additionally, the latest economic studies have found that reconstructionafter years of conflict which devastated infrastructure is a key determinant ofhousing finance (Nguena et al., 2016). Other planned structural reinforcementssuch as the potential housing bank are indicative of a market open for expansionand primed for the introduction of new finance and housing products.
SourcesAfrican Economic Outlook (2018). Central African Republic, 2018.
APA News (2017). “CAR to set up housing bank.”http://apanews.net/en/news/car-to-set-up-housing-bank (Accessed 11 Sept2018).
Badev, A., T. Beck, L. Vado & S. Walley (2014). “Housing finance across countries:New data and analysis”. World Bank Working Paper Series.
Demirgüç-Kunt, A., L. Klapper, D. Singer, S. Ansar, & J. Hess (2018). “The GlobalFindex Database 2017: Measuring Financial Inclusion and the FintechRevolution”. World Bank: Washington, DC.
Economist Intelligence Unit (EIU) (2015). Country Report: Central AfricanRepublic. 16 August 2015.
Government of Central African Republic (2000). National Report Istanbul+5.Bangui, 2000.
Government of Central African Republic (2008). Ministry of Public BuildingsReconstruction, Urban Development and Housing. Lettre de PolitiqueNationale de Développement du Secteur de l'Habitat en RépubliqueCentrafricaine. Bangui, 2008.
Government of Central African Republic (2008). Ministry of Public BuildingsReconstruction, Urban Development and Housing. Résumé du rapport destratégie nationale de l'habitat. Bangui, 2008.
Government of Central African Republic (2009). Ministry of Finance andBudget. Stratégie Nationale pour la Finance Inclusive en RCA. Bangui, 2009.
Government of Central African Republic (2011). Poverty Reduction StrategyPaper 2 2011-2015: Reducing Extreme Poverty. Bangui, 2011.
IMF (2014). Request for disbursement under the Rapid Credit Facility andcancellation of the Extended Credit Facility Arrangement- Staff Report; PressRelease; and Statement by the Executive Director for the Central AfricanRepublic. 1 May 2015.
The Mix. Central African Republic Economic Overview.www.themix.org/mixmarket/countries-regions/central-african-republic(Accessed 11 Sept 2018).
Nguena, C. L., F. Tchana Tchana & A. Zeufack (2016). Housing Finance andInclusive Growth in Africa: Benchmarking, Determinants and Effects. World BankPolicy Research Working Paper N°: WPS7902.
Trading Economics. Central African Republic Interest Rate 2009-2018.www.tradingeconomics.com/central-african-republic/interest-rate (Accessed11 Sept 2018).
UNHRC & Norwegian Refugee Council (2014). Displacement and Housing,Land and Property Rights in the Central African Republic. December 2014.
USAID (2010). Property Rights and Resource Governance: Central AfricanRepublic. USAID Country Profile.
World Bank (2016). Doing Business 2017: Central African Republic CountryProfile.
Websiteswww.globalfindex.worldbank.orgwww.lejustesalaire.com www.mfw4a.org/central-african-republic https://reliefweb.int/country/cafwww.izf.net/ancien/entreprise/num-5378
1 African Development Bank (2018). African Economic Outlook. Note pays CAR. https://www.afdb.org/fileadmin/uploads/afdb/Documents/Generic-Documents/country_notes/RCA_note_pays.pdf (Accessed 11 Sept 2018).2 APA News (July 2017). “CAR to set up housing bank.” 3 Ibid.4 Badev, A., T. Beck, L. Vado & S. Walley (2014).

Africa Housing Finance Yearbook 2018
97
Chad holds substantial oil reserves, which accounted for around 60 percent offiscal revenue from 2003 to 2013. However, the recent collapse in oil prices since2014, rainfall deficits and the deterioration in the security situation have severelyaffected the Chadian economy.8 The persistent violence in neighbouring countriescreates humanitarian, military and political risks for the country. Chad plays a keyrole in regional efforts to combat regional terrorism, including Boko Haram, andsupports an estimated 750 000 refugees and internally displaced persons, mainlyin its border regions.9
As a result of the economic impact of exogenous shocks (drop in oil prices, fallingdomestic oil production, and the rising inflows of refugees), authorities areimplementing an emergency action plan to address the fiscal crisis. This actionplan has resulted in significant spending cuts and the expenditure envelope hasbeen reduced to about half the 2014 level (in nominal terms). In recognition ofthe economic vulnerability caused by an over-reliance on the oil-based sector,efforts have been made toward economic diversification.10 To this end, a newfive-year National Development Plan (NDP), as part of the “Vision 2030, the ChadWe Want” plan, has been prepared and will provide a framework for economicpolicy from 2017. This policy focuses on: diversifying the sources of growth, liftingproductive capacity, boosting job creation, strengthening governance, and restoringpublic finances and external accounts. The implementation of this plan issupported by the IMF’s Extended Credit Facility (ECF) which has reportedly made
OverviewA land-locked country in central Africa, Chad gained independence from Francein 1960. It is one of the largest countries in Africa with an area of 1 284 000 km2
and a population of 14.7 million inhabitants. The population growth rate is3.02 percent1 with an urbanisation rate of 22.78 percent.2 Only 23.1 percent ofthe population live in urban areas, with half of them in N’Djamena alone. ChadRepublic is beset by regional instability, internal tensions between ethnic groupsand environmental challenges of desertification caused by climate change.3 Itsgeography results in a reliance on neighbouring countries and a sensitivity toregional conflicts.4 Furthermore, Chad has been heavily reliant on financial supportfrom the international community.5 President Idriss Deby and his party, thePatriotic Salvation Movement, have dominated politics since 1990, and in 2016Deby was re-elected as president for a fifth term. The Chadian constitution hasbeen amended recently to eliminate the prime minister position and give fullpower to the President under the Fourth Republic that reinstates the two-termlimit of six years starting after the elections of 2021.
Classified as one of the three least developed countries in the world with a rankof 186 out of 188 (Human Development Index), 46.7 percent of the populationlive below the national poverty line and 38.4 percent below the internationalpoverty line of less than US$2 a day.6 According to statistics from a UnitedNations Children’s Fund UNICEF study released in 2015, 78 percent of youngpeople and adults (15 years and older) are illiterate (70 percent male and86 percent female), only 19 percent are enrolled in secondary schools, and onlyfour percent progress to further technical and vocational programmes. Access toelectricity rose from two percent of the population in 2015 to four percent in2017. Only 12 percent of the population have access to sanitation (with 31.4percent for urban population and 6.5 percent for rural population). Mobile phonesubscriptions reach 40.2 percent of the population but remain below the regionalaverage. Internet access was limited to five percent in 2016.7
The Gini coefficient of 43.3 (2011) demonstrates an unequal distribution ofincome despite high levels of oil revenues. A total of 77.7 percent of households(less than two million) are rural, with only 9.2 percent (just under a quarter of amillion) living in major urban areas. According to UN Habitat, Chad’s averagehousehold size has consistently been around eight for the past two decades,though it is gradually decreasing, and is expected to be 7.5 in 2025.
ChadKEY FIGURES
Main urban centresMoundouNdjamena
Exchange rate: 1 US$ = [a] 10 Jul 2018PPP Exchange rate (Local currency/PPP$) 1 CFA = [b]Inflation 2016 [b] | Inflation 2017 [b] | Inflation 2018 [b]
561.05 Central African CFA200.9-1.90 | 3.10 | 3.60
Population [c] | Urban population size 2016 [b] Population growth rate [d] | Urbanisation rate [d]Percentage of the total population below National Poverty Line 2014 [c]Unemployment rate [b]
14 649 076 | 3 268 8763.05% | 3.77%
46.7%7%
GDP (Current US$) 2017 [b] | GDP growth rate annual 2017 [e]GDP per capita (Current US$) 2017 [b]GNI per capita (Current US$) 2017 [b]Gini co-efficient 2011 [c]HDI global ranking 2015 [f] | HDI country index score 2015 [f]
US$9 981 million | -2.95%US$670US$63042.1186 | 0.396
Is there a deeds registry? Number of residential properties that have a title deed Lending interest rate Mortgage interest rate | Mortgage term (years)DownpaymentMortgage book as a percentage of the GDPEstimated number of mortgages Price to Rent Ratio in City Centre | Outside City Centre Gross Rental Yield in City Centre | Outside City Centre Construction as a % of GDP [d]
Yesn/a14.00%8% | 5n/an/an/an/a | n/an/a | n/a20.00%
What is the cost of standard 50kg bag of cement? What is the price of the cheapest, newly built house by a formaldeveloper or contractor? (Local currency)What is the price of the cheapest, newly built house by a formaldeveloper or contractor? (US$) What is the size of this house (m2)? What is the average rental price for this unit (US$)? What is the minimum stand or plot size for residential property?
US$14
30 000 000 Central African CFA
US$55 000120m2
US$500450m2
Ease of Doing Business Rank [g]Number of procedures to register property [g]Time to register property (days) [g]Cost to register property (as % of property value) [g]
1809180 days20%
NB: Figures are for 2018 unless stated otherwise.
[a] Orabank[b] World Bank World Development Indicators[c] African Development Bank[d] Institut National de la Statistique, des Études Économiques et Démographiques (INSEED)[e] International Monetary Fund[f] UNDP Development Indicators[g] World Bank Doing Business

98
satisfactory progress to date. Approval of the conclusions of the Third and FourthReviews of the programme enabled the country to benefit from financial assistancein 2016 and 2017.11 These budgetary assistance supplements were provided bythe African Development Bank, the European Union (EU), France and the WorldBank.12 Financial assistance renewed in 2017 to support the national budget isexpected to continue through 2020.13
The dynamics of Chad’s political instability are complex and continue to pose athreat to regional and national stability and have a negative effect on the country’sinvestment climate.14 Chad is ranked 180 out of 190 countries on the WorldBank’s Doing Business Index for three consecutive years (2016, 2017, 2018) witha score of 38.30 in 2018, a decrease of 0.28 percent over 2017.
Access to financeChad is a member of the Central African Economic and Monetary Community(CEMAC), which has a regional central bank – the Bank of Central African States(BEAC). All banks in Chad are subject to oversight by the Central Africa BankingCommission, which is part of BEAC. Monetary policy is managed by BEAC, whichprioritises controlling inflation and maintaining the CFA franc peg to the euro. TheBEAC is expected to continue to broadly track European Central Bank policy,given the region’s economic and currency ties to the EU. In May 2017, BEAC keptits policy rate at 2.95 percent to boost regional credit growth and enhanceeconomic activity in the non-hydrocarbon sector.
Chad’s financial system is among the least developed in the CEMAC region and ischaracterised by limited debt and low monetisation. Access to financial servicesremains a major issue for the vast majority of Chadians, with banking servicesalmost non-existent outside of urban areas. With less than one branch per1 000 km2, Chad has the least dense banking network in the region. Only12 percent of the population have formal bank accounts, just 30 percent of therichest 20 percent; and only 2.4 percent of the adult population has access tocredit.
With the agreement of the Banque de l’Habitat du Tchad (BHT), and its formallaunching on 16 August 2017, there are nine commercial banks, two insurancecompanies, two pension funds and more than 200 microfinance institutions. Theinformal microfinance sector is very promising and dynamic. The number ofinstitutions increased from 160 in 2013,15 to 170 in 2015, to exceed 200 in 2017,making finance accessible to 10 223 000 people.16
The deteriorating economy has impacted the banking sector. Banks’ links to thegovernment are significant because of their exposure to government debt, andthe private sector’s dependence on government spending. The ongoing economiccrisis has therefore led to a drop in credit to the private sector (about 5.4 percentyear-on-year as of end-June 2016), and an increase in non-performing loans from11.7 percent of gross banking loans at end-2014 to more than 17 percent at end-June 2016.17
According to Findex 2014, 4.5 percent of adults have an outstanding mortgage.At 5.4 percent, a greater percentage of adults in rural areas had a mortgage thanthose in urban areas. Some banks provide mortgages and rates are set at between7-17 percent (2018). Orabank offers a mortgage for a loan repayment termbetween five and 10 years, at an average rate of nine percent not to exceed CFA30 million (US$53 436.59) to those who are formally employed, to privatecompanies or multinationals. The Sahel-Sahara Bank for Investment andCommerce also offers property loans. The newly created BHT is expected toprovide loans at rates between seven and eight percent for a 15-year term.
AffordabilityTypical of low income countries with dominant oil sectors, the capital city ofN’Djamena is ranked as the 15th most expensive city to live in for expatriates byMercer’s Cost of Living Survey, in its worldwide assessment of 209 cities in 2017,moving from number 9 in 2016.18 The unemployment rate was estimated at5.8 percent of the labour force given most are self-employed or working inagriculture and herding.19 The minimum wage is CFA 60 000 (US$106.87).20
According to Numbeo, the rental cost of a formal apartment in the city centreranges between CFA 675,365.67 (US$1 202.97) and CFA 1.35 million(US$2 404.65) a month. Prime residential rentals were around CFA 2 million
(US$3 562.44) a month in 2018, which is slightly down from 2017 as the marketis generally stagnant. Furthermore, to buy an apartment costs about CFA4.5 million (US$8 015.49) per square meter in the city centre and CFA 2.6 million(US$4 631.17) outside the city centre. In contrast, the average annual generalexpenditure per capita, in 2011, was CFA 231 190 (US$411.80), ranging fromCFA 66 321 (US$118.13) for the poorest households to CFA 617 292(US$1 099.53) for the wealthiest. Taking into consideration Chad’s GDP per capita(US$2 40021 in 2018), which includes the significant contribution to the economyby the oil sector and its poverty rate of 60.5 percent, the rental figures highlighthow unaffordable formal housing still is.22
The World Bank claims that the inadequate and informal nature of housing isbecause of the extremely high cost of building materials, stating that this is thereason that the rental market is predominantly informal. While there have beeninitiatives to decrease the cost of imports, such as road paving funded by theWorld Bank and other internal donors, the remoteness of N’Djamena, the capitalcity, and the lack of initiatives to provide affordable housing – marked by the factthat none of the loans provided by international donors have been for housing –means that the high cost of formal housing is likely to remain.
For the resale market, the World Bank’s Doing Business 2017 report states thatthe standard price of property was CFA 22 330 414 (US$39 775.38) down fromCFA 24 855 899 (US$44 273.82) in 2015. Little data is still available on the costof constructing a house but what there is suggests that it continues to be high. Infact, the average cost of building a house in N’Djamena is CFA 350 000/m2. TheLutheran World Federation (LWF) constructed 405 houses for refugees at a costof US$45 500 a house in 2013. However, in 2014, LWF reported that it was ableto build more houses at a cost of US$25 000. The lack of supply of adequate andaffordable housing means that data on the cost of construction is scarce.
Housing supplyThe number of houses was estimated to be about two million based on the totalpopulation of which 76.9 percent live in rural areas. With over 90 percent of itsurban inhabitants living in informal settlements, according to UN Habitat, Chadsuffers from a severe affordable housing shortage. The Housing National Strategyestimated in the year 2000 that around 340 000 units of decent housing wereneeded and 20 000 additional units every year. A rough estimation brings the gapin decent housing to 700 000 units to meet the need of the Chadian populationin 2018. While there is little information available on the actual supply of housingin Chad, it appears that improvements in affordable housing have been slow;75.6 percent of urban housing was inadequate in 2015. Supply of housing in Chadis predominantly provided informally through self-construction or incrementalhousing projects. Its remote, land-locked location drastically increases the priceof imported building materials, while local manufacturing is limited. Chadians tendto construct incrementally, accessing financing through family and informal sources,both in urban and rural areas, predominantly with traditional building materials.
Since 1998 the government has made numerous efforts to improve urbandevelopment and housing conditions in the country. In 2003, the governmentofficially declared it would provide all citizens with decent homes which, at thetime, reflected the willingness to use a significant part of the country’s oil revenuesto improve the living and housing conditions of the poor. “Vision 2030, the ChadWe Want”, the national blueprint plan, aimed to increase access to decent housingto 40 percent by 2030, (from 24.4 percent in 2017). Gaps in housing is estimatedat 300 000 units and the 2017-2021 National Development Plan envisions theconstruction of 30 000 units a year. Starting in 2003, following the oil boom, thegovernment signed several Memorandum of Understanding with foreign realestate agencies, including the Moroccan ADOHA signed in 2014 and the FrenchDuval signed in 2017, but so far no progress has been made.
While the oil boom had increased demand for formal housing at the top of themarket it has done little to increase the supply in the affordable market. At thehigher end of the market, property is generally developed for owner-occupationor for leasing to expatriates. The current expatriate leasing market is dominatedby the diplomatic sector as oil companies have downsized operations.23 Mostnew formal construction happens at the high-end of the market, with thegovernment constructing 60 deluxe houses for an African Union summit in 2015along with residential developments alongside the Ledger Plaza hotel. However,

Africa Housing Finance Yearbook 2018
99
the summit was cancelled due to the economic crisis and since then constructionactivities have halted. In the mid-market, there are plans for thousands of unitsclose to the new Toukra University, which are currently under construction,although no new updates are publicly available at this stage.
Property marketsAs with many African countries, the state holds all private and public land. Thismeans that all land that is considered vacant or unoccupied is the property of theState. However, the law prohibits the expropriation of land without due processand states that the government may only take possession of land 15 days aftercompensation is paid. Furthermore, Article 41 of Chad’s constitution stipulatesthat land should be expropriated only in instances of urgent public need.24
However, individuals and entities can obtain private ownership of state-held andother private land, through land grants, concessions and land purchases.
New land purchases require registration with the Land Registry and buyers mustobtain a titre foncier (land title). However, enforcement of land rights is challenging,partly because the majority of landowners do not have a title or a deed for theirproperty. According to Human Rights Watch, in 2008, the government forciblyevicted an estimated 10 000 residents from N’Djamena and demolished 1 798homes to make improvements to the city. There was reportedly no recourse ordue process and neither compensation nor resettlement assistance was offeredto those affected.25 The office of Domain and Registration (Direction de Domaineet Enregistrement) in the Ministry of Finance and Budget is responsible forrecording property deeds and mortgages. In practice, this office asserts authorityonly in urban areas; rural property titles are managed by traditional leaders whoapply customary law. Chadian courts frequently deal with cases of multiple orconflicting ownership rights or titles to the same property. In cases of multipletitles, the earliest title issued usually has precedence. The government does notprovide clear definitions and protections of traditional use rights of indigenouspeoples, tribes, or farmers. Given that the government recognises that registeringland titles is a priority, in 2013, the Ministry of Land created the One-Stop LandTitling Office (Guichet Unique pour les Affaires Foncière).26
The same factors revealed by the World Bank’s Doing Business Index 2018 inhibitthe development of Chad’s property markets: registering property involves sixprocedures, taking 44 days at a cost of 12.9 percent of the price of the property.As a result, Chad is ranked 159 out of 190 countries in the ease of registering aproperty. The One-Stop Land Titling Office has started in N’Djamena an electronicdatabase of land records and provides untameable titles. However, most title ordeed records in the country remain in paper format and the electronic databasehas not yet been extended to the whole country for checking for encumbrances(liens, mortgages, restrictions and the like). There are no publicly available officialstatistics tracking the number of transactions at the immovable propertyregistration agency. Interestingly, while unmarried men and unmarried womenhave equal ownership rights to property in Chad, married men and women donot.
Policy and regulationProtection of land rights is enshrined in Chad's 1967 codified Land Law. Chadhas a National Housing Strategy (Stratégie National du Logement, SNL), which isimplemented through the Ministry in charge of Urban Development and Housingand was adopted in 1998/1999. The most recent policy document for housing isthe 2017-2021 NDP, which is framed around the: “(i) the reinforcement of nationalunity; (ii) the reinforcement of good governance and a lawful state; (iii) thedevelopment of a diversified and competitive economy; and (iv) the improvementof the quality of life of the Chadian population.”27 As part of the NDP, Chad hasallocated CFA 91.2 billion (US$162 million) to improving the housing stock forthe period 2017-2021. However, this allocation has rarely been reflected in annualbudgets and is expected to be covered by public private partnerships.Furthermore, the government has undertaken the following initiatives: a lawintended to improve and secure property and land ownership was introduced in2013 to parliament, and an expansion of the One-Stop Land Titling Office to thewhole country will be undertaken to allow for the modernisation of land-registryservices. The Ministry of Urban Development and Housing put in place in 2012the Observatory of Housing and Urban Development to conduct propertysurveys in N’Djamena and other cities. Additionally, according to the World Bank,in N’Djamena and a few other cities and towns, 4 082 lots have been establishedby subdividing land. However, no serviced land was offered. A Land and RealEstate Promotion Corporation (SOPROFIM) was created in 2010 and hasformulated a programme with the support of SHELTER-AFRIQUE to provide 800services land plots ranging from 225 m2 to 240 m2 and to build 100 housing units.
OpportunitiesWhile Chad faces significant economic and political challenges in the short term,analysts predict that the economy will return to expansion from 2018. The needfor fiscal austerity measures will also start to moderate from next year, supportingpublic investment in construction and manufacturing. Chad offers an interestingmarket to work in, and one in desperate need of affordable housing developments.The high cost of formal construction provides developers with the opportunityto gain substantial market share by manufacturing building materials locally and/or innovating in the affordable segment of the market. Furthermore, there areenormous opportunities for both the public and private sectors to strengthen thedevelopment and supply of financial services to the broader population – inparticular affordable housing finance products. As part of Africa’s Agenda 2063,the United National Economic Commission for Africa (UNECA) conducted astudy on urbanisation, and intended to provide Chad with an industrialisation planthrough housing value chain development.
Any development in the built environment will face not only the challenges of theeconomic and political environment but also the physical difficulties encompassedin the context of a geographically remote, drought-ridden country with limitedinfrastructure.28 However the Chad’s 2030 development goals intend to fast-track industrialisation and encourage private sector involvement in the economyby developing public private partnerships and by integrating certain economic
Source https://www.cgidd.com/
PPP$40 001 – PPP$10 000 000
PPP$23 001 – PPP$40 000
PPP$12 001 – PPP$23 000
PPP$8 001 – PPP$12 000
PPP$5 001 – PPP$8 000
PPP$3 601 – PPP$5 000
PPP$2 401 – PPP$3 600
PPP$1 601 – PPP$2 400
PPP$801 – PPP$1 600
<PPP$800
- - - Average annual household income needed for the cheapest newly built house by a formal developer, 2017 Average annual household income using expenditure, 2017 (PPP$)
CHAD
Annual income profile for rural and urban households based on consumption (PPP$)
No. of households (thousands)
PPP$8 587
PPP$109 002
Rural Urban500 400 300 200 100 0 100 200 300 400 500
Population: 14 649 076
Urbanisation rate: 3.77%
Cost of cheapestnewly built house:
30 000 000 XAFPPP$149 328
Urban householdsthat could afford thishouse with finance:
1.44%
1 PPP$: 200.9 CFA franc

100
activities into regional, continental and global value chains.29 The launching of theBanque de l’Habitat du Tchad opened the doors for channelling resources tosupport housing development in the country. The private sector through publicprivate partnerships will be able to contribute to providing a solid social housingstock to bridge the gap in adequate housing needs. Professional corporations,such as architects, urban planners, engineers, realtors, are being organised tosupport the promotion and development of the housing sector.
SourcesCGAP (2018), Portail Microfinance, Tchad :https://www.microfinancegateway.org/fr/pays/tchad (Accessed 21 July 2018).
CIA Factbook (2018). Africa: Chad. https://www.cia.gov/library/publications/the-world-factbook/fields/2018.html (Accessed 02 July 2018)
IDA, IFC & MIGA (2015). Country Partnership Framework for the Republic ofChad for the Period FY 2016-2020. (3 November 2015).
IFC (2009). Enterprise surveys: Chad: Country Profile 2009, World Bank Group.
IHS (2017). Country Report: Chad. (27 June 2017).
International Monetary Fund (IMF) (2018). First review under the extendedcredit facility arrangement, and request for a waiver of nonobservance ofperformance criteria – Press release; staff report, and statement by theExecutive Director for Chad. IMF Country Report No. 18/108.
IMF (2016). Third and Fourth reviews under the Extended credit FacilityArrangement, and Requests for Waivers of Nonobservance of PerformanceCriteria, Augmentation of Access, Extension of the Current Arrangement, andRephasing of Disbursements. IMF Country Report No. 16/364.
IMF (2015). Second review under the Extended credit Facility Arrangement, aRequest for Waivers of Nonobservance of Performance Criteria and forModification of Performance Criteria- Press Release; Staff report; and Statementby the Executive Director for Chad. IMF Country Report No. 15/351.
IMF (2015). Chad – IMF executive board completes first review under theECF arrangement, approves augmentation and US$27.7 million disbursement,International Monetary Fund press release.
IMF (2015). Poverty reduction strategy paper – Joint staff advisory note on the2013 monitoring report of the National Development Plan 2013-15.
IMF (2014). Central African Economic and Monetary Community (CEMAC):IMF country report No. 14/305, International Monetary Fund PublicationServices: Washington.
IMF (2011). Chad: Financial Sector Stability Assessment. IMF Country ReportNo. 11/299.
INSEED (2015), Recensement General des Entreprises, Rapport General.INSEED/IFC International (2015) Enquête Démographique et de Sante et aIndicateurs Multiples au Tchad (EDS-MICS) 2014-2015,https://dhsprogram.com/pubs/pdf/fr317/fr317.pdf (Accessed 19 July 2018).
Irish, J. (2014). Chad to double oil output by 2016, develop minerals -minister,Reuters.
Knight Frank (2015). Africa Report: 2015.
Monkam, N. (2010). Mobilising tax revenue to finance development: The casefor property taxation in Francophone Africa, Working paper 195, University ofPretoria
N’Kodia, C. (2014). Chad, African Economic Outlook.
Polgreen, L. (2008). World Bank ends effort to help Chad ease poverty, NewYork Times.
Steffen, S. (2015). Chad: The role of economic interests in Chad's fight againstBoko Haram, Deutsche Welle.
Tchad, Ministère de l’Aménagement du Territoire, de l’Urbanisme et de l’Habitat(2015), Habitat III : Vers un nouvel agenda urbain au Tchad, Rapport National.
Tchad, Ministère de l’Economie et de la Planification du Développement (2017),Vision 2030, le Tchad que Nous Voulons.
Tchad, Ministère de l’Economie et de la Planification du Développement (2017),Plan National de Développement 2017-2021.
UN (2018) UNData, A World of Information, http://data.un.org/en/iso/td.html(Accessed 10 July 2018).
UNECA (2017), Urbanization and Industrialization for Africa’s Transformation,Economic Report on Africa.
UNECA (2017). Renforcer les capacités des États membres en vue deconcevoir et d’appliquer des stratégies et des politiques en faveur de villesinclusives et durables en Afrique, Compte pour le développement (neuvièmetranche – 1415BB), Evaluation de l’intégration de l’urbanisation dans laplanification du développement national au TCHAD, Etude de Cas du Tchad (DrDoudjidingaou Antoine).
UNHABITAT (2018). The State of African Cities 2018: The Geography ofAfrican investment, United Nations Human Settlements Programme: Nairobi.
USAID (2010). USAID country profile: Property rights and resourcegovernance: Chad, USAID.
US Department of State (2015). Chad Investment Climate Statement 2015.
World Bank (2018). Doing Business 2018, Reforming to Create Jobs,
http://www.doingbusiness.org/~/media/WBG/DoingBusiness/Documents/Annual-Reports/English/DB2018-Full-Report.pdf (Accessed 20 July 2018).
World Bank (2015). The Republic of Chad joint staff advisory note on the 2013monitoring report of the National Development Plan 2013-2015: ReportNo. 95505-TD, World Bank.
World Bank (2013). Republic of Chad poverty notes: Dynamics of poverty andinequality following the rise of the oil sector, Poverty Reduction and EconomicManagement 4: Africa Region.
World Bank (2011). Republic of Chad public expenditure review update: Usingpublic resources for economic growth and poverty reduction, PovertyReduction and Economic Management 3: Africa Region.
Websiteswww.africareport.com www.allafrica.comwww.beac.intwww.chadhouses.comwww.cia.gov www.data.imf.orgwww.doingbusiness.orgwww.imercer.comwww.mfw4a.orgwww.mirror.unhabitat.orgwww.mixmarket.org www.numbeo.comwww.tchad.orgwww.tradingeconomics.comwww.unhabitat.orgwww.worldbank.org
1 Worldometers. http://www.worldometers.info/world-population/chad-population/ (Accessed 8 August 2018).
2 Chad: Urbanization from 2007 to 2017. https://www.statista.com/statistics/455790/urbanization-in-chad/ (Accessed 8 August 2018).
3 African Development Bank (AfDB) (2018), Chad Data, Chad EconomicOutlook (Accessed 22 July 2018).
4 CIA Factbook (2018). The World Factbook, Africa, Chad.https://www.cia.gov/library/publications/the-world-factbook/fields/2018.html (Accessed 22 July 2018).
5 CIA Factbook (2018).6 World Bank (2018). Country: Chad Overview.
http://www.worldbank.org/en/country/chad/overview. (Accessed 17 May 2018).
7 CIA Factbook (2018).8 World Bank (2018).
9 International Monetary Fund (IMF) (2018). First review under theextended credit facility arrangement, and request for a waiver of non-observance of performance criteria – Press release; staff report, andstatement by the Executive Director for Chad. IMF Country ReportNo. 18/108.
10 CIA Factbook (2017).11 AfDB, UNDP, OECD. (2016). African Economic Outlook 2016.12 AfDB, UNDP, OECD (2016) & IMF (2016). 13 IMF (2018). 14 IHS (2016). 15 The Consultative Group to Assist the Poor, CGAP (2013). Portail
Microfinance, Tchad : https://www.microfinancegateway.org/fr/pays/tchad(Accessed 18 July 2018).
16 Fouapi Djiogap Constant (2015). Les institutions de microfinance etd’inclusion financière dans la CEMAC, University of Yaounde II, Workingpaper.
17 IMF (2016).
18 CIA Factbook (2018).19 UN (2018). UNData, A World of Information,
http://data.un.org/en/iso/td.html (Accessed 10 July 2018).20 World Bank (2018) Doing Business 2018, Reforming to create jobs.
http://www.doingbusiness.org/rankings?region=sub-saharan-africa(Accessed 19 July 2018)
21 IMF, April 2018 Report. 22 Numbeo (2018) https://www.numbeo.com/property-
investment/country_result.jsp?country=Chad23 Knight Frank (2017). 24 IHS (2017). 25 IHS (2017).26 US Department of State (2015). 27 IDA, IFC & MIGA (2015). p16. 28 IDA, IFC & MIGA (2015). 29 AfDB, UNDP, OECD (2017).

Africa Housing Finance Yearbook 2018
101
The fishing industry has potential but is still mainly undeveloped. Access to landand overpopulation remains a developmental issue.
With almost 400 inhabitants per square kilometre, the Comoros is denselypopulated, and over half of its population (53 percent) is under the age of 20. Thelast household survey conducted in 2014 revealed that almost 18 percent of thepopulation lives under the international poverty line set at US$1.9 per capita perday. About 70 percent of the poor live in rural areas where the incidence ofpoverty is estimated at 49.9 percent against 31 percent in urban areas. In Moronithe poverty rate is estimated at 36.5 percent, compared to poverty levels of morethan 45 percent in Ndzouani and Mwali. There is considerable inequality, with aGini index of 45.3. The Comoros, which was ranked 160 (out of 188) on theUN’s Human Development Index in 2016, must focus its efforts on combatinghunger and malnutrition.
Economic growth increased marginally from 2.2 percent in 2016 to 2.5 percent in2017, mainly as a result of improved electricity supply and an increase in emigrantremittances. Marginal improvements were also noted in infrastructure, mainlyrehabilitation of priority roads. Yet structural reforms to diversify the economicbase of Comoros produced minimal results. Policies to enhance regulatoryefficiency and maintain open markets to develop a more dynamic private sectordid not render the expected results. Thus, Comoros remains heavily dependenton foreign aid while the burdensome business environment restricts sustainedeconomic development.
OverviewThe Union of Comoros (Comoros) is an archipelago of four islands and severalislets located in the Western Indian Ocean, just south of the Equator and less than200 miles off the East African coast. Comoros lies approximately halfway betweenthe island of Madagascar and northern Mozambique at the northern end of theMozambique Channel. The total area of the Comoros is 2 235km2 with apopulation estimated at 832 347 in 2018 (an increase of 2.26 percent over 2017).The United Nations estimated that about one-third of the population lives inurban areas, including Moroni, Mutsamudu and Domoni. Moroni is the largest cityand capital on the semi-autonomous island Grande Comore with a population of55 000.
Formerly a French colony, Comoros became independent in 1975. It comprisesthree islands: Anjouan, Moheli and Grand Comore; a fourth island, Mayotte, is stilla French territory. Under the federal system, each of the main islands has its ownpresident and elected legislature. The governors, formerly elected, were appointedby the president after the constitution was amended in 1982. There are also fourmunicipalities: Domoni, Fomboni, Moroni, and Mutsamudu.
More than 20 coups or attempted coups and a long period of political andinstitutional instability characterise the political history of the Comoros. In 2001,the Fomboni Accord led to the adoption of the new Constitution, establishing theUnion of the Comoros with broad autonomy for the islands. A secession attemptin 2008 requiring military intervention by the international community resulted inan amendment to the Constitution in 2009 for the presidential terms to be fiveyears non-renewable. The president is assisted by three vice presidents, one fromeach of the three islands, and the number of ministers is set constitutionally at 10.The national congress was convened in February 2018 to assess conditions after42 years of independence and recommended an overhaul of the system of arotating presidency among the islands through potential constitutional reforms.
Comoros is one of the poorest countries in the world; most of the populationrely on subsistence agriculture and fishing. The Comoros economy is highlydependent on foreign aid, remittances and tourism. Cassava, sweet potatoes, riceand bananas are the staple crops along with yams, coconuts and maize. Meat, riceand vegetables are leading imports. Comoros is the world’s second-largestproducer of vanilla, with one-third of exports going to France, and the world’sleading producer of ylang-ylang, a perfume oil. Cloves and copra are also exported.
ComorosKEY FIGURES
Main urban centres Moroni
Exchange rate: 1 US$ = [a] 11 Sept 2017PPP Exchange rate (Local currency/PPP$) 1 Comorian franc = [b]Inflation 2016 [a] | Inflation 2017 [a] | Inflation 2018 [a]
423.16 Comorian franc226.081.80 | 1.00 | 2.00
Population 2017 [b] | Urban population size 2017 [b]Population growth rate 2017 [b] | Urbanisation rate 2017 [b]Percentage of the total population below National Poverty LineUnemployment rate [c]
813 912 | 232 2992.28% | 2.73%n/a4.3%
GDP (Current US$) 2017 [b] | GDP growth rate annual 2017 [b]GDP per capita (Current US$) 2017 [b]GNI per capita (Current US$) 2017 [b]Gini co-efficient [h]HDI global ranking 2015 [d] | HDI country index score 2015 [d]
US$649 million | 2.50%US$797US$760n/a160 | 0.498
Is there a deeds registry? Number of residential properties that have a title deed Lending interest rate [b]Mortgage interest rate | Mortgage term (years)DownpaymentMortgage book as a percentage of the GDPEstimated number of mortgages Price to Rent Ratio in City Centre | Outside City Centre Gross Rental Yield in City Centre | Outside City Centre Construction as a % of GDP
yesn/a11.50%11% | 1020%n/an/an/a | n/an/a | n/an/a
What is the cost of standard 50kg bag of cement? What is the price of the cheapest, newly built house by a formaldeveloper or contractor? (Local currency)What is the price of the cheapest, newly built house by a formaldeveloper or contractor? (US$) What is the size of this house (m2)? What is the average rental price for this unit (US$)? What is the minimum stand or plot size for residential property?
US$7.89
15 000 000 Comorian franc
US$35 685150m2
US$500200m2
Ease of Doing Business Rank [e]Number of procedures to register property [e]Time to register property (days) [e]Cost to register property (as % of property value) [e]
158430 days8.10%
NB: Figures are for 2018 unless stated otherwise.
[a] Coinmill.com[b] World Bank World Development Indicators [c] Trading Economics[d] UNDP Development Indicators [e] World Bank Doing Business

102
The African Economic Outlook 2018 also states that the purchase of new powerstations led to the recovery of electricity production, which revitalised entiresectors of the economy, including tourism, hospitality, trade and the distribution offresh food products. Moreover, growth was boosted by rising international pricesof the country’s main export products and improved diplomatic relations withSaudi Arabia and its Persian Gulf allies, which led to significant budget and off-budget support for public investment. Nevertheless, the current political climateposes a serious risk for the economy mainly a result of the new leaders’ decisionto challenge the constitutional principle of alternating presidencies between thecountry’s three main islands, a practice that has ensured institutional stability andpeaceful transitions of power since 2001. Further, the cost of fuel subsidies tothe two public electricity companies absorbs a sizeable portion of the governmentbudget and creates ongoing cash flow problems.
In its Annual Report 2016, the Central Bank of Comoros reported animprovement in the rate of growth mainly due to better electricity productionand distribution, improved public investment and a low inflation rate (1.8 percentin 2016 compared to 1.3 percent in 2015). The Central Bank of Comoros, in itsbi-annual Economic Report for 2017, states that 2017 had been marked by lesserdownside risks compared to the previous year, resulting in higher domesticdemand, improved public investment and increased small and medium enterpriseactivities. However, despite this recovery, the growth momentum in the Comorosremains fragile, partly due to the inadequacy of adjustments made by the publicauthorities. The latter would have required more sound and targeted policies thatwould enable the country to better mobilise resources and direct them to theproductive sectors. Private consumption has been well-oriented, connected tothe regular payment of wages and salaries and the increase in private sectordemand for credit. Other factors such as private transfers, including remittancesfrom the diaspora, which increased by 12.5 percent compared to 2016, roadrehabilitation, telecommunication and air transport developments contributed toeconomic growth in the Comoros in 2017.
In 2017, the Consumer Price Index was influenced mainly by a number of internalmeasures taken by the authorities, the decline in prices of certain goods andservices included in the household consumption basket, and an increase in foodprices, followed by “communication” and “restoration” costs. The evolution ofimported and local prices shows a clear difference over the long term. The priceof local goods remains higher than the price of imported goods.
The World Bank’s 2018 Doing Business Report ranks Comoros at 158 out of 190countries surveyed in ease of doing business compared to 153 in 2016. TheComoros made improvements in six indicators including starting a business, gettingelectricity and trading across borders. Despite, these improvements, the country’sranking fell as other countries made more improvements.
Comoros ranked 160 in the UN Human Development Index for 2016 and 121in the 2018 Economic Freedom Index. Improvements were noted in labourfreedom, judicial effectiveness, and trade freedom, offsetting declines in the taxburden and government spending indicators. The report further noted thatcontracts are weakly enforced, and property rights are not well protected.
The high level of poverty and low level of development in Comoros restricts thedevelopment of housing including social housing. Comoros receives a considerableamount of foreign aid including in the area of housing, however the institutionalinfrastructure is still lagging behind. Nevertheless, with the development of theeconomy and efforts from the Government of Comoros, these bottlenecks areexpected to gradually lessen.
Access to financeComoros has a relatively small and underdeveloped financial sector. In its 2016Annual Report, the Bank of Comoros reports no major changes in the bankingand financial services sector. The Comorian banking and financial system comprises10 institutions approved by the Central Bank of Comoros: four banks, threedecentralised financial institutions or microfinance institutions and three financialintermediaries. At the end of December 2016, the Comorian banking system had125 outlets, including head offices, spread all over the country, including 14 for thefour banks (La Banque pour l'Industrie et le Commerce, La Banque Fédérale deCommerce, Exim Bank and La Banque de Développement des Comores), 67 for
the three networks microfinance networks (L'Union des Meck, L'Union desSanduk d'Anjouan and L'Union des Sanduk de Mohéli) and 44 for financial andpostal services (La Société Nationale des Postes et des Services Financiers).
The Central Bank of Comoros states that, in 2016, deposits amounted to KMF102.7 billion (US$0.24 billion), an increase of 18.6 percent, compared to KMF 86billion (US$0.2 billion) at the end of 2015. Deposits were mainly driven byindividuals and private companies, which at the end of December 2016, accountedfor 44 percent and 46 percent of total deposits respectively. As at December2017, deposits fell to KMF 97.7 billion (US$0.23 billion) as a result of a markeddecreased (24 percent) in deposits of public enterprises. However, deposits ofprivate enterprises increased by 2.7 percent and household deposits increased by1.6 percent over 2016.1 Credit increased continuously through the year to reachits peak in December 2016. Loans to the private sector increased from KMF 68.7billion (US$0.16 billion) at the end of December 2015 to reach KMF 75.2 billion(US$0.18 billion) in December 2016 and KMF 79.6 billion (US$0.19 billion) inDecember 2017. These loans were mainly granted to the private sectorenterprises (41.5 percent of total financing in 2017 compared to 46.2 percent in2016) and households (52.9 percent of total financing in 2017 compared to 43.5percent in 2016). While short-term loans increased by 1.2 percent, medium-termloans decreased by 1.7 percent and long-term loans increased by 9.6 percentbetween 2016 and 2017.
According to the Central Bank of Comoros, there were 366 048 open depositaccounts in 2016 against 318 659 in 2015, and 51 275 loan accounts in 2016against 49 368 in 2015. In financial terms, the total consolidated balance sheets ofthe eight credit institutions increased by 15.8 percent, from KMF 106.8 billion(US$0.25 billion) in December 2015 to KMF 123.7 billion (US$0.29 billion) inDecember 2016, and then dropped marginally by 1.6 percent to reach KMF 121.7billion (US$0.29 billion) in December 2017, as a result of a decrease in both creditsand deposits. Non-performing loans (NPLs) as a ratio of total loans grantedincreased from 19.1 percent in 2015 to 20.7 percent in 2016 and then to 23.4percent in 2017.
The Central Bank of Comoros further reports that the performance of banks andfinancial institutions have deteriorated during 2017, as noted by the decrease indeposits during the year and the unfavourable quality of the portfolio. However,the Central Bank of Comoros expect improvement in the banking climate for thecoming year. A draft regulation on governance has been opened for consultationwith credit institutions and is expected to come into force during 2018. TheCentral Bank of Comoros is also working on regulation concerning electronicmoney.
The International Monetary Fund (IMF) has welcomed the steps taken tomodernise the monetary policy framework and encouraged the authorities tocarefully sequence the envisaged reforms.1 It was noted that, though the financialsector was well-capitalised and liquid, there was still the need to address growingfinancial sector vulnerabilities including the high level of NPLs, which are importantfactors in ensuring credit growth and private sector development. The IMF alsoencouraged the Comorian authorities to ensure that its Anti-Money Launderingframework is in line with international standards, thus addressing the problem ofcorrespondent banking relationships. The IMF recommended that Comorosaddress the growing banking sector vulnerabilities by closely monitoring thefinancial institution’s NPL portfolios and isolated tensions, resolving ongoinggovernance problems, and moving swiftly with the recapitalisation of the state-owned postal bank
The World Bank’s 2018 Doing Business Report ranks Comoros as 122 foraccessing credit (down from 118th in 2017 and 109 in 2016), and 168th in respectof resolving insolvency, up from 169 in 2017.
There is currently no stock market present in the country, nor are there primaryor secondary fixed-income markets for government or commercial debt.Government financing is mostly undertaken in the form of direct credit fromdomestic commercial banks, and liquidity levels are controlled through themodification of reserve requirements only. The main source of inflow for theComorian economy is remittances which totalled US$138.4 million in 2017 (21.3percent of GDP) compared to US$130.6 million in 2016 (21.2 percent of GDP).

Africa Housing Finance Yearbook 2018
103
AffordabilityAccording to the World Bank’s Worldwide Governance Indicators, the Comorosis regularly ranked in the group of countries whose performance is inadequate interms accountability, political stability, absence of violence, governmenteffectiveness, regulatory quality, rule of law and control of corruption.3 Thoughsome progress has been made in most of the indicators, a deterioration was notedin terms of rule of law for 2016.
The Comorian economy is structurally dominated by the public sector. This isreflected in the size of the wage bill of the civil service (about 8 percent of GDP)4
or similar services, which annually absorbs most of the central government budgetand leaves little leeway for public investment. The IMF noted that following reforms,the nominal wage bill was stable but fell markedly as a percentage of revenues.
The main feature of the public sector in the economy is the predominance ofgovernment shareholding in the country’s main strategic enterprises such as thecommunications, water and electricity, and the Hydrocarbons Company ofComoros as well as financial institutions. Thus, government spending for socialhousing is quite limited. Moreover, given that the banking sector lacks dynamism,private lending for private construction for the middle and low income groups isalso limited. Since 2015, credit to the private sector has been decreasing due tolending risks from persistently high MPLs and high excess liquidity.
Moreover, Comoros has a high incidence of poverty with almost 18 percent ofthe population living under the international poverty line set at US$1.9 per capitaper day. In 2012, almost 30 percent of children under five suffered from chronicmalnutrition and stunted growth. The Gini index for Comoros is 44.9. Thesecircumstances reduce the affordability of a housing unit by the poor Comorians.
The Government of Comoros note in their report to the UN Habitat III thatadequate housing has become increasingly inaccessible to the urban populationin the last 20 years. Domestic public funding for housing is only for public servants.Prior to the independence of Comoros, no attempt was made to solve thehousing problem or set up a clear programme for housing. Population growth,and recurring socio-politico-economic crises, aggravated by the global financialcrises have led to housing finance being mostly dependent on the private sector.Since 2015, credit to private sector has been decreasing due to lending risks frompersistently high non-performing loans and high excess liquidity. There has beena timid emergence of housing loans by financial institutions, but these are mostlyaccessible to residents of major cities. At present, housing loans are mostlyaccessible to private sector employees and senior civil servants. However, thefinancial institutions are aiming to offer housing loans at lower costs.
To this effect, it was recommended that mechanisms of financing be put in placeto partly make up for the insufficiency of public resources, and also to mobilise allthe partnerships likely to facilitate access to housing for more people, for exampleby creating a solidarity fund.
Housing supplyApproximately 65 percent of all housing units in the Comoros are made of strawwith roofs made from cocoa leaves and are privately owned; about 25 percentwere made of durable materials including stone, brick, or concrete. Of all housingunits, nearly 90 percent were owned, 3 percent rented, and 3 percent occupiedrent free. Around 98 percent of the population had access to improved sanitationsystems and safe water.5 As per the housing survey conducted in 2014 by theGovernment of Comoros in collaboration with United Nations Children’s Fund,it was noted that 69 percent of households had electricity while 27 percent hadan earth floor.6
Housing in Comoros varies from two-room structures covered with palm leavesto multilevel buildings made of stone and coral. The part of the house at streetlevel often serves as a shop or warehouse, but in earlier times that level housedslaves or servants. Some Western-style houses, with indoor bathrooms andkitchens, also exist. Because of the practice of “matrilocality” – a social customwhere the offspring of a family reside with their mother – females often remainpart of their mother’s household, even after marriage. This is owing in part to thepractice of polygamy, as well as the traditional need for Comorian men to travelaway from their communities in search of work. The family home can be expanded,or a separate structure can be built for a woman to inhabit with her children.
There remains scope for eventual further credit facilities from private banks andfinancial institutions to improve on those houses. In the absence of affordabledwellings supplied by the market, a consortium from Iran proposed, in 2014, toconstruct 5 000 housing units throughout the three islands over a period of fouryears as a follow-up of the UN Habitat programme 2008-2013. However, theproject is not yet completed.
As at 2015, more than 70 percent of the urban population lived in extremelydifficult sanitary conditions and the average housing area did not exceed 30 squaremetres. Three quarters of the population lived in two-room houses with a surfacearea not exceeding 20m2.7
The construction sector companies are mainly focused on the construction ofprivate homes in urban areas compared to public works. An important part ofhousing construction, especially in rural areas, is self-construction. It was thereforerecommended that new construction methods be proposed, which favour theuse of available local materials while protecting the environment and ensuringsustainable development. To this end, the UN Habitat Project was facilitatedthrough the construction of terracotta brick factories on the three islands. Thishas led to the creation of jobs and the training of masons in basic constructiontechniques supported by China and Tanzania.
Property marketPoverty remains prevalent in Comoros at 42.4 percent, as reported in the 2016Article IV Consultation, and the housing standard is basic. Nevertheless, the
PPP$40 001 – PPP$10 000 000
PPP$23 001 – PPP$40 000
PPP$12 001 – PPP$23 000
PPP$8 001 – PPP$12 000
PPP$5 001 – PPP$8 000
PPP$3 601 – PPP$5 000
PPP$2 401 – PPP$3 600
PPP$1 601 – PPP$2 400
PPP$801 – PPP$1 600
<PPP$800
- - - Average annual household income needed for the cheapest newly built house by a formal developer, 2017 Average annual household income using expenditure, 2017 (PPP$)
COMOROS
Annual income profile for rural and urban households based on consumption (PPP$)
No. of households (thousands)
PPP$20 476
PPP$35 096
Rural Urban30 20 10 0 10 20 30
Population: 813 912
Urbanisation rate: 2.73%
Cost of cheapestnewly built house:
15 000 000 KMFPPP$66 348
Urban householdsthat could afford thishouse with finance:
15.61%
1 PPP$:226 Comorian
franc
Source https://www.cgidd.com/

104
market for Comoros up-market properties has been growing over recent yearsled mainly by demand from foreigners. A number of factors including internationalaid, increased tourism and the nation’s relationship with France, Saudi Arabia andits Persian Gulf allies have contributed to the growth in residential and commercialproperty ownership. The purchase price of an average three-bedroom semi-detached house in Comoros remains in the range of US$131 000 to US$700 000.
Rental of a three-bedroom apartment also ranges between US$1 000 andUS$1 500 per month. Foreigners who make a substantial investment in thecountry are eligible to apply for Comorian nationality under the EconomicCitizenship Act, passed in 2008. This allows the few property dealers in Comorosto engage in speculative strategies on the market. Most of the housing units inComoros are rudimentary and are privately owned.The World Bank’s 2018 DoingBusiness Report ranks Comoros in the 111th position for registering propertycompared to 90th in 2017. Comoros is better than the average for Sub-SaharanAfrica in terms of: the number of procedures and the number of days required.However, the cost of registration as a percentage of the property value is higherfor Comoros, and the quality of land administration is weaker.8
Policy and regulationCurrently, the Ministry of Energy, Agriculture, Fisheries, Environment, RegionalPlanning and Urban Planning has the responsibility of overall administration ofhousing and related issues. Previously, housing was under the responsibility of theMinistry of Territorial Management, Urbanisation, Housing and Energy. One of themain priorities of the government is the stable supply of energy at a reasonablecost and which is accessible to all. Energy is considered indispensable for economicdevelopment in particular for the supply of water, hospitals, schools, housing andtransport. The current institutional set-up for urban land management involvesthe ministries responsible for finance; development planning and housing; andmunicipalities.
The absence of a cadastre did not enable secure land rights; as such the ‘directiondu cadastre et de la topographie’ was created post 2015. Comoros receives muchforeign aid especially from Saudi Arabia and its Persian Gulf allies, including forsocial housing. These developments have brought some improvement in creditfor households, house ownership and a slight reduction in the poverty rate.9
Despite the fact that the credit market is at a basic stage, the Central Bank ofComoros has put in place prudential norms. In its 2015 report, the Central Bankof Comoros reported that, following on-site inspection, it noted that compliancewith Bank Prudential Ratios were well respected by the financial institutions thoughthe internal audit function needed to be reinforced. In their 2016 annual report,the Central Bank of Comoros highlights that the inspection carried out on thefinancial institutions revealed some shortcomings in terms of governance, inparticular credit granted to manager, staff and board members.
In recent years, authorities have undertaken several measures to enhance financialintermediation and strengthen the country’s banking and financial sectors. Suchefforts include the facilitation of entry for foreign banks, reforms to the investmentcode in 2007, and establishing a National Agency for Investment Promotion. Thecountry's authorities have, in collaboration with the Central Bank of Tanzania, theCentral African Banking Commission, the French Prudential supervisory authorityand the IMF, strengthened regulatory and supervisory frameworks so as to expandthe scope of prudential regulations, and increase the effectiveness of controlprocedures. In line with the credit risk management, old doubtful or contentiousdebts with a maturity of more than three years will have to be fully provisioned.
OpportunitiesAfter some improvement since 2011, the IMF points out in the 2018 Article IVfor Comoros, that the near-term outlook remains challenging. The IMFrecommends that Comoros build on current reform efforts through theimplementation of a comprehensive set of policy measures which will containvulnerabilities and achieve sufficiently high sustainable growth rates and raise theliving standards. Furthermore, Comoros should work towards overcomingpersistent and severe physical and human capital constraints, particularlybottlenecks in basic infrastructure such as roads and electricity. An improvedbusiness climate is expected to strengthen governance and judicial effectiveness,and address financial sector fragilities and unlock long-term growth prospects.
The IMF further highlights that a strong reform commitment and deeperengagement with the donor community is required for Comoros to ensure thatthe authorities’ detailed strategic development plan is underpinned by sustainablefinancing sources and will meet its inclusive growth objectives. The ambition ofthe Comorian Government is to increase the competitiveness of manufacturing,agri-food craft and construction, respectful of the environment, so as to, amongstother objectives, have a set of construction companies that significantly increasetheir production capacity and provide supplies in the areas of housing and roadinfrastructure construction. Implementation of this plan will create furtheropportunities with respect to housing construction and social housing. As theeconomy progresses, there might be enormous scope for housing and housingfinancing with a particular emphasis on social housing.
Additional sourcesAfrican Development Bank Group (2016). Comoros Country Strategic Paper2016-2020. https://www.afdb.org/fileadmin/uploads/afdb/Documents/Project-and-Operations/COMOROS_-_2016-2020_Country_Strategy_Paper.pdf(Accessed 20 July 2018).
African Development Bank Group (2018). African Economic Outlook 2018.https://www.afdb.org/fileadmin/uploads/afdb/Documents/Publications/African_Economic_Outlook_2018_-_EN.pdf (Accessed 20 July 2018).
Banque Centrale des Comores (2016). Rapport Annuel 2016.http://www.banque-comores.km/DOCUMENTS/Rapport_annuel_2016.pdf(Accessed 12 Sept 2018).
Comoros infos (2014). “Construction de 5000 logements sociaux aux Comoros.”18 March 2014. http://www.comores-infos.net/construction-de-5000-logements-sociaux-aux-comores (Accessed 21 Sept 2018).
Making Finance Work for Africa (2018). Comoros Financial Sector Profile.https://www.mfw4a.org/index.php?id=394 (Accessed 12 Sept 2018).
UN Country Profile – Comoros 2018. https://www.un.org/development/desa/dpad/wpcontent/uploads/sites/45/LDC_Profile_Comoros.pdf (Accessed12 Sept 2018).
World Atlas (2018). Comoros. https://www.worldatlas.com/webimage/countrys/africa/km.htm (Accessed 12 Sept 2018).
World Bank Data (2018). Comoros – Total population.https://data.worldbank.org/indicator/SP.POP.TOTL?end=2018&locations=KM&start=2001 (Accessed 12 Sept 2018).
World Bank (April 2018). Comoros. http://pubdocs.worldbank.org/en/249791492188156070/mpo-com.pdf (Accessed 12 Sept 2018).
Mo Ibrahim Foundation (2018). 2017 Ibrahim Index of African Governance,Index Report. http://s.mo.ibrahim.foundation/u/2017/11/21165610/2017-IIAG-Report.pdf?_ga=2.253668937.1942901850.1517602704-502629705.1517602704 (Accessed 22 July 2018).
Websiteshttps://www.afdb.org/en/ http://www.banque-comores.kmhttp://www.oecd.org/dev/africa/ www.inseed.km
1 Central Bank of Comoros (2018). Annual Bulletin for the Year 2017. http://banque-comores.km/DOCUMENTS/Bulletin_BCC_n17_Déc_2017.pdf (Accessed 22 Sept 2018).
2 International Monetary Fund (June 2018). IMF Country Report No 18/189 Union of the Comoros 2018 ArticleIV Consultation. http://www.imf.org/~/media/Files/Publications/CR/2018/cr18189.ashx (Accessed 31 July 2018).
3 The World Bank (2018). The Worldwide Governance Indicators.http://info.worldbank.org/governance/wgi/index.aspx#home (Accessed 28 July 2018).
4 The World Bank (2017). Report on Comoros Economic Governance Reform. 15 Dec 2017.http://documents.worldbank.org/curated/en/151281514405727345/pdf/Comoros-Economic-Governance-Reform-Grant-P131688-ICRR-12152017.pdf (Accessed 30 July 2018).
5 Ministère des Finances, du Budget et du Plan. Direction Nationale du Recensement (2007). Analyse desdonnées du Recensement des Comores 2003. 1 4 volumes.
6 Government of Comoros (March 2013). Enquête Démographique et de Santé et à Indicateurs Multiples auxComores EDSC-MICS 2012. https://dhsprogram.com/pubs/pdf/PR34/PR34.pdf (Accessed 30 July 2018).
7 Government of Comoros, Vice President in charge of the Ministry of Territory Development, of Infrastructures,Urbanization and Housing (2015). Habitat III 2016 Country Report. http://habitat3.org/wp-content/uploads/National-Reports-Comoros-English.pdf (Accessed 30 July 2018).
8 The World Bank Doing Business (2018). Ease of doing business in Comoros. http://www.doingbusiness.org/data/exploreeconomies/comoros (Accessed 12 Sept 2018).
9 International Monetary Fund (June 2018). IMF Country Report No 18/189 Union of the Comoros 2018 ArticleIV Consultation.
Africa Housing Finance Yearbook 2018
105
Congo Republic
25 percent of workers are employed by families without any salary. Up to 13percent of workers are employed either in large private firms (five percent) or inSMEs (eight percent); industrial jobs are three percent of the total, and publicadministration accounts for 14 percent.7
Access to financeThe Congo Republic is part of the Central African Economic and MonetaryCommunity which includes five other African countries – Cameroon, Gabon,Equatorial Guinea, Central African Republic and Chad – and has its banking systemregulated by the Bank of the Central African States (BEAC).8 These countriesshare a single currency and a unified financial and banking legislation. Congo suffersfrom the high overhead costs of Congolese banks, which are comparativelyspeaking among the highest in the world. This is a result of the poor businessenvironment and the lack of public credit registries in Congo.9
Congo’s formal financial system is not well-developed. There were 3.96commercial bank branches per 100 000 adults and 8.19 ATMs per 100 000 adultsin 2015.10 Congo scores low in terms of ease of getting credit, ranking in 133th
place out of 189 countries.11 Congo scored: six in terms of strength of legal rightsindex (0-12); one in terms of depth of credit information index (0-8); 11.9 percent
OverviewThe Congo Republic presents a remarkable statistic in terms of urbanisation withmore than 60 percent of its population living in the main cities of Brazzavilleand Pointe-Noire. The government introduced a policy called “acceleratedmunicipalisation” which aims to rapidly develop the country’s urban transformation.Within this framework, it has built airports, roads, bridges, stadiums, administrativebuildings and dams, and is continuing to finance large construction projects.1
In 2018, the total size of the population is estimated to be 5 396 963 with anaverage annual population growth of 2.64 percent.2 The real gross domesticproduct (GDP) dropped by approximately four percent in 2017 following acontraction of 2.8 percent in 2016 despite an increase in oil production and arecovery in oil prices in 2017.3 Crude petroleum is an important resource andaccounts for 61 percent of Congo’s exports and 60 percent of its GDP, with timberbeing its second largest export product. The economy is likely to expand by3.1 percent in 2018 and 2.1 percent in 2019, resulting from higher oil production,following the exploitation of the Moho-Nord oil field, which accounts for19.3 percent of the country’s production,4 and assistance from other sectors.Legislation for Special Economic Zones (SEZs) was enacted in April 2017 by thegovernment and these are expected to be operational in 2018. The aim is toprovide favourable terms for investing in the main port and oil hubs of Pointe-Noire, Brazzaville, Oyo and Ouesso.5
Congo Republic’s score on the UN Human Development Index 2015 is 0.592,ranking 135th. It ranked 90 out of 105 countries based on its Gini co-efficient,which places the country among the most unequal societies in the world.6 Sucha result highly impacts the unemployment rate, especially among the youth andwomen. It has an unemployment rate of 32.7 percent for those aged 15-29, 15.6percent for those aged 30-49, and 8.3 percent for those aged 50-64, with the totalunemployment of the labour force sitting at 11.2 percent in 2016. Poverty ispredominant in rural areas, which accounted for 44.3 percent of the poor in 2005,and this figure had increased to 57.4 percent by 2011. The share of the populationliving below the national poverty line is estimated at 34 to 35 percent in 2016which corresponds to a poverty decline of 1.52 percent from 2011-2016 asopposed to a decline of 1.63 percent from 2005-2011. The informal sector isvery large. Three out of five workers (63 percent) are self-employed, running abusiness with no employees, or being involved in subsistence agriculture. A further
KEY FIGURES
Main urban centresBrazzaville Pointe-Noire
Exchange rate: 1 US$ = [a] 19 Jul 2018PPP Exchange rate (Local currency/PPP$) 1 CFA = [b]Inflation 2016 [b] | Inflation 2017 [b] | Inflation 2018 [b]
578.84 Central African CFA763.9n/a | 3.60 | 4.60
Population [c] | Urban population size [c] Population growth rate [c] | Urbanisation rate [d]Percentage of the total population below National Poverty Line 2016 [b]Unemployment rate 2017
5 396 963 | 3 243 5752.64% | 3.02%
34.5%21%
GDP (Current US$) 2017 [b] | GDP growth rate annual 2017 [b]GDP per capita (Current US$) 2017 [e]GNI per capita (Current US$) 2017 [b]Gini co-efficient 2011 [b]HDI global ranking 2015 [f] | HDI country index score 2015 [f]
US$8 724 million | -4.6%US$1 658US$1 36048.9135 | 0.592
Is there a deeds registry? Number of residential properties that have a title deed Lending interest rate [g] Mortgage interest rate | Mortgage term (years)DownpaymentMortgage book as a percentage of the GDPEstimated number of mortgages Price to Rent Ratio in City Centre | Outside City Centre Gross Rental Yield in City Centre | Outside City Centre Construction as a % of GDP [h]
Yesn/a14.50%20% | 12n/an/an/an/a | n/an/a | n/an/a
What is the cost of standard 50kg bag of cement? What is the price of the cheapest, newly built house by a formaldeveloper or contractor? (Local currency)What is the price of the cheapest, newly built house by a formaldeveloper or contractor? (US$) What is the size of this house (m2)? What is the average rental price for this unit (US$)? What is the minimum stand or plot size for residential property?
US$7
n/a
n/an/an/an/a
Ease of Doing Business Rank [i]Number of procedures to register property [i]Time to register property (days) [i]Cost to register property (as % of property value) [i]
179655 days16.00%
NB: Figures are for 2018 unless stated otherwise.
[a] Bloomberg.com[b] World Bank World Development Indicators[c] Worldometers[d] Indexmundi[e] International Monetary Fund[f] UNDP Development Indicators[g] Trading Economics[h] Country Planning Cycle Database (WHO)[i] World Bank Doing Business

106
in terms of credit registry coverage (percentage of adults) and 0.0 percent in termsof credit bureau coverage.12
In 2017, the country’s banking system had 11 commercial banks,13 one more thanin 2015.14 Commercial banks provide corporate banking services either locallyor from overseas. The rate of local credit offered to the private sector is low andexpensive but available to foreign and local investors on the same terms15 withservices being primarily available to large clients involved in the sectors of oil,forestry, telecommunications, import-export, and services. The Agricultural Bankof China has opened a new subsidiary in Congo, the Sino-Congolese Bank forAfrica (BSCA Bank). The official headquarters was inaugurated on 10 April 2018by the president of the Congo Republic M. Denis Sassou N’Guesso and the vicepresident of Agricultural Bank of China, Guo Ningning.16 BSCA Bank is 50 percentowned by the Agricultural Bank of China. BSCA Bank started its activities in 2015and since then has installed 30 ATMs (from 2015-2017) and foresees theinstallation of 50 more by the end of 2018. The total deposits are estimated atXAF 150 billion (around US$268.6 million) in 2017 as opposed to XAF 60 billion(US$104.5 million) in 2016. Credit granted to the private sector in 2017amounted to XAF 92 billion (US$164.7 million), thus representing XAF 66 billion(US$118.1 million) more than what was recorded in 2016.17
The informal economy is predominantly cash-based, and commercial banks serveonly a small segment of the market18 with just 5.5 percent of the adult populationhaving a savings account.19 One reason lies in the existence of cumbersomerequirements for opening new bank accounts, resulting in the growth of informalsavings (30 percent of the population).20 There are 75 microfinance institutions(MFIs), 34 of which are independent, and the rest organized under the networkof the Congolese Savings and Loans Mutual, Mutuelle Congolaise d'Epargne et deCrédit (MUCODEC). MUCODEC, the country’s largest credit union, providessmall and micro loans to businesses and private individuals. In 2014, the overallsize of deposits from MFIs amounted to XAF 249 billion (US$442.2 million)representing 13.3 percent growth as opposed to 2013. Total loan granted in 2014amounted to XAF 63.7 billion (US$113.1 million), representing 8.6 percent growthas opposed to 2013.21 Several banks, including United Bank of Africa, have begunoffering loans of up to US$100 000 to private individuals and small businesses inrecent years. SOCOFIN in Congo Republic,22 Société Générale, La BanqueCongolaise de l’Habitat, La Congolaise de Banque and Credit du Congo also offermortgages to their clients over a seven to 12-year period.
The mortgage finance market is still in its infancy but has a huge potential forgrowth. Very few banks provide medium-term and long-term credit. Nearly 70percent of loans in Congo require collateral which sometimes exceeds the valueof the loan.23 The Congolese tend to use bank accounts for business purposesmore than the regional average; other uses of bank accounts include receivinggovernment payments and wages, as well as for sending/receiving remittances. Thisis shown by the comparatively widespread use of bank tellers for deposits inCongo, as well as the limited use of advanced payment services such as ATMmachines.24
AffordabilityThe private sector is small and concentrated in the tertiary sector of which 90percent is mostly composed of smaller units operating along the Pointe-Noire,Brazzaville corridor.
The State is the largest employer in the formal sector, followed by large privatefirms and SMEs25 offering an average monthly salary of about XAF 150 000 (aboutUS$269). Though rapidly growing, the formal private sector is still very small. Mostpeople are involved in the informal sector. Congo has 57.4 percent of the urbanpoor with close to 20 percent of poor people living in Brazzaville.26
Construction costs in the urban and semi-urban areas are high and increasing. Itcosts about XAF 9 million (US$16 130) to build a standard three-bedroom housein the main urban areas. In the rural areas, the construction costs are lower asmost of the houses are built with substandard materials such as locally made sun-dried clay bricks. Based on the 2014 World Bank statistics, an estimated 43.2percent of households had access to electricity. The 2015 socioeconomic studyset the number of households connected to the electricity network as low as 22percent for Brazzaville and 39 percent for Pointe-Noire.27
The proportion of unplanned settlements in the two main cities coversapproximately 60 percent of the land area, or about 10 000 hectares, with a highproportion of housing stock28 made from fragile materials. In 2005,29 these areashosted 64 percent of households in Brazzaville and approximately 50 percent inPointe-Noire.30 This was confirmed by more recent data (2012) from UN-Habitaton Pointe-Noire and PEEDU-funded socioeconomic studies of the two cities(2015) revealed a significant lack of access to basic infrastructure and services inBrazzaville.31
Housing supplyThe number of new housing units that enter the market annually for rental andownership is insufficient to meet the demands of the increasingly urbanizedpopulation and the growing middle and upper-class population. A quarter of theCongolese population lives in the capital Brazzaville. The demand for housing hasincreased without a subsequent increase in supply. This increasing mismatchbetween demand and supply for housing continues to push up house prices bothfor ownership and rental. In Brazzaville and Pointe-Noire, housing demand wasestimated at 13 550 units per year versus an annual delivery of just two thousandunits.32
There is an increasing number of local housing companies and foreign developerswho are entering the housing market using a Build Operate and Transfer (BOT)model and other initiatives directed towards the development of the housingsector. Most of the new housing developments are driven by demand for highquality housing by expatriate communities. Among the foreign companies, Karmod,a Turkish private developer, has implemented new construction methods throughits prefabricated houses and container-based houses to tackle the housing backlog.The “Salon de l’Immobilier,” which was hosted in Brazzaville, has been among themost successful national housing initiatives focused on the challenges to, andopportunities for, achieving sustainable development.33
Congo introduced the Water, Electricity, and Urban Development Project (Projetd’eau, d’électricité et de développement urbain, PEEDU) in 2010. Under thePEEDU, a new urban policy was elaborated and detailed in a sector policy letterthat provides a reference framework for 2012-2022 with regard to urban sectoractions and investments. It defines strategies to promote sustainable developmentof urban centres, accounting for challenges related to urban organization, landadministration, taxes, infrastructure, and service delivery.
In 2008 the Fuller Centre and its partners, the International Partnership for HumanDevelopment, Engineering Ministries (eMI), USAID, Embassy Brazzaville andB.L.Harbert International anticipated the construction of 24 houses in Makana IIon plots of land already owned by the villagers. The residents decided on two-bedroom houses to be made of baked clay bricks with corrugated metal roofsand a front porch. Homeowners will pay the equivalent of US$20 on a long-term,fixed-rate payment schedule. The cost to sponsor a house for a family wasUS$4 500.
The housing construction programme in the municipality of Kintélé was orderedby the Congolese state on behalf of EMT Building Subsidiary Alliances. Theprogramme sought construction in 2014 of 4 000 residential units and an urbancentre with 22 facilities spread over 100 hectares. The total investment amountedto US$228.9 million.34 In the same locality, the Société Africaine des Travauxanticipated in 2017 under the “accelerated municipalization” scheme, theconstruction of 3 070 affordable housing over 10 years in several cities such asOwando, Oyo, Kinkala, Kindamba, Sibiti, Madingou, Brazzaville, Pointe-Noire etDiosso. The total cost of the development is around XAF 50 billion (US$89.5million).35
A project of at least 10 000 social housing units to be built by the Douja societyPromotion Addoha Moroccan Group in the capital Brazzaville and Pointe-Noirecommenced in 2014. These homes will be added to those currently underconstruction in the two cities. In 2016, the Banque Congolaise de l’Habitat startednegotiating with Sino Great Wall and the Industrial and Commercial Bank of Chinathe final details of the financing of a housing project in Congo Republic. Theinvestment amounts to US$300 million and foresees the development of 1 700houses per year up to 2019.36
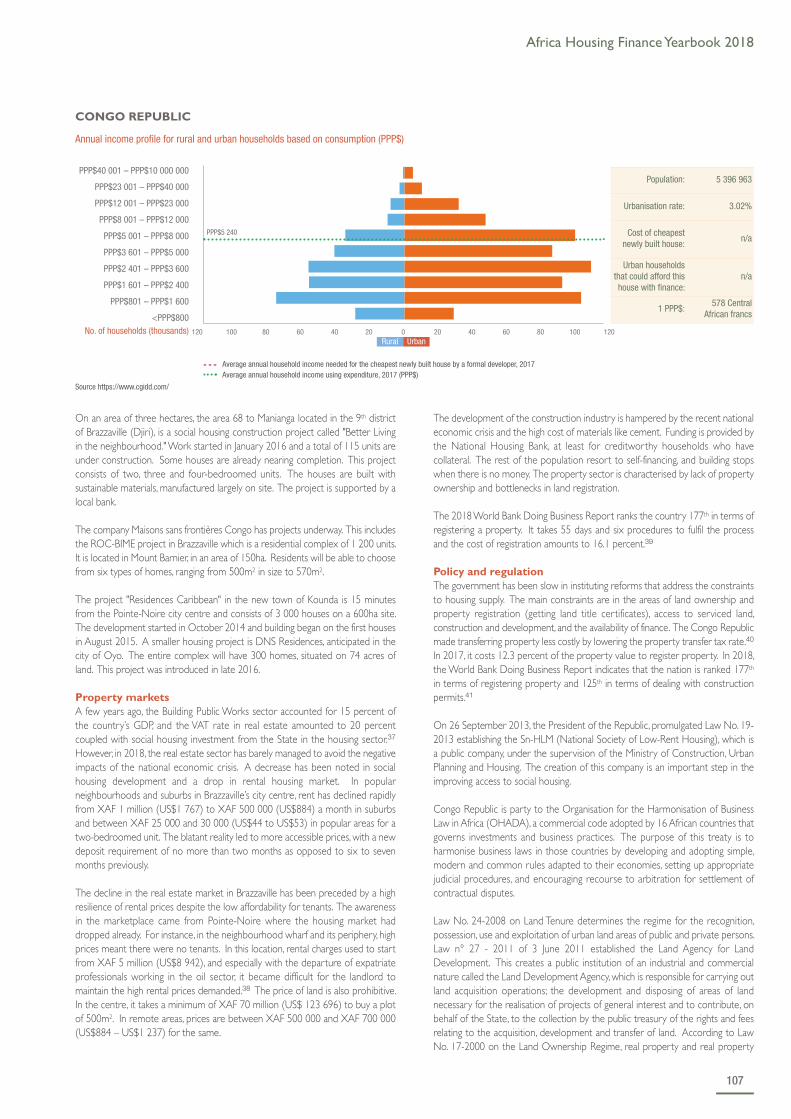
Africa Housing Finance Yearbook 2018
107
On an area of three hectares, the area 68 to Manianga located in the 9th districtof Brazzaville (Djiri), is a social housing construction project called "Better Livingin the neighbourhood." Work started in January 2016 and a total of 115 units areunder construction. Some houses are already nearing completion. This projectconsists of two, three and four-bedroomed units. The houses are built withsustainable materials, manufactured largely on site. The project is supported by alocal bank.
The company Maisons sans frontières Congo has projects underway. This includesthe ROC-BIME project in Brazzaville which is a residential complex of 1 200 units.It is located in Mount Barnier, in an area of 150ha. Residents will be able to choosefrom six types of homes, ranging from 500m2 in size to 570m2.
The project "Residences Caribbean" in the new town of Kounda is 15 minutesfrom the Pointe-Noire city centre and consists of 3 000 houses on a 600ha site.The development started in October 2014 and building began on the first housesin August 2015. A smaller housing project is DNS Residences, anticipated in thecity of Oyo. The entire complex will have 300 homes, situated on 74 acres ofland. This project was introduced in late 2016.
Property marketsA few years ago, the Building Public Works sector accounted for 15 percent ofthe country’s GDP, and the VAT rate in real estate amounted to 20 percentcoupled with social housing investment from the State in the housing sector.37
However, in 2018, the real estate sector has barely managed to avoid the negativeimpacts of the national economic crisis. A decrease has been noted in socialhousing development and a drop in rental housing market. In popularneighbourhoods and suburbs in Brazzaville’s city centre, rent has declined rapidlyfrom XAF 1 million (US$1 767) to XAF 500 000 (US$884) a month in suburbsand between XAF 25 000 and 30 000 (US$44 to US$53) in popular areas for atwo-bedroomed unit. The blatant reality led to more accessible prices, with a newdeposit requirement of no more than two months as opposed to six to sevenmonths previously.
The decline in the real estate market in Brazzaville has been preceded by a highresilience of rental prices despite the low affordability for tenants. The awarenessin the marketplace came from Pointe-Noire where the housing market haddropped already. For instance, in the neighbourhood wharf and its periphery, highprices meant there were no tenants. In this location, rental charges used to startfrom XAF 5 million (US$8 942), and especially with the departure of expatriateprofessionals working in the oil sector, it became difficult for the landlord tomaintain the high rental prices demanded.38 The price of land is also prohibitive.In the centre, it takes a minimum of XAF 70 million (US$ 123 696) to buy a plotof 500m2. In remote areas, prices are between XAF 500 000 and XAF 700 000(US$884 – US$1 237) for the same.
The development of the construction industry is hampered by the recent nationaleconomic crisis and the high cost of materials like cement. Funding is provided bythe National Housing Bank, at least for creditworthy households who havecollateral. The rest of the population resort to self-financing, and building stopswhen there is no money. The property sector is characterised by lack of propertyownership and bottlenecks in land registration.
The 2018 World Bank Doing Business Report ranks the country 177th in terms ofregistering a property. It takes 55 days and six procedures to fulfil the processand the cost of registration amounts to 16.1 percent.39
Policy and regulationThe government has been slow in instituting reforms that address the constraintsto housing supply. The main constraints are in the areas of land ownership andproperty registration (getting land title certificates), access to serviced land,construction and development, and the availability of finance. The Congo Republicmade transferring property less costly by lowering the property transfer tax rate.40
In 2017, it costs 12.3 percent of the property value to register property. In 2018,the World Bank Doing Business Report indicates that the nation is ranked 177th
in terms of registering property and 125th in terms of dealing with constructionpermits.41
On 26 September 2013, the President of the Republic, promulgated Law No. 19-2013 establishing the Sn-HLM (National Society of Low-Rent Housing), which isa public company, under the supervision of the Ministry of Construction, UrbanPlanning and Housing. The creation of this company is an important step in theimproving access to social housing.
Congo Republic is party to the Organisation for the Harmonisation of BusinessLaw in Africa (OHADA), a commercial code adopted by 16 African countries thatgoverns investments and business practices. The purpose of this treaty is toharmonise business laws in those countries by developing and adopting simple,modern and common rules adapted to their economies, setting up appropriatejudicial procedures, and encouraging recourse to arbitration for settlement ofcontractual disputes.
Law No. 24-2008 on Land Tenure determines the regime for the recognition,possession, use and exploitation of urban land areas of public and private persons.Law n° 27 - 2011 of 3 June 2011 established the Land Agency for LandDevelopment. This creates a public institution of an industrial and commercialnature called the Land Development Agency, which is responsible for carrying outland acquisition operations; the development and disposing of areas of landnecessary for the realisation of projects of general interest and to contribute, onbehalf of the State, to the collection by the public treasury of the rights and feesrelating to the acquisition, development and transfer of land. According to LawNo. 17-2000 on the Land Ownership Regime, real property and real property
PPP$40 001 – PPP$10 000 000
PPP$23 001 – PPP$40 000
PPP$12 001 – PPP$23 000
PPP$8 001 – PPP$12 000
PPP$5 001 – PPP$8 000
PPP$3 601 – PPP$5 000
PPP$2 401 – PPP$3 600
PPP$1 601 – PPP$2 400
PPP$801 – PPP$1 600
<PPP$800
- - - Average annual household income needed for the cheapest newly built house by a formal developer, 2017 Average annual household income using expenditure, 2017 (PPP$)
CONGO REPUBLIC
Annual income profile for rural and urban households based on consumption (PPP$)
No. of households (thousands)
PPP$5 240
Rural Urban120 100 80 60 40 20 0 20 40 60 80 100 120
Population: 5 396 963
Urbanisation rate: 3.02%
Cost of cheapestnewly built house:
n/a
Urban householdsthat could afford thishouse with finance:
n/a
1 PPP$:578 Central
African francs
Source https://www.cgidd.com/

108
rights belonging to natural or legal persons of Congolese or foreign nationalityare subject to the provisions of this law.
OpportunitiesSince its accession to national independence and international sovereignty in 1960,the Congo Republic has amassed a significant shortfall in housing which nowconstitutes a real social problem. As a result, the construction industry currentlyenjoys a favourable climate for its development due to the acceleratedmunicipalisation policy and the policy of modernisation of social habitats in thecountry coupled with the recent SEZs enacted in April 2017. This is in line with"Congo, an emerging country by 2025" which is the goal that the government hasset.
Today, private initiatives are increasing, and public and private investors show anotable increase each year in Congo. Several projects are in place, including public-private partnerships. Through these partnerships, more than 3 000 housing unitswere started, 600 of which are being finalised. To encourage private investment,the government has put in place incentives and an advantageous framework forbusiness taxation and customs.
There are huge opportunities for retail, commercial and industrial real estate inthe urban and semi-urban areas despite the plunging prices in the rental housingsegment.
Additional sourcesInternational Monetary Fund (2012). IMF Country Report No. 12/242, Republicof Congo: Poverty Reduction Strategy Paper.https://www.imf.org/external/pubs/ft/scr/2012/cr12242.pdf (Accessed11 September 2018).
International Monetary Fund. (2016). IMF Country Report No. 16/106, CentralAfrican Economic and Monetary Community (CEMAC).http://www.imf.org/en/Publications/CR/Issues/2016/12/31/Central-African-Economic-and-Monetary-Community-CEMAC-Financial-System-Stability-Assessment-43874 (Accessed 11 September 2018).
International Monetary Fund (2013). Republic of Congo: Poverty ReductionStrategy Paper, 2013, Country Report No. 13/226.https://www.imf.org/external/pubs/ft/scr/2013/cr13226.pdf (Accessed11 September 2018).
Salon de l’Immobilier (2016 & 2017). Salon de l’Immobilier du Congo.http://www.salondelimmobilierducongo.com (Accessed 17 July 2018).
The World Bank (2016). World Bank, Combined Project InformationDocuments/Integrated Safeguards Datasheet PID/ISDS.https://www.thegef.org/sites/default/files/project_documents/PCN_PID-ISDS_-_P159835_Revised_0.pdf (Accessed 11 September 2018).
1 Export.gov (2017). Republic of Congo Market Opportunities. https://www.export.gov/article?id=Republic-of-Congo-Market-Opportunities (Accessed 13 July 2018).
2 Worldometers (2018). Congo Population. http://www.worldometers.info/world-population/congo-population/ (Accessed 13 July 2018).
3 The World Bank (2018). Congo Overview. http://www.worldbank.org/en/country/congo/overview(Accessed 6 July 2018).
4 African Development Bank Group (2018). https://www.afdb.org/en/countries/central-africa/congo/congo-economic-outlook/
5 Export-gov (2017). Republic of Congo Market Opportunities.6 World Bank (2017). Republic of Congo Poverty Assessment Report.
https://openknowledge.worldbank.org/bitstream/handle/10986/28302/114706-v2-Republic-of-Congo-ENG-7-17-17-M2.pdf?sequence=1&isAllowed=y (Accessed 11 September 2018).
7 Ibid.8 International Monetary Fund (2015). IMF Country Report No. 15/263, Republic of Congo.
http://www.imf.org/external/pubs/ft/scr/2015/cr15263.pdf (Accessed 11 September 2018).9 International Monetary Fund (2015). IMF Country Report No. 15/264, Republic of Congo.
https://www.imf.org/external/pubs/ft/scr/2015/cr15264.pdf (Accessed 11 September 2018).10 World Bank Economic Indicators.11 World Bank Doing Business (2018).
http://russian.doingbusiness.org/~/media/WBG/DoingBusiness/Documents/Annual-Reports/English/DB2018-Full-Report.pdf (Accessed 11 September 2018).
12 World Bank Doing Business (2018). 13 Export-gov (2017). https://www.export.gov/article?id=Republic-of-Congo-Banking-Systems14 International Monetary Fund (2015). IMF Country Report No. 16/106, Republic of Congo.15 Export-gov (2017). 16 Agence d’Information d’Afrique Centrale (2018). http://www.adiac-congo.com/content/affaires-inauguration-
du-siege-de-la-bsca-bank-brazzaville-8184417 Ibid.18 State gov (2013). Investment Climate Statement-Republic of Congo.
http://www.state.gov/e/eb/rls/othr/ics/2013/204624.htm (Accessed 14 July 2018).19 API Congo (NDA). Services financiers. https://www.apicongo.org/services_financiers.php (Accessed on
19 July 2018).20 Ibid.21 Ibid.22 Municipality of Brazzaville (NDA). http://www.brazzaville.cg
23 International Monetary Fund (2015). IMF Country Report No. 15/264, Republic of Congo.24 Ibid.25 Both employing 13 percent of the workers.26 World Bank (2017). Republic of Congo Poverty Assessment Report.27 Ibid.28 35 percent in Pointe-Noire. 29 Latest figures available.30 The World Bank (2016). The World Bank Report No.: PAD1266, Urban Development and Poor
Neighbourhood Upgrading Project.http://documents.worldbank.org/curated/en/484631468195854426/pdf/PAD1266-PAD-P146933-Box394849-OUO-9-R2016-0011-1.pdf (Accessed 11 September 2018).
31 Ibid.32 African Economic Outlook (2016).
https://www.afdb.org/fileadmin/uploads/afdb/Documents/Publications/AEO_2016_Report_Full_English.pdf(Accessed 11 September 2018).
33 Les Depeches de Brazzaville (2016). http://www.lesdepechesdebrazzaville.fr/node/48268. The second editiontook place from 31 August to 02 September 2016. Salon de l’Immobilier du Congo (2017).http://www.salondelimmobilierducongo.com/ The third edition took place from 29 – 31 August 2017.
34 Skyscrapercity (2013). Alliances Parie Gros Sur L’Afrique Trois Projets Au Sénégal, En Côte D’ivoire Et AuCongo30% De Croissance Du Ca Dans Ces Pays Dès 2016.https://www.skyscrapercity.com/showthread.php?t=1675626 (Accessed 17 July 2018).
35 Les Echos Congo Brazza (2017). Congo construction des logements sociaux et un marché moderne àKintele. https://lesechos-congobrazza.com/societe/3554-congo-construction-des-logements-sociaux-et-un-marche-moderne-a-kintele (Accessed 17 July 2018).
36 Jeune Afrique (2016). Partenariat chinois – banque congolaise de l’habitat.http://www.jeuneafrique.com/mag/342123/economie/logement-partenariat-chinois-banque-congolaise-de-lhabitat/ (Accessed 17 July 2018).
37 Vox (2017). Le marché immobilier tangue à Brazzaville. http://www.vox.cg/le-marche-immobilier-tangue-a-brazzaville/ (Accessed 8 July 2018).
38 Ibid.39 Doing business (2018). Congo Republic: Registering property.
http://www.doingbusiness.org/data/exploreeconomies/congo-rep#registering-property (Accessed 12 July2018).
40 World Bank 2016. Doing Business Report.41 The World Bank (2018). http://www.doingbusiness.org/data/exploreeconomies/congo-rep#getting-credit

Africa Housing Finance Yearbook 2018
109
to the National Census of 2014, 49.7 percent of the population live in towns andcities including 19.4 percent in Abidjan. The authorities expect to address thedemands of urbanisation through ongoing investment projects aimed at doublingelectricity by 2020, implementing an urban plan for the districts located in Abidjan,and upgrading the road between Bamako and San Pedro.
Access to financeCôte d’Ivoire accounts for 30 percent of UEMOA’s private accounts, 32 percentof ATM machines, and 70 percent of the mobile banking subscriptions in theunion.7 According to the Central Bank of the union (BCEAO), the country’sfinancial industry is growing, and innovative activities are taking place to promotefinancial inclusion. To date there are 28 banks, 2 financial establishments, 80microfinance structures (MFIs) and two financial institutions.8
Notwithstanding Côte d’Ivoire’s weight in the UEMOA region, access to financeis limited and most of the banks’ activities are concentrated in Abidjan. Banklending remained low at 18 percent of GDP in November 2014. According toWorld Bank financial inclusion data / Global Findex only 41.3 percent of adultsaged 15 and above have bank accounts, six percent have savings and three percenthave borrowed from formal financial institutions.9 In 2018, there were 41 MFIs
OverviewThe Republic of Côte d'Ivoire is the world’s largest cocoa producer and the largesteconomy in the West African Economic and Monetary Union (WAEMU/UEMOA),accounting for 35 percent of the region’s total GDP in 2016. The local populationis approximately 25 million1 with the rate of urbanisation at 73.5 percent in 2017,the highest in the union. Despite the 35 percent drop in the price of cocoabetween November 2016 and January 2017,2 the economy has become moreresilient. This can be attributed to a better business climate, public and privateinvestments and higher domestic consumption.3 Economic growth is projectedto reach 7.9 percent in 2018 and 7.8 percent in 2019 despite the decline inagricultural output. Inflation stood at 1 percent in 2017 and is forecast to remainmoderate at 1.8 percent in 2018 and 1.9 percent in 2019.4
The government adopted an economic and financial programme (2016-2020)and implemented reforms set out in the memorandum of economic and financialpolicies 2016-2020 (Plan National de Développement 2016-2020, PND) to boostthe economy. Additionally, a US$525 million grant for the Millennium ChallengeCorporation Program Compact seeks to strengthen economic competitivenessthrough investments in education, technical and vocational training, andtransportation. The country was also selected to benefit from the G20 compactwith Africa, which is expected to boost the private sector, particularly throughincreased foreign direct investment (FDI).5
Government efforts in improving the business climate, and political and socialreconciliation, are attracting more foreign investors from European Unioncountries, China, Morocco and the traditional partner, France. The countrynonetheless remains vulnerable to negative macroeconomic shocks, particularlythose related to exports, in the form of lower commodity prices and lower levelsof FDI. Notwithstanding the implementation of major political reforms, theadoption of a new constitution, the appointment of a new vice president andsenate, uncertainty about the 2020 election and a possible reshuffling of politicalforces could be additional sources of instability.
Housing is a growing concern for the authorities. The construction of 60 000 socialhousing units since 2010 was expected to mitigate the backlog of 600 000 housesacross the country. However, the government estimates the annual housing deficitin the capital alone to be 200 0006 and has diversified its housing programme toaccelerate production. A new cement plant Cimaf is under construction and willcontribute to producing an adequate supply of cement in the market. According
Côte d’IvoireKEY FIGURES
Main urban centres Abidjan
Exchange rate: 1 US$ = [a] 21 Sept 2018PPP Exchange rate (Local currency/PPP$) 1 CFA = [b]Inflation 2016 [c] | Inflation 2017 [c] | Inflation 2018 [c]
564.75 CFA franc244.800.73 | 0.80 | 1.70
Population 2017 [b] | Urban population size 2017 [b]Population growth rate 2017 [c] | Urbanisation rate 2017 [b]Percentage of the total population below National Poverty Line 2015 [d]Unemployment rate 2013 [d]
24 294 750 | 13 494 5192.50% | 3.72%
46.30%9.40%
GDP (Current US$) 2017 [b] | GDP growth rate annual 2017 [b]GDP per capita (Current US$) 2017 [b]GNI per capita (Current US$) 2017 [b]Gini co-efficient 2015 [d]HDI global ranking 2015 [e] | HDI country index score 2015 [e]
US$40 389 million | 7.80%US$1 662US$1 54041.50171 | 0.474
Is there a deeds registry? Number of residential properties that have a title deed Lending interest rate [b]Mortgage interest rate [f] | Mortgage term (years)DownpaymentMortgage book as a percentage of the GDPEstimated number of mortgages Price to Rent Ratio in City Centre | Outside City Centre Gross Rental Yield in City Centre | Outside City Centre Construction as a % of GDP
n/an/a5.30%8.38% | 25n/an/an/an/a | n/an/a | n/an/a
What is the cost of standard 50kg bag of cement? [g]What is the price of the cheapest, newly built house by a formaldeveloper or contractor? (Local currency)What is the price of the cheapest, newly built house by a formaldeveloper or contractor? (US$) What is the size of this house (m2)? What is the average rental price for this unit (US$)? What is the minimum stand or plot size for residential property?
US$9.27
12 500 000 CFA franc
US$21 739n/an/an/a
Ease of Doing Business Rank [h]Number of procedures to register property [h]Time to register property (days) [h]Cost to register property (as % of property value) [h]
139630 days7.40%
NB: Figures are for 2018 unless stated otherwise.
[a] Coinmill.com[b] World Bank World Development Indicators [c] IMF World Economic Outlook Database[d] Central Intelligence Agency (CIA) World Factbook[e] UNDP Development Indicators [f] Statista.com[g] CAHF Yearbook 2017[h] World Bank Doing Business
110
listed on Mix Market, with US$306 million worth of loans dispersed to 89 000borrowers, 175 million deposits and 274 000 depositors.10 Mobile money isdriving the overall progress of financial inclusion, with 38 percent of the adultpopulation having a mobile money account in 2017, the highest rate in the union.11
As a result, access to financial services is mostly through mobile money. A meretwo percent of the financially included do not use mobile money, and 11 percentof adults are using informal financial services.12
In the microfinance sector, total deposits have increased by 247 percent over fiveyears: from CFA 72 billion (US$127.05 million) in 2012, to CFA 250 billion(US$411.1 million) by end of September 2017.13 In the first quarter of 2018, thetotal assets of the sector were estimated at over CFA 260 billion with more than1.6 million members.14 The top three microfinance institutions UNACOOPEC-CI,ADVANS and MICROCRED have around 75 percent of the total clientele.
Broadly, four institutions are involved in the financing of housing. These are theNational Investment Bank; the Support Fund for Housing (Fonds de Soutien àl’Habitat, FSH); the Urban Land Account (Compte des Terrains Urbains) and theHousing Mobilisation Account (Compte de Mobilisation pour l’Habitat, CDMH).The CDMH was created to give financial assistance and tax incentives to stimulatethe delivery of affordable housing for low income buyers.
Access to housing finance remains a challenge in Côte d’Ivoire. To alleviate thedifficulties, the government has been able to negotiate a 5.5 percent interest ratefor housing loans, repayable over 25 years.
The FSH and the creation of a mutual guarantee fund for the president’sprogramme of constructing 60 000 houses between 2010 and 2015 have not fullymaterialised. Among the many reasons for this are a lack of adequate funds tocompensate the traditional owners of land, the lack of financial and technicalcompetence of the local developers, and the underestimation of the selling priceof a housing unit, initially priced by the government at CFA 5 million (US$8 700).
The government has since adopted new measures to satisfy consumers, housingdevelopers and financial institutions i.e. the revision of interest rates and houseprices. The cheapest house is now priced at CFA 12.5 million (US$21 750).15
Some people are still sceptical about the government programme and aredemanding the reimbursement of their deposits.
The government has also introduced new incentives in 2017 by Ordonnance N°2017 – 279 du 10 mai 2017 to encourage real estate developers. It has put inplace a reduction of 50 percent of taxes on profit for those developers thatdedicate 60 percent of their production to very low income groups (socialhousing). The government has fixed the prices of houses in the governmentalprogramme as follows: CFA 23 million (US$40 020) per unit for economic housingand CFA 12.5 million (US$21 750) for social housing. The government is alsoencouraging institutions and corporations to participate in housing developmentfor their employees.
AffordabilityIn 2017 access to adequate and affordable houses remained a challenge even amideconomic growth and various initiatives aimed at promoting affordable housing.Rapid urbanisation, low minimum salary, and the inequalities in social infrastructureshave accelerated urban poverty and slums in the cities, especially in Abidjan where19.4 percent of the population live.16 Abidjan also housed most of the country’seconomic activities and slums due to the influx of immigrants from the rural zonesin quest of opportunities. According to the ministry of construction, between2013 and 2017 an estimated 10 00017 units had been delivered. To accelerateaffordability and to boost industrialisation of the housing value chain, the authoritiesintroduced “Circulaire No. 12” which reinforced the capacity of the CDMH tofinance banks, housing developers and homeowners on favourable terms.18
The average Ivoirian earns less than CFA 60 000 (US$104,40) a month, which hasbeen the minimum salary since 2013. The minimum salary relates to those peopleworking for the government and the formal private sector and barely represents18 percent of the labour force. Most of the population works in the agriculturalsector and the informal sector. They live in shanty houses in areas such as Koumasi,
where there is little or no urban infrastructure. According to the local press, rentsin the these areas range between CFA 35 000 and CFA 75 000 (US$60.90 toUS$130.50) for a room. Rents are rising in the residential zones especially areassuch as Plateau, Cocody and Marcory, where most expatriates live. According toa Frank Knight 2018 report, a four-bedroom executive apartment is aboutUS$3 700 a month.
In an attempt to boost affordability, the government continues with efforts toreinvigorate the housing sector, ameliorate the procedure of obtaining constructionlicences, and reduce the cost of refinancing for banks to two percent and maintainthe interest rate for housing loans to 5.5 percent. The government’s goal is toprovide adequate houses for all categories of the population i.e. the low, middle,and high income Ivoirians.
Housing supplyMost houses in Côte d’Ivoire are self-built. Informal enterprises produce most ofthe stock of houses in the country. However, the government has contributed tohousing development between 1970 and 1980, especially in Abidjan througheconomic development policies. SOGEPHIA and SICOGI are the two publiccompanies in charge of housing development and property management19 andthey have produced housing on a mass scale. As of 1995, the government stoppedsubsidising housing, contributing to an acute deficit in housing even before the civilwar.
Currently the government is focusing on investing in mass-produced affordablehouses through different mechanisms to bridge the gap between supply anddemand. This has seen increased construction in the country’s cities and moreparticularly in Abidjan. Among notable construction projects are those of GroupAlliance and Group ADDOHA. In December 2017, Alliance delivered a firsttranche and ADDOHA is expected to deliver in 2018.20 Côte d’Ivoire’s housingdeficit in 2016 was estimated to be over 600 000 units,21 with the need beingmost prevalent in cities. The government estimates the annual housing deficit inAbidjan alone to be 200 000. Housing supply in the capital is less than 3 000 ayear and 68 percent of Ivoirians are renters according to a Knight Frank 2015study.
The housing deficit is a source of rent speculation and other consumer complaints.To protect the population, Le Ministère de la Construction, du Lodgement del’Assainissement et de l’Urbanisme introduced a code of urban properties in 2015,(Le code du foncier Urbanisme) to regulate rents and minimise rental guaranteesand other miscellaneous rental funds.22
Construction of decent affordable homes was among the electoral promises ofPresident Alhassane Ouattara. In February 2017, Opes Holding SA signed a loanagreement with Ikdam.Turc CI.SA. The loan consisted of CFA 13 billion (US$ 23.1million) for the development of a real estate project in Abidjan and itscountryside.23
In September 2017, SICOGI managing director, Bouaké Fofana announced thedelivery of 235 houses in Azito.24 Opes Holding and the Canadian real estategroup NCK International signed a partnership in November 2017 for theconstruction of social housing across the country. The project will be submittedto a joint-venture financing scheme between the two partners.25 In December2017, the Moroccan company Alliances delivered 4 000 houses of varying natureand price located in Anyama to their new owners. The price of social housingwas capped at CFA 12 000 000 (US$21 257.51) while the price of economichousing was capped at CFA 23 000 000 (US$40 753.57).26 The company plansto construct 7 800 units at the site and a total of 14 000 units in the country.ADDOHA, another Moroccan group, is on track to deliver its first unit in early2018 out of 745 units under construction in Koumassi. There are at least 45 localdevelopers and five international ones participating in the government socialhousing project.27 Phoenix Africa Partners Holdings (PAPH), an Ivoirianinvestment platform, and China Railway Construction Corporation signed anagreement in March 2018 for social and economic housing to cater for the risingmiddle-class population.28 The CEO of the Société d’Expertise en Génie Civil(SEGC), Thomas Dagbo announced the launch of a project in Abidjan in May 2018,which will seek to build 250 houses, a hospital and a mall.29

Africa Housing Finance Yearbook 2018
111
The government recognises the limitations of the country’s housing policy asillustrated by the gap between supply and demand for homes. The measuresintroduced in 2016 by the former minister i.e. taxes on the importation ofconstruction material, cement and clinker, and a housing tax on salary, to create aspecial fund which will serve as a guarantee for banks, are yet to be fullyimplemented. However, the government is striving to overcome the challenges.The 2018 edition of the Social and Economic Housing Forum, which took placefrom the 25-27 June 2018, was dedicated to creating a roundtable of key housingactors to find solutions to the constraints in social and economic housing supply;30
the reactivation of the Approval Commission of Real Estate Developers, with morestringent selective procedures, is an illustration of the political willingness toimprove the housing sector.31
Property marketsAccording to the Knight Frank 2017-2018 report,32 rents are increasing. Theaverage price for a four-bedroom executive villa at Cocody, which is a primelocation, is US$3 700 a month. Demand for retail space and offices is also goingup. Response to demand can be seen in new office and retail developments suchas Green Buro in Cocody and Renaissance plaza project in Plateau. New supplyis expected to come onto the market in 2018, placing more pressure on rents.Rental prices range from CFA 125 000 to 200 000 (US$217.50 – US$348.52) fora “studio” in Abidjan targeted at the middle-income population. There is a hugegap between rents, depending on the geographical location of the property.According to local market information, rents in the low income areas rangebetween CFA 45 000 to CFA 55 000 (US$78.30 to US$95.70) for a room in amulti-room building in popular zones. For houses built under the governmentprogramme, prices range between CFA 12.5 million (US$21 750) andCFA 23 million (US$40 020). These are fixed prices.33
Côte d’Ivoire has improved its rank in doing business as far as registration ofproperty is concerned, from 120 in 2015 to 113 in 2018.34 The cost of registrationhas fallen to 7.4 percent, still high by international standards. The registrationprocess of 30 days, though unaffordable for most of the population, is among thelowest in the region. Côte d’Ivoire has begun digitising its land registry system andlowering the property registration tax. The World Bank’s 2018 Doing BusinessReport ranks Côte d’Ivoire in 152nd place out of 190 countries in terms of dealingwith construction permits, with 21 procedures, and 162 days, a net progresscompared to previous years.
Policy and regulationBefore 1998 and according to customary law, women in Côte d’Ivoire wereneither allowed to own land nor inherit it. Law No. 98-75, the rural land law,permits women to own land; however, in rural areas men are still the mainbeneficiaries of land. Although government agencies are responsible for landregistration, a law (N°2013-481) was passed in July 2013 called Arrêté deConcession Definitive, as the sole document for urban land registration. According
to the housing Minister, this law is to facilitate the process of land acquisition andprotect the right to property.
Still, the most recent municipal land regulation and building code was drawn up in1996. The minimum house size that can be built in Abidjan is 100m2 and themaximum height is four storeys; however, in some municipalities more space andheight is allowed.
Côte d'Ivoire has improved the strength of its legal rights through amendments in2012 to the OHADA Uniform Act on Secured Transactions, which broadens therange of assets that can be used as collateral (including future assets), extends thesecurity interest to the proceeds of the original asset, and introduces the possibilityof out-of-court enforcement.
Although legal rights have been improved, the government and the citizensrecognise the limit of the country’s housing policy. In 2016-2017 new regulations(Ordonnance N° 2017 – 279/ 10- May 2017) were enacted, and efforts are beingmade to enforce various existing rules and regulations. It is expected that theimprovement of housing policies will contribute to bridging the gap betweensupply and demand for homes, especially affordable houses.
Laws relating to housing include:
n Law 62-253/31-7-62: Invests full authority in the ministry of housing for thedevelopment of the country’s urban planning.
n Law 2003-208 / 7-7-203: Modified law 62-253/31-7-62 and transfers theauthority from the central government to local authorities.
n Law 98-750 /23-12-98: Transfers customary land rights to private propertyrights regulated by the state.
n Law (N°2013-481) Arrêté de Concession Définitive (ACD): Passed in July2013 and is the sole document for urban land registration. Facilitates theprocess of land acquisition and protects the right to property.
n Ordonnance N° 2017 – 279/ 10- May 2017: Reduction of 50 percent of taxeson profit for those developers who dedicate 60 percent of their productionto very low income group social housing. Encourage real estate developersto invest in housing development for low income groups. Fixes prices ofhouses built in the governmental programme: CFA 12.5 million (US$21 078)for social housing and CFA 23 million (US$40 020) for economic.
Côte d’Ivoire seeks to improve its regulatory framework through several reforms,among which is the one-stop-shop for obtaining building permits, simplification ofprocedures, and reduction of registration and miscellaneous cost. The countryhas also introduced an electronic Land Registry to streamline land titleacquisition.35
PPP$40 001 – PPP$10 000 000
PPP$23 001 – PPP$40 000
PPP$12 001 – PPP$23 000
PPP$8 001 – PPP$12 000
PPP$5 001 – PPP$8 000
PPP$3 601 – PPP$5 000
PPP$2 401 – PPP$3 600
PPP$1 601 – PPP$2 400
PPP$801 – PPP$1 600
<PPP$800
- - - Average annual household income needed for the cheapest newly built house by a formal developer, 2017 Average annual household income using expenditure, 2017 (PPP$)
COTE D'IVOIRE
Annual income profile for rural and urban households based on consumption (PPP$)
No. of households (thousands)
PPP$17 584
PPP$15 091
Rural Urban800 600 400 200 0 200 400 600 800
Population: 24 294 750
Urbanisation rate: 3.72%
Cost of cheapestnewly built house:
12 500 000 CFAPPP$52 062
Urban householdsthat could afford thishouse with finance:
19.45%
1 PPP$: 244.8 CFA franc
Source https://www.cgidd.com/

112
OpportunitiesCôte d’Ivoire has increased its cement production in 2018 with the setting up byMoroccan company Ciment de l’Afrique (Cimaf) of a factory with annual capacityof 300 000 tons in Bouake. Cimaf will have a multiplier effect, for it increases thesupply of cement, reducing the price, and generates jobs. The national housing market is developing, and the needs are enormous, whichmeans great opportunities in all segments of the real estate industry – retail,industrial and tourist. The government is making efforts to improve the businessclimate, implement the ambitious National Development Plan, reform the bankingsector, and simplify construction procedures and property registration. Theincreased presence of foreign investors and developers, various governmentdevelopment programmes and the efforts of the government to modernise anddiversify the urban poles are indicators of opportunities for the housing financeand housing development sectors.
Additional sourcesBA Ibrahima, Directeur Général INS, Directeur Exécutif du RGPH2014;Recensement Général de la Population et de l’Habitat 2014.
Combien coute (2018). Salaire moyen. https://www.combien-coute.net/salaire-moyen/cote-d-ivoire/ (Accessed 14 September 2018).
International Monetary Fund (2017). IMF Country Report N° 17/372 Coted’Ivoire - December 2017.
Recensement General de la Population et de l’Habitat (2014). Ibrahim Ba.Rapport d’exécution et Présentation des principaux résultats.http://www.ins.ci/n/documents/RGPH2014_expo_dg.pdf (Accessed14 September 2018).
1 World Population Review (2018). Ivory Coast Population 2018.http://worldpopulationreview.com/countries/ivory-coast-population/ (Accessed 13 September 2018).
2 African Development Bank (2018). Côte d’Ivoire Economic Overview.https://www.afdb.org/en/countries/west-africa/cote-d%E2%80%99ivoire/cote-divoire-economic-outlook/(Accessed 13 September 2018).
3 African Economic Outlook Country Notes 2018. Cote d’Ivoire.4 Ibid.5 Ibid. 6 Le Ministère de la Construction, du logement, de l’assainissement et de l’urbanisme. 7 The Oxford Business Group (2017). www.oxfordbusinessgroup.com/cote-divoire-2017/banking 8 BCEAO Rapport Annuel 2017.9 World Bank (2018). The Little Data Book on Financial Inclusion. Pg 50.
https://openknowledge.worldbank.org/bitstream/handle/10986/29654/LDB-FinInclusion2018.pdf?sequence=1&isAllowed=y (Accessed 3 September 2018).
10 The Mix (nda). Country and Regions. http://www.themix.org (Accessed 13 September 2018).11 CGAP, Advancing financial inclusion to improve the lives of the poor (2018). Corinne Riquet. In Côte
d'Ivoire, Financial Inclusion at a Crossroads. http://www.cgap.org/blog/c%C3%B4te-divoire-financial-inclusion-crossroads (Accessed 13 September 2018).
12 Ibid.13 Financial Afrik (2018). Jean-Mermoz Konandi. Côte d’Ivoire : le secteur de la microfinance en forte croissance.
https://www.financialafrik.com/2018/01/08/cote-divoire-le-secteur-de-la-microfinance-en-forte-croissance/(Accessed 13 September 2018).
14 DGTPC-CI (2018). Synthèse de la note conjoncturelle du premier trimestre 2018.http://microfinance.tresor.gouv.ci/micro/2018/07/19/synthese-de-la-note-conjoncturelle-du-premier-trimestre-2018/ (Accessed 14 September 2018).
15 Le Ministère de la Construction, du logement, de l’assainissement et de l’urbanisme.16 Recensement General de la Population et de l’Habitat (2014). “Rapport d’execution et Presentation des
principaux resultats.” http://www.ins.ci/n/documents/RGPH2014_expo_dg.pdf (Accessed 21 Sept 2018).17 The Oxford Business Group (2018). “Authorities working to deliver social housing in Côte d'Ivoire.”
https://oxfordbusinessgroup.com/analysis/homes-all-after-few-years-delay-authorities-and-developers-are-making-good-plans-deliver-social (Accessed 21 Sept 2018).
18 Abidjan.net (2018). Le Patriote. Le coût des loyers et cautions va baisser. http://news.abidjan/h/631431.html(Accessed 14 September 2018).
19 Between the two companies, 24 254 housing units were constructed in Yopougon, 10 770 in Cocody and6 938 in Port-Bouet during those years. The houses are individual villas, duplexes and one to two-storeybuildings with apartments and studios built with adequate construction material and in well planned urbancommunities with amenities.
20 The Oxford Business Group (2018). Authorities working to deliver social housing in Côte d'Ivoire.https://oxfordbusinessgroup.com/analysis/homes-all-after-few-years-delay-authorities-and-developers-are-making-good-plans-deliver-social (Accessed 14 September 2018).
21 Le Ministère de la Construction, du logement, de l’assainissement et de l’urbanisme.22 Abidjan.net (2014). http://news.abidjan.net/h/493809.html 23 Agence Ivoirienne de Presse (2017). Un operateur Ivoirien Obtient plus de 13 milliards de fcfa pour la
Construction de Logements a Abidjan. http://aip.ci/logements-un-operateur-ivoirien-obtient-plus-de-13-milliards-f-cfa-pour-la-construction-de-logements-a-abidjan-et-en-region/ (Accessed 14 September 2018).
24 Portail Officiel du Gouvernement de Côte d’Ivoire (2017). Actualites. http://www.gouv.ci/_actualite-article.php?recordID=8075&d=1 (Accessed 14 September 2018).
25 Le Nouvel Afrik (2017). Opes Holding SA et NCK International s’associent pour la construction delogements. https://www.afrik.com/cote-d-ivoire-opes-holding-sa-et-nck-international-s-associent-pour-la-construction-de-logements (Accessed 14 September 2018).
26 Rfi Afrique (2017). 4000 Logements livres à Abidjan. http://www.rfi.fr/afrique/20171228-cote-ivoire-4000-logements-livres-abidjan-pallier-deficit (Accessed 14 September 2018).
27 The Oxford Business Group (2018). Authorities working to deliver social housing in Côte d'Ivoire.28 La Libre Afrique (2018). AFP. Accord avec un Geant Chinois pour les Logements Sociaux.
https://afrique.lalibre.be/16597/cote-divoire-accord-avec-un-geant-chinois-pour-des-logements-sociaux/(Accessed 14 September 2018).
29 Agence de Presse Africaine (2018). APA. Côte d’Ivoire : un promoteur annonce le lancement d’un pôleurbain de 250 logements à Abidjan. http://apanews.net/fr/pays/cote-divoire/news/cote-divoire-un-promoteur-annonce-le-lancement-dun-pole-urbain-de-250-logements-a-abidjan (Accessed 14 September 2018).
30 CCESP (2018). Cisse Yacouba. Forum Du Logement Social, Economique Et Standing.https://ccespblog.wordpress.com/2018/06/23/forum-du-logement-social-economique-et-standing/ (Accessed14 September 2018).
31 Le Blog de Le petit journaliste ivoirien (2017). Côte d’Ivoire : Claude Isaac DE, ministre de la Construction,du Logement, de l'Assainissement et de l'Urbanisme remet son ministère sur les rails.http://lepetitjournalisteivoirien.over-blog.com/2017/10/cote-d-ivoire-claude-isaac-de-ministre-de-la-construction-du-logement-de-l-assainissement-et-de-l-urbanisme-remet-son-ministere-sur (Accessed14 September 2018).
32 Research Knight Frank (2018). Africa Report 2017/18, Real Estate Market in a Continent of Growth andOpportunity. Pg. 19.
33 Koaci (2017). Côte d’Ivoire : Les prix de vente des logements sociaux «imposés» aux promoteurs.https://koaci.com/cote-divoire-prix-vente-logements-sociaux-imposes-promoteurs-109410.html (Accessed14 September 2018).
34 World Bank Doing Business 2018.35 The Oxford Business Group (2018). http://oxfordbusinessgroup.com/cote-divoire-2018
Africa Housing Finance Yearbook 2018
113
The DRC made starting a business easier by eliminating the requirement that awoman obtain her husband’s permission to start a business and by combiningmultiple business registration procedures. Furthermore, the country made dealingwith construction permits more transparent by publishing all regulations relatedto construction online. The DRC is ranked 182nd out of 190 in the World Bank’sDoing Business Index in 2018.8
The Gross National Income per capita is estimated at US$680,9 and two-thirdsof the population live below the poverty line, meaning that approximately74 percent of the population live on less than US$ 1.25 a day.10 The Congolesefranc depreciated against the U.S. dollar by 23.7 percent in 2016 and 22.5 percentin late September 2017, which raised inflation from 0.8 percent in 2015 to6.9 percent in 2016 and to 42.9 percent in 2017. The current account deficit was3.2 percent of GDP in 2016 and an estimated 2.4 percent in 2017 and is projectedto continue to improve in 2018.
OverviewThe Democratic Republic of Congo (DRC) covers an area of 2 344 858km2 forapproximately 84.2 million people.1 Nine (9) border countries surround thecountry. This, added to its immense natural resource reserve, provides an abundantset of assets for business and investment opportunities in the DRC. Despite thewealth of fertile soil, hydroelectric power potential, and mineral resources, theDemocratic DRC struggles with many basic socio-economic problems.2
Mineral wealth has allowed for some levels of real gross domestic product (GDP)growth, as the extractive sectors produce large quantities of copper, cobalt andgold. A growing population in the DRC also drives economic growth from aconsumer spending perspective. However, growth is still restrained by thechallenges of developing adequate infrastructure throughout the country. In 2018,stronger mining sector production, led by copper and cobalt, and stabilisingexternal accounts will support a slight acceleration of economic growth to3.3 percent from 2.8 percent in 2017.3 However, FocusEconomics analysts see agrowth of approximately 3.7 percent in 20194 while the predictions from theAfrican Development Bank indicate that economic growth will reach 4.2 percentin 2019.5
Headline inflation increased from 67.5 percent y-o-y in July to 70.8 percent y-o-yin August. Low commodity prices and insufficient inflows of US dollars have causedthe Congolese franc to weaken significantly. The lack of financing will continue todrive double-digit inflation in 2018 and the government’s ban on common importswill contribute to the spiralling inflation rate. To try to curb inflation, the centralbank increased the country’s base interest rate from 7 percent to 14 percent inFebruary 2017 and to 20 percent in June, with further increases likely in 2018.Although the formal economy is largely dollarised and operates unhindered bylocal interest rates, the current shortage of hard currency and reductions of keyimports will have an adverse effect. The IMF expects inflation to average44 percent in 2018.6
The recently released Plan National Stratégique de Développement (PNSD)2017-2021 focuses on making the DRC an emerging market economy by 2030and a developed country by 2050. However, the country’s deteriorating securitysituation and uncertainty over policy direction have reduced donor assistance anddissuaded foreign investment. The release of the election timetable in November2017 – indicating polls will be held in December 2018 – will provide slightly morecertainty about the country’s political dynamics.7
Democratic Republic of CongoKEY FIGURES
Main urban centresKinshasaLubumbashi
Exchange rate: 1 US$ = [a] 21 Aug 2018PPP Exchange rate (Local currency/PPP$) Congolese franc = [b]Inflation 2016 [b] | Inflation 2017 [b] | Inflation 2018 [c]
1 620 Congolese franc180.105.9 | 53.5 | 44
Population [d] | Urban population size [e] Population growth rate [f] | Urbanisation rate [g]Percentage of the total population below National Poverty Line [h]Unemployment rate [i]
84 260 069 | 33 989 7533.28% | 5.10%74.00%18.0%
GDP (Current US$) 2017 [j] | GDP growth rate annual 2017 [c]GDP per capita (Current US$) 2017 [g]GNI per capita (Current US$) 2017 [b]Gini co-efficient 2017 [g]HDI global ranking 2015 [k] | HDI country index score 2015 [k]
US$37 600 million | 3.3%US$434US$45061.00176 | 0.435
Is there a deeds registry? Number of residential properties that have a title deed Lending interest rate [i] Mortgage interest rate | Mortgage term (years)DownpaymentMortgage book as a percentage of the GDP [f]Estimated number of mortgages Price to Rent Ratio in City Centre | Outside City Centre Gross Rental Yield in City Centre | Outside City Centre Construction as a % of GDP
Yesn/a20.62%14.00% | 15n/a8.00%n/an/a | n/an/a | n/an/a
What is the cost of standard 50kg bag of cement? What is the price of the cheapest, newly built house by a formaldeveloper or contractor? (Local currency)What is the price of the cheapest, newly built house by a formaldeveloper or contractor? (US$) What is the size of this house (m2)? What is the average rental price for this unit (US$)? What is the minimum stand or plot size for residential property?
US$10.00
32 400 000 Congolese franc
US$20 00085m2
US$50085m2
Ease of Doing Business Rank [l]Number of procedures to register property [l]Time to register property (days) [l]Cost to register property (as % of property value) [l]
182838 days11.10%
NB: Figures are for 2018 unless stated otherwise.
[a] Xe.com [b] World Bank World Development Indicators[c] KPMG - DRC[d] Central Intelligence Agency (CIA) World Factbook[e] Worldometers[f] Worldpopulationreview.com[g] World Bank Open Data[h] Food and Agriculture Organization (FAO) for United Nations[i] Trading Economics[j] Focuseconomics.com[k] UNDP Development Indicators[l] World Bank Doing Business

114
Access to financeThe Congolese financial system is growing but remains fragile and operatesprimarily through the Congolese Central Bank (BCC). The financial sectorcomprises 17 licensed banks, a national insurance company, the National SocialSecurity Institute, one development bank, Société Financière de Development, asavings fund, 102 microfinance institutions and cooperatives, 72 money transferinstitutions which are concentrated in Kinshasa, Kongo Central, North and SouthKivu and the former Katanga provinces, three electronic money institutions, and23 foreign exchange offices. There is no secondary equity or debt market.11
Bank penetration is roughly six percent or approximately 3.9 million accounts,which places the country among the most under-banked nations in the world.Based on its strategic plan, the BCC seeks to create more than 20 million bankaccounts by 2030. Banks are increasingly offering savings accounts that payapproximately 3 percent interest, but few Congolese hold savings in banks.According to the Banking Association of Congo (ACB), of an estimated 65 percentof the population that saves, only 4.7 percent do so through a bank.12
Few banks (Bank of Africa, ProCredit Bank, Rawbank and Trust Merchant Bank)and microfinance institutions (FINCA RDC, I-Finance) offer both mortgage andconstruction finance, requiring, however, that borrowers be employees and havetheir employers sign agreements to place their salaries in these institutions. Thesehousing loans are secured either by mortgage or by the commitment of theiremployers that, in case they leave their companies, the borrowers’ terminalpayments will be paid to them through the lending banks. The amount of debtthat can be secured by terminal payment cannot, however, exceed US$ 20 000,while the maximum for mortgages is set at an average of US$ 150 000.13
Financial inclusion is increasing, but substantial progress is needed to developpayment systems, facilitate the use of financial services, and strengthen regulationof the non-banking sector. Consolidation and strengthening of microfinance alongwith reform of the insurance and pension sub-sector could facilitate the expansionof financial services and attract long-term investors.14
The DRC’s capital market remains underdeveloped and consists mainly of theissuance of treasury bonds. There are no stock exchanges operating in the country,although a small number of private equity firms are actively investing in the miningindustry.
The central bank developed a market for short-term bonds, but most of thesebonds are bought and held by local Congolese banks. In the absence of privatedebt securities, the fixed-rate market is limited to government-issued treasurybonds with maturities of up to 28 days traded through commercial banks.
Borrowing options for Small and Medium Enterprises are limited. Maturities forloans are usually limited to 3-6 months, and interest rates typically hover around16-18 percent.
In early 2017 the International Finance Corporation, a member of the World BankGroup, and the MasterCard Foundation signed a US$1 million agreement withthe Foundation for International Community Assistance, known by its acronymFINCA, a microfinance institution, to support the expansion of its digital financialservices and access to credit for the low income population and small-scaleentrepreneurs.15
AffordabilityThe country is still ranked 176th on the UN Human Development Index out of188 countries and territories worldwide.16 Access to affordable and sustainablehousing is almost impossible for low income earners due to a lack of low-costhousing supply and low wages. Both the duration and interest rates for housingloans are restrictive. While the interest rate is at an average of 24 percent (higherfor microfinance institutions) – an indirect consequence of the Central Bank’s highbase interest rate – the maturity of most loans is set at a maximum of 60 months(5 years) due to the unpredictability of the current economic situation.17 Highlending rates by commercial banks make it difficult for the majority of the localpopulation to access financial services. That the unemployment rate is high, roughly46.10 percent in 2013,18 and that 74 percent of the population lives on less thanUS$1.25 a day means that more than half of the population is excluded fromaccess to housing finance.
Housing and offices built by private operators are often too expensive for locals.For example, in Kinshasa, the high price of properties (averaging over US$150 000)is pushing middle class residents and the poorest segment of the population fartheraway from city centre. Houses built in the new Kin-Oasis development atBandalungwa cost approximately US$850 000, which is affordable to few locals.19
Average rental prices vary between US$400-US$500 per month, yet this price isstill not affordable for many Congolese, as civil servants’ monthly salary is roughlybelow US$100. The average rental rates for an apartment in Gombe, a rich suburbof Kinshasa, varies between US$1 200 and US$5 000 per month, while the rentfor a villa in the same area can cost between US$2 500 and US$10 000 permonth.20 The purchase price of an apartment varies between US$200 000 andUS$450 000, depending on the size of the unit.21
Housing supplyHousing demand in the DRC outweighs housing supply, and the backlog isestimated at 3 945 555 houses countrywide. Kinshasa alone has a housing deficitestimated at 54.4 percent of the overall national deficit, i.e. an average of 143 092houses to be built per year.22
Worth noting is that the DRC government does not have any housing supportprogramme specifically targeted to support or subsidise low income householdsto access housing; therefore, the property market is solely left to the private sector.Urbanisation has increased from 9.9 percent in 1956 to over 42 percent in 2015,which reflects a relative surge in construction and housing supply. The countrylacks a national housing development agency that can ensure that humansettlement developments are sustainable, viable and appropriately located.
In rural areas, which make up 57.4 percent of the country,23 the notion of propertydevelopment is totally absent. Therefore, the limited number of developers areconcentrated in urban areas, with very restricted access to finance. Because ofthis situation, housing supply is limited, and only accessible to the elite minority.
In the past five years, there has been a slight increase in housing supply and privatehousing development. However, most of the houses put on the market do nottarget low-income earners and are not affordable.24 In 2011, for example, thecentral government launched a housing project named Cité Kin-Oasis, whichaccommodated the construction of 1 000 social houses in Kinshasa/Bandalungwa.This project has now been completed; however local communities havecomplained about the affordability and high price of the houses.
In Lubumbashi, a US$1.4 billion housing development called Luano City launchedin 2010, is still under construction. Luano City is a mixed-used developmentproject comprising two and three-bedroom houses, office park, and a retail spacein the form of a shopping mall and industrial park.
Most housing development projects in the country are in the capital city ofKinshasa, including Cité du Fleuve, Cité de l’Espoir, Cité Belle Vie, Cité Moderne,etc. However, there are sporadic housing developments currently in the pipelinein other areas such as Fungurume, a mining district of the newly created provinceof Lualaba. Further, UN-Habitat25 has been working mainly in North Kivu, Ituri,Bunia/Djugu, Mahagi and Masisi Territory, and the Equateur Province on severalhousing projects.
Property marketsThe property market in DRC has experienced relative progress in recent years,on the back of private property reforms and the increased demand for housingfrom a fast-growing population, hence offering significant business opportunitiesfor investors.26 However, limited access to finance remains the major constraint,as the majority of the local population do not have access to financial systems,and foreign investment in the sector is very slow. In addition, most of the recentdevelopment projects have been focusing on urban areas such as Kinshasa,Kisangani, Goma and Lubumbashi. In these urban areas, the cost of land, title deedregistration process and building materials are relatively high, therefore slowingdown the development of the property market.
Property prices are high and generally aimed at the high-end market. Accordingto real estate agent Knight Frank, prime yields of 15 percent can be realised inDRC’s retail market, with rents of US$35 per m2 per month.27 Industrial propertyyields 13 percent at US$8 per m2 per month, followed by offices that yield

Africa Housing Finance Yearbook 2018
115
12 percent at US$45 per m2 per month. The residential market yields 10 percentwith rents of US$8 000 a month for a four-bedroom executive house.28
The office development activity appears to have accelerated since the last electionsin 2011, but businesses are likely to become more cautious in the run-up to the2018 elections. Prime rents are approximately US$30 per square metre permonth but can reach US$40 per square metre per month for good quality smallspaces.29 The retail market has shown limited progress in recent years andShoprite is the only major international retailer in Kinshasa, having a supermarketin a prime position in the Gombe district.30
Industrial property is clustered around the Route des Poids Lourds, particularly inthe areas of Kingabwa and Limete. Rents can be as high as US$12 per squaremetre per month, but this is for industrial properties that are used by embassiesand NGOs, rather than industrial users. Prime rents for new-build industrialproperties are more usually in the order of US$8 per square metre per month.31
Residential values in the centre of Kinshasa, and in particular Gombe, were drivenupwards during the 2000s by the arrival of large numbers of UN personnel.
Dealing with construction permits requires 12 procedures, takes 122 days andcosts approximately six percent of the property value. Globally, DRC is ranked121 in 2018 from 114 in 2017 out of 190 economies on the ease of dealing withconstruction permits, which constitutes a negative change for the constructionand housing sectors.32 With regard to property registration, DRC is ranked 158in 2018 and it can be completed in 38 days, down from 44 days last year througheight steps.33 Across the country, households have an average of three rooms forresidential use. The number of bedrooms is two, but 41 percent of householdsdo not have independent bedrooms.34
Policy and regulationIn 2002, the government passed new laws to improve the central bank’s role asregulatory and supervisory authority and increase its independence. Act 11/020of 15 September 2011 defines rules relating to the activity of microfinance.
The insurance legislation, Act No. 15/005 of 17 March 2015, was adopted toliberalise the insurance sector and attract private insurance companies. Thislegislation has allowed the creation and the effective establishment of the InsuranceRegulatory and Control Authority. Other property laws include Circular Noten°005/CAB/MIN/AFF FUNC/2013 of 12 June 2013 on the procedure and thetransfer period of land and property rights; Ministerial Order No.cab/MINA/TUHITPR/007/2013 of 26 June 2013 concerning the regulations ofgranting building permits in DRC; and Law No. 15/025 of 31 December 2015 onleasing and non-professional rents.35
OpportunitiesDRC, a country with the size of a subcontinent, has enormous potential in varioussectors that deserve to be converted into real wealth. The country has beendivided into 26 provinces with a view to economically developing each of them.It is believed that housing development and delivery will be among the majorprojects needed to improve the newly established provinces.
Further, the National Agency for the Promotion of Investments has presented alist of major projects waiting for funding to boost the economy. In total, 27 projectshave been identified and are grouped around four priority areas namely: agriculturesector: 5 projects; infrastructure sector (railways, lake, river and sea): 14 projects;tourism sector: 5 projects; energy sector: 1 project; and ICT sector: 2 projects.36
The implementation of the preceding projects will create employment that willgenerate incomes and provide buying power to local people to address theirneeds, including access to housing. It should be noted that there have been tightlinkages between poverty alleviation and income. Income generation in manycases contributes to development of society by increasing housing affordability,decreasing child malnutrition and decreasing social instability. In addition, thetransfer of the take-home pay increases the domestic demand and makes the localmarket attractive for both domestic and international investments, and thusstimulates local housing markets.
DRC has many areas to be exploited throughout the country; in each province,land dedicated to the construction of social housing exists; housing demand isstrong compared to supply; and a significant market share exists for newconstruction companies and investors in the sector. Furthermore, Habitat forHumanity International has undertaken an analysis of the housing constructionvalue chain in the DRC.
Furthermore, the government has put in place urban land reform strategies, whichconsists of construction in specialised economic zones and agricultural-industrialparks across the country. Through land reform, the government wants to achieveequitable and reasonable urban space planning that promotes equitable resourcedistribution between regions and production sectors as well as to streamline urbandevelopment without neglecting rural development. This is encouraged, inter alia,through the allocation in each province of specific areas dedicated to theconstruction of social housing.37
Lastly, recent initiatives launched by local banks and microfinance institutions, suchas PEPELE Mobile (Trust Merchant Bank), FINCA Mobile, ProCredit Cash Express,etc. as well as the establishment of new private equity companies, promote financialinclusion and provide more housing finance opportunities and options.
Source https://www.cgidd.com/
PPP$40 001 – PPP$10 000 000
PPP$23 001 – PPP$40 000
PPP$12 001 – PPP$23 000
PPP$8 001 – PPP$12 000
PPP$5 001 – PPP$8 000
PPP$3 601 – PPP$5 000
PPP$2 401 – PPP$3 600
PPP$1 601 – PPP$2 400
PPP$801 – PPP$1 600
<PPP$800
- - - Average annual household income needed for the cheapest newly built house by a formal developer, 2017 Average annual household income using expenditure, 2017 (PPP$)
DEMOCRATIC REPUBLIC OF CONGO
Annual income profile for rural and urban households based on consumption (PPP$)
No. of households (thousands)
PPP$5 996
PPP$21 961
Rural Urban3 000 2 000 1 500 1 000 500 0 500 1 000 1 500 2 000 3 000
Population: 84 260 069
Urbanisation rate: 5.10%
Cost of cheapestnewly built house:
32 400 000 CDFPPP$42 414
Urban householdsthat could afford thishouse with finance:
2.45%
1 PPP$:180.1 Congolese
franc

116
1 Worldometers (2018). DRC Population. http://www.worldometers.info/world-population/democratic-republic-of-the-congo-population/ (Accessed 16 August 2018).2 Central Intelligence Agency (2018). World FactBook, Africa: Congo, Democratic Republic of The. https://www.cia.gov/library/publications/resources/the-world-factbook/geos/cg.html3 KPMG DRC (2018). DRC Economic Snapshot H2, 2017. https://home.kpmg.com/content/dam/kpmg/za/pdf/2017/12/DRC-2017H2.pdf (Accessed 16 August 2018).4 Focus Economics (2018). DR Congo Economic Outlook. https://www.focus-economics.com/countries/dr-congo (Accessed 16 August 2018). 5 DABIRE, J.M.V. (2018). Perspectives Économiques en Afrique 2018, République démocratique du Congo, Groupe de la Banque Africaine de Développement. Pg. 4.6 KPMG DRC (2018). 7 African Development Bank Group (2018). Democratic Republic of Congo Economic Outlook. www.afdb.org/en/countries/central-africa/democratic-republic-of-congo/democratic-republic-of-congo-economic-outlook/ (Accessed 16 Aug
2018).8 World Bank Group (2018). Flagship Report Reforming to Create Jobs, Economy Profile, Congo Democratic Republic. http://arabic.doingbusiness.org/~/media/WBG/DoingBusiness/Documents/Profiles/Country/ZAR.pdf (Accessed 16
August 2018).9 United Nations Development Programme (2016). Human Development Report 2016: Human Development for Everyone. http://hdr.undp.org/sites/default/files/2016_human_development_report.pdf (Accessed 16 August 2018).10 Food and Agriculture Organisation of the United Nations (2018). The Democratic Republic of the Congo - Response Plan 2017–2018. http://www.fao.org/emergencies/resources/documents/resources-detail/en/c/1046444 (Accessed 16
August 2018).11 US Department of State (2018). Bureau of Economic and Business Affairs, Investment Climate Statements for 2018. https://www.state.gov/e/eb/rls/othr/ics/investmentclimatestatements/index.htm#wrapper (Accessed 19 July 2018).12 Ibid.13 Interviews with customer service representatives of the relevant banks and microfinance institutions.14 US Department of State (2018). 15 FINCA DRC (2017). FINCA Fights Financial Exclusion with Banking Agents in DR Congo. https://www.finca.org/blogs/financial-exclusion-banking-agents-drc/ (Accessed 16 Aug 2018).16 United Nations Development Programme (2018). Human Development Indicators DRC. http://hdr.undp.org/en/countries/profiles/COD (Accessed 16 August 2018).17 Interviews with customer service representatives from Bank of Africa, Banque Commerciale du Congo, FINCA RDC, I-Finance, ProCredit Bank, Rawbank, Trust Merchant Bank.18 KPMG DRC (2018). https://home.kpmg.com/content/dam/kpmg/za/pdf/2017/12/DRC-2017H2.pdf19 Frank, G. K. (2018). Africa property focus: Democratic Republic of Congo. https://www.kfsa.co.za/blog/2015/05/africa-property-focus-democratic-republic-of-congo (Accessed 16 August 2018).20 Expartisan (2018). Cost of living in Kinshasa, Democratic Republic of the Congo. https://www.expatistan.com/cost-of-living/kinshasa?currency=US$ (Accessed 16 August 2018).21 The Africa Report (2018). Housing: Kinshasa is for the rich. www.theafricareport.com/East-Horn-Africa/housing-kinshasa-is-for-the-rich.html (Accessed 16 Aug 2018).22 National Agency for the Promotion of Investments (2018). https://www.investindrc.cd/en/investment-guide/major-projects-awaiting-fundings23 Encyclopaedia Britannica (2018). Democratic Republic of the Congo Settlement Patterns. www.britannica.com/place/Democratic-Republic-of-the-Congo/Settlement-patterns (Accessed 16 Aug 2018). 24 National Agency for the Promotion of Investments (2018). https://www.investindrc.cd/en/investment-guide/major-projects-awaiting-fundings25 UN Habitat (2018). Sustainable Housing Reconstruction in the Eastern Democratic Republic of Congo. https://unhabitat.org/books/sustainable-housing-reconstruction-in-the-eastern-democratic-republic-of-congo/(Accessed 16 August
2018).26 This is Africa. (2016). Risks ahead for DRC’s booming real estate market. http://www.source8.com/wp-content/uploads/2016/01/Risks-ahead-for-DRC%E2%80%99s-booming-real-estate-market-Business-This-is-Africa.pdf (Accessed 16 Aug
2018).27 Africa Property News (2018). Housing supply limited in Democratic Republic of Congo, http://www.africapropertynews.com/central-africa/3076-housing-supply-in-democratic-republic-of-congo.html (Accessed 16 August 2018). 28 Ibid.29 Expartisan (2018). https://www.expatistan.com/cost-of-living/kinshasa?currency=US$30 Ibid.31 Ibid. 32 World Bank Group (2018). http://arabic.doingbusiness.org/~/media/WBG/DoingBusiness/Documents/Profiles/Country/ZAR.pdf33 Ibid.34 Habitat World Map (2018). Democratic Republic of Congo. http://habitat-worldmap.org/en/pais/africa/democratic-republic-of-the-congo/ (Accessed 16 August 2018).35 Congo Invest Consulting (2018). Housing. http://www.congo-invest.com/v2/index.php/housing/ (Accessed 16 August 2018).36 National Agency for the Promotion of Investments (2018). https://www.investindrc.cd/en/investment-guide/major-projects-awaiting-fundings37 Ibid.

Africa Housing Finance Yearbook 2018
117
population). This is mainly explained by the extremely hot weather, which is notconducive for farming. The official languages are French and Arabic.
The government of Djibouti has made affordable housing a major priority issueand called on local and international partners to support social housing. Thecountry’s President has set up a foundation, the Ismail Omar Guelleh (IOG)Foundation, which has attracted huge support from international players largelydrawn from China and Arabia. The completion of the Djibouti Ethiopia Railwayand Djibouti Free Trade Area are among the major projects undertaken by thecountry. The country’s exchange rate has remained stable over time, the GDPhas continued on an impressive growth path, and the inflation rate is among thelowest in the region. There have been some attempts to enhance infrastructuredevelopment; such an example is the Djibouti Free Trade Area, which is consideredthe biggest investment of its kind in Africa and is expected to lead to the entry ofmore expatriates in the country, pushing up the demand for housing in Djibouti.With such developments and the fact that the country enjoys a stable politicalenvironment, housing developers may find Djibouti a great place to invest.
Access to financeAccess to finance in Djibouti is a major challenge for big and micro, small andmedium enterprises. This significantly curtails the ability of individuals andbusinesses to secure funding or become self-employed. The country has no activecapital markets or fixed income markets and, for many years, the three major credit
Overview Djibouti is a small country in the Horn of Africa with a significant proportion ofits population living in extreme poverty (23 percent).1 Most of the populationlive in urban areas (mainly Djibouti City) since less than 0.04 percent of the landis arable. As such, the country relies heavily on imports of food, exposing it toperennial food shortages. According to the World Bank, Djibouti is highly exposedto external shocks such as spikes in food and fuel prices as well as droughts andfloods. With very little arable land and almost no natural resources (save for saltdeposits) the economy is mainly dependent on external financing and foreigndirect investments. The country is strategically positioned along a major sea traderoute, where the Red Sea meets the Gulf Aden, and is Ethiopia’s main import-export port. Due to its strategic position, the country generates more than80 percent of its revenue from renting military bases and providing port services.In effect, the Djibouti economy is mainly driven by transportation and logisticsservices.
Djibouti has a weak manufacturing sector and limited agricultural output due toits harsh weather conditions. Consequently, the country’s economy is driven bytrade and services. According to the World Bank Economic Outlook 2018, lowerinvestments coupled with weak export yields will lead to a decline in Djibouti’sprojected GDP growth from 7 percent in 2017 to 6.5 percent in 2018. In addition,inflation is projected to remain at 3.5 percent, due to rising oil prices as well ashousing and services-driven demand.2
Although the country is starved of natural resources including arable land, it hasrecorded impressive growth rates in the past 16 years evidenced by an increasein average per capita GDP per annum of 3.1 percent over the period 2001-2017.Importantly, the country’s economic growth has been remarkable, recording morethan 6.5 percent on average per year over 2014 to 2017. According to the AfricanDevelopment Bank (AfDB), the country’s economic growth has exceeded fivepercent in recent years, reaching approximately 6.8 percent in 2017 with aprojected growth of 6.9 percent in 2018 and 2019. The growth is accounted forby growing investments in infrastructure such as ports intended to serve land-locked Ethiopia3 and the completion of the electric railway linking Djibouti toEthiopia.
Djibouti has a population of 865 267 with a population growth rate of 2.16percent.4 Most of the population lives in urban areas (78 percent of the total
DjiboutiKEY FIGURES
Main urban centres Djibouti
Exchange rate: 1 US$ = [a] 16 Aug 2018PPP Exchange rate (Local currency/PPP$) 1 Djiboutian franc = Inflation 2016 [b] | Inflation 2017 [b] | Inflation 2018
180 Djiboutian franc98.103.0 | 2.70 | n/a
Population 2017 [b] | Urban population size [b]Population growth rate 2015 [b] | Urbanisation rate [b]Percentage of the total population below National Poverty Line 2015 [b]Unemployment rate [b]
865 267 | 673 1782.16% | 1.67%
23.00%40.00%
GDP (Current US$) 2017 [c] | GDP growth rate annual 2017 [c]GDP per capita (Current US$) 2017 [c]GNI per capita (Current US$) [d]Gini co-efficient HDI global ranking 2015 [e] | HDI country index score 2015 [e]
US$1 845 million | 4.09%US$1 930US$1 90827.60172 | 0.473
Is there a deeds registry?Number of residential properties that have a title deedLending interest rate [b]Mortgage interest rate | Mortgage term (years)DownpaymentMortgage book as a percentage of the GDPEstimated number of mortgagesPrice to Rent Ratio in City Centre [f] | Outside City Centre [f]Gross Rental Yield in City Centre [f] | Outside City Centre [f]Construction as a % of GDP
Yesn/a11.60%7% | 2020%n/an/a3.84 | 3.7926.05% | 26.39%n/a
What is the cost of standard 50kg bag of cement? [g]What is the price of the cheapest, newly built house by a formaldeveloper or contractor? (Local currency) [g]What is the price of the cheapest, newly built house by a formaldeveloper or contractor? (US$) [g]What is the size of this house (m2)? [g]What is the average rental price for this unit (US$)?What is the minimum stand or plot size for residential property? [g]
US$7.00
13 734 000 Djiboutian franc
US$76 300180m2
n/a300m2
Ease of Doing Business Rank [d]Number of procedures to register property [d]Time to register property (days) [d]Cost to register property (as % of property value) [d]
154639 days12.70%
NB: Figures are for 2018 unless stated otherwise.
[a] Coinmill.com[b] Central Intelligence Agency (CIA) World Factbook[c] World Bank World Development Indicators [d] World Bank Doing Business[e] UNDP Human Development Reports[f] Numbeo[g] CAHF Yearbook 2017

118
rating agencies in the world did not provide sovereign credit rating for the country.However, recent intervention by the World Bank will see 6 000 potential womenand youth entrepreneurs funded, as part of the country’s efforts aimed atpromoting entrepreneurship as a driver of growth and employment creation. Thecountry received US$15 million in funding from the International DevelopmentAssociation (IDA), the World Bank’s fund for the poorest countries.5 The creditwill fund the project aimed at equipping new entrepreneurs with a combinationof training and access to finance, the consolidation and expansion of key businessservices enabling ease of access, and the identification of entrepreneurs and marketlinkages. Dr Asad Alam, World Bank Country Director for Egypt, Yemen andDjibouti, argues that the project’s main objective is to harness the transformativepotential of women and young entrepreneurs. In addition, the Director observesthat “…Creating new economic opportunities for them will help boost innovation,promote job creation, and raise living standards for all in Djibouti”.
As affordability of housing in Djibouti is a major problem owing to low disposableincomes, the IDA intervention will hopefully build financial capacity of loanbeneficiaries to acquire decent housing.
Banking in Djibouti is regulated by the Central Bank of Djibouti (Banque Centralede Djibouti), which is in charge of monetary policy. As at December 2017, Djiboutihad a total of 11 banks, comprising eight conventional commercial banks and threeIslamic banks. According to the World Bank, Djibouti has improved access to creditinformation through the adoption of legal provision for the creation of a newcredit information system.6 Nevertheless, the country is ranked 184 out of 190countries on the access to credit in the country. This World Bank ranking highlightsthe challenges housing investors and homeowners face in getting credit. One ofthe biggest challenges to accessing finance has to do with high poverty levels andan unemployment rate which stands at nearly 40 percent.7
AffordabilityDjibouti’s population is predominantly urban (78 percent)8 and, because of highurbanisation rates, neither the private nor the public sectors are able to meet thegrowing housing needs. Most households which aspire to own private propertieshave difficulties finding affordable decent houses. Affordability for both rental andmortgages is an uphill task for the majority of Djibouti’s population in view of highunemployment and poverty rates. The average after-tax salary in Djibouti isapproximately DJF 272 340 (US$1 534) and a one-bedroom house rent in theDjibouti City centre ranges from DJF 130 000 to DJF 200 000 (US$732 toUS$1 126).9 A three-bedroom apartment in the city centre ranges betweenDJF 200 000 and DJF 220 000 (US$1 126 to US$1 239) and US$1 070 in the citysuburbs. These figures suggest that over 50 percent of Djibouti residents’ salariesgo into house rent every month. Importantly, it costs approximately DJF 120 000(US$676) per square metre to buy a house near or in the Djibouti City centre.
In sum, decent housing is outside the reach of most Djibouti residents and mayexplain why the government has called for local and international help to intervenewith social housing. Djibouti suburbs are littered with make-shift houses with nosupply of basic amenities. Perhaps with the upcoming major developments,coupled with current sustained economic growth, employment rates will increaseand also lead to an influx of more expatriates who can afford housing units beingdeveloped.
Housing supplyDjibouti is faced with a huge imbalance between the supply and demand forhousing, with demand exceeding supply. For instance, the country’s housing deficitis estimated at 10 000 homes with new housing needs estimated at 2 500 unitsannually.10 Cherif Quizani observes that “…The pace of building has proved largelyinsufficient to absorb the deficit with just 1 587 homes delivered between 2012and 2017, of which 261 were built by the private sector”. This may be a majorchallenge for the Djibouti government which has a lean budget of US$699.8 millionas per the 2017 estimate.11 The implication of this budgetary constraint is thatthe government’s ability to finance social housing is severely constrained. ThePresident of Djibouti has made housing a national priority. The IOG Foundationcalled on international development partners and the private sector to supportfinancing housing for the most vulnerable, the insolvent and the disabled.12 ThePresident’s appeal for social housing support has received impressive local andinternational support. For instance, China Merchants Group has committed to
build 1 000 two-bedroom housing units as part of corporate social responsibility.13
The project (dubbed Project Nassib), located 10kms from Djibouti City, waslaunched on 4 July 2018 and will entail the construction of two-bedroom housesequipped with all the necessary amenities.
The government intends to intensify the production of affordable housing andplots of land with infrastructure for the middle and low income groups. In 2016,the government launched a programme to build 2 500 apartments with fundsfrom Arab donors (Saudi Fund for Development, Arab Fund for Economic andSocial Development). The Société Immobilière de Djibouti (SID) was alsolaunched in November 2016. This project covers 100 hectares representing morethan 5 000 plots of various sizes. As at July 2018, 450 houses under the projectCite Nassib had been completed and 500 others were under construction. Tohelp public developers and also encourage private real estate developers, thegovernment planned to establish a Housing Bank in December 2016. However,as at the date of this publication, there is no evidence as to whether the bank hasbeen set up or not. Although the National Investment Promotion Agency (NIPA)estimates that annual housing needs in the capital city are 5 000 units, this demandis yet to be met by current home developers.
Property marketsThe Republic of Djibouti, in contrast to other African countries, has a considerableadvantage in terms of property development. Indeed, by law, any vacant landwithout an owner belongs to the state. All (or almost) non-urbanised areas belongto the state. Public Land Management is operated by the Department of Landand Property Titles Conservation of the Ministry of Budget.
The potential of the land market is huge, and the government plans to acceleratethe land regularisation process for the benefit of the people who still hold thetemporary occupation licence. Once the regularisation procedure is complete,the owner will get a land registration certificate (CIF) to enable them to developthe land or housing within a legal framework while following the rules of urbanplanning. In addition, the CIF legally opens the door to obtaining mortgage creditfrom local banks. According to the World Bank Doing Business 2018, Djibouti isranked 168 out of 189 countries in the field of registering property. Indeed, theprocess of obtaining the final title is costly and sometimes too long for individuals.
There are three different ways to proceed with land registration: for temporaryoccupation certificate holders , the regularisation of land is done through theHousing Fund with the payment of an advance of DJF 20 000 (US$113), fourpercent of the sale value for name change, 10 percent of the sale value for theregistration and DJF 16 000 (US$90) for stamp duty. Individuals buying landdirectly from the Department of Land and Property Titles Conservation of theMinistry of Budget pay four percent of the sales value for the name change,10 percent for the registration and DJF 16 000 (US$90) for stamp duty. Finally,the regularisation of land obtained through the sale from one person to anotherindividual is done through a notary by paying the same ratios (four percent and10 percent plus DJF 16 000 stamps) and by adding notarial fees ranging fromDJF 100 000 to DJF 250 000 (US$565-US$1 413). In addition, if the purchaser isbuying his first piece of land, he must pay transfer duty which corresponds to ninepercent of the sale value (seven percent tax and two percent change of name). Ifthe purchaser is not a first-time buyer, the rate increased from nine percent to12 percent (10 percent tax and two percent change of name). Any investor orprivate developer can obtain an allocation of land once its real estate project isapproved by the Minister Delegate for Housing.
Policy and regulationIn 2011, within the Ministry of Housing, Urban Development and Environment, aState Secretary for Housing was set up to promote the housing sector and findlasting solutions for the deficit in housing. Given its importance within theinstitutional platform, the department was renamed in 2016 as the DelegateMinistry for Housing.
From 2011, the department has developed and implemented a necessaryregulatory and policy framework to develop this sector. In addition to severalstrategic studies undertaken to promote the housing sector, the Delegate Ministryfor Housing has implemented a series of legislative and regulatory texts toencourage potential investors and private developers to invest in the real estate

Africa Housing Finance Yearbook 2018
119
sector. The public operators have seen a redefinition of their roles to adapt theirstatus (real estate development, land management, financial institution), to improvetheir response and management capacity, and to refocus their activities on clearand well-defined missions.
A National Housing Strategy is yet to be finalised with the assistance of the WorldBank, which will entail a major investment programme to develop the real estatesector in Djibouti through the implementation of four key areas: 1) increasing thesupply of affordable plots of land for the majority of households; 2) developingthe production of affordable housing units; 3) stimulating the housing rehabilitationprogramme in precarious existing neighbourhoods; and 4) developing furtherbanking mechanisms and microfinance systems for low income groups. Theinvestment amount required for the realisation of the housing sector’sdevelopment strategy is estimated at more than DJF 52 billion (US$294 million).
In 2015, the government launched a new project targeting low income peoplecalled the Self Construction Program. This project entailed providing lower incomehouseholds with a plot of land of 90m2 and raw materials to build their homes.The assistance was to be brought by the Housing Funds Operator and repaymentwas not supposed to exceed DJF 5 000 (US$28) over 20 to 25 years. However,this initiative is yet to bear fruit.
Djibouti has undertaken both policy and regulatory reforms that have beencommended by the World Bank. For instance, according to the World Bank Easeof Doing Business (2018), the National Laboratory of Djibouti has significantlyreduced the cost of concrete inspections and recorded five reforms, the highestnumber among all fragile states. In addition, the report documents that thecountry “… reduced the fees associated with starting a business and constructioninspections, implemented decennial liability for all professionals involved inconstruction projects, increased the transparency of its land administration systemand established a new credit information system.” As a result of these majorreforms, the World Bank has listed Djibouti among the economies that showedthe most notable improvement in Doing Business in 2018.
Djibouti has made major improvements to protect minority investors in 2016/17by passing a new law, No. 191/AN/17/7, which modifies the Code of Commerceand takes huge steps in mitigating the risk of prejudicial conflicts of interest incompanies. Company directors are now required to give a detailed explanationto the board of directors of any conflict of interest they may have on a proposedtransaction. If they decide to proceed with the transaction, the terms of thetransaction and the extent of the conflict of interest must be included in the annualreport. This may have major implications for companies investing in the housingsector of Djibouti. However, such disclosures are helpful, especially for foreignersdealing with locals with investments in property.
Opportunities Djibouti presents a great opportunity for developers of low cost housing, especiallyforeign investors who have sufficient capital to develop such houses. Consideringthat average rental and mortgage monthly repayment rates take up more than50 percent of average salaries, new and existing developers will need to providebetter terms. Perhaps such developers may consider partnering with the fewcommercial and Islamic banks such as Salaam Bank to finance mortgages underIslamic banking terms.
There is growing demand for decent, relatively low cost housing by the sizeablenumber of people in the expatriate community. This is further supported by thefact that rent constitutes the single largest household expenditure per month inthe country, as discussed under the property markets section. In addition to thehousing demand by the expatriate community, NIPA has noted the rising localdemand for housing as more than 500 000 people live in Djibouti City and itssuburbs. NIPA estimates that annual housing needs in the capital city are 5 000units.
Importantly, the country’s economic growth has remained one of the highest inthe region (above 6.5 percent for over five years) with very low inflation rates.The country has a stable political climate and enhanced security. The governmenthas significantly reduced the cost of concrete inspections and the cost of startinga new housing business. With a stable currency pegged to the US dollar and norestrictions on repatriation of profits from the country, housing investors arepresented with sizable opportunities in Djibouti.
Source https://www.cgidd.com/
PPP$40 001 – PPP$10 000 000
PPP$23 001 – PPP$40 000
PPP$12 001 – PPP$23 000
PPP$8 001 – PPP$12 000
PPP$5 001 – PPP$8 000
PPP$3 601 – PPP$5 000
PPP$2 401 – PPP$3 600
PPP$1 601 – PPP$2 400
PPP$801 – PPP$1 600
<PPP$800
- - - Average annual household income needed for the cheapest newly built house by a formal developer, 2017 Average annual household income using expenditure, 2017 (PPP$)
DJIBOUTI
Annual income profile for rural and urban households based on consumption (PPP$)
No. of households (thousands)
PPP$19 290
PPP$39 075
Rural Urban40 30 20 10 0 10 20 30 40
Population: 865 267
Urbanisation rate: 1.67%
Cost of cheapestnewly built house:
13 734 000 DJFPPP$140 000
Urban householdsthat could afford thishouse with finance:
11.91%
1 PPP$:98.1 Djiboutian
franc

120
Additional sourcesAfDB (2018). Djibouti Economic Outlook.https://www.afdb.org/en/countries/east-africa/djibouti/ (Accessed 18 August2018).
Banque Centrale de Djibouti (2017). Rapport Annuel 2017.https://s3.amazonaws.com/banque-centrale.dj/uploads/document/attachment/189/BCD_Rapport_Annuel_2017_version_finale.pdf?AWSAccessKeyId=AKIAJIZPY62P3HTP7XVQ&Signature=iBP0hMLN5eSiBuUHanGobaMWuvs%3D&Expires=1536933878 (Accessed 14 Sept 2018).
Central Intelligence Agency (2018). World Fact Book: Djibouti.https://www.cia.gov/library/publications/the-world-factbook/geos/dj.html(Accessed 18 August 2018).
International Monetary Fund (2016). Djibouti: 2016 Article IV Consultation-Press Release; Staff Report; and Statement by the Executive Director forDjibouti. 6 April 2016. https://www.imf.org/en/Publications/CR/Issues/2017/04/06/Djibouti-2016-Article-IV-Consultation-Press-Release-Staff-Report-and-Statement-by-the-44807 (Accessed 14 Sept 2018).
Mutethya, E (2018). China Daily.http://www.chinadaily.com.cn/a/201807/06/WS5b3e824ea3103349141e103e.html (Accessed 18 August 2018).
Numbeo (2018). Property prices in Djibouti.https://www.numbeo.com/property-investment/country_result.jsp?country=Djibouti (Accessed 20 August 2018).
Oxford Business Group (2016). The Report: Djibouti 2016.https://oxfordbusinessgroup.com/djibouti-2016-0 (Accessed 14 Sept 2018).
Quazani C. (2018). Housing a National Priority. Afrique Magazine.http://afriquemagazine.com/en/housing-national-priority (Accessed 18 August2018).
World Bank (2018). The World Bank in Djibouti.https://www.worldbank.org/en/country/djibouti/overview (Accessed 31 July2018).
World Bank (2018). Doing Business 2018.http://russian.doingbusiness.org/~/media/WBG/DoingBusiness/Documents/Annual-Reports/English/DB2018-Full-Report.pdf (Accessed 20 August 2018).
World Bank (2018). Djibouti’s Economic Outlook April 2018.https://www.worldbank.org/en/country/djibouti/publication/economic-outlook-april-2018 (Accessed 18 August 2018).
Worldometers (2018). Worldometers population statistics.http://www.worldometers.info/world-population/djibouti-population/ (Accessed28 July 2018).
Websites www.banque-centrale.djwww.ministere-finances.djwww.ccd.djwww.dised.djwww.djiboutiinvest.comwww.banquemondiale.org
1 World Bank (2018). The World Bank in Djibouti. 2 World Bank (2018). Djibouti’s Economic Outlook April 2018.3 AfDB (2018). 4 Central Intelligence Agency (CIA) (2018). World Factbook: Djibouti.5 World Bank (2018). Press Release: Support for Entrepreneurs in Djibouti to Benefit 6,000 Women and Youth. 8 June 2018. https://www.worldbank.org/en/news/press-release/2018/06/08/support-for-entrepreneurs-in-djibouti-to-benefit-
6000-women-and-youth (Accessed 14 Sept 2018). 6 World Bank (2018). Doing Business 2018. 7 Central Intelligence Agency (CIA) (2018). World Factbook: Djibouti.8 Ibid.9 Numbeo (2018). Property prices in Djibouti.10 Quazani C. (2018). Housing a National Priority. Afrique Magazine. Available http://afriquemagazine.com/en/housing-national-priority.11 Central Intelligence Agency (CIA) (2018). World Factbook: Djibouti.12 Quazani C. (2018). 13 Mutethya, E (2018). China Daily.
Africa Housing Finance Yearbook 2018
121
The confidence of international institutions in the Egyptian economy is increasing,as shown in May 2018 by the improvement of Egypt’s S&P sovereign credit ratingto B from B-, citing stronger economic growth and increasing external foreignexchange reserves.4
Access to financeIn 2017/18, the Global Competitiveness report ranked Egypt 77 of 137 in financialmarket development compared to 111 of 138 in the 2016/17 report. On easeof access to loans, Egypt ranked 66 of 137 compared to 136 of 138 countries lastyear.
According to the Mortgage Finance Fund quarterly report, the total financialsupport offered by the Fund for low and medium income citizens was EGP298million (US$16.7 million) in the third quarter of fiscal year 2017/18. In addition,the number of beneficiaries in that period reached 19 987 (of which 79 percentare men, and 21 percent women), accessing finance from 16 banks and sixmortgage finance companies. Ninety-nine percent of the subsidized units were75 – 99m2 in size.
OverviewEgypt is a populous nation, with a current population of 97.06 million and apopulation growth rate of approximately two percent a year.1
Its capital, Cairo, is one of the continent’s megacities, with a population of9.7 million. In 2017 Greater Cairo was named as one of the fastest-growing citiesin the world. Egypt’s population growth has been a contributing factor to housingproblems. The country’s housing shortage, which reached 3.5 million2 units by2018, could worsen if it does not meet the growing demand for housing andprovide more basic housing facilities. Recognising this, in mid-2015 during theEgypt Economic Development Conference held in Sharm el-Sheikh, thegovernment highlighted housing and urbanization as central to its agenda.
Due to increasing inflation after the devaluation of the Egyptian pound inNovember 2016, the property sector has prospered and became the best choicefor people looking to protect the value of their savings in this environment. Thishas been reflected in increased interest and demand by Egyptians in the newcompounds that are still under development in Cairo and Giza, such as Sun CapitalCity and City Gate. As a result, investors have shown interest in real estate, leadingto a great flow of money into the estate sector.
As an economic reform program is being implemented according to theInternational Monetary Fund, the Egyptian economy is expected to improve.According to the World Bank, real GDP is forecast to grow by 5 percent in fiscalyear 2018, and to increase gradually to 5.8 percent by fiscal year 2020. GDP isshowing continuous and sustainable growth, registering 5.2 and 5.3 percent duringthe first and second quarter of the fiscal year 2017/18. This is up from 3.4 and 3.8percent respectively over the same period in 2017.3
According to the Central Bank of Egypt (CBE) inflation report, the annual coreinflation rate declined to 10.9 percent in June 2018 from 11.09 percent in May2018. In addition, the annual consumer price inflation rate decreased to13.8 percent in June 2018, from 30.9 percent in June 2017. On 28 June 2018, theCBE left the overnight deposit rate at 16.75 percent, the overnight lending rate at17.75 percent and the main operation rate at 17.25 percent.
EgyptKEY FIGURES
Main urban centresCairoAlexandria
Exchange rate: 1 US$ = [a] 10 August 2018PPP Exchange rate (Local currency/PPP$) 1 Egyptian pound = [b]Inflation 2016 [c] | Inflation 2017 [c] | Inflation 2018 [d]
17.80 Egyptian pound3.110.20 | 23.30 | 22.10
Population [b] | Urban population size [b] Population growth rate 2016 [b] | Urbanisation rate 2015 [b]Percentage of the total population below National Poverty LineUnemployment rate
97 200 000 | 41 212 8002.00% | 4.31%28.0%12%
GDP (Current US$) [c] | GDP growth rate annual [c]GDP per capita (Current US$) [c]GNI per capita (Current US$) 2016 [b]Gini co-efficient 2015 [b]HDI global ranking 2016 [e] | HDI country index score 2016 [e]
US$234 325 million | 4.2%US$2 544US$3 41031.8111 | 0.691
Is there a deeds registry? Number of residential properties that have a title deed Lending interest rate Mortgage interest rate | Mortgage term (years)DownpaymentMortgage book as a percentage of the GDPEstimated number of mortgages Price to Rent Ratio in City Centre | Outside City Centre Gross Rental Yield in City Centre | Outside City Centre Construction as a % of GDP
Yesn/a16.75%6% | 2010%n/an/a25 | 1012% | 19%n/a
What is the cost of standard 50kg bag of cement? What is the price of the cheapest, newly built house by a formaldeveloper or contractor? (Local currency)What is the price of the cheapest, newly built house by a formaldeveloper or contractor? (US$) What is the size of this house (m2)? What is the average rental price for this unit (US$)? What is the minimum stand or plot size for residential property?
n/a
220 000 Egyptian pound
US$12 35990m2
n/a55m2
Ease of Doing Business Rank [f]Number of procedures to register property [f]Time to register property (days) [f]Cost to register property (as % of property value) [f]
128875 days1.10%
NB: Figures are for 2018 unless stated otherwise.
[a] Central Bank of Egypt (CBE)[b] World Bank World Development Indicators[c] Egyptian Ministry of Finance[d] African Development Bank - African Economic Outlook[e] UNDP Development Indicators[f] World Bank Doing Business

122
The average monthly income of the beneficiaries, 77 percent of whom are aged20-40, was EGP1 953 (US$110). The price of subsidized units in the latest launchof the Mortgage Finance Fund is EGP184 000 (US$10 337) up from EGP154 000(US$8 651). The price issued in April of last year, which is still less than the costof units, was estimated at EGP200 000 (US$11 236). Buyers can reserve the unitsby providing a down payment of EGP11 000 (US$ 618), which is refundable incase of not winning one of the project’s houses, and monthly instalments are atleast EGP590 (US$33).
Fifteen mortgage companies operate in the Egyptian market (Sakan, EHFC, EMRC,Amlak, Al-Tayasor, Tamweel, Tamweel Emirates, Naeem, Al-Ahly, Arab AfricanInternational, Al-Ahly United, El-Masreyin, Eltaameer, Contact for Housing Finance,and Naser Social Bank) in addition to 16 banks out of 39 and 197 real estateappraisers. Banks offer housing loan amounts starting from EGP120 000(US$ 6 741) up to EGP5 million (US$ 28 089). The interest rate is 7 percent forhousing units of EGP 150 000, 8 percent for units worth EGP950 000, and10.5 percent for units that exceed the value of one million Egyptian pounds. Themaximum amount of any loan depends on the net income of the borrower, andthe monthly installment should not exceed 40 percent of monthly net income.5
During 2017, the value of new mortgage finance granted by mortgage companieswas EGP1.38 billion (US$77.5 million) an increase of 46 percent compared toEGP950 million (US$53 million) during 2016. The value of microfinance activityreached EGP7.12 billion (US$400 million) by the end of 2017, 59 percent morethan the EGP 4.49 billion (US$ 252 million) recorded in 2016. In addition,microfinance activity expanded the number of beneficiaries to 2.26 million citizenscompared to 1.8 million in 2016.
The percentage of beneficiaries whose income is more than 3 500 pounds permonth is estimated at 99.4 percent of the total value of financing granted fromthe beginning of the year until October 2017, compared to 98 percent in thesame period the previous year.6
The construction sector accounts for more than 4 percent of Egypt’s grossdomestic product and employs approximately 12 percent of Egyptian workers.The industry is also one of the country’s fastest growing sectors, having grown by10 percent in 2017. In May 2018, the International Finance Corporation (IFC),announced a US$15 million (EGP265.35 million) loan mainly in Egyptian poundsto the Vinavil Egypt for Chemicals Company. The IFC Director for the Middle Eastand North Africa Mouayed Makhlouf clarified that providing the loan in Egyptianpounds ensures the currency is more accessible to local companies, which canhelp boost crucial industries like manufacturing and construction.7
Real estate activity tops the list of financial leasing contracts recordingEGP15.5 billion (US$870 million) or 71 percent of the total financial leasing activity;truck leasing and financing comes second, with a value of EGP1.44 billion(US$81 million) with 6.6 percent of the total; and in third place, contracts of heavyequipment, recording EGP1.43 billion or 6.5 percent of total activity. Manufacturingcontracts recorded EGP1.3 billion (US$73 million) or 6 percent of total activity.8
AffordabilityThe World Bank classifies Egypt as a low middle income nation, with a per capitaGDP of less than EGP12 000 (US$ 674). According to the World Bank’scalculations, the gross national income per capita was EGP1 960 (US$110) permonth in 2013. Housing affordability is limited despite government policy efforts.Just over one-fifth of Egyptians have incomes lower than US$2 per person perday, with northern Egypt being the most impoverished.
The average wage for Egyptians was about EGP2 500 (US$140) a month in 2017,according to the Central Agency for Public Mobilization and Statistics, putting mostnew housing well out of the reach of the bulk of the population. The cheapestflat in Cairo (out of the city) would cost on average EGP120 000 (US$6 741) .
Despite many developing companies supplying various projects to the market, thedemand for housing remains unmet. Although 2017 has witnessed a positive boostin market trends, Egypt’s population of over 90 million requires an additional175 000 to 200 000 housing units a year to cater for the housing shortage of3.5 million units. There are 5.6 million vacant units nationwide, but these propertiesare beyond the purchasing power of low and middle income groups.9
In 2014, President Abdel Fatah al-Sisi announced a plan to build one millionaffordable units for low income youth across 13 cities in collaboration with UAE-based company Arabtec. A part of the project is expected to be finalized by theend of this year, and the entire project is set to be delivered by 2022. This is inaddition to the 62 000 homes being developed for the same segment as part ofthe initiative of the CBE to provide affordable housing.
While there is strong demand in many segments of the real estate market, mostof this demand is concentrated among a small group of people who buyproperties as an investment. Most Egyptians cannot afford to pay EGP800 000(US$44 943) to EGP1 200 000 (US$ 67 415) for an apartment in New Cairo. Ithas been estimated that 80 – 90 percent of new apartments in areas to the eastand west of Cairo are sitting empty.10
Despite the affordability problem for the majority of local Egyptians whoconsidered rent as an alternative solution, properties in 2017 have recorded ahigher rate in sale and rent during the first quarter of 2017 by 179.17 percentcompared to 2016, and have remained steadily strong throughout the first partof the year.
The overall demand for leased apartments in Egypt increased in 2017 by 78.59percent compared to 2016, while the supply offered for rent has decreased by19.57 percent. Demand for villas for rent has increased by 124.78 percent, whilesupply of villas offered for rent has also seen a 52.43 percent decrease. Thedemand for apartments available for sale increased in 2017 by 84.07 percent, whilesupply decreased by 30.3 percent, emphasizing that investors are willing to pumpmoney in the real estate sector in 2018.11
Housing supplyEgypt’s population has tripled in the last half century, and most citizens continueto live on just five percent of the country’s land in the Nile Valley.
The Egyptian real estate market has grown by 133 percent during the first quarterof 2018 due to the number of new projects launched in late 2017, particularlythe New Administrative Capital and Future City projects, according to a reportby the online real estate platform Property Finder. Even though there are overfive million vacant units across the country, the prices of those units are beyondthe purchasing power of low and middle-income classes.
Considering population growth, Greater Cairo is expected to be undersuppliedby approximately 400 000 units by 2020. The majority of the undersupply isexpected to fall within the middle-income market.
Egypt’s mega project, the Administrative Capital, is set to lead the future ofaccommodation in Egypt. The new capital includes an exhibition city, conventioncenter, medical city, government residential district, international airport, relocatedstate institutions and an embassy district.
Another promising project under construction is the Golden Triangle EconomicZone that will boost Upper Egypt. Around 65 percent of the project consists ofmodern industrial hubs, while the remaining area is dedicated to touristic,commercial and residential units.
The Ministry of Housing has estimated that Egypt needs to build 500 000 newhomes every year for five years to keep pace with the expanding population. In2014, the country signed a US$40 billion agreement with the U.A.E.’s Arabtec todevelop 1 million housing units. The project floundered in mid-2015. As a result,the government has committed to delivering about 300 000 housing units by theend of 2016. Cairo also plans to deliver about 750 000 housing units by the endof 2018, in addition to 135 000 units for those currently living in informal housing.
The Ministry of Housing estimates that 40 percent of the population of Cairo livesin informal settlements, while the Informal Settlements Development Fund (ISDF),now part of the new Ministry for Urban Development, estimates that 75 percentof urban areas throughout Egypt are unplanned and 1 percent are unsafe.12
Earlier this year, the Arab Union for New Urban Communities submitted a requestto the housing ministry to build 30 000 residential units in the New Capital City.The project is estimated to cost US$ 3.8 billion and will be financed by privateinvestment, according to reports in a number of Cairo-based newspapers.13

Africa Housing Finance Yearbook 2018
123
In early 2018 a new development company, City Edge Real Estate Development,was formed to build residential and multi-use structures. The venture is capitalisedat EGP1.6bn (US$90 million) and is 60 percent owned by the New UrbanCommunities Authority, 38 percent owned by the Housing and DevelopmentBank, and 2 percent owned by the Holding Company for Development andInvestment. Two projects are already in planning: a EGP2 billion ($132 million),493-unit residential compound at Etapa and a EGP3.5bn (US$196.6 million)mixed-use development in 6th of October City. City Edge focuses on premiumofferings and the use of new technologies and designs.14
Property marketEgypt’s property tax law was amended in 2014. President Abdel Fattah Al-Sisiissued Presidential Decree 117/2014, amending the 196/2008 Property Tax Lawto modify the tax-exempt tranche so that it includes those owning a singleresidential unit valued at up to EGP2 million (US$112 359). Hotels, clubs, hospitals,medical centres and clinics affiliated to the armed forces are exempted from payingtaxes. Residential properties with annual rental values less than EGP24 000 andcommercial units with annual rental values less than EGP1 200 are also exempt.
Egypt’s property market is generally unregulated. Consequently, most Egyptianscannot afford proper housing to adequately accommodate the number of familymembers. The high inflation rate has led to the growth of informal settlements,with poor infrastructure and quality of living.
However, as Egypt Today notes, the high inflation rate has also made propertyinvestment a preferable alternative to depositing savings into a bank: “With a largenumber of developments introduced to the marketplace, the real estate managedto attract investment over other uncertain options; leading to a great flow ofmoney into the real estate sector for investment rather than housing purposes.”15
Private investor enthusiasm has led to a glut of empty properties in a countrywith a housing shortage. According to a Reuters article published in early 2018,Egypt has millions of units under construction or vacant, with the Central Agencyfor Public Mobilisation and Statistics estimating this at 12.8 million. The vacancyrate is approximately 27.5 percent, with some places above 90 percent. Discountsare already offered in the secondary market, along with easy payment terms.
Real estate reforms are crucial to attract investors. Egypt is ranked 119th out of190 countries in registering property, according to the World Bank’s latest DoingBusiness report (2018). It takes 75 days and eight procedures to register aproperty in the country, compared to less than 30.5 days and 5.7 procedures inother Middle East and North Africa (MENA) countries though it costs 1.1 percentof the property value compared to six percent in MENA.
Policy and regulationThree important laws are likely to affect real estate, one of which is the law ontenders. Tender legislation was reportedly plagued by problems such as lengthyprocedures, lack of clarity and potential corruption.16
Parliament has agreed in principle on a draft law of "reconciliation on buildingviolations". The law proposes "legal and practical solutions to the problem ofbuilding violations," including violations that have caused the collapse of buildings.17
The background to the law is the problem of violations of building codes, illegalextensions and constructions. This was highlighted by collapsing buildings, includingone that occurred because of construction violations at three residential buildingsin the central Cairo. In 2017, several buildings collapsed, killing 15 people andinjured 55 others.18
In April 2018, President Abdel Fattah Al-Sisi ratified an amendment to the law onreal estate expropriation for public benefit. The gazetted amendment sets outthat how government compensation to the original owner will be calculated, whichis according to market prices at the time of the decision plus 20 percent.19
A new mortgage law was issued in early 2016. The law lowers mortgage interestrates to five percent for people earning up to EGP1 400 (US$78) a month.Additionally, individuals earning EGP15 000 (US$842.7) a month or families earningEGP20 000 (US$1 123) a month become eligible under the scheme for mortgageswith a 10 percent annual interest rate for 20 years.
In addition, on 24 February 2017, the CBE amended the Mortgage FinanceInitiative for Low and Middle Individuals, originally issued on 19 February 2014.The CBE adjusted the maximum for the low income segment to EGP2 100(US$118) with a five percent interest rate instead of EGP1 400 (US$78.65). Thebank also raised the maximum monthly income limit for the middle-incomesegment to EGP10 000 (US$562) per single person from EGP 8000 (US$ 449)previously, and to EGP14 000 (US$786.5) from EGP 10,000 (US$ 561.8) for afamily. Furthermore, the CBE raised the maximum unit price for the middle-income segment to EGP700 000 (US$ 39,325) instead of 500 000 (US$ 28,089).
Egypt’s housing policy framework has been assertive in addressing the challengesof supply and affordability, but its efforts have been criticised as insignificant. Recentpolitical and social instability has further undermined these efforts and highlightedthe need for a new approach. A shift from supply-side housing subsidies tomechanisms stimulating private sector involvement in the mortgage marketpromise to promote the rapid growth of Egypt’s housing sector and stimulatebroader economic growth in turn.
123
PPP$40 001 – PPP$10 000 000
PPP$23 001 – PPP$40 000
PPP$12 001 – PPP$23 000
PPP$8 001 – PPP$12 000
PPP$5 001 – PPP$8 000
PPP$3 601 – PPP$5 000
PPP$2 401 – PPP$3 600
PPP$1 601 – PPP$2 400
PPP$801 – PPP$1 600
<PPP$800
- - - Average annual household income needed for the cheapest newly built house by a formal developer, 2017 Average annual household income using expenditure, 2017 (PPP$)
EGYPT, ARAB REP.
Annual income profile for rural and urban households based on consumption (PPP$)
No. of households (thousands)
PPP$34 601
PPP$21 964
Rural Urban6 000 4 000 2 000 0 2 000 4 000 6 000
Population: 97 200 000
Urbanisation rate: 4.31%
Cost of cheapestnewly built house:
220 000 EGPPPP$70 968
Urban householdsthat could afford thishouse with finance:
89.09%
1 PPP$:3.1 Egyptian
pound
Source https://www.cgidd.com/

124
OpportunitiesReal estate has continued to prosper over the past year, despite the challengesthe economy and the sector have faced following the currency devaluation inNovember 2016 and the shortage in foreign currency. Egypt has managed toattract foreign investment, leading to a greater flow of money in the sector becauseof the large number of development projects introduced by the government tothe market place such as the new Administrative Capital project and Sun CapitalCity.
The inflow will be positive for the real estate sector and will create an attractiveinvestment climate that brings stability to the market. Demand for housing willvary as there may be increased demand by those seeking investments that offsetdemand by those seeking housing. Real estate developers will also have to playtheir part in finding creative offerings and incentives that will attract customers.
The devaluation of the Egyptian pound has divided the market now into two maindynamics; increased supply at one end of the spectrum, with prices that excludeall but those with high incomes. On the other hand, demand is still unmet forthose with lower incomes. The danger is that a demand bubble is being formedas a result of lack of supply, especially for the low and middle income segments.This means that a shift in supply trends is crucial for the health of the real estatesector in Egypt.
SourcesEverhart, S., Heybey, B. and Carleton, P. (2006). Egypt: Overview of the HousingSector. Housing Finance International.
Jones Lang LaSalle’s quarterly report, April 2014.
USAID (2009). The Legal and Regulatory Environment for Microfinance inEgypt.
Waly, G. (2009). Microfinance in Egypt: An Overview.
World Bank (2016). Doing Business 2016: Egypt Country Profile.
Websiteshttps://www.mff.gov.eg/http://www.fra.gov.eg/www.campas.gov.egwww.efsa.gov.eg www.emrc-online.comwww.hofinet.org www.lafarge.com.egwww.newcities.gov.egwww.cbe.gog.egwww.mof.gov.eghttps://www.cityscapeegypt.comwww.dailynewsegypt.comhttp://www.egyptindependent.com/http://www.doingbusiness.org/data/exploreeconomies/egypt#registering-propertyhttps://egypt.aqarmap.com/en/neighborhood/cairo/http://www.sis.gov.eg
1 The Central Agency for Public Mobilization and Statistics (CAPMAS).2 F. Khaled. “A Good year for real estate.” 1 Jan 2018. Egypt Today. http://www.egypttoday.com/Article/3/39037/A-Good-Year-for-Real-Estate (Accessed 20 June 2018).3 The Egyptian Ministry of Finance. Monthly Bulletin February 2018. http://www.mof.gov.eg/ (Accessed 20 June 2018).4 Govind, H and El-Tablawy, T. “Egypt's Sovereign Rating Raised by S&P on Economic Revival.” 11 May 2018. Bloomberg News. 5 http://www.youm7.com6 http://www.fra.gov.eg/7 Egypt Today. “IFC provides Egyptian currency loan to support construction sector.” 9 May 2018. http://www.egypttoday.com/Article/3/49655/IFC-provides-Egyptian-currency-loan-to-support-construction-sector (Accessed 16 July 2018).8 http://www.fra.gov.eg/9 F. Khaled. “A Good year for real estate.” 1 Jan 2018. Egypt Today.10 Oxford Business Group. “Challenges and opportunities for Egypt's real estate sector.” https://oxfordbusinessgroup.com/overview/interesting-times-two-tiered-sector-resulting-diverse-challenges-and-opportunities (Accessed 19 June 2018). 11 www.propertyfinder.eg12 Egypt Today. “In pics: Slum upgrading projects to be inaugurated in June.” 24 April 2018. https://www.egypttoday.com/Article/1/48539/In-pics-Slum-upgrading-projects-to-be-inaugurated-in-June (Accessed 18 July 2018).13 Khaled, Alaa Eldeen. “Resolving Egypt’s Housing Crisis Crucial to Long-Term Stability.” 7 February 2018. https://www.linkedin.com/pulse/resolving-egypts-housing-crisis-crucial-long-term-stability-khaled/ (Accessed 1 Sept 2018).14 Oxford Business Group. “Egyptian government works to address the housing deficit.” https://oxfordbusinessgroup.com/analysis/place-call-home-government-bodies-are-working-mitigate-housing-deficit, (Accessed 22 June 2018).15 Egypt Today Newspaper. “Game-changing Insights into the Real Estate Market.” 23 April 2018. https://www.egypttoday.com/Article/3/48476/Game-changing-Insights-into-the-Real-Estate-Market (Accessed 20 June 2018).16 Al-Aees,Shaimaa. “3 real estate laws to be issued during current legislative session“. 15 Jan 2018. Daily News Egypt. https://dailynewsegypt.com/2018/.../3-real-estate-laws-issued-current-legislative-sessio (Accessed 22 June 2018).17 Gamil,Marina. “Parliament considers draft law on reconciliation in building violations.” 19 Feb 2018. Egypt Today. https://www.egypttoday.com/Article/2/43222/Parliament-considers-draft-law-on-reconciliation-in -building-violations
(Accessed 15 June 2018).18 Ibid.19 Daily News Egypt. “Al-Sisi ratifies amendment to law on real estate expropriation.” 23 April 2018. https://dailyfeed.dailynewsegypt.com/2018/04/23/al-sisi-ratifies-amendment-law-real-estate-expropriation/
Africa Housing Finance Yearbook 2018
125
The total value of Equatorial Guinea’s GDP continued on a steady decline fromits peak in 2012, where it was valued at US$22.39 billion (CFA 12.5 trillion).10 Itscurrent GDP has reportedly almost halved to US$12.49 billion (CFA 6.9 trillion),representing 0.02 percent of the world economy.11 Its year-on-year growth ratewas reported at -2.5 percent in December 2017. In addition, the economyremains in severe recession, with a GDP decline of eight percent in 2017 and acumulative decline of over 25 percent since 2014.
In an effort to increase investment into the country, the Ministry of Finance,Economy and Planning hosted a joint initiative with the Subregional Office forCentral Africa of the UN Economic Commission for Africa in July 2018. On theagenda was the need to better cushion the country against external shocks causedby over-dependence on the export of raw materials, specifically crude oil.12 Thisattempt at diversification and increase of investment also supports the preliminaryagreement signed between Equatorial Guinea and Ghana to sell Liquefied NaturalGas, an effort which will diversify exports as oil production wanes. Authoritiesare also relying on the stabilisation of public finances and economic diversificationto bring about new sources of economic growth.13
OverviewEquatorial Guinea is one of the smallest countries on the African continent, witha population of approximately 1.27 million people and a land area of 28 015km2.The country has a unique geographical arrangement in that the capital city, Malabo,is located on the island of Bioko, which is situated off the coast of Cameroon. TheEquatoguinean mainland (known as Rio Muni) lies further south on the Africancontinent, along the Atlantic Ocean; the country also includes the smaller islandsof Corisco and Annobon.1
Equatorial Guinea gained independence from Spanish rule in 1968 and is the onlySpanish-speaking country in Africa. President Obiang Nguema is Africa’s longestserving leader on the continent and has been in power since 1979 (after deposingthe former president) and was reelected again in 2016 for a seven-year term. In2017, Equatorial Guinea scored 1.81 out of 10 based on 60 indicators on theEconomist Intelligence Unit’s Democracy Index, ranking the country at number161 out of 167 countries, putting it among the most authoritarian governmentsin the world.2
Currently, 40.3 percent3 of Equatorial Guinea’s population is reported as living inurban settlements, with the urbanisation rate estimated at 4.28 percent annually(2015 – 2020).4
In 2017, the country recorded a government budget deficit equal to 2.30 percentof the country’s GDP. Further, it recorded government debt equivalent to53.80 percent of its GDP in 2017, a sharp increase from 0.5 percent in 2008.5
Economic growth has been primarily driven by the hydrocarbon sector since1990,6 resulting in Equatorial Guinea being one of fastest growing economies onthe African continent, and consequently becoming Sub-Saharan Africa’s thirdlargest oil exporter, following Nigeria and Angola.7 Oil accounted for 85 percentof the GDP and 94 percent of exports as at 2015,8 contributing greatly to vaststructural developments over the past 15 years. However, the fall in both globaloil prices and the country’s output has resulted in a decline in the country’s crudeoil production, from 186 BBL/D/1K (186 000 barrels a day) in March 2017 to176 BBL/D/1K in March 2018.9 This has resulted in the decline of budgetarysurpluses that financed investment programmes across the country.
Equatorial Guinea
PAZ
KEY FIGURES
Main urban centresMalaboPointe-Noire
Exchange rate: 1 US$ = [a] 13 Aug 2018PPP Exchange rate (Local currency/PPP$) 1 CFA = [b]Inflation 2016 [c] | Inflation 2017 [c] | Inflation 2018 [c]
561.41 Central African CFA2311.40 | 1.10 | n/a
Population [b] | Urban population size [b]Population growth rate [d] | Urbanisation rate [d]Percentage of the total population below National Poverty Line [d]Unemployment rate
1 300 000 | 510 8282.40% | 4.28%44.0%7%
GDP (Current US$) 2017 [c] | GDP growth rate annual 2017 [c]GDP per capita (Current US$) 2017 [b]GNI per capita (Current US$) [b]Gini co-efficient HDI global ranking 2016 [e] | HDI country index score 2016 [e]
US$12 490 million | -2.5%US$9 850US$7 060n/a135 | 0.592
Is there a deeds registry? Number of residential properties that have a title deed Lending interest rate [b] Mortgage interest rate [f] | Mortgage term (years) [f]Downpayment [g]Mortgage book as a percentage of the GDP [i]Estimated number of mortgages Price to Rent Ratio in City Centre | Outside City Centre Gross Rental Yield in City Centre | Outside City Centre Construction as a % of GDP 2006 [h]
Yesn/a15.00%15% | 2050%n/an/an/a | n/a9% | n/a2.80%
What is the cost of standard 50kg bag of cement? What is the price of the cheapest, newly built house by a formaldeveloper or contractor? (Local currency) [i]What is the price of the cheapest, newly built house by a formaldeveloper or contractor? (US$) [i] What is the size of this house (m2)? What is the average rental price for this unit (US$)? [i] What is the minimum stand or plot size for residential property?
n/a
20 513 058 Central African CFA
US$36 25445m2
US$664n/a
Ease of Doing Business Rank [j]Number of procedures to register property [j]Time to register property (days) [j]Cost to register property (as % of property value) [j]
173623 days12.50%
NB: Figures are for 2018 unless stated otherwise.
[a] Coinmill.com[b] World Bank World Development Indicators[c] Trading Economics[d] Central Intelligence Agency (CIA) World Factbook[e] UNDP Development Indicators[f] Numbeo[g] El Ente Público de Gestión Inmobiliaria de Guinea Ecuatorial (ENPIGE)[h] African Development Bank - African Economic Outlook[i] Expatistan.com[j] World Bank Doing Business

126
Equatorial Guinea’s GDP composition by sector of origin includes: 2.5 percentcontributed by the agriculture sector, 56.5 percent by industry and 41 percent bythe services sector. Major contributors to the agriculture sector include productssuch as coffee, cocoa, rice, cassava, bananas, palm oil nuts, livestock and timber.Major contributors to the industry sector are petroleum, natural gas andsawmilling.14
Equatorial Guinea is classified as a middle income country, with an estimated GDPof US$12.49 billion (CFA 6.9 trillion) in 2017. The GDP per capita (at PurchasingPower Parity) was estimated at US$34 900 (CF 19.5 million) in 2017.15 Despitethe level of development which the country has experienced, the economy isvulnerable to the fluctuations of the hydrocarbon industry, evidenced in the factthat the GDP growth rate dropped to -10.60 percent in 2016 before recoveringslightly to approximately -8 percent in 2017.
The country’s GDP is expected to contract further by 6.4 percent throughout2018. However, the contraction is expected to gradually reduce in 2020 on theback of investment in the hydrocarbon sector; particularly with the Fortuna gasproject.16
Non-oil economic activity is chiefly driven by substantial public investment in newinfrastructure projects such as roads and high profile urban developments,specifically a housing policy for new homes and better access to serviceinfrastructure, with construction contributing seven percent of GDP in 2015.17
Forestry and farming make small contributions to the GDP and the general neglectof the rural economy has marginalised the potential of the sector as a possibleavenue for diversification.18
Efforts to increase investment could be undermined by corruption and red tape.In 2017, Equatorial Guinea was ranked 17119 (out of 180 countries) on theCorruption Perceptions Index and 173 (out of 190 countries) according to theEase of Doing Business Index. In addition, in January 2018, Human Rights Watchreported the mismanagement of public funds, credible allegations of high-levelcorruption, the repression of civil society groups and opposition politicians, andthat unfair trials persist.20 Foreign aid programmes by the World Bank and theInternational Monetary Fund (IMF) have been suspended since 1993 as a resultof corruption and mismanagement. As a middle income country, EquatorialGuinea is now ineligible for most low-income donor funding.21
The IMF, in its statement at the end of its visit to conduct the First Review ofEquatorial Guinea’s Staff-Monitored Programme, 02 – 11 July 2018, reported thatthe country had made notable strides in implementing their reform programme.This included an improved framework, which contributed to higher non-resourcetax revenues and a lower non-resource primary deficit in the first four months of2018. The country has also implemented better control and tracking of publicspending. There has been progress in enhancing revenue administration and theenvironment for investment.22
Access to financeEquatorial Guinea forms part of the Central African Economic and MonetaryCommunity, and it shares a common currency with other member states. Thecentral bank is known as the Bank of Central African States.
In May 2017, the bank kept its policy rate at 2.95 percent in order to boost regionalcredit growth and enhance economic activity in the non-hydrocarbon sector. Thepolicy rate has remained at 2.95 percent in 2018. The spread between lendingand deposit rates remains relatively high, as lending interest rates are expected toaverage around 15 percent23 in the short term while the deposit interest rate iscurrently 2.45 percent.24
In 2016, Equatorial Guinea was reported as having 9.15 ATMs and 4.89 commercialbank branches per 100 000 adults. It was also reported that there were 21.74borrowers from commercial banks, 205 depositors with commercial banks and344 bank accounts per 1 000 adults. Lastly, remittance in flows was reported at0.07 percent of the GDP which was US$10.18 billion in 2016.25
The banking sector is highly concentrated and consists of five banks, three of whichhold 84 percent of total assets. In 2015, the African Development Bank reported
the total value of loans per bank at an average of US$399.98 million (CFA 223.9trillion). Total loans were valued at US$1.9 billion (approximately CFA 1 trillion)with the percentage of non-performing loans being 17.91 percent. The rest ofthe financial sector consists of three microfinance institutions and three insurancecompanies.
The financial sector is shallow and is characterised by limited inclusiveness. Financialdeepening, as measured by deposit and loan-to-GDP ratios, is less than a third ofthe emerging market average. Equatorial Guinea’s financial development gap isthe highest among African oil-exporters.26 The shallowness of the financial sectoris mostly due to persistent structural bottlenecks, which include limitations onpotential borrowers’ credit history and high collateral requirements. Furthermore,a constrained microfinance sector impedes access to financial services by low-income populations. The use of mobile banking in Equatorial Guinea is also laggingcompared to the rest of Africa, which has led the world in innovative financialservices based on mobile telephony.27 Only 18.9 percent of the population usesthe internet and 66.4 percent are mobile phone subscribers.28
The banking system in Equatorial Guinea is characterised by high overhead costsand interest rate spreads, owing to high lending risk and low competition due tothe limited number of commercial banks. The World Bank’s 2018 Doing Businessindicators scored Equatorial Guinea at 122 out of 190 countries globally in termsof ease of getting credit. Bank credit to the private sector increased to 20 percentof GDP in 2015 from five percent of GDP in 2010, but remains heavilyconcentrated among large enterprises, especially those operating in theconstruction sector. The World Bank expects that this concentration will decrease,however, as commercial banks adjust their strategies in favour of othernonhydrocarbon sectors.29
AffordabilityEquatorial Guinea’s unemployment rate was reported at 6.9 percent in December2017.30 As mentioned, the GDP per capita (at Purchasing Power Parity) wasestimated at US$34 900 (CFA 19.5 million) in 2017 and the average income wasreported as CFA 250 000 (US$ 443.74).31 Despite this, Equatorial Guinea wasstill ranked 135 out of 188 countries on the Human Development Index for socialand economic development in 2016.32
Contrasting the above, poverty remains high. Equatorial Guinea has thecharacteristics of a low income country while having one of the highest per capitaGDPs in Africa. The country’s last household survey was conducted in 2006,where it was reported that 79.9 percent of the rural population, 31.5 percent ofthe urban population, and 44 percent of the national population live below thepoverty line,33 thus suggesting that many of the population get little to no benefitfrom the oil economy. This is further supported by the fact that about threequarters of the population live on less than US$ 2 (CFA 1 119.76) a day.34
Most people in Equatorial Guinea are involved in the informal sector. Poverty isconcentrated primarily within rural areas where subsistence living is dominant dueto limited rural economic opportunities.
The African Development Bank has projected that from 2010 to 2020, between25 000 to 49 000 young people will enter the labour market annually. Job creationis limited due to the small size of the non-oil sector. Oil accounts for 85 percentof GDP, but employs only four percent of the labour force.35 The agriculturesector contributes approximately 2.5 percent to GDP and employs about59.52 percent of the working population, both formally and informally.36
According to Numbeo (2018), the average rent for a one-bedroom apartment inMalabo is about CFA 200 000 (US$358) a month, and can be as low asCFA 150 000 (US$266.24) a month outside of the city centre. The averagemonthly rental cost for a three-bedroom apartment in Malabo is aboutCFA 600 000 (US$1 064.98), and CFA 400 000 (US$ 709.98) outside of the citycentre. For those seeking to buy, the average price per square meter of anapartment in the city centre is about CFA 422 208,79 (US$749.40), andCFA 394 905, 95 (US$700.94) outside of the city centre. This is highly unaffordablefor the average person earning CFA 250 000 (US$ 443.74) after tax a month.

Africa Housing Finance Yearbook 2018
127
Housing supplyHousing conditions in Equatorial Guinea, and especially in Malabo and Bata, remainprecarious due to the rapid increase in the urban population and the lack of anurbanisation plan to control disorderly construction. As a result, most housingdoes not meet minimum standards: houses are derelict and unsafe, sewage andrefuse removal are inadequate, and there is, among other problems, overcrowdingand insufficient ventilation.37
In the north, houses are made from wooden planks or palm thatch. Many houseshave shutters. On the mainland, there are houses of various kinds, which are self-built using natural materials, with small houses made of cane and mud walls withtin or thatch roofs. In the cities, high rise apartment buildings are found. Many ofthe better quality apartments in Malabo are leased to oil companies to providehousing to their employees. These apartments provide small serviced units, oftenin buildings designed as hotels, where rental is approximately US$2,000 (CFA 1.1million) a month. Across the board, quality is an issue and many properties areoffered in a poorly maintained state.
On the other hand, wealthy individuals have channelled a significant amount ofcapital into residential real estate development and there are some good qualityapartment blocks to the west, and in the centre, of Malabo. Despite declining oiland gas prices and waning expatriate demand, there continues to be a reasonablemarket for serviced apartments and compounds catering for oil workers.38
Generally, rental can be as high as US$6 500 (CFA 3.6 million) per month, with aprime yield of nine percent.
According to the III General Census for Population and Housing 2001, theGovernment of Equatorial Guinea prioritised the expansion of social housingconstruction programmes. This has led to the development of 17 919 socialhousing units across the country which come with favourable financing to assistwith affordability, making the state the primary housing supplier.39 TheGovernment has also articulated other priorities: developing and implementingadequate regulations for the housing market; increasing and diversifying financialsupport for social housing construction projects; and the preparation andapplication of an urban policy and a national urbanisation plan.40
The development of affordable housing continues to be constrained, however, by,the lack of specialised financial institutions focused on housing and urban planning;inadequate coordination of initiatives in the construction of social housing, andthe lack of investment by the private sector in the construction of rental housing.41
Data on housing delivery is scarce and dated. The public investment programmeas outlined by the IMF (2015) planned to spend CFA 1 492 billion (US$ 2.6 billion)on social housing. By mid-2014, CFA 394 billion (US$670 million) or 26 percenthad been spent, and by 2015 an additional CFA 113 billion (US$192 million) wasspent. No further figures outlining expenditure progress are available. Above that,CFA 5 995 billion (US$10 million) was planned for urban development.
Also in 2015, the government funded a series of public housing blocks in BiokoNorte, for low income earners. Over 1 000 houses were built on Sampaka, asmall town north of Malabo.42 However, it is debatable whether most locals canafford mass housing developments such as Buena Esperanza on the outskirts ofMalabo.
Property marketsAccording to the World Bank’s Doing Business Indicators 2018, the country ranked162 out of 190 countries in terms of registering property – having dropped twopositions since 2017. There are six procedures to register property which is onpar with the Sub-Saharan African’s 6.2. Registering property takes on average23 days and the cost to register property is 12.5 percent of the property value.43
With regards to dealing with construction permits, the country ranked 160 outof 190 countries. There are 13 procedures to get a construction permit, which iswithin the Sub-Saharan African range of 14.8. It takes an average of 144 days andcosts 4.2 percent of the property value to get a construction permit.
Some large scale projects in the country include the Malabo II urban corridor andthe Sipopo luxury resort, and work has begun on the construction of a new capitalcity at Oyala on the mainland.
However, due to decreased oil revenues, the government has also recently reducedits investment in the construction sector. With the oil and gas sectors contracting,demand for office space is low. Office demand in Equatorial Guinea has beenhistorically driven by the construction, energy and oil sectors with many of theself-contained, owner-occupied buildings belonging to companies such asMarathon, Noble Energy and Total. However, the market’s few major officelandlords are debt-free and able to cope with vacancies. On average, rental isestimated at US$37 (CFA 20 715.60) a square meter a month with a prime yieldof 11 percent.
The government has planned to close K5 (a port to the north of Airport Road)and requires most of its industrial sector to operate from Luba. This has resultedin many significant purpose-built construction projects and real estate speculation.Rental is estimated at US$11 (CFA 6 158.69) a square meter per month with aprime yield of 14 percent in the industrial property sector.
The majority of title or deed records in the country are in paper format and thereis no electronic database for checking for encumbrances (liens, mortgages,restrictions and the like). There are no publicly available official statistics trackingthe number of transactions at the immovable property registration agency.Discrepancies around ownership rights exist between unmarried men andunmarried women who have equal ownership rights, while married men andwomen do not.
PPP$40 001 – PPP$10 000 000
PPP$23 001 – PPP$40 000
PPP$12 001 – PPP$23 000
PPP$8 001 – PPP$12 000
PPP$5 001 – PPP$8 000
PPP$3 601 – PPP$5 000
PPP$2 401 – PPP$3 600
PPP$1 601 – PPP$2 400
PPP$801 – PPP$1 600
<PPP$800
- - - Average annual household income needed for the cheapest newly built house by a formal developer, 2017 Average annual household income using expenditure, 2017 (PPP$)
EQUATORIAL GUINEA
Annual income profile for rural and urban households based on consumption (PPP$)
No. of households (thousands)
PPP$10 517
PPP$28 613
Rural Urban50 40 30 20 10 0 10 20 30 40 50
Population: 1 300 000
Urbanisation rate: 4.28%
Cost of cheapestnewly built house:
20 513 058 XAFPPP$88 801
Urban householdsthat could afford thishouse with finance:
64.15%
1 PPP$: 231 CFA franc
Source https://www.cgidd.com/

128
According to the civil code Law of State Patrimony and Law of the Soil, all landbelongs to the State. This gives the State a wide mandate to take possession ofland whenever it is in the sovereign interest to do so. Equatoguinean law providesfor compensation in the event that property is taken by the government. However,when people are evicted from their homes they seldom receive adequatecompensation.
Policy and regulationAccording to the IMF, the government’s development agenda is guided by amedium-term strategy, the National Economic Development Plan: Horizon 2020,which targets economic diversification and poverty reduction. The first phase ofHorizon 2020, focusing on infrastructure development, was concluded in 2012.The second phase is focusing on economic diversification, targeting strategic newsectors such as fisheries, agriculture, tourism, and finance. The need to focus ondeveloping new economic sectors was driven by the drop in oil prices and thedecline of the historically dominant sector.
The new city of Djibloho, in the centre of mainland Equatorial Guinea, will beestablished under the framework of the policy for regrouping the populations ofthe main cities – Malabo, Bata, Mongomo, Ebebiyin, Evinayong and Luba. Anintegrated, coordinated approach was taken in drafting the master plans for roads,housing and social infrastructure in order to improve the quality of urban lifethrough economies of scale.44
With support from the World Bank, Equatorial Guinea has established a statisticsoffice to better inform policy-makers, indicating that the country is cognisant ofthe fact that quality data influences informed policy.
Opportunities Equatorial Guinea has significant assets. The country’s infrastructure is world-class,including roads, ports and energy. The cultural diversity of the country’s populationand the return of a well-trained diaspora willing to invest in the country is anadded benefit to the country’s growth prospects.45 These factors are conduciveto an investment focus on affordable housing – and the demand is clearly evident.Furthermore, the high cost of formal construction provides developers with anopportunity for innovation, whether through the local manufacture of buildingmaterials locally or through other initiatives.
To the extent that Equatorial Guinea’s financial sector has been a constraint, a2015 IMF report highlights significant efforts to strengthen financial sectordevelopment and improve access to financing in the past few years, by thegovernment in cooperation with the private sector. The IMF indicates that enactedmeasures include the introduction of a real-time interbank clearance mechanismand the placement of ATMs at the bank branch level, as well as significantinvestments towards laying fiber-optic cable to the mainland. Plans are also under
way to develop nation-wide ATM and credit card networks, while authorities areconsidering proposals for the creation of a credit fund and the development of agovernment debt market. These will all bode well for a stronger financial sectorthat too, will be able to support increased activity in the affordable housing market.
SourcesAfrican Development Bank Group (2012). Equatorial Guinea EconomicOutlook. http://www.undp.org/content/dam/rba/docs/Reports/African%20Economic%20Outlook%202012%20En.pdf (Accessed 30 June 2018).
International Monetary Fund (2015). Country Report No. 15/260. Republic ofEquatorial Guinea.
International Monetary Fund (2016). Republic of Equatorial Guinea: SelectedIssues. 12 August 2016. IMF Country Report No. 16/358.
International Monetary Fund (2018). Republic of Equatorial Guinea Staff-Monitored Program. 4 June 2018.https://www.imf.org/en/Publications/CR/Issues/2018/06/04/Republic-of-Equatorial-Guinea-Staff-Monitored-Program-45935 (Accessed 30 June 2018).
Knight Frank (2015). Africa Property Focus: Equatorial Guinea.https://bit.ly/2v5pu4F (Accessed 4 July 2018).
Making Finance Work for Africa (2017). Equatorial Guinea: Financial SectorProfile. www.mfw4a.org/equatorial-guinea/financial-sector-profile (Accessed4 uly 2018).
Numbeo (2018). Cost of Living in Equatorial Guinea. www.numbeo.com/cost-of-living (Accessed 4 July 2018).
Reegle (2012). Equatorial Guinea, 2012. http://www.reegle.info/policy-and-regulatory-overviews/GQ (Accessed 8 July 2018).
Trading Economics (2017). Equatorial Guinea Unemployment Rate.https://tradingeconomics.com/equatorial-guinea/unemployment-rate (Accessed18 August 2018).
Websiteshttp://www.undp.orghttps://www.afdb.org/en/countries/central-africa/equatorial-guinea/http://www.mfw4a.org/equatorial-guinea/https://www.economy.com/equatorial-guinea/indicators#ECONOMYhttps://tradingeconomics.com/equatorial-guinea/indicatorshttp://www.worldbank.org/en/country/equatorialguinea/overview http://ihsmarkit.com
1 IHS Markit (2017). Country Reports: Equatorial Guinea. IHS Markit.2 Economist Intelligence Unit (2018). Country Report: Equatorial Guinea. Economist Intelligence Unit.
https://bit.ly/2AdKVGB 3 World Bank (2017). Urban Population. https://bit.ly/2nqC7DS 4 Central Intelligence Agency (CIA) (2018).The World Factbook.5 Trading Economics (2018). Equatorial Guinea Government Budget. https://tradingeconomics.com/equatorial-
guinea/government-budget (Accessed 4 July 2018).6 CIA World Factbook (2018).7 World Bank (2018). The World Bank In Equatorial Guinea Overview. https://bit.ly/2Lpch1A 8 AfDB, OECD, UNDP (2017). African Economic Outlook 2017: Entrepreneurship and Industrialisation. African
Development Bank. https://bit.ly/2rvIsS4 9 Trading Economics (2018). Equatorial Guinea Crude Oil Production https://tradingeconomics.com/equatorial-
guinea/crude-oil-production (Accessed 4 July 2018).10 Trading Economics (2018). Equatorial Guinea GDP. www.tradingeconomics.com/equatorial-guinea/gdp (Accessed
4 July 2018).11 Ibid. 12 All Africa (2018). “Equatorial Guinea Keen on Economic Diversification Dialogue with ECA.”
https://bit.ly/2JZKOOe 13 AfDB, OECD, UNDP (2017). African Economic Outlook 2017: Entrepreneurship and Industrialisation. Pg. 142.14 Moody’s Analytics (2018). Equatorial Guinea - Economic Indicators. https://www.economy.com/equatorial-
guinea/indicators#ECONOMY (Accessed 4 July 2018).15 CIA World Factbook (2018).16 World Bank (2018). Ease of Doing Business in Equatorial Guinea. https://bit.ly/2mJP37B 17 AfDB, OECD, UNDP (2017). African Economic Outlook 2017: Entrepreneurship and Industrialisation.18 CIA World Factbook (2018).19 Transparency International (2018). Corruption Perceptions Index 2017.
https://www.transparency.org/news/feature/corruption_perceptions_index_2017 (Accessed 30 June 2018).20 Human Rights Watch (2018). Equatorial Guinea Country Summary.
http://hdr.undp.org/sites/all/themes/hdr_theme/country-notes/GNQ.pdf (Accessed 30 June 2018).21 CIA Factbook (2018).22 Fouda, L.M. (2018). Statement at the End of an IMF Visit to Conduct the First Review of Equatorial Guinea’s Staff-
Monitored Program. The International Monetary Fund (IMF).
23 World Bank Data (2007). Lending Interest Rate.https://data.worldbank.org/indicator/FR.INR.LEND?locations=GQ (Accessed 18 August 2018).
24 Trading Economics (2018). Equatorial Guinea: Interest Rate. https://tradingeconomics.com/equatorial-guinea/interest-rate (Accessed 4 July 2018).
25 Trading Economics (2018). Equatorial Guinea: Commercial Bank Branches.https://tradingeconomics.com/equatorial-guinea/commercial-bank-branches-per-100-000-adults-wb-data.html(Accessed 4 July 2018).
26 International Monetary Fund (2018). Republic of Equatorial Guinea. 27 Ibid.28 IHS Markit (2017). 29 World Bank (2018). Ease of Doing Business in Equatorial Guinea.30 Trading Economics (2017). Equatorial Guinea Unemployment Rate. 31 NUMBEO (2018). Cost of Living in Equatorial Guinea. 32 UNDP (2016) Equatorial Guinea Newsletter : Strategic Focus for Sustainable Development. https://bit.ly/2LKGI1o 33 AfDB, OECD, UNDP (2017). African Economic Outlook 2017: Entrepreneurship and Industrialisation.34 Africa Economic Outlook (2012). Equatorial Guinea. https://bit.ly/2LAVBnb 35 Ibid.36 Trading Economics (2018). Equatorial Guinea: Employment in Agriculture.
https://tradingeconomics.com/equatorial-guinea/employment-in-agriculture-percent-of-total-employment-wb-data.html (Accessed 4 July 2018).
37 UNDP (2005). Equatorial Guinea Informe Sobre Los Objetivos De Desarrollo Del Milenio (ODM).https://bit.ly/2KMXf0n
38 Knight Frank (2017). Africa Report 2017/18. https://bit.ly/2LTN1Ng (Accessed 4 July 2018).39 African Development Bank Group (2018). Equatorial Guinea Economic Outlook. https://www.afdb.org/en/
countries/central-africa/equatorial-guinea/equatorial-guinea-economic-outlook/ (Accessed 30 June 2018).40 Ibid.41 UNDP (2005).42 Knight Frank (2015). Africa Property Focus: Equatorial Guinea. 43 World Bank (2018).44 African Development Bank Group (2018). Equatorial Guinea Economic Outlook. 45 AfDB, OECD, UNDP (2017). African Economic Outlook 2017: Entrepreneurship and Industrialisation.
Africa Housing Finance Yearbook 2018
129
impressive healthcare system and low prevalence of HIV/AIDS and malaria. Eritreahas achieved this feat with minimal resources and little foreign assistance, winningpraise from the UN. The country opposes foreign interference and has not shiedaway from banning nine US Non-Governmental Organisations, considering suchinternational assistance as forms of slavery.5 Although the country has sufferedfrom long-standing border disputes with its neighbour, recent developments haveraised hopes for the resolution of these differences. The newly elected Ethiopianprime minister has visited6 Eritrea for the first time in decades and the EritreanPresident made a return visit,7 leading to the opening of the Eritrean Embassy inAddis Ababa. These major developments in the region and between the twocountries bode well for housing investors in Eritrea.
Access to financeEritrea’s financial system is considered underdeveloped, with a limited supply offinancial services which fall far short of demand. Banking sector assets areequivalent to just 18.4 percent of the Gross Domestic Product (GDP).8 None ofthe banks publish financial statements and most of the operations in the bankingsector are manually executed. Commercial banks are required to set aside20 percent of their deposits as reserves.
OverviewEritrea is one of the countries that lie along the horn of Africa, bordering Ethiopia,Djibouti and Somalia. The population of the country is estimated at 5 918 919 in2017.1
Eritrea is considered as the most isolated country in Africa and has been subjectto numerous economic sanctions by the United Nations (UN) and the UnitedStates of America (USA), due to its perceived support of militia groups. In effect,the country has limited foreign currency reserves, curtailing its ability to importessential food supplies for its largely poor population. The inflation rate in 2017stood at nine percent. Eritrea remains one of the poorest countries in the worldand economic performance has been uneven within this challenging environment.Unpredictable weather, economic sanctions, low commodity prices and a weakbusiness environment have all contributed to holding economic growth at3.8 percent in 2016 which dropped to 3.4 percent in 2017.2
The World Bank’s 2018 Doing Business Report ranks Eritrea as the second mostdifficult county in which to do business (189 out of 190 countries). In addition,the indefinite period of national service requirements, which has been in place for12 years, has forced most of the adult population to serve as recruits for extremelylow wages.3 Many Eritreans depend on the support of relatives in the diasporafor survival due to the prevalence of high poverty rates. The UN has estimatedthat the number of refugees and economic migrants from Eritrea exceeds10 percent of the current population. Eritreans comprise one of the largestproportion of emigrants per total population. However, new evidence suggeststhat the number of Eritrean migrants reaching Europe has dropped substantiallycompared to figures in 2017.4
Agriculture accounts for 80 percent of rural employment. This is supported byan observation by the World Bank that Eritrea has poor quality educationinfrastructure, exposing it to a heightened skills gap. These challenges constrainthe development of human capital, limiting long-term inclusive and sustainableeconomic growth. The country recently discovered commercially viable quantitiesof gold but will have to contend with the declining global prices of minerals.
The unresolved border dispute between Eritrea and Ethiopia, coupled withcrippling isolation of the country by the international community have inspiredthe adoption of inward-looking policies by the government. The country has an
EritreaKEY FIGURES
Main urban centres Asmara
Exchange rate: 1 US$ = [a] 12 Aug 2018PPP Exchange rate (Local currency/PPP$) 1 Nakfa = [e]Inflation 2016 [c] | Inflation 2017 [c] | Inflation 2018
15.29 Nakfa5.9 9.00 | 9.00 | n/a
Population 2017 [c] | Urban population size [c] Population growth rate [c] | Urbanisation rate 2017 [c]Percentage of the total population below National Poverty LineUnemployment rate 2013 [c]
5 918 919 | 2 373 4870.85% | 3.86%n/a8.60%
GDP (Current US$) 2017 [d] | GDP growth rate annual 2017 [d]GDP per capita (Current US$) 2017 [d]GNI per capita (Current US$) 2017 [e]Gini co-efficient [c]HDI global ranking 2015 [f] | HDI country index score 2015 [f]
US$3 860 million | 3.4%US$514US$520n/a179 | 0.420
Is there a deeds registry? Number of residential properties that have a title deed Lending interest rate Mortgage interest rate [g] | Mortgage term (years)DownpaymentMortgage book as a percentage of the GDPEstimated number of mortgages Price to Rent Ratio in City Centre | Outside City Centre Gross Rental Yield in City Centre | Outside City Centre Construction as a % of GDP
n/an/an/a9.5% | 25n/an/an/an/a | n/an/a | n/an/a
What is the cost of standard 50kg bag of cement? [h]What is the price of the cheapest, newly built house by a formaldeveloper or contractor? (Local currency) [h]What is the price of the cheapest, newly built house by a formaldeveloper or contractor? (US$) [h]What is the size of this house (m2)? [h]What is the average rental price for this unit (US$)? What is the minimum stand or plot size for residential property?
US$32.60
1 265 248 Nakfa
US$82 696125m2
n/an/a
Ease of Doing Business Rank [i]Number of procedures to register property [i]Time to register property (days) [i]Cost to register property (as % of property value) [i]
1891178 days9.00%
NB: Figures are for 2018 unless stated otherwise.
[a] Coinmill.com[b] World Bank World Development Indicators[c] Central Intelligence Agency (CIA) World Factbook[d] Tradingeconomics[d] African Development Bank[e] Indexmundi[f] Transformation Index BTI [g] Statistia.com[h] CAHF Yearbook 2017[i] World Bank Doing Business
130
Eritrea’s banking sector is dominated by state-owned banks regulated by Bank ofEritrea. There are three commercial banks in Eritrea: Commercial Bank of Eritrea,a state-owned bank with nearly 28 branches in the country; the Housing andCommerce Bank of Eritrea (HCBE), a private bank, specialising in commercial andresidential mortgage loans; and the Eritrean Investment and Development Bank, astate-owned bank specialising in long-term industrial and agricultural loans.9
Microfinance has been in operation since 2005 and has served the rural poor,particularly women. Despite the potential of this mode of financial operations, itsreach is limited by the rudimentary ITC network, including mobile telephonepenetration. Cell phone subscriptions have increased gradually from only 1 to 17per 1 000 inhabitants between 2000 and 2015.
According to the World Bank’s 2018 Doing Business Report, in the “ease of gettingcredit” category, Eritrea was ranked 186th out of 190 countries.10 Notwithstandingsome positive developments, access to traditional financial services remains difficult.The share of the population having an account at, or borrowing from, a financialinstitution is low. The cost of borrowing remains prohibitively high, with realinterest rates around 7 to 12 percent. If not subsidised, interest rates could be ashigh as 30 percent depending on the use of the money being borrowed.Moreover, financial markets have not evolved in ways that allow individuals andfirms to diversify their savings and enable firms to raise money through stocks,bonds, and foreign exchange markets.
Eritrea’s economy is mainly cash-based, with limited use of demand deposits andalmost no term deposits. Reforms in 2016 brought in an automated paymentsystem and the old Nakfa (ERN) banknotes were replaced. The combined effectof these actions has been to reduce the size of the black market and hinder humantrafficking. All citizens have been encouraged to transact their business throughthe banking system. However, due to the issuance of new banknotes, many peopleare struggling to make ends meet as the cost of living has risen.11
Although the government enacted the comprehensive Bank and FinancialInstitutions Act, permitting the licensing of private financial institutions, includingforeign banks, no other local or foreign private financial institution has been allowedto work in Eritrea (except for the foreign exchange bureau). HCBE offers savingsand current accounts in the local currency (Nakfa), US dollars and euros, as wellas US-dollar-denominated Certificates of Deposit. According to the Bank’swebsite, its main product offerings include: medium and long-term loans for theconstruction of houses and businesses, as well as various types of medium andlong-term loans for the construction of buildings, stores and community centres.The bank’s other product offerings include loans for purchasing existing buildingsand for home repairs, maintenance, modifications and extensions, as well ascommercial, consumer and personal loans. The bank also has a large-scale housingconstruction programme that it has financed to deliver stock for sale to thepublic.12
Eritrea ranks low in Africa in terms of loan access and information on borrowerssuch as credit history and credit risk. Data on mortgage lending is not availableand does not appear to be collected by the Central Bank, hence it is not possibleto determine the size of the mortgage market. However, it is likely to be small.The country’s collateral markets are underdeveloped, making it difficult for citizensto obtain mortgage loans. For example, undeveloped land, no matter the tenureform, cannot be used as collateral, which denies landholders the opportunity toaccess loans for house construction.
AffordabilityAccording to Numbeo, the rental cost of a one-bedroom apartment in theAsmara city centre is NFA 1 529 (US$100) per month. Furthermore, Numbeoindicates that purchasing an apartment in Asmara city centre costs NFA 53 991(US$3 531) per square metre, while buying an apartment outside the city centrecosts NFA 10 795 (US$706) per square metre. Eritrea has one of the highestpoverty rates and is one of the least developed countries in the world, with closeto 65 percent of the population living in rural areas.13 House rental rates andestimated cost per square metre for acquiring a house are way beyond the reachof most Eritreans.
Eritrea has a low urbanisation level, estimated at 40.1 percent of the totalpopulation.14 At the same time, access to housing and urban infrastructure
services is severely constrained. While some households can make use of bankloans, a significant percentage of houses are either self-financed, or built withremittances from Eritreans living abroad. Homes are often built over years andcost the entire life savings of those who invested in them. Because of tougheconomic conditions and to alleviate their housing problems, many individuals haveresorted to informally selling part of the land allocated to them for development.The main purpose of these sales is for the owners to use the proceeds to buildtheir own houses on a portion of their land. This practice has become widespreadover the past 20 years despite the government considering it an “illegal sale ofland”.
For the minority that can afford mortgages, the banks, usually HCBE, require a25 percent deposit, and then an installment-to-income ratio of no more than athird of the borrower’s income over a maximum tenor of 25 years. According tolocal news sources, a 16m2 room in Asmara and in villages in the vicinity goes forNFA 1 000 (around US$65) a month and the median average salary of agovernment employee in the country is NFA 800 (US$52) a month. It is apparentthat only higher income households can afford the available housing stock inEritrea.
In 2013, the government launched a major housing project in Asmara. Accordingto the official website, apartments and houses range from 30m2 – 120m2 and125m2 – 200m2 respectively. Apartment prices range from NFA 315 055(US$21 015) for a 30m2 unit to NFA 1 162 995 (US$77 578) for a 120m2 unit.House prices vary from NFA 1 247 887 (US$83 241) for a 125m2 home all theway up to NFA 1 977 185 (US$131 889) for a 200m2 unit. As stipulated onHCBE’s website, only nationals who have fulfilled their national obligations andwho make a 25 percent deposit payment for the house or business shops theyselect qualify for the purchase. The costs of these types of units are prohibitivelyexpensive for most Eritreans.
Housing supplyAs emphasised in the previous section, the availability of adequate and affordablesocial housing continues to be problematic in Eritrea. According to a 2005 Housingand Urban Development study, the majority of households own their homes(68.9 percent), ranging from 82 percent in villages to 63 percent in the primarycities. However, it is not clear if these households have formal title or are able touse their land rights to mobilise finance. The remaining 31.1 percent is composedof renters, including private renters (24.5 percent), sharers (6 percent) and nodata (0.6 percent).15 The formal and informal rental housing sector appears tooffer viable housing solutions for many families in Eritrea.
In Asmara, over half of the households in the city are tenants. In the rest of thecountry, this proportion is lower, ranging from 17 percent in small towns to22 percent in the medium-sized towns. According to Proclamation n. 58/1994 of24th August 1994,16 annual rent must be paid, with the sole exception of ruralhousing. “House sharers” are often immediate or extended family members whoeither cannot pay rent or cannot find a house to rent. The large ratio of sharersreflects the serious housing problem in the country. The majority of urbanresidents in Eritrea live in over-crowded housing conditions with limited access toaffordable water and safe sanitation.
According to the Human Rights Council (HRC), over the years the successivemovement of refugees and internally displaced persons has caused severe housingshortages. In recent years, the Eritrean authorities have resorted to evictions andthe demolition of houses that were built outside of local planning permissions.The HRC has reports of the demolition of approximately 800 houses in Asmaraand several other villages in the vicinity of the capital city, as well as other townssuch as Adi Keyh, in the southern part of the country. An estimated 3 000 peoplebecame homeless after these demolitions. Many evictees sought refuge withfriends and family, which further exacerbated the overcrowded housing problemand further limited access to affordable water and safe sanitation. According tothe HRC, by resorting to these types of actions, the Eritrean authorities havedemonstrated that they are reluctant to create the necessary conditions to expandaccess to adequate social housing.
It is not clear what the government’s current housing delivery rate is, but recentreports suggest that many of the new developments target the medium to high

Africa Housing Finance Yearbook 2018
131
end of the property market. Local news sources indicate that Eritrea was buildinga number of infrastructure projects (dating from 2014). These projects includethe development of luxury resorts, colleges, modern homes and dams. Eritrea iswitnessing an unprecedented development boom. Examples of this high-endboom include the Asmara Housing Project which was launched in 2013 anddeveloped in the Sembel, Halibet and Space 2001 districts of the city. Accordingto recent news reports, over 40 percent of this housing project has beencompleted.17 The project has been undertaken by an Italian Company, Piccini, incollaboration with other local construction companies under the umbrella of theHousing and Commercial Bank of Eritrea. The project comprises a total of 1 754housing complexes including 930 apartments and 824 villas as well as 192 businesscomplexes. This housing project includes road infrastructure, a sewage systemand water pipelines, and electricity, as well as telephone and internet installations.In addition, a pre-cast factory in Asha-Golgol has been actively producing thematerials required for the project.18
In an interview with state media in February 2014, President Isaias Afwerki wasquoted by an online news source, Madote, saying that, “The pilot housing projectin Asmara is a precursor of a comprehensive urban and rural national housingscheme for the years to come.”19 Therefore, it is suggested that urban areas suchas Mendefera, Teseney, Assab, Dekemhare and Keren should expect to see housingdevelopment projects of their own. There is also the NFA 1 758 429 547 (US$115million) Dahlak Master Plan and several high-end resorts in Ras Harab and Halibay.
The government also appears to be constructing residential properties that willbe sold to Eritreans in the diaspora who can afford to pay in foreign currency.Another Italian company, Gruppo Italiano Costruzioni, has also been involved indelivering 1 680 housing units in the country. The NFA 4 497 373 504 (US$300million) Massawa project appears to be a mix of luxurious resorts, hotels andresidential buildings. Currently, the construction of the project has beenpostponed, presumably due to the Asmara pilot project taking priority.
Property marketsThe property market in Eritrea is challenging. According to the World Bank’s 2017Doing Business Report, registering property in Eritrea requires 11 procedures,takes 78 days and costs 9.1 percent of the property value. Furthermore, themajority of title or deeds records in the country are in paper format and there isno electronic database for checking for encumbrances (liens, mortgages,restrictions and the like). There are no publicly available official statistics trackingthe number of transactions at the immovable property registration agency.
Under the 1994 Land Proclamation Act, land ownership is vested in the state, withindividuals, both Eritreans and foreign investors alike, granted users' rights undera renewable lease arrangement, for 10 to 60 years. Women have equal rights tomen under the Land Proclamation Act. Two legal instruments drafted in the 1990sgave every Eritrean the right to land for housing in urban areas and ancestral
villages, subject to meeting certain allocation criteria. There are two distinct formsof land tenure for housing: “Tessa” and lease land. “Tessa” land refers to allottedvillage land. Lease land is allocated in urban areas and houses built on it may besold, donated, inherited, transferred or mortgaged.
Policy and regulationThe Land Proclamation and Legal Notice 31/1997 serves as the country’s post-independence land law. According to the proclamation, land is the exclusiveproperty of the state; the sale, transfer and mortgaging of land is prohibited.Therefore, an individual citizen only has usufruct rights over land, and thegovernment could allocate land through leaseholds. Every Eritrean citizen whohas met the necessary criteria (including national service duties) is given the rightto be allocated a plot of land for housing in urban areas and ancestral villages. Theproclamation specifies that:
n An annual rent must be paid, which is determined by the law or by regulationof the Ministry of Finance, with the sole exception of rural housing;
n Land rights cannot be transferred, except where expressly provided for bylaw;
n Expropriation can be ordered only for purposes of development and capitalinvestment aimed at national reconstruction or other similar purposes, withthe decision being final and not justifiable; and
n Compensation for expropriated land, which must be agreed between theowner and the state, is to be paid in cash or in kind.
The amount of compensation for expropriation will be commensurate with thedamage experienced and will be paid before the holder relinquishes the land. Inthe case of disagreement, the titleholder can bring a suit before the High Court.
This legislation has created significant obstacles for the housing industry. One ofthe challenges has been the housing delivery system, which has been unable tospeedily respond to the need for housing land, and the demand for housing hasfar exceeded supply. Other factors such as poor governance, mismanagementand a lack of clarity within institutional structures has further compounded thecountry’s housing shortage.
The main national institutions include the Department of Urban Development ofthe Ministry of Public Works, the Ministry of Lands, Water and the Environment(MLWE), the Housing Commission and the various municipalities. The mainmission of the MLWE is to ensure the implementation of sustainable landmanagement and guarantee optimum use and fair distribution of land. It ismandated to study land capability and land use planning, allocation of land parcels,and to monitor whether allocated land is utilised according to designated purpose.
Recently, the ruling party introduced price controls on the amount of rent payableand on the procedure for enforcing rental contracts.20 Property owners are now
Source https://www.cgidd.com/
ERITREA
PPP$40 001 – PPP$10 000 000
PPP$23 001 – PPP$40 000
PPP$12 001 – PPP$23 000
PPP$8 001 – PPP$12 000
PPP$5 001 – PPP$8 000
PPP$3 601 – PPP$5 000
PPP$2 401 – PPP$3 600
PPP$1 601 – PPP$2 400
PPP$801 – PPP$1 600
<PPP$800
- - - Average annual household income needed for the cheapest newly built house by a formal developer, 2017 Average annual household income using expenditure, 2017 (PPP$)
No. of households (thousands)
PPP$11 092
PPP$67 110
Rural Urban250 200 150 100 50 0 50 100 150 200 250
Population: 5 918 919
Urbanisation rate: 3.90%
Cost of cheapestnewly built house:
1 265 248 ERNPPP$213 364
Urban householdsthat could afford thishouse with finance:
1.85%
1 PPP$: 5.9 Nakfa
Annual income profile for rural and urban households based on consumption (PPP$)

132
required to effect rental transactions at the nearest government office. There havebeen instances where government officials collect rent from tenants and deliverafter-tax rent to property owners, fuelling significant graft. This regulation haseffectively made the ruling party the de facto landowner, landlord and estatebroker, with significant risks for current and potential property developers. Theproblem is compounded by the introduction of strict currency controls throughLegal Notice No. 129/2017, limiting the amount of Nakfa travellers exiting Eritreacan hold.21 The legal notice has set the Nakfa holding limit for travellers exitingEritrea at a maximum of Nakfa 1 000 while travellers aged below 18 will not beallowed any amount of Nakfa.
OpportunitiesAnalysts agree that Eritrea’s growth prospects are potentially favourable in themedium term due to the mining of mineral resources, the commodity pricerecovery and plans to scale up energy supply. In addition, the National IndicativeDevelopment Plan 2014-2020 foresees the allocation of substantial resources andinvestment to increase the supply and quality of the country’s human capital inthe broadest sense and within competitive standards. Eritrea’s rich entrepreneurialtradition provides opportunities for private sector growth and industrialisation.
Eritrea clearly has a great need for affordable housing delivery and there aresignificant opportunities for both the public and private sectors to strengthen thedevelopment of housing finance, as well as increase its supply. Possible initiativesinclude expanding tailored housing loan products to low income groups; providingtechnical assistance to banks to enable them to originate and manage loans forlow income housing; and introducing innovative and competitive housing solutionsand products for the poor. Furthermore, substantial remittances from the diasporaprovide a useful source of housing finance (when it is not subjected to tax) thatcould be harnessed for both mortgage and microfinance lending.
Beyond mortgage finance, there is a significant need for additional cheaper buildingmaterials, which provides potential investors with the opportunity to gainsubstantial market share by manufacturing some building materials locally.
Following the peace agreement and restoration of diplomatic relations betweenEritrea and Ethiopia,22 the UN is in the process of lifting crippling sanctionsimposed on Eritrea.23 This development is likely to improve the country’seconomic performance and foreign currency reserves. Further, the two countrieshave restored both telecommunications and air transport between them. Thiswill hopefully improve the environment for doing business, considering EthiopianAirlines is one of the largest airlines in the region.24
Additional sourcesAfDB (2018). African Economic Outlook 2018.https://www.afdb.org/en/countries/east-africa/eritrea/eritrea-economic-outlook/(Accessed 27 Aug 2018).
Awate (2018). Djibouti Objects to the Lifting Of UN Sanctions on Eritrea.http://awate.com/djibouti-objects-to-the-lifting-of-un-sanctions-on-eritrea/(Accessed 26 Aug 2018).
Castellani L. G (2000). Recent Developments in Land Tenure Law in Eritrea,Horn of Africa. https://ageconsearch.umn.edu/bitstream/12800/1/ltcwp37.pdf(Accessed 6 Sept 2018).
Central Intelligence Agency-CIA (2018). World Fact Book.https://www.cia.gov/library/publications/the-world-factbook/geos/er.html(Accessed 25 Aug 2018).
Numbeo (2018). Property prices in Eritrea.https://www.numbeo.com/property-investment/country_result.jsp?country=Eritrea (Accessed 25 Aug 2018).
Housing and Commerce Bank of Eritrea-HCBE (2018). New InformationRegarding Asmara Housing Project (AHP) on Second Payment of October2016. https://erhcb.com/ (Accessed 25 Aug 2018).
Reuters (2018). At concert, Ethiopia, Eritrea leaders preach peace, love, andunity. https://www.reuters.com/article/us-ethiopia-eritrea/at-concert-ethiopia-eritrea-leaders-preach-peace-love-unity-idUSKBN1K50ZB (Accessed 27 Aug2018).
UNHABITAT (2018). Eritrea: Housing/Urban Development Policy Report.https://mirror.unhabitat.org/files/6670_FINAL_Consolidated_Policy_Report_Eritrea_July20.pdf (Accessed 18 Sept 2018).
World Bank (2018). The World Bank in Eritrea.http://www.worldbank.org/en/country/eritrea/overview (Accessed 26 Aug2018).
1 Central Intelligence Agency-CIA (2018). World Factbook – Eritrea.https://www.cia.gov/library/publications/the-world-factbook/geos/er.html (Accessed 5 Sept 2018).
2 Africa Development Bank-AfDB (2018). Eritrea Economic Outlook. https://www.afdb.org/en/countries/east-africa/eritrea/eritrea-economic-outlook/ (Accessed 5 Sept 2018).
3 BTI (2018). Eritrea Country Report. https://www.bti-project.org/en/reports/country-reports/detail/itc/ERI/.(Accessed 25 Aug 2018).
4 RMSS (2018). A year on – revisiting The Eritrean Exodus.http://www.regionalmms.org/index.php/component/spsimpleportfolio/item/74-a-year-on-revisiting-the-eritrean-exodus (Accessed 25 Aug 2018).
5 Madote (2018). U.S. NGOs Kicked Out of Eritrea: Foreign Aid Is Meant to Cripple People.http://www.madote.com/2015/04/us-ngos-kicked-out-of-eritrea-foreign.html (Accessed 25 Aug 2018).
6 Reuters (2018). Eritrea's president to visit Ethiopia, embassy to re-open. https://www.reuters.com/article/us-ethiopia-eritrea/eritreas-president-to-visit-ethiopia-embassy-to-re-open-idUSKBN1K30NE (Accessed 26 Aug2018).
7 Bloomberg (2018). Ethiopian Premier Visits Eritrea as Nations End Decades of Strife.https://www.bloomberg.com/news/articles/2018-07-08/ethiopia-prime-minister-abiy-in-historic-eritrea-visit-on-sunday (Accessed 26 Aug 2018).
8 Africa Development Bank-AfDB (2018). AfDB (2018) African Economic Outlook 2018. 9 Embassy of the State of Eritrea (2018). Banking in Eritrea. http://eritrean-embassy.se/invest-in-eritrea/banking-
in-eritrea/ (Accessed 25 Aug 2018).10 World Bank (2018). Doing Business 2018.
http://russian.doingbusiness.org/~/media/WBG/DoingBusiness/Documents/Annual-Reports/English/DB2018-Full-Report.pdf (Accessed 25 Aug 2018).
11 Ministerie van Buitenlandse Zaken (2017). Country of Origin Report on Eritrea - February 2017.https://www.government.nl/documents/reports/2017/02/06/country-of-origin-report-on-eritrea-february-2017 (Accessed 25 Aug 2018).
12 Housing and Commerce Bank of Eritrea-HCBE (2018). https://erhcb.com/13 World Bank (2018). The World Bank in Eritrea.14 CIA (2018).15 Eritrea Ministry of Public Works/Department of Urban Development, UN-HABITAT and UNDP (2005).
Eritrea: Housing/Urban Development Policy Report.https://mirror.unhabitat.org/files/6670_FINAL_Consolidated_Policy_Report_Eritrea_July20.pdf (Accessed 18Sept 2018).
16 Castellani (2000). 17 Madote (2018). Is Eritrea on the verge of a construction boom?. http://www.madote.com/2014/02/is-eritrea-
on-verge-of-construction-boom.html (Accessed 26 Aug 2018).18 Ibid.19 Ibid.20 Awate (2018). Eritrean Economy: Increased Control of Real Estate. http://awate.com/eritrean-economy-
increased-control-of-real-estate/ (Accessed 26 Aug 2018).21 Geeska Afrika (2018). Central Bank to Tighten Currency Controls.
http://www.geeskaafrika.com/27210/central-bank-tighten-currency-controls/ (Accessed 26 Aug 2018).22 Reuters (2018). At concert, Ethiopia, Eritrea leaders preach peace, love, and unity. 22 Awate (2018). Djibouti Objects to the Lifting Of UN Sanctions on Eritrea.24 Awate (2018). Ethiopian Airlines Will Resume Flights to Asmara. http://awate.com/ethiopian-airlines-will-
resume-flights-asmara/ (Accessed 26 Aug 2018).

Africa Housing Finance Yearbook 2018
133
According to the central bank’s financial stability report, as at June 2017 thecountry’s banking sector saw good asset growth and banks were well-capitalised,but poor bank profitability and deteriorating asset quality threatened the sector.11
Total banking sector assets recorded in June 2017 were E18.3 billion (US$1.2billion), up from E15.8 billion (US$1.1 billion) in the previous year. Loans andadvances constitute approximately 58 percent of total banking assets while thetotal capital adequacy ratio in June 2017 was 23.5 percent.
According to the Central Bank of eSwatini, deteriorating asset quality combinedwith high inflation rates led to poor bank profitability in 2017. After reaching ahigh of 9.9 percent in March 2017, non-performing loans (NPLs) to gross loanssettled at 8.2 percent by midyear. However, this is still significantly higher thanprevious years – NPLs in June 2015 were recorded at 3.6 percent.12
Although still small, the Swaziland Stock Exchange (SSX) has grown in recent years.As at July 2018, total market capitilisation was E3.5 billion (US$246 million), upfrom E2.0 billion (US$140 million) in July 2013.13
OverviewThe Kingdom of Swaziland, or more recently known as the Kingdom of eSwatinifollowing a decision by King Mswati II to change the country’s name (which issubsequently being challenged),1 is a landlocked country in Southern Africa. In2017, the total recorded population was 1.3 million people, of which 76 percentlive in rural areas.2 The most recent estimates put urban population growth ratesat 2.5 percent, while overall growth rates were 1.8 percent in 2017.3 eSwatinihas a very young population with 80 percent falling under the age of 35,4 and anaverage life expectancy at birth of 57.8 years.
eSwatini’s economic growth, while still low, is growing. As at 2017, the estimatedGDP growth rate was 2.3 percent, up from 1.4 percent in 2016, while projectgrowth rates for 2018 are over 3 percent.5 Since 2015, GDP per capita hasremained approximately US$3 900.6
The improved economic growth in 2017 was driven by the recovery of theagricultural sector, following the severe drought in 2016, and positive growth inthe manufacturing sector. Combined, agricultural activities and manufacturingcontribute 43.2 percent to GDP. The economy is also expected to benefit in themedium term from the country’s readmission to the United States’ African GrowthOpportunity Act (AGOA) in 2017, which should boost exports to its tradingpartners.7 However, major economic risks are expected to continue to constrainthe country’s growth. These include the growing fiscal deficit which is beingfinanced by high levels of public debt (20.8 percent of GDP as at June 2018),8
constrained public spending as a result of the fiscal deficit, and external risks suchas lower-than-expected demand in the mining sector and South Africa’s pooreconomic outlook affecting Southern African Customs Union (SACU) revenues.9
Inflation has followed a downward trend since 2016 when it spiked to 7.8 percentas a result of the country’s drought and subsequent food price increases. As atJune 2018, inflation was recorded at 4.8 percent.
Access to financeeSwatini’s banking sector consists of four commercial banks, three of which aresubsidiaries of large South African banks, First National Bank, Nedbank andStandard Bank and one state-owned development bank – Swazi Bank. There isone building society - Swaziland Building Society (SBS) and three credit institutions- Letshego Financial Services, First Finance (Pty) Ltd and Blue Financial Services.10
eSwatiniKEY FIGURES
Main urban centres Mbabane
Exchange rate: 1 US$ = [a] 21 Sept 2018PPP Exchange rate (Local currency/PPP$) 1 Lilangeni = [b]Inflation 2016 [c] | Inflation 2017 [c] | Inflation 2018 [c]
15.26 Lilangeni5.108.00 | 6.30 | 5.40
Population 2017 [b] | Urban population size 2017 [b]Population growth rate 2017 [c] | Urbanisation rate 2017 [b]Percentage of the total population below National Poverty Line 2015 [d]Unemployment rate [e]
1 367 254 | 291 7311.78% | 1.89%
63.00%26.40%
GDP (Current US$) 2017 [b] | GDP growth rate annual 2017 [b]GDP per capita (Current US$) 2017 [b]GNI per capita (Current US$) 2017 [b]Gini co-efficient 2009 [d]HDI global ranking 2015 [f] | HDI country index score 2015 [f]
US$4 409 million | 2.00%US$3 334US$2 96051.50148 | 0.541
Is there a deeds registry? Number of residential properties that have a title deed Lending interest rate [b]Mortgage interest rate [g] | Mortgage term (years)DownpaymentMortgage book as a percentage of the GDPEstimated number of mortgages Price to Rent Ratio in City Centre | Outside City Centre Gross Rental Yield in City Centre | Outside City Centre Construction as a % of GDP [l]
n/an/a10.75%8.00% | n/an/an/an/an/a | n/an/a | n/an/a
What is the cost of standard 50kg bag of cement? [h]What is the price of the cheapest, newly built house by a formaldeveloper or contractor? (Local currency) [h]What is the price of the cheapest, newly built house by a formaldeveloper or contractor? (US$) [h]What is the size of this house (m2)? [h]What is the average rental price for this unit (US$)? [h]What is the minimum stand or plot size for residential property? [h]
US$6.00
763 000 Lilangeni
US$50 000160m2
US$180500m2
Ease of Doing Business Rank [i]Number of procedures to register property [i]Time to register property (days) [i]Cost to register property (as % of property value) [i]
112921 days7.10%
NB: Figures are for 2018 unless stated otherwise.
[a] Coinmill.com[b] World Bank World Development Indicators [c] IMF World Economic Outlook Database[d] Central Intelligence Agency (CIA) World Factbook[e] Trading Economics[f] UNDP Development Indicators[g] Statista.com[h] CAHF Yearbook 2017[i] World Bank Doing Business
Member organisations of the African Union for Housing Finance (AUHF):Swaziland Building Society

134
According to the latest available data (FinScope 2014), 64 percent of adults (age18 or older) are formally included in the financial sector. Of the financially included,54 percent have access to a bank account. The use of non-bank productsparticularly for remittance purposes is also high. In 2014, 45 percent of adultsreported either sending or receiving remittances monthly.14
The use of informal financial products and services, particularly for saving andcredit purposes, is relatively high in eSwatini. In 2014, 40 percent of adults reportedusing informal financial products. Of those, 68 percent said they use informalproducts for saving purposes, while 51 percent said it was for lending purposes.In the same period, only 12 percent of adults said that they borrowed from a bankor other financial institution in the 12 months prior to the survey, while 59 percentof adults said they did not borrow at all.15 Despite this, credit extension has beenincreasing in recent years.
Credit extension by banks increased from E9.3 billion (US$655 million) in March201516 to E14.5 billion (US$1.0 billion) in June 2018, of which approximately40.7 percent is extended to households.17 However, the Central Bank did notemarginally slower credit growth rates in early 2018. The bank’s funding isdominated by customer deposits (78 percent), with 14 percent from shareholderequity.
According to the Central Bank’s June 2017 financial stability reports, householdand personal loans accounted for the largest share of total bank loans at 42.6percent, of which almost 29 percent were unsecured loans. Loans to the realestate sector (both residential and commercial) accounted for 11.8 percent oftotal bank loans in the same period.18 Given the high proportion of the loans tothe household sector and reliance on customer deposits for funding, the bankingsector is highly vulnerable to any shocks that impact household’s willingness andability to repay debt.
eSwatini's performance on the World Bank’s Doing Business ‘getting credit’ indeximproved between 2017 and 2018 following the passing of the Consumer CreditAct 2016. The Act gives borrowers the rights to access data on their borrowinghistory stored at the credit bureau. Currently, credit bureau coverage in eSwatinisits at approximately 44 percent of adults. In terms of the ‘getting credit’ ranking,in 2018 it ranked 77th out of 190 countries, down from 82nd in 2017.19
eSwatini has a relatively small but functioning mortgage market. The countriesdeeds offices processes on average 200 or more mortgage bonds a quarter.20
The Swaziland Building Society (SBS) remains the leading provider of mortgagesin eSwatini, with the four big banks providing the balance. By March 2017, SBSreported total assets worth E2.2 billion (US$155 million), of which E1.4 billion(US$98 million) consisted of loans and advances to clients.21 SBS offers loans topurchase land and/or properties, as well as building loans, to individual andcommercial clients. SBS also offers a “Home Plan” product which is designed toassist employees to purchase and/or complete properties in rural or urban areaswith a loan guaranteed by their employer.22 SBS also offers a range of personalloans and other commercial banking services including savings and investmentproducts.
While historically the SBS provided credit at lower than average market interestrates, it now appears to charge in line with other commercial banks. As at March2017, SBS’s prime lending rate was 10.75 percent.23 SBS also charged a monthlyadministration fee on all mortgage loans of E66.5 (US$5).24
Commercial banks operating in eSwatini also offer a range of housing loans. FNBoffer 100 percent loan-to-value mortgages, while Nedbank and Standard Bankrequire a 10 percent up-front deposit. The maximum loan term of 25 years isoffered by Standard Bank, while monthly administration charges on mortgagesrange from E30 (US$2) in the case of FNB and a minimum charge of E83 (US$6)for Standard Bank.25
Further, Swazi Bank offers a range of housing finance products including a civilservants housing loan scheme offering “relaxed loan requirements,” subsidisedinterest rates and no up-front deposit requirements. Under this scheme, civilservants may borrow up to E400 000 (US$28 000) for urban housing and up toE200 000 (US$14 000) for rural housing.26 Swazi Bank appears to charge some
of the highest fees on their housing loans (this may exclude loans to civil servants)with monthly administration fees of E113 (US$8) and a loan initiation fee of 7.7percent of the loan amount.27
Reports also suggest that the Swaziland National Housing Board is consideringventuring into housing finance for customers of their projects in order to competewith the banks in the future.28
AffordabilityAccording to the African Development Bank (AFDB), eSwatini’s classification as amiddle-income country does not accurately reflect the widespread poverty andinequality in the country.29 In 2018, GDP per capita was recorded at US$3 934.However, in 2016, 42 percent of the population was reported to be living belowthe income poverty line of US$1.90 per person per day.30
Unemployment is a key driver of poverty in the country. In 2016, an estimated52 percent of young adults between the ages of 15 – 24 years old wereunemployed. Recent estimates put total unemployment at 26 percent.31 Theagriculture sector remains the largest employer in the country, contributing 69percent of total employment in 2017. However, there is significant gender disparityin the labour market. According to a recent report by the AFDB, only 45 percentof woman are employed in the formal sector, compared to 73 percent of men.32
These factors, among others, contribute to eSwatini’s poor ranking on the UNDPHuman Development Index at 144th out of 189 countries.33
Recent calls for minimum wages in some sectors of the economy reflect thefrustration of workers. The Amalgamated Trade Union of Swaziland (ATUSWA)has put pressure on the government to implement a basic minimum wage fortextile workers of E3 000 (US$211) per month. Textiles workers are reportedto currently earn between E1 300 and E1 500 (US$92 – US$106) per month,34
placing them far out of the reach of any decent formal housing.
The Swaziland National Housing Board (SNHB), a state-owned organisationmandated to provide affordable housing to eSwatini citizens, offers rental housingranging from E1 510 to E3 785 (US$106 – US$267) for a two-bedroom apartment in the capital city, Mbabane.35 One-bedroom flats in some of their newerdevelopments start at E2 455 (US$173) per month. Assuming an affordability of25 percent of income, an individual would have to earn at least E6 000 in orderto afford one of the cheapest rental options from SNHB.
More recently SNHB have branched into developing housing for higher incomesegments in an effort to bolster their revenues and cross-subsidise futureaffordable housing investments.36 A 361m2 plot in one of SNHB’s new and fully-serviced developments starts at E79 360 (US$5 593). Buyers can choose one offive house types to be built on their plot, however, the cost of the construction isnot clear.37
Seeff Properties Swaziland suggest that an entry-level property will cost a buyerbetween E800 000 to E1.2 million (US$56 000 – US$84 000), but the “middlemarket” can only afford around half of this amount, suggesting that there is asufficiently large affordability gap in the country.38
Housing supplyHousing was included as a priority item in His Majesty’s Government Programmeof Action 2014 – 2018 strategy document. During this period, the governmentpromised to deliver over 700 additional residential serviced plots across fourtownships, in addition to other urban development projects. However, urbandevelopment and informal settlement upgrading has been a priority of thegovernment since the 1990s.39
While the urban development plan has been successful in delivering serviced sitesto communities, the project has been less successful in recouping much-neededfunds from the sale of the plots to beneficiaries. Given the government’s landtenure system at the time (all land was owned by the King), plots were allocatedto beneficiaries on a 99-year leasehold agreement and households were expectedto pay an up-front commitment fee of E400 (US$28).40 Beneficiaries were givenfive years to pay off the remainder of the plot price. However, according to theMbabane 2018 Annual Report, only 20 percent of all plots developed in Phase 1
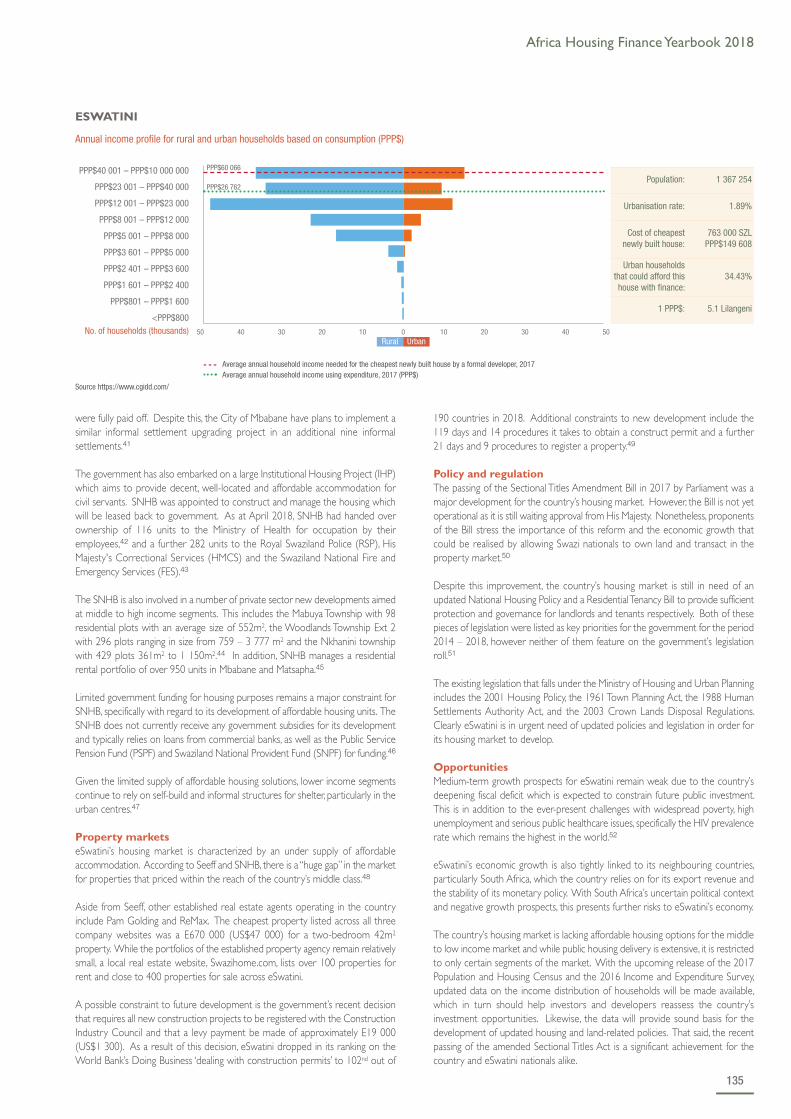
Africa Housing Finance Yearbook 2018
135
were fully paid off. Despite this, the City of Mbabane have plans to implement asimilar informal settlement upgrading project in an additional nine informalsettlements.41
The government has also embarked on a large Institutional Housing Project (IHP)which aims to provide decent, well-located and affordable accommodation forcivil servants. SNHB was appointed to construct and manage the housing whichwill be leased back to government. As at April 2018, SNHB had handed overownership of 116 units to the Ministry of Health for occupation by theiremployees,42 and a further 282 units to the Royal Swaziland Police (RSP), HisMajesty's Correctional Services (HMCS) and the Swaziland National Fire andEmergency Services (FES).43
The SNHB is also involved in a number of private sector new developments aimedat middle to high income segments. This includes the Mabuya Township with 98residential plots with an average size of 552m2, the Woodlands Township Ext 2with 296 plots ranging in size from 759 – 3 777 m2 and the Nkhanini townshipwith 429 plots 361m2 to 1 150m2.44 In addition, SNHB manages a residentialrental portfolio of over 950 units in Mbabane and Matsapha.45
Limited government funding for housing purposes remains a major constraint forSNHB, specifically with regard to its development of affordable housing units. TheSNHB does not currently receive any government subsidies for its developmentand typically relies on loans from commercial banks, as well as the Public ServicePension Fund (PSPF) and Swaziland National Provident Fund (SNPF) for funding.46
Given the limited supply of affordable housing solutions, lower income segmentscontinue to rely on self-build and informal structures for shelter, particularly in theurban centres.47
Property marketseSwatini’s housing market is characterized by an under supply of affordableaccommodation. According to Seeff and SNHB, there is a “huge gap” in the marketfor properties that priced within the reach of the country’s middle class.48
Aside from Seeff, other established real estate agents operating in the countryinclude Pam Golding and ReMax. The cheapest property listed across all threecompany websites was a E670 000 (US$47 000) for a two-bedroom 42m2
property. While the portfolios of the established property agency remain relativelysmall, a local real estate website, Swazihome.com, lists over 100 properties forrent and close to 400 properties for sale across eSwatini.
A possible constraint to future development is the government’s recent decisionthat requires all new construction projects to be registered with the ConstructionIndustry Council and that a levy payment be made of approximately E19 000(US$1 300). As a result of this decision, eSwatini dropped in its ranking on theWorld Bank’s Doing Business ‘dealing with construction permits’ to 102nd out of
190 countries in 2018. Additional constraints to new development include the119 days and 14 procedures it takes to obtain a construct permit and a further21 days and 9 procedures to register a property.49
Policy and regulationThe passing of the Sectional Titles Amendment Bill in 2017 by Parliament was amajor development for the country’s housing market. However, the Bill is not yetoperational as it is still waiting approval from His Majesty. Nonetheless, proponentsof the Bill stress the importance of this reform and the economic growth thatcould be realised by allowing Swazi nationals to own land and transact in theproperty market.50
Despite this improvement, the country’s housing market is still in need of anupdated National Housing Policy and a Residential Tenancy Bill to provide sufficientprotection and governance for landlords and tenants respectively. Both of thesepieces of legislation were listed as key priorities for the government for the period2014 – 2018, however neither of them feature on the government’s legislationroll.51
The existing legislation that falls under the Ministry of Housing and Urban Planningincludes the 2001 Housing Policy, the 1961 Town Planning Act, the 1988 HumanSettlements Authority Act, and the 2003 Crown Lands Disposal Regulations.Clearly eSwatini is in urgent need of updated policies and legislation in order forits housing market to develop.
OpportunitiesMedium-term growth prospects for eSwatini remain weak due to the country’sdeepening fiscal deficit which is expected to constrain future public investment.This is in addition to the ever-present challenges with widespread poverty, highunemployment and serious public healthcare issues, specifically the HIV prevalencerate which remains the highest in the world.52
eSwatini’s economic growth is also tightly linked to its neighbouring countries,particularly South Africa, which the country relies on for its export revenue andthe stability of its monetary policy. With South Africa’s uncertain political contextand negative growth prospects, this presents further risks to eSwatini’s economy.
The country’s housing market is lacking affordable housing options for the middleto low income market and while public housing delivery is extensive, it is restrictedto only certain segments of the market. With the upcoming release of the 2017Population and Housing Census and the 2016 Income and Expenditure Survey,updated data on the income distribution of households will be made available,which in turn should help investors and developers reassess the country’sinvestment opportunities. Likewise, the data will provide sound basis for thedevelopment of updated housing and land-related policies. That said, the recentpassing of the amended Sectional Titles Act is a significant achievement for thecountry and eSwatini nationals alike.
Source https://www.cgidd.com/
PPP$40 001 – PPP$10 000 000
PPP$23 001 – PPP$40 000
PPP$12 001 – PPP$23 000
PPP$8 001 – PPP$12 000
PPP$5 001 – PPP$8 000
PPP$3 601 – PPP$5 000
PPP$2 401 – PPP$3 600
PPP$1 601 – PPP$2 400
PPP$801 – PPP$1 600
<PPP$800
- - - Average annual household income needed for the cheapest newly built house by a formal developer, 2017 Average annual household income using expenditure, 2017 (PPP$)
ESWATINI
Annual income profile for rural and urban households based on consumption (PPP$)
No. of households (thousands)
PPP$26 762
PPP$60 066
Rural Urban50 40 30 20 10 0 10 20 30 40 50
Population: 1 367 254
Urbanisation rate: 1.89%
Cost of cheapestnewly built house:
763 000 SZLPPP$149 608
Urban householdsthat could afford thishouse with finance:
34.43%
1 PPP$: 5.1 Lilangeni

136
Websites http://www.centralbank.org.sz/http://databank.worldbank.org/data/source/world-development-indicators/http://www.snhb.co.sz/http://www.gov.sz/
1 Mabuza, N. 2018. Swaziland’s name change challenged in court. 28 August 2018. https://mg.co.za/article/2018-08-28-swazilands-name-change-challenged-in-court (Accessed 29 September 2018).
2 The World Bank (2018). World Development Indicators. http://databank.worldbank.org/data/reports.aspx?source=world-development-indicators (Accessed 29 September 2018).
3 Ibid. 4 AFDB (2018). 2018 African Economic Outlook. Swaziland.
https://www.afdb.org/fileadmin/uploads/afdb/Documents/Generic-Documents/country_notes/Swaziland_country_note.pdf (Accessed 29 September 2018). Pg. 8.
5 Ibid. Pg. 2.6 Trading Economics (2018). Swaziland Per Capita GDP. https://tradingeconomics.com/swaziland/gdp-per-capita
(Accesses 29 September 2018). 7 AFDB (2018). Pgs. 2 – 3. 8 Central Bank of Eswatini (2018). Quarterly Review June 2018.
http://www.centralbank.org.sz/monetarypolicy/quarterly/June-2018-Quartely-Review.pdf. Pg. 26. 9 AFDB (2018). Pg. 3.10 The Central Bank of eSwatini (2018).
http://www.centralbank.org.sz/financialregulation/banksupervision/index.php. (Accessed 29 September 2018). 11 Central Bank of Swaziland (2017). Financial Stability Report. June 2017. Issue No. 1.
http://www.centralbank.org.sz/financialstability/FinancialStabilityReportIssue1.pdf (Accessed 29 September 2018). 12 Ibid. Pg. 23. 13 SSX (2018). Market capitalisation as at 31 July 2018. http://www.ssx.org.sz/index.php/2015-05-11-14-00-
53/2015-05-11-14-10-01?start=20 (Accessed 30 September 2018). 14 Finmark Trust (2014). FinScope Consumer Survey 2014. http://www.finmark.org.za/wp-content/uploads/
2016/01/Brich_FsSwaziland_2014.pdf (Accessed 30 September 2018).15 Ibid. 16 The Central Bank of Swaziland (2017). Pg. 22. 17 The Central Bank of Swaziland (2018). Pg. 20. 18 The Central Bank of Swaziland (2017). Pg. 23 – 24. 19 The World Bank (2018). Ease of Doing Business in Swaziland.
http://www.doingbusiness.org/en/data/exploreeconomies/swaziland#DB_gc (Accessed 30 September 2018). 20 The Government of Swaziland (2018). Deeds Registry Office. Performance for Quarter ending 30th June
2018. http://www.gov.sz/images/DEEDS_REGISTRY_-_Performance_report_April_-_June_2018.pdf(Accessed 30 September 2018).
21 Swaziland Building Society (2017). Annual Report for year end 31 March 2017.https://www.sbs.co.sz/images/22.pdf (Accessed 30 September 2018).
22 Swaziland Building Society (2018). Property Finance. https://www.sbs.co.sz/index.php/homeloans23 https://www.sbs.co.sz/images/22.pdf (Accessed 30 September 2018). 24 Ibid. 25 Analysis of banks’ websites.26 Swazi Bank (2018). Housing Loans. https://www.swazibank.co.sz/mfmbs/ib/housingloans.jsp (Accessed
30 September 2018). 27 Swazi Bank (2018). Fees and Charges. https://www.swazibank.co.sz/mfmbs/ib/swazifeesandcharges.jsp
(Accessed 30 September 2018). 28 Eswatini Property Review (2018). Vol 1. Issue 1. Apr – Jun 2018.
http://www.barcodecreative.net/assets/files/Eswatini%20Property%20Review%20-Issue%201%20(Digital%20Copy%20-%2036pgs%20-%20R).pdf (Accessed 30 September 2018). Pg. 16.
29 AFDB (2018). 2018 African Economic Outlook – Swaziland.https://www.afdb.org/fileadmin/uploads/afdb/Documents/Generic-Documents/country_notes/Swaziland_country_note.pdf (Accessed 30 September 2018).
30 UNDP (2016). Human Development Report 2016.http://hdr.undp.org/sites/default/files/2016_human_development_report.pdf (Accessed 30 September 2018).
31 UNDP (2018). Unemployment, total (% of labour force). http://hdr.undp.org/en/indicators/140606#a(Accessed 30 September 2018).
32 AFDB (2018). Pg. 9. 33 UNDP (2018). Human Development Indicators. http://hdr.undp.org/en/countries/profiles/SWZ (Accessed
30 September 2018). 34 Zwane, S. (2018). Is 2018 the year for textile workers? 25 January 2018.
http://www.times.co.sz/news/116789-is-2018-the-year-for-textile-workers.html (Accessed 30 September2018).
35 Swaziland National Housing Board (2018). Rental Housing Estates.http://www.snhb.co.sz/index.php?option=com_content&view=article&id=202&Itemid=128 (Accessed 30September 2018).
36 Eswatini Property Review (2018). Pg. 15. 37 SNHB (2018). Sales portfolio. http://www.snhb.co.sz/index.php?option=com_content
&view=article&id=180&Itemid=122 (Accessed 30 September 2018).38 Eswatini Property Review (2018). Pg. 17. 39 Banes, C. (2000). How Swaziland is Upgrading its Slums. http://documents.worldbank.org/curated/en/
266041468123582514/pdf/329840ENGLISH0Civis201Jan020011.pdf (Accessed 30 September 2018). 40 The Observer (2017). Thousands failing to pay for plots in Mbabane. 14 January 2017.
https://www.pressreader.com/swaziland/observer-on-saturday/20170114/281749859048493 (Accessed30 September 2018).
41 The City of Mbabane (2018). Annual Report 2018. https://www.mbabane.org.sz/annual-report-2018/ Pg. 16. 42 SNHB (2018). The SNHB messenger. Volume 83. http://www.snhb.co.sz/images/Volume%2083-Umgijimi-
ilovepdf-compressed.pdf (Accessed 30 September 2018). 43 SNHB (2018). Institutional Housing Project Progress. http://www.snhb.co.sz/index.php?option=com_
content&view=article&id=217&Itemid=66 (Accessed 30 September 2018). 44 SNHB (2018). Sales portfolio. 45 SNHB (2018). Rental Housing Estates. 46 Eswatini Property Review (2018). Pg. 15. 47 CAHF (2017). 2017 Yearbook. Housing Finance in Africa. http://housingfinanceafrica.org/app/uploads/
2017_CAHF_YEARBOOK_14.10-copy.compressed.pdf (Accessed 30 September 2018). 48 Eswatini Property Review (2018). Pg. 17. 49 The World Bank (2018). 50 Eswatini Property Review (2018). 51 The Government of Swaziland (2018). Status of proposed legislation.
http://www.gov.sz/index.php/component/content/article/141-test/2002-bills?Itemid=799 (Accessed30 September 2018).
52 AFDB (2018). Pgs. 3 – 8.

Africa Housing Finance Yearbook 2018
137
located in Addis Ababa. The share of private banks in the total branch networkrose to 66.6 percent from 61.8 percent last year. Following a significant capitalinjection by CBE, the total capital of the banking industry increased by 81.1 percentand reached ETB 78.0 billion (US$3.36 billion) by the end of June 2017.2
The share of private banks in deposit mobilisation increased to 33.6 percent from32.2 percent last year due to the opening of new branches. CBE alone mobilised66.1 percent of the total deposits. Consequently, total outstanding borrowing ofthe banking system stood at ETB 32.9 billion (US$1.20 billion), slightly higher thanETB 31.2 billion (US$1.14 billion) a year ago. Of the total borrowing, domesticsources accounted for 89.1 percent and foreign sources the remaining balance.Commercial banks and the Development Bank of Ethiopia disbursed ETB109 billion (US$4.69 billion) in fresh loans, which was 23.8 percent higher than ayear ago. Of the total new loans, about 55.6 percent was provided by privatebanks and 44.4 percent by the two public banks.
Total outstanding credit of the banking system, including to the central government,increased by 30.4 percent and reached ETB 365.6 billion (US$13.4 billion) at theend of June 2017. Excluding central government, credit to industry accounted for40.2 percent followed by international trade (16.2 percent), domestic trade(13 percent), housing and construction (11.8 percent) and agriculture (6.2 percent).The share of private sector in outstanding credit was ETB 231.2 billion (US$8.5billion) (or 63.2 percent), reflecting 29.1 percent year-on-year growth.
OverviewAs the second largest country in Africa, Ethiopia has a population of 105 million,with a GDP growth rate of 8.2 percent driven by public investments in agricultureand infrastructure. The population density in Ethiopia is 108 per square kilometreand 20.6 percent of the population is urban. The poverty rate has fallen from44 percent in 2000 to 23.5 percent in 2015/16. The current account deficitdeclined in 2016/17 to 8.2 percent of GDP from 9.1 percent the previous year,reflecting lower drought-related imports and lower public sector capital goodsimports. However, export revenues were mainly unchanged despite significantvolume growth, as global agricultural commodity prices remained low. Foreigndirect investment growth was 27.6 percent due to investments in the newmanufacturing industrial parks and privatisation inflows. International reserves atthe end of 2016/17 stood at US$3.2 billion.
More than 70 percent of Ethiopia’s population is still employed in the agriculturalsector, but services have surpassed agriculture as the principal contributor to GDP.According to the UN’s Human Development Report (2017) the country has avery low human development ranking of 174 out of 190 countries and HumanDevelopment Index rating of 0.448.
Since 2004/05, the government has focused on developing housing, upgradingslums, providing infrastructure and promoting small urban enterprises. The Growthand Transformation Plan for 2015-2019 continues to target infrastructuraldevelopment with the view of the country being classified as “middle income” by2025,1 while the construction sector plays an immense role in Ethiopia's economicgrowth. Real estate and other construction contributed 12.5 percent to GDP,according to information obtained from the Ministry of Construction.
Access to finance Banks, insurance companies and microfinance institutions are the major financialinstitutions operating in Ethiopia. The number of banks stood at 18, insurancecompanies at 17 and microfinance institutions (MFIs) at 35 at the end of June2017. Of the 18 banks, 16 are private and two are state-owned. Based on numberof branches and capital accumulation, the five major banks in the country areAwash Bank, Dashen Bank, Abyssinia Bank, Wegagen Bank and United Bank.
The Ethiopian financial sector has remained well capitalised and profitable. TheCommercial Bank of Ethiopia (CBE) opened 956 new branches in 2016/17, raisingthe total number of branches to 4 257. About 33 percent of bank branches were
EthiopiaKEY FIGURES
Main urban centres Addis Ababa
Exchange rate: 1 US$ = [a] 23 Aug 2018PPP Exchange rate (Local currency/PPP$) 1 Ethiopian birr = [b]Inflation 2016 [c] | Inflation 2017 [c] | Inflation 2018 [c]
27.24 Ethiopian birr9.17.27 | 9.86 | 11.22
Population [d] | Urban population size [d] Population growth rate [c] | Urbanisation rate [d]Percentage of the total population below National Poverty LineUnemployment rate [b]
105 350 020 | 21 491 4042.46% | 4.64%29.60%25.20%
GDP (Current US$) 2017 [b] | GDP growth rate annual 2017 [b]GDP per capita (Current US$) 2017 [b]GNI per capita (Current US$) 2017 [b]Gini co-efficient [d]HDI global ranking 2015 [b] | HDI country index score 2015 [e]
US$80 560 million | 10.25%US$767US$740n/a174 | 0.448
Is there a deeds registry? Number of residential properties that have a title deed Lending interest rate [a] Mortgage interest rate [a] | Mortgage term (years) [a]Downpayment [a]Mortgage book as a percentage of the GDPEstimated number of mortgages Price to Rent Ratio in City Centre [e] | Outside City Centre [e]Gross Rental Yield in City Centre [e] | Outside City Centre [e]Construction as a % of GDP [l]
Yesn/a18.00%16.00% | 1510.00%n/an/a7.65 | 9.199.85% | 10.88%12.20%
What is the cost of standard 50kg bag of cement? [f] What is the price of the cheapest, newly built house by a formaldeveloper or contractor? (Local currency) [g]What is the price of the cheapest, newly built house by a formaldeveloper or contractor? (US$) [g] What is the size of this house (m2)? [g] What is the average rental price for this unit (US$)? [g] What is the minimum stand or plot size for residential property? [g]
US$8.82
1 400 000 Ethiopian birr
US$51 39594m2
US$25746m2
Ease of Doing Business Rank [h]Number of procedures to register property [h]Time to register property (days) [h]Cost to register property (as % of property value) [h]
161n/a52 days6.10%
NB: Figures are for 2018 unless stated otherwise.
[a] National Bank of Ethiopia (NBE)[b] World Bank World Development Indicators[c] Statista.com[d] iResearch.worldbank.org[e] Numbeo[f] Constructionmaterial.com[g] Ezega.com[h] World Bank Doing Business

138
MFIs generally offer services to informally self-employed poor people and alsoformal employed low income households. The number of MFIs remained at 35 atthe end of June 2017, while their total capital and total assets increased significantlyby 20.8 percent and 35.1 percent, to reach ETB 10.7 billion (US$392.8 million)and ETB 49.6 billion (US$1.8 billion), respectively. Their deposit mobilisation andcredit allocation also expanded remarkably. Compared to last year, their depositssurged by 42.8 percent and reached ETB 26.3 billion (US$965.4 million) whiletheir outstanding credit went up by 28.5 percent to ETB 32.4 billion (US$1.19billion). The Amhara, Dedebit, Oromiya, Omo and Addis Credit and Savingsinstitutions were the major MFIs, accounting for 83.7 percent of the total capital,93.1 percent of the savings, 88.6 percent of the credit and 89.9 percent of thetotal assets of the MFIs sector. Most of the MFIs operating in the city have beenin business for almost 10 years, indicating relatively adequate experience withfinancial services, including diversification of loan portfolios to include housingmicrofinance loans. An Addis Credit and Savings institution is one of the majorMFIs. After realising the potential lucrative market in the country, the MFIdiversified its loan portfolio in 2006 to include housing microfinance loans. TheMFI offered small loans suitable for significant housing improvement, the additionof a new room, and for new house construction.
Recently, government banks like the Commercial Bank and the Development Bankhave joined the mortgage market but only in the commercial construction sector.The same is true of the emerging private bank sector. There is limited involvementin residential mortgages by public and private banks because of the perceived highrisk and shortage of experience. In recent years, MFIs have become increasinglyimportant players, as they are viewed as effective mechanisms for povertyreduction. The loan policies of MFIs indicate that preference should be given topoor rural farmers and microeconomic activities of rural and urban communitieswith small cash requirements. MFIs therefore offer a potential source of financefor poor and low income earners. The World Bank’s 2018 Doing Business Reportshowed that almost 94 739 individuals and 7 656 firms were recorded on thepublic credit registry, but representing just 0.2 percent of the population.3 As aresult, Ethiopia continues to underperform with respect to getting credit and isranked 173rd out of 190 countries. A major player in the mortgage market is CBEwhich has grown since the introduction of the Integrated Housing DevelopmentProgramme’s (IHDP) current project in the capital of Addis Ababa, in which itplays an important role in the provision of mortgage finance. Mortgage rates forthe 40/60 development scheme are estimated at 14 percent over a 10-year periodwith a 40 percent downpayment. The 40/60 housing scheme is designed for themiddle income group that can afford to save 40 percent and above of the moneyneeded to build the house and get the remaining balance as a credit from theCBE.
Affordability In Ethiopia a major challenge is providing affordable housing for low incomeearners with an annual per capita income of less than US$1 025 and with limitedaccess to housing finance. Following the market-led adjustments implementedpost 1991, subsidised interest rates were removed, which significantly increasedlending rates. This increased from 4.5 percent for co-operatives and 7.5 percentfor individuals to 18 percent for both, severely reducing the opportunity for lowincome households to secure a home loan. A key challenge to housing affordabilityis the absence of a diversified and flexible housing finance sector.
Traditional construction techniques involve the use of bricks, blocks and cement,which are expensive, inefficient, and time-consuming. There are few factoriesproducing construction materials, and locally available inputs are in short supply.
The government’s IHDP has compounded the housing affordability issues for lowerincome residents. In June 2016, the CBE and the Ministry of Urban Planning andHousing revealed that the condos in the new 40/60 scheme were an additionalETB 4 919 (US$180.5) per square meter from their original price. This priceincrease was due to rising construction and labour costs, which have forced theMinistry of Urban Development, Housing and Construction and Addis AbabaSavings & Houses Development Enterprise to re-evaluate their prices, taking intoaccount the current market, land, water, electricity and building design prices. Thecost of two- , three- and four-bedroom condos currently valued at ETB 614 693(US$22 566), ETB 636 974 (US$23 384) and ETB 829 690 (US$30 459)respectively will increase accordingly by the square meter of the apartments. Theapartments are 124.97m2, 129.5m2 or 168.68m2 in size. The increased costs of
construction, and thus the downpayments as well as mortgages, have placedadditional financial burdens on the poor. As a result, many beneficiaries from lowincome groups have rented out their units to more affluent citizens. In turn, theunit owners tend to stay in their original substandard dwellings or have returnedto another precarious housing type.
Housing supply Ethiopia’s Federal Housing Corporation (FHC) has announced plans to build 1 673homes in Addis Ababa at an estimated cost of around ETB 1.2 billion(US$44 052 860). According to the FHC information, about half of the housingis to be offered to state officials, and the remainder are for rental houses toemployees of businesses.
The existing housing stock, particularly in Addis Ababa, is generally of poor quality,with many settlements congested and unplanned. Using the UN-Habitat slumdefinition, 80 percent of Addis Ababa is a slum with 70 percent of this comprisinggovernment-owned rental housing. Only 30 percent of the total housing stock isin fair condition, while the remaining 70 percent is in need of total replacementor significant upgrading. According to estimates by the Ministry of Works andUrban Development, the housing deficit in Addis Ababa alone is about 300 000units. The housing deficit is not just measured by the large number of units thatare required today but also in the quality of the housing stock and the extremelysmall sizes of most available dwelling units.
Access Capital research details four categories of new residential developmentsin Ethiopia: (a) government-initiated condominium buildings; (b) residentialneighbourhoods initiated by developers; (c) owner-built housing dwellings; and (d)new home activity driven by housing cooperatives. In addition, there are twoother major categories of housing units in Addis Ababa: kebele-rental housing (veryold stock), mainly for those on low incomes, and informal settlements.4
1. Government-built condominiumsRecently, the government implemented a new housing project in Addis Ababawhich is divided into four different groups based on payment modalities: 10/90,20/80, 40/60 and housing association. The payment modality for the last onenecessitates 100 percent direct payments, while the others incorporate 10, 20and 40 percent down payment mixed with a long-term mortgage plan.
The IHDP was implemented in Addis Ababa and other cities. It was planned intwo phases. In phase one 947 376 people registered for housing and thegovernment built 270 146 houses, however of the available stock only 182 000houses were allocated.
There are still 88 146 condominium units under construction at 18 sites. The newcondominium houses that are being built will be 18 storey buildings. Accordingto the latest figures available in the 40/60 housing programme, 154 000 of the160 000 people registered under the scheme are saving money each monthtoward acquiring a home. Out of these, 17 600 have paid the full amount andmore than 29 000 have paid 40 percent of the total cost. Those who have paidin full will have priority when the condominium units are handed over to thehomeowners. The cost of this housing scheme per square meter is ETB 4 918(US$180.5).5
2. Private sector real estate developersThe National Urban Development Policy emphasises the role the private realestate development sector can play in providing housing for the high income groupunder the framework of free market principles. The private real estate housingsector is concentrated in Addis Ababa and its surrounding towns (Legetafo, Burayu,Sululta and Sebeta), and other major urban centres such as Dire Dawa, Adama,Bahir Dar, Hawassa and Mekelle.
According to data from the Ethiopian Investment Commission, close to 117companies took an investment licence to invest in 56 different projects, and 99percent of them are owned by Ethiopians or in joint ventures with foreigninvestors. Some were still fully owned by foreigners. Out of the existing 56 realestate projects to date, 43 are located in Addis Ababa.
The real estate companies focus exclusively on building houses for the upper andmiddle class. The price of houses is different based according to location. The

Africa Housing Finance Yearbook 2018
139
average price in square meters is between ETB 15 000 (US$550) up toETB 60 000 (US$2 202) based on the location.
The private real estate sector has managed to construct a considerable numberof houses but significantly below the expected output.6
In Addis Ababa, between 2005 and 2017, housing supply by real estate developerswas only 4.8 percent, compared to 58.1 percent by the government and 37.1percent by individuals (cooperative and lease).
3. Owner-built housing constructionSelf-built housing was the most common type of housing delivery approach beforethe introduction of the IHDP. While limited now, this building approach is stillactive in older residential neighbourhoods. “Costs for owner-built constructionare generally higher and this segment of the market tends to include the full rangeof housing units from modest homes constructed over extended periods to largeand luxurious homes often built by razing or replacing older properties.”7
4. Housing cooperativesThis is the primary mode of housing construction in Addis, constituting over halfof the city’s total formal sector housing stock. They are recognised as legal entitiesby the government, and allocated land on which to design and construct theirdevelopments. The city administration up to the end of 2017 has registered morethan 500 housing cooperatives. Between 14 and 24 members are allowed in ahousing cooperative. Many cooperative members are middle income (per capitalincome between US$1 026 and US$4 035), based on employer associations suchas Ethiopian Airlines or other state-owned companies.
Property marketsAccording to the World Bank’s 2018 Doing Business Report, Ethiopia ranks 161out of 190 economies on the ease of dealing with construction permits. Regardingregistering property, seven procedures are required; it takes 52 days and costs6.1 percent of the property value. As such, Ethiopia stands at 133 in the rankingof 190 economies on the ease of registering property.8
Ethiopia has a federal system of government constituted by nine regional statesand two city administrations, with a dual land tenure system (for urban and ruralland). Land in Ethiopia is the property of the state and can generally be acquiredonly on the basis of a lease. Private ownership of land is prohibited. Onceacquired through a lease, land cannot be mortgaged or sold, but the lease valueof the land (the down payment and annuity paid) and the fixed assets on that landmay be mortgaged or transferred to third parties.
Land administration is delegated under the constitution to the regions (for ruralland) and to city governments and municipalities (for urban land). Accordingly,regional governments and municipal administrations are authorised to lease ruraland urban land under their respective laws. In the city suburbs, the government
reserves what it calls a land bank for investors, which, having compensated thelandholders, it provides to investors engaging in real estate development. Aninvestor who acquires land under a lease has to enter into a land lease agreementwith the government and obtain a lease-holding certificate issued in its name. Theminimum lease downpayment is 10 percent of the total lease payment. Theremaining balance of the lease amount is to be paid in equal annual installmentsover the payment term. Interest is to be paid on the remaining balance, in linewith the prevailing interest rate on loans offered by the CBE.
The lease contracts normally include provisions to regulate when constructionwill start, how long it will take to completion, the payment schedule, grace period,rights and obligations of the parties, as well as other relevant details. Thedownpayment of the lease price must be paid prior to signing the contract. Theduration of an urban land lease for real estate development is 60 years for AddisAbaba and 70 years for other cities and towns in Ethiopia.9
The new lease prices range from ETB 1 686 (US$61.9) per square meterdesignated as central market place to ETB 191 (US$7) that are grouped asexpansion place in the city. The rate for central market district zone will beapplicable in most areas of the city that are considered to be main business areasthat entertain high levels of business activity. The expansion zone is classified intofour levels and covers areas that are considered to be in the outskirts of the city,where the city is expected to expand in the future.
Policy and regulation The slums and housing problems in Ethiopia are the result of accumulated deficitsof policies and practices over several years.
The Federal Ministry of Works and Urban Development is the lead agencyentrusted with the responsibility of providing housing. In recent years urbanisationhas resulted in unprecedented levels of growth with the development andexpansion of Addis Ababa and other cities. The urban development policy andstrategies have the objectives of promoting the role of urban areas in the overallnational development. The policy and strategy is further articulated in the IHDP.This has provision for affordable and low cost housing, empowering urbanresidents through property ownership, job creation, income generation as well asimproving the quality of the urban environmental through infrastructuraldevelopment and the urban renewal programme. The IHDP is subsidised by thegovernment to support low income earners.
A number of policies govern the housing sector, including the following:
n Urban Development Policy (2005): Formulated by the Council of Ministersof the Federal Democratic Republic of Ethiopia to link together the small-scale efforts made by regional governments and cities since 2000;
n The Federal Rural Land Administration and Land Use ProclamationNo.456/2005: Enacted for the purpose of ensuring tenure security,
Source https://www.cgidd.com/
PPP$40 001 – PPP$10 000 000
PPP$23 001 – PPP$40 000
PPP$12 001 – PPP$23 000
PPP$8 001 – PPP$12 000
PPP$5 001 – PPP$8 000
PPP$3 601 – PPP$5 000
PPP$2 401 – PPP$3 600
PPP$1 601 – PPP$2 400
PPP$801 – PPP$1 600
<PPP$800
- - - Average annual household income needed for the cheapest newly built house by a formal developer, 2017 Average annual household income using expenditure, 2017 (PPP$)
ETHIOPIA
Annual income profile for rural and urban households based on consumption (PPP$)
No. of households (thousands)
PPP$7 596
PPP$97 612
Rural Urban5 000 4 000 3 000 2 000 1 000 0 1 000 2 000 3 000 4 000 5 000
Population: 105 350 020
Urbanisation rate: 4.64%
Cost of cheapestnewly built house:
1 400 000 ETBPPP$153 846
Urban householdsthat could afford thishouse with finance:
0.55%
1 PPP$: 9.1 Ethiopian birr

140
strengthening property rights of farmers, sustainably conserving anddeveloping natural resources, establishing a land database, and establishing anefficient land administration in the country;
n Expropriation of Landholdings for Public Purposes and Payment ofCompensation and Council of Ministers Regulation No.135/2007: TheFederal Constitution vests in the government the power to expropriateprivate property in the public interest, provided it pays compensation priorto acquisition and in an amount commensurate with the value of the seizedproperty;
n Ethiopian Building Proclamation 624/2009 formal sector: A legal documentoutlining the building regulations and requirements, for use by local authoritiesto ensure building standards are maintained in their jurisdiction. Parts ofEthiopia are located in an earthquake zone and a code exists to ensurebuildings resist maximum predicted earthquake loads. The codes are onlyused and enforced in buildings developed in the formal sector;
n Regulation No.15/2004: Outlines the establishment of the Addis Ababa CityGovernment Housing Development Project office and outlines its duties andresponsibilities;
n Regulation No.12/2004: Outlines the condominium regulations for AddisAbaba city, regulating further details to Proclamation No.370/2003;
n Proclamation 624/2009 Ethiopian Building proclamation: Outlines theminimum national standard for the construction or modification of buildingsor alteration of their use in order to ensure public health and safety.
OpportunitiesThe Ethiopian government has been addressing the public’s ever-increasingdemand for housing by employing various condominium housing schemes thathave mainly benefited low and middle income citizens. Through the constructionof 100 000 cost-effective houses with necessary facilities and infrastructure in thecapital, the government has made a significant contribution towards benefiting theurban poor, women and civil servants. In addition to the government’sinvolvement, private real estate developers have been playing a growing role inthe sector. Capitalising on the favourable policy climate, real estate companieshave made significant a contribution in satisfying the demand of middle and highincome citizens for apartments and other high-end houses.10 Furthermore, theEthiopian government has paved the way for European and Chinese entrepreneursto become involved in the country’s infrastructural development and industrialgrowth. Despite the risks of bringing in foreign companies, the Ethiopians are quitegrateful for the assistance and business potential offered by global players.
Additional sourcesAddisbiz.com Ethiopian Business Portal (2017). Current Status of 40/60Condominiums in Addis Ababa, Ethiopia. https://addisbiz.com/tag/40-60-condominium/ (Accessed 5 Sept 2018).
African Economic Outlook (2018). Ethiopia 2017. AfDB, OECF, UNDP.
African Union for Housing Finance (2015). Financing Housing in Africa. Issue41: March 2015.
CSA (2016). Federal Democratic Republic of Ethiopia Demographic andHealth Survey, Addis Ababa, Ethiopia. October 2016.
Delz, S. (2014). Ethiopia’s Low Cost Housing Program: How Concepts ofIndividual Home-Ownership and Housing Blocks Still Walk Abroad. ETHZurich.
The Economist Intelligence Unit (EIU) (2016). Country Report: Ethiopia.(August 2015).
Everline Auma (2014). The International Journal of Business & Management(ISSN 2321 – 8916), Vol 2 Issue 10.
Ethiopian Civil Service University. Land Administration Law.www.ecsu.edu.et/content/land-administration-law (Accessed 5 Sept 2018).
Federal Democratic Republic of Ethiopia (2010). Ministry of Works and UrbanDevelopment. Housing Development Programme: 2006-2010 PlanImplementation Report.
The Global Economy.com. Ethiopia Unemployment Rates.www.theglobaleconomy.com/Ethiopia/Unemployment_rate/ (Accessed 5 Sept2018).
International Monetary Fund (IMF). The Federal Republic of Ethiopia.http://www.imf.org/en/Countries/ETH (Accessed 5 Sept 2018).
IMF (2017). The Federal Democratic Republic of Ethiopia: Selected Issues. IMFCountry Report No. 15/326 (4 September 2015).
Ministry of Urban Development, Housing and Construction (2015). HousingDevelopment: The Ethiopian Experience. Study on Africa’s Market DynamicsRegional Workshop. Addis Ababa (17-19 February 2015).
National Bank of Ethiopia (NBEAR) (2017). Annual Report for 2015/16.http://www.NBE.gov.org.et (Accessed 5 Sept 2018).
NBEAR (2018). Annual Report for 2016/17. http://www.NBE.gov.org.et(Accessed 5 Sept 2018).
OECD.org. Ethiopia. http://www.oecd.org/countries/ethiopia/ (Accessed5 Sept 2018).
TAK-IRDI (2016). Assessment of the Role the Private Sector Plays in GTP II.TAK-Innovative Research and Development Institution, Addis Ababa, Ethiopia.
Tesfalem.T (2017). Factors Affecting Housing Delivery of Condominium Projectin Addis Ababa: The Case of Gulele Housing Development Project, Addis Ababa,Ethiopia.
Trading Economics (2018). Ethiopia Exports.tradingeconomics.com/ethiopia/exports (Accessed 5 Sept 2018).
USAID/Ethiopia (2016). Opening Doors: A Performance Evaluation of theDevelopment Credit Authority (DCA) in Ethiopia, Addis Ababa.
The World Bank – IBRD IDA. The World Bank in Ethiopia.http://www.worldbank.org/en/country/ethiopia (Accessed 5 Sept 2018).
Websiteshttp://www.acsi.org.ethttp://www.addisbiz.comhttp://www.addisfortune.nethttp://www.AllAfrica.comhttp://www.combanketh.com http://www.csa.gov.ethttp://www.ethiomedia.comhttp://www.ethiopiahope.comhttp://www.nbe.gov.ethttp://www.mwud.gov.et/
1 NBEAR (2018). National Bank of Ethiopia (2018). Annual Report for 2016/17.2 Ibid.3 The World Bank – Doing Business (2018). Ease of Doing Business in Ethiopia.http://www.doingbusiness.org/data/exploreeconomies/ethiopia (Accessed 5 Sept 2018). 4 Access Capital Research (2010). Sector Report-Real Estate. https://www.ethioconstruction.net/ (Accessed 9 Sept 2018). 5 Addisbiz.com (2017). Current Status of 40/60 Condominiums in Addis Ababa, Ethiopia.6 Housing in Ethiopia, Social Inclusion and Energy Management for Informal Urban Settlements; EiABC, Krems,3 March 2017.7 Access Capital Research (2010). 8 The World Bank – Doing Business (2018).9 Access Capital Research (2010). 10 Derso, Bilal (2018). “Ethiopia: Private Sector's Viable Role in Housing Development.” 25 April 2018. The Ethiopian Herald. https://allafrica.com/stories/201804250582.html (Accessed 12 Sept 2018).

Africa Housing Finance Yearbook 2018
141
operating in the country have the freedom to contract credit from abroad.3 Inaddition, local credit is available to both local and foreign investors on equal terms.Nevertheless, the country’s main economic actors, such as oil companies, arefinanced from outside the country.4
Gabon is part of the Economic and Monetary Community of Central Africa(Communauté Économique et Monétaire de l'Afrique Centrale, or CEMAC) andas such utilises the common currency known as the Communauté FinancièreAfricaine (CFA) Franc, which is tied to the Euro for the purpose of currencystabilisation. Furthermore, in compliance with being part of the CEMAC, Gabon’scentralised monetary agency is the regional Bank of Central African States (Banquedes Etats d’Afrique Centrale/BEAC) which regulates the banking and microfinanceinstitutions (MFIs) sectors through the Central African Banking Commission(COBAC).5 The country is also home to the Central Africa Regional StockExchange which was established in 2008.
The microfinance sector is still at an infant stage with few limited registeredmicrofinance institutions which cover only a limited portio of the population.
Deposit, savings and payment of services to low income earners are offered byCaisse d’Epargne Postal which is a postal savings bank that covers about 13.5
OverviewGabon is on the west coast of Africa, and covers an area of 267,667 m2. Gabonhosts a total population of 2 067 561 people, with 89.4 percent living in the urbanarea of the capital city Libreville and Port-Gentil, the second largest city. Thecurrent life expectancy at birth is 66.1 years old,1 the population growth rate for2018 is 2.09 percent and the urbanisation rate is 1.92% (2017).2 A formerlyFrench colony, the country gained independence in 1960 and French is the officiallanguage. Gabon shares common borders with Equatorial Guinea, Republic ofCongo and Cameroon by land and Sao Tome and Principe by sea. The climatecondition is characterised by tropical weather, hot and humid, with a range ofterrestrial morphology such a narrow coastal plain, hilly interior, savanna in theeast and south. The Gabonese territory is rich in mineral and natural resourcessuch as petroleum, natural gas, diamond, indium, manganese, uranium, gold, timber,iron ore and hydropower.
The primary economic activity of Gabon is the exploitation and exploration ofnatural resources. It is now the ninth most significant producer of oil in Africa. Inaddition to oil, the country also produces and exports timber and other mineralssuch as manganese and uranium. In the past five years, the oil industry hasaccounted for almost 80 percent of exports, 45 percent of the GDP, and 60percent of budget revenue. Nevertheless, in recent years, Gabon has beendiversifying its economy by investing more in agricultural activities and the tourismindustry.
For many years, France remained the main foreign economic and business partnerof Gabon, benefiting from particular privileges in multiple sectors such finance andnatural resource exploitation (oil) as well as infrastructure development. However,since the advent of the new government headed by the president Aly BongoOndimba, the country has opened up its border to new international investorsinterested in natural resources and infrastructure development.
Access to financeThe financial sector of Gabon consists of the Gabonese Development Bank (BGD)and nine commercial banks. However, approximately 80 percent of deposits andloans services are provided by three of the largest banks. The financial system isalso open to foreign commercial banks such as the US bank Citigroup. The primarybusiness focus of BGD is to lend money to small and medium-size companies.Corporate services are offered by commercial banks. However, corporations
GabonKEY FIGURES
Main urban centresLibrevillePort-Gentile
Exchange rate: 1 US$ = [a] 23 Aug 2018PPP Exchange rate (Local currency/PPP$) 1 CFA franc = [a]Inflation 2016 [a] | Inflation 2017 [a] | Inflation 2018 [b]
582.1 CFA franc231.24.80 | 2.80 | 3.50
Population 2017 [c] | Urban population size 2017 [d] Population growth rate 2017 | Urbanisation rate 2017 [d] Percentage of the total population below National Poverty LineUnemployment rate 2017 [a]
2 025 137 | 1 773 0072.26% | 2.48%34.30%19.63%
GDP (Current US$) 2017 [a] | GDP growth rate annual 2017 [a]GDP per capita (Current US$) 2017 [a]GNI per capita (Current US$) 2017 [a]Gini co-efficient 2015 [a]HDI global ranking 2017 [e] | HDI country index score 2017 [e]
US$14 623 million | 1.10%US$7 221US$6 61042.2109 | 0.697
Is there a deeds registry? Number of residential properties that have a title deed Lending interest rate [b]Mortgage interest rate [a] | Mortgage term (years) [a]Downpayment [a]Mortgage book as a percentage of the GDPEstimated number of mortgages Price to Rent Ratio in City Centre 2017 [f] Outside City Centre 2017 [f]Gross Rental Yield in City Centre 2017 [f]Outside City Centre 2017 [f]Construction as a % of GDP
n/an/a15.00%2.9% | 2025.00%n/an/a8.0719.1512.40%5.22%n/a
What is the cost of standard 50kg bag of cement? What is the price of the cheapest, newly built house by a formaldeveloper or contractor? (Local currency)What is the price of the cheapest, newly built house by a formaldeveloper or contractor? (US$) What is the size of this house (m2)? What is the average rental price for this unit (US$)? What is the minimum stand or plot size for residential property? [g]
US$9.62
21 916 150 CFA franc
n/a150m2
n/a40m2
Ease of Doing Business Rank [g]Number of procedures to register property [g]Time to register property (days) [g]Cost to register property (as % of property value) [g]
197533 days10.50%
NB: Figures are for 2018 unless stated otherwise.
[a] World Bank World Development Indicators[b] Trading Economics[c] Indexmundi.com[d] Worldpopulationreview.com[e] UNDP Development Indicators[f] Numbeo[g] World Bank Doing Business

142
percent of the population. Nevertheless, access to finance for low income earnersis still very low.
Gabon’s housing finance programme and budget are divided between differentstate institutions that have the mandate to deliver and execute housingprogrammes in the country. These institutions are: the Ministry of Housing, theANGT, and the National Real Estate Company, a government body created in1976 with the aim to develop and oversee housing projects. Today thegovernment retains 70 percent of the stake of the National Real Estate Company.Additionally, there are the Gabon National Housing Fund (NHF) created in 1973and the National Building Society (SNI) created in 1976 by merging the NationalHousing Corporation and the Gabonese Development of Real Estate andEquipment. In addition, Crédit Foncier of Gabon (CREFOGA) was established bythe Gabonese government in 1976 as a specialised agency in housing finance.However, the business model of CREFOGA was severely handicapped by unpaiddebts which resulted in its liquidation.6 Another financial government institutionis the Guarantee Fund for Housing (Fonds de Garantie pour le Logement, FGL).The FGL has the administrative and financial distribution mandate to deal withhousing deficit. The government of Gabon has also established the housing bank,which is commissioned to provide loans at all stages of the housing constructionand sale process.
Today, there are a number of financing mechanisms in Gabon that have beenidentified through the National Infrastructure Master Plan (NIMP) in order tofacilitate real estate investment, public private partnerships and built operationtransfer cession as well as fully-controlled private projects. In order to promoteprivate investment in the country, the government has embarked on theestablishment of development and growth funds destined to small and mediumenterprises as well as the creation of a specialised agency. These include privatebanks and credit institutions operating in the housing sector with the aim tostimulate and provide finances to real estate developers and new home buyers.
AffordabilityGabon planned to improve its fiscal deficit to between 1.25 and 3 percent of theGDP in 2018 in order to compensate for the drop in oil revenues of the samemagnitude.7 Hence, Gabon’s GDP per capita is US$7 221 in 2017. However, thecountry is subject to high income inequality that has left some local communitymembers who lack ties to government officials, in extreme poverty. As a result ofthe decline in oil prices and national budget cuts in 2015, the economic growth ofGabon decreased from 5.6 percent to 4 percent.8 This situation has not onlyaffected the local economy but also community purchasing power. As such thePlan Stratégique Gabon Emergent Vision 2025 (PSGE) was launched in 2012, totry and diversify and develop new industries including transformative industries(agribusiness and wood processing) and promote infrastructuredevelopment/construction by building smart cities that will respond to housingneeds based on sustainable development principles. The expected economicgrowth of the country is 2 percent in 2018.9
According to the 2018 World Bank Doing Business Report, Gabon is currentlyranked 167 out of 190 countries globally and stands at 132 on the ease of startinga business.10 Among the key innovations that government has put in place, isreducing the paid-in minimum capital requirement for starting a business(CFA 500 000). Despite the fact that for the last four decades Gabon experiencedhigh growth due to oil revenues, this did not translate into job creation or povertyalleviation. The 2018 unemployment rate is above 19.63 percent with primarilyyouth and uneducated people affected.
Gabon’s poverty rate is very high; 34.3 percent of the local population arevulnerable and living with a monthly income of below minimum wage of US$225with an additional US$34 monthly allowance per child. In more than 60 of theregions, many local community/residents do not have access to basic services suchas safe drinking water, electricity and health care.11 Income inequality in Gabonand unemployment remain major challenges, especially among the youthpopulation, 42 percent of which are under the age of 25.12
Housing supplyThe majority of social housing developments projects are initiated by thegovernment and executed by international companies mainly from China and India.
The Oxford Business Group stressed that Gabon is facing a huge backlog ofhousing demand especially social housing. However, this situation could improvewith the new government’s financial strategies and through better regulations andefforts to facilitate access to land titles.
In 2009, the government has ratified the NIMP based on sustainable developmentprinciples with a short to long term vision. The plan includes the development ofinfrastructure strategies across different sectors, these are: transportation, energy,and telecommunication, housing and utility infrastructure.13 According to theNIMP action 152, the government plans to build 35 000 houses with the aim ofsignificantly increasing housing supply and facilitating access to mixed used housing.The project aims to build and deliver to the country on average 5 000 unitsannually, in order to encourage social diversity and vertical and horizontaldensification.
The materialisation of the NIMP housing delivery vision is currently underway inthe peripheral area of Libreville. One of the projects that have already started isthe new urban development project called Angondje Development Districtlocated in the west part of the city. Since the beginning of this project, 872 pre-fabricated houses were completed and, at the end of March 2016, 633 houseswere allocated to their owners.14 Another 420 social houses are beingconstructed by the Chinese company Dacheng Taihe Steel Structure Science andTechnology, based in Beijing. The project is underway, and 320 houses have beencompleted and delivered. Chinese investment in Gabon is based on Sino-Gabonese friendship and cooperation. The government aims to allocate 5 000registered plots annually with a title deed to identified builders, private developersand housing construction developers. The objective is to facilitate housing marketaccess to public servants such as teachers, health personnel, and army personnel.
In addition, the SNI is currently working in partnership with a mining companyknown as Compagnie Minière de l’Ogooué to build 2 000 houses destined to lowincome earners in Bikélé. This project will be financed by the Gabon InternationalBank of Commerce and Industry (Banque Internationale pour le Commerce etl’Industrie) and the Union Bank of Gabon (Union Gabonaise de Banque). TheCentral African Development Bank based in Congo Brazzaville is also supportingthe project. To date the project is two-thirds complete, with key infrastructuressuch as road connections, water and electricity supply remaining.
The government of Gabon has signed an agreement with a Chinese consortium,One Link Holding Group, to build 200 000 homes in several cities and across thecountry in addition to the development of a new town in Panga province ofNyanga (south of Gabon).
Another housing project currently underway in Gabon is the development of 3 133houses in Estuaire. The project was initially planned for completion at the end of2016, but only 2 048 houses have been completed so far. The government ofGabon is also committed to facilitating the establishment of housing cooperativesthrough public funding. At the same time, the government planned to diverthousing bonuses usually paid to public servants to the finance housing cooperative.
However, in the last two years, most of Gabon’s housing development projectshave suffered financial setbacks due to the drop in oil prices which have forcedthe government to reallocate funds to higher priority projects. The main housingproject which suffered setbacks is the Alvia Okolassi housing project that plannedto build 650 social houses from 2016 to April 2018. However the project hasnot taken off due to the withdrawal of financial support from the bank. A secondproject is the social housing project of Bikele which suffered major setbacks dueto financial maladministration and corruption. Another major project is the housingdevelopment of Mangoumba which was delayed for lack of finances.
Housing development programmes are currently taking place under Action 153of the National Infrastructure Master Plan (2011) called ‘Restructuring and slumupgrading’. This programme will involve restructuring and relocation of residentsfrom precarious neighbourhoods to new urban centres with suitableaccommodation and social infrastructure. This approach will promote access toland and social facilities as well as social services to local residents. This newdevelopment is supposed to take into account all different categories of income.

Africa Housing Finance Yearbook 2018
143
Nevertheless, it is important to note that the Gabon housing and urbandevelopment sector is still characterized by (i) a weak institutional and legal system;(ii) rigid tenure; (iii) virtually ineffective financing systems and (iv) very low capacityof interventions by actors.
Property marketIn the last decade, Gabon has experienced a rapid increase of its urban population,with 89 percent of the population now living in urban areas. However, thecountry’s real estate market has remained underdeveloped and characterised byhigh-end sales and expatriate rentals as key drivers, followed by demands for socialhousing. Nevertheless, in 2017 the Knight Frank ranked Libreville 26th among themost profitable African cities in terms of real estate investment.15 According tothe 2018 World Bank Doing Business Report, the number of procedures requireto register a property in Gabon is 5 and it takes 33 days to complete. Gabon isranked 173 in the world in terms of the ease of registering property.16
However, much of housing development, property demand and infrastructuredevelopment in the country were driven by the hosting of the 2012 and 2015Nations African football tournament, despite the growing challenge/needs for socialhousing for poor communities and low income earners. Thus, the government ofGabon has set in place plans to establish the legal basis for a National Laboratoryand Public Works (LNBTP) as a strategic institution for the promotion of improvingreal estate development.17
Hauts de Gué-Gué, La Sablière and Batterie IV are amongst the successfuldevelopments located around Libreville. Demand for high quality residentialproperty is also on the rise due to competition demands between private andcorporate occupiers with the consequence of rental price increases. In addition,there is an increasing demand for retail and office buildings in the country, withstate institutions and international institutions being the target markets.
The average rental rates in Gabon are as follows, in and around the capital city ofLibreville:
n Apartment (1 bedroom) in city centre: US$1 529n Apartment (1 bedroom) outside city centre: US$655 n Apartment (3 bedrooms) in city centre: US$4 150 n Apartment (3 bedrooms) outside city centre: US$1 340
In 2012, the government of Gabon announced the implementation andconstruction of 5 000 houses to take place in Esterias, 30 kms north of Libreville,which will be financed by the Gabon government through GaboneseDevelopment Bank (Banque Gabonaise de Développement).
To support delivery, the government is engaged in a number of reforms to tryand stimulate the housing sector. These reforms include efforts to alleviate theburden of administrative and regulatory obstacles that were hampering social
housing delivery projects. Institutional reforms are also taking place in the housingsector which include the creation of new specialised housing agencies and theestablishment of several new institutions, such as: the National Agency for UrbanPlanning and the Topographical Works and Land Registry called (Agence Nationalde l’Urbanisme, des Travaux Toppographique et du Cadastre, ANUTTC), whosemission is to plan and oversee all land and real estate development projects,maintain and extend the national land registry, and facilitate the purchase andtransfer of property units.
Hence, Gabon’s priority is to increase the housing stock as stressed in the NIMPlaunched in June 2012. The budget for the housing development projects identifiedin the master plan for the period between 2011 and 2016 is estimated at US$2.66billion; part of this money will come from the public sector, as well as the privatesector and foreign investment.
Policy and regulationsGabon’s current economic policy and regulations are aimed at transforming thecountry into an emerging economy. This approach seeks to improve investmentin other sectors to move away from oil dependency. The country’s 1998investment code, elaborated in accordance with CEMAC’s investment regulations,provides equal rights to foreign and local companies operating in Gabon. However,a certain number of strategic business sectors, such as mining, forestry andpetroleum, are organised under a specific investment code based on customs andtax incentives. In order to increase transparency in its recourse and mining industry,the country is in the process of introducing a new mining and petroleum code.Gabon has also adhered to the Organisation for the Harmonisation of BusinessLaw in Africa (OHADA) which allows foreign investors to choose without restraintfrom a wide range of legal business structures, such as a private limited liabilitycompany or a public limited liability company.
The Gabon constitution of 1991, which has been amended several times,acknowledges the right to housing for every Gabonese citizen in Article 1:
n Paragraph 10: “Everyone Gabonese has the right to property. No one maybedeprived of his/her property except for public necessity, legally recognised,required on condition of prior and just compensation; however, propertyexpropriations incurred in the public interest, for failure or lack ofdevelopment, and properties registered, are governed by law.”
n Paragraph 11: “All of Gabon has the right to freely choose his domicile orresidence anywhere in the country and to engage in all activities, subject torespect for public order and law.”
Gabon does not have a clear land policy. The closest form of land policy datesback to 1911 which still forms part of the land legislation.18 Most land belongs tothe state and there is no cadastral plan in some parts of the country aside fromLibreville. The country also suffers from a lack of a proper system of transfer oftitle deed/land ownership, which affects poor communities as without proper
PPP$40 001 – PPP$10 000 000
PPP$23 001 – PPP$40 000
PPP$12 001 – PPP$23 000
PPP$8 001 – PPP$12 000
PPP$5 001 – PPP$8 000
PPP$3 601 – PPP$5 000
PPP$2 401 – PPP$3 600
PPP$1 601 – PPP$2 400
PPP$801 – PPP$1 600
<PPP$800
- - - Average annual household income needed for the cheapest newly built house by a formal developer, 2017 Average annual household income using expenditure, 2017 (PPP$)
GABON
Annual income profile for rural and urban households based on consumption (PPP$)
No. of households (thousands)
PPP$20 511
PPP$24 963
Rural Urban150 100 50 0 50 100 150
Population: 2 025 137
Urbanisation rate: 2.48%
Cost of cheapestnewly built house:
21 916 150 CFAPPP$94 793
Urban householdsthat could afford thishouse with finance:
34.37%
1 PPP$: 231.2 CFA franc
Source https://www.cgidd.com/

144
land/property ownership, households lack collateral to access credit. To overcomethis situation, the NIMP, under Action 146, plans to reinforce the legal frameworkfor the construction and housing sector. This plan aims to create a legal frameworkand incentives in order to facilitate access to private property development andconstruction activities by defining and putting in place clear rules and regulations.
OpportunitiesGabon offers many business and financial opportunities for investors regardlessof its small population. The country has one of the highest GDP per capita ratesin Africa, which is an advantage for investment in the country. In the last decadesit has attracted and continues to attract French retailers such as Carrefour supermarkets and Casino. There is also a new shopping centre called Le Grand Marchéde Libreville soon to be completed on a 7-hectare land parcel in Libreville. TheGrand Marché project is financed by the Swiss group Webcor at the value ofroughly US$49 million and the construction is conducted by the same company.This project has not been completed yet.
Up until recent years Gabon has enjoyed a relatively stable economic relationshipwith its former colonial power. However, due to changes in the global economicarena, Gabon has broadened its economic and diplomatic partners to otheremerging powers from Asia and Africa who possess the financial weight andexpertise to boost Gabon’s economy away from oil dependencies.
In 2012, Gabon also introduced a new system of ‘guichet unique’ (one stop shop)with the aim to simplify the procedure of land purchase and reduce the time toacquire a title deed from the initial 10 years to 180 days and reducedadministrative steps from 134 to seven.
In addition to the Angondje District Development project, there are also othersimilar projects in the pipeline with the same approach and addressing the sameissues with the same standards. These projects are Nkoltang, located on the Routenational 1, situated 5 km east of Nkok; this project is yet to begin. The other urbandistrict project in the pipeline is the Lambarene situated in the river transport hub– the aim of this project is the construction of 1000 units.
Private investment in development projects is also expected to increase graduallyover the next 20 years due to government commitments to make the country an“emerging’ economy”. However, one of the biggest challenges remains theaffordability and accessibility to housing for low income earners/poor unemployedcommunities. The policies in place do not clarify the strategies that will be utilisedin order to improve access to adequate and safe shelter for all Gabonese.However, the government strategy to boost the property market and housingsector is beginning to show positive signs by attracting foreign investment.
SourcesAfrican Development Bank Group (2011). Gabon: Country strategy paper2011- 2015.
African Development Bank Group (2016). Joint 2016-2020 Country strategypaper (CSP) and Country portfolio performance review (CPPR) Report.
The Borgen Project (2013). Oil, inequality and youth in Gabon. 14 July 2013.https://borgenproject.org/oil-inequality-and-youth-poverty-in-gabon/ (Accessed24 June 2018).
GlobalSecurity.org. “Gabon-China Relations.”www.globalsecurity.org/military/world/africa/gb-forrel-prc.htm (Accessed 28Aug 2018).
Habitat World Map. www.wm-urban-habitat.org/eng/gabon/#Social-and-economic-aspects (Accessed 28 Aug 2018).
IMF (2018). Press release No 18/255. IMF Staff Completes Review Mission toGabon. 25 June 2018.https://www.imf.org/en/News/Articles/2018/06/25/pr18225-imf-staff-completes-review-mission-to-gabon (Accessed 27 Sept 2018).
International Monetary Fund (2017). Country Report No. 17/408. 28 Dec2017. https://www.imf.org/en/Publications/CR/Issues/2017/12/28/Gabon-First-Review-of-the-Extended-Arrangement-under-the-Extended-Fund-Facility-Requests-for-45529 (Accessed 27 Sept 2018).
Oxford Business Group (2016). The Report: Gabon 2016.https://oxfordbusinessgroup.com/gabon-2016 (Accessed 27 Sept 2018).
Oxford Business Group (2018). “Bridging the gap: Several new projects willhelp to reduce the housing deficit.”http://www.oxfordbusinessgroup.com/overview/bridging-gap-several-new-projects-will-help-reduce-housing-deficit-0. (Accessed 28 Aug 2018).
Plan strategic Gabon Emergent (2012). Vision 2015 et orientation strategiques2011 – 2016.
Programme des Nations Unies pour les établissements humains (2013). Etudediagnostique pour l’élaboration d’une stratégie national d’habitat et dedéveloppement urbain au Gabon.
U.S. Department of State Bureau of Economic and Business Affairs (2017).“Gabon: 2017 Investment Climate Statement.”https://www.state.gov/e/eb/rls/othr/ics/2017/af/269735.htm (Accessed 27 Sept2018).
World Bank (2018). Doing Business: Gabon. http://www.doingbusiness.org/(Accessed 28 Aug 2018).
Worldometers. “Gabon population.” http://www.worldometers.info/world-population/gabon-population/ (Accessed 28 Aug 2018).
1 The World Bank (2018). The World Bank Open Data. https://data.worldbank.org/indicator/SP.DYN.LE00.IN?locations=ZG-GA (Accessed 29 Aug 2018).2 CIA (2018). The World Factbook. https://www.cia.gov/library/publications/the-world-factbook/geos/gb.html (Accessed 29 Aug 2018).3 US Department of State (2017). Investment climate statement report.4 Ibid.5 US Department of State (2017). Investment climate statement report.6 Republic of Gabon (2011). Projet d’appui a l’elaboration d’une strtegie national d’habitat et de development urbain.7 International Monetary Fund (2017). Country report N0.17/408.8 World Bank Group Report (2016). Doing Business: Gabon.9 International Monetary Fund (2018). Press release No 18/255.10 World Bank Group Report (2018). Doing Business: Gabon.11 World Bank Group Report (2016). Doing Business: Gabon.12 The World Bank (2017). The World Bank Open Data.13 Plan Strategic Gabon Emergent (2011 - 2016).14 Oxford Business Group (2018).15 Le Nouveau Gabon. http://www.lenouveaugabon.com16 World Bank Group Report (2018). Doing Business: Gabon.17 Oxford Business Group (2018).18 AldenWily (2012). Les Droit Foncier au Gabon-Faire fasse au passé et au present, FERN.

Africa Housing Finance Yearbook 2018
145
seeks to ensure that the country’s environment and natural resources aresustainably managed and conserved to increase resilience.7
According to the IMF’s Country Report of June 2018, The Gambian economy hasstarted to recover following the growth slowdown of 2016.8 Economic growthin 2017 is estimated at 3.5 percent bolstered by improved market confidence,resurgence in trade and tourism, and an improvement in foreign exchange supply.Headline inflation declined from 8.7 percent in April 2017 to 6.6 percent in April2018 and the Central Bank of The Gambia (CBG) reduced its policy rate from23 percent to 15 percent in mid-2017, causing commercial lending rates to declinefrom 28 percent to about 18 percent.9 Accordingly, the Government of TheGambia’s (GoTG) policy orientation will continue to be anchored in a liberalagenda and is expected to be in broad agreement with the internationaldevelopment framework as enshrined in the Sustainable Development Goals.While the NDP does not mention urban development and housing, it highlightsthree key results for land use planning: a National Land Policy; a Land Use Plan;and a Nationwide Cadastral Map.
Access to financeThe Gambian financial sector is comprised of 12 banks (one of which is an Islamicbank) with the remaining 11 conventional banks being mostly foreign-owned. The
OverviewThe Gambia, surrounded by the Republic of Senegal on all sides except the AtlanticOcean, is the smallest country on mainland Africa with a total land area of11 295m2, of which 50 percent is arable land. The Gambia’s economy relies mainlyon services (66 percent of GDP in 2016) as the main driver of growth, and avolatile, drought-prone agriculture sector (21 percent of GDP in 2016).1 TheGambia has a population of about two million people, which is growing at a rateof three percent per annum.2 In addition to this high population growth rate,61 percent of the population resides in urban areas as a result of high andunplanned rural-urban migration.
Following the tumultuous December 2016 election and political impasse, a newgovernment, under the leadership of President Adama Barrow took power inJanuary 2017, marking the country’s first democratic transition since independencein 1965. The new government’s key economic objectives are to restoremacroeconomic stability and attain sustained, high and inclusive growth to promotesocioeconomic development. The National Development Plan (NDP) 2018-2021was launched in February 2018, which has seven crucial enablers geared towardsachieving an overall objective to “deliver good governance and accountability, socialcohesion, and national reconciliation, and a revitalized and transformed economyfor the well-being of all Gambians”.3
Classified as a least developed country (LDC), with a GNI per capita of US$473.2in 2017,4 The Gambia is also ranked 174 out of 189 in the United NationsDevelopment Programme’s (UNDP) Human Development Report 2017, with ascore of 0.460, which puts it in the low human development category.5
Accordingly, the incidence of poverty is high, with The Gambia Bureau of Statistics(GBoS) 2015 Integrated Household Survey indicating that an estimated48.6 percent of the population live below the poverty line. Rural areas areespecially disenfranchised, with rural poverty estimated at 79.5 percent. The highincidence of rural poverty and the high population growth rate of 3.4 percent canbe seen as leading to the country’s high urbanisation rate of 4.3 percent.6
Coastal climate vulnerability poses a significant challenge for land management,use and planning, with approximately 3 515km2 (32 percent) of the country’s totalland area below 10m of sea level; the capital, Banjul, has 11km2 (more than90 percent) of its total land area below sea level. The new government recognisesthe vulnerability of the country’s coastal zones to rising sea levels and the NDP
The GambiaKEY FIGURES
Main urban centresKanifing Brikama
Exchange rate: 1 US$ = [a] 6 Jul 2018PPP Exchange rate (Local currency/PPP$) 1 Dalasi = [b]Inflation 2016 [c] | Inflation 2017 [c] | Inflation 2018 [c]
45.15 Dalasi 13.17.2 | 8.3 | 5.80
Population 2017 [b] | Urban population size 2017 [d] Population growth rate 2017 [b] | Urbanisation rate 2017 [b]Percentage of the total population below National Poverty Line [e]Unemployment rate [d]
2 100 568 | 1 276 9353.00% | 3.93%48.6%3%
GDP (Current US$) [b] | GDP growth rate annual [b]GDP per capita (Current US$) [b]GNI per capita (Current US$) [b]Gini co-efficient 2015 [b]HDI global ranking 2015 [e] | HDI country index score 2015 [e]
US$1 015 million | 3.5%US$483US$45035.9173 | 0.452
Is there a deeds registry? Number of residential properties that have a title deed Lending interest rate Mortgage interest rate | Mortgage term (years)DownpaymentMortgage book as a percentage of the GDPEstimated number of mortgages Price to Rent Ratio in City Centre | Outside City Centre Gross Rental Yield in City Centre | Outside City Centre Construction as a % of GDP
Yesn/an/a17.25% | 1040%n/an/an/a | n/an/a | n/an/a
What is the cost of standard 50kg bag of cement? What is the price of the cheapest, newly built house by a formaldeveloper or contractor? (Local currency)What is the price of the cheapest, newly built house by a formaldeveloper or contractor? (US$) What is the size of this house (m2)? What is the average rental price for this unit (US$)? What is the minimum stand or plot size for residential property?
US$6
947 743 Dalasi
US$20 99149m2
n/an/a
Ease of Doing Business Rank [f]Number of procedures to register property [f]Time to register property (days) [f]Cost to register property (as % of property value) [f]
146566 days7.60%
NB: Figures are for 2018 unless stated otherwise.
[a] Central Bank of The Gambia[b] World Bank World Development Indicators[c] IMF World Economic Outlook Database[d] UNDP Development Indicators[e] Gambia Bureau of Statistics[f] World Bank Doing Business
Member organisations of the African Union for Housing Finance (AUHF):Home Finance Company of The Gambia

146
banking industry continues to be highly monopolised, as indicated in the GambiaBankers Association year-end report for 2016, revealing that the top four banksaccount for 69.6 percent and 70.6 percent of industry assets and depositsrespectively. The banking industry continues to cater towards meeting the needsof the small formal sector, with CBG estimates for banking penetration rangingfrom 20 percent to 25 percent nationwide. Financial inclusion continues to be achallenge. This is despite the fact that, as of the end of 2016, 80 registered creditunions, three microfinance companies and 65 Village Savings and CreditsAssociations were operational.10
According to the CBG, the banking sector remains well capitalised, highly liquidand profitable, with a liquidity ratio at 94.7 percent – significantly higher than therequirement of 30 percent. As result of the slowdown in government borrowing,private sector credit growth is recovering strongly, growing to a peak of 6.2 percentin March 2018, the highest since 2014. Given the improvement in the economicenvironment, the CBG reduced the monetary policy rate by 1.5 percentage pointsto 13.5 percent in May 2018 to reinforce private sector credit growth.11
The 2018 World Bank’s Doing Business Report ranks The Gambia 146 out of190 economies for getting credit, and 129 for registering property. There is a needfor government to continue embarking on reforms to improve the businessenvironment, which is especially pertinent for the housing finance sector. Currently,there is only one financial operator, Home Finance Company Limited (HFC), thatoffers mortgages to customers. The national mortgage market remains low andthis is evident given the company’s narrow portfolio of just 47 mortgages on itsbooks as of the end of 2017, with a total portfolio of approximately US$300 000,which is insignificant compared to total banking industry loan portfolio of aboutUS$88 million. HFC offers a mortgage product that can finance up to 70 percentof the value of a property payable over a maximum of 20 years. HFC offers fourdifferent types of mortgage products: Home Purchase, Home Completion, HomeImprovement and Home Equity. The company reduced its mortgage interest ratefrom 20 percent to 18 percent in 2017.12 However, it continues to be constrainedby non-performing loans, which accounted for over 50 percent of its loan portfolioin 2017. This has slowed the growth of the number of mortgages underwrittenby the company as it focuses on loan recoveries.
The Gambia has a pension industry that actively supports housing expansion. TheSocial Security and Housing Finance Corporation (SSHFC) aims to provideadequate social protection for workers and to facilitate social shelter delivery ona sustainable basis. The corporation operates four constituent funds: the FederatePension Fund, the National Provident Fund, the Injuries Compensation Fund, andthe Housing Finance Fund. SSHFC requires a minimum down payment of25 percent of the selling price, with the balance payable monthly over a 15 yearperiod.
AffordabilityGBoS Income and Household Survey 2015/2016 notes that 56.1 percent ofhouseholds in The Gambia live in owner-occupied dwellings, with 31.2 percentliving in rented housing. A higher percentage of people in rural areas live in owner-occupied dwellings (88.4 percent) as compared to the capital city Banjul and otherurban centres where 66.4 percent and 46.5 percent of inhabitants respectivelylive in rented housing. Accordingly, the demand for housing is higher in the urbanareas, where 34 percent of the urban population live in slums and are faced withsignificant challenges in terms of housing, health and environmental degradation.
While curated data on the trend in property prices in The Gambia is unavailable,different players in the industry confirm that prices have risen steadily over thepast few years, largely driven by the property interests of Gambians in the diaspora.There is a shortage of affordable housing for most Gambians. The main developerof affordable housing in The Gambia is the SSHFC, which is mandated to provideserviced plots of land with or without small construction loans for low and middleincome groups. It also develops complete housing units for purchase by middleincome households. The price of a three-bedroom house (220m2) is aboutUS$100 000 (GMD4.3 million), while a two-bedroom house is US$50 000(GMD2.2 million).
According to Taf Africa Homes, a leading real estate developer in The Gambia andthe ECOWAS sub-region, it would cost approximately GMD4 800 (US$100) per
square meter to buy a two or three-bedroom house in its planned affordablehousing development in the metropolitan centre,13 working out to aroundGMD1 300 000 (US$328 792) and GMD1 900 000 (US$42 081) per property.The company has partnered with three local commercial banks (Trust BankGambia Ltd, Ecobank Gambia, and Guarantee Trust Bank Ltd) to offer a mortgagefinancing facility for its customers – a 10-year mortgage plan that requires40 percent deposit. While the price point for the planned affordable housingestate by Taf Africa Homes is much lower than that offered by SSHFC, it is stillwell above the affordability threshold for the vast majority of Gambians. Thisshortage of affordable housing is also reflected in the lack of adequate, affordablerental housing stock, and consistent reports of steep rises in urban area rentals.14
On average, it costs GMD6 000 (US$140) and GMD11 500 (US$269) per monthto rent a one and three-bedroom apartment respectively in the metropolitancentres.
Given the lack of affordable housing in the country, most Gambians self-build theirhouses as they cannot afford to purchase a house outright. This has led to therapid growth of Amiscus Horizons Ltd, a company that runs a cement block savingsscheme using a pay-as-you-go model that started operations in 2014. Thecompany allows its clients to build up enough blocks for a period of two to fiveyears to be able to complete their house. Most of the company’s clients aremiddle income earners such as teachers, nurses, police officers, mid-level civilservants and young professionals. As per Amiscus Horizon’s estimates, the costof affordable housing should be within the range of GMD500 000-GMD700 000(US$10 000-US$15 000) excluding the cost of the land.15 This estimate is wellbelow the going rate of affordable housing developments by SSHFC and leadingproperty developers.
Housing supplyThe demand for housing among the urban population continues to exceed supply,with a housing deficit estimate of 50 000 housing units, according to the Ministryof Lands and Regional Government in 2015, still being the deficit being referredto by industry players.
Based on available information, there have not been any new affordable housingdevelopments in the country in the last year, with the last major housingprogramme completed in the country being in 2011, when UN-Habitatimplemented its Participatory Slum Upgrading Programme. This 36-monthprogramme, with an estimated cost of US$5 million, sought to meet the housingneeds of low and middle income earners in the city of Banjul, and the Kanifing andBrikama municipalities. The programme aimed to construct 2 000 housing unitsacross the three cities. In addition, 200 commercial shops, mosques, three chapels,community centres, recreation facilities and parks were planned to be constructedin the three sites. The project was part of a wider collection of urban upgradingprojects that sought to address urban infrastructure, governance, health,environmental issues, local economic development, urban safety and urban disastermanagement, all being driven with the support of UN-Habitat. The Gambia isnow in the second phase of the programme which entails action planning andprogramme formulation.
The biggest housing schemes in the country were implemented by SSHFC, withthe most notable ones in Bakoteh, Kanifing and Brusubi. The two former projectswere completed in the 1980s. The Bakoteh project provided 200 housing unitsof two and three-bedroom houses and failed as the end product was unaffordableby the target group of beneficiaries. The government thus had to subsidise thehouses for 15 percent and waived any interest incurred on the loans which weregiven to the beneficiaries for a 25-year repayment period. For the Kanifing Project,the developed land was demarcated on 743 serviced plots ranging in size from250m2 to 350m2. Small construction loans were given to project beneficiarieswho were then guided in the construction of their own houses. The loan waspart of the World Bank Urban Management and Development Project and offeredbeneficiaries 9 percent interest over a 25-year repayment period.
The third housing project, Brusubi, involves three phases and promises to deliverclose to 3 000 housing units. This project site’s total area is 6.9 hectares and iscovered by the lease for Brusubi Housing Project Phase 1. The project comprises138 service plots, of which 100 plots consist of complete housing units for outrightpurchase. The remaining 38 service plots are to be sold by tender to mobilise

Africa Housing Finance Yearbook 2018
147
resources to meet additional infrastructural and other costs. The complete housingunits consist of three-bedroom bungalows and two-storey houses. The projectwas co-financed by Shelter Afrique and offered at a 15-year mortgage term.However, a review of the project indicates that the mortgage default rate isrelatively high indicating that high loan defaults are a cross-cutting issue for allmortgage finance players in the country.
As at July 2018, SSHFC is engaged in three housing projects – the Brikama Jamisa,Jabang and Tujereng projects – which are all site and services. SSHFC is embarkingon extending housing facilities in the urban centres of the country, especially withinthe Kanifing and Brikama municipalities in a bid to reduce the strain on theimmediate urban infrastructure and other services. The Tujereng project comprises1 515 residential serviced plots, 11 business plots and 94 plots earmarked for thedevelopment of complete housing units. The Jabang project has a total of 817residential serviced plots, 29 business plots and 39 plots reserved for theconstruction of complete housing units. SSHFC is actively seeking to partner withinterested developers for the construction of the complete housing units usingalternative building materials. The change of government and the improvingfinancing avenues that are expected to emerge with greater donor engagementwith the country are expected to give a boost to SSHFC to launch new affordablehousing projects.
Furthermore, there are several private sector players operating in The Gambia,such as Sky High Group, Taf Africa Homes, Blue Ocean Properties, Swami IndiaInternational, Global Properties and Amiscus Horizons, that have designs on makinga foray into the affordable housing sector. While most of these companies arepredominantly focused on the higher end of the housing market, Amiscus’ mainobjective is to make housing affordable for all Gambians by pioneering the conceptof cement block banking with plans to extend to other products such as tiles andcorrugated sheets.
Property marketsProperty rights and secured interests in property are protected by theConstitution. The Department of Lands (under the Ministry of Lands and RegionalGovernment) issues title deeds which are duly registered. Both moveable andreal properties are recognised and enforced. The concept of mortgage exists(even though the mortgage market is extremely small) and there is a recognisedand reliable system of recording such security interests. The legal system fullyprotects and facilitates acquisition and disposition of all property rights includingland, building and mortgages. That being said, the bulk of the land is customarytenure or controlled by farmers and traditional rulers. Such land can, however, beeasily taken over by government or declared reserved land to be used in futurefor social amenities such as schools, hospitals or office buildings.
As a result, land tenure remains an ongoing issue. This is partly because registeringproperty involves, on average, five procedures, which take 66 days and cost7.6 percent of the property value. Tenure security is limited, with only 45 percent
of the population being secure and in some cities the number is even lower. Tenuresecurity is highest in rural areas, at between 70 percent and 89 percent. It takesan average of three years to secure a title deed and the cost is exorbitant:GMD4 000 (US$93) in transfer tax to the municipality and GMD40 000 (US$93)in capital gains tax per transaction. This limits accessibility to mortgage financingand dampens the incentive to self-build through housing microfinance.
Policy and regulationThe most notable policy development revolves around the establishment of theCollateral Registry and Registration System, instituted by the CBG under theSecurities Interests in Movable Properties Act 2014, which makes provision forthe creation, perfection, priority and enforcement of security interests in movableproperty.16 The intent of this is to facilitate credit delivery through the provisionof efficient, cost-effective services and by creating an enabling environment toensure easy access to credit.17
However, there have not been any significant developments in housing-specificlegislation and regulation, or any formulation of a highly needed urbandevelopment strategy or policy guiding the urbanisation process by the newgovernment through the Ministry of Lands and Regional Government, whichcontinues to be broadly responsible for implementing housing and land-relatedpolicy.18 Accordingly, the main policy and regulatory frameworks that govern thehousing sector are as outlined in the 2017 annual report, notably:
n SSHFC Act (1981);n State Lands Act (1991);n The Physical Planning and Development Control Act (1991); n Land Acquisition and Compensation Act (1991);n The Survey Act (1991); n Local Government Act (2002); n Rent Act (2014); andn Mortgages Act (1992).
OpportunitiesThe affordable housing market in The Gambia continues to be untapped.However, recent improvements in the government’s implementation of soundmacroeconomic policies, coupled with increased business confidence mayencourage greater private sector participation in the affordable housing segment.A key development is the new government’s commitment to ensuring macro-stability to support a lower interest rate environment. The expectation is for acontinued decline in lending rates of commercial banks and for them to partnerwith property developers to offer mortgage financing products. There is also apush for the use of alternate approaches, technologies and materials which speedup the delivery and improvement of housing.
The high levels of informality and self-builds, coupled with an established regulatoryframework for the microfinance industry, opens up a huge window for the
Source https://www.cgidd.com/
PPP$40 001 – PPP$10 000 000
PPP$23 001 – PPP$40 000
PPP$12 001 – PPP$23 000
PPP$8 001 – PPP$12 000
PPP$5 001 – PPP$8 000
PPP$3 601 – PPP$5 000
PPP$2 401 – PPP$3 600
PPP$1 601 – PPP$2 400
PPP$801 – PPP$1 600
<PPP$800
- - - Average annual household income needed for the cheapest newly built house by a formal developer, 2017 Average annual household income using expenditure, 2017 (PPP$)
GAMBIA, THE
Annual income profile for rural and urban households based on consumption (PPP$)
No. of households (thousands)
PPP$10 496
PPP$36 594
Rural Urban40 30 20 10 0 10 20 30 40
Population: 2 100 568
Urbanisation rate: 3.93%
Cost of cheapestnewly built house:
947 743 GMDPPP$72 347
Urban householdsthat could afford thishouse with finance:
3.27%
1 PPP$: 13.1 Dalasi

148
development of housing microfinance products that the existing financial industryplayers are yet to take advantage of. The revitalisation of the Association of RealEstate Companies has brought together about 60 percent of the estimatedregistered companies in the country. With more companies expected to join theassociation, it is envisaged that the association will engage in dialogue with thegovernment to address their key challenges, including access to land for housingdevelopment, slow government procedures, and a reliable supply of electricity andwater.19 The successes of Amiscus Horizons and the crash in the yields ofGovernment Treasury bills should encourage more financial industry players toseek out greater opportunities within this sector.
Additional sourcesAmiscus Horizons (2017). Interview with Amiscus Horizons Managing Director,August Prom Jr. 27 July 2017.
Association of Real Estate Companies (2018). Interview with The President,Abubakar Bensouda. 27 June 2018.
Central Bank of The Gambia (2018). Monetary Policy Committee PressRelease: 20 May 2018. http://www.cbg.gm/research/mpolicy.html (Accessed29 Aug 2018).
Central Bank of The Gambia (2017). Collateral Registry at the Central Bank ofThe Gambia. http://www.gambiacollateralregistry.gm/ (Accessed 28 Aug 2018).
Central Bank of The Gambia (2017). Interview with Siaka Bah; Principal atMicrofinance Department of the Central Bank of The Gambia (3 Aug 2017).
Gambia Bankers Association (2017). Annual Returns of Banks 2016.
Gambia Bureau of Statistics (May 2017). Integrated Household Survey2015/2016: Preliminary Survey Findings.
GoTG (2018). Government of The Gambia: National Development Plan 2018-2021. https://mofea.gov.gm/ndp (Accessed 29 Aug 2018).
Home Finance Company (2018). Interview with Home Finance CompanyManaging Director Omar Sarr. 27 June 2018.
IMF (2018). The Gambia: IMF Country Report No. 18/197.https://www.imf.org/~/media/Files/Publications/CR/2018/cr18197.ashx(Accessed 29 Aug 2018).
Senghore Law Practice (2017). Interview with Yassin Senghore: LegalPractitioner in The Gambia. 27 July 2017.
Taf Africa Homes (2018). Interview with Taf Africa Homes Gambia ManagingDirector: Bajen Njie. 27 June 2018.
UNDP (2016). Country Programme Document for The Gambia (2017-2021).https://digitallibrary.un.org/record/835912?ln=en (Accessed 29 Aug 2018).
UNDP (2017). Human Development Indices and Indicators: 2018 StatisticalUpdate: Briefing note for countries on the 2018 Statistical Update: Gambia.http://hdr.undp.org/sites/all/themes/hdr_theme/country-notes/GMB.pdf(Accessed 20 Sept 2018).
UNDP (2017). Support to Support to Entrepreneurship and Private SectorDevelopment for Inclusive Growth, Employment Generation and PovertyReduction Project Document.
World Bank Doing Business. Ease of doing business in The Gambia.http://www.doingbusiness.org/data/exploreeconomies/gambia (Accessed28 Aug 2018).
World Bank. Data: The Gambia. http://data.worldbank.org/country/gambia-the?view=chart (Accessed 28 Aug 2018).
World Trade Organisation (2017). “Trade Policy Review of The Gambia”.WT/TPR/S/365, World Trade Organization, Geneva.https://www.wto.org/english/tratop_e/tpr_e/s365_e.pdf (Accessed 29 Aug2018).
1 WTO (2017). Trade Policy Review of The Gambia.2 World Bank (2018). World Development Indicators.3 Gambia Government (2018). National Development Plan.4 World Bank (2017). World Development Indicators.5 UNDP (2017). Human Development Indices and Indicators: 2018 Gambia.6 Gambia Bureau of Statistics (2017). Integrated Household Survey 2015/2016: Preliminary Survey Findings.7 Gambia Government (2018). National Development Plan.8 IMF (2018). The Gambia: IMF Country Report No. 18/197.9 Ibid.10 Central Bank of The Gambia (2017). Interview with Siaka Bah; Principal at Microfinance Department of the
Central Bank of The Gambia: 3 August 2017.11 Central Bank of The Gambia (2018). Monetary Policy Committee Press Release: 20 May 2018.
12 Home Finance Company (2018). Interview with Home Finance Company (HFC) Managing Director OmarSarr : 27 June 2018.
13 Taf Africa Homes (2018). Interview with Taf Africa Homes Gambia Managing Director: Bajen Njie. 27 June 2018.14 Ibid.15 Amiscus Horizons (2017). Interview with Amiscus Horizons Managing Director, August Prom Jr. 27 July 2017.16 CBG (2017). 17 Ibid. 18 Senghore Law Practice (2017). Interview with Yassin Senghore: Legal Practitioner in The Gambia: 27 July 2017.19 Association of Real Estate Companies (2018). Interview with President Abubakar Bensouda: 26 June 2018.
Africa Housing Finance Yearbook 2018
149
Ghana’s short-term economic prospects are good in spite of challenges with publicdebt and rising expenditure. By year-end 2017, the estimated growth rate was8.5 percent (compared to 3.7 percent in 2016) boosted by increased oilproduction.11 Overall GDP is projected to reach 6.8 percent in 2018, dependentprimarily on an increase in oil and other commodity outputs. The non-oil growthis expected to slow down to 4.3 percent with inflation expected to fall within thetarget range of 8 +/- 2 percent in 2018,12 allowing for more monetary policyeasing and lower interest rates to spur private sector investment. According tothe Bank of Ghana, private sector credit grew to 5.7 percent as at end of June2018 as compared to 2.4 percent as at end of March 2018. However,notwithstanding the positive signals, this performance fell far short of the 15.1percent registered a year earlier. The central bank was still positive in its outlookof the economy, based on the rise in the disbursement of new loans from banksand specialised deposit-taking institutions reaching growth of 24.7 percent year-to-date.
The banking sector is also undergoing significant reforms as part of thegovernment’s efforts to strengthen the financial sector and foster economicgrowth. Minimum operating capital for universal banks has been raised from
Overview In 2017 Ghana went through the third successive government transition from onepolitical party to another, which has assured economic stability and a favourablebusiness environment. Economic performance improved in the first half of 2017,after years of fiscal slippage. The fiscal deficit for the first half of 2017 was2.7 percent of GDP while revenues underperformed at 14.9 percent below theirtarget.1 This underperformance was reversed in the second half of 2017 aspolicies, including a reduction in recurrent and capital expenditure announced inthe first quarter, took effect to keep a fiscal consolidation programme on track.
Annual inflation followed a positive trend as headline inflation was 11.8 percentat the end of December 2017 compared to 15.4 percent in 2016 for the sameperiod.2 This further decreased to 9.8 percent as at May 2018.3 This mainlyreflects a restraint in transport, housing and utilities prices, partially offset by anuptick in food prices. The reduction aided monetary policy easing, and the Bankof Ghana cut the monetary policy rate (MPR) by a cumulative 550 basis pointsfrom 25.5 percent in 2016 to 20 percent at end of 2017. In line with decliningMPR, the average lending rate decreased to 22.9 percent in May 2018 from31.68 percent in December 2016.4
Housing and mortgage finance have experienced several difficulties, as evidencedby the 6 000 mortgages in the country in the face of the 6.6 million households.5
Limited mortgages have been attributed to inadequate capital allocated to long-term financing, persistent gaps in borrower credit appraisals, and difficultmacroeconomic conditions resulting in high interest rates. Industry expertsattribute the high lending rates and limited credit to high non-performing loan(NPL) rates6 which has also made some banks give up on products such asmortgage loans.7 Similarly, housing microfinance has encountered challenges inits consolidation, perhaps worse than mortgages.8 Only 15 of 35 banks offermortgage financing and only five microfinance institutions (MFIs) offer housingcredit products.9 Notwithstanding these challenges, opportunities for improvingresidential housing supply and strengthening inclusive housing finance exist. In June2018, the government announced plans to allow banks to issue securities forpension funds, collective investments and insurance investment portfolios. Thiswill lead to an estimated GH¢300 million of debt issuances every month on theGhana Fixed Income Market by banks.10 This will ensure cheaper pension fundsare available to address the country’s housing delivery and infrastructure needs.
GhanaKEY FIGURES
Main urban centresAccra Kumasi
Exchange rate: 1 US$ = [a] 2 Aug 2018PPP Exchange rate (Local currency/PPP$) 1 Ghanaian cedi = [b]Inflation 2016 [c] | Inflation 2017 [c] | Inflation 2018 [c]
4.52 Ghanaian cedi1.515.40 | 11.80 | 9.80
Population [d] | Urban population size [d] Population growth rate [e] | Urbanisation rate 2016 [f]Percentage of the total population below National Poverty Line [g]Unemployment rate [c]
29 400 000 | 16 100 0002.10% | 3.41%24.0%12%
GDP (Current US$) [h] | GDP growth rate annual [a]GDP per capita (Current US$) 2016 [i]GNI per capita (Current US$) 2016 [b]Gini co-efficient 2015 [j]HDI global ranking 2017 [j] | HDI country index score 2017 [j]
US$42 803 million | 6.8%US$1 380US$1 39042.8139 | 0.579
Is there a deeds registry? Number of residential properties that have a title deed 2017Lending interest rate Mortgage interest rate | Mortgage term (years)DownpaymentMortgage book as a percentage of the GDPEstimated number of mortgages Price to Rent Ratio in City Centre | Outside City Centre [k]Gross Rental Yield in City Centre | Outside City Centre [k]Construction as a % of GDP [c]
Yes5 760n/a28.70% | 2020%4%n/a10.17 | 29.239.83% | 3.4%13.70%
What is the cost of standard 50kg bag of cement? [l] What is the price of the cheapest, newly built house by a formaldeveloper or contractor? (Local currency)What is the price of the cheapest, newly built house by a formaldeveloper or contractor? (US$) What is the size of this house (m2)? What is the average rental price for this unit (US$)? What is the minimum stand or plot size for residential property?
US$7.00
100 000 Ghanaian cedi
US$22 62454m2
n/a650m2
Ease of Doing Business Rank [i]Number of procedures to register property [i]Time to register property (days) [i]Cost to register property (as % of property value) [i]
120647 days6.20%
NB: Figures are for 2018 unless stated otherwise.
[a] Bank of Ghana[b] World Bank World Development Indicators[c] Statistics Ghana[d] Worldometers[e] Worldpopulationreview.com[f] Trading Economics[g] UNICEF Ghana[h] IMF World Economic Outlook Database[i] World Bank Doing Business[j] UNDP Development Indicators[k] Numbeo[l] Ghacem.com

150
GH¢120 million to GH¢400 million13 for a deadline of December 2018. Thesereforms respond to the accumulation of the serious management inefficienciesfrom previous years which saw NPLs increasing to 8.4 percent in 2016. At present,only a few banks have complied with, or are close to realising, the new CapitalRequirement Directive.14 These programmes are expected to help createstronger banking institutions, improve credibility and augment the sector’scontribution to the economy.
Access to finance Since independence in 1957, at the end of April 2018 the Ghanaian financial sectorhad grown from two banking institutions to 37 licensed banks,15 564 licensedinstitutions (MFIs), 64 nonbank financial institutions, and one mortgage house.Through the Ministry for Works and Housing, the government actively seeks toexpand affordable housing finance through the civil servant loan schemes. Theintention is to invigorate this scheme with new budgetary grants to provide lowercost mortgages targeting public servants. In addition, efforts have been made in2018 by the Ministry of Finance to obtain lower cost credit from the nationalpension scheme. This will lead to monthly debt issuances of up to the equivalentof US$65 million by commercial banks,16 very supportive of affordable housingfinance in the country.
Growing demand in (lower income) housing combined with the lack ofaffordability bolstered an increase in the variety of mortgage products, althoughmortgage debt to GDP, from 0.37 percent (2007) to 0.25 percent (2010), remainsinsignificant compared to other developing economies, averaging 13 percent acrossAfrica between 2004 and 2009.17 In part, the global financial crisis affected themajority of borrowers made up of foreign-based Ghanaians. Two principalconstraints to mortgage market growth are high interest rates and the limitedsupply of affordable housing. However, mortgage lending remains relatively well-established in Ghana.18
Currently, 15 of Ghana’s 37 commercial banks officially offer different mortgageloan products. Ghana Home Loans (now GHL Bank), is the dominant player andmarket leader in the industry, accounting for about 50 percent of the market share.Due to the immature financial market in Ghana, GHL Bank relied mainly on foreigncurrency from development finance institutions (DFIs) for long-term funds until2017, when it acquired a universal banking licence to operate.19 It now has theopportunity to raise (short-term) funds from deposits. Other major players withinthe Ghanaian mortgage market include Republic Bank (formerly HFC Bank),Fidelity Bank, Cal Bank, Stanbic Bank, Bank of Baroda and the Construction Bank.
Addressing the housing deficit of almost two million remains daunting as theslowdown in economic activities in the last years forced some banks in Ghana togive up on mortgage loans. Long-term funds have diminished,20 coupled with therising cost of capital, weak compliance, and high non-performing loans (NPL ratioincreased from 17.3 percent in 2016 to 22.7 percent in December 2017).21
Demand for mortgages has also decreased due to high interest rates on homeloans, although there was a marginal decrease from 31.5 percent in March 2017to 30.2 percent as at December 2017.22 Over the period, Barclays Bank chargedthe highest interest rate on mortgages (38.5 percent) with the lowest rate beingoffered by Bank of Baroda (22.0 percent). Maintenance of taxes on interestsearned on mortgages constrains the reduction of interest on mortgages. On theCAHF dashboard on housing affordability and mortgage (2016), it indicates thata US$10 000 housing loan over 20 years would require an average of US$242 amonth and, at an interest rate of 29 percent, would accumulate to US$60 189 inrepayments by the end of the period. For such a loan, only 3.4 percent of theurban population would be eligible.23 The future does not portend well unlessthere is significant change in this situation.
In addition, the underdeveloped capital market has constrained long-term fundingand reliance on shorter-term deposits among the few banks offering mortgageloans endangers mortgage lending. Besides the DFIs, Republic Bank and GHL Bankhave in the past relied on multilaterals agencies – World Bank, International FinanceCorporation, among others – to raise funds for their operations. Borrowing inforeign currency has driven mortgage institutions to lend to borrowers earning inforeign currencies (whether resident or non-resident) to mitigate against currencyfluctuation risk and exchange rate losses. Local currency mortgages are available,
albeit at much higher interest rates. Republic Bank reported dollar mortgageinterest rates between 12 percent and 13.5 percent in 2015. In contrast, cedimortgages had interest rates between 28 percent and 31 percent for the sameperiod. The preference for foreign currency borrowers over those in Ghanaiancedi is indicative of the constrained affordability. Foreign currency mortgages alsolimit the mortgage institutions from wide coverage down the income spectrum.Lastly, the mortgage loan products do not synchronise with the incrementalhousing development approach of the majority of households, more attuned tocycles of smaller loans.
Ideally, MFIs could be a viable solution to the future development of affordablehousing finance. Although MFIs presently number 2 234 in the country, only a fewlend specifically for housing.24 There are five housing MFIs in the country, operatingprimarily in southern Ghana.25 These MFIs providing housing loans charge interestrates far above local currency denominated mortgages by as much as 15 percentfor two to three-year durations. Much remains to be done to improve the housingmicrofinance market including linking commercial banks and MFIs to theincremental housing process, the dominant form of affordable housing constructionin the country. Innovation is urgently needed to diversify and strengthen thehousing finance sector to engender substantial gain.
Affordability Formal housing is out of reach for many in Ghana – despite government policyefforts – due to the combination of continuous price increases in building materialsand land, especially in newly urbanised areas, and a lack of cheaper housing finance.Many households live in informal, overcrowded and substandard housing that lacksbasic infrastructure, such as water, electricity and sanitation. House prices in Ghana,relative to income, are more expensive than in most African countries. Blue RoseGroup, the only formal developer innovating for affordable housing, offers newlybuilt one-bedroom (54m2) house at US$22 624.26 The Ghana Real EstateDeveloper Association (GREDA) notes that the least expensive house as at 2017,available on the periphery of Accra, costs between US$55 211 and US$67 633.However, the US$22 625 house would still be unaffordable to over 95 percent ofGhana’s urban population considering monthly mortgage repayments relative tohousehold income of urban residents estimated at US$4 735 (GH¢20 930).27 Atpresent, the mortgage interest rate is 28 percent over 20 years compared to33 percent in 2017.
To boost access to affordable housing, the government inaugurated a US$180million project in 2016 to produce 5 000 units in the Ningo-Prampram District inthe Great Accra Region. About 40 percent of the houses are to be sold atsubsidised rates for low and middle income earners in the country. As at 2017,the first phase of construction, comprising 1 500 housing units, had beencompleted, although these units are not yet occupied because the off-siteinfrastructure is still not in place.
The 2015 National Housing Policy recommended establishing a national housingfund to offer decent and reasonable mortgages, slum upgrading and support forsmall-scale local building material manufacturers. However, it remains to berealised.
Housing supply and the property marketGhana's population has grown at an annual rate of 2.1 percent in the last decade,with approximately 54.4 percent of the country's population now residing in urbanareas.28 This urban population is expected to grow by 3.4 percent a year due toa combination of natural growth and internal migration. The housing deficit isestimated to be in excess of 1.7 million units as at December 2015, with anincrease in annual demand for housing units of over 60 000 affordable housingunits. The housing stock in urban Ghana was 3.4 million units according to the2010 census, annually requiring 70 000 to 90 000 housing units to be delivered.29
Despite a widening deficit, the parastatal agencies Tema Development Corporationand State Housing Corporation were only able to deliver 24 000 units between1957 and 1990.30
Besides government’s efforts, private sector developers’ activity in housing supplyhas been sorely inadequate. Most of the high-end residential estate is deliveredby the members of GREDA with a total annual output of 4 500 housing units.The 85 000 transactions a year in real estate,31 estimated by Ghana Investment

Africa Housing Finance Yearbook 2018
151
Promotion Centre with an approximate value of US$1.7 billion32 caters for therich only. The majority of housing, about 90 percent of the total, is delivered byindividuals and the most common building method is incremental construction,where owners self-manage, relying on craftsmen and tradesmen to buildprogressively, dictated by availability of funds. This trend has implications on thequantity and quality of the dwellings. The result has been overcrowding, particularlyin urban areas, evidenced in the Greater Accra Region, with 61 percent ofhouseholds occupying single-room house with a family size of 3.8 people,33 fuellingthe proliferation of slums as the only option for low income households.
The removal of the five percent value added tax (VAT) on real estate transactionsin 2017 is yet to boost housing production as expected. The maintenance of theeight percent rent tax and the VAT on imported materials for residentialconstruction, despite calls by developers to scrap these taxes, limit the opportunityfor mass production.34 It is argued that scrapping such taxes related to affordablehousing development would reduce the costs associated with low to middleincome housing supply.
The cost of land is another important factor contributing to unaffordable housing.Land is beset by social, political and economic challenges complicated by highdemand, which has resulted in disputes in a lot of cases.35 Slow land titling andregistration processes further hinder the property market.36 Multiple ownershipclaims on land plots often cause formal builders and housing finance institutionsto withdraw their participation from such projects. Currently, it takes betweenone to three years to receive land title registration although the Ministry of Landsand Natural Resources is trying to reduce this to 30 days through the GhanaEnterprise Land Information System.
Policy and regulations The 2015 National Housing Policy aims for “an enabling environment for housingdelivery” targeting the low income sector.37 The policy follows longstandinglegislative and institutional efforts to remove restrictions in the housing market tobolster private investments in residential construction and housing finance. Thecurrent administration favours the proposed National Housing Fund anddiscussions have ascribed two purposes for its functions: subsidising the cost ofhousing for the low income sector and restructuring mortgages to make monthlypayment obligations more affordable. The latter mimics the path that led to thefailed Bank for Housing and Construction (BHC), established in 1974 as agovernment-owned entity but forced to close in early 2000 due to excessivedefault in spite of the interest subsidies. In part, the BHC also had no legal meansto recover losses from delinquent borrowers without lengthy adjudication as perthe Mortgage Decree of 1973.38 In 2008, the Home Mortgage Finance Actattempted to resolve bottlenecks and protect mortgage lenders.
Since 2007, the Credit Referencing Bureaus (CRBs), created by the CreditReporting Act, permits CRBs to determine credit risks of borrowers using a data-
rating tool for financial and non-financial institutions. Today, millions of Ghana’sbanked population have credit scores due to the screening efforts of the threeCRBs: XDS Data Credit Referencing Bureau, Hudson Price Credit Bureau, andDun & Bradstreet Credit Bureau Limited. The provision of credit screening hasmotivated borrowers to meet payment obligations to minimise denial of loansdue to past delinquencies or defaults. Even though there are tangible results fromthe CRBs, much remains to be done on credit screening as the trio of ratings’institutions covers only an estimated 10 percent of Ghana’s adults.39
To improve on land use management, a number of pieces of legislations have beenpromulgated under the Land Administration Project (LAP).40 The Land Use andSpatial Planning Act, 2016 (Act, 925) aims to streamline processes of land useplanning. When effectively implemented, it will reduce the number of procedures,time and cost to register property, leading to lower mortgage costs for residentialhousing. In addition, the Local Governance Act, 2016 (Act, 936) promotes effectivelocal administration by speeding up the building permits processes. The Lands Bill,2017 approved by Cabinet last year, drives towards sustainable land administrationand management, and effective land tenure in the country. A consequence of animproved land registration system in Ghana would be the reduction of costs ofhome loans, especially unsecured housing microfinance, as well as a considerablereduction of cost of properties.
OpportunitiesThe current government has sought to address the multifaceted challenges facingthe housing sector through innovative approaches. Their manifesto promises towork with organised labour groups to drive housing for all has significant, but asyet unrealised, prospects, given the multitude of such groups in Ghana and theirsubstantial land holding.41 Prime-Stat (2017) found that 13 cooperative creditunions sampled held 640 hectares of land in the periphery of the Accrametropolitan area, in dire need of affordable housing finance and infrastructurecomprising roads, drainage, water and power.
Policymakers would need to focus on stabilising the macroeconomic environmentto create the necessary conditions for long-term lending because the success ofa housing finance market largely hinges on the macroeconomy. Prudentmanagement of the economy will create greater opportunities for developing aneffective mortgage market in the country and improve investor confidence in theoperations of the capital market.
The profound increase in land prices, driven in part by urbanisation, has drivendevelopers towards upscale multi-family development throughout Ghana’s cities.Condominium units are prime for growth as they can also be targeted at lowincome households instead of detached housing units. Historically, the publicpension fund in Ghana, the Social Security and National Insurance Trust (SSNIT),has invested in the development of residential flats across urban areas.42 Theresulting 7 168 flats produced is a pointer for institutional investors and developersseeking to address housing needs in an affordable and accessible manner for lower
Source https://www.cgidd.com/
PPP$40 001 – PPP$10 000 000
PPP$23 001 – PPP$40 000
PPP$12 001 – PPP$23 000
PPP$8 001 – PPP$12 000
PPP$5 001 – PPP$8 000
PPP$3 601 – PPP$5 000
PPP$2 401 – PPP$3 600
PPP$1 601 – PPP$2 400
PPP$801 – PPP$1 600
<PPP$800
- - - Average annual household income needed for the cheapest newly built house by a formal developer, 2017 Average annual household income using expenditure, 2017 (PPP$)
GHANA
Annual income profile for rural and urban households based on consumption (PPP$)
No. of households (thousands)
PPP$15 851
PPP$61 438
Rural Urban1 500 1 000 500 0 500 1 000 1 500
Population: 29 400 000
Urbanisation rate: 3.41%
Cost of cheapestnewly built house:
100 000 GHSPPP$66 667
Urban householdsthat could afford thishouse with finance:
7.37%
1 PPP$: 1.5 Ghanaian cedi

152
income Ghanaian households. The challenge remains the viability of this approachfor the pension funds as exemplified in the ongoing quest by the governmentcompelling a reduction, and implicitly a subsidy, in the house pricing for an ongoingdevelopment, albeit without any transfers to the national pension fund, SSNIT, thatfunded the project.43
With most households in rental arrangements, particularly in urban areas, somefinancial institutions are experimenting with tenancy purchase arrangements toprovide loan instruments for renters aspiring to become homeowners. With thehigh costs of home purchase and the disposition to rent, such housing financearrangements can potentially have strong appeal.
Ghana has longer term maturity assets available through life insurance and pensionindustries, with the life insurance industry seen as a leader in the West Africa sub-region. However, in 2014, this financial sub-sector, at 3.07 percent, lagged in marketpenetration behind South Africa (13.39 percent) and Kenya (3.17 percent)respectively.44 Strengthening the life insurance sector can in turn stimulate longer-term asset allocation better suited for investment in housing finance.
The proposed plans and ongoing discussions to issue securities for banks toborrow from the pension funds to make housing loans, as earlier outlined, needsto crystalise quickly. As things stand, SSNIT is not short on funds, as it remains thelargest institutional investor in the Ghana Stock Exchange,45 demonstrating thatthe opportunity for channelling of capital into mortgage debt securities is prime.In addition, workers can use their second-tier contributions to reduce downpayment requirements and assist homeownership long before retirement.46
Notably, it is also possible for workers employed in informal sector work to fallon their privately controlled Tier 3 pension fund47 contributions to accessmortgage loans.48
Lastly, there is potential for microlenders and community-based credit unions tothrive with incremental land and housing products. With the right terms, thesealternative products can flourish, especially as an overwhelming majority ofGhanaians prefer to build their homes in a piecemeal manner as they accumulatefunds. Furthermore, as borrower’s complete repayment obligations on othermicroloans, lower and irregular income beneficiaries can have the means ofattaining a credit rating aligned with the industry standards of the CRBs. This canlead to greater opportunities in providing those with moderate and variableincomes a feasible means to eventually use shelter-financing products that servethe housing needs of the many throughout Ghana.
It is evident there are financial and policy-based opportunities to reduce risks andminimise high interest rates for mortgages and microloans to promote inclusiveaccess to housing finance.49 Certainly, further facilitation is required to make theseopportunities demonstrably material for prospective investors.
Additional sourcesAdusei, M. (2016). Modelling the efficiency of universal banks in Ghana.Quantitative Finance Letters, 4(1), pp. 60-70.
Government of Ghana (GoG). (2015). National Housing Policy. Ministry ofWater Resources, Works and Housing, Accra, Ghana.
World Bank, (2003). Project appraisal document on a proposed credit in theamount of SDR 15.1 million (US $20.5 million equivalent) to the Republic ofGhana for a land administration project.
1 Stanbic Bank Ghana Limited (2017). 2 Government of Ghana (2017). 3 Bank of Ghana (2018). Banking Sector Report, January 2018. 4 Ibid.5 Ghana Statistical Services (GSS) (2014). GLSS Round 6: Main Report. 6 Stanbic Bank Ghana Limited (2017). 7 Teye, J. K., Teye, I., & Asiedu, M. O. (2015). Pgs. 1-16. 8 Bondinuba, F. K., Karley, D. N. K., Biitir, S. B., & Adjei-Twum, A. (2016)..9 Government of Ghana (2017).10 “Govt plans GH¢300m monthly debt issuance for pension funds” 3 July 2018. https://www.myjoyonline.com/business/2018/July-3rd/govt-plans-gh300m-monthly-debt-issuance-for-pension- funds.php
11 Bank of Ghana (2018). https://www.bog.gov.gh/privatecontent/MPC_Press_Releases/Summary_of_Economic_ and_Financial_Data_July_2018.pdf
12 Government of Ghana (2017).13 Bank of Ghana (2017). 14 In a press release, the Governor of the Central Bank announced that of the 37 licensed banks, six had already met
the new capital requirement and two more were within reach of compliance (although press reports of the eventindicated that it was nine of the remaining that would meet the requirements by the deadline). [See Item 17 ofPress statement - https://www.bog.gov.gh/privatecontent/MPC_Press_Releases/MPC%20Press%20Release%20-%20July%202018.pdf; For press report on Bank of Ghana press conference, see https://www.ghanaweb.com/
GhanaHomePage/business/15-banks-set-to-meet-GH-400m-minimum-capital-Bank-of-Ghana-671217] 15 As at the time of finalizing the report, the Central Bank had withdrawn the banking license of seven of these banks
for variety of fraudulent infringements of the banking regulations. 16 “Gov’t plans GH¢300m monthly debt issuance for pension funds” 3 July 2018. https://www.myjoyonline.com/ business/2018/July-3rd/govt-plans-gh300m-monthly-debt-issuance-for-pension-funds.php
17 Ghana Home Loans (2016). 18 The estimated market value as at 2013 was about US$180 million, representing an increase of US$50.78 over the
2008 figure - US$126.223.19 Ghana Home Loans (2017). 20 “Why big banks in Ghana are fleeing the mortgage market.” https://ghanacompares.com/big-banks-ghana-fleeing-
mortgage-market/21 Bank of Ghana (2018). Banking Sector Report, January 2018. See also: https://ghanacompares.com/big-banks-ghana-
fleeing-mortgage-market/22 Bank of Ghana (2018). Annual percentage rates and average interests paid on deposits as at 31st December 2017. 23 Centre for Affordable Housing Finance Mortgage Calculator. http://housingfinanceafrica.org/dashboards/calculating-
mortgage-housing-affordability-africa/ 24 Bondinuba, F. K., Karley, D. N. K., Biitir, S. B., & Adjei-Twum, A. (2016). 25 Ibid.26 Online housing advertisement at blueroselimited.com See http://www.blueroselimited.com/bluerose-ongoing-
bluerosecity-project?id=6727 Ghana Statistical Service (2016). 28 Ghana Statistical Service (GSS) (2013). 2010 Population and Housing Census: National Analytical Report. 29 Ghana Statistical Service (GSS) (2014). 2010 Population and Housing Census: Housing in Ghana – October 2014.
http://www.statsghana.gov.gh/docfiles/2010phc/Mono/Housing%20in%20Ghana.pdf. (Accessed 24 July 2018).
30 Tipple, A. G., & Korboe, D. (1998). Housing policy in Ghana: Towards a supply-oriented future. Habitat International,22(3), pp. 245-257.
31 This high number does not represent individual units for each transaction but rather includes multiple paymentsmade in stages for the same properties.
32 Mega African Capital Ltd (2013). Prospectus – 19 December 2013. 33 Awanyo, L., McCarron, M., & Morgan Attua, E. (2016). “Affordable housing options for all in a context of developing
capitalism: Can housing transformations play a role in the Greater Accra Region, Ghana?”, African GeographicalReview, 35(1). Pgs. 35-52.
34 Government of Ghana (2017). 35 Mireku, K. O., Kuusaana, E. D., & Kidido, J. K. (2016). Legal implications of allocation papers in land transactions in
Ghana – A case study of the Kumasi traditional area. Land Use Policy, 50. Pgs. 148-155.36 Owusu, G. (2016). Housing the Urban Poor in Metropolitan Accra, Ghana: What is the Role of the State in the Era
of Liberalization and Globalization?, Alternative Development: Unravelling Marginalization, Voicing Change, p. 73.37 Government of Ghana (2015). 38 Quansah, D. P., & Debrah, A. A. (2015). Sustainable Housing Finance in Ghana: The Way Forward. Real Estate Finance.39 Kusi, B. A., Agbloyor, E. K., Fiador, V. O., & Osei, K. A. (2016). “Does Information Sharing Promote or Detract from
Bank Returns: Evidence from Ghana?” African Development Review, 28(3). Pgs. 332-343. 40 The Land Administration Project is a long-term land administration reform programme, initiated in 2003, to
implement key policy actions recommended in the National Land Policy. LAP I (2003 – 2011) was aimed at landpolicy and institutional reforms and key land administration pilots to lay a foundation for a sustainable decentralisedland administration system that is fair, efficient, cost-effective and that assures land tenure security. LAP – II is underimplementation, with the objective to consolidate and strengthen land administration and management systemsfor efficient and transparent land service delivery. See World Bank (2003) for further details.
41 New Patriotic Party (2016). Manifesto for election 2016: Change, An agenda for job - Creating Prosperity & EqualOpportunity for All. (pg. 84 – 86).
42 Amankwah, O., Pratt, I., & Kootin–Sanwu, V. (2017). Sustainable Management and Maintenance Practices ofMultifamily-Shared Residential Buildings in Ghana. African Journal of Applied Research (AJAR), 3(1). Pgs. 59-71.
43 GhanaWeb. “GHC25,000 affordable housing units now GHC220,000 - Dept. Works and Housing Minister”. 5 Oct2017.
44 Meristem (2014) The Nigerian insurance sector: rich hunting ground for investment. The Nigerian insurance industry,2014 Sector Report.
45 Abels, M., & Guven, M. U. (2016). Pension Systems in Sub-Saharan Africa: Brief Review of Design Parameters andKey Performance Indicators (No. 109428). The World Bank.
46 Donkor-Hyiaman, K. A., & Owusu-Manu, D. (2016). “Another look at housing finance in Africa: the anatomy ofpension asset-backed housing financing”. International Journal of Housing Markets and Analysis, 9(1). Pgs. 20-46.
47 “The First Tier is the Basic National Social Security Scheme for all workers in Ghana. It is a defined benefit schemeand mandatory for workers to have 13.5% contributions made on their behalf. The contribution is managed bySSNIT. The Second Tier is a defined contributory Occupational Pension Scheme mandatory for workers with 5%contribution made on behalf of members. The contribution is managed privately by approved Trustees. The ThirdTier which includes all Provident Funds and all other Pension Funds outside Tiers I and II is a voluntary scheme.”Source: https://www.ssnit.org.gh/faq/the-new-pension-scheme/
48 Darko, E. (2016). The Effectiveness of the Current Three-Tier Pension Scheme in Providing Adequate Social Securityfor Ghanaians: Evidence from the Eastern Region of Ghana (Doctoral dissertation, University of Ghana).
49 Owusu-Manu, D., Pärn, E. A., Donkor-Hyiaman, K., Edwards, D.J., & Blackhurst, K. (2016). The relative importance ofmortgage pricing determinants in mortgage affordability in Ghana: An ex post attribution. Journal of Engineering,Design and Technology, 14(3). Pgs. 563-579.

Africa Housing Finance Yearbook 2018
153
Guinea
contracts.4 There are no pension-backed funds supporting housing finance inGuinea.
The Government of Guinea (GOG) adopted the Plan National de DevelopmentEconomique et Social (PNDES) in Paris in 2016. It is structured around fourobjectives: improve governance, diversify the economy, reinforce human capital,and improve resource management. The GOG was able to rally the internationalcommunity and foreign investors who promised GNF 180 200 billion (US$20billion) to support PNDES. To date, the GOG has crafted 50 structured projectsin infrastructural development, but housing development is yet to be financed.
Successive governments have failed to address the country’s crumblinginfrastructure and housing development. In social housing, the government led byPresident Alpha Conde has introduced a number of policies and rules such as theLand Code, Code of Investment, Code of Construction and Housing, Tax Code,Customs Code, and public private partnerships. The GOG has set up the SociétéNationale de l’Aménagement et de la Promotion Immobilière (SONAPI, NationalSociety for Planning and Real Estate Development), mainly devoted to planning,
OverviewGuinea is a member of the Economic Community of West African States(ECOWAS). Conakry, its capital city, is where most of the country’s economicactivities are centred. It has approximately 13 million people, the world’s largestdeposits of bauxite and untapped iron ore reserves,1 and high quality gold anddiamonds. Guinea also has fertile soils, regular rainfall and is the source of severalWest African rivers including the Gambia, Senegal and Niger. The country’s hydro-potential makes it a potential exporter of electricity. The country’s agriculturesector has at least six million unexploited hectares of arable lands. It is expectedto be a powerhouse and an exporter of natural resources.2
Guinea has one of the poorest populations in the world according to the UNDPHuman Development Index score of 0.414, ranking 153 of 190 countries. Theoutbreak of the Ebola epidemic in 2014-2015 had a devastating effect on the stateof Guinea. In 2015, the country stood at 0.1 percent growth with a budget deficitof more than seven percent of GDP.
The housing backlog is estimated at 250 000 units over the next five years. Atotal number of 1 253 154 households and an annual population growth rate of2.64 percent, coupled with rural exodus and uncertain incomes, makes it difficultfor the financial sector to avail long-term financing for low and middle incomefamilies.
When the country was declared Ebola-free, the economy grew approximately to6.6 percent in 2016 and 6.7 percent in 2017 and it is forecast to reach a growthrate in real GDP of 5.8 percent in 2018.3 Following a double-digit inflation ratein 2010, the overall price level in terms of inflation was below 10 percent in 2017,and is forecast to fall below eight percent in 2018.
The percentage of total population below the poverty line is 55.20 percent withan average daily income of US$1.90. The unemployment rate is 6.3 percent andis acute among the youth.
The health and economic crises have affected investment in the housing sector.The average leading interest rate is between 12 percent and 17 percent. There isno available information on the mortgage rate, and mortgage financing is notgenerally covered by Guinea’s banks, which are dominated by short-term lending
KEY FIGURES
Main urban centresConakryKindia
Exchange rate: 1 US$ = [a] 25 Jul 2018PPP Exchange rate (Local currency/PPP$) 1 Guinean franc = [b]Inflation 2016 [c] | Inflation 2017 [c] | Inflation 2018 [c]
9 005 Guinean franc3 386.19.00 | 8.60 | 9.80
Population [d] | Urban population size Population growth rate [d] | Urbanisation rate [e]Percentage of the total population below National Poverty Line [b]Unemployment rate [f]
13 050 000 | 4 913 3252.60% | 3.64%55.0%6.3%
GDP (Current US$) 2017 [b] | GDP growth rate annual 2017 [b]GDP per capita (Current US$) 2017 [b]GNI per capita (Current US$) 2017 [b]Gini co-efficient [g]HDI global ranking 2016 [h] | HDI country index score 2016 [h]
US$10 491 million | 12.7%US$824US$82033.7183 | 0.414
Is there a deeds registry? [i]Number of residential properties that have a title deed [i]Lending interest rate Mortgage interest rate | Mortgage term (years)DownpaymentMortgage book as a percentage of the GDPEstimated number of mortgages Price to Rent Ratio in City Centre [j] | Outside City Centre [j]Gross Rental Yield in City Centre [j] | Outside City Centre [j]Construction as a % of GDP [l]
Yes210 57114.50%2.50% | 233%n/an/a11.60 | 12.50n/a | n/an/a
What is the cost of standard 50kg bag of cement? What is the price of the cheapest, newly built house by a formaldeveloper or contractor? (Local currency)What is the price of the cheapest, newly built house by a formaldeveloper or contractor? (US$) What is the size of this house (m2)? What is the average rental price for this unit (US$)? What is the minimum stand or plot size for residential property?
US$7.75
180 000 000 Guinean franc
US$20 00090m2
US$500250m2
Ease of Doing Business Rank [k]Number of procedures to register property [k]Time to register property (days) [k]Cost to register property (as % of property value) [k]
153644 days9.00%
NB: Figures are for 2018 unless stated otherwise.
[a] Banque Centrale de la République de Guinée [b] World Bank World Development Indicators[c] Statistics Guinea[d] Worldpopulationreview.com[e] Fortune of Africa[f] TheGlobalEconomy.com[g] Knoema.com[h] UNDP Development Indicators[i] Ministry of Housing and Urban Planning - Guinea[j] Guinea National Revenue Authority[k] World Bank Doing Business

154
identifying real estate developers, allocating lands and promoting affordable housingfor people in the low income bands. The income bands in Guinea vary from lessthan GNF 1 million (US$111) for a total number of 807 017 households, toGNF 1 000 001 to 5 000 000 (US$111-US$555) for 285 726 households toGNF 5 000 001 to GNF 10 million (US$555-US$1110) for 103 265 householdsand finally more than GNF 10 million (US$1 110) for 57 145 households.
Access to financeGuinea’s financial sector is small and dominated by the banking sector whichincludes the Central Bank of the Republic of Guinea, 15 commercial banks, fiveinsurance companies, two Loans and Credit Associations and Mutual Funds foryouth and women. Credit conditions are favourable for women and the youth.According to Gana Doré, the credit terms are a 1.5 percent interest rate with ashort-term repayment period for an amount below GNF 45 million (US$4 995.56)and two percent over the same period for an amount above GNF45 million.5
These loans allow most of them to rise above the poverty line. For the mutualfunds, called the President’s Initiative for Poverty Alleviation among Youth andWomen, the figures show that approximately a total amount of GNF 130 billion(US$ 15 million) has been channelled through Afriland First Bank, with supportfrom Agence Nationale des Institutions de Microfinance (ANAMIF).6
Unfortunately, the financial sector keeps these figures confidential.
The financial sector does not contribute much to financing housing development,and is mostly concerned with short-term activities such as merchandise trade.7
However, banks such as Banque Islamique de Guinée provide constructionfinancing with terms based on Islamic finance law.8 The most important housingfinance was done by First International Bank – for 30 years with an interest rateas low as two percent a year – with Chinese Drill Group (CDG), considered thedominant developer in the sector in Guinea, with a loan estimated at GNF 225.2billion (US$25 million) under the Plaza Diamond project.
Most commercial banks do, however, provide construction finance to nationalprivate companies. Among them are EcoBank, Banque Internationale pour leCommerce et l’Industrie de Guinée and Banque Islamique de Guinée. Beneficiarycompanies, such as SOGEFEL SA and Guico Press SA, develop constructionprojects and affordable housing through the government’s public privatepartnerships.
The GOG has financed billions in local currency in partnership with these entities.For the Independence Day construction projects rotating between theadministrative regions, for instance, the GOG has financed GNF 250 billion(US$27 753 140) for the sole region of Kankan.
Affordability According to World Bank figures, 55.20 percent of the population live below thepoverty line of US$1.90 a day. The main challenges remain youth unemploymentand urban poverty which increased from 23.5 percent in 2002 to 37 percent in2018. The rural exodus, unemployment among the rural and urban femalepopulation, a shortage of public services such as healthcare, education, security,decent housing, sanitation facilities, and food security are part of the challengesthe country faces in 2018.
The types of affordable housings are F2, F3 and F4, respectively two, three andfour rooms. Most people with an income band below GNF 1 million (US$111)can afford slums, those below GNF five million (US$555) can afford F2, those withless than GNF 10 million (US$1110) can afford F3 and people with higher incomescan afford F4. The Code of Construction and Housing considers a bedroom andliving room as a room as well.
In cities such as Conakry where population growth is constantly increasing, thereis a disturbing development of slums but no move to make-shift housing yet. TheGOG provides different types of subsidies to developers in the form of tax breaksand tax incentives. These subsidies include land provision and duty-free importfor construction material and equipment. Nevertheless, the greatest challengethe country faces is how to provide decent housing for slum populations, low, andmiddle income groups. To support such policies, the GOG has created four publicentities: SONAPI, Mortgage Guarantee Fund (FGH), Mortgage Securitization Fund(FSH) and National Fund for Habitat and Urban Planning (FNHU). To date, thelast three entities are yet to function.
Housing supply Due to lack of reliable developers and financing options in Guinea, peopleinformally build their houses by themselves. It takes a typical Guinean on averagebetween 10 and 15 years or more to finish their house. Most of the constructionmaterials are locally produced, except heavy equipment imported from Westerncountries as well as South Africa, which provides the machines used to makeblocks. SONAPI designs new developments to build less expensive houses usingbricks on stabilised land. The houses built with this material are traded atreasonable prices between GNF 180 159 800 (US$20 000) to 261 231 710(US$29 000) for F2.
The gap between housing supply and demand is a critical issue. The housingbacklog is estimated at approximately 250 000 units over five years. The mostvulnerable populations are teachers, youth and women with an income band farbelow GNF 5 million (US$555). In attempts to fill that gap, the GOG haspromoted policies such as the public private partnership agreement with privatereal developers, including with CDG to build approximately 200 000 houses inthe areas from Kipé to Cobayah in Conakry. The GOG has signed seven otheragreements with foreign companies and national developers for the constructionof hundreds of social housings. The major private developers are CDG, KakandéImmo, AKC Groupe and SOGEFEL SA.
The trade unions represented by the teacher’s union in Guinea and the NationalConfederation of Workers signed a project with Association pour leDéveloppement de l’Habitat Social, with the support of the GOG, to construct638 housing units. It has been indicated that the types of the housing units to bebuild are F2, F3, F4, and condominium. The project, located at Keitaya nearDubreka, was scheduled to start in 2015. Unfortunately, it has not yet starteddue to lack of funding by the government. The materials used are locally producedand made from blocks, concrete, cement, sand, concrete iron, wood, timber,corrugated sheets and sheet metal. The land size varies between 70m2 and 250m2
for F2, F3 and F4, while the size is larger for the condominium.
The housing market in Guinea comprises of 70 percent of rental housing with anaverage price in the city centre equal to GNF 9 007 999 (US$1 000) and outsidethe city equal to GNF 4 503 999.5 (US$500). According to the Guinea NationalInstitute of Statistics census data, there were 1 253 154 households in 2012.
Property marketsAccording to Doing Business, Guinea is making steady progress in improving thebusiness environment for property rights. In 2010, the cost of registering propertywas lowered; in 2013 Guinea made obtaining a building permit less expensive. In2014 the country made transferring property easier by reducing the propertytransfer costs; and in 2015, the registration of property was made easier. It nowcosts 8.9 percent of the total cost of the property and takes 44 days to register awarehouse, involving six procedures. In 2018, the country ranked a record low of153 of 190 countries.
Since 2010, the GOG has been implementing reforms such as, but not limited to,the Code of Construction and Housing and Land Code, designed to frame landrights. To date, almost 10 percent of the properties are registered. The governmentowns land. Private land is governed by customary and traditional laws. With theassistance of the government of Morocco, a technical mission of the Ministry ofHousing Development and Urban Planning is implementing a process to registerland by digitalising them and delivering land titles free of charge. Prices in theformal market are beyond reach for low and middle income families in the citycentre and outside the city. The average rental price in the city centre is GNF ninemillion to GNF 18 010 000 (US$1 000-US$2 000) for office space andGNF905 000 to GNF 4 502 500 (US$100-US$500) for residential rent. The rentalprice in Kipé varies on average between GNF 9 009 999 and GNF 10 809 000(US$1 000-US$1 200) for office space, and GNF 1 801 598 to GNF 4 503 999(US$200-US$500) for residential rent. In the city centre and near Kipé areas inConakry, 500m2 costs approximately GNF two billion (US$222 025.11). OutsideConakry, in Coyah for instance, the same size of land is priced on average at GNF120 million (US$13 321.50). Because of the exponential increase of these prices,more people rent rather than own houses, thus putting upward pressure on rentalprice.

Africa Housing Finance Yearbook 2018
155
There are formal and informal real estate agencies in Guinea. The most importantare Agence Guinée Immobilier, Société Immobilière de Guinée, CompagnieInternationale d’Aménagement et de Déménagement, Agence Immobilière Fina,Agence Immobilière Titi Camara, CIC Guinée, COGEST SA and Guinée Home.
The International Finance Corporation has commissioned work on a housingmarket diagnostic for Guinea. The housing backlog in Guinea is estimated at250 000 units over the next five years and is steadily increasing with the growingpopulation growth rate, and rural exodus. Given that population growth is at2.64 percent per annum, the shortage will continue unless there is a majorexpansion of the housing stock enabled by policy reforms and the developmentof financing options.
Policy and regulationTo promote access to land and decent housing in Guinea, the GOG has set policiesand reforms on financing options and property rights including homeownershipand landownership. The GOG should reinforce institutional and human capacityin the construction sector, because the institutional framework is weak, and notwell oriented to address the housing backlog. It should also improve productivityand affordability in the housing sector as a policy response to the crisis thatcontinues to limit the involvement of the private sector in the sector. It is ofparamount importance that the GOG promote the financing option to increaseaffordability, and create and reinforce the role of agencies such as mortgagefinancing institutions and pension-backed funds. Finally, the GOG should promotepolicies that increase land availability and manage urban growth. In this view, toolssuch as SONAPI, FGH, FNHU and FSF are important instruments.
Among the policy instruments is the Land Code of 2015, which sets rules andregulations for land ownership in Guinea.9 The Code states that the state, as wellas other private individuals and legal entities, may hold title to the land and buildingsit carries, and exercise it according to the rules of the Civil Code and those of thisCode. The right of ownership confers on its holder the enjoyment and freedisposition of the property which are the object, in absolute terms. And this rightis exercised in compliance with the limitations imposed by the general interest ofthose provided for by the legal provisions.
The New Code of Investment was adopted by the National Assembly andpromulgated by the GOG in 2012.10 It outlines the legal and administrativeframework designed to ease the conditions for domestic as well as foreigninvestors in Guinea. It provides incentives to companies that invest in growth-ledsectors such as public infrastructure and housing development. The InvestmentGuide is an easy-to-understand document designed to facilitate the understandingof the Code of Investment.
The Tax Code is a set of rules enacted in 2015 by the Parliament to provide duty-free provisions to domestic as well as foreign investors in Guinea in different areas
such as housing development. The Simplified Tax Code was designed to make itsreading and understanding easier for companies liable for taxes.
The public private partnership, called the New Law, entered into law in 2017. Itregulates all forms of public private partnerships.11 This agreement is designed tofacilitate land ownership and to promote access to affordable and decent housingin Guinea. It provides incentives to private developers such as tax breaks or taxholidays over eight to 10 years.
The Customs Code entered into law in 2015. This code determines and governsthe regulations that facilitate the import and export of goods.12 It grantscomprehensive duty-free entry for construction material and equipment in Guinea.
The Code of Construction and Housing is one of the most recent laws in Guinea.Entered into law in 2015, it outlines the conditions for access to land and decenthouses in Guinea. For instance, the GOG provides duty-free land to developersthat build social housing for low and middle income people. The GOG allows asolidarity tax of one percent, monthly levied on the gross wage of employees.There are also other financial resources such as taxes on government buildings.However, these mechanisms have yet to start to function.
Despite multiple efforts to promote the housing development sector, the countrystill faces major difficulties. However, there are huge investment opportunities ininfrastructure and housing development. And Guinea appears to be one of themost interesting investment destinations in West Africa. With the country’soutstanding potential, many multinational companies are now locally based inGuinea, and they bring significant added value to the country. The GOG hasundertaken several reforms to promote the private sector to facilitate theirinstallation and business development. To this end, a framework for public-privatesector dialogue was established and became operational with the organisation ofpublic-private roundtables such as the ones held in Dubai in 2011 and Paris in2017.
Opportunities There are numerous policy challenges that must be overcome if the housingfinance sector is to fulfil its objectives of increasing the availability and affordabilityof housing development in Guinea. The housing problem should be addressed byconsidering housing policies and financing issues as a way to facilitate access todecent housing for poor people. The GOG should assist and encourage thefinancial sector in the creation and development of mortgage financing options toincrease support for slum populations, and low and middle income families. Itshould also promote housing development banks that can provide preferentiallending terms to needy people.
With a more stable political situation and vital structural reforms underway, Guineaoffers exciting opportunities for investment and is well-placed to finally reap the
Source https://www.cgidd.com/
PPP$40 001 – PPP$10 000 000
PPP$23 001 – PPP$40 000
PPP$12 001 – PPP$23 000
PPP$8 001 – PPP$12 000
PPP$5 001 – PPP$8 000
PPP$3 601 – PPP$5 000
PPP$2 401 – PPP$3 600
PPP$1 601 – PPP$2 400
PPP$801 – PPP$1 600
<PPP$800
- - - Average annual household income needed for the cheapest newly built house by a formal developer, 2017 Average annual household income using expenditure, 2017 (PPP$)
GUINEA
Annual income profile for rural and urban households based on consumption (PPP$)
No. of households (thousands)
PPP$14 337
PPP$19 667
Rural Urban400 300 200 100 0 100 200 300 400
Population: 13 050 000
Urbanisation rate: 3.64%
Cost of cheapestnewly built house:
180 000 000 GNFPPP$53 159
Urban householdsthat could afford thishouse with finance:
12.33%
1 PPP$:3 386.1 Guinean
franc

156
benefits of its huge economic potential.13 The most dynamic sectors in Guineaare mining and agriculture. The government recognises the need for housingdevelopment and investment in basic infrastructures which remain the mostpressing needs in today’s Guinea.
Since 2010, successive governments have undertaken a host of economic andpolitical reforms to enable the majority of Guineans possession of their ownhouses and decent living conditions. With support and technical assistance fromthe international community, the country has started to harness the fruit of thesereforms. This includes installation of foreign private developers, mostly the Chinese,and domestic developers. In this regard, the Land Code, New Investment Code,and Code of Construction and Housing were adopted by the GOG. In additionto land provision to private developers, tax breaks and tax holidays are grantedto investors interested in the social housing development. There is also duty-freeentry for construction equipment, freedom to convert money and to repatriateproceeds back to the home country. The ‘’New’’ Guinea, born in 2010, is a landof opportunity and a destination for secure investment; and investment in thehousing sector remains a top priority for its government.
SourcesWorld Bank Group (2018). Doing Business 2018 – Reforming to create jobs –Economy Profile – Guinea.http://www.doingbusiness.org/~/media/WBG/DoingBusiness/Documents/Profiles/Country/GIN.pdf (Accessed 11 September 2018).
World Bank Group (2017). Doing Business 2017 – Equal opportunity for all –Economy Profile - Guinea.https://openknowledge.worldbank.org/bitstream/handle/10986/25536/WP-DB17-PUBLIC-Guinea.pdf?sequence=1&isAllowed=y (Accessed 11 September2018).
The World Bank (2016). Enterprise Surveys: Guinea 2016 Country Profile.https://www.enterprisesurveys.org/~/media/GIAWB/EnterpriseSurveys/Documents/Profiles/English/Guinea-2016.pdf (Accessed 11 September 2016).
Le360Afrique (2017). “Guinee: Energie, Avandcees Dans La Construction DuGrand Barrage Souapiti.” 31 May 2017.http://afrique.le360.ma/guinee/economie/2017/05/31/12236-guinee-energie-avancees-dans-la-construction-du-grand-barrage-souapiti-12236 (Accessed11 September 2018).
Panel meeting with Jacqueline Sultan Minister of Agriculture about Invest inGuinea, 2013. Westbury Hotel, London. https://www.theguardian.com/global-development/2013/jun/21/guinea-agriculture-mining (Accessed 19 July 2018).
USAID (2018). USAID Country Profile: Property Rights and ResourceGovernance - Guinea. https://land-links.org/wp-content/uploads/2016/09/USAID_Land_Tenure_Guinea_Profile.pdf (Accessed6 August 2018).
The World Bank (2018). The World Bank in Guinea.http://www.worldbank.org/en/country/guinea/overview (Accessed 20 July 2018).
World Economic Outlook (April 2018). IMF Datamapper: Inflation rate, averageconsumer prices.http://www.imf.org/external/datamapper/PCPIPCH@WEO/GIN (Accessed12 September 2018).
InterviewsConversation with M’Bemba Sylla the Chief Financial Officer about financingoptions available at la Banque Saheho-Sahélienne pour l’Industrie et leCommerce de Guinée. Guinea: 18 July 2018.
Conversation with Gana Doré, Deputy Managing Director about the loanconditions available at Caisses Populaires d’Epargne et de Crédit Yètè Mali deGuinée. Guinea. 20 July 2018.
Telephonic conversation with Ibrahima Sory Cissé the Managing Director atAgence Nationale des Institutions de Microfinance (ANAMIF). 24 July 2018.
Websiteshttp://www.who.org/guineahttp:// www.apip.gov.gn/guineahttp://www.dni.gov.gnhttp://www.mines.gov.gnhttp://www.mbudget.gov.nethttp://www.mef.gov.gnhttp//www.gouvernement.gov.gnhttp://www.mpciguinee.gn
1 Interview with Abdoulaye Magassouba, the Minister of Mines and Geology on the diversification of Guinea’s economy. Paris: 19 November 2017. http://guinee7.com/mines-abdoulaye-magassouba. (Accessed 20 July 2018). 2 Interview with Jacqueline Sultan the Minister of Agriculture about Invest in Guinea. Westminster Hotel, London: 21 June 2013.3 World Economic Outlook (2018). Guinea Country Profile. 4 Interview with Mohamed Pascal Condé the Chargé d’Affaires about financing options available at la Banque Islamique de Guinée. Guinea: 18 July 2018.5 Conversation with Gana Doré, the Deputy Managing Director at Caisses Populaires d’Epargne et de Crédit de Guinée Yètè. Mali. 2 September 2018.6 Interview with Ibrahima Sory Cissé, Managing Director at Agence Nationale des Institutions de Microfinance (ANAMIF). 10 August 2018. 7 Conversation with M’Bemba Sylla, Chief Financial Officer at Banque Sahélo-Sahélienne pour le Commerce et l’Industrie. 18 July 2018. 8 Conversation with Mohamed Pascal Condé the Chargé d’Affaires about financing options available at la Banque Islamique de Guinée. Guinea: 18 July 2018.9 See http://www.apip.gov.gn/sites/default/files/CODE%20FONCIER%20et%20DOMANIAL.pdf10 See http://invest.gov.gn/document/code-des-investissements-201511 See https://www.droit-afrique.com/uploads/Guinee-Loi-2017-32-partenariat-public-prive.pdf12 See http://mines.gov.gn/docs/PDF/code_des_douanes_2.pdf13 Testimony by Tony Blair (2017). APIP|Guinea the former British Prime Minister, Founder Africa Growth Initiative. http://apip.gov.gn/temoignage.php (Accessed 19 July 2018).
Africa Housing Finance Yearbook 2018
157
Tax revenues improved in the first half of 2017, up 36.3 percent from the sameperiod the previous year. This reflects more efficient tax collection, particularly ofcustoms duties, which leaped 26 percent from 2016. The 39.8 percent rise in theinternational price for cashews in 2017 to US$1 950 per ton helped Guinea-Bissau’s economy. Specifically, the decline in cashew exports, from 201 921 tonsin 2016 to 192 661 tons in 2017, was offset by a rise in export prices, from CFA772 per kg in 2016 to CFA 1 100 per kg in 2017. Cashew export revenues areexpected to grow 31 percent, from CFA 162 billion in 2016 to CFA 212 billion in2017.6
Political uncertainty continues to dominate economic prospects. This situationhinders the business environment and governance and fuels social unrest. Thecountry is ranked 176 out of 190 countries in the World Bank’s 2018 DoingBusiness report.7
There is no system for housing delivery in Guinea-Bissau. The land is generallyowned by the council or is inherited by individuals. Middle income householdspurchase plots to construct housing. Most households live in units that are
OverviewThe Republic of Guinea-Bissau is located in West Africa and is bordered by theAtlantic Ocean, Senegal, and Guinea. It covers 36 125km2 and has a populationof around 1.9 million which ranks 149th in the world.1 Governance in GuineaBissau is challenging. According to the 2016 Transparency International corruptionperceptions index, the country ranks 168th out of 176 countries. In 2017, thecountry was ranked 43rd out of 54 countries in Africa on the Mo Ibrahim Indexof good and quality governance in Africa. However, the authorities haveannounced holding parliamentary elections in November 2018 and reopening theNational Assembly, which will hopefully lead to the stabilisation of the politicalsituation and the growth of the economy.2
Guinea-Bissau’s economy remains fragile: 69 percent of the population lives belowthe poverty threshold and the recurrence of power outages has triggered riotsand unrest. Notwithstanding the economic and socio-political climate, 2016 wasan exceptional year for cashew sales and there was a notable expansion in theharvest of food crops (8.9 percent).3 Economic growth nevertheless dippedslightly from 5.8 percent in 2016 to an estimated 5.5 percent in 2017 and isprojected to remain at 5.5 percent in 2018. Growth in 2017 was driven mainlyby food crop production (which grew 8 percent, up from 5.6 percent in 2016)and the fishing industry (which grew 9.5 percent, up from 9 percent in 2016). Inthe secondary sector, construction grew 16.6 percent in 2017 following a sharpdownturn of 17.8 percent in 2016. In the tertiary sector, retail was up 8.9 percentin 2017. On the demand side, the key determinants of GDP growth in 2017 werepersonal spending, public investment, and exports. These reflect situational factors,such as the rise in the price of cashews.4
Public finances improved in 2017. The budget deficit (including grants) halved,from four percent of GDP in 2016 to two percent in 2017, mainly reflecting theincrease in tax revenues from CFA 66.1 billion ($105.6 million) in 2016 to CFA79.9 billion in 2017. Inflation as measured by the consumer price index wasestimated at 2.3 percent in 2017 – well below the ceiling of 3 percent. Totaloutstanding public debt (domestic and foreign) is expected to be 43.3 percent ofGDP, down from 47.3 percent in 2016, well within the West African Economicand Monetary Union (WAEMU) ceiling of 70 percent of GDP. The currentaccount was in surplus in 2016 (2.2 percent) and 2017 (2.8 percent), due to atrade surplus of 4.6 percent in 2016 and 3.1 percent in 2017.5
Guinea-BissauKEY FIGURES
Main urban centresBissauKindia
Exchange rate: 1 US$ = [a] 21 Aug 2018PPP Exchange rate (Local currency/PPP$) 1 CFA franc = [b]Inflation 2016 [c] | Inflation 2017 [c] | Inflation 2018 [c]
566.90 CFA franc247.88.2 | 8.50 | 8.10
Population [d] | Urban population size [d] Population growth rate 2017 [e] | Urbanisation rate [e]Percentage of the total population below National Poverty Line 2015 [f]Unemployment rate
1 913 442 | 830 4331.86% | 3.41%
69.0%6.5%
GDP (Current US$) 2017 [b] | GDP growth rate annual 2017 [c]GDP per capita (Current US$) 2017 [g]GNI per capita (Current US$) 2017 [h]Gini co-efficient [i]HDI global ranking 2017 [j] | HDI country index score 2017 [j]
US$1 347 million | 6.90%US$723US$66050.7178 | 0.42
Is there a deeds registry? Number of residential properties that have a title deed Lending interest rate [k]Mortgage interest rate | Mortgage term (years)DownpaymentMortgage book as a percentage of the GDPEstimated number of mortgages Price to Rent Ratio in City Centre | Outside City Centre Gross Rental Yield in City Centre | Outside City Centre Construction as a % of GDP [l]
n/an/a15.00%11.0% | 15n/an/an/a11.60 | 12.50n/a | n/an/a
What is the cost of standard 50kg bag of cement? What is the price of the cheapest, newly built house by a formaldeveloper or contractor? (Local currency)What is the price of the cheapest, newly built house by a formaldeveloper or contractor? (US$) What is the size of this house (m2)? What is the average rental price for this unit (US$)? What is the minimum stand or plot size for residential property?
n/a
985 153 921 CFA franc
US$74 21785m2
US$878n/a
Ease of Doing Business Rank [l]Number of procedures to register property [l]Time to register property (days) [l]Cost to register property (as % of property value) [l]
168548 days5.50%
NB: Figures are for 2018 unless stated otherwise.
[a] Coinmill.com[b] World Bank World Development Indicators[c] Compagnie Française d'Assurance pour le Commerce Extérieur[d] World pouplation review[e] Central Intelligence Agency (CIA) World Factbook[f] African Development Bank[g] Trading Economics[h] World Bank Open Data[i] International Monetary Fund[j] UNDP Development Indicators[k] Indexmundi[l] World Bank Doing Business

158
categorised as having adobe (earth) as the predominant building material and thebacklog, in 2015, stood at only 4 000 units.8 The Chinese government hadprovided 82 million yuan (US$12.3 million) in funding which will contribute toGuinea Bissau’s planned construction of social housing in the country’s capital,Bissau. Guinea Bissau is also establishing a partnership with Moroccan propertydevelopers for the construction of buildings of up to floor fours, also in theBissalanca area.9
Access to finance Guinea-Bissau joined the WAEMU in 1997 and shares a common Central Bank,the Central Bank of West African States, and a common bank regulatory andsupervisory authority, the West Africa Monetary Union Banking Commission, withthe seven other WAEMU countries (Benin, Burkina-Faso, Cote d’Ivoire, Mali, Niger,Senegal, and Togo).10
The financial system remains undeveloped and offers limited coverage. It includesfive commercial banks with 22 branches, which hold 94 percent of the country'sfinancial assets, although this represents less than 1 percent of total assets inWAEMU's banking sector. In fact, the banking penetration rate in 2015 was8.8 percent, with 26 counters and 42 automated teller machines (ATMs). Thenumber of commercial bank branches per 100 000 adults was 2.5 in 2015, a figurethat had remained constant from 2013. The figure for ATMs per 100 000 adultswas at 3.67 in 2013, an increase from 1.36 in 2010.11 Credit to the private sectorexpanded by 10.6 percent in 2016, driven by the strengthening of economicactivity.12 Credit extension has continued to be concentrated in commerce,construction, and manufacturing, which together accounted for about two-thirdsof total credit.13
There are various reasons for the under-banking, among which is a youthfulpopulation (40 percent younger than 16 years old), poverty (approximately 69percent of the population lives below the poverty line), poor financing of theeconomy by banks, a difficult business environment, and continuing politicalinstability.14
In June 2017, Guinea Bissau had six microfinance institutions across the country,accounting for four percent of all establishments of this type in WAEMU. The IMFnetwork counted approximately 10 000 customers, and 17 points of service. Thecredit offered by the IMF was CFA 131 billion in June 2017, while depositsamounted to CFA 215 billion. This data demonstrates the limited scope of themicrofinance sector and show the poor financial inclusion in the area.15
Private insurance companies and a semi-autonomous public pension fund, theNational Institute of Social Security, account for most of the rest of the formalfinancial system. Informal financial structures exist, and cater for poorer sectors,especially people in rural areas and some small entrepreneurs. Guinea-Bissau hasaccess to the regional securities exchange, the Bourse Régionale des ValeursMobilières, established in 1998 and based in Abidjan. However, none of its 39 listedcompanies are from Guinea-Bissau.16
Access to financial services in Guinea-Bissau is low compared to its regionalneighbours. On average, only 89.46 of every 1 000 Bissau Guineans held depositaccounts in commercial banks, the second lowest among WAEMU members afterNiger (48.87), as reported by the IMF Financial Access Survey in 2015. Mobilemoney remains marginal in the country. There were only 236 active mobile moneyaccounts in the country in 2014, which equated to 0.22 accounts per 1 000 adults.Nonetheless, 36 percent of Bissau Guineans has access to a mobile connectionserviced by two national providers. That is approximately half the Sub-Saharanaverage, and presents significant room to expand the country's mobile moneyservices. Developing mobile financial services could help widen financialinclusiveness for the unbanked population in the country, especially in rural areas.17
The banking sector is stable; it lends only to a small section of the economy andis relatively risk averse, with credit risk perceived as being high. The four bankshave increased their loans outstanding, from CFA 25.76 billion (US$ 43.7 million)in 2010 to CFA 62.6 billion (US$ 106 million) in 2015. Most of these loans areshort- or medium-term, with just CFA 646 million (US$ 1.1 million) categorisedas being long-term. At the same time, deposits held by the banks have increased,from CFA 54 billion (US$ 92 million) in 2010 to CFA 114 billion (US$ 195
million).18 Private sector loans accounted for the largest share of assets at over55 percent each year since 2010. Liquid reserves were the lowest share of assets:10 percent each year since 2013. Foreign assets accounted for 21 percent of thetotal in 2015 – down from 40 percent in 2010 – while loans to Guinea Bissau'sgovernment leapt from 0.38 percent of assets in 2010 to 10 percent by 2014 and26 percent a year later.
Data available on mortgage finance is limited. In December 2014, banks werelending at an average prime rate of 9.5 percent and as of 31 December 2016, thecommercial bank prime lending rate was 15 percent,19 though these numbers arenot related to mortgages. For mortgages, the interest rate was 9 to 11 percentin 2015, according to the Branch Chief of Ecobank Headquarters in Bissau.Mortgages available are restricted to medium and high-income households, andthose who have a warranty or an employment contract of 10 years, the typicalterm of a mortgage. For all commercial banks, repayments for loans granted willbe a maximum of 33 percent of an employee’s salary. Some people manage tobuild their homes using this type of loan, with loan values varying from CFA 3 to5 million (US$5 464 to US$9 107). This depends on the nature of theiremployment contract, with the yearly renewal of the loan at the beginning of eachyear allowed (some organisations will provide a four or five-year contract,depending on the length of time needed to develop projects). According toinformation gathered at Orabank, there are plans, still subject to research, toexpand the provision of mortgage finance to large segments of the population. Ifa mortgage market were to develop, banks in Guinea-Bissau would have accessto Caisse Regional de Refinancement Hypothecaire-UEMOA (CRRH-UEMOA),the regional mortgage refinance facility. It appears that housing microfinance islimited, with the formal microfinance sector accounting for CFA 71 million(US$129 318) in outstanding loans in March 2016, from CFA 84 million(US$152 996) in 2014, and CFA 265 million (US$482 668) in deposits, also inMarch 2016, from CFA 207 million (US377 027) in 2014.20 There is a smallmicrofinance sector with 18 licensed institutions. However, only five areoperational, and they provide limited financial services.21
The Catholic Relief Services is implementing a Savings and Internal LendingCommunities project to help community members to form groups, pool theirsavings and make loans. This allows people to access affordable financial services.22
In terms of construction finance, banks do not cater to the construction of newunits. Only 2.8 percent of loans in 2016 were allocated to the building andconstruction sector.23
AffordabilityIn addition to the constraints in accessing housing finance, Guinea-Bissau has lowlevels of affordability because of the high level of poverty in the country as wellas the country’s low GDP per capita: 58 percent of households earn belowUS$2 400 a year, according to data from the Canback Global Income DistributionDatabase.24 Household income is heavily dependent on cashew and riceproduction, the income from which is volatile because of international prices andlocal weather. With little productivity growth in the country, it is unlikely that mosthouseholds will be able to afford formal houses constructed by formal developers(that may cost CFA 93 474 013,65 or approximately $162 000),25 and would bebetter served by the provision of housing microfinance.
Government initiatives to improve housing conditions were under way but havebeen interrupted. In the past, whatever units constructed by the governmentwere allocated by assessing applicants or by using a lottery system. There was acommission responsible for evaluating the allocation of houses and assessingspecific household needs, although housing was predominantly awarded to warveterans or civil servants. There are some private developers working in the fieldbut the houses that they construct tend to be for rental purposes, servingemployees from international organisations. The monthly rents in thesedevelopments can range between CFA 500 000 and 1 000 000 (US$910 andUS$1 821). Similar units for sale are available for between CFA 18 million to50 million (US$32 785 to US$91 069).
Housing supplyIt is estimated that there is an urgent need for 4 000 homes throughout thecountry. The 2009 census26 showed that 73 percent of households wererecorded as owning their houses, while 19 percent of households live in private

Africa Housing Finance Yearbook 2018
159
rental. The numbers for Bissau were different: 3.8 percent of households lived inpublic rental stock, 46.4 percent in private rental, and 42.7 percent owned theirhouses. The census recorded 176 500 households (compared to 267 293households estimated by C-GIDD in 2016), 89.1 percent of which resided inprecarious housing. In cities, 78.6 percent of households lived in precarioushousing, and in Bissau only 24.5 percent did. The UN-Habitat State of AfricanCities Report 2014, the latest report of the series, states that 83.1 percent ofurban households live in slums.27 In urban areas, 28.2 percent of households livein one-bedroom units, compared to 9.8 percent in rural areas (17.7 percentnationally). The trend is the same for two-bedroom units (27.7 percent of urbanhouseholds, against 16.5 percent of households in rural areas), but changes fromthree-bedroom units onwards – 43.8 percent of urban households live in unitswith three bedrooms or more, compared to 74.3 percent of rural households.28
There is no system for housing delivery in Guinea-Bissau and the housing backlogin 2015 stood at only 4 000 units.29 The Chinese government had provided CNY82 million (US$12.3 million) and part of this fund will be allocated to finance thesocial housing project under construction in Guinea-Bissau. China will start withthe construction of 250 homes in a first stage, but the goal is to reach 1 000. Theplan includes two-bedroom, three-bedroom and four-bedroom homes to be builtin the Bissalanca area, next to Bissau’s international airport. Guinea Bissau is alsoestablishing a partnership with Moroccan property developers for theconstruction of buildings of up to floor fours, also in the Bissalanca area.30
Most households (76.3 percent) live in units that are categorised as having adobe(earth) as the predominant building material, with a further 14.5 percent ofhouseholds living in units categorised as reinforced adobe. A further 5.4 percent(10 percent of urban households) live in units constructed using cement-blocks.In urban areas, 84,3 percent of households live in units that have zinc roofs(57.6 percent nationally), while 60,3 percent of households have straw roofs inrural areas (36,9 percent nationally).
Approximately 110 million people currently live in the WAEMU region; over thenext twenty years, an additional 100 million more will be born. Most of them willbe urban dwellers, as the area is experiencing rapid urbanisation of approximately3.41% a year. Some 800 000 new housing units are needed every year to addressthe housing shortage; WAEMU banks only issue about 15 000 new mortgagesper year.31
The social housing project funded by China, as highlighted above, aims to addressthe chronic housing shortage by expanding access to long-term housing financefor households with modest and irregular incomes. This goal will be achieved bylengthening the term of mortgage loans, currently at 7-8 years on average, to15 years and beyond.32
Funding from the World Bank's International Development Association (IDA) willbe channelled from the West African Development Bank, also known as Banque
Ouest Africaine de Développement (BOAD), to CRRH-UEMOA, to facilitateabout 50 000 new mortgages and to leverage much greater amounts ofinvestment into affordable housing through the bond-raising activity of CRRH-UEMOA.33
IDA financing along with investment from the International Finance Corporation,another part of the World Bank, into CRRH-UEMOA will strengthen the businessmodel and the ability to mobilise long-term resources to expand affordablehousing finance to the benefit of WAEMU households. The US$155 millionpackage consists of an IDA scale-up credit of US$130 million to BOAD, the firstIDA scale-up facility credit to a regional organisation, and a US$25 million regionalIDA grant to the WAEMU.34
Property markets Guinea-Bissau is improving the real estate business environment. The introductionof regulations which govern the licensing and functioning of credit bureaus in themember states of WAEMU and a new credit bureau has improved its creditreporting system. A new conciliation procedure for companies in financialdifficulties and a simplified preventive settlement procedure for small companieshas also made resolving insolvencies easier. Additionally, Guinea-Bissau madetransferring property easier by lowering the property registration tax.35
The latest reform has resulted in Guinea-Bissau bettering its Doing Businessregistering property ranking, from 150 in 2016 to 149 in 2017 and now down to126 in 2018. The cost remains 5.5 percent of the total cost of the property toregister a property, however it now involves five (from eight last year) proceduresand takes 48 days, down from 51 days last year.36
Policy and regulationThough there are several laws in place to govern its ownership, land ispredominantly accessed outside of Bissau in accordance with traditional practices.Both traditional practices and a 1975 law do not provide for freehold ownership,only usufruct rights. Law 4 of 1975 stipulates that “all the land of the nationalterritory … is part of the public domain of the State and cannot be reduced toprivate property.” National laws do allow for concessions of up to 90 years, thoughthere is no standard process of securing a concession. Efforts to finalise a newland law, the 1998 Land Law of Guinea Bissau, which should improve security oftenure, have stalled, with the law still awaiting adoption. Considering that most ofthe real property rights in the country have not formalised under the form ofconcessions, acquiring a concession of Right of Private Use is complex andexpensive.37
The country’s land regulations include the Law of 23 April 1998, which regulatesland-use planning and rational exploitation of land;38 the Act No. 6/73 approvingthe Overseas Land Act of 13 August 1973 regulates the right of use of public andprivate lands of the overseas territories;39 Norms No. 9/11/1992 approving Legaland Fiscal Regime for Land Occupation;40 and the Law of 6 January 1967.41
PPP$40 001 – PPP$10 000 000
PPP$23 001 – PPP$40 000
PPP$12 001 – PPP$23 000
PPP$8 001 – PPP$12 000
PPP$5 001 – PPP$8 000
PPP$3 601 – PPP$5 000
PPP$2 401 – PPP$3 600
PPP$1 601 – PPP$2 400
PPP$801 – PPP$1 600
<PPP$800
- - - Average annual household income needed for the cheapest newly built house by a formal developer, 2017 Average annual household income using expenditure, 2017 (PPP$)
GUINEA-BISSAU
Annual income profile for rural and urban households based on consumption (PPP$)
No. of households (thousands)
PPP$8 693
PPP$2 168 955
Rural Urban35 30 25 20 15 10 5 0 5 10 15 20 25 30 35
Population: 1 913 442
Urbanisation rate: 3.41%
Cost of cheapestnewly built house:
985 153 921 XOFPPP$3 975 601
Urban householdsthat could afford thishouse with finance:
3.11%
1 PPP$: 247.8 CFA franc
Source https://www.cgidd.com/

160
The ambiguity from the current land regulatory framework presents a number ofchallenges for housing finance. Firstly, the national laws allow for concessions ofup to 90 years, and this is not good for the long-term investments. Secondly, thelaws state that land is property of the government and its expropriation is allowedonly under concession or authorisation granted by the government; in this regardland tenure is not secured as government may expropriate it withoutcompensation at any time. Again, in terms of long-term finance (e.g. a 30 yearsmortgage), this is a real challenge. Finally, the protection of property rights isextremely weak in the country, because judges are poorly trained, poorly paid,influenced by the executive, and subject to corruption and this is not good forlong-term housing finance because in cases of dispute there is no efficient judiciarysystem to turn to.
Traditional practices prevail in most rural areas, and those who live in urban areasoften bring judicial disputes to traditional counsellors to avoid the official system’scosts and bureaucratic impediments. The police often resolve disputes withoutrecourse to the courts.42
Opportunities Guinea-Bissau shows much promise, despite the political instability. Theimprovement in ease of starting a business is a result of the establishment of aone-stop shop which eliminated the requirement for an operating license andsimplified the method for providing criminal records and publishing a registrationnotice. The recent establishment of a commercial court and the one-stop shopfor business registration suggests that there is the will to make the necessaryreforms. The stabilisation of the banks, which has lowered their non-performingloan rates and seen them seize collateral, is a sign that the financial sector is betterequipped to expand access to finance. As part of WAEMU, Guinea-Bissau has alow inflation rate and low forex risk, providing a sound foundation for futureinvestment.
Transferring property has become easier because of reduced property registrationtax and an increased number of notaries dealing with property transactions.43
These reforms can catalyse economic growth, which would likely increase housingaffordability. A property market boom is expected in the near future as thecountry and region experience a rapid urbanisation rate of around 3.41 percenta year.
Despite an infamous black market and other obstacles that threaten to destabilisethe country’s economy, Guinea-Bissau has strong potential to enhance thelivelihoods of its poorest communities through its vast supply of natural resources.The country is blessed with weather that promotes the growth of cash crops and
the production of mineral resources.44 Furthermore, with the introduction ofregulations which govern the licensing and functioning of credit bureaus in theWAEMU member states and an improved credit reporting system, householdswill more easily access loans for housing and other purposes.
Additional sourcesAnalysis of Guinea-Bissau Residential Property Market (2018). Global propertyGuide, https://www.globalpropertyguide.com/Africa/Guinea-Bissau (Accessed16 July 2018).
Andrianarison, F., Arvanitis, Y. & Ie, I. (2016). Guinea-Bissau. African EconomicOutlook. www.africaneconomicoutlook.org/en/country-notes/guinea-bissau(Accessed 16 July 2018).
Banque Centrale des États de l'Afrique de l'Ouest (2016). Passif De LaSituation Des Banques. www.edenpub.bceao.int/rapportPredefini.php(Accessed 16 Aug 2018).
Food and Agriculture Organisation of the United Nations (2018), FAOLEX -legislation database of FAO Legal Office, Guinea-Bissau.http://extwprlegs1.fao.org/cgi-bin/faolex.exe?rec_id=000092&database=valid&search_type=link&lang=eng&format_name=@ESPRF (Accessed 16 Aug2018).
Food and Agriculture Organisation of the United Nations (2018). Land Act No5/98 Guinea Bissau, FAOLEX Database. http://www.fao.org/faolex/results/details/en/c/LEX-FAOC016728/ (Accessed 5 July 2018).
Food and Agriculture Organisation of the United Nations (2018). Norms No.9/11/1992 approving Legal and Fiscal Regime for Land Occupation. GuineaBissau, FAOLEX Database. http://www.fao.org/faolex/results/details/en/c/LEX-FAOC124324/ (Accessed 5 July 2018).
IMF (2015). Guinea-Bissau Country Report No. 15/195. https://www.imf.org/external/pubs/ft/scr/2015/cr15195.pdf (Accessed 16 Aug 2018).
IMF (2017). Guinea-Bissau: Third Review Under the Extended Credit FacilityArrangement, Request for a Waiver of Non-observance of PerformanceCriterion, and Financing Assurances Review-Press Release and Staff Report.
Riquet, C. (2015). 20 Years of Financial Inclusion Progress in WAEMU; More toCome! C-GAP. www.cgap.org/blog/20-years-financial-inclusion-progress-waemu-more-come (Accessed 5 July 2018).
The World Bank (2016). Systematic Country Diagnostic (SCD): Guinea-Bissau:Turning Challenges into Opportunities for Poverty Reduction and InclusiveGrowth. Report No. 106725-GB.
The World Bank (2018). Supports Accessed to Affordable Housing Finance inWest Africa. https://www.worldbank.org/en/news/press-release/2017/10/13/world-bank-group-supports-accessed-to-affordable-housing-finance-in-west-africa (Accessed 5 July 2018).
1 World Population Review (2018). Guinea-Bissau Population 2018. http://worldpopulationreview.com/countries/guinea-bissau-population/ (Accessed 10 Sept 2018).
2 African Development Bank (2018). Perspectives Économiques en Afrique. https://www.afdb.org/fileadmin/uploads/afdb/Documents/Publications/African_Economic_Outlook_2018_-_FR.pdf (Accessed 10 Sept 2018).
3 Ibid. 4 African Economic Outlook (2018). https://www.africanbondmarkets.org/en/country-profiles/west-africa/guinea-
bissau/ (Accessed 16 July 2018). Pg. 1. 5 Ibid. 6 Ibid. 7 African Economic Outlook (2018). Pg. 1. 8 Macauhub (2016). “Funding from China waits for Guinea-Bissau to define projects”. 5 sept 2016. https://macauhub.com.mo/2016/09/05/funding-from-china-waits-for-guinea-bissau-to-define-projects/ (Accessed
16 Aug 2018).9 Ibid. 10 African Economic Outlook (2018). Pg. 1. 11 The World Bank – Data (2018). Guinea Bissau. https://data.worldbank.org/country/guinea-bissau?view=chart
(Accessed 10 Sept 2018).12 The World Bank – Data (2018). Guinea Bissau.13 Ibid.14 African Development Bank (2018). Perspectives Économiques en Afrique. 15 Ibid.16 Italian Agency for Development Cooperation (2018). Making Finance Work for Africa. https://www.mfw4a.org/
fileadmin/data_storage/documents/MFW4A-documents/Country_FSP_GUINEA_BISSEAU_.pdf 17 Ibid. 18 Banque Centrale des États de l'Afrique de l'Ouest (2018). Rapport sur les conditions de Banques.
https://www.bceao.int/19 Ibid.20 Direction Générale de la Stabilité et de l'Inclusion Financières (2016). Principaux indicateurs des SFD de l'UMOA
au 31/03/2016. Banque Centrale des États de l'Afrique de l'Ouest.21 Honohan, P. and Beck, T. (2018). Making Finance Work for Africa. The World Bank. https://www.mfw4a.org/
fileadmin/data_storage/documents/other-internal-documents/Making_Finance_Work_for_Africa.pdf (Accessed16 Aug 2018).
22 Catholic Relief Services in Guinea-Bissau (2018). CRS in Guinea-Bissau. https://www.crs.org/our-work-overseas/where-we-work/guinea-bissau (Accessed 16 Aug 2018).
23 African Economic Outlook (2018). Pg. 1. 24 Apartment cost in of Guinea Bissau Regions (2018). What is the Cost of Apartments? https://price-
calculator.com/apartments-calculate-price.php25 Ibid. 26 Instituto Nacional De Estatística (2009). Condição de Vida do Agregado. Terceiro Recenseamento Geral Da
População e Habitação De 2009.27 UN-Habitat (2014). State of African Cities 2014 , Re-imagining sustainable urban transitions.
https://unhabitat.org/books/state-of-african-cities-2014-re-imagining-sustainable-urban-transitions/ .28 Ibid .29 Macauhub (2016). “Funding from China waits for Guinea-Bissau to define projects”. 5 sept 2016.30 Ibid.31 The Central Intelligence Agency (2018). The World Fact Book: Guinea-Bissau. https://www.cia.gov/library/
publications/the-world-factbook/geos/pu.html. 32 Ibid. 33 Ibid. 34 Ibid. 35 World Bank Group (2018). Doing Business 2018:Reforming to create jobs – Economy Profile, Guinea-Bissau.
http://arabic.doingbusiness.org/~/media/WBG/DoingBusiness/Documents/Profiles/Country/GNB.pdf 36 Ibid. 37 Christopher Tanner (2018). Doing (Inclusive) Business in Guinea Bissau: Re-Activating The 1998 Land Law, 13.
https://slideplayer.com/slide/12730663/38 Food and Agriculture Organisation of the United Nations (2018). http://extwprlegs1.fao.org/cgi-
bin/faolex.exe?rec_id=000092&database=valid&search_type=link&lang=eng&format_name=@ESPRF39 Food and Agriculture Organisation of the United Nations (2018). 40 Ibid.41 Ibid. 42 Economic Freedom Score (2018). Guinea Bissau. https://www.heritage.org/index/pdf/2010/countries/
guineabissau.pdf43 IMF (2018). Country Report No. 17/380 Guinea Bissau. www.imf.org/~/media/Files/Publications/CR/2017/
cr17380.ashx 44 Catholic Relief Services in Guinea-Bissau (2018). CRS in Guinea-Bissau.

Africa Housing Finance Yearbook 2018
161
National debt reached 57 percent of GDP in 2017, a significant increase from38 percent in 2012.4 This will place significant pressure on resources required toimplement the “Big Four” agenda. In addition, with the state offering high yieldingbonds, particularly tax-free infrastructure bonds, to fund their deficit, the cost offinance for housing finance becomes very expensive.
Access to financeKenya has an established banking sector which contributes to 75.3 percent of theadult population being formally included, a fifty percent increase in the last tenyears. According to the 2016 FinAccess Household Survey, financial exclusion,which was 17.4 percent in 2016, has more than halved since 2006.5
The formal financial sector is regulated by the Central Bank of Kenya and theCapital Markets Authority. Kenya has 43 banking institutions (42 commercial banksand one mortgage finance company), nine representative offices of foreign banks,13 microfinance banks, three credit reference bureaus, 19 money remittanceproviders and 73 foreign exchange bureaus.6 Out of the 43 banking institutions,40 were privately owned, while the Kenyan government had majority ownershipin three institutions. As at December 2017, three of Kenya’s commercial banks
OverviewKenya is East Africa’s largest economy, and a leading financial centre in the region.An emerging middle-income country, it has a vibrant, and highly sought afterresidential property market, especially so for the luxury market. While 2017 wasa difficult year politically, President Kenyatta’s announcement in December 2017that affordable housing was one of his “Big Four” strategies has energised theaffordable housing sector.1 In 2018, there has been increased engagement withthe policy, regulatory, financial, and other institutional factors required to givesubstance to the President’s commitments. While the feasibility of delivering onthe commitment for 500 000 affordable housing units in the President’s termcontinues to be a subject of debate, the target itself has stimulated activity thatwill no doubt transform affordable housing for the country.
Kenya is still a primarily rural country with only 28 percent of its population of 46million people living in urban areas. With an urbanisation rate (4.2 percent) almostdouble the population growth rate (2.5 percent), however, the rural character ofthe country is due to change. It is estimated that by 2050, half the population willbe living in cities. This is already putting pressure on the demand for affordablehousing, together with infrastructure, and effective land use planning andmanagement.
Kenya’s economy has shown strong growth in the past few years with a GDPgrowth rate above 5 percent per annum for the past five years. In 2016, real GDPgrowth was 5.8 percent, dominated by the services industry (66 percent ofgrowth), which itself was dominated by real estate (which grew 12 percent).2
Between 2013 and 2017, real estate contributed an average of 7.5 percent toGDP, while construction contributed around five percent; 5.8 percent estimatedin 2017.
By 2017, Kenya’s real GDP growth declined to 4.9 percent, largely due touncertainty caused by the political situation, the drought, and a slowing of creditgrowth, itself due in part to interest rate caps imposed from September 2016.Although there was a general slowdown in credit uptake in the country, thebuilding and construction sector experienced a 4.9 percent increase in loans andadvances from commercial banks, from Ksh104.8 billion (US$1.04 billion) in 2016to Ksh109.9 billion (US$1.09 billion) in 2017. Inflation has hovered around 4percent during 2018, down considerably from eight percent in 2017, and wasrecorded at 4.04 percent in August 2018. The currency has been similarly stableduring 2018, offering a level of economic certainty.3
KenyaKEY FIGURES
Main urban centresNairobiMombasa
Exchange rate: 1 US$ = [a] 16 Aug 2018PPP Exchange rate (Local currency/PPP$) 1 Kenyan shilling = [b]Inflation 2016 [c] | Inflation 2017 [c] | Inflation 2018 [d]
100.30 Kenyan shilling47.506.00 | 8.00 | 4.90
Population [d] | Urban population size [b] Population growth rate [b] | Urbanisation rate [b]Percentage of the total population below National Poverty Line 2017 [e]Unemployment rate [b]
46 600 000 | 13 167 4812.5% | 4.20%
36.10%11.5%
GDP (Current US$) 2017 [b] | GDP growth rate annual 2017 [b]GDP per capita (Current US$) 2017 [b]GNI per capita (Current US$) 2017 [b]Gini co-efficient 2005 [e]HDI global ranking 2016 [f] | HDI country index score 2016 [f]
US$74 938 million | 4.9%US$1 507US$1 44048.50146 | 0.555
Is there a deeds registry? Number of residential properties that have a title deed Lending interest rate [g] Mortgage interest rate [g] | Mortgage term (years) [g]Downpayment [g]Mortgage book as a percentage of the GDPEstimated number of mortgages [g] Price to Rent Ratio in City Centre | Outside City Centre Gross Rental Yield in City Centre 2016 [h]Outside City Centre 2017 [i]Construction as a % of GDP
Yesn/a13.46%13.46% | 2510%n/a24 085n/a | n/a6.5%5.0%n/a
What is the cost of standard 50kg bag of cement? 2017What is the price of the cheapest, newly built house by a formaldeveloper or contractor? (Local currency) [j]What is the price of the cheapest, newly built house by a formaldeveloper or contractor? (US$) [j] What is the size of this house (m2)? What is the average rental price for this unit (US$)? What is the minimum stand or plot size for residential property?
US$6.00
1 155 000 Kenyan shilling
US$11 500200m2
US$15085m2
Ease of Doing Business Rank [k]Number of procedures to register property [k]Time to register property (days) [k]Cost to register property (as % of property value) [k]
80961 days6.00%
NB: Figures are for 2018 unless stated otherwise.
[a] Coinmill.com[b] World Bank World Development Indicators [c] Kenya National Bureau of Statistics[d] Trading Economics[e] Central Intelligence Agency (CIA) World Factbook[f] UNDP Development Indicators[g] Central Bank of Kenya (CBK)[h] Global Property Guide[i] Cytonn Investments[j] Suraya Properties[k] World Bank Doing Business

162
were not operational, with one of them under statutory management and twounder receivership. The banking sector grew its total net assets from Ksh3.695trillion (US$36.8 billion) in December 2016 to Ksh4 trillion (US$39.8 billion) inDecember 2017, an increase of 8.3 percent. The average 91-day Treasury bill ratedropped to 8.37 percent in 2017 from 8.62 percent in 2016. The average 182-dayTreasury bill rate declined to 10.42 percent in 2017 from 10.9 percent in 2016.7
Growth in credit to the private sector has been on the decline, and hit a low of1.4 percent in July 2017. By October 2017, it was up to 2 percent, buoyed in partby a 10 percent growth in credit to the real estate sector, and 4 percent growthin private sector credit to the building and construction sector.8 Much of thisgrowth, however, was attributed to lending to corporates as credit to householdscontinued to decline.
The Kenyan Central Bank is one of the few central banks in Africa that conductannual mortgage surveys to monitor the residential mortgage market. Accordingto this survey, there were 26 187 mortgage loans in the market in December2017, a net increase of 2 128 mortgage loans in the year since December 2016.The outstanding value of mortgage loan assets was Ksh223.2 billion (US$2.2 billion)December 2017, representing a growth of a 1.5 percent over the year. Threequarters of this lending was offered by six institutions including one medium-sizedbank (holding 20.9 percent market share) and five of Kenya’s major banks. Thenumber of banks offering mortgages has dropped from 35 in 2016 to 31 in 2017.The value of non-performing mortgages was high at 12.2 percent of the total book,but this was slightly below the industry NPLs to gross loans ratio of 12.3 percent.
The average mortgage loan size of Ksh10.9 million (US$108 600) in 2017demonstrates a market focus at the higher end. As a result of the interest ratecap which became effective on 14 September 2016, interest rate charges onmortgage loans ranged between 10.8 percent and 14 percent in 2017 comparedto 18.7 percent average in 2016. Just over three quarters of mortgages (78.4percent) are on variable interest rates.9 Anecdotally, most (60 percent of)mortgages outstanding are at subsidized rates to bank employees or employeesof corporations which have ‘funded deposits’ with the bank to fund these rates.10
One of the motivations for the forthcoming Kenya Mortgage Refinance Company(KMRC) is to provide the liquidity necessary to enable lenders to fund mortgageson the open market, which are not supported by such funded deposits.
The Central Bank’s mortgage market survey tested lenders’ sense of obstacles tothe development of the mortgage market in Kenya. By far, the most frequentresponse from banks had to do with high costs (of housing units, of land forconstruction, and of the various incidentals, taxes and fees). This was followed bydifficulties with property registration and titling, and then household affordabilityas a result of low incomes. Access to affordable long term finance was the sixthmost popular response from a list of ten, followed by various constraints in theresidential property transaction process. Regarding the impact of the interest ratecap, lenders noted a higher demand for mortgage loans given perceivedaffordability. They had responded however, with tighter credit standards, so thatactual mortgage disbursements had been lower than increased demand. TheCentral Bank also noted a shift in preference to offer short term loans.11
Given Kenya’s economic status and population size, however, 26 187 mortgageloans is far below what would be expected. FinAccess 2016 notes that the use ofcredit for housing purchases appears to be limited. In 2016, 34.2 percent ofrespondents reported having used at least one type of credit instrument. Of these,only 14.7 percent said the loan had been for a house or land. These loans weremost commonly obtained from both SACCOs (45.9 percent of all loans for housingor land) and banks (34.2 percent). Informal providers, microfinance lenders andmobile banks together provided about a fifth of all loans used for housing.12
The World Bank estimates that up to 90 percent of housing finance in Kenya issupplied by Savings and Credit Cooperatives (SACCOs) and housing cooperativenetworks.13 The SACCO industry is significant with nearly 3.5 million membersand combined total assets of Ksh393 billion (US$3.9 billion) across 175 licensedand regulated deposit taking institutions at the end of December 2016.14
SACCOs package home loans as development loans, generally at lower rates, andwith faster processing times than what is offered by commercial banks. Aconsortium of 35 SACCOS recently launched a housing loans plan enabling their
members to obtain interest free mortgages by paying “rent” instalments over 20years.15 SACCOs also offer micro-mortgages through the Kenya Union of Savingsand Credit Co-operatives Housing Fund. In many instances SACCOs availunsecured construction loans, establishing them as key role players in facilitatingaccess to housing finance at the bottom end of the income pyramid.
However, as the World Bank notes, SACCOs’ single source of liquidity is memberdeposits, which limits their ability to grow their housing loan portfolio. In 2017and 2018, concerted efforts were made by the World Bank and the Central Bankof Kenya to establish a Kenya Mortgage Refinance Company (KMRC), similar towhat has been established in Tanzania, Nigeria, Egypt16 and the WAEMU region.An explicit focus of this institution will be the provision of liquidity to SACCOs insupport of their housing lending role. It is expected that the KMRC will beoperational within 2019.
AffordabilityHousing affordability is a critical issue in Kenya, and a key focus of the current policydebate. Even entry-level housing is expensive, with the cheapest newly built unitby a private developer still only affordable to a minority of urban residents. Forexample, Suraya Properties offers a 16m2 bedsitter unit in its Encasa 1 project onthe Mombasa Road in Nairobi, for Ksh1 155 000 (US$11 500), or a 20m2 studioapartment for Ksh1 760 000 (US$17 500), whether for purchase with cash or witha mortgage.17 At 14 percent per annum, over 15 years and with a 20 percentdeposit, the 16m2 bedsitter would cost US$267 per month to service, and wouldbe affordable to 51 percent of the urban population (though, Suraya only included85 of these units in its first phase). At these same terms, the 20m2 studio apartmentwould be affordable to only 24 percent of the urban population.18
Off-plan, the finance arrangements make a significant difference to the price. ForSuraya’s planned Phase 2 Encasa development, a 40m2 two-bedroom unit lists forKsh3 190 000 (US$31 600) when paid with a plan involving five instalments, versusKsh3 415 500 (US$33 900) when paid with a mortgage.19 The reason for thisincrease in price is worth exploring, and has to do both with the impact of Kenya’svery slow and cumbersome land titling process, and the availability and cost ofconstruction finance. In essence, by offering a cash instalment plan for off-plan(before construction) purchases, Suraya is able to finance its development processwith customer deposits rather than with a construction loan. It also needn’t waitfor the titling process of individual plots to be completed before being paid, as itwould if it waited for its buyers to access mortgage finance to fund their purchase.As a result, a higher income strata is likely purchasing even lower cost housing,possibly for investment rental purposes.
According to the KNBS 2018 Economic Survey, there was a 10.2 percent increasein the value of new private buildings in Nairobi County from Ksh77.7 billion(US$774 million) in 2016 to Ksh85.6 billion (US$853.4 million) in 2017, owing tosustained rise in construction of residential and non-residential buildings. TheSurvey also indicates a 3.8 percent rise in the cost of materials for residentialbuildings in 2017, up from 1.9 percent in 2016 and 2.6 percent in 2015. Inflationin the cost of labour was more significant, with a 10.5 percent rise in 2017, down,however, from 12.5 percent in 2016 and 25.5 percent in 2015.20
Housing supplyIn late 2016, President Kenyatta made an explicit commitment to increasingaffordable housing supply, promising 500 000 affordable housing units in the courseof his five-year term as president.21 With an estimated two million unit backlog,nearly 61 percent of urban households living in slums, and a 4.2 percenturbanisation rate, some analysts have called this a drop in the ocean.22 The KenyaProperty Developers Association (KPDA) suggests that Kenya actually needs todevelop 200 000 new units annually, versus the 50 000 currently being constructed.
Analysis undertaken by CAHF suggests that the value of housing construction in2016 was Ksh272 billion (US$2.7 billion), equivalent to about 6.3 percent ofKenya’s GDP. This comprised Ksh119 billion (US$1.19 billion) in gross value added,and a further Ksh153 billion (US$1.5 billion) in intermediate inputs purchasedfrom the primary, secondary and tertiary sectors of the economy. Just under atenth of this (9.3 percent) was imported – or 16 percent of all manufacturedgoods used in the housing process. After adjusting for import leakages, CAHFestimates that housing construction has a direct impact output multiplier of 2.16.23

Africa Housing Finance Yearbook 2018
163
The profile of housing delivery has shifted over the past 15 years. Hass Consultmonitors the mix of property types available in Kenya on an annual basis. In 2001,apartments comprised 23.5 percent of Kenya’s residential property market, whilesemi-detached houses represented another quarter (24.5 percent) and detachedhouses comprised the majority (52 percent). By the end of 2017, the ratios hadshifted entirely, with apartments comprising almost half of the total market (48.7percent), semi-detached houses still at a quarter (24.9 percent) and detachedhouses at 26.4 percent.24
Rental housing is a significant feature in Kenya. Much of this middle-income rentalhousing is offered by small scale landlords who build 20 to 40 units on small, family-owned plots. This investment is generally financed with equity, and the pooling ofpersonal loans, or a loan from the SACCO, as the accommodation is builtincrementally. The units are basic, often with poor lighting and limited crossventilation, and no common amenities. They are managed by the owner or a thirdparty agent. At the same time, developers are building larger formal estates ofmore than one hundred apartments, and selling these on a condominium orsectional title basis to investors, who then rent them out to a lower or middleincome target market. For example, Karibu Homes offers entry-level two-bedroom, standard units from Ksh3.43 million (US$34 200). The Riverviewdevelopment comprises of three and four storey walk-ups, rather than stand-aloneunits.25 To contain price, these developments are usually on the urban periphery.Developers finance the construction with their own equity, cash instalments fromindividual buyers and bank debt. Investor units then enter the pool of rental stock,either managed directly by the investor themselves, or a third party.26
Housing Cooperatives are an important affordable housing supplier.27 TheNational Cooperative Housing Union (NACHU), an apex organisation made ofregistered housing cooperatives, works to provide affordable and decent housingto Kenyans in low income communities.28 NACHU has more than 800 housingcooperatives in eight regions of Kenya and has become a leading organisation inthe provision of housing microfinance, capacity building and technical services.
Government is a significant player in the housing supply sector, and increasingly sowith the announcement of the “Big Four” plan. In the 2018 Budget Statement ofthe National Treasury, US$1.5 billion is allocated to public private partnershipprojects for housing for civil servants, police and prisons, and for affordable housingin the period 2018-2020. The statement also confirms the continuation of existinggovernment programmes: investment in low-cost houses through slum upgrading,and the provision of infrastructure services and income-generating activities ininformal settlements.29
The KPDA was established in Nairobi in 2006, to represent stakeholders inproperty development in Kenya. The association has 138 members.30 With thenational focus on affordable housing, the KPDA has formed an Affordable HousingTask Force to collate member perspectives, and engage with government for policychange. According to the KPDA’s Affordable Housing Task Force, there are many
challenges to the delivery of affordable housing, starting with poor urban planningand the failure of municipalities to service land, leaving it to developers who thenadd this to the purchase price. High costs of construction are in part due toKenya’s very high import duties, poor import logistics, and an unfavourable taxregime. Construction finance has become increasingly limited since the introductionof the interest rate caps, and mortgage finance remains both unaffordable andinaccessible.31 A key constraint relates to the inefficient titling process, which,according to the World Bank’s Doing Business survey for 2018, involves nine stepsand takes 61 days.32 High incidental costs result in an additional six percent beingadded to the cost of the unit, to accommodate stamp duty, legal fees, valuationfees and facilitation fees.33
Property marketsKenya has a vibrant upper income property market that is eagerly tracked byvarious analysts. In 2018, Cytonn reported that Kenya’s real estate sector remainsan attractive asset class in large part because of returns (24.3 percent over thelast five years) that are almost double that of traditional asset classes (whichaveraged 13.2 percent). Looking specifically at the Nairobi market, Cytonn foundthat the residential sector recorded total returns of 8.2 percent in 2017/18.34
Rapid property price appreciation (Hass Consult estimates that property valueshave increased by 4.46 times since 2000), however, has put pressure on housingaffordability, and some suggest this is constraining market growth as the high endmarket becomes saturated. In the second quarter of 2018, property pricesincreased by 3.6 percent increase for the quarter (and an annual change of 5.1percent). Hass Consult views the improvement in sales and rentals as a sign ofKenya’s economic recovery, with the main growth in the price and rental of semi-detached houses.35 The Kenya Bankers Association’s Housing Price Index offersa slightly different view, with a 1.76 percent rise in the second quarter of 2018,suggesting a stabilising of house prices. Drivers of the index continue to relate tothe size of the house, parking availability, and access to water through a borehole.36
A key challenge in Kenya’s housing sector relates to land titling. The issuing of titledeeds is a flagship programme of the government, which has registered over 2.43million title deeds between July 2013 and February 2017. The government is alsoengaging in the digitisation of its 57 land registries, which have been keeping manualrecords since 1895. While the President’s Delivery Unit reports that the Nairobiregistry is fully digitized, however, developers argue that titling remains cumbersome.37
Policy and regulationIn Kenya, the Ministry of Land, Housing and Urban Development and the NationalLand Commission (NLC) are the two main institutions responsible for landadministration. The ministry is part of the executive arm of the national governmentwhile the NLC is an independent body that was created by the 2010 Constitution.
The inclusion of affordable housing as one of the four pillars of growth in thePresident’s “Big Four” plan has stimulated a range of policy and regulatory
PPP$40 001 – PPP$10 000 000
PPP$23 001 – PPP$40 000
PPP$12 001 – PPP$23 000
PPP$8 001 – PPP$12 000
PPP$5 001 – PPP$8 000
PPP$3 601 – PPP$5 000
PPP$2 401 – PPP$3 600
PPP$1 601 – PPP$2 400
PPP$801 – PPP$1 600
<PPP$800
KENYA
Annual income profile for rural and urban households based on consumption (PPP$)
No. of households (thousands)
PPP$16 472
PPP$38 286
Rural Urban2 000 1 500 1 000 500 0 500 1 000 1 500 2 000
Population: 46 600 000
Urbanisation rate: 4.20%
Cost of cheapestnewly built house:
1 155 000 KESPPP$24 316
Urban householdsthat could afford thishouse with finance:
50.57%
1 PPP$:47.5 Kenyan
shilling
Source https://www.cgidd.com/
- - - Average annual household income needed for the cheapest newly built house by a formal developer, 2017 Average annual household income using expenditure, 2017 (PPP$)

164
interventions in the housing sector. In its 2018 Budget Review, National Treasuryannounced a series of legislative and administrative interventions, relating to soundplanning that is responsive to household affordability; a focus on housing locationand the use of public land for affordable housing; a reduction in the cost ofconstruction through interventions in the construction value chain; increasing accessto end-user finance, through growing the capacity of the mortgage lending sectorwith the introduction of a Kenya Mortgage Refinance Company; administrativeefficiencies, especially in relation to access to land and formal title; and theintroduction of public private partnerships to expedite administrative approvals,enhance access to well-located land, and improve inter-governmentalcoordination.38
The creation of a National Housing Development Fund was also introducedthrough a proposed amendment to the Employment Act. This amendment willallow for the introduction of a one percent tax on gross monthly salary and amatching contribution by employers to be contributed to the fund. In June, Cytonnquoted the local press in clarifying that individuals in the affordable housing targetmarket would be eligible to access their savings in the NHDF to purchase housingthrough tenant purchase schemes, or as a deposit towards financing their homepurchase with a mortgage. With the effective demand created by the NHDF, thestate would enter into PPPs for housing construction, offering housing on a lotterybasis to NHDF depositors.39
The Budget Policy Statement also announces the reduction of the corporate taxrate for developers who construct at least 100 units per year, and the plans toestablish a National Social Housing Development Fund to strengthen the NationalHousing Corporation. A review of the National Construction Authority Act, theBuilt Environment Bill and related legislation is also planned.40 The Finance Billintroduced amendments to the Central Bank of Kenya Act to include the regulationof mortgage refinance companies. Effectively, this paves the way for the setting upof state-backed Kenya Mortgage Refinancing Company to create liquidity in themortgage market.
Other legislation and policy under development for the achievement of theAffordable Housing programme in Kenya include amendments to the National
Social Security Fund Act to increase contributions; an amendment of RetirementBenefits Authority Act, to allow NSSF to invest more than 30 percent in real estate;an amendment of Stamp Duty Act to exempt first time home owners from payingstamp duty; the imposition of a tax on idle land; a review of the PPP Act; and areduction in property transfer costs.41
The country’s Ease of Doing Business ranking has improved remarkably. Thecountry moved up 12 places, from a ranking of 92 in 2017 to 80 in 2018.42 TheWorld Bank’s Doing Business Report notes that Kenya scrapped the clearance feespreviously payable to the National Environment Management Authority and theNational Construction Authority which effectively reduced construction cost.
OpportunitiesWith clear political will promoting a range of interventions to ensure its success, thefuture of Kenya’s affordable housing sector looks very positive. Government’sambition is not insubstantial: the promise of 500 000 new affordable housing unitsby 2022 will more than double current output, such that National Treasury estimatesthat the real estate and construction sectors will contribute 14 percent to GDP.
For this all to work, however, there is an entire value chain of interventions thatrequire attention. The effective supply of land and infrastructure at the local, countylevel, is on the top of this list. The devolution of powers to the 47 countygovernments is promising, but they will need to engage explicitly with the time andcost of the housing procedures they control. Other policy interventions do lookimminent. For its part, the KPDA is mobilising the private sector and creating auseful platform for debate and innovation through its Affordable Housing Task Force.
A key opportunity that must not be lost in the push towards scale, however, is forsmall scale initiatives that mobilise local level capacity, support entrepreneurialism,and often better target the affordability realities of households that seek improvedhousing conditions. This will require much better targeted housing financingproducts, whether for developers or end-users, whether for incrementalconstruction or larger scale developments. The promise of a KMRC that is awareof this market diversity is encouraging.
1 Speech by His Excellency Hon. Uhuru Kenyatta, C.G.H., President andCommander in Chief of the Defence Forces of the Republic of Kenyaduring the 2017 Jamhuri Day Celebrations at the Moi InternationalSports Centre, Kasarani on the 12th December 2017.http://www.president.go.ke/2017/12/12/speech-by-his-excellency-hon-uhuru-kenyatta-c-g-h-president-and-commander-in-chief-of-the-defence-forces-of-the-republic-of-kenya-during-the-2017-jamhuri-day-celebrations-at-the-moi-international/ (Accessed 29 Sept 2018).
2 African Development Bank Group (2018). Kenya Economic Outlook.https://www.afdb.org/en/countries/east-africa/kenya/kenya-economic-outlook/ (Accessed 29 Sept 2018).
3 KNBS (2018). Economic Survey 2018. https://www.knbs.or.ke/download/economic-survey-2018/ (Accessed 29 Sept 2018).
4 Trading Economics (2018). Kenya Government Debt to GDP 1998-2018.https://tradingeconomics.com/kenya/government-debt-to-gdp (Accessed30 Sept 2018).
5 Central Bank of Kenya. Kenya National Bureau of Statistics & FSD Kenya.(2016). The 2016 FinAccess Household Survey on financial inclusion.Nairobi, Kenya: FSD Kenya. http://s3-eu-central-1.amazonaws.com/fsd-circle/wp-content/uploads/2016/02/30093031/The-2016-FinAccess-household-survey-report4.pdf (Accessed 29 Sept 2018).
6 Central Bank of Kenya (2018). www.centralbank.go.ke (Accessed29 Sept 2018).
7 Central Bank of Kenya (2018). Bank Supervision Annual Report 2017.https://www.centralbank.go.ke/uploads/banking_sector_annual_reports/873911276_2017%20Annual%20Report.pdf (Accessed 29 Sept 2018).
8 Central Bank of Kenya (2017). Monetary Policy Committee Report,October 2017. https://www.centralbank.go.ke/uploads/monetary_policy_reports/907887845_19th%20MPC%20REPORT%20-%20October%202017.pdf (Accessed on 29 Sept 2018).
9 Central Bank of Kenya (2018). Bank Supervision Annual Report 2017. 10 Central Bank of Kenya (2018). Bank Supervision Annual Report 2017. 11 Central Bank of Kenya (2018). Bank Supervision Annual Report 2017. 12 Central Bank of Kenya, Kenya National Bureau of Statistics & FSD Kenya.
(2016). The 2016 FinAccess Household Survey on financial inclusion.Nairobi, Kenya: FSD Kenya. http://s3-eu-central-1.amazonaws.com/fsd-circle/wp-content/uploads/2016/02/30093031/The-2016-FinAccess-household-survey-report4.pdf (Accessed 29 Sept 2018).
13 World Bank (2017). Kenya Economic Update. April 2017. Edition No. 15.Housing: Unavailable and unaffordable. http://documents.worldbank.org/curated/en/988191491576935397/pdf/114115-REVISED-PUBLIC-KenyaEconomicUpdateFINALFINALMay.pdf ( Accessed 29 Sept 2018).
14 Wood, D (2018). Case Study Series 12: The role of savings and creditcooperative organizations in Kenya’s housing finance sector. Centre forAffordable Housing Finance in Africa, March 2018. http://housingfinanceafrica.org/app/uploads/case-study-NO-12-formated.pdf (Accessed 29 Sept 2018).
15 Kiganda, A (2017). Kenyan SACCOs to offer interest-free housing loansplan. Construction Review Online. 21 July 2017.https://constructionreviewonline.com/2017/07/kenyan-saccos-to-offer-interest-free-housing-loans-plan/ (Accessed 30 Sept 2018).
16 See Langhan, S (2016). Case Study Series 2: The role of mortgageliquidity facilities in housing finance: lessons learned from Egypt, Tanzania,Nigeria and Malaysia. Centre for Affordable Housing Finance in Africa,February 2016. http://housingfinanceafrica.org/documents/case-study-2-the-role-of-mortgage-liquidity-facilities-in-housing-finance-lessons-learned-from-egypt-tanzania-nigeria-and-malaysia/ (Accessed 30 Sept 2018).
17 Encasa @ Mombasa Road Price List. March 2018.http://www.suraya.co.ke/wp-content/uploads/2016/03/[email protected] (Accessed 30 Sept 2018).
18 These calculations were made using CAHF’s Housing AffordabilityCalculator. See http://housingfinanceafrica.org/dashboards/calculating-mortgage-housing-affordability-africa/ (Accessed 30 Sept 2018).
19 Encasa @ Mombasa Road Price List. March 2018. 20 KNBS (2018). Economic Survey 2018. https://www.knbs.or.ke/download/
economic-survey-2018/ (Accessed 29 Sept 2018).21 Speech by His Excellency Hon. Uhuru Kenyatta, C.G.H., President and
Commander in Chief of the Fefence Forces of the Republic of Kenyaduring the 2017 Jamhuri Day Celebrations at the Moi InternationalSports Centre, Kasarani on the 12th December 2017.http://www.president.go.ke/2017/12/12/speech-by-his-excellency-hon-uhuru-kenyatta-c-g-h-president-and-commander-in-chief-of-the-defence-forces-of-the-republic-of-kenya-during-the-2017-jamhuri-day-celebrations-at-the-moi-international/ (Accessed 29 Sept 2018).
22 Mugo, D (2018). State’s promised 500,000 low cost homes a drop in theocean. Daily Nation 11 Jan 2018. https://www.pressreader.com/kenya/daily-nation-kenya/20180111/282192241383892 (Accessed 30 Sept 2018).
23 Gardner, D, K Lockwood and J Pienaar (2018). Kenya Private SectorDiagnostic: Affordable Housing & Construction Value Chain ‘Deep Dive’ –Draft report, not for circulation. Centre for Affordable Housing Financein Africa.
24 Hass Consult (2018). Housing Price Index Quarter Two Report 2018.http://www.kba.co.ke/downloads/KBA-HPI%20issue%2015.pdf (Accessed30 Sept 2018).
25 See Karibu Homes. http://karibuhomes.com (Accessed 30 Sept 2018).26 Shah, S (2018). CAHF Benchmarking Research: How can we use CAHF
study to spur Kenyan housing sector. 30 August 2018.http://housingfinanceafrica.org/documents/presentation-seeta-shah-cahf-community-of-practice/ (Accessed 30 Sept 2018).
27 Mwololo (2018). Cooperatives to deliver 500 000 social housing. Units.Daily Nation. https://www.nation.co.ke/lifestyle/dn2/Cooperatives-to-deliver-social-housing-units/957860-4670584-1jqx1rz/index.html(Accessed 24 Aug2018).
28 See NACHU. https://nachu.or.ke (Accessed 30 Sept 2018).
29 Republic of Kenya, National Treasury (2018). Medium Term 2018 BudgetPolicy Statement – Creating Jobs, Transforming Lives – “The Big Four”Plan. Feb 2018. http://www.treasury.go.ke/component/jdownloads/send/195-budget-policy-statement/732-2018-budget-policy-statement.html(Accessed 30 Sept 2018).
30 See Kenya Property Developers Association. http://www.kpda.or.ke(Accessed 30 Sept 2018).
31 KPDA, iJenga (2018). Affordable Housing in Kenya: Investment cases fordevelopers building affordable homes in Nairobi. Industry Report. 26 June2018. http://housingfinanceafrica.org/documents/affordable-housing-in-kenya-investment-cases-for-developers-in-nairobi/ (Accessed 30 Sept 2018).
32 World Bank (2018). Doing Business 2018: Kenya.http://www.doingbusiness.org/content/dam/doingBusiness/country/k/kenya/KEN.pdf (Accessed 30 Sept 2018).
33 KPDA, iJenga (2018). Affordable Housing in Kenya: Investment cases fordevelopers building affordable homes in Nairobi. Industry Report. 26 June2018. http://housingfinanceafrica.org/documents/affordable-housing-in-kenya-investment-cases-for-developers-in-nairobi/ (Accessed 30 Sept 2018).
34 Cytonn Report (2018). Nairobi Metropolitan Area Residential Report2017/18 & Cytonn Weekly #26/2018. 8 July 2018. https://cytonnreport.com/research/nairobi-metropolitan-area-residential-report-cytonn-weekly-262018#focus-of-the-week (Accessed 30 Sept 2018).
35 Hass Consult (2018). Housing Price Index Quarter Two Report 2018.http://www.kba.co.ke/downloads/KBA-HPI%20issue%2015.pdf (Accessed30 Sept 2018).
36 Kenya Bankers Association (2018). Housing Price Index, September2018. http://www.kba.co.ke/downloads/KBA-HPI%20issue%2015.pdf(Accessed on 30 Sept 2018).
37 Government of Kenya (2018). Flagship Projects.https://www.delivery.go.ke/flagship (Accessed 31 July 2018).
38 Republic of Kenya, National Treasury (2018). Medium Term 2018 BudgetPolicy Statement – Creating Jobs, Transforming Lives – “The Big Four”Plan. Feb 2018. http://www.treasury.go.ke/component/jdownloads/send/195-budget-policy-statement/732-2018-budget-policy-statement.html(Accessed 30 Sept 2018).
39 Cytonn Report (2018). Eurobonds in Sub-Saharan Africa, & CytonnWeekly #25/2018. 24 June 2018. https://cytonnreport.com/research/eurobonds-in-sub-saharan-africa-cytonn-weekly-252018#real-estate(Accessed 30 Sept 2018).
40 Republic of Kenya, National Treasury (2018). Medium Term 2018 BudgetPolicy Statement – Creating Jobs, Transforming Lives – “The Big Four”Plan. Feb 2018. http://www.treasury.go.ke/component/jdownloads/send/195-budget-policy-statement/732-2018-budget-policy-statement.html (Accessed 30 Sept 2018).
41 See http://www.president.go.ke/affordable-housing/ (Accessed 30 Sept 2018).42 World Bank (2018). Doing Business 2018: Kenya.
http://www.doingbusiness.org/content/dam/doingBusiness/country/k/kenya/KEN.pdf (Accessed 30 Sept 2018).

Africa Housing Finance Yearbook 2018
165
mortgage finance product. Lesotho has an operational credit bureau system withapproximately 137 000 individuals and 220 000 accounts registered in the bureau.9
Credit information enquiries, mostly by banks, have risen to 13 000 since theestablishment of the bureau two years ago.10 The Lesotho ministerial cabinet ispreparing legislation on the Secured Transaction Regime that would permitmovable property to serve as collateral.
SLB offers home loans from LSL100 000 (US$7 570.20) up to LSL10 million atthe rate of 12.5 percent a year payable over a 20-year period. SLB has anestimated 2 100 mortgages and the average loan size is LSL328 833(US$23 076).11 The total amount of home loans outstanding in 2018 isLSL208 915.45 (US$15 8153) and this represents 6.95 percent of the outstandingloans. It also offers pension-backed loans, but these are not recorded separatelyfrom normal loans. FNB Lesotho also offers home loans at an interest rate of11.25 percent a year. Nedbank Lesotho offers home loans to purchase property.
OverviewLesotho is a mountainous, landlocked country surrounded by the Republic ofSouth Africa, with an estimated population of 2 263 253 people in 2018. Thepopulation growth rate increased from 0.68 to 1.2 percent in 2016. In 2016,31.7 percent of the population lived in urban areas while 68.3 percent lived in therural areas.1 The national household average size is estimated at 4.8 persons forrural areas and 3.4 persons in urban areas. The rural population stands at1 590 277 and the urban population 68 5938 in 2018.2 The urbanisation rate ofLesotho is 3.5 percent a year. There are 10 main urban centres, namely MaseruCity, Teyateyaneng (TY) Berea, Maputsoe Leribe, Hlotse Leribe, Botha-Bothe,Mafeteng, Mohales’hoek, Moyeni Quthing, Thaba-Tseka and Qachas’nek.
The inflation rate in Lesotho was recorded at 2.90 percent in July 2018 and isestimated to be 3.30 percent by the end of September, 2018.3 According toTrading Economics global models and analysts' expectations, it is further estimatedthat inflation will stand at 3.10 percent in 12 months time.4 The GDP was US$2.30billion in 2016 and increased to US$2.64 billion in 2017.5 The GDP growth ratewas 2.40 percent in 2016 and 4.60 percent in 2017. This contributed to economicgrowth as a result of the following sectors as main contributors: agriculture,manufacturing, mining and quarrying. Other services and goods as well as taxesalso contributed to Lesotho’s economy.
The GDP per capita in 2017 was recorded at LSL18 612.45 (US$1 409.20).6
Lesotho’s overall fiscal position remained weak for most of 2017/18, with sporadicspikes of shortages in cash and foreign reserves. Government revenue is projectedto be LSL845.7 million (US$59.3 million) below budget by the end of March2018.7 The fiscal deficit is estimated at 5.7 percent of GDP for the fiscal year2017/18, up from the budgeted 4.8 percent.8
Access to finance Lesotho has a limited banking sector. Access to housing finance is mainly mortgagefinance, with approximately 400 loans a year provided to borrowers who earnabove LSL1 285 (US$900) a month. This sector is regulated by the Central Bankof Lesotho and is dominated by Standard Lesotho Bank Limited (SLB), FirstNational Bank (FNB), Nedbank Lesotho and Lesotho Postbank (LPB). NedbankLesotho has 10 main branches spread across the seven districts of Lesotho, fourof which are based in Maseru District. Standard Bank has 16 branches throughoutthe country, with four in Maseru. LPB is the only bank that does not offer a
LesothoKEY FIGURES
Main urban centresMaseru City Teyateyaneng
Exchange rate: 1 US$ = [a] 13 Jul 2018PPP Exchange rate (Local currency/PPP$) 1 Loti = [b]Inflation 2016 [b] | Inflation 2017 [b] | Inflation 2018 [b]
14.69 Loti5.006.21 | 5.60 | 4.80
Population [c] | Urban population size 2016 [d]Population growth rate [c] | Urbanisation ratePercentage of the total population below National Poverty Line [e]Unemployment rate [f]
2 264 063 | 685 9381.33% | 3.50%40.0%28%
GDP (Current US$) 2016 [b] | GDP growth rate annual 2016 [b]GDP per capita (Current US$) 2016 [b]GNI per capita (Current US$) 2016 [b]Gini co-efficient [g]HDI global ranking 2017 | HDI country index score 2017
US$2 639 million | 5.59%US$1 181US$1 28054.2159 | 0.52
Is there a deeds registry? [h]Number of residential properties that have a title deed [h]Lending interest rate Mortgage interest rate | Mortgage term (years)DownpaymentMortgage book as a percentage of the GDPEstimated number of mortgages Price to Rent Ratio in City Centre | Outside City Centre Gross Rental Yield in City Centre | Outside City Centre Construction as a % of GDP
Yes65 95810.00%11.87% | 2015%4%n/an/a | n/an/a | n/an/a
What is the cost of standard 50kg bag of cement? What is the price of the cheapest, newly built house by a formaldeveloper or contractor? (Local currency)What is the price of the cheapest, newly built house by a formaldeveloper or contractor? (US$) What is the size of this house (m2)? What is the average rental price for this unit (US$)? What is the minimum stand or plot size for residential property?
US$6.83
214 694 Loti
US$14 61540m2
US$170375m2
Ease of Doing Business Rank [i]Number of procedures to register property [i]Time to register property (days) [i]Cost to register property (as % of property value) [i]
104443 days8.10%
NB: Figures are for 2018 unless stated otherwise.
[a] Bank of Lesotho[b] World Bank World Development Indicators[c] Worldpopulationreview.com[d] Lesotho Bureau of Statistics [e] United Nations Indicators for Monitoring the Millenium Development Goals[f] Indexmundi[g] Trading Economics[h] Lesotho Land Administration Authority[i] World Bank Doing Business

166
It requires a bond initiation fee of LSL5 700 (US$431.50) as a once-off cost forprocessing the home loan, occupational rent if the client moves in before thetransfer date, and the bond registration costs.
LPB provides financial services predominantly to the under-served Basotho in theurban areas and previously un-served rural population. LPB has 42 branchesthroughout the country and ATMs but it does not provide mortgages.12
There are 235 non-banking financial institutions, 51 active financial cooperatives,11 insurance companies, four licensed asset managers, 30 licensed insurancebrokers, 102 pension funds, and six collective investment schemes, including twomoney market funds. There are 29 registered micro lenders in Lesotho and it isestimated that there are an additional 50 microlenders that are not registeredwith the central bank. Among these micro lenders, there are only two that areproviding housing-related loans in a specific housing portfolio and these are LesanaFinancial Services and Letshego Financial Services. The average loan size given byLesana Financial Services is LSL36 736.15 (US$2 781). The loans are payable atan interest rate of 21.5 percent for housing-related loans and 45 percent for otherloans. The loan duration ranges from a year to over a period of 60 months. In2018, there are 4 743 housing micro finance loans provided by Lesana FinancialServices and its unsecured lending interest is 17.96 percent.13
AffordabilityLesotho is classified as one of the least developed countries globally; 40 percentof its total population is living below the international poverty line of LSL15.20(US$1.25) a day.14 Above 20 percent of the population is at risk of multi-dimensional poverty, HIV/AIDS, hunger, and unemployment.15 The unemploymentrate remains very high and is estimated at 28.1 percent of the economically activepopulation aged 15 years and above.16
The Lesotho Housing Profile 2016 revealed that approximately 70 percent ofBasotho households earn less than LSL1 000 (about US$ 70) a month. The costof housing to household expenditure ratio is 4:1. Seventy percent of the totalurban housing stock in Lesotho is provided through the informal channels andrental affordability is estimated at 25 to 30 percent of household expenditure.17
Therefore, urban households can afford to occupy just a single room and paybetween LSL208 (US$14.59) to LSL250 (US$17.54) a month for rent.18 Asignificant number of Basotho people cannot afford to buy formally developedhouses despite the 17 percent of Basotho earning a salary in the formal market,as the average loan size provided by Standard Lesotho Bank is US$23 076 orLSL328 833.
In Lesotho the price of the cheapest newly built house by a formal developer orcontractor is LSL193 059.55 (US$14 615). The average rental price is LSL2 575.90(US$195) a month. Only middle and high income earners can afford this type ofa house, which is normally a two-bedroomed house with an average size of 40m2.
The minimum plot size according to 1990 Lesotho Planning Standards is 375m2
and at the current land market prices, plots are sold at LSL100 (US$7.57) a squaremetre. This remains unaffordable for most low income Basotho. Notwithstandingall these challenges, Basotho still rely on social networks and inheritance to ownproperty with a small percentage, 23 percent, living in houses they financedthrough bank loans. Some build their homes themselves while others live in homesthat they have inherited.19
Housing supplyAlthough the right to adequate housing is reflected in the Constitution of Lesotho,the government has not yet fulfilled its mandate to facilitate the realisation of thisright. The Lesotho Housing Profile (2015) estimated that a total of 99 000dwellings (or 170 000 rooms) will have to be constructed by 2025 to meet thedemand for housing in Lesotho. An estimated 5 200 dwellings or 9 000 rooms ayear are needed to meet the annual urban housing demand.20 This is largelybecause of urban migration, new household formations, overcrowding and a largelyobsolete housing stock. According to the UN-Habitat definition of a slum, almost68 percent of Lesotho households live in slum conditions.
Lesotho Housing and Land Development Corporation (LHLDC) is a governmentparastatal mandated to deliver formal housing in Lesotho. The LHLDC has taken
a phased approach to housing delivery. Maseru South West (MASOWE) ProjectPhase I and II was implemented between 2000 and 2010. MASOWE Phase IIIwas implemented between 2010 and 2016 where only 34 houses were built andsold between 2010 and 2016. In MASOWE IV, LHLDC had 448 residential plotswith 189 earmarked for low income housing. The average plot size of these unitswas 450m2. An additional 227 were earmarked for middle to high income housingwith plot sizes ranging from 700m2 to 800m2. LHDC also faces challenges ofadequate housing finance to be able to execute its housing mandate effectivelyand satisfactorily. There was an additional 17 two-bedroom housing project inLinakotseng that was initiated by the Ministry of Local Government andChieftainship as a low income housing project and later transferred to LHLDC in2015. All 17 houses have been sold between 2017 and 2018.
LHLDC also provides rental for middle income households at an average ofUS$343.16, and US$480.42 for high income households. The Maseru MunicipalCouncil (MMC) is responsible for planning and allocating land within the designatedcity boundaries and for housing development in public-private partnerships (PPP).In 2017, MMC sold out serviced sites for the high income earners in the innercity of Maseru at LSL250 (US$19.04) a square meter. Plot sizes were 40m2 and30m2 at Matala Phase II and sold at a price of LSL150 (US$11.42) a square metre.These were primarily targeted at middle income households. Low income buyershave also been considered. The provision of 36 plots selling at LSL60 (US$4.57)a square metre located at Khubelu area provides an opportunity for low incomehouseholds who intend on constructing incrementally over time.
There is a booming market for private housing developers to do satellite townhousing developments in partnership with the MMC. This includes a pipelinehousing development currently under negotiation, called “MORERO CityDevelopment: Sustainable Infrastructure for a better future”. The aim of this newhousing project is to provide a mixed-use development located in the South Westof Maseru, 5km from the Maseru City Centre. The project will require 400ha ofland for residential housing, office space and education facilities.21 Thedevelopment will also include a retail complex, hotel and sport facilities. Theproject is meant to be delivered over a four-year period.
To date, the NGO Habitat for Humanity has helped 2 724 households with varioushousing solutions. Between July 2016 and June 2017, 70 two-room houses withpit latrines were built for vulnerable households in the country. From July 2017to June 2018, an additional 50 pit latrines and two-room houses of 25.92m2 wereconstructed.22 Most of the houses provided under Habitat for Humanity Lesothoare 100 percent subsidised. The NGO is the only one working in the housingsector in Lesotho.
Private Housing Developers in Lesotho include Matekane Group of Companies(MGC) Properties, Lesotho Housing and Land Development Corporation,Creative Properties, Green City Construction and Property Developers, withdevelopments such as the Bridge Estate Rental, Masowe 3 Rental, Thetsane WestRental, New Office Park Masowe, New Development 1 Phuthiatsana River TypeA & B and Caledon River Estate New Residential Development. Growth in theconstruction sector is estimated at 1 percent a year and contributes approximately9 percent of GDP.23
MGC Properties has built 20 three-bedroom luxury houses at Mpilo Estate. Theprice per unit ranges from LSL1.8 million to LSL2.5 million (US$137 090 toUS$190 403). Sigma Construction and Property Development has developedlow, middle, and high income residential houses (both detached and multi-family)in Mabote, Khubetsoana, MASOWE II and III. Their housing stock for sale catersfor middle to high income buyers only and ranges from LSL650 000 (US$44 610)to LSL950 000 (US$65 199) and LSL1.5 million (US$102 947) to LSL3.5 million(US$240 210) respectively. It also caters for low income renters, with rentalsranging from LSL1 800 (US$123) to LSL2 500 (US$171); LSL5 000 (US$343) toLSL10 000 (US$686) for middle income and LSL15 000 (US$1 029) to LSL25 000(US$1 715) for high income categories.
The cost of a standard 50kg bag of cement in July 2018 was LSL84.84 (US$6.38)at factory warehouses and LSL100 (US$7.52) at the retail outlets.

Africa Housing Finance Yearbook 2018
167
Property marketsProperty markets are skewed towards potential buyers in the middle to highincome category and only a few middle to high income earners rely on real-estateagents. The real-estate sector is not formally regulated, resulting in a lack of dataand inflated prices.
The real estate and property markets have recently made use of technologies likewebsite marketing for house rental and sale. MyProperty Real Estate and Propertyis helping house buyers and renters to find the best and cheapest properties forrent or for sale in Lesotho, both from private sellers or real estate brokers andagents. MyProperty.co.ls uses new technologies to offer the best rates in thecountry from Maseru to Mafeteng, Pitseng and other parts of the country. It offersvarious types of properties from apartments, houses, condominiums to plots ofland for sale.24
Lesotho has a dynamic land tenure system, characterised by both the customaryand statutory land tenure systems. The type of land tenure rights that exist inLesotho comprise Leasehold, Form C and Title Deed. The 2016 Population andHousing Census (PHC) Report revealed that 16 percent of the population haslease rights; 41 percent has Form C rights, 4 percent has Title Deed and 27 percentand 12 percent25 represents other and none of the above. This implies that only61 percent of Basotho have land rights documents.
The land legislative and institutional reforms that took place In Lesotho in 2010supported the establishment of the Land Administration Authority (LAA) and theadoption of the new Land Act 2010, which brought significant improvement inthe land sector. It helped speed up the processing of land leases, which improvedrevenue collection through efficient land billing and collection systems such as landtaxes. The LAA has reduced costs and time of registering title by large margins.The registering of titles, which used to take between six and 10 years, now takes11 days, with a ninety-year lease issued in a month. In 2018, a total of 76 581leases have been issued and registered with the office of the Register of Deeds atthe Land Administration Authority.26
With the support of the World Bank and the Private Sector Competitiveness andEconomic Diversification Project, government has improved the constructionpermit process by moving from manual to electronic and automated systems,reducing the time and cost of issuing the permits.27
Policy and regulationThe National Housing Policy Implementation Strategy 2018-2020, developed inpartnership with UN-Habitat, sets out the priority actions and activities that areproposed for the five-year period from 2016 to 2021, towards the achievementof the goals of the National Housing Policy. The goal is to “achieve the progressiverealization of the right to adequate housing for all by promoting housing as a basichuman right, a social good, an economic investment, job creation opportunity anda strategy for poverty reduction.”28
The Maseru Urban Planning and Transportation Study was prepared as a steptowards developing an urban policy and structure plan for the City of Maseru andto inform the development of a National Spatial Development Framework. Thegoals and objectives of this study will provide adequate and varied housingsolutions and choices, especially affordable serviced housing, to meet existing andprojected needs.29 With the current urbanisation rate, these frameworks will beimportant in guiding the spatial distribution of people, resources, and the use andconsumption of land.
The Maseru Master Plan Readiness Study that was started in 2015 was completedin 2018. This will provide guiding principles for Maseru urban management systems,especially in enhancing municipal finance and real estate development. It will alsoaid the implementation of housing and neighbourhood development, and willserve as a road map for urban implementation and as a tool for integration ofurbanisation across all departments.
The review of the National Strategic Development Plan II and its implementationin 2018 – 2022 will help the country to:
n Promote densification/through zoning and infill development in the inner areasof all urban centres in Lesotho, in which the public sector owns extensiveland, but under extremely low-density development. This will make housingmore affordable by cutting capital costs and bringing people closer toinfrastructure and other services.
n Review, update and adopt the regulatory framework for urban developmentin the country.
n Develop new frameworks, including the National Urban Policy and theNational Spatial Development Framework.
n Adopt: Sectional Title Bill, Maseru Urban Planning and Transport Study for theCity of Maseru.
n Review: Development Control Code 1989, Planning Standards 1990.
Lesotho has been given the privilege to chair the Sub-Committee on HumanSettlement and Urban Development (HUD) of the African Union SpecializedTechnical Committee no.8 on Public Service, Local Government, UrbanDevelopment and Decentralization (AU-STC no.8). This opportunity will helpLesotho to implement the Harmonized Implementation Framework for the NewUrban Agenda, which was adopted in Quito, Ecuador in October 2016. Theframework highlights the synergies of the New Urban Agenda with otherinternational commitments such as the Sustainable Development Goals,particularly Goal 11, and the 2036 African Agenda Goals.
Opportunities There is still an opportunity for property market investment due to the high levelsof demand, particularly for the middle to higher income groups. Quite a numberof different property developments have been advertised for various housingoptions in 2018. The most popular one is MyProperty for Real Estate and
PPP$40 001 – PPP$10 000 000
PPP$23 001 – PPP$40 000
PPP$12 001 – PPP$23 000
PPP$8 001 – PPP$12 000
PPP$5 001 – PPP$8 000
PPP$3 601 – PPP$5 000
PPP$2 401 – PPP$3 600
PPP$1 601 – PPP$2 400
PPP$801 – PPP$1 600
<PPP$800
LESOTHO
Annual income profile for rural and urban households based on consumption (PPP$)
No. of households (thousands)
PPP$13 435
PPP$18 006
Rural Urban80 60 40 20 0 20 40 60 80
Population: 2 264 063
Urbanisation rate: 3.50%
Cost of cheapestnewly built house:
214 694 LSLPPP$42 939
Urban householdsthat could afford thishouse with finance:
17.78%
1 PPP$: 5 Loti
Source https://www.cgidd.com/
- - - Average annual household income needed for the cheapest newly built house by a formal developer, 2017 Average annual household income using expenditure, 2017 (PPP$)

168
Property for sale and rent. In 2018, it had 245 units for rent and 331 for saleacross the whole country that it advertised on its website.30
The ongoing legislative and policy reforms coupled with the current developments,which are concentrated mostly in Maseru, leave other districts open forinvestments in the housing sector. Microfinance institutions continue to increasethe number of clients receiving housing microfinance services and this helpsprovide diversified innovative housing options targeted at lower income earners.As a result of the implementation of the Private Sector Competitiveness andEconomic Diversification Project initiative, the number of days required to registera company decreased from 28 to seven.31 Additionally, the number of daysrequired to obtain an industrial license decreased from 35 to five days, and theturn-around time for a trade licence was reduced to 15 days from 30-50 days.According to the latest World Bank annual rating, Lesotho is ranked 104 in 2017among 190 economies in the ease of doing business.32
Progress made in addressing land allocation and management weaknesseshighlighted previously helped to reduce the number of days taken from 30 to 11days for acquiring a land lease from date of submission, as well as five days toregister a deed. The number of land transactions recorded has increasedtremendously in 2017 which will facilitate various development initiatives on thepieces of land by the land owners, including housing development. This alsoincreases investment opportunities as commercial banks accept land lease ascollateral for loans. An approval of Sectional Titles will create opportunities inproperty ownership as it enables separate ownership of a section or sections ofa building. Apartments can therefore, be owner occupied. Processes to reviewthe 1980 Town and Country Planning Act, which is aimed at promoting orderlydevelopment of land in urban areas, are under way. The review document willpave the way to the establishment of planning boards, declare planning areas andset out procedures for the preparation of physical plans which will createopportunities for acquisition of planned sites for development in an efficientmanner.
Additional sourcesCentral Intelligence Agency (CIA) World Factbook (Jan 2018). LesothoPopulation below poverty line. https://www.indexmundi.com/lesotho/(Accessed July 2018).
Lesotho Bureau of Statistics (BOS). Lesotho Inflation Rate (April 2018).https://www.tradingeconomics.com/lesotho/inflation-cpi/forecast/ (Accessed3 Sept 2018).
Mabaleha, Rethabile (2018). Public Relations and Marketing Department.Standard Lesotho Bank. July 2018.
Majale, Dr. Michael (April 2018). United Nations Human SettlementsProgramme (UN-Habitat). National Housing Implementation Strategy 2018-2022.
Matsoso, Manthatisi (2018). Interview with Compliance Manager, LesanaFinancial Services, 25 July 2018.
Ministry of Local Government and Chieftainship (2016). Land AdministrationAuthority Audit Report (2016/17).
Mpaki, Bereng. (January 2017). Credit Bureau expands to corporates.https://www.lestimes.com/credit_bureau-expands-to-corporates (Accessed July2018).
Myproperty. Real Estate and Property in Lesotho. https://www.myproperty.co.ls/(Accessed July 2018).
Paradza, Dr. Gaynor (July 2018). Women’s Access to Land and Housing inLesotho. Unpublished research report undertaken for Habitat for HumanityLesotho.
Sephoso Tankiso. Land Administration Authority Newsletter : MOBUNews/Volume 6.Issue 1, 2018: Women Access to Land Economic Emancipation.Presented at 2017 Conference on Land Policy in Africa held in Addis Ababa,Ethiopia.
Tipple, Graham (2015). United Nations Human Settlements Programme (UN-Habitat). (October 2015). Lesotho Housing Profile.
United Nations Fund (Nov 2016). UNFPA 6th Country Programme Evaluation:Kingdom of Lesotho 2013-2017. Pg.75.
United Nations Population Fund (July 2018). Lesotho Population 2018:Demographics, Maps and Graphs. (2018).https://worldpopulationreview.com/countries/lesotho-population (Accessed3 Sept 2018).
The World Bank- Doing Business. (2018). Ease of Doing Business in Lesotho.https://tradingeconomics.com/lesotho/ease-of-doing-business/ (Accessed June2018).
1 Bureau of Statistics (2016). National Population and Housing Census.2 Ibid. Pg 13.3 Trading Economics. Lesotho Inflation Rate – Forecast. https://tradingeconomics.com/lesotho/inflation-
cpi/forecast/ (Accessed 9 Sept 2018).4 Ibid.5 International Monetary Fund (2017). IMF World Economic Outlook: Real GDP Growth.
https://www.gfmag.com/global-data/country-data/lesotho-gdp/ (Accessed Sept 2018).6 Trading Economics (2017). Lesotho GDP Per Capita PPP. https://tradingeconomics/lesotho/gdp-per-capita/
(Accessed July 2018).7 Dr. Moeketsi Majoro, Budget Speech to the Parliament of Lesotho for the 2018/19 Fiscal Year, 28 February
2018.8 Dr. Majoro, Pg. 2.9 Dr. Majoro, Pg. 4.10 Lebohang Rakotsoane (August 2016). The Post Newsletter : Credit Bureau makes progress.
http://www.thepost.co.ls/business/credit-bureau-makes-progress (Accessed June 2018).11 Information submitted from Standard Lesotho Bank from Business Department, July 2018.12 Auto Teller Machines placed at strategic public places as a convenient outlet to withdraw money.13 Interview with Compliance Manager, Lesana Financial Services, 25 July 2018.14 World Population Review. Lesotho Population (2018). https://worldpopulationreview.com/country/lesotho-
population/ Accessed 9 Sept 2018).15 Ibid.
16 Central Bank of Lesotho (March 2016). Quarterly Review.17 United Nations Human Settlement Programme, UN–Habitat (2015). Lesotho Housing Profile.18 Ministry of Local Government and Chieftainship (2016). Lesotho Housing Policy Draft. Pg. 7.19 Ibid.20 UN-Habitat (2015). Lesotho Housing Profile. https://unhabitat.org/lesotho-urban-housing-profile Pg. 52.21 Lerotholi, David (2018). MORERO City Development Holdings (PTY) Ltd.22 Habitat for Humanity Lesotho (June 2018). Global Matrix Tool(GMT) Report.23 Ministry of Local Government and Chieftainship (April 2018). National Housing Policy: Implementation
Strategy 2018-2022.24 https://www.myproperty.co.ls25 Bureau of Statistics (2016). National Population and Housing Census.26 Director of Leases (2018). Land Administration Authority. https://www.laa.org.ls/27 Dr. Gaynor Paradza (June 2018). The Draft Lesotho Baseline on Women’s Access to Land: Research Summary
and Recommendations Note.28 Ministry of Local Government and Chieftainship (2018). National Housing Implementation Strategy - 2018-
2022.29 Maseru City Council (2017). Maseru Urban Planning and Transportation Study. 30 Myproperty Real Estate and Property in Lesotho (2018). https://www.myproperty.co.ls/31 Land Administration Authority Audit Report (2016/17), Ministry of Local Government and Chieftainship.32 The World Bank- Doing Business. (2018). Ease of Doing Business in Lesotho.

Africa Housing Finance Yearbook 2018
169
coupled with a drop in commodity prices has further weakened the country’seconomy. The total revenue collected in the financial year 2016/17 was LRD77.01billion (US$523.8 million), representing a 13 percent deficit against the approvedforecast of LRD88.24 billion (US$600.2 million). Taxes on international tradedeclined by LRD3.514 billion (US$23.9 million) or 12 percent.11 Liberia ranks172 out of 190 countries on the Ease of Doing Business Ranking 2018.12
The mortgage sector in Liberia has historically been weak since the collapse ofthe National Housing and Savings Bank in the 1990s during the civil war. Currentlythe main commercial bank offering housing loans to the public is the Liberian Bankfor Development and Investment (LBDI), while Ecobank provides housing loansto its staff only. In addition, Mutual Fund for Africa, a local credit union, offersconstruction materials to its clients as a form of housing credit. However, housingmicrofinance is undeveloped.
The newly elected government under His Excellency George M. Weah, Presidentof the Republic of Liberia, has demonstrated good will by prioritising housing aspart of an infrastructure programme. On 20 June 2018, the president launcheda LRD1.176 billion (US$8 million) modern Rural Housing Project in MargibiCounty to lift rural inhabitants out of poverty. He assured Liberians that all the15 political sub-divisions will benefit from the project, stressing: “This is my promise
OverviewThe Republic of Liberia is on the West coast of Africa bordered by Sierra Leoneto the west, Guinea to the north, Côte d’Ivoire to the east and the Atlantic Oceanto the south. The country became independent in 1847 and now has a populationof 4.8 million. It is one of the poorest countries in the world with a HumanDevelopment Index (HDI) score of 0.427, placing it at a ranking of 177 out of188 countries.1
Liberia’s population density is 50 per km2 (131 people per m2). Total land area is96 320km2 and 50.8 percent of the population is urban (2 467 489 people in2018). The median age is 18.7 years.2 In 2017, Liberia’s population increased byapproximately 2.53 percent compared to the previous year.3 Sixty-six percent ofthe urban population lives in slums. Forty percent of Liberia’s population lives inthe Capital City Monrovia and 70 percent of Monrovia’s population lives in slums.Sixty-eight percent of all employment is informal.4
Liberia is a member of several regional institutions including the West AfricanMonetary Institute, West African Monetary Agency, Economic Community of WestAfrican States, and the Association of African Central Banks. Liberia’s developmentpartners include the World Bank, International Monetary Fund, and the AfricanDevelopment Bank.5 It is considered a low income country with a Gross NationalIncome (GNI) per capita of LRD54 396 (US$370) for 2016 – this is the mostrecent information available.6 Gross Domestic Product (GDP) growth is expectedto be 3.9 percent in 2018.7 The US$ exchange rate increased from LRD81.14 in2017 to LRD147.0171 in July 2018.8 The inflation rate increased from a provisional10.0 percent in June 2017 to 12.4 percent at the end of 2017 – representing a2.4 percentage point increase.
The provisional inflation rate in 2018 is 17.5 percent, representing an8.9 percentage point increase above the projected 8.6 percent already reported.9
The average lending rates declined from 13.59 percent in 2016 to 13.25 percentin 2017, personal loans from 13.92 percent to 12.97 percent, mortgages from13.85 percent to 13.33 percent, and time deposit from 3.82 percent to3.75 percent respectively.10
The country’s economy is dependent on exported natural resources: iron ore,rubber, timber, gold, diamond, coffee, and cocoa. The Ebola epidemic in 2014
LiberiaKEY FIGURES
Main urban centres Monrovia
Exchange rate: 1 US$ = [a] 29 Jul 2018PPP Exchange rate (Local currency/PPP$) 1 Liberian dollar = [b]Inflation 2016 [a] | Inflation 2017 [a] | Inflation 2018 [c]
147.01 Liberian dollar0.608.88 | 12.40 | 17.50
Population 2017 [d] | Urban population size [d] Population growth rate [d] | Urbanisation rate [e]Percentage of the total population below National Poverty Line [f]Unemployment rate [c]
4 853 516 | 2 467 4892.60% | 3.24%54%4%
GDP (Current US$) 2017 [b] | GDP growth rate annual 2017 [b]GDP per capita (Current US$) 2017 [b]GNI per capita (Current US$) 2017 [b]Gini co-efficient [g]HDI global ranking 2017 [h] | HDI country index score 2017 [h]
US$2 158million | 2.45%US$456US$38033181 | 0.435
Is there a deeds registry? [i] Number of residential properties that have a title deed Lending interest rate [a] Mortgage interest rate | Mortgage term (years)DownpaymentMortgage book as a percentage of the GDPEstimated number of mortgages Price to Rent Ratio in City Centre | Outside City Centre Gross Rental Yield in City Centre | Outside City Centre Construction as a % of GDP [i]
Yesn/a13.25%13.33% | 830%4%n/an/a | n/an/a | n/an/a
What is the cost of standard 50kg bag of cement? What is the price of the cheapest, newly built house by a formaldeveloper or contractor? (Local currency)What is the price of the cheapest, newly built house by a formaldeveloper or contractor? (US$) What is the size of this house (m2)? What is the average rental price for this unit (US$)? What is the minimum stand or plot size for residential property?
US$8.00
1 200 000 Liberian dollar
US$15 000194m2
US$901 012m2
Ease of Doing Business Rank [j]Number of procedures to register property [j]Time to register property (days) [j]Cost to register property (as % of property value) [j]
172n/a6 days16.00%
NB: Figures are for 2018 unless stated otherwise.
[a] Central Bank of Liberia[b] World Bank World Development Indicators[c] Trading Economics[d] Worldometers[e] Indexmundi[f] Allafrica.com[g] Africa Development Bank[h] UNDP Development Indicators[i] Government of Liberia - Center for National Documents, Records and Archives[j] World Bank Doing Business

170
to them.” According to him, the project fulfills a promise made to the Liberianpeople during the 2017 campaign period.13
Access to financeAccess to finance is a major challenge. Liberia is ranked 172 out of 190 economiesfor access to credit according to the World Bank Doing Business Report 2018.14
Total credit stock of commercial banks to all sectors of the economy as atNovember 2017 amounted to LRD53.34 billion (US$362.8 million), a growth of31.0 percent when matched against the amount of LRD98.249 billion (US$666.9million) recorded in December 2016. Credit to construction is recorded at6.9 percent.15 However, the percentage of construction loans disbursed tohousing construction is not clear. The number of operating non-deposit-takingmicrofinance institutions is 16, with 49 networks mainly providing services in thehard-to-reach rural communities across the country. The sector’s client baseexpanded from 23 478 to 26 326 in 2017. Meanwhile, a diagnostic and assessmentstudy of microfinance sector has resulted in a concept document for a “TieredRisk-Based Approach to Regulation of Microfinance Institutions in Liberia”.16
There are nine registered commercial banks in Liberia. The total number of branchnetworks, windows and annexes across the country reduced from 93 in 2016 to90 in 2017 due to the closure of some unprofitable branches by Ecobank. Thereis one development finance company, Liberian Enterprise Development FinanceCompany, one deposit-taking microfinance institution, Diaconia MDI, and 19 licensedinsurance companies with 31 branches across the country. There are two insurancebrokerage firms licensed by the Central Bank of Liberia (CBL) to provide insuranceintermediation. Registered licensed foreign exchange bureaus increased from 131in 2016 to 133 in 2017. There are 12 licensed Rural Community Finance Institutions,260 credit unions, and 2 300 Village Savings and Loan Associations, and two mobilemoney providers – Orange Money, a subsidiary of Orange CommunicationCompany, and Lonestar Cell MTN Mobile Money Inc. The number of mobilemoney agents increased from 2 110 in 2016 to 3 162 in 2017. The banking industry,which is the largest subsector of the financial sector (accounting for at least 85percent of the total assets of the financial sector), witnessed strong growth in itsbalance sheet in 2017, mainly due to exchange rate depreciation of the Liberiandollar (the reporting currency) and increased business activities during the year.Total assets rose by 30.1 percent compared with 5.4 percent in 2016. Total capitalalso grew by 38.4 percent compared with 21.2 percent in 2016 while total depositsgrew by 19.4 percent compared with 3.8 percent in 2016. Growth in total loanswas 36.1 percent compared with 12.3 percent in 2016.17
In 2017, total assets of the insurance sector reduced by 24.1 percent, capitaldecreased by 37.1 percent while investment grew by 6.3 percent compared to2016. These developments were largely attributed to the enforcement of CBLRegulation CBL/RSD/INS/005/2016 Concerning Prudential Requirements ofInsurance Companies, which calls for the discounting or disallowance of assets forregulatory solvency purposes. Gross premium income (comprising life and non-life businesses) grew by 33.2 percent, while net income recorded a growth of 24.7percent.18
Average interest rates decreased as follows: personal loans from 13.92 percent in2016 to 12.97 percent in 2017 as well as mortgage loans from 13.85 percent in2016 to 13.33 percent in 2017.19 Meanwhile, access to finance is still limited tourban areas while access to affordable long-term credit continues to be a challengefor the majority of the population.
The Government of Liberia encourages home ownership and the developmentof a mortgage sector to make houses affordable to low and middle incomeearners. The first subsidised formal mortgage programme for post-conflict Liberiawas launched in 2013 by the Liberian Bank for Development and Investment(LBDI), financed with LRD1.470 billion (US$10 million) from the CBL Mortgage
Credit stimulus initiative. The programme involved LBDI taking ownership of a30-year old estate built for low income earners and managed by the NationalHousing Authority (NHA). In addition, 87 new dwellings built by NHA have beensold via LBDI mortgage loans to-date. These are offered to households purchasingNHA housing units at LRD2.940 million (US$20 000).
Beyond LBDI’s subsidised mortgage product, longer-term financing is required tobridge the affordability gap. An Employer-Assisted Housing Feasibility studyrevealed that mortgage penetration could be deepened to reach 7 000 formallyemployed workers should mortgage financing be available within a 25-year term.20
AffordabilityLiberia’s public debt stock at 30 November 2017 increased by LRD102.9 million(US$0.69 million) representing a 13.3 percent increase from LRD113.278 billion(US$771.2 million) or 36.7 percent of GDP recorded at end-December 2016 toLRD128.51 billion (US$874.1 million) or 41.3 percent of GDP. At 30 September2017, the total number of clients in the microfinance sector had increased to26 352 from 23 478 recorded in June 2017. Total loans outstanding in the sectoramounted to LRD705.68 million (US$4.8 million), compared to LRD661.57 million(US$4.5 million) at end-June 2017. Total mandatory savings increased toLRD123.49 million (US$0.84 million), from LRD105.3 million (US$0.715 million)at end June 2017.21 Liberia’s unemployment rate is estimated at four percent22
with 54 percent23 of the population living below the poverty line.
Affordability is further compounded by low household income earned fromsalaries and wages. Many Liberians (22.4 percent) earn between LRD6 000(US$41) and LRD15 000 (US$102) monthly, while only 13.5 percent earn overLRD30 000 (US$204.1). Only 17.1 percent of the urban population earnLRD30 000 (US$204.1) and above.24 Access to mortgage finance is extremelylimited. High levels of poverty and income informality, combined with high interestrates and short tenors (10 years maximum), make housing finance inaccessible tothe majority of the population. Fragile land tenure and the falsification of deedsare additional factors which make issuing mortgages more difficult.
A brief affordability analysis of the LBDI-NHA scheme is presented in the tablebelow. The minimum monthly income required to buy a home is LRD56 748(US$386) a month, which remains out of reach for most of the population.
Because home ownership is inaccessible to most, rental is a popular option. Rentalhomes are provided primarily by informal housing promoters. Rents varyaccording to the location and the quality of homes. They range from LRD3 513(US$25) (for a basic room with a shared bathroom) to LRD249 929 (US$1 700)a month for houses in Monrovia for higher income households and expatriates.Less than one percent of the population has access to government-subsidisedhomes managed by NHA. The majority of the population in urban areas live inslums or in multi-occupied houses where rents are subject to fluctuationsaccording to demand.
Housing supplyAccording to the Liberia Institute of Statistics and Geo Information Services“Household Income and Expenditure Survey 2016 published August 2017,”houses in Liberia are classified by material typologies. Most dwelling walls in Liberiaare made of mud and sticks – 40 percent. Concrete and cement blocks (26.4percent) and mud bricks (24.3 percent) are the other most common materialsfor the walls. There are significant differences between rural and urban dwellings.In rural Liberia the use of mud and sticks and mud-bricks are ubiquitous at 93.5percent. However, in the urban parts of the country, concrete and cement-blocks,as well as zinc, iron and tin, make up nearly 55 percent of the material used forwalls. There is far less diversity in materials used for dwelling roofs as comparedto the walls. Zinc sheets, iron or tin are used to roof the majority of dwellings in
ProgrammeLBDI- NHA
LBDI mortgage loan product structure
Loan-to-value(LTV) limit
Requireddown
paymentin US$
Loan tohomebuyer
in US$
Interestrate
Term (in years)
Term (inpayments)
Debtservice
constant
Requiredmonthlypaymentin US$
Minimummonthlyincomerequired
Minimumannualincomerequired
US$15,000house 70% $4 500 $10 500 8% 10 120 1.21% US$127 US$386 US$4 633

Africa Housing Finance Yearbook 2018
171
the country (86 percent) and nearly all roofs in urban areas (96 percent) are madeof zinc sheets, iron or tin. The percent is lower at 75.5 percent in rural areas,where there is a higher prevalence of thatched roofs at 23 percent.25
There is no data on the current housing stock. From available data from the 2014UN-Habitat Liberia Housing Profile, stock is estimated to be 327 000 dwellings in2010 and housing needs are 512 000 (2013-2030) at a build rate of 30 000housing units a year.26 The NHA, a state-owned enterprise, is the only institutionproviding housing at a relatively large scale although production is still far belowwhat is needed. Since 2013, only 185 housing units were completed by the NHAout of which 70 housing units were completed in 2017, and the construction ofan additional 108 housing units is currently underway. The houses are two andthree-bedroom units at a subsidised cost of LRD2.205 million (US$15 000) andLRD2.940 million (US$20 000) respectively. Between 1962 and 1984, NHAdeveloped and implemented a number of housing programmes in the major cities,producing 1 789 housing units and 600 serviced plots of land for low-cost housing;the investment was estimated at LRD2.940 billion (US$39.6 million).
Property marketsLike other Anglophone countries in West Africa, the housing market in Liberia issmall as the sale of a house is unconscionable to most people. There is a smallmarket in newly-built housing aimed at the Diaspora and higher echelons ofMonrovian society.27 According to World Bank Doing Business Report 2018,Liberia is ranked 183 on property registration. There are five procedures involvedin registering a property, and costs stand at 15.7 percent of the property value.28
Data on the property market is scarce and, when available, does not reflect marketreality. There are no regulations in Liberia affecting the way property is bought,sold, let or rented, apart from the deed/ land registration requirements.
There appears to be three separate markets in urban Liberia: the informal rentalmarket in the poorest neighbourhoods, the market in houses for sale, and theexpatriate rental market in Monrovia. Non-Liberians are not permitted to ownland in Liberia. In the informal rental market, in poorer neighbourhoods ofMonrovia and in the smaller cities, rents are very low.29
Policy and regulationThe legal and regulatory framework governing urban development and specificallyhousing has been meagre for a long time. However, in addition to the ZoningLaw of 1957 and the National Housing Policy (Draft), the Liberia Land Authorityhas been established to oversee all land issues.
There are several policy and regulatory efforts on land administration and urbanrenewal. The Act Against Criminal Conveyance of Land (26 August 2014) hasbeen enacted. The Land Rights Act (Draft) is currently at the National Legislaturepending approval, and a Framework for National Land Use Planning 2018 isunderway by the Liberia Land Authority with inputs from stakeholders. The ActEstablishing the National Housing Authority (1960) is under review internally for
possible amendment. The Masterplan Study on Urban Facilities Restoration andImprovement in Monrovia in the Republic of Liberia, November 2009, wasconducted to guide citywide planning, while the Urban Policy Discussion Paperleading to the actual urban policy document has been published with supportfrom UN-Habitat and Cities Alliance.
In 2017, the NHA established a Slum Upgrading Unit with support from Habitatfor Humanity and Cities Alliance to develop and guide interventions in slumupgrading and affordable housing. The establishment of the Unit is a shift ingovernment policy from addressing the housing needs of formally employedhouseholds with verifiable income to low income segments via an incrementalhousing approach. Voluntary Relocation Guidelines and Slum UpgradingGuidelines, that will eventually lead to the formulations of a Relocation Policy anda Slum Upgrading Policy, are being developed at present. Profiling of slumcommunities that will enhance policy interventions is being conducted by theYoung Men’s Christian Association with support from Slum Dwellers International.To date, the profiling of 63 slum communities within greater Monrovia has beencompleted.
OpportunitiesOpportunities in all aspects of Liberia’s housing sector exist. Specifically, privatefunding is required to meet the country’s huge urban housing needs. At a policylevel, key interventions are required to expand the sector. For example, thecompletion of the National Housing Policy, National Urban Policy and the approvalof the Land Rights Act 2014 are only a few. The need for affordable financepresents opportunities, including the expansion of housing microfinance,establishing mortgage institutions that will provide access to long-term funding ataffordable rates, and manpower capacity-building. A National Housing Trust Fundis required to stabilise the sector, especially for those at the lower end of theincome pyramid. Addressing affordability opens opportunities in innovationsaround construction technology and building materials. A market-based approachis needed to accelerate housing delivery as opposed to the Government beingthe main provider. There is opportunity for the formalisation of a property marketthat will attract investment into the sector.
Habitat for Humanity International (HFHI) under the Cities Alliance-led LiberiaCountry Programme has developed a “Slum Upgrading and Affordable HousingFramework”. The framework identifies key constraints, opportunities andinterventions at various levels – community level, market level, and policy andenabling environment necessary to stimulate systemic change in the housing sector.HFHI is currently supporting the Slum Upgrading Unit of the NHA to implementselected interventions while at the same time enhancing inter-governmentalcoordination and capacity-building.
Source https://www.cgidd.com/
PPP$40 001 – PPP$10 000 000
PPP$23 001 – PPP$40 000
PPP$12 001 – PPP$23 000
PPP$8 001 – PPP$12 000
PPP$5 001 – PPP$8 000
PPP$3 601 – PPP$5 000
PPP$2 401 – PPP$3 600
PPP$1 601 – PPP$2 400
PPP$801 – PPP$1 600
<PPP$800
- - - Average annual household income needed for the cheapest newly built house by a formal developer, 2017 Average annual household income using expenditure, 2017 (PPP$)
LIBERIA
Annual income profile for rural and urban households based on consumption (PPP$)
No. of households (thousands)
PPP$2 911
PPP$382 991
Rural Urban200 150 100 50 0 50 100 150 200
Population: 4 853 516
Urbanisation rate: 3.24%
Cost of cheapestnewly built house:
1 200 000 LRDPPP$670 803
Urban householdsthat could afford thishouse with finance:
0.01%
1 PPP$: 0.6 Liberian dollar

172
Additional sourcesCentral Bank of Liberia (2017). Annual Report 2016. Monrovia: Central Bankof Liberia.
Executive Mansion. “President Sirleaf Dedicates 70 Affordable Housing Units inBrewerville.” 14 February 2017.https://www.emansion.gov.lr/2press.php?news_id=3963&related=7&pg=sp(Accessed 21 July 2017).
Front Page Africa (2017). “National Housing Authority Purchases Land toRelocate West Point.” 11 May 2017.https://frontpageafricaonline.com/news/2016news/national-housing-authority-purchases-land-to-relocate-west-point/ (Accessed 21 July 2017).
The World Bank (2017). Doing Business Economy rankings.http://ow.ly/CV7030dLhl9 (Accessed 18 July 2017).
United Nations Population Division (2017). World Population Prospects 2017.http://ow.ly/wEuF30dN6Gz (Accessed 19 July 2017).
United Nations Development Programme (2016). Human DevelopmentReports: Liberia Human Development Indicators. http://ow.ly/dzwt30dLgiE(Accessed 18 July 2017).
1 United Nations Development Programme. Human Development Report, 2016.http://hdr.undp.org/sites/default/files/2016_human_development_report.pdf (Accessed 5 July 2018).
2 Worldometers. Liberia population. http://www.worldometers.info/world-population/liberia-population/(Accessed 2 July 2018).
3 Statista. Liberia: Population growth from 2007 to 2017 (compared to previous year).https://www.statista.com/statistics/460211/population-growth-in-liberia/ (Accessed 5 July 2018).
4 UN-Habitat (2017). A National Urban Policy for Liberia/ Discussion Paper. UN-Habitat. Pg. 4.5 Central Bank of Liberia. Annual Report 2017. Pg. 68.6 The World Bank. World Bank Country and Lending Groups, 2017. http://ow.ly/Mc8Q30dNbvc (Accessed
20 July 2017).7 African Development Bank Group. Liberia Economic Outlook. https://www.afdb.org/en/countries/west-
africa/liberia/liberia-economic-outlook/ (Accessed 5 July 2018).8 Central Bank of Liberia. Daily exchange rates.
https://www.cbl.org.lr/2content.php?sub=175&related=29&third=175&pg=sp&pt=Daily%20Exchange%20Rates9 Central Bank of Liberia. Economic and Financial Bulletin January to March 2018.10 Central Bank of Liberia. Annual Report for 2017.11 Liberia Revenue Authority. Annual Report - Fiscal Year 2016-2017. Pg. V.12 World Bank 15th Edition Doing Business Report 2018.
http://russian.doingbusiness.org/~/media/WBG/DoingBusiness/Documents/Annual-Reports/English/DB2018-Full-Report.pdf (Accessed 3 July 2018). Pg. 4.
13 Executive Mansion. “President Weah Launches US$8 Million Modern Rural Housing Project.” 20 June 2018.http://www.emansion.gov.lr/2press.php?news_id=4561&related=7&pg=sp (Accessed 3 July 2018).
14 World Bank 15th Edition Doing Business Report 2018. Pg. 4.15 Central Bank of Liberia. Annual Report 2017. Pg. 22.16 Ibid. Pg. 48.17 Ibid. Pg. 42.18 Ibid. Pg. 49.19 Ibid. Pg. 24.20 Affordable Housing Institute. Employer-Assisted Housing Feasibility Study, Liberia 2016.21 Central Bank of Liberia. Annual Report 2017. Pgs. 24, 37, 39, 48, 49.22 Trading Economics. Liberia unemployment rate. https://tradingeconomics.com/liberia/unemployment-rate
(Accessed 5 July 2018).23 All Africa. “Liberia Poverty Rate Stands At 54 Percent - World Bank Report.”
http://allafrica.com/stories/201610190636.html (Accessed 5 July 2018).24 Liberia Institute of Statistics and Geo Information Services: Household Income and Expenditure Survey 2016
published in August 2017. Pg. 59.25 Liberia Institute of Statistics and Geo Information Services: Household Income and Expenditure Survey 2016
published August 2017. Pgs. 35-36.26 UN-Habitat (2014). Liberia Urban Housing Profile. https://unhabitat.org/books/liberia-housing-profile/
(Accessed 25 Sept 2018). 27 UN-Habitat (2014). Liberia Urban Housing Profile. Pg. 107.28 World Bank Doing Business Report 2018.
http://www.doingbusiness.org/data/exploreeconomies/liberia#starting-a-business (Accessed 3 July 2018).29 UN-Habitat (2014). Liberia Urban Housing Profile. Pg. 105.

Africa Housing Finance Yearbook 2018
173
OverviewLibya is in North Africa, on the Mediterranean Sea, bordered by Niger, Chad, Egypt,Sudan, Algeria, and Tunisia. In 2017, the country had a population of 6.4 million.1
Libya’s economy depends on oil; oil revenue accounted for 38.5 percent of totalnominal GDP and oil accounted for 97.2 percent of total exports in 2014.2 Priorto the national unrest, Libya was once considered an upper middle income countrywith the highest GDP in Africa and one of the highest HDI rankings in the world.
The national unrest, which resulted in the fall of Muammar Gaddafi’s authoritarianregime in 2011, as well as civil war, tribal and religious militias, and terrorist activities,have weakened the economy and affected some of the neighbouring countries.In 2017, political conflict persisted, despite efforts by the United Nations SupportMission in Libya (UNSMIL) to mediate between the parties. Consequently, thecountry is still experiencing an escalating humanitarian crisis with more peoplebeing displaced by violence. Migrants and refugees are exposed to life-threateningconditions which include sexual assaults and forced labour.
Analyses of North African economic performance often exclude Libya becausethe volatility of that economy distorts the figures. African Economic Outlookreports that real GDP growth was estimated at 55.1 percent in 2017 after threeyears of economic contraction, due to a significant increase in oil production (from400 000 bpd in 2016 to 900 000 bpd in 2017) and a slight increase in oil prices.As a result, the current account deficit is expected to turn into a surplus of1.8 percent of GDP in 2017.3 This is also expected to increase exports by62.5 percent and imports by 4 percent - which have been falling with the declinein foreign reserves. After peaking in 2015 at 126.6 percent of GDP, the budgetdeficit dropped to an estimated 43.3 percent of GDP in 2017. The removal offood subsidies has fuelled inflation which reached 32.8 percent in 2017.4
Despite the recently improving economic outlook, uncertainty persists, givenLibya’s political situation. Consensus on the wording of the Libyan PoliticalAgreement is yet to be reached in preparation for a constitutional referendumand elections before the end of 2018.5 Key challenges confronting Libya includerestoring the rule of law, putting in place a functional government, reducingeconomic dependency on the petroleum industry, and reaching consensus onstrategies for reconstruction and long-term development.
Libya
Once these challenges are addressed, housing and urban infrastructures will likelybe among the priorities. Before the conflict, there was resentment and politicaland social grievances due to an acute shortage of housing units. Currently anestimated 435 000 out of the population of 6 million are internally displaced, andhouses, schools, and hospitals are destroyed.6 The cumulative deficit in 2014 was353 139 housing units and the estimated housing units to be implemented tomeet the deficit and satisfy the need between 2014 and 2033 is estimated at1 164 134 units.7
Access to financeDevelopment of Libya’s financial sector has stagnated due to Libya’s instability, highinflation, and a sustained liquidity crisis.8 The House of Representatives establisheda second central bank operating in eastern Libya, which printed its own Libyandinars due to the liquidity crisis, injecting an estimated 4 billion illegitimate Libyandinars into the economy.9
For years, the banking sector in Libya was isolated. Early in 1970, when Gaddaficame to power, all the banks were nationalised and international sanctions through
KEY FIGURES
Main urban centres Tripoli
Exchange rate: 1 US$ = [a] 21 Sept 2018PPP Exchange rate (Local currency/PPP$) 1 Libyan dinar = [b]Inflation 2016 [c] | Inflation 2017 [c] | Inflation 2018 [c]
1.38 Libyan dinar0.6025.90 | 28.0 | 24.3
Population 2017 [b] | Urban population size 2017 [b]Population growth rate 2017 [b] | Urbanisation rate 2017 [b]Percentage of the total population below National Poverty LineUnemployment rate [d]
6 374 616 | 5 033 4611.28% | 1.55%n/a17.7%
GDP (Current US$) 2017 [b] | GDP growth rate annual 2017 [b]GDP per capita (Current US$) 2017 [b]GNI per capita (Current US$) 2017 [b]Gini co-efficient HDI global ranking 2017 [e] | HDI country index score 2017 [e]
US$50 984 million | 26.68%US$7 998US$6 540n/a108 | 0.706
Is there a deeds registry? Number of residential properties that have a title deed Lending interest rate [d]Mortgage interest rate | Mortgage term (years)DownpaymentMortgage book as a percentage of the GDPEstimated number of mortgages Price to Rent Ratio in City Centre | Outside City Centre Gross Rental Yield in City Centre | Outside City Centre Construction as a % of GDP
n/an/a3.00%6.00% | 30n/an/an/an/a | n/an/a | n/an/a
What is the cost of standard 50kg bag of cement? [g]What is the price of the cheapest, newly built house by a formaldeveloper or contractor? (Local currency) [g]What is the price of the cheapest, newly built house by a formaldeveloper or contractor? (US$) [g]What is the size of this house (m2)? What is the average rental price for this unit (US$)? [g]What is the minimum stand or plot size for residential property? [g]
US$10.12
69 000 Libyan dinar
US$50 000n/aUS$520250m2
Ease of Doing Business Rank [h]Number of procedures to register property Time to register property (days) Cost to register property (as % of property value)
185n/an/an/a
NB: Figures are for 2018 unless stated otherwise.
[a] Coinmill.com[b] World Bank World Development Indicators [c] IMF World Economic Outlook Database[d] Trading Economics[e] UNDP Development Indicators[f] Statista.com[g] CAHF Yearbook 2017[h] World Bank Doing Business

174
the 1990s limited foreign investment in Libya. Libya’s banking sector wasdominated by five state-owned banks: Jumhouria Bank, National Commercial Bank,Wahada Bank, Sahara Bank, Libya Foreign Bank (which controlled about 80 percentof total banking assets),10 and a stock market which was established in 2006.11
A process of privatisation and banking reform commenced in 2007 with someforeign banks authorised to acquire shares in public banks, the legalisation of jointventures between foreigners and local investors in 2010, and a rise of interest inseeking new banking licenses.12
Bank lending for housing finance is restricted by high collateral requirements, theinexistence of a Libyan land register or a credit bureau, and inadequate centralbank regulation. Libya has a very low loan-to-deposit ratio, with the most recentdata reporting 28.3 percent as of end 2015.13 Domestic credit to the privatesector in 2017 was 17.2 percent of GDP.14 This is largely a result of a steadycontraction of real GDP and the crisis in the banking sector.
The ratio of housing finance to GDP is estimated to have remained low at below1 percent. Once, the Savings and Real Estate Investment Bank would grantsubsidised housing loans to Libyan citizens at zero interest rate and tenures up to30 years. Yet, there was a lack of independent oversight, which allowedmismanagement and many Libyans view these loans as grants, so there are veryhigh default rates. The banks’ poor targeting of home loans as well as poorrepayment enforcement distort the housing finance market and restrict thedevelopment of a functioning mortgage system. Today, it is particularly difficult forlow income or small borrowers to access finance for housing.
In 2013, the government passed a law to enforce a strict Islamic Banking regimeand ban interest in financial transactions.15 The law went into effect in January2015, although implementation has proved a challenge. Libya is the third Middle-eastern country, after Iran and Sudan, to ban non-Sharia compliant banking.Nevertheless, lack of government control of the country has left enforcement ofthis policy in limbo and many commercial banks have ceased lending, effectivelyparalyzing the banking sector.
AffordabilityLibya’s minimum wage in 2018 is LD450 (US$325).16 Overall unemployment wasestimated at 17.7 percent in 2017 and even higher for youth – up to 45.96 percent– with most of the unemployed holding university degrees.17 At least 70 percentof the Libyan working population is estimated to be employed in the public sectorwhile a mere 4 percent are working in the private sector and about 120 000Libyans are self employed.18 Owing to the political state of affairs and a disruptionin business, the unemployment rate has remained high and the earning capacityof Libyans has continued to decline.
Given the housing shortage, rental shares have escalated beyond the affordabilityof an average household; a one-bedroom unit in central Tripoli costs betweenUS$400 – US$600 per month, while rents for units outside the city centre areestimated at US$376 per month.
Housing for ownership is very difficult to access on the private market due to thelimited amount of private land available for purchase and development. As a result,most households in the past would be placed on waiting list for years and stay inpoorly serviced informal neighbourhoods until they were able to access asubsidised house from the Libyan government.
Housing supply Housing in Libya, alongside the provision of free education, transport, andhealthcare, has historically been the main responsibility of the government. Publichousing with zero percent interest loans was offered to households duringGaddafi’s regime. In the 1970’s, the government’s ambitious programme forhousing which sought to address the shortage experienced in the late 1960s waseliminated as there was a surplus from 1973 to 1981. Oil revenue was used toimplement Libya’s housing programme in accordance with Gaddafi’s policy toprovide houses for all Libyans, as a result of which there were 17 274 residentialunits in surplus in 1973. The surplus was absorbed annually until 1982 when therewas a deficit which continued to the present. The shortage is due to onerousadministrative procedures, population growth, inadequate expertise of local
contractors, legislation that forbids leasing (Act N°4), and a decrease in oil revenuefrom US$35.69/barrel in 1981 to US$11.21/barrel in 1998, in addition to otherpolitical issues which caused the decline in the quantity of oil exported and itsrevenue.19
The decline in revenue had a negative impact on the economy, particularly thehousing sector. Between 1989 and 1996 the private sector was absent in thehousing sector due to unfavourable legislation, and the government continued toplay an instrumental role in housing supply. As from mid 1990s, Libya enactednumerous laws and regulations to improve the business climate and attract foreigninvestors. Libya witnessed the return of foreign investors as a result of thefavourable business climate coupled with the lifting of UN sanctions in 2003. In2008, the country started to implement an ambitious housing programme of 396054 units with facilities.20
The Housing and Infrastructure Board (HIB) of the Ministry of Housing andUtilities (MHU) was traditionally responsible for the implementation of publicworks contracts. HIB works on infrastructure and public building projects, as wellas managing the state’s residential projects on a turn-key basis and contractingwith both national and multinational firms. At its creation in 2007, HIB was taskedwith building 200 000 units. Official figures from the MHU in 2012 indicated that134 341 housing units were under construction, 94 500 were in their biding phase,and 11 121 had been completed. The entire programme has been on hold since,with an estimated US$11 billion worth of uncompleted housing projects (anestimated 60 000 units) under construction. The largest of this was a US$6 billioncontract with China State Construction Engineering Corporation for the Benghazinew town project which comprised 25 000 units. The entire programme was puton hold in early 2011 when the uprising against Gaddafi began. Out of nearly240 000 housing units contracted, only 11 121 have been completed accordingto HIB, with another 134 341 under construction and 94 500 still in the bidingstage. In 2014, the housing shortage was estimated at 353 139 units, yet therehas been a lot of destruction in cities and displacement of people, which will impactupon housing shortage estimates.21
EU-imposed sanctions, which had put restrictive measures on HIB since 2001,were lifted in January 2014.22 The majority of HIB projects have neverthelessremained unfinished due to the poor security situation. Since 2011, many foreignand local investors involved in housing construction in Libya have been forced toabandon or face interruptions in their work. Efforts to resume have beendisrupted by continued insecurity, arguments over payments for delays, andincreased cost in the intervening period. This resulted in very limited new supplyand an increasing housing backlog. In December 2013, AECOM announced apartnership with HIB worth over US$205 million over a period of 25 months.23
However the programme is yet to be implemented because of the politicalinstability. Another international firm, Egypt’s Al Abd, halted work on housingprojects worth US$102 million in 2015 over ongoing security tensions.
Property marketsAfter the 1969 coup d’état, approximately 38 000 hectares of land, previouslyowned by Italian farmers, were confiscated and redistributed among Libyans.24
These plots have been further fragmented over time, as the traditional inheritancesystem guarantees each son a part of his father’s land. In 1971, the state confirmedall confiscated land as state land and was involved in further confiscations ofuncultivated land and its reallocation to citizens in accordance with what wasconsidered acceptable to fulfil their needs. Ownership is thus difficult todetermine.
Since then, Libya’s property market has been influenced by legislation whichprevents ownership for leasing purposes. One of the most important lawsregarding housing development during Gaddafi’s socialism regime, was Law n° 4which prevented activities for profit purposes, stopped housing rents, andprevented the private sector from building houses for leasing purposes. As a result,many changes occurred which led to administrative instability; there was highturnover among civil servants, both high level decision-makers and low levelimplementers. The merger and separation of provinces (administrative districts)was another one of the significant causes of administrative instability whichprovoked confusion in the local and national housing programmes, hencecontractors could not carry out their commitments.25

Africa Housing Finance Yearbook 2018
175
With Decree 21 in 2006, Libya attempted to open its real estate sector and enableforeign investment in real estate. The decree allowed the HIB to contract privateand foreign developers for property development. Although foreigners could buyreal estate, a lack of clarity on property rights prevented much uptake; and effortsto open the property and real estate markets have been significantly set back dueto the sustained post-revolution instability and subsequent investor scare.
Property markets have, since the revolution, been in disarray as many formerowners of confiscated land returned to lobby for the reform of property laws andcompensation. Draft bills on property were brought before parliament –nevertheless, nothing has been passed due to the political fragmentation andcontroversy over such reforms. The situation is further complicated by the factthat many properties have been resold since confiscation and property registrationrecords were destroyed in the early 1980s. It is estimated that up to three-quarters of homes in Tripoli might have been formerly confiscated properties.
Until the ambiguity of property rights is resolved, banks will remain reluctant toregister property as collateral. The property market is further constrained bydifficulties in doing business. Today, there are no procedures in place for obtaininga construction permit, registering property or resolving insolvency, giving Libya aranking of 185 out of 190 countries in the World Bank 2018 Doing Businessreport.26 Corruption is also an issue, with Transparency International‘s 2017Corruption Perceptions Index rating Libya 171th in the world out of 175countries.27
Policy and regulationLibya housing policy and regulation can be classified under three periods after thecoup d’état of 1969: 1970 to 1978, 1979 to 1988, and 1989 to 2000.28
1970-1978After the coup d’état, a number of laws were passed to organise the housingsector. The resolution of the Council Leadership Decision for leases gave rightsto people and companies to lease property. Law 116 of 1972 gave commercialbanks the right to give loans for housing, Law 88 of 1975 stipulated thenationalisation of land, and Law 28 of 1976 reduced loan charges by 30 percentand prevented advance rent.
1979-1988This period was characterised by immense political and economic changes. Libyaadopted socialism as an economic system in 1977. This period was marked byLaw 4 which prevented leases and restricted the right of ownership to one house,beyond which property was confiscated. The government thus confiscated alldwellings prepared for lease by the private sector. The confiscated dwellings weretransferred or rented to inhabitants who purchased or paid for their property bymonthly instalments. By the end of this period, Law 88 was passed in 1988. Thislaw granted the right to practise economic activities, including real estatetransactions and rental agreements.
1989 – 2000After the removal of sanctions, more flexible laws were passed. Law 11 whichaddresses the possession of real estate was passed in 1992. It was later modifiedby Law 14 which gave the right to possess more than one house or piece of landsuitable for construction.29
According to some researchers in the housing sector in the Libyan economy, thepolicies sought to provide suitable housing for the people of Libya, however someinternal and external factors have prevented effective implementation of thepolicies and led to a gap between the supply and demand for housing.30
Post-Gaddafi Libya is still characterised by uncertainty. Once rule of law is restored,there will be a need for reconstruction. Infrastructure and housing should be toppriorities in addition to putting in place policies and regulation that encourage thecreation of wealth. Regarding housing, the authorities should adopt policies thatpromote effective development, promote real estate development, protect thepopulation, and empower Libyans to participate effectively in the reconstructionof their country.
OpportunitiesIt is estimated by the World Bank that restoring Libya’s infrastructure will costUS$200 billion over the next ten years.31 A peace settlement in Libya could leadto a rebound in oil outputs and exports which could improve the fiscal deficit andcurrent account imbalances, and allow Libya to address housing shortages andeconomic development. As projected by the African Economic Outlook, Libyawitnessed significant oil production in 2017 boosting the real GDP growth rateto 55.1 percent. The production of crude oil was at one million bpd in July 2017– an increase from less than 400 000 bpd in 2016.
Despite the positive economic indicators for 2018, there is still uncertainty for thefuture. The economic outlook for 2019 depends on the political unity and theextent of improvements in security. However Libya has great potential andopportunities in the areas of infrastructure and housing. Alongside more thanUS$ 100 billion for housing, there are other sectors of property developmentwhich are also of interest, particularly upper standard hospitality outlets, hotels,chalets, and inns for the yet-to-be-developed tourism industry. With its richheritage, Libya is a land of multiple civilizations, and blessed with natural resourcesand a young population. Once Libya achieves peace and stability, addressing thechronic housing shortage and providing housing to internally-displaced personscould become a primary state priority.
PPP$40 001 – PPP$10 000 000
PPP$23 001 – PPP$40 000
PPP$12 001 – PPP$23 000
PPP$8 001 – PPP$12 000
PPP$5 001 – PPP$8 000
PPP$3 601 – PPP$5 000
PPP$2 401 – PPP$3 600
PPP$1 601 – PPP$2 400
PPP$801 – PPP$1 600
<PPP$800
LIBYA
Annual income profile for rural and urban households based on consumption (PPP$)
No. of households (thousands)
PPP$19 048
PPP$33 095
Rural Urban400 300 200 100 0 100 200 300 400
Population: 6 374 616
Urbanisation rate: 1.55%
Cost of cheapestnewly built house:
69 000 LYDPPP$115 000
Urban householdsthat could afford thishouse with finance:
7.92%
1 PPP$: 0.6 Libyan dinar
Source https://www.cgidd.com/
- - - Average annual household income needed for the cheapest newly built house by a formal developer, 2017 Average annual household income using expenditure, 2017 (PPP$)

176
1 African Development Bank Group (2018). Libya Economic Outlook: Key Facts. https://www.afdb.org/en/countries/north-africa/libya/ (Accessed 18 September 2018).2 IMF(2016). Economic Diversification in Oil Exporting Arab Countries. Annual meeting of Arab Ministers of Finance – April 2016. https://www.imf.org/external/np/pp/eng/2016/042916.pdf (Accessed 20 Sept 2018). Pg.13.3 African Development Bank Group (2018). African Economic Outlook 2018. https://www.afdb.org/fileadmin/uploads/afdb/Documents/Publications/African_Economic_Outlook_2018_-_EN.pdf (Accessed 19 Sept 2018). Pg. 153.4 African Development Bank Group (2018). Libya Economic Outlook. https://www.afdb.org/en/countries/north-africa/libya/libya-economic-outlook/ (Accessed 15 Sept 2018).5 United Nations Security Council (2018). “Libyan political agreement still key to holding credible elections, ending crisis, Security Council says in Presidential statement, calling for compromise.” 6 June 2018.
https://www.un.org/press/en/2018/sc13366.doc.htm (Accessed 15 Sept 2018).6 Gberie, Lansana (2018). “Forgotten war: A crisis deepens in Libya but where are the cameras?” Dec 2017 - March 2018. Africa Renewal. https://www.un.org/africarenewal/magazine/december-2017-march-2018/forgotten-war-crisis-
deepens-libya-where-are-cameras (Accessed 16 Sept 2018).7 Shawesh, Ezedin Mohamed (October 2016). “Libyan Policy in the Field of Public Housing.” International Journal of Research Studies in Science, Engineering and Technology, Volume 3, Issue 10. http://ijrsset.org/pdfs/v3-i10/2.pdf (Accessed
17 Sept 2018). Pg. 14.8 Al-Shahomy, Suliman S. (2016). “Cash liquidity crisis in Libyan Commercial Banks.” 13 Jan 2016. Libya Prospect. http://libyaprospect.com/index.php/2016/01/13/cash-liquidity-crisis-in-libyan-commercial-banks/ (Accessed 15 Sept 2018).9 Pack, Jason (2017). “Libya’s Liquidity Crunch and the Dinar’s Demise: Psychological and Macroeconomic Dimensions of the Current Crisis.” 21 April 2017. US-Libya Business Association. https://www.libyaherald.com/wp-
content/uploads/2017/04/Liquidity-Crunch-in-Libya-report-USLBA-210417-LH.pdf (Accessed 15 Sept 2018).10 The Economist Intelligence Unit (2016). “Bank Profits Continue to Shrink.” 30 March 2016.
http://country.eiu.com/article.aspx?articleid=1284071912&Country=Libya&topic=Economy&subtopic=Forecast&subsubtopic=Monetary+policy+outlook&u=1&pid=1861011170&oid=1861011170 (Accessed 15 Sept 2018).11 US Department of State. 2011 Investment Climate Statement – Libya. https://www.state.gov/e/eb/rls/othr/ics/2011/157312.htm (Accessed 15 Sept 2018).12 Ibid.13 The Economist Intelligence Unit (2016). “Bank profits continue to shrink.” 30 March 2016.
http://country.eiu.com/article.aspx?articleid=1284071912&Country=Libya&topic=Economy&subtopic=Forecast&subsubtopic=Monetary+policy+outlook&u=1&pid=1861011170&oid=1861011170 (Accessed 15 Sept 2018).14 The World Bank – Data (2018). Domestic Credit to Private Sector (% of GDP). https://data.worldbank.org/indicator/FS.AST.PRVT.GD.ZS (Accessed 16 Sept 2018).15 Mohammed A M., Abdel Rahim El-Brassi, Nabil Bello, Syed Mussa Alhabshi (2017). "Libya’s Transformation to an Islamic Financial System: Issues and Challenges." International Review of Management and Business Research Volume 6.
Issue 3 (September 2017). http://www.irmbrjournal.com/papers/1503041381.pdf (Accessed 19 September 2018).16 Minimum-wage.org. Libya Minimum Wage Rate 2018. https://www.minimum-wage.org/international/libya (Accessed 18 Sept 2018).17 Statista.com. Libya Youth unemployment rate. https://www.statista.com/statistics/812198/youth-unemployment-rate-in-libya/ (Accessed 16 Sept 2018).18 Dr.Dia Sadek Abuhadra and Dr.Tawfik Taher Ajaali (2014). Labour Market and Employment Policy in Libya, Prepared for European Training Foundation (ETF).
https://www.etf.europa.eu/sites/default/files/m/01BE9A2F283BC6B2C1257D1E0041161A_Employment%20policies_Libya.pdf (Accessed 16 Sept 2018). Pgs. 9-32.19 Gamal N. Sheibani, and Tim Havard (2006). “The Reasons For Shortages of Housing In Libya.” http://www.irbnet.de/daten/iconda/CIB_DC26989.pdf (Accessed 23 Sept 2018).20 Shawesh, Ezedin Mohamed (October 2016). “Libyan Policy in the Field of Public Housing.” International Journal of Research Studies in Science, Engineering and Technology, Volume 3, Issue 10. http://ijrsset.org/pdfs/v3-i10/2.pdf (Accessed
23 Sept 2018). Pg. 13.21 Mirza, Abdal (2013). “Feature: Libya US$ 100 billion Housing opportunities.” 20 June 2013. Architect’s Journal. https://www.architectsjournal.co.uk/home/feature-libyas-100bn-housing-opportunity/8649627.article (Accessed 16 Sept
2018). 22 Libya Business News (2014). “EU lifts sanctions against HIB.” 20 Feb 2014. https://www.libya-businessnews.com/tag/housing-and-infrastructure-board-hib/ (Accessed 18 Sept 2018).23 AECOM (undated). “Press release: AECOM announces US$209-million contract with Libyan Housing and Infrastructure Board for nation-wide housing, infrastructure development program.” https://www.aecom.com/dach/press-
releases/aecom-announced-today-that-it-has-signed-an-agreement-with-the-libyan-governments-housing-and-infrastructure-board-hib-authorizing-work-valued-at-us209-million-over-a-25-month-period/ (Accessed 17 Sept 2018).24 Metz, Helen Chapin ed. (1987). Land Use and Irrigation. Libya table of Contents. http://countrystudies.us/libya/63.htm (Accessed 19 Sept 2018).25 Gamal N. Sheibani, and Tim Havard (2006). “The Reasons For Shortages of Housing In Libya.” http://www.irbnet.de/daten/iconda/CIB_DC26989.pdf (Accessed 23 Sept 2018). Pgs. 120-121.26 World Bank (2018). World Bank Doing Business 2018: Reforming to Create Jobs. http://www.doingbusiness.org/content/dam/doingBusiness/media/Annual-Reports/English/DB2018-Full-Report.pdf (Accessed 20 Sept 2018). Pg. 4.27 Trading Economics (2018). Libya corruption rank. https://tradingeconomics.com/libya/corruption-rank (Accessed 17 Sept 2018).28 Gamal N. Sheibani, and Tim Havard (2006). “The Reasons For Shortages of Housing In Libya.” http://www.irbnet.de/daten/iconda/CIB_DC26989.pdf (Accessed 23 Sept 2018).29 For detailed information, see: https://www.universiteitleiden.nl/binaries/content/assets/rechtsgeleerdheid/instituut-voor-metajuridica/resolving-real-property-disputes-in-post-ghadaffi-libya.pdf30 Gamal N. Sheibani, and Tim Havard (2006). “The Reasons For Shortages of Housing In Libya.” http://www.irbnet.de/daten/iconda/CIB_DC26989.pdf (Accessed 23 Sept 2018). Pg.116. Also: Fatallah, N. and Omran, A.N. (2018). “Housing
Policies and Strategies in Libya: An Overview.” ACTA TECHNICA CORVINIENSIS - Bulletin Of Engineering, Tome XI (2018) Facicule1 (January-March).https://www.researchgate.net/publication/323116201_HOUSING_POLICIES_AND_STRATEGIES_IN_LIBYA_BRIEF_AN_OVERVIEW (Accessed 20 Sept 2018).
31 World Bank (2016). “Press Release: Economic Effects of War and Peace in the Middle East and North Africa.” 3 Feb 2016. http://www.worldbank.org/en/news/press-release/2016/02/03/economic-effects-of-war-and-peace-in-the-middle-east-and-north-africa (Accessed 18 Sept 2018).

Africa Housing Finance Yearbook 2018
177
spending, strengthen the judicial system and decrease corruption. However,political uncertainty linked to the upcoming presidential elections in late 2018 is arisk to the country’s continued development, as are external factors including therising global oil price and ever-present risk of natural disasters.12
Access to financeAccording to the latest available data, there are 11 banks, 25 deposit-takingmicrofinance institutions and 18 other financial institutions operating inMadagascar.13 Of the 11 banks, 10 are foreign-owned and the top four banksown close to 90 percent of total assets and deposits.14 The government holds aminority stake in three of the top four banks.15
Madagascar’s banking sector is reported to be “on average, sufficiently capitalised,liquid and very profitable” with asset quality steadily improving since 2013.According to Banky Foiben’i Madagasikara, the country’s Central Bank (hereinafter“BFM”), as at March 2018, total banking assets stood at MGA 9.7 trillion (US$2.8billion).16 In the same period, non-performing loans (NPLs) to total gross loanswas 7.9 percent, down from a high of 11.6 percent in December 2013, while thesector’s return on assets and return on equity was 4.5 percent and 43.2 percentrespectively.17
OverviewMadagascar is the world’s fourth largest island, located off the coast of East Africawith an estimated population of 25.5 million in 2017.1 The country has a veryyoung and predominantly rural-based population with 60 percent falling underthe age of 252 and 64 percent residing in rural areas.3 However, the annual urbanpopulation growth rate is high at 4.5 percent a year with total population growthat 2.7 percent in 2017.4
The country has experienced good economic growth in the past four years. Theestimated GDP growth rate in 2017 was 4.2 percent (up from 2.3 percent in2013), with a projected growth rate of 5.0 percent in 2018.5 Contributing to thisgrowth includes a growing transport-services sector, driven by an increase indomestic tourism, a growing manufacturing sector, largely due to the tax incentivesin the country’s export processing zones, as well as a highly profitable bankingsector. Despite this, the country’s primary activity, agriculture, which is reportedto employ approximately 80 percent of the population, continues to contract.6
2017 was a particularly difficult year for the large proportion of households whorely on rice crops as a source of both food security and income. Following asevere drought and one of the strongest cyclones to hit the country in its history,7
rice prices rose by an estimated 30 percent, leading to some of the highest inflationrates in the past five years (9.1 percent as at November 2017).8 While inflationhas eased in the first quarter of 2018 (7.6 as at March 2018), it is still higher thanneighbouring countries.
With the continued poor performance of the agriculture sector and high inflationrates, amongst other challenges, Madagascar remains one of the 10 poorestcountries in the world, based on GDP per capita data released by the InternationalMonetary Fund (IMF). As at April 2018, the country’s GDP per capita wasMGA1 633 965 (US$479),9,10 and approximately 75 percent of the populationare living below the poverty line (defined as US$1.90 per day).11 However, inrecent years, the government has been working hard to improve the country’seconomic outlook.
Under the IMF’s 40-month Extended Credit Facility Arrangement worth US$304.7million, awarded to the country in 2016, Madagascar has implemented severalreforms to strengthen macroeconomic stability, improve central bank operationsand financial supervision, increase revenue generation and prioritise public
MadagascarKEY FIGURES
Main urban centres Antananarivo
Exchange rate: 1 US$ = [a] 21 Sept 2018PPP Exchange rate (Local currency/PPP$) 1 Malagasy ariary = [b]Inflation 2016 [c] | Inflation 2017 [c] | Inflation 2018 [c]
3270.00 Malagasy ariary901.206.70 | 8.10 | 7.80
Population 2017 [b] | Urban population size 2017 [b]Population growth rate 2017 [b] | Urbanisation rate 2017 [b]Percentage of the total population below National Poverty LineUnemployment rate 2017 [d]
25 570 895 | 9 301 6692.68% | 4.44%n/a2.10%
GDP (Current US$) 2017 [b] | GDP growth rate annual 2017 [b]GDP per capita (Current US$) 2017 [b]GNI per capita (Current US$) 2017 [b]Gini co-efficient HDI global ranking 2017 [e] | HDI country index score 2017 [e]
US$11 500 million | 4.17%US$449US$400n/a161 | 0.5129
Is there a deeds registry? Number of residential properties that have a title deed Lending interest rate Mortgage interest rate | Mortgage term (years)DownpaymentMortgage book as a percentage of the GDPEstimated number of mortgages Price to Rent Ratio in City Centre | Outside City Centre Gross Rental Yield in City Centre | Outside City Centre Construction as a % of GDP
n/an/an/a19% | 20n/an/an/an/a | n/an/a | n/an/a
What is the cost of standard 50kg bag of cement? [g]What is the price of the cheapest, newly built house by a formaldeveloper or contractor? (Local currency) [g]What is the price of the cheapest, newly built house by a formaldeveloper or contractor? (US$) [g]What is the size of this house (m2)? [g]What is the average rental price for this unit (US$)? What is the minimum stand or plot size for residential property? [g]
US$8.00
465 975 000 Malagasy ariary
US$50 00095m2
n/a100m2
Ease of Doing Business Rank [h]Number of procedures to register property [h]Time to register property (days) [h]Cost to register property (as % of property value) [h]
1626100 days9.10%
NB: Figures are for 2018 unless stated otherwise.
[a] Coinmill.com[b] World Bank World Development Indicators[c] IMF World Economic Outlook Database[d] Central Intelligence Agency (CIA) World Factbook[e] UNDP Development Indicators [f] Statista.com[g] CAHF Yearbook 2017[h] World Bank Doing Business
178
Despite a well-performing sector, banking penetration remains very low inMadagascar. According to 2017 Global Findex data, less than 10 percent of adults(age 15 or older) report having an account (either personally or with someoneelse) at a bank or other financial institution. Further, the latest FinScope datasuggests that 41 percent of Malagsy households are completely excluded fromthe financial sector.18 However, mobile money offers some promise for financialinclusion. Between 2014 and 2017, mobile money account usage increased three-fold from 4.4 percent in 2014 to 12.1 percent in 2017.19
The reach of microfinance institutions (MFIs) has also improved in recent years.In 2016, the household penetration rate of MFIs was 30.4 percent, up from 19.5percent in 2011.20 Despite good growth, the sector still struggles with limitedprofitability and high loan losses. In 2016/17, the return on equity ranged fromnegative 10 percent to positive 23 percent (depending on the type of MFI) andNPLs ranged from 6 percent to 21 percent.21
Low levels of financial inclusion, high interest rates, lack of collateral and limitedinformation on borrowers, constrain access to and usage of credit in Madagascar.In 2017, 3.6 percent of adults (age 15 or older) reported borrowing from afinancial institution in the past 12 months, while 2.4 percent reported having anoutstanding home loan at a bank or other financial institution.22 As at June 2017,there were over 900 000 borrowers (97 percent of which were individuals)recorded in the country’s public credit registry with 3.9 million open/active loans.23
This includes all loans from banks and MFIs. In the same period, total credit grantedto the economy was MGA 4.2 trillion (US$1.2 billion), of which 12 percentconstituted long-term credit (primarily to the real estate sector), while 35 percentwas medium-term credit.24
With bank interest rates ranging from 9 percent to 24 percent per year25 andeffective interest rates reaching up to 50 percent,26 it is not surprising that banklending is only accessible to a small portion of the population (and corporates).Interest rates are market-determined and clearly reflect the inherent risk in thecountry’s credit market, as well as the cost of capital. As at November 2017, theBFM lending rate was 9.50 percent (up from 8.30 percent in 2016).27
Despite a small mortgage loan market, several banks offer housing-related loansincluding BNI Madagascar, Bank of Africa Madagascar (BOA), BFV-Société Générale(BFV-SG), AccèsBanque Madagascar, Banque Malgache de L'ocean Indien (BMOI),BGFI Bank, and Mauritius Commercial Bank (MCB). Loans terms vary dependingon the purpose of the loan. The maximum loan term for land acquisition or homeimprovement/renovations is 96 months, while loans to purchase or construct ahouse range from 36 months to 240 months.28 Interest rates do not appear tovary depending on the type of loans. For example, BNI Madagascar charges 15percent per annum plus a 2.2 percent initiation fee for all types of real estate loans(land acquisition, house purchase or construction), while BFV-SG charge the samerate for home purchase/construction and home renovation projects (18 percentper annum). Banks primarily target salaried individuals and application criteriaincludes a monthly contribution of no more than 33 percent of monthly incomeand at least a 10 percent deposit.
A few microfinance institutions also offer housing-related loans, namely Baobab(formerly MicroCred), OtivTana and Premiere Agence de Microfinance. The loansare primarily for home improvements and have a maximum loan term of36 months. Maximum loan amounts vary considerably from MGA 50 million toMGA 600 million and interest rates are charged monthly on a declining balance.29
For example, Baobab charge 3 percent a month on a declining balance with aonce-off 2.4 percent administrative charge on new loans. Of the 10 MFIsregistered on MixMarket with available credit data, Baobab has the largest grossloan book of MGA 249 billion (US$72 million) with over 33 000 activeborrowers.30
In an effort to improve credit decision-making in the country, expand the borrowerbase and grow the performance of the credit sector, a new Credit InformationLaw (N°2017-045 of 15 February 2018) was passed. The new Credit Law governsthe establishment, operations and supervision of private credit bureaus inMadagascar. In early 2018, the BFM started the process of identifying and selectingan international credit bureau to operate in the country. The appointed privatecredit bureau will be responsible for providing credit information and credit risk
services to support all lending sectors and institutions (financial and non-financial,regulated and non-regulated).31 According to the BFM, once the country’s firstprivate credit bureau is operational, the public credit registry, will be reviewed andpotentially repurposed for internal use.32
AffordabilityGiven the high rate of poverty, housing is unsurprisingly largely unaffordable tothe majority of the population in Madagascar. The country has a large but low-paid working population. As at 2016, the total unemployment rate in the countrywas 2.1 percent.33 However, in the same year, 95 percent of adults were reportedto have a personal monthly income of MGA 400 000 (US$116) or less.34
For almost half of the adult population (47 percent), the principle source of incomeis farming or farming-related activities, while 14 percent of adults are self-employedin unregistered businesses. Only 15 percent of adults are salaried workers.35
Household affordability is further affected by natural disasters. Almost 40 percentof adults (4.3 million people) said that they experienced an agricultural shock inthe past year.36
The textile industry is another key employer in the country. Following thecountry’s reinstatement to the African Growth and Opportunity Act (AGOA) in2014, several large international clothing retailers relocated their factories toMadagascar including M&S, Zara, American Eagle and Woolworths. In 2016,approximately 45 000 workers were employed in textile-related jobs in thecountry’s export processing zones (EPZ),37 located around Antananarivo andAntsirabe, the two largest cities in Madagascar. In addition to the preferential tradeagreements in the EPZs, the textile industry benefits from the country’s low wages.
As at March 2018, the minimum monthly wage was MGA 168 019 for non-agricultural workers and MGA 170 422 for agricultural workers (approximatelyUS$49).38 Assuming a factory worker earns three times the minimum wage(approximately MGA 500 000 or US$145 p/m), which is in line with the wages ofsomeone falling between a high skilled and low skilled worker,39 they should beable to afford rentals or loan repayments of around MGA 166 000 a month (usingthe bank’s affordability ratio of 33 percent). This is far below the affordabilityrequired to rent or purchase a property on the formal market.
A one-bedroom apartment in the city centre of Madagascar’s capital city,Antananarivo, rents for between MGA 500 000 and MGA 1.6 million (US$145 –US$464) per month, while a three-bedroom apartment in the same area rentsfor MGA 1.8 million – MGA 3 million (US$522 – US$870) per month. Rentalsare 30 percent to 60 percent cheaper outside of the city centre.40
A recently constructed 70m2 two-bedroom house just outside of the capital citycan cost around MGA 89 million (US$25 810).41 With a 15-year loan at 15 percentper annum, monthly repayments on this property would be around MGA 1.2million (US$348), which is within the reach of only a small portion of the population.
Housing supplySlum dwellings are characteristic of urban living conditions in Madagascar. Basedon the lasted available data (2014), 77.2 percent of urban households live inslums.42 According to the Periodic Household Survey of 2010, about 86.5 percentof the country’s households live in self-built, traditional housing. These houses areusually temporary structures made with compacted mud and poorly attachedthatched roofs which provide very little protection from diseases and theenvironment, and little security from crime.
Access to basic services is very low. In 2015, 51.5 percent of the total populationhad access to an improved drinking water source;43 this was higher in urban areasat 81.6 percent.44 In the same period, only 12 percent of the population hadaccess to improved sanitation.45
Access to electricity is also very low, however, with plans to tap into the country’srich renewable energy sources, this should soon change. Madagascar is one ofthe countries participating in the Climate Investment Fund’s (CIF) Scaling upRenewable Energy in Low Income Countries Programme (SREP). The SERP formspart of Madagascar’s New Energy Policy which aims to provide electricity to 70percent of households by 2030, through a combination of hydroelectricity, windpower, and solar energy.46
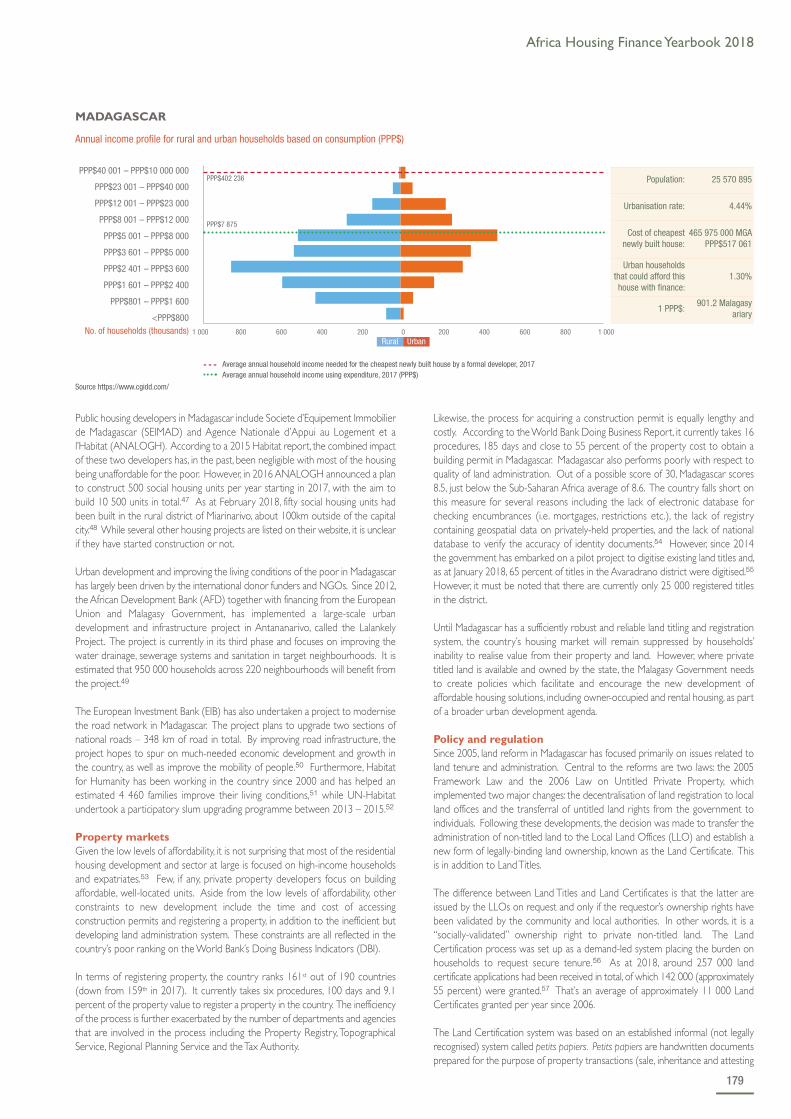
Africa Housing Finance Yearbook 2018
179
Public housing developers in Madagascar include Societe d’Equipement Immobilierde Madagascar (SEIMAD) and Agence Nationale d’Appui au Logement et al’Habitat (ANALOGH). According to a 2015 Habitat report, the combined impactof these two developers has, in the past, been negligible with most of the housingbeing unaffordable for the poor. However, in 2016 ANALOGH announced a planto construct 500 social housing units per year starting in 2017, with the aim tobuild 10 500 units in total.47 As at February 2018, fifty social housing units hadbeen built in the rural district of Miarinarivo, about 100km outside of the capitalcity.48 While several other housing projects are listed on their website, it is unclearif they have started construction or not.
Urban development and improving the living conditions of the poor in Madagascarhas largely been driven by the international donor funders and NGOs. Since 2012,the African Development Bank (AFD) together with financing from the EuropeanUnion and Malagasy Government, has implemented a large-scale urbandevelopment and infrastructure project in Antananarivo, called the LalankelyProject. The project is currently in its third phase and focuses on improving thewater drainage, sewerage systems and sanitation in target neighbourhoods. It isestimated that 950 000 households across 220 neighbourhoods will benefit fromthe project.49
The European Investment Bank (EIB) has also undertaken a project to modernisethe road network in Madagascar. The project plans to upgrade two sections ofnational roads – 348 km of road in total. By improving road infrastructure, theproject hopes to spur on much-needed economic development and growth inthe country, as well as improve the mobility of people.50 Furthermore, Habitatfor Humanity has been working in the country since 2000 and has helped anestimated 4 460 families improve their living conditions,51 while UN-Habitatundertook a participatory slum upgrading programme between 2013 – 2015.52
Property marketsGiven the low levels of affordability, it is not surprising that most of the residentialhousing development and sector at large is focused on high-income householdsand expatriates.53 Few, if any, private property developers focus on buildingaffordable, well-located units. Aside from the low levels of affordability, otherconstraints to new development include the time and cost of accessingconstruction permits and registering a property, in addition to the inefficient butdeveloping land administration system. These constraints are all reflected in thecountry’s poor ranking on the World Bank’s Doing Business Indicators (DBI).
In terms of registering property, the country ranks 161st out of 190 countries(down from 159th in 2017). It currently takes six procedures, 100 days and 9.1percent of the property value to register a property in the country. The inefficiencyof the process is further exacerbated by the number of departments and agenciesthat are involved in the process including the Property Registry, TopographicalService, Regional Planning Service and the Tax Authority.
Likewise, the process for acquiring a construction permit is equally lengthy andcostly. According to the World Bank Doing Business Report, it currently takes 16procedures, 185 days and close to 55 percent of the property cost to obtain abuilding permit in Madagascar. Madagascar also performs poorly with respect toquality of land administration. Out of a possible score of 30, Madagascar scores8.5, just below the Sub-Saharan Africa average of 8.6. The country falls short onthis measure for several reasons including the lack of electronic database forchecking encumbrances (i.e. mortgages, restrictions etc.), the lack of registrycontaining geospatial data on privately-held properties, and the lack of nationaldatabase to verify the accuracy of identity documents.54 However, since 2014the government has embarked on a pilot project to digitise existing land titles and,as at January 2018, 65 percent of titles in the Avaradrano district were digitised.55
However, it must be noted that there are currently only 25 000 registered titlesin the district.
Until Madagascar has a sufficiently robust and reliable land titling and registrationsystem, the country’s housing market will remain suppressed by households’inability to realise value from their property and land. However, where privatetitled land is available and owned by the state, the Malagasy Government needsto create policies which facilitate and encourage the new development ofaffordable housing solutions, including owner-occupied and rental housing, as partof a broader urban development agenda.
Policy and regulation Since 2005, land reform in Madagascar has focused primarily on issues related toland tenure and administration. Central to the reforms are two laws: the 2005Framework Law and the 2006 Law on Untitled Private Property, whichimplemented two major changes: the decentralisation of land registration to localland offices and the transferral of untitled land rights from the government toindividuals. Following these developments, the decision was made to transfer theadministration of non-titled land to the Local Land Offices (LLO) and establish anew form of legally-binding land ownership, known as the Land Certificate. Thisis in addition to Land Titles.
The difference between Land Titles and Land Certificates is that the latter areissued by the LLOs on request and only if the requestor’s ownership rights havebeen validated by the community and local authorities. In other words, it is a“socially-validated” ownership right to private non-titled land. The LandCertification process was set up as a demand-led system placing the burden onhouseholds to request secure tenure.56 As at 2018, around 257 000 landcertificate applications had been received in total, of which 142 000 (approximately55 percent) were granted.57 That’s an average of approximately 11 000 LandCertificates granted per year since 2006.
The Land Certification system was based on an established informal (not legallyrecognised) system called petits papiers. Petits papiers are handwritten documentsprepared for the purpose of property transactions (sale, inheritance and attesting
Source https://www.cgidd.com/
PPP$40 001 – PPP$10 000 000
PPP$23 001 – PPP$40 000
PPP$12 001 – PPP$23 000
PPP$8 001 – PPP$12 000
PPP$5 001 – PPP$8 000
PPP$3 601 – PPP$5 000
PPP$2 401 – PPP$3 600
PPP$1 601 – PPP$2 400
PPP$801 – PPP$1 600
<PPP$800
MADAGASCAR
Annual income profile for rural and urban households based on consumption (PPP$)
No. of households (thousands)
PPP$7 875
PPP$402 236
Rural Urban1 000 800 600 400 200 0 200 400 600 800 1 000
Population: 25 570 895
Urbanisation rate: 4.44%
Cost of cheapestnewly built house:
465 975 000 MGAPPP$517 061
Urban householdsthat could afford thishouse with finance:
1.30%
1 PPP$:901.2 Malagasy
ariary
- - - Average annual household income needed for the cheapest newly built house by a formal developer, 2017 Average annual household income using expenditure, 2017 (PPP$)
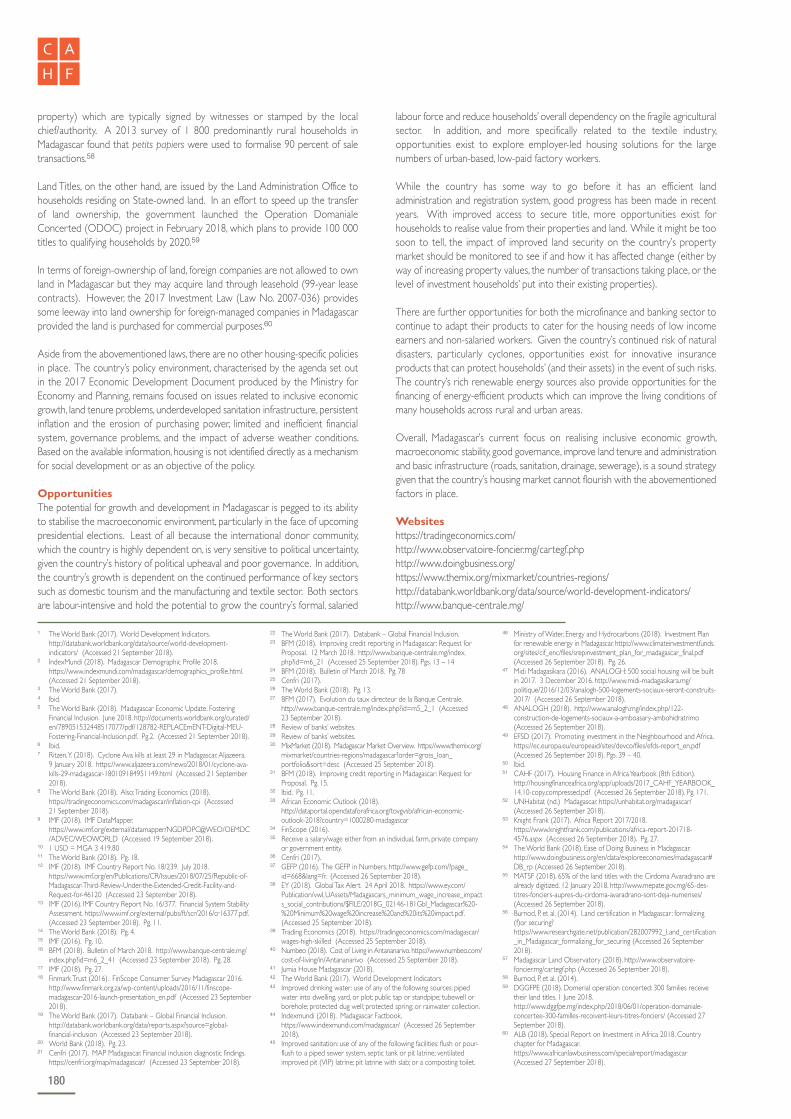
180
property) which are typically signed by witnesses or stamped by the localchief/authority. A 2013 survey of 1 800 predominantly rural households inMadagascar found that petits papiers were used to formalise 90 percent of saletransactions.58
Land Titles, on the other hand, are issued by the Land Administration Office tohouseholds residing on State-owned land. In an effort to speed up the transferof land ownership, the government launched the Operation DomanialeConcerted (ODOC) project in February 2018, which plans to provide 100 000titles to qualifying households by 2020.59
In terms of foreign-ownership of land, foreign companies are not allowed to ownland in Madagascar but they may acquire land through leasehold (99-year leasecontracts). However, the 2017 Investment Law (Law No. 2007-036) providessome leeway into land ownership for foreign-managed companies in Madagascarprovided the land is purchased for commercial purposes.60
Aside from the abovementioned laws, there are no other housing-specific policiesin place. The country’s policy environment, characterised by the agenda set outin the 2017 Economic Development Document produced by the Ministry forEconomy and Planning, remains focused on issues related to inclusive economicgrowth, land tenure problems, underdeveloped sanitation infrastructure, persistentinflation and the erosion of purchasing power, limited and inefficient financialsystem, governance problems, and the impact of adverse weather conditions.Based on the available information, housing is not identified directly as a mechanismfor social development or as an objective of the policy.
OpportunitiesThe potential for growth and development in Madagascar is pegged to its abilityto stabilise the macroeconomic environment, particularly in the face of upcomingpresidential elections. Least of all because the international donor community,which the country is highly dependent on, is very sensitive to political uncertainty,given the country’s history of political upheaval and poor governance. In addition,the country’s growth is dependent on the continued performance of key sectorssuch as domestic tourism and the manufacturing and textile sector. Both sectorsare labour-intensive and hold the potential to grow the country’s formal, salaried
labour force and reduce households’ overall dependency on the fragile agriculturalsector. In addition, and more specifically related to the textile industry,opportunities exist to explore employer-led housing solutions for the largenumbers of urban-based, low-paid factory workers.
While the country has some way to go before it has an efficient landadministration and registration system, good progress has been made in recentyears. With improved access to secure title, more opportunities exist forhouseholds to realise value from their properties and land. While it might be toosoon to tell, the impact of improved land security on the country’s propertymarket should be monitored to see if and how it has affected change (either byway of increasing property values, the number of transactions taking place, or thelevel of investment households’ put into their existing properties).
There are further opportunities for both the microfinance and banking sector tocontinue to adapt their products to cater for the housing needs of low incomeearners and non-salaried workers. Given the country’s continued risk of naturaldisasters, particularly cyclones, opportunities exist for innovative insuranceproducts that can protect households’ (and their assets) in the event of such risks.The country’s rich renewable energy sources also provide opportunities for thefinancing of energy-efficient products which can improve the living conditions ofmany households across rural and urban areas.
Overall, Madagascar’s current focus on realising inclusive economic growth,macroeconomic stability, good governance, improve land tenure and administrationand basic infrastructure (roads, sanitation, drainage, sewerage), is a sound strategygiven that the country’s housing market cannot flourish with the abovementionedfactors in place.
Websiteshttps://tradingeconomics.com/http://www.observatoire-foncier.mg/cartegf.phphttp://www.doingbusiness.org/https://www.themix.org/mixmarket/countries-regions/http://databank.worldbank.org/data/source/world-development-indicators/http://www.banque-centrale.mg/
1 The World Bank (2017). World Development Indicators.http://databank.worldbank.org/data/source/world-development-indicators/ (Accessed 21 September 2018).
2 IndexMundi (2018). Madagascar Demographic Profile 2018.https://www.indexmundi.com/madagascar/demographics_profile.html.(Accessed 21 September 2018).
3 The World Bank (2017).4 Ibid.5 The World Bank (2018). Madagascar Economic Update. Fostering
Financial Inclusion. June 2018. http://documents.worldbank.org/curated/en/789051532448517077/pdf/128782-REPLACEmENT-Digital-MEU-Fostering-Financial-Inclusion.pdf. Pg.2. (Accessed 21 September 2018).
6 Ibid. 7 Ritzen, Y. (2018). Cyclone Ava kills at least 29 in Madagascar. Aljazeera.
9 January 2018. https://www.aljazeera.com/news/2018/01/cyclone-ava-kills-29-madagascar-180109184951149.html (Accessed 21 September2018).
8 The World Bank (2018). Also: Trading Economics (2018).https://tradingeconomics.com/madagascar/inflation-cpi (Accessed21 September 2018).
9 IMF (2018). IMF DataMapper.https://www.imf.org/external/datamapper/NGDPDPC@WEO/OEMDC/ADVEC/WEOWORLD (Accessed 19 September 2018).
10 1 USD = MGA 3 419.8011 The World Bank (2018). Pg. 18. 12 IMF (2018). IMF Country Report No. 18/239. July 2018.
https://www.imf.org/en/Publications/CR/Issues/2018/07/25/Republic-of-Madagascar-Third-Review-Under-the-Extended-Credit-Facility-and-Request-for-46120 (Accessed 23 September 2018).
13 IMF (2016). IMF Country Report No. 16/377. Financial System StabilityAssessment. https://www.imf.org/external/pubs/ft/scr/2016/cr16377.pdf.(Accessed 23 September 2018). Pg. 11.
14 The World Bank (2018). Pg. 4. 15 IMF (2016). Pg. 10. 16 BFM (2018). Bulletin of March 2018. http://www.banque-centrale.mg/
index.php?id=m6_2_41 (Accessed 23 September 2018). Pg. 28. 17 IMF (2018). Pg. 27.18 Finmark Trust (2016). FinScope Consumer Survey Madagascar 2016.
http://www.finmark.org.za/wp-content/uploads/2016/11/finscope-madagascar-2016-launch-presentation_en.pdf (Accessed 23 September2018).
19 The World Bank (2017). Databank – Global Financial Inclusion.http://databank.worldbank.org/data/reports.aspx?source=global-financial-inclusion (Accessed 23 September 2018).
20 World Bank (2018). Pg. 23.21 Cenfri (2017). MAP Madagascar. Financial inclusion diagnostic findings.
https://cenfri.org/map/madagascar/ (Accessed 23 September 2018).
22 The World Bank (2017). Databank – Global Financial Inclusion.23 BFM (2018). Improving credit reporting in Madagascar : Request for
Proposal. 12 March 2018. http://www.banque-centrale.mg/index.php?id=m6_21 (Accessed 25 September 2018). Pgs. 13 – 14
24 BFM (2018). Bulletin of March 2018. Pg. 7825 Cenfri (2017).26 The World Bank (2018). Pg. 13. 27 BFM (2017). Evolution du taux directeur de la Banque Centrale.
http://www.banque-centrale.mg/index.php?id=m5_2_1 (Accessed23 September 2018).
28 Review of banks’ websites.29 Review of banks’ websites.30 MixMarket (2018). Madagascar Market Overview. https://www.themix.org/
mixmarket/countries-regions/madagascar?order=gross_loan_portfolio&sort=desc (Accessed 25 September 2018).
31 BFM (2018). Improving credit reporting in Madagascar : Request forProposal. Pg. 15.
32 Ibid. Pg. 11. 33 African Economic Outlook (2018).
http://dataportal.opendataforafrica.org/tovgvsb/african-economic-outlook-2018?country=1000280-madagascar
34 FinScope (2016).35 Receive a salary/wage either from an individual, farm, private company
or government entity.36 Cenfri (2017).37 GEFP (2016). The GEFP in Numbers. http://www.gefp.com/?page_
id=668&lang=fr. (Accessed 26 September 2018).38 EY (2018). Global Tax Alert. 24 April 2018. https://www.ey.com/
Publication/vwLUAssets/Madagascars_minimum_wage_increase_impacts_social_contributions/$FILE/2018G_02146-181Gbl_Madagascar%20-%20Minimum%20wage%20increase%20and%20its%20impact.pdf.(Accessed 25 September 2018).
39 Trading Economics (2018). https://tradingeconomics.com/madagascar/wages-high-skilled (Accessed 25 September 2018).
40 Numbeo (2018). Cost of Living in Antananarivo. https://www.numbeo.com/cost-of-living/in/Antananarivo (Accessed 25 September 2018).
41 Jumia House Madagascar (2018).42 The World Bank (2017). World Development Indicators43 Improved drinking water : use of any of the following sources: piped
water into dwelling, yard, or plot; public tap or standpipe; tubewell orborehole; protected dug well; protected spring; or rainwater collection.
44 Indexmundi (2018). Madagascar Factbook.https://www.indexmundi.com/madagascar/ (Accessed 26 September2018).
45 Improved sanitation: use of any of the following facilities: flush or pour-flush to a piped sewer system, septic tank or pit latrine; ventilatedimproved pit (VIP) latrine; pit latrine with slab; or a composting toilet.
46 Ministry of Water, Energy and Hydrocarbons (2018). Investment Planfor renewable energy in Madagascar. https://www.climateinvestmentfunds.org/sites/cif_enc/files/srepinvestment_plan_for_madagascar_final.pdf(Accessed 26 September 2018). Pg. 26.
47 Midi Madagasikara (2016). ANALOGH: 500 social housing will be builtin 2017. 3 December 2016. http://www.midi-madagasikara.mg/politique/2016/12/03/analogh-500-logements-sociaux-seront-construits-2017/ (Accessed 26 September 2018).
48 ANALOGH (2018). http://www.analogh.mg/index.php/122-construction-de-logements-sociaux-a-amboasary-ambohidratrimo(Accessed 26 September 2018).
49 EFSD (2017). Promoting investment in the Neighbourhood and Africa.https://ec.europa.eu/europeaid/sites/devco/files/efds-report_en.pdf(Accessed 26 September 2018). Pgs. 39 – 40.
50 Ibid. 51 CAHF (2017). Housing Finance in Africa Yearbook (8th Edition).
http://housingfinanceafrica.org/app/uploads/2017_CAHF_YEARBOOK_14.10-copy.compressed.pdf (Accessed 26 September 2018). Pg. 171.
52 UNHabitat (nd.) Madagascar. https://unhabitat.org/madagascar/(Accessed 26 September 2018).
53 Knight Frank (2017). Africa Report 2017/2018.https://www.knightfrank.com/publications/africa-report-201718-4576.aspx (Accessed 26 September 2018). Pg. 27.
54 The World Bank (2018). Ease of Doing Business in Madagascar.http://www.doingbusiness.org/en/data/exploreeconomies/madagascar#DB_rp (Accessed 26 September 2018).
55 MATSF (2018). 65% of the land titles with the Cirdoma Avaradrano arealready digitized. 12 January 2018. http://www.mepate.gov.mg/65-des-titres-fonciers-aupres-du-cirdoma-avaradrano-sont-deja-numerises/(Accessed 26 September 2018).
56 Burnod, P. et al. (2014). Land certification in Madagascar : formalizing(f)or securing?https://www.researchgate.net/publication/282007992_Land_certification_in_Madagascar_formalizing_for_securing (Accessed 26 September2018).
57 Madagascar Land Observatory (2018). http://www.observatoire-foncier.mg/cartegf.php (Accessed 26 September 2018).
58 Burnod, P. et al. (2014). 59 DGGFPE (2018). Domerial operation concerted: 300 families receive
their land titles. 1 June 2018.http://www.dggfpe.mg/index.php/2018/06/01/operation-domaniale-concertee-300-familles-recoivent-leurs-titres-fonciers/ (Accessed 27September 2018).
60 ALB (2018). Special Report on Investment in Africa 2018. Countrychapter for Madagascar.https://www.africanlawbusiness.com/specialreport/madagascar(Accessed 27 September 2018).

Africa Housing Finance Yearbook 2018
181
performing loans decreasing to 12.7 percent from 15.7 percent. However, this isstill far above the regulatory benchmark of 5.0 percent. Lending to the real estatesector also remains low at 0.4 percent of the loan book.
Financial inclusion remains a challenge in Malawi. According to the 2017 GlobalFindex data, 23 percent of adults (15 years or older) in Malawi report having anaccount (either a personal or shared account) at a bank or another type of financialinstitution.20 Including mobile money services, this proportion increases to33.7 percent.
Given the relatively low levels of financial inclusion, it is unsurprising that there arevery low levels of consumer borrowing in the country. In 2017, only 8.6 percentof adults (15 years or older) reported borrowing money from a financial institutionor using a credit card in the past 12 months.21 In the same period, less than6 percent of adults reported having an outstanding housing loan (either personallyor together with someone else).
Financial inclusion is in part constrained due to limited access to suitable formalfinancial products and services in rural areas. According to the Microfinance
OverviewMalawi is a small, landlocked country with an estimated population of 18.6 millionpeople,1 which is expected to grow to 20.2 million by 2020.2 The country has ayoung and predominantly rural population. Based on 2017 data, 64.9 percent ofthe population are under the age of 243 and 83.4 percent of the population live inrural areas.4 However, Malawi’s urban population is growing faster than the ruralpopulation. In 2017, the annual urban population growth rate was 4.1 percent whilethe rural population growth rate was 2.6 percent.5 The majority of the urbanpopulation reside is four main areas including Lilongwe, Blantyre, Mzuzu and Zomba.6
Malawi ranks amongst the world’s poorest countries and performs poorly on variousindicators. Gross domestic product (GDP) per capita in 2017 hit a record high (butstill very low) of US$486.45, while inflation was recorded at 8.6 percent in June2018.7 In 2017, Malawi’s GDP growth rate picked up to 4 percent, up from 2.5percent in 2016.8 However, the country’s growth prospects are expected to beslightly lower in 2018 following adverse weather conditions and an army worminfestation affecting the agriculture sector.9 Malawi also continues to score low onthe United Nations Development Programme (UNDP) Human Development Index(HDI), coming in 171th place out of 189 countries on the 2018 statistical update.10
Malawi’s construction sector saw good growth in 2017 at 4.8 percent comparedto 3.4 percent in 2016.11 This was largely driven by improved public investmenttowards large infrastructure projects including the heavily delayed Kamuzu Barragein the Machinga District12 and the construction of a dual carriageway inLilongwe.13 Despite the increased public investment, the construction sector onlyaccounts for approximately 3 percent of the country’s annual GDP.14
Access to finance Malawi’s financial sector has consolidated in the last three years following a numberof acquisitions including that of the state-owned Malawi Savings Bank (MSB) byFDH Holdings Limited in 2015,15 and the acquisition of IndeBank by the NationalBank of Malawi (NBW) in 2016.16 While there are 10 banks operating in thecountry (down from 12 in 2016),17 the sector is concentrated around two bankswhich own almost half of the sector’s total assets and total deposits.18
According to the Reserve Bank of Malawi (RBM), the country’s banking sector isprofitable, liquid, and adequately capitalised. While total assets declined by3.7 percent to K1 514.9 billion (US$2.08 billion)19 during the 6-month periodfrom December 2017 to June 2018, asset quality improved with the ratio of non-
MalawiKEY FIGURES
Main urban centresLilongweBlantyre
Exchange rate: 1 US$ = [a] 6 Aug 2018PPP Exchange rate (Local currency/PPP$) 1 Malawian kwacha = [b]Inflation 2016 [a] | Inflation 2017 [a] | Inflation 2018 [a]
725.99 Malawian kwacha205.600.20 | 7.10 | 8.60
Population [c] | Urban population size 2016 [d] Population growth rate | Urbanisation ratePercentage of the total population below National Poverty Line [e]Unemployment rate [f]
19 209 248 | 3 172 7802.80% | 3.80%51.0%6%
GDP (Current US$) 2017 [e] | GDP growth rate annual 2017GDP per capita (Current US$) 2017 [b]GNI per capita (Current US$) 2017 [b]Gini co-efficient [g]HDI global ranking 2017 [h] | HDI country index score 2017 [h]
US$6 300 million | 4.6%US$338US$32045.0171 | 0.477
Is there a deeds registry? Number of residential properties that have a title deed Lending interest rate [a]Mortgage interest rate | Mortgage term (years)DownpaymentMortgage book as a percentage of the GDP 2014 [l]Estimated number of mortgages Price to Rent Ratio in City Centre | Outside City Centre Gross Rental Yield in City Centre | Outside City Centre Construction as a % of GDP [i]
Yes
31.64%35.5% | 1010%1.5%n/an/a | n/an/a | n/an/a
What is the cost of standard 50kg bag of cement? What is the price of the cheapest, newly built house by a formaldeveloper or contractor? (Local currency) [j]What is the price of the cheapest, newly built house by a formaldeveloper or contractor? (US$) [j]What is the size of this house (m2)? [j]What is the average rental price for this unit (US$)? [j]What is the minimum stand or plot size for residential property? [j]
US$8.27
15 000 000 Malawian kwacha
US$20 65775m2
US$234300m2
Ease of Doing Business Rank [k]Number of procedures to register property Time to register property (days) Cost to register property (as % of property value) [k]
110669 Days1.60%
NB: Figures are for 2018 unless stated otherwise.
[a] The Reserve Bank of Malawi[b] World Bank World Development Indicators[c] Worldpopulationreview.com[d] Worldometers[e] Trading Economics[f] ieconomics.com[g] Oxfam Malawi[h] UNDP Development Indicators[i] Indexmundi[j] Malawi Housing Corporation[k] World Bank Doing Business[l] Hofinet

182
Information Exchange (MIX), 46 percent of all financial access points are locatedin Malawi’s two largest cities, Lilongwe and Blantyre.22
Until recently, the lack of credit information in the country constrained lending.The legal framework for credit information sharing was established following theenactment of the Credit Reference Bureau (CRB) Act in 2010. The Act wasamended in 2015 to remove ambiguities which had hindered its roll out and byAugust 2016, the country had its first operational credit bureau (CRB).23 However,the establishment of the CRB has not been without challenges and it is reportedthat the banking institutions are not utilising its services as they are expected to.24
Few banks offer mortgages in Malawi, namely the National Bank of Malawi (NBM),Standard Bank, FDH Bank and New Building Society (NBS). However, overall,access to mortgage finance is limited by household affordability and strict eligibilitycriteria including a minimum 10 percent cash deposit, a minimum of three to sixmonths history with the bank and three months of payslips. Furthermore, banksonly offer mortgages on properties located in areas “deemed acceptable to theBank”.25 This means that the unbanked population and the casually self-employed(for example, small-scale farmers) are largely excluded.
In the fourth quarter of 2017, the RBM revised the base lending rate to 16 percentfrom 18 percent, maintaining the downward trend of the past two years.26 Themain mortgage financiers have responded to the policy rate by equally reducingtheir lending interest rates. As at January 2018, NBS, the largest mortgage provider,charge 25.5 percent on mortgage loans (down from 27.5 percent in June 2017).27
NBM currently have the lowest rates on mortgages at 23 percent, while CDHInvestment and FDH charge 24.5 percent and 25 percent respectively.28, 29
Most banks have excess liquidity, their funds consisting primarily of a combinationof equity plus retail funds from savers. Some have external lines of credit, but onlyfor special schemes such as SME lending or access to foreign exchange. The mainsource of funds for mortgages remains retail funds, with most surplus funds beinginvested in Treasury bills.
The microfinance sector also offers a broad range of loans that provides someleeway to housing finance. As at December 2017, there were 45 registeredmicrofinance institutions in Malawi.30 Total assets for the microfinance sectorincreased from K35.3 billion (US$48.5 million) in December 2017 to K39.9 billion(US$54.8 million) in June 2018.31 However, during the same period, the loanportfolio for the sector decreased from K19.9 billion (US$27.3 million) to K18.5billion (US$25.4 million).
The deposit-taking subsector (comprised of one MFI, FINCA Malawi Ltd)registered a profit of K101.7 million (US$139 856) in June 2018 compared toK45.0 million (US$61 883) in June 2017. The improved profit is largely due togrowth in income from investments. Conversely, the recorded losses in the non-deposit taking sector continue to deepen. As at June 2018, the registered loss inthis subsector was K246.5 million (US$338 984) compared to a K206.5 million(US$283 976) loss in the previous year. Contributing to this loss was the increasein NPLs from 16.5 percent in December 2017 to 21.8 percent in June 2018.
The primary MFIs that offer short-term housing loans include: Select FinancialServices, Epik Finance, and Greenroot Microfinance. Epik Finance, for example,offers incremental building loans to low and middle income earners; the maximumloan value is US$900 (K500 000), repayable over 18 months. Habitat for Humanity(HfH) has sustained its partnerships with two housing microfinance lenders:Opportunity Bank of Malawi (OBM) and Select Financial Services. Through thispartnership, low income households access small habitat loans from themicrolenders and HfH provide them Construction Technical Assistance (CTA).
Malawi’s pension sector has grown in recent years due to growing membershipnumbers and the performance of the Malawian Stock Exchange. The sector’sinvestment is primarily directed towards listed equities and government securities.Investment in real estate currently stands at 6.1 percent.32
While limited tenure security may still be an issue with regard to accessing housingfinance in Malawi, the lack of a national identification system should soon no longerbe an issue. The National Registration and Identification System (NRIS project) waslaunched in October 2016 with the support of the UNDP.33 The mass ID registrationcampaign started in May 2017 and is expected to be completed by 2019.
AffordabilityAccording to data published by the International Monetary Fund in April 2018,Malawi is the third poorest country in the world based on GDP per capitafigures.34 Furthermore, based on a subjective-assessment of economic wellbeing,in 2016, close to 70 percent of households in Malawi considered themselves to“poor” or “very poor”.35
According to the latest available labour force data from 2013, the majority ofeconomically active adults (aged 15 – 64 years old) in Malawi work in theagriculture sector and levels of self-employment are high (54.% percent ofemployed adults are employers or own-account workers). Informal employmentrelationships also dominate the labour market.36
In July 2017, the Malawi Government raised the daily minimum wage from K787.70(US$1.07) to K962.00 (US$1.30).37 Assuming a worker is employed for the fullmonth (20 working days) at the revised minimum wage, they can expect to earna gross monthly income of approximately K19 240 (US$26.50). However, giventhe high levels of informal employment, many workers might earn even less thanthis.
Given the low levels of income and high rate of informal employment, fewMalawians qualify for mortgage finance. Prices of a newly built entry-level house,built by a developer, average K8.5 million (US$11 643).38 Since only 30 percentof a household’s income is allowed towards servicing of loans or mortgagepayments, a borrower needs to earn at least K700 000 (US$978.9) to afford thehouse. Thus even the cheapest house is only accessible to highest income earners.Furthermore, most mortgage lenders target salaried individuals thereby excludinga large portion of the Malawian workforce. National Bank provides a mortgageas small as K500 000 (US$684.9); and the least mortgage value at Standard Bankis approximately K4 million (US$5 479.80). Repayment periods range between15 and 20 years.
Housing supplyAccording to the IHPS 2016 data, there is a decreasing trend in the number ofowner-occupied and renter households in Malawi. In 2016, approximately68 percent of households owned their dwellings (down from 73 percent in 2010),while 18 percent rented (down from 19 percent in 2010). This appears to bedriven by an increase in households taking up free dwellings (9.8 in 2016 comparedto 4.8 percent in 2010). Owner-occupied dwellings are concentrated in ruralareas (79.2 percent of rural households report owning their dwellings), whilerenter household dominate in urban areas (49.9 percent of urban householdsreport renting their dwellings). Approximately 38 percent of urban householdsown their dwellings.39
In 2016, approximately 68 percent of dwellings were constructed using permanentor semi-permanent materials, while 32 percent were constructed using traditionalmaterials (down from 42 percent in 2010).40 In 2016, the average household sizewas 4.8 persons (this is the same in both rural and urban areas). Furthermore,16.8 percent of all households were overcrowded (have four or more people perhabitable room).
As can be expected, there is a vast difference in terms of access to services amongurban and rural households. In 2016, the dominant source of drinking water inrural areas was borehole water (72.1 percent), while in urban areas it was pipedwater into a yard/communal area (61.9 percent). Approximately 18 percent ofhouseholds in urban areas reported having piped water into their dwelling.41 Interms of electricity, 49.6 percent of households in urban areas reported havingaccess to electricity (up from 40.1 percent in 2013), compared to only 5.8 percentof rural households. However, access to flush toilets remains low; only 15.3 percentof urban households reported having access to a flush toilet in 2016.42
Despite some improvements in access to services, an increasing proportion ofhouseholds in Malawi consider their housing situation to be inadequate. Accordingto the IHPS 2016, over half of all households surveyed reported inadequatehousing (up from 44.2 percent in 2010). Habitat for Humanity Malawi estimatesthat 21 000 new housing units are needed every year for the next 10 years tomeet housing demand.43
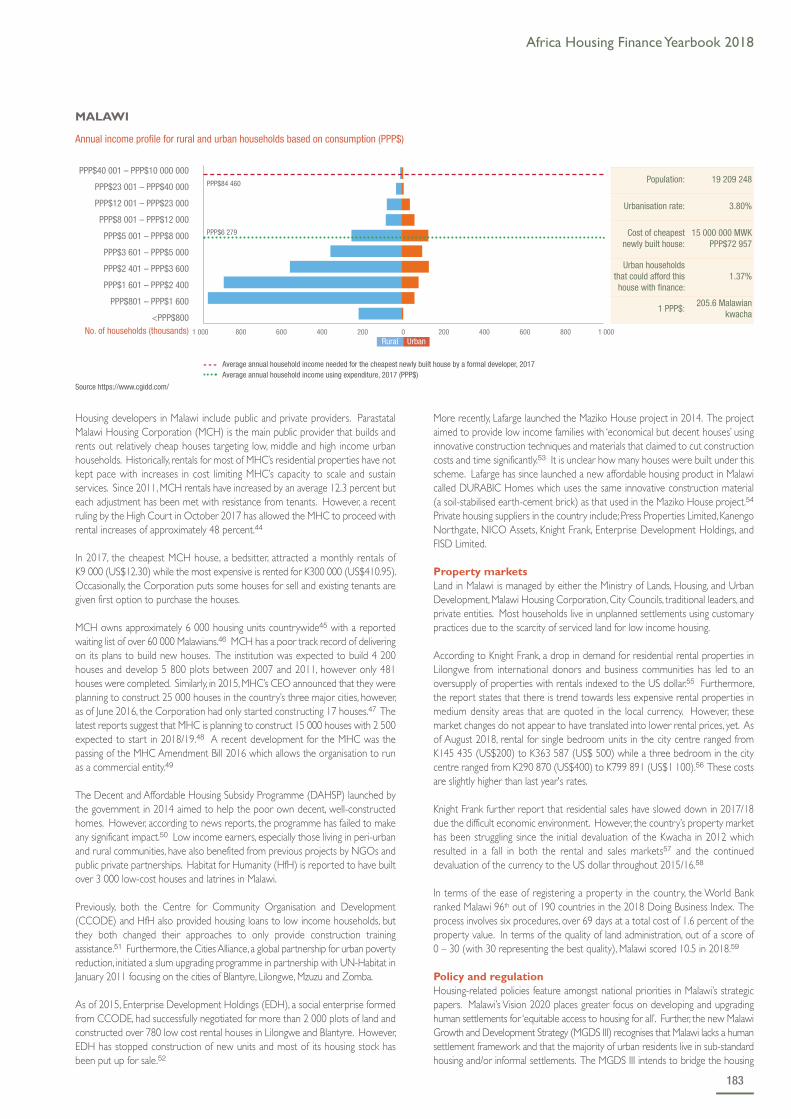
Africa Housing Finance Yearbook 2018
183
Housing developers in Malawi include public and private providers. ParastatalMalawi Housing Corporation (MCH) is the main public provider that builds andrents out relatively cheap houses targeting low, middle and high income urbanhouseholds. Historically, rentals for most of MHC’s residential properties have notkept pace with increases in cost limiting MHC’s capacity to scale and sustainservices. Since 2011, MCH rentals have increased by an average 12.3 percent buteach adjustment has been met with resistance from tenants. However, a recentruling by the High Court in October 2017 has allowed the MHC to proceed withrental increases of approximately 48 percent.44
In 2017, the cheapest MCH house, a bedsitter, attracted a monthly rentals ofK9 000 (US$12.30) while the most expensive is rented for K300 000 (US$410.95).Occasionally, the Corporation puts some houses for sell and existing tenants aregiven first option to purchase the houses.
MCH owns approximately 6 000 housing units countrywide45 with a reportedwaiting list of over 60 000 Malawians.46 MCH has a poor track record of deliveringon its plans to build new houses. The institution was expected to build 4 200houses and develop 5 800 plots between 2007 and 2011, however only 481houses were completed. Similarly, in 2015, MHC’s CEO announced that they wereplanning to construct 25 000 houses in the country’s three major cities, however,as of June 2016, the Corporation had only started constructing 17 houses.47 Thelatest reports suggest that MHC is planning to construct 15 000 houses with 2 500expected to start in 2018/19.48 A recent development for the MHC was thepassing of the MHC Amendment Bill 2016 which allows the organisation to runas a commercial entity.49
The Decent and Affordable Housing Subsidy Programme (DAHSP) launched bythe government in 2014 aimed to help the poor own decent, well-constructedhomes. However, according to news reports, the programme has failed to makeany significant impact.50 Low income earners, especially those living in peri-urbanand rural communities, have also benefited from previous projects by NGOs andpublic private partnerships. Habitat for Humanity (HfH) is reported to have builtover 3 000 low-cost houses and latrines in Malawi.
Previously, both the Centre for Community Organisation and Development(CCODE) and HfH also provided housing loans to low income households, butthey both changed their approaches to only provide construction trainingassistance.51 Furthermore, the Cities Alliance, a global partnership for urban povertyreduction, initiated a slum upgrading programme in partnership with UN-Habitat inJanuary 2011 focusing on the cities of Blantyre, Lilongwe, Mzuzu and Zomba.
As of 2015, Enterprise Development Holdings (EDH), a social enterprise formedfrom CCODE, had successfully negotiated for more than 2 000 plots of land andconstructed over 780 low cost rental houses in Lilongwe and Blantyre. However,EDH has stopped construction of new units and most of its housing stock hasbeen put up for sale.52
More recently, Lafarge launched the Maziko House project in 2014. The projectaimed to provide low income families with ‘economical but decent houses’ usinginnovative construction techniques and materials that claimed to cut constructioncosts and time significantly.53 It is unclear how many houses were built under thisscheme. Lafarge has since launched a new affordable housing product in Malawicalled DURABIC Homes which uses the same innovative construction material(a soil-stabilised earth-cement brick) as that used in the Maziko House project.54
Private housing suppliers in the country include; Press Properties Limited, KanengoNorthgate, NICO Assets, Knight Frank, Enterprise Development Holdings, andFISD Limited.
Property marketsLand in Malawi is managed by either the Ministry of Lands, Housing, and UrbanDevelopment, Malawi Housing Corporation, City Councils, traditional leaders, andprivate entities. Most households live in unplanned settlements using customarypractices due to the scarcity of serviced land for low income housing.
According to Knight Frank, a drop in demand for residential rental properties inLilongwe from international donors and business communities has led to anoversupply of properties with rentals indexed to the US dollar.55 Furthermore,the report states that there is trend towards less expensive rental properties inmedium density areas that are quoted in the local currency. However, thesemarket changes do not appear to have translated into lower rental prices, yet. Asof August 2018, rental for single bedroom units in the city centre ranged fromK145 435 (US$200) to K363 587 (US$ 500) while a three bedroom in the citycentre ranged from K290 870 (US$400) to K799 891 (US$1 100).56 These costsare slightly higher than last year's rates.
Knight Frank further report that residential sales have slowed down in 2017/18due the difficult economic environment. However, the country’s property markethas been struggling since the initial devaluation of the Kwacha in 2012 whichresulted in a fall in both the rental and sales markets57 and the continueddevaluation of the currency to the US dollar throughout 2015/16.58
In terms of the ease of registering a property in the country, the World Bankranked Malawi 96th out of 190 countries in the 2018 Doing Business Index. Theprocess involves six procedures, over 69 days at a total cost of 1.6 percent of theproperty value. In terms of the quality of land administration, out of a score of0 – 30 (with 30 representing the best quality), Malawi scored 10.5 in 2018.59
Policy and regulationHousing-related policies feature amongst national priorities in Malawi’s strategicpapers. Malawi’s Vision 2020 places greater focus on developing and upgradinghuman settlements for ‘equitable access to housing for all’. Further, the new MalawiGrowth and Development Strategy (MGDS III) recognises that Malawi lacks a humansettlement framework and that the majority of urban residents live in sub-standardhousing and/or informal settlements. The MGDS III intends to bridge the housing
Source https://www.cgidd.com/
PPP$40 001 – PPP$10 000 000
PPP$23 001 – PPP$40 000
PPP$12 001 – PPP$23 000
PPP$8 001 – PPP$12 000
PPP$5 001 – PPP$8 000
PPP$3 601 – PPP$5 000
PPP$2 401 – PPP$3 600
PPP$1 601 – PPP$2 400
PPP$801 – PPP$1 600
<PPP$800
MALAWI
Annual income profile for rural and urban households based on consumption (PPP$)
No. of households (thousands)
PPP$6 279
PPP$84 460
Rural Urban1 000 800 600 400 200 0 200 400 600 800 1 000
Population: 19 209 248
Urbanisation rate: 3.80%
Cost of cheapestnewly built house:
15 000 000 MWKPPP$72 957
Urban householdsthat could afford thishouse with finance:
1.37%
1 PPP$:205.6 Malawian
kwacha
- - - Average annual household income needed for the cheapest newly built house by a formal developer, 2017 Average annual household income using expenditure, 2017 (PPP$)

184
gap by “increasing access and availability of affordable and decent houses”. Strategiesincluded in the MGDS III include: the registration of customary land parcels and thedigitization of land records, as well as property valuations and assessments.
The country has also ratified the Global Agenda for Housing, Habitat III, whichbinds governments to ensure everyone has access to “adequate, safe andaffordable housing and basic services” by 2030.60
Despite not having a National Housing Policy in place (it has been in draft formsince 2007), in recent years, a number of land-related Bills have been passed byparliament. These include a revised: Land Act, Physical Planning Act, CustomaryLand Act, Registered Land Act, Land Acquisition Act, Local Government Act, andMalawi Housing Corporation Act.61 The Customary Land Act has ignited debateover the role of chiefs in land administration with opposers of the bill arguing itstrips chiefs of their traditional powers over land and overburdens poor peopleto pay for land leases. Proponents argue the new law gives rural communities anopportunity to own land individually, which they can then register and use ascollateral in the future. In line with the MGDS III, the Registered Land(Amendment) Act provides for title registration throughout the country for allland categories including customary estates.62
With the passing of the Land Act 2016 and Customary land Act 2016, two majordepartures have been made to the country’s historic tenure system. Firstly, landin Malawi is now only classified into public or private land, whereas customaryland used to have its own classification.63 Customary land is now classified asprivate land except for unallocated customary land which is classified as public.Secondly, all land is vested to the Republic in perpetuity, as opposed to it beingvested to the president.64 However, a potential deterrent for foreign investors isthe clause relating to foreign ownership of land in the amended Land Act. TheAct limits the maximum period of leasehold to non-Malawian citizens to 50 years,with the caveat that longer leasehold’s may be permitted if more time is requiredfor the realisation of an investment.65
To date, some of the major constraints to the development of Malawi’s mortgage
market include limited access to privately-owned land, lack of secure tenure,inability to use rural-based land and houses as collateral and an inefficient landregistration system. The successful implementation of the above-mentionedpolicies and legislation and should, hopefully, ease these constraints in the comingyears.
Opportunities Malawi has faced tough economic conditions in recent years and continues toperform poorly on various macroeconomic indicators. Poverty levels remain highand affordability and access to decent housing remains a major challenge for thecountry. However, recent improvements in land reform policies and plannedimprovements to the country’s land registration system and title deed system areencouraging prospects.
A key development in recent years has been the reclassification of customary landto private land. The primary benefit of this being that a large portion of thepredominantly rural population will now be able to own land individually andpotentially use this land as collateral for future housing investments.
Furthermore, the base lending rate in Malawi continues to decline and currentlystands at 16 percent down from 18 percent in 2017. The banks and other lendinginstitutions have responded accordingly by cutting their rates thereby improvingaccess to and affordability of loans, including mortgages. The country’s housingmarket continues to struggle following the devaluation of the Malawian Kwachaand subsequent depreciation of the currency to the US dollar in the followingyears. However, the recent developments in land policy and the government’scommitment to improving housing conditions, as set out on the MGDS III, signalpositive prospects for the country’s housing market in years to come.
Websites http://www.doingbusiness.org/ http://hdr.undp.org/enhttp://www.nsomalawi.mw/ https://www.rbm.mw/
1 United Nations (2017). World Population Prospects. Data Booklet. 2017Revision. https://population.un.org/wpp/Publications/Files/WPP2017_DataBooklet.pdf (Accessed 17 September 2018).
2 United Nations (2017). World Population Prospects. Volume II:Demographic Profiles. 2017 Revision. https://population.un.org/wpp/Publications/Files/WPP2017_Volume-II-Demographic-Profiles.pdf.(Accessed 17 September 2018). Pgs. 477 – 479.
3 United Nations (2017). Pg. 477.4 The World Bank (2017). World Development Indicators.
http://databank. worldbank.org/data/source/world-development-indicators (Accessed 18 September 2018).
5 Ibid. 6 Worldpopulationreview.com (2018). http://worldpopulationreview.com/
countries/malawi-population/cities/ (Accessed 17 September 2018).7 Trading Economics (2018). Malawi – Economic Indicators.
https://tradingeconomics.com/malawi/ind. cators (Accessed 19 September2018).
8 The World Bank. (2017). 9 The World Bank (2018). Sub-Saharan Africa. Macro-Poverty Outlook.
Spring Meetings 2018. http://pubdocs.worldbank.org/en/720441492455091991/mpo-ssa.pdf (Accessed 18 September 2018).
10 UNDP (2018). Human Development Reports. 2018 Statistical Update.http://hdr.undp.org/en/2018-update (Accessed 18 September 2018).
11 The Reserve Bank of Malawi (2017). Financial and Economic Review. Vol51 – Number 4. Pg.23.
12 Andsen-Mana, T. (2018). Upgraded Kamuzu Barrage ready October end.29 July 2018. Nyasa Times. https://www.nyasatimes.com/upgraded-kamuzu-barrage-ready-. ctober-end/ (Accessed 18 September 2018).
13 The Reserve Bank of Malawi (2017). Pg. 23. 14 African Development Bank Group (2018). African Economic Outlook.
Malawi. https://www.afdb.org/fileadmin/uploads/ afdb/Documents/Generic-Documents/country_notes/Malawi_country_ note.pdf(Accessed 18 September 2018).
15 FDH Bank (2015). FDH Bank ltd recapitalization update.http://www.fdh.co.mw/index.php/press-releases (Accessed18 September 2018).
16 National Bank of Malawi (2016). Annual Report 2016.https://www.natbank.co.mw/index.php/publications/annual-reports/81-annual-report-2016/file (Accessed 18 September 2018).
17 The Reserve Bank of Malawi (2017). Financial Institutions SupervisionAnnual Report 2017. Pg.12.
18 The Reserve Bank of Malawi (2018). Financial Stability Report. June 2018.Pg.8.
19 Exchange rate as at 18 September 2018. 1 US$ = 727.174 MWK20 The World Bank (2017). https://globalfindex.worldbank.org/sites/
globalfindex/files/countrybook/Malawi.pdf21 Ibid. 22 The MIX (nd). Reaching Rural Areas is the Key to Unlocking Full Financial
Inclusion in Malawi. https://www.themix.org/news/mymix/ reaching-rural-areas-key-unlocking-full-financial-inclusion-malawi (Accessed 18 September2018).
23 CRB News (2017). Message from Credit Data CRB Ltd.https://www.creditdatamw.com/category/news/ (Accessed18 September 2018).
24 Ibid. 25 FDH Bank (2018). Mortgages. http://www.fdh.co.mw/index.php/products/
asset-finance/mortgages#full-details (Accessed 19 September 2018). 26 The Reserve Bank of Malawi (2017). Financial & Economic Review. Vol
51 – No. 4. Pg.1027 NBS (2018). https://www.nbs.mw/index.php/treasury/ ratesandtarrifs/
interest-rates (Accessed 21 September 2018). 28 CDH Investment Bank (2018). https://www.cdh-malawi.com/index.php
/interest-rates (Accessed 19 September 2018). 29 FDH Bank (2018). http://www.fdh.co.mw/index.php/rates-tariffs/bank-
interest-rates (Accessed 19 September 2018).30 The Reserve Bank of Malawi (2017). Financial & Economic Review. Vol
51 – No. 4. Pg.39. 31 The Reserve Bank of Malawi (2018). Financial Stability Report. June 2018.
Pg. 29.32 The Reserve Bank of Malawi (2017). Financial Institutions Supervision
Annual Report. Pg.24.33 UNDP (2017). NRB issues the first national identity cards to Malawians.
http://www.mw.undp.org/content/malawi/en/home/presscenter/articles/2017/11/09/nrb-issues-the-first-national-. dentity-cards-to-malawians.html(Accessed 18 September 2018).
34 IMF (2018). IMF DataMapper. https://www.imf.org/external/datamapper/NGDPDPC@WEO/OEMDC/ADVEC/WEOWORLD. (Accessed19 September 2018).
35 National Statistical Office Malawi (2017). Pgs. 88 & 92. 36 National Statistical Office Malawi (2014). Malawi Labour Force Survey
2013. http://www.nsomalawi.mw/images/stories/data_on_line/demography/Labour%20Force/Labour%20Force%20Survey%202013/Key%20Finding%20Report_Labour%20Force%20Indicators.pdf (Accessed19 September 2018).
37 Thipa, G. (2017). Fears Rise Over Wage Avoidance. Daily Times. 13 July2017. https://www.times.mw/fears-rise-over-wage-avoidance/ (Accessed19 September 2018).
38 This is based on an analysis of real estate ads in Malawi’s daily newspapersand also top real estate websites sites such as http://www.nyumba24.com
39 National Statistical Office Malawi (2017). 40 Ibid. 41 Ibid.42 Ibid. 43 Habitat for Humanity Malawi (2018). https://www.habitat.org/where-we-
build/malawi (Accessed 19 September 2018). 44 Chilanga, Z. (2017). Malawi Housing Corporation wins case to effect
rental hike. 31 october 2017. https://www.nyasatimes.com/malawi-housing-corporation-wins-case-effect-rental-hike/ (Accessed19 September 2018).
45 Ibid.46 Katona, M. (2017). Malawi Housing Corporation rescinds rental hike.
16 June 2017. https://www.times.mw/malawi-housing-corporation-rescinds-rental-hike/ (Accessed 19 September 2018).
47 Interview with MCH employee.48 Ibid.49 Malawi Housing Corporation (2017). MHC Public Service Reforms
Presentation. http://www.mhcmw.org/index.php/mhc-media/publications/8-mhc-public-service-reforms-presentation (Accessed 19 September2018).
50 Chikoko, R. (2017). Housing subsidy flop. 21 October 2017.https://mwnation.com/flop-housing-subsidy/ (Accessed 19 September2018).
51 CCODE (2015). Situational Assessment of Rural Housing in Malawi: ACase Study of Salima District. Unpublished.
52 Interview with an EDH employee.53 Lafarge (nd). Maziko Houses brochure. https://www.lafarge.mw/sites/
malawi/files/documents/Maziko_Houses_Brochure.pdf (Accessed19 September 2018).
54 DURABRIC (2018). https://www.durabric.com/durabric-homes.(Accessed 19 September 2018). Export.gov (2016). Malawi BankingSystems. https://www.export.gov/article?id=Malawi-banking-systems.(Accessed 19 September 2018).
55 Knight Frank (2017). Africa Report 2017/2018.https://www.knightfrank.com/ publications/africa-report-201718-4576.aspx (Accessed 19 September 2018).
56 Numbeo (2018). Cost of Living in Malawi. https://www.numbeo.com/cost-of-living/country_result.jsp?country=Malawi (Accessed19 September 2018).
57 Knight Frank (2013). Africa Report 2013.https://content.knightfrank.com/research/155/documents/en/africa-report-2013-2013.pdf (Accessed 19 September 2018).
58 The Reserve Bank of Malawi (2016). Press Statement. Malawi KwachaDepreciation and Near-Term Prospects. 28 January 2016.https://www.rbm.mw/MediaCenter/PressReleases/ (Accessed19 September 2018).
59 The World Bank (2018). Ease of doing business in Malawi.http://www.doingbusiness.org/en/data/exploreeconomies/malawi#DB_rp(Accessed 19 September 2018).
60 Ministry of Lands, Housing and Urban Development (2015). MalawiHabitat III Report. http://habitat3.org/wp-content/uploads/Malawi-Final-Habitat-3-Report-Oct2015-1.pdf (Accessed 19 September 2018).
61 Mlaka, E. (2018). New land law overview: Key changes.http://www.kas.de/wf/doc/kas_53120-1522-2-30.pdf?180716124546.(Accessed 19 September 2018).
62 Ibid. 63 Note: Public land can be classified as either government land or
unallocated customary land. Private land can be split into customaryestate, leasehold land and freehold land.
64 Ministry of Agriculture, Irrigation and Water Development (2017). ShireValley Irrigation Project. Resettlement Policy Framework. 10 August2017. http://documents.worldbank.org/curated/en/572641502362203937/pdf/SFG3554-RP-P158805-Box405293B-PUBLIC-Disclosed-8-10-17.pdf (Accessed 19 September 2018).
65 Ibid.

Africa Housing Finance Yearbook 2018
185
between the Region Mortgage Refinancing Facility (CRRH-UEMOA), the WestAfrican Development Bank and the World Bank, which aims at increasing accessto affordable housing finance to households with modest revenues.
Mali has consistently improved its ranking on the Starting a Business indicator ofthe Doing Business Report from 172 in 2016 to 108 in 2017, and to 104 in 2018.
Access to financeIn 2018, the financial sector consisted of 13 banks,5 three financial institutions, twopension funds – a social security fund for private sector employees (the NationalInstitute of Social Welfare) and a pension fund for public sector employees (theRetirement Fund of Mali) – and six insurance companies. The banking financialsector is dominated by commercial banks. Other financial institutions include theMali Branch of Alios Finance (a Cote d'Ivoire-based private financial group) andthe Mali Mortgage Guarantee Fund (Fonds de Garantie Hypothecaire du Mali, orFGHM). Five banks in Mali formally offer housing loans. Some commercial banksalso offer up to CFA 30 million or US$52 2296 for equipment loans for housingenhancement, acquisition or construction of housing for individuals at a 12 percent
OverviewThe Republic of Mali is one of the largest countries in West Africa covering anarea of 1 248 574 km2. Mali’s total population was estimated at 18.5 million in2017, still growing at an annual rate of three percent.1 This is projected to doubleby 2030, while the urban population will triple from the current level of40.7 percent.2 In Mali, four out of 10 people live in urban areas.
Mali is one of the poorest countries in the world. According to the UNDP’sHuman Development Index, it ranked 175 out of 188 countries in 2016. Lifeexpectancy at birth is estimated at 57.5 years. Gross national income (Atlasmethod) was US$770 per capita in 2017, among the lowest in the world. In 2016,44.8 percent of Malians were living below the international poverty line (US$1.9;2011 PPP).3
With the July 2013 presidential election, the political situation stabilised, and thiswas strengthened with the signing of peace agreements with rebel groups in Mayand June 2015. However, challenges remain on the way to full peace all over thecountry, as sporadic outbreaks of violence due to rebel or jihadist attacks werenoted in several parts of the country in 2017 and 2018. New presidential electionswere held in July and August 2018, which saw the re-election of President IbrahimBoubacar Keita. GDP growth remained strong over the past five years and reached5.8 percent in 2016 and 5.5 percent in 2017; and is projected to be five percentin 2018 and 2019. GDP growth in Mali is driven by gold exports and the primarysector (thanks to good harvests), but also a rebound in the ICT sector andincreased public investments to reduce the infrastructure gap. Inflation remainedunder control and jumped from -1.8 percent in 2016 to two percent in 2017 dueto high food prices and an increase in the international oil price.4
President Ibrahim Boubacar Keita fell short in delivering on his promise to provide50 000 housing units between 2013 and 2018. Less than 13 000 units had beendelivered as of May 2018. In 2016, the Banque de l’Habitat du Mali (BHM), theMali Housing Bank, one of the pillars of the Mali Housing Policy, was absorbed bythe Banque Malienne de Solidarité (BMS). It is too early to judge whether thisoperation has been successful or not.
As a member of the West African Economic and Monetary Union, Mali willcertainly benefit from the signing of a US$155 million financing agreement
MaliKEY FIGURES
Main urban centres Bamako
Exchange rate: 1 US$ = [a] 18 Sept 2018PPP Exchange rate (Local currency/PPP$) 1 CFA franc = [b]Inflation 2016 [c] | Inflation 2017 [c] | Inflation 2018
574.34 CFA franc217.00-1.80 | 2.00 | n/a
Population 2017 [b] | Urban population size 2017 [b]Population growth rate 2017 [b] | Urbanisation rate 2017 [b]Percentage of the total population below National Poverty LineUnemployment rate [b]
18 541 980 | 7 683 9822.90% | 4.84%40.70%7.9%
GDP (Current US$) 2017 [b] | GDP growth rate annual 2017 [b]GDP per capita (Current US$) 2017 [b]GNI per capita (Current US$) 2017 [b]Gini co-efficient 2009 [b]HDI global ranking 2016 [d] | HDI country index score 2016 [d]
US$15 288 million | 5.30%US$824US$77033.00175 | 0.442
Is there a deeds registry? Number of residential properties that have a title deed [e]Lending interest rate [b]Mortgage interest rate | Mortgage term (years)DownpaymentMortgage book as a percentage of the GDPEstimated number of mortgages [f]Price to Rent Ratio in City Centre | Outside City Centre Gross Rental Yield in City Centre | Outside City Centre Construction as a % of GDP
Yes151 5515.30%8.75% | 6n/an/a452n/a | n/an/a | n/an/a
What is the cost of standard 50kg bag of cement? What is the price of the cheapest, newly built house by a formaldeveloper or contractor? (Local currency)What is the price of the cheapest, newly built house by a formaldeveloper or contractor? (US$) What is the size of this house (m2)? What is the average rental price for this unit (US$)? What is the minimum stand or plot size for residential property?
US$7.82
13 577 850 CFA franc
US$23 63960m2
n/a150m2
Ease of Doing Business Rank [g]Number of procedures to register property [g]Time to register property (days) [g]Cost to register property (as % of property value) [g]
143529 days11.10%
NB: Figures are for 2018 unless stated otherwise.
[a] Coinmill.com[b] World Bank World Development Indicators[c] African Development Bank - African Economic Outlook[d] UNDP Development Indicators[e] Mali Ministry of Finance[f] Central Bank of West African States[g] World Bank Doing Business

186
(but negotiable) interest rate over five years. Many of these banks (such asEcobank Mali and Coris Bank International Mali) are also active in supportinghousing projects through partnerships, either with developers or housingcooperatives such as the Agence de Cessions Immobilières and the ConfédérationNationale des Sociétés Coopératives D’habitat du Mali.
Despite the number of financial institutions, access to finance as measured bycredit-to-GDP ratio was estimated at only 25.1 percent in 2017, according toCentral Bank of West African States (Banque Centrale des Etats de l’Afrique del’Ouest – BCEAO) statistics. In 2017 there were 402 bank branches and 417 ATMmachines, most of which were concentrated in urban areas.7 As of December2017, a total of CFA 2 230 billion (US$3.88 billion) of loans were emitted, only asix percent increase from 2016. According to the 2016 Annual Report of theCommission Bancaire de l’UMOA, there are 1 339 486 bank accounts in thecountry.8 More recent information is not available. Specific data on housingfinance is difficult to obtain as it is not collected on a regular basis by the CentralBank and made public.
General lending rates are between eight and nine percent on average for long-term loans (mortgages), above the West African Economic and Monetary Union(WAEMU) average of 7.7 percent in 2013.9 Interest rates on deposits haveremained almost constant at around 3.5 percent.
In 2015, following an assessment of the financial sector in Mali, the dismantlementof the Mali Housing Bank was recommended, and led to its absorption by theBMS in May 2016. Indeed, the fiscal sustainability of BHM which was subsidisedby the Government of Mali as one of its main housing policy instruments wasseriously questioned. It is also important to mention that despite the creation ofthe Caisse Regionale de Refinancement Hypothecaire (CRRH), a regionalmortgage refinancing facility, Malian banks are among those which take lessadvantage of it – Mali is the country with the lowest number of banks affiliated tothe CRRH. However, housing finance continued to grow, with the Mali branch ofBank of Africa launching the “Prêt ma maison” in 2016. This new mortgage productis offered over a period of 15 to 20 years at a moderated interest rate. Theamount of the mortgage depends on the applicant’s revenue and the interest rateis negotiable, with an approximate minimum of eight percent per year. No down-payment is required from the applicant to obtain the loan, but standard guaranteeconditions apply (for example, a secure job or a stable source of revenue). TheBMCE Group of which Bank of Africa is part of, offers similar products in othercountries such as Benin and Togo. Since this product is new, it is difficult at thispoint to measure take-up.
The microfinance sector, which soared in Mali at the end of the 1990s, is facingimportant challenges, exacerbated by the 2012 political crisis. The 2015 WorldBank Financial Assessment conducted on the Mali financial sector identified themajor challenges the microfinance sector faced. These included, among others, anincrease in the default rate and consequently an increase in the risk portfolio, anda deterioration of the profitability of the sector and loss of confidence fromaffiliated members. According to BCEAO, the number of microfinance institutions(networks) in Mali decreased from 105 at the end of March 2017 to 85 at theend of March 2018 (excluding affiliated members of networks). On a sample of21 microfinance institutions representing about 90 percent of the sector, therewas a total of 472 service points for a total of CFA 100.3 billion (US$174.62million) outstanding credits and CFA 76.5 billion (US$133.18 million) in depositsfor a total of 1.136 million clients.10 The joining of Microcred in 2014 (of whichthe International Finance Corporation is a shareholder) helped mitigate themicrofinance crisis in Mali. Reforming the microfinance sector is part of theInternational Monetary Fund programme signed with the Mali Government, whichis currently being implemented.
Housing microfinance is very limited in Mali, with only one microfinance network,Nyesigiso, offering housing microfinance. Nyesigiso, in partnership with FGHM,provides mortgage loans for the acquisition of housing units on serviced sites (themaximum amount of these mortgages is CFA 20 million, or US$34 819, over upto 15 years) and construction loans for financing the construction of new housingunits, for up to CFA 3 million (US$5 223), payable over a maximum of36 months.11
The FGHM, created in 2000 to cover losses incurred by financial institutions inthe case of default by mortgagees, and to sustain home ownership for households,remains one of the strongest pillars of Mali housing policy. FGHM offers twoproducts: mortgage guarantee and social housing guarantee. This was a uniquehousing finance product in the WAEMU region, as it allows the institution to meetthe dual demand of covering the risks of default and enhancing the quality of theportfolio.
In February 2018, Mali launched its first Islamic bond or Sukuk, for a total of CFA150 billion (or US$261 million) over the period 2018-2025 at an annual interestrate of 6.25 percent. Part of the proceeds of the bond will finance thegovernment’s affordable housing programme.
Affordability While land and housing are not expensive by international standards, very lowincomes mean that formal housing is still unaffordable for a large proportion ofthe population. According to Office Malien de l’Habitat (OMH) data,12 thecheapest housing unit built by a developer in 2017 costs CFA 13 577 850 orUS$23 639 (including land costs). This house was built on a 200m2 plot, over59.62m2. This means that it cost on average US$396.49 per square meter to buildsuch a house. Prices in the capital city of Bamako are as high as double that ofother areas. However, in the provision of serviced plots, the focus is on plotscosting between CFA 1.5 million and CFA 2 million (between US$2 611 andUS$3 482) in cities all over the country. A standard galvanised iron sheet, oftenused in self-build initiatives, costs between CFA 3 000 (US$5.22) for a 4kg sheetand CFA 6 000 (US$10.44) for a 7kg sheet. The minimum acceptable size landplot is around 160m2.
Cement price continues to drop since the completion of several cement plantsaround the country (the Dio plant, the Diamou plant, the Astro plant, and theDiamond plant). Only five years ago, a ton of cement was sold at around CFA120 000 (US$208.92) or CFA 6 000 (US$10.44) for a bag of 50kg. As of June2018, the same 50kg bag of cement costs CFA 4 490 or US$7.82, a slight increasefrom the 2017 price. This follows the general downward trend in cement pricesin West Africa, with an increased interest from major investors in the region suchas West African Cement (WACEM), Dangote Cement, Lafarge and HeidelbergCement.
The average annual income as estimated by the per capita gross national income(Atlas Method) was at US$780 in 2017. The price of the cheapest housing unit istherefore about 29 times the annual per capita income. This justifies thegovernment’s emphasis on affordable housing and subsidy programmes to supportpeople to acquire housing. In the absence of regular household surveys (the mostrecent of which was undertaken in 2010), it is difficult to obtain accurateinformation on household income and expenditure patterns, including what kindof housing different households can afford.
Housing supplyA recent World Bank study estimated the need for housing in Mali at about 82 500units per year, 51 100 in urban areas and 31 400 in rural areas.13 In line withsimilar initiatives by his predecessors, the President of Mali launched an importanthousing programme in 2013, with the goal of delivering 50 000 affordable housingunits by the end of his term in 2018. The government’s strategy to achieve thisgoal is based on public private partnerships with major companies in the housingconstruction sub-sector. Several partnerships have been concluded with, amongother important actors, the Association des Promoteurs Immobiliers du Mali(Malian Association of Real Estate Developers), the Association Professionnelledes Banques et Etablissements Financiers du Mali, the Chinese company ChinaMachinery Engineering Corporation, and Palmer Energy and ConstructionCorporation, a US-based company. Several local banks, including Coris BankInternational, Ecobank-Mali, BMS, Banque Internationale Pour le Mali, Bank of Africa,Banque de Development du Mali, and Banque Nationale de DeveloppementAgricole, partnered with real estate developers to support the Presidential SocialHousing Programme. All this is spearheaded by OMH, one of the major playersin the public sector. Among other things, OMH: (i) administers the government’ssubsidy programme in partnership with the FGHM; (ii) negotiates and signs publicprivate partnerships with potential investors; (iii) manages the acquisition and salesof newly built housing units; (iv) ensures that government lands are serviced to

Africa Housing Finance Yearbook 2018
187
host housing development projects; and (v) administers the allocation of housingto potential beneficiaries so as to ensure transparency and fairness. TheGovernment increased the OHM budget by more than 200 percent between2016 and 2017 to support the supply of housing. The OMH budget more thandoubled for the year 2017 jumping from about CFA 23 billion (US$40.04 million)to CFA 73 billion (US$127.09 million) with the clear goal of getting as close aspossible to the 50 000 housing units target. However, only 12 566 housing unitswere delivered on the programme at the end of May 2018 due, among otherthings, to weak resource mobilisation to support the programme.
In April 2018, the Abu Dhabi Fund for Development signed a US$30 million loanagreement with the Mali Government to support its social housing programme.This is a significant development, as the signed agreement will bring much-neededresources into the sector. Indeed, the housing programme in Mali has beenthreatened by the government falling short of fulfilling its obligations towardspartner banks and developers that blocked the programme (by withholding thekeys of complete housing units) for a few months before an agreement was found,to release the 12 566 completed units. Likewise, Shelter Afrique promised inFebruary this year a US$100 million investment in the housing programme forthe coming years.
Despite tremendous efforts by the government to provide housing to itspopulation, self-construction remains the main means of housing supply. A 2011Shelter Afrique study on the real estate sector in Mali estimated that almost75 percent of the housing supply in the country constituted self-constructed units.Self-construction involves two approaches: simple self-construction and assistedself-construction, the latter involving direct technical assistance from the MalianHousing Office, available only to housing cooperatives.
Property markets In Mali, most land is owned by the government (mainly central); however, manyindividuals claim ownership without proper land titles. To secure the propertymarket, the government is progressively putting in place a national cadastre,focusing first on urban areas and regional capitals. Mali has put in place aPermanent Secretariat for Domain and Land Reform, a new institution under theMinistère du Domaine de l’Etat et des Affaires Foncières to spearhead land reformand lead the development of a national cadastre. The first phase covers sixcommunes of the Bamako District and eight communes of the Kati circle.
Despite these challenges, property markets function somehow in Mali, with theOMH, BMS and a few small private real estate developers as the main actors.Developers and banks also serve in the role of real estate agents. Developersagree to sell all completed housing units to the OMH, which in turn sells them tohouseholds under leasing or direct purchase contracts. BHM and a few othercommercial banks, as well as the microfinance network Nyesigiso, provide housingloans or mortgages up to CFA 20 million (US$34 820) over a 20-year term at anaverage interest rate of about 10 percent a year. The loans are then guaranteed
by FMGH. A down-payment of 30 percent of the purchase price is required byBHM, which then finances the remaining 70 percent with a mortgage.
Difficulties remain that hinder the efficient functioning of Mali’s property markets,despite significant efforts by the government. According to the World Bank’s 2018Doing Business Report, obtaining construction permits involves 13 procedures,takes 124 days and costs 6.2 percent of the property value. This places Mali in134th place out of 190 countries, eight places up from its 2017 ranking. On theregistering property indicator, Mali ranked 137 out of 188 countries in 2018, twoplaces down compared to 2017. Indeed, it still takes five procedures and 29 days,and costs 11.1 percent of the property value to register a property. Also, thequality of the land administration index remains low at 8 on a 0-30 scale, despitethe significant land administration reform launched since 2016, which led to thecreation of a separate Directorate for Public Land Administration and aDirectorate for the National Cadaster. This is part of efforts undertaken by theMalian Government to modernise land administration. At the end of 2017, a totalof 149 391 out of 151 551 available property titles were digitalised.14 In addition,all land archives from the Bamako District and the Kati Circle were successfullymoved to a modernised archive room as of the end of 2017.
To face the demand for housing, especially in urban areas, a rental market isdeveloping around big agglomerations such as Bamako (where 37 percent ofhouseholds are renters) and other secondary cities where the housing demand ishigh. It is estimated that 34 percent of urban dwellers rent their housing units.Aggressive housing policy implementation has slowed down the development ofinformal settlements, which was as high as 65 percent in 2002.15
It is also worth noting that a few websites developed by small real estate operatorsoften advertise and try to maintain up-to-date opportunities for selling or buyingproperties, mostly around Bamako and other urban centers.
Policy and regulation Mali adopted its National Housing Strategy in 1995, and this continues to be themain framework under which all housing interventions are pursued. The goal ofthis strategy is to improve living conditions throughout the country by promotingaccess to decent housing for people with low and intermediate incomes. In linewith this, the government created several institutions to facilitate access to housing,such as the OMH, the Mali Housing Agency created in 1996, and more recentlythe Land Registry Department and the State Property Department for landadministration. The agency is the main facilitator of relationships between differentactors in the sector, and is active in supplying serviced land for housing, promotingthe use of local building materials, participating in financial operations (whichincludes having a shareholding in the BMS and the FGHM) and subsidising theinterest rate on loans for eligible mortgage applicants, mostly members of housingcooperatives.
Source https://www.cgidd.com/
PPP$40 001 – PPP$10 000 000
PPP$23 001 – PPP$40 000
PPP$12 001 – PPP$23 000
PPP$8 001 – PPP$12 000
PPP$5 001 – PPP$8 000
PPP$3 601 – PPP$5 000
PPP$2 401 – PPP$3 600
PPP$1 601 – PPP$2 400
PPP$801 – PPP$1 600
<PPP$800
MALI
Annual income profile for rural and urban households based on consumption (PPP$)
No. of households (thousands)
PPP$14 233
PPP$54 138
Rural Urban600 400 200 0 200 400 600
Population: 18 541 980
Urbanisation rate: 4.84%
Cost of cheapestnewly built house:
13 577 850 XOFPPP$62 571
Urban householdsthat could afford thishouse with finance:
2.33%
1 PPP$: 217 CFA franc
- - - Average annual household income needed for the cheapest newly built house by a formal developer, 2017 Average annual household income using expenditure, 2017 (PPP$)

188
Members of housing cooperatives benefit from a subsidised interest rate rangingfrom 7 to 11 percent depending on the monthly income of the eligible applicant.Besides this, individual housing cooperative members with monthly incomes lowerthan CFA 75 000 (US$ 130.57) and CFA 100 000 (US$ 174.10) benefit from anextra subsidy comprising a three-point and two-point reduction, respectively, ontheir mortgage interest rates for the first five years of the mortgage. The Maliangovernment’s housing subsidy programme is implemented through the OMH.
The Banque de l’Habitat du Mali (BHM) no longer exists, as it has been absorbedby the Banque Malienne de Solidarité in 2016 because of poor performance. Thegovernment has also taken a number of other measures to facilitate housing supply.The regulatory framework for the housing sector in Mali is one of the mostcomprehensive in the WAEMU region, including a law on condominiums (Law 01-106 of 10 December 2001), a law governing property development (Law 99-40of 10 August 1999) and a law on housing finance (Law 01-105 of 10 December2001). These measures have increased the number of local real estate developersoperating in the housing market and the number of housing cooperatives.
Land administration is improving significantly, with the launching of the nationalcadastre project, and the enactment of the separation of the Land RegistryDepartment (Executive Order No. 2017-024/P-RM of 30 March 2017) and theState Property Directorate (Executive Order No.2017-025/P-RM of 30 March2017). Besides this, to ensure improved land titling management and reduce landdisputes, the government has deployed new software for the management ofurban housing concessions (Concessions Urbaines d’Habitation – CUH) and ruralhousing concessions (Concessions Rurales d’Habitation – CRH) to 12 specialisedoffices of Private Land and State Property Administration.16 Expansion of this willcontinue as the development of the national cadastre expands.
In June 2015, the Parliament of Mali voted a new law on Credit Reference Bureausin compliance with the WAEMU directives on the matter. This is a keydevelopment for the housing sector as it will enhance the credit environment inMali.
Opportunities Malian authorities at the highest level have made the provision of affordablehousing a top priority of their political and social agenda, as shown by differentpolicy and laws voted to govern the housing sector, and the commitment of thePresidential Social Housing Programme to provide 50 000 housing units in fiveyears. Along with Senegal and Cote-d’Ivoire, the Malian housing sector is one ofthe most vibrant of the WAEMU region. Mali is also working on improving itsland administration through the development of a national cadaster, andstrengthening property rights enforcement, through new institutions. Likewise,regional projects such as the US$150 million International DevelopmentAssociation-funded Affordable Housing Finance Project, will ease access to housingfinance for low income and informal sector workers, to enable them to accessproperty. The most recent available data estimated the housing needs in Mali atabout 82 500 units per year, of which 51 100 is for urban areas and 31 400 is forrural areas. This is in line with the government ambition of providing 50 000housing units over the period 2013-2018. The government programme has raisedthe interest of several investors in the housing construction sector in Mali.However, there is still a lot of room, at least for the coming years, for newcomers,to meet housing demand in Mali. Housing supply is currently influenced by the
government, which is active in contracting public private partnerships to that end,the goal being the promotion of house ownership, mainly affordable housing, giventhe low level of income in the country. Experience from the past few years clearlyshowed that national capacities to meet the needs for housing construction arelimited, which leaves room for new developers to come in. Despite a strongpolitical will, the government’s housing programme has delivered less than 13 000housing units over the past five years. During his second term, President IbrahimBoubacar Keita has already committed to continue supporting the provision ofsocial housing. Opportunities also exist in the rental segment of housing, especiallyin urban areas where four inhabitants out of 10 are in the market for rentals.
Additional sourcesAfDB, OECD, UNDP and UNECA (2017). African Economic Outlook 2017.Country Note Mali. Abidjan, June 2017.
AfDB (2018). African Economic Outlook 2018. Abidjan, June 2018.
Droit Afrique. Mali Code domanial et foncier - Ordonnance n°00-027 du 22mars 2000. http://www.droit-afrique.com/upload/doc/mali/Mali-Code-2000-domanial-et-foncier-MAJ-2002.pdf (Accessed 10 September 2018).
Gouvernement du Mali (1995). Ministère de l'Urbanisme et de l'Habitat.Stratégie Nationale du Logement. Bamako: 1995.
Gouvernement du Mali (2009). Ministère du Logement, des Affaires Foncièreset de l'Urbanisme. Note sur le marché du logement au Mali. Bamako, Aout2009.
INSTAT-Mali (2018). Prix Moyen de Vente et Indice des Matériaux et Produitsde Construction à Bamako (Bâtiment avec Couverture en Dalle BA). Mois dejuin 2018. Bamako. INSTAT-Mali. Juillet 2018. http://www.instat-mali.org/contenu/pub/imc0618_pub.pdf (Accessed 19 August 2018).
Shelter Afrique (2011). Etude sur le Secteur de l'Immobilier au Mali: Nairobi,2011.
UMOA (2016). Rapport Annuel de la Commission Bancaire 2016. Abidjan,Décembre 2016. https://www.bceao.int/sites/default/files/2018-05/rapport_annuel_com_ban_umoa_2016_internet.pdf (Accessed 20 August2018).
United Nations, Department of Economic and Social Affairs, Population Division(2017). World Population Prospects: The 2017 Revision, custom data acquiredvia website. https://esa.un.org/unpd/wpp/ (Accessed 19 August 2018).
World Bank (2018). Doing Business 2018: Reforming to Create Jobs.Washington, DC: World Bank.
World Bank (2018). World Development Indicators 2017. Mali Data: 2017.https://data.worldbank.org/country/mali (Accessed 19 August 2018).
World Bank (2018). Macro Poverty Analysis Outlook 2018. Sub-Saharan AfricaCountry-by-Country Analysis and Projection for the Developing World.Washington, DC: World Bank
Websiteshttps://www.bceao.inthttp://www.nyesigiso-mali.org/https://landportal.info
1 United Nations, Department of Economic and Social Affairs, Population Division (2017). 2 World Bank (2017). World Development Indicators: Mali Data 2017.3 World Bank (2018) http://pubdocs.worldbank.org/en/720441492455091991/mpo-ssa.pdf (Accessed 20 August
2018).4 World Bank (2018). “The World Bank in Mali”. http://www.worldbank.org/en/country/mali/overview (Accessed
20 August 2018).5 BCEAO (2018). “Paysage bancaire au 30 juin 2018”. https://www.bceao.int/fr/content/paysage-bancaire
(Accessed 20 August 2018).6 All conversion of CFA Francs to US$ are based on the conversion rate of US$ 1 = CFA Francs 574.39, as of 20
August, 2018 on http://coinmill.com/7 BCEAO (2018). Annuaire Des Banques et Etablissements Financiers De L’UMOA 2017.
https://www.bceao.int/sites/default/files/2018-08/Annuaire%20des%20banques%20et%20%C3%A9tablissements%20financiers%20de%20l%27UMOA%202017.pdf (Accessed 20 August 2018). Also author’s compilations and calculations.
8 UMOA (2017). Rapport Annuel de la Commission Bancaire 2016. https://www.bceao.int/sites/default/files/2018-05/rapport_annuel_com_ban_umoa_2016_internet.pdf (Accessed 20 August 2018). Pg.151.
0 BCEAO (2014). Note d’analyse sur les conditions de financement bancaire de l’habitat dans les pays del’UEMOA. October 2014. https://www.bceao.int/sites/default/files/2017-11/3note_d_analyse_sur_les_conditions_de_financement_bancaire_de_l_habitat_dans_les_pays_de_l_uemoa.pdf
10 BCEAO (2018). Principaux Indicateurs des SFD de l’UMOA au 31 mars 2018.https://www.bceao.int/sites/default/files/2018-07/Indicateurs%20au%2031%20mars%202018-4.pdf (Accessed 20August 2018).
11 Nyesigiso. “Nyesigiso: Une reference en matiere d’epargne et de credit au Mali: Services Aux Particuliers”.http://www.nyesigiso-mali.org/tab_produit.php (Accessed 9 Sept 2018).
12 Conversation with an Office Malien de l’Habitat (OMH) official on 22 July 2018.13 World Bank Finance and Markets Global Practice (2016). Financial Sector Assessment Programe – Development
Module – Mali. The Banking System and Credit to the Economy: Technical Note, December 2015.http://documents.worldbank.org/curated/en/894621467999119269/pdf/105294-FSAP-P153363-PUBLIC-Mali-FSAPDM-TN-Banking-Public.pdf (Accessed 19 August 2018).
14 Gouvernement du Mali (2018). Rapport Annuel D’Evaluation De La Mise En Oeuvre Du Prem – 2017.February 2018. http://carfip.finances.gouv.ml/files/Rapport_Execution_PREM_AU_31-12-2017_VF.pdf (Accessed19 August 2018).
15 According to the director of OMH Mali during a presentation at a Shelter Afrique symposium on affordablerental housing in Mali, in May 2015.
16 These are decentralized offices of the Land Registry Department and the State Property Directorate.

Africa Housing Finance Yearbook 2018
189
for expanding borrower coverage in the credit registry. With the support of theWorld Bank and African Development Bank, the country continues to use theaction plan that focuses on clearer property rights; simpler administrativeprocedures and taxation; streamlined investor protection; and an updated judicialsystem.
Access to financeMauritania has established a roadmap to preserve financial stability for the financialsector in line with the IMF’s Financial Sector Assessment Program to deepen thefinancial markets. This is in accordance with existing strategies to commence risk-based bank supervision with actions to improve on the regulatory framework. In2014, Mauritania attempted via a charter to implement a stock exchange. To date,the efforts have proven fruitless as there is no stocks and bonds market.Mauritanians generally rely on commercial bank loans for credit. Recently, there
OverviewMauritania is classified as a lower middle income country with an economydominated by natural resources and agriculture. The country connects theMaghreb region and Sub-Sahara Africa with a population mainly dependent onagriculture and livestock. Despite its relatively low GDP, the country’s mineralresources include iron ore, gold, copper and phosphate rock. According to theIMF country report, Mauritania’s economy continues to recover at three percentprojected growth for 2018.1 On average, inflation is slated to remain moderateat 2.7 percent with the current account deficit contracting due to a surge in miningand fishing exports. Mauritania plans to enhance its strategies to fight corruption,improve the business environment as well as ensure financial sector reforms withsound fiscal policy and a judicious borrowing strategy.
Mauritania is highly urbanised with 53.7 percent of its population concentrated inurban areas. The capital city, Nouakchot, hosts 37.6 percent of the urbanpopulation. The rate of urbanisation was at 4.28 percent in 2018 according tothe World Fact Book.2 Initially planned and built as an administrative capital in1958 for fewer than 15 000 people, Nouakchott now has a population of overone million. As more people moved to the urban areas, the nomadic lifestyle thatwas prevalent before this period decreased extensively to approximately sevenpercent of the population, posing capacity challenges at the local government levelfor city planning, economic integration, and the provision of basic services andinfrastructure. Approximately a quarter of the urban population is connected toelectricity, half to water, and only a small fraction to sanitation networks.
Mauritania has a population of 4.4 million and a Human Development Index of0.513 with a ranking of 157.3 The GNI per capita growth was 2.04 in 2017 andis projected at 3.1 percent for 2018 and 3.9 percent for 2019. This is indicativethat Mauritania is a relatively poor country and still has high levels of incomeinequality. Unemployment rates in Mauritania are estimated at 10.2 percent as atDecember 2017 with youth unemployment higher at 18.57 percent. Youthconstitute 60 percent of the population. In Mauritania, 31 percent of thepopulation live in relative poverty and 16.6 percent of the population is living inextreme poverty mostly in rural areas.4
Mauritania continues to improve its ranking in the World Bank’s Doing Businessat 150 out of 190 countries, gaining 10 ranks from the previous year.5 This ismainly due to the consistent elimination of the minimum capital requirements and
Mauritania
REPUBLIQUE ISLAMIQUE
DEMA
URITANIE
KEY FIGURES
Main urban centresNoukchottNouadhibou
Exchange rate: 1 US$ = [a] 9 Jul 2018PPP Exchange rate (Local currency/PPP$) 1 Ouguiya = [b]Inflation 2016 [c] | Inflation 2017 [c] | Inflation 2018 [d]
355.52 Ouguiya 102.901.50 | 2.30 | 3.30
Population [e] | Urban population size [e] Population growth rate [e] | Urbanisation rate [e]Percentage of the total population below National Poverty Line [f]Unemployment rate [d]
4 568 285 | 685 9382.17% | 3.20%40.50%11.80%
GDP (Current US$) 2017 [g] | GDP growth rate annual 2017 [d]GDP per capita (Current US$) 2017 [g]GNI per capita (Current US$) 2017 [b]Gini co-efficient 2016 [b]HDI global ranking 2017 [h] | HDI country index score 2017 [h]
US$5 440 million | 3.1%US$1 370US$1 10040.50159 | 0.520
Is there a deeds registry? Number of residential properties that have a title deed Lending interest rate [d] Mortgage interest rate | Mortgage term (years)DownpaymentMortgage book as a percentage of the GDPEstimated number of mortgages Price to Rent Ratio in City Centre | Outside City Centre Gross Rental Yield in City Centre | Outside City Centre Construction as a % of GDP
Yes27 0009.00%8% | 1035.00%n/an/an/a | n/an/a | n/an/a
What is the cost of standard 50kg bag of cement? What is the price of the cheapest, newly built house by a formaldeveloper or contractor? (Local currency)What is the price of the cheapest, newly built house by a formaldeveloper or contractor? (US$) What is the size of this house (m2)? What is the average rental price for this unit (US$)? What is the minimum stand or plot size for residential property?
US$7.74
10 371 229 Ouguiya
US$29 172120m2
n/an/a
Ease of Doing Business Rank [i]Number of procedures to register property [i]Time to register property (days) [i]Cost to register property (as % of property value) [i]
150449 days4.60%
NB: Figures are for 2018 unless stated otherwise.
[a] Coinmill.com[b] World Bank World Development Indicators[c] Knoema.com[d] Trading Economics[e] Worldometers[f] Indexmundi[g] IMF World Economic Outlook Database[h] Countryeconomy.com[i] World Bank Doing Business

190
has been a rise of microfinance institutions that offer mostly short-term loans withhigh interest rates. Access to housing finance in Mauritania through the formalbanking system is still exceptionally difficult as financial services are not accessibleto the majority of the population as most of the citizens are informally employedand remain either unbanked or underbanked.6 Only 17 percent of the populationis included in the formal economy. Although the World Bank cites access to financeas the top constraint to the Mauritanian private sector, the IMF country reportfor the Extended Credit Facility Arrangement on Mauritania in March 2018 showsthere are signs of improvement to the economy through sizable policy adjustmentson finance. Cash is the most common means of payment in the domesticeconomy. Lending to both the private sector and individual households continuesto be low, while limited access to credit and high costs of financing constrainentrepreneurial activity.
Business regulatory reforms have made it considerably easier to do business inthe country. The World Bank’s 2018 Doing Business Report’s ‘ease of getting credit’category ranking decreased two points from 157 to 159. The credit registrycoverage for Mauritania’s adult population has increased from 6.6 percent in 2017to 7.1 percent. Ordinarily, agglomeration yields visible positive effects, however, inMauritania these are few due to a fragmented, shallow and extremely informalcredit market. Urban centres are characterised by informality, poor infrastructure,and poor service coverage, self-employment and weak human capital –characteristics which are neither favourable for attracting the private sector toinvest nor for creating an enabling environment for the development of higher-productivity services and tertiary sectors. Although the government promotesprivatisation to attract foreign investment, the World Bank noted that access tofinance remains a drawback to investing in Mauritania.
The number of banking institutions remains unchanged with 25 national andforeign banks operating in Mauritania, even though only some 15 percent of thepopulation holds bank accounts.7 In May 2018, Attijari Bank launched its firstdigital/mobile bank as an initiative to innovate and diversify banking productscurrently available in the market. Attijari Bank is said to have 40 branches and8 000 customers in its portfolio.8 In 2018, there were 21 registered microfinanceinstitutions; two specialised financial institutions: Caisse de Dépôts et deDéveloppement, a public development bank created in 2011 with special legalstatus, and Finance, Conseils, et Investissement; two pension funds; 12 insurancecompanies; two active microfinance networks, the largest Agence de Promotiondes Caisses Populaires d’Epargne et de Crédit with 51 offices, and Oasis Mutualand Investment Credit; and 32 exchange bureaus. These institutions operate underthe purview of the Central Bank of Mauritania.
The sector remains underdeveloped with more than 80 percent of the financialsector’s assets held by commercial banks. Due to fiscal and external trends at theend of 2017, the IMF estimated the debt-to-service ratio to be at 14.7 percent.Although the banking system seems well-capitalised overall, some banks are stillnot meeting the minimum capital requirement and are under-provisioned. Assetquality remains weak.9 Increased non-performing loans (NPLs) naturally leadbanks to lend less credit. In March 2018, Mauritania drafted a law on loan recovery“aimed at improving mechanisms for credit recovery and enforcement of collateralby banks.”10 The draft law, which is currently sitting with parliament, will facilitatethe removal of NPLs from bank balance sheets. With Mauritania’s alreadychronically low mortgage lending rates, a decrease in NPLs will inadvertentlypromote credit for housing finance.
Mauritania still has an extremely small mortgage market with no specialist housinglending banks, essentially new limiting instruments to facilitate the financing ofhousing. According to the 2014 Financial Sector Assessment Program, Mauritanialacks vital instruments such as a housing loans fund; a housing loans refinancingfund; long-term housing loans with periodically re-negotiable rates that minimiseinterest rate risks due to a mismatch between assets and liabilities; housing savingsplans that provide stable resources; and microcredit for housing. CAPECs haveundertaken limited operations in financing housing.
The Central Bank of Mauritania continues to strengthen its regulatory frameworkand supervision capacity to support the continued development and stability ofthe financial system. However, opening branches outside the main urban centresof Nouakchott and Nouadhibou has not encouraged an increase in the use of
banking services. The World Bank’s 2018 Ease of Doing Business Report indicatesthat there are no private bureaus and only 7.1 percent of adults are registered ona public credit registry. Household credit was at 38 percent in June 2016 anddominated by credit to the private sector. The effectiveness of mortgages hasbeen hampered by banks’ lack of diligence in registering mortgages, given highregistration fees. In response, the authorities reduced the registration fees in 2006.
AffordabilityThere are two main types of housing. First, substandard dwellings (tents, shacks/huts, baraques and m’bar) representing 32.5 percent of all housing and second,formal dwellings comprising the remaining 67.5 percent. Since independence, thegovernment has placed enormous emphasis on housing development and theeradication of slums, making homeownership relatively high despite the highincidence of poverty.
The Urban Development Project aims to combat poverty in precarioussettlements in Nouakchott and Nouadhibou, combining access to housing, accessto credit, vocational training, and local development. It was launched in outlyingsettlements and land parcels around Nouakchott and enabled long-term residentsof city slums to move to an improved urban environment on rationalised plotpatterns with registered land titles in a test environment. The results of this projectwere as follows: outcomes were satisfactory, risk to development outcome wasmoderate, bank performance was satisfactory, and borrower performance wassatisfactory.
Certain lessons learned include that the project method is not the most efficientway for workable capacity building. Developing local governmental capacitiesneeds a national programme, based on sustainable resources and strong politicalcommitment that ultimately will be reinforced by donors. The project revealedthe viability and sustainability of microcredit operations for creating incomeactivities in Mauritania. Slum upgrading has limitations when there is a lack ofestablished appropriate regulatory frameworks for land development in an urbanenvironment.
Accommodation is the one of the most expensive items of householdexpenditure. The average one-bedroom flat in the city centre costs approximatelyMRO90 000 and MRO80 000 outside the city.11
Mauritania’s GNI is very low at US$1 120, and remains higher than its GDP,suggesting more foreign investments within the country than external investments,making it unlikely that most Mauritanians would be able to afford these properties.
Housing supplyThe Mauritanian housing sector remains largely unchanged since 1975 when thegovernment introduced regulations, which included persuading governmentemployees to purchase their own property to reduce the demand for publichousing and attract developers to start work on private development.Construction remains a relatively small portion of GDP, and is included in theindustry category in the World Bank indicators.12 However, it is difficult toextrapolate the exact percentage from the latest available figures. Housingresources are strained, and a large percentage of the urban population lives insubstandard housing, such as tents, huts, or shacks. Self-construction has thereforecontinued to be the main method of building houses in Mauritania.
At present, the top end of the residential development market is wholly local andstill dominated by the ad hoc construction of buildings for owner-occupation orleasing mainly to the expat market in Tevragh Zeina. Many diplomatic staff arehoused in accommodation that has been built within embassy compounds.13
A low cost housing microcredit system was instituted under PDU, the UrbanDevelopment Project, which helped to produce 5 000 housing units in Nouakchottand Nouadhibou. The determination of the government authorities to clearsquatter settlements and offer people more decent housing led to thedevelopment and implementation of neighbourhood-based integratedrestructuring programmes. The first of these between 2003 and 2007 was a pilotin El Mina. Subsequently, government opted for a more affordable, participatoryapproach to rehabilitate the other informal settlements of Nouakchott andNouadhibou. This entailed engaging with representatives in awareness raising and

Africa Housing Finance Yearbook 2018
191
information sharing as well as a broad enumeration of households. Theprogramme has been successful in both the Arafat and Hay Saken informalsettlements.
The kebbe and the gazra, the two types of informal housing still prevalent in theurban areas, were initially the result of spontaneous settlements; yet they are stillstanding, and similar construction continues.14 Government efforts to eliminatethe problem of informal settlements have not yielded the desired results. To fightagainst the proliferation of slums, the Mauritanian government implemented policyevictions, which were a scheme or plan to evict squatters in the early 1980s.However, with the spread of kebbes, politicians still prefer to preserve social peaceand consider more consensual solutions. Despite these efforts, high levels ofmistrust between government officials and informal sector dwellers remain.
In 2017, external investment into the property market appeared to bematerialising and, according to the Middle East Monitor, Qatari-funded housingprojects were being developed in the municipality of Jadir Al-Mahkan in thesouthern state of Tarrza consisting of 100 housing units.15 The project wassuspended due to the accusation of Qatar supporting terrorism. No furtherinformation appears to be available about the project.
Property marketsArticle 15 of Mauritania’s 1991 constitution guarantees private property and the2012 Investments Code, which was reformed in 2016, further outlining theprotection of private property rights. The 1983 Law on land Tenure which wasclarified in a decree in 2000 in terms of its concrete application regulates landproperty in Mauritania. However, it is important to note there are still inefficienciesin the judicial capacity to settle land disputes, given the challenge in accessing andregistering land. According to the World Bank, Mauritania has made great stridesin addressing these challenges with more transparent systems. This makespurchase or leasing of land less precarious as the ambiguity between state andcustomary land laws gets restructured.
Private property is one of the most politically critical and perilous aspects ofMauritania where the majority of the population lives in rural areas, as well as onpartly-registered on non-registered land in urban areas. Information on propertyrights continues to be mixed, with cases of state agents attributing plots of land toindividuals not related to settlement programmes as well the fact that threeagencies are in charge of land designation with overlapping responsibilities: theMinistry of Housing, Urbanisation and Planning (responsible for land management),the Ministry of Finance (responsible for land allocation), and the Agency for UrbanDevelopment.16
Recently, Mauritania launched a land registry website that provides details onregistry services such as property transfer regulations, procedures and fees as wellas other pertinent information to the public. Previously, the lack of cadastralinformation and cumbersome legal procedures hampered the transfer of property
titles to Mauritanians. The digital registry was established in 2015 by the Ministryof Economy to provide more transparent land allocation. The Land RegistryAgency within the Ministry of Habitat maintains all information regarding propertytitles, mortgages and other tax related matters. Due diligence is performed priorto the final title transfer to register a property. Owners require a notarised saleagreement and a title certificate.17 According to the World Bank’s Ease of DoingBusiness 2018 data, Mauritania is ranked 98 of 190 countries for registering aproperty. The process requires four procedures, takes 49 days to complete thetransfer of property, and costs 4.6 percent of the property value.
The latest available data from the Directorate of Land and State Assets is from2016, which indicated that there was a total of 27 075 official deeds registered, ofwhich 27 003 were in urban areas and 72 in rural areas. Of the 27 075 deeds,92 percent were titled to men and eight percent to women. In terms of overallhousing, there were 38 574 occupancy permits listed implying that the rentalmarket has about 11 499 units making it 29 percent of the market. It waspreviously estimated that the city of Nouakchott had more than 500 000provisional property deeds which were delayed in titling due to previousinstitutional overlap of jurisdictions.18 This information remains unchanged withno new information available.
Policy and regulationThe policy and regulation framework in Mauritania has been improving in thehousing finance sector, as risk associated with the lack of solid and unequivocallaws has been lowered due to increased transparency of information. Changescontinue to be made to improve this, but the pace is not sufficiently swift toaddress the policy dichotomies. In 2018, Mauritania made starting a business easierby combining multiple registration procedures. To become an owner in Mauritaniaone must obtain permission to occupy the land by hakems (officials). The publicoften regards this licence as a property right in itself; however, it has no final legalvalue. It is issued against the price of land and the cost of demarcation. From thispoint, the beneficiary has two years to build (according to planning regulations)before claiming the outright ownership. This process is complex and slow. Manyincidents of abuses, illegal occupation, land speculation and issuing of fraudulenttitle by hakems have been reported. In 2018, Mauritania made it easier to enforcecontracts with the introduction of court automation, which allows for electronicpayments to the courts as well as electronic publications of cases and judgements.
The rapid urbanisation that followed the droughts of the 1970s outstripped theability of government to manage urban growth and the provision of housing. Someinstitutional mechanisms aimed at liberalising and promoting the sector togethercreate a loose policy framework. Property-based local revenues are minimal andfurther hamper the ability of local governments to provide basic infrastructure,particularly to the informal settlements on the urban fringe where most of theurban growth is concentrated. The main policy and regulation frameworksgoverning the housing sector include:
PPP$40 001 – PPP$10 000 000
PPP$23 001 – PPP$40 000
PPP$12 001 – PPP$23 000
PPP$8 001 – PPP$12 000
PPP$5 001 – PPP$8 000
PPP$3 601 – PPP$5 000
PPP$2 401 – PPP$3 600
PPP$1 601 – PPP$2 400
PPP$801 – PPP$1 600
<PPP$800
- - - Average annual household income needed for the cheapest newly built house by a formal developer, 2017 Average annual household income using expenditure, 2017 (PPP$)
MAURITANIA
Annual income profile for rural and urban households based on consumption (PPP$)
No. of households (thousands)
PPP$13 368
PPP$38 153
Rural Urban150 100 50 0 50 100 150
Population: 4 568 285
Urbanisation rate: 3.20%
Cost of cheapestnewly built house:
10 371 229 MROPPP$100 789
Urban householdsthat could afford thishouse with finance:
2.89%
1 PPP$: 102.9 Ouguiya
Source https://www.cgidd.com/

192
n Mauritania Constitution of 1991 – Article 15 provides that the right toproperty is guaranteed; however, the law may limit the scope of the exerciseof private property if the requirements of economic and social developmentrequire this;
n Land Code, ordinance 83-127 of 5 June 1983 – Article 2 “The Staterecognises and guarantees private ownership of land which in accordancewith Sharia contribute to economic and social development of the country”;
n Law No. 99-031 of 20 July 1990, as amended by Law No 2005-08 of30 January 2005, and its implementing texts – established real estatedevelopment in the country; and
n World Bank/International Monetary Fund’s Poverty Reduction Strategy PaperIII (2011-2015) action plan – Part of this programme aims to improve livingconditions by making decent low cost housing available and providing properamenities and infrastructure. The approach has focused mainly on: 1) adoptingand implementing a national housing strategy; 2) significantly increasing thesupply of housing; 3) encouraging real estate development, with a view toquickly providing a diverse supply of dwellings at a cost that is accessible tohouseholds; 4) continuing and expanding the Twizé low cost housingprogramme to the major urban areas; and 5) implementing a system forfinancing housing taking into account the needs of households, as well as thoseof real estate developers.
Mauritania Constitution of 1991 Article 15 – provides that the right to propertyis guaranteed; however the law may limit the scope of the exercise of privateproperty if the requirements of economic and social development require this;
OpportunitiesMauritania continues to be one of the top 10 reformers worldwide in the WorldBank’s Doing Business ranking. There is opportunity to continue strengtheningstructural reforms to promote improved property rights and streamline investorprotection with support from the World Bank and the African Development Bank.Mauritania has recently experienced growing revenues from the mineral resourcessector, which should have a positive impact on the availability of credit tohouseholds, and promote investment opportunities in the financing of housing ifthese revenues can be redirected to investment that assists in diversifying theeconomy.
Historically, Mauritania has been relatively open to foreign direct investment (FDI).High-level government officials in Mauritania remain diligent about their objectivesto improve the business climate in order to attract more FDI, particularly fromWestern countries. There is no law prohibiting or limiting foreign investment,which can target any sector of the economy. There are no laws or regulationsspecifically authorising private firms to adopt articles of incorporation orassociation, which limit or prohibit foreign investment, participation, or control.There are no other practices by private firms to restrict foreign investment.
Furthermore, there are always opportunities for both the public and privatesectors to strengthen the development of housing finance and increase its supply.Efforts should continue to be targeted towards establishing refinancing andguarantee mechanisms and creating new products, such as housing savings plans,long-term mortgages and renegotiable mortgage products. The major players inthis case would be commercials banks venturing into developing building societiesthat will support individual housing loans as well as favourable loan terms forconstruction companies. These would complement those recommended by theWorld Bank’s Country Partnership Strategy for the government to explore thefeasibility of establishing: 1) a loans recovery company and/or a mortgaged realproperty management company; 2) a mortgage refinancing fund; and 3) amortgage guarantee fund.19
SourcesInternational Monitory Fund (2013). Islamic Republic of Mauritania: PovertyReduction Strategy Paper.http://www.imf.org/external/pubs/ft/scr/2013/cr13189.pdf. (Accessed 3 August2018).
Banque Populaire de Mauritanie (2018). Tamouil Seken.http://www.bpm.mr/En/tamouil-seken_11_258. (Accessed 18 July 2018).
Demirguc-Kunt, A. et al (2014). The Global Findex Database 2014: MeasuringFinancial Inclusion around the World. Policy Research Working Paper 7255.http://documents.worldbank.org/curated/en/187761468179367706/pdf/WPS7255.pdf. (Accessed 3 August 2018).
Global Finance Magazine (2017). Mauritania GDP and Economic Data CountryReport 2017. https://www.gfmag.com/global-data/country-data/mauritania-gdp-country-report. (Accessed 18 July 2018).
IECONOMICS (2018). Mauritania - Interest Rate.https://ieconomics.com/mauritania-interest-rate. (Accessed 18 July 2018).
UN Habitat (2017). Habitat Worldmap: Mauritania. http://habitat-worldmap.org/es/pais/africa/mauritania/#HOUSING-MARKET. (Accessed 18 July 2018).
Wabha,S. (2002). The evolution and impact of shelter and poverty alleviationstrategies in marginalized settlements in Nouakchott, Mauritania. PhD Thesis.Harvard University.
The World Bank (2014). Financial Inclusion Data / Global Findex Mauritania.http://datatopics.worldbank.org/financialinclusion/country/mauritania. (Accessed18 July 2018).
World Bank (2018). Ease of Doing Business in Mauritania.http://www.doingbusiness.org/data/exploreeconomies/mauritania/registering-property. (Accessed 18 July 2018).
Worldometers (2018). Mauritania. http://www.worldometers.info/world-population/mauritania-population/. (Accessed 18 July 2018).
1 International Monetary Fund (IMF) (2018). Islamic Republic of Mauritania: First Review Under the Extended Credit Facility Arrangement-Press Release; and Staff Report. County Report, No. 18/137. http://www.imf.org/en/publications/cr/issues/2018/05/30/islamic-republic-of-mauritania-first-review-under-the-extended-credit-facility-arrangement-45917 (Accessed 17 June 2018).2 Central Intelligence Agency (2018). The World Fact Book, Mauritania. https://www.cia.gov/library/publications/the-world-factbook/geos/mr.html (Accessed 25 July 2018).3 Human Development Reports (2018). Mauritania 2018. http://hdr.undp.org/en/countries/profiles/MRT (Accessed June 23 2018). 4 World Bank Group (2018). World Development Indicators (2018). https://data.worldbank.org/country/mauritania (Accessed 29 June 2018).5 World Bank (2018). Doing Business Report: Mauritania. http://www.doingbusiness.org/reports/global-reports/~/media/WBG/DoingBusiness/documents/profiles/country/MRT.pdf (Accessed 3 August 2018).6 Bertelsmann Stiftung (2018). BTI 2018 Country Report – Mauritania. http://www.bti-project.org/fileadmin/files/BTI/Downloads/Reports/2018/pdf/BTI_2018_Mauritania.pdf (Accessed 3 August 2018). 7 Bureau of Economic and Business Affairs (2017) Investment Climate Statements for 2017: Mauritania. http://www.state.gov/e/eb/rls/othr/ics/investmentclimatestatements/index.htm?year=2017&dlid=269757 (Accessed June 20 2018). 8 Financial Afrik (2018). Mauritania Attijari bank launches its first digital bank. https://en.financialafrik.com/2018/05/01/mauritania-attijari-bank-launches-its-first-digital-bank/ (Accessed 20 June 2018). 9 IMF (2018).10 IMF (2018).11 Numbeo (2018). Cost of living in Mauritania. https://www.numbeo.com/cost-of-living/in/Nouakchott-Mauritania (Accessed 15 June 2018).12 World Development Indicators (2018). 13 Dessie, E (2013). Land, informality and notions of secure tenure- perceptions from Nouakchott, Mauritania. http://www.irenees.net/bdf_fiche-analyse-1024_en.html (Accessed 3 August 2018). 14 Ibid15 The Middle East Monitor (2017). Mauritania suspends housing projects funded by Qatar. https://www.middleeastmonitor.com/20170705-mauritania-suspends-housing-projects-funded-by-qatar/ (Accessed 27 June 2018). 16 Bertelsmann Stiftung (2018). 17 Bureau of Economic and Business Affairs (2017).18 Bal, S., Baro, M. and O'Sullivan, N. (2015). Women’s Access to Land in Mauritania : A Case Study in Preparation for the COP. https://openknowledge.worldbank.org/handle/10986/22938 (Accessed 6 July 2018).19 World Bank (2013). Mauritania - Country partnership strategy for the period FY2014-2016 (English). http://documents.worldbank.org/curated/en/294641468056337844/Mauritania-Country-partnership-strategy-for-the-period-FY2014-
2016 (Accessed 3 August 2018).

Africa Housing Finance Yearbook 2018
193
The World Bank ranked Mauritius first in Sub-Saharan Africa and 25th globally, interms of the ease of doing business. Mauritius made starting a business easier byexempting trade fees for licenses below Rs5 000 (US$145) and introducing theelectronic certificate of incorporation. Improvements were also noted in termsof registration of property, dealing with construction permits and trading acrossborders. The GDP was estimated at US$13.34 billion in 2017, and GDP (PPP)per capita was over US$10 140,1 amongst the highest in Sub-Saharan Africa.
Access to financeMauritius boasts a vibrant financial services sector, contributing about 12 percentto the GDP. Basic financial sector infrastructure, such as payment, securities tradingand settlement systems, are modern and efficient, and access to financial servicesis high, with more than one bank account per capita. BOM acts as the CentralBank and the regulator for banking institutions, while the Financial ServicesCommission supervises the non-bank financial institutions including the stockexchange and insurance companies.
Mauritius has relatively active capital markets. The institutional and technicalinfrastructure of the Stock Exchange of Mauritius (SEM) is developed, but themarket is characterised by low volume and poor liquidity – as is typical of smalleconomies. The fixed income market is relatively well developed. BOM regularlyissues a diversity of government securities and the country has a sovereign debtrating of Baa1 by Moody's.
OverviewThe Republic of Mauritius (Mauritius) is a small island nation of only 2 040km2 inthe Indian Ocean, with a population of 1.27 million people as at December 2017(396 335 households in 2016). It is located 2 000km off the southeast coast ofthe African continent, which includes the islands of Mauritius, Rodrigues, 560km2
east of Mauritius, and the outer islands of Agaléga, St. Brandon and two disputedterritories. The islands of Mauritius and Rodrigues form part of the MascareneIslands, along with nearby Réunion. The nation's exclusive economic zone covers2.3 million km2 of the Indian Ocean, including approximately 400 000km2 jointlymanaged with the Seychelles. Mauritius comprises nine Districts, one AutonomousRegion, and two Dependencies. The capital city of Mauritius is Port Louis.
The Mauritian economy is well-run, with sound political and economicmanagement practices reflected by the Mo Ibrahim Foundation ranking Mauritiusfirst in Africa in terms of governance. Economic growth remained unchangedfrom the 2016 rate of 3.6 percent and it was fuelled mainly by construction andfinancial services. While the Mauritian economy has diversified since independencein 1968, it is still dependent on sugar, textiles and tourism for foreign income andits main market remains Europe.
Mauritius is seeking to become a high income economy within the next 10 years.The growth strategy is anchored around an ambitious public investmentprogramme and improvements in the business climate. However, fiscal space islimited, and competitiveness bottlenecks are limiting the gains from trade. Thevibrant Global Business Sector faces pressure from international anti-tax avoidanceinitiatives. Thus, in the 2018-2019 National Budget, the Government announcedmajor reforms in line with recommendations made by the Organisation forEconomic Co-operation and Development.
Mauritius’ fiscal deficit was recorded at 3.5 percent of Gross Domestic Product(GDP), at the end of the fiscal year 2016/17, as the government rolled out severalnew social programmes but reduced capital spending. In September 2017, theBank of Mauritius (BOM) cut the key policy rate by 50 basis points to 3.5 percent,with the intention of stimulating investment into the productive sectors of theeconomy.
MauritiusKEY FIGURES
Main urban centres Port Louis
Exchange rate: 1 US$ = [a] 9 Sept 2018PPP Exchange rate (Local currency/PPP$) 1 Mauritian rupee = [b]Inflation 2016 [c] | Inflation 2017 [c] | Inflation 2018 [c]
34.31 Mauritian rupee16.301.00 | |3.70 | 5.10
Population 2011 [c] | Urban population size 2011 [c] Population growth rate 2017 [b] | Urbanisation rate 2017 [b]Percentage of the total population below National Poverty Line [d]Unemployment rate [d]
1 265 309 | 499 3490.09% | -0.17%10.00%7.1%
GDP (Current US$) 2017 [a] | GDP growth rate annual 2017 [b]GDP per capita (Current US$) 2017 [b]GNI per capita (Current US$) 2017 [b]Gini co-efficient [d]HDI global ranking 2017 [e] | HDI country index score 2017 [e]
US$13 338 million | 3.8%US$10 547US$10 14040.0065 | 0.790
Is there a deeds registry? Number of residential properties that have a title deed Lending interest rate 2017 [f] Mortgage interest rate [f] | Mortgage term (years) [f]Downpayment [f]Mortgage book as a percentage of the GDPEstimated number of mortgages Price to Rent Ratio in City Centre | Outside City Centre Gross Rental Yield in City Centre | Outside City Centre Construction as a % of GDP [d]
yesn/a6.81%5.50% | 3010%20.10%n/a277 | 2770.04% | 0.04%4.00%
What is the cost of standard 50kg bag of cement? What is the price of the cheapest, newly built house by a formaldeveloper or contractor? (Local currency)What is the price of the cheapest, newly built house by a formaldeveloper or contractor? (US$) What is the size of this house (m2)? What is the average rental price for this unit (US$)? What is the minimum stand or plot size for residential property?
US$6.67
1 220 000 Mauritian rupee
US$35 38250m2
US$125100m2
Ease of Doing Business Rank [g]Number of procedures to register property [g]Time to register property (days) [g]Cost to register property (as % of property value) [g]
25517 days6.00%
NB: Figures are for 2018 unless stated otherwise.
[a] Coinmill.com[b] World Bank World Development Indicators[c] IMF World Economic Outlook Database[d] Statistics Mauritius [e] UNDP Development Indicators [f] Bank of Mauritius[g] World Bank Doing Business

194
As at the end of June 2017, the financial system comprised 23 banks, of which10 were local, nine were subsidiaries of foreign banks and four were branches ofinternational banks. Two banks provided private banking services exclusively andone bank conducted Islamic banking exclusively. The banking sector had a networkof 204 branches, 10 counters, six mobile vans and 454 Automated Teller Machines(ATMs). There were five foreign exchange dealers, seven money changers andeight non-bank deposit-taking institutions.2
All the banks have licenses to carry out banking business locally and internationally.The Mauritius Commercial Bank and the State Bank of Mauritius are among thelargest banks in the East African region. The banking system is highly concentrated,with two of the major banks servicing 60 percent of the domestic market.
The country’s commercial banks are well capitalised, well regulated, liquid andprofitable. The capital adequacy ratio increased from 17.6 percent in 2016 to17.9 percent in 2017, mainly due to the capital base increasing at a higher rate of6.2 percent relative to a rise of 4.1 percent observed in the risk-weighted assets.3
Banks in Mauritius remained adequately capitalised, with a capital adequacy ratiothat is above the regulatory minimum. In 2017, the profitability of banks increasedand the asset quality improved as a result of a decline in the amount of non-performing loans from 7.1 percent in June 2016 to 7.0 percent in 2017 (impairedcredit in Mauritius declined while impaired credit outside Mauritius continued toincrease). Exposure of banks to large borrowers, measured as a percentage ofbanks’ capital base, fell from 204 percent in 2016 to 150 percent in 2017.
Deposits went up from 73.2 percent in 2016 to 74.6 percent in 2017. Theadvances-to-deposits ratio, which indicates the extent to which funds mobilisedby way of deposits have been utilised to finance lending activities, decreased from74.3 percent in 2016 to 69.9 percent in 2017, reflecting a somewhat faster rise indeposits compared to lending.4
Some 15 banks offer mortgage finance, and the use of mortgage finance isgenerally high by African standards, although it has declined recently. Accordingto the Mauritius Housing Census, just over 12 percent of houses were mortgagedin 2011, versus 16 percent in 2000. Mauritius has a relatively large pension industry,and 51.4 percent of the labour force are contributors. The national pension fundis also involved in the housing sector and, for example, lends money to theMauritius Housing Company (MHC).
MHC was incorporated as a public company in 1989 to address the housingfinance requirements of the population, paying careful attention to low incomehouseholds. In 1982, MHC introduced a special savings scheme, which has beena major source of contributions. This scheme encouraged Mauritians to save withthe MHC so as to be later eligible for a housing loan. Thus, MHC is a deposit-taking institution and provides architectural, technical, legal and insurance services.
There are constraints to the growth of the Mauritian mortgage market.Affordability constraints as well as informal incomes undermine access tomortgages, and lenders feel that the cost and time of foreclosing on a propertyincreases risk. The Borrowers’ Protection Act of 2007 aims to ensure responsibleborrowing and lending and provides for a Commissioner to examine and have asay in cases of foreclosure. Though no improvement is noted in the country’sinsolvency-resolving capacity, there has been nonetheless a change in its rankingin the World Bank Doing Business 2018 from 39th in 2017 to 36th in 2018. Whilethere are no private credit bureaus, 82.1 percent of the population are includedin the public credit registry.
The FinScope Mauritius Study 2014 revealed a high level of financial inclusion, withonly 10 percent of adults (above 18) classified as financially excluded; 85 percentof the adult population is banked; 49 percent use non-bank products/services; and26 percent use informal mechanisms to manage their finances. Financial inclusionrates are hampered by income regularity as most financial products are peggedto consistent income.
According to BOM, households continued to accumulate debt in a low interestrate environment, led by mortgages, while loans for consumption purposesdeclined in absolute terms. The stock of household debt relative to theirdisposable income fell in 2017 when compared to the 2016 figures, but a slight
increase was noted in mortgages. Over 90 percent of household debts arecollateralised and the fall in interest rates has reduced the debt service cost ofhouseholds.
Against a backdrop of low interest rates, household indebtedness, measured asthe ratio of household debt to disposable income, dropped to 52.3 percent in2017 compared 53.2 percent in 2016. Corporate indebtedness also declinedfrom 53.1 percent in 2016 to 50.1 percent in 2017. Domestic debt of corporatesaccounted for around 88 percent of total corporate debt in June 2017. As a ratioto GDP, it dropped from 46.4 percent in 2016 to 44.2 percent in 2017. Externaldebt of corporates, which accounted for approximately 12 percent of totalcorporate debt, have also declined in nominal terms and as a ratio to GDP, from6.6 percent of GDP in 2016 to 6.0 percent in 2017.
AffordabilityAverage monthly household disposable income increased from Rs29 420(US$853.22) in 2012 to Rs36 810 (US$ 1 067.54) in 2017, an increase of 25.1percent. According to Statistics Mauritius, in 2012, most households (92.7 percent)owned their dwellings or were supplied one free by parents or relatives,6.4 percent rented their dwellings (compared to 8.4 percent in 2006/07) and lessthan one percent were supplied free by the employer. Household ownership washigher in rural regions, while 10.5 percent of households in urban regions lived inrented dwellings against 3.5 percent for their counterparts in rural regions.
Some 45 percent of households are indebted, of which more than half have ahousing debt. According to the 2012 Household Budget Survey (HBS), 45.3percent of households reported having made at least one debt repayment duringthe month compared to 46.5 percent in the 2006/07 Household Budget Survey.Housing remained the largest component of debt repayment.
Mauritius has a relatively comprehensive social security system that includes arange of government subsidies for housing. The government uses state-ownedcompanies to improve affordability for housing, namely MHC and the NationalHousing Development Company (NHDC), a parastatal body set up in 1991 toserve low income Mauritians. The NHDC offers both fully developed units andsite-and-service options at subsidised rates.
The NHDC sells concrete housing units of 50m2 to families earning less than Rs20000 (US$580.03). Assistance is targeted by household range of income as follows:
Group 1 Rs6 200 (US$179.81) to Rs10 000 (US$290.01);Group 2 Rs10 000 (US$290.01) to Rs15 000 (US$435.02); andGroup 3 Rs15 001 (US$435.02) to Rs20 000 (US$580.03).
There is a government subsidy of 66.67 percent of the price of the unit forGroup 1.50 percent for Group 2 and 20 percent for Group 3. Housing units arebuilt on leased land and the annual rental varies based on the income of the familyfrom Rs1 (US$0.03) to Rs3 000 (US$87). The maximum duration is 30 years andthe interest rate is 6.5 percent for the first five years, 8 percent for the next fiveyears and after that 10 percent.
The NHDC site-and-service scheme provides applicants with a plot of 250m2 ofstate land through a lease for an annual rent of Rs3 000 (US$87). Qualifyingincome criteria is a monthly income of between Rs10 000 (US$290.01) andRs25 000 (US$725.04). Beneficiaries of serviced lots have to construct their ownhouses within the time-frame stipulated in their lease agreement. While theseschemes cover the majority of the population, a minority of the workingpopulation, the lowest paid, still cannot afford to meet their housing needs, resultingin incidences of squatting. The government’s National Empowerment Foundation(NEF) is responsible for this category of the population.
Under the “Right to Buy” policy introduced in 2007, the Government made itpossible for the 19 442 owners of ex-CHA houses to buy the state land on whichtheir houses stood, for a nominal amount of Rs2 000 (US$58). Vulnerable familieswho could not benefit from the scheme are treated on a case-to-case basis andgranted the land free of charge through a waiving of the purchase price andregistration fees.

Africa Housing Finance Yearbook 2018
195
Government also encourages self-help construction of housing units by very lowto low income families who already own a plot of land and are having difficultieswith constructing a concrete housing unit. These families are financially assistedthrough a grant scheme either for the casting of roof slabs to complete theirconstruction or for the purchase of building materials to start their constructionof a housing unit of up to 150m2. Households in Group 1 are eligible for a grantof Rs100 000 (US$2 900.15) while those in Group 2 are eligible for a grant ofRs70 000 (US$2 030.10) and in Group 3 are eligible for a grant of Rs50 000(US$1 450.07). A grant of Rs60 000 (US$1 740.07) is given to households earningless than Rs10 000 (US$290.01) for slab casting of a second house (extensionunit). The maximum grant for the purchase of building material is Rs65 000(US$1 885.10) for households earning less than Rs10 000 (US$290.01) .
The cost of building a single-storey house, as measured by the Construction PriceIndex has increased marginally in 2017 mainly as a result of an increase in the priceof blocks and sand. However, since 2009, the index has risen by 16.3 points. Thecheapest newly built house, currently on the market, costs around US$35 382(Rs1.22 million) excluding the land, and is 50m2 with two bedrooms, a living anddining room, kitchen, toilet/washroom and small veranda. Minimum plot size is250m2 in urban areas. A bag of 50 kgs of cement costs US$6.67 (Rs230) (incl.VAT).
Property marketsThe government expects the real estate sector to be a primary growth driver.The market segment is closely tied to the economic fortunes of Europe and theUS because of the deliberate efforts by government to encourage greater foreignownership. The Permanent Residence Scheme, the Integrated Resort Scheme,and the Scheme to Attract Professionals for Emerging Sectors all encourageforeign investment and settlement.
According to the World Bank’s 2018 Doing Business Report, it takes 17 days andfive procedures on average to register property (which ranks Mauritius as beston the continent and 35th globally with a marked improvement in the score).Mauritius has made it easier to transfer property by eliminating the transfer taxand registration duty, implementing a complaint mechanism and publishing servicestandards. The registration process costs on average 0.6 percent of the value ofthe property.
Policy and regulationThe planning and management of housing and land in Mauritius is the responsibilityof the Ministry of Housing and Lands which has set up a comprehensive array ofsupport and initiatives to address housing needs. Subsidy programmes target bothnew-build construction and self-help housing, and government has made an expliciteffort to deal with those with no affordability at all. Spatial data for land usemanagement and planning is facilitated by the Land Administration Valuation andInformation Management System (LAVIMS).
Prior to 2006, social housing was solely the responsibility of government. But asdemand kept growing and the government could only build around 900 units ayear (with a waiting list of 25 000 housing units in 2015), the private sector wascalled to participate through various Public Private Partnership projects. Aninteresting aspect of the Finance Act of 2009 requires companies, as part of theircorporate social responsibility, to pay two percent of their book profit after taxinto a Corporate Social Responsibility Fund. This Fund can be used on approvedprojects, among which social or subsidised housing is a high priority. Moreover,interest on mortgage is tax exempted for first houses for middle income earners.
Housing supplyThe 2011 Housing and Population Census reports that there are 356 900 housingunits in Mauritius and Rodrigues. According to the Housing and Population Censusof 2011, 99.4 percent of households have access to electricity and 94.2 percenthave access to water inside their homes. Most housing stock in Mauritius is ofgood quality: 91 percent of the dwellings are durable with only 4.8 percent of thepopulation living in iron/tin walled houses. The Census also found that 90.5 percentof residential dwellings were used as a principle residence, 1.7 percent assecondary dwellings and 7.8 percent were vacant. Semi-detached houses andblocks of flats went up to 16.6 percent of total stock, from 11.5 percent in 2000.
The housing stock increased more in rural than in urban regions. It is reportedthat 77.7 percent of the housing units were non-mortgaged while 12.3 percentwhere mortgaged in 2011. Furthermore, 88.9 percent owned their dwelling whileeight percent rented, and 3.1 percent had free accommodation. The averagemonthly rent for housing was Rs4 400 (US$127.61) in 2011, representing anincrease of 91 percent since 2000 and currently it stands around Rs5 000(US$145). In line with the Consumer Price Index, the rental price since 2012 hasincreased marginally by 3.8 points.
The household size decreased from 3.92 in 2000 to 3.56 in 2011 and the numberof persons per room decreased from 0.91 to 0.79.
Successive government budget proposals have ensured that all citizens have ahouse providing decent living conditions. The strategy focuses on social and lowincome housing as well as facilities for middle income families.
1. The Housing Empowerment Scheme targets middle income families earningup to Rs50 000 (US$1 450) monthly. Under the scheme, banks require fivepercent minimum downpayments and provide loans of up to 95 percent ofthe cost of a residential unit. The moratorium period is two years on capitalrepayment. The Government guarantees 20 percent of the loan amount andreimburses VAT of up to Rs300 000 (US$8 700) on the construction of anyhouse or purchase of an apartment costing less than Rs2.5 million(US$72 504). For its part, the MHC provides, free of charge, at least 12 typesof architectural plans for each house of an area of 1 000ft2 to 1 200ft2. The
PPP$40 001 – PPP$10 000 000
PPP$23 001 – PPP$40 000
PPP$12 001 – PPP$23 000
PPP$8 001 – PPP$12 000
PPP$5 001 – PPP$8 000
PPP$3 601 – PPP$5 000
PPP$2 401 – PPP$3 600
PPP$1 601 – PPP$2 400
PPP$801 – PPP$1 600
<PPP$800
- - - Average annual household income needed for the cheapest newly built house by a formal developer, 2017 Average annual household income using expenditure, 2017 (PPP$)
MAURITIUS
Annual income profile for rural and urban households based on consumption (PPP$)
No. of households (thousands)
PPP$18 359
PPP$36 334
Rural Urban100 80 60 40 20 0 20 40 60 80 100
Population: 1 265 309
Urbanisation rate: -0.17%
Cost of cheapestnewly built house:
1 220 000 MURPPP$74 847
Urban householdsthat could afford thishouse with finance:
93.73%
1 PPP$:16.3 Mauritian
rupee
Source https://www.cgidd.com/

196
interest rate is 2.5 percent above the repo rate, presently at 5.50 percent.Twelve banks are involved in this project.
2. In the national budget 2018-19, the Government announced projects tofinance construction of 1 000 low cost housing units for families whosemonthly income is below Rs10 000 (US$290.01). The size of the housingunits will be increased from 39m2 to 50m2. Funds were also provided for theconstruction of 700 housing units for vulnerable families under the NEF.
3. With regard to middle income families, the current bank limit of loan funding(up to Rs5 million (US$145 000)) of up to 90 percent of the residentialproperty has been removed. Moreover, the eligibility criteria for social housingschemes of the NEF and the NHDC have been increased so as to berealigned with the new poverty threshold on an adult basis of the SocialRegister of Mauritius.
These programmes complement the extensive investment that the public andprivate sectors have made in housing development. Since 2011, the NEF hasconstructed more than 300 core housing units of 32m2 each. It is projected tobuild 700 additional such units within the next two years. Furthermore, by 2012,the NHDC had built more than 12 000 units, and a further 10 000 units were inthe pipeline. An innovative subsidy scheme offered by government through theNHDC promotes self-build approaches. Households with a monthly income ofbetween Rs10 000 (US$290) and Rs25 000 (US$725) and who have neitherreceived a grant previously nor already own a property are entitled to apply forland that is periodically made available. Grants are also provided for casting ofslab or purchase of building materials. The land is made available on a leasearrangement and the beneficiary is required to pay the fee. The construction ofa housing unit on the land must begin within six months following the signing ofthe lease agreement and it must be completed within 18 months. Beneficiariescan apply to the MHC to finance the construction and can access architecturalservices from the MHC for Rs2 (US$0.05) per ft2.
Furthermore, there is also an incentive for developers to develop residential units.Requirements are that the land for development must be non-agricultural andhave access to main infrastructure lines and amenities. In addition, developersshould provide all basic infrastructure and 25 percent of the development mustbe for low income households, for which the sale price is determined by thegovernment. A Social Housing Development Fund was also established, capitalisedwith Rs1.5 billion (US$43.5 million) to encourage the creation of not-for-profitHousing Development Trusts. A Marshall Plan against poverty was also announcedin the Budget 2015. Under this project, as part of their social responsibility,companies will have to take under their wings pockets of poverty situated in theregion where the companies are located. Thus, the private sector will also assistin poverty alleviation.
OpportunitiesMauritius has been emerging as an international financial centre since the early1990s and is the easiest place to do business in Africa. Currently, the Governmentof Mauritius is working on a blueprint for the financial services sector. Severalmajor reforms have also been announced for this sector in the 2018/19 NationalBudget which will impact on income and employment and consequently on thehousing market. The country also has preferential access to markets in the Africaregion (such as the African Union, SADC, the Common Market for Eastern andSouthern Africa (COMESA) and the Indian Ocean Rim Association for RegionalCo-operation (IOR-ARC), pointing to its strategic location.
According to the African Executive (2014), for Mauritius to become a high incomecountry, it needs to start attracting foreign skilled labour. If labour flows are similarto those experienced by Dubai, Hong Kong and Singapore at a similar stage, overthe next decade Mauritius should be ready and willing to accommodate some5 000 to 20 000 foreigners annually, with a total of 100 000 to 200 000 for the
period. In the short run, such an influx could be accommodated in the variousreal estate projects. However, going forward, this offers a greater opportunity inmiddle to higher end housing finance, as foreign investment and wealth increasein Mauritius.
Additional sourcesAfrican Development Bank Group – African Economic Outlook 2018.https://www.afdb.org/fileadmin/uploads/afdb/Documents/Publications/African_Economic_Outlook_2018_-_EN.pdf (Accessed 22 July 2018).
African Development Bank Group - Mauritius Country Strategic paper 2014-2018. https://www.afdb.org/fileadmin/uploads/afdb/Documents/Project-and-Operations/2014-2018_-_Mauritius_Country_Strategy_Paper.pdf (Accessed22 July 2018).
Bank of Mauritius (2017). Annual Report for the year ended 30 June 2017.
Bank of Mauritius (2017). Financial Stability Report.
Economist – Economic Intelligence Unit (2018). Country Risk Service:Mauritius. https://store.eiu.com/product/country-risk-service/mauritius(Accessed 1 Sept 2018).
Financial Services Commission (2017). Annual Report 2016.
Heritage Foundation (2017). 2017 Index of Economic Freedom.
Mauritius Banking Association (2013). The Banking Industry.www.mba.mu/pdf/The-Banking-Industry-FSR-Aug2013.pdf (Accessed 26 July2018).
Ministry of Finance and Economic Development, Mauritius (2018). NationalBudget 2017-18.
Mo Ibrahim Foundation (2018). Ibrahim Index of African Governance IndexReport 2018.
Statistics Mauritius (2011). 2011 Housing Census – Main Results.http://statsmauritius.govmu.org/English/CensusandSurveys/Documents/ESI/esi2011.pdf (Accessed 25 July 2018).
Moody’s (2018). Mauritius, Government of. https://www.moodys.com/credit-ratings/Mauritius-Government-of-credit-rating-600017176 (Accessed 24 Sept2018).
Statistics Mauritius (2012). Household Budget Survey 2012.
The African Executive (2014). How Mauritius Can Become a High IncomeCountry.
The World Bank (2018). Doing Business 2018: Reforming to create jobs.Mauritius.
Trading Economics. Mauritius GDP Annual Growth Rate.https://tradingeconomics.com/mauritius/gdp-growth-annual (Accessed 1 Sept2018).
UN Habitat (2012). Mauritius National Urban Profile.https://unhabitat.org/books/mauritius-national-urban-profile/ (Accessed 23 July2018).
Websiteswww.africanexecutive.comwww.bom.muwww.fscmauritius.org www.govmu.org www.statsmauritius.govmu.orghttp://gis.gov.muwww.mba.muwww.mhc.muwww.nhdcmauritius.comwww.pwc.com/muwww.housing.govmu.org/www.mofed.govmu.orgwww.nef.mu
1 The World Bank (2018). The World Bank Open Data. http://povertydata.worldbank.org/poverty/country/MUS (Accessed 26 July 2018).2 Bank of Mauritius (2017). Annual Report for the year ended 30 June 2017. Pg. 92.3 Bank of Mauritius (2017). Pgs. 92-93.4 Bank of Mauritius (2017). Pgs 94-95.5 Bank of Mauritius (2017). Pgs. 106-118.6 Ministry of Housing & Lands (2018). Housing Division. http://housing.govmu.org/English/DeptOrg/Divisions/Pages/Housing-Division.aspx (Accessed 20 July 2018).7 Statistics Mauritius (2011). 2011 Housing Census – Main Results. http://statsmauritius.govmu.org/English/CensusandSurveys/Documents/ESI/esi2011.pdf (Accessed 25 July 2018).
Africa Housing Finance Yearbook 2018
197
The real estate price index (which gives detailed information on all formal propertytransactions in the country) rose by five percent in 2017 after an increase of1.3 percent in 2016, which is due to the rise in the prices of residential properties(+4.9 percent), land (+5.3 percent) and commercial real estate (+7 percent).
Despite good growth prospects, the country remains in the bottom half of thegroup of countries with medium human development. The value of Morocco’shuman development index for 2015 was 0.647 and the country was positioned123rd out of 188 countries.9 This is primarily due to the extremely low literacyrates of approximately 65 percent, and an unemployment rate that increased from9.9 percent in 2016 to 10.2 percent in 2017, with a higher rate registered amongyouth at 26.5 percent.10 The living conditions of urban and rural communitiesdiffer significantly. Poverty rates are higher in rural areas.11 The poverty rate in2014 was 4.8 percent at the national level, 9.5 percent in rural areas, and1.6 percent in urban areas. Educational opportunities are lower in rural areas,where many children drop out of primary school.
Social tensions increased in 2017, mostly in the northern region of the Rif, due todemands for better access to health services, jobs, and greater public investments.
OverviewMorocco is a lower-middle income country in North Africa with one of the mostdiversified and developed economies on the continent. Despite its exposure to asuccession of crises in recent years (the global financial crisis of 2008, protractedlow growth in its European trading partners since 2009, and the onset of the ArabSpring in 2011), the Moroccan economy has remained resilient. Morocco has severalcomparative advantages that provide reasons for optimism for the country’s future.These include relative security compared to the rest of the region, an attractivegeographical position for investors, a relatively diversified economic base, and a largepool of young workers.1 While the country does not have any hydrocarbon wealth,it does have an estimated 70 to 75 percent of the world’s reserves of phosphatesand is the third largest phosphate producer after the United States and China. Thephosphate and auto industries are the country’s top export sectors.
The Moroccan economy recovered significantly in 2017. Economic growth pickedup in 2017 to 4.1 percent against 1.1 percent in 20162 mostly driven by therebound of the agricultural sector that accounts for close to 15 percent ofMorocco's GDP and employs close to 40 percent of the Moroccan workforce.
Exports continued their good performance in 2017 with a volume growth of10 percent. Morocco is recognized as one of the best emerging markets forforeign investment and attracted nearly US$2.57 billion in foreign direct investmentin 2017, an increase of 12 percent over 2016.3 Morocco is currently ranked 694
on the World Bank’s Doing Business index.
In 2017, the sales of cement, a key indicator of the construction sector, declinedby 2.54 percent against a decline of 0.7 percent in 2016,5 accumulating the 6th
consecutive annual decline. This is explained by the decline in housing starts,whether for social housing or self-build housing that absorbs around 40 percentof national consumption.6
Bank loans granted to the real estate sector rose in 2017 by 4.2 percent (against+2.5 percent in 2016). This performance is due to the increase of housing loansby +3.6 percent (against +5.2 percent in 2016) and loans to real estate developersby +8.7 percent (against -4.6 percent in 2016).7
In 2017, the consumer price index (CPI) increased by 0.7 percent. The increaseconcerned both food products (+0.1 percent) and non-food products(+1.4 percent).8
MoroccoKEY FIGURES
Main urban centresCasablancaRabat
Exchange rate: 1 US$ = [a] 12 Jul 2018PPP Exchange rate (Local currency/PPP$) 1 Moroccan dirham = [b]Inflation 2016 [c] | Inflation 2017 [c] | Inflation 2018
9.4 Moroccan dirham
3.501.60 | 0.70 | 2.40
Population [c] | Urban population size [c] Population growth rate [c] | Urbanisation rate [b]Percentage of the total population below National Poverty Line 2014 [c]Unemployment rate [c]
35 230 036 | 21 968 0001.06% | 2.10%
4.8%10.2%
GDP (Current US$) 2017 [c] | GDP growth rate annual 2017 [d]GDP per capita (Current US$) 2017 [c]GNI per capita (Current US$) 2017 [b]Gini co-efficient 2014 [c]HDI global ranking 2015 [e] | HDI country index score 2015 [e]
US$113 000 million | 4.1%US$3 247US$2 86339.50123 | 0.647
Is there a deeds registry? [f] Number of residential properties that have a title deed [f] Lending interest rate [g] Mortgage interest rate [d] | Mortgage term (years) [d]Downpayment [h]Mortgage book as a percentage of the GDPEstimated number of mortgages Price to Rent Ratio in City Centre [i] | Outside City Centre [i]Gross Rental Yield in City Centre [i] | Outside City Centre [i]Construction as a % of GDP [j]
Yes5 800 0005.53%4.96% | 2120%n/an/a20.57 | 20.514.86% | 4.9%6.50%
What is the cost of standard 50kg bag of cement? 2016What is the price of the cheapest, newly built house by a formaldeveloper or contractor? (Local currency)What is the price of the cheapest, newly built house by a formaldeveloper or contractor? (US$) What is the size of this house (m2)? What is the average rental price for this unit (US$)? [g] What is the minimum stand or plot size for residential property?
US$8.50
140 000 Moroccan dirham
US$14 89355m2
US$106n/a
Ease of Doing Business Rank [k]Number of procedures to register property [k]Time to register property (days) [k]Cost to register property (as % of property value) [k]
69622 days6.40%
NB: Figures are for 2018 unless stated otherwise.
[a] Coinmill.com[b] World Bank World Development Indicators[c] Haut Commissariat au Plan[d] Bank Al-Maghrib[e] UNDP Development Indicators[f] National Agency for the Land Conservation of Cadastre and Cartography[g] Ministry of Economy and Finance - Morocco[h] Meilleurtaux.ma[i] Numbeo[j] Y.B. Batiment Management and Construction[k] World Bank Doing Business

198
In addition, a consumer boycott campaign was launched in April 2018, targetingfood, oil and gas companies. The goal of this campaign is to protest against risinginflation and persistent urban and youth unemployment.12
Access to financeIn recent years, Morocco’s banking sector has continued to deepen, with totalbank assets reaching 140 percent of GDP, and has become more diversified,including a rapid expansion into Sub-Saharan Africa. Banks are well-capitalisedand profitable and benefit from stable funding sources. In 2016, in aggregate, thecapital adequacy ratio stood at 14.2 percent13 well above the Basel IIIrequirements, and bank profitability has been stable. However, since 2012, thenon-performing loan ratio has been rising due to weaker economic activity andstrains in the corporate sector, reaching 7.7 percent in March 2018.14
In 2016, there were 83 institutions that fell under the supervision of Bank Al-Maghrib,15 Morocco’s central bank, including 19 commercial banks, 33 financecompanies (including 2 companies specialised in housing finance),13 microfinanceassociations and the Central Guarantee Fund.
Following the new banking law (n°103-12) adopted in 2014, which introducedparticipative banks (in Morocco the term “participative” is used instead of“Islamic"), Bank Al-Maghrib in January 2017 gave approval to open five participativebanks and three participative windows.16 Among the very first products offeredon the market by these banks is housing Murabaha.17
In January 2018, Morocco adopted a more flexible exchange rate regime.18 TheCentral Bank would continue to set the dirham price on the basis of a basket ofeuros (60 percent) and dollars (40 percent) but with a much greater margin offlexibility. The fluctuation band went from 0.3 to 2.5 percent in each direction.This measure is aimed at strengthening the resilience of the national economy toexogenous shocks in order to support its competitiveness and to improve its levelof growth.
On 13 July, 2017, law 40-17 was adopted by the government. The law furtherstrengthens the Central Bank’s independence and extends its supervisorypowers.19 It gives it total independence from the executive branch and politicalpartisanship, therefore granting more credibility to monetary policy.
Morocco has the most advanced and diverse housing finance market in the region.There is a wide range of sources for mortgage lending in the country, from publicand private commercial banks, as well as consumer credit companies andmicrofinance institutions. Typical terms are 15-25 years, and housing finance canbe between 50 to 100 percent of the property’s appraised value. Up to70 percent of residential properties have fixed interest rates. In March 2016, theCentral Bank cut its key interest rate by 25 basis points to 2.25 percent – its lowestrate since 2000. As of 19 June 2018, this interest rate remained unchanged.20
The financing of the real estate sector by banks continues to recover, after a slumpseen a few years ago. Its evolution in 2017 confirms this trend. Real estate loanshave ended 2017 with an annual growth of 4.2 percent and an outstanding amountof MAD257.2 billion (US$27.3 billion). The financing of real estate developers hasespecially benefited from this turnaround, rising from -4.6 percent in 2016 withoutstanding loans of MAD55.5 billion (US$5.9 billion) to +8.7 percent in 2017,with outstanding loans of MAD60.3 billion (US$6.4 billion). On the other hand,housing loans have slowed down, as they went from 5.2 percent growth in 2016with outstanding loans of MAD188.7 billion (US$20.1 billion) to 3.6 percent in2017 with outstanding loans of MAD195.4 billion (US$20.8 billion).21 In addition,a steady decline in mortgage lending rates has been observed in Morocco overthe past five years. From 2012 to 2017, rates went from six percent to five percenton average.
Partnerships between banks and the government (GoM) make lending moreaccessible to middle and low income families, through the establishment ofmortgage guarantee funds. FOGARIM stands for “Fonds de Garantie pour lesRevenus Irréguliers et Modestes,” or “Guarantee Fund for Irregular and LowIncomes.” Launched in 2004, FOGARIM guarantees 70 percent of a mortgageloan made to a household with an informal income for the purchase of a unitworth less than MAD250 000 (US$26 596). Monthly instalments are capped atMAD1750, around US$186 (upper income threshold) and 40 percent of the
household’s income (lower threshold).22 Another guarantee programme,FOGALOGE, targets moderate income civil servants, middle class independentworkers and non-resident Moroccans buying or building houses up to about MADone million (US$106382) in value.
The figures for 2017 show a decline in the number of the fund's beneficiaries,which was limited to 11 650 for FOGARIM and 5 129 for FOGALOGE, comparedto 12 709 and 5 676 respectively in 2016. On the other hand, the grantedamounts have almost stagnated to stand out at MAD1.9 billion (US$202 million)for the FOGARIM and MAD1.4 billion (US$ 149 million) for the FOGALOGE.
FOGARIM is open to all banks in theory, but two of them grant more than80 percent of all FOGARIM loans.23 While FOGARIM has not been entirelysuccessful at convincing banks to go downmarket and at extending access tohousing finance to those with irregular income, it represents a significantimprovement compared to the pre-FOGARIM period.
Growth in the microfinance sector has been rapid in Morocco since theMicrofinance Act was passed in 1999. Microfinance institutions (MFIs) provideloans for the development of income-generating enterprises (lending tomicroenterprises accounted for 90 percent of the total)24 and for housingpurchase or construction, as well as for connections to basic utilities. In 2016, loansgranted by MFIs to customers totalled a gross outstanding amount of MAD6.4billion (US$681 million) and the number of beneficiaries reached 900 000.25
A mortgage securitisation framework exists in Morocco since 1999 but its usehas been limited, with only four issuances. The framework was revised in 2008,but besides making securitisation structures more flexible, it did not foster its usagefor housing finance.
AffordabilityAffordability remains an important challenge for housing in Morocco, a countrywhere disparities remain high: the income Gini coefficient was 39.5 percent in2014.26
Morocco's minimum wage is MAD3 000 (US$319) a month in the public sector,MAD2 570 (US$273) a month in the private sector and MAD 69 (US$7) a dayfor agricultural workers. Morocco's minimum wage was last changed on 1st July2015.27 The average annual income per capita in Morocco increased, between2001 and 2014, from about MAD11 000 (US$1 170) to MAD19 000 (US$2 021),marking an average growth of five percent a year.28
The Moroccan government defines two types of affordable housing units, bothcommonly called “social” housing and differentiated by their maximum price: thefirst one “Low Real Estate Value – Faible Valeur Immobilière Totale (FVIT) –programme” was created by the 2008 Finance Act with a capped price ofMAD140 000 (about US$14 893) and dwellings covering a surface area ofbetween 50m2 and 60m2. The programme targets individuals who earn less thantwice the minimum wage.29
The second type of social housing was initiated under the 2010 Finance Act witha capped price of MAD250 000 excluding VAT (approximately US$26 595). Thecovered surface area is between 50m2 to 80m2 and no maximum income isrequired to purchase these housing units.
The 2013 Finance Act has introduced the middle income housing programme,which is defined as housing units ranging from 80m2 to 150m2 and selling atmaximum price of MAD6 000 (US$638) per square metre excluding taxes. Thistype of housing is aimed at people earning up to US$2 068 a month.
To stimulate the development of social housing, the GoM offers private developerstax incentives.The total fiscal subsidy over the period 2008-2017 for the FVITprogramme is estimated at MAD656 million (US$70 million)30 and MAD23.6billion (US$ 2.5 billion) for the MAD250 000 housing programme.31
For the MAD250 000 housing programme, the GoM also provides privatedevelopers with non-monetary subsidies in the form of a supply of State land atless than market value, provision of trunk infrastructure at less than market price,
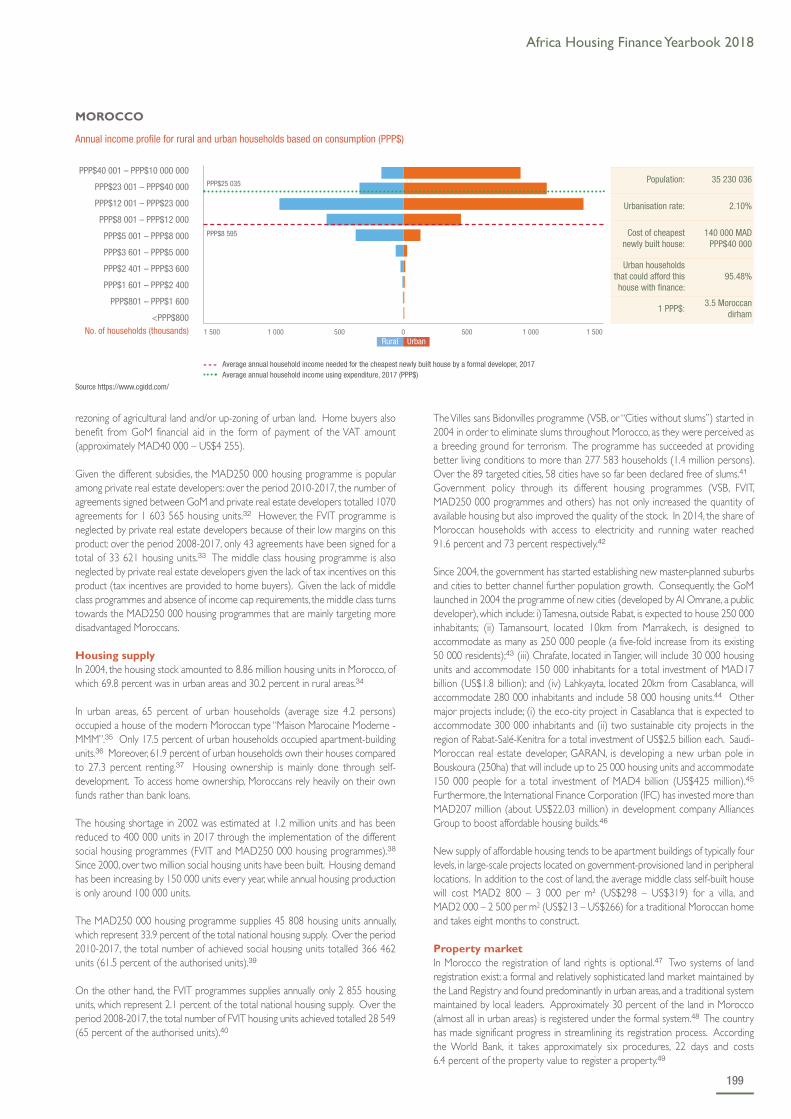
Africa Housing Finance Yearbook 2018
199
rezoning of agricultural land and/or up-zoning of urban land. Home buyers alsobenefit from GoM financial aid in the form of payment of the VAT amount(approximately MAD40 000 – US$4 255).
Given the different subsidies, the MAD250 000 housing programme is popularamong private real estate developers: over the period 2010-2017, the number ofagreements signed between GoM and private real estate developers totalled 1070agreements for 1 603 565 housing units.32 However, the FVIT programme isneglected by private real estate developers because of their low margins on thisproduct: over the period 2008-2017, only 43 agreements have been signed for atotal of 33 621 housing units.33 The middle class housing programme is alsoneglected by private real estate developers given the lack of tax incentives on thisproduct (tax incentives are provided to home buyers). Given the lack of middleclass programmes and absence of income cap requirements, the middle class turnstowards the MAD250 000 housing programmes that are mainly targeting moredisadvantaged Moroccans.
Housing supplyIn 2004, the housing stock amounted to 8.86 million housing units in Morocco, ofwhich 69.8 percent was in urban areas and 30.2 percent in rural areas.34
In urban areas, 65 percent of urban households (average size 4.2 persons)occupied a house of the modern Moroccan type “Maison Marocaine Moderne -MMM”.35 Only 17.5 percent of urban households occupied apartment-buildingunits.36 Moreover, 61.9 percent of urban households own their houses comparedto 27.3 percent renting.37 Housing ownership is mainly done through self-development. To access home ownership, Moroccans rely heavily on their ownfunds rather than bank loans.
The housing shortage in 2002 was estimated at 1.2 million units and has beenreduced to 400 000 units in 2017 through the implementation of the differentsocial housing programmes (FVIT and MAD250 000 housing programmes).38
Since 2000, over two million social housing units have been built. Housing demandhas been increasing by 150 000 units every year, while annual housing productionis only around 100 000 units.
The MAD250 000 housing programme supplies 45 808 housing units annually,which represent 33.9 percent of the total national housing supply. Over the period2010-2017, the total number of achieved social housing units totalled 366 462units (61.5 percent of the authorised units).39
On the other hand, the FVIT programmes supplies annually only 2 855 housingunits, which represent 2.1 percent of the total national housing supply. Over theperiod 2008-2017, the total number of FVIT housing units achieved totalled 28 549(65 percent of the authorised units).40
The Villes sans Bidonvilles programme (VSB, or “Cities without slums”) started in2004 in order to eliminate slums throughout Morocco, as they were perceived asa breeding ground for terrorism. The programme has succeeded at providingbetter living conditions to more than 277 583 households (1.4 million persons).Over the 89 targeted cities, 58 cities have so far been declared free of slums.41
Government policy through its different housing programmes (VSB, FVIT,MAD250 000 programmes and others) has not only increased the quantity ofavailable housing but also improved the quality of the stock. In 2014, the share ofMoroccan households with access to electricity and running water reached91.6 percent and 73 percent respectively.42
Since 2004, the government has started establishing new master-planned suburbsand cities to better channel further population growth. Consequently, the GoMlaunched in 2004 the programme of new cities (developed by Al Omrane, a publicdeveloper), which include: i) Tamesna, outside Rabat, is expected to house 250 000inhabitants; (ii) Tamansourt, located 10km from Marrakech, is designed toaccommodate as many as 250 000 people (a five-fold increase from its existing50 000 residents);43 (iii) Chrafate, located in Tangier, will include 30 000 housingunits and accommodate 150 000 inhabitants for a total investment of MAD17billion (US$1.8 billion); and (iv) Lahkyayta, located 20km from Casablanca, willaccommodate 280 000 inhabitants and include 58 000 housing units.44 Othermajor projects include; (i) the eco-city project in Casablanca that is expected toaccommodate 300 000 inhabitants and (ii) two sustainable city projects in theregion of Rabat-Salé-Kenitra for a total investment of US$2.5 billion each. Saudi-Moroccan real estate developer, GARAN, is developing a new urban pole inBouskoura (250ha) that will include up to 25 000 housing units and accommodate150 000 people for a total investment of MAD4 billion (US$425 million).45
Furthermore, the International Finance Corporation (IFC) has invested more thanMAD207 million (about US$22.03 million) in development company AlliancesGroup to boost affordable housing builds.46
New supply of affordable housing tends to be apartment buildings of typically fourlevels, in large-scale projects located on government-provisioned land in peripherallocations. In addition to the cost of land, the average middle class self-built housewill cost MAD2 800 – 3 000 per m2 (US$298 – US$319) for a villa, andMAD2 000 – 2 500 per m2 (US$213 – US$266) for a traditional Moroccan homeand takes eight months to construct.
Property marketIn Morocco the registration of land rights is optional.47 Two systems of landregistration exist: a formal and relatively sophisticated land market maintained bythe Land Registry and found predominantly in urban areas, and a traditional systemmaintained by local leaders. Approximately 30 percent of the land in Morocco(almost all in urban areas) is registered under the formal system.48 The countryhas made significant progress in streamlining its registration process. Accordingthe World Bank, it takes approximately six procedures, 22 days and costs6.4 percent of the property value to register a property.49
PPP$40 001 – PPP$10 000 000
PPP$23 001 – PPP$40 000
PPP$12 001 – PPP$23 000
PPP$8 001 – PPP$12 000
PPP$5 001 – PPP$8 000
PPP$3 601 – PPP$5 000
PPP$2 401 – PPP$3 600
PPP$1 601 – PPP$2 400
PPP$801 – PPP$1 600
<PPP$800
- - - Average annual household income needed for the cheapest newly built house by a formal developer, 2017 Average annual household income using expenditure, 2017 (PPP$)
MOROCCO
Annual income profile for rural and urban households based on consumption (PPP$)
No. of households (thousands)
PPP$8 595
PPP$25 035
Rural Urban1 500 1 000 500 0 500 1 000 1 500
Population: 35 230 036
Urbanisation rate: 2.10%
Cost of cheapestnewly built house:
140 000 MADPPP$40 000
Urban householdsthat could afford thishouse with finance:
95.48%
1 PPP$:3.5 Moroccan
dirham
Source https://www.cgidd.com/

200
According to the “National Housing Demand Survey” of 2015, the national housingdemand is estimated at 1 572 893 housing units of which 87 percent is in theurban area (1 359 788 housing units).The demand for housing units accounts for1 300 000 against demand of 271 100 for land plots (to be used to build mainlyMMM).The rental demand is only 13 percent (175 298). For apartments andMMM, the area demanded ranges between 50 and 100 m2 with an averagenumber of three to four rooms.50
In 2017, the real estate price index registered an increase of five percent(compared to an increase of 1.3 percent in 2016) due to an increase of 4.9 percentfor residential properties and 5.3 percent for land. However, the volume oftransactions dropped by 7.6 percent after an 8.4 percent increase in 2016, includinga decline of 8.7 percent in sales of residential properties and a 4.8 percent dropin sales of land.51
Policy and regulationPolicies that directly or indirectly have an impact on affordable housing include:
a) Constitution of 1996, which guarantees private property rights;b) Strategie Nationale de Developpement Urbain that places emphasis on the
creation of regional growth poles and competitive cities while promptingsocial cohesion and the efficient use of resources;
c) Finance Act 2008/2012, which introduced a new social housing programmeknown as FVIT programme: price capped at MAD140 000 (US$14 894),covered surface between 50m2 and 60m2 and targeted at individuals whoearn less than twice the minimum wage;
d) Finance Act 2010/2012 that redefined the social housing programme as adwelling for a primary residence with a covered area between 50m2 and80m2 and a selling price not exceeding MAD250 000 (US$26 596), VATexcluded. This programme is targeting all socio-professional categorieswithout any special income requirement;
e) Finance Act 2013/2014, which introduced the middle income housingprogramme: covered area between 80m2 and 150m2 and the sale price persquare meter of MAD6 000 (US$638) VAT excluded;
f) Establishment of a real estate price index (REPI) in 2010 in order to monitorprice volatility in the property market;
g) Enactment of a banking law (n°103-12) in 2014 that introduced theparticipative banks; and
h) Introduction of a new law (n°67-12) in 2014 to improve the contractualrelations between landlords and tenants.
OpportunitiesOver the longer term, Morocco's economic prospects are among the mostpromising in the Middle East and North Africa region. The country has a youngand growing population, an improving business environment, and is well-placed toserve as a manufacturing hub for exporters to Europe and rapidly-growingeconomies in Sub-Saharan Africa.
While the real estate and construction sectors are currently experiencing a slowerperiod, the demand for affordable housing is still high, particularly among the lowand middle income population. This demand, coupled with government-ledinitiatives and incentives, could continue to present opportunities for investors.Besides, middle class and rental housing are good opportunities but the GoM needsto introduce new measures (ex. tax incentives) to boost these two segments.
The Minister of Housing has already announced several housing programmes tobe implemented by 2021 in order to boost supply and further reduce the gapbetween supply and demand. Furthermore, although slow to develop, coveredbonds remains a significant innovation for Morocco, opening up the market forlonger and more affordable housing finance.
Additional sourcesHCP (2017). “Note d’informatio du Haut-Commissariat au Plan sur le parc delogements au Maroc a l’occasion de la journeemondiale de l’habitat du2 octobre 2017”. https://www.hcp.ma/Note-d-information-du-Haut-Commissariat-au-Plan-sur-le-parc-de-logements-au-Maroc-a-l-occasion-de-la-journee-mondiale-de_a2020.html (Accessed 12 July 2018).
UNDP (2016). Human Development Report 2016:Morocco.http://hdr.undp.org/sites/all/themes/hdr_theme/country-notes/MAR.pdf(Accessed 12 July 2018).
Websites http://www.bkam.ma/https://www.huffpostmaghreb.com/http://www.mhpv.gov.ma/
1 International Monetary Fund (IMF) (2016). 2015 Article IV Consultation- Press Release; Staff Report;and Statement by the Executive Director of Morocco. IMF Country Report No.16/35.
2 Bank Al-Maghrib (BAM) (2018). Réunion du Conseil de Bank Al-Maghrib - 19 juin 2018.http://www.bkam.ma/Communiques/Reunion-du-conseil/2018/Reunion-du-conseil-de-bank-al-maghrib-19-juin-2018 (Accessed 12 July 2018).
3 HUFFPOST. https://www.huffpostmaghreb.com4 The World Bank (2018). Doing Business 2018 – Reforming to create jobs – Economic Profile:
Morocco. http://arabic.doingbusiness.org/~/media/WBG/DoingBusiness/Documents/Profiles/Country/MAR.pdf (Accessed 12 July 2018).
5 Fédération Nationale des Promoteurs Immobiliers (FNPI) (2018).http://fnpi.net.ma/wp-content/uploads/2018/02/Immo-Chifre-Janvier-2018.pdf (Accessed 12 July 2018).
6 L’Economiste. Ciment: Le marchépeine à retrouver la croissance. 27 Dec 2017. https://leconomiste.com/article/1021984-ciment-le-marche-peine-retrouver-la-croissance (Accessed 12 July 2018).
7 Direction du Trésor et des Finances Extérieures (DTFE) (2017). Note de conjoncture premiersrésultats 2017. https://www.finances.gov.ma/ (Assessed 12 July 2018).
8 BAM (2018). 9 UNDP (2018). http://hdr.undp.org/sites/all/themes/hdr_theme/country-notes/MAR.pdf10 Haut Commissariat au Plan (HCP) (2017). La Situation du marché du travail en 2017. https://www.hcp.ma/La-
Situation-du-marche-du-travail-en-2017_a2108.html (Accessed 12 July 2018).11 HCP. Introduction de Monsieur Ahmed LAHLIMI ALAMI, Haut Commissaire au Plan, à la présentation des
résultats de L'enquêtenationale sur la consommation et les dépenses des ménages au Maroc.https://www.hcp.ma/Introduction-de-Monsieur-Ahmed-LAHLIMI-ALAMI-Haut-Commissaire-au-Plan-a-la-presentation-des-resultats-de-L-enquete_a1819.html (Accessed 12 July 2018).
12 Reuters (2018). Morocco consumer boycott has big business in its sights. 30 May 2018.https://www.reuters.com/article/morocco-protests/morocco-consumer-boycott-has-big-business-in-its-sights-idUSL5N1SP35Z (Accessed 12 July 2018).
13 BAM (2016). Rapport annuel 2016. http://www.bkam.ma/Supervision-bancaire/Indicateurs-et-publications/Rapport-annuel-sur-la-supervision-bancaire (Accessed 12 July 2018).
14 CEIC (2018). Morocco non-performing loans ratio. https://www.ceicdata.com/en/indicator/morocco/non-performing-loans-ratio (Accessed 12 July 2018).
15 BAM (2016). Rapport annuel 2016. Pg.13.16 BAM (2017). Communiqué du Comité des établissements de Crédit relatif à l’agrément pour l’exercice de
l’activité bancaire participative. https://ribh.files.wordpress.com/ (Accessed 12 July 2018).17 Le Matin (2018). L'offre enrichie par la Mourabaha immobilière. 11 Feb 2018.
https://lematin.ma/journal/2018/loffre-enrichie-mourabaha-immobiliere/287005.html (Accessed 10 Sept 2018).18 Bloomberg (2018). “Morocco adopts more flexible exchange”. https://www.bloomberg.com/news/articles /2018-
01-12/morocco-adopting-more-flexible-exchange-rate-to-boost-standing (Accessed 12 July 2018).19 Challenge (2017). Bank Al Maghrib change de statut. 14 July 2017. http://www.challenge.ma/bank-al-maghrib-
change-de-statut-86346/20 BAM (2018).21 Direction du Trésor et des Finances Extérieures (DTFE) (2017). Note de conjoncture premiers résultats 2017,
https://www.finances.gov.ma/. (Assessed 12 July 2018). Pg.37.22 Hassler (2011). Housing and real estate finance in ddle East and North Africa countries.
http://siteresources.worldbank.org/INTMNAREGTOPPOVRED/Resources/MENAFlagshipHousingFinance.pdf(Accessed 10 Sept 2018).
23 Centre for Affordable Housing Finance in Africa (2016). Case Study 1 | The FOGARIM: A Housing LoanGuarantee for the Informally Employed. http://housingfinanceafrica.org/documents/the-fogarim-a-housing-loan-guarantee-for-the-informally-employed/ (Accessed 20 July 2017).
24 BAM (2016). Rapport annuel 2016. Pg.52.25 Ibid.26 HCP (2016). Royaume Du Maroc Haut Commissariat Au Plan. https://www.hcp.ma/file/183899/ (Accessed
12 July 2018).27 Min wage org (2018). Moroccan minimum wage 2018. https://www.minimum-wage.org/international/morocco
(Accessed 12 July 2018).28 HCP. Introduction de Monsieur Ahmed LAHLIMI ALAMI, Haut Commissaire au Plan, à la présentation des
résultats de L'enquêtenationale sur la consommation et les dépenses des ménages au Maroc.29 Ministère de l’Habitat et de la politique de la ville (MHPV). http://www.mhpv.gov.ma/30 MHPV (2018). Etude d’évaluation du programme FVIT de MAD 140,000. 31 MHPV (2018). Etude d’évaluation du programme de logements sociaux à MAD 250,000.32 Ibid.33 MHPV (2018). ‘Etude d’évaluation du programme FVIT de MAD 140,000’.34 HCP (2017). https://www.hcp.ma/Note-d-information-du-Haut-Commissariat-au-Plan-sur-le-parc-de-logements-
au-Maroc-a-l-occasion-de-la-journee-mondiale-de_a2020.html35 HCP (2014). ‘Habitat au Maroc : Situation du parc de logements et statut d’occupation 2014’.
https://www.hcp.ma/downloads/RGPH-2014_t17441.html (Accessed 12 July 2018).36 HCP (2014). Pg. 4.37 HCP (2014). Pg. 10.38 Le 360. http://fr.le360.ma/economie/le-ministere-de-lhabitat-cherche-a-reduire-le-deficit-en-logements-16403839 MHPV (2018). ‘Etude d’évaluation du programme de logements sociaux à MAD 250,000’.40 MHPV (2018). Etude d’évaluation du programme FVIT de MAD 140,000.41 La Tribune (2018). “Plus de 200.000 famillesontbénéficié du programme « villes sans bidonvilles », selonl’Habitat”.
22 May 2018.https://lnt.ma/plus-de-200-000-familles-ont-beneficie-programme-villes-bidonvilles-selon-lhabitat/(Accessed 12 July 2018).
42 HCP (2014). Pg. 12.43 Oxford Business Group (2014). The Report: Morocco 2014.44 MHPV (2018). “Villes et Zones d’Urbanisation Nouvelles”. http://www.mhpv.gov.ma/45 Garan La Vie Eco. “Bouskoura : le moyen standing à partir de 7 000 DH/m2”.
http://www.garan.ma/old/uploads/images/presse/9.pdf (Accessed 12 July 2018).46 Alliances Développement Immobilier. http://www.alliances.co.ma/images/publications-financieres/14-00256-
Note_dInfo3-14.pdf47 Chef du Gouvernement (2015). Rapport de synthèse sur l’état des lieux du secteur foncier.
http://www.agadirinvest.com/ (Accessed 12 July 2018).48 USAID. “Morocco: Property Rights and Resource Governance”. https://land-links.org/wp-
content/uploads/2016/09/USAID_Land_Tenure_Morocco_Profile.pdf (Accessed 10 Sept 2018).49 World Bank (2018). Doing Business Indicators
2018.http://www.doingbusiness.org/data/exploreeconomies/morocco (Accessed 12 July 2018).50 MHPV (2016). Enquête nationale sur la demande en habitat.http://www.mhpv.gov.ma/ (Accessed 12 July 2018).51 BAM (2017). Communiqué du Comité des établissements de Crédit relatif à l’agrément pour l’exercice de
l’activité bancaire participative.

Africa Housing Finance Yearbook 2018
201
A major change in the year has been in the money markets, with a rise of 16-20percentage points in treasury bill rates, closing at the end of 2017 at 24.32 percentfor 91 days, 27.47 percent for 182 days and 28.84 percent for 365 days.11 Thishas put pressure on banks’ retail interest rates, and impacted substantially on thehousing investment environment.
Access to financeThe Mozambique financial sector has seen an expansion during the last years,although financial access remains limited. FinScope 2014 for Mozambique reportsthat 20 percent of the adult population is banked and another four percent isfinancially included with non-bank institutions; 16 percent of the adult populationhas access to only informal financial mechanisms; and 60 percent (the highest inall the countries studied by FinScope) is excluded entirely from the financialsector.12
The banking sector has 20 registered banks, with the three largest banksaccounting for 73 percent of total banking sector assets. A bank capital adequacyratio of 18 percent in 2016 (up from 17 percent in 2015) is in line with Basel II,and reserves ratio of 27 percent foreign currency and 14 percent national currency.The non-performing loan (NPLs) rate increased slightly to six percent in 2016, up
OverviewMozambique is a very low-income country on the East Coast of Southern Africa.Provisional reports from the 2017 Population and Housing Census put the totalpopulation at 28.8 million people.1 One third of the population lives in cities.With an urbanisation rate estimated at 3.81 percent per annum, however, thisproportion is expected to increase in line with urban growth patterns across thecontinent.
The country suffers from high levels of poverty and vulnerability. While povertyrates have improved, they are still high, estimated at 41-45 percent of the nationalpopulation in 2014/15.2 GDP per capita reached a still low ‘high’ of US$519 in2017.3 In 2017, the United Nations Development Programme’s (UNDP) HumanDevelopment Report (HDR) ranked Mozambique 180th out of 189 countries.4
High unemployment (25 percent in 2017)5 persists while the vast majority of thelabour force relies on subsistence farming and informal activities. The governmentapproved a long-term National Strategy for Development, Estratégia Nacional deDesenvolvimento (ENDE) for the 2015 to 2035 period.6 The ENDE placesparticular emphasis on industrialization and identifies agriculture, fisheries, industrialdiversification, infrastructure, the extractive industries and tourism as key priorityareas.
The economy in Mozambique has been volatile in the past few years, in part as aresult of declining global commodities prices and a fall in agricultural productiondue to climatic change, but also due to an unstable political environment, asuspension of donor support to the national budgets, and a downward review ofthe sovereign rating.7 By the end of 2016, the Bank of Mozambique intervenedwith monetary policy that contained the inflationary pressure and stabilised theMetical exchange rate, which had depreciated by 60 percent in 2015. By August2018, the annual inflation rate was at 5.02 percent, up from 2.33 percent in April2018, but down dramatically from its November 2016 high of 26.35 percent.8 InAugust 2018, the Central Bank announced annual GDP growth of 3.4 percent9
down from 3.8 percent in 2016, and well below the 8.8 percent average of thepast twenty years. KMPG reports that more than half of GDP growth in 2016resulted from the tertiary (services) sector, of which housing (8.7 percent growth)and financial services (17.9 percent growth) were the most productive. Theconstruction sector grew by 11.4 percent in 2016, but slowed in 2017 due to theimpact of the exchange rate and rising interest rates on the import of materials.10
MozambiqueKEY FIGURES
Main urban centres Maputo
Exchange rate: 1 US$ = [a] 16 Jul 2018PPP Exchange rate (Local currency/PPP$) 1 Mozambican metical = [b]Inflation 2016 [b] | Inflation 2017 [b] | Inflation 2018 [b]
60.03 Mozambican metical
21.2019.20 | 17.5 | 10.56
Population [b] | Urban population size [b]Population growth rate [c] | Urbanisation rate [b]Percentage of the total population below National Poverty Line [c]Unemployment rate [c]
29 668 834 | 9 736 1252.87% | 3.81%46.10%22.6%
GDP (Current US$) 2017 [a] | GDP growth rate annual 2017 [b]GDP per capita (Current US$) 2017 [b]GNI per capita (Current US$) 2017 [b]Gini co-efficient [d]HDI global ranking 2017 [d] | HDI country index score 2017 [d]
US$12 334 million | 3.71%US$415US$42045.70180 | 0.437
Is there a deeds registry? Number of residential properties that have a title deed [e]Lending interest rate [b]Mortgage interest rate | Mortgage term (years) [e]DownpaymentMortgage book as a percentage of the GDPEstimated number of mortgages Price to Rent Ratio in City Centre [f] | Outside City Centre [f]Gross Rental Yield in City Centre [f] | Outside City Centre [f]Construction as a % of GDP
yes161 66327.86%30% | 2020%1.00%60015.16 | 17.716.60% | 5.65%n/a
What is the cost of standard 50kg bag of cement? What is the price of the cheapest, newly built house by a formaldeveloper or contractor? (Local currency)What is the price of the cheapest, newly built house by a formaldeveloper or contractor? (US$) What is the size of this house (m2)? What is the average rental price for this unit (US$)? What is the minimum stand or plot size for residential property?
US$6.00 3 301 650 Mozambicanmetical
US$55 00065m2
US$300150m2
Ease of Doing Business Rank [g]Number of procedures to register property [g]Time to register property (days) [g]Cost to register property (as % of property value) [g]
138640 days5.10%
NB: Figures are for 2018 unless stated otherwise.
[a] Coinmill.com[b] World Bank World Development Indicators[c] World Bank Open Data[d] UNDP Development Indicators[e] National Institute of Statistics of Mozambique[f] Numbeo[g] World Bank Doing Business

202
from four percent in 2014. Lending rates remain very high, with prime ratesincreasing by about 10.7 percentage points in 2017 and settling at about27 percent by the end of 2017.13 In August 2018, Banco de Mozambiquedecreased the Standing Lending Facility to 18 percent and prime lending rates to21.75 percent.14
Most of Mozambique’s commercial banks offer a mortgage product, but themortgage loan to GDP ratio is very low and was measured at 0.91 percent at theend of 2014 according to Banco de Moçambique. Banks’ mortgage portfoliosrepresent 2.42 percent of total outstanding loans. The conditions for mortgageloans are generally restrictive, reflecting the banking industry’s austerity. Loan-to-cost maximums are generally set at 80 percent. Commercial banks requestanother property or fixed assets as collateral for a transition loan at least until theconstruction is 80 percent completed and can thus be mortgaged. Mortgageinterest rates are set at around five percent above prime; as a result, current rateshover around 30 percent with a repayment term of 15, 20 or 25 years and aminimum downpayment of 30 percent. The minimum loan amount is aroundMZN 300 000 (US$5 000).
To make housing loans more accessible, some banks offer property leasing or rent-to-buy schemes in which the property is made available on a rental basis to atenant who has an option to buy the property at the end of the lease. The Fundfor Housing Promotion (FFH) has agreements with several banks to makemortgage loans accessible to public employees. These loans have shorter terms,sometimes of five to ten years. In some cases, the lender requires a guarantee orother forms of collateral. Construction or developer finance is limited andexpensive, with rates of up to 30-35 percent.
Although the microfinance sector is vibrant, only five microfinance providers offeran explicit housing microfinance product. There have been significant changes inthis industry over the past few years and the depth of financial intermediationremains low. Socremo offers housing loans for home improvements andrehabilitation up to MZN 1 million (US$16 700). Letshego offers a loan product,“Credimola” of up to MZN 1 million (US$16 700) for a minimum of 6 monthsand a maximum of 6 years.15
AffordabilityHousing affordability in Mozambique is severely constrained. Construction costsare estimated to be 30 percent higher than in neighbouring South Africa, as aresult of higher material costs, low labour productivity and high financing costs. Asmall percentage of construction materials are locally manufactured; most materialsare imported from South Africa, Portugal and China. Only the most basic materials(such as cement and wood) are sourced locally. The lack of basic infrastructureadds to the total costs of the development. Plots are often far from main roadsand not linked to the public water and electricity network.
While the minimum wage was revised in April 2018 to MZN 4 142 (US$ 69) amonth, the majority of the population earns less than US$100 a month. Banksoffering mortgages have a minimum loan amount of MZN300 000 (US$5 000),which is far out of reach of the majority, yet still far less than the cheapest housein the market. At the current rate of 28 percent, the minimum loan would beaffordable only to a household with a monthly income of about MZN 22 000(US$370). The mortgage applicant would also need to save a third of the purchaseprice to cover the deposit requirements, registration costs and taxes, and valuationand origination fees.
As a result, the majority of households build incrementally.16 With regards to thelack of affordable housing and the lack of access to finance, most families rely ontheir own savings (as these become available) and local materials to self-constructtheir homes. UN-Habitat suggests Mozambican families have invested at leastUS$3 billion in informal housing in Maputo alone.
Housing affordability is also a challenge in the rental market, where high demandand the lack of adequate supply have resulted in highly inflated prices across allincome brackets with owners setting monthly rents in the upper market fromUS$1 000 to US$10 000 a month in Central Maputo. The lower income marketis offering rental houses from US$100 to US$300 a month in the informalneighbourhoods.
Housing supplyFFH estimates a housing deficit of two million units and over 13.5 million peoplethat require housing. The equivalent of 2.5 million families, or 60 percent of theMozambican population, live in substandard housing; approximately 70 percent ofhouseholds in Maputo live in informal housing. While it is estimated that 23 000units will be needed by the year 2020 in the Maputo areas of Baixa, Museu, Polana,Sommerschield I, Sommerschield II and Marginal, there are currently only 4 500new housing units expected to enter the market in central Maputo over the sameperiod. The housing deficit is also felt in other emerging economic centres in thecountry, such as Tete, Nampula and Pemba.
In its previous five-year plan (2010-2014), the government committed to build100 000 houses and service 300 000 plots of land by 2014. According to localsources, the government only delivered 1922 houses by the end of 2014. Thehousing target in the new five-year plan (2015-2020) is less ambitious with thestate committing to build 35 000 houses by 2019 (7 000 a year), but this numberremains unrealistic as the government of Mozambique continues to experiencefiscal pressures. Some projects began in Marracuene, Tete and Nampula, but thereis not a clear strategy to solve the lack of housing in Mozambique.
There is very limited investment by the private sector in the low-cost housingsector, as investors prefer high-end projects. The Casa Jovem project in Costa deSol, for example, is a 36 hectare housing project under development on theoutskirts of Maputo, and is often mentioned as an example of a private sectoraffordable housing project. The project comprises 1 680 flats in four to eight storeywalk-ups, and 300 houses, of which 100 flats have been constructed to date.However, with the price of flats ranging between US$47 000 and US$130 000, itis out of the reach of most Mozambicans.
Potential developers are also put off by the need to build supporting transportand services infrastructure for new sites and the lack of government support forlow-cost housing schemes.
Over the years, there have been some promising public-private partnershiparrangements, but these have not reached expectations, neither in quantum noraffordability. For example, Intaka started in 2012, with the intention to build 5 000houses in the southern city of Matola, in partnership with Henan GoujiI Mobiliária.Unit prices are between US$63 000 and US$158 100. An agreement with theChinese government promised a further 5 000 houses in other cities. Apartnership with a Spanish construction group also wanted to develop of 4 500houses in three provinces, with prices starting at US$30 000. Construction wassupposed to launch in 2014 but work never started.
Other developments included a US$217 million facility provided through threecredit lines by the Indian government in 2013 to fund public works and housingprojects. The projects included the construction of 1 200 houses in Tete, Zambéziaand Cabo Delgado but work never started. In addition, FFH also signedagreements for new social housing projects in the Provinces of Cabo Delgado,Nampula, Tete and Maputo for 50 000 housing units at a total cost of US$5.5billion. The Municipality of Maputo signed a memorandum in 2017 with TurkishAkay Constructions to build 5 000 houses in Zimpeto, Polana Caniço andKa-tembe with a starting cost of US$70 000. Akay is looking for 2 500 peopleinterested to start the construction of the houses. Nyumba and MCMS hasrecently announced plans to build 12 000 prefab houses T2 with prices starting atUS$16 700 and sizes of 40 m2.
Casa Real, a Mozambican social enterprise focused on affordable housing, has beendeveloping housing at prices between US$10 000 and US$50 000. The first tenof these are expected to be made available for sale in September 2018, withfunding secured to deliver another 100-150 units in the near future. Casa Realplans to launch a rent-to-buy scheme for low income households who wish topurchase their starter units of 26m2, at a price of US$10 000. Rental amountswill be in the range of US$90 – US$100 /month, with priority given to municipalworkers in the Beira area.
Casas Melhoradas in Maputo is another approach to improve housing inunplanned settlements using low cost materials.17 Casa Minha lda, also in Maputo,is an affordable housing project with an innovative strategy to transform a well

Africa Housing Finance Yearbook 2018
203
located informal settlement into a neighbourhood using a land readjustmentapproach. They are building twenty houses in a first demonstration phase with aplan to scale up to 160 houses in the next five years.
Property marketsMozambique’s property market is dominated by the fact that the state owns allland. Land rights may not be sold, mortgaged or otherwise alienated. The LandLaw recognises a “use right to land”, known by the Portuguese acronym DUAT(directo de uso e aproveitamento dos terras). Any investment made on the landitself is considered to be private property and can be bought, sold or mortgaged.
The registration and cadastre systems still only cover limited urban areas. Thislimits the amount of formally financeable land through mortgages and contributesto a general lack of clarity on property titles. According to the Global HousingIndicators, only 20 percent of properties in the greater Maputo area wereregistered in 2009.18 According to the World Bank’s Ease of Doing Businessindicators, Mozambique ranks 104 out of 190 countries in terms of registeringproperty. It takes an estimated 40 days to complete the six procedures involvedin registering property and the process costs an estimated 5.1 percent of theproperty value. Mozambique scores low on the quality of the land administrationindex, with a score of 9.5 out of 30.19
The resale property market is limited. Apart from the fact that secondary salesare difficult due to the protracted procedures and consents necessary because ofleasehold tenure, owners also avoid the risk of forfeiting current rights in theprocess of sale (fearing, for example, that the title may be questioned). Theproblem of collateral enforcement is exacerbated by the long times it takes to gothrough the courts (on average three years), and that there are many instances offraudulent titles.
Policy and regulationThe policy and regulation framework governing the housing sector is based onarticle 109 of Mozambique’s Constitution of 2004, which states that all ownershipof land vests in the state and that all Mozambicans shall have the right to use andenjoy land as a means for wealth creation and social well-being. The Constitutionfurther provides that the state shall recognise and protect land rights acquiredthrough inheritance or by occupation, unless there is a legal reservation, or theland has been lawfully granted to another person or entity.20
Many of the laws governing property date as far back as the 1960s and have notbeen updated since. The Land Law of 1997 reasserts the state’s ownership ofland and provides that individuals, communities and entities can obtain long-termor perpetual rights to use and benefit from land. The Land Law protects thecustomary rights of communities to their traditional territories and recognisesrights obtained through traditional and good-faith land occupancy, as equivalentto rights obtained by government grant. Community land use rights are legally
equivalent to rights granted by the government to individuals and entities. Womenand men have equal rights to hold land. Nationals have unrestricted rights ofaccess to land; foreign individuals and entities must have a local residence and anapproved investment plan.
Housing is coordinated through two government organisations. The NationalDirectorate for Housing and Urbanization (DNUH) and the Fund for HousingPromotion (FFH), both under "Ministério das ObrasPúblicas e Habitação" (MOPH),are the two government agencies with a specific mandate for housing. With thereorganization of the MOPH in 2010, the different departmental roles wereclarified so that DNHU is in charge of the politics side and FFH has the mandateto act as an implementation agency. At the same time, within the MOPH, aDirectorate that is responsible for the building materials was also created.
The Housing Policy of 2011 promised adequate housing at an affordable price forall social groups. The policy recognized the need to improve land management,facilitate access to infrastructure, promote housing construction and enable accessto financing resources. Currently, the Housing Policy is being reviewed by DNUHin collaboration with UN Habitat through a Housing Profile for Mozambique thatwill be the base to implement a new strategy for future plans.
The Financial Sector Development Strategy 2013-2022 (MFSDS) provides anoverall vision and a comprehensive and detailed roadmap for reforms in thefinancial sector. The strategy foresees the elaboration of a policy on housingfinance, which will address necessary reforms for the development of the financialmarket for construction and purchase of housing. A first step in improving housingfinance has already been implemented by revising the status of the FFH, giving itaccess to a variety of refinancing resources. The Economic and Social Plan, andthe Slum Upgrading Strategy, both of 2012, add emphasis to housing and urbaninfrastructure upgrading.
OpportunitiesThe previously healthy economic growth rates and foreign investment inMozambique have significantly slowed in the last years. Analysts suggest that thedevelopment of the natural gas and coal reserves in Mozambique should have abig impact on GDP growth and create opportunities in the industrial andcommercial sectors.21
There are a wide range of opportunities for both public and private sectors tostrengthen the development of housing finance, as well as increase its supply.Possible initiatives include expanding tailored housing loan products to low incomegroups and introducing innovative and competitive incremental self-build housingsolutions. The growing microfinance industry offers potential for the growth alsoof housing microfinance, to support incremental housing delivery and the provisionof starter plots by the FFH.
Source https://www.cgidd.com/
PPP$40 001 – PPP$10 000 000
PPP$23 001 – PPP$40 000
PPP$12 001 – PPP$23 000
PPP$8 001 – PPP$12 000
PPP$5 001 – PPP$8 000
PPP$3 601 – PPP$5 000
PPP$2 401 – PPP$3 600
PPP$1 601 – PPP$2 400
PPP$801 – PPP$1 600
<PPP$800
- - - Average annual household income needed for the cheapest newly built house by a formal developer, 2017 Average annual household income using expenditure, 2017 (PPP$)
MOZAMBIQUE
Annual income profile for rural and urban households based on consumption (PPP$)
No. of households (thousands)
PPP$6 274
PPP$149 909
Rural Urban1 000 500 0 500 1 000
Population: 29 668 834
Urbanisation rate: 3.81%
Cost of cheapestnewly built house:
3 301 650 MZNPPP$155 738
Urban householdsthat could afford thishouse with finance:
1.26%
1 PPP$:21.2 Mozambican
metical

204
With rising building materials, opportunities exist regarding the use of alternateapproaches, technologies and local materials that could help to reduce the needfor imported building materials and speed up the delivery of affordable housing.
Additional sourcesAfrican Development Bank (2018). African Economic Outlook.https://www.afdb.org/fileadmin/uploads/afdb/Documents/Publications/African_Economic_Outlook_2018_-_EN.pdf (Accessed 14 August 2018).
Allen, C. and Johnsen, V. (2008). Access to Housing Finance in Africa: Exploringthe Issues (No. 7) Mozambique. Paper commissioned by the FinMark Trust withsupport from Habitat for Humanity.http://housingfinanceafrica.org/documents/overview-of-the-housing-finance-sector-in-mozambique/ (Accessed 27 Sept 2018).
Banco de Moçambique, Boletim Mensal de Conjuntura Outubro 2017.Relatório Anual – 2016. http://www.bancomoc.mz/fm_pgTab1.aspx?id=106(Accessed 14 August 2018).
Banco de Moçambique, Conjuntura Econômica e Perspectivas de Inflação Junho2018. http://www.bancomoc.mz/fm_pgtab1.aspx?id=105 (Accessed 9 Sept2018).
Broll (2014). The Broll Report 2014/2015. https://www.broll.co.mz/publications/(Accessed 9 Sept 2018).
Casamoçambique. Property market overview.http://casamozambique.co.mz/revista (Accessed 9 Sept 2018).
Cordero, L. (2013). Overview and Trends of Housing Finance in Mozambique.UN-Habitat.
Club of Mozambique. “Employers protest at high interest rates – AIM report.21 June 2018”. http://clubofmozambique.com/news/employers-protest-at-high-interest-rates-aim-report/ (Accessed 14 August 2018).
Club of Mozambique. “Mozambique: Political change boosts risk-reward scorein Southern African markets. 21 June 2018.”http://clubofmozambique.com/news/mozambique-political-change-boosts-risk-reward-score-in-southern-african-markets/ (Accessed 14 August 2018).
Global Real Estate Institute, 2014 Africa GRI 2014: Africa's Most Senior RealEstate Event, Nairobi – 18 & 19 June 2014. Discussion summaries provided byMBA students of the Department of Real Estate and Construction Management(RECM) from the University of Nairobi.
Habitat for Humanity (2011). The Global Housing Policy Indicators AssessmentTool, 23 May 2011.
HOFINET Housing Finance Information Network. Mozambique Macro-Economic Data.http://www.hofinet.org/countries/context.aspx?regionID=8&id=115#732(Accessed 14 August 2018).
Ministry of Finance (2013). Financial Sector Development Strategy.
Ministry of Public Works and Housing (2011). Housing Policy and Strategy forMozambique.
Prime Yield (2013). Guide to Property Investment in Mozambique.
Price Waterhouse Coopers PWC (2015). Real Estate: Building the future ofAfrica, March 2015. https://www.pwc.co.za/en/publications/real-estate-building-the-future-of-africa-2015.html (Accessed 9 Sept 2018).
Standard Bank (2016). Monthly economic newsletter, Edition June 2016.http://www.standardbank.co.mz/pt/Boletim-Economico (Accessed 9 Sept 2018).
World Bank. World Development indicators - Country profile Mozambique.http://databank.worldbank.org/data/views/reports/reportwidget.aspx?Report_Name=CountryProfile&Id=b450fd57&tbar=y&dd=y&inf=n&zm=n&country=MOZ (Accessed 14 August 2018).
World Bank - Doing Business. Ease of doing business in Mozambique.http://www.doingbusiness.org/data/exploreeconomies/mozambique/#registering-property (Accessed 14 August 2018).
International Monetary Fund African Department. Republic of Mozambique :Selected Issues. 7 March 2018.http://www.imf.org/en/Publications/CR/Issues/2018/03/07/Republic-of-Mozambique-Selected-Issues-45702 (Accessed 14 August 2018).
International Monetary Fund. Press Release No. 17/290. IMF Staff concludesvisit to Mozambique. 19 July 2017.http://www.imf.org/en/News/Articles/2017/07/19/pr17290-imf-staff-concludes-visit-to-mozambique (Accessed 14 August 2018).
Websites http://www.ine.gov.mz/www.bancomoc.mz
1 XinhuaNet (2017) “Mozambique has 28.8 million people: census.” 29 December 2018.http://www.xinhuanet.com/english/2017-12/30/c_136860636.htm (Accessed 23 Sept 2018).
2 Ministry of Economics and Finance (2016). Poverty and Well-Being in Mozambique: Fourth National PovertyAssessment (IOF 2014/15). https://www.wider.unu.edu/sites/default/files/Events/PDF/Abstract_Executive_Summary_EN_4Eval_0.pdf (Accessed 23 Sept 2018).
3 Trading Economics (2018). Mozambique GDP per capita. https://tradingeconomics.com/mozambique/gdp-per-capita (Accessed 23 Sept 2018).
4 UNDP (2018). Human Development Indices and Indicators: 2018 Statistical Update. Briefing note forcountries on the 2018 Statistical Update: Mozambique.http://hdr.undp.org/sites/all/themes/hdr_theme/country-notes/MOZ.pdf (Accessed 23 Sept 2018).
5 Trading Economics (2018). Mozambique Unemployment Ratehttps://tradingeconomics.com/mozambique/unemployment-rate (Accessed 23 Sept 2018).
6 Republica de Mocambique (2015). Estratégia Nacional de Desenvolvimento.http://extwprlegs1.fao.org/docs/pdf/moz147210.pdf (Accessed 23 Sept 2018).
7 KPMG (2017). Banking Survey 2017. November 2017. http://www.amb.co.mz/index.php/estudos-e-publicacoes/pesquisa-do-sector-bancario/75-banking-survey-2017 (Accessed 27 Sept 2018).
8 Trading Economics (2018). Mozambique Inflation Rate. https://tradingeconomics.com/mozambique/inflation-cpi (Accessed 27 Sept 2018).
9 Banco de Moçambique (2018). Comité de Política Monetária. Cominicado No. 04/2018. Maputo, 30 deAgosto de 2018. http://www.bancomoc.mz/fm_pgTab1.aspx?id=16 (Accessed 27 Sept 2018).
10 KPMG (2017). Banking Survey 2017. November 2017. http://www.amb.co.mz/index.php/estudos-e-publicacoes/pesquisa-do-sector-bancario/75-banking-survey-2017 (Accessed 27 Sept 2018).
11 KPMG (2017). Banking Survey 2017. November 2017. http://www.amb.co.mz/index.php/estudos-e-publicacoes/pesquisa-do-sector-bancario/75-banking-survey-2017 (Accessed 27 Sept 2018).
12 Murambire, B (2018). Capacitação de Jornalistas (Sistema Financeiro). FSDMoç 25 Julho 2018.http://fsdmoc.com/wp-content/uploads/2018/07/Apresentação-sobre-Inclusão-Financeira_Conceitos-Gerais.pdf (Accessed 23 Sept 2018).
13 KPMG (2017). Banking Survey 2017. November 2017. http://www.amb.co.mz/index.php/estudos-e-publicacoes/pesquisa-do-sector-bancario/75-banking-survey-2017 (Accessed 27 Sept 2018).
14 Associação Moçambicana de Bancos (2018). Communicado. Maputo aos 31 de Agosto de 2018.www.bancomoc.mz (Accessed 27 Sept 2018).
15 See Letshego’s website: https://www.letshego.com/mozambique (Accessed 23 Sept 2018).16 Centre for Affordable Housing Finance (2018). Housing Investment Chronicles.
http://housingfinanceafrica.org/documents/mozambique-housing-investment-chronicles/ (Accessed 9 Sept2018).
17 For more details, see http://casasmelhoradas.com (Accessed 23 Sept 2018). 18 Global Housing Indicators (2009). Maputo, Mozambique.
http://globalhousingindicators.org/en/content/maputo-mozambique (Accessed 23 Sept 2018).19 World Bank (2018). Doing Business: Ease of Doing Business in Mozambique.
http://www.doingbusiness.org/en/data/exploreeconomies/mozambique#DB_rp (Accessed 23 Sept 2018).20 For an English translation of Mozambique’s 2004 constitution (as updated in 2007) see
https://www.constituteproject.org/constitution/Mozambique_2007?lang=en (Accessed 23 Sept 2018).21 Instituto National Estadistica (2016). IESE Instituto de Estudos Sociais e Econômicos, Boletim nº 89 Junho
2016. http://www.ine.gov.mz/ (Accessed 14 August 2018).

Africa Housing Finance Yearbook 2018
205
settlements.9 The unavailability of serviced land has been flagged as one of thekey challenges facing housing development. In response, a target has been set toservice 26 000 new residential plots by 2019, with an estimated allocation ofN$915.2 million for 2018/19 and N$1.4 billion in 2019/20.10 The 2018/19medium-term budget allocates 9.2 percent of the budget to housing and land.11
Access to financeThe Bank of Namibia, Namibia’s Central Bank, regulates all banking activity in thecountry. Insurance companies and microlenders are regulated by the NamibiaFinancial Institutions Supervisory Authority (NAMFISA). There are eight licensedcommercial banks in Namibia: Bank Windhoek Limited, First National BankNamibia Limited, Nedbank Namibia Limited, Standard Bank Namibia Limited,Trustco Bank Namibia Limited, Banco Atlantico, Bank BIC Namibia Limited andLetshego Bank Namibia Limited. First National Bank Namibia Limited, StandardBank Namibia Limited, Nedbank Namibia Limited and Bank Windhoek Limiteddominate, with all the other banks being fairly new entrants into the Namibianbanking sector. These four banks collectively made up 98.9 percent of the totalbanking assets in 2017, growing from 98.0 percent in 2016.12
OverviewNamibia is a middle income country in Southern Africa, with a GDP per capita ofUS$5 555 at current prices in 2017, up by US$214 from 2016.1 Namibia hasbeen one of Sub-Saharan Africa's most politically stable countries since itsindependence in 1990, which has aided it in becoming one of the most attractiveinvestment destinations in the region.
Real GDP growth in Namibia was -0.8 percent in 2017, down from 0.7 percentin 2016. According to the African Economic Outlook Namibia profile (2018) andNamibia Statistics Agency, this was due to continued fiscal consolidation by centralgovernment, which could be worsened by weak revenues from the SouthernAfrican Customs Union (SACU)2 and limited investment in the mining sector. Inthe first quarter of 2018, growth was recorded at -0.1 percent.3 While this showsa negative picture of the economy, it is an improvement from the 2017 average.Subdued growth in 2017 followed a period of impressive growth. Public debt stillstands at 44.3 percent of GDP. Inflation was 6.2 percent in 2017.4 This is set todecrease following better crop production after the drought.5 Real GDP growthis projected to reach 1.1 percent in 2018 and 2.9 percent in 2019 due to aprojected increase in agriculture and mining production and the manufacturingsector.6 Agriculture and extractive industries are the main sectors driving growthin Namibia with mining contributing 20.6 percent to GDP.
The bulk of Namibia’s imports (vehicles, machinery, food products and otherconsumables), at 56.2 percent, are sourced from South Africa followed by Zambiaat 7.0 percent and China at 5.9 percent. According to the African EconomicOutlook, Namibia’s key exports include diamonds, copper cathodes, fish, copperores and zinc. Key export destinations are South Africa at 26.7 percent andBotswana at 13.3 percent. The Namibian dollar is pegged to the South AfricanRand and monetary policy to contain inflation. This leaves the Namibian economyhighly vulnerable to shocks in the South African economy as well as the Angolanand Zimbabwean economies.
The provision of affordable housing falls within the Support to Planning,Infrastructure and Housing Programme under the mandate of the Ministry ofUrban and Rural Development responding to the Harambee Prosperity Plan’spillar of social progression.7 In addition, Namibia’s fifth National DevelopmentPlan has the following targets: to reduce the percentage of Namibians living inimpoverished houses to 12 percent (which is currently growing at 14.2 percentyear-on-year)8; to service 6 500 erven by 2022 and to upgrade two informal
Namibia KEY FIGURES
Main urban centres Windhoek
Exchange rate: 1 US$ = [a] 23 Aug 2018PPP Exchange rate (Local currency/PPP$) 1 Namibian Dollar = [b]Inflation 2016 [b] | Inflation 2017 [c] | Inflation 2018 [c]
13.40 Namibian Dollar6.67.0 | 6.2 | 4.0
Population 2016 [d] | Urban population size 2016 [d]Population growth rate 2016 [d] | Urbanisation rate 2016 [d]Percentage of the total population below National Poverty Line 2016 [d]Unemployment rate 2016 [d]
2 280 716 | 1 068 6251.90% | 4.25%
10.7%34.00%
GDP (Current US$) 2017 [d] | GDP growth rate annual 2017 [d]GDP per capita (Current US$) 2017 [d]GNI per capita (Current US$) 2017 [d]Gini co-efficient 2016 [d]HDI global ranking 2016 [e] | HDI country index score 2016 [e]
US$13 159 million | -8.8%US$5 555US$5 47457.2125 | 0.340
Is there a deeds registry? Number of residential properties that have a title deed [d]Lending interest rate [f]Mortgage interest rate | Mortgage term (years) [g]DownpaymentMortgage book as a percentage of the GDPEstimated number of mortgages Price to Rent Ratio in City Centre [h] | Outside City Centre [h]Gross Rental Yield in City Centre [h] | Outside City Centre [h]Construction as a % of GDP 2017 [d]
Yes92 16110.12%11.50% | 200.00%2.10%n/a8.95 | 9.8111.17 | 10.192.90%
What is the cost of standard 50kg bag of cement? What is the price of the cheapest, newly built house by a formaldeveloper or contractor? (Local currency) [i]What is the price of the cheapest, newly built house by a formaldeveloper or contractor? (US$) [i]What is the size of this house (m2)? What is the average rental price for this unit (US$)? What is the minimum stand or plot size for residential property? [i]
n/a
280 000 Namibian Dollars
US$20 89635m2
n/a300m2
Ease of Doing Business Rank [k]Number of procedures to register property [k]Time to register property (days) [k]Cost to register property (as % of property value)
106852 daysn/a
NB: Figures are for 2018 unless stated otherwise.
[a] Coinmill.com[b] World Bank World Development Indicators[c] Bank of Namibia [d] Namibia Statistics [e] UNDP Development Indicators[f] Namibia Financial Stability Report https://www.bon.com.na[g] First National Bank Namibia[h] Numbeo[i] National Housing Enterprise[j] Institute of Public Policy Research[k] World Bank Doing Business
206
According to the NAMFISA quarterly statistical bulletin, there were 7 056registered non-banking financial institutions as at Q4 2017 which includes138 pension funds and 317 microlenders.13. There are 333 179 members of thepension funds in Namibia with a net income of N$13 424 million (US$1 billion).Forty-four percent of investment from pension funds is invested in Namibia and2.2 percent is invested in property. Microloans are divided into term loans andpayday loans. Term loans refers to loans provided for between six and 60 monthsand payday loans are loans provided on a monthly basis and repayable within 30days. The total value of the loan book for microlending at the end of 2017 wasN$5 460 million (US$407 million), of which 98 percent was allocated to termloans. There are 30 913 term loans and 147 397 payday microloans. The averageloan size for term microloans is N$23 777 (US$1 775) and for payday microloansthis is N$1 620 (US$121).14
According to the Namibia Statistics Agency GDP Q1 2018 report,15 the financialintermediation sector experienced slow growth at 1.4 percent in real value addedin the first quarter of 2018, 0.4 percent less than the same quarter in 2017. Thiswas mainly due to the insurance sub-sector. The banking sector, however,increased by 0.4 percent in real value added in Q1 2018 compared to Q1 2017.This growth is due to the “improvement in the overall liquidity position of banks”16
from Q1 2017 to Q1 2018. Bank deposits grew by 5.9 percent from Q1 2017to Q1 2018 to N$91 060 million (US$6 795 million).
Commercial banks in Namibia are generally regarded as well-capitalised andprofitable. Although the banks appear to be healthy, they are nevertheless exposedto risks such as credit risk arising from household mortgages. According to the Bankof Namibia’s Financial Stability Report, the ratio of household debt to disposableincome was 83.3 percent at the end of 2017, down by 1.2 percent from 2016. Thiswas due to the contraction in instalment credit and mortgage lending to households,the same as the previous year. Household debt in Namibia is mainly made up ofmortgage lending at 51.5 percent of the total loan book,17 of which 38 percent istowards residential mortgages.18 The concentration of lending in mortgagesheightens the banking sector’s vulnerability to shocks in the property market.Growth in mortgage lending continued to slow by 0.7 percent from 2016 to 2017,standing at 8.0 percent in 2017. Overall poor domestic economic conditions andthe introduction of maximum loan-value ratios for non-primary residentialmortgages at 80 percent and changes to the Credit Agreement Act added to slowergrowth in credit extended to households.19 Mortgage non-performing loans makeup 58 percent of the share of total non-performing loans. Household indebtednessslowed from 9.3 percent in December 2016 to 6.7 percent in 2017.
According to the 2018 Namibia Financial Stability Report, while house priceinflation decelerated by 1.4 percent from 2016 to four percent at the end of 2017,the stability of the financial system is not under threat currently. This is due to avariety of factors such as sustained demand for housing supply (coupled with slowdelivery) and maximum loan-to-value regulation for secondary properties.20 TheFinancial Stability Report predicts a more stable housing market in Namibia withan increased supply of housing and a slower rate of price increase.
The International Monetary Fund (IMF) (2018) indicates that house prices areovervalued by about 10 percent from 18 percent three years ago.21 This, coupledwith a house price index that far outperformed the consumer price index from2010 to end of 2017, has also raised concern for the market and banks’ mortgageexposure. In addition, it's important to note is that there has been increasedpressure on households’ disposable income in the light of a slowing economy andthe impact of the economic slowdown in South Africa.
The infrastructure to facilitate mortgage lending is fairly well-developed. TheWorld Bank’s 2018 Doing Business Report scores Namibia seven out of a possibleeight on the “depth of credit information” index, as the country now has fourprivate credit bureaus. This score is well above the Sub-Saharan Africa score ofthree out of eight. In 2016, Namibia improved access to credit information byguaranteeing by law borrowers’ right to inspect their own data. Namibia scoreshigh in ease of getting credit, ranking 68 out of 190 countries in 2018, down sixplaces from 2017.
Microlending for housing purposes is on the rise through organisations such asthe Shack Dwellers Federation of Namibia (SDFN), providing building loansranging from N$30 000 (US$2 238) to N$45 000 (US$3 358) with the average
being N$35 000 (US$2 612). The loans are repayable within a period of 11 yearsat an annual interest rate of about six percent and a monthly charge of five percent.
AffordabilityLiteracy levels are significantly high at 87 percent of the population aged 15 yearsand over.22 The Gini coefficient has decreased over the years to 0.56 indicatingreduced levels of inequality. The proportion of households considered poor (notable to afford US$38 on basic needs per month) has decreased by 2.1 percentfrom 2009/10 to 2015/2016 to 17.4 percent, but the number of severely poorhouseholds (not able to afford US$29 per month on basic needs) increased by1.1 percent to 10.7 percent. This indicates that almost 30 percent of thepopulation needs support.
The key sources of income are salaries and wages at 53 percent, followed bypensions at 11 percent, subsistence farming at 10.6 percent, grants at 9.6 percent,and business income at 9.1 percent. There are 125 425 households with outstandingdebt in Namibia, which makes up 23 percent of the household population with 70percent of this debt in urban areas. Debt in the form of bonds makes up just overfive percent, indicating that about 6 300 households have an outstanding bond. Theaverage household consumption in Namibia per annum is N$119 065 (US$8 885)and the average annual per capita consumption is N$28 434 (US$2 121).Households in Namibia spend most of their income on food and beverages (36.3percent). This is sharply followed by housing at 31.8 percent, making up N$20 103million (US$1 500 million) of total annual household expenditure.
According to the December 2017 First National Bank (FNB) Namibia HousingPrice Index, the median house price for 2017 was N$1.1 million (US$82 089) upfrom N$850 000 (US$63 432) in 2016. Just over 20 percent of households livein impoverished housing. House prices for the small, medium and large segmentsrange accordingly (based on data from the Namibia Financial Stability Report):
n Small: N$448 000 (US$32 432) ≤ value <N$1 368 000 (US$102 090);n Medium: N$1368 000 (US$102 090) ≤ value < N$3 129 000 (US$233 507);n Large: N$3 129 000 (US$233 507) ≤ value < N$6 500 000 (US$485 074).
According to an article in the Namibian: a middle low income earner earnsbetween N$3 000 and N$5 999 a month; upper low income earners earnbetween N$6 000 and N$8 999 a month; and a middle income earner earnsbetween N$9 000 and N$14 000 a month.23
The cost of a 50kg bag of cement is US$7.5. The unemployment rate wasrecorded at 34 percent in 2016, a 6.6 percent increase from 2014, indicating adecreasing labour force and lack of employment opportunities both of whichimpact on housing affordability levels.24
Housing supplyBased on the 2016 Income and Expenditure Survey, 17 percent of households havetitle deeds, 4.4 percent have leasehold certificates, 12.4 percent have land rightcertificates, and 22 percent of properties are rental. Key stakeholders in the Namibianhousing supply market include government, civil society and the private sector.
The National Housing Enterprise (NHE), a state-owned company under the Ministryof Urban and Rural Development, is responsible for housing delivery and access tohousing finance in Namibia in line with the Harambee Prosperity Plan and the 5th
National Development Plan to provide 5 000 of the 20 000 housing delivery targetin the next four years. In addition, 46 622 houses need to be delivered by the NHEbased on the Vision 2030 strategy. The NHE has in the past been tasked to deliverthe Mass Housing Programme, which has only delivered 1 500 houses and thereare still 87 000 people on the NHE waiting list.25 The NHE indicates the mainchallenges facing the industry include lack of serviced land, land tenure and propertyrights issues, limited financial resources, and a growing demand in the face of a110 000 housing backlog.26 The NHE targets households earning a maximum ofN$30 000 per month and individuals earning a maximum of N$20 000 a monthwith a variety of housing finance products offered. The maximum loan size offeredis N$600 000, including transfer and registration fees at prime plus one percent over20-30 years.27 Some of the projects underway include: construction of 200 housesat Oshakati at approximately N$500 000 (US$37 313); construction of 135 housesin Rundu (a joint venture with Salami Island Investments) with houses estimated tobe below N$500 000; and 50 houses in Omuthiya.

Africa Housing Finance Yearbook 2018
207
According to the Development Bank of Namibia (DBN) 2017 Annual Report, TheDBN, which is responsible for financing development infrastructure, has providedfinancing for the servicing of 498 erven (N$114 million or US$8.5 million) andfor the construction of 736 housing units (N$436 million or US$32.5 million) inNamibia to address the need for affordable land and housing.28
Ndhlovu and Remmert (2018) indicate that the three main civil society groupsactive in Namibia are SDFN, the Namibia Housing Action Group (NHAG) andDevelopment Workshop Namibia.29 However, SDFN is the only group activelyproviding houses and housing finance supported by NHAG, acting as a communitysavings scheme. The Ministry of Urban and Rural Development has allocatedUS$7 million to SDFN for this financial year and US$10 million for next financialyear.30 Thus far, the SDFN has constructed over 4 000 houses.
The Otjomuise project is implemented by the NHE and the City of Windhoek.Igen Africa has been appointed project manager and is partnering with the SouthAfrican division of Calgro M3 and Namibian Contractor, Afrikuumba. The projectamounts to approximately N$1 billion (US$74.6 million). Extension 10 has begunwith 364 two to three-bedroom units built out of 3 600 planned over threephases, including provision for social facilities.
The private sector continues to engage with the demand for affordable housing.To this end, Ohorongo Cement, FNB Foundation and Pupkewitz Foundationpartnered with SDFN for the construction of houses for low income families inearly 2016, by pledging N$3 million (US$ 223 880) to SDFN and NHAG in March2016. Thus far 292 houses have been constructed in the Hardap region. Housescost about N$32 000 each to build and beneficiaries pay off this cost over 11 to20 years at a five percent interest rate. Nine housing groups were formed with328 members, making this partnership particularly important because the localcommunity (mainly women) were capacitated in the process to make bricks andexcavate the foundations of their homes.
In July 2017, Trustco Properties launched the Ombala Estate, offering affordabletwo-bedroom and one-bathroom homes targeted at joint monthly incomes ofN$35 000 (US$2 612). Serviced plots starting at 300m2 for the affordable marketare available, spanning a total area of 130 103m2. The starting price for a plot andplan is N$689 000 (US$51 418), which includes the transfer and conveyancingcosts. Trustco Bank offers financing.
There are various plans by government through public private partnerships toconstruct housing as well as to service land for housing in the near future.Examples include investment earmarked by Helao Nafidi Town Council, which isputting aside US$0.8 million for housing. City of Windhoek aims to service 300erven by 2019 in Rocky Crest31 and invest US$11 million in 1 200 affordablehousing units for example.32 Government generally provides land, and partnersprovide technical expertise and financing. In addition, various private organisationshave housing planned for Namibia. These include Trustco and Groot Systems, a
Namibia-based investment company. Groot has two housing projects planned forNamibia: Trotwood Suburb with 320 units planned and valued at US$32.6 million,to start in September 2018 with house prices ranging from N$29 000(US$22 014) to N$750 000 (US$55 970); and Westerville Township with 3 000units planned at a value of US$30 billion.
Property marketsAccording to the World Bank’s 2018 Doing Business Report, Namibia ranks 175out of 190 countries for ease of registering a property, a drop from 2017’s rankingof 174. On average the eight procedures involved in registering a property (higherthan the Sub-Saharan Africa number of 6.2 days) still take 52 days and cost 13.8percent of the property value. In comparison to Sub-Saharan Africa, the time toregister property in Namibia is lower by 7.2 days and higher in terms of cost ofregistering property, indicating the need for improved efficiency to offercompetitive advantage. The quality of land administration for reliability ofinfrastructure, transparency of information, geographic coverage, land disputeresolution and equal access to property rights ranks 8.5 out of 30 (with 30 beingthe best score), slightly lower than the Sub-Saharan average of 8.6 and much lowerthan Mauritius and South Africa which rank 17.0 and 13.5 respectively.
The cost of transfer and registration of full title residential property in 2018remains the same as 2017, averaging 1.6 percent of the purchase price.33 Whenthe municipality serviced its own erven, it could offer subsidised plots to poorerresidents for as little as N$6 900 for a 300 m2 erf. The cost of servicing the plotswas a mere N$69.35 per m2. They were then sold at a subsidised rate of N$23/m2, but in some areas plots were being sold by private developers at a cost ofN$505 000 for a 600m2 erf, effectively placing it beyond the reach of thosehouseholds most in need.34 The same sentiment is expressed by the NationalPlanning Commission of Namibia in that there is a perception that stakeholdersinflate house prices to maximise profits.35
The average time on the market for properties in Namibia is 24 weeks and fourdays, much higher than the South African average of 14 weeks in Q1 of 2018.36
This was significantly lower for the low and middle income market segments at13 and 22 weeks respectively, indicating a greater demand in these segments.
Namibia has a history of exorbitant house price inflation; however, the market iscorrecting itself as there has been constant contraction in house price growth.37
The average house price dropped to N$1.1 million over the past year (with declinesin prices seen mostly in the higher income segments) and is expected to grow atbetween five and six percent in 2018.38 According to Nambhu (2018), one of thekey reasons for the drop in house prices is the new supply of serviced land in theaffordable housing market.39 Prices in the lower income segment have grown by3.4 percent year-on-year.40 Housing supply is growing at 4.9 percent year-on-year.41
According to the FNB Housing Index, December 2017, housing transactions wereup 16.2 percent in 2017, mainly driven by new supply in the affordable housingsegment. The FNB Housing Index predicts slowing demand in the middle to higher
Source https://www.cgidd.com/
PPP$40 001 – PPP$10 000 000
PPP$23 001 – PPP$40 000
PPP$12 001 – PPP$23 000
PPP$8 001 – PPP$12 000
PPP$5 001 – PPP$8 000
PPP$3 601 – PPP$5 000
PPP$2 401 – PPP$3 600
PPP$1 601 – PPP$2 400
PPP$801 – PPP$1 600
<PPP$800
- - - Average annual household income needed for the cheapest newly built house by a formal developer, 2017 Average annual household income using expenditure, 2017 (PPP$)
NAMIBIA
Annual income profile for rural and urban households based on consumption (PPP$)
No. of households (thousands)
PPP$21 716
PPP$24 530
Rural Urban80 60 40 20 0 20 40 60 80
Population: 2 280 716
Urbanisation rate: 4.25%
Cost of cheapestnewly built house:
280 000 NADPPP$42 424
Urban householdsthat could afford thishouse with finance:
48.02%
1 PPP$:6.6 Namibian
dollar

208
income segments and that increased mass housing supply in the lower incomesegment will target backlogs.42 The same trend has been seen for rentals.
Policy and regulationTwo key changes to the regulatory environment in Namibia over the past yearhave been the loan-to-value regulation under the Banking Institutions Act, 1998(Act No.2 of 1998) for non-primary residential properties Namibia to promoteresponsible borrowing, “reduce concentration risk for commercial banks” and“promote preferential access to housing for first time home buyers”,43 and theUrban and Regional Planning Bill (Bill 13 of 2017).
The National Development Plan (NDP) was adopted as a medium-term planafter the launch of Vision 2030. Following five reviews of the original plan, theNDP5 was launched in 2017. Speaking at its launch, the Namibian president saidhousing, especially affordable housing, remains a major developmental challengein the country.
The National Housing Policy, revised in 2009, guides all actions taken by theDirectorate of Housing and guarantees the right to a house, especially for theformerly disadvantaged groups of the society. In addition, the Harambee ProsperityPlan aims to deliver 20 000 houses by 2020 and 26 000 serviced plots of land.
There is a new Urban and Regional Planning Bill, Bill 13 of 2017, aimed attransforming the spatial planning sector by introducing a better planning systemfor fast-tracking the provision of affordable housing and well-planned areas.
The Agricultural (Commercial) Land Reform Act, No 6 1995 provides forgovernment acquisition of agricultural land for purposes of land reform andredistribution. The National Resettlement Policy of 2001 and the AffirmativeAction Loan Scheme are designed to resettle landless households on land acquiredunder the Agricultural (Commercial) Land Reform Act. The Communal LandReform Act, No 5 of 2002 regulates the powers of traditional authorities overcommunal land. The Land Boards grant, record, and cancel land rights inconsultation with the traditional authorities.
The National Housing Development Act, No 28 of 2000 establishes a NationalHousing Advisory Committee, which is responsible for establishing a HousingRevolving Fund by local authority councils and regional councils. The LocalAuthorities Act, No 23 of 1992, section 57 to 62 deals with Housing Schemes.
The National Housing Enterprise Act, No 5 of 1993 covers the NHE, which is taskedto provide financial assistance through the delivery of affordable housing and creditfacilities in the form of housing loans to low and middle income households.
The Namibia Financial Institutions Supervisory Authority Act, No 3 of 2001 wasput in place to establish an Authority to exercise supervision over the business offinancial institutions and over financial services. The Namibia Estate Agents Act,No 112 of 1976 was established to provide for the establishment of an EstateAgency Affairs Board. The Pension Fund Act, No 24 of 1956 makes provision forregistered pension funds to be used as a guarantee.
The Sectional Titles Act, No 2 of 2009, came into operation in December 2014.The Act does away with limitations and shortcomings that restricted development,access to land and property. The Deeds Registry Act, No 47 of 1937 (amended)and the Registration of Deeds in Rehoboth Act, No 93 of 1976 (amended),provide for registration of all freehold titles at central registries maintained inWindhoek and Rehoboth.
OpportunitiesWhile the commitment to improve housing conditions in Namibia is prevalent,with renewed effort and commitment from government, there is a need tostimulate increased involvement by the private sector. Momentum is picking upand a number of public private partnerships are being undertaken, with increasedinterest in, and supply of, serviced land and affordable housing. The general housingdemand is known and inflated and speculative house prices are decreasing, leadingto market correction. Importantly, the new loan-to-value regulation targeting non-primary residential property will ensure financial stability. Increased exports anda slow yet steady recovery of the economy is expected (according to the IMF,2018)44 as mining production increases, construction stabilises and manufacturingrecovers. This will increase employment and affordability.
Additional sourcesBank Windhoek (2017). Bank Windhoek announces new interest rates.www.bankwindhoek.com.na (Accessed 29 July 2018).
Mhunduru, E.N. (2017). LTV regulation to curb mortgage lending dominance onloan books. http://www.observer.com.na/index.php/business/item/8015-ltv-regulation-to-curb-mortgage-lending-dominance-on-loan-books (Accessed 4August 2018).
National Planning Commission (2018). Status of the Namibian Economy.http://www.npc.gov.na/ (Accessed 5 August 2018).
Nunuhe, M. (2018). The housing bubble bursts: House prices in Namibia take adip. https://southerntimesafrica.com/site/news/the-housing-bubble-bursts-house-prices-in-namibia-take-a-dip (Accessed 4 August 2018).
The World Bank (2018). Doing Business Indicators: Namibia.http://www.doingbusiness.org/en/data/exploreeconomies/namibia# (Accessed 4August 2018).
1 Namibia Statistics Agency (2018). Preliminary National Accounts, 2017.https://nsa.org.na/ (Accessed 21 July 2018).
2 African Development Bank (2018). 2018 African Economic Outlook:Namibia. https://www.afdb.org/ (Accessed 15 July 2018).
3 Namibia Statistics Agency (2018). Media Release: Update on EconomicStatistics. https://cms.my.na/assets/documents/TSB_and_GDP_Q1_2018_Press_statement.pdf (Accessed 29 August 2018).
4 Bank of Namibia (2017). Annual Report.https://www.bon.com.na/CMSTemplates/Bon/Files/bon.com.na/92/92d106b2-a920-4168-be80-ec1645e42e95.pdf (Accessed 5 August 2018).
5 African Development Bank (2018).6 Ibid.7 The Harambee Prosperity Plan is Namibia’s nationally adopted
development programme from 2016 – 2020. 8 Kalili, N. (no date). Namibian Housing Market: FNB Namibia Holdings.
http://www.unam.edu.na/sites/default/files/state_of_housing_market.pdf(Accessed 30 August 2018).
9 National Planning Commission, Republic of Namibia (2017). Namibia’sFifth National Development Plan. http://www.npc.gov.na/ (Accessed1 September 2018). Pg. 68.
10 Ministry of Finance (2017). Medium Term Expenditure Framework2017/18-2019/20. https://www.bon.com.na/CMSTemplates/Bon/Files/bon.com.na/90/901e521e-2cd3-414b-b4a3-cca346947dc8.pdf(Accessed 19 July 2018).
11 National Planning Commission Namibia, Republic of Namibia (2018).Development Programmes Estimates of Expenditure: Medium TermExpenditure Framework 2018/19-2020/21.http://www.npc.gov.na/?wpfb_dl=309 (Accessed 4 August 2018).
12 Bank of Namibia (2017).13 Namibia Financial Institutions Supervisory Authority (2017). Quarterly
Report Namfisa: Fourth Quarter. https://www.namfisa.com.na/wp-content/uploads/2018/06/Quarterly-Statistica-Bulletin-2017-Q4-1.pdf(Accessed 24 July 2018).
14 Namibia Financial Institutions Supervisory Authority (2017).
15 Namibia Statistics Agency (2018). Gross Domestic Product: FirstQuarter 2018. https://cms.my.na/assets/documents/First_Quarter_GDP_2018.pdf (Accessed 5 August 2018).
16 Namibia Statistics Agency (2018). Gross Domestic Product: FirstQuarter 2018. Pg. 28.
17 Bank of Namibia (2018). Financial Stability Report.https://www.bon.com.na/CMSTemplates/Bon/Files/bon.com.na/99/998aa419-7411-4e75-8024-24ffa12abc23.pdf (Accessed 6 August 2018). Also:International Monetary Fund (2018). IMF Country Report No. 18/56:Namibia. https://www.imf.org/~/media/Files/Publications/CR/2018/cr1856.ashx (Accessed 20 July 2018).
18 Bank of Namibia (2018). Financial Stability Report.https://www.bon.com.na/CMSTemplates/Bon/Files/bon.com.na/99/998aa419-7411-4e75-8024-24ffa12abc23.pdf (Accessed 6 August 2018).
19 Bank of Namibia (2018). Pg. 13. 20 Bank of Namibia (2018). Pg. 34. 21 International Monetary Fund (2018). Namibia: Financial System Stability
Assessment. https://www.imf.org/en/Publications/CR/Issues/2018/03/15/Namibia-Financial-System-Stability-Assessment-45723(Accessed 5 August 2018).
22 Namibia Statistics Agency (2018). Namibia Household Income andExpenditure Survey 2015/16 Report. https://cms.my.na/assets/documents/NHIES_2015-16.pdf (Accessed 5 August 2018).
23 Hartman, A. (2016). Swakop’s Balancing Act with Land.https://www.namibian.com.na/ (Accessed 5 August 2018).
24 National Planning Commission Namibia, Republic of Namibia (2018).Development Programmes Estimates of Expenditure: Medium TermExpenditure Framework 2018/19-2020/21.
25 Nampa (2018). NHE Warms Non-performing Contractors.https://www.namibian.com.na/ (Accessed 5 August 2018).
26 National Housing Enterprise (2017). National Housing Enterprise Strategy2017/18-2022/23. http://www.nhe.com.na/ (Accessed 5 August 2018).
27 Ndhlovu, P. and Remmert,D. (2018).28 Development Bank of Namibia (2017). Annual Report 2017.
http://www.dbn.com.na/index.php/publication-home/annual-reports/file/147-dbn-annual-report-2017 (Accessed 5 August 2018).
29 Ndhlovu, P. and Remmert,D. (2018).30 Namibian Broadcasting Corporation (2018). First lady hands over
houses to Shack Dwellers Federation at the coast. https://www.nbc.na/(Accessed 5 August 2018).
31 De Klerk (2018). Development in Rocky Crest. http://www.we.com.na/(Accessed 5 August 2018).
32 Likela, S. (2018). City plans N$148m housing project.https://www.namibian.com.na/ (Accessed 4 August 2018).
33 Based on calculations from Sauls Jacobs & Co. Law Firm.34 Lennon, J. (2018). How Namibia’s housing shortage became a
humanitarian crisis. https://medium.com/@Jade_Lennon/how-namibias-housing-shortage-became-a-humanitarian-crisis-eef05ba14b9b(Accessed 4 August 2018).
35 National Planning Commission, Republic of Namibia (no date). SpecialProgrammes: Housing Sector. http://www.npc.gov.na/?page_id=424(Accessed 4 August 2018).
36 First National Bank (2018). Property Barometer. https://cdn.ymaws.com/www.saiv.org.za/resource/collection/B70457DF-B11F-442D-94B2-8B1BF7C28C2F/FNB_Property_Barometer_Price_Realism_and_Market_Balance_9_April_2018.pdf (Accessed 4 August 2018).
37 Nambashu, J. (2018). House Prices Fall Again. http://www.property.com.na/blog/house-prices-fall-again (Accessed 4 August 2018).
38 Matthys, D. (2018). House prices to grow by 5% - FNB Housing IndexForecast. https://economist.com.na/33022/markets/house-prices-to-grow-by-5-fnb-housing-index-forecast/ (Accessed 4 August 2018).
39 Nambashu, J. (2018).40 Nambashu, J. (2018).41 Kalili, N. (no date).42 First National Bank (2017). FNB Residential Property Monthly.
https://www.fnbnamibia.com.na/downloads/namibia/housingIndex/HousingIndex201712.pdf (Accessed 4 August 2018).
43 Bank of Namibia in Mhunduru, E.N. (2017). 44 International Monetary Fund (2018). IMF Country Report No. 18/56:
Namibia. https://www.imf.org/~/media/Files/Publications/CR/2018/cr1856.ashx. (Accessed 20 July 2018).

Africa Housing Finance Yearbook 2018
209
2018 compared to the average of 42.6 percent in sub-Sahara Africa.4 There isone central bank and 12 commercial banks,5 with branches mostly concentratedin Niamey, the capital, and other large cities. An agriculture bank (Bagri) wasestablished in 2011 with branches added in 2015 in Niamey and two other cities.A mortgage bank (Banque d’Habitat) was created in early 2011 (but still notoperating to date), and there are some insurance companies, two pensioninstitutions and some microfinance institutions.
Microfinance is steadily growing, with about 29 active Financial Service Providers(FSP). These 29 FSPs disbursed a total of US$55 million to 259 000 borrowersin 2017, and held US$34 million in deposits from 258 000 consumers in thecountry.6 Prior to 2000, the government of Niger offered housing finance andgovernment-subsidised homes to government employees through a public andprivate owned credit and loan institution known as Crédit du Niger (CDN) andthrough a government-owned housing development company called SociétéNationale d’Urbanisme et de Construction Immobilière (SONUCI). The SONUCIis still operating but CDN has been liquidated, and in 2011 was replaced byBanque d’Habitat which is not yet operating to date.
OverviewThe Niger Republic is a landlocked country covering 1 267 000km2 with a youngand growing population of 21.6 million inhabitants in 2018, of which 19 percentlive in towns and cities, making the country less urbanised than other countries inthe region. With one of the highest fertility rates in the world (7.2 children bornper woman),1 Niger has an urban population that is estimated to double in12 years. Thus the demand for housing and other urban infrastructures is toremain very high. The population is concentrated in the narrow strip to the southwhere the main economic activities are farming and herding. Only 12 percent ofNiger is arable land, where the main cash crops are onion, peanuts, sesame andblack-eyed peas.
The country is rich in natural resources such as uranium, petroleum, coal, gold,molybdenum, tin, phosphates, iron ore, gypsum and salt. Among the naturalresources, uranium, gold and petroleum are currently exploited and Niger is oneof the largest producers of uranium in the world. Despite its resources, Nigerremains one of the least developed countries in the world, ranking lowest (189out of 189) on the updated 2018 Human Development Index.2 The countryenjoys relative political stability with peaceful presidential and parliamentarianelections in early 2016, but continues to suffer from external threats along itsborders, including conflicts in Mali and Libya, and religious conflicts such as BokoHaram in Nigeria.
According to the African Development Bank, the 2017 GDP growth was5.2 percent in 2017, mainly driven by increased oil production from Société deRaffinage de Zinder, (SORAZ). SORAZ is a joint corporation between the ChinaNational Petroleum Corporation and the government of Niger. The economicoutlook is good, and growth is estimated at 5.4 percent in 2018 and 5.2 percentin 2019,3 due to the performance of the oil and agricultural sectors. However,the outlook is subject to risks related to oil price shocks, climatic shocks, andconflicts in the neighbouring countries. The country continues to suffer from thecrises in Mali and Libya as security weighs heavily on the socioeconomic outlook,particularly public finances. Furthermore insecurity in the Diffa region due to BokoHaram remains a major economic, social, security and budgetary challenge.
Access to financePenetration of formal financial services, although progressing, remains very low inNiger, with 15.5 percent of adults (aged 15 and above) having bank accounts in
NigerKEY FIGURES
Main urban centres Niamey
Exchange rate: 1 US$ = [a] 21 Sept 2018PPP Exchange rate (Local currency/PPP$) 1 CFA = [b]Inflation 2016 [c] | Inflation 2017 [c] | Inflation 2018 [c]
564.75 CFA franc216.500.20 | 2.40 | 3.90
Population 2017 [b] | Urban population size 2017 [b]Population growth rate 2017 [b] | Urbanisation rate 2017 [b]Percentage of the total population below National Poverty Line 2009 [d]Unemployment rate [e]
21 477 348 | 4 145 7723.82% | 5.35%
45.40%2.60%
GDP (Current US$) 2017 [b] | GDP growth rate annual 2017 [b]GDP per capita (Current US$) 2017 [b]GNI per capita (Current US$) 2017 [b]Gini co-efficient [c]HDI global ranking 2015 [f] | HDI country index score 2015 [f]
US$8 120 million | 4.89%US$378US$360n/a187 | 0.353
Is there a deeds registry? Number of residential properties that have a title deed Lending interest rate [b]Mortgage interest rate [f] | Mortgage term (years)DownpaymentMortgage book as a percentage of the GDPEstimated number of mortgages Price to Rent Ratio in City Centre | Outside City Centre Gross Rental Yield in City Centre | Outside City Centre Construction as a % of GDP
n/an/a5.30%10.50% | 9n/an/an/an/a | n/an/a | n/an/a
What is the cost of standard 50kg bag of cement? [g]What is the price of the cheapest, newly built house by a formaldeveloper or contractor? (Local currency) [g]What is the price of the cheapest, newly built house by a formaldeveloper or contractor? (US$) What is the size of this house (m2)? What is the average rental price for this unit (US$)? [g]What is the minimum stand or plot size for residential property? [g]
US$9.26
7 500 000 CFA franc
US$13 047n/aUS$300200m2
Ease of Doing Business Rank [h]Number of procedures to register property [h]Time to register property (days) [h]Cost to register property (as % of property value) [h]
144435 days6.50%
NB: Figures are for 2018 unless stated otherwise.
[a] Coinmill.com[b] World Bank World Development Indicators[c] IMF World Economic Outlook Database[d] Central Intelligence Agency (CIA) World Factbook[e] UNDP Development Indicators [f] Central Bank of West African States[g] CAHF Yearbook 2017[h] World Bank Doing Business
Member organisations of the African Union for Housing Finance (AUHF):Haggai Mortgage BankNigeria Mortgage Refinance Company

210
In 2018 all the commercial banks operating in Niger offer housing loans toemployees of formal registered companies and other international governmentaland non-governmental organisations. Some of the banks have agreements withthe companies and organisations to offer preferential interest rates to employees.The loans are secured by the employer or are mutual guarantee loans. The interestrate is between 6.5 percent and 9 percent, and in most cases a 10 percentdownpayment is required at a maximum term of 20 years.
Mortgage financing is still in an embryonic stage due to the low average incomeof employees and low employment rate. There is no mortgage bank operating inNiger ; however, each commercial bank offers housing loans under certainconditions, including employer-provided collateral, as well as partnerships or otheragreements with developers in the housing industry. In most cases, downpaymentrequirements are a minimum of 10 - 25 percent of the loan. The interest rate is8 - 10 percent, at 7 - 20 years. Apart from banks and other formal enterprises,some private but informal housing promoters use their personal funds to buildhouses for low income and higher income brackets for rentals. Other forms ofhousing finance include personal savings, remittances and family assistance.
As with most West African Economic and Monetary Union countries, long-termfunding remains a major challenge for Niger’s housing market despite the supplyfrom some banks and microfinance institutions. However, the US$155 millionagreement signed in 2017 between the World Bank and the West AfricanDevelopment Bank (BOAD), the West African Economic Monetary Union(WAEMU) and the West African Regional Mortgage Refinance Company (CRRH)will help address the chronic shortage of long-term finance that adversely impactson housing finance. The flow of funding will be extended with longer terms forhouseholds with moderate and irregular incomes.7
AffordabilityAccess to mortgage finance is limited, and when available, interest rates and loantenure render the cost of borrowing very high. As such, most Nigeriens cannotafford homeownership. The smallest mortgage available as of 2016 is FCFA 7.5million (US$13 050), which, at an interest rate of 10.5 percent and repayable overseven to 15 years, would require a monthly repayment of between US$132 andUS$176. About 7.5 percent of the country’s population earn below US$3.1 a day,which makes even the smallest mortgage unaffordable. Only about 22 percentof salaried workers representing less than one percent of the entire population(in most cases high-level government officials, and to some extent middlemanagement staff in private companies and international organisations), haveaccess to housing finance.
The majority of the population in the urban areas rent their homes, providedprimarily by informal housing promoters and SONUCI. Rents vary according toquality and location and range from the equivalent of US$169 to US$3 524 amonth for middle and upper income housing in Niamey, the capital. Other formsof rentals include the popularly known ‘rooms’ or ‘room and parlour’ arrangementsfound all over Niger, especially in the popular streets of the capital, ranging fromUS$27 to US$106 a month. At present no company or institution currentlyprovides rentals on a larger scale (including SONUCI which used to do so in thepast). Additionally, less than one percent of the population has access togovernment subsidies for housing due to the fact that only salaried workers (andparticularly government employees) qualify for subsidised houses.
Housing supplyDemand is estimated to be 50 000 units per annum for the whole nation, and6 000 for Niamey alone. According to Sahel Dimanche, the public nationalnewspaper, the rate of housing supply is insufficient to meet the demand, asillustrated by different national surveys. The economic growth and rapidurbanisation have escalated rents and demand for houses, while the absence ofmortgage banks in the provision of end-user finance is a major challenge to thedevelopment of housing.
There are no recent statistics about the number of registered companies in theconstruction industry, but most development companies function in the roads andurban infrastructure sector, with very few in the real estate sector. Those in thereal estate sector focus on land acquisition from traditional proprietors andservicing the land into plots. The serviced plots are sold to potential homeowners
who build their homes incrementally. The majority of potential homeownersfinance these purchases with savings and loans. Among MFIs, the most popularscheme consists of initial savings over three to five years for land acquisition, afterwhich a loan is granted according to the client’s income and the land title. In mostcases, the loans are insufficient for building a home; therefore, most homeownersmust build their homes over time.
Housing stock found all over Niger can be classified into three categories basedon the material used for construction: construction with mud and straw, andceilings of wood (maison en terrecuite /banco); construction with mud and plasterwith cement, and corrugated iron sheet for the ceiling (maison en semi dur); andconstruction with cement, concrete and stone, and corrugated iron for the ceiling(maison en dur) modern homes. The average cost of construction of the differentcategories depends on the geographical location, the size of the land, the plan andthe quality of the material used. In the capital, housing stock is predominantlyconstructed with durable materials, cement and concrete.
In the 40 years between 1960 and 2000, the government of Niger financed only1 236 houses. Prior to 2000, the government of Niger only offered government-subsidised homes to government employees and middle to senior civil servants.More recently, the government has introduced policies that are intended to inducethe private sector, including public private partnerships and facilitating land accessfor developers as well as tax incentives. To that effect, the housing company NigerShield has expressed its intention to beneficiate from the new tax incentivesregulation by developing 600 units under a social housing project. The companypromised to invest over FCFA12 billion (US$21.23 million) over the three yearsfollowing its tax exoneration.8 The Sary - Koubou project in Niamey, financed bygovernment, is another good example of recent progress, providing 174 one- tofour-bedrooms houses. Each home is constructed on 200m2 - 400m2 of land andall were delivered as of 2016. Other projects include 100 homes in Dosso bySONUCI (Dosso Sogha) delivered in August 2015, 100 houses “Cite derenaissance” in Niamey, 198 houses by Society Federal Niger development inNiamey, 50 houses by SATU SA in Dosso, 76 houses in Maradi by DB IMMO, and248 houses for the military in Niamey. The government acquired 88 hectares ofland and 1 000 plots of land. The general secretary of the ConfédérationDémocratique des Travailleurs du Niger (CDTN) and the managing director ofSociété Fédérale Niger Développement (FND) entered into a partnershipagreement for the development of social housing in Niamey 4. The type of unitswill vary from two rooms to four rooms and from 200 m2 to 400 m2. The pricerange will be from FCFA 9 856 666 (US$17 439) to FCFA 19 884 513 (US$35 182)excluding taxes. FND is the developer and will deliver 1000 units under the firstphase. The entire project is strictly targeted for CDTN employees.9
According to the housing ministry, the rate of housing supply is insufficient to meetthe demand, despite incentive policies to encourage the private sector to investin mass construction of economic and affordable houses. Demand remains highand housing is one of the priorities of the current presidential programme ofRenaissance 2. To date the programme is yet to be implemented. Affordablehousing is among the presidential campaign promises and housing remains one ofthe priorities of the government, as illustrated by the ambitious housing goals of25 000 houses to be built from now through 2021, or about 6 250 per year.10 Toattain this goal, the Nigerien government signed a memorandum with ChinaConstruction First Group (CCFG) during the China-Africa summit. The projectwill also be supported by the Niger Housing Bank and the African Solidarity Fundsand should be implemented through several constructing phases of 2 000 units.11
In 2016, the administration initiated a programme to work with the Chamber ofCommerce to encourage local entrepreneurs to take advantage of the incentivepolicies to boost supply and satisfy the national need for affordable housing. Therehas been a lot of publicity concerning the different developers and the productsoffers in the local press, over the radio and to some extent in the banks, but thereis little or no information about the number of units constructed and delivered.
Property marketProperty prices have risen steadily over the past decade given an increase indemand for houses (and insufficient supply) due to economic growth, populationgrowth, the influx of non-governmental organisations, and the increase inurbanisation. Affluent Nigeriens, neighbouring Africans, and the Diaspora arebuying properties and investing heavily in modernising the stock of residential and

Africa Housing Finance Yearbook 2018
211
commercial properties in the capital and other cities. The growth in the marketis expected to continue due to the growing demand for houses and commercialoutlets, coupled with the president’s ambitious programme, known as ‘NiameyNyala’ or ‘Niamey the cute’, a programme to transform Niger’s capital into amodern, attractive city.
According to the 2018 World Bank Doing Business Report, Niger ranks 144th outof 190 economies in terms of ease of doing business, 164th in dealing withconstruction, and 116th in terms of registering property.12 Four procedures arerequired to register property (with six procedures required, on average, acrossSub-Saharan Africa), and the process takes 35 days (almost half the Sub-SaharanAfrican average). Niger has reduced the cost of registering a property from9 percent to 6.5 percent of the property value, but the cost of registration is stillrelatively high. Overall Niger has improved its ranking in the Doing BusinessReport as a result of the government efforts in improving the country’s businessclimate.
Policy and regulationSince the late 1990s, there has been a significant evolution in urban planning andurban management. The Niger Republic’s National Policy and Regulation on Land(Politique Nationale en Matière d’Habitat) was adopted on 29 December 1998.The law defines the procedures for housing finance and the approach topromoting housing development. These include creating a national housing fundscheme, creating a national research centre to promote construction materialsand technology, and transforming CDN into a housing finance bank. The NationalPolicy on Habitat advocates for housing loans by commercial banks andencourages private investments and savings. However, to date the NationalHousing Fund Scheme and the National Research Centre have not been created.
In 2012, the Public Private Partnership Act was adopted regarding developmentof urban infrastructure, especially housing, where long-term financing is crucial.The goal of the Act is to promote private interest in the development of housingand other urban infrastructure.
In terms of investment, the new Code of Investment enacted through Loi No.2014-09 of 16 April 2014 provides for tax incentives available for many sectorsincluding social housing. For instance, during the construction phase, the projectwill be exonerated from custom taxes and VAT for all materials and equipmentwhich is unavailable locally; during the exploitation phase, the profit made fromthe project will also be tax-free. A variety of other tax incentives are applicablethroughout the development of the project.13
In terms of urban planning and land administration, the Land Administration Law(la Loi d’Orientation sur l’Urbanisme et l’Aménagement Foncier, or LOUAF) wasadopted in March 2008.14 LOUAF deals with customary property rights anddecentralisation. The adoption of LOUAF has contributed to the clarification ofresponsibilities between the central authority and communal authorities which
has facilitated the registration of properties in rural areas. Prior to implementation,it was impossible to register rural land or properties. There are no recent statisticson the number of registered properties. Research is needed to measureimplementation and evaluate the impact on the decentralised communities andon the development of housing and housing finance in Niger and other UEMOAcountries.
There are different land ownership rights (for example, full and temporary rights,as well as customary rights), and some reform in land administration and theregistration of properties to obtain full ownership rights. As a result, the processhas improved, although some difficulties persist. There is no official data for thenumber of full ownership rights of land and property titles, or Titre Foncier issuedsince Sheida, the reform system adopted by the UEMOA countries in 2006 tosimplify the process of obtaining full ownership title. The reform has also reducedthe cost of registration and has eliminated unnecessary bureaucratic authorisations.However, La loi de finance introduced in 2018 and currently in effect will certainlyimpact on overall cost of registration.
In summary, Sheida, LOUAF and the new investment code will hopefully contributeto accelerating the development of housing and housing finance in Niger. Inaddition, Niger adopted a law in June 2013 providing for urban planning and urbanmanagement, which was signed in 2014 as a major reform in urban regulation. Itis expected that the decree will facilitate the implementation of projects ofupgrading slums and contribute to making urbanisation a tool for economic andsocial development.
OpportunitiesNiger offers potential opportunities for housing and mortgage products due toshortages in affordable and adequate houses, its high rate of urbanisation, itsdemography, exploitation of mineral resources, the exploitation of petroleum inspite of a recent drop in global demand, the construction of new cement factories,the ambitious government programme of the current president, and a significantincrease in middle class Nigeriens. Niger is very rich in mineral resources especiallyresources such as limestone and gypsum used in making cement.
Because Niger is landlocked, it pays relatively high logistics costs. Low energyproduction constrained growth of the cement industry, but the rate of urbanisation,the government programme for housing and the development of energy (thesalkadama coal reserve alone could produce 600 MW) and infrastructure favoursthe development of the cement industry. The growth of cement industries willnot only increase production and reduce costs, but will generate employment,revenues for the government, and accelerate the development of urbaninfrastructures and housing.
Niger's property market is young and offers investment opportunities in all sectorsof the market: retail, residential, commercial, industrial and hospitality. Currently agreat deal of construction of roads, commercial buildings and hotels is taking place,
PPP$40 001 – PPP$10 000 000
PPP$23 001 – PPP$40 000
PPP$12 001 – PPP$23 000
PPP$8 001 – PPP$12 000
PPP$5 001 – PPP$8 000
PPP$3 601 – PPP$5 000
PPP$2 401 – PPP$3 600
PPP$1 601 – PPP$2 400
PPP$801 – PPP$1 600
<PPP$800
- - - Average annual household income needed for the cheapest newly built house by a formal developer, 2017 Average annual household income using expenditure, 2017 (PPP$)
NIGER
Annual income profile for rural and urban households based on consumption (PPP$)
No. of households (thousands)
PPP$6 741
PPP$21 477
Rural Urban1 000 800 600 400 200 0 200 400 600 800 1 000
Population: 21 477 348
Urbanisation rate: 5.35%
Cost of cheapestnewly built house:
7 500 000 XOFPPP$34 642
Urban householdsthat could afford thishouse with finance:
1.73%
1 PPP$: 216.5 CFA franc
Source https://www.cgidd.com/

212
and there is further room for growth. Considerate efforts are being deployed bythe government to modernise the major cities, especially Niamey, the capital, andto encourage investors to participate in the multi-billion infrastructure and housingprogramme of the country. There is a huge market for the development ofaffordable houses and a lot of incentives are offered to stimulate that segment ofproperty market. The reform in land management, registration of properties andfiscal advantages offered by the government of Niger Republic to formal privateenterprises are important tools for stimulating the development of the propertymarket and housing finance.
SourcesAfrican Development Bank (2018). African Economic Outlook 2018.https://www.afdb.org/fileadmin/uploads/afdb/Documents/Publications/African_Economic_Outlook_2018_-_EN.pdf (Accessed 1 October 2018).
African Development Bank (2018). Statistics Pocket Book Doing Business 2017:Ranking of African Economies by Quintiles.https://www.afdb.org/en/knowledge/publications/the-afdb-statistics-pocketbook/(Accessed 2 October 2018).
Agence Nigérienne de Presse (2018). Signature d’une Convention entre lePromoteur Immobilier et la CDTN. 29 Jan 2018.http://www.anp.ne/?q=article/signature-d-une-convention-entre-un-promoteur-immobilier-et-la-cdtn-pour-la-construction-des#sthash.qgUa4dn5.sGz4So83.dpbs (Accessed 2 October 2018).
BCEAO (2017). Rapport Annuel 2017.https://www.bceao.int/sites/default/files/2018-07/Rapport_annuel_2017.pdf(Accessed 1 October 2018).
The Investment Policy Hub (2014). Code d’Investissements.http://investmentpolicyhub.unctad.org/InvestmentLaws/laws/206 (Accessed3 October 2018).
Ministère de l’Equipement de l’habitat et de l’Aménagement du territoire etCabinet du Premier Ministre, consultant Gilles Horenfel (2002). Revue de lapolitique de financement de l’habitat au Niger, Rapport Final Provisoire.
The Mix. Niger. www.themix.org/mixmarket/countries-regions/niger (Accessed14 September 2018).
Niamey.com (2016). Niger : Construction de 25 000 lodgements sociaux d’ici2021 (officiel). July 2016. http://news.aniamey.com/h/73871.html (Accessed14 September 2018).
Niamey.com (2018). En Chine, le Gouvernement signe avec une entreprisechinoise, un mémorandum pour la construction de 25 000 logements au Niger.31 August 2018. http://news.aniamey.com/h/87137.html (Accessed 2 October2018).
Niamey et les 2 jours (2018). La Société Niger Shield en Passe de Bénéficierdes Avantages Fiscaux pour la Construction de 600 Logements Sociaux.9 March 2018. https://www.niameyetles2jours.com/la-gestion-publique/social/0903-2006-la-societe-niger-shield-en-passe-de-beneficier-des-avantages-fiscaux-pour-la-construction-de-600-logements-sociaux (Accessed2 October 2018).
Le Sahel (2008). La Loi d’Orientation sur l’Urbanisme et l’AménagementFoncier Adopté. http://nigerdiaspora.net/journaux/sahel26-03-08.pdf (Accessed3 October 2018).
The United Nations Development Program (2018). Human DevelopmentReport. http://hdr.undp.org/en/2018-update (Accessed 14 September 2018).
World Bank Data (2017). Country profile.http://databank.worldbank.org/data/views/reports/reportwidget.aspx?Report_Name=CountryProfile&Id=b450fd57&tbar=y&dd=y&inf=n&zm=n&country=NER(Accessed 14 September 2018).
World Bank (2017). World Bank Group supports access to Affordable Housingin West Africa. https://www.worldbank.org/en/news/press-release/2017/10/13/world-bank-group-supports-access-to-affordable-housing-finance-in-west-africa (Accessed 2 October 2018).
World Bank Group (2018). The Little Data Book on Financial Inclusion.https://openknowledge.worldbank.org/bitstream/handle/10986/29654/LDB-FinInclusion2018.pdf?sequence=1&isAllowed=y (Accessed 1 October 2018).
1 World Bank Data (2017). 2 The United Nations Development Program (2018). 3 African Development Bank (2018). African Economic Outlook 2018. Pg. 162.4 World Bank Group (2018). The Little Data Book on Financial Inclusion. Pg. 117.5 BCEAO (2017). Rapport Annuel 2017.6 The Mix. Niger. www.themix.org/mixmarket/countries-regions/niger (Accessed 14 September 2018). 7 World Bank (2017). World Bank Group supports access to Affordable Housing in West Africa.8 Niamey et les 2 jours (2018). La Société Niger Shield en Passe de Bénéficier des Avantages Fiscaux pour la Construction de 600 Logements Sociaux. 9 March 2018. 9 Agence Nigérienne de Presse (2018). Signature d’une Convention entre le Promoteur Immobilier et la CDTN. 29 Jan 2018.10 Niamey.com (2016). Niger : Construction de 25 000 lodgements sociaux d’ici 2021 (officiel). July 2016.11 Niamey.com (2018). En Chine, le Gouvernement signe avec une entreprise chinoise, un mémorandum pour la construction de 25 000 logements au Niger. 31 August 2018.12 African Development Bank (2018). Statistics Pocket Book Doing Business 2017: Ranking of African Economies by Quintiles.13 The Investment Policy Hub (2014). Code d’Investissements.14 Le Sahel (2008). La Loi d’Orientation sur l’Urbanisme et l’Aménagement Foncier Adopté.

Africa Housing Finance Yearbook 2018
213
diversifying the economy through its initiatives in agriculture, manufacturing, ICT,trade and investment and mining, or it whether it will show bias to the dictates ofits political base.
As at the first quarter 2018, the Nigerian real estate sector accounted for5.63 percent of the country’s gross domestic product.4 There is sparse progressin the government’s stated annual production of one million standardisedaffordable housing units. According to the Managing Director of Federal MortgageBank of Nigeria (FMBN), the housing deficit is estimated at between 17 to 20million housing units, increasing annually by 900 000 units, with a potential cost ofN6 trillion (US$16 billion). The Federal Ministry of Finance recently launched theFamily Homes Fund, a Public-Private Partnership between the Federal Ministry ofFinance and the Nigeria Sovereign Investment Authority (NSIA), which will havethe federal government give as part of the Medium Term Expenditure Framework(MTEF) seed funding of N100 billion per annum (US$278 million) over the nextfive years. It is hoped that the funds from this five-year planning cycle will bematched by domestic and external partners to help give discounted mortgages
OverviewOver the past year, Nigeria has been on the path of economic recovery followingthe significant economic challenges faced in 2016/17. Most of the market indicesshowed a positive trend in the first half of 2018. The GDP annual growth ratewas 1.9 percent in Q1 2018, and 1.5 percent in Q2 2018, consolidating the endof the 2016 recession, which turned in Q2 2017 when 0.55 percent GDP growthwas achieved. Although still in the double-digits, inflation has been on a downwardtrend over the last 18 months stopping at 11.6 percent in June 2018. The Nairahas stabilized against the US Dollar, even though liquidity is still constrained. Atthe Stock Exchange, market capitalisation reached an all-time high of N25.39trillion in January 2018 and closed at N23.50 trillion (US$64.8 billion) in July 2018.1
There is a new optimism within the investor community, bolstered by oil pricesreaching US$70 in late January 2018. Oil production averaged 2 million barrelsper day in the first four months of 2018. Although the 2018 budget was premisedon 2.3 million barrel per day at US$51 per barrel, production is at 1.9 million perday2 and the buoyant oil price continues to boost the economy.
The investment climate in Nigeria has also improved within the last year. ManyMinistries, Departments and Agencies, led by the Nigeria Investment PromotionCommission (NIPC) and the Presidential Enabling Business Environment Council(PEBEC) are working assiduously to improve the investment climate in Nigeria.Foreign exchange policy directives by the CBN (Central Bank of Nigeria), and thegovernment’s continued execution of its economic diversification policy, away froma mono-focused oil economy, are having a positive impact. As a result of theseinitiatives, Nigeria has shown a marked improvement in the World Bank’s 2018Ease of Doing Business ranking, climbing 25 positions to 145th overall, making itone of the top ten most improved countries internationally.3 With a nationalbudget of N9.12 trillion (US$25.33 billion) for 2018, and the Ministry of Power,Works and Housing being allocated 6.5 percent of this budget, there is clearly adeliberate focus by government on infrastructure, which will certainly impacthousing and housing finance. Stakeholders are of the opinion that these factorswill increase direct investment (whether foreign or local) in the construction andhousing space.
However, following the kick-off of political activities and the distractions that a pre-election year can create in an economy, the question in the minds of many iswhether government will continue to forge ahead on the mammoth task of
Nigeria KEY FIGURES
Main urban centresLagosKano
Exchange rate: 1 US$ = [a] 17 Jul 2018PPP Exchange rate (Local currency/PPP$) 1 Nigerian naira = [b]Inflation 2016 [a] | Inflation 2017 [a] | Inflation 2018 [a]
305.3 Nigerian naira102.712.77 | 15.91 | 11.61
Population [c] | Urban population size [d]Population growth rate | Urbanisation ratePercentage of the total population below National Poverty Line [d]Unemployment rate Q3 2017 [e]
198 000 085 | 99 000 0002.60% | 4.94%67.0%18.8%
GDP (Current US$) [e] | GDP growth rate annual Q1 2018 [e]GDP per capita (Current US$) [e]GNI per capita (Current US$) [f]Gini co-efficient [g]HDI global ranking [h] | HDI country index score [h]
US$375 550 million | 1.9%US$2 412US$2 08043.00152 | 0.527
Is there a deeds registry? Number of residential properties that have a title deed Lending interest rate [i]Mortgage interest rate | Mortgage term (years)DownpaymentMortgage book as a percentage of the GDPEstimated number of mortgages Price to Rent Ratio in City Centre | Outside City Centre Gross Rental Yield in City Centre | Outside City Centre Construction as a % of GDP [j]
Yesn/a25.00%19.50% | 2025%1%24 414n/a | n/a3.72% | 8.42%3.72%
What is the cost of standard 50kg bag of cement? What is the price of the cheapest, newly built house by a formaldeveloper or contractor? (Local currency)What is the price of the cheapest, newly built house by a formaldeveloper or contractor? (US$) What is the size of this house (m2)? What is the average rental price for this unit (US$)? What is the minimum stand or plot size for residential property?
US$8.42
5 000 097 NGN
US$13 88862m2
n/an/a
Ease of Doing Business Rank [k]Number of procedures to register property [k]Time to register property (days) [k]Cost to register property (as % of property value) [k]
1451170n/a
NB: Figures are for 2018 unless stated otherwise.
[a] Central Bank of Nigeria[b] World Bank World Development Indicators[c] National Population Commission (NPC)[d] Central Intelligence Agency (CIA) World Factbook[e] Trading Economics[f] World Bank Poverty and Equity Data Portal[g] Indexmundi[h] UNDP Development Indicators[i] Nigeria Mortgage Refinance Company[j] Nigeria Bureau of Statistics (NBS)[k] World Bank Doing Business
Member organisations of the African Union for Housing Finance (AUHF):Haggai Mortgage BankNigeria Mortgage Refinance Company

214
to potential homeowners. Currently, the World Bank is reviewing the possibilityof leveraging the seed funding.
Almost half of Nigeria’s population lives in cities, and it continues to witness adisproportion in supply and demand between social economic brackets. While anewly built development in a high-income area like Ikoyi in Lagos is reportedly60 percent empty, overcrowding is a major issue in many poorer areas. This leadsto increased conversion of rural areas to semi-urban and urban spaces, oftenwithout the necessary plans and policies in place.
Nigeria has a low homeownership rate of 25 percent, lower than that of Indonesia(84 percent), Kenya (73 percent), and South Africa (56 percent).5 The major issuesthat continue to affect housing in Nigeria include constraints related to the highcost of securing and registering secure land title, inadequate access to finance, slowadministrative procedures, and the high cost of land. Good news however, is therecent set-up of Mortgage Warehouse Funding Limited (MWFL). MWFL is aspecial-purpose company set up by member mortgage banks with the objectiveof providing short-term liquidity and funding for the origination of their mortgages.In addition, the Nigerian Mortgage Refinance Corporation (NMRC) has assistedto improve liquidity in Nigeria’s nascent mortgage institutions.
Access to financeAccording to EFINA (Enhancing Financial Innovation & Access) in collaborationwith the Nigerian Bureau of Statistics, financial inclusion declined between 2014to 2016, as growth in the adult population over the period outplaced growth inthe banked population. This was despite an increase in the number of adultsformally banked (36.9 million or 38.3 percent in 2016) or otherwise formallyincluded (another 10 million adults, or 10.3 percent of the adult population). In2016, 41.6 percent of the adult population, or 40.1 million adults, remainedfinancially excluded.6 This posed a challenge to the CBN’s target of reducing thenumber of financially-excluded Nigerians from 46 percent in 2010 to 20 percentby 2020. The CBN recently licensed mobile money operators and super agentsknown as the Shared Agent Network Expansion Facilities (SANEF). SANEF isaimed at an aggressive roll-out of a network of 500,000 agents to offer basicfinancial services.
There are 58 financial service providers (30 mortgage banks, 21 commercial banks,7 microfinance banks) that provide financing for housing demand and supply.Amongst these are 43 active mortgage providers, six Commercial Banks,30 Primary Mortgage Banks, and seven Microfinance banking (MFB) institutions.
It is clear that the mortgage finance industry in Nigeria is still in its infancy, targetingprimarily high income earners and largely excluding middle and low incomeearners. For the majority of Nigerians, mortgage finance is not an option due tothe lack of a robust land tenure and financial system, and because loan repaymentcosts remain prohibitively high. Mortgage finance therefore remains a very smallpercentage of Nigeria’s GDP, at 0.58 percent in comparison to the UK(80 percent), USA (77 percent), and South Africa (31 percent).
A number of secondary market institutions provide services intended to expandNigeria’s mortgage sector, beginning with the Federal Mortgage Bank of Nigeria(FMBN), Nigeria’s apex mortgage institution, which promotes mortgage lendingand manages the Nigerian housing policy. The FMBN raises capital through theNational Housing Fund (NHF), which obtains funding mostly from salariedemployees earning N3 000 (US$8.33) and above monthly, who are required tocontribute 2.5 percent of their salary. Although the scheme is open to all, therecruitment structure has previously mostly targeted larger companies, recruitingmiddle income earners and hitherto ignoring the low income earners in Smalland Medium Enterprises (SMEs). However, in a recent policy shift in 2018, FMBNhas not only created uniform underwriting standards for the informal market andSMEs to augment the uniform underwriting standards for the formally employedmarket, but they have reduced required equity contributions for borrowers indifferent house price categories. For example, the downpayment for house pricesof up to N5 million (US$13 889) is now zero percent (from 10 percent) anddownpayment for house prices of N5.01 million (US$13 889) and up to N15million (US$41 667) is now 10 percent (formerly ranging between 10 percent to30 percent).7 FMBN offers one of the lowest mortgage rates on its products –6 percent, compared to all banks, which range from 16 to 28 percent. Maximum
tenor of loans is 30 years, although most are granted with shorter terms. BetweenJanuary to June 2017, the bank received N9.5 billion (US$26 million) in capitalthrough the NHF and disbursed a sum of N1.1 billion (US$3 million) to borrowers.
The Nigerian Mortgage Refinance Company (NMRC) is licensed to provide long-term secondary market refinancing. As at the end of 2016, the NMRC hadrefinanced mortgages amounting to N8 billion (US$22 million) – the amount ofits inaugural bond issue. In June 2018, the company successfully issued N11 billion(US$30.5 million) 13.80 percent series 2 bonds to refinance eligible mortgageloans originated by the lending institutions in its network. The amount is part ofNMRC’s bond issuance under its N440 billion (US$1.2 billion) medium term noteprogramme The bond issuance was rated ‘AAA’ by both Global Credit RatingCo. and Agusto & Co. It is important to mention that the bond was fullyguaranteed by the Federal Government of Nigeria.
The Mortgage Warehouse Funding Limited (MWFL) was created and launchedin late 2017. The MWFL aims to ease the current lack of liquidity for mortgageorigination in the market by providing a source of short-term funding for primarymortgage banks. MWFL’s operations are designed to support the mandate of theNMRC’s refinancing focus.
AffordabilityMore than half of Nigeria’s estimated population of 198 million live on less thanUS$1 a day. The unemployment rate increased from 10.4 percent in Q1 2016 to18.8 percent in Q3 2017.8 Coupled with the high rate of unemployment, theminimum wage remains at N18 000 (US$60.28) per month, which has remainedconstant for the past six years, even with a high and increasing inflation ratecurrently at 11.6 percent.
Home purchase and rent prices have grown ahead of general inflation. A standardthree-bedroom, middle-income apartment in urban locations currently commandsa rent of approximately US$5 000 per annum and a purchase price ofUS$100 000. Overall, both at the state and federal level, there is a strong push bythe administration to focus interventions on lower income earners who areaspiring to be homeowners, and have been traditionally sidelined by the propertymarket which is predominately controlled and used by the elite. However, newhousing construction remains limited in supply and prohibitively expensive formiddle and lower income households. Fifty to sixty percent of total constructioninputs go to building materials. Although the Naira – US Dollar exchange ratehas stabilised considerably within the last year, it is expected that the price ofconstruction will continue to increase as many construction items remain on thegovernment's list of 44 items disqualified from getting foreign exchange from theCentral Bank of Nigeria (CBN), forcing importers to source materials from ascarcer and often more expensive black market.
In an effort to ensure that land transactions are carried out with minimum difficulty,in January 2015, Lagos State cut down land use charges from 13 percent to3 percent of the property’s value. The Federal Government is also pushing for areduction in land transaction fees from 16 percent to 3 percent.
As a result of the high cost and limited production of affordable housing in Nigeria,51 percent of Nigerians live in rented accommodation, 40 percent of whom arepaying between N20 000 (US$55.56) and N100 000 (US$222.22) yearly.9 Withthe majority of the population forced to rent and low regulatory monitoringregarding rentals, landlords and estate agents dictate the market. To curb this, theLagos Tenancy Bill of 2011 was promulgated as a law. Amongst other aspects, itstates that landlords can only charge for one year’s rent in advance. However, thelaw is not being enforced and people seeking rental accommodation still face issuesof landlords requesting payments of two or more years. Agency fees are anotherexpense the Lagos Tenancy Law has been unable to govern, and it is very high inNigeria, ranging from 5 to 10 percent, in comparison to countries such as Ghana(5 percent), and Kenya (1.25 percent). This is fuelling the rise of innovative schemesby property developers such as rent-to-purchase, in which you pay a larger rentthan usual, but have the option of purchasing the home at the end of the rent stay.
Housing supplyIn Nigeria, neither the government nor the private sector provides sufficienthousing units especially for the masses that need and demand it. Formal housing

Africa Housing Finance Yearbook 2018
215
production is at approximately 100 000 units per year and this is highly inadequatebecause at least 1 000 000 units are needed yearly to bridge the 17 to 20 millionhousing deficit by government’s target date of 2033 (if the population continuesat its annual growth rate of 3.5 percent). It is estimated that it will cost US$363billion to curb the current housing deficit and the number is expected to keepgrowing.
President Muhammad Buhari stated that his government would supply two millionnew middle-class homes in the first year of his tenure (2015), and one million newmiddle-class homes for every following year. This would be coupled with fourmillion low income houses and homeowners by the end of his first four year term.This was to be rolled out with longer mortgage payment structures, however,given the myriad of economic challenges the country faced over the last year,housing has not been high on the political agenda. There was also to be a NationalInfrastructure Development Bank capable of providing nominal single digit interestrates, but this has also not been implemented as yet.
The rapid population increase and rural to urban migration have contributed tothe shortfall of housing in Nigerian urban centers. The unresolved tenurearrangements, cost of building materials, access to infrastructure, deficiency ofhousing finance arrangements, stringent loan conditions from mortgage banks,time to process legal documents and inadequate government housing policies arealso major issues affecting housing delivery.
Lagos has taken the lead in housing supply with a vast array of new projects onthe way. Orange Island (focused on the middle class) is to cover 150 hectares ofland in Lekki, at an estimated cost of N40 billion (US$ 111 million). It shouldaccommodate 25 000 people and be completed by 2019. The upcoming LekkiFree Trade zone has triggered a rash of housing development in Ibeju, Lekki withnumerous residential estates being built.
Most of the new developments are led by the private sector and target the middleand upper classes. Most developments targeted at the lower income bracket aregovernment led; unfortunately no remarkable impact has been made thus far.
Property marketsThe real estate sector which accounts for 5.63 percent of the Nigerian economy,in GDP terms, has been plagued with market uncertainty and declining demand,reflective of the underperformance in the mortgage and consumer lending sectors.Additional drivers to the sector’s underperformance include the slow economicrecovery rate since the last recession and rising house production costs. Theeconomic slowdown has severely impacted the demand side of the market, whichhas led to high vacancy rates, especially in the prime and luxury property markets.Abuja is beginning to witness some marginal increase in house prices following asignificant drop in 2017. Lagos has seen a marginal increase especially in mid-market property segments. Property markets in the North East, affected bypolitical instability and security have seen a significant drop given a high level of
uncertainty; while the neighbouring markets to the North East have seen amarginal increase in property values as a result of migration to these regions.
A review of house prices in four major towns in Nigeria by The Roland IgbinobaHouse Price Index (RI Index) in the second quarter of 2018 suggests that thehousing sector is consistently recovering from the effect of the recent recession.10
Between April and June 2018, most places in Lagos recorded increases in pricescompared with Q4 2017 and Q1 2018. There was a significant rise in prices fromQ4 2017 to Q2 2018, across all house types (2,3,4 and 5-bedroom houses) inmost areas in Lagos, especially Ajah, Agege, Ikoyi Lekki, Gbagada, Ibeju-lekki, Isolo,and Surulere axis of Lagos.
Movements of house prices were also on the increase in Abuja in the secondquarter of 2018. Areas such as Dakwa, Kaura, Lokogoma, Mbora, Utako, and Wuserecorded an increase in prices of all house types (3, 4 and 5 bedroom) with thesmallest increase seen in the 3-bedroom houses. Prices however was erraticacross all house types in Apo, Asokoro, Guzape, Gwarinpa, Jabi, Karsana, KarshiKatampe, Kubwa, Lugbe, Mabuchi and Maitama.
In Port Harcourt, several areas also experienced increase on house prices withreference to the last quarter of 2017. In Kaduna, movements of house pricesseemed to reflect the changes experienced in other parts of the nation.
Overall, the RI Index for the second quarter of 2018 suggest that there is significantimprovement in house prices in all the four major towns: Lagos, Abuja, PortHarcourt and Kaduna. The slow but improving economy no doubt impacted onhouse prices.
Policy and regulationThe 1999 Nigerian Constitution states that all citizens have the right to acquireand own immovable property. Similarly, Vision 20:202011 advocates for adequatehousing for all Nigerian citizens. “Vision 20:2020 is the economic transformationblueprint for stimulating Nigeria’s economic growth and launching the countryonto a path of sustained and rapid socio-economic development.”
The National Housing Policy of 2012 emphasizes the role of private sectorfinancing, highlighting that it should be involved with mass housing, skills acquisition,disaster management, urban renewal, slum upgrading, and job creation. The targetof the policy is to guide the building of one million houses yearly, through a varietyof schemes such as NMRC. However, the policy has not resulted in any significantexecution in the housing market in Nigeria. This may not be unconnected withthe fact that there is lack of political will to implement the policy.
The Land Use Act (1978) continues to dictate and hinder the land market inNigeria. To date the objective of the Act, which was to make land more easilyavailable, has not been achieved. Instead the Act has been seen to be an onerousprocess by the citizens. Formerly, land could be bought from communities,
- - - Average annual household income needed for the cheapest newly built house by a formal developer, 2017 Average annual household income using expenditure, 2017 (PPP$)
NIGERIA
Annual income profile for rural and urban households based on consumption (PPP$)
Source https://www.cgidd.com/
PPP$40 001 – PPP$10 000 000
PPP$23 001 – PPP$40 000
PPP$12 001 – PPP$23 000
PPP$8 001 – PPP$12 000
PPP$5 001 – PPP$8 000
PPP$3 601 – PPP$5 000
PPP$2 401 – PPP$3 600
PPP$1 601 – PPP$2 400
PPP$801 – PPP$1 600
<PPP$800No. of households (thousands)
PPP$21 235
PPP$30 120
Rural Urban6 000 4 000 2 000 0 2 000 4 000 6 000
Population: 198 000 085
Urbanisation rate: 4.94%
Cost of cheapestnewly built house:
5 000 097 NGNPPP$48 686
Urban householdsthat could afford thishouse with finance:
38.92%
1 PPP$:102.7 Nigerian
naira
216
individuals, and institutes, but due to the Land Use Act, urban land is managed bythe Governor of a state through a Land Use and Allocation Committee whodispenses land through the granting of Certificates of Occupancy. ‘Other lands’(not urban) is managed by Local Government through a Land Allocation AdvisoryCommittee. Legally a Nigerian who has a Certificate of Occupancy, which isexpensive and often takes an average of three to years to obtain, does not ownthe land but is a statutory occupant, as the government remains the sole trusteeof land.
According to the 2018 Doing Business survey, Nigeria ranks 179th out of 190countries in registering properties. The twelve procedures involved take 105 daysand cost an estimated 11.1 percent of the property value. Of these, it is the fifthprocedure: submitting the application for processing the Governor’s Consent andobtaining the title (required in terms of the Land Use Act 1978) that takes thelongest, at 90 days.12
OpportunitiesGiven the economic slowdown, it is expected that there will be a slow recoveryin pure market-driven activity within the housing market. Government-driveninitiatives are expected to be the main driver of growth within the housing market,yet these are likely to be constrained for the period leading up to, and immediatelypreceding, the election in 2019. With respect to market segments, the prime andluxury market segment is expected to face the slowest growth and continuedhigh levels of vacancy. Currently, the luxury supply market is far outpacing demand,with many projects that were started during the oil boom years, coming to fruitionnow and remaining empty. The middle-income market is expected to grow thefastest as the economy recovers, but will require the delivery of more affordablehousing products to meet this market. Overall, the bulk of households willcontinue to resort to house rental and accessing housing in the informal land andhousing market, especially in Nigeria’s rapidly growing cities.
With the coming on board of the Family Homes Fund, local and foreign investorsare now being sensitised to the benefits of investing in the middle and low-incomesegments of the market. The middle-income segment currently remains the mostattractive, with the speed of occupancy in the Lekki axis of Lagos highlightingdemand potential in this area. More land area in other states should be dedicatedto this, as the middle- income purchasers are also key to developing a healthymortgage system and a growing housing market.
Regardless of the investments and programmes being introduced in the market(e.g. NMRC, NHFP, FMBN), efforts need to be established to ease the access tohousing and housing finance, focusing on the constraints currently facing propertyregistration, housing finance access and affordability, the high costs and time takenfor housing construction and constraints imposed by current rental laws.Notwithstanding these constraints, Nigeria is the most populous country in Africaand offers significant potential demand for housing contractors and developers tomeet, if this is carefully matched with the desires and affordabilities of households.
Additional sourcesAdegboye, K. (2016). Lagos government plans 50 housing unit in every LGA.Vanguard. 24 May 2016. https://www.vanguardngr.com/2016/05/lagos-govt-plans-50-housing-units-every-lga/ (Accessed 24 Sept 2018).
Aderinokun, K. (2016). Lafarge Africa: Expanding Low Cost Housing for LowerIncome Nigerians. This Day Live. 29 May 2016.https://www.thisdaylive.com/index.php/2016/05/29/lafarge-africa-expanding-low-cost-housing-for-lower-income-nigerians/ (Accessed 24 Sept 2018).
Alao, T. (2017). “Analysts express concerns over 2017 budget on real estatesector.” 8 Feb 2017. Nigerian Tribune.https://www.tribuneonlineng.com/61452/ (Accessed 28 Aug 2018).
Awosusi, D. (2017). Best Property Developments Under Construction in Lagos.PropertyPro Insider. 13 April 2017. https://www.propertypro.ng/blog/best-property-developments-undergoing-construction-in-lagos/ (Accessed 24 Sept2018).
Awosusi, D. (2017). Land Use Act in Nigeria – Explained. PropertyPro Insider.18 April 2017. https://www.propertypro.ng/blog/land-use-act-in-nigeria-explained/ (Accessed 24 Sept 2018).
Doherty, A. (2016). “Understanding the concept of rent to own”. 24 May 2016.Punch (Accessed June 2016). https://punchng.com/understanding-concept-rent/ (Accessed 5 Sept 2018).
Komolafe, B. (2018). Financial Inclusion: CBN, banks target 60m Nigerians with500,000 agents’ network. Vanguard. 28 March 2018.https://www.vanguardngr.com/2018/03/financial-inclusion-cbn-banks-target-60m-nigerians-500000-agents-network/ (Accessed 28 Aug 2018).
Kumo, G (2018). Mortgage Dearth: Nigeria’s homeonwership lowest in Africa.Vanguard. 08 July 2013. https://www.vanguardngr.com/2013/07/mortgage-dearth-nigerias-homeownership-lowest-in-africa-fmbn/ (Accessed 31 Aug2018).
Okonj, E (2018). Addressing the challenge of financial inclusion in Nigeria. ThisDay. 10 June 2018.https://www.thisdaylive.com/index.php/2018/06/10/addressing-the-challenge-of-financial-inclusion-in-nigeria/ (Accessed 31 Aug 2018).
Websiteswww.cbn.gov.ngwww.fmbn.gov.ng www.howwemadeitinafrica.com www.nigerianstat.gov.ng www.socialhousingnigeria.comwww.thenationonlineng.net www.lapo-nigeria.orgwww.population.gov.ngwww.pebec.gov.ngwww.cbn.gov.ng.
1 CEIC (2018). “Nigeria Market Capitalisation: Nigeria Stock Exchange”. https://www.ceicdata.com/en/nigeria/nigeria-stock-exchange-market-capitalization/market-capitalization-nigeria-stock-exchange (Accessed 16 September 2018).2 Adugbo, Daniel. “Oil production in June drops to 1.89b/d – FG”. 10 July 2018. Daily Trust. https://www.pressreader.com/nigeria/daily-trust/20180710/281788514821631 (Accessed 31 Aug 2018).3 World Bank (2018). Doing Business: Ease of Doing Business in Nigeria. http://www.doingbusiness.org/en/data/exploreeconomies/nigeria/ (Accessed 24 Sept 2018).4 Shola Ayeotan. “Analysis of real estate market contribution”. 30 May 2018. https://nigeriarealestatehub.com/analysis-of-real-estate-market-contribution-to-nigeria-gdp.html/ (Accessed 17 Sep 2018). 5 Gimba Yau’ Kumo, paper presented at the 6th Abuja Housing Show.6 EFInA (2017). Key Findings: EFInA Access to Financial Services in Nigeria (A2F) 2016 Survey. http://www.efina.org.ng/assets/A2F/2016/Key-Findings-A2F-2016.pdf (Accessed 24 Sept 2018).7 Ochayi, Chris (2018). “Housing : FG grants zero percent equity loans not exceeding N5m to civil servants”. 13 July 2018. Vanguard. https://www.vanguardngr.com/2018/07/housing-fg-grants-0-equity-for-loans-not-exceeding-n5m-to-civil-
servants/ (Accessed 5 Sept 2018). 8 Trading Economics (2018). Nigeria Unemployment Rate 2006-2018. https://tradingeconomics.com/nigeria/unemployment-rate (Accessed 24 Sept 2018).9 Kolawole, Y (2014). 51% of adult Nigerians live in rented houses – NOI Polls. https://www.vanguardngr.com/2014/11/51-adult-nigerians-live-rented-houses-noi-polls/ 24 Nov 2014. Vanguard. (Accessed 24 Sept 2018).10 Igbinoba, R. (2018). Roland Igbinoba House Price Index, Quarter 2, 2018 Report. http://reic-ng.com/roland-igbinoba-house-price-index-ri-index/ 11 National Planning Commission (December 2009). “Nigeria Vision 20:2020 – Economic Transformation Blueprint”. http://www.nationalplanning.gov.ng/images/docs/NationalPlans/nigeria-vision-20-20-20.pdf (Accessed 17 Sep 2018).12 World Bank (2018). Doing Business: Ease of Doing Business in Nigeria. http://www.doingbusiness.org/en/data/exploreeconomies/nigeria/ (Accessed 24 Sept 2018).

Africa Housing Finance Yearbook 2018
217
Access to financeIn June 2017, the local financial sector consisted of 11 commercial banks, fourmicrofinance banks, one development bank and one cooperative bank. The totalnumber of microfinance institutions is 473, of which 18 have limited liabilitycompany status.9 A total of 455 are savings and credit cooperatives (SACCOs)and Umurenge-SACCOs.10 The institutions are complemented by non-bankfinancial institutions, including 16 insurers,11 a public, mandatory pension schemeoffered by the Rwanda Social Security Board and 62 voluntary occupationalpension schemes. The pension sector continues to grow and is the second largestcontributor to financial sector assets after the banking sector.12 Eleven percentof investment in the insurance sector is in property.13 Ten banks are originatingand funding mortgage loans: Equity Bank, Bank of Kigali, Urwego Opportunity Bank(UOB), Ecobank, I&M Bank, Crane Bank, KCB Bank Rwanda, Cogebanque, AccessBank and BPR.
The total outstanding mortgage debt is FRW 453 860 688 million or US$534.31million (in 2016), estimated at about one percent of GDP.14 New loans in thefinancial year 2015/16 were worth FRW 207 967 850 million (US$244.83million).15 Banks increased lending to the mortgage sector with an annual growthrate of 38.4 percent in 2016; non-performing mortgages were 5.1 percent in June2016.16 There are an estimated 60 000 mortgages in the country.
OverviewMany policies of the Rwanda government aim to improve general living conditionsand the provision of services. In 2017 the GDP was estimated to be 6.1 percenthigher in real terms compared to 2016.1 GDP per capita was at US$774 and hadincreased from US$735 in 2016.2 Rwanda’s economic growth rate is projectedto be 7.2 percent in 2018 by the International Monetary Fund (IMF).3 Whilegrowth is mainly driven by the services and agriculture sectors, the contributionof real estate activities is eight percent of GDP.4 The real estate and constructionindustries have become important drivers of economic growth in Rwanda.Construction accounted for 51 percent of the industry growth, with 12.8 percentaverage annual growth in 2010-2015.5
Rwanda’s credit rating in 2017 was B with a stable outlook.6 Rwanda was ranked58th in the 2017/2018 Global Competitive Report7 and is the most competitiveplace to do business in the East African Community. It is positioned 41st out of190 economies in the World Bank Doing Business 2018 survey, an improvementby 15 places on the previous year.8
The newly adopted National Strategy for Transformation 2018-24 (NST 1)bundles the strategic goals from the Second Economic Development and PovertyReduction Strategy 2013-2018 (EDPRS 2), Vision 2020, the SustainableDevelopment Goals (SDGs), the African Union’s Agenda 2063 and the Vision 2050of the East African Community. Since 2013, Rwanda has emphasised urbanisation,taking a proactive approach to promote well-planned urban and human settlementdevelopment that enhances local and national economic growth and ensuresquality of life. While the National Housing Policy’s (2015) vision of “access tohousing for all” is well under implementation, housing still remains a key concern.The government’s commitment to facilitating housing is reflected in a frameworkthat is continously being complemented. After the triggered increase of real estateactivities, professionalism in the construction industry supply chain is among thesector priorities identified by the new Sector Strategic Plan 2018-24 (SSP) for theUrbanisation and Human Settlement Sector.
Consolidating the impacts of policy efforts from the previous years is observed,and a further increase in investment in large-scale, affordable housing projects isexpected. Besides this, attempts are being made to facilitate residents in formal,individual construction where permissible.
RwandaKEY FIGURES
Main urban centresCity of KigaliMuhanga
Exchange rate: 1 US$ = [a] 25 Jun 2018PPP Exchange rate (Local currency/PPP$) 1 Rwandan franc = [b]Inflation 2016 [a] | Inflation 2017 [a] | Inflation 2018 [a]
872 Rwandan franc305.706.90 | 4.80 | n/a
Population 2012 [c] | Urban population size 2012 [c] Population growth rate 2013 | Urbanisation rate 2017 [b]Percentage of the total population below National Poverty Line 2013 [c]Unemployment rate 2017 [c]
10 515 973 | 1 737 6841.80% | 5.57%
39.0%13.2%
GDP (Current US$) 2017 [c] | GDP growth rate annual 2017 [c]GDP per capita (Current US$) 2017 [c]GNI per capita (Current US$) 2017 [b]Gini co-efficient 2013 [c]HDI global ranking 2015 [d] | HDI country index score 2015 [d]
US$8 944 million | 6.1%US$774US$70045.00159 | 0.498
Is there a deeds registry? Number of residential properties that have a title deed Lending interest rate [b]Mortgage interest rate [b] | Mortgage term (years)DownpaymentMortgage book as a percentage of the GDPEstimated number of mortgages [a]Price to Rent Ratio in City Centre | Outside City Centre Gross Rental Yield in City Centre | Outside City Centre Construction as a % of GDP [c]
Yes8 400 00016.76%16.76% | 1520%1%60 000150 | 2007.5% | 6.5%8.00%
What is the cost of standard 50kg bag of cement? What is the price of the cheapest, newly built house by a formaldeveloper or contractor? (Local currency)What is the price of the cheapest, newly built house by a formaldeveloper or contractor? (US$) What is the size of this house (m2)? What is the average rental price for this unit (US$)? What is the minimum stand or plot size for residential property?
US$12.80
17 500 000 Rwandan franc
US$19 76880m2
US$175n/a
Ease of Doing Business Rank [e]Number of procedures to register property [e]Time to register property (days) [e]Cost to register property (as % of property value) [e]
4137 days10.00%
NB: Figures are for 2018 unless stated otherwise.
[a] National Bank of Rwanda[b] World Bank World Development Indicators[c] National Institute of Statistics Rwanda[d] UNDP Development Indicators[e] World Bank Doing Business

218
The cost of financing is high for both investors and end users. Access to financeis difficult despite the continuos improvement of lending conditions over the pastdecade. Investors borrow at 15-16 percent while beneficiaries borrow at 17-21percent. Mortgage loans require high downpayments and high minimum loanrates. Mortgage borrowing periods are now up to 20 years. With less than10 percent of the labour force employed in the formal sector, low per capitaincome, irregular household incomes, and insufficient household income data, fewbenefit from conventional mortgage finance schemes.17 Better access to mortgagefinance for the end user intends to grow the number of housing mortgages tomatch the housing demand, estimated far above 30 000 units annually, and toimprove the financial capacities of households seeking formal housing. A steadyannual increase of accessed housing mortgages has been set as one of the targetsby the new SSP of the Urbanisation and Rural Settlement Sector.
Lenders are still challenged with evaluating the creditworthiness of households.Nevertheless, as of June 2017, Rwanda has had a private credit reporting systemwhich collects information from mandatory and voluntary participating institutions.The Credit Information System will contribute to reducing costs and the risk oflending. Additionally, “the country has commenced the journey towardsmobilization of savings”18 to address funding for long-term investments. Effortsare under way to educate toward a culture of saving and to prepare the groundfor saving products specifically targeting improved access to housing finance. Thedomestic savings promotion agenda includes plans for a long-term savings scheme.Mechanisms that allow risk reduction to borrowing and support life-time savingfor housing are not yet part of the financing landscape. Developing long-terminvestment and long-term savings is paramount to housing finance.
A Capital Market Master Plan is expected to advance a strategic agenda acrossEast African financial markets, as the main constraints (and opportunities) in thesector relate to liquidity of banks and lenders and the availability of long-terminvestment capital with high prices for long-term finance.19 The lack of equityfunding for large-scale housing projects, and a parallel difficulty in findingconstruction debt financing in suitable quantities, results in a tendency of the fewdevelopers in Rwanda to build on a small scale.
To make housing more affordable, a mixed set of instruments that target the supplyand demand sides of housing is being implemented. Since December 2015,infrastructure and public facilities for affordable housing projects are financiallysupported based on a Prime Minister’s Order. On 30 June 2017, the cabinetapproved the establishment of the Affordable Housing Financing Fund. The entityis planned to be operational from late 2018 after adoption of a legal frameworkto back its functioning with the objective to improve access to housing mortgagesfor households and to supply-side finance for developers. Housing mortgagelending conditions are expected to improve, with lending terms to increase up to30 years and interest rates reduced through subsidisation for the benefit of thosewho were not able to access mortgages until now, including households withmonthly incomes as low as FRW 200 000 or US$240.
Alternative instruments must complement the mortgage products, such as help-to-buy, rent-to-own and renting, based on the realisation that the current mortgagemarket does not yet have the capacity to provide off-take assurance to developersof new homes in the short term. The feasibility of issuing green bonds is beingexplored, and a scheme piloting green affordable housing concepts is beingprepared under Rwanda’s Green Fund FONERWA for application to the GreenClimate Fund.
AffordabilityIn 2015, Rwanda had the highest discrepancy in Africa between the Gross NationalIncome per capita and the cost for the cheapest newly constructed (formal)house20 with less than 10 percent of households able to afford a formal housingunit. Since EDPRS 2, the government has been using a framework which facilitatesprivate sector-led housing finance and construction and the National HousingPolicy (2015) has initiated a discussion about how to enable “access to housingfor all”.21
Median annual household incomes in the City of Kigali are about US$824 in thefirst market quintile, US$1 766 for the second quintile, US$2 943 for the thirdquintile, US$5 415 for the fourth quintile and US$15 069 for the fifth quintile.22
According to the International Growth Centre (IGC), an annual growth in realincome can be registered for the first three quintiles (4.9 percent, 7.6 percent and5.4 percent respectively), while incomes for the fourth quintile remain stable(0.3 percent growth) and incomes in the fifth quintile group decline (-5.2 percent).The national average annual household income differs significantly from householdincomes in Kigali at US$368.23
Despite the discrepancy between affordable and actual house costs, the gapbetween household incomes and construction costs is reducing, with the cheapestformal house in the market now just below US$20 000. According to estimatesby the IGC in 2017, the bottom 20 percent of the population need homes belowUS$11 850, the bottom 40 percent need homes below US$23 700, and thebottom 60 percent need homes below approximately US$37 900, while the top20 percent can afford housing.24
On a wider policy approach, housing shall become increasingly affordable byaddressing i) cost-efficiency in design, construction and construction management;ii) increase of material resources; iii) decrease of unit sizes and floor area perperson; iv) use of technologies and design skills which lower construction cost;and v) facilitation of households to co-locate with economic opportunities.25 Arecent study demonstrates that should all the aspects be addressed, constructioncosts could significantly decrease to as low as US$170 a square meter floor areaand the household income segment that could theoretically afford a housing unitwould be between about US$170 and US$685.26
The Rwanda Ministry of Infrastructure (MININFRA) encourages home buildersand developers to use locally-made construction materials. It has been officiallyexplained that the use of earth materials is not illegal. District governments inpartnership with planning firms are steadily preparing for land subdivision plansto lay out space for formal access and utilities in formerly unplanned areas, and tofacilitate building permitting in areas where there is high interest in individualconstruction. The effort is paying off with residents more easily adapting to thenew planning and building requirements, which have been carefully drafted tofacilitate formal home building for low income households and reduce informalgrowth in the urban planning areas.
Housing supplyThe incentives introduced in 2015 clearly appeal to affordable housing investors.Government-subsidised housing development has thus far been approved forabout 600 units but over the course of the coming years, 4 500 units are expectedthrough involvement of the Development Bank of Rwanda (BRD) with 20-30percent equity participation.27
The continued dependency on imports in the construction industry is a result ofthe limited local industry, which stems from a lack of volume.28 The governmentnevertheless strongly promotes investment in the construction industry and infacilities for the local production of building materials as part of its Made in Rwandaprogramme. Examples of new production facilities include: Strawtech, a factoryproducing light steel profiles; SMEs that are producing standardised burnt bricksmore efficiently; and an SME producing stabilised soil blocks in a purpose-builtproduction facility. The most recent player in the country to start producingconstruction materials in 2017 is AfriPrecast Ltd., producing pre-cast, pre-stressedconcrete element products with the target of increasing efficiency in theconstruction process, economy of scale and durability. The plant has the capacityto supply East and Central Africa. Rwanda’s cement producer CIMERWA hasinvested US$170 million in a new modern dry process production plant with acement production capacity of 600 000 tons/year by mid-2018.29 The KigaliCement Company has a production capacity of 100 000 tons/year, expected toincrease with investments from the recent acquisition by Kenya’s ARM Cement.Prime Cement has signed a partnership with a Danish firm to build a US$65million cement grinding plant in Northern Rwanda with an operational capacityof 0.7 mt/year; a proposed second phase will add an integrated clinker plant withinthe next five years.30
Property marketsRegistering property in Rwanda now only requires a three step-process, hasreduced to seven days and costs 0.1 percent of the property value. Rwanda thusranks second out of 190 economies on the ease of registering property.31 The

Africa Housing Finance Yearbook 2018
219
Ministerial Order Determining Urban Planning and Building Regulations and theMinisterial Order Determining Building Permits were slightly amended for even higherefficiency in permitting processes. Rwanda has also embarked on an online buildingpermitting platform, which was first spearheaded by the City of Kigali and is nowalso operational in the secondary cities, with countrywide access being rolled outby 2024. Increases in property transactions are expected in Kigali and thesecondary cities with more efficient building and more accountable issuing ofbuilding permits and the availability of urban master planning documents.
When modelling cost-efficient , high-density housing, the projected costs for landare at one percent of a project outside of Kigali and four percent in Kigali;infrastructures and public facilities may account for 26 to 32 percent of projectcosts outside of Kigali and 41 percent in Kigali. House construction itself comprisesbetween 66 and 73 percent of the total project cost in urban areas outside ofKigali and 55 percent in Kigali.32
The National Housing Policy 2015 and a resolution from the High-LevelLeadership Retreat 2018 have highlighted the significance of not usingexpropriation as a tool for local governments when servicing land for housing, butto collaborate with the land holders, to not cause artificial inflation of land costs.
Policy and regulationThe National Housing Policy 2015 strategises the way towards a positive impacton living conditions, an increase of employment rates and growth in the localconstruction industry. It further covers aspects of public responsibility andpartnership and lays the ground for a framework that enables the private sectorto satisfy the growing demand for housing. The policy highlights measures toincrease the purchasing power through saving, pooling of individual resources andfinancing models inclusive of low income earners.
In 2017, the National Informal Urban Settlement Upgrading Strategy was validated.Urban upgrading is to tap existing and future land and property equity, helpintegrate housing neighbourhoods that offer affordable housing and conserve largehousing stock. Five options for implementing and upgrading projects have beenidentified with action forseen countrywide to reduce the percentage of urbanpopulation living in under-serviced settlements. The strategy details the proceduresto tap into opportunities for collaborative development in urban renewal, withthe original landholders forming cooperatives to finance their developmentprojects or teaming up with a private investor holding shares in redevelopmentor a (Social) Real Estate Investment Trust.
The Law N°10/2012 of 02 May 2012, Governing Urban Planning and Building inRwanda, guides the overall framework for urban planning and building. It isimplemented through a set of orders providing clear procedures for localdevelopment management for sustainable, integrated and inclusive development,with auditing and public inspection components. An amended version of the lawfrom 2012 is expected to be submitted to parliament in the second half of the year.
Two legal documents adopted in 2015 intend to facilitate private investment inaffordable housing. The Prime Minister’s Instructions Nº001/03 of 23 February2017, determining the conditions and procedures for obtaining governmentsupport for affordable and high-density housing projects first adopted in 2015, area step taken to attract investment for affordable housing and represent thegovernment’s commitment to financing neighbourhood infrastructure in projectsfulfilling affordability and efficiency conditions.33 The Law N°06/2015 of 28 March2015 for Investment Promotion and Facilitation offers a preferential corporateincome tax rate for affordable housing projects and accelerated depreciation forinvestment in constructions worth US$ 1.8 million or more.
The new SSP pronounces more emphasis on professionalism in the constructionindustry and the regulation and monitoring of professional bodies. Linked to thiseffort, a Ministerial Order on liability for professionals in the industry is in itsdrafting stage, targeting the life expectancy of a building, its livability andsustainability. Added to this are newly launched green building compliancerequirements, and an internationally recognised voluntary certification system ofthe green building scheme which is under way. The Rwanda Green BuildingOrganisation was launched on 22 November 2016. The green buildingrequirements in Rwanda explicitly target i) energy efficiency; ii) water efficiency;iii) land use efficiency; iv) material efficiency; v) environmental protection; vi) indoorenvironmental quality; and vii) cost efficiency of operation.34
The National Bank of Rwanda (BNR) initiated several legal revisions andcomplementary measures in the finance, microfinance and insurance sub-sectors.Among the tax laws expected to be amended this year is the Law N°59/2011 of31 December 2011 establishing the sources of revenue and property ofdecentralised entities and governing their management with a focus on propertytaxes.
OpportunitiesRwandas National Housing Policy35 reacts sensitively and holistically to the in-country housing situation by demonstrating innovative solutions to challengingconditions. In an effort to overcome the limited resources at micro and macrolevels, the Rwandan government aims to complete a sensitive facilitationframework based on good collaboration with the private sector. The policypromotes the development of housing finance and develops solutions forcollectively carried risks to ensure that the large population groups with low andirregular income receive opportunities to improve their socioeconomiccircumstances.
Additional work is planned to complete and harmonise fiscal, monetary and taxpolicies to enhance household incomes through developing employmentopportunities, domestic productivity and the production of building componentsand materials.36 The private sector, with government facilitation, should take onthe development of a long-term investment sector, including the insurance industry,private sector pension funds and other long-term savings vehicles. It should foster
PPP$40 001 – PPP$10 000 000
PPP$23 001 – PPP$40 000
PPP$12 001 – PPP$23 000
PPP$8 001 – PPP$12 000
PPP$5 001 – PPP$8 000
PPP$3 601 – PPP$5 000
PPP$2 401 – PPP$3 600
PPP$1 601 – PPP$2 400
PPP$801 – PPP$1 600
<PPP$800
- - - Average annual household income needed for the cheapest newly built house by a formal developer, 2017 Average annual household income using expenditure, 2017 (PPP$)
RWANDA
Annual income profile for rural and urban households based on consumption (PPP$)
No. of households (thousands)
PPP$10 746
PPP$33 458
Rural Urban4 000 3 000 2 000 1 000 0 1 000 2 000 3 000 4 000
Population: 10 515 973
Urbanisation rate: 5.57%
Cost of cheapestnewly built house:
17 500 000 RWFPPP$57 246
Urban householdsthat could afford thishouse with finance:
4.46%
1 PPP$:305.7 Rwandan
franc
Source https://www.cgidd.com/

220
active and fair competition in mortgage lending backed by securitisationlegislation.37 Emphasis should be on the promotion of saving and de-riskingproducts for private beneficiary households and on facilitating the finance sectorto offer more accessible housing mortgages. Further activities target resourceefficiency and professionalism in the construction industry and increased local andregional competitiveness – these are priority actions outlined in the SSP 2018-24.More projects should target formal rental housing and the integration of real estatemanagement components. Although partially addressed in the Condominium Lawfrom 2010,38 additional regulations for real estate management are still needed.Amongst these are operation, maintenance, and service charge regulation; atenancy law; changes to securities exchange rules to allow issue of index-linkedbonds; and the completion of a framework that facilitates rental housingcompanies. The economics and finance models around cooperative and rentalhousing models should be further explored in pilot projects.
Sites with a total surface area of approximately 55 hectares in Kigali and the sixsecondary cities are available for development of high-density mixed-use housingthrough the districts. This would increase supply quantities in the short term.About 496 hectares have been identified for possible affordable housinginvestment in the mid term.39 Future growth will be driven by a combination ofcontinued government investments in infrastructure and private investments inconstruction. In addition to catering for domestic demand, Rwanda also providesopportunities for investors to manufacture and export construction materials andskills to the regional market.
SourcesBookstaber, Michael (2015). Business Plan for Development Bank of Rwanda(BRD) to Support and Grow the Housing Production and the Housing FinanceSectors of Rwanda (Second draft).
Buckley, R., Ilberg, A. and Murray, S. (2015). Rwanda’s Urban Housing Policies: ASummary of the Current Situation and Some Suggestions.
Government of Rwanda (2013). Rwanda Financial Sector Strategy 2013-2018,Final Report.http://www.minecofin.gov.rw/fileadmin/templates/documents/sector_strategic_plan/Financial_Sector_Strategic_Plan_June2013.pdf (Accessed 11 July 2018).
Government of Rwanda (2013). Second Economic Development PovertyReduction Strategy 2013-18 (EDPRS 2).
Government of Rwanda (2015). Integrated Household Living ConditionsSurvey, Main Indicators Report, EICV 2013/14.http://www.statistics.gov.rw/publication/main-indicators-report-results-eicv-4(Accessed 5 July 2018).
Government of Rwanda (2015). National Housing Policy.
Government of Rwanda (2015). Rwanda Poverty Profile Report 2013/2014,Results of Integrated Household Living Conditions Survey.http://www.statistics.gov.rw/publication/rwanda-poverty-profile-report-results-eicv-4 (Accessed 5 July 2018).
Government of Rwanda (2017). National Informal Urban SettlementUpgrading Strategy.
Government of Rwanda (2017). National Strategy for Transformation 2017-24.
Government of Rwanda (2017). Urbanisation & Human Settlement SectorStrategic Plan for National Strategy for Transformation 2017-24, 2018/19 -23/24.
Government of Rwanda (2018). The Annual Economic Report Fiscal Year2016/2017.
Ministry of Infrastructure / IPE Global (2017). Consultancy for theEstablishment of Cost- Efficiency Standards for Affordable Housing Projects.
National Bank of Rwanda (2017). BNR Annual Report 2016/2017.https://www.bnr.rw/fileadmin/uploaddoc/BNR_Annual_Report_2016-2017.pdf(Accessed 5 July 2018).
Republic of Rwanda (2011). The 2010/11 Integrated Household LivingConditions Survey (EICV3), National Institute of Statistics, Rwanda.
Republic of Rwanda (2011). Thematic Report Income, 2010/11 IntegratedHousehold Living Conditions Survey (EICV3), NISR.
Republic of Rwanda (2015). The 2013/14 Integrated Household LivingConditions Survey (EICV4), NISR.
Schwab, K. (ed.) (2018). World Economic Forum: The Global CompetitivenessReport 2017–2018. https://www.weforum.org/reports/the-global-competitiveness-report-2017-2018 (Accessed 10 July 2018).
The World Bank (2015). Stocktaking of the Housing Sector in Sub-SaharanAfrica, Challenges and Opportunities.
The World Bank (2018). Doing Business 2018: Reforming to Create Jobs,Rwanda.
Xinhua. Publication from 2018-03-23. Rwanda's economic growth rebounding,continued reforms needed: IMF. http://www.xinhuanet.com/english/2018-03/23/c_137060601.htm (Accessed 1 July 2018).
Websiteswww.bnr.rwhttps://www.bpmis.gov.rw/#
1 National Institute of Statistics Rwanda (NISR) (2017). GDP National Accounts 2017.2 NISR: Gross Domestic Product – 2017.3 Xinhua. Publication from 2018-03-23. Rwanda's economic growth rebounding, continued reforms needed: IMF.
http://www.xinhuanet.com/english/2018-03/23/c_137060601.htm 4 NISR: Gross Domestic Product – 2017.5 Business Sweden-The Swedish Trade & Invest Council (2017): Opportunities in the Construction Industry in
Rwanda, Fact Pack. Pg. 6. https://www.business-sweden.se/contentassets/46366e8d9f584bf495f139ae7f2020d7/factpack---construction-industry-in-rwanda---2017.pdf. (Accessed 2 July 2018).
6 Rated by credit rating agency Standard & Poor.7 Schwab (2018). The Global Competitiveness Report 2017-2018. 8 The World Bank (2018): Doing Business 2018, Rwanda.9 The National Bank of Rwanda (BNR) (2017): BNR Annual Report 2016/17. Pgs. 32/33.10 Savings and credit cooperatives at sector level.11 BNR (2017). 12 BNR (2016): BNR Annual Report 2015/16. Pg. 24. 13 BNR (2017). Pg.43. 14 BNR (2017). Pg. 82.15 Ibid.16 Development Bank of Rwanda (2016). Financial stability Report 2016-17. Pg. 13.17 Buckley, R., Ilberg, A. and Murray, S. (2015). Rwanda’s Urban Housing Policies: A Summary of the Current Situation
and Some Suggestions.18 Price Waterhouse Coopers (2018). Presentation: Reimagine the possible: Rwanda’s 2018/2019 National Budget
Insights and Highlights.19 Ibid.20 The World Bank (2015). Stocktaking of the Housing Sector in Sub-Saharan Africa, Challenges and Opportunities.21 Government of Rwanda (2015). National Housing Policy.
22 IGC estimate for 2014. In IGC (2017): Housing Demand, Results from Updating the 2012 Housing DemandModel. (Presentation document).
23 Republic of Rwanda (2011). Thematic Report Income, 2010/11 Integrated Household Living Conditions Survey(EICV3), NISR.
24 IGC (2017): Housing Demand, Results from Updating the 2012 Housing Demand Model. (Presentationdocument).
25 Government of Rwanda (2015). National Housing Policy.26 Ministry of Infrastructure / IPE Global (2017). Consultancy for the Establishment of Cost-Efficiency Standards for
Affordable Housing Projects.27 Joint Sector Review of the Urbanization and Rural Settlement Sector (June 2016). 28 Altair Ltd. (discussion 2018).29 Ministry of Infrastructure / IPE Global (2017). Consultancy for the Establishment of Cost-Efficiency Standards for
Affordable Housing Projects.30 Ibid. 31 The World Bank (2018). 32 Ministry of Infrastructure / IPE Global (2017). Consultancy for the Establishment of Cost-Efficiency Standards for
Affordable Housing Projects.33 Prime Minister’s Instructions No 004/03 of 13/09/2015 Determining the Conditions and Procedures for
Obtaining Government Support for Affordable Housing Projects. In Official Gazette n°48 of 30/11/2015.34 MININFRA working documents. 35 Government of Rwanda (2015). National Housing Policy. 36 Information from consultation with MININFRA and recorded in Kopany, M. (2015) Supporting Affordable
Housing in Rwanda – Plans and Options from, Policy Note, IGC.37 Bookstaber, M. (2015).38 Law No 15/2010 of 07 May 2010: Creating and organizing condominiums and setting-up procedures for their
registration.39 Ministry of Infrastructure, Status June 2017, Internal brief.
Africa Housing Finance Yearbook 2018
221
São Tomé and Príncipe
be reviewed and amended.11 The third priority is to work with the legislature tominimise the administrative red tape associated with starting a business and tofurther increase the capacity and influence of the judicial system in definingcommercial aspects and regulations.12 The intention with this strategy is to engageand partner with national and international entities and ministries to reinforce andgrow limited economic infrastructure as well as identify and address existingweaknesses within the institutional capacity.13
The country has undergone an extensive process of increasing tax revenues whichwas externally monitored and evaluated. Other funding and economic supportstrategies include large-scale cooperative agreements signed with other countriesincluding China, with a STP3.04 trillion (US$146 million) investment agreementover five years with a sectoral focus on infrastructure (mostly around the ports),health and agriculture.14
The financial sector as a whole is constrained as a result of capital shortages at acorporate level, a lack of bankable projects, and increasingly restricted foreigncurrency reserves.15 Furthermore the government’s economic policies are notsupportive of an emergent private sector. On the whole, despite the increasedlarge-scale investment, the business environment is not ideal due to: high overheads
Overview Sao Tome and Principe (STP) is a lower-middle income archipelago off the westcoast of Africa sharing maritime borders with Equatorial Guinea, Gabon,Cameroon and Nigeria. It is the second least populated African country with anational population of just 208 818 and an area of 1 001 km2.1
The country and its economy are highly vulnerable and subject to exogenousmarket shocks as well as environmental vulnerabilities. The GDP growth rate wasan estimated 5.2 percent in 2017 but is projected to increase to 5.5 percent in2018. This growth is off the back of increased external investments in infra-structure and construction.2 The overall fiscal deficit increased from 1.7 percentof GDP in 2016 to 2.1 percent in 2017, with a further projected increase to2.9 percent in 2018.3 The increasing-deficit trend is expected to remain for aslong as expenditures exceed domestic resource collection.4
Tourism and public infrastructure project investments have increased economicactivity with a recorded GDP of STP8.15 trillion (US$0.391 billion) in 2017, anincrease from STP7.29 trillion (US$0.35 billion) in 2016.5 According to theInternational Monetary Fund (IMF), despite investment in these sectors, a projected6 percent growth is required to reduce the poverty rate.6 The Sao Tomeangovernment continues to drive the extension of the oil industry, which continuesto be identified as a critical sector for growth.7 The expectation is that revenuesgenerated from the industry could potentially reduce poverty and enablesustainable economic transformation and growth over the next decade. Thereare major risks associated with this approach to economic growth due to theweak strategic, legal and regulatory frameworks in Sao Tome. The capacity ofpublic administration, with regard to the transparent management and effectiveand efficient utilisation of public financial resources has been cited as a concernfor growth within the region.8 These challenges and opportunities have solicitedthe involvement of development finance institutions such as the AfDB, the IMFand the World Bank to provide supportive technical assistance as well as fundingto ensure the creation of capacity-building strategies that develop economic andfinancial governance, strengthen strategic planning and programming, and create amore conducive environment for private sector activity.9 This is to be achievedfirstly through the development of policies and capacity aimed at addressing budgetstrength and improving credibility, transparency and efficiencies in execution andcontrol.10 Secondly, the weak reporting and deficient accounting systems must
KEY FIGURES
Main urban centres Sao Tome
Exchange rate: 1 US$ = [a] 26 Jul 2018PPP Exchange rate (Local currency/PPP$) 1 Dobra = [b]Inflation 2016 [c] | Inflation 2017 [c] | Inflation 2018 [c]
20 949.5 Dobra12 463.604.58 | 5.48 | 5.39
Population [d] | Urban population size [d]Population growth rate [d] | Urbanisation rate [e]Percentage of the total population below National Poverty Line 2009 [e]Unemployment rate
208 818 | 144 9752.20% | 3.33%
66.0%13.5%
GDP (Current US$) 2017 [f] | GDP growth rate annual [f]GDP per capita (Current US$) 2017 [f]GNI per capita (Current US$) 2017 [b]Gini co-efficient 2010 [g]HDI global ranking 2015 [h] | HDI country index score 2015 [h]
US$391 million | 5.0%US$1 305US$1 77030.80142 | 0.574
Is there a deeds registry? Number of residential properties that have a title deed Lending interest rate Mortgage interest rate | Mortgage term (years)DownpaymentMortgage book as a percentage of the GDPEstimated number of mortgages Price to Rent Ratio in City Centre | Outside City Centre Gross Rental Yield in City Centre | Outside City Centre Construction as a % of GDP
Yesn/an/a12.0% | 15n/an/an/an/a | n/an/a | n/an/a
What is the cost of standard 50kg bag of cement? What is the price of the cheapest, newly built house by a formaldeveloper or contractor? (Local currency)What is the price of the cheapest, newly built house by a formaldeveloper or contractor? (US$) What is the size of this house (m2)? What is the average rental price for this unit (US$)? What is the minimum stand or plot size for residential property?
n/a
1 508 364 000 Dobra
US$72 000110m2
n/an/a
Ease of Doing Business Rank [i]Number of procedures to register property [i]Time to register property (days) [i]Cost to register property (as % of property value) [i]
169852 days10.20%
NB: Figures are for 2018 unless stated otherwise.
[a] Coinmill.com[b] World Bank World Development Indicators[c] Statista.com[d] Worldometers[e] Central Intelligence Agency (CIA) World Factbook[f] Trading Economics[g] Knomea.com[h] UNDP Development Indicators[i] World Bank Doing Business
222
relating to energy, maintenance, and human capital; high interest rates; a lack ofaccess to long-term financing; further vulnerabilities and instabilities in the bankingsector; and a weak judicial system.
Growth in the agricultural and tourism sectors are coupled with high imports,captured at STP668 billion (US$32.05 million), compared to exports in the firstquarter of 2018 which were lower than usual STP19.4 trillion (US$0.930million).16 Cocoa exports remain the dominant commodity, constituting81 percent of exports. The diverse range of the country’s imports exemplify thevulnerability of the country with a large component of the imports being basicfood sources such as rice and poultry as well as basic construction materials suchas cement.17
There is resulting pressure for government expenditure to act as a primaryeconomic driver. Due to high import rates, domestic price fluctuations are tiedto those of international prices, oil prices being the most notable exemption asfuel prices are fixed.18 In 2010, the STP Dobra was pegged to the Euro to stabilisethe currency. Domestic inflation levels have converged to Euro-area level at anestimated 5.39 percent for 2018.19
Current government agendas include a reform outlined in the 2016-2018 NationalStrategy Document, giving priority to: the promotion of good governance, publicsector transformation, sustainable and inclusive growth; and strengthening humancapital, social service delivery, social cohesion, and social protection. Thegovernment has entered into a three-year macroeconomic framework with theIMF under the Extended Credit Facility (ECF) for 2015-2018, which is in line withtheir programme to reduce the country’s high risk of distress.20 Government hasalso indicated that they will prioritise highly concessional financing (loans with moregenerous terms than those on the open market), in accordance with the IMF’snew debt policy. Under this agreement the government has made a borrowingcommitment of STP946 billion (US$45.4 million) until the end of 2018.21
Furthermore the stipulation is that all new borrowing should go toward projectsin infrastructure and social spending with a high impact on development, includingjob creation and poverty reduction.22
Access to finance STP has a small financial system. The Central Bank of STP (BCSTP) serves in asupervisory role over the national financial system and defines monetary andexchange rate policies in the country. Commercial banks constitute 98 percentof financial sector assets; the majority of the eight banks, namely Afriland First Bank,Banco Equador, BISTP - Banco Internacional de São Tomé e Príncipe, CommercialBank of São Tomé and Príncipe, Ecobank, Island Bank, National Investment Bankand Energy Bank, are foreign-owned.23 Furthermore, the sector is highlyconcentrated with the largest three banks in possession of almost 75 percent oftotal assets.24 The private sector has access to local credit, but this is limited andexpensive despite it being available to both foreign and local investors on equalterms. The country's main economic actors finance themselves outside STP.
The country is ranked 169th in the Word Bank Doing Business Report 2018 foraccess to credit,25 due to high interest rates and a general lack of regulatory policesto ensure credit distribution.26 Furthermore according to the report, in STP thereis no credit bureau or credit registry, the lack of which means that there is noregulatory framework in which credit could be facilitated and monitored, thusincreasing the risk of providing credit.
The lack of versatility and portfolio variance is evident at the individual bank level.Some banks do not have credit exposure to all sectors and the size of the creditportfolios vary greatly. In 2015, credit to the construction sector was providedmainly by one bank, and to a large degree the same was true for lending to tourismand manufacturing. This credit concentration increases banks’ vulnerability tosector-specific shocks as well as limiting the accessibility of finance across theboard.27 However, loans for construction, trade and consumption account forthe largest proportions of credit by the economic sector.28
There is currently no state strategy to develop microfinance institutions and noformal regulatory framework to support the growth and development of thesector, which is almost nonexistent with only a single operator.29 The high
concentration of the banking system has led to limited competition. The systemis composed of negative profitability, a high component of non-performing loans,and low capital adequacy.30 The banks are faced with capital deficiencies and alack of feasible projects exacerbated by a dwindling availability of reserves offoreign currency. Banks thereby need to strengthen their risk-assessment criteriafor lending, as the limited access to finance serves as an impediment to economicdevelopment and poverty alleviation.31
In recognition of the poor performance of the financial sector as a whole, theFinancial Sector Development Implementation Plan (FSDIP): 2017-2019 wasinitiated with a focus on policy reforms and actions in three key areas: (i)strengthening financial sector supervision, (ii) increasing financial inclusion, and (iii)upgrading financial infrastructure.32 Only 48 percent of people have a savingaccount, only 7 percent of small and medium-sized enterprises (SMEs) have a bankloan, and less than 5 percent are clients of consumer finance firms.33 Currentlythere is record of a targeted intervention for housing finance, however theconstraints of the sector as a whole suggest a limited or rather constrained capacity.
Affordability Unemployment is at 13.5 percent with an estimated 62 percent of the populationliving under the poverty line.34 Urban poverty is intensified due to limitedemployment opportunities, particularly for youth, as well as a reliance onemployment opportunities concentrated around one urban centre.35
There is a very limited amount of information available on the cost of living, incomelevels and housing in general in STP. A cost of living survey was conducted in 2011by the International Civil Service Commission’s secretariat in STP, but the samplesize of respondents was very limited. However, the survey provides at least someidea of the situation. According to the study, monthly rental of a three-bedroomhouse at the time cost STP45 million (US$2 160) and a five-bedroom house costSTP68 million (US$3 262).36 In breaking down the disbursement of these rates,apart from the actual rent, the highest cost was for utilities, with a monthly costof STP4.9 million (US$234) and STP10.3 million (US$494) respectively. This datais consistent with business cost analyses which indicate that high costs of electricityact as a major barrier to business growth and investment in the country.
The Public Institute of Housing and Real Estate (Instituto de Habitação eImobiliária, IHI), has indicated the cost of a newly constructed house to be STP625million (US$30 000). They provide no indication of the size, yet it is stated thatthe actual cost of construction is higher. In looking at property listings availablethrough the International Bank of STP (Banco Internacional de S.Tome e Principe),the average cost of a three-bedroom house is approximately STP1.5 billion(US$72 000). Housing affordability is thereby constrained by the cost of housingand a limited and unclear system of housing credit. Furthermore, for the two-thirds of the population mostly employed in the informal economy, only theinformal housing market, community savings and micro-credit schemes (for whichthere is no accurate detailed data) are affordable.
Housing supply The country gained independence from Portugal in 1975. The right to housing isenshrined in Article 49 of the Constitution of Sao Tome, which states that:“Everyone has the right to housing and environment of human life and the dutyto defend” and secondly, “it is incumbent upon the State to plan and execute anintegrated housing policy.”37
STP has only one main urban centre, the city of Sao Tome, which has 65.6 percentof the urban population and a population density of 208.2 per km2 ,86.6 percentof which live in slum areas (2014/2015).38 According to a report produced bythe National Institute of Statistics (INE), in 2012 the majority (68 percent) ofhomes were occupied by their owners, with only 14.6 percent renting, 16.3 percentliving in free accommodation, and 1.2 percent in other arrangements.39 Accordingto this report, as of 2012 there were 29 182 urban dwellings and 14 846 ruraldwellings. The majority (43 percent) of which are one-bedroom units, 37.8 percenttwo-bedroom, 14 percent three-bedroom, 3.9 percent four-bedroom and 1.3percent five-bedrooms or more.40 On average, a family consists of 5.2 persons,the majority of which live in a one to two-bedroom unit.41 The level ofdevelopment of these units is incredibly basic: 76.4 percent of the units have no

Africa Housing Finance Yearbook 2018
223
water on site and 57 percent have no form of sanitation facilities. However, thisis an improvement from 1991 when 80.1 percent of units had no sanitationfacilities.
Houses are primarily made from wood with 64.8 percent using wood forconstruction and 15.3 percent using reclaimed or salvaged wood. Only 19.2percent of houses were masonry-based. The dominant use of these materials isindicative of how informal housing construction has been undertaken as well ashow impoverished the population is. The expansion of informal housing is furtherindicated by the fact that while the use of masonry has dropped by 4.4 percentsince 1991, the use of wood has increased by 12.1 percent over the same period.This trend is expressed further in the prevalence of zinc as the primary roofingmaterial. Houses are incredibly rudimentary and informal.
Property markets Approximately 86 percent of the land is state-owned, as a portion of land wasnationalised when the country gained independence. Given that the state ownsthe land, concession arrangements are made for farmers that have usufruct rightsover the land. Furthermore land can be transferred to private ownership incircumstances in which projects are deemed to be in the national public interestand with adequate compensation.42
STP is ranked 171 out of 190 according to the World Bank Doing Business Report2018 in ease of registering property. The capacity of the Property Registry limitsthe efficiency of this process which would serve as a potential obstacle toinvestment. To register a property, it takes eight procedures, 52 days and costs10.2 percent of the property value. Registration is done with the Finance Ministry,as well as at the Agricultural Ministry for rural land, or at the Geographic andRegistration Services for urban land. Records are all on paper, and propertyregistry and cadastral agencies are not only separate, but they use differentidentification markers for the same properties. As such, and in conjunction withdifferent land tenure types and forms of use, along with the difficulties inregistration, there is duplication of registries with overlapping ownership andconfusion amongst types of entitlement, both within the formal and the informalreal estate markets. In dealing with construction permits, STP is ranked 103 of190, with 16 procedures over 67 days (which is comparatively less than regionalcounterparts’ average of approximately 147.5 days).43 STP is ranked 5 out of 15in the building quality control index.44
These constraints to doing business have been exacerbated by high interest ratesand limited access by investors to credit, coupled with poor physicalinfrastructure.45 Finance, real estate and business services comprised 4.5 percentof the GDP in 2015, demonstrating a recognition for further investment in thissector. However the dominant focus remains agriculture, forestry, fishing andhunting which constitute 40.4 percent of GDP. This indicates the national focuson improving macroeconomic diversification and strengthening local primaryproduction.
STP was rated with a credit rating of 15, for which its market is deemed ‘extremelyspeculative’, which is a low grading that doesn’t engender investor confidence.46
Policy and regulation The Second Poverty Reduction Strategy Paper (PRSP-II), produced by theInternational Development Association (IDA) and the IMF, approved by the STPCabinet in 2012, outlines four objectives namely: “(i) promoting good governanceand public-sector reform, (ii) supporting sustainable and inclusive economic growth,(iii) enhancing human capital and extending basic social services, and (iv) reinforcingsocial cohesion and social protections, particularly for vulnerable groups”.47
In 2014, the land reform office of the Ministry of Agriculture, Fisheries and RuralDevelopment announced plans to redistribute 1 500 abandoned land parcels foragricultural production in a bid to combat poverty in Sao Tome.48 This programmefalls in line with the National Transformation Agenda as part of the STP Vision2030 which specifies nine objectives: reduce poverty in rural and coastal areas;promote youth employment through education and training; strengthen the healthsystem; reinforce the public and administrative management tool; promotetransparency and accountability in relation to the provision of PublicAdministration; strengthen internal security, public security and coastal security;simplify legislation and improve the business environment; implement infrastructureprograms to support growth; and ensure environmental protection and controlof operators.49
In January 2016 the National Land Use Plan (PNAT) Study Project was approved,funded by the Republic of Sao Tome and Principe through a loan from the AfricanDevelopment Fund of approximately STP31 billion (US$1.5 million) andimplemented by the Ministry of Public Works, Infrastructure, Natural Resourcesand Environment.50 The objective of the project is to contribute to sustainablepoverty reduction through coordinated land development which takes intoaccount improved population and activity distribution as well as considering theconstraints and potential of the natural environment, socioeconomic specificitiesof localities and environmental preservation.51 More specifically the study isintended to provide the administration and local authorities of Sao Tome andPrincipe with a planning framework that prioritises a coherent, integrated andinclusive approach to national land use.52 The expected date of completion isDecember 2018, however the formalisation of the recommendations therein intoan adopted legal framework has no projected timeframe.
Opportunities The STP Vision 2030 recognises the pitfalls of the current structure in place andseeks to redress issues of poverty, structural inadequacy, economic vulnerabilityand administrative incapacity. The goals laid out in the plan are being driven largelyby state funding, foreign aid and investment. The successful development of portinfrastructure driven by Chinese enterprise would constitute a significant steptoward improving and opening the geographical and economical gateways intoSTP and would open STP to foreign business and funding as per the plans specified
Source https://www.cgidd.com/
PPP$40 001 – PPP$10 000 000
PPP$23 001 – PPP$40 000
PPP$12 001 – PPP$23 000
PPP$8 001 – PPP$12 000
PPP$5 001 – PPP$8 000
PPP$3 601 – PPP$5 000
PPP$2 401 – PPP$3 600
PPP$1 601 – PPP$2 400
PPP$801 – PPP$1 600
<PPP$800
- - - Average annual household income needed for the cheapest newly built house by a formal developer, 2017 Average annual household income using expenditure, 2017 (PPP$)
SÃO TOMÉ AND PRÍNCIPE
Annual income profile for rural and urban households based on consumption (PPP$)
No. of households (thousands)
PPP$13 235
PPP$69 718
Rural Urban12 10 8 6 4 2 0 2 4 6 8 10 12
Population: 208 818
Urbanisation rate: 3.33%
Cost of cheapestnewly built house:
1 508 364 000 STDPPP$121 022
Urban householdsthat could afford thishouse with finance:
1.34%
1 PPP$: 12 463.6 Dobra

224
in the 2015 Step in London Conference in which potential developments wereflagged within various sectors of the economy. These include ecotourism, portdevelopment, business parks, energy sector growth, and many other potentialprojects and reforms.53
In looking forward, the completion of the PNAT Study is critical in determiningthe direction of development for STP. The impact and effectiveness of this exercisedepends upon the adoption of an effective and comprehensive land use policy, inconjunction with an implementation agent or mechanism that ensures oversightand governance of the policy. Housing, and particularly affordable housing, do notappear to be a primary deliverable for the government and investors in STP,however given the objectives of the PNAT, affordable housing is expected to formpart of any inclusive or holistic poverty reduction strategy.
Additional sources Assembleia Nationale de Sao Tome e Principe (2017).http://www.parlamento.st/ (Accessed 24 September 2017).
World Bank Doing Business (2018). Sao Tome and Principe.http://www.doingbusiness.org/data/exploreeconomies/s%C3%A3o-tom%C3%A9-and-principe (Accessed 25 July 2018).
Websites http://www.nationsonline.org/oneworld/sao_tome_principe.htmwww.coface.comhttps://www.statista.comhttps://knoema.comhttps://icsc.un.orghttp://www.ine.st
1 Worldometers. Sao Tome & Principe Population (LIVE).http://www.worldometers.info/world-population/sao-tome-and-principe-population/ (Accessed 23 July 2018).
2 Soares Da Gama, F. (2018). Sao Tome and Principe: African EconomicOutlook. African Development Bank.https://www.afdb.org/fileadmin/uploads/afdb/Documents/Generic-Documents/country_notes/Sao_Tome_country_note.pdf (Accessed24 July 2018). Pg. 2
3 Soares Da Gama, F. (2018). Pg.2. 4 Ibid.5 Trading Economics (2018). Sao Tome and Principe - Economic
Indicators. https://tradingeconomics.com/sao-tome-and-principe/indicators (Accessed 25 July 2018).
6 Coface (2018). Sao Tome and Principe: Major Macro EconomicIndicators. www.coface.com/Economic-Studies-and-Country-Risks/Sao-Tome-and-Principe (Accessed 23 July 2018).
7 Reuters. “BP, Kosmos win rights to two oil blocks in Sao Tome andPrincipe.” 23 Jan 2018. https://www.reuters.com/article/us-saotome-oil/bp-kosmos-win-rights-to-two-oil-blocks-in-sao-tome-and-principe-idUSKBN1FC133 (Accessed 23 July 2018).
8 African Development Bank Group (2012). Country Strategy Paper2012-2016. https://www.afdb.org/fileadmin/uploads/afdb/Documents/Project-and-Operations/STP%20-%20CSP%202012%20-%202016.pdf (Accessed 24 September 2017).
9 African Development Bank Group (2012). Country Strategy Paper2012-2016.
10 African Development Bank Group (2012). Pg. 21.11 Ibid.12 Ibid.13 Ibid.14 Central Intelligence Agency (CIA). The World Factbook: Africa: Sao
Tome and Principe.https://www.cia.gov/library/publications/resources/the-world-factbook/geos/tp.html (Accessed 25 July 2018).
15 Soares Da Gama, F. (2018).16 Trading Economics (2018).17 OEC (2018). Sao Tome and Principe Profile.
https://atlas.media.mit.edu/en/profile/country/stp/#Imports (Accessed4 September 2018).
18 World Bank (2018). The World Bank in Sao Tome and Principe.https://www.worldbank.org/en/country/saotome/overview (Accessed26 July 2018).
19 Statista(2018). São Tomé and Príncipe: Inflation rate from 2012 to2022. https://www.statista.com/statistics/729387/inflation-rate-in-s%25C3%25A3o-tome-and-principe/ (Accessed 8 September 2018).
20 Soares Da Gama, F. (2018).21 Ibid.22 Ibid.23 BISTP-GPC - Banco Internacional de São Tomé e Príncipe - Gabinete
de Planeamento e Controlo (2016). “BISTP no Mercado de S. Tomé ePríncipe”. Oportunidades de Negócio em São Tomé e Príncipe,Conferences Portugal Global, Lisboa: AICEP Portugal Global, 30September 2016.
24 IMF (2016). Democratic Republic Of São Tomé and Príncipe. IMFCountry Report No. 16/175.https://www.imf.org/external/pubs/ft/scr/2016/cr16175.pdf (Accessed24 September 2018).
25 World Bank Doing Business (2018). 26 Soares Da Gama, F. (2018).27 IMF (2016).28 Ibid. 29 Ibid.30 Soares Da Gama, F. (2018).31 Ibid.32 World Bank (2016). Democratic Republic of São Tome and Príncipe:
Financial Sector Development Implementation Plan, 2017-2019.https://openknowledge.worldbank.org/handle/10986/25684 License: CCBY 3.0 IGO (Accessed 8 September 2018).
33 Ibid.34 Knoema (2018). Sao Tome and Principe. https://knoema.com/atlas/Sao-
Tome-and-Principe (Accessed 24 July 2018).35 World Bank (2018).36 ICSC (2012). Cost of Living Survey Report.
https://icsc.un.org/resources/cold/csr/current/pp/Sao%20Tome%20and%20Principe-11.pdf (Accessed 24 July 2018).
37 Habitat World Map. Sao Tome and Principe. http://habitat-worldmap.org/en/pais/africa/sao-tome-and-principe/ (Accessed 25 July2018).
38 UN-Habitat (2016). UN-Habitat World Cities Report.http://habitat3.org/the-new-urban-agenda/preparatory-process/national-participation/sao-tome-and-principe/ (Accessed 24 September 2017).
39 Instituto Nacional de Estatistica Republica, Democratica de S.Tome ePrinicpe (INE)(2012). Características e Condições de vida das famíliase da habitação.http://www.ine.st/Documentacao/Recenseamentos/2012/TemasRGPH2012/10%20CARACTERISTICAS%20E%20CONDICOES%20DE%20VIDA%20DAS%20FAMILIAS%20E%20DA%20HABITACAO%20Recenseamento%202012.pdf (Accessed 24 September 2017).
40 INE (2012).41 Ibid.
42 U.S Department of State (2017). Bureau of Economic and BusinessAffairs Investment Climate Statements for 2017 – Sao Tome andPrincipe.https://www.state.gov/e/eb/rls/othr/ics/2017investmentclimatestatements/index.htm?dlid=269771&year=2017#wrapper (Accessed8 September 2018).
43 World Bank Doing Business (2018). 44 Ibid. 45 World Bank (2018).46 Trading Economics (2018). 47 IDA & IMF (2013). Democratic Republic of São Tomé and Príncipe
Joint IDA-IMF Staff Advisory Note on the Second Poverty ReductionStrategy. Paper Report No. 72388-ST.http://documents.worldbank.org/curated/en/935171468304470846/pdf/723880PRSP0P130900IDA0SecM201300169.pdf (Accessed24 September 2018). Pg. 1.
48 Graca, R. (2013). Sao Tome Government redistributes land to combatpoverty. Deutsche Welle (DW). http://www.dw.com/pt-002/governo-s%C3%A3o-tomense-redistribui-terras-para-combater-pobreza/a-16966265 (Accessed 24 July 2018).
49 Government of Sao Tome and Principe (2015). Agenda deTransformação-no horizonte 2030, Conferência Internacional dosInvestidores e Parceiros de desenvolvimento (Transformation Agenda-Vision 2030. Conference for international investors and partners fordevelopment).
50 African Development Fund (2015). Study on the National Land UsePlan-Appraisal Report.https://www.afdb.org/fileadmin/uploads/afdb/Documents/Project-and-Operations/SAO_PRINCIPE_AND_PRINCIPE_AR-_Study_on_the_National_Land_Use_Plan__APPROVED.pdf (Accessed8 September 2018). Pg. ii.
51 African Development Bank Group (2018). Sao Tome and Principe -National Land Use Plan Study Project.http://projectsportal.afdb.org/dataportal/VProject/show/P-ST-K00-011(Accessed 8 September 2018).
52 African Development Bank Group (2018).53 Step In London (2015). Sao Tome e Principe International Conference.
http://www.saotomeislands.com/docs/STeP-IN-LONDON-Book-International-Conference-2015.pdf (Accessed 24 September 2017).

Africa Housing Finance Yearbook 2018
225
expansion beyond Dakar to boost infrastructure development, employment andprovide equal access to home ownership for all Senegalese. The governmentremains active in improving the business environment and supporting private andforeign investments.
Access to financeSenegal’s financial sector is growing and dynamic. Some 25 banks are listed by theCentral Bank, as well as four non-bank financial institutions.7 Access to finance inthe country is among the highest in the WAEMU/UEMOA, though low by globalstandards. Senegal has improved its rating on financial inclusion, as illustrated bythe percentage of the population with a bank account, from 15 percent of thecountry’s population over the age of 15 with a bank account in 2014, to 42.3percent in 2018; 7.3 percent have savings, and 7.8 percent have loans comparedto just 4 percent in 2014. The country’s finance sector is growing, as three newbanks have been established in the last two years and the number of brancheshas increased to serve the growing urban population. New products have beenintroduced, among which are credit cards, automatic teller machines (ATMs) andeven consumer credit for automobiles for people with regular revenues.
OverviewSenegal is a low income country located in West Africa on the Atlantic Coast. Thestatistical agency, Agence Nationale de Statistiques et de la Démographie,estimated the population at 15 726 037 inhabitants in 2018,1 and 3 630 324 ofthese live in Dakar, the capital. Comprising an area of 196 712km2, Senegal is highlyurbanised: 44 percent of the population live in urban areas, with a density of80 people per square kilometre.
Senegal’s economic prospects are good. The growth rate of Gross DomesticProduct (GDP) is on the rise and projected by African Economic Outlook toincrease from 6.8 percent in 2017 to 7 percent in 2018, driven by the secondaryand tertiary sectors.2 The country has put efforts into improving services thatsupport production, particularly energy and transportation, and growth isexpected to continue in 2019. According to the International Monetary Fund(IMF), a stronger and sustainable annual growth rate is anticipated up until 2021,estimated to be 7-8 percent.3 The country’s inflation remained low at 1.7 percentin mid 2017 and the exchange rate appreciated in 2018 against some regionaland foreign currencies, against the Naira up to 52.1 percent and against the BritishPound up to 20.4 percent.4 Public debt reached 62 percent of GDP in 2017, upfrom 58.5 percent in 2016.5 Despite the increase, Senegal, according to IMF, ismanaging its debt carefully and the debt ratio remains well below the West AfricanEconomic and Monetary Union (WAEMU/UEMOA) ceiling of 70 percent.6 Theincrease is attributed to the ambitious infrastructure development programmesthat have been implemented in recent years, in agriculture, transportation, andspecial economic zones.
One of the special economic zones is Diamniadio, a multi-functional urbanplatform and a major project of the Emerging Senegal Plan (ESP) adopted in 2014to accelerate progress towards becoming an emerging economy by 2035. Theproject is an instrument for the government of Senegal to transform the economyfrom low economy status to an emerging and sustainable economy. It is expectedthat Diamniadio will revolutionise Senegal’s urban economy and tackle the housingbacklog, a major crisis in Senegal.
Since independence, housing has been a major concern for every Senegalesegovernment because of the scarcity of land and the increasing rates of urbanmigration, especially to Dakar. In 2015, President Macky Sall initiated capital
SenegalKEY FIGURES
Main urban centres Dakar
Exchange rate: 1 US$ = [a] 21 Sep 2018PPP Exchange rate (Local currency/PPP$) CFA Franc = [b]Inflation 2016 [a] | Inflation 2017 [a] | Inflation 2018 [a]
582.1 CFA Franc221.700.90 | 1.40 | 1.50
Population 2017 [b] | Urban population size 2017 [b]Population growth rate 2017 [b] | Urbanisation rate 2017 [b]Percentage of the total population below National Poverty Line 2017 [c]Unemployment rate 2017 [d]
15 858 567 | 7 041 4562.81% | 3.62%
46.70%15.7%
GDP (Current US$) 2017 [b] | GDP growth rate annual 2017 [b]GDP per capita (Current US$) 2017 [b]GNI per capita (Current US$) 2017 [b]Gini co-efficient [b]HDI global ranking 2017 [e] | HDI country index score 2017 [e]
US$16 375 million | 6.79%US$1 033US$95040.28164 | 0.505
Is there a deeds registry? Number of residential properties that have a title deed Lending interest rate [b]Mortgage interest rate [f] | Mortgage term (years)DownpaymentMortgage book as a percentage of the GDP [g]Estimated number of mortgages Price to Rent Ratio in City Centre | Outside City Centre Gross Rental Yield in City Centre | Outside City Centre Construction as a % of GDP
n/an/a5.60%7.62% | 15n/a0.86%n/an/a | n/an/a | n/an/a
What is the cost of standard 50kg bag of cement? [g]What is the price of the cheapest, newly built house by a formaldeveloper or contractor? (Local currency)What is the price of the cheapest, newly built house by a formaldeveloper or contractor? (US$) What is the size of this house (m2)? [g]What is the average rental price for this unit (US$)? [g]What is the minimum stand or plot size for residential property? [g]
US$5.40
10 000 000 CFA Franc
US$17 39265m2
n/an/a
Ease of Doing Business Rank [h]Number of procedures to register property [h]Time to register property (days) [h]Cost to register property (as % of property value) [h]
140556 days7.80%
NB: Figures are for 2018 unless stated otherwise.
[a] Coinmill.com[b] World Bank World Development Indicators [c] Central Intelligence Agency (CIA) World Factbook[d] Trading Economics[e] UNDP Development Indicators[f] Central Bank of West African States[g] CAHF Yearbook 2017[h] World Bank Doing Business

226
The microfinance sector is dynamic and provides financial services for all categoriesof Senegalese in both the urban and rural areas. In 2018, there were 125 MFIsregistered on the Mix Market (an online source of microfinance performance dataand analysis) with 310 000 active borrowers, a gross loan portfolio of US$387million, and US$226 million in deposits.8
In 2017, Senegal remained one of the most active countries among the memberstates of WAEMU/UEMOA with housing loans valued at CFA 48 billion (US$83.5million) out of CFA 288 billion (US$500.9 million ) total housing loans disbursedin the union in 2017. Senegal was second after Côte d’Ivoire.9 According to thelatest study carried out by BCEAO in 2014, Banque de l’Habitat du Senegal (BHS),the mortgage bank of Senegal, represented 30 percent of the total housing loans(CFA 203.7 billion) of the union in 2013.10 BHS, founded in 1979, is among thepioneers in the UEMOA. Its main objective is to finance real estate and homeownership, emphasising the affordable housing market. In the same year, 2013,the average interest rate of the union was 7.44 percent and 6.8 percent forSenegal. The average bond term in Senegal was 8.7 years.11 BHS is evolving froma short-term credit facility to a mortgage bank, mobilising funds locally andinternationally for mortgage products with longer term maturity. Initially createdto serve the low income market, BHS has diversified its services and enlarged themarket it targets. Loans are used to acquire land, to build housing and to purchasehousing. One of its popular products is “Le Park 35,” a mortgage that allows apotential client to acquire a house valued at less than CFA 35 million without adownpayment, at the interest rate of 6 percent, over 20 to 25 years. Among thebank’s more popular products is one that offers a reduced interest rate when theborrower saves 10 percent towards the purchase price. BHS has also contributedto the foundation of some of the mortgage banks in the region.
The Senegalese financial sector is flourishing and so is the housing developmentmarket. By the end of 2017, all commercial banks offered diversified housing loans.In spite of the market dynamism, access to finance is still a challenge for most ofthe population who have no bank accounts. According to the 2018 World BankDoing Business Report, for ease of getting credit, Senegal ranks 142nd out of 190countries.12 According to local media, the situation has gotten more difficult sinceDecember 2017 when the average interest rate on mortgages rose from 6.4percent, one of the lowest in UEMOA, to 8.9 percent, the highest in the union.13
However sources are somewhat contradictory: according to the BCEAO, theaverage interest rate for a housing loan in Senegal in December 2017 was 7.62percent and the average for the union was 8.04 percent.14 The interest rate isrising but is not the highest in the union. There is one public registry and no privatecredit bureaus in Senegal.
AffordabilityHousing affordability remains limited, given the high price of land, high cost offinance, price speculation and inadequate supply, in spite of government efforts toboost production. Senegal’s average interest rate is on the rise from 7.59 percentin 2016 to 7.62 in 2017. There are few developers and many speculators whoprimarily target higher income earners. Rents and property prices depend ongeographical location, the architectural plan and the quality of material used forconstruction. As a regional headquarters of corporate and internationalorganisations, Dakar has a concentration of expatriates in the residential zoneswhere there are varieties of houses: simple well-constructed houses, apartments,luxurious villas and condominiums. According to Knight Frank, a prime propertyrental in a residential area is up to US$2 800 a month for houses in the residentialzones, where there is concentration of prime properties and large-scaledevelopment under construction.15 According to the press, speculation is leadingto price increases in the suburbs. According to a 2010 local survey, rents havemore than doubled in the past years and the minimum rent of a room for studentsis CFA 50 000 (US$86.92). According to the local market, the increase in theinterest rate up to 7.62 percent will accelerate speculation of rents in the urbanareas, particularly in Dakar where most of the population are renters. Prior tothe increase, the rentals ranged from CFA 150 000 to CFA 500 000 (US$260.76to US$869.19) per month.
According to Diène Farba, Minister in charge of housing, housing production rosefrom 4 000 in 2012 to 10 000 in 2016, yet affordability remains a national problem.To this end the government is introducing reforms which includes a new law (LoiN°23-2016) to reduce the cost of production and accelerate the production of
affordable houses for low income groups.16 A new observatory body(Observatoire de l’habitat social) is proposed by some parliamentarians to controleffective application of rules and regulations concerning access to social housesto constrain speculation which is undermining the government’s efforts to boostaffordability.
About 60 percent of the population earn less than US$3.10 a day which makesthe cheapest house unaffordable. The cheapest newly built house is a three-bedroom house built on 150m2 in Diamniadio suburb of Dakar and sold for CFA13 000 000 (US$22 598), requiring monthly payments of CFA 88 627 (US$154)for 15 years. It is expected that the law will contribute to economic growth,eliminate speculation, and boost production and affordability.
Housing supplyMost Senegalese homes are self-built with cement, concrete and stone withcorrugated iron for the ceiling, without an architect, and at a total cost of less thanCFA 30 million (US$52 151) or well above, depending on the plan, the geo-graphical situation and the quality of material used. Informal settlements accountfor 25 percent of urban spaces in Senegal and for 30 percent of inhabited areasin Dakar. However, the situation is changing due to the country’s urbanisationplanning, infrastructure programme, various housing projects, and the governmentsocial housing programme.17 As a result, formal planned communities are underconstruction all over the major urban cities especially the greater Dakar area. Acritical issue in Dakar is the rapid urbanisation rate and the city’s housing backlog,and as such informal settlement persists in the absence of an adequate supply ofhousing. The majority of the population in the informal settlements are low incomeearners, vulnerable and exposed to hygiene problems due to inadequate waterdrainage, sewerage systems and flooding during the rainy season.
The 2016 housing deficit was estimated to be 322 000 units for the whole ofSenegal and 158 000 for Dakar. There are several constraints to the housing supply,especially for low income earners. Insufficient formal market players, limitedavailability of serviced land, limited availability of relevant financial products, highconstruction costs and weak policy all constrain the market. In response to thesechallenges, the government introduced a series of initiatives focusing on theaffordable housing market to address housing demand. Among the initiatives aretax breaks for promoters, subsidies offered to first home-buyers, and a landregularisation programme. To boost housing supply, in 2015 the government alsogranted CFA 1 billion (US$ 1 738 376) to Fonds de garantie pour des investisse-ments prioritaires (FONGIP) to create a special guarantee fund for small andmedium enterprises in the housing sector, and Fonds de garantie pour l’acquisitiondu lodgement (FOGALOG) to facilitate access to financing for small and mediumenterprises. FONGIP is a national guarantee fund created to facilitate access tofinancing SMEs in the government’s priority sectors, such as housing, especially lowincome houses, which are among the top priorities. FOGALOG has signed anagreement with BHS and the housing ministry to facilitate access to affordablehouses for the Senegalese in the informal sector. The 2015 agreement allowsSenegalese households with irregular revenue to access special guaranteed housingloans.
Another important project of ESP is the development of a new city currentlyunder construction. Diamniadio is approximately 30km south west of Dakar and15km away from the future International Airport of Senegal (Blaise Diagne). Theproject targets a diverse market – low, middle and upper class. The houses rangefrom two to four bedroom houses, duplexes and town apartments. Comparedto Dakar, Diamniadio is well-planned and equipped with social infrastructure,including a new conference centre, an industrial park, the second university ofSenegal university campus, commercial centres, schools, hospital and recreationalamenities. The government has allocated serviced plots of land and given otherincentives to developers to promote small and medium enterprises and enhancehousing supply in Senegal.
Recently the government has initiated other measures to increase housingproduction, including a Social Housing Guidelines Act, the decree defining socialhousing, and the Prime Minister’s order establishing approval processes forproduction by private developers.

Africa Housing Finance Yearbook 2018
227
Senegal ranks 145 in the 2018 World Bank Doing Business Report in dealing withconstruction permits. Senegal improved its rank in Ease of Doing Business in 2018to 140th out of 190 countries, up from 147th in 2017. The country has alsoimproved on its property registration and procedure costs, dropping from15.2 percent of the property value in 2015 to 10.2 percent in 2016 and 2017,and 7.8 percent in 2018.
New laws and government programmes project a minimum of 15 000 houses tobe constructed per year.18 Ongoing projects include Cite Sicap Lac Rose, situatedon 70ha, consisting of 2 427 units, 1 820 of which will be constructed on 200m2
plots of land and 607 on 150m2 each. Bambilor is a new city about 10 minutesfrom Lac Rose and 30 minutes from downtown Dakar, and includes Cite CDC,consisting of two to four-bedroom villas, built on 150m2 to 200m2 and costingbetween CFA 10 million and CFA 47 million (US$17 383 and US$81 703). Citede l’Emergence is a project of 11-storey buildings of modern apartments, 16 ofwhich will be constructed in Dakar by Group Adoha, a Moroccan real estatedeveloper. The project consists of 700 apartments and the estimated cost is CFA45 billion (US$78 million) to be delivered in 2017. All the projects target diversemarkets. To date there is no data on the rate of realisation of the ongoing projectsor the number of units delivered.
Property markets Senegal is witnessing dynamic growth in the real estate industry, particularly inDakar and other urban areas. Factors driving the real estate boom include:government development programmes among which are construction of highwaysand secondary roads to improve access to all the regions of Senegal; establishmentof new urban zones; mass production of houses; population growth; and thereputation of Senegal as a stable democratic country which creates an enablingenvironment for investors. Additionally, members of the Senegalese diaspora andAfrican investors from neighbouring countries are building second homes forinvestment.
Over half a million Dakar residents are tenants, and the rental market is said tofavour the landlord. In theory, rents on residential leases are fixed by law accordingto the market value of the premises. In practice, however, rents are decided solelyby the landlord. Presently, access to financing available for producing rental housingon a large scale is improving and the market is promising, considering the effortsof the government in securing long-term financing for affordable homes to sustainthe growth in the sector.
According to real estate consultancy Knight Frank’s 2017-2018 property reportfor Senegal, the residential construction market is quite dynamic especially forsmall-scale schemes. Progress at the larger-scale waterfront development hascontinued to be relatively slow and prices are dropping. According to the press,rents are escalating for the very low income groups, while the supply of housesfor middle income group is improving. Away from the waterfront the market is
buoyant. The Diamniadio and other ongoing projects are under construction,hence the middle to low income household market is booming and there is roomfor growth. Senegal is also improving on its property registration and procedurecosts.
Another important factor to stimulate the market is that institutional publicity,forums, conferences and international forums concerning housing in Senegal aresupported by the government. The International Habitat Fair (“Salon Internationalde l’Habitat”) was held in Dakar for the second time in October 2017.19 Theconference was a venue for stakeholders to share knowledge and businessopportunities for potential investors.
Policy and regulationSenegal’s complex legal and regulatory framework has been identified as one ofthe factors responsible for the housing deficit. As a result, the present governmentis addressing the issue through a participative process with all the stakeholders ofthe sector; hence some reforms are being implemented. New legal frameworksto regulate social housing are intended to accelerate production of affordablehouses, reduce cost of production, regulate control, promote innovation, andpromote the exploitation of local resources, creating employment and wealth. Thenew law and accompanied measures hopefully will enhance the effectiveimplementation of other rules and regulations of the sector.
Changes in law and other incentives to promote the development of real estate,especially housing, are accelerating housing production and stimulating theformalisation of the real estate market.
The Land Tenure Act ensures security of tenure and authorises temporaryoccupancy permit holders in urban centres to transform them, at no cost, intopermanent title deeds. With reinforced security of tenure, it is expected thatlandlords will invest in upgrading their properties, and they are. Most houses inthe capital have been upgraded and land and home prices have escalated. Dakarresidents and even diasporic Senegalese are taking advantage of the new law toregister properties, which is causing property values to appreciate. This result isbeing duplicated in other regions of the country, particularly those close to Dakar.
Opportunities Senegal is among the fastest growing economies in Africa with a young populationin demand of goods and services, particularly adequate accommodation. Thegovernment is trying to satisfy the needs which are in reality investmentopportunities, hence the efforts deployed to attract investors. Although interestrates are on the rise, business opportunities are real, given the geographicalsituation, the political stability, the ambitious infrastructure programme of thecurrent government, the presence of many international organisations anddevelopment agencies, dynamic cultural events, and a robust tourist industry. TheSenegal housing market is booming with construction being undertaken practically
- - - Average annual household income needed for the cheapest newly built house by a formal developer, 2017 Average annual household income using expenditure, 2017 (PPP$)
SENEGAL
Annual income profile for rural and urban households based on consumption (PPP$)
Source https://www.cgidd.com/
PPP$40 001 – PPP$10 000 000
PPP$23 001 – PPP$40 000
PPP$12 001 – PPP$23 000
PPP$8 001 – PPP$12 000
PPP$5 001 – PPP$8 000
PPP$3 601 – PPP$5 000
PPP$2 401 – PPP$3 600
PPP$1 601 – PPP$2 400
PPP$801 – PPP$1 600
<PPP$800No. of households (thousands)
PPP$18 890
PPP$13 744
Rural Urban300 250 200 150 100 50 0 50 100 150 200 250 300
Population: 15 858 567
Urbanisation rate: 3.62%
Cost of cheapestnewly built house:
10 000 000 XOFPPP$45 106
Urban householdsthat could afford thishouse with finance:
63.66%
1 PPP$: 221.7 CFA franc

228
all over the urban centres. The new city of Diamniadio is delivering modernapartments, condominiums and houses of various architectural styles andeconomic standards.
Dakar, the capital, is home to the regional headquarters of many internationalorganisations, some regional organisations, and a gateway to the West Coast ofAfrica and to other major cities on all continents. With the new DakarInternational Airport, inaugurated in December 2017, it is projected that tourismand the hospitality industry will flourish. The geographical location of the airportis also a development factor for some of the neighbouring cities such as Thiès.
The current growth rate, the rate of urbanisation, the government infrastructureprogramme and the commitment of the African Development Bank to supportthe government programmes, are signs that the housing boom is here to stay. Thereturn on investment in real estate is relatively high in Senegal, 12 percent forindustrial, 10 percent for offices, 9.5 percent for retail, and 7 for residential.20 Thereis a need in all sectors of real estate – industrial, retail, offices and residential,especially low income units. The country has improved its business climate and itsperformance in dealing with construction and registration of property and enacteda new law (Loi N°23-2016) to boost production of affordable houses. The newlegal framework and other measures are all incentives for promoting businessopportunities and providing the majority of the population with decent andaffordable houses.
SourcesBCEAO (2016). Annuaire des Banques et Etablissement Financiers del’UEMOA 2016.
https://www.bceao.int/sites/default/files/201712/annuaire_des_banques_et_etablissements_financiers_de_l_umoa_2016.pdf (Accessed 21 September 2018).
BCEAO (2017). Rapport Annuel 2017.https://www.bceao.int/sites/default/files/2018-07/Rapport_annuel_2017.pdf(Accessed 21 September 2018).
Brookings Institute (2017). Foresight Africa: Top Priorities for the Continent in2017. 9 Jan 2017. African Growth Initiative at Brookings.https://www.brookings.edu/multi-chapter-report/foresight-africa/ (Accessed21 September 2018).
Mbow, C., Diop, A. and Diaw, A.T. (2009). “Flood Risk and Land Occupation inDakar Outskirts. Does Climate Variability Reveal Inconsistent UrbanManagement?” In IOP Conference Series Earth and Environmental Science Vol.6 (33). February 2009.
World Bank (2018). Doing Business 2018: Senegal.http://www.doingbusiness.org/content/dam/doingBusiness/country/s/senegal/SEN.pdf (Accessed 26 September 2018).
Websiteswww.bceao.intwww.bhs.snwww.dakaractu.comwww.globalpropertyguide.comwww.knightfrancsk.comwww.lesafriques.comwww.seneweb.comwww.uemoa.int
1 Agence Nationale de la Statistique et de la Demographie. www.ansd.sn (Accessed 10 August 2018). 2 African Development Bank Group (2018). African Economic Outlook 2018.
https://www.afdb.org/fileadmin/uploads/afdb/Documents/Publications/African_Economic_Outlook_2018_-_EN.pdf (Accessed 21 Sept 2018). Pg. 166.
3 Deloite (2017). Invest in Senegal: A competitive investment destination in West Africa - March 2017.https://www2.deloitte.com/content/dam/Deloitte/za/Documents/africa/za_ASG_Country%20Reports_Senegal_Repro.pdf (Accessed 21 Sept 2018). Pg. 2.
4 African Development Bank Group (2018). African Economic Outlook 2018. Pg. 16.5 Ibid.6 IMF (2018). “IMF Staff Completes Review Mission to Senegal.” 11 May 2018.
https://www.imf.org/en/News/Articles/2018/05/11/pr18170-imf-staff-completes-review-mission-to-senegal(Accessed 21 Sept 2018).
7 BCEAO (2018). Rapport sur les Conditions de banques dans l'UEMOA 2017. Tableau 2.https://www.bceao.int/sites/default/files/2018-08/Rapport%20sur%20les%20conditions%20de%20banque%20dans%20l%27UEMOA%20-%202017.pdf (Accessed 21 Sept 2018). Pg. 8.
8 TheMix. Senegal. https://www.themix.org/mixmarket/countries-regions/senegal (Accessed 20 Sept 2018).9 BCEAO (2018). Rapport sur les conditions de banques dans l’UEMOA 2017. Tables 8.1.2. (Accessed
21 Sept 2018). Tables 8.1.2 and 1.1.2.10 BCEAO (2014). Note d’Analyse sur les Conditions de financement bancaires de l’habitat dans l’UEMOA.
Octobre 2014. Pg. 13.
11 BCEAO (2014). Note d’Analyse sur les Conditions de financement bancaires de l’habitat dans l’UEMOA.Octobre 2014. Pg. 5.
12 World Bank (2018). Doing Business 2018: Senegal. 13 Le 360 Afrique (2018). “Credit Immobilier : Le Senegal Bat le Recod de Cherte dans l’UEMOA.”
http://afrique.le360.ma/senegal/economie/2018/04/01/19562-credit-immobilier-le-senegal-bat-le-record-de-cherte-dans-luemoa-19562 (Accessed 10 Aug 2018).
14 BCEAO (2018). Rapport sur les conditions de banques dans l’UEMOA 2017. Tables 8.2.2. and 1.2.2. 15 Knight Frank (2018). Africa Report 2017/18: Real Estate Market in a Continent of Growth and Opportunity.16 Le Soleil Online (2016). “Loi d’orientation sur l’Habitat social : L’Etat va alléger les conditions d’acquisition des
logements sociaux." 31 October 2016. http://lesoleil.sn/actualites/item/57167-loi-d-orientation-sur-l-habitat-social-l-etat-va-alleger-les-conditions-d-acquisition-des-logements-sociaux.html (Accessed 15 Aug 2018).
17 Recensement Général de la population et de l’habitat, de l’agriculture et de l’élevage de 2013 (RGPHAE-2013). Chapitrer Habitat (Chapter 10).
18 Le Soleil Online (2016). “Loi d’orientation sur l’Habitat social : L’Etat va alléger les conditions d’acquisition deslogements sociaux.” 31 Aug 2016.
19 Salon International de l’Habitat de Dakar (SEN Habitat Dakar). 13-15 Oct 2017. http://www.au-senegal.com/salon-international-de-l-habitat-de-dakar-sen-habitat-dakar,14737.html (Accessed 20 Sept 2018).
20 Knight Frank (2018). Africa Report 2017/18: Real Estate Market in a Continent of Growth and Opportunity.Pg. 37.

Africa Housing Finance Yearbook 2018
229
namely starting a business, getting electricity, and registering property; progresswas especially noted in terms of dealing with construction permits as Seychellesincreased transparency by publishing construction industry regulations online freeof charge.6
Access to financeSeychelles has a relatively well-developed financial system overseen by tworegulators namely the Central Bank of Seychelles and the Financial ServicesAuthority. As at December 2017, the Seychelles financial structure comprised10 banks (only nine banks in operation), one credit union, two non-bank creditinstitutions, 15 payment service providers and 27 bureaux de change. Eight outof the 10 banks were privately and primarily foreign-owned while the Governmentof Seychelles held majority ownership in the other two banks. Though licensedsince December 2016, SBM Bank (Seychelles) Limited was yet to commenceoperations as at December 2017.7 The Financial Services Authority has licensedsix domestic and six non-domestic insurance companies as well several insuranceintermediaries. Seychelles also has a securities exchange and a number ofintermediaries.8
For 2017, credit granted by commercial banks rose by 9 per cent to reachSCR10 740 million. Credit granted to the private sector in 2017 amounted toSCR6 032 million, representing an increase of 18 per cent over the previous year,which may be a result of the fall in interest rates as from August 2017. The share
OverviewThe Republic of Seychelles (Seychelles) is a small country, comprising 115 islandsscattered over 1 million square kilometres of sea in the Indian Ocean, northeastof Madagascar. It has a total land area of 455km2 and a population of 95 821 asat December 2017 (an increase of 1.7 percent over 2016).1 Seychelles has metmost of the Millennium Development Goals and reached a high income status in2015, being one of the highest income countries in Sub-Saharan Africa to reachthis status. The income per capita in Seychelles stood at US$15 078 in 2016,representing a growth of 2.3 percent over 2015.2
Seychelles has one of the highest Human Development scores in Africa, ranking62nd globally for the year 2018 (up from 63rd in 2016 and 74th in 2015).3 TheSeychellois economy is heavily dependent on the global economic environment.Tourism dominates the economy and is the main employer. Fisheries are thecountry’s most important export sector, accounting for over 90 percent of exportrevenues, but represent only approximately 11 percent of employment.
The growth rate was 4.5 percent in 2016, driven primarily by strong tourist arrivalsand continued expansion in water and electricity production, information andcommunication services, transportation and financial services.4 Tourism andfisheries contributed considerably to foreign exchange earnings, employment, andgrowth in auxiliary sectors. Tight monetary policy led to a negative one percentinflation in 2016, which was further accentuated by lower than anticipated pricesof oil and other imports.
The World Bank remarks that Seychelles has a very small population in a relativelyisolated location which makes it reliant on external demand, especially tourism.Developments in Europe, which is one of its main tourism markets, renders theeconomy vulnerable to external shocks. Moreover, it has a small pool of localskilled labour and the cost of external transport and energy is quite high, whichposes a challenge in terms of deepening or diversifying Seychelles’ sources ofgrowth. The African Development Bank recommends Seychelles focus oneconomic diversification, structural transformation, and regional integration to dealwith major challenges, notably a small domestic economy, geographical remoteness,high transportation costs, insufficient skilled labour, and vulnerability to externalshocks.5
Seychelles ranked 95 out of 190 countries in the World Bank 2018 Doing BusinessReport, compared to 93 in 2017. While Seychelles has improved in four areas
SeychellesKEY FIGURES
Main urban centres Victoria
Exchange rate: 1 US$ = [a] 10 Sep 2018PPP Exchange rate (Local currency/PPP$) 1 Seychellois rupee = [b]Inflation 2016 [a] | Inflation 2017 [a] | Inflation 2018 [a]
13.25 Seychellois rupee
7.30-1.0 | 2.90 | 3.80
Population [c] | Urban population size [b] Population growth rate [d] | Urbanisation rate [b]Percentage of the total population below National Poverty Line [d]Unemployment rate [d]
95 843 | 52 2741.70% | 1.83%39.3%3.9%
GDP (Current US$) 2017 [b] | GDP growth rate annual 2017 [b]GDP per capita (Current US$) 2017 [b]GNI per capita (Current US$) 2017 [b]Gini co-efficient [d]HDI global ranking 2015 [e] | HDI country index score 2015 [e]
US$1 486 million | 4.2%US$15 504US$14 18045.9063 | 0.78
Is there a deeds registry? Number of residential properties that have a title deed Lending interest rate [f] Mortgage interest rate [f] | Mortgage term (years) [f]Downpayment [f]Mortgage book as a percentage of the GDP [f]Estimated number of mortgages Price to Rent Ratio in City Centre | Outside City Centre Gross Rental Yield in City Centre | Outside City Centre Construction as a % of GDP
yesn/a12.10%7.9% | 2010%3.00%n/an/a | n/an/a | n/an/a
What is the cost of standard 50kg bag of cement? What is the price of the cheapest, newly built house by a formaldeveloper or contractor? (Local currency)What is the price of the cheapest, newly built house by a formaldeveloper or contractor? (US$) What is the size of this house (m2)? What is the average rental price for this unit (US$)? What is the minimum stand or plot size for residential property?
US$7.60
750 000 Seychellois rupee
US$55 535150m2
US$1 184n/a
Ease of Doing Business Rank [g]Number of procedures to register property [g]Time to register property (days) [g]Cost to register property (as % of property value) [g]
95433 days7.00%
NB: Figures are for 2018 unless stated otherwise.
[a] Coinmill.com[b] World Bank World Development Indicators[c] IMF World Economic Outlook Database[d] National Bureau of Statistics[e] UNDP Development Indicators [f] Central Bank of Seychelles[g] World Bank Doing Business

230
of credit to the private sector rose by 23 percent in 2017 (from SCR1 097 millionin 2016 to SCR1 350 million in 2017) and represented 22 percent of the loans tothe private sector (SCR1 350 of SCR 6 032). Mortgage loans increased by23 percent to SCR714 million in 2017. However, credit to the real estate category,with a share of 11 percent of total private sector loans, increased by seven percent.
The banking sector remained profitable in 2017 despite a decline in the net profitafter tax for the sector by 15 percent. Notwithstanding the decrease in theindustry-wide capital adequacy ratio from 27 percent to 24 percent, the bankingsystem remained sufficiently capitalised. The sector average liquid assets-to-total-liabilities ratio climbed by three percentage points and stood at 57 percent atthe end of the year.9 However, the World Bank considers the Seychelles financialsystem as “unsatisfactory” as only seven of the banks may be considered as full-fledged commercial banks. As such, access to credit is limited while lending ratesare high against low interest on deposits, leading to excessive profit margins.
A Financial Literacy Baseline Survey conducted by FinMark Trust in 2016 revealedSeychelles to be the most financially included country in the Southern AfricanDevelopment Community, as 94 percent of Seychellois are banked.10 The studyalso found that 75 percent of Seychellois earn regular and consistent income fromformal channels such as government jobs, employment at private companies,receiving salaries from another individual, or self-employment.
The World Bank ranked Seychelles 133rd (out of 190 countries) for getting creditin the 2018 Doing Business report compared to 118th in 2017 and 109th in 2016.11
Microfinance is extremely limited but growing slowly as international microfinanceinstitutions begin to penetrate the local financial services market. There is a needto set up a credit bureau and to reinforce collateral and bankruptcy laws to protectthe rights of borrowers and lenders and thus facilitate lending.
Housing finance has received explicit attention through two state-sponsoredinstitutions – the Housing Finance Company (HFC) Limited and the PropertyManagement Corporation (PMC). The HFC was established in 2004 from themerger of the Seychelles Housing Development Corporation and a former PMC.In January 2013, the HFC underwent a transformation that saw the PMC split offagain so that the two entities now operate independently though in co-operationwith one another. The HFC is the financier, offering construction and end-userfinance for housing development, home purchase and home improvements,whereas the PMC is the developer, focusing on the construction, managementand maintenance of government’s social housing stock. In the past decade, theHFC has approved over 8 200 loans for a sum of SCR733 million (US$55.32million). HFC borrows affordably from banks and passes the lower interest ratesto its clients. It has served low and moderate income households and aims tocontinue providing affordable loans to the low income earners while operating aprofitable company.
The HFC offers a range of end-user products promoting housing affordability. First,there is a Home Savings Scheme to enable Seychellois to save a minimum depositof 10 percent to qualify for government-constructed housing (the currentpurchase price of government-subsidised housing is approximately SCR450 000,or (US$33 321). If the affordability of the 10 percent deposit is a problem,prospective beneficiaries must demonstrate that they can at least save 10 percentof their monthly income.
There are three types of Home Loans available to Seychellois: Housing LoanScheme, 2nd Housing Loan Scheme and House Extension Loan. The Housing LoanScheme is for clients who are owners of their own plot of land and wish toconstruct thereon, or for those who wish to purchase a property. The maximumloan amount granted under this scheme is SCR850 000 (US$62 940). Theeligibility for this loan is a maximum income of SCR30 000 (US$2 223) a month.There is no minimum qualifying income, though in practice loans are not affordableto those who earn less than SCR6 000 (US$444) a month. The HFC registers amortgage bond (“first charge”) on the properties and requires beneficiaries toobtain mortgage insurance and provide “assignment of salary”. The loan amountis calculated based on the client's net income with the repayment amount beingcalculated at 30 to 40 percent of the net income/combined net income. Themaximum loan repayment term is 23 years, and the loan must be repaid beforethe client reaches 63 years of age.
The 2nd Housing Loan Scheme is for clients who are constructing on their parents’property or other property on which they have permission to build. Themaximum loan amount is SCR400 000 (US$29 619) granted to clients earning amaximum income of SCR30 000 (US$2 223) a month.
Home Improvement Loans are intended to help clients with funds to renovatetheir houses. For general renovations, the maximum amount is SCR50 000(US$3 702) and for re-roofing of the house, the maximum amount is SCR100 000(US$7 405). The maximum loan period is five years (which can be extended toseven years under special circumstances). Applicants must earn less thanSCR15 000 (US$1 111) a month per household.
As of January 2016, HFC has also been assisting pensioners with a HomeImprovement Loan under the pensioner’s scheme. Under this scheme, themaximum amounts granted are SCR50 000 (US$3 702) for general renovationsand SCR100 000 (US$7 405) for re-roofing. The pensioner’s scheme comprisesa component of grant such that 25 percent of the loan amount is subsidised bythe government, while the pensioner repays the balance of 75 percent at aninterest rate of zero percent. The loan repayment term is seven years. Allpensioners are required to have a guarantor who is in stable employment tosecure the Home Improvement Loan. There is no maximum qualifying incomecriterion and a guarantor is compulsory. The guarantor is assessed on the basisthat s/he can afford the monthly repayments, not necessarily that s/he is able toafford to repay the entire loan amount. If the pensioner passes away withoutcompleting the repayment, it will be the guarantor’s responsibility to repay theloan.
A new housing finance subsidy scheme was implemented in 2014, with a totalbudget of SCR21 million (US$1.55 million). It has aided 343 families, whobenefited from assistance to the value of SCR39.7 million over the period 2014to 2016. Despite the presence of commercial banks, most housing projects havebeen financed through the HFC alone to the tune of 97 percent of housingloans.12
AffordabilitySeychelles has a generous social welfare system that supplements incomesconsiderably. Education is free, and subsidies are provided to support post-secondary education. The government is the principle health-care provider andspends significant budgetary resources in the sector. Housing is the primary capitaland services expenditure item for the private sector. Unemployment, which was5.5 percent at the end of 2016, fell to 3.9 percent at the end of 2017. As thecountry with the highest GDP per capita in Sub-Saharan Africa (US$27 602 in2018), Seychelles is ranked 88th in terms of economic freedom.13
Still, there are pockets of poverty. The government has noted a rising trend inreliance on social assistance for income enhancement as well as growing socialproblems, which are impacting on the economy and society. Throughbenchmarking with international governmental bodies for the last decade, theSeychelles Government has steered its housing policies away from being the majorsupplier, from subsidising to more of a facilitator, given that families are beingorientated to be more financially independent. Government housing policies arenot stagnant but are intended to fluctuate with the current housing/economicconditions. The current policy is geared to referring upper-income earners toprivate/commercial financial institutions.
The government of Seychelles has two schemes in place: the social housing andthe condominium schemes. The condominium scheme targets semi-professionalsand professionals and is based on loan sustainability and needs/urgency/priority.Social housing is provided to the public in need of a decent house. Allocation isbased on needs and is established by priority rating and recommendations fromthe local district authority.14
The government has a policy to help Seychellois obtain loans from financialinstitutions. There are six categories of housing and loan schemes: a full housingloan (to construct a new house), a home improvement loan (for minormaintenance/renovation works), a 2nd housing loan scheme (for construction of asecond house – new construction); house extensions schemes (for theconstruction of one extra bedroom and bathroom only); a land loan (to purchase

Africa Housing Finance Yearbook 2018
231
land from the Government/private sector); and a land and house loan (to purchaseexisting property).
Government-subsidised housing is currently being delivered for SCR500 000(US$37 023), and estate agents advise that for SCR200 000 (US$14 810) toSCR300 000 (US$22 214), a buyer can get a very basic unit. An average three-bedroom home of approximately 150m2 ranges from between SCR750 000(US$55 535) and SCR1 million (US$74 047). Construction companies advisethat finished homes sell for between SCR11 500 (US$852) and SCR62 000(US$4 591) per m2. While there are no minimum-house-size regulations, 100m2
is the accepted norm for minimum size. A 100m2 house built by a privatepromoter costs around US$160 000.
The Financial Literacy Baseline Survey, conducted by FinMark Trust in 2016,revealed that the second most important motive for borrowing by Seychelloiswas to buy or build a dwelling or simply to improve or renovate a dwelling.15
However, the percentage of Seychellois saving towards buying, building orrenovating a dwelling is extremely low. Unfortunately, the study also reveals thatthe main reason for borrowing is to pay off debt, with surveys showing around26 percent of Seychellois are over-indebted. Approximately 67 percent of adultsmake use of credit from banks. They may also access credit from other sources.Six percent access credit from informal credit providers, while approximately threepercent exclusively rely on credit from family and friends.
Housing supplyAccording to the latest National Bureau of Statistics figures, Seychelles has 25 929houses. Of these, 87 percent are made of stone/block and 13 percent ofwood/iron. There is a change in building materials and in living conditions and newpatterns in lifestyle, from wood to stone/block, with palm/lattice, houses to modernstructures with modern telecommunications technology, household amenities andownership of assets.
The housing market in Seychelles is still rudimentary. Most people prefer to buildand move into new accommodation; existing accommodation is purchasedprimarily for rental purposes. According to the 2013 Housing and PopulationCensus, most of the population (82 percent) say they own the dwelling in whichthey live.16 Some 11 percent rent their houses privately. Three-bedroomapartment rentals range from SCR16 000 (US$1 184) to SCR19 000 (US$1 406).Just under seven percent say they live rent-free in a dwelling they do not own.Most households (93 percent) have access to treated, piped water, and82.4 percent have flush toilets connected to a septic tank. In terms of energy use,98 percent use electricity for lighting and 92 percent use gas for cooking. Inaddition, 94 percent of the population has access to mobile phones and 95 percentpossess a television set.
The construction sector is showing signs of stagnation as per the quarterly nationalaccounts bulletin of the National Bureau of Statistics, with negative growth noted
in quarters one and four.17 From the period between 2008 and 2011, the sectorhad experienced significant growth that was linked to the implementation of large-scale foreign direct investment projects as well as government housing projects.However, significant declines have been experienced thereafter.
In terms of housing supply, the Government of Seychelles has allocated 1 404houses between 2006 and 2014. The Ile Perseverance housing project is estimatedto provide 2 000 houses from 2006 till the end of the project, thus catering foralmost 70 percent of the housing needs in Seychelles. An estimated 1 055 unitshave already been made available to Seychellois families. A new official plan startedin 2017 whereby authorities will build housing estates in all 25 districts of thecountry. This project is expected to reduce the pressure of congestion aroundVictoria and its suburbs. The lle Perseverance housing estate is the largest urbanarea, with approximately 2 000 houses for an estimated 8 000 people. TheGovernment of Seychelles envisions reducing reliance on government and cash-strapped public enterprises, such as home mortgage finance and propertymanagement companies, by tapping public-private partnership initiatives to financehousing development.
Property marketThe Seychellois property market is strong, driven primarily by the tourist industry.Real estate websites advertise properties in US dollars or euros, and investorsbuy new and existing properties, as well as land. Land in the country is in greatdemand, and the tourism and agricultural industries compete with the housingindustry for sites. Conflicts over land and housing are set to deepen as theurbanisation rate continues to grow. There is no legislation governing the minimumsize of a plot of land. Properties can range from as small as 20m2 to sizeableholdings. Most land is privately held, with prices ranging from SCR731 per squaremetre (US$56) to SCR375 per square metre (US$28.30) for unserviced land.Serviced land averages approximately SCR1 000 per square metre (US$74).However, for prime beachfront properties, the average price stands at SCR21 921(US$1 689) per square metre.
Seychelles ranks 62nd out of 190 countries according to the World Bank’s 2018Doing Business Report for the indicator “ease of registering property”. The fourprocedures take 33 days and cost seven percent of the property value.
In Seychelles, foreigners can own property. Seychellois can purchase property atany time without permission and the transfer tax is set at five percent of thepurchase price. A non-Seychellois may purchase immovable property which isprivately-owned, or rights therein, in Seychelles subject to permission beingobtained from the Government of Seychelles. Sanctions granted are valid for oneyear from the date on which these were issued during which time the transactionsmust have been effected and registered.
Source https://www.cgidd.com/
- - - Average annual household income needed for the cheapest newly built house by a formal developer, 2017 Average annual household income using expenditure, 2017 (PPP$)
SEYCHELLES
Annual income profile for rural and urban households based on consumption (PPP$)
PPP$40 001 – PPP$10 000 000
PPP$23 001 – PPP$40 000
PPP$12 001 – PPP$23 000
PPP$8 001 – PPP$12 000
PPP$5 001 – PPP$8 000
PPP$3 601 – PPP$5 000
PPP$2 401 – PPP$3 600
PPP$1 601 – PPP$2 400
PPP$801 – PPP$1 600
<PPP$800No. of households (thousands)
PPP$33 946
PPP$36 848
Rural Urban8 7 6 5 4 3 2 1 0 1 2 3 4 5 6 7 8
Population: 95 843
Urbanisation rate: 1.83%
Cost of cheapestnewly built house:
750 000 SCRPPP$102 740
Urban householdsthat could afford thishouse with finance:
55.13%
1 PPP$:7.3 Seychellois
rupee
232
Policy and regulation The Ministry of Land Use and Housing is intent, through a variety of measures, onensuring access to adequate housing for all Seychellois. Though the governmentcontinues to develop innovative programmes to address the demand foraffordable housing, there is a need to increase capacity to meet the considerabledemand in the affordable and low income markets.
The government of Seychelles announced in its national budget that SCR18 million(US$1 358 472) will be allocated to the housing finance subsidy schemes in 2018.Moreover, first-time home buyers are charged a maximum processing fee ofSCR2 500 (US$1 358 472) on housing loans below SCR1.5 million(US$1 358 472) and for the remaining loan amount above SCR1.5 million, thefirst-time home buyers will be charged a maximum of 0.5 percent as processingfee on the balance.18
OpportunitiesThe Seychelles has been ranked 95th out of 190 countries overall in the WorldBank’s 2018 Doing Business Report. With the country being a tourist destination,there is a focus on housing for higher income earners. Property prices inSeychelles’ high-end market have risen continuously over the past several years.House prices in Mahe, the largest of the islands, were as follows:
n One-bedroom apartments sell for an average of SCR6.17 million(US$475 000).
n Two-bedroom apartments sell for an average of SCR8.76 million(US$675 000).
n Villas sell for an average of SCR45.43 million (US$3.5 million).
In a bid to open the country to more foreign investment, recent changes in thelaw of property ownership have been approved to offer freehold title andresidency rights to foreign owners and their immediate families.
SourcesAfrican Development Bank Group (2018). African Economic Outlook.https://www.afdb.org/en/knowledge/publications/african-economic-outlook/(Accessed 22 July 2018).
African Development Bank Group (2016). Seychelles Country Strategic Paper2016-2018. https://www.afdb.org/en/documents/document/seychelles-country-strategy-paper-2016-2018-86803/ (Accessed 25 July 2018).
Central Bank of Seychelles (2017). Annual Report 2017.
FinMark Trust (2016). Financial Literacy Baseline Survey Seychelles 2016.http://www.cbs.sc/Downloads/publications/Report_Financial%20Literacy%20Survey.pdf (Accessed 25 July 2018).
FinMark Trust (2011). SADC Microfinance Study: Landscape, regulatoryenvironment, level of monitoring and support. http://www.finmark.org.za/wp-content/uploads/2016/01/Fin66-SADC-Microfinance-Study-20111017-mh-v5.5-final.pdf (Accessed 25 July 2018).
Heritage Foundation (2018). 2018 Index of Economic Freedom.https://www.heritage.org/international-economies/commentary/2018-index-economic-freedom (Accessed 25 July 2018).
International Monetary Fund (2014). Financial Access Survey (FAS) 2014.https://www.imf.org/en/Data (Accessed 25 July 2018).
International Monetary Fund (2018). IMF Country Report: Seychelles.https://www.worldbank.org/en/country/seychelles/overview (Accessed 25 July2018).
Mo Ibrahim Foundation (2017). Ibrahim Index of African Governance IndexReport.
National Bureau of Statistics of Seychelles (2013). Population & HousingCensus 2010. https://www.nbs.gov.sc/downloads/population-and-housing-census-2010-report/download (Accessed 25 July 2018).
National Bureau of Statistics (2018). Seychelles in figures 2017.https://www.nbs.gov.sc/news/91-seychelles-in-figures-2017 (Accessed 25 July2018).
Ministry of Finance, Trade Investment and Economic Planning of Seychelles(2018). National Budget 2018.http://www.finance.gov.sc/uploads/national_budget/Budget%20Speech%20for%20Fiscal%20Year%202018%20Final.pdf (Accessed 25 July 2018).
UN-Habitat (2004). Human Settlements Country Profile: Seychelles.
United Nations Development Programme (2007). Capacity Development forSustainable Land Management in Seychelles.
United Nations Research Institute for Social Development (2009). Social Policyin the Seychelles: Social Policies in Small States Series, No. 5.
World Bank (2012). International Finance Corporation, Country PartnershipStrategy for the Republic of Seychelles, FY 2012 – 2015.http://documents.worldbank.org/curated/en/524151468165858183/pdf/669190CAS0P1240Official0Use0Only090.pdf (Accessed 25 July 2018).
World Bank. (2018). Doing Business 2018: Reforming to create jobs: Seychelles.
Websiteswww.afrol.comwww.cbs.schttp://www.globalpropertyguide.com/www.luh.gov.scwww.mfw4a.orgwww.nation.schttps://www.nbs.gov.scwww.sib.gov.scwww.statehouse.gov.schttp://www.arrivaseychelles.com/ownershiphttps://www.seylii.org/greybook
1 National Bureau of Statistics (2018). Population and vital statistics December 2017.https://www.nbs.gov.sc/downloads/population-vital-statistics-2018-1/download (Accessed 25 July 2018).
2 National Bureau of Statistics (2018). 2016 Annual National Accounts Statistics.https://www.nbs.gov.sc/downloads/ana-2016/download (Accessed 25 July 2018).
3 United Nations Development Programme (2018). 2018 Statistical update and Human Development Index –Seychelles. http://hdr.undp.org/en/countries/profiles/SYC (Accessed 24 September 2018).
4 National Bureau of Statistics (2018). 2016 Annual National Accounts Statistics. 5 African Development Bank (2017). Seychelles Economic Outlook. https://www.afdb.org/en/countries/east-
africa/seychelles/seychelles-economic-outlook/ (Accessed 25 July 2018).6 The World Bank (2018). Ease of Doing Business in Seychelles.
http://www.doingbusiness.org/en/data/exploreeconomies/seychelles# (Accessed 25 July 2018).7 Central Bank of Seychelles (2018). Annual Report 2017.
http://www.cbs.sc/Downloads/publications/Annual%20Report%202017.pdf (Accessed 25 July 2018).8 Financial Services Authority Seychelles (2018). http://www.fsaseychelles.sc/index.php/regulated-entities
(Accessed 25 July 2018).9 Central Bank of Seychelles (2018). Financial Surveillance Report 2017.
http://cbs.sc/Downloads/publications/Financial%20Surveillance%20Report%202017.pdf (Accessed 25 July2018).
10 FinMark Trust (2016). Financial Literacy Baseline Survey Seychelles 2016.11 The World Bank (2018). Ease of Doing Business in Seychelles. 12 Government of Seychelles (2016). 2016 Budget Speech.
http://www.finance.gov.sc/uploads/national_budget/2016%20Budget%20Speech-%20English%20version-%20FINAL.pdf (Accessed 25 July 2018).
13 Heritage Foundation (2018). 2018 Index of Economic Freedom. https://www.heritage.org/international-economies/commentary/2018-index-economic-freedom (Accessed 25 July 2018).
14 Ministry of Habitat, Infrastructure and Land Transport, Seychelles website.http://www.luh.gov.sc/default.aspx?PageId=13 (Accessed 25 July 2018).
15 FinMark Trust (2016). Financial Literacy Baseline Survey Seychelles 2016.16 National Bureau of Statistics of Seychelles (2013). Population & Housing Census 2010.
https://www.nbs.gov.sc/downloads/population-and-housing-census-2010-report/download (Accessed 25 July2018).
17 National Bureau of Statistics of Seychelles (2018). Quarterly National Accounts. Q1 2018https://www.nbs.gov.sc/downloads/quarterly-national-accounts-q1-2018/download (Accessed 25 July 2018).
18 Government of Seychelles (2018). Seychelles government budget for the fiscal year 2018.

Africa Housing Finance Yearbook 2018
233
and South Sudan.10 Further, in 2016, over 50 percent of the population werereported to be living below the international poverty line (US$1.90 per personper day).11
High inflation rates continue to erode the purchasing power of households inSierra Leone. Despite the Bank of Sierra Leone (BSL) maintaining a tight monetarypolicy and several base lending rate increases throughout the year, inflation ratesremain very high. As at June 2018, inflation was 17.7 percent, just slightly lowerthan the 5-year high of 20.2 percent in March 2017.12
Other immediate challenges faced by the government include reducing publicdebt, which stood at 61 percent in 2017, and increasing tax revenue generationand collection.
Access to financeAccording to the BSL, there are 14 commercial banks, 14 microfinance institutions(12 credit-only and two deposit-taking), and one home mortgage finance companyoperating in the country. There are a further 17 community banks offering avariety of finance products and services.
Overview Located in West Africa on the coast, Sierra Leone has an estimated population of7.5 million1 people living in approximately 1.2 million households.2 According tothe latest Census data (2015), the population is relatively evenly distributed acrossthe country with 35 percent residing in the Northern region, 23 percent in theEast, 21 percent in the West and 20 percent in the South. Overall, the geographicalsplit of households is 59 percent rural and 41 percent urban. In 2017, the urbanpopulation growth rate stood at 3 percent per annum.3 As is common in manyAfrican countries, Sierra Leone has a young population with 62 percent of thepopulation falling under the age of 25.4
Sierra Leone’s capital city, Freetown, located in the Western region, is the country’slargest city with a population of 1 million.5 Freetown is the central focus of muchof the country’s urban development debate given its potential to drive economicgrowth, primarily due to its active port, and its political importance (it is the seatof the government).
Following the sharp economic downturn in 2015 driven by the twin shocks of theEbola epidemic and collapse of the iron ore mining sector, Sierra Leone’s economicgrowth continues to be weak. In 2017, GDP growth decreased to 3.7 percent,down from 6 percent the previous year.6 The country’s current economic outlookreflects the continued challenges faced by the mining sector including thesuppressed global iron ore prices, higher domestic energy prices and a reductionin private investment. In addition, the country’s GDP growth in 2017 wasconstrained by lower growth in the construction industry following decreasedpublic sector spending on infrastructure.7
On the upside, the country’s agriculture sector, which contributes approximately61 percent to annual GDP,8 grew by 4.5 percent in 2017 (up from 3.8 percent in2016). The continued resilience of the agriculture sector, expected upturn of themining sector, improved business climate and increased public sector investmentare expected to contribute to generate better economic growth in the medium-term (projected at 6.5 percent by 2020).9 However, a key challenge for thegovernment is to maintain sustained and inclusive economic growth in order toreduce the country’s widespread poverty.
According to the UNDP Human Development Index (HDI) 2018 statisticalupdate, Sierra Leone ranks 184th out of 189 countries, just above Burundi, Chad
Sierra LeoneKEY FIGURES
Main urban centresFreetownBo
Exchange rate: 1 US$ = [a] 7 Sept 2018PPP Exchange rate (Local currency/PPP$) 1 Sierra Leonean leone = [b]Inflation 2016 [c] | Inflation 2017 [c] | Inflation 2018 [c]
8 337.55 Sierra Leonean leone
2 393.5010.80 | 18.25 | 16.63
Population 2015 [c] | Urban population size 2015 [c]Population growth rate 2015 [c] | Urbanisation rate 2015 [c]Percentage of the total population below National Poverty Line 2011 [c]Unemployment rate 2015 [c]
7 092 113 | 2 907 4923.30% | 3.90%
52.9%8.6%
GDP (Current US$) 2017 [b] | GDP growth rate annual 2017 [b]GDP per capita (Current US$) 2017 [b]GNI per capita (Current US$) 2017 [b]Gini co-efficient [c]HDI global ranking 2017 [d] | HDI country index score 2017 [d]
US$3 774 million | 4.2%US$499US$51029.70184 | 0.419
Is there a deeds registry? Number of residential properties that have a title deed [a]Lending interest rate [a]Mortgage interest rate [a] | Mortgage term (years) [a]Downpayment [a]Mortgage book as a percentage of the GDPEstimated number of mortgages [a]Price to Rent Ratio in City Centre | Outside City Centre Gross Rental Yield in City Centre | Outside City Centre Construction as a % of GDP
Yesn/a26.00%22% | 1540%n/a2803.10 | 5.10n/a | n/an/a
What is the cost of standard 50kg bag of cement? What is the price of the cheapest, newly built house by a formaldeveloper or contractor? (Local currency)What is the price of the cheapest, newly built house by a formaldeveloper or contractor? (US$) What is the size of this house (m2)? What is the average rental price for this unit (US$)? What is the minimum stand or plot size for residential property?
US$10.00150 000 000 Sierra Leoneanleone
US$18 000100m2
US$36050m2
Ease of Doing Business Rank [e]Number of procedures to register property [e]Time to register property (days) [e]Cost to register property (as % of property value) [e]
160756 days10.80%
NB: Figures are for 2018 unless stated otherwise.
[a] Bank of Sierra Leone[b] World Bank World Development Indicators[c] Statistics Sierra Leone [d] UNDP Human Development Reports[e] World Bank Doing Business

234
Previously, the financial sector also included two development banks – the NationalDevelopment Bank and the National Co-operative Bank – but according toreports these institutions were “largely dysfunctional” and neither appear to stillbe operational.13
The country also has a small stock exchange. First established in 2001, the SierraLeone Stock Exchange has three listed companies – Rokel Commercial Bank, FirstDiscount House and Home Finance Company (HFC) Mortgage.14
According to a recent World Bank report, Sierra Leone’s banking sector is broadlystable but faces significant risks.15 The percentage of non-performing loans togross loans, although decreasing, remains high at 17.5 percent. Furthermore, thepoor performance of the two largest state-owned banks, Rokel Commercial Bank(RCB) and Sierra Leone Commercial Bank (SLCB), continues to put pressure onthe whole sector. Despite this, total assets in the banking sector increased toLe7.4 trillion (US$884 million) in 2017, while the average capital adequacy ratiowas 34 percent in the same period – although it is reported that the averagecapital adequacy ratio does not accurately reflect credit risk in the country andthe varying performance of different banks.
Financial inclusion remains a major challenge for the Government of Sierra Leoneand this is recognised in the National Strategy for Financial Inclusion for 2017 –2020. The latest Global Findex data indicates that, as of 2017, only 12 percent ofadults (age 15 or older) had an account (either by themselves or with someoneelse) at a bank or other financial institution. Unsurprisingly, the country’s creditmarket is very small. Between 2014 and 2016, average credit extended to theprivate sector was approximately 5 percent of GDP, while in 2017, only 2.8percent of adults were reported to use formal credit products.16 To cope in timesof need, individuals rely on informal products or personal networks for credit.17
Lack of reliable and relevant credit information remains a major constraint to thecountry’s credit sector. In 2018, Sierra Leone ranked 159th out of 190 countrieson the World Bank Doing Business ‘ease of getting credit’ index. The country’sweak legal rights for lenders and borrowers and the dearth of credit informationon borrowers were factors that contributed to this low ranking.18 However,proposed reforms in the credit sector should change this in coming years.
In September 2018, President Bio, with support from the UNCDF and the UNDP,announced an ambitious plan to roll out an improved credit bureau processleveraging the combined power of a digital national identification process andblockchain technology.19 The project will receive funding and technical assistancefrom the UNCDF and UNDP and planned implementation is 2019. Until then,the credit sector will rely on the existing but limited Credit Reference Bureau(CRB), established in 2011 following the passing of the Credit Reference Act 2011.
Given the challenges, few banks offer long-term loans. HFC Mortgage and SavingsBanks (HFC) appears to be the primary provider of mortgage loans and otherhousing-related finance. The bank continues to receive its funding from NASSITwhich was mandated in 2004 to administer the Sierra Leone National PensionScheme. HFC offers nine housing-related loan products ranging from homepurchase mortgages to home equity loans for individuals and construction-relatedfinance aimed at real estate developers.20
HFC home purchase mortgages have a maximum loan amount of Le1 billion(US$120 000) and maximum loan term of 20 years. Upfront costs are high forbuyers. The initial deposit amount is set at 20 percent with additional processingand registration fees of 4.5 percent of the loan amount. The bank applies muchstricter criteria for non-residents; deposit requirements are 30 percent, while themaximum loan term is reduced to 15 years.21
A product targeted directly at low income segments is the HFC ‘Buy Land andBuild Own Home’ mortgage which aims to assist low income households buy landand develop it over time. The loan provides borrowers with access to a maximumof Le83 million (US$10 000) for land purchases and a further Le250 million(US$30 000) for construction. Preconditions for the loan include the client usingthe services of a pre-approved architect and builder; all funds are dispersed directlyto the suppliers and there must be clear and undisputed title to the land.
In terms of finance for developers, HFC offers two products – the ConstructionFinance Mortgage (CFM) and the Construction Stage Payment Mortgage product(CSPM). The CFM is targeted at developers who wish to develop properties forsale, although the loan is not contingent on the properties being sold, and term islimited to 3 years. The CSPM is targeted at developers who are ether in theprocess of, or planning to, build properties for prospective HFC mortgageborrowers but need finance to finish the project. The maximum loan term on theCSPM is only 12 months.
It is unclear what interest rates the HFC charge on any of their mortgage loans,however, they are likely to be high. BSL base lending rates followed an upwardtrend throughout 2018. As at July 2018, the base lending rate was 16.5 percent,up from around 12 percent in June 2017.
Of the 14 MFIs in Sierra Leone, only one appears to be actively offering housing-related loans – A Call to Business (ACTB). However, limited information is availableon the characteristics of their micro housing loan.22 Likewise, updated informationon the performance of the MFI sector in Sierra Leone is not available.
AffordabilityHousing affordability is a serious challenge in Sierra Leone. Aside from lowincomes, most of the population are self-employed which adds a level ofcomplexity to credit extension. Based on the latest revision in 2015, the nationalminimum monthly wage currently sits at Le500 000 (US$60).23 However, thisonly applies to salaried workers, of which there are not many. According to 2015Census data, at least 2.2 million individuals are self-employed (mostly withoutemployees), while approximately 275 000 individuals are paid employees. Thetotal employed population in 2015 was 2.75 million, the majority of which areworking in the agriculture sector.24
Sierra Leone’s development partners continually stress the role that a well-functioning capital city, like that of Freetown, can play in generating a moreproductive labour force and profitable job market. Current constraints to businessin the city include unreliable access to electricity, poor infrastructure, strainedtransport systems resulting in poor mobility of people and goods, inefficient landuse and poor land administration creating an insecure and unmarketable landmarket.25 Given these challenges, business in the city consists of predominantlysmall, informal retail outlets employing few people.
With property prices in the formal market ranging from Le2.3 million (US$275)to Le21 million (US$2 511) for a one bedroom in the city centre, and up to Le67.6million (US$8 000) for a 3-bedroom apartment in the city centre,26 the urbanpoor are entirely reliant on densely populated informal settlements for shelter.Those with some capacity to rent properties are also continuously under pressuredue to annual rent increases. According to a 2015 SALHOC survey, middle tolow income households are spending over 40 percent of their income onhousing.27
Housing supplyCreating access to affordable housing remains a major challenge for government.According to the 2015 Census, there are 1.2 million households living inapproximately 801 000 dwelling units in Sierra Leone. In urban areas alone, thehousing stock deficit stands at over 500 000 units.28 The lack of housing stockcombined with high urban population growth rates has created a housing marketthat is characterised by overcrowded, sub-standard living conditions in sprawlinginformal settlements.
Given this situation, many households cope by sharing dwellings with otherhouseholds. In 2015, it was found that, on average, two households live in onedwelling unit with an average dwelling size (total number of people living in thedwelling) of 9.2 people in urban areas.29
In terms of dwelling type, 48 percent of urban households live in stand-alonedwellings (“separate houses”) or semi-detached houses, while a further 27 percentlive in flats/apartments. Over 90 000 urban households (or 16 percent of all urbanhouseholds) live in a room in a shared house (“compound house”), furtherhighlighting the disparity between the supply of, and demand for, urban housing.

Africa Housing Finance Yearbook 2018
235
No doubt the rise of shared living arrangements has contributed to the increasein rental housing in the country. In 2015, 23.8 percent of all households reportedrenting their dwellings, up from 19.3 percent in 2004. As is typically the case,renting is a more significant form of tenure in urban Sierra Leone than it is in ruralareas. Using the same Census data, 46 percent of urban households reportedrenting their dwellings, compared to less than six percent of rural households.Forty seven percent of urban households reported owning their dwellings.30
Property ownership in the country has largely been driven by householdsthemselves, either through self-build or inheritance. As of 2015, 48.7 percent ofall households were owner-constructed, while 20.3 percent were owner-inherited.Only 2 percent of households reported purchasing their current dwelling,suggesting that very little, if any, housing stock is being delivered by the private andpublic sector.31
While self-build is supplying much-needed housing stock in the country, there isclearly a need to support households to improve both the quality of theirconstruction and access to formal building materials. A significant proportion ofurban households are constructed using ‘traditional’ materials. For example, 43percent of urban households were reported to have either mud bricks, zinc, timber,sandcrete or mud & wattle as their primary wall material.32 Based on thehousehold’s subjective assessment of their dwelling condition, 23 percent ofdwellings needed either major repairs/rehabilitation or complete reconstructionin 2015.33
An estimated three quarters of the urban population in Sierra Leone are living inslum living conditions characterised by, amongst other things, poor access tosanitation and limited access to safe drinking water.34 As at 2015, approximately10 percent of urban households had access to a flush toilet either inside or outsidetheir dwelling, while a similar proportion had access to piped water. The lack ofaccess to clean water and improved sanitation is compounded by poor wastemanagement practices in the country.35
Sierra Leone’s major infrastructural challenges with respect to water, sanitationand waste management were put in the spotlight during the Ebola crisis whenaccess to clean running water and hygienic disposal of waste were critical factorsfor disease management and infection control. With the Water Sector Reformproject under the Millennium Challenge Corporation (MCC), the Governmenthopes to improve water service delivery in the country and reduce currentinefficiencies in the sector.36
While seemingly good relative to other services, access to electricity is a furtherchallenge. According to the 2015 Census, less than 50 percent of urbanhouseholds have access to electricity,37 though energy sector reforms have takenplace in recent years with the support of the World Bank through their SierraLeone Infrastructure Development Fund.38
Following the end of government-subsidised housing in 2002, housing delivery hasrelied largely on the private sector, NGOs and donors.39 The government-backedNational Social Security and Insurance Trust (NASSIT), despite its promises todeliver affordable housing across the country, has largely been ineffective. NASSITis reported to have built houses that are unaffordable for its initial target market,resulting in some of their houses now standing vacant.40
Unsurprisingly private sector developers have focused on higher-income marketsegments, while local NGOs attempt to fill the gap in housing delivery. Forexample, Home Leone, a local NGO with a mission to eradicate slum living, plansto build 1 000 homes by 2019. In addition to housing, Home Leone combineseducation, skills development and training in order to create long-term change.41
Despite poor housing delivery to date, Sierra Leone Housing Corporation(SALHOC) and the newly re-established Ministry of Planning and EconomicDevelopment (MoPED) are reportedly in discussions about affordable housingsolutions and strategies for the fourth National Agenda for Prosperity,42 suggestingthat the government remains committed to its 2035 vision to provide “access toaffordable housing for all”.43
Property marketsAccording to the SALHOC, new housing development is constrained by limitedaccess to finance and state land, as well as the country’s rent assessment codes.44
Additional challenges include the time and cost required to obtain a buildingpermit and register a property, as well as poor land administration. It currentlytakes 17 procedures and 182 days to access a building permit and a further 56days to register a property.45
In terms of land administration, Sierra Leone title deeds and city maps are stillrecorded in paper format and currently no registry of privately held land currentlyexists.46 This has led to a situation of widespread land disputes and corruption.However, the National Land Policy 2015 aims to address these issues with thedevelopment of a new land administration and management system, among otherreforms.47 It is still too early to tell if this new policy has been effective or not.
Previous efforts by SALHOC to provide affordable housing have failed due totenant non-payment. In 2015, SALHOC reported that they were owed over Le1billion (US$119 million) by tenants in their two housing estates, including the Kissylow cost housing estate.48
Policy and regulationAfter six years in development, the National Land Policy was adopted in 2015. Theextensive policy document sets out several land reforms and policy clarificationsincluding, but not limited to, a revision of the constitution to allow women equalrights to own land and the clarification of land tenure forms.
Source https://www.cgidd.com/
PPP$40 001 – PPP$10 000 000
PPP$23 001 – PPP$40 000
PPP$12 001 – PPP$23 000
PPP$8 001 – PPP$12 000
PPP$5 001 – PPP$8 000
PPP$3 601 – PPP$5 000
PPP$2 401 – PPP$3 600
PPP$1 601 – PPP$2 400
PPP$801 – PPP$1 600
<PPP$800
- - - Average annual household income needed for the cheapest newly built house by a formal developer, 2017 Average annual household income using expenditure, 2017 (PPP$)
SIERRA LEONE
Annual income profile for rural and urban households based on consumption (PPP$)
No. of households (thousands)
PPP$15 811
PPP$57 328
Rural Urban300 250 200 150 100 50 0 50 100 150 200 250 300
Population: 7 092 113
Urbanisation rate: 3.90%
Cost of cheapestnewly built house:
150 000 000 SLLPPP$62 670
Urban householdsthat could afford thishouse with finance:
7.52%
1 PPP$:2 393.5 SierraLeonean leone
236
Sierra Leone has a dual land tenure system – common law governs land in theWestern Region while customary law governs the land in all the other regions(North, East, South – also known as the ‘Provinces’). Land in the Western regionmay be individually-owned by individuals or a group of individuals or by a privatecompany under freehold tenure. Communal land is entrusted to the respectivecommunity and Chiefdom Land Committee. Any land transaction under customarytenure must be recognised by the Chiefdom. There is also a subset of customarytenure called family tenure where land is owned by a family and administered bythe family head.49
Foreigners are allowed title to land in Sierra Leone but only under a 50-yearleasehold. The policy also limits the amount of land that foreigners can own to5 000 hectares.
However, the National Land Policy fails to consider rental housing in much detail,though some mention is made about rental tribunals and the potential need formore to be operationalised across the country. As at 2015, there was only onerental tribunal in the country. Given this oversight, the rental market is still governedunder the outdated Rent Restrictions Act, Cap 52 established in the 1950s. It isnot clear to what extent the policies of the Rent Restrictions Act are still enforcedbut, nonetheless it is fair to say that the country is in urgent need of a revised rentalhousing policy.
OpportunitiesProviding decent housing and safe living conditions remains a major challenge forthe government but with an already high and growing fiscal deficit, the countrylacks the resources required to implement any major infrastructure investments.However, with the support of its development partners, the country is makingprogress.
The 2015 National Land Policy provides much-needed clarity with regard to landtenure forms and improvements with the land management and administrationsystems. This together with an ambitious plan to roll out a digital national identity
and credit bureau system leveraging block chain technology, should go some wayto improving the functioning of the country’s housing and housing finance market.
However, the development of the country’s housing market is highly reliant oneffective urban planning. The World Bank estimates that the urban population inFreetown will double in the next 20 years. With already weak infrastructureproviding limited access to basic services, inefficient land use resulting in sprawlinginformal settlements, and poor land administration resulting in increasedconstruction of illegal dwellings in environmentally unsafe areas, it is clear that thecity is in urgent need of a coherent urban development plan. The World Bankcautions that without such a plan, any future investments in infrastructure, landreform and housing in the country will be severely constrained by the additionalcost and effort required to implement plans once settlement has already occurred.
Investment in housing without efficient land administration and secure tenure isnot recommended. However, where households have title and have alreadyinvested in their dwelling, there is great opportunity to provide home improvementsupport programmes. With the prevalence of owner-constructed housing,technical assistance and training programmes could help improve the quality anddurability of existing dwellings. Furthermore, much-needed skills would also betransferred to communities.
Despite its challenges, the country holds significant potential for growth, particularlythe capital city which could be developed into a hub for West African exportsand centre of urban renewal in the country.
Websiteshttps://www.statistics.sl/http://www.doingbusiness.org/https://www.bsl.gov.sl/
1 The World Bank (2018). World Development Indicators. http://databank.worldbank.org/data/source/world-development-indicators/ (Accessed 27 September 2018).
2 Statistics Sierre Leone (2017). 2015 Population and Housing Census. Thematic Report on HousingConditions. https://www.statistics.sl/images/StatisticsSL/Documents/Census/2015/sl_2015_phc_thematic_report_on_housing_conditions.pdf (Accessed 27 September 2018). Pg. 1.
3 The World Bank (2018). 4 Statistics Sierra Leone (2016). 2015 Population and Housing Census. Summary of Final Results.
https://www.statistics.sl/images/StatisticsSL/Documents/final-results_-2015_population_and_housing_census.pdf (Accessed 27 September 2018). Pg. 46.
5 Statistics Sierre Leone (2017). Pg. 13. 6 The World Bank (2018). Sierre Leone Economic Update. Edition No 1. June 2018.
https://openknowledge.worldbank.org/bitstream/handle/10986/30032/127049-WP-PUBLIC-SierraLeoneEconomicUpdatev.pdf?sequence=1&isAllowed=y (Accessed 27 September 2018).
7 Ibid. 8 Indexmundi (2018). Sierra Leone Economy Profile 2018.
https://www.indexmundi.com/sierra_leone/economy_profile.html (Accessed 27 September 2019)9 The World Bank (2018). Sierra Leone Economic Update. Edition No 1. June 2018. Pg. 39. 10 UNDP (2018). Human Development Index. http://hdr.undp.org/en/composite/HDI (Accessed
28 September 2018). 11 UNDP (2016). Human Development Report. http://www.hdr.undp.org/sites/default/files/2016_human_
development_report.pdf (Accessed 28 September 2018). 12 Trading Economics (2018). Sierra Leone Inflation Rate. https://tradingeconomics.com/sierra-leone/inflation-cpi
(Accessed 27 September 2018). 13 Government of Sierra Leone (2005). Poverty Reduction Strategy Paper. A National Programme for Food
Security, Job Creation and Good Governance 2005 – 2007. http://siteresources.worldbank.org/INTPRS1/Resources/Sierra-Leone_PRSP(March-2005).doc (Accessed 29 September 2018).
14 Globalex Markets (2017). Stock Exchanges.http://www.globexmarkets.com/exchanges/af/exchanges_af_sle.html (Accessed 28 September 2018).
15 The World Bank (2018). Sierra Leone Economic Update. Edition No 1. June 2018. Pg. 30.16 BSL (2017). National Strategy for Financial Inclusion 2017 – 2020. https://www.bsl.gov.sl/SL%20FI%
20Strategy%202017%20-%202020.pdf (Accessed 29 September 2018). Pg. 31. 17 In 2017, 18 percent of adults (15+) reported that they borrowed from an informal savings club in the past 12
months, while 29 percent said that they borrowed from friends or family members. Four percent of adultsreported borrowing from a bank or financial institution in the same period. Source: The World Bank (2017).Global Financial Inclusion Indicators. http://databank.worldbank.org/data/reports.aspx?source=global-financial-inclusion (Accessed 28 September 2018).
18 The World Bank (2018). Ease of Doing Business in Sierra Leone. http://www.doingbusiness.org/en/data/exploreeconomies/sierra-leone#DB_gc (Accessed 28 September 2018).
19 UNCDF (2018). Kiva, Sierra Leone and United Nations agencies partner to implement “credit bureau of thefuture”. 28 September 2018. http://www.uncdf.org/article/3948/kiva-sierra-leone-and-united-nations-agencies-partner-to-implement-credit-bureau-of-the-future (Accessed 28 September 2018).
20 HFC (nd.). Mortgage products. http://www.hfcsl.org/mortage.html (Accessed 28 September 2018). 21 HFC (nd.).22 ACTB (nd.). Loan products. http://savingsandloans.sl/products-and-services/loan-products (Accessed
28 September 2018). 23 Kamara, A. (2018). Only 2 media houses are paying the minimum wage – IMC. 14 September 2018.
https://awoko.org/2018/09/27/sierra-leone-news-only-2-media-houses-are-paying-the-minimum-wage-imc/(Accessed 29 September 2018).
24 Statistics Sierra Leone (2016). Pgs. 92 – 102.
25 The World Bank (2018). Sierra Leone Economic Update. Edition No 1. June 2018. Pg.57.26 Numbeo (2018). Cost of living in Sierra Leone. https://www.numbeo.com/cost-of-living/country_
result.jsp?country=Sierra+Leone&displayCurrency=USD (Accessed 29 September 2018). 27 CAHF (2017). Housing Finance in Africa Yearbook (8th Edition).
http://housingfinanceafrica.org/app/uploads/2017_CAHF_YEARBOOK_14.10-copy.compressed.pdf 28 Housing stock deficit calculated by subtracting the total urban housing stock (i.e. dwelling units) from the total
number of urban households and multiplying the number by 2 (on average, 1.6 households live in onedwelling). Data obtained from: Statistics Sierra Leone (2016). 2015 Population and Housing Census.Summary of Final Results. Pg. 122.
29 Statistics Sierre Leone (2017). 2015 Population and Housing Census. Thematic Report on HousingConditions. https://www.statistics.sl/images/StatisticsSL/Documents/Census/2015/sl_2015_phc_thematic_report_on_housing_conditions.pdf (Accessed 27 September 2018). Pgs. 42 – 43.
30 Statistics Sierra Leone (2016). Pg. 126. 31 Statistics Sierre Leone (2017). Pg. 42. 32 Statistics Sierre Leone (2017). Pg. 132. 33 Ibid. Pg. 127. 34 The World Bank (2018). World Development Indicators. 35 African Research Institute (2015). Flooding in Freetown: a failure of planning? 6 November 2015.
https://www.africaresearchinstitute.org/blog/flooding-in-freetown-a-failure-of-planning/ (Accessed28 September 2018).
36 MCC (nd.). Sierra Leone Threshold Program. https://www.mcc.gov/where-we-work/program/sierra-leone-threshold-program (Accessed 28 September 2018).
37 Statistics Sierra Leone (2016). Pg. 140. 38 The World Bank (2018). Sierra Leone Energy Access Project. http://projects.worldbank.org/P126180/sierra-
leone-energy-access-project-sierra-leone-infrastructure-development-fund?lang=en&tab=overview(Accessed 28 September 2018).
39 Rogers, S. (2016). Rethinking ‘expert sense’ in international development: the case of Sierra Leone’s housingpolicy. UCT Graduate School of Business.https://www.tandfonline.com/doi/pdf/10.1080/03056244.2016.1169163 Pg. 583.
40 Moriba, S. (2017). NASSIT housing project in Kenema – a “white elephant”.https://awoko.org/2017/09/12/sierra-leone-news-nassit-housing-project-in-kenema-a-white-elephant/(Accessed 28 September 2018).
41 Home Leone (2016). Turley and Home Leone: A CSR Partnership Project. https://homeleone.org/wp-content/uploads/2014/11/Turley-and-Home-Leone-report.pdf (Accessed 28 September 2018).
42 Villa, S. (2018). SALHOC discusses solutions to affordable housing. https://awoko.org/2018/07/18/sierra-leone-news-salhoc-discusses-solutions-to-affordable-housing/ (Accessed 28 September 2018).
43 The Government of Sierra Leone. (nd.) The Agenda for Prosperity. Sierra Leone’s Third Generation PovertyReduction Paper. 2013 – 2018.http://www.undp.org/content/dam/sierraleone/docs/projectdocuments/povreduction/undp_sle_The%20Agenda%20for%20Prosperity%20.pdf (Accessed 28 September 2018).
44 Villa, S. (2018). 45 The World Bank (2018). Ease of doing business in Sierra Leone.46 Ibid. 47 Joaque, Z. (2017). Land rights policy contributes to poverty reduction. https://awoko.org/2017/07/28/sierra-
leone-news-land-rights-policy-contributes-to-poverty-reduction/ (Accessed 28 September 2018). 48 Bangura, J (nd.). Tenants owe SALHOC billions of leones. http://slconcordtimes.com/tenants-owe-salhoc-
billions-of-leones/ (Accessed 29 September 2018). 49 The Government of Sierra Leone (2015). Final National Land Policy of Sierra Leone. Version 6. 1 August
2015. http://extwprlegs1.fao.org/docs/pdf/sie155203.pdf (Accesses 29 September 2018).

Africa Housing Finance Yearbook 2018
237
41.8 percent of school-aged children are enrolled in primary schools and less thaneight percent of secondary age children attend secondary schools.
Access to finance Before 1991 Somalia had a basic financial system comprising the Central Bank ofSomalia and three commercial banks. During 1991-2011, Somalia was suspendedfrom accessing global financial markets and did not have functioning banks. In thelast decade, the banking system has been revitalised. From 1991 to 2009 theinformal financial sector – Hawalas – developed and filled the gap by providingbasic financial services especially trust-based loans, international remittances aswell as domestic financial transactions, and money transfer services.9 The formalfinancial sector is small and concentrated in Mogadishu with each institution havingonly a few branches in other parts of the country. It comprises the Central Bankof Somalia (CBS), six banks with provisional licences, and 12 licensed MoneyTransfer Operators (MTOs). The CBS and Somali financial institutions are takingcrucial steps to modernise national payments systems. The World Bank, the CBSand private financial institutions are streamlining their efforts to strengthen the
Overview The Federal Republic of Somalia covers an area of 637 657 square kilometres andis comprised of three regions: Puntland, Somaliland, and South-Central Somalia.The regions are autonomously governed with different governance structures.There are 20 urban centres including the capital Mogadishu. In the past threedecades, Somalia suffered civil strife, recurrent drought and famine, and violentconflicts.1 The formation of the Federal Government of Somalia in 2012established the first permanent government since 1991. Parliamentary andpresidential elections were held in December 2016 and February 2017respectively. However, the political situation remains challenging.2
With an estimated GDP of US$17.47 million in the financial year 2017/18, Somaliais one of the poorest economies in the world.3 It is ranked 190 in the world interms of doing business.4 The per capita income increased from US$435 in 2016to US$442 in 2017. A fledgling agriculture sector, grants, donor support,remittances, and foreign direct investment, mostly by the Somali diaspora, remainthe main sources of economic growth. The Somali diaspora provide over80 percent of the start-up capital for small and medium enterprises. Somalia hassubstantial unexplored mineral deposits, agriculture and fishing. Livestock rearingis the backbone of the economy and accounts for 80 percent of foreign exchangereceipts and 60 percent of the population derives a livelihood from livestockproduction. Almost half of the country’s population requires a humanitarianresponse because of the severe drought.5 Since 2013, the donor community hasgiven more than US$4.5 billion in humanitarian and developmental grants. Theperpetual instability compounds the challenges to restore peace, stability andeconomic prosperity.
The population of Somalia is 15.1 million.6 At least 67 percent is rural, and theremaining 32 percent is urban. According to UN-Habitat, the urban population isexpected to increase to 44.6 percent by 2025. The Somalia NationalDevelopment Plan 2017-2019 shows that 69 percent of the population livesbelow the poverty line, 88 percent of the internally displaced population is poor,75 percent and 67 percent of the rural and urban population respectively are alsopoor. A weak government, insecurity, and natural disasters such as floods anddroughts all aggravate poverty.7 Almost 70 percent of the population is underthe age of 30. The youth unemployment rates are estimated at 67 percent.8 Thispredisposes the youth to violence and criminal activities. Currently only
SomaliaKEY FIGURES
Main urban centres Mogadishu
Exchange rate: 1 US$ = [a] 6 Jul 2018PPP Exchange rate (Local currency/PPP$) 1 Somali shilling = Inflation 2016 [b] | Inflation 2017 [b] | Inflation 2018 [b]
571.03 Somali shillingn/a1.28 | 5.24 | 2.80
Population [c] | Urban population size [d] Population growth rate 2017 [d] | Urbanisation rate [e]Percentage of the total population below National Poverty LineUnemployment rate 2017
15 100 000 | 4 968 5263.00% | 4.06%n/a67.0%
GDP (Current US$) 2017 [b] | GDP growth rate annual 2017 [b]GDP per capita (Current US$) 2017 [b]GNI per capita (Current US$) 2017 [b]Gini co-efficient HDI global ranking | HDI country index score
US$7 369 million | 3.10%US$500US$521n/an/a | n/a
Is there a deeds registry? Number of residential properties that have a title deed Lending interest rate Mortgage interest rate | Mortgage term (years)DownpaymentMortgage book as a percentage of the GDPEstimated number of mortgages Price to Rent Ratio in City Centre | Outside City Centre Gross Rental Yield in City Centre [f] | Outside City Centre [f]Construction as a % of GDP
Non/an/a7.50% | 20n/an/an/an/a | n/a0.12 | 0.13n/a
What is the cost of standard 50kg bag of cement? What is the price of the cheapest, newly built house by a formaldeveloper or contractor? (Local currency)What is the price of the cheapest, newly built house by a formaldeveloper or contractor? (US$) What is the size of this house (m2)? What is the average rental price for this unit (US$)? What is the minimum stand or plot size for residential property?
US$14.00
39 970 000 Somali shilling
US$70 000n/an/a400m2
Ease of Doing Business Rank [g]Number of procedures to register property [g]Time to register property (days) [g]Cost to register property (as % of property value) [g]
190n/a30 daysn/a
NB: Figures are for 2018 unless stated otherwise.
[a] Coinmill.com[b] IMF World Economic Outlook Database[c] Worldometers[d] UN World Population Prospects [e] Central Intelligence Agency (CIA) World Factbook[f] Numbeo[g] World Bank Doing Business

238
inter-bank payment, clearing and settlement systems in Somalia.10 In 2017 theCBS considered 13 applications for commercial bank licences. There are sixcommercial banks: International Bank of Somalia; First Somali Bank; Salaam SomaliBank; Somalia Premier Bank; and Tawakal Money Express. The four Islamic financialinstitutions offering mortgage/home loans are Salaam Somali Bank, Dahabshiil BankInternational, Premier Bank and International Bank of Somalia.
In 2017, the balance sheet of the CBS was stable with assets estimated at US$9.2million. Most operations in the country are on a cash basis and the US dollar isthe popular unit currency of operation, despite the reintroduction of the Somalishilling (SOS). The US dollar is approximately SOS571.03. The CBS does notcontrol the exchange rate or the supply of the Somali shilling. It has not issuedany bank notes since 1991 and the bulk of payments are settled in US dollars,mobile phone platforms, and counterfeit SOS notes. Moreover, official internationalreserves are relatively low. The capitalisation of banks remains strong and theirassets increased by 20.5 percent in 2016.11 Industry capitalisation is about40 percent. Only one bank does not meet the minimum capital requirement ofUS$5 million.12 The Federal Government of Somalia has embarked on a processof structural, legislative, and institutional reform. The CBS regulates and supervisesthe finance sector. The CBS has six strategic goals: formalising the private sector;establishing an effective monetary policy; building a strong banking operationsfoundation; increasing organisational effectiveness; strengthening reporting andtransparency; and promoting good governance.13
MTOs dominate the formal and informal financial sector. The MTOs facilitate thetransfer of remittances from the Somali diaspora, donor resources and foreigninvestments. However, the formal banking sector is improving. Seven banks havebeen registered since 2012. These include: Amal Bank; Premier Bank; InternationalBank of Somalia; Dahabshiil Bank International; Salam Somali Bank; Dayreel Bank;and Tawakal Global Bank). There are 11 money transfer operators. These are:Amal Money Transfer ; Amana Online Money Transfer ; Dahabshil Money Transfer ;Hodan Global Money Transfer ; Jubba Money Transfer ; Kaah Express MoneyTransfer ; Taaj Money Transfer ; Tawakal Money Transfer ; Iftin Money Transfer ;Globalex Money Transfer ; and Horyal Express Money Transfer. The transactionsof the MTOs are estimated at US$1.5 billion in annual remittances to Somaliacompared to Somalia’s GDP in 2016 of US$6.2 billion.
Only three percent of the population is banked. There are no fixed incomemarkets in Somalia and no formal credit facilities. Seventy percent of thepopulation has access to mobile services and access to financial services is mainlybased on innovative mobile telephony schemes.14 Only 15 percent of thepopulation has accounts with formal banks, and 73 percent of the population usemobile money. The use of mobile money to transfer incoming internationalremittances domestically reflects the strong links that exist between mobilenetwork operators and money transfer businesses.
There are few mortgages in Somalia, although and access to finance by householdsis improving through the growing microfinance sector. Silatech, Kaah Express,Barwaqu Microfinance Bank and Kaaba Microfinance Institution are the main actorsin the sector. Loans are offered for a period of up to six months. Microfinancefacilities and informal facilitators charge between five percent and 10 percentcommission. Alternatively, loans are also secured through family members.
Affordability In 2015, the average house price per square meter was US$250 and the averageplot size is 400m2. According to a recent news article, the price of the cheapestnewly built house built by a developer in Somalia is US$70 000 with double storeyhouses costing approximately US$130 000. Assuming a mean housing price ofUS$100 000, this would be affordable to almost zero percent of the Somalipopulation. This house would cost US$769 a month, and US$276 809 over theterm, at an interest rate of 8.5 percent, zero percent deposit and repaid over a30-year period.15 Given that the average monthly salary after tax is US$225illustrates how unaffordable formal home ownership is for the average Somali.
Numbeo shows apartment rentals ranging from US$50 to US$350 a month andbetween US$50 and US$150 a month, inside the city and outside the city centrerespectively. Accounts of Somali investors point to a booming rental market.Development experts note that rent has increased in some places from US$300
five years ago to between US$2 000 and US$3 000 in 2016 in urban areas suchas Mogadishu and Hargeisa. An average three bed-roomed apartment in the citycentre costs between US$120 and US$400 to rent while outside the city centrethe same apartment would approximately cost between US$100 and US$2500.16
This is inaccessible to most of the households of approximately 5.9 persons each,17
given that most of the population live below the poverty line of US$1.90 a day.The high rate of urbanisation has led to many urban dwellers, especially women-headed households, the poor and internally displaced persons (IDPs), living ininsecure and unhygienic conditions. They lack access to basic services and areprone to forced evictions.18 Somalia’s public and private housing stock wasvirtually destroyed after more than 20 years of conflict. In 2005, about 85 percentof the total population was living in slums or partially destroyed housing.19 Yetthe population is growing by almost three percent each year, with a high fertilityrate of 6.26 children per woman, which is the fourth highest in the world.20
Housing strategies need to address the population growth, deficit of adequatehousing for the current population, the urban poor, IDPs, and refugee returnees.
With 73 percent of the population earning less than US$60 a month, theaffordability for formal housing is extremely limited. Cement costs about US$14a 50kg bag. Using the GNI per capita of US$122.90, approximately nine bags ofcement – far below the estimated 35-40 bags of cement that would be requiredto build a basic 40 square metre house – be purchased. With an income of US$60,69.2 percent of the population could afford a house priced at US$1 951, assumingan interest rate of 8.5 percent and a 30-year repayment period.21
Housing supplyIn 2014, the Federal Government of Somalia and the United Nations PopulationFund reported that there were approximately 2 076 677 households in Somaliawith an average household size of 5.9 people.22 Just under a quarter (24 percent)of the population has access to formal housing (60 percent in urban areas and sixpercent in rural areas).23 Adequate housing according to the United NationsFactsheet No. 21/Rev 1 includes the following entitlements: security of tenure;housing, land and property restitution; equal and non-discriminatory access toadequate housing; participation in housing-related decision-making at the nationallevel. Housing is characterised by temporary structures with earthen floors, palmleaf roofs or iron sheet walls and roofs. About 24 percent of houses in Somaliaare constructed with durable materials and can be classified as permanentstructures. Approximately 56 percent have walls or roofs constructed of semi-durable materials; the remaining 20 percent are temporary. In rural areas,90 percent of households are owner-occupied as opposed to 60 percent in urbanareas. One in every four houses is rented in urban areas as opposed to one inevery 25 in rural areas. In addition, one third of those households in urban areashad two or more families living in the same house, with more than half of themsharing a single roomed house.24
Non-governmental organisations (NGOs) and donor aid governments provide asignificant portion of the housing especially to those affected by the wars and theinternally displaced. These include organisations such as UN-Habitat and theNorwegian Refugee Council among others. The UN-Habitat has been active inSomalia for more than 30 years, and project activities range from targetingimmediate local needs, to more strategic attempts to address sustainable urbandevelopment through integrated human settlement programmes. UN-Habitathas invested in 19 projects totalling US$49 million.25 These projects include:Shelter Provision, Reintegration, and Improved Livelihoods for Returnees andInternally Displaced Persons in three towns. The latter was worth US$3.2 millionand includes the construction of 475 houses. The Integration of Long-term IDPsinto the Host Community in Bossaso project is worth US$2 million to build524 houses. The Shelter Provision, Reintegration, and Improved Livelihoods forReturnees and IDPs project is worth US$2.3 million to build 335 houses. Thesethree projects are funded by the Government of Japan and are intended toprovide security of land tenure and permanent housing, social infrastructure, andskills training for 1 334 vulnerable IDP families in Bossaso and Berbera towns.26
The diaspora is also investing in housing. Other developers include the SalaamBank and individual investors. This is contributing to decongesting Mogadishu aswell as offering better quality lives to those who can afford it. Salaam Properties,a development company established in 2014, is an important actor. It is currentlydeveloping Darul Salaam City, the first large-scale housing project in Somalia, whichwill ultimately comprise 6 000 housing units, and will be constructed over a three-
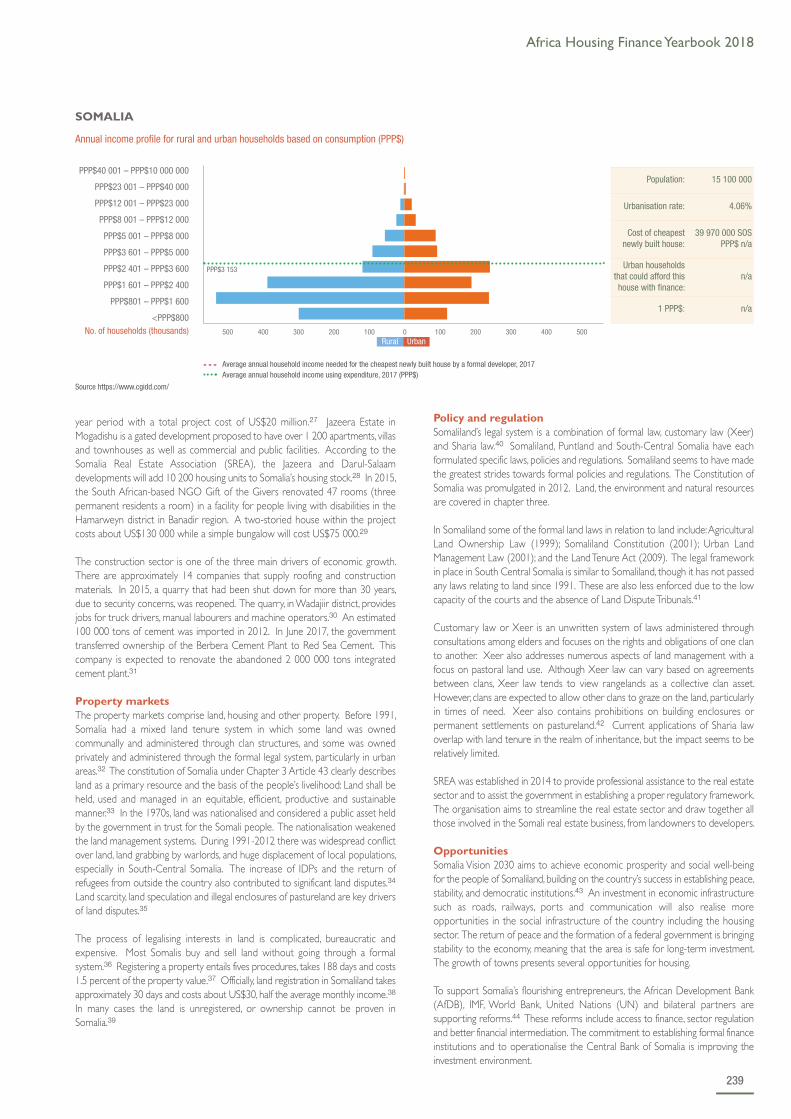
Africa Housing Finance Yearbook 2018
239
year period with a total project cost of US$20 million.27 Jazeera Estate inMogadishu is a gated development proposed to have over 1 200 apartments, villasand townhouses as well as commercial and public facilities. According to theSomalia Real Estate Association (SREA), the Jazeera and Darul-Salaamdevelopments will add 10 200 housing units to Somalia’s housing stock.28 In 2015,the South African-based NGO Gift of the Givers renovated 47 rooms (threepermanent residents a room) in a facility for people living with disabilities in theHamarweyn district in Banadir region. A two-storied house within the projectcosts about US$130 000 while a simple bungalow will cost US$75 000.29
The construction sector is one of the three main drivers of economic growth.There are approximately 14 companies that supply roofing and constructionmaterials. In 2015, a quarry that had been shut down for more than 30 years,due to security concerns, was reopened. The quarry, in Wadajiir district, providesjobs for truck drivers, manual labourers and machine operators.30 An estimated100 000 tons of cement was imported in 2012. In June 2017, the governmenttransferred ownership of the Berbera Cement Plant to Red Sea Cement. Thiscompany is expected to renovate the abandoned 2 000 000 tons integratedcement plant.31
Property marketsThe property markets comprise land, housing and other property. Before 1991,Somalia had a mixed land tenure system in which some land was ownedcommunally and administered through clan structures, and some was ownedprivately and administered through the formal legal system, particularly in urbanareas.32 The constitution of Somalia under Chapter 3 Article 43 clearly describesland as a primary resource and the basis of the people’s livelihood: Land shall beheld, used and managed in an equitable, efficient, productive and sustainablemanner.33 In the 1970s, land was nationalised and considered a public asset heldby the government in trust for the Somali people. The nationalisation weakenedthe land management systems. During 1991-2012 there was widespread conflictover land, land grabbing by warlords, and huge displacement of local populations,especially in South-Central Somalia. The increase of IDPs and the return ofrefugees from outside the country also contributed to significant land disputes.34
Land scarcity, land speculation and illegal enclosures of pastureland are key driversof land disputes.35
The process of legalising interests in land is complicated, bureaucratic andexpensive. Most Somalis buy and sell land without going through a formalsystem.36 Registering a property entails fives procedures, takes 188 days and costs1.5 percent of the property value.37 Officially, land registration in Somaliland takesapproximately 30 days and costs about US$30, half the average monthly income.38
In many cases the land is unregistered, or ownership cannot be proven inSomalia.39
Policy and regulation Somaliland’s legal system is a combination of formal law, customary law (Xeer)and Sharia law.40 Somaliland, Puntland and South-Central Somalia have eachformulated specific laws, policies and regulations. Somaliland seems to have madethe greatest strides towards formal policies and regulations. The Constitution ofSomalia was promulgated in 2012. Land, the environment and natural resourcesare covered in chapter three.
In Somaliland some of the formal land laws in relation to land include: AgriculturalLand Ownership Law (1999); Somaliland Constitution (2001); Urban LandManagement Law (2001); and the Land Tenure Act (2009). The legal frameworkin place in South Central Somalia is similar to Somaliland, though it has not passedany laws relating to land since 1991. These are also less enforced due to the lowcapacity of the courts and the absence of Land Dispute Tribunals.41
Customary law or Xeer is an unwritten system of laws administered throughconsultations among elders and focuses on the rights and obligations of one clanto another. Xeer also addresses numerous aspects of land management with afocus on pastoral land use. Although Xeer law can vary based on agreementsbetween clans, Xeer law tends to view rangelands as a collective clan asset.However, clans are expected to allow other clans to graze on the land, particularlyin times of need. Xeer also contains prohibitions on building enclosures orpermanent settlements on pastureland.42 Current applications of Sharia lawoverlap with land tenure in the realm of inheritance, but the impact seems to berelatively limited.
SREA was established in 2014 to provide professional assistance to the real estatesector and to assist the government in establishing a proper regulatory framework.The organisation aims to streamline the real estate sector and draw together allthose involved in the Somali real estate business, from landowners to developers.
Opportunities Somalia Vision 2030 aims to achieve economic prosperity and social well-beingfor the people of Somaliland, building on the country’s success in establishing peace,stability, and democratic institutions.43 An investment in economic infrastructuresuch as roads, railways, ports and communication will also realise moreopportunities in the social infrastructure of the country including the housingsector. The return of peace and the formation of a federal government is bringingstability to the economy, meaning that the area is safe for long-term investment.The growth of towns presents several opportunities for housing.
To support Somalia’s flourishing entrepreneurs, the African Development Bank(AfDB), IMF, World Bank, United Nations (UN) and bilateral partners aresupporting reforms.44 These reforms include access to finance, sector regulationand better financial intermediation. The commitment to establishing formal financeinstitutions and to operationalise the Central Bank of Somalia is improving theinvestment environment.
- - - Average annual household income needed for the cheapest newly built house by a formal developer, 2017 Average annual household income using expenditure, 2017 (PPP$)
SOMALIA
Annual income profile for rural and urban households based on consumption (PPP$)
Source https://www.cgidd.com/
PPP$40 001 – PPP$10 000 000
PPP$23 001 – PPP$40 000
PPP$12 001 – PPP$23 000
PPP$8 001 – PPP$12 000
PPP$5 001 – PPP$8 000
PPP$3 601 – PPP$5 000
PPP$2 401 – PPP$3 600
PPP$1 601 – PPP$2 400
PPP$801 – PPP$1 600
<PPP$800No. of households (thousands)
PPP$3 153
Rural Urban500 400 300 200 100 0 100 200 300 400 500
Population: 15 100 000
Urbanisation rate: 4.06%
Cost of cheapestnewly built house:
39 970 000 SOSPPP$ n/a
Urban householdsthat could afford thishouse with finance:
n/a
1 PPP$: n/a

240
SourcesAfrican Development Bank (2014). Partner of Choice for Eastern Africa WeWant: East Africa Regional Centre, Nairobi, Kenya.
African Development Bank (2014). African Economic Outlook: Global ValueChains and Africa's Industrialisation. Africa Development Bank.
African Development Bank (2017). Annual report 2017.https://www.afdb.org/fileadmin/uploads/afdb/Documents/Generic-Documents/AfDB_Annual_Report_2017_EN.pdf (Accessed 20 Aug 2018).
African Development Bank Group (2013). Somalia: Country Brief 2013-2015.East Africa Regional Centre.
African Development Bank Group (2018). African Economic Outlook.https://www.afdb.org/en/knowledge/publications/african-economic-outlook/(Accessed 20 Aug 2018).
Aid Coordination Unit office of the Prime Minister, Federal Republic of Somalia.(2017). Aid Flows in Somalia: Analysis of aid flow data. Federal Republic ofSomalia.
Bertelsmann Stiftung’s Transformation Index (BTI) (2014). Somalia CountryReport.
Central Intelligence Agency (CIA). The World Factbook: Somalia.https://www.cia.gov/library/publications/the-world-factbook/geos/so.html(Accessed 4 July 2018).
Federal Republic of Somalia (2013). Economic Recovery Plan 2014 - 2015.
IHS Markit (2017). Country Reports: Somalia.https://www.garda.com/crisis24/country-reports/somalia (Accessed 20 Aug2018).
International Monetary Fund (IMF) (2015). Somalia 2015 Article IVConsultation – Press Release; Staff Report; and Statement by the ExecutiveDirector for Somalia.
IMF (2016). Letter of Intent, Memorandum on Economic Financial Policies, andTechnical Memorandum of Understanding International Monetary Fund.
IMF (2017). Second and Final Review under the Staff-Monitored Program andRequest for a New Staff Monitored Program- Press Release and Staff Report.IMF Country Report No. 17/2014. Pg. 5.https://www.imf.org/en/Publications/CR/Issues/2017/07/11/Somalia-Second-and-Final-Review-Under-the-Staff-Monitored-Program-and-Request-for-a-New-45065 (Accessed 6 July 2018).
IMF (2018). Somalia: second and final review under the staff monitores programand request for a new staff monitores program - press release and staff report :Country report No. 18/212. Washington DC : Publication services.
Making Finance Work for Africa (2016). Country Financial Sector Profile –Somalia. https://www.mfw4a.org/fileadmin/data_storage/documents/MFW4A-documents/Country_FSP_SOMALIA.pdf (Accessed 10 July 2018).
Ministry of Foreign Affairs and Investment Promotion (2015). ResourcefulSomalia. http://www.wardheernews.com/wp-content/uploads/2015/02/Somalia-Monetary-policy-By-Dalmar.pdf
Mohamed Dalmar (2015). Somalia: A Long Road to Currency Reform.Wardheer News.
Norwegian Refugee Council (2016). Housing, Land and Property Rights forDisplaced Women.
Norwegian Refugee Council and Legal Action Worldwide (2014). Housing Landand Property Issues in Somalia: Persons of concern in Somaliland and South-Centra Somalia.
Norwegian Refugee Council, UN-Habitat and UNHCR (2013). Land, Property& Housing in Somalia.
SAHAN Statebuilding Team (2015). Somalia's Troubled Transition: Vision 2016Revisited.
Shuraako Org (2013). Somalia Banking: Transfers, Challenges and Opportunities.http://shuraako.org/sites/default/files/documents/Land%20Tenure%20in%20Somalia%20A%20Potential%20Foundation%20for%20Security%20and%20Prosperity.pdf (Accessed 20 Aug 2018).
Shuraako (2014). Land Tenure in Somalia: A Potential Foundation for Securityand Prosperity. Pgs. 6-13.
Sungow, J.A. (2017). “Somalia’s Governance Challenges.” WardheerNews.8 February 2017. http://www.wardheernews.com/somalias-governance-challenges/ (Accessed 4 July 2018).
The Economist (2017). Country Report: Somalia.
United Nations Development Programme (2012). Somalia HumanDevelopment Report 2012.http://www.undp.org/content/undp/en/home/librarypage/hdr/Somalia-human-development-report-2012.html (Accessed 10 July 2018).
United Nations Fund for Population (2014). Population Estimation Survey 2014for the 18 Pre-War Regions of Somalia.
United Nations Fund for Population (UNFPA) (2016). Population Estimates forSomalia.vol.5 UNFPA.
United States Agency for International Development (USAID) (2016). StrategicFramework for Somalia: 2016-2019.https://www.usaid.gov/sites/default/files/documents/1860/Public_Strategy_USAID.Somalia_03.29.2017_3.pdf (Accessed 10 July 2018).
World Bank (2017). “Doing Business- Measuring business regulations: Somalia.”http://www.doingbusiness.org/data/exploreeconomies/somalia. (Accessed 6 July2018).
Websiteswww.kiva.orgwww.somalieconomicforum.org www.somaliinvestments.com http://somaliainvestor.so/www.somalilandpress.com http://tradeinvestsomalia.com/www.tradingeconomics.com/somalia/exporthttps://tradingeconomics.com/somalia/indicatorswww.unhabitat.org/somalia/
1 Sungow, J.A. (2017). 2 IHS Markit (2017). Country Reports: Somalia. 3 Central Intelligence Agency (CIA) World Factbook.4 World Bank (2017). Doing Business- measuring business regulations.5 International Monetary Fund (IMF) (2017). 6 Worldometer (2018). Somalia Population.
http://www.worldometers.info/world-population/somalia-population/(Accessed 6 July, 2018).
7 United States Agency for International Development (USAID) (2016).8 UNDP (2012). 9 Making Finance Work for Africa (2016). 10 World Bank (2018). “Press Release: Central bank of Somalia and Somali
financial institutions taking steps to modernize banking sector.” 18 Jan2018. http://www.worldbank.org/en/news/press-release/2018/01/18/central-bank-of-somalia-and-somali-financial-institutions-take-crucial-steps-to-modernize-banking-sector
11 International Monetary Fund (IMF) (2017). 12 African Development Bank (2017).13 Centre for Affordable Housing Finance in Africa. (2017). Housing
Finance in Africa Year Book, 2017. 14 Shuraako (2013). 15 Centre for Affordable Housing Finance Africa. (2016). Housing Finance
in Africa Year book, 2016. Centre for Affordable Housing Finance. 16 Numbeo (2018). https://www.numbeo.com/cost-of-
living/country_result.jsp?country=Somalia (Accessed 6 July 2018).17 United Nations Fund for Population (UNFPA) (2016).
18 Federal Government of Somalia (2017). Somalia National DevelopmentPlan 2017-2019.
19 http://www.encyclopedia.com/topic/Somalia.aspx.20 World Population Review. Somalia Population.
http://worldpopulationreview.com/countries/somalia-population/ 21 Centre for Affordable Housing Finance Africa (2016). Housing Finance
in Africa Year Book, 2016.22 United Nations Population Fund (2014). Population Estimation Survey
2014 for the 18 Pre-War Regions of Somalia.23 Norwegian Refugee Council, UN-Habitat and UNHCR (2013). Land,
Property & Housing in Somalia.24 UN-Habitat (2008). World Cities Report.25 Ibid.26 UN-Habitat (2016). World Cities Report.27 Sowetan Live (2016). “Housing boom as Mogadishu emerges from
ashes of war.”28 The Somali Investor (2016). “Rediscovering real estate in Somalia: A
paradigm shift.” 9 April 2016 www.somaliainvestor.so/rediscovering-real-estate-in-somalia-a-paradigm-shift/ (Accessed 20 Aug 2018).
29 Africa property news (2016). “Somalia's housing sector gainsmomentum.” 12 Jan 2016. http://www.africapropertynews.com/east-africa/3192-somalia-housing-sector-gains-momentum.html. (Accessed20 Aug 2018).
30 African Union Mission in Somalia (AMISOM) (2016). “ConstructionSector Driving Somalia’s Economic Recovery.” 21 April 2016.www.amisom-au.org/2016/04/construction-sector-driving-somalias-economic-recovery/ (Accessed 20 Aug 2018).
31 Global Cement (2017). “Somaliland government gives ownership ofBerbera Cement Plant to Red Sea Cement.” 14 June 2017.www.globalcement.com/news/item/6214-somaliland-government-gives-ownership-of-berbera-cement-plant-to-red-sea-cement (Accessed 20Aug 2018).
32 Norwegian Refugee Council and Legal Action Worldwide (2014). 33 Federal Republic of Somalia (2012). Constitution of the Federal
Republic of Somalia.34 Norwegian Refugee Council and Legal Action Worldwide (2014)..35 African Development Bank (2013). Somalia Annual report. 36 Ibid.37 Centre for Affordable Housing Finance Africa (2017). Housing Finance
in Africa Year Book, 2017.38 UN-Habitat (2011). World Cities Report. 39 The Guardian. (2013). Responses to information requests –
Immigration and refugee Board of Canada.https://www.justice.gov/sites/default/files/eoir/legacy/2013/12/13/SOM104486.FE.pdf (Accessed 20 Aug 2018).
40 Farah,H.M. (2009). Baseline assessment of the Somaliland judiciary.41 Ibid.40 Shuraako.org (2014). Pg. 13.40 Republic of Somaliland (2011). Somaliland Vision 2030.40 The Economist Intelligence Unit (2017). Country Report: Somalia.

Africa Housing Finance Yearbook 2018
241
training for students who cannot afford tertiary education has also put immensepressure on the fiscus, alongside an escalating public wage bill.
However consumer confidence showed improvement in the first two quarters of2018.14 This was primarily a result of perceived improved economic and politicalprospects following the removal of the incumbent president, Jacob Zuma by theruling party, the African National Congress (ANC). The ANC, which has been thepolitical party in power since 1994, has seen a decline in support in the last tenyears. However since the ANC’s national elective conference in January 2018 whichsaw Zuma replaced by Cyril Ramaphosa as the President of the ruling party,significant and visible steps have been taken to stamp out corruption and ensuregood governance, in state-owned-entities especially. Still, there are fears that politicaluncertainty heading into the 2019 national elections will hinder growth andinvestment, and that the implications of “state capture” which took hold over thelast 5-10 years, will have long-reaching effects that cannot be easily or quickly rectified.
South AfricaKEY FIGURES
Main urban centresPretoria, JohannesburgCape Town
Exchange rate: 1 US$ = [a] 10 Sept 2018PPP Exchange rate (Local currency/PPP$) 1 South African Rand = [b]Inflation 2016 [c] | Inflation 2017 [c] | Inflation 2018 [c]
14.39 South African Rand6.106.30 | 5.30 | 5.30
Population [d] | Urban population size 2017 [b]Population growth rate [d] | Urbanisation rate [b]Percentage of the total population below National Poverty Line [d]Unemployment rate Q2 2018 [d]
57 730 000 | 37 309 6801.18% | 1.99%25.20%27.20%
GDP (Current US$) [c] | GDP growth rate annual 2017 [c]GDP per capita (Current US$) 2017 [b]GNI per capita (Current US$) 2017 [b]Gini co-efficient 2017 [b]HDI global ranking [e] | HDI country index score [e]
US$349 300 million | 1.50%US$6 161US$5 43062.80113 | 0.699
Is there a deeds registry? Number of residential properties that have a title deed [f]Lending interest rate [g]Mortgage interest rate [g] | Mortgage term (years) [g]Downpayment [g]Mortgage book as a percentage of the GDP 2017 [h]Estimated number of mortgages [f]Price to Rent Ratio in City Centre [i] | Outside City Centre [i]Gross Rental Yield in City Centre [i] | Outside City Centre [i]Construction as a % of GDP 2017 [h]
Yes6 378 92210.00%10% | 2010%28.8%2 387 7969.69 | 8.8710.23% | 11.28%3.40%
What is the cost of standard 50kg bag of cement? [j]What is the price of the cheapest, newly built house by a formaldeveloper or contractor? (Local currency) [k]What is the price of the cheapest, newly built house by a formaldeveloper or contractor? (US$) [k]What is the size of this house (m2)? What is the average rental price for this unit (US$)? What is the minimum stand or plot size for residential property?
US$4.30
352 000 South African Rand
US$24 46140m2
US$232n/a
Ease of Doing Business Rank [l]Number of procedures to register property [l]Time to register property (days) [1]Cost to register property (as % of property value) [l]
827237.30%
NB: Figures are for 2018 unless stated otherwise.
[a] Coinmill.com[b] World Bank World Development Indicators[c] National Treasury Budget Review 2018[d] Statistics South Africa[e] UNDP Development Indicators[f] Lightstone Property[g] First National Bank South Africa[h] South African Reserve Bank[i] Numbeo[j] Builders Warehouse[k] Cosmopolitian Homes[l] World Bank Doing Business
Member organisations of the African Union for Housing Finance (AUHF):First National Bank - International Home Loans Home Finance Guarantors Africa Reinsurance Gauteng Partnership FundThe Banking Association South Africa
OverviewWith a population estimated at 57.73 million in 2018,1 South Africa’s GrossDomestic Product (GDP) was R4.604 trillion (US$319.9 billion) in 2017, forecastto rise to R4.94 trillion (US$343.3 billion) in 2018.2,3 Although South Africa has the2nd largest economy in Africa (after Nigeria), it ranks 4th in Africa in GDP per capita,after Mauritius, Gabon and Botswana.4 In recent years, South Africa’s GDP per capitahas been decreasing, from a high of US$6 823 in 2013 to US$6 161 in 2017.5
Since the establishment of the democratic state in 1994, the government hasprioritised an extensive social security and poverty alleviation programmeproviding social grants, free basic education and health care, government-subsidisedhousing, and targeted infrastructure investment for basic services. Between 1994and December 2017, government reports that it has built 2.975 million housesfor low income households as part of a massive government-subsidisedprogramme aimed at providing adequate shelter, increasing home ownership, andreversing the spatial divisions which are a legacy of the apartheid regime.6
The focus on social security and developmental spending notwithstanding, SouthAfrica remains one of the least equal economies in the world, with a Gini indexof 62.8 in 2017. South Africa continues to be plagued by massive unemploymentand persistent inequality. The unemployment rate reached 27.2 percent in Q32017, the highest since September 2003.7,8 The lack of job opportunities is acritical concern for graduates and youth; in 2018, unemployment among youthaged 15-24 (who make up 17 percent of the population) was 32.4 percent.9
Economic growth has been insufficient to tackle the key issues of poverty,unemployment and inequality. Real GDP growth in 2017 was 1.0 percent, anincrease from 0.3 percent in 2016.10 However, Q1 2018 GDP growth was -2.6%,followed by -0.7% growth in Q2, according to Statistics SA. As a result, South Africais now technically in a recession (defined by two consecutive quarters of negativeGDP).11 Across the region, average growth in Sub-Saharan Africa is expected toremain moderate at 2.7 percent in 2017, rising to 3.5 percent in 2019.12
Due to poor economic performance, compounded by political uncertainty andsocial unrest, Fitch, S&P Global and Moody’s Rating Agencies downgraded theinvestment outlook for South Africa in November 2017 after assessing the country’scredit rating.13 Concerns regarding the poor governance of state-owned entities– mostly notably the national airline, South African Airways, and Eskom, theelectricity provider – also contributed to the downgrade and weakened investorconfidence. The announcement in January 2018 of fee-free higher education and

242
These developments have had a noticeable impact on the exchange rate andinflation. The Rand began 2016 in a weak position at R16.89/US$1 (20 Jan 2016)and then improved, reaching R11.56/US$1 on 26 Feb 2018. However thecurrency has weakened since then, to a recent low of R15.43/US$1 on 5 Sept2018.15 South Africa has followed a monetary policy of inflation targeting since2000; on the whole, inflation has stayed within the target range of 3 to 6 percent.16
CPI inflation was 5.3 percent in 2017, down from 6.3 percent in 2016, andelectricity inflation has stabilised, dropping from 9.2 percent in 2016 to 4.7 percentin 2017.17 As of 2018, inflation pressures have arisen, partially due to an increasein value-added-tax (VAT) from 14 percent to 15 percent, as of 1 April 2018.Looking forward, CPI inflation is expected to hold steady at 5.3 percent in 2018.18
With well-developed transportation, information technology, and servicesinfrastructure, South Africa’s economy was historically dominated by mining, butis currently led by the services sector. Transport, electricity, trade and financesectors are contributing to growth while the mining and manufacturing sectorsare experiencing contractions. The construction sector has recorded poorperformance; compared to 1.7 percent growth in 2015, growth in real value addedin construction only reached 0.4 percent in the first three quarters of 2017.19
Nevertheless, the construction sector is a notable contributor to GDP, adding 3.4percent to South Africa’s GDP in 2017.20 Research by CAHF using 2016 datashowed that residential construction and rental sectors contribute 4.1 percent toGDP (including intermediate outputs), making their contribution equivalent to theentire agriculture, forestry and fishing sector ; the food sector ; and the energysector. The research also demonstrated that residential construction and rental isa R60.5 billion (US$4.2 billion) industry, employing 468 000 people annually.21
After a boost in investor confidence due to the installation of PresidentRamaphosa, investor confidence has fallen back in the 2nd and 3rd quarters of2018,22 largely due to political uncertainties, ongoing corruption issues andconcerns with the current debate regarding the legal framework for expropriationof land without compensation. In its 2018 Doing Business Report, the World Bankranked South Africa 82nd (down, from 74th in 2017), and fifth in Sub-SaharanAfrica.23 Poor performance in the rankings is in the areas of registering property,paying taxes, and obtaining construction permits.
Access to finance South Africa benefits from a sophisticated banking system with 36 local institutions:19 registered banks, 3 mutual banks, 3 cooperative banks and 15 local branchesof foreign banks – plus 31 foreign banks with approved local representative offices.Five banks dominate: Absa Bank, First National Bank, Nedbank, Standard Bank andCapitec. The capital-adequacy ratio for the banking sector was 16.12 percent inJanuary 2018, compared to 15.88 the previous year, well above the minimumregulatory requirement.24 The 2017 FinScope survey found that 77 percent ofthe South African adult population is banked. The use of non-bank financialservices increased from 66 percent in 2016 to 69 percent in 2017.25 Governmentis taking steps to expand the reach of competitive, affordable banking servicesthrough digital banking especially; in 2017 three new bank licenses were approved.The application by the South African Post Office’s Postbank for a banking license,to allow it to offer a full range of services, is still pending approval.26
South Africa also has a well-developed mortgage market. The ratio of mortgagedebt outstanding to GDP is currently 28.8 percent (2017), down from a high of 40.9percent in 2008.27 According to the National Credit Regulator (NCR), the totaloutstanding gross debtors book of consumer credit for the quarter ended March2018 was R1.78 trillion, of which R913.78 billion, or 51.41%, was mortgages.28
However, while origination grew in real terms between 2010 and 2015, the nominalbook value of bank mortgages remains below pre-Global Financial Crisis levels inreal terms. In 2017, new loans accounted for only 20 percent of total book value,versus 60 percent of total book value in 2005, when the market grew 43 percentyear-on-year in loans paid out. Recent research commissioned by CAHF estimatesthat in 2007, 14.5 percent of households in South Africa had a mortgage. By 2016,this had declined to 9.7 percent of households.29
Broadening access to financial services has been an area of focus for thegovernment and the financial sector since the Financial Sector Charter (FSC) cameinto effect in 2004. The FSC sought to ensure access to financial services for those
previously excluded, primarily low-income earning black South Africans, howeverprogress has been slow. In 2017, government undertook a review and identifiedkey issues, including the need for improved data collection, better monitoring andreporting, sanctions for companies who fail to meet the FSC objectives, and theimperative to raise the transformation targets.30 A new Financial Sector Codewas gazetted in December 2017 with the aim of increasing access to financialservices for black South African, especially low income households.31
However, despite well-developed credit markets and the intentions of the FSC,access to mortgage finance is largely limited to high income earners. Of the153 467 mortgages granted in 2017, only 6 824 (or 4.4 percent) were granted toindividuals with a gross monthly income of R15 000 (US$1 042) or less.32
Furthermore, consumer indebtedness across all loan products continues to be aconcern: 34 percent of borrowers in the income segment of R10 000 to R15 000(US$695 – US$1 042) have at least one account in arrears of three months ormore.33 The prime lending rate is currently 10 percent, having recently peaked at10.5 percent in March 2016.34 Typically, borrowers in the South African affordablemarket access mortgages at a premium of two percentage points above theconventional housing market.
Microfinance continues to be a growth area with significant potential, and non-governmental organisations have managed to roll out effective loan products tofacilitate incremental building. For example, the Kuyasa Housing Finance Companyhas developed a successful home improvement loan product and has grown itsportfolio. Kuyasa issued 1 756 loans for home improvements in 2017/18, with anaverage loan amount per customer of R8 000 (US$556).35
The three main state-supported housing financiers – the National Housing FinanceCorporation (NHFC), the Rural Housing Loan Fund (RHLF), and National UrbanReconstruction and Housing Agency (NURCHA)—are undergoing a process ofconsolidation into a single development finance institution, the Human SettlementsDevelopment Bank. The operational consolidation of the three entities isproceeding and the policy has been approved, while the legislation for the Bank’sestablishment is currently being drafted. The aim of the Bank is to facilitate theincreased provision of finance across the human settlements value chain, explicitlysupporting construction financing for government-led integrated housing projectsin urban areas.36
There are other positive developments impacting on access to housing finance.In June 2018, FSD Africa announced that it was investing R30.496 million (£1.6million) in Sofala Capital, a private equity company targeting niche market housingfinance providers based in Cape Town, to enable them to upscale theirconstruction mortgages in both Zambia and South Africa. The investment willsupport iBuild Home Loans Pty Limited (iBuild Home Loans), one of Sofala’scompanies, which provides mortgage loans to low income households who wishto add a room to their house to rent out.37
Affordability Housing affordability in South Africa remains a critical challenge. In 2018, thecheapest, newly built house was estimated at R352 500 (US$24 496). This housewould cost R6 130/month (US$426) at an interest rate of 10.5 percent over20 years, assuming a 20 percent deposit. Under these terms, the house would beaffordable to only 34.4 percent of urban households.38 Low household incomes;poor credit records limiting access to finance; rising building costs; and scarcity ofaffordable, well-located land for human settlements development are all factorswhich contribute to the affordability challenge. According to research undertakenby CAHF to benchmark housing construction costs across 16 African countries,in South Africa construction (labour, materials and indirect costs) comprised62 percent of the total cost of the house; other development costs (marketing,finance and holding costs, and sales taxes) comprised 18 percent; infrastructure,12 percent; land, 6 percent; and compliance one percent.39
Government’s primary means of addressing the housing backlog and the housingaffordability challenge has been focused on the supply side, providing houses to lowincome households as part of a comprehensive subsidised programme in whichgovernment is the delivery agent, as opposed to a demand-side approach tosubsidisation. Households earning below R3 500/month (US$243/month) are eligiblefor a government-subsidised house at no cost if they meet the qualification criteria.

Africa Housing Finance Yearbook 2018
243
For those households earning R1 500 to R15 000 (US$104 – US$1 042), the socialhousing programme provides subsidised rental units in targeted urban zones.
Households earning between R3 500 (US$243) and R22 000 (US$1 528) fall intothe so-called ‘gap’ market, whereby they earn too much to qualify for a ‘free’ housefrom government, and are often unable to access sufficient housing finance fromcommercial banks to afford the cheapest newly built house, due to insufficient orinformal income or poor credit records. To address the needs of the gap market,the government introduced the Finance-Linked Individual Subsidy Programme(FLISP) in 2012. The programme provides a once-off capital subsidy which is tiedto an approved mortgage from a bank for a new or existing house. The subsidyworks on a sliding scale: the maximum subsidy of R121 626 (US$8 452) isprovided to a person earning R3501/month (US$243), while a person earningR22 000/month (US$1 528) is eligible to receive R27 960 (US$1 943). HoweverFLISP has had very limited take-up, due to institutional issues, limited awarenessof the programme, and prolonged approval and disbursement processes. In2017/18 only 2 295 FLISPs were granted nationwide (against a target of 5000).40
Another key government intervention to improve housing affordability for lowincome households is the Government Employee Housing Scheme (GEHS) whichprovides a monthly housing allowance of R1 200 (US$83). Participants savetowards a downpayment via an individual linked savings facility; once they havepurchased a home, their monthly housing allowance goes towards their bondpayment. The GEHS also provides monthly subsidies for employees who rent.
Housing supply Eighty percent of South African households lived in formal dwellings in 2017. Ofthose living in formal dwellings, 55.5 percent fully own their house and 24.7 percentare renting. A total of 3.1 million households in South Africa live in informal ortraditional dwellings (19.1 percent of the total population).41
As noted above, up to now, government has acted as the primary producer ofhousing at the low end of the market. According to the 2017 General HouseholdSurvey, over 2.8 million households have received a state housing subsidy.However the backlog is massive – estimated at between 2.3 million and 3.7 millionunits – and annual delivery by government is clearly insufficient to meet demand:in 2017, 135 983 housing opportunities (top structures and serviced sites) weredelivered country-wide.42 As a result, individuals may wait for up to 15 years onthe needs register prior to being selected as a prospective beneficiary.
As part of an effort to significantly boost delivery, government initiated aprogramme of large scale housing development projects in 2016 – some led bygovernment and some by the private sector. There are a total of 48 approvedcatalytic human settlements projects nationwide, and implementation has begun,driven in large part by the Housing Development Agency (HDA). In addition togreenfields housing projects, government also invests significant resources in itsprogramme to upgrade informal settlements and provide basic services.
Figures on the number of units delivered annually by the private sector vary:according to StatsSA, 39 014 residential units were completed in 2017, while theNational Home Builders Registration Council (NHBRC) reports that 53 277 unitswere enrolled in 2016/17.43
In recent years, there has been an increased focus on rental housing, includingexploration of how government might support and facilitate of low income rentalin backyards. The Social Housing Regulatory Authority (SHRA) has estimated thatthe demand for social housing units is 235 000 in major urban areas and 83 000units in secondary towns and cities.44 However delivery has fallen far short: a totalof 3 535 social housing units were delivered in 2017/18, against a target of 7 915.45
A key means to unlock housing supply at the lower end of the market would beto facilitate and promote resale. While government-subsidised properties carryan 8-year restriction on resale, many of the 1.9 million subsidised houses on thedeeds registry are now eligible to form part of the resale market. For theremainder of subsidised houses not yet formally transferred, the failure to providetitle deeds has made it impossible for them to sell their houses formally.
Property markets South Africa’s residential property market forms the largest component of theSouth African property market, comprising most of the property assets within thecountry. By the end of 2017, the South African deeds registry had 7.2 millionproperties, worth R6.8 trillion (US$472 billion). Of this, about R5.1 trillion (US$354billion) is in the residential sector, involving approximately 6.37 million registeredproperties. Just over half (57 percent) of the total formal residential propertymarket is found in the eight metropolitan municipalities.
A majority of the residential property market – 58 percent at the end of 2017 –includes homes valued at less than R600 000 (US$41 695). Thirty-five percent arehomes that are valued at less than R300 000 (US$20 847), of which the majority(about a third of the total residential property market) are estimated to have beenfully subsidised by the government.
South Africa has a well-established property market and a world-class cadastralsystem. According to the 2018 World Bank Doing Business Report, South Africais ranked 107th of 190 countries globally, in terms of how easy it is to registerproperty. It takes 23 days to go through the seven procedures and costs anestimated 7.3 percent of the property value. However, this is not a useful proxyfor residential property, especially at the bottom end of the market, where it cantake upwards of ten months for the entire resale transaction process toconclude.46 The quality of the land administration index rates South Africa at 14.5,well below the OECD high income country score of 22.7, but above the Sub-Saharan Africa score of 8.6.
The registration of title deeds for government-subsidised properties remains aserious challenge. A Title Deed Restoration Programme is aimed at addressing
- - - Average annual household income needed for the cheapest newly built house by a formal developer, 2017 Average annual household income using expenditure, 2017 (PPP$)
SOUTH AFRICA
Annual income profile for rural and urban households based on consumption (PPP$)
Source https://www.cgidd.com/
PPP$40 001 – PPP$10 000 000
PPP$23 001 – PPP$40 000
PPP$12 001 – PPP$23 000
PPP$8 001 – PPP$12 000
PPP$5 001 – PPP$8 000
PPP$3 601 – PPP$5 000
PPP$2 401 – PPP$3 600
PPP$1 601 – PPP$2 400
PPP$801 – PPP$1 600
<PPP$800No. of households (thousands)
PPP$19 186
PPP$24 057
Rural Urban2 000 1 500 1 000 500 0 500 1 000 1 500 2 000
Population: 57 730 000
Urbanisation rate: 1.99%
Cost of cheapestnewly built house:
352 000 ZARPPP$57 705
Urban householdsthat could afford thishouse with finance:
34.38%
1 PPP$:6.1 South African
Rand

244
the backlog and ensuring the formal registration of government-subsidised housing.As of June 2018, approximately 30 percent of the known backlog has beenaddressed. However the process is slow and encumbered by administrativeobstacles, including legal and planning matters which must be resolvedretrospectively, and contestation of ownership in situations where the originalbeneficiary no longer resides in the house.47 The Department reports that only41 841 title deeds were issued in 2017/18, against a target of over 327 000.48
Policy and regulation The foundation of the policy and legislative framework for housing in South Africais Section 26 of the Constitution which states that everyone has the right to accessto adequate housing and that “the state must take reasonable legislative and othermeasures, within its available resources, to achieve the progressive realisation ofthis right.” Beginning with the Reconstruction and Development Programme(RDP) in 1994, the state has focused on home ownership as the primary meansto fulfil this constitutional right. The RDP, which focused on the rapid rollout ofstand-alone 40m2 houses transferred to low income households at no cost, waslater replaced by the Breaking New Ground (BNG) policy in 2004. BNG heraldeda policy shift towards integration and sustainability, and an intention to move thefocus away from housing production toward the development of humansettlements where neighbourhoods contained economic and social amenities andwere spatially integrated into urban areas.
South Africa’s vision and approach for meeting the housing needs of the populationwas initially set out in the Housing White Paper in 1994. The key piece of sectorallegislation, the Housing Act, followed in 1997 and set out basic roles andrelationships of the three spheres of government with respect to housing.49 In2018, the Department of Human Settlements embarked on a comprehensivereview of the policy and legislative framework, with the ultimate aim of amendingthe Housing Act to reflect the shift towards sustainable and integrated humansettlements. In 2017, the National Department also revised the 2009 HousingCode, the set of technical guidelines that serve as the basis for implementation ofthe various national housing programmes.
Other legislation has been enacted to bring about changes in the institutionalarrangements for housing delivery. SHRA was established in 2010 to regulate andinvest in the delivery of affordable rental homes, with a focus on social housing.To address the scarcity of serviced land for housing, the HDA was established in2009 with a mission to fast-track the acquisition and release of land for humansettlement development. It has since become a fully-fledged propertydevelopment agency, and provides project management support to municipalities.
Other key legislation is currently being amended. The Property Practitioner’s Bill,gazetted in 2018, seeks to transform the property sector and will replace the oldEstate Agencies Affairs Act of 1976. The Department is also amending theHLMDA, which governs reporting requirements by finance institutions on lendingpatterns and practices; the final HLMDA Amendment Act will be gazetted in 2019.Furthermore, the Rental Housing Amendment Act (No. 35 of 2014) extendsgreater protections to tenants, including a requirement that all leases – includingin the informal sector – be set out in writing. However the date on which theAct comes into effect has not yet been proclaimed by the President.
OpportunitiesWhile the high end of South Africa’s residential property market continues to seegrowth, the potential at the lower end of the market is largely untapped. Withgreater interventions to stimulate and enable the functioning of the secondarymarket at the lower end, demand will increase for affordable housing ashouseholds are able to access finance and move up the housing ladder.
In the context of low economic growth and a tight fiscus, there is a growingrecognition and acknowledgement that the mass delivery of full-subsidisedownership units to low income households is not sustainable. In upcoming monthsand years, we are likely to see a shift in government policy towards a greateremphasis on rental housing and the role of the state in enabling and facilitating afunctioning property market. Government is also paying more attention to thepotential for innovative public-private partnerships, including rent-to-buy schemes,employer-assisted affordable housing, and higher density designs for rental andsectional title.
There is also considerable opportunity for expansion in the microfinance sector,to support the construction of backyard units for rental or incremental building ininformal settlements, former township areas, or on government-provided servicedstands. Another notable area of opportunity for investment is in inner city rentaland the conversion of office blocks and abandoned buildings into residentialaccommodation for sale or rent. Looking forward, the need for affordable, well-located housing will only increase as South Africa confronts the prospect of 71.3percent of the population residing in urban areas by 2030.50
Websiteswww.chartwellgroup.co.za www.thehda.gov.zahttps://www.flisp.co.za/ www.dhs.gov.zawww.gehs.gov.za www.ncr.org.zawww.oldmutual.co.za www.resbank.co.zawww.statssa.gov.za www.shra.org.zawww.nhfc.co.za
1 Statistics South Africa (StatsSA) (2018). Press release: Mid-year populationestimate: 2018. 23 July 2018.
2 National Treasury – Republic of South Africa (2018). Budget Review 2018.21 February 2018. Pg. 17.
3 1 US$ = 14.39 ZAR as at 10 Sept 2018 (www.coinmill.com).4 Business Tech (2018). The Biggest Economies in Africa. 10 July 2018.5 World Bank (2018). World Bank World Development Indicators. 6 National Department of Human Settlements (2018). HSDG Housing
Opportunities and Subsidies Delivered 1994 to 30 December 2017.http://www.dhs.gov.za/sites/default/files/u16/HSDG%20to%20Dec%202017.pdf (Accessed 8 Oct 2018).
7 National Treasury (2018). Budget Review 2018. Pg. 17. 8 Statistics South Africa (2018). Quarterly Labour Force Survey, Quarter 2:
2018. http://www.statssa.gov.za/publications/P0211/P02112nd Quarter2018.pdf (Accessed 2 Oct 2018).
9 Statistics South Africa (2018). Quarterly Labour Force Survey, Quarter 2:2018.
10 National Treasury (2018). Budget Review 2018. Pg. iv. 11 Statistics South Africa (2018). Economic Growth: The economy shrinks by
0.7% in Q2 2018. http://www.statssa.gov.za/?p=11507 (Accessed2 October 2018).
12 National Treasury (2018). Budget Review 2018. Pg. 15. 13 Donnelley, L. (2017). Global credit ratings agency has downgraded South
Africa to junk status. 25 Nov 2017. The Mail & Guardian.14 Bureau for Economic Research (2018). FNB/BER Consumer Confidence
Index (History Data), 2018.15 South African Reserve Bank (2018). Selected historical rates.
https://www.resbank.co.za/Research/Rates/Pages/SelectedHistoricalExchangeAndInterestRates.aspx (Accessed 7 Oct 2018).
16 South African Reserve Bank (2018). The Inflation Target.https://www.resbank.co.za/MonetaryPolicy/DecisionMaking/Pages/InflationMeasures.aspx (Accessed 7 Oct 2018).
17 National Treasury (2018). Budget Review 2018. Pg. 20. 18 Ibid. Pg. 20. 19 Ibid. Pg. 23.
20 Statistics South Africa (2018). Statistical Release: Gross Domestic ProductFourth Quarter 2017. 5 June 2018. Pg. 10.
21 Rust, K. (2018). Presentation: “Investment & economic empowermentopportunities in South Africa’s affordable housing sector.” 14 September2018. Centre for Affordable Housing Finance.
22 Bureau for Economic Research (2018). RMB/BER Business Confidence Index.23 World Bank Group (2018). Doing Business: Ranking & Access to Frontier. 24 South African Reserve Bank (2018). Selected South African Banking Sector
Trends January 2018.25 Finmark (2016). Finscope Consumer Survey South Africa 2016. 26 Sefako-Musi. G. (2018). Post Bank, Ithala banking licence approval under
spotlight. 19 March 2018. SABC News. 27 South African Reserve Bank, online statistical query: https://www.resbank.co.za/
Research/Statistics/Pages/OnlineDownloadFacility.aspx (Accessed 13 Oct2018). Total mortgage debt outstanding (KBP1480J) at the end of 2017 wasis R1.34 trillion, against a GDP at current prices (KBP6006J) of R4.65 trillion.
28 National Credit Regulator (2018). Consumer Credit Market Report:March 2018.
29 Melzer, I (2018). Bringing life to mortgage markets in South Africa.http://housingfinanceafrica.org/documents/bringing-life-to-mortgage-markets-in-south-africa/ (Accessed 13 Oct 2018).
30 National Treasury – Republic of South Africa (2018). Budget Review2018. Pg. 162.
31 Ibid. Pg. 26. 32 National Credit Regulator (2018). Consumer Credit Market Report:
March 2018.33 71point4 (2018). Presentation: “Entitled: Reframing the City.” September
2018. Slide 14.34 Absa. Current and historical prime rate. https://www.absa.co.za/indices/prime-rate/ 35 Email correspondence with Emma Harrington, Reall, 13 August 2018. 36 Department of Human Settlements (2018). Address by the Honourable
Minister of Human Settlements, Ms. Noma-Indiya Mfeketo at the presentationof the Department of Human Settlements Budget Vote 2018/19. 10 May 2018.
37 FSD Africa (2018). FSD Africa invests £1.6 million in African housingfinance. 22 June 2018.
38 Centre for Affordable Housing Finance. 2018 Dashboard: CalculatingMortgage and Housing Affordability in Africa. www.housingfinanceafrica.org
39 Standard house is defined as a 46 m2 house with 9 m2 balcony, built on a120 m2 stand, with basic finishes. The costs of building this house were testedacross 15 countries. Comparatively, the costs in South Africa were relativelylow at US$28 436 in Pretoria, versus US$63 241 in Nairobi, Kenya, andUS$26 750 in Dar es Salaam, Tanzania. See: CAHF (2017). Down to BrickLevel: Benchmarking Housing Construction Costs in Africa. 7 Nov 2017.
40 National Department of Human Settlements (2018). 2017/18 AnnualReport. Pg. 60.
41 StatsSA (2018). Statistical Release PO318: General Household Survey2017. 21 June 2018.
42 National Department of Human Settlements (2018). 2017/18 AnnualReport. Pg. 67.
43 71point4 (2018). Presentation: “Entitled: Reframing the City.” September2018. Slide 19.
44 SHRA (2017). To the Next Level: State of the Social Housing SectorReport 2016.
45 National Department of Human Settlements (2018). 2017/18 AnnualReport. Pg. 49.
46 Melzer (2018). TSC Case Study 1: The time it takes to buy a house inDelft. http://housingfinanceafrica.org/case-study-1-the-time-it-takes-to-buy-a-house-in-delft/ (Accessed 7 Oct 2018).
47 Email correspondence with Anton Arendse, National Co-ordinator: TitleRestoration Project, National Department of Human Settlements,10 October 2018.
48 National Department of Human Settlements (2018). 2017/18 AnnualReport. Pg. 44.
49 Other critical sectoral legislation includes: the Social Housing Act (No. 16of 2008); the Prevention of Illegal Eviction and Unlawful Occupation ofLand Act (No. 19 of 1998, amended); the Housing Consumer ProtectionMeasures Act (No. 95 of 1998); the Rental Housing Act (No. 50 of 1999);the Housing Development Agency Act (No. 23 of 2008); the HomeLoans and Mortgage Disclosure Act (No. 63 of 2000); and the SpatialPlanning and Land Use Management Act (No. 16 of 2013).
50 Department of Cooperative Governance (2016). Integrated UrbanDevelopment Framework: A New Deal for South African Cities and Towns.
Africa Housing Finance Yearbook 2018
245
expenditure on health and education only sums up to about 6.4 percent of totalgovernment outflows. To try to manage the worsening deficit, the authorities havemonetised the fiscal deficit against the backdrop of declining domestic and foreignrevenues. This has resulted in a steady rise in inflation to unprecedented levels.The inflation rate as measured by the annual Consumer Price Index increased by480 percent in 2016 and by 155 percent for the one-year period ending in 2017.
The foreign exchange value of the South Sudanese pound (SSP) has continued todepreciate. The monetary authority’s decision to move from a fixed to a floatingexchange rate arrangement in 2015 resulted in a 830 percent depreciation of thelocal currency against the US dollar from SSP18.5 per dollar in December 2015to SSP173 per dollar by August 2017. With the return of relative peace,culminating in the signing of the peace accord in June 2018, the SSP has recoveredand trades at SSP130 per dollar in July 2018.
Overall, the new wave of peace and commitment from regional member statestowards ensuring sustained peace in the promising nation will most certainly actas a springboard for development initiatives over the next few years. The rapidinflow of resources towards the country’s biggest resource, the oil sector, coupledwith multiplier effects to other sectors including housing, infrastructure and finance,will encourage development initiatives in the country.
OverviewThe economy of South Sudan has suffered slow progress due to the July 2016bouts of political insurgency that undermined development gains recorded earlierduring relative calm and stability. With the peace deal collapsing in 2016, hundredsof thousands of people were killed and about 5 million were displaced leading toa worsened regional refugee situation. One half of the relatively small populationof 12.57 million continue to face severe food insecurity. It is against thisbackground that efforts to restore peace commenced and culminated in thesigning of a peace deal between South Sudanese President Salva Kiir and rebelleader Riek Machar on 26 June 2018, which aimed at ending the war.
The peace deal is likely to see an implementation of a permanent ceasefire,cantonments for all forces and the deployment of forces by the IntergovernmentalAuthority on Development and the African Union to safeguard the ceasefire.Additionally, the country will have three capital cities; namely Juba, Wau and Malakalon a temporary basis to host the three proposed vice-presidents. The Khartoumgovernment will also be allowed to secure oil fields in South Sudan in coordinationwith the Juba administration, and to rehabilitate the wells to restore the previouslevels of production. This is likely to boost trade gains for the most oil-dependentcountry in the world, whose oil export revenues account for approximately60 percent of its GDP.1
South Sudan’s GDP per capita was SSP144 719 (US$1 111) in 2014, dropping toless than SSP30 871 (US$237) in 2017.2 Due to the fragile political state of thecountry, the subsistence sector has become dominant and livelihoods increasinglyrely on low productive, unpaid agriculture and pastoralist work. The county’seconomic collapse from July 2017 to June 2018 has seen output contract andinflation soar. For the one-year period to June 2018, the economy has contractedby 6.9 percent because of an increasing reliance on low output agriculture and aremarkable decline in oil production. Whereas the contraction in GDP issignificantly better than the -11 percent recorded in 2016-2017, the position hasworsened the fiscal deficit to over 4 percent of GDP in 2017.
Exports and household consumption have continued to decline while governmentconsumption recorded a sharp increase because of high-level spending on securityoperations of this fragile political state. Public expenditure is skewed towardsecurity at the expense of development initiatives. Security-related spendingaccounts for over 70 percent of the total budget whereas, the combined
South SudanKEY FIGURES
Main urban centres Juba
Exchange rate: 1 US$ = [a] 22 Jul 2018PPP Exchange rate (Local currency/PPP$) 1 South Sudanesepound = [b]Inflation 2016 [c] | Inflation 2017 [c] | Inflation 2018 [c]
142.38 South Sudanese pound
6.90379.8 | 187.9 | 104.1
Population 2017 [b] | Urban population size 2017 [b]Population growth rate 2017 [b] | Urbanisation rate 2017 [b]Percentage of the total population below National Poverty LineUnemployment rate [d]
12 575 714 | 2 423 0892.78% | 4.02%n/a18.5%
GDP (Current US$) 2017 [d] | GDP growth rate annual 2017 [d]GDP per capita (Current US$) 2017 [b]GNI per capita (Current US$) 2017 [b]Gini co-efficient [e]HDI global ranking [e] | HDI country index score [e]
US$2 870 million | -11.1%US$237US$39045.50187 | 0.388
Is there a deeds registry? Number of residential properties that have a title deed Lending interest rate Mortgage interest rate | Mortgage term (years)DownpaymentMortgage book as a percentage of the GDPEstimated number of mortgages Price to Rent Ratio in City Centre | Outside City Centre Gross Rental Yield in City Centre | Outside City Centre Construction as a % of GDP
Yesn/a24.20%24% | 2460%n/an/an/a | n/an/a | n/an/a
What is the cost of standard 50kg bag of cement? What is the price of the cheapest, newly built house by a formaldeveloper or contractor? (Local currency)What is the price of the cheapest, newly built house by a formaldeveloper or contractor? (US$) What is the size of this house (m2)? What is the average rental price for this unit (US$)? What is the minimum stand or plot size for residential property?
US$452 135 700 South Sudanesepound
US$15 000120m2
n/a40m2
Ease of Doing Business Rank [f]Number of procedures to register property [f]Time to register property (days) [m]Cost to register property (as % of property value) [f]
187950 days15.90%
NB: Figures are for 2018 unless stated otherwise.
[a] Bank of South Sudan[b] World Bank World Development Indicators[c] IMF World Economic Outlook Database[d] Central Intelligence Agency (CIA) World Factbook[e] UNDP Development Indicators[f] World Bank Doing Business

246
Access to financeThe Bank of South Sudan, at the helm of the country’s monetary policy, has beeninstrumental in licensing financial institutions in the country. The banking industrynow boasts 22 commercial banks concentrated in major urban areas of SouthSudan. Access to bank branches and ATMs is estimated at 1.4 and 0.76respectively per 100 000 adults. Access to deposit bank accounts stands at amarginal 6.4 percent. Although access to banking services is still minimal, the risein commercial banks’ presence is monumental as it signifies a 100 percent jumpfrom 11 banks in 2011. The financial sector in South Sudan is still plagued by lowlevels of regulatory oversight, weak depositor protection legislation and low levelsof client financial literacy. The leading financial institutions are regional entities withroots in neighbouring Kenya. These include Kenya Commercial Bank (KCB), EquityBank and Co-operative Bank. These banks have, however, not derived value fromtheir operations in South Sudan, thus making their subsidiaries in the countryunlikely to remain profitable due to the recent conflict and currency depreciation.KCB, Stanbic, Equity Bank, and Co-operative Bank have seen their subsidiaries inthe troubled country fall on hard times due to hyperinflation and currencydevaluation, coupled with the recent armed conflict that has nearly crippled thefragile country’s economy.
To help the economy stabilise and attract investments in the banking industry, theauthorities need to put special emphasis on controlling public expenditure,increasing non-oil revenues, encouraging investment and economic diversificationand removing subsidies to the national oil company (Nilepet). The 2018 nationalbudget aims to limit the government’s ability to deplete the central bank’sresources through borrowing, reducing inflation and preventing furtherdepreciation of the South Sudan pound.
In financial services, the insurance industry is nascent, comprising 10 companies,both private and partially government-owned providers. The total premiumscollected by the industry amount to US$0.7 million and is still unavailable tosupport mortgage lending in the country. The pension sector is a key driver oflong-term funding for mortgage lending in many developed and developing nations.The country’s Pension Regulation was passed in 2013 but little has been done toestablish and support pension schemes in the country. The deduction of civilservant’s pension contributions began in late September 2016 for workers at thenational government level. This excludes workers at state level. In addition, theMilitary Pension Scheme, Organised Forces Scheme and private sector schemesare yet to be established.
The microfinance sector is young, underdeveloped, and unregulated. The sectoris monitored by the South Sudan Microfinance Development Facility, a jointinitiative of the government, the Bank of South Sudan and the Multi-donor TrustFund, yet these shortfalls remain prevalent. A number of microfinance institutions(MFIs) operate in the country, as well as small savings and cooperatives or RotatingSavings and Credit Associations. The largest MFIs by asset base are BRAC SS (asubsidiary of the Bangladeshi INGO), SUMI (the result of greenfield investmentfunded by USAID), and FSL (funded by ARC International and Micro AfricaLimited). MFIs still face huge operational challenges including high non-performingloans as a result of emigration resulting from civil unrest, and low levels of clientfinancial literacy and business skills, both of which, collectively, drive up the MFIs’cost of doing business.
Overall, the banking industry suffers from limited utilisation of the credit referencebureau due to a low coverage rate and an underdeveloped collateral registry,thereby restricting access to credit facilities. The financial sector has beencharacterised by high interest spreads of up to 24 percent while most of thelending activity is concentrated in short-term lending, usually between three to24 months over the entire period of post-independence (2010 and beyond).
Less than eight percent of the entire loan portfolio is attributed to the real buildingand construction sector, with banks preferring to lend to well-known and well-established individuals and institutional customers. Commercial bank lending isstill less advanced with over 90 percent of the loans being short-term (less thana year) at interest rates of between 8 and 10 percent.3
Medium-term loans of one to five years, at interest rates of between 22 and 24percent, constitute about four percent of the loans. Loans of over five years
constitute the balance (one percent), and they are offered at interest rates ofbetween 18 and 20 percent. The main sectors which received commercial loansinclude (i) domestic trade, (ii) households, (iii) building and construction and (iv)real estate. The average loan size is estimated at approximately US$25 000. Ahigh downpayment of up to 60 percent is required to reduce credit risk. However,financial institutions have scaled down housing finance because of rising politicaltension and increasing credit risk. Some banks have, including Equity Bank, exitedthe mortgage space.
As an intervention in the financing space, the government introduced a YouthBusiness Startup Programme to offer financing opportunities to youth in thepolitically fragile country. Under this programme, approximately SSP130 260 toSSP156 312 (US$1 000 to US$1 200) is offered as a grant to youths, of which60 percent are female beneficiaries. The recipients participate in week-long trainingfor life and business skills before they obtain access to the allotted grant throughtheir respective commercial bank account. The grant is unconditional and can beused for any expenditure at the discretion of the beneficiary.
The initial programme attracted about 6 000 applicants in 2014 and funds weredisbursed in 2015 through to 2016. The programme was, however, cancelled dueto the outbreak of war in 2016. It is hoped that more youth will be consideredwith the return of relative peace and calm over 2018, leading to marginalimprovements in access to finance.
AffordabilityThe government of South Sudan has over the past few years been the majoreconomic player in the country, through its various monetary and fiscal arms aswell as being the dominant employer after the collapse of the private sector dueto armed conflict. With a deteriorating revenue base and rising defence-relatedspending, the government has largely been financing itself through accumulatedarrears to civil servants and printing more money to finance the deficit. Non-payment of salaries to government employees in both urban and rural areas hasaffected their ability to afford the minimum food basket and has resulted in anumber of employees quitting government service. The urban labour forceparticipation rate in urban South Sudan has declined from about 50 percent toabout 34 percent between 2016 and 2017. The drop has mainly been attributedto deterioration in the political and economic conditions of the country.
Printing of more money on the other hand accelerated inflation from 187 percentin June 2016 to 550 percent in September 2016, before decelerating to 118percent in recent months to the end of 2017.4 This has resulted in a large loss ofwage purchasing power, driving many households into poverty. Poverty amongwage-earning households has more than doubled from 28 percent in 2015 toover 65 percent in 2017
Economic decline has resulted in an increase in poverty from 49 percent in 2015to 74 percent in 2017, particularly in urban areas.5 The urban poverty gapincreased by over 54 percent between 2015 and 2017. The gap between the richand the poor also increased as reflected by the poverty severity index whichdoubled from 0.10 in 2015 to 0.22 in 2017. Overall, deterioration in economicconditions has led to depressed demand for goods and services across all sectorsof the economy.
Housing supplyThe supply of housing units in South Sudan has continued to weaken amid periodsof political unrest. Several small-scale developers that had commenced the supplyof low-income housing units stopped because of declining demand for rentalhouses in South Sudan’s major urban centres, including Juba, Wau, Malakal, Bor,Gogrial, Nimule, Yei, Tonj and Torit. The demand for residential housing units hadrisen because of an increasing presence of not-for-profit organisations and small-business holders serving various segments in the young nation. With the outbreakof war in 2016, most project staff and business operators were forced to flee thecountry, leaving most housing units vacant. Over the past two years, the supply ofhousing units has largely been through the re-introduction of formerly occupiedresidential units that have since lost tenants due to civil strife.
Impediments to housing finance continue to be evident as the major commercialbanks including the Co-operative Bank, Equity Bank, KCB Bank and CFC Stanbic

Africa Housing Finance Yearbook 2018
247
Bank and Buffalo Commercial Bank continue to scale down operations in mostareas affected by political instability. A significant number of residents in majorcities including Juba continue to reside in temporary structures at a going rate ofUS$25 a month for a single room. Furthermore, land acquisition, particularly thehigh cost of land leases, has deterred prospective investors from developingmodest housing projects (between 20 and 50 units).
Property marketsThe bulk of housing units in South Sudan are low cost, low quality housingstructures mainly constructed for the poor and migrant low cost earners (earningbelow SSP26 052 (US$200). Many peri-urban areas are dotted with grassthatched huts (Tukuls) that are traditionally built for family units and otherstructures made from iron sheets and timber that are mostly leased to foreignnationals at monthly rates ranging between SSP2 605 (US$20) and SSP3 908(US$30). A few luxury single-suite apartments are also available at rates rangingbetween SSP325 650 (US$2 500) and SSP390 780 (US$ 3 000) a month. Suchluxury structures include Liaison Courts with 12 apartments, Tongpin area with14 units, Atlabara with 20 units, Diplomat, Hudsson and Classiqueson.
The cost of renting these structures varies depending on the developer’s businessmodel. Some developers rent the rooms out on a daily rate and others onmonthly basis. The daily rates model mostly applies to structures built nearmarkets, with a focus on the mobile traders, especially those delivering items tomarkets and then heading out of the city once they have sold their merchandise.A daily fee of SSP391 (US$3) is charged for this usually furnished room with asingle bed, plastic seat and table. The monthly payment model targets low income(earning an average of SSP19 539 to SSP26 052 (US$150 to US$200) a month)foreign nationals with some level of residence in South Sudan. These are usuallymarket traders, hotel or restaurant attendants, construction labourers and otherpoor people. Tenants are required to move in with their household items becausethe monthly rental is not inclusive of furnishing.
Overall, the property market is significantly underdeveloped with most residentialareas lacking access to electricity, piped water and clear access roads. This makessuch areas unattractive to prospective developers due to additional estate runningcosts of thermal power generation, water pumping and road maintenance. A fewreal estate brokers are available, listing some properties in their portfolio at highprices. Other service providers in the housing supply chain are difficult to locate,operating informally in less structured settings. These include architects, quantitysurveyors and property valuers. Prospective buyers therefore encounterchallenges in ascertaining the true value of properties being offered. The currentbenchmark of similar structures in nearby localities could be misleading if suchproperties also appear to be overpriced. Verification of true owners of landedproperties tends to be strenuous due to the absence of clear processes at theland records office. Verification of ownership can take weeks, thus hinderingimmediate conclusion of purchase transactions.
Policy and regulationIn the past year, there have been no new developments in the policy andregulatory environment governing South Sudan’s housing finance sector. Effortsto end the protracted conflict have, for two consecutive years, forced thegovernment to prioritise military spending, stifling resources to ministries,departments and agencies whose mandate is relevant to the development of thehousing industry and housing finance sector. The country has several policies,strategies and regulatory frameworks that espouse practical and feasible measureson how to adequately and sustainably develop the housing industry and housingfinance sector.
The Ministry of Housing, Physical Planning and Environment continues to overseehousing developments in the country and also monitors compliance withestablished planning and building standards. The Land Act of 2009 continues togovern land use management. Additionally, the government adopted the LandPolicy of South Sudan in 2013 to address issues pertaining to land acquisition andland management.
OpportunitiesSouth Sudan is a country with immense growth potential across several sectorsof the economy. The bulk of this growth depends on renewed activity in the oilsector, which is likely to commence with the actualisation of the peace agreementsigned in June 2018. A few challenges will need to be overcome for theopportunities in the housing sector to be realised. The first is restoring peace andsecurity through cessation of hostilities and implementation of governance andsecurity arrangements that promote private sector-led investments. The deliveryof affordable housing entails harnessing both multiple stakeholder initiatives andprivate sector-led initiatives to ensure housing sector development. To supportsuch initiatives, the government will need to implement comprehensivemacroeconomic reforms to unify the official and parallel exchange markets andreduce inflation. This is essential for foreign direct investment in housing and othersectors of the economy. Additionally, clear plans for longer-term action to boostemployment, build infrastructure, and diversify the economy will help createdemand for housing units during the post-conflict period of economic recovery.
Source https://www.cgidd.com/
- - - Average annual household income needed for the cheapest newly built house by a formal developer, 2017 Average annual household income using expenditure, 2017 (PPP$)
SOUTH SUDAN
Annual income profile for rural and urban households based on consumption (PPP$)
PPP$40 001 – PPP$10 000 000
PPP$23 001 – PPP$40 000
PPP$12 001 – PPP$23 000
PPP$8 001 – PPP$12 000
PPP$5 001 – PPP$8 000
PPP$3 601 – PPP$5 000
PPP$2 401 – PPP$3 600
PPP$1 601 – PPP$2 400
PPP$801 – PPP$1 600
<PPP$800No. of households (thousands)
PPP$10 075
PPP$119 254
Rural Urban300 250 200 150 100 50 0 50 100 150 200 250 300
Population: 12 575 714
Urbanisation rate: 4.02%
Cost of cheapestnewly built house:
2 135 700 SSPPPP$309 522
Urban householdsthat could afford thishouse with finance:
2.87%
1 PPP$:6.9 South
Sudanese pound
248
SourcesAfrican Development Bank Group. South Sudan Economic Outlook 2018.https://www.afdb.org/en/countries/east-africa/south-sudan/south-sudan-economic-outlook/ (Accessed 5 August 2018).
Ministry of Finance and Planning, Republic of South Sudan. Approved BudgetTables – Fiscal Year 2017/18. September 2017. http://grss-mof.org/wp-content/uploads/2017/11/book-final-1718-1.pdf (Accessed 8 August 2018).
National Bureau of Statistics, Republic of South Sudan. Consumer Price Indexfor South Sudan April 2017. 4 May 2017.http://www.ssnbss.org/sites/default/files/2017-05/CPI-April_2017_Press_Release%202017%5B6091%5D.pdf (Accessed 6 August 2018).
Phan, Chap. “Lack of progress in peace talks will lead to economic collapse inSouth Sudan”. 3 July 2015. South Sudan Nation.comhttp://www.southsudannation.com/lack-of-progress-in-peace-talks-will-lead-to-economic-collapse-in-south-sudan/ (Accessed 5 August 2018).
The World Bank Group (2018). The World Bank in South Sudan.https://www.worldbank.org/en/country/southsudan/overview (Accessed8 August 2018).
1 The World Bank Group (2018).2 Ibid.3 Interview with key resource persons from Bank of South Sudan Officers, Equity Bank and KCB Bank (2018).4 The World Bank Group (April 2018). South Sudan: Macro Poverty Outlook. http://pubdocs.worldbank.org/en/713731492188171377/mpo-ssd.pdf (Accessed 24 Sept 2018). Pg. 1. 5 Dihel, Nora Carina and Pape, Utz Johann. South Sudan Economic Update, 2017: Taming the Tides of High Inflation. http://documents.worldbank.org/curated/en/806291508505062484/South-Sudan-economic-update-taming-the-tides-of-
high-inflation-policy-options. Pg. 12.

Africa Housing Finance Yearbook 2018
249
SDG7.0154/US$ in December 2017 and SDG6.6834/US$ in March 2017. Therate was SDG=US$0.06 (US$1=SDG17.96) according to coinmill.com on 26 July2018; however, it is important to note that the rate used by the commercial banksis US$1=38SDG, while the rate used for trade by the CBoS isUS$1=SDG17.9551; in the black market it reaches over US$1=SDG45.
Government Revenue is projected to grow to SDG136.915 billion (US$7.6 billion)in 2022. In addition to agricultural export commodities of livestock, cotton andsesame, Sudan is the world’s largest producer of gum Arabic, which used toaverage US$40 million annually in revenue and constituted 80% of the world’stotal output of gum Arabic; Sudan’s share of the world market today is below 50%.
The building and construction sector made up 1.8% of the GDP in 2015 comparedto 3.4% in 2013. The housing price inflation rate in 2017 averaged 17.7% (withthe highest monthly rate of 19.6% in March). There have been concerns raisedabout corruption in government land distribution. The construction sector outputgrew by 10.8% during 1982-2009; 30.4% in 2001; 25.4% in 2004; 5% in 2015; and5.5% in 2016. Measures of efficiency in dealing with construction permits areassessed based on obtaining land ownership certificates, planning permission,project clearances, building permits and inspections, certificates of conformity,
Overview The Republic of the Sudan is bordered by seven countries and comprises 18 states.Sudan has an area of 1 861 484 km2 and is dominated by the Nile and itstributaries. The urban population is estimated at about one-third (34.6%) of thetotal population of 41.5 million. Sudan’s capital of Khartoum has a population of5.1 million (2015). Sudan gained independence in 1956 and the currentgovernment has ruled since 1989; the country has been embroiled in civil warsfor most of the 20th century. Although comprehensive sanctions by the UnitedStates ended recently, the economic situation has worsened. Lack of liquidity, adramatic increase in prices and a lack of basic commodities are some of theproblems facing Sudan.
After the secession of South Sudan in 2011, Sudan lost three-quarters of its oilresources, 90% of export earnings and nearly 50% of revenue. The oil sector haddriven much of Sudan's GDP growth since 1999. The country is attempting todevelop non-oil sources of revenues, but while it has plentiful mineral resourcesand an abundance of agricultural land, it faces environmental challenges andperiodic droughts. Its inflation rate, ranked the third highest in the world, jumpedfrom 25.1% in December 2017 to 55.6% in March 2018.
Ongoing conflicts, lack of basic infrastructure and reliance on subsistenceagriculture, which employs 44.6% of the workforce, keep much of the populationin poverty. It is estimated that 53.1% of the population lived in multi-dimensionalpoverty in 2016, rising from 46.5 % in 2009; 14.9% of the population is living belowthe income poverty line. With a Human Development Index (HDI) of (0.49)Sudan is ranked at 165th of 188 countries while the GINI index of Sudan is 35.4(2016) with a global rank of 105.
Sudan has a GDP per capita of US$4 202.18 (2018 estimate) and a GDP growthrate calculated at 3.6% in 2018, down from 3.75% in 2017 with an industrialproduction growth rate of 2.5% as estimated in 2017. Sudan’s Governmentrevenue is forecast to be SDG86.6 billion (US$4.8 billion) in 2018 accounting for9.2% of GDP, up from SDG75.879 billion (US$4.2 billion) in 2017. The Sudanesecurrency was formally devalued in June 2012. More recently, as part of ongoingausterity measures and to control the fast depreciation of the currency in theblack market, the Central Bank of Sudan (CBoS) devalued the Sudanese currencytwice within two months; from SDG6.7 to SDG18 in January 2018, and fromSDG18 to SDG30 in February 2018. The exchange rate of Sudanese currencyagainst the US$ as of March 2018 was SDG18/US$ in comparison to
SudanKEY FIGURES
Main urban centresKhartoumPort Sudan (Bur Sudan)
Exchange rate: 1 US$ = [a] 22 Jul 2018PPP Exchange rate (Local currency/PPP$) 1 Sudanese pound = [b]Inflation 2016 [c] | Inflation 2017 [c] | Inflation 2018 [c]
17.9635 Sudanese pound
4.1016.80 | 35.90 | 55.60
Population [d] | Urban population size [d] Population growth rate [d] | Urbanisation rate [d]Percentage of the total population below National Poverty Line 2016 [e]Unemployment rate 2015 [e]
41 511 526 | 14 380 2172.38% | 3.17%53.0%13.6%
GDP (Current US$) 2017 [f] | GDP growth rate annual 2017 [f]GDP per capita (Current US$) 2017 [f]GNI per capita (Current US$) 2017 [f]Gini co-efficient 2015 [e]HDI global ranking 2015 [e] | HDI country index score 2015 [e]
US$117 488 million | 4.28%US$2 898US$2 37835.40165 | 0.488
Is there a deeds registry? Number of residential properties that have a title deed Lending interest rate [g] Mortgage interest rate [g] | Mortgage term (years) [g] Downpayment [g] Mortgage book as a percentage of the GDPEstimated number of mortgages Price to Rent Ratio in City Centre | Outside City Centre [k]Gross Rental Yield in City Centre | Outside City Centre [k]Construction as a % of GDP [c]
n/an/a12.00%12% | 3050%n/an/an/a | n/an/a | n/a1.80%
What is the cost of standard 50kg bag of cement? What is the price of the cheapest, newly built house by a formaldeveloper or contractor? (Local currency) [g] What is the price of the cheapest, newly built house by a formaldeveloper or contractor? (US$) [g] What is the size of this house (m2)? [g] What is the average rental price for this unit (US$)? What is the minimum stand or plot size for residential property?
US$15.50
190 000 Sudanese pound
US$10 570300m2
n/a120m2
Ease of Doing Business Rank [h]Number of procedures to register property Time to register property (days)Cost to register property (as % of property value)
170n/an/an/a
NB: Figures are for 2018 unless stated otherwise.
[a] Oanda.com[b] World Bank World Development Indicators[c] Republic of Sudan - Central Bureau of Statistics[d] United Nations Department of Economic and Social Affairs, Population Division [e] UNDP Development Indicators[f] IMF World Economic Outlook Database[g] Iskan Housing and Construction Fund[h] World Bank Doing Business

250
water and sewage connections and updating of land registry records. Sudandeteriorated in the global ranking of the ease of doing business from number168 in 2017 to 170 in 2018.
Access to finance Sudan is ranked at number 173 in the ease of obtaining credit.1 Data is not readilyavailable on credit registries, banks and financial institutions. The CBoS balancesheet assesses the performance of the banking system, the Microfinance Unit,Credit and Information Scoring Agency and Electronic Banking Services. The CBoSaims to remove restrictions on banking in all 18 states. This led to a significantincrease in bank deposits from SDG63.4 billion (US$3.5 billion) by the end of2015 to SDG84 billion (US$4.7 billion) by the end of 2016 at a rate of 32.5%, a10.8% increase in ATMs (from 81 074 at the end of 2015 to 1 190 by the end of2016), and an increase in ATM cards by 11% (from 2.5 million cards by the end of2015 to 2.8 million cards by the end of 2016). There was also a 13% increase inbank branches from 720 branches at the end of 2015 to 733 branches by theend of 2016. The number of points of sale increased by 19.5% from 2 885 at theend of 2015 to 3 447 by the end of 2016. The number of electronic wallet cardsincreased by 8% from 722 000 cards at the end of 2015 to 778 000 cards by theend of 2016. The number of financial transfer office branches increased from25 branches at the end of 2015 to 32 branches in 2016 by 28%.
As of 2016, there are two non-governmental specialised banks, 29 operating banks,including one government-owned commercial bank, two government-ownedspecialised banks, 23 private commercial banks, one investment bank, and twobranches of foreign banks. The interest rate is set at 12% a year ; microfinanceoperations are exempted from this rate.
In 2010, the CBoS listed the real estate sector and supporting industries, such ascement, bricks and blocks, among the priority sectors for finance. This is somewhatcontradictory, considering that funding for real estate has been prohibited by theCBoS since May 2014; all banks and financial agencies cannot offer loans for realestate, land purchases and land development. Loans granted to fund popularhousing (al iskaan al shabi) and economic housing (al iskan al igtisadi), guaranteedby the National Fund for Housing and Reconstruction (NFHR), as well as loans todevelop land for agricultural purposes, are exempted from this rule. The CBoSjustified this by stating that resources need to be channelled to the productivesectors. In 2015, exceptions were made for hospitals and health facilities,universities, schools, public educational facilities, and the improvement of housingwithin the limits set for microfinance. The latter has increased from SDG20 000(US$1 114), as set in 2011, to SDG30 000 (US$1 670) in 2016.
A system of granting ownership of residential units is based on a “mortgagepledge” where the money is lent with the property as security for the loan. Therepayment terms depend on the individual regulations of the bank in question.The mortgage interest rate varies from 0-12% per year. Down payments varyfrom 0-50% of the price of the residential unit. The loan is granted on conditionthat the repayments do not exceed 33% of the income of the applicant. A 10%discount of the total price is offered for cash payment.2 Other government andprivate agencies, such as the Social Security Investment Authority (al jihaaz alistismari lil damaan al ijtimai) – established in 2004, provide housing support. Theseagencies have their own unique repayment processes, repayment periods andguarantees as security for the loans. However, the property remains owned bythe lending agency until the repayment is completed.3
Affordability Khartoum continues to see exorbitant real estate prices; the price of vacant landin central locations in Khartoum is as high as US$1 500/m2.4 This is attributed tohigh demand, government policies, soaring inflation rates and the weakness of theSudanese Pound. From 1997 to 2006, prices of housing, water and electricity grewalmost twice as fast as the prices of tradable goods, specifically food, clothing andconsumer goods. Prices in Khartoum increased dramatically around 2009.Researchers concluded that most of the low income households (50% of thepopulation) can afford a house of nondurable materials, about two-thirds of themiddle income households (10-15% of the population) can afford houses ofdurable materials, and more than half of the high income households (5% of thepopulation) can afford houses of advanced materials.5 Current building costs persquare metre vary from SDG1 200/m2 (US$67/m2) to SDG3 000/m2 (US$167/m2)depending on construction type. A load-bearing structure with “agid” (jack-arch
structure) roof with basic finishes would cost about SDG1 200/m2 (US$67/m2. Areinforced concrete frame building with high quality finishes would cost anestimated SDG3 000/m2 (US$167/m2) or more.6 One estimate of large scalebuilding costs may be derived from Jawhara Al Awda Residential Development, aproject self-funded by Khartoum State Housing and Development Fund (SandoogAl-Iskan Willayat alKhartoum), which provided 1 216 apartments in 76 buildings forSDG672 870 016 (US$37.5 million) inclusive of the costs of services to the project.
The cost of construction is excessive compared to salaries, which vary betweenSDG400 (US$22) and SDG1 500 (US$84) a month.7 The time needed to raisethe capital funds to build a house ranges from 20 to 83 years depending on thetype of house and interest rates, assuming a savings rate of 25% of income.Another source states the cost of building a modest house – without land – wouldequal the gross salary of a civil servant for a decade.8 In the case of Jawhara AlAwda, the cost starts from US$56 147 (in case of cash payment) with monthlyinstalment of US$834 and repayment period of 48 months. Material costs accountfor two-thirds of house costs with the remaining third allocated for labour. Thehigh construction costs are believed to be due to increasing government tariffson materials, as duties can sometimes reach 100% or more, with another 17% asvalue-added tax and 1% as services on top of that. Also, the price of rentingconstruction machines and labour costs have been pushed up by the secession ofSouthern Sudan. Before 2011, most labourers were Southern Sudanese and theirdisappearance from the market has created a shortage and triggered wage rises.
As of June 2018, one ton of steel costs SDG31 500 – SDG32 750 (US$1 754 –US$1 823), compared to SDG7 200 in Aug 2015. A ton of cement costsSDG3 550 – 3 750 (US$198 – US$209) compared to SDG1 500 in August 2015.This recent increase has been accompanied by a surge in the costs of otherbuilding materials such as bricks and sand. Sand for example almost doubled inprice from August 2015 to SDG3 500/US$195 for a 18m3 lorry load.
Sudan mainly relies on imports for most its building materials, though theestablishment of GIAD Industrial Complex in 1997 contributed significantly to thelocal production of some building materials. The industrial complex is located inEl-Geziera state about 50km south of Khartoum. GIAD Group includes fourcompanies that specialise in producing building materials and components, namelysteel products, tubes and pipes, aluminium and cables.9 Sudan has witnessed anincrease in national cement production, which covers local need and producesexcess for export.
Housing supply Sudan’s Report for Habitat III 2016 noted that the contribution of public agenciesto supplying adequate housing is limited. Sudanese citizens satisfy their need forhousing with great difficulty by using their own savings and transfers from familymembers working abroad. According to the report, the average household sizeis 5.7 people, as reported in the 2008 Census (5.6 in 1996).10 The current gap inthe housing supply is estimated at approximately 2.5 million units.11
Only 311 000 serviced plots were distributed nationally between 956 and 2007,which is considered a major housing programme in the Sudan. Only 43% of thoseplots were developed. Core-house units are built through various governmentprogrammes but this incremental option does not supply the high demand forhousing. Informality in Greater Khartoum included about 83 squatter settlementsaccommodating about 60% of its population in 1990.12
In 2007, the Higher Committee for Housing and Reconstruction was establishedand in March 2008 the National Project “Shelter for All” was launched, to providehousing for the residents of the entire country within all income groups. Theproject aims at a comprehensive renaissance in the urban environment, theachievement of sound physical planning achieving the best utilisation of land byproviding adequate, affordable housing for middle and low income earners. TheNFHR was established in 2008 to implement this project. Its main objectives areto:13
n Contribute to urban planning strategies through cooperation betweenauthorities at national and state levels;
n Coordinate funds for housing and reconstruction on the state level;n Obtain loans and grants for the fund's projects;n Encourage financing for housing and reconstruction at national and state
levels;

Africa Housing Finance Yearbook 2018
251
n Contribute to research on, and development of, building materials and theuse of local materials in construction; and
n Reduce construction costs by refunding taxes and duties on cement and steel.
The NFHR’s target was to build 150 000 “economic” housing units in 15 statesover five years, i.e. 30 000 units a year. While it is believed that inadequate budgetsslowed progress, the NFHR claims that 80% of the units planned for part of theShelter for All project were built.14 The moratorium on lending for real estate mayhave negatively affected the resources of the NFHR and disrupted its progress.15
Since the late 1990s, some cities – notably Greater Khartoum – have establishedhousing funds to construct affordable, popular housing16 units provided withinfrastructure, and to sell them to eligible households with affordable, subsidisedinstalments. At the same time, the city also builds luxury villas and apartmentsand sells them for profit to cross-subsidise the popular housing units. Since itsestablishment in 2001, the Khartoum State Housing and Development Fund(KSHDF) has managed to construct 61 929 what are termed “popular” and“economic” units, amounting to 66% of units provided. The city has also built3 881 apartments and villas as a form of “investment” housing, constituting 34%of its units.17
KSHDF delivers popular housing (sakn shabi) and economic housing (sakn igtisadi).Both products are low density, peripherally-located and target low-income groups.KSHDF has the following track record:n The applications for popular housing increased from 6 372 (2003) to 17 966
(2015), peaking at 34 963 in 2011;n 70 603 families have been housed in popular and economic housing;
economic housing is a total of 30% of all housing delivered; andn 40 000 beneficiaries (government workers) were provided with popular
housing (sakn shabi) between 2008 and 2015.18
KSHDF supports housing for those employed by the Khartoum LocalGovernment, under the auspices of the Trade Unions, through sectoral housing(sakn fiawi) in the State (wilaya). Each building is four storeys high, and eachapartment is 120m2.19 Prices start at SDG337 796 (US$$18 808) with a monthlyrepayment of SDG5 608 (US$$312) for 48 months. Recovery of rental costs isreportedly a challenge.20
KSHDF implements projects to certain specifications and hands over ownershipin three to 12 years depending on the income levels of the beneficiaries. To helpbuild popular housing, the fund implements the following: n Establishing and supporting factories and workshops for building materials;n Involvement in all engineering services related to the building of the various
types of housing;n Purchasing and importing building materials; andn Geology and quarrying services.
KSHDF has promoted alternative building materials and techniques for achievingpassive thermal control and constructing light-weight roofs. In line with thegovernment policy of privatisation (khaskhasa), the fund appoints privatecontractors. Popular housing is funded by beneficiaries’ instalment payments; thedifference between operating costs and resident repayments is subsidised byKSHDF. Three types of products are provided – none of which are fully subsidised:n Popular housing (al sakn shabi) – beneficiaries pay instalments to own the
house, the government partially subsidises the units;n Economic housing (al sakn igtisadi) – based on the same principles with a
lower subsidy, higher instalment; and n Luxury housing (al sakn al fakhir) – investment housing.
The allocation of popular housing is based on a point system developed accordingto specific rules and eligibility criteria as set by KSHDF:n The applicant must be born in Khartoum or have permanent residence for
not less than 10 years;n The applicant's place of work and residence is within the state;n The applicant has a family permanently residing in the state;n The applicant has never owned a piece of land within the housing plan in
Khartoum state;n The applicant does not own a house or a piece of land; andn The applicant should gain 25 points at the minimum.
The first category of popular housing, which is identified as being the KSHDF’score programme, also has three sub-categories: n Popular housing as part of the housing strategy/plan (al khuta al iskaniya);n Popular housing exempted/outside of the strategy/plan; andn Improved popular housing.
For the first sub-category, applicants must apply to the Local Committees (lajnaashabiya), which often takes three months. Upon approval, the applicant must paythe deposit/down payment. The second sub-category has a similar but fasterprocess. The third category differs in the size, number of rooms and otherspecifications. The so-called “economic housing” – accessible to anyone with anyincome level – has the benefit of being immediately available for purchase; thehousing is well located and has easier procedures. The minimum specificationsare as follows – with variations in building materials and methods: n room + kitchen + traditional toilet + boundary wall; andn 2 rooms + kitchen + toilet + boundary wall.21
Property markets High rates of urbanisation in Sudan (3.17% a year on average) and high rates ofrural-to-urban migration have resulted in the growth of squatter settlements toaccommodate the new migrants. Those usually take the form of squatting onvacant land at the peripheries of towns, often on land deemed undesirable suchas garbage dumps, and flood-prone areas, or renting out unplanned andunregistered houses in extant villages that lie on the periphery of towns.
SUDAN
Annual income profile for rural and urban households based on consumption (PPP$)
Source https://www.cgidd.com/
- - - Average annual household income needed for the cheapest newly built house by a formal developer, 2017 Average annual household income using expenditure, 2017 (PPP$)
PPP$40 001 – PPP$10 000 000
PPP$23 001 – PPP$40 000
PPP$12 001 – PPP$23 000
PPP$8 001 – PPP$12 000
PPP$5 001 – PPP$8 000
PPP$3 601 – PPP$5 000
PPP$2 401 – PPP$3 600
PPP$1 601 – PPP$2 400
PPP$801 – PPP$1 600
<PPP$800No. of households (thousands)
PPP$11 583
PPP$19 685
Rural Urban1 400 1 200 1 000 800 600 400 200 0 200 400 600 800 1 000 1 200
Population: 41 511 526
Urbanisation rate: 3.17%
Cost of cheapestnewly built house:
190 000 SDGPPP$46 341
Urban householdsthat could afford thishouse with finance:
67.69%
1 PPP$:4.1 Sudanese
pound

252
Most land in the Sudan is state-owned. Registering property in the Sudan has atotal of six procedures and takes up to 14 days at a cost of 2.5% of the land value.There are two processes for land registration, determined by whether the land ispurchased from the Ministry of Planning or not. The process for the latter dependson the type of ownership of the land. Generally, non-registered land is in one ofthese two categories, freehold prior to 1970 and leasehold where the Ministry ofPlanning determines the duration and type of lease.
It is argued that the sale of vacant land and old evacuated government facilities inthe city centre to affluent buyers deprives the majority of their right to such sitesand widens the gap between rich and poor. Peripheral expansion has madeeveryday life difficult and increased the vulnerability of the urban poor. It isestimated that 50% of neighbourhoods in Khartoum originated informally. Homeownership, as a percentage of total households, was estimated at 87% in 2008rising from 76% in 1996, while home ownership in rural areas was 95% in 1996.
Policy and regulations The history of government housing programmes can be summarised into fournational strategies over the years. These strategies are aligned to governmentdevelopment and financial programmes. The government decided to make useof its extensive land resources in “site and service” schemes and self-build projectsduring the 80s. This became known as the Third Housing Strategy. Thisprogramme delivered 300 014 plots from 1959-2005, but the failure of the stateto provide basic services resulted in a decline in the development of these sites –half of them remain undeveloped. This has had serious negative repercussionsincluding sprawl, low density, high infrastructure expenses, ruralisation of theperipheries, increased land values, housing demand and city management costs. Ithas also led to growing agriculture land speculation.22 The site and servicesapproach was terminated in 2005 and the Fourth Housing Strategy launched in2007, underpinned by the controversial Khartoum Structure Plan (2007-2027).
Neighbourhoods in Khartoum are categorised as “classes” based on the incomeof residents and this determines allowable coverage, materials, methods ofconstruction and provision of infrastructure and services. The plot sizes anddensities for the Khartoum Metropolitan Region in the Doxiadis Plan of 1960-1990 were as follows:n 500m2 in 1st class areas with a net population density target of 80 persons/
hectare;n 400m2 in 2nd class zones with a net population density of 95 persons/hectare;
andn 200m2 in 3rd class areas with a net population density of 190 persons/hectare.
In 2001, slum-upgrading offices within Khartoum State were closed down becauseit was assumed that their mission had been accomplished. However, theproliferation of informal mining in recent years has led to new squatter settlementsmushrooming on the fringes of the desert in the Northern, North Kordofan andNorth Darfur States. These squatter settlements could easily develop into fullyfledged towns in the future.23
Opportunities Sudanese cities face similar challenges as other African cities. Sprawl, poverty andinequitable distribution of resources and opportunities create problematic socio-political dynamics. Viewed positively, peripheral areas show that different groupsof people, coming from different parts of the country, have managed to co-exist;they also build differently, reflecting a wealth of local experience and heritage. Yet,the stigma around traditional neighbourhoods, materials and methods persistsbecause of class classification systems. While residential ownership remains animportant component of the housing market, many people living and working inKhartoum consider their rural homes as their permanent address. Well-locatedrental housing, as part of mixed-use developments, could be considered, with arange of densities, configurations and affordability levels. Government’s role, asopposed to aiming for unattainable targets in terms of quotas, could be re-directed
towards building institutions capable of implementing projects, at scale, as well aspartnering with the private sector, to meet the high demand for housing.
Sources Abu Goukh, M. (2014). Prices Beyond Belief in The Niles.http://www.theniles.org/en/articles/land/2300/ (Accessed 10 Sept 2017).
Al Nilin (2015). Forty Thousand beneficiaries/labourers in Khartoum Province frompopular housing (iskan shaabi) (translated from Arabic), Al Nilin. 8 April 2015.
Al Sudan Alyoum (2018). Housing: Executing more than 80% of the NationalProject for Shelter (translated from Arabic) in Al Sudan Alyoum. 6 Jan 2018.
Al Sudan Alyoum (2017). Building material costs continue to increase (translatedfrom Arabic) in Al Sudan Alyoum, 17 Aug 2017.
Assayha (2016). Opening of Al Jawhara Residential Complex (translated fromArabic), in Assayha. 11 Feb 2017.
Aawsat (2017). Sudan expands in real estate development projects after liftingthe sanctions (translated from Arabic). 25 June 2018.
Elfadil, A. & Eltayib, Z. (2015). The Experience of the National Project for Shelterand Human Settlements in Sudan: To Achieve Sustainable Urban Development.Presented at the First Arab Ministerial Forum on Housing and UrbanDevelopment, Egypt, Cairo, 20-22 December 2015.
Elkhalifa, A. A. (2012). The Construction and Building Materials Industries forSustainable Development in Developing Countries: Appropriate and InnovativeBuilding Materials and Technologies for Housing in Sudan. PhD thesis, Universityof Camerino, Italy.
Fadl Al Moola, A. (2016). Statistics in government housing delivery, 2016, Workshopon opportunities and challenges at Salam Rotana 18.04.2016. Khartoum, Sudan.
Foreign Policy. Sanctions against Sudan didn't harm an oppressive government –They helped it. 3 July 2018.
Global Finance (2017). Sudan GDP and Economic Data. Country Report.
Hamid, G. M. and Elhassan, A. A. M. (2014). Incremental Housing as an AlternativeHousing Policy: Evidence from Greater Khartoum, Sudan, International Journal ofHousing Policy, Vol. 14, No. 2, Pgs. 181-195.
Haydar Ahmed Ali architectural practice (2017). Haydar Ahmed Ali architecturalpractice, ([email protected]), Khartoum interview conducted byMalaz Saif Al Islam in July 2017 with Engineer Daliya Shams Eldin.
IMF (2016). IMF-GDDS-Sudan Summary; Table I. Plans for Improvement.
Iskan (n.d.) a. Al Jawhara Alawda Residential Apartments. http://iskan.sd/home/(Accessed 27 June 2018).
Iskan (n.d.)b. Economic Housing Offers.
Khartoum State Housing and Development Fund (KSHDF) (n.d.).http://www.iskan.sd/index.php (Accessed 14 Aug 2016).
Mecometer (2016). GINI Index - Sudan.
News 24 (2018). https://www.news24.com/Africa/News/sudan-devalues-pound-to-30-against-us-dollar-20180205
Sid Ahmed, M.M. (2016). Land registration in the Sudan, interview with AssistantLand Registrar, 14.08.2016, Khartoum, Sudan.
Sudancon (2018). Prices of Building Materials 10.6.2018.http://www.sudacon.net/2018/06/10-6-2018.html (Accessed 27 June 2018).
Tag Elsir Mekki, O. (2016). Mortgage Loans in Sudan, interview with employee ofByblos Bank, conducted by Malaz.
UN-Habitat (2016). Sudan’s Report for United Nations’ Third Conference onHousing and Sustainable Urban Development, (Habitat III), 2016.
United Nations, Department of Economic and Social Affairs, Population Division,(2018). World Urbanization Prospects: The 2018 Revision.
US Department of State (2017). The Administration Extends Sudan SanctionsReview Period.
Wagialla, M., S. (2014). Spatial Justice as a Tool for Sustainable Reform inKhartoum Metropolitan Area, UIA Congress Proceedings, UIA 2014 Durban.
The World Bank (2018). Doing Business, Dealing with Construction Permits.http://www.doingbusiness.org/data/exploreeconomies/sudan (Accessed June 2018).
1 World Bank (2018). Pg. 32.2 Iskan (n.d.)b.3 Tag Elsir Mekki, O. (2016).4 Aawsat (2017).5 Elfadil & Eltayib (2015).6 Haydar Ahmed Ali architectural practice (2017). 7 Abu Goukh (2014).
8 Abu Goukh (2014). 9 Elkhalifa (2012).10 UN-Habitat (2016), Pg. 42.11 Aawsat (2017).12 Hamid and Elhassan (2014). 13 Elkhalifa, A. (2012). Pg. 210. 14 Al Sudan Alyoum (2018).
15 Assayha (2016).16 Popular housing is a direct translation from the
Arabic term and implies government supported,ownership housing provided with basic infrastructurefor low-income households against easy instalments.
17 UN-Habitat (2016). Pg. 42.18 Al Nilin (2015).
19 Assayha (2016). 20 Fadl Al Moola, A. (2016).21 All information on Sandoog Al-Iskan Willayat
alKhartoum Khartoum State Housing andDevelopment Fund (KSHDF).
22 Wagialla (2014).23 UN-Habitat (2014).

Africa Housing Finance Yearbook 2018
253
ratios for the sector were 18.7 percent and 39.0 percent as at the end of April2018, above regulatory requirements of 10 percent and 20 percent respectively.However, the quality of the banking sector assets deteriorated, as reflected by theratio of non-performing loans to gross loans which reached 11.3 percent at theend of April 2018 compared to 10.8 percent at the end of April 2017.
According to FinScope 2017, Tanzania has made remarkable progress in expandingthe opportunities for people to use financial services. Formal inclusion has reached65 percent, growing by 14 percent between 2013 and 2017. Twenty-eight percentof the adult population remained financially excluded in 2017, compared to
Overview Tanzania is a growing economy, straddling the East African and Southern Africaneconomic development communities. The country is sixth among the top10 fasted growing African economies.1 It is rich in natural resources such asminerals and natural gas. At least 32.6 percent of the country’s 59 million peoplelive in urban areas, with a population growth rate of 3.11 percent2 and urbanisationrate of 5.22 percent1 per annum.
The country has experienced impressive GDP growth rates over the past decadeaveraging six to seven percent a year. The GDP grew by 7.1 percent in year 2017,broadly matching 2016’s results with the growth rate for years 2018 and 2019projected at 6.5 percent.4
Inflation rates have shown a declining trend in the first five months of 2018, withthe rate dropping from 3.8 percent in April to 3.6 percent in the month of Maymainly due to the decrease in the price of food, non-alcoholic beverages andclothing and footwear. These movements have gone hand-in-hand withmovements in the 182 days Treasury bill rate which continued to experience adownward trend during the first half of 2018, with the weighted average yieldreaching 2.68 percent by mid-June 2018. This downward trend on the 182 daysTreasury bill rate promotes all forms of long-term debt, including mortgages bymaking them less expensive. This, coupled with the Bank of Tanzania’s (BOT) moveto reduce its discount rate from 16 percent to nine percent in August 2017, hasresulted in some of the leading banks lowering their interest rates on personalloans from 21 percent to 17 percent.
The positive developments in the housing industry have attracted substantialmultilateral and donor support. In addition to the African Development Bank’scommitment to fund the construction of residential houses and the developmentof agriculture and other economically viable areas in Tanzania with a total approvedassistance package exceeding US$1.1 billion for years 2016-2020, the country hasbeen promised more funding support from the World Bank in various sectorsincluding real estate.5
Access to financeTanzania has 58 commercial banks and other private financial institutions. Thebanking sector in Tanzania is regulated by the BOT. As per the June 2018 MonetaryPolicy Statement, the banking sector remained stable and profitable with levels ofcapital and liquidity generally above regulatory requirements. Capital and liquidity
Tanzania KEY FIGURES
Main urban centresDar-es-Salaam Dodoma
Exchange rate: 1 US$ = [a] 10 Jul 2018PPP Exchange rate (Local currency/PPP$) 1 Tanzanian shilling = [b]Inflation 2016 [c] | Inflation 2017 [c] | Inflation 2018 [c]
2 272.73 Tanzanian shilling 708.405.00 | 5.32 | 4.84
Population [d] | Urban population size [d]Population growth rate [d] | Urbanisation rate [e]Percentage of the total population below National Poverty Line 2012 [f]Unemployment rate 2014 [g]
59 091 392 | 19 244 7093.22% | 5.22%
28.0%10.3%
GDP (Current US$) 2017 [g] | GDP growth rate annual 2017 [h]GDP per capita (Current US$) 2017 [g]GNI per capita (Current US$) 2017 [i]Gini co-efficient 2016 [j]HDI global ranking 2015 [k] | HDI country index score 2015 [k]
US$52 090 million | 7.1%US$900US$90037.80151 | 0.531
Is there a deeds registry? Number of residential properties that have a title deed [l]Lending interest rate [m]Mortgage interest rate [m] | Mortgage term (years) [m]Downpayment [m]Mortgage book as a percentage of the GDP [m]Estimated number of mortgages Price to Rent Ratio in City Centre [n] | Outside City Centre [n]Gross Rental Yield in City Centre [n] | Outside City Centre [n]Construction as a % of GDP [o]
Yes758 67917.91%17% | 1010%3.30%4 20915.23 | 12.066.56% | 8.3%12.50%
What is the cost of standard 50kg bag of cement? What is the price of the cheapest, newly built house by a formaldeveloper or contractor? (Local currency) [p]What is the price of the cheapest, newly built house by a formaldeveloper or contractor? (US$) [p]What is the size of this house (m2)? [p]What is the average rental price for this unit (US$)? What is the minimum stand or plot size for residential property? [q]
US$6.38
37 966 107 Tanzanian shilling
US$16 70560m2
n/a400m2
Ease of Doing Business Rank [r]Number of procedures to register property [r]Time to register property (days) [r]Cost to register property (as % of property value) [r]
137867 days5.20%
NB: Figures are for 2018 unless stated otherwise.
[a] Coinmill[b] World Bank World Development Indicators[c] Statista.com[d] Worldometers[e] Central Intelligence Agency (CIA) World Factbook[f] World Bank Open Data[g] Trading Economics[h] Focus-economics.com[i] Indexmundi[j] Knoema.com[k] Countryeconomy.com[l] Tanzania Ministry of Lands, Housing and Human Settlements Development[m] Bank of Tanzania[n] Numbeo[o] World Bank Doing Business [p] Tanzaniainvest.com[q] Watumishi Housing Company [r] World Bank Doing Business
Member organisations of the African Union for Housing Finance (AUHF):National Mortgage Bank Plc Tanzania Tanzania Mortgage Refinance Company LtdWatumishi Housing Company

254
55 percent reported in 2009. The take-up of digital financial services remainedone of the main drivers of access to financial services in Tanzania, with the rate ofmobile phones adoption within households being reported at 86 percentcountrywide in 2017.6 Findex 2017 reports that the use of mobile money (whichhas been centred in East Africa) has increased to 21 percent of adults in Sub-Saharan Africa, almost twice the number reported in 2014 and the highest of anyregion in the world.
FinScope 2017 further pointed out that 16.7 percent of adult Tanzanians have oruse bank services with 48.6 percent using other formal services (such as mobilemoney, microfinance or SACCOS). This is an increase compared to 14 percentand nine percent reported in 2013 and 2009 respectively.
In 2010, the BOT issued regulations for a credit reference bureau within theframework of the Bank of Tanzania Act of 2006. To date BOT has registered twocredit reference bureaus and has made using credit bureau reports mandatory duringa bank’s loan appraisal process. According to the 2018 World Bank Doing BusinessReport, Tanzania ranked 55th in ease of getting credit which negatively impacts onaccessibility to housing finance due to the cumbersome processes involved. Moreover,only 6.2 percent of the adult population is covered by credit bureaus.
Tanzania’s mortgage market is among the smallest in the East African region (theratio of outstanding mortgage debt to GDP is 0.33 percent as at 31 March 2018).According to BOT, the mortgage market recorded an annual growth rate inmortgage loan balances of six percent between March 2017 and March 2018. Akey element in the growth of the mortgage market has been the provision oflong-term funding by the Tanzania Mortgage Refinance Company (TMRC) whichwas established in 2010 under the Housing Finance Project to expand access toaffordable housing finance in Tanzania. As part of its strategy to strengthen itsfunding base and ensure its long-term sustainability, on 25 May 2018 TMRC offeredthe first tranche of a TZS 12 billion (US$5.28 million) five-year corporate bond tothe public (out of its total note programme of TZS 120 billion (US$52.8 million).7
By 31 March 2018, TMRC had extended TZS 91.1 billion (US$40.08 million) tocommercial banks in a bid to facilitate mortgage lending. TMRC lending made27 percent of the total outstanding mortgage book in the market as at 31 March2018. Since the creation of the TMRC, mortgage loans’ average duration hasincreased from five to 10 years to 15 to 20 years, with typical rates offered bylenders for the mortgage product currently varying between 15 percent and19 percent.
In addition, the International Finance Corporation, in its efforts to support growthof the private sector in Africa through investments and advisory services, injectedTZS 2.52 billion (US$1.11 million) equity investment in First Housing Finance(Tanzania) Limited, a greenfield mortgage finance bank set up in partnership withBank M Tanzania Limited, HDFC India and prominent investors. The company waslicensed as the first housing finance company in Tanzania in August 2017 andofficially launched its operations on 23 October 2017 with a focus of providinglong-term housing solutions for the citizens of Tanzania. As of 31 March 2018 thecompany had issued loans totalling TZS 315.7 million (US$138 918).
A slowdown in credit growth and rising trends on non-performing loans has beenexperienced within the banking sector since 2017. As at 31 March 2018, totalmortgage debt stood at TZS 340.92 billion (US$150 million) and 4 209 mortgages,compared to 31 December 2017 when the mortgage debt stood at TZS 344.84billion (US$151.73 million) with 4 714 mortgages. The average loan size as at31 March 2018 was TZS 81 million (US$35 640), a decrease from 31 December2017 when the average loan size was TZS 82.2 million (US$36 168). The loan tovalue requirement for mortgage loans currently stands at 90 percent as per therevised Mortgage Finance Regulations issued in 2015.
Given affordability levels, the microfinance sector is especially important inaddressing housing supply in Tanzania and is growing steadily. Some of theinstitutions offering housing microfinance include DCB Commercial Bank, EFCTanzania Microfinance Bank, Yetu Microfinance Bank and Akiba Commercial Bank.Offered loan amounts usually range between TZS 1 million (US$440) to TZS 50million (US$22 000) for a term ranging between one to five years at an interestrate of 17 percent with residential licences being mostly used among other
collateral. In 2011, a Housing Microfinance Fund (HMFF) was established as one ofthe components of the Housing Finance Project with a US$3 million contributionfrom the World Bank. An additional US$15 million was extended for the HMFF(out of the US$60 million extended for the Housing Finance Project) in March2015 to make a total fund of US$18 million. As of 31 March 2018, TZS 11.5 billion(US$5 million) had been disbursed under the fund to various banking institutionsto facilitate issuance of housing microfinance loans to final borrowers.
AffordabilityAccording to the Integrated Labour Force Survey of 2014, as carried out by theNational Bureau of Statistics (NBS), the working age population in 2014 comprisedof 25.8 million people of which 86.7 percent were economically active, mostly inrural areas. In addition, according to the 2015 Formal Sector Employment andEarnings Survey by the NBS, the total number of employees in the formal sectorin Tanzania mainland increased to 2.3 million in 2015 from 2.1 million in 2014. Thesurvey also revealed that in 2015 24.7 percent of employees earned monthlywages from TZS 300 001 (US$132) to TZS 500 000 (US$220), with only fourpercent of employees earning monthly wages above TZS 1.5 million (US$660).According to a World Bank report, Tanzania’s workforce is expected to grow to40 million workers who will need productive jobs by 2030. The share of thepopulation employed in emerging sectors is expected to increase to 22 percentwhereas the average income per worker is expected to only increase to US$1 900by 2030.8 With almost 66 percent of paid employees earning a mean monthlyincome of less than TZS 500 000 (US$220), the average mortgage size of TZS 114million (US$51 454.07) is high, indicating that most clients are high income earnerswith the majority of households financing their housing through cash sourced fromhousehold savings, microcredit loans and personal loans. A number of NGOs9
cater to the lower income market segments, but their reach is insufficient to meetthe scale of demand.
According to a 2018 Cost of Living study by Numbeo, a Dar es Salaam residentpays the largest chunk of his/her earnings (31.1 percent) on house rents than onany other basic commodity that is needed to survive. The study also states thatat least 27.6 percent of an average Tanzanian’s earnings is spent on rent – leavingthe remaining 72.4 percent for other basic needs.10
For building materials, a 50kg bag of cement costs US$6.38 (Grade 42.5R) and ismore expensive in rural areas. A standard sheet of surrogated iron for roofing,gauge 28, is US$8.14, gauge 30 is US$7.70 and gauge 32 is US$7.48. The minimumplot size for residential property in urban areas is 400m2. Prices quoted for twoto three-bedroom houses (60-121m2) constructed for civil servants underWatumishi Housing Company’s countrywide project (first phase) ranged betweenTZS 38 million (US$16 705) and TZS 109 million (US$47 960) VAT exclusive.
Housing supplyTanzania still suffers from a shortage of good quality and affordable housing. Thecurrent housing deficit is estimated at three million housing units valued at US$180billion coupled with a 200 000 unit annual demand with a projected combinedcost of US$12 billion.11 With a rapidly growing urban population, about83 percent of Dar es Salaam residents still live in informal communities.12 Thelatest household budget survey for Tanzania for year 2011/12 published in July2014 by the NBS revealed that 18 percent of the households had a connectionto the electricity grid (up from 12 percent reported in 2007). Coverage by thegrid continued to be concentrated in Dar es Salaam (68.1 percent) and otherurban areas (34.7 percent) with rural areas having coverage of only 3.8 percentin 2011/12.
The survey further revealed that in 2011/12, nearly 68 percent of the householdslived in houses with modern roofs (55 percent in 2007). Similarly, 46 percent ofhouseholds lived in houses with modern walls in 2011/12 (35 percent in 2007).
For home ownership, the survey showed that more than 75 percent of householdsin Tanzania Mainland owned the houses in which they were currently living.Ownership in rural areas, urban areas and Dar es Salaam was 89.3 percent,57.9 percent and 37.1 percent respectively. Also, about 17.4 percent of householdswere living in privately rented houses, mostly in Dar es Salaam where more thanhalf of the households were living in privately rented dwellings.

Africa Housing Finance Yearbook 2018
255
The National Housing Corporation (NHC) announced in 2011 that it was raisingits budget from US$23 million to US$230 million to increase the scale of deliveryin the country. By 30 June 2017 NHC reported to have a balance sheet worthUS$2.1 billion and US$306 million worth of ongoing projects in real estate. NHC’smajor ongoing projects in Dar es Salaam include the 711 Kawe, MwongozoHousing Estate, Morocco Square and Victoria Place. The Kawe project is a satellitecity being constructed from a US$2 billion loan secured from Trade DevelopmentBank (the financial arm of COMESA), which will involve 500 buildings and isexpected to become the busiest centre in Dar hosting about 50 000 people,operating 20 hours a day. The first phase of the project has already begun withthe construction of 262 housing units and other amenities. The MwongozoHousing Estate is located in Gezaulole Kigamboni and consists of 221 2-3bedroom town houses priced between TZS44.7 million (US$19 668) andTZS128.9 million (US$56 716) excluding VAT. Construction is at final stages withunits almost sold out. The Morocco Square project was launched in October2015 and consists of four blocks including a shopping mall for different commercialuses. Construction is in progress with the project reported to be selling fastbecause of its nature and location. The project is targeting the high-end marketwith three to four-bedroom units sold at prices ranging between TZS 592.8 million(US$260 832) and TZS 921.9 million (US$405 636) VAT inclusive. The VictoriaPlace located within the Victoria area along the new Bagamoyo road is a mixed-use project at completion stage, with 88 three to four-bedroom duplexapartments priced between TZS 287.7 million (US$126 588) to TZS 456.3 million(US$200 772) VAT inclusive, targeting the high end and commercial space for sale.
In line with the government’s decision to move its administrative functions to thecapital city of Dodoma, NHC introduced a mega project of building the LyumbuSatellite Centre in Dodoma in December 2016. The project includes theconstruction of 300 houses on NHC-owned land, located at the Lyumbu area inDodoma Municipality. The first phase commenced in December 2016 withconstruction of 300 three-bedroom stand alone housing units (45 units of 79m2,210 units of 85m2 and 45 units of 115m2) and other associated facilities. Theproject has been designed to suit the urban living environment targeting middleand low income groups with all important services and amenities. In December2017 the President of the United Republic of Tanzania inaugurated 150 houseswhich are part of the 300 houses to be built at the satellite centre. As of 31 March2018, construction of 151 units had been completed with construction of theremaining 149 units already commenced and in progress.
Likewise Watumishi Housing Company (WHC), a real estate investment trustowned by pension funds continues with the implementation of the Public ServantsHousing Scheme, in which 50 000 affordable housing units are expected to beconstructed in five phases. Implementation of the first phase started in July 2015with an expected completion date of September 2018. A total of 760 units willbe constructed under phase one. By the end of April 2018 construction of 631houses in four regions (namely Morogoro, Dodoma, Mwanza and Dar-es-Salaam)
priced between TZS 38 million (US$16 720) and TZS 109 million (US$47 960)excluding VAT was nearing completion.
In August 2017 WHC also embarked on the Watumishi Njedengwe HousingEstate project to build 338 units in Njedengwe, Dodoma following thegovernment’s decision to relocate its administrative functions to the capital city ofDodoma over the next five years. Construction of 39 stand-alone unitscommenced early September 2017 under the first phase of the project and isexpected to be completed by September 2018. The units constructed under theproject are three-bedroom houses of 78 m2, 87 m2 and 115m2 priced betweenTZS 58 million (US$25 520) to TZS 84 million (US$36 960) VAT inclusive. Interms of sales the project has been fully booked from the end of 2017.
Property marketsAt 137th of 190 economies in the World Bank’s 2018 Doing Business Report,Tanzania ranks poorly in ease of doing business, deteriorating from a rating of132nd out of 190 economies for year 2017. It ranks 142nd in terms of ease ofregistering property, down from a rank of 132nd in 2017. It takes eight proceduresand 67 days to register a property, at a cost of 5.2 percent of the property value– compared to an average of 7.8 percent and 59.3 days for Sub-Saharan Africancountries.
A fundamental problem, however, is the lack of land titles. Only 15 percent of theTanzania total land surface is surveyed for various uses. According to FinScope2017, only three percent of adult Tanzanians have a title deed.
According to the 2018/19 Ministry of Land budget speech, the ministry hadreleased a total of 41 179 title deeds by May 2018 out of the target to release400 000 title deeds and 3 000 unit titles in year 2017/18. The ministry alsoreported it was in the final stages of changing from an analogue system ofdocumentation of land issues to the Integrated Land Management InformationSystem (ILMIS). Issuance of electronic title deeds from the ILMIS was scheduledto commence in Ubungo and Kindondoni districts from June 2018.
Although in principle rights of occupancy can be bought, sold, leased andmortgaged in Tanzania, in practice the land market is inhibited by many layers ofgovernment control. According to Shelter Afrique (2012), the formal market fortransfers requires government approval, and land received through grants mustbe held for three years before the landholder can sell the rights. The transfer ofa granted right of occupancy must be approved by the municipality and registered.A holder of a customary right of occupancy can sell the right, subject to theapproval of, and subject to any restrictions imposed by, the village council.Mortgages are regulated by formal law, and land rights must be registered beforethey can be mortgaged.13 There is a very limited formal land sale market inTanzania though this has been gaining momentum in recent years as the real estatesector keeps growing. Real estate agents involved in the formal sale of houses
PPP$40 001 – PPP$10 000 000
PPP$23 001 – PPP$40 000
PPP$12 001 – PPP$23 000
PPP$8 001 – PPP$12 000
PPP$5 001 – PPP$8 000
PPP$3 601 – PPP$5 000
PPP$2 401 – PPP$3 600
PPP$1 601 – PPP$2 400
PPP$801 – PPP$1 600
<PPP$800
- - - Average annual household income needed for the cheapest newly built house by a formal developer, 2017 Average annual household income using expenditure, 2017 (PPP$)
TANZANIA
Annual income profile for rural and urban households based on consumption (PPP$)
No. of households (thousands)
PPP$11 191
PPP$40 239
Rural Urban2 500 2 000 1 500 1 000 500 0 500 1 000 1 500 2 000 2 500
Population: 59 091 392
Urbanisation rate: 5.22%
Cost of cheapestnewly built house:
37 966 108 TZSPPP$53 594
Urban householdsthat could afford thishouse with finance:
2.53%
1 PPP$:708.4 Tanzanian
shilling
Source https://www.cgidd.com/

256
include Knight Frank, Dar Property and Prime Location to mention a few.According to the 2017/18 Africa report by Knight Frank, rental yields for residentialand commercial properties range between six percent and 10 percent with higheryields being observed on commercial properties despite an increased supply.
Policy and regulationThe Ministry of Lands, Housing and Human Settlements Development has beenmandated to administer land and human settlements in Tanzania on behalf of thePresident of Tanzania who serves as the trustee of all land. While housing development in Tanzania is guided by the National HumanSettlements Development Policy of 2000, the policy’s objectives mainly catertowards the provision of adequate shelter, an efficient land delivery system, serviceprovision and better rural housing without specifically addressing the problemswithin the housing sector. Efforts are underway to develop a housing policy thatwill address key issues surrounding the housing sector. As of May 2018, theMinistry of Lands reported that a draft housing policy has already been developedand that views are being collected from various stakeholders to further improvethe draft.
Mortgage finance in Tanzania is guided by the Mortgage Finance Act of 2008, andthe Banking and Financial Institutions (Mortgage Finance Regulations) of 2015developed for regulating mortgage finance operations for banks and housing financecompanies. The Banking and Financial Institutions (Tanzania Mortgage RefinanceCompany) Regulations, 2011 was also developed with support from the WorldBank to guide the operations of the TMRC. The National Microfinance Policy wasadopted by the government in 2000 and revised in 2017 to incorporate newdevelopments, limitations and challenges in the microfinance sub-sector. Prudentialnorms were created for microfinance institutions (MFIs) in April 2005 intended toincrease wholesale funding to MFIs and ensure their financial viability. In 2014, theBOT issued revised regulations to address the shortcomings of the 2005 regulationswhich excluded some of the MFIs from the Bank’s regulatory ambit.
OpportunitiesDespite a number of large-scale real estate development projects that continueto increase the supply of residential housing, industrial and commercial premises,a gap still exists in the supply of affordable housing and affordable housing financein the country. This presents a key area of opportunity for the government andkey stakeholders in the real estate sector to explore ways in which the supply ofaffordable housing can be enhanced to cater for its ever-increasing demand, andfor extensive use of microfinance as a source of affordable housing finance.
Opportunity also exists around the understanding and monitoring of housingneeds for delivery of effective solutions, which the government has already begunaddressing by embarking on the design of a housing information centre with thepurpose of collecting, storing and analysing housing data for forecasting housingdemand, supply and price levels in the country.
SourcesBank of Tanzania (2018). “Monetary Policy Statement 2018/2019.” June 2018.https://www.bot.go.tz/Publications/MonetaryPolicyStatements (Accessed 29 June2018).
Bank of Tanzania and Tanzania Mortgage Refinance Company (2018). TanzaniaMortgage Market Update 31 March 2018. Pgs. 1-8.
Central Intelligence Agency (CIA) (2018). “The World Fact Book – Africa,Tanzania.” 5 September 2018. https://www.cia.gov/library/publications/the-world-factbook/geos/tz (Accessed 10 September 2018).
The Citizen Reporter (2017). “Tanzania Assured of More World Bank Support.”5 Dec 2017. http://www.thecitizen.co.tz/News/Tanzania-assured-of-more-WB-support (Accessed 29 June 2018).
Demirguc-Kunt, A. et al. (2017). The Global Findex Database 2017: MeasuringFinancial Inclusion and the Fintech Revolution. The World Bank Group. Pg. 20.
Focus Economics (2018). “Tanzania Economic Outlook.” 21 August 2018.https://www.focus-economics.com/countries/tanzania (Accessed 30 August2018).
The Guardian Reporter (2017). “NHC’s Victoria Place, Morocco Square AlmostSold Out.” 1 September 2017.https://www.ippmedia.com/en/business/nhc%E2%80%99s-victoria-place-morocco-square-almost-sold-out (Accessed 3 July 2018).
Knight Frank (2018). “Knight Frank Africa Report 2017/18.”https://www.knightfrank.co.ke/research/africa-report-201718 (Accessed18 August 2018).
Masare, A. (2018). “Mortgage Refinance Company TZS12 Billion Bond ExceedsTarget by 4.3 Percent.” 24 June 2018. http://www.thecitizen.co.tz/News/TMRC-Sh12bn-bond-exceeds-target-by-4-3pc (Accessed 3 July 2018).
Maseko F. (2018). “Top 10 Fastest Growing Economies in Africa 2018.” 4 May2018. http://www.itnewsafrica.com/2018/05/top-10-fastest-growing-economies-in-africa-2018 (Accessed 1 August 2018).
Ministry of Lands, Housing and Human Settlements Development (2018).“2018/2019 Budget Speech.” June 2018. http://lands.go.tz/speeches (Accessed2 July 2018).
Morisset, J. and Haji, M. (2014). “When Good Is Not Good Enough for 40Million Tanzanians.” 9 December 2014.http://blogs.worldbank.org/futuredevelopment/when-good-not-good-enough-40-million-tanzanians (Accessed 3 July 2018).
Mushi, E. et. al. (2017). FinScope Tanzania 2017. The Financial Sector DeepeningTrust. Pgs. 27-61.
National Bureau of Statistics Tanzania (2016). “Formal Sector Employment andEarnings Survey, 2015 Tanzania Mainland.” October 2016.http://nbs.go.tz/nbstz/index.php/english/statistics-by-subject/labour-statistics/838-formal-sector-employment-and-earnings-survey-2015-tanzania-mainland(Accessed 3 July 2018).
National Bureau of Statistics Tanzania (2014). “Household Budget Survey MainReport, 2011/12.” July 2014. http://nbs.go.tz/nbstz/index.php/english/statistics-by-subject/household-budget-survey-hbs (Accessed 3 July 2018).
Numbeo Database (2018). “Cost of Living in Tanzania.” June 2018.https://www.numbeo.com/cost-of-living/country/Tanzania (Accessed 30 June2018).
Sheuya, S. A. (2010). Informal Settlements and Finance in Dar-es-Salaam,Tanzania. UN Habitat. Pg. 13.
Shelter Afrique (2012). “Study on the Housing Sector - Tanzania for ShelterAfrique.” December 2012.https://view.officeapps.live.com/op/view.aspx?src=http%3A%2F%2Fwww.shelterafrique.org%2Fwp-content%2Fuploads%2F2012%2F12%2FStudy-on-the-Housing-Sector-Tanzania-for-Shelter-Afrique (Accessed 3 July 2018).
Tanzania Mortgage Refinance Company (2018). “TMRC Launches its 5 yearsCorporate Bond Issuance Program.” May 2018.http://www.tmrc.co.tz/index.php/highlights/view/tmrc-launches-its-5-years-corporate-bonds-issuance-program (Accessed 30 June 2018).
The World Bank Group (2018). “Doing Business 2018:Tanzania.”http://www.doingbusiness.org/reports (Accessed 30 June 2018).
Worldometers (2018). “Tanzania Population.” 29 June 2018.http://www.worldometers.info/world-population/tanzania-population (Accessed29 June 2018).
Zacharia, A. (2018). “Tanzania: Race to End Housing Deficit Hots Up.” 2 April2018. https://allafrica.com/stories (Accessed 18 August 2018).
Websiteshttp://www.thecitizen.co.tz https://www.bot.go.tzhttp://www.nbs.go.tz http://lands.go.tzhttp://www.tmrc.co.tz https://www.whctz.org
1 Maseko F. (2018). “Top 10 Fastest Growing Economies in Africa 2018.” 4 May 2018. 2 Worldometers (2018). “Tanzania Population.” 29 June 2018.3 CIA (2018). “The World Fact Book – Africa, Tanzania.” 5 September 2018.4 Focus Economics (2018). “Tanzania Economic Outlook.” 21 August 2018.5 The Citizen Reporter (2017). “Tanzania Assured of More World Bank Support.” 5 Dec 2017.6 Mushi, E. et. al. (2017). FinScope Tanzania 2017. The Financial Sector Deepening Trust. Pgs. 27-61.7 Masare, A. (2018). “Mortgage Refinance Company TZS12 Billion Bond Exceeds Target by 4.3 Percent.” 24 June
2018.
8 Morisset, J. and Haji, M. (2014). “When Good Is Not Good Enough for 40 Million Tanzanians.” 9 December2014.
9 Such as TRIAS, Belgian Raiffeisen Foundation, Appui au développement autonome, KIVA, and UNITUS. Theseare working with Mufindi Community Bank.
10 Numbeo Database (2018). “Cost of Living in Tanzania.” June 2018.11 Zacharia, A. (2018). “Tanzania: Race to End Housing Deficit Hots Up.” 2 April 2018.12 Sheuya, S. A. (2010). Informal Settlements and Finance in Dar-es-Salaam, Tanzania. UN Habitat. Pg. 13. 13 Shelter Afrique (2012). “Study on the Housing Sector - Tanzania for Shelter Afrique.” December 2012.

Africa Housing Finance Yearbook 2018
257
There are 432 microfinance institution service points, serving 2 235 699 clientswith a total of CFA 163 050 million (US$283.86 million)7 in deposits andoutstanding loans to the value of CFA 144 444 million (US$251.47 million).8 TheFaîtière des Unités Coopératives d’Epargne et de Crédit is the biggest microfinancenetwork in Togo with over 500 000 members and consolidated assets ofapproximately CFA 50 billion (US$87.05 million).9
Over the past few years, the government has targeted interventions to increaseaccess to finance. In 2014 it launched several initiatives to further financial inclusion.These include the creation of the National Inclusive Finance Fund (Fonds Nationalde la Finance Inclusive – FNFI) to reach those at the bottom of the income pyramid.The FNFI developed several microfinance products specifically targeted at lowincome households, with a close to zero percent interest rate. Microfinance clientsrepresent about 43 percent of Togo’s population, one of the highest in theWAEMU region, which averages at 16 percent. Yet Togo ranked 139th out of190 countries on the “Getting Credit” indicator of the Doing Business 2017report.10 None of the microfinance networks in Togo offer housing microfinance.The financial landscape in Togo also includes two social security institutions, and12 insurance companies.11
OverviewTogo is a small country in the Gulf of Guinea that occupies an area of 56 800km2.In 2017, the population was recorded at 7 797 6941 with an annual growth rateof 2.5 percent.
Togo is part of the West African Economic and Monetary Union (WAEMU).Agriculture contributes 41 percent to the Togolese economy while the industrial,services and manufacturing sectors contribute 17 percent, 30 percent and4 percent respectively.2 Togo’s GDP slowed over the past three years with adeclining growth rate of 5.3 percent in 2015, 5.1 percent in 2016 and 4.4 percentin 2017, as a result of significant reduction in public investment and a slowdownin port activities.3 However, fiscal consolidation, as part of an ongoing InternationalMonetary Fund (IMF) structural adjustment programme,4 resulted in a slightincrease in GDP growth to 4.7 percent in 2018.5 Increased indebtedness, tofinance large scale infrastructure projects between 2012 and 2015, impactednegatively on the economic performance of the country. Debt ratio to GDPreached 76 percent, above the 70 percent WAEMU limit, which led to thenegotiation of an economic reform programme with the IMF. This programmeshould help reduce the debt ratio to 56.4 percent by 2021. In 2017, inflation was0.7 percent.6
Togo has experienced a high level of social unrest since 2017. Opposition partieshave started a wave of protests to demand constitutional change, leading to theresignation of the head of state. Mediation is under way, led by the Guinean andGhanaian presidents, with mixed results.
Access to financeTogo’s financial sector is highly concentrated, with one bank owning over one fifthof the total bank assets in the country. At the end of 2017, there were 13 banksand two financial intermediaries in Togo. These include, the Fonds Africain deGarantie des Investissements Privés en Afrique de l’Ouest and the Regional MortgageRefinancing Fund (Caisse Régionale de Garantie Hypothécaire – CRRH). The Bankingsystem is dominated by commercial banks, a third of which are government-owned. Bank of Africa Togo, Orabank, BIA-Togo and Banque Atlantique Togo arethe only banks offering mortgages. Togo is also the headquarters of the pan-African bank Ecobank.
TogoKEY FIGURES
Main urban centresLoméKpalimé
Exchange rate: 1 US$ = [a] 21 Sept 2018PPP Exchange rate (Local currency/PPP$) 1 CFA franc = [b]Inflation 2016 [b] | Inflation 2017 [b] | Inflation 2018
564.75 CFA franc228.900.85 | -0.70 | n/a
Population 2017 [b] | Urban population size 2017 [b]Population growth rate 2017 | Urbanisation rate [b]Percentage of the total population below National Poverty Line 2015 [c]Unemployment rate [d]
7 797 694 | 3 194 3252.48% | 3.72%
55.10%1.8%
GDP (Current US$) 2017 [b] | GDP growth rate annual 2017 [b]GDP per capita (Current US$) 2017 [b]GNI per capita (Current US$) 2017 [b]Gini co-efficient 2015 [c]HDI global ranking 2016 [e] | HDI country index score 2016 [e]
US$4 813 million | 5.57%US$617US$61043.10166 | 0.487
Is there a deeds registry? Number of residential properties that have a title deed Lending interest rate [d]Mortgage interest rate 2013 [f] | Mortgage term (years) 2013 [f]DownpaymentMortgage book as a percentage of the GDPEstimated number of mortgages Price to Rent Ratio in City Centre | Outside City Centre Gross Rental Yield in City Centre | Outside City Centre Construction as a % of GDP
yes47 3265.30%9.13% | 5n/an/an/an/a | n/an/a | n/an/a
What is the cost of standard 50kg bag of cement? What is the price of the cheapest, newly built house by a formaldeveloper or contractor? (Local currency)What is the price of the cheapest, newly built house by a formaldeveloper or contractor? (US$) What is the size of this house (m2)? What is the average rental price for this unit (US$)? What is the minimum stand or plot size for residential property?
US$6.96
7 000 000 CFA franc
US$12 14632m2
US$78150m2
Ease of Doing Business Rank [g]Number of procedures to register property [g]Time to register property (days) [g]Cost to register property (as % of property value) [g]
1565283 days6.00%
NB: Figures are for 2018 unless stated otherwise.
[a] Coinmill.com[b] World Bank World Development Indicators [c] National Statistical Office Togo[d] Trading Economics[e] UNDP Development Indicators[f] Central Bank of West African States[g] World Bank Doing Business

258
The total outstanding loans amounted to CFA 1 066 billion (US$ 1.86 billion) in2017, a slight decrease from the 2016 level, representing 38 percent of the 2018GDP.12 There are limited housing finance products available in the market. Theseinclude loans for land acquisition, loans for housing upgrades and loans for thepurchase of housing. For example, Bank of Africa Togo launched a housing savingsproduct to encourage its clients to save at least CFA 20 000 (US$ 34.82) a monthover at least 36 months (with an interest rate of 4.5 percent a year), and thenapply for a housing loan as high as six times the savings. Conditions of access tothese products vary from one bank to the next, but the loan period is usuallybetween four and 10 years. The interest rate is between 11 and 12 percent onaverage, while guarantees requested by the lending bank range from a lien on thepurchased land or house to life insurance. These parameters will likely changewith the World Bank funded WAEMU Affordable Housing Finance Project, whichintends to extend mortgage terms, decrease interest rates and extend access tohousing finance to those who do not have a regular income. Some banks requesta proportion of up to five percent of the loan as a guarantee. In general, theseloans are available to people who are formally employed with regular, declarableincomes.
Lomé, the capital city, is also headquarters of the regional mortgage refinancingfacility, Caisse Régionale de Refinancement Hypothécaire (CRRH), a regional liquidityfacility created in 2010 to mobilise the long-term resources required by partnerbanks to extend mortgage repayment periods. In February 2017, the InternationalFinance Corporation signed a CFA 1.72 billion (US$3 million) equity investmentagreement with CRRH. In October 2017, the World Bank Group signed aUS$155 million (consisting of US$20 million in grant funding) financial agreementfor the WAEMU Affordable Housing Finance Project with the West AfricanDevelopment Bank to support the CRRH’s capacity to provide long-termresources to improve access to housing finance in the region. The CRRH itselfsuccessfully concluded its seventh bond on the regional financial market, mobilizingCFA 25.1 billion (about US$43.70 million) in November 2017, bringing to CFA132 billion (US$229.81 million) the total resources the institution mobilised tosupport housing finance in the region since its creation.
AffordabilityAccording to the World Bank’s World Development Indicators 2018, the grossnational income per capita was estimated at US$1 453 (in PPP $). The minimumsalary in Togo has remained at CFA 35 000 (US$60.93) since 2013. The minimumsize of a plot is 150m2 for a minimum floor area of 40m2. On average, the landprice in the country was estimated at CFA 8 500 (US$14.80) per m2, while thebuilding cost of a medium-size house was estimated at CFA 75 00013 orUS$130.57 per m2 before taxes. Despite political unrest and a declining economicsituation, 2017 and 2018 saw major developments in the housing and housingfinance sectors. In October 2017, the World Bank Group signed a US$155 millionfinancing agreement with the West African Development Bank (BOAD – BanqueOuest-Africaine de Développement) and the regional mortgage refinancing facility,Caisse Regionale de Refinancement Hypothecaire (CRRH). The IFC has investedUS$9 million (CFA51 billion) in CRRH bonds, with the objective of leveragingabout US$500 million to support affordable housing finance in WAEMU.
Housing supplyThe Government of Togo adopted a new Draft Land Code and launched aprogramme to provide Togolese cities with master plans for urban development.A social housing programme has also been introduced, with the goal of reaching2 500 housing units per year and 20 000 units by 2022.14
A few modest housing developments have recently been launched in Lomé. The“Cité des Anges” has delivered several hundreds of vacant plots and 156 housingunits of different sizes. There is also a new 20-unit complex, mostly targeted atupper income households, located on the west side of Lomé. The project is beingcarried out by N Real Estates, a consortium of Togolese and foreign nationals. CitéMokpokpo is a project launched by the Government of Togo, in partnership withprivate investors. The project is currently under development with plans to deliver1 000 social housing units. The project will be completed as a public privatepartnership with the Ivorian real estate operator, Societe Ivoirienne de PromotionImmobilière and three local banks, namely Orabank Togo, BIA Togo and BanqueAtlantique. Partner banks will offer mortgage loans over a 15 to 20-year term ata 7.75 percent interest rate, with no down payment required. The housing units
will cost between CFA seven million and CFA 17 million (between US$12 187and US$29 596) and are exclusively targeted at civil servants. The project, whichis partly located in Adidogome in the north-western part of Lomé, will comprise420 villas and 120 apartments. The project is well under way but has fallen behindthe planned completion schedule. Other projects include the WellCity Project,with 1 500 housing units planned in Adeticopé, in the Greater Lomé region. Theproject is promoted by Derou & Partners, an international holding company,through its branch, Confortis International. The project is supported by local banks,Coris Bank International, Orabank Togo, Ecobank, Bank of Africa and ShelterAfrique. The first phase of 500 units will be completed in 2020. Potentialhomeowners have several modalities of purchase, including a 20-year mortgageproduct with partner banks, at an interest rate of between 7.75 and 8.5 percent.
In 2018, the Togo National Social Security Fund (CNSS) launched the ResidenceRenaissance Project in Lomé. The project will provide 394 luxurious villas and205 apartments for a total investment of CFA 94 billion (US$164 million). Theunits will be sold at between CFA 18.5 million (US$32 208) and CFA 1.9 billion(US$3.3 million).15 The CNSS has a number of housing investments, including471 villas at the Residence du Benin in Lomé, 23 villas in Kara (in the center ofthe country), 193 villas and 24 apartments in Baguida (a few kilometers fromLomé) and 99 villas in the Cité OUA 2000 development in Lomé. The RésidenceEsperanza project was delivered by CECO Immo. The project consists of 200housing units, is in Sotouboua and is targeted at middle income households. Eachof those units was advertised at between CFA 32 million (US$55 710) and CFA50 million (US$87 048).
Besides these projects, the government has signed partnerships with severalorganisations and corporations to supply housing. These include deals with PolyGroup China, for the delivery of 10 000 housing units; German company TKMtowards the construction of affordable housing units and MESSIBAT Togo Sarl todeliver another 10 000 housing units to the market. At this stage, only frameworkagreements have been signed with these corporations.
The cost of certain construction materials can be sourced at a relatively low price.A galvanised sheet of iron for roofing costs between CFA 3 200 (US$5.57) andCFA 5 500 (US$9.58), depending on thickness, while a 50kg bag of cement costsCFA 4 000 (US$6.96). The cheapest housing unit built by a developer is aroundCFA seven million (or about US$12 186).16 The vast majority of Togolese cannotafford this, even for large parts of the formally employed population. This haspushed most low income households to the periphery of urbanised areas, wherethey develop informal settlements and slums. This can be illustrated in thenorthern outskirts of Lomé, Tsévié.
Property marketTogo’s formal property market is slowly developing, but outdated landadministration legislation as well as lengthy and costly property registrationprocedures hinder optimal functioning of the market. Registering a property stillrequires five procedures, takes 283 days on average and costs 9.1 percent of theproperty value. The ranking of Togo on the “Registering Property” indicator ofthe 2018 Doing Business index remained at 182nd out of 188 countries.18 Togoscores only 6.0 on the Quality of Land Administration Index, on a 0-30 scale.However, there is a significant improvement compared to six years ago, whenregistering a property took as many as 49 procedures, involved 10 governmentagencies and cost as much as 25 percent of the property value.
There have been major improvements in ensuring land security, with the launchof a national cartographic database, covering the whole country, to establish anational cadastre. An audit of all land in Lomé was launched in early 2018 and isplanned to be rolled out in all districts by the end of the year. In the meantime,the Central Directorate of Cartography and Cadastre has improved ontransparency of land administration by making available a new service to citizenswhich allows them, for a CFA 2 000 (US$4) fee, to check the status and ownershipof any given piece of land before any transaction is made on it. The pending newLand and Domanial Code will further improve transparency and modernise landadministration. The draft legislation was adopted by the government in May, andis awaiting Parliament’s vote. The process is supported by the Millennium ChallengeCorporation.

Africa Housing Finance Yearbook 2018
259
Obtaining a construction permit became mandatory in 2007. The rule is jointlyenforced by the Togolese Order of Geometers, the Ministry of UrbanDevelopment and Housing, and several municipalities. Yet, it is still very expensiveto access these permits at a cost of 13.5 percent of the value of the property.People continue with direct sale of properties based on a simple sales agreementin the informal market. Sometimes, for those who can afford it, the assistance ofa notary is procured. This is likely to change with the Land and Domanial Code.
There are a few housing brokers operating on the Togolese housing market.Among those are Phillison and Co., Immowants, Le Logis and ConfortisInternational SA.
There is a growing but informal rental market, mainly in the urban areas of Lomé,Kara, Kpalime, Attakpame, Sotoubua, Sokode and Aneho. This market is operatedby individuals who build and rent out their houses. Rental values have increasedsignificantly due to high demand for housing in urban areas, while salaries, especiallyin the public sector, have not changed much over the past 30 years. In Lomé, oneneeds between CFA 45 000 (US$78.34) and CFA 150 000 (US$ 261.14) to renta one-bedroom apartment.19
Policy and regulationMost of the existing policies and regulations were enacted between the 1950sand 1970s and were guided by the government’s willingness to provide adequateand affordable housing to every Togolese.
Government supply of housing is mandated under the National Urban SectorPolicy Statement, a Housing Policy Statement, and a newer National HousingStrategy. The focus of the latter is to reorganise the housing sector through theadoption of adequate legislation, the improvement of the existing real estate stockand to provide all income segments, particularly low and middle incomehouseholds, with affordable housing that meets minimum safety, occupancy,structural stability and temporal standards. The strategy stipulates that thegovernment will contribute to this demand, every year, by facilitating the supply(through public private partnerships and subsidy programmes) of 2 500 housingunits. So far, the only development achieved under this mandate is the CitéMokpokpo. However, there are several public private partnership agreementssigned by the government that are yet to materialise.
Over the past three years, significant steps have been taken to strengthen thepolicy and regulation environment for land, housing development and access tofinance. These include: the adoption of a decree to ease delivery (reduction oflength of procedures and cost) of construction permits in 2016 and the adoptionof a new Land and Domanial Code by the Government in March 2018 with thegoal of modernising and increasing transparency in land administration. TheMillennium Challenge Corporation, which is supporting land reform in Togo, hasmade it a requirement that the new Land and Domanial Code be adopted by
Parliament. Togo also adopted the WAEMU Uniform Law on Credit Bureaus (LawN°2016-005 of March 14, 2016), which was modified in May 2018 to strengthenprotection of personal data.
OpportunitiesThe government has engaged in several important economic and fiscal reformswhich should continue improving the business environment, but also the road andenergy infrastructure. Likewise, important reforms have been launched tomodernise land administration, but also develop a master plan for urbandevelopment in all cities. The government has therefore created the requiredeconomic environment for investment in the housing sector. Government’sambitions for the housing sector have been clearly spelt out in Prime MinisterKlassou’s General Policy Speech in June 2015, which is to support the provision ofhousing to the Togolese. This delivery is to take an incremental approach, startingwith the 1 000 unit Cité Mokpokpo development at Adidogome, on the outskirtsof Lomé. Subsequent agreements have been signed with other local andinternational developers, but those will not be sufficient to address the housingneed.
The scarcity of developers leaves room for newcomers to take advantage of theseopportunities. With a high demand for housing from the government, severalcompanies and organisations, including Shelter Afrique, have been positioningthemselves to take advantage of a market that is still untapped. The Moroccanreal estate investment group Addoha expressed interest in investing in cementplants as well as the housing sector. The US$155 million World Bank-fundedAffordable Housing Finance Project will facilitate access to affordable housingfinance to more households. Through this, affordable resources will be availableto households, especially those with low revenues, including those from theinformal sector, through support to microfinance institutions. This will bring majorchanges in the housing finance sector in Togo.
- - - Average annual household income needed for the cheapest newly built house by a formal developer, 2017 Average annual household income using expenditure, 2017 (PPP$)
TOGO
Annual income profile for rural and urban households based on consumption (PPP$)
Source https://www.cgidd.com/
PPP$40 001 – PPP$10 000 000
PPP$23 001 – PPP$40 000
PPP$12 001 – PPP$23 000
PPP$8 001 – PPP$12 000
PPP$5 001 – PPP$8 000
PPP$3 601 – PPP$5 000
PPP$2 401 – PPP$3 600
PPP$1 601 – PPP$2 400
PPP$801 – PPP$1 600
<PPP$800No. of households (thousands)
PPP$9 393
PPP$33 159
Rural Urban140 120 100 80 60 40 20 0 20 40 60 80 100 120 140
Population: 7 797 694
Urbanisation rate: 3.72%
Cost of cheapestnewly built house:
7 000 000 XOFPPP$30 581
Urban householdsthat could afford thishouse with finance:
2.23%
1 PPP$: 228.9 CFA franc

260
SourcesAfDB (2018). African Economic Outlook 2018. https://www.afdb.org/fileadmin/uploads/afdb/Documents/Publications/African_Economic_Outlook_2018_-_EN.pdf. (Accessed 4 Sept 2018).
Manlan, Olivier. Perspectives Économiques en Afrique 2018: Togo. AfricanEconomic Outlook 2018: African Development Bank.https://www.afdb.org/fileadmin/uploads/afdb/Documents/Generic-Documents/country_notes/Togo_note_pays.pdf (Accessed 4 Sept 2018).
BCEAO (2018). Annuaire Statistique 2017. Banque Centrale des Etats del’Afrique de l’Ouest (BCEAO), Dakar, Août 2018.https://www.bceao.int/sites/default/files/2018-08/Annuaire%20statistique%20de%20la%20BCEAO%20-%202017.pdf(Accessed 19 Aug 2018).
BCEAO (2018). Statistical Yearbook 2017: BCEAO: Dakar, August 2018.
United Nations, Department of Economic and Social Affairs, Population Division(2017). World Population Prospects: The 2017 Revision, custom data acquiredvia website.
World Bank Group - Open Knowledge Repository. World DevelopmentIndicators 2017. https://openknowledge.worldbank.org/handle/10986/26447(Accessed 4 Sept 2018).
UNDP Human Development Reports. Togo: Human Development Indicators.http://hdr.undp.org/en/countries/profiles/TGO (Accessed 19 Aug 2018).
The World Bank – Data. Togo https://data.worldbank.org/country/togo(Accessed 19 Aug 2018).
Websiteswww.wellcity.tg http://www.camimo.com/ https://lacitedesanges.com/http://urbanisme.gouv.tg/ http://www.dadc.gouv.tg
1 UN-DESA (2017). World Population Data Prospects 2017. https://esa.un.org/unpd/wpp/DataQuery/ (Accessed 19 August 2018).2 Global Edge (2017). Togo Country Factsheet. US Commercial Services.3 AfDB (2018). African Economic Outlook 2017. Togo Country Profile. Pg. 2.4 World Bank. The World Bank in Togo - Overview. http://www.worldbank.org/en/country/togo/overview (Accessed on 19 August 2018).5 International Monetary Fund (2018). Second Review Under the Extended Credit Facility Arrangement and Request for Modification of Performance Criteria. African Department. Pg. 4.6 World Bank (2017). The World Bank in Togo – Overview.7 All conversion of CFA to US$ are based on the conversion rate of US$ 1 = CFA 574.39, as of 19 August 2018 on http://coinmill.com/8 BCEAO (2018). Principaux indicateurs des SFD de l'UMOA au 31/12/2017. https://www.bceao.int/sites/default/files/2018-04/Indicateurs%20%C3%A0%20fin%20d%C3%A9cembre%202017.pdf (Accessed 19 August 2018).9 FUCEC Togo (2018). http://www.fucec-togo.com/presentation-generale/ (Accessed 19 August 2018).10 World Bank (2018). Doing Business 2018. Reforming to create jobs. Economy profile Togo. http://www.doingbusiness.org/~/media/WBG/DoingBusiness/Documents/Profiles/Country/TGO.pdf (Accessed 19 August 2018). 11 AfDB (2018). African Economic Outlook 2017. Togo Country Profile. Pg.9.12 BCEAO (2018). Données Economiques et Financières. https://edenpub.bceao.int/ (Accessed 19 August 2018).13 BCEAO (2018). Annuaire Statistique 2017. Banque Centrale des Etats de l’Afrique de l’Ouest (BCEAO), Dakar, Août 2018. Pg.153.14 Government of Togo (2018). Togo : 44% d'urbanisation et plus de 20 000 logements sociaux à l'horizon 2022. https://republiquetogolaise.com/politique/2003-1663-togo-44-durbanisation-et-plus-de-20-000-logements-sociaux-a-lhorizon-
2022 (Accessed 19 August 2018).15 CNSS Togo (2018). Residence Renaissance: Un harmonieux cadre de vie. https://www.r-renaissance.tg/#top (Accessed 19 August 2018).16 Price offered by developers for the Mokpokpo Estate, a new Government project being implemented in public private partnership with the Societe ivoirienne de promotion immobilière.17 World Bank (2018) Doing Business - Togo. http://www.doingbusiness.org/data/exploreeconomies/togo (Accessed 4 September 2018).18 World Bank (2018). Doing Business 2018.19 Numbeo (2018). Cost of living in Togo. https://www.numbeo.com/cost-of-living/country_result.jsp?country=Togo (Accessed 19 August 2018).

Africa Housing Finance Yearbook 2018
261
compartmentalisation and deregulation of the banking sector (pursuant to theLaw No. 2001-65 on credit institutions) have allowed new actors to strategicallyposition themselves in this market. This move was mainly due to the decliningperformance of the Housing Bank whose share of the home purchase savingscollection market dropped from over 80 percent in 2003 to less than 60 percentin 2014, as well as the increasing attractiveness of the housing finance market.Strategic interest in this market has led to fiercer competition between creditinstitutions that frequently launch dedicated promotional campaigns such as theMaskan Al Baraka advertising campaign. Maskan Al Baraka is a sharia complianthousing loan for people who have accumulated home savings for four years atleast. It can be used to finance a home purchase, land acquisition, construction, orextension of an existing home. The housing loan amount that can be given underMaskan Al Baraka is twice the amount of accumulated savings with a ceiling ofTD 100 000 (US$40 290). Maskan Al Baraka can finance up to 80 percent of thehome value over 15 years.
Overall, product offerings in this market have become largely undifferentiated, butconditions of access to housing finance have considerably expanded through thelaunch of specialised products tailored to various categories of clients includinghigh and middle income, salaried workers, but also lower income families who canbenefit from subsidised loans.8
OverviewFollowing the 2011 revolution and the adoption of a new constitution and theelection of a new government in 2014, there was an expectation that there wouldbe increased growth in the economy. While the economic growth has not yetmatched expectations, there are signs of recovery. Tunisia also still ranks highly inNorth Africa in terms of economic and human development.
In 2017, GDP grew by 1.9 percent, up from about 1.1 percent in 2016.1 Netnational savings (as a percentage of gross national income) declined from aboutsix percent (2016) to 0.1 percent (2017).2 Public debt deteriorated from 61.9percent of GDP in 2016 to 69.9 percent of GDP in 2017, mainly due to thegrowth in external debt.3
The higher increase in GDP reflects on the job market. The unemployment ratedropped from 14 percent in 2016 to 13 percent in 2017.4 Women, youth (ages15-24) and graduates continue to have higher unemployment rates than average.
Housing is traditionally the second largest item of expenditure for Tunisianhouseholds after food. In 2017 it remained so.5 Although housing is increasinglyavailable, its affordability is increasingly problematic, especially since 2011. Increaseddemand, more onerous liquidity requirements for mortgage lenders, and thelimited availability of housing microfinance inhibit the growth of the housing financemarket. The depreciation of the Tunisian Dinar as well as the rise in inflation alsoraised the cost of living and affected the ability of households to access finance.6
Access to financeTunisia has a reasonably well-developed financial sector, which is regulated by theCentral Bank of Tunisia. Over the past four decades, a sophisticated mortgage-based housing finance system has developed. There are a large number of financialinstitutions offering loan products for housing. By the end of 2016, there wereabout 23 domestic banks and eight microfinance institutions among other formalfinancial institutions. There are also a number of financial access points availableto consumers including 1 774 bank branches, 73 of which were opened in 2016.7
Until the early 2000s, the publicly-owned Housing Bank (Banque de l’Habitat),established as a result of the National Housing and Savings Fund’s shift to UniversalBank, had been the single player in the mortgage market. The de-
TunisiaKEY FIGURES
Main urban centresTunisSfax
Exchange rate: 1 US$ = [a] 24 August 2018PPP Exchange rate (Local currency/PPP$) 1 Tunisian dinar = [b]Inflation 2016 [b] | Inflation 2017 [b] | Inflation 2018 [c]
2.74 Tunisian dinar0.705.56 | 5.73 | 7.5
Population 2017 [b] | Urban population size 2017 [b]Population growth rate 2017 [b] | Urbanisation rate 2017 [b]Percentage of the total population below National Poverty Line 2015 [d]Unemployment rate [e]
11 532 127 | 7 756 3931.1% | 1.44%
15.2%15.4%
GDP (Current US$) 2017 [b] | GDP growth rate annual 2017 [b]GDP per capita (Current US$) 2017 [b]GNI per capita (Current US$) 2017 [b]Gini co-efficient 2010 [b]HDI global ranking 2015 [f] | HDI country index score 2015 [f]
US$40 257 million | 1.96%US$3 496US$3 50035.8097 | 0.725
Is there a deeds registry? Number of residential properties that have a title deed Lending interest rate Mortgage interest rate | Mortgage term (years)DownpaymentMortgage book as a percentage of the GDPEstimated number of mortgages Price to Rent Ratio in City Centre | Outside City Centre Gross Rental Yield in City Centre | Outside City Centre Construction as a % of GDP [f]
Yesn/a7.78%8% | 25n/an/an/a24.16 | 20.164.14% | 4.96%3.78%
What is the cost of standard 50kg bag of cement? What is the price of the cheapest, newly built house by a formaldeveloper or contractor? (Local currency)What is the price of the cheapest, newly built house by a formaldeveloper or contractor? (US$) What is the size of this house (m2)? [g]What is the average rental price for this unit (US$)? What is the minimum stand or plot size for residential property?
n/a
69 870 Tunisian dinar
US$25 50050m2
n/an/a
Ease of Doing Business Rank [h]Number of procedures to register property [h]Time to register property (days) [h]Cost to register property (as % of property value) [h]
88439 days6.10%
NB: Figures are for 2018 unless stated otherwise.
[a] Coinmill.com[b] World Bank World Development Indicators[c] Tunisia National Institute of Statistics [d] Knoema.com[e] UNDP Development Indicators[f] Trading Economics[g] Oxford Business Group [h] World Bank Doing Business
262
While private lending is focused on high to middle income households, there havebeen savings-for-housing programmes for the formally employed since the 1970s.The Housing Bank is the exclusive manager of a state-subsidised housing loan forlow income salaried people called FOPROLOS (Fonds pour la Promotion desLogements aux Salariés or Housing Promotion Fund for Salaried People). Loanrates for mortgages range from 2.5 percent to 5.75 percent9 for three differentincome eligibility brackets. These are targeted at households earning a regularsalary between the minimum wage and up to 4.5 times the minimum wage. Thiscompares to an average 7.23 percent to 7.57 percent rate for mortgages availableat commercial rates in 2016.10 In March 2017, the minimum monthly wage wasincreased by 4.3 percent to TD 352.534 (US$142).11
According to the Central Bank’s 2016 annual report,12 the total value of housingloans decreased between 2015 and 2016. Mortgage lending is approximatelyequivalent to 8.6 percent of GDP. Rules modified in 2007 (Circular 2007/25 datedNovember 19, 2007)13, 14 limit loan-to-value ratios to below 80 percent (thoughup to 90 percent in social lending programmes, such as FOPROLOS), and amaximum term of 25 years. Part of this law also requires long-term liquiditymatching requirements for loans over 10 years and a requirement that interestrates must be fixed for housing loans longer than 15 years. This requirementmeans that many banks are funded by sovereign bonds and are hesitant to offerloans beyond 15 years. Current challenges include a lack of liquidity and a highlevel of non-performing loans, which was reported to have increased from12 percent in 2010 (pre-revolution) to 14.4 percent in 2016.15 It should be notedthat the Supplementary Budget Law of 2015 included measures to treat debtsheld by beneficiaries of housing credits issued as part of social housing initiatives.16
In February 2017, the Government of Tunisia launched the “programme premierlogement” (“first housing” programme).17 This programme, which benefits froma special account (initially funded with TD 200 million or US$80 million), targetsmiddle class families (households earning between 4.5 and 10 times the minimumwage) that wish to purchase their first home. “First housing” helps them financetheir downpayment (up to 20 percent of the total price of a house), from a list ofavailable houses from the state. The loan can finance houses priced at TD 200 000or less (about US$80 000) over up to 12 years with no repayment over the firstfive years.18
In terms of secondary markets, Tunisia has a stock exchange (La Bourse des ValeursMobilieres de Tunis – BVMT) and, in 2001, developed the legal framework forsecuritisation to facilitate access to long-term funding for mortgage finance.However, activity has been extremely limited with only two transactions19 (in 2005and 2006 respectively, amounting to TD five million each, about US$2 million) bya single institution, the International Arab Bank of Tunisia. There is also analternative capital securities market for Tunisian companies that cannot be listedon the main market.
The Decree-Law No. 2011-117 on microfinance institutions of 5 November 2011opened the way for new entrants. As a result, the microfinance sector has evolvedover the past years with more players coming in. Today, six microfinance institutionsoperate in Tunisia: Enda Tamweel, Microcred Tunisie, Zitouna Tamkeen, TaysirMicrofinance, Centre Financier aux Entrepreneurs, and Advans Tunisie.20
Zitouna Bank was the first institution in 2009 to launch a Mourabaha product.The government is working with the Islamic Development Bank to issue its firstSukuk bonds, which has been presented as a cheap means to access long-termfinance. Ultimately, only an estimated 4.1 percent of Tunisian households haveaccess to housing loans.
The government of Tunisia also offers subsidised finance for residential propertydevelopers. The Housing Bank can finance up to 80 percent of the total cost ofa project if the housing units are “social” units at 6.78 percent per annum, and upto 70 percent if they are “economic” or “high-standing” units, at 7.28 and 8.28percent per annum respectively. This financing system was introduced as part ofthe National Housing Strategy (1988) that saw the private sector as an importanthousing producer.
AffordabilityAccording to the Brookings Institution, the size of Tunisia’s middle class reachedmore than 40 percent of the total population in 2010, up from 25 percent in 2000.
In 2010, the middle class may have made up almost 70 percent of the population,although this has dropped significantly since the revolution in 2011.21 Euromonitorcurrently estimates that the middle class in Tunisia makes up 36.3 percent of thepopulation.
Consumer expenditure per household decreased from US$13 009 in 2014 toUS$10 360 in 2017.22 Consumer expenditure on housing per household alsodropped from US$2 118 in 2014 to US$1 735 in 2017, making up about17 percent of total consumer expenditure per household.23 It remains the secondhighest expenditure for households in Tunisia.
The majority of the population, 69 percent of 2.8 million households, arehomeowners.24 Of the 2.8 million households that are homeowners, 96 percentdo not have a mortgage while the other four percent maintain a mortgage.Twenty-six percent of Tunisian households rent their homes. This suggests thatalthough the majority of the population own their homes and do so without amortgage, there are at least 26 percent of the population who stand to benefitfrom affordable housing finance.
Annual disposable income in 2017 was TD 71.6 billion (US$26.9 billion), up fromTD 66.6 billion (US$25 billion), 72 percent of which is earned in the urban areasof the country. Per capita spending averaged US$2 360 a year in 2010, whichranged from US$1 496 in the Centre West region to US$3 228 in Tunis. In 2012,1.2 percent of households had expenditure of less than US$2 500 a month,12.8 percent spent between US$2 500 and US$5 000, 24.9 percent betweenUS$5 001 and US$7 500, 20.9 percent between US$7 501 and US$10 000 and40.2 percent above US$10 000. Due to progressive housing policies sinceindependence in 1956, housing is more affordable in Tunisia compared to othercountries in the region and the overall price-to-income index is often quoted asfive. However, this number does not reflect the reality for low income households,a growing market segment as youth unemployment remains high at above35 percent.25 These households usually cannot qualify for housing loans and donot have the capacity to pay for even a modest unit.
In terms of affordability, a 2012 analysis by UN Habitat calculated that a house of75m2 built progressively on peri-urban land cost about US$14 000 (TD 21 746),or US$187.5 (TD 291) per square metre. Such a unit has a price-to-annual-income ratio close to nine for the lowest decile households. Assuming 30 percentof income could be mobilised for monthly housing payments, the repaymentsrequired on the cheapest housing loan makes this unit unaffordable to 30 percentof Tunisian households.
The government FOPROLOS programme was designed in 1977 to providehousing finance for low income groups and is still the main tool assisting access toaffordable housing. There are three main categories:
n FOPROLOS 1: Households earning between one and two times theminimum wage can purchase a unit below 50m2 for US$25 500, with a loanof 90 percent loan-to value (LTV) for 25 years, at 2.5 percent per annum.
n FOPROLOS 2: Households earning between two and three times theminimum wage can purchase a unit below 75m2 at US$32 100, with a loanof 90 percent LTV for 25 years, at four percent per annum.
n FOPROLOS 3: Households earning between three and 4.5 times theminimum wage can purchase a unit of between 80-100m2 at less thanUS$43 400, with a loan of 85 percent LTV for 25 years, at 5.75 percent perannum.
However, in recent years, the cost of a FOPROLOS home has become inaccessibleto its original target groups, with housing costs at around US$510 a square metre.Qualifying criteria do not enable households with irregular incomes to participate.Furthermore, loan ceilings have not increased with the cost of production, so it isdifficult for developers to offer a housing supply to match the subsidised financialproduct. There are clear indicators that, in its current shape, this mechanism isnot suited for attaining its set objectives, thus prompting a spillover of the demandinto the informal sector. According to data from the Tunisian Ministry ofEquipment, Land Development and Sustainable Development (Ministère del’Equipement, de l’Aménagement du Territoire et du Développement Durable),the share of approved FOPROLOS housing units offered by private developersonly represented on average six percent of the total approved housing units

Africa Housing Finance Yearbook 2018
263
between 2004 and 2013. FOPROLOS remains mainly underused due to a lackof adapted supply rather than a lack of resources. The cumulative surplus (unspentresources) of FOPROLOS reached almost US$230 million at the end of 2013.
This prompted the government of Tunisia to reflect on possible reform of theFOPROLOS mechanism, which is widely regarded as obsolete. This formed partof the new Housing Strategy presented to the Prime Minister in October 2015.The upcoming reform aims to increase access to affordable housing and shouldinclude an extension of the repayment terms, a decrease in the self-financing rate,and a revision of the eligibility criteria. The strategy also provides for a newguarantee fund mechanism aimed at promoting access to housing finance, includingthrough FOPROLOS, to low income households that are not affiliated to socialsecurity or do not hold a bank account. A removal of the de jure monopoly ofthe Housing Bank on subsidised FOPROLOS loans is also under consideration.
Housing supplyThe 2014 census and housing survey, released in September 2015,26 recorded atotal housing stock of 3 289 903 units, an increase of 789 103 units since theprevious census in 2004. A total of 79.2 percent of Tunisians own their home andan estimated 17.7 percent of these homes are vacant usually consisting of high-cost units purchased as secondary homes, luxury rental properties, or speculativeinvestment properties. Most developers in Tunisia have also been focussed ondeveloping houses for the mid to higher range segments as the cost to constructsocial housing units outstrips its property price ceiling.27
Of the annual demand, estimated at 77 000 units per year, around 40 percent isbuilt informally on an incremental basis on quasi-formally subdivided land – theland is bought and acquired through notary deed. A total of 42 587 buildingpermits were issued in 2013.28 Of the formal units, approximately 80 percent areconstructed by individual households (responsible for 28 000 building permits and38 300 units per year), two percent by public developers and 18 percent byregistered developers, who tend to target middle to high income groups.
Property marketThere are two land registration systems. The first regime was established by theDecree-Law of 20 February 1964 on the registration of agricultural lands. Thisland registration is compulsory, free of charge, and state-administrated. The secondregime involves voluntary applications to register land by landowners, usually basedon a notarial deed. The land registration system involves three main actors. First,the Property Court, which is the competent judicial authority, intervenes at theonset of the registration process by issuing a registration judgement. Second, theLand Survey and Topography Agency (Office de Topographie et de Cadastre),undertakes boundary marking and allotment operations as well as establishingland plans. Lastly, the Landed Property Registry (Conservation de la PropriétéFoncière) is responsible for issuing, updating, and maintaining title deeds.
The real estate and construction sector is an important contributor to nationalGDP and employment. In the first quarter of 2016, the number of jobs in theconstruction and settlements sector was measured at 459 800, which represented13.5 percent of total employment. The housing sector also accounted for threepercent of the revenues of the state via taxes collected from rental and propertymanagement, VAT generated by construction and local land taxes.
Prices in the formal real estate market have been increasing at a rate of eightpercent an annum since 1990, and have continued to rise following the revolution.The rental market has experienced increased demand, and higher rentals, due toLibyan immigrants who have settled in Tunisia to escape the political situation intheir home country. According to the Ministry’s Housing Observatory, in 2010the average price of a housing unit was US$36 180 at a size of 134m2, or US$270per square metre. Meanwhile, the Global Property Guide reports that the averagesale price for a house in Tunis can reach as high as US$2 100 to US$41 00 a squaremetre.
The number of registered real estate developers continues to increase in Tunisiaafter the regulatory framework for the profession was put in place in 1990. Thereare more than 2 700 registered developers at present. However, this number isnot indicative of an increase in the production of housing, as many investorsregister as developers to benefit from tax incentives for property construction.
Policy and regulationWhile the total government budget increased by 10.7 percent between 2016 and2017, the budget of the Ministry of Equipment, Housing and Land Developmentincreased by 55 percent to TD 1 641 million (US$662 million).29
In force for more than 40 years, government financial assistance mechanisms forthe housing sector mainly consist of financial subsidies, such as subsidised interestrates and tax exoneration on home saving accounts. For instance, the NationalFund for Housing Improvement (Fonds National d’Amélioration de l’Habitat)finances loans and grants for home improvements for people who earn less thanthe minimum wage. The fund was established by law in 2004 but has only beeneffectively operating since 2007.30 To a lesser extent, there are land subsidiesthrough the Housing Land Agency (Agence Foncière d’Habitation), which also hasthe objective of reducing land speculation. This regime was enhanced in 2007through the issuing of direct subsidies by the National Solidarity Fund (FondsNational de Solidarité), targeted to benefit households wishing to purchase socialhousing. Complementary mechanisms were established in the 1980s in the formof slum upgrading schemes managed by the Urban Rehabilitation and RenovationAgency and the National Programme for the Resorbing of Rudimentary Lodging.
In 2014, the Ministry of Public Works, Housing and Settlements undertook acomprehensive review of its housing policy, particularly in terms of exploringpublic-private partnerships. The review also looked at possible reforms of thesubsidy programmes aimed at widening the scope and rationalising government
- - - Average annual household income needed for the cheapest newly built house by a formal developer, 2017 Average annual household income using expenditure, 2017 (PPP$)
TUNISIA
Annual income profile for rural and urban households based on consumption (PPP$)
Source https://www.cgidd.com/
PPP$40 001 – PPP$10 000 000
PPP$23 001 – PPP$40 000
PPP$12 001 – PPP$23 000
PPP$8 001 – PPP$12 000
PPP$5 001 – PPP$8 000
PPP$3 601 – PPP$5 000
PPP$2 401 – PPP$3 600
PPP$1 601 – PPP$2 400
PPP$801 – PPP$1 600
<PPP$800No. of households (thousands)
PPP$45 786
PPP$28 993
Rural Urban600 500 400 300 200 100 0 100 200 300 400 500 600
Population: 11 532 127
Urbanisation rate: 1.44%
Cost of cheapestnewly built house:
69 870 TNDPPP$99 814
Urban householdsthat could afford thishouse with finance:
36.32%
1 PPP$: 0.7 Tunisian dinar

264
housing aid, as well as expanding the mandate of FOPROLOS. Preliminaryrecommendations for a new National Housing Strategy were presented by thegovernment in September 2014 and included revitalising the role of the HousingLand Agency in land provision.
OpportunitiesDespite a slowdown in the pace of new constructions (as evidenced by a 6.5percent decrease in the demand for cement in the first quarter of 2015, accordingto the Ministry of Industry), and as the outlook of capital markets and the bankingsector remains uncertain, Tunisians continue to put their money in real estate ashousing in Tunisia is still considered a secure and profitable form of investment.The construction boom can be seen in both the informal and formal sector,particularly apparent in the high cost of land and construction materials. However,continued price rises may not be sustainable, and there is a risk of this furtherexcluding low to middle income households from homeownership.
Contribution of the housing sector to GDP was estimated at US$2.8 billion in2014, representing 6.6 percent of GDP. Removing restrictions on foreignownership of property and the rise in demand for Islamic housing finance mayallow the sector to grow significantly.
A slight upturn in the population growth rate will help to drive the market’sexpansion. With regard to solvency of the demand, the impact of the economicchanges experienced by the country since 2011 will tend to make income levelsinstable. Demand for housing credits will grow in complexity and will rely less andless on traditional products, which will impact the evolution of the nature ofdemand.
Economic growth in 2017 is expected to accelerate (2.3 percent compared to1.0 percent in 2016). Projections for the next years continue to be positive witha 2.8 percent economic growth in 2018 and 3.2 percent in 2019.31 While themain drivers of the expected economic growth do not include construction andhousing, an improved economic context should also boost the housing sector overthe medium term.
Additional sourcesAchy, Lahcen (2011). Tunisia’s Economic Challenges. Carnegie Middle EastCentre. https://carnegieendowment.org/files/tunisia_economy.pdf (Accessed11 September 2018).
African Development Bank (2012). Tunisia: Interim Country Strategy Paper.Tunis. https://www.afdb.org/fileadmin/uploads/afdb/Documents/Project-and-Operations/2014-2015_-_Tunisia_Interim_Country_Strategy_Paper.pdf(Accessed 11 September 2018).
African Economic Outlook (2014). Tunisia Country Profile.http://www.un.org/en/africa/osaa/pdf/pubs/2014afrecooutlook-afdb.pdf(Accessed 11 September 2018).
Banque Centrale de Tunisie (2015). Rapport Annuel 2014.https://www.bct.gov.tn/bct/siteprod/documents/RA_2015_fr.pdf (Accessed11 September 2018).
EuroMonitor (2018). World Consumer Income and Expenditure Patterns: 14thEdition.
Hassler, O (2011). Housing and Real Estate Finance in Middle East and NorthAfrica Countries.http://siteresources.worldbank.org/INTMNAREGTOPPOVRED/Resources/MENAFlagshipHousingFinance.pdf (Accessed 12 September 2018).
Kahloun H (2014). Habitat informel.http://www.mehat.gov.tn/fileadmin/user1/doc/Contenus/FR/HabitatInformelRapportIntermEdiaireProvisoireHKahlounOct2014.pdf (Accessed 13 September2018).
Sayah Z (2014). Promotion de l’accès au financement du logement.http://www.mehat.gov.tn/fileadmin/user1/doc/Contenus/FR/PromotionDeLAccesAuFinancementDuLogementZSayahOct2014.pdf (Accessed 13 September2018).
Taleb R (2014). Auto construction formelle des logements.http://www.mehat.gov.tn/fileadmin/user1/doc/Contenus/FR/AutoconstructionFormelleDesLogementsRTalebOct2014.pdf (Accessed 13 September 2018).
UN-HABITAT (2011). Affordable Land and Housing in Africa.https://unhabitat.org/books/affordable-land-and-housing-in-africa/ (Accessed13 September 2018).
UN-HABITAT (2011). Tunisia: HousingProfile.https://unhabitat.org/books/tunisia-urban-housing-sector-profile/(Accessed 11 September 2018).
World Bank (2014). Doing Business Economy Profile 2015: Tunisia.https://openknowledge.worldbank.org/bitstream/handle/10986/21027/921490WP0Box3804580Tunisia00Public0.pdf?sequence=1&isAllowed=y (Accessed11 September 2018).
Websites www.bct.gov.tn. www.bh.com.tn. www.cgap.orgwww.ins.nat.tnwww.mehat.gov.tnwww.mfw4a.orgwww.mixmarket.org
1 World Development Indicators (2018). Tunisia.http://databank.worldbank.org/data/reports.aspx?source=2&country=TUN (Accessed 25 July 2018).
2 Trading Economics. https://tradingeconomics.com/tunisia/adjusted-savings-net-national-savings-percent-of-gni-wb-data.html (Accessed 19 July 2017).
3 Nourou, M.A. (2018). Tunisia’s Public Debt reached nearly 70% of GDP in 2017,https://www.ecofinagency.com/public-management/0503-38152-tunisia-s-public-debt-reached-nearly-70-of-gdp-in-2017 (Accessed 25 July 2018).
4 Indexmundi (2018). Tunisia Unemployment Rate.http://www.indexmundi.com/tunisia/unemployment_rate.html (Accessed 20 July 2018).
5 Euromonitor (2018). Economies and Consumers Annual Data. www.euromonitor.com (Accessed 25 July2018).
6 Aliriza, F. (2018). 'Two Classes left - Rich and Poor': Sinking Tunisia’s currency.http://www.middleeasteye.net/news/sinking-tunisia-s-currency-63299104 (Accessed 25 July 2018).
7 Banque Centrale de Tunisie (2016). Annual Report 1016.https://www.bct.gov.tn/bct/siteprod/documents/RA_2016_en.pdf (Accessed 20 July 2018).
8 Housing Finance Information Network (HOFINET) (2013). Tunisia Country Profile.http://www.hofinet.org/countries/description.aspx?regionID=5&id=168 (Accessed 20 August 2017).
9 Banque de l’Habitat (2017). Le Crédit. FOPROLOS https://www.bh.com.tn/credit_foprolos.asp (Accessed19 July 2017).
10 Banque Centrale de Tunisie (2017). https://www.bct.gov.tn/bct/siteprod/documents/RA_2016_fr.pdf(Accessed 20 July 2017).
11 Highlights (2017). Highlights. http://highlights.com.tn/tunisie-voici-nouveaux-montants-smig/ (Accessed20 July 2017).
12 Banque Centrale de Tunisie (2017). https://www.bct.gov.tn/bct/siteprod/documents/RA_2016_fr.pdf(Accessed 20 July 2017).
13 Law No. 2007-12 issued on 3 January 2007 amending the law establishing FOPROLOS. 14 Banque Centrale de Tunisie (2017). https://www.bct.gov.tn/bct/siteprod/documents/cir87_47n(1).pdf
(Accessed 20 August 2017).15 The Global Economy (2017). http://www.theglobaleconomy.com/Tunisia/Nonperforming_loans/ (Accessed
20 July 2017).
16 The Supplementary Budget Law for 2015 was adopted by the Assembly of the People’s Representatives(ARP) on 5 August 2015.
17 Called “programme premier logement”.18 Huffpost (2017). Tout savoir sur le programme "premier logement”.
http://www.huffpostmaghreb.com/2017/02/03/logement-tunisie-_n_14594908.html (Accessed 19 July 2017).19 All Africa (2016). Tunisie: L'indispensable réforme de la loi sur la titrisation.
http://fr.allafrica.com/stories/201610180556.html (Accessed 20 July 2017).20 Concours Tunisie (2017). Concours Tunisie. http://concours-tunisie.tn/2017/05/03/liste-institutions-de-
microfinance-tunisie-institution-microfinance/ (Accessed 20 July 2017).21 Aliriza, F. (2018). 'Two Classes left - Rich and Poor': Sinking Tunisia’s currency.22 EuroMonitor (2018). Income and Expenditure, www.euromonitor.com (Accessed 25 July 2018).23 EuroMonitor (2018).24 Ibid.25 Huffpost (2017). Rapport mondial de l'OIT sur le chômage des jeunes: Où se place la Tunisie?
http://www.huffpostmaghreb.com/2016/12/19/oit-rapport-chomage-jeune_n_13720084.html (Accessed20 July 2017).
26 National Institute of Statistics – Tunisia.27 Oxford (2017). The Report: Tunisia 2017. https://oxfordbusinessgroup.com/tunisia-2017 (Accessed
11 September 2018). 28 MEATDD data29 ilBoursa (2016). épartition du budget de l'Etat pour 2017 par Ministère.
http://www.ilboursa.com/analyses/arp-repartition_du_budget_de_l_etat_pour_2017_par_ministere-50(Accessed 20 August 2017).
30 République tunisienne (2017). Ministère de l’Equipement, de l’Habitat et de l’Aménagement du Territoire.http://www.equipement.tn/index.php?id=271&L=1 (Accessed 20 August 2017).
31 The World Bank (2017). Tunisia’s Economic Outlook- April 2017.http://www.worldbank.org/en/country/tunisia/publication/economic-outlook-april-2017 (Accessed 20 August2017).
Africa Housing Finance Yearbook 2018
265
private sector credit by 10.8 percent in December 2017 compared to 7.9 percentin December 2016. This has also been augmented an increase of imports of rawmaterials and capital goods. The economy is expected to grow at an improvedrate of 5.8 percent in the financial year 2017/2018 compared to 3.6 percent in2016/2017. This will be achieved on the back of improvements in the agriculturalsector by 3.2 percent, the industrial sector by 6.2 percent, and the service sectorby 7.3 percent. GDP is expected to strengthen further to 6.0 percent7 in thefinancial year 2018/2019.
Moody’s credit rating for Uganda in March 2018 was maintained at B2, and at parwith Kenya after Kenya’s down grade from B1.8 The rationale for the B2 grade isUganda’s small economic size and low wealth levels, pointing to limited shockabsorption capacity from external shocks, limited institutional capacity posingchallenges in managing the 38 percent rising debt associated with infrastructureinvestment, and an elevated susceptibility to event risk. The outlook is howeverstable, reflecting a broad balancing of credit risks and expected gains frominfrastructure investment alongside continued structural reforms in cooperationwith the IMF to support the growth outlook.
Uganda
OverviewUganda’s economy has achieved a strong performance, with a 5.2 percent growthrate reported in 2018, up from 4.6 percent in 2017.1 This has been largelyattributed to high levels of public infrastructure developments and investment ina wide range of sectors, including housing and construction, manufacturing andthe service sector.
On the monetary front, the central bank has continued with the drive to reduceborrowing interest rates to encourage private sector credit for enhancedeconomic growth. Headline inflation has continued on the downward trend to1.7 percent2 in May 2018 compared to 7.2 percent in May 2017.3 The success incontrolling inflationary pressures to well within the target rate of 5 percent hasbeen recognized by monetary authorities as a catalyst for low-priced debt forprivate sector investments. However, despite these successes, the debt-to-GDPratio has increased from 34.6 percent in 2016 to 37 percent in 2018 and isprojected to reach 47.8 percent in 2021.4
The government has announced measures aimed at reducing the debt burden inthe short to medium term. These are largely focused on expanding the tax baseand increasing domestic funding for the recurrent budget. The tax-relatedmeasures have had a considerable impact on housing developments, with likelyconstraints on rental housing developments within the tax period. Uganda’s taxrevenue to GDP ratio is still low at 14 percent, an improvement from the decade-long position of approximately 10 percent, although still below the 16 percentaverage for economies in sub-Saharan Africa.5 This points to an increasing needfor widening the tax base in the medium term if the development objectives areto be achieved.
The country’s foreign sector has posted a weak performance with deterioratingbalance of payments mainly as the result of external economic factors, includingslow growth in Europe and China, and tightening financial and monetary conditionsglobally. Coupled with a low interest rate regime, deterioration in exportperformance has exacerbated the depreciation of the local shilling against the USdollar by 8.4 percent from USh3 582 in June 2017 to USh3 884 in June 2018.
Overall, there are indications of private investment activity as reflected in thegrowth of foreign direct investment, which increased by 18.5 percent6 in 2017compared to a decline of 30.5 percent in 2016, and in the growth in local currency
KEY FIGURES
Main urban centresKampalaEntebbe
Exchange rate: 1 US$ = [a] 20 Sept 2018PPP Exchange rate (Local currency/PPP$) 1 Ugandan shilling = [b]Inflation 2016 [c] | Inflation 2017 [c] | Inflation 2018 [c]
3 884.75 Ugandan shilling1 143.505.50 | 5.6 | 3.6
Population [b] | Urban population size [b] Population growth rate [b] | Urbanisation rate [b]Percentage of the total population below National Poverty Line [d]Unemployment rate [d]
42 862 958 | 7 198 4053.26% | 5.50%23.0%9.2%
GDP (Current US$) 2017 [b] | GDP growth rate annual 2017 [b]GDP per capita (Current US$)2017 [b]GNI per capita (Current US$) 2017 [b]Gini co-efficient [d]HDI global ranking [f] | HDI country index score [f]
US$25 891 million | 3.96%US$604US$60037.10163 | 0.493
Is there a deeds registry? [g]Number of residential properties that have a title deed Lending interest rate [a] Mortgage interest rate | Mortgage term (years)DownpaymentMortgage book as a percentage of the GDPEstimated number of mortgages Price to Rent Ratio in City Centre [h] | Outside City Centre [h]Gross Rental Yield in City Centre [h] | Outside City Centre [h]Construction as a % of GDP [i]
Yes630 00020.03%18% | 2515%3.00%5 00055.86 | 8.451.79% | 11.8%5.00%
What is the cost of standard 50kg bag of cement? What is the price of the cheapest, newly built house by a formaldeveloper or contractor? (Local currency)What is the price of the cheapest, newly built house by a formaldeveloper or contractor? (US$) What is the size of this house (m2)? What is the average rental price for this unit (US$)? What is the minimum stand or plot size for residential property?
US$8.15
76 000 000 Ugandan shilling
US$20 00060m2
n/a300m2
Ease of Doing Business Rank [g]Number of procedures to register property [g]Time to register property (days) [g]Cost to register property (as % of property value) [g]
1221042 days3.10%
NB: Figures are for 2018 unless stated otherwise.
[a] Bank of Uganda[b] World Bank World Development Indicators[c] Worldometers[d] Uganda Bureau of Statistics[e] IMF World Economic Outlook Database[f] UNDP Development Indicators[g] World Bank Doing Business[h] Numbeo[i] Uganda Ministry of Lands , Housing and Urban Development
266
Access to financeThe financial sector in Uganda has remained strong, resulting in the improvedperformance of financial institutions in 2017 and an increase in credit facilitiesextended to the private sector. The Central Bank Rate, a policy benchmark rate,has remained at its all-time low of 9.0 percent in June 2018, since the last reductionfrom 9.5 percent in February 2018.9 The country has also posted an improvementin shilling credit extension by 10.8 percent in December 2017 compared to7.9 percent in December 2016. Total lending in the local currency has risen by7.4 percent from USh11 972 040 million in April 2017 to USh12 925 983 millionin April 2018.10
Credit to the building and construction sector has improved very slightly from20.8 percent to 21.0 percent of the total credit outstanding in the country. Otherleading sectors include trade at 19.2 percent, personal credit at 18.3 percent,agriculture at 12.4 percent and manufacturing at 12.0 percent. Energy, transport,mining and other services are all under 10 percent each.11
The provision of development finance represents 7.1 percent of the 21 percentreal estate sector allocation, followed by residential mortgages at 5.7 percent,commercial mortgages at 3.5 percent and land purchase at 0.6 percent. Thebiggest lender for building and construction projects is still Housing Finance Bank,which leads the mortgage market in Uganda with approximately 55 percent ofthe total mortgage portfolio in the country. Other banks involved in housing-related finance include Stanbic Bank, Standard Chartered Bank, DFCU Bank, KCBBank and Centenary Bank. The total mortgage portfolio, comprising bothresidential and commercial mortgages, has increased by 8 percent from USh2.492trillion in April 2017 to USh 2.711 trillion in April 2018.The increment is attributedto a drop in mortgage interest rates from an average of 19.5 percent in April 2017to 17.5 in April 2018. Mortgage rates vary from bank to bank, the lowest being17 percent and the highest being 19.5 percent.
The rate of non-performing loans as a percentage of gross loans, has declinedfrom a peak of 10.5 percent in December 2016 to 5.6 percent in December2017.12 This has further supported credit extension. The noted improvement inthe quality of loan portfolio over the year is attributable to an industry-wide effortto book quality loans and enhance recovery efforts, as demanded by the bankingregulator following the shake-up and eventual closure of the third largest lender,Crane Bank Limited, whose non-performing loans were in excess of 12 percentof the bank’s loan book. This industry-wide improvement in loan quality hasresulted in stricter credit underwriting standards, also coming with the adoptionof International Financial Reporting Standard (IFRS) 9, requiring banks to be moreprudent when making provisions for their loan book. The actual eventual impactof IFRS9 on bank performance will be examined when banks release their final2018 financial results.
On the other government side, investment in public infrastructure relating to thetransport sector has opened up new areas for development and is likely tosubstantially raise output and credit extension for greenfield projects in suchareas.13 Infrastructure projects opening new areas include the Kampala-EntebbeExpressway (commissioned June 2018) and Kampala-Jinja Expressway (plannedfor 2020).
The biggest challenge for local lenders (tasked with financing these projects) liesin their inability to raise long-term funds, due to the nature of the deposit base ofcommercial banks. Most banks still rely on retail and wholesale deposits to supportup to 80.4 percent of bank lending. Such deposits support very short-termoperations, with less than 15 percent available to issue credit. In addition to amarginal portion of retail deposits that are stretched to create long-term assets,banks continue to rely heavily on pension funds available on a one-year recurrentbasis. Existing pension sector regulations still restrict the use of pension assets forlong-term credit by banks.14
Recent innovations in the financial sector have increased access levels to financialservices. Financial sector deepening initiatives in Uganda, including Agent Bankingand mobile-based payments, have been aligned to support the changingdemography, technology, and attitudes in the country. Uganda has a youthfulpopulation with 47.9 percent between 0-14 years of age, 49.2 percent between15 – 64 years, and 2.9 percent above 65 years. Furthermore, approximately75 percent of the population reside in rural areas, with limited access to financial
services, while only 25 percent of the population resides in urban areas. Basedon this market information, financial services providers have introduced a wave ofdigital financial services aimed at improving proximity and bringing harder-to-reachclients into the formal financial space at relatively lower costs. These innovationsinclude agent banking, mobile money and electronic payments. Most banks arenow accessible through mobile phones and local bank agents. Bank of Ugandareleased new Agent Banking Regulations in July 2017, paving way for theappointment by banks of agents for the conduct of financial institution businesson behalf of the appointing bank. Currently, most banks are rolling out agentsacross the country to enhance access to their services, including deposits,withdrawals, balance checks, bill payments and collection of documents for accountopening and loan applications.
On the regulatory front, the government has introduced amendments to thetaxation law in a bid to widen and deepen the tax base. As from July 2018, mobilephone-based cash transactions, including depositing, withdrawing and sendingmoney held a one percent tax. Additionally, excise duty on banking services hasbeen increased from 10 percent to 15 percent. Such measures are likely to resultin a slight decline in the use of the affected services and restrict access to affordablefinancial services.
AffordabilityAlthough the demand for housing units is high among Uganda’s middle class withaggregate monthly household incomes ranging between US$400 (USh1 553 600)to US$1 000 (USh 3 884 000), effective demand is perceived to be modest,because of the low levels of regular verifiable income as evidenced by adequateincome documentation. The situation has been further exacerbated by an increasein the prices of building materials. The limited capacity of cement manufacturersto boost production levels in response to demand has affected housingaffordability in the early part of 2018. In March and April 2018, cement pricesincreased by over 79 percent from an average of USh28 000 to more thanUSh50 000 for a 50kg bag. This was attributed to increased demand frominfrastructure developments, including road construction and the Karumahydroelectric power plant construction. This price movement greatly reducedindividual households’ capacity to continue with construction projects alreadystarted and called for additional loan financing for houses that were beingconstructed on relatively fixed approved amounts.
To reduce these pressures, Hima Cement is expected to start production on itsUS$40m plant within the second half of 2018. The new plant, which has a capacityof approximately 800 metric tonnes, could help to bring down prices as well asstabilise supply in the market. Additionally, three new cement plants are expectedto open this year in Tororo, including Hima Cement, Tororo Cement (a new1.8 million metric tonnes plant) and Simba Cement. The three are projected toincrease cement production to 6.8 million metric tonnes a year, almost doublethe current 3.6 metric tonnes. With local demand currently at 2.4 million metrictonnes a year, the likely oversupply is expected to drive down the cost ofcement.15 Other construction materials such as sand, stones, bricks and tiles haveincreased by approximately 15 percent on account of high inflation in fuel costswhich was 10.3 percent for May 2018 and 15.1 percent for June 2018. The resulthas been a noted deterioration of housing affordability among the low and middle-income segments of the population.
On the demand side, a notable decline in interest rates to an average of17.5 percent and persistent decline in inflation to 3.4 percent,16 down from5.7 percent a year ago, have combined to raise households’ disposable income,thereby boosting affordability.
Of course, these developments do not address the housing affordability of themost poor, nor of the growing refugee population in Kampala and other citycentres. Recent research17 has found that the majority of refugee householdsrent their housing, and that this housing is generally of poor quality with pooraccess to services. Even so, about a third of those surveyed also reported thathousing constituted their largest expense.
Housing supplyUganda’s current housing stock is estimated at about 8 021 000 housing units withan average household size of 4.7 persons for the 37.7 million residents.18 Aminority of urban Ugandans own however: an estimated 71 percent of households
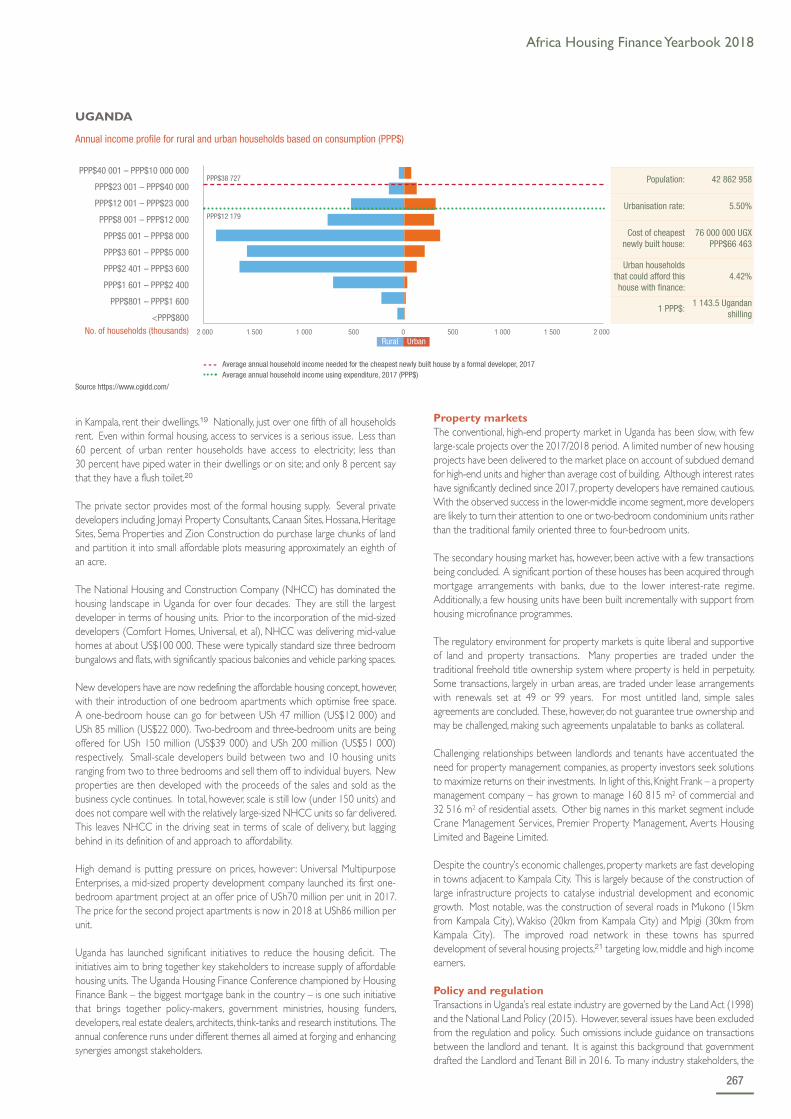
Africa Housing Finance Yearbook 2018
267
in Kampala, rent their dwellings.19 Nationally, just over one fifth of all householdsrent. Even within formal housing, access to services is a serious issue. Less than60 percent of urban renter households have access to electricity; less than30 percent have piped water in their dwellings or on site; and only 8 percent saythat they have a flush toilet.20
The private sector provides most of the formal housing supply. Several privatedevelopers including Jomayi Property Consultants, Canaan Sites, Hossana, HeritageSites, Sema Properties and Zion Construction do purchase large chunks of landand partition it into small affordable plots measuring approximately an eighth ofan acre.
The National Housing and Construction Company (NHCC) has dominated thehousing landscape in Uganda for over four decades. They are still the largestdeveloper in terms of housing units. Prior to the incorporation of the mid-sizeddevelopers (Comfort Homes, Universal, et al), NHCC was delivering mid-valuehomes at about US$100 000. These were typically standard size three bedroombungalows and flats, with significantly spacious balconies and vehicle parking spaces.
New developers have are now redefining the affordable housing concept, however,with their introduction of one bedroom apartments which optimise free space.A one-bedroom house can go for between USh 47 million (US$12 000) andUSh 85 million (US$22 000). Two-bedroom and three-bedroom units are beingoffered for USh 150 million (US$39 000) and USh 200 million (US$51 000)respectively. Small-scale developers build between two and 10 housing unitsranging from two to three bedrooms and sell them off to individual buyers. Newproperties are then developed with the proceeds of the sales and sold as thebusiness cycle continues. In total, however, scale is still low (under 150 units) anddoes not compare well with the relatively large-sized NHCC units so far delivered.This leaves NHCC in the driving seat in terms of scale of delivery, but laggingbehind in its definition of and approach to affordability.
High demand is putting pressure on prices, however : Universal MultipurposeEnterprises, a mid-sized property development company launched its first one-bedroom apartment project at an offer price of USh70 million per unit in 2017.The price for the second project apartments is now in 2018 at USh86 million perunit.
Uganda has launched significant initiatives to reduce the housing deficit. Theinitiatives aim to bring together key stakeholders to increase supply of affordablehousing units. The Uganda Housing Finance Conference championed by HousingFinance Bank – the biggest mortgage bank in the country – is one such initiativethat brings together policy-makers, government ministries, housing funders,developers, real estate dealers, architects, think-tanks and research institutions. Theannual conference runs under different themes all aimed at forging and enhancingsynergies amongst stakeholders.
Property marketsThe conventional, high-end property market in Uganda has been slow, with fewlarge-scale projects over the 2017/2018 period. A limited number of new housingprojects have been delivered to the market place on account of subdued demandfor high-end units and higher than average cost of building. Although interest rateshave significantly declined since 2017, property developers have remained cautious.With the observed success in the lower-middle income segment, more developersare likely to turn their attention to one or two-bedroom condominium units ratherthan the traditional family oriented three to four-bedroom units.
The secondary housing market has, however, been active with a few transactionsbeing concluded. A significant portion of these houses has been acquired throughmortgage arrangements with banks, due to the lower interest-rate regime.Additionally, a few housing units have been built incrementally with support fromhousing microfinance programmes.
The regulatory environment for property markets is quite liberal and supportiveof land and property transactions. Many properties are traded under thetraditional freehold title ownership system where property is held in perpetuity.Some transactions, largely in urban areas, are traded under lease arrangementswith renewals set at 49 or 99 years. For most untitled land, simple salesagreements are concluded. These, however, do not guarantee true ownership andmay be challenged, making such agreements unpalatable to banks as collateral.
Challenging relationships between landlords and tenants have accentuated theneed for property management companies, as property investors seek solutionsto maximize returns on their investments. In light of this, Knight Frank – a propertymanagement company – has grown to manage 160 815 m2 of commercial and32 516 m2 of residential assets. Other big names in this market segment includeCrane Management Services, Premier Property Management, Averts HousingLimited and Bageine Limited.
Despite the country’s economic challenges, property markets are fast developingin towns adjacent to Kampala City. This is largely because of the construction oflarge infrastructure projects to catalyse industrial development and economicgrowth. Most notable, was the construction of several roads in Mukono (15kmfrom Kampala City), Wakiso (20km from Kampala City) and Mpigi (30km fromKampala City). The improved road network in these towns has spurreddevelopment of several housing projects,21 targeting low, middle and high incomeearners.
Policy and regulationTransactions in Uganda’s real estate industry are governed by the Land Act (1998)and the National Land Policy (2015). However, several issues have been excludedfrom the regulation and policy. Such omissions include guidance on transactionsbetween the landlord and tenant. It is against this background that governmentdrafted the Landlord and Tenant Bill in 2016. To many industry stakeholders, the
Source https://www.cgidd.com/
PPP$40 001 – PPP$10 000 000
PPP$23 001 – PPP$40 000
PPP$12 001 – PPP$23 000
PPP$8 001 – PPP$12 000
PPP$5 001 – PPP$8 000
PPP$3 601 – PPP$5 000
PPP$2 401 – PPP$3 600
PPP$1 601 – PPP$2 400
PPP$801 – PPP$1 600
<PPP$800
- - - Average annual household income needed for the cheapest newly built house by a formal developer, 2017 Average annual household income using expenditure, 2017 (PPP$)
UGANDA
Annual income profile for rural and urban households based on consumption (PPP$)
No. of households (thousands)
PPP$12 179
PPP$38 727
Rural Urban2 000 1 500 1 000 500 0 500 1 000 1 500 2 000
Population: 42 862 958
Urbanisation rate: 5.50%
Cost of cheapestnewly built house:
76 000 000 UGXPPP$66 463
Urban householdsthat could afford thishouse with finance:
4.42%
1 PPP$:1 143.5 Ugandan
shilling

268
bill is seen as an attempt to protect tenants, saving them from arbitrary rent andutility increments by landlords of both commercial and residential premises. TheBill is still under discussion with a wide range of stakeholders.
OpportunitiesGeneral interest rates have continued to decline over the past two years leadingto a drop in housing loan rates from an average of over 22 percent toapproximately 17.5 percent, indicating, in part, availability of mortgage finance foreligible borrowers. Most borrowers with bank and microfinance housing loansare individuals and companies with regular, verifiable income. On the whole, theseborrowers constitute less than 38 percent of the working population. There istherefore a need to develop more inclusive housing finance products forprospective borrowers in the informal sector, as well as to develop mechanismswithin the mortgage product for underwriting informal incomes.
Additionally, developers are constrained by the inadequacy of appropriatelystructured project finance for the sector. Lenders in the sector structure developerloans in such a way that repayments for the facilities must be made monthly. Thisis well aligned to the financial institutions’ own funding obligations which may bemonthly, quarterly or bi-annually. However, because developers derive theirrepayment funds from the sale of housing units, which may not be regular, defaultsbegin to emerge, as a result not of market failures but rather structuringdeficiencies. Developer finance must be appropriately structured and tagged tothe sale of the funded units rather than tagged to the expiry of the time period.With relative success in the single-bedroom housing units’ segment, newdevelopers are likely to turn their focus on this market for future projects.
On the regulatory front, the country is still waiting for enabling regulations tosupport the creation of pension-backed mortgages. The Uganda RetirementBenefits Regulatory Act-2011, provides for the creation of such mortgages for thebenefit of pension-contributing members. However, the pension regulator hasnot yet released the governing regulations that would enable actual transactionsbetween lenders and such members.
Overall, improvements in public infrastructure, the completion of newhydroelectric power dams in Karuma, and the production of more cement willmost likely combine to increase reach for greenfield housing projects on affordableterms. To complement these developments, lenders will need to structureaffordable facilities in their product catalogues to maximise the latent demand foraffordable housing.
SourcesBusiness Daily. (2014). Banks start open loan-pricing July. 21 May 2014.http://www.businessdailyafrica.com/Banks-start-open-loan-pricing-July/-/539546/2322744/-/a8l3jhz/-/index.html (Accessed 17 Aug 2018).
The Compendium of Diaspora Business and Investment Opportunities. HousingSector. http://www.ugandainvest.go.ug/wp-content/uploads/2016/02/Compendium-of-Investment-and-Business-Opportunities-Vol-I.pdf (Accessed 8 August 2018).
The East African (2014). Uganda’s real estate sector set to thrive. 27 Dec 2014.http://www.theeastafrican.co.ke/news/Uganda-s-real-estate-sector-set-to-thrive-in-2015/-/2558/2570616/-/1ux7w9z/-/index.html (Accessed 17 Aug 2018).
Ministry of Finance Planning and Economic Development (2014). Poverty StatusReport. http://www.ug.undp.org/content/dam/uganda/docs/UNDPUg2014%20-%20POVERTY%20STATUS%20REPORT%202014.compressed.pdf (Accessed 2September 2018).
Ministry of Finance, Planning and Economic Development, Report on publicdebt, guarantees, other financial liabilities and grants for financial year 2017/18.March 2018.http://www.finance.go.ug/sites/default/files/Publications/REPORT%20ON%20PUBLIC%20DEBT%20%20GUARANTEES%20AND%20OTHER%20FINANCIAL%20LIABILITIES%20AND%20GRANTS%20FOR%20FINANCIAL%20YEAR%202017-2018.pdf (Accessed 26 July 2018).
Ministry of Lands Housing and Urban Development (2014). Habitat III NationalReport. http://habitat3.org/the-new-urban-agenda/preparatory-process/national-participation/uganda/
Uganda Bureau of Statistics. Uganda National Household Survey 2016/2017.https://www.ubos.org/onlinefiles/uploads/ubos/pdf%20documents/UNHS_VI_2017_Version_I_%2027th_September_2017.pdf (Accessed 30 July 2018).
Uganda Bureau of Statistics (2018). Quarter Two Key Economic Indicators(March 2018), Pg. 10. https://www.ubos.org/publications/statistical/30/ (Accessed10 August 2018).
The World Bank (2018). Increasing Tax Flow Key to Financing Uganda’s Growth,Development. 15 May 2018.https://www.worldbank.org/en/country/uganda/publication/increasing-tax-flow-key-to-financing-ugandas-growth-development (Accessed 26 July 2018).
Websiteshttps://ubos.orghttps://www.finance.go.ughttps://www.theeastafrican.co.kehttps://www.financetrust.co.ug/https://www.bou.org.ughttps://ug.equitybankgroup.com/
1 Uganda Bureau of Statistics (UBOS). Quarter Two Key Economic Indicators, March 2018.2 Bank of Uganda, State of the Economy Report, June 2018. Pg. 20. https://www.bou.or.ug/bou/bou-downloads/publications/StateOfEconomyReports/2018/Jun/State-of-the-Economy-Report-June-2018.pdf (Accessed
10 August 2018).3 UBOS CPI Publication, May 2017.4 Ministry of Finance, Planning and Economic Development, Report on public debt, guarantees, other financial liabilities and grants for financial year 2017/18, March 2018. Pg. 37.5 The World Bank. (2015). Increasing Tax Flow Key to Financing Uganda’s Growth, Development. 15 May 2015. https://www.worldbank.org/en/country/uganda/publication/increasing-tax-flow-key-to-financing-ugandas-
growth-development 6 Bank of Uganda. Private Sector Credit Data, February 2018.7 Uganda Bureau of Statistics. Quarter Two Key Economic Indicators, March 2018.8 Moody’s Investor Service (2018).9 Bank of Uganda. Monetary and Economic Sector Statistics. https://www.bou.or.ug/bou/rates_statistics/statistics.html 10 Ibid. 11 Ibid.12 Bank of Uganda, Monetary Policy Statement, February 2018. https://www.bou.or.ug/bou/monetary_policy/monetary_policy_statements.html (Accessed 26 July 2018).13 Uganda National Roads Authority Report (2017).14 The Uganda Retirement Benefits Regulatory Authority Act – 2011, restricts direct lending of pension assets to commercial banks but permits lending through creation of short-term deposits and marketable
securities such as corporate bonds. National Social Security Fund (NSSF) the largest government owned pension fund has is exploring ways of working with property developers and banks to support boosthousing supply and improve access to credit. The pension fund must however find a way around several government procedural requirements to achieve this objective.
15 Hima Cement Industry data (2018).16 Uganda Bureau of Statistics. Uganda National Household Survey 2016/2017.17 Agora (2018). Understanding the Needs of Urban Refugees and Host Communities Residing in Vulnerable Neighborhoods of Kampala. https://www.kcca.go.ug/news/302/kampala-urban-refugees-and-host-
community-needs-report-2018#.W4v9Ny2B2Rs 18 Uganda Bureau of Statistics. Uganda National Household Survey 2016/2017.19 Uganda Bureau of Statistics. Uganda National Household Survey 2016/2017. 20 CAHF (2018) Understanding and quantifying rental markets in Africa. Focus Note: Uganda.21 These housing projects are delivered by individuals. A project comprises one or two blocks of 10 to 15 2-bedroom flats.

Africa Housing Finance Yearbook 2018
269
economy, weak market competition, and an inability of financial services providersto tap into the informal markets and the financial needs of low income homeseekers.
There are 19 licensed and registered commercial banks with 329 branches14 anda total loan portfolio of ZMW24.24 billion (US$2.4 billion),15 as at March 2018,of which only ZMW816 million (US$80.79 million) or 3.4 percent were directedto Real Estate, up from 2.3 percent in 2014. All commercial banks offer homeloan products at lending rates ranging between 24.6 percent and 35.8 percent.16
Foreign bank subsidiaries dominated the sector commanding 97 percent of theprofit share and issuing 68 percent of all loans compared to just 20 percent issuedby local banks and 12 percent by local private banks. Zambia National CommercialBank, in which Government holds a 25 percent stake, is the largest provider oflocal financing, with a net worth of ZMW3 504.7 million (US$347 million).
The Bank of Zambia has gradually reduced its policy rate cap from 15.5 percentin January 2017, to 9.75 percent as at April 2018. The maximum interest ratecharged by non-banking financial institutions and Microfinance Institutions (MFIs)however remained at 1.6 and 2.3 times of the BoZ policy rate.
OverviewZambia is a lower middle-income country with GDP per capita (current) ofUS$1 475.70,1 GDP growth of 3.9 percent2 and GNI per capita (Atlas method,current), of US$1 300.3 Copper mining provides 70 percent of exports and12 percent of GDP with 80 percent of Foreign Direct Investment (FDI) attributedto the mining sector.4 Zambia’s economy has been affected by frequent poweroutages, budget deficits, poor rainfall, high unemployment of 15 percent, and 8.1percent inflation rate, exchange rate depreciation and an external debt ofZMW88.78 billion (US$8 790 million).5 In 2017 the economy recovered due toa good crop harvest, better electricity supply, increased FDI of ZMW2.26 billion(US$223 million)6 and Official Development Assistance (ODA) of ZMW8.05billion (US$797 million).7 Government has launched the “Zambia Plus” economicrecovery programme to diversify and stabilise the economy.
Zambia’s population of 17.6 million is growing at three percent per year , doublingevery 25 years, and is expected to reach 41 million in 2050. Approximately39.4 percent (or 7 239 024 people) live in urban centres, which is expected toincrease to 12 million in 2030 and 25.7 million in 2050, reflecting a need for amore focused national housing strategy.8 Poverty stands at 54.7 percent9 withhigh inequality at 0.69 GINI co-efficient and 77 percent of the poorest living inrural areas.10 Zambia’s median age is 17.2 years while life expectancy increasedto 61.8 years in 2016 from 56.6 years in 2010.11
Access to finance In Zambia access to finance is not universal although the situation is improving. A2015 Finscope survey found that 41 percent Zambians (approximately 39 percentmen and 43 percent women) were financially excluded while 59 percent(4.8 million) were financially included, exceeding government’s 50 percent target.An estimated 24.8 percent (2 million) adults used bank services while 28.5 percent(2.3 million) used non-bank financial services. Approximately 6.5 percent of adults(0.4 million) belonged to some form of Savings Group (or Chilimba) while 12.5percent (1 million) were members of Rotating, Savings and Credit Associations(ROSCAs).12
In 2017, a Financial Sector Deepening (FSD) Zambia survey found that 30 percentof urban and 50 percent of rural dwellers were financially excluded while manyFSPs preferred to locate along the economic and transportation routes and moredensely populated areas.13 Barriers to financial inclusion include a cash-based
Zambia KEY FIGURES
Main urban centresLusakaLivingstone
Exchange rate: 1 US$ = [a] 23 Sept 2018PPP Exchange rate (Local currency/PPP$) 1 Zambian kwacha = [b]Inflation 2016 [c] | Inflation 2017 [c] | Inflation 2018 [c]
10.10 Zambian kwacha3.50n/a | 7.60 | 8.10
Population 2017 [b] | Urban population size 2017 [b] Population growth rate 2017 [d] | Urbanisation rate 2016 [e]Percentage of the total population below National Poverty Line [c]Unemployment rate [c]
17 094 130 | 7 152 1842.90% | 4.2%56.2%15.0%
GDP (Current US$) 2017 [b] | GDP growth rate annual 2017 [b]GDP per capita (Current US$) 2017 [b]GNI per capita (Current US$) 2017 [b]Gini co-efficient 2016 [e]HDI global ranking 2016 [f] | HDI country index score 2016 [f]
US$25 808 million | 4.08%US$1 509US$1 30069.00164 | 0.58
Is there a deeds registry? Number of residential properties that have a title deed Lending interest rate [g] Mortgage interest rate | Mortgage term (years)DownpaymentMortgage book as a percentage of the GDPEstimated number of mortgages Price to Rent Ratio in City Centre | Outside City Centre Gross Rental Yield in City Centre | Outside City Centre Construction as a % of GDP
yesn/a15.50%31% | 2020%3.00%n/an/a | n/an/a | n/an/a
What is the cost of standard 50kg bag of cement? What is the price of the cheapest, newly built house by a formaldeveloper or contractor? (Local currency)What is the price of the cheapest, newly built house by a formaldeveloper or contractor? (US$) What is the size of this house (m2)? What is the average rental price for this unit (US$)? What is the minimum stand or plot size for residential property?
US$5.80
650 000 Zambian kwacha
US$65 00070m2
US$375240m2
Ease of Doing Business Rank [h]Number of procedures to register property [h]Time to register property (days) [h]Cost to register property (as % of property value) [h]
149645 days10.00%
NB: Figures are for 2018 unless stated otherwise.
[a] Coinmill.com[b] World Bank World Development Indicators[c] Central Statistical Office (CSO)[d] Central Intelligence Agency (CIA) World Factbook[e] UN Habitat [f] UNDP Development Indicators [g] Bank of Zambia [h] World Bank Doing Business
Member organisations of the African Union for Housing Finance (AUHF):Zambia National Building SocietyZambian Home Loans

270
Mortgage financing remains the main source of formal housing finance with theZambia National Building Society (ZNBS) commanding over two-thirds of themortgage market share. In late 2017, ZNBS obtained a US$25 million (ZMW252million) loan facility from the African Development Bank,17 enabling it to build itsinstitutional capacity and provide mortgages for affordable housing in Zambia.Other lenders include Pan African Building Society, Finance Building Society, FirstNational Bank, Madison and Meanwood Finance companies, Royal Money Lenderand Zambia Home Loans, which has obtained a ZMW5.05 million (US$500 000)Loan Facility from FSD Africa for construction mortgages and loans for diasporaZambians.18
The net mortgage and loan portfolio for all building societies decreased fromZMW799 million (US$79 million) in 2016 to ZMW637 million (US$63 million)in December 2017 while total deposits increased from ZMW421 million (US$41million) deposit in 2016 to ZMW479 million (US$47 million) in December 2017.Of the total deposits, ZMW277 million (US$27 million) were personal savings.Mortgage lending interest rates ranged between 31.5 percent and 51 percent in2018.19 Long term demand remained high in Lusaka, Copperbelt and NorthWestern regions. A new policy to allow movable assets to be used as collateralhad not yet been approved, limiting access to secured credit.
Barriers to Zambia’s housing financing sector, however, include expensive wholesalefinance, short maturities on available funds, few reinsurance firms, inadequatematched funding for long term credit, and high default rates. For borrowers, accessto mortgage finance is constrained by high interest rates, high transaction costs(usually more than 5 percent of total loan value), deposit requirements of between20 and 30 percent, collateral requirements in the form of title deeds, and relativelyshort loan repayment terms from two to 15 years.
In 2018 there were 25 registered and licensed MFIs, a reduction from 36 in 2017.MFIs disbursed over ZMW3.38 million (US$334 653) in loans and advances as ofDecember 2017.20 BoZ requires an MFI to have at least 80 percent of its totalloan portfolio serving MSMEs, less than 20 percent serving individuals in formalemployment and an average loan size per borrower not exceeding ZMW2 500(US$247). Most MFIs are non-bank payroll based consumer lenders, accountingfor approximately 90 percent of total MFIs assets; four are micro-enterprise lenderswhile six are deposit-taking financial institutions in terms of the 2006 Banking andFinancial Services Act.
In 2018 MFI’s offered housing loan products ranging between ZMW2 000(US$198) and ZMW350 000 (US$34 653) with a maximum loan term of60 months. MFI’s high interests have contributed to the high number of non-performing loans, closure of marginal branches with high operating costs, and adecrease in number and loan size. In 2006, the Bankers Association of Zambia(BAZ) established the first credit reference system which was purchased byTransUnion in 2012 and remains the sole credit reference bureau in Zambia.
Lafarge has partnered with BancABC and ZNBS to disburse loans of up toZMW2 500 (US$247), and with ILO Zambia Green Jobs Programme (ZGJP)21
to construct 800 affordable houses using Habiterra blocks. Lafarge has alsopartnered with Habitat for Humanity (HfHZ) to construct 2 150 houses, providing1 000 bags of cement and free technical designs. Since 2017 Lafarge has pilotedthe Kumanga franchise to promote access to cheaper building materials andestablished one-stop Home Builders Centre to provide technical and financialsupport to clients.
Zambia’s pension funds industry had total assets of ZMW71.8 billion at end 2016,and total assets employed for investment purposes of ZMW6 656 million in 2016.Of this, 23 percent was directly invested in property.22 Despite pension-backedlending being permissible by Zambian law, this is not common.
Informal finance is administered by ROSCAs for small loans and homeconstruction or purchase. The Swalisano Urban Poor Fund, established in about2007 by the Peoples’ Process on Housing and Poverty in Zambia (PPHPZ) enablesmembers to access low-interest loans. No recent information is available on theiractivities, however.
AffordabilityFormal, developer-delivered housing in Zambia is expensive, and as a result, mosthousing is self-built. Pam Golding’s online estate agency site reports 51 housesfor sale in Zambia, with the cheapest newly built home (two bedrooms, one bath,76m2 on a 467m2 plot of land) listed as ZMW750 000 (US$61 300) in September2018.23 Property24, another online property website, lists a two bedroomtownhouse for sale in New Kasama as the lowest priced, new house in theirdatabase, at ZMW350 000 ($28 600) in September 2018.24
Housing supplyZambia’s housing deficit was estimated in 2012 at 1 539 000 units and is projectedto increase to 3.3 million units by 2030.25 UN-Habitat has forecast a deficit of1.3 million urban units by 2030, if no efforts are made to deliver at least 46 000units per annum until 2030. According to the 2015 Living Conditions MonitoringSurvey Report, there were just over 3 million dwellings in Zambia. Just over halfof these (53.5 percent) were traditional huts, and another 2.85 percent weredetached houses. Ten percent of all dwellings were flats or apartments, and 5.5percent were semi-detached houses. Just under half of all dwellings (53 percent)were in urban areas.26
Under the 7th National Development Plan (NDP) Government plans to deliver10 000 units annually per district or 1 150 000 units nationally, an increase from73 000 annually in 2016. Most houses will be built in the 42 newly created districts,the Copperbelt, North Western and Lusaka Provinces. Approximately 194 600Ha of land will be required of which 139 000 Ha is for housing and 55 600 Ha foramenities and infrastructure. Government’s allocation of ZMW823 million(US$81.48 million) or 1.3 percent of the 2017 budget to housing, however, is wellbelow the financing need.27
Mining houses, local authorities and other employers were once compelled byemployment contracts to provide housing but their role has significantly diminishedwith economic liberation and government reforms. Housing supply is now byeither private developers or individual self-built, mainly for rent or owner-occupation, with the latter taking up to seven years to complete. Many peoplewho cannot afford homeownership or pay market rentals have moved into lowincome or informal settlements.
In 2012, UN Habitat established that the National Housing Authority (NHA) hadproduced less than 100 units per annum since 1994.28 Since then, NHA secureda loan from Shelter Afrique for affordable housing construction, and partneredwith private Malaysian company (MKP) to develop the Lusaka North GateGardens complex. Most of this development, however, has remained unoccupieddespite a recent 30 percent reduction in the asking price. High costs ofconstruction and bulk service provision have escalated the cost per unit makingthem unaffordable to the majority Zambians.29 The National Pension SchemeAuthority (NAPSA) has also been involved in affordable housing delivery, with justover 1 000 units in three projects delivered.30 While some of these were alsotargeted at high income earners, pricing has been an issue: NAPSA recentlyreduced the price of its 438-unit Kalulushi Housing Complex on the Copperbeltby 30 percent, put some units on rent-to-own basis and has partnered withBuilding Societies to sell the units using mortgages.
Private developers such as Meanwood, Lilayi Estates, Silverest Gardens, Nkwashi,Roma, Vorna Valley, Salama Park, KB Davies (Chambishi and Woodgate) and FinanceBuilding Society (Finsbury Park Project), continue to build mainly top end unitsper annum, supported by the state with land provided at minimal cost. SmartHomes Africa has focused on student housing and high end two to four-bedroomunits, while Phathisa31 has funded 1 000 (52-56m2) mixed income units on sevenhectares and 192 walk-up two bed apartments on 1.7 hectares at Makeni inLusaka. In 2017, Development Bank of Zambia, obtained ZMW1587.7 million(US$157 million) from a Chinese bank, ICBC, to construct 2 000 homes forsecurity personnel.32
NGOs such as HfHZ, Zambia Homeless and Poor People’s Federation (ZHPPF),PPHPZ, Shelter for All and the UK-based Reall help to fill the affordable housingsupply gap through organized collective action. HfHZ secures land from LocalAuthorities and then provides micro loans.

Africa Housing Finance Yearbook 2018
271
Property marketsThe residential property market is largely dominated by self-build homes, mainlyfor rent or owner occupation, with a small resale market as most housing stock isinformal and requires upgrading to suitable standards. Demand for high-endquality housing, however, has stimulated development of modern housing clustersand gated communities. Private developers and individuals can obtain 99 yearleaseholds with no limitations and land is transferable. Government is reformingand streamlining the land administration system to make it more efficient andtransparent for housing delivery.
There are multiple barriers to affordable residential property markets, includingexchange rate fluctuations; land use planning and management issues such aslengthy environmental approvals for new housing developments, and an inefficientland delivery system. According to the World Bank’s Ease of Doing BusinessReport, Zambia ranked 85 out of 190 countries in 2018. In dealing withconstruction permits, Zambia scores 69th overall. The ten procedures involvedtake 189 days, but only cost 3.1 percent of the value of the property. In registeringproperty, however, Zambia scores 149th overall. In Lusaka, the six steps involvedin registering property take 45 days and cost 9.9 percent of the property value.Zambia scores low on the quality of the land administration index, with a scoreof seven out of 30.33
Policy and regulationZambia has well-developed policy and regulations to promote access to housingfinance. An expected National Housing Sector Development Policy aims toincrease housing production by facilitating reforms to the housing finance system;increasing government financing and developing public social housing estate fundsand group housing improvement finance schemes; improving affordability ofmortgages by providing mortgage guarantee schemes; fiscal incentives to privatefinancial institutions and introduce mortgage specific policy rates.
The 7th NDP34 provides for the construction of 100 000 affordable housesannually for the next five years while the enactment of the Urban and RegionalPlanning (URP) Act (2015), Lands Act (1995) and Urban and Regional PlannersAct (2014) provides further impetus for private sector participation. The URPAct recognises informality enabling households to obtain Occupancy Licenses,Land Records and titles to be used as collateral for housing finance. It also providesfor incremental housing development, conversion of 30 year OccupancyCertificates to 99 year leases, and mandates Local Authorities to engage TraditionalLeaders to release additional land and frames improvements to land registrationand titling.
Delayed legislative reforms around collateral and credit recovery; slow landdelivery system; delays in approval of the Draft Land and National UrbanisationPolicy are barriers to enabling a nation-wide housing delivery programme. TheZMW6 billion (US$594 million) land audit programme is expected to improveland titling and registration and enhance access to housing finance.
OpportunitiesZambia’s property market is growing rapidly; attracting private equity andinvestment and proving to be a resilient and risk tolerant long-term investmentdestination. The residential property market remains largely untapped andunattended, however. The focus on the high end of the housing market leaves alarge gap in medium and low cost housing, an opportunity area for privateinvestment.35 Political economic analysis indicates a contentious and dynamic butgenerally stable political environment with several progressive policies, includingthe new National Housing Policy but little to show in terms of implementation.The political will to overcome the housing deficit exists as reflected inGovernment’s effort to create 42 new districts, bringing the total to 115 districts.An opportunity exists to construct formal housing in these newly created districts.With over two-thirds of the total housing stock classified as informal, anopportunity exists to upgrade, improve housing standards and increase both thequality and market value. Housing microfinance sector remains a huge growtharea with significant potential in increasing affordable loans and mortgages for lowand medium income earners and expanding financial inclusion targeting themajority poor.
Websites African Development Bank (2018). http://www.afdb.org/ African Development Bank (2018). http://www.africaneconomicoutlook.org/ Bank of Zambia. http://boz.zmFSDZambia. www.fsdzambia.org ILO Zambia (2017). http://www.ilozambia.org.zmLusaka Times (2018). http://www.lusakatimes.com Mixmarket (2018). http://www.mixmarket.org/
Source https://www.cgidd.com/
PPP$40 001 – PPP$10 000 000
PPP$23 001 – PPP$40 000
PPP$12 001 – PPP$23 000
PPP$8 001 – PPP$12 000
PPP$5 001 – PPP$8 000
PPP$3 601 – PPP$5 000
PPP$2 401 – PPP$3 600
PPP$1 601 – PPP$2 400
PPP$801 – PPP$1 600
<PPP$800
- - - Average annual household income needed for the cheapest newly built house by a formal developer, 2017 Average annual household income using expenditure, 2017 (PPP$)
ZAMBIA
Annual income profile for rural and urban households based on consumption (PPP$)
No. of households (thousands)
PPP$12 881
PPP$184 634
Rural Urban400 300 200 100 0 100 200 300 400
Population: 17 094 130
Urbanisation rate: 4.23%
Cost of cheapestnewly built house:
650 000 ZMWPPP$185 714
Urban householdsthat could afford thishouse with finance:
8.49%
1 PPP$:3.5 Zambian
kwacha
272
1 IMF (2018). Zambia Data Portal, Central Statistical Office. GDP per Capita by Country. Statistics from IMF,1980-2023: Zambia. http://zambia.opendataforafrica.org/pjeqzh/gdp-per-capita-by-country-statistics-from-imf-1980-2023?country=Zambia (Accessed 28 Sept 2018).
2 World Bank (2018). The World Bank in Zambia. https://www.worldbank.org/en/country/zambia/overview(Accessed 28 Sept 2018).
3 World Bank (2018). GNI per capita, Atlas method (current US$) Zambia.https://data.worldbank.org/indicator/NY.GNP.PCAP.CD?locations=ZM (Accessed 28 Sept 2018).
4 World Bank (2018). The World Bank in Zambia. https://www.worldbank.org/en/country/zambia/overview(Accessed 28 Sept 2018).
5 Exchange Rate from http://www.coinmill.com as at June 2018.6 IMF (2018). Zambia Data Portal, Central Statistical Office. GDP per Capita by Country. Statistics from IMF,
1980-2023: Zambia. http://zambia.opendataforafrica.org/pjeqzh/gdp-per-capita-by-country-statistics-from-imf-1980-2023?country=Zambia (Accessed 28 Sept 2018).
7 The World Bank Group (2017). World Bank Open Data. https://data.worldbank.org/ 8 UNDESA (2018). www.worldometers.info/world-population/zambia-population/ (Accessed 24 Sept 2018).9 The World Bank Group (2018). https://data.worldbank.org/country/zambia (Accessed 27 Sept 2018).10 CAHF (2017). http://housingfinanceafrica.org/documents/2017-housing-finance-africa-yearbook/ (Accessed
28 Sept 2018).11 The World Bank Group (2018). https://data.worldbank.org/country/zambia (Accessed 27 Sept 2018).12 Financial Sector Deepening Zambia (2016). FinsScope 2015. http://www.fsdzambia.org/finscope-2015/
(Accessed 28 Sept 2018).13 FSD Zambia (2018). Zambia: demand, Supply, Policy and Regulation. Financial Inclusion Summary Report
2018. http://www.fsdzambia.org/wp-content/uploads/2018/02/MAP-Zambia-Summary-report-final.pdf(Accessed 28 Sept 2018).
14 Bank of Zambia (2017). http://www.boz.zm/Financialandotherstatistics2017Final.pdf 15 Bank of Zambia (2018). http://www.boz.zm/StatisticsFortnightly2018Vol25No9.pdf 16 Bank of Zambia (2018). www.boz.zm 17 Lusaka Times (2018). AfDB approves US$25 million Loan to Zambia National Building Society.
12 November 2018. https://www.lusakatimes.com/2017/11/12/afdb-approves-us-25-million-loan-zambia-national-building-society/ (Accessed 28 Sept 2018).
18 FSD Africa (2018). https://www.fsdafrica.org/news/fsd-africa-invests-1-6-million-in-african-housing-finance/ 19 Bank of Zambia (2018). http://www.boz.zm/Non-Banks-Financial-Statements-for-2017.htm20 Bank of Zambia (July 2018). http://www.boz.zm/quarter-4-nbfi-FS.htm
21 ZGJP is a project of the Government of Zambia, Government of Finland and ILO Zambia.http://www.zambiagreenjobs.org/index.php (Accessed 28 Sept 2018).
22 Pensions and Insurance Authority (2016). Annual Report. http://www.pia.org.zm/download/file/fid/409(Accessed 24 Sept 2018).
23 Pam Golding Properties, Zambia. https://www.pamgolding.co.za/property-search/houses-for-sale-zambia/2656(Accessed 28 Sept 2018).
24 Property24: Zambia. www.property24.co.zm (Accessed 28 Sept 2018).25 UN Habitat (2012). Zambia Urban Housing Sector Profile Study. https://unhabitat.org/books/zambia-urban-
housing-sector-profile/ (Accessed 24 Sept 2018).26 Central Statistical Office (2016). 2015 Living Conditions Monitoring Survey Report.
https://www.zamstats.gov.zm/phocadownload/Living_Conditions/2015%20Living%20Conditions%20Monitoring%20Survey%20Report.pdf (Accessed 24 Sept 2018).
27 Ministry of National Development Planning, Zambia (2017). Seventh National Development Planhttp://www.mndp.gov.zm/download/7NDP.pdf (Accessed 28 Sept 2018).
28 UN Habitat (2012). Zambia Urban Housing Sector Profile Study. https://unhabitat.org/books/zambia-urban-housing-sector-profile/ (Accessed 24 Sept 2018).
29 Interview with Anderson Zulu, Projects Director, July 2018.30 Lungu, F (2018). Life after retirement from NAPSA’s lens. Daily Mail 15 August 2018. http://www.daily-
mail.co.zm/life-after-retirement-from-napsas-lens/ (Accessed 24 Sept 2018).31 Phatisa is a Private Equity Manager that manages the Pan African Housing Fund.32 Reuters (2017). Zambia gets Chinese finance to build 2,000 houses for military. 30 March 2017
https://af.reuters.com/article/africaTech/idAFKBN17129D-OZATP (Accessed 24 Sept 2018).33 World Bank (2018). Ease of Doing Business in Zambia.
http://www.doingbusiness.org/en/data/exploreeconomies/zambia#DB_dwcp (Accessed 24 Sept 2018).34 Ministry of National Development Planning, Zambia (2017). Seventh National Development Plan
http://www.mndp.gov.zm/download/7NDP.pdf (Accessed 28 Sept 2018).35 Interview with Alexander Chileshe, UN Habitat Zambia Office, July 2018.

Africa Housing Finance Yearbook 2018
273
budget, the Minister of Finance, Mr Patrick Chinamasa stated that Zimbabwe willrevise the stagnated 2015 Lima Plan, a debt clearance programme betweenZimbabwe and international finance institutions.
Zimbabwe’s inflation, pegged at 0.21 percent in March 2017 by the IMF, is nowexpected to be at 5 percent by the close of 2018. Inflation continues to be anissue since the adoption of the multi-currency economic regime in 2009 with theUS dollar serving as the primary currency.8
Persistent liquidity challenges and the introduction of the bond note, a surrogatecurrency that is touted through official government communication as trading atpar with the US dollar, have created a pricing distortion in the economy. In aninterview with GAP Solutions (a pan-African consulting firm) on 17 May 2018,Justin Machibaya, the Group Managing Director of Homelux Real Estate said thatthe housing finance sector has been greatly affected by the prevailing tiered pricemodel. Homeowners value their properties in US dollars, because of thediscrepancy between the US dollar and the other methods of payment. Bond
OverviewFollowing a military-backed but generally bloodless intervention in November2017, Robert Mugabe’s presidency came to an abrupt end and precipitated atransition that catapulted the recently-sacked Vice President EmmersonMnangagwa to the Presidency. The international community watched closely asthe events unfolded, confirming the importance of the end of 93-year-old Mugabe’srule. Zimbabwe had firmly established itself as a pariah state following thewithdrawal from the Commonwealth and coupled with the various economic andtargeted sanctions that were imposed on the landlocked country. The adverseeconomic effects of the 18-year long isolation were evidenced by the largepopulation of the Zimbabwe diaspora. South Africa alone is estimated to be hometo over 5 million legal and illegal Zimbabweans living in the country.1
On 26 August 2018, Mnangagwa became the duly elected president of Zimbabweafter a heavily contested election in which the main opposition party, the MDCAlliance, alleged collusion between the ruling ZANU PF and the ZimbabweElectoral Commission. The election result dispute degenerated into protests andsix people were confirmed dead during the violent clashes. Mnangagwa’s victorywas upheld by a constitutional court ruling following a challenge by the opposition.The United States of America (USA) noted that significant improvements in basichuman rights still needed to be implemented. In August 2018, providing a clearsign that the international community is not convinced by the reformist rhetoricof the President,2 US President Trump signed an amendment into law of thesanctions first instituted against Zimbabwe in 2001, extending them for a further5 years.3 In a more positive development, the United Kingdom, pledged itssupport to the Zimbabwean government,4 and reaffirmed an earlier pledge tosupport Zimbabwe’s bid to rejoin the Commonwealth.5
Zimbabwe successfully cleared its arrears to the IMF in October 2016. In January2018, Mnangagwa continued to augment efforts to reintegrate Zimbabwe intothe global economic space, most notably by attending the World Economic Forumin Davos, Switzerland. Mnangagwa highlighted his intent to institute wide rangingmeasures to increase the ease of doing business in Zimbabwe, and to bolsterinvestor confidence by tackling corruption.6 Mnangagwa also met with theInternational Monetary Fund (IMF) Managing Director where she indicated thatthe relationship between Zimbabwe and the IMF was turning into a positive onebut she highlighted the significant debt exposure as a huge challenge.7 In the 2018
ZimbabweKEY FIGURES
Main urban centresHarareBulawayo
Exchange rate: 1 US$ = [a]PPP Exchange rate (Local currency/PPP$) 1 United States Dollar = [b]Inflation 2016 [c] | Inflation 2017 [c] | Inflation 2018 [c]
1 United States Dollar
0.50-1.57 | 1.25 | 5.16
Population [d] | Urban population size [d] Population growth rate [e] | Urbanisation rate [f]Percentage of the total population below National Poverty LineUnemployment rate
16 913 261 | 5 252 8502.32% | 2.44%n/an/a
GDP (Current US$) 2017 [b] | GDP growth rate annual 2017 [b]GDP per capita (Current US$) 2017 [b]GNI per capita (Current US$) 2017 [b]Gini co-efficient HDI global ranking 2017 [g] | HDI country index score 2017 [g]
US$17 846 million | 3.5%US$1 079US$910n/a156 | 05.35
Is there a deeds registry? Number of residential properties that have a title deed Lending interest rate [h] Mortgage interest rate | Mortgage term (years)DownpaymentMortgage book as a percentage of the GDPEstimated number of mortgages Price to Rent Ratio in City Centre | Outside City Centre Gross Rental Yield in City Centre | Outside City Centre Construction as a % of GDP [i]
Yesn/a12.00%12% | 2525%n/an/an/a | n/an/a | n/a2.10%
What is the cost of standard 50kg bag of cement? What is the price of the cheapest, newly built house by a formaldeveloper or contractor? (Local currency)What is the price of the cheapest, newly built house by a formaldeveloper or contractor? (US$) What is the size of this house (m2)? What is the average rental price for this unit (US$)? What is the minimum stand or plot size for residential property?
US$11.30
18 000
US$18 000150m2
n/a200m2
Ease of Doing Business Rank [j]Number of procedures to register property [j]Time to register property (days) [j]Cost to register property (as % of property value) [j]
159536 daysn/a
NB: Figures are for 2018 unless stated otherwise.
[a] Coinmill.com[b] World Bank World Development Indicators[c] Statista.com[d] Worldometers[e] Worldpopulationreview.com[f] Indexmundi[g] UNDP Development Indicators[h] Trading Economics[i] Zimbabwe Ministry of Finance[j] World Bank Doing Business
Member organisations of the African Union of Housing Finance (AUHF):NMB Bank LimitedCBZ Bank Limited

274
notes, Real Time Gross Settlement (RTGS)9 and mobile money transfers all attractdifferent premiums based on the prevailing exchange rates to the US dollar.10
This confuses property value and financing.
A significant number of Zimbabweans remain either unemployed or on reducedsalaries, reducing the number of qualifying loans. Although mortgage loanrepayments are marginally lower than rental of a similar property, the applicationguidelines preclude the majority of Zimbabweans by conditions such as 12 months’continuous employment as well as guarantees from employers that salaries bepaid through the financier and on time. In Zimbabwe’s precarious economicenvironment not many employers have the confidence to make suchcommitments.
Government has not made any substantive statements addressing the cashshortages or the price distortions, which effectively implies that there is no clearstrategy on how to curtail the concomitant economic effects. Newly appointedVice President and former Army General, Constantino Chiwenga was corneredinto addressing this issue at a political rally in Hopley, a constituency near Harare.11
The residents demanded to know what steps the government was taking toaddress the premiums imposed on “Ecocash” , the most prominent mobile moneyplatform, by their agents, as well as their stance on “land barons” (illegal landholders, often connected to the political elite, who take advantage of homeseekers, by “selling” land illegally acquired). Chiwenga acknowledged that thedistortions were indeed a reality and promised to legislate stiff penalties for cashdealers and land barons.
Double-digit lending rates continue to constrain economic recovery. Zimbabwestill experiences structural regression, with acceleration of de-industrialisation andeconomic informalisation. These challenges are caused by difficult economicproblems, including infrastructure and regulatory deficiencies, policy uncertaintyand insufficient formal employment.
Access to financeAs at 30 June 2018, the number of licensed banking institutions remain constantat 20 operating banking institutions including the central bank, thirteen commercialbanks, one merchant bank, four building societies and one savings bank. Twosignificant developments within the commercial banking sector were therebranding of MBCA Bank to Nedbank, the parent company, and the sale ofBarclays stake in Zimbabwe to a Malawian Bank. Under the Reserve Bank'sfinancial inclusion drive there has been noteworthy movement with an increasein the registration of microfinance institutions from 168 in June 2016 to 187 inJune 2018.12
The four functioning building societies, National Building Society (NBS), FBCBuilding Society, CABS, and ZB Building Society are the country’s major source ofhousing finance. In March of 2018, Steward Bank announced that the bank wasnow offering loans to Zimbabweans living and working in the diaspora to eitherbuild or buy a home in Zimbabwe with financing from US$10 000 up toUS$200 000. The applicant must have a work permit, residence permit or visa inthe country he or she is a resident of, and should have either a valid Zimbabweanpassport or Zimbabwean ID to be considered.13
Despite the reforms adopted by the new president on doing business as well astackling corruption, the World Bank Ease of Doing Business report does not yetecho these sentiments. Zimbabwe only progressed by one spot to 159 from theprevious year’s 160.
The Banking Amendment Act 2015, introducing the Credit Reference Registry, adatabase of credit information of individuals and companies and housed at theReserve Bank of Zimbabwe (RBZ), was implemented in January 2017. The Actmandated all financial institutions offering credit facilities, including banks, micro-finance institutions, utility bodies, retailers, and mobile network operators to supplycredit information to the Registry. As of June 2017, The Office of the Presidentand Cabinet stated that data relating to nearly 85 percent of all loans was uploadedonto the platform.14
Mortgage lending remains largely undertaken by the Building Societies. StewardBank recently carved out what promises to be a high-value niche in the mortgage
lending sector by providing mortgage loans to Zimbabweans living and workingin the diaspora. Unlike residents, Zimbabweans working abroad typically haveconsistent and higher income, making them an attractive segment. Mortgagelending rates retained their range of 15-20 percent. As the traditional leader, CABScontinues to require 10 percent of the property value as deposit, in addition to10 percent of the value paid towards property transfer fees. Stanbic Bankcontinues its requirement of exclusive banking for a minimum of 12 months, fivepercent of the property value and five percent for property transfer fees.
The government continues to waiver stamp duty on cession of mortgage bondsin order to incentivise provision for additional mortgages, a waiver introduced inJanuary 2015.
Lending in the Banking sector remains short term: notwithstanding the introductionof bond rates, the rate of demand deposits continues to rise. The public’s fearthat the introduction of bond notes will bring back inflation have beensubstantiated. The liquidity crunch meant to be halted by bond notes has persistedand worsened: US dollars in hard currency attract a premium, further drivingdemand for the currency and leading to more shortages. Bank withdrawal limitshave been reduced and withdrawals happen as and when the currency is availableand is paid out in coins of denominations of 5 cents, 10 cents, 25 cents, 50 centsand 1 dollar, as the notes are also in short supply.15
Limited availability of affordable long-term finance impacts negatively on the abilityof mortgage lenders to provide affordable mortgages; as such, lenders pass highborrowing costs to customers. A pricing distortion of goods and commodities inZimbabwe exists due to the premium attached to other methods of paymentintended to match the exchange rate of these payment channels to the US dollar.Banks make payments on mortgage loans through the RTGS system, and thisamount is everywhere accepted to have a lower value than hard currency in USdollars. The distortion is sometimes evident in multi-tiered pricing effected byhome sellers where different prices are listed for a property depending on themethod of payment.
The drive to make the economy cashless has not been welcomed as widely asanticipated and has instead driven price hikes and cost distortions especially sinceZimbabwe remains a gross importer. While the volumes and values of transactionsmade via electronic payments continue to increase significantly, these statistics aredriven only by a lack of alternative which many retailers and businesses have takenadvantage of by charging up to 30% extra for any transaction not paid for in cash.The RBZ reported in May that the number of Point of Sale machines throughoutthe country had reached 70 000, while electronic payments were stated to nowconstitute 95% of all transactions in retail outlets. Echoing the sentiments madeby the then Vice President, Emmerson Mnangagwa last year, the RBZ chiefreiterated that efforts were still being made to reduce the cost to customer ofelectronic payments, which the regulator concedes are still too high.16
Zimbabwe continues to witness an increase in access and affordability of housingfinance, due to the relaxation of the terms and requirements in some housingdevelopment projects. Although credit risk is taken into account by housing financelenders, the interest rates for most borrowers remain unchanged, with 8-16percent a year for regular borrowers, 6-10 percent a year for prime borrowerswith low credit risk, and 10-18 percent a year for borrowers with high credit risk.
To enable low income earners to access housing finance, building societiescollaborate with employers for loans at subsidised rates. Partnerships existbetween the banks and local councils, wherein the bank acts as a developer andthe council provides the land at a cheaper cost or contributes to the housingproject. Microfinance loans run over a shorter term compared to loans frombanks and usually have higher interest rates, though they offer quicker turnaroundtimes for application processing and approval, making them more attractive tothose that qualify for their loans.
AffordabilityThe sustained cash shortages will cause Zimbabwe’s economy to remain fragileand contracted. The economic contraction is contributing to increased job lossesand further erosion of disposable incomes, resulting in increases in poverty. Thiscontinues to affect the affordability of housing finance

Africa Housing Finance Yearbook 2018
275
The Budiriro CABS project, which began in 2012, was hampered by low uptake,with various stakeholders citing the high cost as one of the reasons the unitsremained unattractive. Confidence in the project also suffered greatly after reportsabout the poor construction workmanship started surfacing. Various initiativeswere taken to try to hasten uptake, with little success until 2018. Approximately2 000 units have now been sold, up from a meager 800 units in June of theprevious year. Further relaxation of the terms and requirements have encouragedthe interest in the Budiriro Units. One of the changes includes scrapping thedeposit requirement altogether, permitting customers with a proven track recordof consistent income to let the houses for a year and allowing the payments to gotowards deposit.17 Zimbabweans in the diaspora as well as corporates are alsoeligible to purchase the housing units upon meeting the mortgage criteria.
The National Social Security Authority (NSSA), through its bank the NBS, recentlylaunched an ambitious project in the Dzivarasekwa high density suburb to deliverlow cost housing. The authority injected US$17 million to deliver 600 housestowards the project. NBS is reported to have built approximately 3 000 housessince its inception and reportedly planned to build 10 000 more housing units in2018.18
Old Mutual have a project in Bulawayo’s Pumula high Density Suburb. The Pumula(Phase 1) housing project has managed to sell 386 housing stands translating to96 percent uptake. Stands ranging between 200m2 and 400m2 were valued atUS$30 per square meter, while those measuring between 401m2 and 800m2 atUS$25 per square meter.19
Most banks are still lending to qualified low income earners (earning US$750 amonth) for mortgages between US$15 000 and US$20 000. While it is laudable,the threshold for qualification is significantly above earnings of most industry andcommerce workers, and those in government service, especially when consideringthat the cheapest newly built house costs a minimum of US$18 000. The realityon the ground remains that even those in formal employment for a decade ormore can no longer afford basic houses, partly due to savings depletion aftersuccessive currency regimes that led to the dollarisation in 2009.
Housing supplyHousing continues to take centre stage in Zimbabwe’s developmental discourse,however the lack of traction gained from consecutive proclamations andincongruent resource allocation casts into doubt the level of commitment of thenational authorities to meeting housing challenges. It is estimated that Zimbabweneeds 20 years to clear the 1.3 million housing backlog. The new ZANU PFelection manifesto, The People’s Manifesto, which will steer policy now the partyhas won the general elections,20 makes bold projections for housing delivery,promising 1.5 million new houses in the next five years (2018 to 2023). This claimhas been challenged by many critics who say that it demonstrates that thegovernment lacks genuine resolve or understanding to tackle the housing crisis.A prominent property lawyer and aspiring legislator, Fadzayi Mahere, is quoted in
an online publication asking how the government intends to fund this ambitiousproject, pointing out that this figure means 822 houses will have to be constructedevery day for the next five years in order to meet this target.21
The document also details plans to address irregular land allocation as well asworking with land developers to put back proceeds towards infrastructuredevelopment. It also talks about two welcome developments on issues that haveaffected many home seekers: regularisation of land allocation and issuing of titledeeds to beneficiaries, and putting an end to demolitions of property whereregularisation is still requested (this applies except when land is designated forschools, clinics and roads).
According to the Zimbabwe National Association of Housing Cooperatives, anapex body representing housing co-operatives, its membership has serviced morethan 20 000 stands and built more than 10 000 houses since 2000.22
UK-based Reall, a global network of housing development enterprises, approvedfour projects during 2017/18, providing 420 units across Harare, Masvingo andBulawayo, along with improved sanitation for an additional 850 houses in Harare.These projects have involved leveraging considerable land resources (11.67ha)from cooperative groups, significantly lowering the cost of affordable housingprovision. ShelterSol, a local housing enterprise, is planning to develop 730 unitson their Lower Rangemore site in Bulawayo. The land surrounding the site is alsoall due to be developed soon and the whole area is important within the cityauthority’s masterplan. ShelterSol and Reall are working on the most appropriatemodel for sustainable project delivery.
In April 2016, following a review of its housing policy, the Harare City Councilbanned housing cooperatives from occupying any new state land, to streamlinehousing development and better manage waiting lists and backlogs. As of May2018, many housing cooperatives are still selling land, a clear sign that they hadacquired vast tracts of land before the ban was put in place, giving the ban littleor no effect in the short term. Courts are still inundated with land disputesbetween home seekers and cooperatives.
Property marketsA report by Old Mutual Securities showed that the property market in Zimbabwecontinued to be depressed up to the first quarter of 2018, and attributed this toa subdued economy. The effect of the unstable economic environment on theproperty sector included “increased voids, arrears, decreased property returnsand values across the board.” The slow positive economic progress was expectedto result in a positive turn in the property markets. A regional comparisonindicated that Zimbabwe might continue to have comparatively high financingcosts due to high costs of building materials. Developments of informalsettlements like Caledonia, Hopley, and Southlea remain popular residential optionscompared to rentals, where landlords are not willing to revise rentals downwards,causing buildings to become unused over time. A migration trend has also beennoted, where businesses now shun central business locations in favour of light
Source https://www.cgidd.com/
PPP$40 001 – PPP$10 000 000
PPP$23 001 – PPP$40 000
PPP$12 001 – PPP$23 000
PPP$8 001 – PPP$12 000
PPP$5 001 – PPP$8 000
PPP$3 601 – PPP$5 000
PPP$2 401 – PPP$3 600
PPP$1 601 – PPP$2 400
PPP$801 – PPP$1 600
<PPP$800
- - - Average annual household income needed for the cheapest newly built house by a formal developer, 2017 Average annual household income using expenditure, 2017 (PPP$)
ZIMBABWE
Annual income profile for rural and urban households based on consumption (PPP$)
No. of households (thousands)
PPP$10 130
PPP$13 650
Rural Urban600 400 200 0 200 400 600
Population: 16 913 261
Urbanisation rate: 2.44%
Cost of cheapestnewly built house:
18 000 ZBNPPP$36 000
Urban householdsthat could afford thishouse with finance:
24.66%
1 PPP$:0.5 Zimbabwean
Bond notes
276
industrial areas where land and rents are cheaper. In spite of all these broadereconomic factors, property prices continue to surge because of the speculativedemand for US dollars as a hedge against the volatile bond note that has continuedto lose its value against the greenback over the past seven months. Knight FrankZimbabwe (KFZ) Annual Property report indicated that demand for residentialproperties to purchase exceeded supply in the last quarter of 2017.23 Some have,however, expressed reservations about taking this to be representative of abroader market outlook as opposed to being speculative hoarding by a small partof the population.
Policy and regulationA strong institutional and regulatory framework shapes the housing sector inZimbabwe. Much of the legislative and policy frameworks in Zimbabwe haveremained unchanged. They are mostly progressive and include the Regional, Town and Country Planning Act [Chapter 29:12]; Urban Councils Act [Chapter 29:15];Land Survey Act [Chapter 27:06]; Deeds Registry Act [Chapter 20:05];Consolidated Land Acquisition Act [Chapter 20:10]; Rural Land Occupiers Act of2002; the National Housing Policy of 2012; and Model Building By-laws. Someanalysts observe that major challenges in the sector may stem from inadequateinstitutional capacity to support the effectiveness of these laws. For instance, the1.5 million housing waiting list is cited as inaccurate as it does not accuratelycapture the deficit. Officials also cite this waiting list as susceptible to duplicationas well as manipulation.
Several laws also suffer from not being retrospective in application. Thegovernment appreciated the importance of decongesting the urban areas andmeeting demand for housing in those areas, through Acts aligned with the Peri-Urban Settlement policy (GoZ 1998). This was aimed at augmenting residentialand industrial infrastructure in zones called growth points. However, developmentat growth points has stagnated due to economic regression. There has been alack of policy responses to the failed attempts at targeting growth in peri-urbancentres such as Mungate and Chiroodza in Domboshava.
Further, long-term funding to address infrastructure bottlenecks is needed foreffective housing delivery, including additional capacity to avail loans for both landand housing development. The Deed Registries Act [Chapter 20: 05] targets theissue of loan security and provides for the registration of mortgage bonds andnotarial bonds. This provides security in the housing finance sector. As of June2016, the deeds registry was given the nod to digitize operations in the DeedsRegistries Amendment Act, 2016. There were no stipulated timeframes providedfor the process and the progress in digitization is yet to be made public.
OpportunitiesThe Zimbabwean economy, sometimes alluded to as a sleeping giant, has for thefirst time in a long time seen glimpses of that potential on various fronts, includinginternational re-integration and re-admittance into international financing forums.A lot of interest has been generated since the government transition in Novemberof 2017.24 Several international investors and investor groups have flown into thecountry, drawn by the administration’s efforts to attain legitimacy as a safeinvestment haven.25 Policy still remains a contentious subject as not many changes,although touted, have been effected yet.
In July 2017, the mayor of Harare, Dr. Bernard Manyenyeni, said that the city hadadvanced plans to raise a US$100 million bond towards housing construction.This is yet to be realised.
The excitement around the potential investment by Africa’s richest man, AlikoDangote, that had died down after many months of silence and speculation hasbeen rekindled.26 In his 2015 visit, the prospects were to invest in coal mining,cement manufacturing and power generation. It was reported that plans werenow afoot to resuscitate the ailing deals under the new administration, with noclear indication, however, whether cement manufacturing would still form part ofthese opportunities.
Additional sourcesPeralta, E (2017). “Robert Mugabe: A legacy of tyrannical rule, economic ruinand international isolation.” National Public Radio (NPR). 15 November 2017.https://www.npr.org/sections/parallels/2017/11/15/564313423/robert-mugabe-a-legacy-of-tyrannical-rule-economic-ruin-and-international-isolat (Accessed18 une 2018).
ZWINOIRA, T (2018). “Zim Inflation to quicken-IMF.” 31 October 2017.Newsday. https://www.newsday.co.zw/2017/10/zim-inflation-quicken-imf/(Accessed 28 June 2018).
The World Bank Doing Business (2018).http://www.doingbusiness.org/data/exploreeconomies/zimbabwe, (Accessed3 July 2018).
1 Bulawayo 24 News (2017). “Grace Mugabe, G40 cabal fired.” 19 November 2017. https://bulawayo24.com/index-id-news-sc-national-byo-122423.html (Accessed 18 June 2018).2 The Zimbabwe Mail (2018). “US Congress Passes Zidera Amendment Bill, Awaits Trumps Signature” 26 July 2018. http://www.thezimbabwemail.com/zimbabwe/u-s-congress-passes-zidera-amendment-bill-awaits-trumps-signature/,
(Accessed 30 August 2018).3 Maveriq (2018). US President Trump Signs Zidera Amendment into Law. 9 August 2018. Pindula New. https://news.pindula.co.zw/2018/08/09/us-president-trump-signs-zidera-amendment-into-law/, (Accessed 30 August 2018).4 Zoom Zimbabwe (2018). “UK Pledges Support to Zimbabwe”. 6 August 2018. https://www.zoomzimbabwe.com/2018/08/06/uk-pledges-to-support-zimbabwe/, (Accessed 30 August 2018)5 Katongomara, A. (2018). UK Pledges to Support Zim’s Commonwealth Bid. 23 May 2018. The Chronicle. http://www.chronicle.co.zw/uk-pledges-to-support-zims-commonwealth-bid/, (Accessed 30 August 2018)6 Turak, N (2018). “Zimbabwe is Open for Business.” 24 January 2018. CNBC News. https://www.cnbc.com/2018/01/24/zimbabwe-is-open-for-business-new-president-emmerson-mnangagwa-tells-davos.html, (Accessed 28 June 2018).7 Reuters (2018). “IMF’s Lagarde welcomes Mnangagwa’s promise to revive Zimbabwe economy”, 25 January 2018. https://www.reuters.com/article/us-imf-zimbabwe/imfs-lagarde-welcomes-mnangagwas-promise-to-revive-zimbabwe-
economy-idUSKBN1FE2M6 (Accessed 14 September 2018).8 The Zimbabwean Mail (2018). “British Minister for Africa arrives in Zimbabwe” 1 February 2018. http://www.thezimbabwemail.com/zimbabwe/british-minister-africa-arrives-zimbabwe/, (Accessed 16 June 2018).9 Real Time Gross Settlements (RTGS) is an interbank settlement mechanism developed to enable real-time transactions between commercial banks. It was implemented in Zimbabwe in November 2002. For a description of the system
and its issues, see Ngwira, D. (2017). RTGS backlogs should be explained. Zimbabwe Independent. 30 June 2017. https://www.theindependent.co.zw/2017/06/30/rtgs-backlogs-explained/ (Accessed on 16 September 2018).10 Zwinoira, T (2017). “Bond notes in free fall as US$ premiums rise.” The Standard. 5 November 2017. https://www.thestandard.co.zw/2017/11/05/bond-notes-free-fall-us-premiums-rise/ (Accessed 27 June 2018).11 Nkomo, C (2018). Zimbabwe: Chiwenga ‘forced’ to warn cash dealers, land barons. AllAfrica, 13 June 2018. https://allafrica.com/stories/201806140499.html (Accessed 16 September 2018).12 The Reserve Bank of Zimbabwe (2017), Microfinance Quarterly Report, 30 June 2017. https://www.rbz.co.zw/assets/mfi--june-2017.pdf (Accessed on 16 September 2018)13 Tech Zim Media (2018). “Zimbabweans In the Diaspora Can Now Access Steward Bank Mortgages (Loans) To Buy Or Build Houses In Zimbabwe.” 1 March 1 2018. https://www.techzim.co.zw/2018/03/hey-zimbo-diaspora-want-build-
buy-finish-house-back-home-steward-bank-mortgage/ (Accessed 20 June 2018).14 Mphambela, C (2017). Why banks have fully embraced central credit registry. 16 June 2017. Newsday Newspaper. https://www.newsday.co.zw/2017/06/banks-fully-embraced-central-credit-registry/ (Accessed 23 June 2018).15 Zimbabwe News (2017). “Zim banks runout of cash…withdrawal limit drops to zero.” 24 October 2017. https://www.zimbabwenews.co.uk/zim-banks-run-out-of-cash-withdrawal-limit-drops-to-zero/ (Accessed 23 June 2018).16 Marufu, L (2018). POS machines reach 70,000. 3 May 2018. The Herald Newspaper. https://www.herald.co.zw/pos-machines-reach-70-000/ (Accessed 10 June 2018).17 The Herald Newspaper (2018). “Relaxed terms boost CABS Budiriro project.” 3 April 3 2018. https://www.herald.co.zw/relaxed-terms-boost-cabs-budiriro-project/ (Accessed 23 June 2018).18 The Source (2017). “NSSA injects 17 Mil in Dzivarasekwa housing project.” 12 Dec 2017. http://source.co.zw/2017/12/nssa-injects-17mln-in-dzivarasekwa-housing-project/ (Accessed 10 June 2018).19 The Chronicle Newspaper (2018). “Old Mutual unveils 1082 serviced stands.” 9 March 2018. http://www.chronicle.co.zw/old-mutual-unveils-1-082-serviced-stands/ (Accessed 16 June 2018).20 Tanyana (2018). Zanu-PF 2018 Election Manifesto Summary PDF Download. T https://news.pindula.co.zw/2018/05/05/zanu-pf-2018-election-manifesto-summary-pdf-download/ 5 May 2018. Pindula News.(Accessed 16 Sept 2018). 21 Thompson, J (2018). Big Bold Claims as Zimbabwe prepares for crucial election. 8 May 2018. Herald Live. https://www.heraldlive.co.za/news/world/2018-05-08-big-and-bold-claims-as-zimbabwe-prepares-for-crucial-election/ (Accessed
16 June 2018).22 Parliament of Zimbabwe (7 May 2015). The first report of the Portfolio Committee on Small and Medium Enterprises and Cooperative Development on the role, management and impact of housing cooperatives on the delivery of
national housing in Zimbabwe. http://www.veritaszim.net/sites/veritas_d/files/First%20Report%20of%20the%20Portfolio%20Committee%20on%20SMEs%20on%20Housing%20Co-Operatives.pdf (Accessed on 16 Sept 2018).23 Chiriga, E (2018). US speculation drives property prices up. 7 May 2018. The Daily New Newspaper. https://www.dailynews.co.zw/articles/2018/05/07/us-speculation-drives-property-prices-up (Accessed 23 June 2018).24 The Zimbabwe Mail (2018). “Relations between Zimbabwe and IMF positive but…” 2 February 2018. http://www.thezimbabwemail.com/economic-analysis/relations-zimbabwe-imf-positive/ (Accessed 18 June 2018).25 Share, F (2018). US govt to send investors to Zimbabwe. 17 February 2018. The Chronicle Newspaper. http://www.chronicle.co.zw/us-govt-to-send-investors-to-zimbabwe/ (Accessed 11 June 2018).26 Ncube, X (2018). Dangote team back in Zim. Newsday. 10 April 2018. https://www.newsday.co.zw/2018/04/dangote-team-back-in-zim/ (Accessed on 16 September 2018).

s THabitat for Humanity’ Teerw
vwilliger Center for Innovaation in Shelte
er
works to enhance the inclusivity of h
supply and demand sides. The cent
sector and serving as a facilitator an
low-income households.
The center advances knowledge ar
impact of these strategies, compilin
developing toolkits for practitioners
s. T
housing market systems for low-income househol
ter does so by mobilizing the flow of capital to the
nd adviser to market actors on strategies to more
ound housing markets by conducting research stu
ng sector insights and best practices in flagship pu
Too learn more about the center, visit www.habita
ds on both the
housing
effectively engage
udies on the
ublications, and
at.org/TCIS.
3,035,000 peo71 institut
ple served, US$859,985,967 of capita
tions advised, 850+ practitioners trai
al mobilized,
ned
s.tekevexpandingeandBuilding inclusive housing mark

s across solutions
rket.
Reall is transformin
ngglable housing developersprovides market driven s
le homes ma
transforminff d bth
Partnering with affordAfrica and Asia, Reall
for low
the affordab
provides market-driven sw-income people.
Housing11,000 affordable housing
ServicesImproved water sa
nitation or
stment.
People served55,000
*Since 2014
Contact us to enquire abo
.reall.net | www
11,000 affordable housing solutions approved
ut partnerships, funding or inves
Improved water, sanitation or energy services approved for 23,500 people

14Trees is a Laaccelerating th
housing togethe
afargeHolcim and CDC Grhe provision of affordab
er with our bank partners
roup joint venture dedicatele housing in Africa.
and contractors.
ed to
We are making
green and affffordable housing a reality for Africa.
www.14Trees.com / [email protected]


iBUILD addresses activities associated with 13 of the 17 SDG’s. We are asustainable, powerful platform that,“Empowers the World to Build.”
�������� �� ��� ��������
Helping our customers build their dream homes, one step at a time through
INCREMENTAL HOUSING FINANCE.
Illovo Edge Office Block, Building 4, 9 Harries Road, Illovo, 2196Telephone: +27 11 214 8300Email: [email protected] [email protected]: www.selectafrica.net
With a defined plan to establish new businesses and new product offerings in other sub-Saharan African countries, coupled with our expertise and the potential of the African continent, this provides the impetus
for us to accomplish our growth targets.
Select has various existing funding sources, and we continuously seek new funding partnerships.
For more information please contact us:
Loan book operations in Swaziland, Lesotho, Kenya, and Malawi, with administration and support hubs in Mauritius and South Africa.
We’re focused on financial inclusion to the under-banked or entry level retail credit market.
A responsible lender with built-in lending mechanisms to ensure customer affordability, with long-term affiliations with leading
DFI’s and technical partners.
Select Africa is delighted to
support CAHF in its work in promoting housing finance in
Africa.
HOFINETA Global Resource for Housing Finance Information
Housing FinanceInformation Network
The Housing Finance Information Network is the first truly globalwebportal that consolidates and regularly updates internationalhousing finance knowledge in one central, easily accessible place. Alldata is in the public domain and can be easily downloaded.
• It collects and updates standardized statistical data until 2016 oncountries' housing finance systems – currently for 140 countries –and provides country reports and links to legal and statisticalcountry resources.
• It provides state-of-the art information on the main topics inhousing finance through our global network of experts and througha continuously updated library of research and policy papers.
Telephone: 215.898.3313 Fax: [email protected]
www.hofinet.org


ERAYEHTNEHWLUFESUERASTEKRAMLLACNNNIIF A IA
e
ELBAATSTSSSEECCCCCAA SLUFESU
S
everves rvyehtsiemonoceehtto lufesueromarethat
stekramlancinaifdliubmehtplehto ,metsyslancinaiftheinsrotcaeroth
andsrotaluger,snoitutitsnilancinaifto secruosercalitechnand latipacngidiovrp,rotatilicafafa siacirfADSF
tnemploevedcimonoceevisulcnievirdandytrevopecuder,acirfAnarahaS-businstekram
lancinaifmrofosnart fto tnemnrevoGKUehtybup tess waacirfADSF
TNEICIFFEDNA,EEVVIISSNNOOPPSSEER,REELLBBIIS
ERAYEHTNEHWS
.cairAfn ince naif
pn iCAHF thwingeritnrape bto eased lps iacirfADSF
groca.irsdaffwww.orgca.irfao@fsdnfit:aus ct taCon
ngsihoungotiomrp


Housing as a Basic Human Right: The South Africa Constitution (1996)'s Bill of Rights,
in Section 26 states that all South Africans have a right to 'access adequate housing'. It
is the government's duty to take reasonable legislative and other measures, within its
available resources, to achieve the realisation of this right on a progressive basis.
To give effect to the right, the Ministry of Human Settlements has committed itself to the
establishment of a single Human Settlements DFI, the Human Settlements Development
Bank (HSDB), which consolidates the mandate of its existing development finance
institutions namely NHFC, NURCHA and RHLF. The core rationale for the establishment
of the HSDB resides in the need to provide a more effective government financing
support to key segments of the housing market in the face of considerable market failure
and significant need.
Core Purpose:
• To meet the human settlements finance needs in a sustainable manner, a
coordinated and integrated financial institutional structure is required that is
able to effectively leverage government grants, wholesale and investment
funding so as to maximise private sector capital, as well as household
contributions.
HSDB will thus:
• Serve as a catalyst for change in the Human Settlements funding and financing role
(redefinition)
• Support the effective transformation of the Human Settlements sector
• Additionality: "do activities that HSDB is able, to impact beyond that which would
have occurred"
• Focus in addressing market failure through innovative financing and effective risk
mitigation instruments
The HSDB will be established through an enactment of parliament
As a potential partner for innovation and delivery of government financing
support to the needy, be on the lookout for the new fully integrated HSDB
dynamic brand identity and launch.
COREFUNCTIONS: Lender Investor Facilitator Advisor
It is the golden-era of Human Settlements expansion .... "


IFC, a member of the World Bank Group, is the largest global developmentinstitution focused on the private sector in emerging markets. IFC isboosting housing finance with investments and advisory work across Africa,including the West African Economic and Monetary Union, Nigeria,Tanzania, Kenya and Rwanda. IFC has invested over $3 billion in housingfinance in 46 countries world‐wide.
IFC is pleased to support the 9th edition of the Africa Housing FinanceYearbook, published by the Centre for Affordable Housing Finance in Africa.

WHAT DOES A HEALTHY HOUSING MARKETLOOK LIKE?
Adequate, affordable housing is available for all incomegroups n A range of housing mechanisms are available in the market.
n There is adequate supply of affordable housingand vibrantcompetition.
n Input costs are contained (land, cement,materials).
n There is targeted investment in real estate and construction.
n Transaction systems are accessible, efficient and affordable.
n End user finance is available and improves affordability.
Residential property is easy to buy and sell for all incomegroups n Land is formally registered.
n Transaction systems are accessible and efficient.
n End user finance is available for resale markets.
n Market information is readily available.
n A diversity of suppliers provides a diversity of housing types.
n Affordable accommodation is available both to rent and own.
The Centre for Affordable Housing Finance in Africa (CAHF) is an independentthink tank based in Johannesburg, South Africa. CAHF's work extends across thecontinent, and it is supported by and collaborates with a range of funders andpartners.
CAHF's mission is to make Africa's housing finance markets work through thedissemination of research and market intelligence, the provision of strategic support,and ongoing engagement in both the public and the private sector. CAHF supportsincreased investment, cross-sector collaborations and a market-based approach.
The overall goal of our work is to see an increase of investment in affordable housingand housing finance throughout Africa: more players and better products, with a specificfocus on the poor.
For more information and to join us in pursuing this agenda, please visit our website:www.housingfinanceafrica.org, like our Facebook page and follow us:
@cahf_Africa @cahf_houseofafrica


Twitter: @AUHF_Housing Facebook: @auhfhousing LinkedIN
CHAIRMAN Oscar Mgaya CEO, TMRC
Tanzania
VICE CHAIRMAN Charles Inyangete
CEO, NMRC
Nigeria
TREASURER Cas Coovadia
MD, BASA
South Africa
SECRETARY Omar Sarr CEO, HFC
The Gambia
Ruth Odera Regional Manager
HFHI-EMEA
Kenya
Joseph Chikolwa
MD, ZNBS
Zambia
Reginald Motswaiso
CEO, BHC
Botswana
Femi Adewole MD,
Shelter Afrique
Kenya
AUHF BOARD
The African Union for Housing Finance (AUHF) was established as amember-based body of housing lenders in 1984. Today, the AUHFcomprises of 61 members from 17 countries across the continent.Members include commercial and mortgage banks, buildingsocieties, microfinance banks/institutions, housing developmentcorporations, and other institutions involved in the mobilisation offunds for shelter and housing. As an industry body, the AUHFpromotes the development of effective housing finance markets, anddelivery of affordable housing across Africa, working in the interestsof both the members and the industry as a whole.
Vision: : An enabled and productive housing finance sector across Africa where governments and the private sector work together to developand maintain efficient and effective housing markets and access to adequate and affordable housing for all.
Mission: To support its members in realising their vision, through networking and deal facilitation, information collection and dissemination,lobbying and advocacy, and capacity building and training.
In serving its members and realising its goals of effective housing finance markets and delivery of affordable housing in Africa, the AUHFpursues four main activities:
1. Networking & Deal Facilitation:Identifying and connecting stakeholders, making the whole greaterthan the sum of its parties;
n Speaking opportunities and discounts to attend industryevents/conferences
n Annual AUHF conferences and AGMsn Regional seminars / workshops
2. Information collection & Dissemination: Understanding the issues and sharing this with members and thewider sector;
n Monthly newsletters n CAHF Yearbookn Case studies of members & fact sheets on key issuesn Benchmarking initiative with members
3. Lobbying & Advocacy:Promoting member interests in making housing finance marketswork in Africa;
n ANNUAL DECLARATIONS ON HOUSING FINANCE (lobbyingdocuments)
n Engagement with Regional bodies, national governments &other relevant stakeholders with member support,
n Identification of and engagement in key national & regionalissues with member support.
4. Capacity Building & Training: Enabling members to respond to the challenges and opportunitieswithin the context of their businesses; supporting betterengagement between the public & private sectors;
n Capacity building seminar in Accra, Ghana, co-hosted withCAHF and IFC: Capacity
n Financing Housing in Africa – Issue 55: Information
JOIN US TODAYBe part of a continental body that advocates for affordable housing and efficient housing finance markets ...
www.auhf.co.za | [email protected] | (T) +27 11 447 9581 | (C) +27 82 834 3556

www.housingfinanceafrica.org
With thanks to our sponsors