2018-2019 ANNUAL REPORT - The American Pecan Council
333
1 2018-2019 ANNUAL REPORT 3880 HULEN STREET, SUITE 650 FORT WORTH, TX 76107 817-916-0020 [email protected] WWW.AMERICANPECAN.COM
-
Upload
khangminh22 -
Category
Documents
-
view
3 -
download
0
Transcript of 2018-2019 ANNUAL REPORT - The American Pecan Council

1
2018-2019ANNUAL REPORT
3880 HULEN STREET, SUITE 650FORT WORTH, TX 76107
817-916-0020
WWW.AMERICANPECAN.COM

2
TABLE OF CONTENTS
I. Introduction & Overview
II. Strategic Planning
45 6 10 12 13 15
274777
Message from Executive Director
Message from Chairman of the Council
Brief History of the FMO
Council Members
District Map
APC Staff
Statement of Financial Position
Interim Review of Findings with Council
Working Group Meeting #2
Working Group Meeting #3
III. 2018 – 2019 Consumer Marketing
111 112 124
Committee Summary
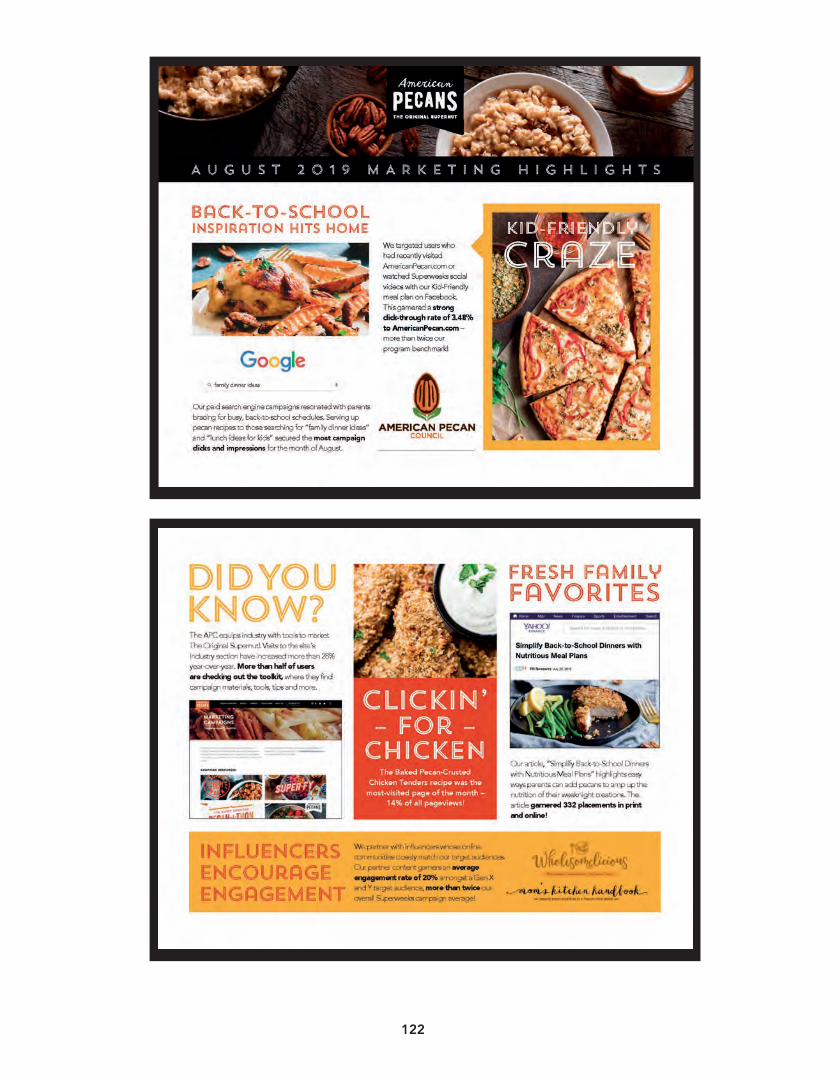
2018 – 2019 Marketing Highlights
Marketing the Original Supernut

3
IV. 2018 – 2019 Fiscal Year Industry Relations
147148149196198199
Committee Summary
Uniting and Equipping the American Pecan Industry
Updates and Communications – In A Nutshell
Industry Toolkit and Resources
Training and Collaboration
Look Ahead to 2019 – 2020
TABLE OF CONTENTS
V. Grades & Standards
VI. Data & Statistics
203204211
217218233238279
Committee Summary
Updated Grades & Standards
Quality Assurance Program
Year – End Inventory & Pecans Handled Throughout the Year
Pecan Position Reports
Pecan Production
American Pecan Council Acreage & Age Survey
Economic Benchmark Model and Analysis of the Effects of the Chinese
Tariff on the U.S. Pecan Industry
VII. Find Us Here

4
The 2018 – 2019 year for the American Pecanindustry saw lows and highs for the industry. Fromhurricanes in the east, to floods in the central andfires in the west, the industry was challenged fromall fronts thanks to mother nature. Additionally, theindustry saw challenges on the global trading frontwith retaliatory tariffs from China to proposed tradeagreements with Japan and Mexico. All theseactivities impacted the pecan industry. Despitethese challenges, the American Pecan industry sawsome leaps forward with a successful completion ofa strategic plan that covered five critical areas forthe industry, marketing programs that successfullyincreased consumption and awareness, and a majorstep in unifying the industry across 15 states. At the beginning for the American Pecan Council’sfiscal year, the Council voted unanimously to moveforward with a strategic plan. The concept of theplan was to have a non-biased, outside consultingfirm to analyze the industry and look at the areasthat the Council should focus on with its limitedresources. The result was a finalized plan thatfocuses on fives areas. These include: Winning itsfair share of tree nuts; Leading among globalsuppliers; Strengthening our infrastructure;modernizing the industry; and uniting the pecanstakeholders. The results of theseactivities have been exceptional. A few highlights of the results based on the activitiesof the APC include: a strategic plan for the next fiveyears that sets a course for the industry whileproviding measurements for the APCs activities; anincrease of 12 percent consumption since theinception of the APC and over 33% in one year sincethe implementation of the strategic plan and APCmarketing programs; increase in top of the mindawareness; the formation of the Pecan Congress(the assembly of all 21 Pecan organizations for thefirst time in industry’s history); the signing of theAPC and US Pecan Growers Council (USPGC)unification document in which both organizationsare working together to increase awareness,consumption, and shipments for top
export markets; educating the industry on newtransaction models that will assist the industry inmodernizing the industry; mapping states of pecanacreage in an effort to get accurate pecan acreageand developing forecasting models; developed anearly economic model that will assist the industry inpecan economics for the industry; and looking toincorporating voluntary grades and standards thatwill assist the American industry in showcasing itspremium product to consumers, just to name a fewof the activities.
Please find enclosed a summary of the AmericanPecan Council’s activities for the 2018 – 2019 year.On behalf of the American Pecan Council and itsstaff, I would like to thank the industry for theopportunity to continue to serve the industry and its15 states. We look forward to successful year andany suggestions and input from you the growers,shellers and accumulators that make the industrysuccessful. Please do not hesitate to contact theCouncil office should you have any questions.
High Regards,
Message From the Executive Director_____________________________________________________________________
Alexander J. OttEXECUT I VE D I RECTOR
A true story is told about the legendary collegefootball coach, Abe Martin, and one of his All-Starquarterbacks during their times together at TCU inthe 1950’s. On a crisp fall Saturday afternoon duringa game at Amon Carter Stadium in Fort Worth, theHorned Frogs were backed up inside theiropponents 5-yard line. The situation was dire. CoachMartin called time out and summoned his QB to thesidelines for a strategy session. With his arm aroundhis star player’s shoulder, the coach felt that hisoptions were few. Calmly, he instructed his QB topunt the ball in an attempt to improve the team’sfield position. The QB reentered the game. He linedup in punt formation. The ball was snapped. Thecrowd was tense. Upon receiving the football, theQB then confidently ran and dodged from his own5-yard line for 95 yards and a touchdown. In amoment of joy yet concern, Coach Martin called hisdisobedient player to the sideline and said, “Chuck,I told you to punt.” The QB matter-of-factly replied,“But, Coach, you didn’t say when.”
I relate to that story. The U.S. pecan industry hasbeen backed up on the 5-yard line for some timenow. Most of the reasons involve circumstances forwhich we did not foresee nor have much controlover. I will not list them here because they areknown too well to all of us. The real decision forthose of us “in the pecan arena” is what do we dofrom here.
The American Pecan Council has wisely invested ourassessment dollars. The goal has been and willcontinue to be to increase the demand for pecans.The intended result of that objective is to returnsustained profitability to all segments of theindustry. Although sometimes difficult to detect inthe economic and policy turmoil of the times,progress has been made. Since inception of theFederal Marketing Order, the domesticconsumption of pecans has measurably andmarkedly risen. Less progress is identifiable ininternational markets, but efforts continue on thatfront as well.
The good news is that we, as pecan stakeholders,have an organization in the APC that is in themarketplace daily doing our bidding. Our state andregional pecan organizations are also active on ourbehalf, and the recently formed National PecanFederation is effectively representing our interests inWashington. The collective voice for pecans is beingheard more so than at any time in our history.
Back to the football story and the question “Whatdo we do from here?” Without a crystal ball,particularly regarding events and circumstances overwhich we have no control, I say that we “stay thecourse.” I also am fully confident that our efforts willpay dividends, and a “touchdown or score” willcome. Like the coach and the QB, the “when” is amatter of conjecture. But also, like the QB, I do notintend to punt.
Message From the Chairman of the Council_____________________________________________________________________
B. Michael AdamsCHAI RMAN OF THE COUNCI L

5
The 2018 – 2019 year for the American Pecanindustry saw lows and highs for the industry. Fromhurricanes in the east, to floods in the central andfires in the west, the industry was challenged fromall fronts thanks to mother nature. Additionally, theindustry saw challenges on the global trading frontwith retaliatory tariffs from China to proposed tradeagreements with Japan and Mexico. All theseactivities impacted the pecan industry. Despitethese challenges, the American Pecan industry sawsome leaps forward with a successful completion ofa strategic plan that covered five critical areas forthe industry, marketing programs that successfullyincreased consumption and awareness, and a majorstep in unifying the industry across 15 states. At the beginning for the American Pecan Council’sfiscal year, the Council voted unanimously to moveforward with a strategic plan. The concept of theplan was to have a non-biased, outside consultingfirm to analyze the industry and look at the areasthat the Council should focus on with its limitedresources. The result was a finalized plan thatfocuses on fives areas. These include: Winning itsfair share of tree nuts; Leading among globalsuppliers; Strengthening our infrastructure;modernizing the industry; and uniting the pecanstakeholders. The results of theseactivities have been exceptional. A few highlights of the results based on the activitiesof the APC include: a strategic plan for the next fiveyears that sets a course for the industry whileproviding measurements for the APCs activities; anincrease of 12 percent consumption since theinception of the APC and over 33% in one year sincethe implementation of the strategic plan and APCmarketing programs; increase in top of the mindawareness; the formation of the Pecan Congress(the assembly of all 21 Pecan organizations for thefirst time in industry’s history); the signing of theAPC and US Pecan Growers Council (USPGC)unification document in which both organizationsare working together to increase awareness,consumption, and shipments for top
export markets; educating the industry on newtransaction models that will assist the industry inmodernizing the industry; mapping states of pecanacreage in an effort to get accurate pecan acreageand developing forecasting models; developed anearly economic model that will assist the industry inpecan economics for the industry; and looking toincorporating voluntary grades and standards thatwill assist the American industry in showcasing itspremium product to consumers, just to name a fewof the activities.
Please find enclosed a summary of the AmericanPecan Council’s activities for the 2018 – 2019 year.On behalf of the American Pecan Council and itsstaff, I would like to thank the industry for theopportunity to continue to serve the industry and its15 states. We look forward to successful year andany suggestions and input from you the growers,shellers and accumulators that make the industrysuccessful. Please do not hesitate to contact theCouncil office should you have any questions.
High Regards,
Message From the Executive Director_____________________________________________________________________
Alexander J. OttEXECUT I VE D I RECTOR
A true story is told about the legendary collegefootball coach, Abe Martin, and one of his All-Starquarterbacks during their times together at TCU inthe 1950’s. On a crisp fall Saturday afternoon duringa game at Amon Carter Stadium in Fort Worth, theHorned Frogs were backed up inside theiropponents 5-yard line. The situation was dire. CoachMartin called time out and summoned his QB to thesidelines for a strategy session. With his arm aroundhis star player’s shoulder, the coach felt that hisoptions were few. Calmly, he instructed his QB topunt the ball in an attempt to improve the team’sfield position. The QB reentered the game. He linedup in punt formation. The ball was snapped. Thecrowd was tense. Upon receiving the football, theQB then confidently ran and dodged from his own5-yard line for 95 yards and a touchdown. In amoment of joy yet concern, Coach Martin called hisdisobedient player to the sideline and said, “Chuck,I told you to punt.” The QB matter-of-factly replied,“But, Coach, you didn’t say when.”
I relate to that story. The U.S. pecan industry hasbeen backed up on the 5-yard line for some timenow. Most of the reasons involve circumstances forwhich we did not foresee nor have much controlover. I will not list them here because they areknown too well to all of us. The real decision forthose of us “in the pecan arena” is what do we dofrom here.
The American Pecan Council has wisely invested ourassessment dollars. The goal has been and willcontinue to be to increase the demand for pecans.The intended result of that objective is to returnsustained profitability to all segments of theindustry. Although sometimes difficult to detect inthe economic and policy turmoil of the times,progress has been made. Since inception of theFederal Marketing Order, the domesticconsumption of pecans has measurably andmarkedly risen. Less progress is identifiable ininternational markets, but efforts continue on thatfront as well.
The good news is that we, as pecan stakeholders,have an organization in the APC that is in themarketplace daily doing our bidding. Our state andregional pecan organizations are also active on ourbehalf, and the recently formed National PecanFederation is effectively representing our interests inWashington. The collective voice for pecans is beingheard more so than at any time in our history.
Back to the football story and the question “Whatdo we do from here?” Without a crystal ball,particularly regarding events and circumstances overwhich we have no control, I say that we “stay thecourse.” I also am fully confident that our efforts willpay dividends, and a “touchdown or score” willcome. Like the coach and the QB, the “when” is amatter of conjecture. But also, like the QB, I do notintend to punt.
Message From the Chairman of the Council_____________________________________________________________________
B. Michael AdamsCHAI RMAN OF THE COUNCI L

6
The APC is only one of 29 FMOs in the U.S.FMOs are voted in by the growers, and Councilmembers are elected by the industry. TheCouncil votes for its assessments, policies,standards, marketing, research, and budget.After five years, the growers, and only thegrowers, have the ability to vote to continue theFMO. Other government bodies do not have thistype of local government aspect. The APCprovides direct grower and industry input for theindustry.
Conversely, the APC is also an extension of theUS Department of Agriculture (USDA). Meaning,we have a level of oversight that USDA providesin order to ensure certain aspects of the industrydo not take advantage of other members of theindustry.
It also allows USDA to provide supervision, toensure that the industry is following all necessary“government speech” rules and regulations.Additionally, by allowing shellers to sit on theboard, the APC can collect assessments from thehandlers, placing less burden of paperwork onthe grower while providing a surveillancemechanism to ensure that shellers are reportingthe industry information properly and accurately.Failure to report correctly may result in penalties.This system of uniting growers, shellers, andaccumulators makes the American Pecan Councilthe largest and broadest pecan body in the U.S.Additionally, with USDA oversight, it makes theAPC government and provides the industry witha powerful tool.
A BRIEF HISTORYOF THE FMO
Our Roots:
The American Pecan Council (APC) is a FederalMarketing Order (FMO) established under theAgricultural Marketing Agreement Act of 1937. Itwas established by a vote of the growers inNovember 2016.Every five years, the growers canvote to continue the APC, making it one of thepurest forms of a local government the industryhas at its disposal.
...SO WHAT EXACTLYTHE APC DO?
These activities are permissible and required underthe Federal Marketing Order. However, it should benoted that all activities, including promotion andmessaging must follow all USDA rules andregulations and must be approved by the USDA.The Council sets priorities for each of these fiveareas and then establishes a budget for eachsection. All activities, once approved by theCouncil, move to USDA review and approval toensure that a specific group does not directlybenefit solely on the activities approved or fundedand that the activities meet both the FMOrequirements and USDA rules and regulations. Thisoversight, as mentioned earlier, is the extra checkand balance for the industry in order to ensure thatthe Council does not overstep its authority.
Set pricesLobbyBuy or sell productPromote one company over another
These activities are not permissible underthe FMO and will not be approved by USDA.However, other entities, associations, or“tools” have these abilities. Thus, theyshould be handled by other pecanorganizations.
There are specific activities that theAmerican Pecan Council may notconduct. These include:
As mentioned earlier, FMOs are one critical tool inthe toolbox. Without the FMO, standards,marketing and promotion, research, and datawould go away. These activities that are nowbeing conducted, are establishing for the first time,an opportunity for the industry to havetransparency, and ultimately, have data to makecritical marketing decisions. The FMO providesan opportunity for everyone to play by one fair setof rules for standards. Furthermore, the FMOprovides an opportunity to unite the industry underone organization and one message, pavingthe way for everyone to work together toward acommon goal: Increasing awareness anddemand for pecans.
ACTIVITIES APC CANNOT DO
CAN
10
Domestic and International Promotionand MarketingResearchGrades & StandardsComplianceData & Statistics
There are specific items that FMOsmay do. The American Pecan Councilis allowed to conduct the followingactivities:
THE JOB DUTIES OF AN FMO
_____________________________________________________________________

7
The APC is only one of 29 FMOs in the U.S.FMOs are voted in by the growers, and Councilmembers are elected by the industry. TheCouncil votes for its assessments, policies,standards, marketing, research, and budget.After five years, the growers, and only thegrowers, have the ability to vote to continue theFMO. Other government bodies do not have thistype of local government aspect. The APCprovides direct grower and industry input for theindustry.
Conversely, the APC is also an extension of theUS Department of Agriculture (USDA). Meaning,we have a level of oversight that USDA providesin order to ensure certain aspects of the industrydo not take advantage of other members of theindustry.
It also allows USDA to provide supervision, toensure that the industry is following all necessary“government speech” rules and regulations.Additionally, by allowing shellers to sit on theboard, the APC can collect assessments from thehandlers, placing less burden of paperwork onthe grower while providing a surveillancemechanism to ensure that shellers are reportingthe industry information properly and accurately.Failure to report correctly may result in penalties.This system of uniting growers, shellers, andaccumulators makes the American Pecan Councilthe largest and broadest pecan body in the U.S.Additionally, with USDA oversight, it makes theAPC government and provides the industry witha powerful tool.
A BRIEF HISTORYOF THE FMO
Our Roots:
The American Pecan Council (APC) is a FederalMarketing Order (FMO) established under theAgricultural Marketing Agreement Act of 1937. Itwas established by a vote of the growers inNovember 2016.Every five years, the growers canvote to continue the APC, making it one of thepurest forms of a local government the industryhas at its disposal.
...SO WHAT EXACTLYTHE APC DO?
These activities are permissible and required underthe Federal Marketing Order. However, it should benoted that all activities, including promotion andmessaging must follow all USDA rules andregulations and must be approved by the USDA.The Council sets priorities for each of these fiveareas and then establishes a budget for eachsection. All activities, once approved by theCouncil, move to USDA review and approval toensure that a specific group does not directlybenefit solely on the activities approved or fundedand that the activities meet both the FMOrequirements and USDA rules and regulations. Thisoversight, as mentioned earlier, is the extra checkand balance for the industry in order to ensure thatthe Council does not overstep its authority.
Set pricesLobbyBuy or sell productPromote one company over another
These activities are not permissible underthe FMO and will not be approved by USDA.However, other entities, associations, or“tools” have these abilities. Thus, theyshould be handled by other pecanorganizations.
There are specific activities that theAmerican Pecan Council may notconduct. These include:
As mentioned earlier, FMOs are one critical tool inthe toolbox. Without the FMO, standards,marketing and promotion, research, and datawould go away. These activities that are nowbeing conducted, are establishing for the first time,an opportunity for the industry to havetransparency, and ultimately, have data to makecritical marketing decisions. The FMO providesan opportunity for everyone to play by one fair setof rules for standards. Furthermore, the FMOprovides an opportunity to unite the industry underone organization and one message, pavingthe way for everyone to work together toward acommon goal: Increasing awareness anddemand for pecans.
ACTIVITIES APC CANNOT DO
CAN
10
Domestic and International Promotionand MarketingResearchGrades & StandardsComplianceData & Statistics
There are specific items that FMOsmay do. The American Pecan Councilis allowed to conduct the followingactivities:
THE JOB DUTIES OF AN FMO
_____________________________________________________________________

8
"TO INCREASE DEMAND
FOR AMERICAN PECANS
AND PROVIDE INDUSTRY
WITH A PATH TO
SUSTAINABLY GROW
PROFITABILITY ACROSS
THE VALUE CHAIN."
A P C ' S S T R A T E G I C V I S I O N

9
"TO INCREASE DEMAND
FOR AMERICAN PECANS
AND PROVIDE INDUSTRY
WITH A PATH TO
SUSTAINABLY GROW
PROFITABILITY ACROSS
THE VALUE CHAIN."
A P C ' S S T R A T E G I C V I S I O N

10
COUNCIL MEMBERS
AMERICAN PECAN COUNCILMarketing Order No. 986
4-Year Term Ending July 31, 20202016-2020
EXECUTIVE DIRECTOR:Alexander J. Ott
CHAIRPERSON:B. Michael Adams
GROWER REPRESENTATIVES
MEMBERS ALTERNATES
Eastern Region
Central Region
Western Region
Buck A. Paulk Angie S. Ellis
Trent Mason Randy Hudson
Molly Willis Claire Powell
Mike Adams
Michael L. Spradling
Billy Scott Landgraf
Jennifer Ivey
Lalo Medina
Mike Montgomery
Frank P. SalopekLouie J. Salopek
G.L. Straley
Phillip Arnold
Leslie L. Daviet II
John Heuler
7
_____________________________________________________________________
AT-LARGE MEMBERS
SHELLER REPRESENTATIVES
Western Region
Bruce Caris Deborah E. Ralls
Sonja Roeder Blake Houston
Eastern Region
Jeff Worn Adam C. Harrell
Lawrence Willson Kenny Tarver
MEMBERS ALTERNATES
Central Region
Daniel J. Zedan Steve Zaffarano
William D. "Dan" York, Jr. Rickey Jones
MEMBERS ALTERNATES
Accumulator
Public Member
J.B. Easterlin Chad Selman
Ronald P. HaysVacant
8

11
COUNCIL MEMBERS
AMERICAN PECAN COUNCILMarketing Order No. 986
4-Year Term Ending July 31, 20202016-2020
EXECUTIVE DIRECTOR:Alexander J. Ott
CHAIRPERSON:B. Michael Adams
GROWER REPRESENTATIVES
MEMBERS ALTERNATES
Eastern Region
Central Region
Western Region
Buck A. Paulk Angie S. Ellis
Trent Mason Randy Hudson
Molly Willis Claire Powell
Mike Adams
Michael L. Spradling
Billy Scott Landgraf
Jennifer Ivey
Lalo Medina
Mike Montgomery
Frank P. SalopekLouie J. Salopek
G.L. Straley
Phillip Arnold
Leslie L. Daviet II
John Heuler
7
_____________________________________________________________________
AT-LARGE MEMBERS
SHELLER REPRESENTATIVES
Western Region
Bruce Caris Deborah E. Ralls
Sonja Roeder Blake Houston
Eastern Region
Jeff Worn Adam C. Harrell
Lawrence Willson Kenny Tarver
MEMBERS ALTERNATES
Central Region
Daniel J. Zedan Steve Zaffarano
William D. "Dan" York, Jr. Rickey Jones
MEMBERS ALTERNATES
Accumulator
Public Member
J.B. Easterlin Chad Selman
Ronald P. HaysVacant
8

12
DISTRICT MAP
3
REGIONs
15
States
West
Central
East
11
EXECUTIVE DIRECTORAlexander J. Ott
DIRECTOR OF INDUSTRYRELATIONSEmma Garner
DIRECTOR OF MARKETING ®ULATORY AFFAIRS
Jeff [email protected]
OPERATIONS MANAGERDeborah Barnett
ASSISTANT DIRECTOR OFMARKETING & INDUSTRY RELATIONS
Julianna [email protected]
9
APC STAFF
INDUSTRY RELATIONSSPECIALIST
Courtney [email protected]

13
DISTRICT MAP
3
REGIONs
15
States
West
Central
East
11
EXECUTIVE DIRECTORAlexander J. Ott
DIRECTOR OF INDUSTRYRELATIONSEmma Garner
DIRECTOR OF MARKETING ®ULATORY AFFAIRS
Jeff [email protected]
OPERATIONS MANAGERDeborah Barnett
ASSISTANT DIRECTOR OFMARKETING & INDUSTRY RELATIONS
Julianna [email protected]
9
APC STAFF
INDUSTRY RELATIONSSPECIALIST
Courtney [email protected]

14
STATEMENT OF FINANCIAL POSITION:FISCAL YEAR ENDED SEPTEMBER 30, 2019
Current Assets:Cash and Cash Equivalents $5,398,557Accounts Receivable $252,655Prepaid Expenses $5,558
Total Current Assets $5,656,770
Fixed Assets:
Property, Plant, and Equipment $47,289Less: Accumulated Depreciation ($17,638)
Total Fixed Assets $29,651
Other Assets:
Security Deposit $2,400
Total Other Assets $2,400 TOTAL ASSETS: $5,688,821
ASSETS
Accounts Payable $777,403Payroll Liability $4,901
Total Current Liabilities $782,304 TOTAL LIABILITIES: $782,304
LIABILITIES
Without Donor Restriction $4,906,517
Total Net Assets $4,906,517
NET ASSETS
TOTAL LIABILITIES AND NET ASSETS $5,688,821
13
_____________________________________________________________________

15
STATEMENT OF FINANCIAL POSITION:FISCAL YEAR ENDED SEPTEMBER 30, 2019
Current Assets:Cash and Cash Equivalents $5,398,557Accounts Receivable $252,655Prepaid Expenses $5,558
Total Current Assets $5,656,770
Fixed Assets:
Property, Plant, and Equipment $47,289Less: Accumulated Depreciation ($17,638)
Total Fixed Assets $29,651
Other Assets:
Security Deposit $2,400
Total Other Assets $2,400 TOTAL ASSETS: $5,688,821
ASSETS
Accounts Payable $777,403Payroll Liability $4,901
Total Current Liabilities $782,304 TOTAL LIABILITIES: $782,304
LIABILITIES
Without Donor Restriction $4,906,517
Total Net Assets $4,906,517
NET ASSETS
TOTAL LIABILITIES AND NET ASSETS $5,688,821
13
_____________________________________________________________________

16
STATEMENT OF EXPENSES: 2018-2019
General Administrative $1,131,400Compliance $145,508Industry Relations $295,799 Marketing $5,560,269 Standardization $192,505Research $434,995Strategic Planning $1,100,000 TOTAL: $8,860,476
EXPENSES
REVENUES $8,262,632
EXPENSES $8,860,476
NET ASSETS ENDING $4,906,517
Marketing62.8%
General Administrative12.8%
Strategic Planning12.4%
Research4.9% Industry Relations
3.3%Standardization2.2%
14
_____________________________________________________________________APPROVED BUDGET EXPENSES: 2019-2020
General Administrative $1,387,700Compliance $346,000Industry Relations $888,000 Marketing $4,420,000 Standardization $202,000International Relations $400,000Contingency $623,000 TOTAL: $8,258,000
EXPENSES
REVENUES $8,265,000
EXPENSES $8,258,000
PROJECTED NET ASSETS ENDING $4,913,517
Marketing53.5%
General Administrative16.8%
Industry Relations10.7%
Contingency7.5%
International Relations4.8%
Compliance4.2%
14
_____________________________________________________________________

17
STATEMENT OF EXPENSES: 2018-2019
General Administrative $1,131,400Compliance $145,508Industry Relations $295,799 Marketing $5,560,269 Standardization $192,505Research $434,995Strategic Planning $1,100,000 TOTAL: $8,860,476
EXPENSES
REVENUES $8,262,632
EXPENSES $8,860,476
NET ASSETS ENDING $4,906,517
Marketing62.8%
General Administrative12.8%
Strategic Planning12.4%
Research4.9% Industry Relations
3.3%Standardization2.2%
14
_____________________________________________________________________APPROVED BUDGET EXPENSES: 2019-2020
General Administrative $1,387,700Compliance $346,000Industry Relations $888,000 Marketing $4,420,000 Standardization $202,000International Relations $400,000Contingency $623,000 TOTAL: $8,258,000
EXPENSES
REVENUES $8,265,000
EXPENSES $8,258,000
PROJECTED NET ASSETS ENDING $4,913,517
Marketing53.5%
General Administrative16.8%
Industry Relations10.7%
Contingency7.5%
International Relations4.8%
Compliance4.2%
14
_____________________________________________________________________

18
STRATEGIC PLANNING

19
STRATEGIC PLANNING

20
Bruce CarisTrent MasonGL StraleyBuck PaulkMolly WillisJeff WornMike SpradlingLouie SalopekPhillip ArnoldDan ZedanSonja RoederLalo MedinaDeborah Walden-RallsJennifer Ivey
The American Pecan Council (APC) completed a 3-month process developing a long-term strategic plan andvision for the future of the Pecan industry. The depth and breadth of topics covered over the courseof this effort were wide-ranging and based on significant research and analysis as well as numerousstakeholder discussions and interviews. The program provides an industry outlook over the next 1, 3, 5 and 10years, while examining activities and opportunities for the APC and industry. This program is critical for thepecan industry as it identifies where the industry should most effectively put their dollars to “move the needle”for pecans. The strategic plan establishes a comprehensive view of the state of the American Pecan industry,which will help identify priorities that will directly address the problems and challenges identified along withsolutions that benefit the industry, for the long term. The overall vision from the strategic plan is to increasedemand for American pecans and provide industry with a path to sustainably grow profitability across thevalue chain. For additional information, please contact the APC office.
WORKING GROUP SUMMARY_____________________________________________________________________
Working Group Chair
Committee Members
Mike Adams

21
Bruce CarisTrent MasonGL StraleyBuck PaulkMolly WillisJeff WornMike SpradlingLouie SalopekPhillip ArnoldDan ZedanSonja RoederLalo MedinaDeborah Walden-RallsJennifer Ivey
The American Pecan Council (APC) completed a 3-month process developing a long-term strategic plan andvision for the future of the Pecan industry. The depth and breadth of topics covered over the courseof this effort were wide-ranging and based on significant research and analysis as well as numerousstakeholder discussions and interviews. The program provides an industry outlook over the next 1, 3, 5 and 10years, while examining activities and opportunities for the APC and industry. This program is critical for thepecan industry as it identifies where the industry should most effectively put their dollars to “move the needle”for pecans. The strategic plan establishes a comprehensive view of the state of the American Pecan industry,which will help identify priorities that will directly address the problems and challenges identified along withsolutions that benefit the industry, for the long term. The overall vision from the strategic plan is to increasedemand for American pecans and provide industry with a path to sustainably grow profitability across thevalue chain. For additional information, please contact the APC office.
WORKING GROUP SUMMARY_____________________________________________________________________
Working Group Chair
Committee Members
Mike Adams

22

23
1
Summary of American Pecan Council 2018 Strategic Planning The American Pecan Council (APC) completed a 3-month process developing a long-term strategic plan and vision for the future of the Pecan industry. The depth and breadth of topics covered over the course of this effort were wide-ranging and based on significant research and analysis as well as numerous stakeholder discussions and interviews. This whitepaper summarizes the analyses, findings, and recommendations, which are organized into 3 sections:
A. Outside-in analysis of current state of the industry & key learnings (“Case for Change”)B. Strategic plan to address challenges & opportunities for the Pecan industryC. Next steps for APC & industry as a whole
A. Outside-in analysis of current state of the industry & Case for ChangeThe first phase of work focused on establishing a fact base for the Pecan industry. To better understand the currentstate of the industry, we embarked on two paths of research and analysis. The first path was connecting withstakeholders to learn about the industry from their perspective. The second path was an objective, data-drivenanalysis of industry dynamics using proprietary data, research reports, and insights from similar industries. Thispath involved three specific areas of research: an analysis of industry economics across the value chain, a deep-dive into marketing & demand strategies, and a forecasted evolution of global supply. From these efforts, weuncovered several issues inherent in the Pecan industry:
• Pecans are more expensive to grow relative to other tree nuts (e.g., almonds and walnuts).• US growing and shelling costs are higher than Mexico’s, putting pressure on American firms, who are
struggling to compete.• Pecans have historically transacted in a cash-driven model, leading to pain points for both growers &
shellers.• A longstanding association with desserts and confectionery items has hindered pecan demand growth, as
they have been unable to ride the tailwinds of healthy snacking trends led by almonds.• Despite having similar health benefits to other tree nuts, pecans are unable to leverage nutritional claims
in marketing given a lack of supporting scientific research.• Without action, the global pecan market will have an excess supply by 2027.• Historically, the industry has struggled to unify around collaborative action given the diversity of regions
and stakeholders across the value chain.These existing challenges were amplified in 2018. Hurricane damage, a trade war with China, and the looming threat of increased foreign supply made for a difficult year, and highlighted the need for a paradigm shift to best position the pecan industry for the future.
Connecting with stakeholders - Belief audits & stakeholder survey: To capture industry sentiment, our strategic planning began with hundreds of hours of belief audits, and a survey of over 150 industry participants. When asked about challenges, some key themes emerged:
• Price volatility and unpredictability is a persistent concern.• The lack of cooperation and collaboration between growers & shellers has created pain points that
permeate the entire pecan value chain.• Single-market dependency has led to headwinds in export demand.• Low-cost suppliers pose a threat to higher-cost U.S. supply.
When asked about the role of the APC, there are several areas where stakeholders want leadership to step in. Above all else, industry participants want the APC to provide a single, unifying voice (“north star”) for the Pecan industry. Stakeholders are also looking to the APC to grow pecan demand among consumers. Finally, the APC can lead the way forward by promoting uniform, simplified, and trustworthy standards as well as improving data and transparency throughout the industry.

24
2
Analysis of industry dynamics - Industry economics & dynamics across value chain: A number of legacy tensions underpin the US pecan industry, inhibiting progress. Limited data availability and transparency in the marketplace, coupled with a historical lack of collaboration between growers & shellers, has exacerbated several challenges that the strategic planning process brought to light.
• Overall, pecans are 10-50%+ more expensive to grow relative to other tree nuts.i Within pecans, there arevariations in growing costs across and within regions that determine growers’ ability to shoulder pricefluctuations.
• Pressure from low-cost Mexican shellers is making it difficult for US shellers to compete, and as a resultmany are struggling to stay in business.
• US growers face similar pressure, becoming increasingly reliant on the Chinese market to sustain in-shellprices and suffering price declines when that market reduces its purchases.
• The industry has typically transacted on a cash-upfront basis, which has strained relationships,concentrated risk and upside, and misaligned incentives.
Both growers & shellers are struggling, and a lack of collaboration has led both parties to perceive the industry as a “zero-sum” situation, where one party’s “win” is automatically a “loss” for the other.
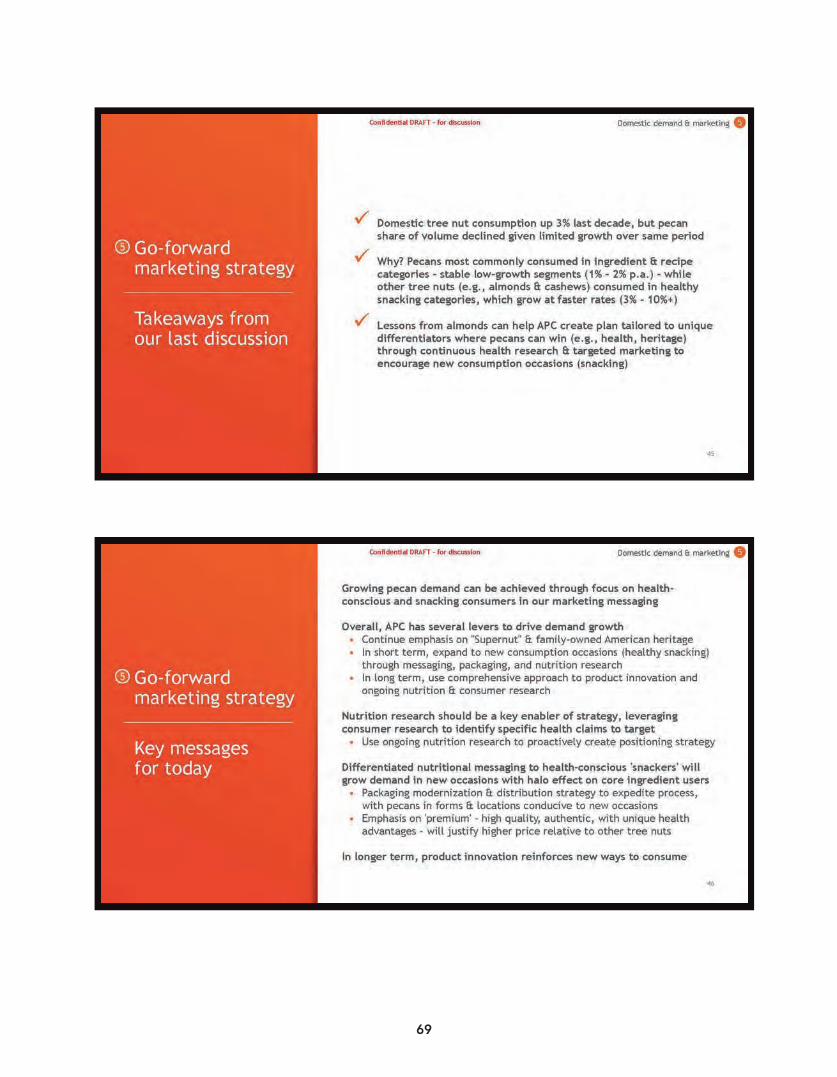
Analysis of industry dynamics - Insights on marketing & demand strategies: Understanding and addressing demand generation was a priority, seen as both the main responsibility of the APC and a win for the entire pecan value chain. Through research, interviews, and analysis, several challenges were identified which are currently restricting pecan demand growth.
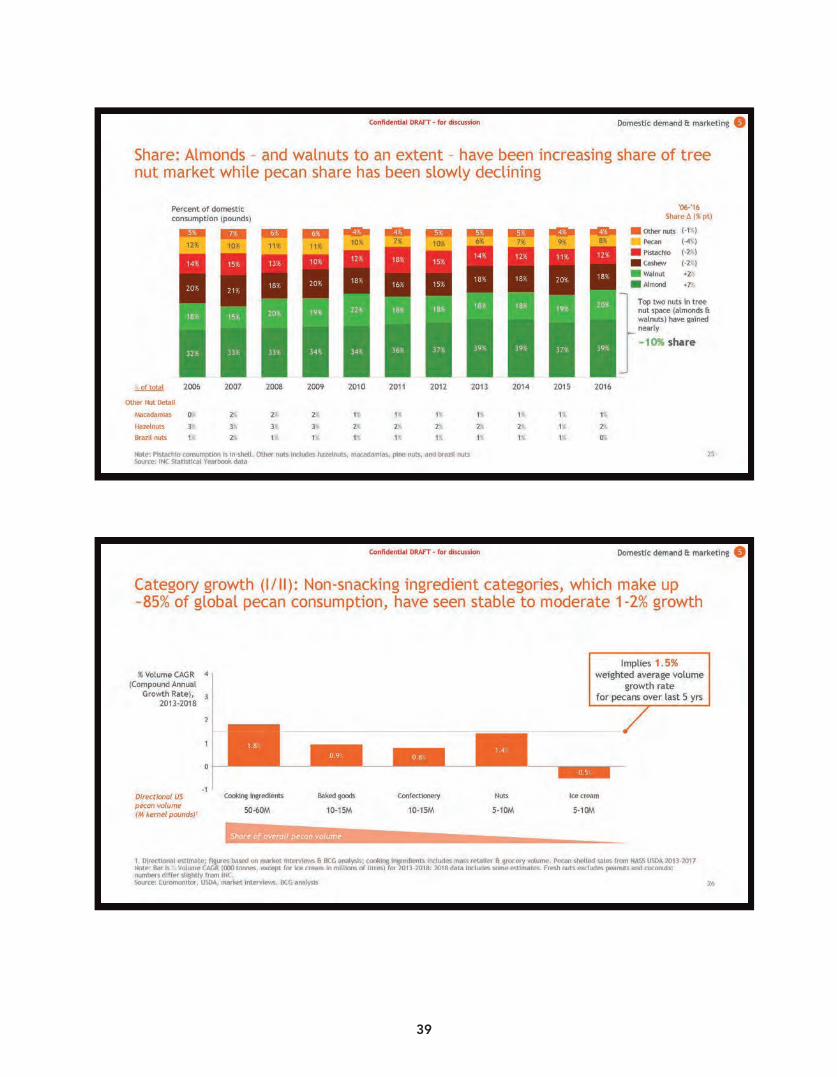
• Pecans are associated with indulgence and tend to be consumed in desserts (e.g., ice cream and pies) thatare eaten with little regularity. Despite several health benefits, pecans are not considered particularlynutritious, and a lack of nutrition research has limited the ability to market health claims.
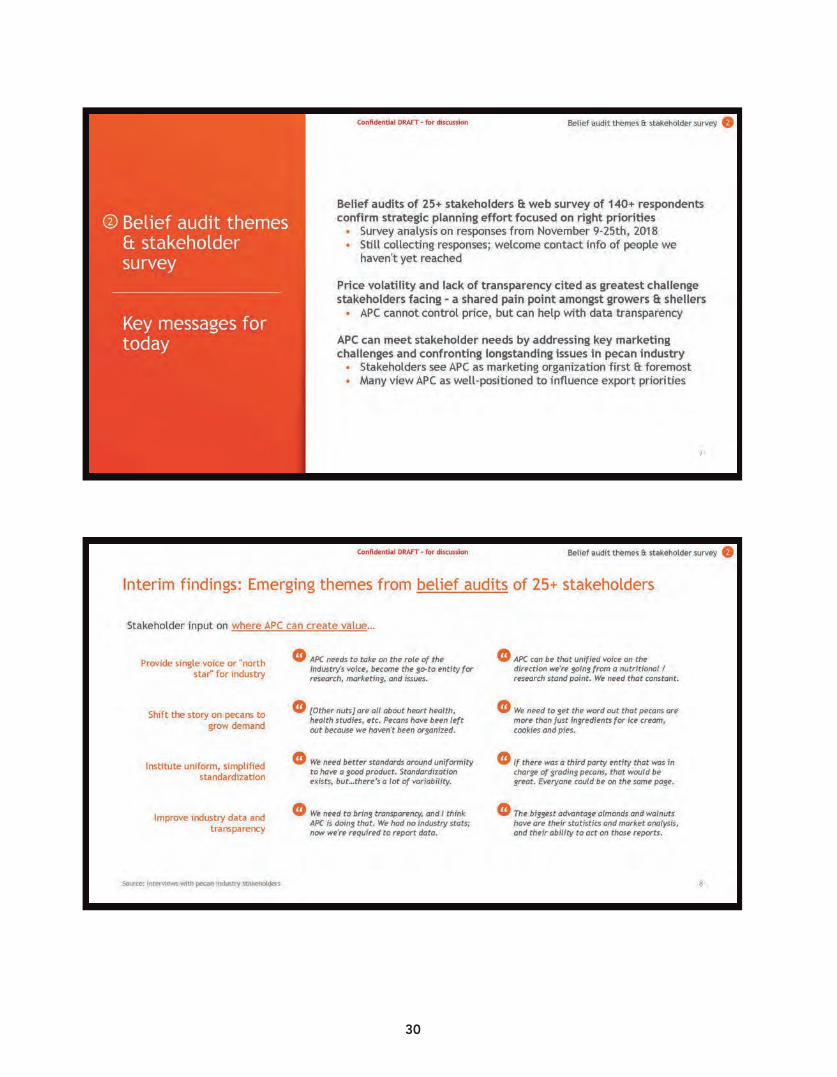
• In contrast, other nuts such as almonds have managed to create a perception of health, leveraging decadesof nutrition research to emphasize health benefits in marketing & messaging.
• This perception of health has allowed other tree nuts to gain share of “snacking occasions,” which can beas many as 20 times per week for some consumers.ii The shift to snacking has bolstered demand forcompeting tree nuts. For example, domestic almond consumption has grown over 70% in the ten yearsbetween 2006 and 2016, whereas pecan consumption growth has been flat (0%) to declining.iii
Analysis of industry dynamics – Evolution of global supply: Although pecan supply originated in the US, other countries have recently developed significant production capabilities and the future pecan supply landscape is increasingly global. Through a combination of market interviews, research, analysis, and forecasting, the magnitude of the impact of low-cost supply from South Africa and China became apparent.
• Global supply is forecasted to grow at ~6% per annum over the next 10 years, with global demandcurrently projected to grow at only 4-5% per annum.iv
• The US is slated to lose share as a global supplier, as South Africa and China lead much of the industry’sgrowth.
• China and South Africa may eventually preclude western supply in North America from accessing easternmarkets such as Europe and Asia.
• Without action, supply outpacing demand could lead to a gradual oversupply of up to 15% by 2027, whichmay have a negative impact on prices.v
B. Strategic plan to address challenges & opportunities for the Pecan industryAfter establishing a comprehensive view of the state of the American Pecan industry, our goal was to create astrategic plan directly addressing problems with solutions that benefit the industry as a whole, for the long term.

25
3
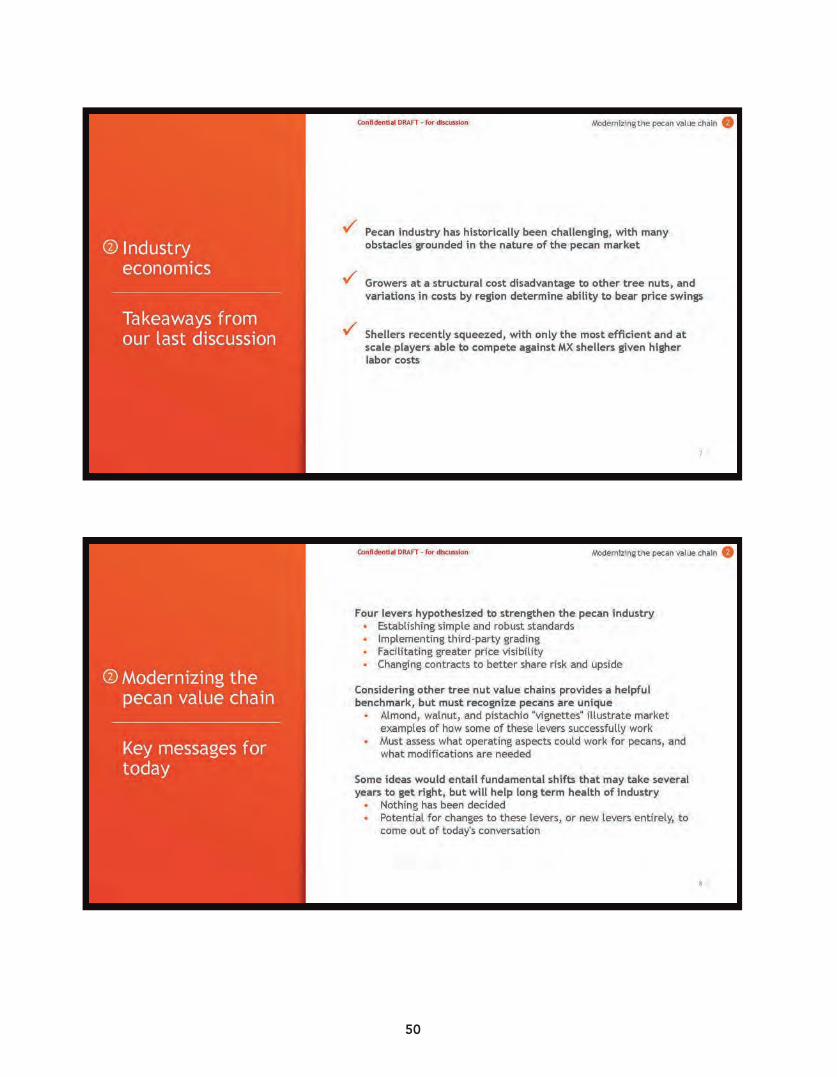
The resultant plan encompasses 5 industry challenges and the corresponding strategic priorities aimed at addressing them.
1. Pecans are not growing as fast as other tree nuts because they are not associated with high-growthconsumption categories such as health, nutrition, and snacking.
• Strategic priority #1: Win fair share of tree nuts by aggressively marketing health benefits togrow everyday use of pecans. Focus marketing on nutrition and snacking, message health benefitsto key influencers (e.g., nutritionists, doctors, business-to-business customers), acceleratenutrition research to expand messaging of pecan health benefits, and modernize packaging withsnack-sizes and differentiated labelling.
2. Global demand for pecans is underdeveloped today, with consumption concentrated in a few markets andlimited coordination of international marketing efforts.
• Strategic priority #2: Lead amongst global suppliers through data-driven prioritization ofinternational markets and coordinated international efforts. Market directly to consumers inWestern Europe & Canada, where similar healthy snacking campaigns will appeal. APC will leadcoordinated marketing efforts with other pecan associations, and focus limited APC resources onthe highest return export markets and activities.
3. The US Pecan industry's “infrastructure” is less developed than that of other tree nuts, with unreliabledata, outdated standards, and conflicts over grading practices inhibiting industry growth.
• Strategic priority #3: Strengthen our infrastructure by making better data & uniformstandards/grading available to all. Simplify and publish standards for industry-wide adoption andusage, establish an option for third-party grading, ensure standards are applied equally acrossdomestic and international product, and track and publish pecan data for all stakeholders toaccess.
4. The Pecan industry is one of the only remaining markets where transactions require upfront cashpayments between growers and shellers, creating pain points, weakening value chain relationships andhindering growth.
• Strategic priority #4: Modernize the industry by educating stakeholders on options for improvingthe way growers & shellers transact. Research best practices from other industries and aid inlearning & revision of alternative pecan transaction models, which industry participants canchoose to adopt.
5. A lack of transparency and visibility across stakeholder groups leads to limited cooperation, fragmentedand duplicated efforts, and inefficiencies in the pecan market – the industry has never had a uniformstrategic vision before.
• Strategic priority #5: Unite pecan stakeholders through regular communications and clarityaround the APC strategic plan. APC will provide ongoing communications about its strategy andprogress and encourage partnership and coordination with other industry associations tomaximize impact. The APC will help unite the industry behind one common goal of growing pecandemand.
C. Next steps for APC & industry as a wholeAs the strategic planning phase wrapped, APC prepared for immediate and comprehensive action to move forwardwith these priorities. APC has assembled working teams comprised of leadership from the APC staff, councilmembers, and volunteers from the industry. Initiatives have assigned owners, who are accountable for progressand meeting milestones. The goal is for each of the five initiatives to move the Pecan industry toward a future statewherein:

26
5
Priority Current State Future State Win fair share
of tree nuts Seasonally consumed, “indulgent” ingredient nut that lags growth of other tree nuts
Differentiated, nutrition-oriented, everyday “snacking” nut capturing fair share of growth
Lead amongst global
suppliers
Trade-show based, “push” export strategy with resources spread across many markets and limited common messaging
A consumer-driven export marketing strategy that adopts domestic messaging and focuses on a few markets with the highest potential
Strengthen our infrastructure
Limited, unreliable data and non-uniform standards that are enforced inconsistently
Reliable, accessible data sources that support decision making, reinforced by implementation of uniform standards
Modernize the industry
One cash-only transaction model that prevents value chain partnerships and inhibits market growth
A modernized, diversified set of transaction models informed by well-researched best practices that educate industry on sharing risk & upside to promote stability & efficiency
Unite pecan stakeholders
Fragmented stakeholders acting in their individual interest with limited collaboration
Unified stakeholder base with a commons strategy, working together to benefit the American Pecan industry
i Almond Board; UC Davis; USDA; Market Interviews ii Weber Shandwick / Mintel iii INC Statistical Yearbooks iv Supply data estimated using a variety of primary sources and proprietary analysis. Sources include: USDA FAS/GATS, SIAP-SAGARPA, Comenuez, SAPPA, Industry Interviews, APC Stakeholder Survey. Demand data is based on historic pecan consumption growth globally. v Based on difference between projected supply and demand, growing over 10-year period. Number reflects a theoretical imbalance, not necessarily actual predicted consumption

27

28

29
30

31

32

33

34

35

36

37

38
39

40

41

42

43

44

45

46

47

48

49
50

51

52

53

54

55

56

57

58

59

60

61

62

63

64

65

66

67

68
69

70

71

72

73

74

75

76

77

78

79

80

81

82

83

84

85

86

87

88

89

90

91

92

93

94

95

96

97

98

99

100

101

102

103

104

105

106

107
108

109
1
2018-2019 F ISCAL YEAR CONSUMER MARKETING

110
Mike AdamsLalo MedinaTrent MasonAngie EllisMolly WillisLouie SalopekPhillip ArnoldJeff WornFrank SalopekRandy HudsonJennifer IveySonja RoederLes Daviet
The marketing efforts of the American Pecan Council totaled over 75% of the industry’s entire operating fund. The commitment to marketing American pecans is job one. During 2019, the APC built a first-rate team ofmarketing professionals and prepared to diversify its efforts by bringing more activities inhouse. Thanks inpart to the Boston Consulting Group’s strategic plan, we will save our industry $1.85 million each year as theAPC team finds ways to repurpose marketing dollars at significant savings. Looking forward over the nextcouple of years, the industry’s realized savings will be repurposed into areas such as influencer marketing andengagement, nutrition-based research and marketing, and advertising including audio, video and digitalmarketing. Early returns on these efforts show a significant increase in pecan consumption by over 30%.Furthermore, in larger cities across the US, consumers will hear and see our commercials positioning pecans asa scrumptious snack. Furthermore, the APC has placed a significant focus on measuring the effectiveness ofour marketing efforts. Data will drive the who, what, where and how of our efforts to make strategic use ofeach precious industry dollar.
COMMITTEE SUMMARY_____________________________________________________________________
Committee Chair
Committee Members
Bruce Caris

111
Mike AdamsLalo MedinaTrent MasonAngie EllisMolly WillisLouie SalopekPhillip ArnoldJeff WornFrank SalopekRandy HudsonJennifer IveySonja RoederLes Daviet
The marketing efforts of the American Pecan Council totaled over 75% of the industry’s entire operating fund. The commitment to marketing American pecans is job one. During 2019, the APC built a first-rate team ofmarketing professionals and prepared to diversify its efforts by bringing more activities inhouse. Thanks inpart to the Boston Consulting Group’s strategic plan, we will save our industry $1.85 million each year as theAPC team finds ways to repurpose marketing dollars at significant savings. Looking forward over the nextcouple of years, the industry’s realized savings will be repurposed into areas such as influencer marketing andengagement, nutrition-based research and marketing, and advertising including audio, video and digitalmarketing. Early returns on these efforts show a significant increase in pecan consumption by over 30%.Furthermore, in larger cities across the US, consumers will hear and see our commercials positioning pecans asa scrumptious snack. Furthermore, the APC has placed a significant focus on measuring the effectiveness ofour marketing efforts. Data will drive the who, what, where and how of our efforts to make strategic use ofeach precious industry dollar.
COMMITTEE SUMMARY_____________________________________________________________________
Committee Chair
Committee Members
Bruce Caris

112

113
114

115

116

117

118

119

120

121
122

123

124
2
The 2018-2019 Fiscal Year was tremendously exciting for American Pecans. After introducing American Pecans, The Original Supernut to the world in April 2018, this was the year to kick our program into high gear. We focused on using the new brand to showcase the benefits of American Pecans as well as the powerful people behind the product.
NUTRITIOUS, DELICIOUS AND VERSATILE: MARKETING THE ORIGINAL SUPERNUT™
While industry continued to face challenges – from higher tariffs to severe weather, we carefully built momentum for our national marketing program. Our commitment is to make the strongest use of industry dollars, driving the largest impact for you and your businesses.

125
3
Focusing On a More Targeted Audience
Leading up to and during the brand launch, we pursued widespread awareness of American Pecans. With early successes in generating domestic awareness and a streamlined budget that required the utmost efficiency, we built our next phase of marketing to specifically pursue those with the biggest potential for driving pecan purchases.
In the 2018-2019 Fiscal Year, we strategically narrowed our target to focus on one core audience: Generation X and Y mothers. This group has children at home and holds purchasing power for groceries. Health and wellness for their families is a top priority, and demanding schedules mean that accessibility and ease of use are paramount. By focusing our efforts on these consumers, we were able to make a bigger impact with the consumers who are most likely to drive pecan purchase.
Fueled by consumer trends and behavior analysis, 2018-2019 Fiscal Year marketing efforts focused on sharing new ways to use pecans. We knew that pecans were a favorite dessert nut, but getting on mom’s recurring mental menu required creative content, strong partnerships – and most of all, direct connection with consumers to educate them about the versatility of our native nut.
Digital-first, Integrated Marketing
Changing consumers’ behavior was dependent on communicating in places they already go for help to make decisions and where they are influenced by new products and ideas. As digital media continues to dominate today’s culture, concentrating our efforts on social media, outreach to editors at digital publications, paid search and influencer partnerships were keys to success.
Throughout the three major campaigns in the 2018-2019 Fiscal Year – Super American Pecan-A-Thon, Super-fy, and Superweeks – our core
messages of taste, nutrition and versatility remained front and center. We took every opportunity to dig deeper into these dominant themes, as well as share more about the pecan’s heritage.

126
4
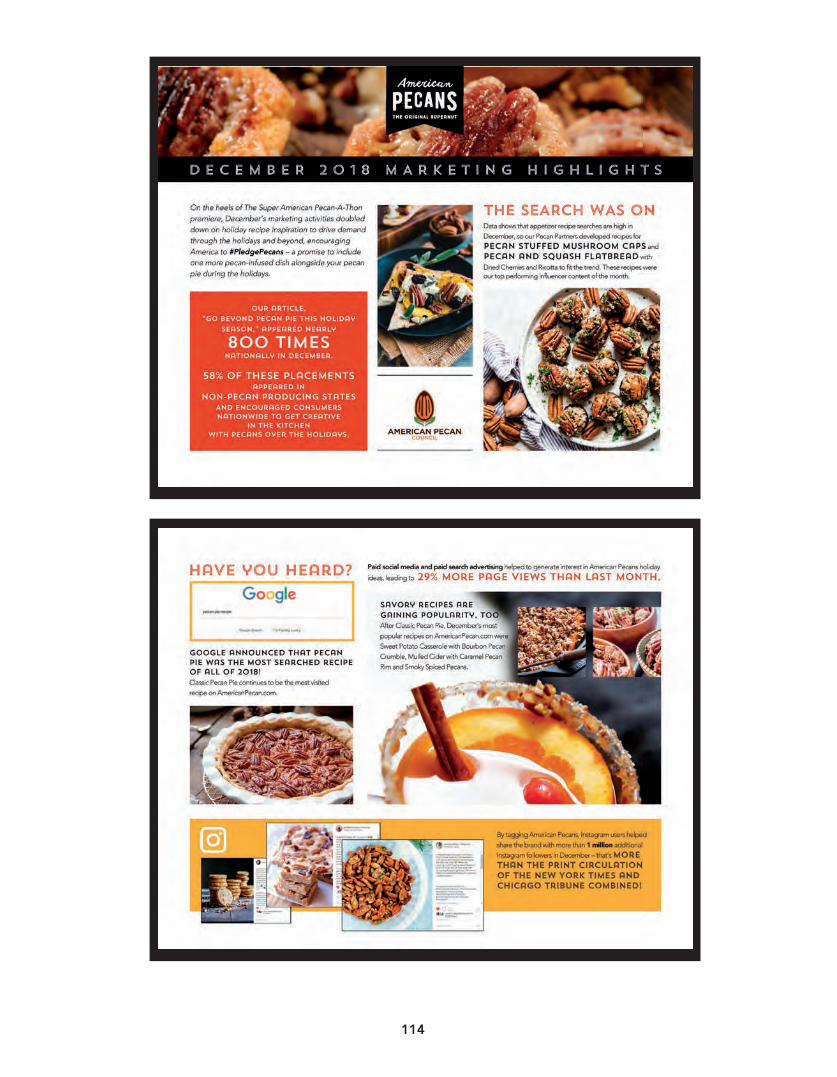
SUPER AMERICAN PECAN-A-THON (October-December 2018)
We kicked off the 2018-2019 Fiscal Year with one of our most ambitious and exciting events yet – The Super American Pecan-A-Thon. At the end of a tough year for the pecan industry, and as the holidays approached, we needed a strong push to drive consumer demand.
Food brands pull out all the stops during the holiday season, showcasing their most craveable recipes in the great race for a place on America’s tables. But even with their status as a beloved holiday ingredient, we knew American Pecans had to do more than pump out festive recipes to break through the clutter and inspire our target audience to consider more pecan-based dishes during the season.
We turned to research to see if the resilience of the American Pecan farmer would resonate with our target of Gen X and Y moms. Turns out they were very invested in the economic wellbeing of American agriculture. In fact, in the top 20 media outlets that Gen X and Y moms frequent, more than 2,000 articles and 1.3 million social shares featured the economic wellbeing of American agriculture and the future of the industry.
We leveraged this finding, along with other pieces of research: these moms care deeply about serving their family high-quality, delicious meals and have interest in the origins of their food. Forty-three percent of Gen X and Y moms make an extra effort to buy locally grown foods at the grocery store, and 55 percent believe doing so supports the local economy.

127
5
Pledge Pecans for the Holidays
Armed with these insights, we set out to turn our target’s passion for buying local, healthy food into a patriotic interest. We wanted to put the American Pecan industry forward and shine a light on their perseverance while driving people to make more pecan recipes during the holiday season. To accomplish our task, we created a one-of-a-kind variety show, The Super American Pecan-A-Thon, where we asked America to #PledgePecans for the holidays – a promise to make one more pecan dish, beyond the beloved holiday pie, in support of America’s pecan growers.
The Super American Pecan-A-Thon was the first of its kind executed by a commodity board – a live, online variety show featuring recipes, home décor and entertaining ideas for the upcoming holiday season – all featuring America’s native nut.
To execute the production on a national scale, we partnered with one of the largest international media organizations, Condé Nast, and their brand Epicurious, one of the most visited websites for culinary inspiration in the world. Epicurious attracts expert and amateur cooks alike and is a popular site with our target audience. It’s also founded on the basis of culinary exploration – perfect for a product seeking to go beyond its traditional sweet usage.
We researched the most searched-for recipes during the holiday period to be featured in the show – everything from main dishes and sides to drinks and holiday crafts. All of them highlighted the unexpected ways people can use pecans beyond the pie, from a Pecan Crusted Prime Rib to a holiday snow globe craft.

128
6

129
7
Holiday Inspiration, American Pecans Style
The show was hosted by comedian Wendi McLendon-Covey of hit TV shows and movies such as “The Goldbergs” and “Bridesmaids.” A cast of pecan growers and shellers from each region were the stars, lending candor and authenticity to the show as they took the stage to cook, share their stories, and mingle with social influencers, entertaining experts and culinarians, our celebrity host, and even a family band whose members were pecan growers! The show featured both growers and shellers representing the Western, Central, and Eastern regions. From the Western region, we had Heather Salopek (Grower, New Mexico) and Ben and Laura King (Growers, California). From the Central region, we had Kortney Chase (Grower and Sheller, Texas), Mike Spradling (Grower, Oklahoma) and the Iveys band, including Arlen (Grower, Texas), Sam, Jessica, Jenna, and Galen Ivey. From the Eastern region, we had Marianne Brown (Grower, Georgia).
A true celebration of the rich history and diverse backgrounds that make up America’s pecan industry, The Super American Pecan-A-Thon aired on November 20 – one of the most popular days for online recipe searches – on AmericanPecan.com and had its own dedicated landing page where site visitors could tune in and find recipes from the show.
The show simultaneously screened on Epicurious.com and was supported via paid promotion through Condé Nast. It was also promoted on social media through paid campaigns targeted directly at Gen X and Y moms with an interest in cooking.
We pitched national, local and trade media to drive further awareness and emphasize the connection to the pecan growing community. The outreach resulted in articles like the Tulsa World piece, “Past the Pie: Pecan growers share various uses for nuts on new web show,” as well as a tune-in announcement and interview with Executive Director Alex Ott on RFD-TV.

130
8
Industry in the Spotlight
Industry involvement was particularly powerful during this campaign, which featured so many industry members themselves. Promotional social media posts and supportive likes, comments, and shares of the show helped drive impact and raise awareness of the campaign.
The Super American Pecan-A-Thon drove more than 163,000 pledges comprised of recipe clicks on Epicurious.com and AmericanPecan.com. That’s 163,000 moments of inspiration driving home pecans’ place outside the pie shell. The Pecan-A-Thon also saw 11 million interactions including clicks, site page views, shares, likes, comments and video views. The show was watched 29,000 times on Epicurious and AmericanPecan.com.

131
9

132
10
SUPER-FY (January-March 2019)
The beginning of the 2019 calendar year brought a renewed focus on health and wellness. To take advantage of the strong cultural interest in healthy living, we introduced the Super-fy campaign. The campaign showed how pecans can amp up the nutrition and taste of average meals and snacks, taking any dish from simple standby to super standout. We encouraged consumers to keep American Pecans in their fridge or freezer so they can easily add them to any recipe, from snacks and appetizers to sides and main dishes.
Heart-Smart* with Pecans
Our media relations efforts focused on educating Americans on the health benefits of pecans and offering quick, easy ways to incorporate them into diets. We wrote and released an article, “Simple Ways to be Heart Smart” to newspapers
and magazines nationwide in the last week of January, right on the cusp of American Heart Month in February. In addition to the heart-smart* qualities of pecans, the article featured the recipe for Cherry Pecan Energy Bites, an ideal fit for our Gen X and Y mom target audience who wants quick and kid-friendly options.
To further insert American Pecans into the healthy habits conversation, we partnered with registered dietitian Andrea Luttrell for broadcast news segments to highlight pecans alongside other heart-healthy* ingredients. The segment aired in markets on the East Coast to reach consumers beyond the Pecan Belt.
*According to the U.S. Food and Drug Administration, scientific evidence suggests but does not prove that eating 1.5 ounces per day of most nuts, such as pecans, as part of a diet low in saturated fat and cholesterol may reduce the risk of heart disease. One serving of pecans (28g) has 18g unsaturated fat and only 2g saturated fat.

133
11
From Daily Newspapers to Supermarket Magazines
We also tapped into relevant cultural moments to tell the Super-fy story. From New Year’s resolutions to the Super Bowl, we secured coverage featuring American Pecans and new signature recipes in outlets such as Reader’s Digest, the San Diego Union Tribune, Times News (Lehighton, Pennsylvania), Paris Post-Intelligencer (Paris, Tennessee) and Arkansas Gazette.

134
12
As we work to increase demand and purchase of pecans, where better to do that than at the supermarket where people buy groceries? We partnered with Kroger’s Live Naturally magazine to release a heart-focused feature in four major markets nationwide: Kroger Atlanta, Kroger Southwest (Texas, Louisiana), Ralph’s of California and Kroger Mid-Atlantic (West Virginia, Virginia, North Carolina, and Tennessee).
By combining pecan nutrition information with the seasonal interests of our audience, we created an engaging article featuring one of our summer grilling recipes.

135
13
Retail Dietitians Spread the Word
In 2019, we strengthened important relationships with retail dietitians. They helped present pecans as a versatile ingredient, reinforcing its heart-smart* benefits and bringing its taste to life with product samples and recipe demonstrations. These RD partners received The Original Supernut Dietitian Toolkit filled with educational materials and branded signage for in-store demos and displays. Twenty-three retail dietitians nationwide used the campaign toolkit and conducted demonstrations with American Pecans in-store – right as consumers are considering what items they are going to purchase.
With recipe inspiration, recommended social media content and nutrition information, the toolkit allowed supermarket RDs to take their in-store support of pecans to new heights. Several RDs expanded on these kits, featured content on their social channels and highlighted The Original Supernut in local news coverage.
In April during National Pecan Month, RD and social media influencer Mia Syn shared the pecan love in a TV cooking demo in Charleston, SC and with her 84,000 Instagram followers by posting about six different ways to use pecans “outside the pie.”

136
14
SUPERWEEKS (April-September 2019)
Throughout the spring and summer, we capitalized on the success of the Super-fy program by evolving it into Superweeks. We knew that the back half of the year had to be extremely hardworking, stretching dollars to target the people with the greatest volume potential for pecan purchase, while leveraging our strongest value adds – nutrition and taste. In order to make pecans an everyday cooking and snacking staple for our audience, we needed to insert ourselves in the everyday process of meal planning. We wanted to encourage our audience to make a simple, definable change – to purchase one bag of pecans per week – and convince them to do so through a campaign that showcases the versatility and value of pecans.
This campaign leveraged the popularity of meal planning by offering ideas on how one bag of pecans could be incorporated into a week’s worth of family meals. We outlined the many uses for pecans to our target audience (Gen X and Y moms) as they planned their meals for the week. We also tapped into their desire to put creative, family-friendly dishes on the table.
Discover quick and easy meal plans at AmericanPecan.com

137
15
Pecan-Inspired Meal Plans for All
By showing how versatile just one bag of pecans can be, we encouraged our target audience to add them into their weekly grocery hauls. Each week of the campaign, we released a new selection of pecan-inspired recipes for families to enjoy during busy work weeks. The meal plans highlighted seven themes – Heart Health, Gluten Free, Kid-Friendly, Plant-Based, Magic Number, Energy and Summer Socials – that were informed by extensive research into the lifestyles, and dietary needs and goals of our target audience. The research focused on themes with the highest search volume, social conversations and earned conversations on a monthly basis tailored to our target.

138
16
Digital Content and Partnerships Drive Efficient Results
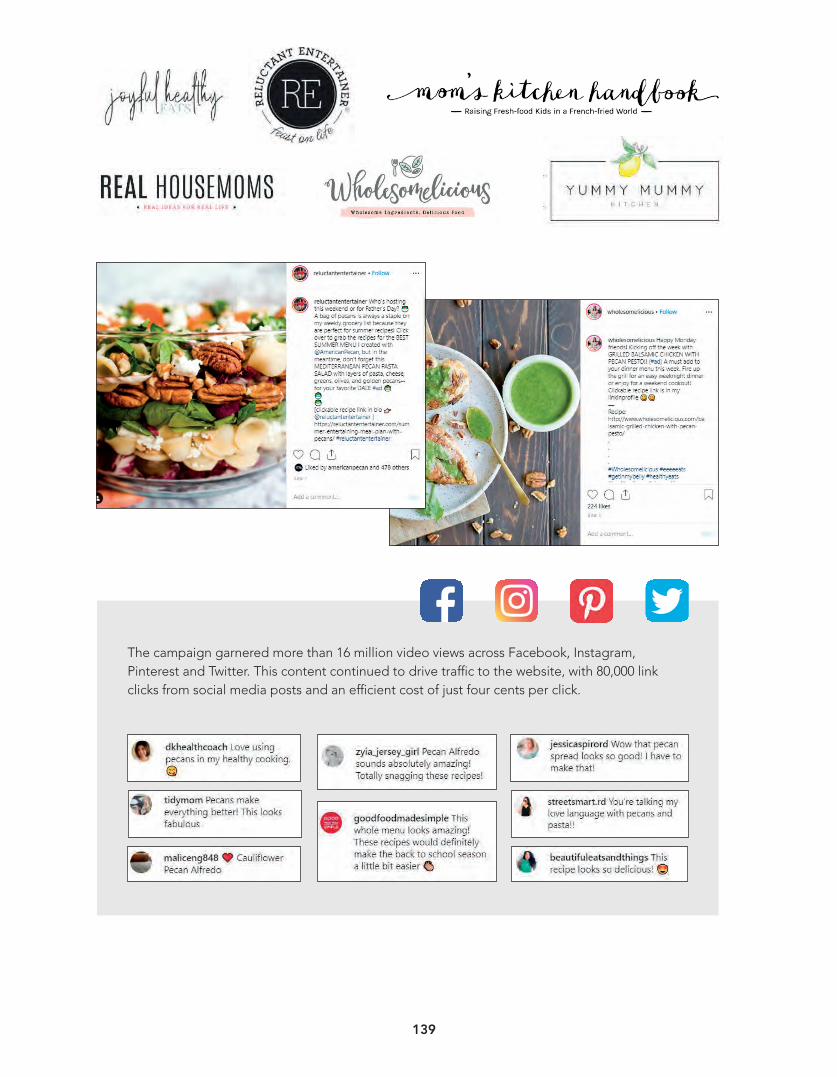
We partnered with influencers and bloggers who specialize in creating meal-planning guides and menus to develop content as well as promote the program on blogs that our audience already loves to read. We leveraged traditional media outreach to share the Superweeks message with news outlets nationwide, as well as paid social media advertisements targeted to our audience.
139
17
The campaign garnered more than 16 million video views across Facebook, Instagram, Pinterest and Twitter. This content continued to drive traffic to the website, with 80,000 link clicks from social media posts and an efficient cost of just four cents per click.

140
18
Media Results from Coast to Coast
To support the campaign in newspapers and online, we wrote and released an article titled “Simplify Back-to-School Dinners with Nutritious Meal Plans” to hundreds of news outlets nationwide. The article – which featured the nutrition benefits of pecans plus tasty, weeknight-friendly options such as Pecan-Crusted Air Fryer Pork Chops – was distributed in July and August for the start of back-to-school season. The article ran in print and online news outlets more than 1,000 times in all 50 states, including the St. Louis Post-Dispatch, The Advocate (Baton Rouge, Louisiana) and The Southern Maryland Chronicle.
We were also featured in the May 27 issue of OK! Magazine, a top national entertainment magazine, with our Baked Pecan-Crusted Chicken Tenders in the “Things We’re Obsessed With” section, reaching an audience of more than 2 million consumers.

141
19
Retail Dietitians Promote Health Benefits
On local broadcast TV segments in July, registered dietitians Amy Goodson and Annessa Chumbley presented pecans as a source of protein that make for a delicious snack and recipe addition. They explained the pecan’s health benefits and how the nut is ideal for effortless summertime entertaining, sharing our Pecan Berry Green Salad as an impressive option. The segments reached more than 25,000 viewers, connecting them with the easy entertaining options of The Original Supernut.
In building our relationships with supermarket RDs, we partnered with one of their most trusted sources – the Retail Dietitians Business Alliance (RDBA). The RDBA’s newsletter is distributed to more than 2,200 members nationwide, and in the May and June issues, American Pecans provided an opportunity for RDs to download the RD toolkit and Superweeks content.

142
20
The goal of our 2018-2019 Fiscal Year efforts continues into the 2019-2020 Fiscal Year: increase demand for pecans by showing consumers they are not just a traditional sweet ingredient, but rather a superfood with delicious and nutritious offerings for all meals, seasons and lifestyles.
LOOK AHEAD TO 2019-2020 FISCAL YEAR CONSUMER MARKETING
A Pie Full of Holiday Inspiration
We started the new fiscal year with a bang and broke through the typical holiday coverage with a national showstopper – the Pecan ThanksEverything Pie. The wacky creation was born out of the desire to disrupt newsfeeds and news cycles to reach our audience during a typically cluttered time period. To do that, we needed a breakthrough way to show how pecans are a crucial ingredient in both sweet and savory dishes during holiday celebrations. We partnered with Brooklyn-based pie bakers and sisters Melissa and Emily Elsen of Four & Twenty Blackbirds pie bakery to develop the Pecan ThanksEverything Pie, a creation with eight unique slices each representing a different holiday dish.
From national media coverage to deskside meetings with editors in New York City and robust paid social media support, the campaign provided a strong start to the 2019-2020 Fiscal Year at a peak time for pecan sales. The Pecan ThanksEverything Pie drew national media attention and was one of our most successful campaigns to-date, putting pecans front and center as a must-have holiday ingredient.
Media outlets such as Thrillist, Reader’s Digest, Good Housekeeping, Rachael Ray Every Day, Delish, Taste of Home and more ran stories or posted on social media about the Pecan ThanksEverything Pie and highlighted ways to incorporate pecans into holiday meals.

143
21
The Superpowers of Pecans
To ring in the new decade, American Pecans introduced The Superpowers of Pecans, a content series created in the comic-book style of superheroes, which are dominating today’s movie and media culture. The series promotes the nutrition qualities of pecans as superheroes in their own right, acting as the ultimate sidekick to help busy consumers power through their packed schedules.
As the year continues, American Pecans will continue to build a marketing program fueled by strong consumer analysis and social media targeting, as well as events, activations and content informed by what is relevant and popular in today’s culture. In order to break pecans out of the harvest and holiday dessert pattern, we’re continuing to share pecan recipe inspiration at unexpected times and around some of the biggest celebration moments in culture today.
As we work in earned, paid and social media, we are committed to constant improvement. We continually evaluate the performance of our marketing program to inform what we create next, ensuring that we optimize every step of the way and use industry dollars effectively.

144

145
22
2019-2020 F ISCAL YEAR INDUSTRY RELATIONS

146
The U.S. pecan industry is spread across 15 growingstates from California all the way to North Carolina. Each region and even each state is very unique andface many different challenges to overcome. Priorto the Federal Marketing Order, there was a lack oftransparency and visibility across stakeholder groupsleading to limited cooperation among stakeholders,fragmented and duplicated efforts, andinefficiencies in the pecan market – the industry hasnever had a uniform strategic vision before. Withsuch diverse dynamics, it is very important toencourage coordination among stakeholders andunify industry efforts to make the biggest impact. The focus should be shifted to fighting the “nutwar”. The Industry Relations committee goal is tounite pecan stakeholders through regularcommunications and clarity around the APCstrategic plan. APC will provide ongoingcommunications about its strategy and progress andencourage partnership and coordination with otherindustry associations to maximize impact. The APCis dedicated to helping unite the industry behindone common goal of growing pecan demand andawareness.
The American Pecan Council keeps industry up todate on current issues and items with activecommunications through multiple channels such asthe bi-weekly newsletter, industry publicationarticles, and engagement with other trade mediasources. APC has presence at each pecanassociation conference and meetings and otheroutreach opportunities in order to meet industrymembers across the fifteen growing states.
In the past, the industry has depended on limitedand unreliable data. In light of this, APC is focusedon providing reliable and accessible data sourcesthat support decision making. The FMO mandateshandlers of pecans to submit monthly dataregarding their operations. Currently, APC compilesand publishes this data through industry withmonthly pecan industry position reports posted onAmericanPecan.com & sent to the broader industryin order to establish fair and transparent data.
COMMITTEE SUMMARY_____________________________________________________________________
Buck PaulkAngie EllisMike AdamsMike SpradlingLouie SalopekPhillip ArnoldAdam HarrellDan ZedanRon Hays
Committee Chair
Committee Members
Deborah Walden-Ralls
The Pecan Industry Position Reports coupled withother funded projects such as USDA NASS surveysand Land IQ pecan acreage surveys enable industrymembers to make more informed businessdecisions. All of these items create regularcommunications about APC’s strategy and progressto the broader industry to create a unifiedstakeholder base with a common strategy, workingtogether to benefit American pecan industry. Tokeep up to date on the Council and all the programsand activities, we encourage industry members toregister on the American Pecan website under the“For Industry” tab to keep up to date with theCouncil.

147
The U.S. pecan industry is spread across 15 growingstates from California all the way to North Carolina. Each region and even each state is very unique andface many different challenges to overcome. Priorto the Federal Marketing Order, there was a lack oftransparency and visibility across stakeholder groupsleading to limited cooperation among stakeholders,fragmented and duplicated efforts, andinefficiencies in the pecan market – the industry hasnever had a uniform strategic vision before. Withsuch diverse dynamics, it is very important toencourage coordination among stakeholders andunify industry efforts to make the biggest impact. The focus should be shifted to fighting the “nutwar”. The Industry Relations committee goal is tounite pecan stakeholders through regularcommunications and clarity around the APCstrategic plan. APC will provide ongoingcommunications about its strategy and progress andencourage partnership and coordination with otherindustry associations to maximize impact. The APCis dedicated to helping unite the industry behindone common goal of growing pecan demand andawareness.
The American Pecan Council keeps industry up todate on current issues and items with activecommunications through multiple channels such asthe bi-weekly newsletter, industry publicationarticles, and engagement with other trade mediasources. APC has presence at each pecanassociation conference and meetings and otheroutreach opportunities in order to meet industrymembers across the fifteen growing states.
In the past, the industry has depended on limitedand unreliable data. In light of this, APC is focusedon providing reliable and accessible data sourcesthat support decision making. The FMO mandateshandlers of pecans to submit monthly dataregarding their operations. Currently, APC compilesand publishes this data through industry withmonthly pecan industry position reports posted onAmericanPecan.com & sent to the broader industryin order to establish fair and transparent data.
COMMITTEE SUMMARY_____________________________________________________________________
Buck PaulkAngie EllisMike AdamsMike SpradlingLouie SalopekPhillip ArnoldAdam HarrellDan ZedanRon Hays
Committee Chair
Committee Members
Deborah Walden-Ralls
The Pecan Industry Position Reports coupled withother funded projects such as USDA NASS surveysand Land IQ pecan acreage surveys enable industrymembers to make more informed businessdecisions. All of these items create regularcommunications about APC’s strategy and progressto the broader industry to create a unifiedstakeholder base with a common strategy, workingtogether to benefit American pecan industry. Tokeep up to date on the Council and all the programsand activities, we encourage industry members toregister on the American Pecan website under the“For Industry” tab to keep up to date with theCouncil.

148
23
This past year was one of the more challenging years that our industry has experienced, but one in which perseverance and collaboration continued to move the industry forward. The beginning of the fiscal year was marked by continued international changes, and tariff pressures dominated much of industry conversation. In addition, the devastation of severe weather, especially Hurricane Michael in the Southeast, forced much of industry to recover and rebuild.
UNITING AND EQUIPPING THE AMERICAN PECAN INDUSTRY
Throughout these challenges, we were given the opportunity to continue unprecedented measures of unification and forward momentum for the future of American Pecans, with national marketing efforts being a significant part of the equation. As we continue to advance our goals of raising awareness of and driving demand for pecans, we have made a parallel commitment to keeping the industry involved, informed of how funds are being spent and equipped to support your own marketing efforts with American Pecans.
Congress kicked off and provided an opportunity for 22 industry organizations to come together for the first time in pecan history. The event provided an opportunity for each of the organizations to update each other on activities and while creating synergies on like minded projects. This forum has become an invaluable part of information sharing for the industry on hot topic and important issues that impact the marketing of pecans.
. The creation of the Pecan

149
24
Our commitment came with an increased volume and depth of industry communications in the 2018-2019 Fiscal Year. A key resource to keep industry abreast of news, the In a Nutshell newsletter was distributed via email twice per month to more than 3,000 recipients, detailing APC regulatory, policy and marketing initiatives and updates. Dedicated e-blast announcements shared details of important industry events, marketing campaign launches, or other issues that required special attention.
UPDATES AND COMMUNICATIONS

150
25
Your Dollars at Work
In addition to this regular communication, this fiscal year, we introduced the Monthly Marketing Highlights. These reports were developed in direct response to industry requests for a short, easy-to-read, frequent update on marketing initiatives. The new monthly progress report, which features the ongoing success and development of the domestic marketing program, is the most frequently visited item in our Industry Toolkit.
Each report offers a handful of data points that demonstrate the tangible impact of marketing efforts. It also provides insights on a variety of different tactics, including paid social media, traditional earned media coverage and work with bloggers and influencers. The report not only shows increased awareness of pecans as a versatile ingredient, but also consumer actions that demonstrate purchase intent, like website recipe views.
Industry in the News
We also strengthened our relationships with trade and local media outlets in pecan-growing markets. The American Pecan Council continued to contribute regularly to Pecan South, Georgia Pecans and West Coast Nut, with articles covering a breadth of topics and updates on APC activities such as social media, measuring success, marketing strategies and campaign themes. Around large marketing campaign launches, we secured coverage featuring our industry members and the APC in trade outlets such as RFD-TV and local media such as Tulsa World.
N O V E M B E R 2 0 1 9 M A R K E T I N G H I G H L I G H T S
Thanks to media coverage and paid social media advertisements, there were nearly 150,000 site visitors in November – the most monthly visitors since we launched!
As we work to engage consumers on the benefits and many uses of pecans, we look at time spent on the site as an indicator of interest in this content. Time on the site in November increased 40% from this time last year!
Made this tonight and the goat cheese log and honey pecan spread were amazing. I felt so fancy! Thanks for the inspiration!”
Omg! So perfect!!!! Saving this for sure”
These look incredible!! Love pecans so so much“
Just started following @Americanpecan thanks!”
Consumers are staying to browse!
“
“
”
“
Record-setting site visits
D E C E M B E R 2 0 1 9 M A R K E T I N G H I G H L I G H T S
The Pecan ThanksEverything Pie was a showstopper, and social media videos of the pie reached viewers nationwide. We cut our cost per video view in half from our last campaign. Thanks to appealing content, which resonated with more of our target audience, we stretched your marketing dollars even further.
Social Content Hits the Mark
Cost Per Click at an All-time Low!Reaching consumers who are searching for recipes gives us a great opportunity to influence those preparing to buy ingredients. We used paid search terms to drive consumers to pecan recipes on our website as they searched for holiday inspiration.
Compared to last December, our cost per click to the site was 53% lower at 92 cents, demonstrating increasingly efficient targeting and relevant keywords.
O C T O B E R 2 0 1 9 M A R K E T I N G H I G H L I G H T S
Social media continues to be a valuable tool to bring pecans top of mind for consumers. So far this year, more than 40% of all AmericanPecan.com visitors were directed via social media to our site, where they can learn more about the great taste, versatility and heritage of pecans.
Social Media Drives Web Traffic The APC is reaching Gen X/Y moms who are meal
planning by showcasing pecans in a range of family-friendly recipes. Our Pecan Crusted Tilapia recipe gained inclusion in a 7-Day Menu planner in several papers across the country, reaching more than half a million consumers.
Meal Prep with Pecans
of all americanpecan.com visitors were directed
via social media
40%

151
IINN AA NNUUTTSSHHEELLLL Issue No. 6 OCTOBER 2018
THE SUPER AMERICAN PECAN-A-THON
Mark your calendars – our next show-stopping pecan event is launching in November! Just ahead of the Thanksgiving holiday, we are partnering with top recipe site Epicurious to host the Super American Pecan-A-Thon. The interactive, online variety show is designed to reach our target audience through Conde Nast owned properties Bon Appetit, Self, Conde Nast Traveler and more. Growers will appear alongside a celebrity host and influential food and lifestyle bloggers to share recipes, cooking tips, home décor and entertaining ideas all featuring The Original Supernut. To further the movement, viewers will be encouraged take the #PecanPledge, a promise to make one more dish beyond pie this holiday season in support of American Pecan growers.
GET INVOLVED
Harvest is upon us, and the holidays aren’t far behind – a time of year when pecans are top-of-mind with consumers. In our first harvest season as The Original Supernut, we’re aiming to celebrate the heritage and holiday traditions of our native nut, while encouraging our target audience to think beyond the pecan pie. Our next phase of marketing activities includes an online variety show encouraging recipe lovers coast to coast to pledge to make one new recipe with pecans this holiday season, in addition to their tried-and-true favorites. As we continue to drive towards our goal of changing perceptions and raising demand, we want you to be a part of the American Pecan story. There are several ways you can get involved: Share Your Story: Help us personalize American Pecans with stories of the families behind the nut we love and the journey from field to fridge. We’re collecting photos and videos that tell your story – prize-winning trees, planting kickoff, celebrations of a healthy yield, vintage family photos or videos of the farm
and field and more. If you’d like to share, please upload your images/videos here by Friday, 10/19. We are happy to provide further direction or answer any questions you might have before then.
Share Your Product: Many Americans aren’t familiar with the taste, color, and texture of a real, fresh pecan – and we’re aiming to change that. We’re in need of fresh, beautiful pecans and/or pecan oil to feature during our variety show and via our social influencer partnerships. If you’re interested in donating, please respond to this email by Friday, 10/19 so we can provide further shipping instructions.
Share Your Thanks: Our goal is to share a personalized thank you on behalf of the industry for folks who take the #pecanpledge. That’s where you come in! If you have a smart phone and are willing to take a video, we are looking for you. Simply record yourself saying the below script and upload the file here by Friday, 10/19
Sample Script: We’d love it if you would take the Pecan Pledge and give a new American Pecan dish a try this holiday. We hope our recipes will make your family as happy as you’ve made ours. Thank you! We will cut to a series of “Thank you”s together to end the video.
Helpful Tips:
1. Shoot your video outdoors if the weather permits in front of your pecan orchard or barn
2. Make sure to speak clearly so that the sound is captured
3. The light should be shining towards you, not behind you
4. Shoot your video horizontally
We are grateful to the industry for your willingness to support this FMO, and are excited to kick off another campaign in celebration of The Original Supernut and the people behind it. We’ll share more about the Pecan-A-Thon in the weeks ahead.
HURRICANE MICHAEL Our thoughts and prayers are with all of those affected by the devastation of Hurricane Michael this week. For additional information, please see communication titled "Hurricane Michael & Disaster Assistance Information.”

152
Visit our website or social channels for these seasonal recipes (L:R: Slow Cooker Mulled Cider with Pecan Rim, Pecan Ghost Cookies, Roasted Pumpkin and Sweet Potato Soup with Pecan
Pomegranate Salsa, Pecan Baked Apples)
HARVEST STORYTELLING: CELEBRATE THE SEASON
Before the Pecan-a-thon debut, the fall celebration is officially underway! There is no better time to promote American Pecans than the harvest and holiday seasons, when the nut is already top-of-mind with consumers. Thanksgiving-inspired recipes are a great way to showcase the versatility and heritage of pecans. Among the thousands of news stories about pecans over the past year, holiday-themed recipes have been very popular with both editors and readers. As we pursue an even bigger push with consumers this holiday season, we are not only evaluating what was sucessful last fall, we are using search engine and social media data to show us what type of recipes our target audience is seeking. Each of these insights helps APC determine which recipes we share and get the most out of our marketing efforts. So, what type of meal and snacking inspiration are we sharing this fall? We are encouraging media – as well as their readers and viewers – to think of a traditional fall ingredient in a non-traditional way. In addition to coupling pecans with other classic fall flavors like pumpkin and squash, we are also breaking tradition with new ideas like ciders, soups, and salads to show the many different uses for pecans. We’re also using Thanksgiving to tell the uniquely American heritage story of The Original Supernut.
TRY THESE SPOOK-TACULAR TREATS! For all you Halloween lovers, don’t worry – we aren’t skipping this spooky holiday! Last year, our Pecan Ghost Cookies performed spook-tacularly with media and consumers, so we’re again sharing this clever recipe as a homemade alternative to store-bought sweets. We’re also serving up our Sweet Potato and Pumpkin Pecan Soup as a hearty pre-trick-or-treating meal. No matter what delicious pecan recipe you enjoy, try it with the Slow Cooker Mulled Cider – the delicious Pecan Rim is definitely a treat. Click on the link below or our social channel buttons at the end of this newsletter to find these and many more
seasonal recipes. If you try them out, we’d love to hear what you think!
Pecan partners inspire audiences with recipes such as Instant Pot Stuffed Acorn Squash with Pecans (A Couple Cooks) and No Bake
Pumpkin-Pecan Pie Paleo Bits (The Defined Dish)
CAPTURING SEASONAL TRENDS Our social influencers and bloggers, otherwise known as our “Pecan Partners,” are hard at work creating new seasonal and holiday recipes based on some of the season’s hottest food trends and cooking techniques. For example, A Couple Cooks’ Instant Pot Stuffed Acorn Squash with Pecans not only celebrates the best flavors of fall, but also answers the high online search volume for recipes using an Instant Pot and was recently featured in a must-try fall round-up on Self.com. The Defined Dish’s new No-Bake Pumpkin-Pecan Pie Paleo Bites are paleo diet friendly, but delicious for anyone looking for a fun twist on a classic favorite. The recipes will be shared with our target audiences through paid social and search campaigns to make the content work even harder for us, reaching more consumers to grow interest and demand. They also appear on the recipe page of our website, AmericanPecan.com, which has more than 60,000 visitors each month. You can check out some of the additional fall recipes at the links below, and be sure to check back throughout the season:
Roasted Pumpkin and Sweet Potato Soup with Pecan Pomegranate Salsa
Pecan Apple Stuffing Sweet Potato Casserole with Bourbon Pecan
Crumble Pecan Cranberry Relish

153
Growers at the Alabama Pecan Growers’ Annual Meeting were among the first to hear about our next big holiday marketing push
APC ON THE ROAD
We enjoyed meeting many industry members at this year’s National Pecan Shellers Association Annual Meeting in California and, most recently, at the Alabama Pecan Growers’ Annual Meeting in Fairhope. For those who attended, we hope you found the marketing updates and presentation on what is coming up this year informative and exciting! Many of this year’s conferences are now complete, but we will continue to travel and meet with industry. Executive Director Alex Ott will be in New Mexico next week, and APC staff will be attending the PMA Fresh Summit Conference & Expo in Orlando, Florida October 19-20, as well as visiting several stops in Georgia in the days following. We look forward to the opportunity to connect with many of you in person! In addition to opportunities to meet at events and conferences, we encourage you to continue to stay in touch through the newsletter, email ([email protected]) and phone (817) 916-0020.) As you enter the holiday season, please reach out if you are interested in learning more about how to make American Pecans marketing materials work for you and your business. From social media content, to printed nutrition facts and handouts, the APC staff is here to equip you with the resources you need.
3880 Hulen Street, Suite 105 Fort Worth, Texas 76107
PH: (817) 916-0020
Follow us on social media: @americanpecan

154
IINN AA NNUUTTSSHHEELLLL Issue No. 7 October 2018
APC Staff Alex Ott & Jeff Smutny join Brent Brinkley with the Georgia Pecan
Growers Association to survey the damage caused by Hurricane Michael.
APC TOURS HURRICANE DAMAGED AREAS On October 10 – 12, Hurricane Michael ravaged the
Southeast pecan producing regions, smashing into Florida, Alabama, Georgia and making its way to South Carolina. When the storm hit the Florida panhandle it was recorded as a dangerous Category 4, making it one of the worst storms in U.S. history. APC staff met with several growers who were impacted by the storm. According to Lenny Wells, with the University of Georgia Extension, losses are currently estimated at “27,455 acres of pecan trees which translates to a loss of approximately 17% of Georgia’s pecan acres.” Additionally, the Extension estimates current year crop losses at $100 million, and tree loss valued at $260 million. Future income loss is predicted at $200 million due to the lack of pecan producing trees. Secretary Perdue announced that farmers and ranchers impacted by the hurricane in 13 counties are eligible for federal assistance. Several of the programs are through the Environmental Quality Incentives Program (EQIP) program. For additional information please go to: https://www.fema.gov/disaster/4400 . The American Pecan Council will continue to update the industry as more information becomes available.
MITIGATION DOLLARS AVAILABLE
As part of trade mitigation measures, the US Department of Agriculture (USDA) is providing $200 million in Agricultural Trade Promotion (ATP) Dollars. The Foreign Agricultural Service will be managing the application requests and distribution of program dollars. Although the dollars are open to Federal Marketing Orders, state commissions, trade associations, and private companies, it was emphasized by FAS that the broadest group, coupled with a complete Unified Export Strategy (UES) will have more success in obtaining the dollars. It should be emphasized that these dollars are not Market Access Program (MAP) dollars and are part of a separate program. However, these dollars may be utilized in markets that will assist the industry due to the tariffs that were imposed on several commodity programs. Additionally, these dollars are in addition to the industry buy programs. The pecans industry received $16.8 million under the commodity purchase program. The APC is currently working with USDA to provide product specifications for the purchase of product. In the meantime, APC will continue to work with applicants and the industry as the ATP dollars become available. Applications for these dollars are due November 2, 2018.
NASS SURVEY BEING CONDUCTED The American Pecan Council has funded a (NASS) survey
to collect the latest information from the pecan community. This survey, coupled with American Pecan Council’s 2018 monthly data, will provide the industry with information that will assist the industry in knowing how much crop is projected, being moved, and in inventory. Currently, the APC has released 2016 and 2017 summary data. For a complete copy of the data, please visit the APC website at: www.americanpecan.com . In the meantime, the industry is encouraged to fill out their NASS survey if they have not done so. Council staff will continue to update the website and inform the pecan industry as data is updated.
APC GIVES PRESENTATION TO OK GROWERS On October 2, 2018, Executive Director Alex Ott
attended an Oklahoma tour. Special thanks to Mark Hamilton in providing a tour of his pecan cleaning and pecan oil facilities. After the tour, growers were updated on the latest American Pecan Council Activities, Oklahoma research projects, and presented the latest information on domestic and international market issues that may impact this year’s crop. The Oklahoma

155
Pecan Growers Association (OPGA) also provided information about their organization and working relationship with the Federal Marketing Order. Ott emphasized the importance of driving demand over the next six months to move product during our peak times. Changing the perception of pecans from a “pie ingredient” to an everyday use while emphasizing the important health benefits is going to be critical in order to prepare for the “wave” of pecans that are coming down the line. Council staff will continue to promote and update the industry as the marketing programs continue to move forward.
STRATEGIC PLANNING GETS UNDERWAY
The American Pecan Council (APC) is beginning the first phases of its comprehensive strategic planning program. The program will provide an industry outlook over the next 1, 3, 5 and 10 years, while examining activities and opportunities for the APC and industry. This program will be critical for the pecan industry as it will identify where the industry should most effectively put their dollars to “move the needle” for pecans. Additionally, the project will lay out specific goals for the industry to measure success for both the FMO and the pecan industry. Currently, an industry survey is being prepared and will be sent out for feedback. APC will continue to update the industry as studies and information become available. For additional information, please contact the APC office.
APC PRESENTS AT NEW MEXICO SHORT COURSE On October 15 – 17, New Mexico State held its pecan
short course program. Executive Director, Alex Ott, presented the latest activities of the APC to the group. The program included information on basic pecan practices, soil and water technologies and techniques, marketing strategies, and the latest on pecan pests and diseases. Special thanks to Richard Heerema with New Mexico State for putting on the short course.
APC ATTENDS PMA On October 18 – October 20, American Pecan Council
(APC) attended the annual Produce Marketing Association (PMA) trade show in Orlando, FL. The PMA show provides an opportunity to meet with buyers, consumers, growers, and suppliers throughout the U.S. and the world. Events include: latest marketing techniques, latest technologies, recipe development, domestic and international market development, and the latest on new food laws and regulations, just to name a few. It is also a great opportunity to meet with other federal marketing orders, trade associations, and commodity programs to share information on the current market place.
SAVE THE DATE AMERICAN PECAN-A-THON
Get ready for the online event of the year. Highlight November 15th on your calendar for the online event of the year; The Super American Pecan-A-Thon. We aim to creatively engage our consumer at a time when pecans are top-of-mind with a breakthrough activation. We are excited to be working in partnership with top recipe media property Epicurious/Bon Appetit to put on an entertaining variety show starring The Original Supernut. The Super American Pecan-A-Thon broadcast will feature hilarious film star Wendi McLendon-Covey and some top recipe and lifestyle social influencers to help guide the show. Plus, you'll see fellow growers supporting the show, as well! We’ll help encourage viewers to take the #pecanpledge to make one more pecan dish (beyond the pie) this holiday. Keep your eyes peeled for more information.
Find us on social media!
CALENDAR OF EVENTS
New Mexico Pecan Growers Meeting November 2, 2018
Las Cruces, New Mexico
Pecan-A-Thon November 15, 2018
North Carolina Pecan Growers Association
February 16, 2019 TBD
AAmmeerriiccaann PPeeccaann CCoouunncciill 3880 Hulen Street, Suite 105 Fort Worth, Texas 76107 PH: (817) 916-0020 FAX: (866) 232-0085 [email protected] americanpecan.com
#americanpecan @americanpecan

156
IINNAANNUUTTSSHHEELLLL Issue No. 8 NOVEMBER 2018
Tune into The Super American Pecan-A-Thon on November 20th at Epicurious.com
THE SUPER AMERICAN PECAN-A-THON IS ALMOST HERE!
Get ready to see The Original Supernut like you’ve never seen it before. The Super American Pecan-A-Thon is set to air on November 20 at 11 AM EST / 10 AM CST, and we can’t wait to share it with you!
Just what is the Super American Pecan-A-Thon? It is an interactive, online variety show that celebrates the versatility of America’s native nut, while entertaining consumers and introducing them to the growers behind pecans. We’ll also be combining two themes that resonate with our consumer audience – health and humor.
Our celebrity host is Wendi McLendon-Covey, comedian and star of hits such as television shows “The Goldbergs” and “Reno 911!” and the movie “Bridesmaids.” She’s joined by a cast of food and lifestyle bloggers who've created custom recipes, crafts, and home décor ideas – all featuring American Pecans.
Of course, no pecan event would be complete without the you – the industry! We have several industry members joining the cast of the show – The Iveys, a Texas pecan-growing family band, Mike and Lotsee Spradling of Oklahoma, Kortney Chase of Texas, Heather Salopek of New Mexico, Ben and Laura King of California, and Marianne Brown of Georgia – who will be sharing pieces of their family stories illusturating the powerful legacy of the American pecan industry.
From Thanksgiving sides to cocktails and how to arrange the perfect tablescape, our hosts will show the audience how to create new holiday traditions the whole family will enjoy. Throughout the online broadcast, viewers can click the site for more information on the featured recipes and holiday decorations.
Mike and Lotsee Spradling shooting Super American Pecan-A-Thon promotional materials in their orchard earlier this week.
#PLEDGEPECANS
Beginning a week before Thanksgiving, we will ask America to #PledgePecans, and make one more dish with America’s native nut this holiday season. Whether consumers are inspired by a recipe from one of our food bloggers or get creative in the kitchen on their own, #PledgePecans will encourage Americans to add one more pecan dish to the table, beyond pie. Starting Nov. 15, you can go to bit.ly/epi-pledgepecans to let us know you will #PledgePecans.
Once you make your pecan creations, share photos on social media using the hashtag #PledgePecans. We hope you’ll encourage friends and family to do the same. #PledgePecans will continue through Dec. 31 – we look forward to seeing all of the pecan creations!
Sweet Potato Casserole with Bourbon Pecan Crumble, the perfect addition to this year’s Thanksgiving table.

157
A NEW MARKETING TOOLKIT FOR YOU
Keep an eye out for additional information and resources to put the Super American Pecan-A-Thon and #PledgePecans campaign to work for you. The day prior to the Pecan-A-Thon, we’ll share an updated, online Industry Toolkit with materials to share with your friends and family, and to benefit your own business. Stay tuned for more details!
SHARE YOUR LEGACY
Thank you to all industry members who donated their pecans and pecan products to The Super American Pecan-A-Thon – we greatly appreciate your support, and look forward to sharing your fresh, beautiful product during the show. If you’re still interested in contributing to the Pecan-A-Thon or future campaigns, we welcome family stories, pictures, and videos for inclusion in our ongoing marketing activities. Please consider submitting your favorites via this link, or by emailing [email protected].
Registered Dietitan Holley Grainger appears on WBRC Birmingham, sharing nutritious pecan treats for Halloween celebrations.
TAKE THE APC SURVEY
You should have received an email from the APC this week regarding an industrywide survey. The APC values your feedback and your input is vital to the success of our efforts on behalf of industry. We ask that you please respond no later than Monday, November 19.
3880 Hulen Street, Suite 105
Fort Worth, Texas 76107 PH: (817) 916-0020
Follow us on social media: @americanpecan
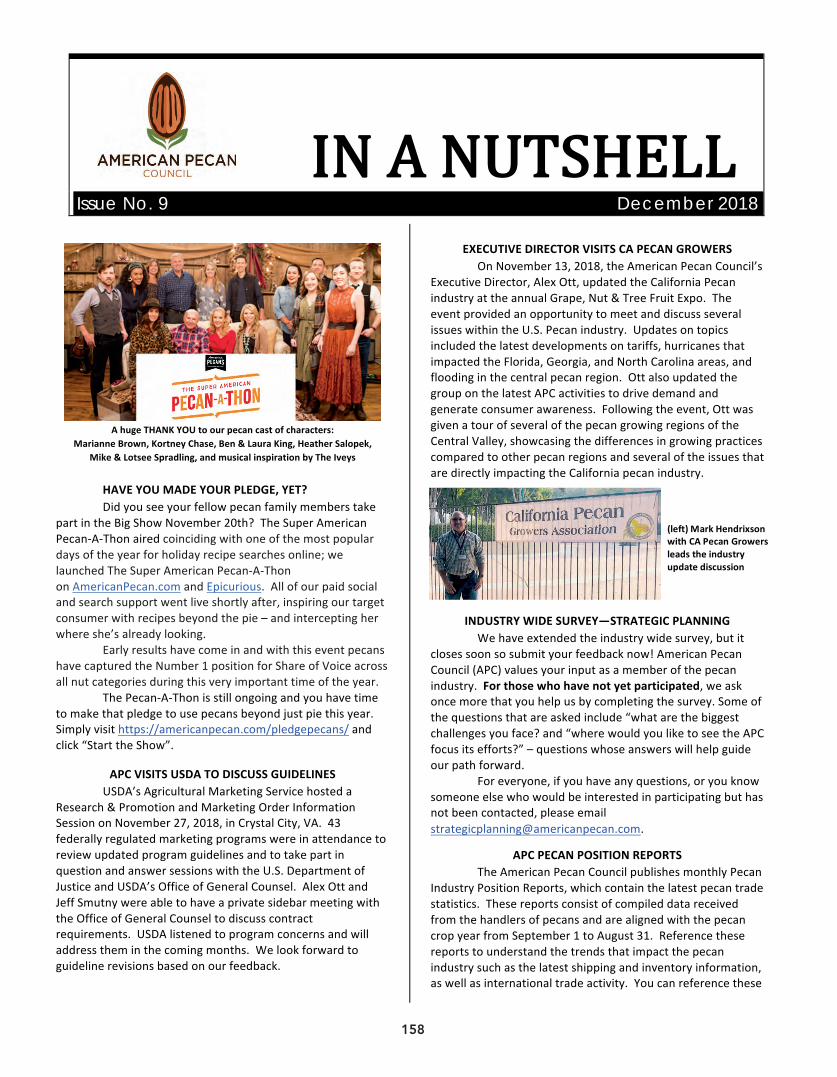
158
IINNAANNUUTTSSHHEELLLLIssue No. 9 December 2018
AhugeTHANKYOUtoourpecancastofcharacters:
MarianneBrown,KortneyChase,Ben&LauraKing,HeatherSalopek,Mike&LotseeSpradling,andmusicalinspirationbyTheIveys
HAVEYOUMADEYOURPLEDGE,YET?Didyouseeyourfellowpecanfamilymemberstake
partintheBigShowNovember20th?TheSuperAmericanPecan-A-Thonairedcoincidingwithoneofthemostpopulardaysoftheyearforholidayrecipesearchesonline;welaunchedTheSuperAmericanPecan-A-ThononAmericanPecan.comandEpicurious.Allofourpaidsocialandsearchsupportwentliveshortlyafter,inspiringourtargetconsumerwithrecipesbeyondthepie–andinterceptingherwhereshe’salreadylooking.
EarlyresultshavecomeinandwiththiseventpecanshavecapturedtheNumber1positionforShareofVoiceacrossallnutcategoriesduringthisveryimportanttimeoftheyear.
ThePecan-A-Thonisstillongoingandyouhavetimetomakethatpledgetousepecansbeyondjustpiethisyear.Simplyvisithttps://americanpecan.com/pledgepecans/andclick“StarttheShow”.
APCVISITSUSDATODISCUSSGUIDELINESUSDA’sAgriculturalMarketingServicehosteda
Research&PromotionandMarketingOrderInformationSessiononNovember27,2018,inCrystalCity,VA.43federallyregulatedmarketingprogramswereinattendancetoreviewupdatedprogramguidelinesandtotakepartinquestionandanswersessionswiththeU.S.DepartmentofJusticeandUSDA’sOfficeofGeneralCounsel.AlexOttandJeffSmutnywereabletohaveaprivatesidebarmeetingwiththeOfficeofGeneralCounseltodiscusscontractrequirements.USDAlistenedtoprogramconcernsandwilladdresstheminthecomingmonths.Welookforwardtoguidelinerevisionsbasedonourfeedback.
EXECUTIVEDIRECTORVISITSCAPECANGROWERS
OnNovember13,2018,theAmericanPecanCouncil’sExecutiveDirector,AlexOtt,updatedtheCaliforniaPecanindustryattheannualGrape,Nut&TreeFruitExpo.TheeventprovidedanopportunitytomeetanddiscussseveralissueswithintheU.S.Pecanindustry.Updatesontopicsincludedthelatestdevelopmentsontariffs,hurricanesthatimpactedtheFlorida,Georgia,andNorthCarolinaareas,andfloodinginthecentralpecanregion.OttalsoupdatedthegrouponthelatestAPCactivitiestodrivedemandandgenerateconsumerawareness.Followingtheevent,OttwasgivenatourofseveralofthepecangrowingregionsoftheCentralValley,showcasingthedifferencesingrowingpracticescomparedtootherpecanregionsandseveraloftheissuesthataredirectlyimpactingtheCaliforniapecanindustry.
INDUSTRYWIDESURVEY—STRATEGICPLANNINGWehaveextendedtheindustrywidesurvey,butit
closessoonsosubmityourfeedbacknow!AmericanPecanCouncil(APC)valuesyourinputasamemberofthepecanindustry.Forthosewhohavenotyetparticipated,weaskoncemorethatyouhelpusbycompletingthesurvey.Someofthequestionsthatareaskedinclude“whatarethebiggestchallengesyouface?and“wherewouldyouliketoseetheAPCfocusitsefforts?”–questionswhoseanswerswillhelpguideourpathforward.
Foreveryone,ifyouhaveanyquestions,oryouknowsomeoneelsewhowouldbeinterestedinparticipatingbuthasnotbeencontacted,[email protected].
APCPECANPOSITIONREPORTSTheAmericanPecanCouncilpublishesmonthlyPecan
IndustryPositionReports,whichcontainthelatestpecantradestatistics.ThesereportsconsistofcompileddatareceivedfromthehandlersofpecansandarealignedwiththepecancropyearfromSeptember1toAugust31.Referencethesereportstounderstandthetrendsthatimpactthepecanindustrysuchasthelatestshippingandinventoryinformation,aswellasinternationaltradeactivity.Youcanreferencethese
(left)MarkHendrixsonwithCAPecanGrowersleadstheindustryupdatediscussion

159
monthlyPecanIndustryPositionReportsintheIndustrytaboftheAmericanpecan.comwebsite.Ifyouhaveanyquestionsregardingthemonthlyreportingforms,pleasecontacttheAPCofficeat(817)916-0020.
OURTEAMISGROWING!WearehappytowelcomeAmericanPecanCouncil’snewExecutiveAssistant,DeborahBarnett.Deborahbringsavariedwealthofknowledgetoherrole.Aveteranofthenon-profitsector,she’shighlyexperiencedinadministrativeofficemanagement,eventplanning,andrelationshipbuilding.Throughouthercareer,Deborahhasworkedwithteamstoimproveefficiencybystreamliningoperations,builddigitalmanagementsystems,andmanageprojectstosuccess,whichmakeshertheperfectfitforourteam!
TheAmericanPecanCouncilwouldalsoliketowelcomethenewAssistantDirectorofMarketingandIndustryRelations,JuliannaKeck.JuliannahalesfromtheCoachellaValleywhereherfamilyhasadeep-rootedhistoryintheCaliforniaDateindustry.Additionally,shegrewupspendingtimeonherfamily’sranchesinsoutheasternArizonaandNewMexicoassistingherparentsinplantingtheir
nowestablishedpecanorchardinCochiseCounty.AgraduateofPepperdineUniversitywithadegreeinIntegratedMarketingCommunication,Juliannaestablishedacareerinmediaandoutreachthroughwritingforregionaltravelandlifestylepublications.HerexperiencewillassisttheAPCinmarketingandindustryrelations.PleasetakeamomenttowelcomebothDeborahandJuliannatotheAmericanPecanCouncil.
INMEMORYOFBENJAMINLITTLEPAGE
BenjaminMeekLittlepage,87,ofColfax,Louisiana,passedawayonWednesday,December5,2018.Hewasawell-respectedpecangrowerfromColfax,Louisiana.Throughouthismanyyearsinthepecanindustry,hebecamethePresidentoftheNationalPecanGrowersCouncilandreceivedmanyawardsforhiscontributionstotheindustry.Mr.Littlepagebecamewellknownforprovidinghispecan
cropestimateeveryyearattheTri-StatePecanConference.AmericanPecanCouncilisdeeplysaddenedbythenewsofthepassingofMr.Littlepage.Hewillbesorelymissedaswillhiseffortsthathavehelpedthepecanindustrysucceed.OurcondolencesgoouttoallBen’sfriendsandfamily.
Improved90%
Native/Seedling7%
Substandard3%
2018Crop YearYTDBreakdown
AL,FL,NC,SC1%
GA
54% OK,LA
3%
TX
42%
2018CropYear YTDBreakdownByState
CALENDAR OF EVENTS
American Pecan Council Meeting
December 18, 2018 Dallas, Texas
Fruit Logistica
February 6-8, 2019 Messe Berlin
Southeastern Pecan Growers Annual Conference
February 22-23, 2019 Sandestin, Florida
Western Pecan Growers Association Annual Conference a
March 3-5, 2019 Las Cruces, New Mexico
NPSA Mid-Winter Meeting
March 13-15, 2019 Atlanta, Georgia
Georgia Pecan Growers Association Conference
March 26-28, 2019 Tifton, Georgia
Texas Pecan Growers Associations Conference & Tradeshow
July 14-17, 2019 Frisco, Texas
American Pecan Council 3880 Hulen Street, Suite 105 Fort Worth, Texas 76107 PH: (817) 916-0020 FAX: (866) 232-0085 [email protected] americanpecan.com
Don’t forget to find us on social media! #americanpecan @americanpecan
Operations Manager,

160
IINN AA NNUUTTSSHHEELLLL Issue No. 10 DECEMBER 2018
Oklahoma growers Mike and Lotsee Spradling promote
The Super American Pecan-A-Thon.
THE PECAN-A-THON IS LIVE! We hope you have all had the opportunity to tune in to The Super American Pecan-A-Thon. The online variety show – which debuted November 20 and runs through the end of the year – celebrates the many ways American Pecans can make the holidays a little more super. Featuring celebrity comedian Wendi McLendon-Covey, food and lifestyle bloggers, and growers from across the country, the show highlights pecan-inspired takes on traditional recipes and creative décor ideas.
The full Pecan-A-Thon cast, including growers, food and lifestyle
influencers, and celebrity host Wendi McLendon-Covey, pause for a group photo during filming.
Our grower cast members have continued to spread the word with local media, and we have enjoyed seeing how many of you are bringing the Pecan-A-Thon and #PledgePecans to life this holiday season. It’s not too late to get involved. You can spread the word through social media or by using this printable flyer (password: pecans18). And be sure to share your own culinary creations on social media or by emailing us at [email protected]. If you haven’t yet, watch the show by visiting AmericanPecan.com/PledgePecans, keep sharing photos of how you and your families have chosen to #PledgePecans this season, and be on the lookout for a report on the results of the Pecan-A-Thon in the New Year.
Pecan-A-Thon cast member Kortney Chase (Austin, TX) brought each recipe and craft featured on the show to her family over Thanksgiving.
PUT APC MARKETING TO WORK FOR YOU If you have recently visited the Digital Toolkit for Industry on AmericanPecan.com (password: pecans18), you may have noticed a different look! The toolkit has been redesigned for easier navigation and expanded with additional marketing resources for you. Under the Marketing Campaigns section, we’ve created mini toolkits for both the consumer brand launch in April and The Super American Pecan-A-Thon campaign, which house helpful information and resources related to each effort. The Tools & Tips section includes guides and how-to resources,
Pecans are #1! Earlier this month, Google released its annual Year in Search report, where it shares the top searched terms from the previous
year. Topping the list of most searched recipes in 2018 was the holiday standby Classic Pecan Pie.

161
and you can find a host of American Pecans brand assets under the Logos & Downloadable Materials page.
CHECK OUT MARKETING HIGHLIGHTS
Many of you have asked for printable, monthly updates on APC marketing. We appreciate the input and last month, we debuted a monthly update of marketing highlights to show how your dollars are being used to support our goal of driving awareness and preference for American Pecans. These reports can be found on the Your Dollars at Work page in the updated Digital Toolkit for Industry (password: pecans18). There you can also find the Year One Impact Report. If you have questions about the new reports or resources, or any updates or photos you’d like to share, please contact us at [email protected].
Stahmanns Pecan Inc. (La Mesa, NM) shared a photo
of their team watching The Super American Pecan-A-Thon.
ELEVATING NUTRITION IN THE NEW YEAR With The Super American Pecan-A-Thon, we showed America all the ways pecans can be used in holiday dishes in addition to the traditional pie. In 2019, we’ll remain focused on the versatility of The Original Supernut, but with an even greater emphasis on our taste and nutrition messages. We’re kicking off the New Year with a new Super-fy campaign, where we’ll show how any dish can be taken from standard to standout, simply by adding American Pecans. We’re also engaging supermarket registered dietitians (RDs) – nutrition experts who specialize in helping consumers make wholesome choices in the grocery aisles. With these RDs advocating on behalf of pecans, we can drive our nutrition message to shoppers right at the point-of-sale. We’ll have more details, along with new Super-fy resources you can use, as we get closer to the campaign kick-off in January. Be on the lookout for an update in coming newsletters, and stay up-to-date by following American Pecans on social media. Links to our channels can be found by clicking on the icons at the end of this newsletter.
3880 Hulen Street, Suite 105 Fort Worth, Texas 76107
PH: (817) 916-0020
Follow us on social media: @americanpecan
From all of us at the American Pecan Council, warmest wishes to you and
yours this holiday season!

162
Issue No. 11 JANUARY 2019
RESEARCH PROJECTS MOVING FORWARD
The American Pecan Council is conducting several research projects to assist in data collection, and health benefits for pecans. The following is a list of the projects currently being conducted:
Economic Benchmark Model & Study The American Pecan Council approved Forecasting and Business Analytics, LLC to conduct an economic benchmark model and study. The purpose of the study is to develop an economic baseline model capable of analyzing the effects of changes in the US pecan markets and the consequences for US production, consumption, prices, and trade. This project is important to the industry as it will establish a repeatable model that may be used by the industry to assist in disasters, production changes, or any other issues that may impact the pecan industry.
Satellite Mapping The American Pecan Council will be conducting a US Pecan acreage survey. Conducted by Land I.Q., the project will utilize satellite imaging to identify pecan trees. Instead of acreage surveys conducted by the industry, the use of modern technology will give the American Pecan industry a more detailed and accurate summary of acreage in the top eight states. Once the project is completed, other states may be added as there will be a model to identify trees both in the native and improved varieties. The project is set to begin in the west and move east. To date, 70% of California, Arizona, and New Mexico is complete, with work beginning in the central region. APC will update the industry as this project nears competition.
Quantifying Phosphite Residues in Pecan Kernels Dr. Tim Brenneman, Department of Plant Pathology, UGA; Dr. Clive Bock, USDA‐ARS, Byron, GA; and Dr. Charles Rohla, Noble Foundation, have been conducting an American Pecan Council study on phosphite residues in pecan kernels.
According to the research team’s initial summary, phosphite fungicides have proven to be an important tool in the pecan industry. EPA considers this chemistry so safe they did not require residue data for crops like pecans. However, in recent years the European Union (EU) started requiring phosphite maximum residue levels (MRL’s) for products they import, including pecans. Since data does not exist, these levels were set at an extremely low level (2.0 PPM). Limited testing of treated pecans indicates that virtually any usage will result in residues exceeding this level. Exports to the EU would face a problem with MRLs. However, since this project was initiated, the EU has approved a much higher MRL for pecans (500 PPM) as part of nut‐crop group package with the other tree nuts (almond, pistachio and walnut). Initial results from this project show that the industry is well below these MRLs. Thanks to the APCs funding efforts and the work of the Dr. Brenneman, Dr. Bock, and Dr. Rohla, this specific pecan study shows that it was critical to establish a more realistic MRL for phosphites, while having data available to shoe specific pecan uses of the product. A final report will be available once the work is completed.
Health Nutrition Study The American Pecan Council is funding studies specifically focused on health nutrition. Currently, several of the nut studies focused on health include pecans as part of a general nut category. However, it is important to develop specific pecan health studies that focus on the specific characteristics of the nut. These studies will assist in understanding the pecan health benefits in more detail, while assist in giving the pecan its own unique health benefit identity. APC will update the industry as these studies begin receiving data.
Pecan Shelf Life Study The American Pecan Council is funding a pecan shelf life study for handling practices of pecans. The objective of this study is to determine the best storage practices for shelled halves and in‐shell raw pecans by conducting a shelf‐life

163
study using rancidity development, moisture changes, physical changes and sensory evaluations while the product is stored at different storage conditions in a variety of packaging types. As the results are collected, it will assist the industry in educating consumers and buyers on the best handling practices of pecans. Pecan quality and consistency is key in order to ensure that customers enjoy their experience with pecans and continue to purchase our commodity. Results will be shared once the project is complete.
FARM BILL SIGNED – IMPORTANT TOOL ADDED TO APC
On December 20, 2018, President Trump signed into law the Agriculture and Nutrition Act (Farm Bill). Although the $867 billion package is for the next ten‐years, there are several important requirements and funding contained within the package. For the American Pecan Council and the pecan industry, a provision for pecans was added into the entitled Section 8e(a) of the Agricultural Adjustment Act (7 U.S.C. 608e1(a)), adding pecans into this section of law.
Section 8e of the Act provides that when certain domestically produced commodities, including pecans, are regulated under a Federal marketing order, imports of that commodity must meet the same or comparable grade, size, quality, and maturity requirements. In short, it provides the industry with an equal rule across the industry.
Enforceable quality standards are created and submitted to USDA by Federal Marketing Orders (FMO). Because the American Pecan Council is the industry’s FMO, the APC will begin looking at standards for the industry. Once approved by APC, standards will be submitted to USDA for approval and eventual enforcement through inspection. The APC is tasked with creating the standards and assisting USDA in enforcement of the standards. Without a Federal Marketing Order, the Section 8(e) provision would not be enforceable. This is a big step and win for the industry in establishing standards that can be applied equally for all pecans.
Find us on social media!
CALENDAR OF EVENTS
Annual Texas Pecan Short Course January 28 – 31, 2019
College Station, TX
Fruit Logestica February 6-8, 2019 Berlin, Germany
North Carolina Pecan Growers Association February 16-17, 2019
Clinton, NC
Southeastern Pecan Growers Annual Convention February 22 – 23, 2019
Destin, FL
Western Pecan Growers Association March 3 – 5, 2019
Las Cruces, New Mexico
National Pecan Shellers Association Mid-Winter March 13 – 14, 2019
Atlanta, GA
Georgia Pecan Growers Annual Conference & Trade Show March 25 – 27, 2019
TBD, GA
AAmmeerriiccaann PPeeccaann CCoouunncciill 3880 Hulen Street, Suite 105 Fort Worth, Texas 76107 PH: (817) 916-0020 FAX: (866) 232-0085
[email protected] americanpecan.com
#americanpecan @americanpecan

164
IINN AA NNUUTTSSHHEELLLL Issue No. 12 JANUARY 2019
The latest marketing campaign from the APC shows how to take any dish from standard to standout by adding The Original Supernut.
SUPER-FY WITH AMERICAN PECANS
If you follow American Pecans’ social channels, you’ve likely seen that our Super-fy marketing campaign is well underway. Because pecans are often viewed as a dessert nut, they don’t always get the health-promoting credit they deserve. With Super-fy, we’re showing consumers that pecans are a hard-working ingredient that can make any recipe not only more delicious but also more nutritious. Through targeted paid social media posts, we’re putting wholesome and timely recipes featuring American Pecans in the social feeds of our key audience – meal-planning Gen X and Y moms. Through paid search, consumers looking online for specific recipes will immediately be directed to dishes “super-fied” with pecans. Our partnership with Epicurious.com is still working hard for us as we continue to run digital ads with them and other Conde Nast owned properties. The partnership also features shoppable ads which direct users to Amazon.com where consumers can directly purchase pecans to super-fy their meals at home.
We’re also capitalizing on high-search moments in time by promoting pecan-inspired recipes for specific holidays and cultural events. Consumers looking for appetizer ideas for their football watch party or a heart-healthy option to serve-up during American Heart Month in February will see super-fied American Pecans recipes in their top search results. You can learn more about the campaign by visiting AmericanPecan.com/superfy.
GOING IN-STORE WITH RETAIL DIETITIANS A new year means new resolutions, with many Americans committing to their health in 2019. While nutrition is top of mind, we are working to educate retail dietitians about the nutrition benefits of the pecan for use in their own efforts at point-of-sale. Who are retail dietitians? You may be surprised to learn that most supermarkets have a registered dietitian on staff whose role is to help shoppers choose wholesome options when perusing the grocery aisles. By working with these health-focused purchase-drivers, we can elevate The Original Supernut’s presence, reinforce its heart health benefits and bring its superior taste to life through product sampling and in-store recipe demonstrations. We’ll turn retail dietitians into pecan advocates – and in doing so, engage meal planners while they shop for groceries.
We’re arming these important partners with The Original Supernut Retail Dietitian Toolkit – a suite of tools, educational materials and branded signage for in-store demos and displays. Full of recipe ideas, suggested social content, and nutrition information, the toolkit makes it easy for supermarket RDs to put pecans in the grocery store spotlight.
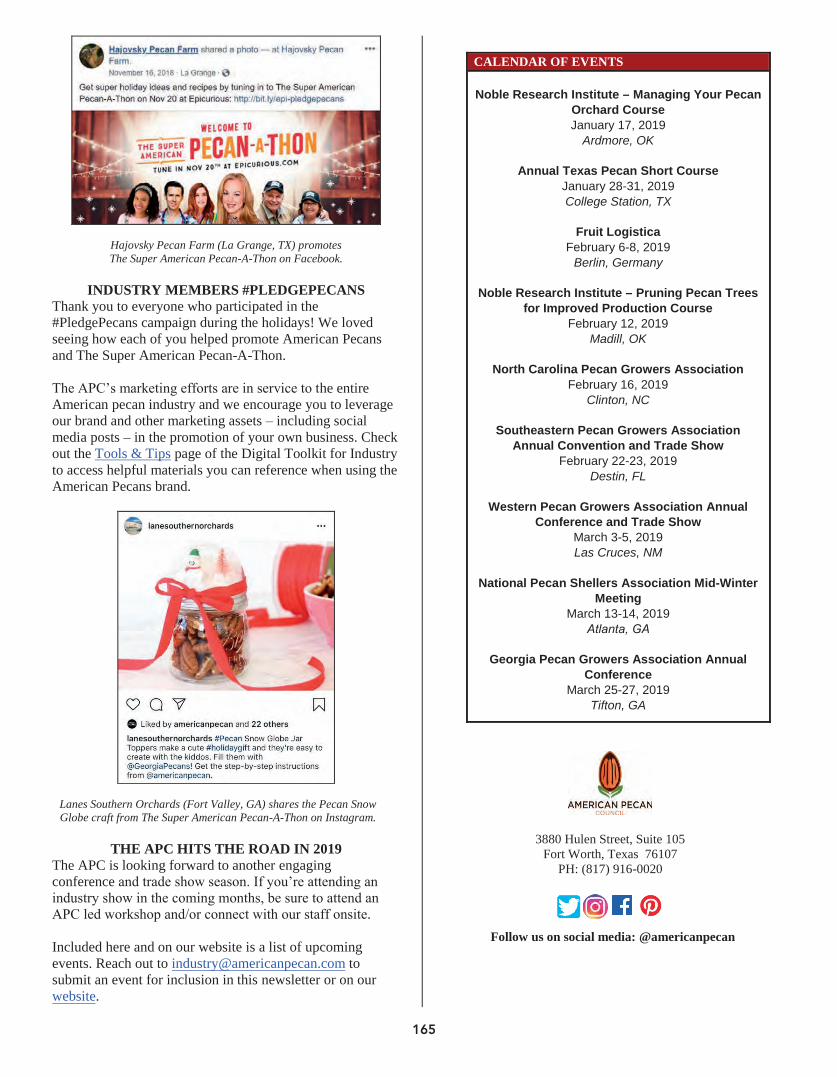
165
Hajovsky Pecan Farm (La Grange, TX) promotesThe Super American Pecan-A-Thon on Facebook.
INDUSTRY MEMBERS #PLEDGEPECANSThank you to everyone who participated in the #PledgePecans campaign during the holidays! We loved seeing how each of you helped promote American Pecans and The Super American Pecan-A-Thon.
The APC’s marketing efforts are in service to the entire American pecan industry and we encourage you to leverage our brand and other marketing assets – including social media posts – in the promotion of your own business. Check out the Tools & Tips page of the Digital Toolkit for Industry to access helpful materials you can reference when using the American Pecans brand.
Lanes Southern Orchards (Fort Valley, GA) shares the Pecan Snow Globe craft from The Super American Pecan-A-Thon on Instagram.
THE APC HITS THE ROAD IN 2019 The APC is looking forward to another engagingconference and trade show season. If you’re attending an industry show in the coming months, be sure to attend an APC led workshop and/or connect with our staff onsite.
Included here and on our website is a list of upcomingevents. Reach out to [email protected] tosubmit an event for inclusion in this newsletter or on our website.
CALENDAR OF EVENTS
Noble Research Institute – Managing Your PecanOrchard CourseJanuary 17, 2019
Ardmore, OK
Annual Texas Pecan Short Course January 28-31, 2019College Station, TX
Fruit Logistica February 6-8, 2019
Berlin, Germany
Noble Research Institute – Pruning Pecan Trees for Improved Production Course
February 12, 2019Madill, OK
North Carolina Pecan Growers Association February 16, 2019
Clinton, NC
Southeastern Pecan Growers Association Annual Convention and Trade Show
February 22-23, 2019Destin, FL
Western Pecan Growers Association Annual Conference and Trade Show
March 3-5, 2019Las Cruces, NM
National Pecan Shellers Association Mid-Winter Meeting
March 13-14, 2019 Atlanta, GA
Georgia Pecan Growers Association Annual Conference
March 25-27, 2019Tifton, GA
3880 Hulen Street, Suite 105Fort Worth, Texas 76107
PH: (817) 916-0020
Follow us on social media: @americanpecan

166
Issue No. 13 JANUARY 2019
GEARING UP FOR TRADE SHOW SEASON
As harvest draws to a close in the West, another big season for the pecan industry is on the horizon—conference & trade show season! Beginning mid-February and continuing through the late summer months, members of our staff will be traveling near and far, attending the annual conferences of more than a dozen state growers and national shellers associations. The North Carolina Pecan Growers Association will kick off the season with its annual workshop on February 16, 2019, in Clinton, NC. This is closely followed by the Southeastern Pecan Growers Annual Convention & Trade Show, February 22-23, 2019, in Destin, FL, and the Western Pecan Growers Association Annual Conference and Trade Show, March 3-5, 2019, in Las Cruces, NM. Mark your calendar and plan to attend an industry show in your region—we look forward to connecting with you in person and/or seeing you in one of our APC-led workshops. For a complete list of upcoming events and additional details, see the calendar on page 2 of this newsletter, or visit the Industry Events page on our website.
SUPER-FY YOUR MARKETING EFFORTS Our Super-fy campaign is up and running, with targeted social media, paid search and digital ads spreading the word about American Pecans’ nutrition, versatility and taste to consumers nationwide. To help you get the most out of the campaign, we’ve developed a dedicated Super-fy page in the Digital Toolkit for Industry. Complete with a social media calendar, downloadable logos and more, the new page is full of information and resources you can leverage for your own marketing activities. You can check out the new page and explore the rest of the toolkit by visiting americanpecan.com/toolkit (password: pecans18).
Engaging your online followers has never been so easy! On the new
Super-fy page, you’ll find all sorts of useful marketing tools, including a Social Media Content Calendar with pre-designed social posts
APC INSTATES ANNUAL ‘BEN LITTLEPAGE DAY’ During the December General Council meeting, the American Pecan Council unanimously approved a resolution honoring the profound contribution and legacy of the late Benjamin Meek Littlepage, by declaring September 24th “Ben Littlepage Day.” Mr. Littlepage was a bigger-than-life pecan-grower and a gentle giant in the industry, whose participation within a variety of organizations has helped the industry succeed across the pecan belt. We are grateful for Ben Littlepage and hope you’ll join in celebrating his life and legacy, annually on the 24th day of September. To view a certified true copy of the resolution visit the Industry News page on our website.
APC PECAN POSITION REPORTS The latest APC Pecan Position Report shows a total of 17,564,847 pounds (in-shell basis) of net shipments to sources such as retail, grocery stores, wholesale, other handlers, etc. Currently, the total handler inventory supply reported is 174,232,650 pounds (in-shell basis) with a total of 134,545,875 pounds (in-shell basis) committed. To view the December Pecan Industry Position Report, please navigate to the Industry tab of the Americanpecan.com website.

167
If you have any questions regarding the monthly Pecan Industry Position Reports or the monthly reporting forms, please contact the APC office at (817) 916-0020 or email [email protected].
DECEMBER MARKETING HIGHLIGHTS The latest edition of our monthly Marketing Highlights Report, sharing updates on December activities, is available to view, download and print. Check out the December report by clicking below or by visiting the Your Dollars at Work page in the updated Digital Toolkit (password: pecans18).
Download the December Marketing Report
3880 Hulen Street, Suite 105 Fort Worth, Texas 76107
PH: (817) 916-0020
MARK YOUR CALENDAR
Fruit Logistica February 6-8, 2019
Berlin, Germany
North Carolina Pecan Growers Association Annual Meeting
February 16, 2019 Clinton, NC
Southeastern Pecan Growers Association Annual Convention and Trade Show
February 22-23, 2019 Destin, FL
Western Pecan Growers Association Annual Conference and Trade Show
March 3-5, 2019 Las Cruces, NM
National Pecan Shellers Association Mid-Winter Meeting
March 13-14, 2019 Atlanta, GA
Georgia Pecan Growers Association Annual Conference and Trade Show
March 26-27, 2019 Tifton, GA
Follow us on social media: @americanpecan

168
IINN AA NNUUTTSSHHEELLLL Issue No. 14 FEBRUARY 2019
Our Cherry Pecan Energy Bites recipe was featured in our latest media article showcasing pecans as a heart-healthy ingredient.
ASKING AMERICANS TO THINK
HEART-SMART February is American Heart Month – and right on the heels of New Year’s resolutions, it’s the perfect time to remind consumers of how easy it is to incorporate heart-healthy ingredients as part of a balanced diet and healthier lifestyle. To insert American Pecans into the healthy habits conversation, our media relations efforts have focused on educating Americans on the health benefits of pecans and offering quick, easy ways to incorporate them into daily diets. Our article, “Simple Ways to be Heart Smart” was timed for release to newspapers and magazines nationwide in the last week of January, as editorial teams begin to focus on heart health. Media has shared our story from coast-to-coast, including Malibu Times Magazine (Malibu, CA), The Miami County Republic (Miami, Kansas) and Longview News-Journal (Longview, TX), among others. The article not only shares the heart-smart qualities of pecans, but debuts one of our newest recipes – Cherry Pecan Energy Bites. As a quick, portable, kid-friendly option, they’re an ideal fit for our Gen X and Gen Y mom target audience. You can find the recipe in the article, or at AmericanPecan.com. If you give them a try, send us a note and/or photo, at [email protected] – we always enjoy seeing industry use our recipes at home.
To further amplify our heart-healthy efforts, we’ve partnered with a registered dietitian for broadcast news segments to highlight pecans alongside other heart-healthy ingredients. Featuring our new Cherry Pecan Energy Bites recipe, the segment will air in markets in the northeast, ensuring our heart health message reaches consumers well beyond the Pecan Belt. You can celebrate American Heart Month, too, by sharing heart-smart pecan-based recipes with your followers on social media. Check out the new Social Media Content Calendar resource on the Super-fy marketing page in the Digital Toolkit for Industry (password: pecans18) for fresh ideas to post to your channels. Additionally, we’ve renewed American Pecans’ American Heart Association (AHA) Heart-Check Mark for 2019, which you can use in your own marketing materials and packaging. Reach out to us at [email protected] for more details.
The American Pecans Nutrition Handout is just one of the nutrition-focused resources available to industry in the Digital Toolkit.
SPREADING THE PECANS NUTRITION MESSAGE
From our Super-fy campaign, which shows consumers how they can make meals more nutritious and delicious by adding American Pecans, to new partnerships with retail dietitians, we’re putting the pecan nutrition message front and center in 2019. This includes our research priorities, as we look to conduct our own nutrition studies in the coming months and years. Based on consumer research, while most Americans see other nuts, like almonds and pistachios, as a “health food,”

169
there is little awareness of the pecan’s unique nutrition profile. We see significant opportunity to differentiate the nutrition of pecans in the broader tree nut category, and we intend to focus our research – this year and beyond – on investigating the health benefits of The Original Supernut. We’ll then leverage any findings in our marketing efforts to align with popular consumer trends in health and nutrition. As a member of the pecan industry, you can take advantage of the nutrition-focused resources created by the APC. Our Logos & Downloadable Materials page in the Digital Toolkit for Industry is chock-full of useful materials, including the American Pecans Nutrition Handout. Visit AmericanPecan.com/toolkit (password: pecans18) to download the handout for use in your own marketing and promotion activities.
Lane Southern Orchards (Fort Valley, GA) shares our Pecan Milk Breakfast Porridge on Instagram
INDUSTRY SHARES THE ORIGINAL SUPERNUT
All APC marketing efforts are intended to directly support the American pecan industry, and that includes your own individual business. We are always pleased to see members of the industry using our recipes and social media posts in their own marketing materials. Visit the Tools & Tips page in the Digital Toolkit for Industry for a helpful how-to guide for sharing APC posts to your business’ social channels.
Tennessee Valley Pecan Company (Decatur, AL) uses our recipe for
Pecan Milk in a promotional post on Twitter.
CALENDAR OF EVENTS
Noble Research Institute – Pruning Pecan Trees for Improved Production Course
February 12, 2019 Madill, OK
North Carolina Pecan Growers Association
February 16, 2019 Clinton, NC
Southeastern Pecan Growers Association
Annual Convention and Trade Show February 22-23, 2019
Destin, FL
Western Pecan Growers Association Annual Conference and Trade Show
March 3-5, 2019 Las Cruces, NM
National Pecan Shellers Association Mid-Winter
Meeting March 13-14, 2019
Atlanta, GA
Georgia Pecan Growers Association Annual Conference
March 26-27, 2019 Tifton, GA
3880 Hulen Street, Suite 105 Fort Worth, Texas 76107
PH: (817) 916-0020
Follow us on social media: @americanpecan

170
Issue No. 15 FEBRUARY 2019
The APC joined over 78,000 top-class trade visitors from 135 countries, who congregated in Berlin for Fruit Logistica 2019
APC ABROAD: FRUIT LOGISTICA 2019
The American Pecan Council attended Fruit Logistica, the world’s largest produce exposition in Berlin, Germany, during the week of February 4th. Executive Director Alex Ott and Marketing Director Jeff Smutny met with international marketing agencies from the United Kingdom, China, India, Germany, France, and Spain. The recently completed industry funded strategic plan has specifically pointed towards China, the European Union, Canada and India as the top international markets for American pecans. The strategic plan has identified pecan global supply to almost double to 1.2 billion pounds by 2027. Like most other Federal marketing orders, bringing the international marketing component in-house will provide APC with substantial cost savings that can in turn provide for a much more aggressive international marketing strategy.
APC ATTENDS NCPGA ANNUAL MEETING
On February 15 – 16, American Pecan Council’s Executive Director Alexander Ott and Chairman Mike Adams attended the 25th Annual North Carolina Pecan Growers Association’s Annual Meeting. The event provided an opportunity for the APC to listen to the latest issues and developments in the North Carolina pecan industry. North Carolina suffered damage from Hurricane Florence in 2017 and continues to make a comeback. Several growers are finding success in selling their pecans in local markets while
new growers are beginning to become involved with new plantings. Additionally, the APC provided an update to the growers on the latest developments of APC events and activities and an update on the global pecan market place. The APC demonstrated the need to work together as an industry no matter how big nor small the acreage or state. Events that occur in another country or state will have an impact on the entire pecan industry. A special thanks to Phillip Ricks and the North Carolina pecan growers for allowing the APC the opportunity to meet with the industry.
Custom ordering your own branded gear is fun & easy
REP AMERICAN PECANS IN STYLE! If you didn’t know, the American Pecan Council has a partnership with Lands’ End, making it easy for you to proudly display the American Pecans brand wherever you go!
Our next stops… The Western Pecan Growers Association Annual Conference and Trade Show in Las Cruces, NM, and the National Pecan Shellers Association Mid-Winter Meeting in Atlanta, GA. Hope to see you there!

171
Whether you’re looking for gear to wear on the farm, around town, or at a business function, the “American Pecans” portal on the Lands’ End Business website lets you add our logo to an array of eligible Lands’ End items, including hats, vests, polos, pullovers, and more. The American Pecans logo is available for embroidery with or without “The Original Supernut” tagline. For assistance with ordering, contact the American Pecan Council office. Once you’ve received your apparel, we’d love to see! Share a picture on social media and tag @AmericanPecan, and/or email us a photo at [email protected].
JANUARY MARKETING HIGHLIGHTS Today, we released the January edition of our monthly Marketing Highlights Report, sharing updates and results from January marketing activities. You can view and download the report by clicking the link below or by visiting the Your Dollars at Work page in the Digital Toolkit for Industry (password: pecans18).
Download the January Marketing Report
SAVE THE DATE—APRIL COUNCIL MEETING
Mark your calendars now for APC’s upcoming General Council Meeting. The meeting, which will take place from 9:00 a.m. to 12:00 p.m. on Wednesday, April 10th, 2019, at the Hyatt Regency DFW International Airport, is open to the public. Stay tuned for more details in the coming weeks!
CALENDAR OF EVENTS
Southeastern Pecan Growers Association Annual Convention and Trade Show
February 22-23, 2019 Destin, FL
Western Pecan Growers Association Annual
Conference and Trade Show March 3-5, 2019 Las Cruces, NM
National Pecan Shellers Association Mid-Winter
Meeting March 13-14, 2019
Atlanta, GA
Georgia Pecan Growers Association Annual Conference
March 26-27, 2019 Tifton, GA
For a complete list of upcoming industry events & educational courses, visit the Industry Events page
on AmericanPecan.com
3880 Hulen Street, Suite 105 Fort Worth, Texas 76107
PH: (817) 916-0020
Follow us on social media: @americanpecan

172
IINN AA NNUUTTSSHHEELLLL Issue No. 16 March 2019
Supermarket dietitian Kim Kirchher of IGA Supermarkets shares her excitement about the American Pecans toolkit she received with her
Twitter followers.
SUPERMARKET DIETITIANS ACTIVATE IN-STORE TO PROMOTE THE ORIGINAL
SUPERNUT As mentioned in previous newsletters, part of the APC’s 2019 focus on marketing the nutrition of pecans includes partnerships with supermarket dietitians – in-store experts who help consumers choose nutritious options during their weekly grocery run. Partnering with these Registered Dietitians has helped us intercept our target audience – Gen X and Gen Y moms – in the grocery store as they are making purchasing decisions about what to feed their families. We kicked off our partnerships earlier this year by sending toolkits that included nutrition information, pecan-inspired recipes and mini food processors so they could share pecans with consumers during in-store demos. We specifically
targeted dietitians located in states outside the Pecan Belt to help introduce America’s native nut to shoppers who may not be as familiar with pecans. Since launching this program, 25 dietitians have committed to participating and 11 have already begun featuring American Pecans recipes on their social channels, hosting in-store demos with pecans, and even mentioning The Original Supernut in news coverage through their partnerships with their local media outlets. We look forward to seeing how these experts continue to spread the pecan love in the months to come.
MARKETING TACTIC SPOTLIGHT: PAID SOCIAL MEDIA
The APC is committed to being good stewards of industry assessment dollars, and is using the latest marketing tactics to reach our target audience in effective, cost-efficient ways. One of the many tools we use is paid social media. Research shows that 70 percent of consumers have purchased a product that they have seen in a brand’s social media channels or from paid social posts appearing in their feed. In 2018 alone, social media advertising helped brands generate $51.3 billion in revenue, and that revenue is set to grow 10.5 percent each year. With paid social media, we are able to target American Pecans posts to appear in our key audience’s social media feeds. To ensure our investment drives the most impact, we conducted research to uncover which social channels are best for reaching our Gen X and Gen Y mom target audience. As a result, we’ve focused our paid social efforts on Facebook and Instagram to spread our message on the digital platforms where they already spend their time. We also found that these channels allow for more detailed targeting, allowing us to reach key consumers. The results show that this tactic is working. Since beginning paid social, the visits to AmericanPecan.com have risen almost 30 percent in only three months. We have also seen more visitors viewing the pecan recipes we feature on the website, showing we are driving interest in new uses for pecans. While on the site, consumers can also view
Heart-Healthy Media Mentions During National Heart Month, our registered dietitian partnerships were hard at work for The Original Supernut. American Pecans were featured as a heart-healthy ingredient in broadcast segments that appeared in markets across the nation.

173
information on the many benefits of pecans, including nutrition information and recipe inspiration. As a member of the American pecan industry, you can leverage the creative assets the APC develops for its own paid social media posts. This includes our Super-fy 10-second videos, which feature delicious, pecan-filled recipes. These videos are available for you to download and share on your own social media channels – just visit the Super-fy page in the Digital Toolkit for Industry and look under the Resources for You section (password: pecans18).
APC collateral used in American Pecans paid social is available in the
Digital Toolkit for Industry to download and use.
INDUSTRY SHARES THE ORIGINAL SUPERNUT We love seeing industry members share APC marketing assets on their own social media. Be sure to follow @AmericanPecan on Facebook, Twitter, Instagram and Pinterest. You can also visit the Tools & Tips page in the Digital Toolkit for Industry to access and download our how-to guide for sharing APC social media posts to your channels. Who knows? Your post may be featured in an upcoming issue of this newsletter!
The Nut House & Country Market shares our mouth watering chili recipe
with their Facebook followers.
CALENDAR OF EVENTS
National Pecan Shellers Association Mid-Winter Meeting
March 13-14, 2019 Atlanta, GA
Georgia Pecan Growers Association Annual
Conference March 26-27, 2019
Tifton, GA
American Pecan Council General Council Meeting
April 10, 2018 Dallas/Fort Worth International Airport
_______________
For a complete list of upcoming industry events & educational courses, visit the Industry Events page
on AmericanPecan.com
3880 Hulen Street, Suite 105 Fort Worth, Texas 76107
PH: (817) 916-0020
Follow us on social media: @americanpecan

174
Issue No. 17 MARCH 2019
APC MEETS WITH INDUSTRY
American Pecan Council (APC) management has had a busy February and March this 2019. Representatives made presentations highlighting some of the statistical findings from APC’s recently completed Strategic Plan. Talking points on the 5 initiatives identified in the plan were covered, including unifying industry, pecan marketing, international marketing, modernizing the industry, and grower sheller transaction models. APC met with industry members at:
◼ Southeastern Pecan Growers Association Annual Conference in Destin, FL on February 22nd and 23rd;
◼ Georgia Pecan Growers Association Meeting in Tifton, Georgia on February 26th;
◼ West Texas Pecan Growers Association in El Paso, TX on February 27th;
◼ Western Pecan Growers Association Annual Conference in Las Cruces, NM from March 3rd through 5th;
◼ National Pecan Shellers Association Mid-Winter Meeting in Atlanta, GA on March 13th and 14th
APC staff had the privilege of meeting with industry members and delivering presentations at recent conferences
The APC will be providing a deeper look into the Industry’s Strategic Plan with the Council during a working group meeting in April. APC will also provide statistical information to those attending the upcoming Pecan Congress on April 9th.
APC Executive Director Alex Ott educates pecan growers on options
for grades & standards at the February meeting in De Leon, TX
DE LEON MEETING APC staff Alex Ott and Emma Garner met with ~60 Texas growers in De Leon, Texas on February 27, 2019, to provide updates on APC’s recent marketing and industry relation activities, an overview of the strategic plan findings, and grades and standards 101. The purpose of the meeting was to educate industry members on each individual grade and standards. Currently, the pecan industry has voluntary in-shell and shelled standards. However, industry can choose to mandate a grade and standard if it is the direction they would like to go. We want to thank each and every one of you who came out to the De Leon meeting. If you have any questions regarding grades and standards, please reach out to the Council office.
APC COMMITTEE MEETING UPDATES Four committees met via conference call on March 20th and March 21st, 2019, to discuss new opportunities and initiatives that align with APC’s Strategic Plan. A big thank you to everyone who contributed time & energy to these important meetings. You’ll find a brief recap of what was discussed on the following page.

175
Grades & Standards Committee Congratulations to Randy Hudson for becoming the Chairman of the Grades & Standards committee. The Committee met to discuss grades and standards such as incoming, outgoing, and quality standards under the provisions on Section 8(e). There was great dialogue and feedback from industry members regarding the current issues around MRLs and standards within the industry. The pecan industry has inshell and shelled standards that have been in place for over thirty years. In December 2018, the shelled meats standards were updated to meet internal USDA requirements. Currently, the Council is looking into submitting updated inshell and shelled grades and standards as a package to USDA. These standards will remain nonmandatory, unless industry chooses to move forward with mandating them, through enforcement via third party inspection. APC staff will continue to gather more information regarding the standards and potential research on MRL levels. We will update the industry once more information is available. Industry Relations Committee Congratulations to Deborah Walden-Ralls for her appointment as Chairwoman of the Industry Relations Committee. The meeting discourse centered around streamlining the reporting form and data collection process. The Committee recommended an RFP for electronic data reporting which will be reviewed during the next Council meeting. These services include development, launch, and ongoing maintenance of the system. Additionally, APC provided an update of the NASS January survey for the American pecan industry, which has been delayed due to the government shutdown. The new publication date of the NASS survey is March 14, 2019. APC also provided an update on the Land IQ and digital mapping project, a.k.a. the U.S. Pecan Acreage survey. This project utilizes satellite imaging to provide a detailed and accurate summary of acreage in the top eight states. The Industry Relations Committee discussed the first edition of the American Pecan Council annual report showcasing APC activities and progress during the 2017-2018 fiscal year. Once published, this will be available on the American Pecan website. The last item of conversation was the revamping of the APC communications plan to increase presence and engagement with industry members. International Committee The International Committee will be making a recommendation to the Council on April 10th to contract with Callanan and Callanan Consulting to submit an Emerging Market Program (EMP) proposal and a Unified Export Strategy (UES) to USDA on behalf of the APC. The committee also discussed relations with the Mexican pecan industry and how the APC might be able to work with Mexico to contribute to APC efforts through voluntary contributions on Health and Research studies, as an example. Another alternative that the committee asked APC staff to look into was the establishment of a USDA Research and Promotion Board that would mandate
assessments on nuts imported into the United States. Part of such a program would also mandate foreign representation on the Board. Marketing Committee The Marketing Committee will be making a recommendation to the Council during its April meeting to approve the social media based “Superweeks” proposal presented by Weber Shandwick. This is a six-month campaign that would finish off the fiscal year. In addition, the Committee will be recommending that the APC subscribe to the AspireIQ influencer platform. The platform will enable APC staff to work directly with social media influencers. Being able to conduct certain marketing activities in house allows the APC to stretch industry’s dollars. The platform will save a substantial amount on social media efforts and then enable the APC to apply those savings to other line items within the marketing budget. Another recommendation for the Council to consider will be the funding of studies on health-related issues and pecans. Dr. Guy Johnson has identified areas of interest for pecans. If the Council approves, the APC will be posting requests for proposals on the different areas, with studies to begin later this year. In a preview of what’s to possibly come with the next fiscal year; the National Pecan Shellers Association proposed two Chefs Summit events. Also, the committee is looking at utilizing Comcast Cable to run a 6-month television campaign in strategically aligned markets.
FEBRUARY MARKETING HIGHLIGHTS
The latest Marketing Highlights Report, sharing activity and results from February marketing efforts, is available to view and download. Visit the Your Dollars at Work page in the Digital Toolkit for Industry (password: pecans18) or click the button below to check it out.
Download the February Marketing Report

176
PECAN CONGRESS TO BE HELD The American Pecan Council is coordinating a Pecan Congress of all pecan associations. The meeting will take place on Tuesday, April 9, 2019, at the Hyatt Regency DFW International Airport. The first of its kind, this meeting will provide a space for up to two representatives from each association to gather and give updates on their current activities and research. This will enable industry to further unify our efforts and eliminate duplication, so we can maximize our impact with limited resources. On April 10, 2019, the American Pecan Council will have a general Council meeting open to public. The meeting will take place from 9:00 am CST – 12:00 pm CST in the Maverick Conference Room at the Hyatt Regency DFW International Airport. If you have any questions, please feel free to contact the Council office. We hope you’ll join us for the general Council meeting!
CALENDAR OF EVENTS
Georgia Pecan Growers Association Annual Conference
March 26-27, 2019 Tifton, GA
Pecan Association Congress Meeting April 9, 2019
Dallas/Fort Worth International Airport
American Pecan Council General Council Meeting
April 10, 2019 Dallas/Fort Worth International Airport
Oklahoma Pecan Growers Association Annual Convention
June 15-19, 2019 Ardmore, OK
For a complete list of upcoming industry events & educational courses, visit the Industry Events page
on AmericanPecan.com
3880 Hulen Street, Suite 105 Fort Worth, Texas 76107
PH: (817) 916-0020
Follow us on social media: @americanpecan

177
IINN AA NNUUTTSSHHEELLLL Issue No. 18 April 2019
OUR TARGET AUDIENCE:
WHO THEY ARE AND WHY THEY ARE OUR FOCUS
You’ve probably heard us talk about reaching our “target audience” and may be wondering – who is this audience, and why did the American Pecan Council choose to focus on them? When we refer to target audiences, we are simply talking about a specific group of people who – based on unique defining traits – represent the greatest opportunity for expanding the purchase and consumption of pecans. A target audience is critical to ensuring that valuable marketing funds are being spent where they can make the biggest difference. What does this mean for American Pecans? This means that our target audience does not include folks who are already loyal pecan purchasers. That is the key reason that industry members see less of APC marketing efforts than the average consumer – you already know about and consume pecans! As we then look at audiences who are not yet pecan lovers, we further focus in on demographics that represent the largest purchase potential. This is not to say generating broad awareness among a greater population set is not important – if we had our way, we’d convince everyone to
eat pecans! But we know there are some groups who will be easier to reach and convince using fewer resources. For this reason, we have identified a specific target audience to focus our marketing efforts and make sure we’re making the most effective and efficient use of industry dollars. Who is APC’s target audience and why? Developing a target audience is a tailored process that must first start with consumer research. We started with a base question: who would buy the most pecans when properly motivated? Those who cook at home multiple times a week, with multiple mouths to feed would be most likely to purchase larger quantities of an ingredient or snack. Going deeper, we knew that nutrition was a critical piece of our pecan story – so our target audience is also health conscious and looking for ways to make their weekly meals more nutritious. Most importantly, we needed to ensure our target audience had purchasing power – individuals who are likely to make the everyday spending decisions for their household, particularly when it comes to food. Our research found that moms in Generations X and Y fit the bill on all counts:
56 percent of moms with children 18 or younger cook at least 3 meals at home a week and have “healthy foods” listed as a “MUST” when considering their weekly plans.
These moms love learning about new ingredients and are interested in trying new recipes – 60 percent of moms look up new food ideas while they’re cooking.
78 percent of Gen X and Y moms are in a grocery store at least once a week, indicating they hold the food purchasing power for their households.
While some of our marketing efforts cast a wide net for all potential pecan consumers, we focus the majority of our efforts on our target audience of Gen X and Y moms with kids at home. Identifying our target audience allows us to tailor our marketing techniques. For example, consumer trends showed that Instant Pots have become popular among busy moms, so we worked with an influencer partner to create a
Pecans for Lent We’re always on the lookout for new ways to introduce pecans to media contacts. The beginning of Lent posed an ideal time to focus on meatless recipe options and position pecans as a “plant-based protein.” This approach landed hits like this local Times News feature in Pennsylvania!

178
recipe incorporating pecans into an easy weeknight dinner using an Instant Pot. Targeted search engine advertising suggested the recipe and our website to Gen X and Y moms who searched online for “instant pot recipes” – generating 34 percent of clicks to the APC website in a single month! What’s next? How do we plan to continue reaching this audience? We have already seen how investing our funds toward marketing tactics that reach Gen X and Y moms allows us to stretch our dollars to get the most out of industry’s resources. In this next phase of marketing, we remain focused on reaching this audience and showing them how pecans can be a nutritious, delicious part of their regular routine. This spring and summer, we’re introducing the concept of Superweeks – a week of meals incorporating pecans. With this campaign, we’ll show Gen X and Y moms the many uses for pecans as they plan their meals for the week, as well as tap into their desire to put creative and healthy dishes on the table for their families. The Superweeks concept also shows the value of our product – we know pecans are a premium product, so showing how versatile just one bag can be encourages our target audience to add them to their regular, weekly grocery haul. To do this, we’re leveraging traditional media outreach – sharing our Superweeks story with news outlets from coast to coast – as well as social media targeting. We’re also harnessing the power of a new group of influencers and bloggers who specialize in meal-planning guides and menu creation to connect directly to our ideal consumer. With Superweeks, we’ll reach our target audience via the channels they most often turn to for meal planning, with a message that will most resonate with their desire to feed their families quick, nutritious and delicious meals.
RESULTS AND REASONING: HOW YOU CAN STAY CONNECTED
Today’s marketing landscape looks very different than that of our parents, grandparents – or even ourselves five years ago! The most efficient tactics for reaching consumers are constantly shifting and changing, and it’s our promise as the stewards of your Federal Marketing Order to stay smart on what new channels are most effective for spreading the word about American Pecans. While we aim to provide timely and thorough updates on our consumer marketing efforts, we know many of you may want to learn even more about our campaigns and strategic tactics. This summer, we’re hitting the road to share updates on APC – including our marketing program – at conferences throughout the country. We look forward to connecting with you in person at these events, and hope that you’ll take the opportunity to share your thoughts and ask any questions you may have.
In the meantime, we’re committed to sharing updates on marketing results with you on a monthly basis – through these newsletters and through the Digital Toolkit for Industry at americanpecan.com/industry. Be sure to check out the “Your Dollars at Work” page to access our Monthly Marketing Highlights reports, which showcase key results from marketing activities each month.
CALENDAR OF EVENTS
American Pecan Council General Council Meeting
April 10, 2019 Dallas/Fort Worth International Airport
Oklahoma Pecan Growers Association Annual
Convention June 15-19, 2019
Ardmore, OK
TriState ArkLaMiss Pecanference June 20-21, 2019 New Roads, LA
______________ For a complete list of upcoming industry events &
educational courses, visit the Industry Events page on AmericanPecan.com
3880 Hulen Street, Suite 105
Fort Worth, Texas 76107 PH: (817) 916-0020
Follow us on social media: @americanpecan

179
Issue No. 19 APRIL 2019
Representatives from 19 of 21 state, regional, and national pecan
associations attended the inaugural Pecan Congress on April 9, 2019
A SIGNIFICANT STEP FORWARD FOR THE AMERICAN PECAN INDUSTRY
On April 9, 2019, the American pecan industry held its first-ever “Pecan Congress.” The historic event brought together 19 of 21 pecan organizations representing different regions, state and national organizations. It provided a venue for the organizations to inform the industry on their specific issues, while offering an exchange of ideas and updates for the whole industry. Additionally, the US Pecan Growers Association and the American Pecan Council signed a contract which will unify international messaging and help the industry go after extra funds to expand marketing efforts. This unification strategy is important as it will provide an avenue for increasing activities with pecan’s limited resources.
USPGC and APC leadership sign historic agreement
USPGC will lead the efforts in China, South Korea and South East Asia, while the APC will focus on Canada, EU, India, and other countries. This allows an opportunity to utilize expertise from both organizations for a common goal–to market and move pecans. Overall, the event has received positive feedback and the industry is set to hold its next Pecan Congress on August 20, 2019, with the Council meeting on August 21. A special thank you to all of those that participated to make the event such a success. More detailed information will be sent to the associations as we begin preparing for the next event. If you’d like to learn more about the Pecan Congress, please do not hesitate to contact the APC office.
APC Executive Director Alex Ott addresses Georgia growers and
industry members at GPGA’s 2019 Annual Conference in Tifton, GA ON THE ROAD: GPGA ANNUAL CONFERENCE
APC staff attended and made a presentation highlighting aspects of APC’s recently completed Strategic Plan at the Georgia Pecan Growers Association Annual Conference on March 27, 2019. Executive Director Alex Ott presented 5 strategic priorities—win our fair share of tree nuts, lead amongst global suppliers, strengthen our infrastructure, modernize the industry, & unite pecan stakeholders—that emerged from the data, providing industry with a roadmap for successfully navigating the future. APC staff also conducted a Handler Regulatory & Reporting Course to provide further education and training on compliance activities required by the Federal Marketing

180
Order 986, such as filling out the monthly reporting forms. If you were unable to attend the workshop and have any questions regarding the reporting forms, please feel free to contact the Council office at any time. We are here to assist you in completing the proper documentation to ensure compliance with the FMO.
RESULTS ARE IN … AND THEY’RE PROMISING: ECONOMIC CONTRIBUTION OF GENERIC FOOD
& AGRICULTURAL PRODUCT ADVERTISING Results were just released of a study* conducted that analyzed the economic impact of agricultural promotion groups (APGs) in the United States. Results conclude that these programs have effectively enhanced the profits of their respective stakeholders and generated high rates of returns to the dollars invested in the programs. The study also found that the success of the programs in supporting and growing their respective sectors of agriculture has spilled over to growth in the general economy.
Click Here to Learn More About This Study
*“The National Economic Contribution of Agricultural Advertising and Promotion” by Forecasting and Business Analytics, LLC (April 2017).
MARCH MARKETING HIGHLIGHTS
The latest edition of our monthly Marketing Highlights Report, sharing updates on recent marketing activities, is available to view, download and print. Check out the March report by clicking below or by visiting the Your Dollars at Work page in the Digital Toolkit for Industry (password: pecans18).
Download the March Marketing Report
CALENDAR OF EVENTS
2019 NPSA Pecan Chefs Summit May 1-3, 2019
San Antonio, TX
Arkansas Pecan Growers Association Education Meeting 2019 May 4, 2019 Lonoke, AR
Mississippi Pecan Growers Association—
Field Day 2019 May 7, 2019
Raymond, MS
Oklahoma Pecan Growers Association Annual Convention
June 15-19, 2019 Ardmore, OK
TriState ArkLaMiss Pecanference
June 20-21, 2019 New Roads, LA
For a complete list of upcoming industry events & educational courses, visit the Industry Events page
on AmericanPecan.com
3880 Hulen Street, Suite 105 Fort Worth, Texas 76107
PH: (817) 916-0020
Want to attend a course in person? The next Handler Regulatory & Reporting Courses are scheduled to take place on July 15th & 16th at the 2019 Texas Pecan Growers Association Conference and Trade Show in Frisco, TX
Follow us on social media: @americanpecan

181
IINN AA NNUUTTSSHHEELLLL Issue No. 20 May 2019
HAVE A SUPERWEEK WITH AMERICAN PECANS
Last month, we gave you a sneak peek at our latest marketing initiative – Superweeks – where we show consumers the many delicious ways to incorporate pecans into weekly menus. The concept taps into the current weekly meal planning trend among our target audience of moms in generations X and Y. Each week, we’ll release a new line-up of pecan-inspired recipes the whole family can enjoy during the work week. Our goal is to show consumers how one bag of pecans can amp up their families’ meals all week long. In doing so, we hope to change people’s perceptions of pecans from a specialized ingredient they purchase around the holidays to a
year-round staple they add to their grocery basket on a weekly basis. Some of you might be thinking, what is the difference between Superweeks and Super-fy? Think of Superweeks as an evolution of Super-fy. We want consumers to Super-fy their meals every day by adding pecans to their weekly meal plan routine – making each week a Superweek! To do this, our meal plans will rotate between six themes – Heart Health, Gluten Free, Kid-Friendly, Plant Based, Magic Number, and Summer Socials – every few weeks. These themes were carefully chosen based on our target audience of Gen X and Y moms who have purchasing power and search for these types of recipes when meal planning this time of year. The campaign kicked off last month and will run through September, sharing pecan-inspired recipes throughout the summer and into the back-to-school season this fall. Be on the lookout for Superweeks content on APC digital channels in the coming months!
The Superweeks campaign shows consumers how adding pecans to their weekly grocery routine allows for new, delicious and nutritious options
beyond the pie.
ENGAGING INFLUENTIAL VOICES TO TELL THE SUPERWEEKS STORY
One of the key elements of this campaign is our partnerships with influential bloggers in the food/nutrition space who will create original content for Superweeks. While vetting influencers, we ensured each is a good fit for the campaign
National Pecan Month Feature! In honor of April being National Pecan Month, registered dietitian and social media influencer Mia Syn shared the pecan love in a TV cooking demo in Charleston, SC, and with her 84K Instagram followers by posting about six different ways pecans can be used “outside the pie.”

182
and relates to our target audience of moms in Generations X and Y (age 25-54). Our newest influencers are all mothers who have a love for cooking and learning about nutritious new foods, regularly meal plan for their families and share their ideas with their social media and blog followers. For Superweeks, each influencer will prepare meal plans along one of our six themes (Heart Healthy, Kid-Friendly, Gluten Free, Plant Based, Magic Number, and Summer Socials). Each partner was thoughtfully matched with one of these themes to fit their blog content, personal style and what their loyal followers have come to expect from them. Our influencer partnerships for Superweeks are already underway – one of our partners, Sandy Coughlin of Reluctant Entertainer has already begun sharing Superweeks content with her 586K social media and blog followers. As a mom of three, she loves trying new recipes and sharing them online, and has amassed a strong following and popularity among other mothers who are looking to feed their families nutritious and delicious meals. Sandy will create meal plans and content with our Summer Socials theme – showing how pecans can be incorporated into recipes for summertime meals and entertaining. Be sure to follow her on social media (Facebook, Instagram and Pinterest) and keep an eye out for her Superweeks posts!
Sandy Coughlin of Reluctant Entertainer is just one of the influential bloggers we will work with for Superweeks.
SUPERWEEKS RESOURCES FOR INDUSTRY
As with all of our marketing initiatives, the Superweeks campaign is in service to you. As a member of the American pecan industry, we encourage you to take advantage of the materials and content the APC creates for Superweeks for use in promoting your own business. To give you easy access to a host of Superweeks campaign resources, we created a dedicated page in the Digital Toolkit
for Industry (password: pecans18). The page shares helpful information on the campaign and includes downloadable resources – like our heart-smart shopping list and recipe cards – which you can print to hand out to customers or post to your own website. Much like the Superweeks campaign, we will update the page frequently with new materials, so continue to check back throughout the campaign!
CALENDAR OF EVENTS
Oklahoma Pecan Growers Association Annual Convention
June 12-14, 2019 Ardmore, OK
TriState ArkLaMiss Pecanference
June 20-21, 2019 New Roads, LA
Texas Pecan Growers Association Annual
Conference July 14-17, 2019
Frisco, TX
Arizona Pecan Growers 24th Annual Conference 2019
September 5-6, 2019 Tuscon, AZ
National Pecan Shellers Association Annual
Meeting September 11-13, 2019
Nashville, TN
3880 Hulen Street, Suite 105 Fort Worth, Texas 76107
PH: (817) 916-0020
Follow us on social media: @americanpecan
Know someone who should receive our newsletter?
Tell them to sign up by visiting AmericanPecan.com and entering their email in the “Let’s Stay in Touch”
field. They can also email us directly at [email protected] and ask to join our
mailing list.

183
Issue No. 21 MAY 2019
NEW ROUND OF TARIFFS SET On May 10, 2019, the Trump Administration announced that it would begin imposing a new round of tariffs totaling $200 billion in higher tariffs on Chinese goods. This new round of tariffs is in response to the tariffs that China has imposed on U.S. goods and services, including agricultural products, such as pecans. China’s response has been to increase existing tariffs by as much as 25% including agricultural products. As a result of the new trade tariffs being proposed, President Trump has turned to additional mitigation funding through existing programs, such as Market Facilitation Program, additional Agricultural Trade Promotion Program (ATP), and additional dollars for agricultural purchase programs. Last round, the pecan industry received a total of $16.8 million for purchase products and $1.3 million in ATP assistance. As a result of the tariffs, the American pecan industry has seen exports to China/Hong Kong go from 80 million pounds to just 7 million pounds. It is projected that the impact on the pecan industry has been between $240 - $300 million dollars. The American Pecan Council will continue to update the industry as additional information becomes available. In the meantime, the APC will continue to drive demand in both domestic and selected international markets and increase awareness to alleviate supply. For additional information, please contact the Council office.
THE GEORGIA PECAN CONFERENCE The APC attended the first annual Georgia Pecan Congress which took place in Tifton, Georgia, April 29-May 1, 2019.
The event was well attended by Georgia growers, accumulators and shellers. Others in attendance included members of the USDA and Georgia State Agriculture. Discussion centered around improving relations within the supply chain and thus unifying industry. Other topics included Mexican imports, domestic marketing and improving the packaging of pecans. Shellers showed interest in encouraging foreign suppliers to make voluntary donations to and the APC. If agreed upon, those donations would be utilized by the APC to increase domestic marketing efforts and to conduct health research studies. On the marketing front, attendees noted that they would like to see a macro strategy when it comes to promoting pecans in regions of the United States that may not recognize pecans for use outside of holiday baked goods. There were approximately 30 attendees in all. The overwhelming positive response appears to point towards Georgia conducting this event once a year. Thanks to Brent Brinkley and Samantha McLeod for coordinating the event.
Culinary Director Marie Ostrosky leads a live cooking demo
showcasing the versatility of pecans at the Culinary Institute of America – San Antonio Campus
NPSA’S CHEFS SUMMIT 2019 ROUND-UP
May 1-3 marked the 2019 Pecan Chefs Summit in San Antonio, TX. The annual event, which took place in San Antonio, Texas, was organized and hosted by the National Pecan Shellers Association and funded in part by the American Pecan Council.

184
During this three-day immersion into the world of pecans, R&D chefs from around the nation were invited to see how pecans are grown and brought to market through touring a farm run by a 5th generation grower as well as a commercial shelling facility. Additionally, the chefs learned about the nutritional profiles of pecans and how to differentiate the texture, flavor, and uses of various pecan products (including halves, pieces, meal/flour, and oil), through live cooking demos and educational sessions. We’re excited to see what new applications from the foodservice industry come about as a result of this event!
APC RAMPS UP INFLUENCER MARKETING The APC has partnered with the premiere influencer platform firm AspireIQ to begin building content for the Council’s website and to build out their social communities. Thanks to AspireIQ, over the next few months the APC will begin working with over 30 influencers that will provide content via Pinterest, Instagram, Facebook and Twitter. The APC will also be creating a YouTube Channel that will host a variety of industry videos and recipes. The recently conducted APC Strategic Plan confirmed areas in which the Council could repurpose marketing dollars towards building a library of content while still retaining the services of the APC’s public relations firm Weber Shandwick. These identified savings provide room within the budget to reach our target audience utilizing a variety of marketing tools. We look forward to expanding on this strategy in the upcoming fiscal year.
APRIL MARKETING HIGHLIGHTS Today we released the latest edition of our monthly Marketing Highlights Report, sharing updates on recent marketing activities. You can view and download the report by clicking the button below or by visiting the Your Dollars at Work page in the Digital Toolkit for Industry (password: pecans18).
Download the April Marketing Report
CALENDAR OF EVENTS
Oklahoma Pecan Growers Association Annual Convention
June 12-14, 2019 Ardmore, OK
TriState ArkLaMiss Pecanference
June 20-21, 2019 New Roads, LA
Texas Pecan Growers Association
Conference & Trade Show July 14-17, 2019
Frisco, TX
Pecan Association Congress Meeting August 20, 2019
Dallas/Fort Worth International Airport
American Pecan Council General Council Meeting
August 21, 2019 Dallas/Fort Worth International Airport
For a complete list of upcoming industry events & educational courses, visit the Industry Events page
on AmericanPecan.com
3880 Hulen Street, Suite 105 Fort Worth, Texas 76107
PH: (817) 916-0020
Save the Date! The next Handler Regulatory & Reporting Courses are scheduled to take place on July 15th & 16th at the 2019 Texas Pecan Growers Association Conference and Trade Show in Frisco, TX
Follow us on social media: @americanpecan
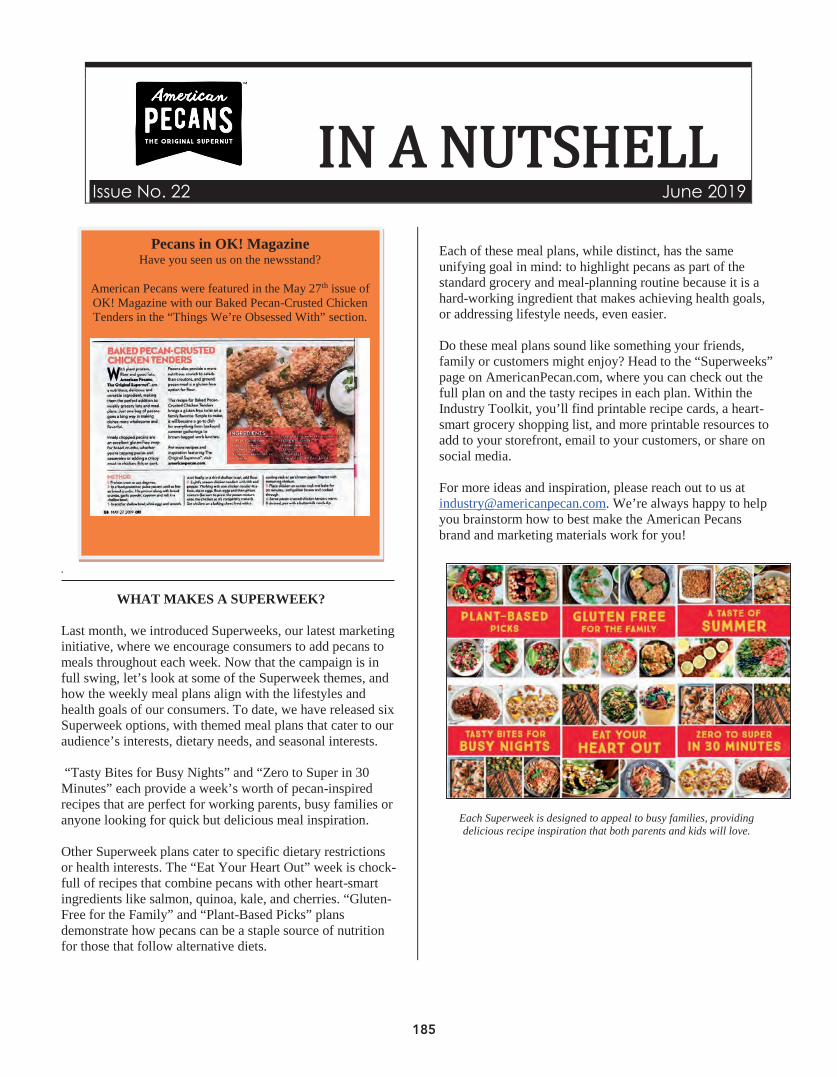
185
Issue No. 22 June 2019
.
WHAT MAKES A SUPERWEEK? Last month, we introduced Superweeks, our latest marketing initiative, where we encourage consumers to add pecans to meals throughout each week. Now that the campaign is in full swing, let’s look at some of the Superweek themes, and how the weekly meal plans align with the lifestyles and health goals of our consumers. To date, we have released six Superweek options, with themed meal plans that cater to our audience’s interests, dietary needs, and seasonal interests. “Tasty Bites for Busy Nights” and “Zero to Super in 30 Minutes” each provide a week’s worth of pecan-inspired recipes that are perfect for working parents, busy families or anyone looking for quick but delicious meal inspiration. Other Superweek plans cater to specific dietary restrictions or health interests. The “Eat Your Heart Out” week is chock-full of recipes that combine pecans with other heart-smart ingredients like salmon, quinoa, kale, and cherries. “Gluten-Free for the Family” and “Plant-Based Picks” plans demonstrate how pecans can be a staple source of nutrition for those that follow alternative diets.
Each of these meal plans, while distinct, has the same unifying goal in mind: to highlight pecans as part of the standard grocery and meal-planning routine because it is a hard-working ingredient that makes achieving health goals, or addressing lifestyle needs, even easier. Do these meal plans sound like something your friends, family or customers might enjoy? Head to the “Superweeks” page on AmericanPecan.com, where you can check out the full plan on and the tasty recipes in each plan. Within the Industry Toolkit, you’ll find printable recipe cards, a heart-smart grocery shopping list, and more printable resources to add to your storefront, email to your customers, or share on social media. For more ideas and inspiration, please reach out to us at [email protected]. We’re always happy to help you brainstorm how to best make the American Pecans brand and marketing materials work for you!
Each Superweek is designed to appeal to busy families, providing delicious recipe inspiration that both parents and kids will love.
Pecans in OK! Magazine Have you seen us on the newsstand?
American Pecans were featured in the May 27th issue of OK! Magazine with our Baked Pecan-Crusted Chicken Tenders in the “Things We’re Obsessed With” section.

186
The Retail Dietitians Business Alliance is a resource for specific registered dietitians who work inside grocery stores nationwide, sharing new products and nutrition information with shoppers while they are in
the store.
EXPANDING OUR RETAIL DIETITIAN PARTNERSHIP
You may recall our work with a group of “Supermarket RDs” earlier this year during our Super-fy campaign. We developed a turnkey toolkit of recipe cards, nutrition and proper storage information, as well as a calendar of suggested themes and activations for RDs to use during their in-store demonstrations. These RDs are particularly strong partners for our goal of increasing demand, because they educate shoppers in the store, influencing purchasing decisions. The program’s first round was very successful, with 23 RDs activating in grocery stores nationwide. Now, we have expanded this Supermarket RD program by collaborating with the Retail Dietitians Business Alliance, a key resource for these dietitians. The RDBA’s newsletter is distributed to more than 2,200 members nationwide, and American Pecans was featured in a May issue and will be featured in another this month. Within these e-newsletters, we provided an opt-in link for RDs to receive our toolkit, including nutrition info, recipes, and usage inspiration as well as information they need to make successful in-store displays and demos. We are also sending the RDs a nutrition handout along with themed Superweeks 5-recipe meal plans, so they can encourage their shoppers to purchase a bag of pecans and create a week’s worth of meals. Interested in taking advantage of these resources for your own business? Head to the Industry Toolkit on AmericanPecan.com (password: pecan18) where you can find these materials and more.
CALENDAR OF EVENTS
Oklahoma Pecan Growers Association Annual Convention
June 12-14, 2019 Ardmore, OK
TriState ArkLaMiss Pecanference
June 20-21, 2019 New Roads, LA
Texas Pecan Growers Association Annual
Conference July 14-17, 2019
Frisco, TX
Arizona Pecan Growers 24th Annual Conference 2019
September 5-6, 2019 Tuscon, AZ
National Pecan Shellers Association Annual
Meeting September 11-13, 2019
Nashville, TN
3880 Hulen Street, Suite 105 Fort Worth, Texas 76107
PH: (817) 916-0020
Follow us on social media: @americanpecan
Know someone who should receive our newsletter?
Tell them to sign up by visiting AmericanPecan.com and entering their email in the “Let’s Stay in Touch”
field. They can also email us directly at [email protected] and ask to join our
mailing list.

187
Issue No. 23 JUNE 2019
NEW INDIA TRADE TARIFFS DO NOT IMPACT PECANS
On June 16, 2017, India government officials announced an increase in taxes on US products on several existing commodities. For nuts, it was announced that the surcharge duties will be set at 120%. However, pecans are excluded from the increased duty. Almonds and walnuts are the only nuts listed in the increase for duties. The effective duties go into effect June 16, 2019.
The American Pecan Council (APC) identified India as a potential top five market to target. Currently, the APC is submitting an emerging market proposal (EMP) to try and obtain dollars to study the market and begin establishing a pecan market in the country. The current tariff on pecans shipped to India is 36%. APC will continue to monitor and communicate with industry as data becomes available.
APC VISITS OKLAHOMA AND TRI-STATE CONFERENCES
On June 13, the American Pecan Council presented to the Oklahoma Pecan Growers Association. After the trip through the Panhandle State, the APC turned south to Louisiana where the APC spoke to the Tri-State Pecan Growers Conference. The presentations updated the attendees on the latest activities that the APC has completed and continues to work on. Currently, active projects include: continuation of the “Superweeks” consumer marketing campaign, nutritional research, consumer tracking, nearly completing the US satellite acreage
mapping, preparing for the next Pecan Congress, and providing updates on the latest shipment data. Issues discussed during the Q&A session included market updates on India, Mexico, S. Africa, domestic shipments, grades and standards and the changing of communication to target consumer groups. A special thank you to both the Oklahoma Pecan Growers Association and the Tri-State Pecan Growers conference for putting on two great events. For more information about the topics covered, please contact the Council office.
APC Executive Director Alex Ott presents to industry members
from Arkansas, Louisiana, and Mississippi at the 2019 Tri-State Pecan Growers Conference
MRL WORKSHOP
APC Staff Emma Garner attended the 2019 MRL Harmonization Workshop in San Francisco, CA on May 29-30, 2019. Over 150 attendants including industry members, organizations, and governmental agencies were represented at this workshop. There were 30 international attendees coming from over 7 countries. The workshop included international updates from Germany regarding the EU Commission, South Korea and Taiwan regarding their Positive List and enforcement, as well as the Southeast Asian Nation’s current MRLs. Other topics of discussion were EU pesticide policies as it relates to trade with EU, the MRL early alert system in the EU, an update from Environmental Protection Agency (EPA) and Committee on Pesticide Residues (CCPR), and FAS, overall MRL

188
compliance and exemptions, and the future of MRL harmonization. All presentations from this workshop are now available online at the link provided below: http://specialtycrops.org/mrlworkshop.html
SASDA 2019 CONFERENCE From June 8-12, 2019, Commissioners and Secretaries of Agriculture from Alabama, Arkansas, Florida, Georgia, Kentucky, Louisiana, Maryland, Mississippi, North Carolina, Puerto Rico, South Carolina, Tennessee, Texas, Virgin Islands, Virginia, and West Virginia gathered in Fort Worth, Texas for the 2019 Annual SASDA Conference. The purpose of the Southern Association of State Departments of Agriculture (SASDA) is to improve American agriculture through the development and promotion of sound public policy and agriculture related businesses and programs, and to communicate the vital economic importance of agriculture. As a sponsor of the conference, APC was invited to join the Commissioners and Secretaries for educational sessions on the regulatory responsibilities of each state, and discussions over current and future agriculture policy issues. To learn more about the organization and conference, visit www.sasdaannualconference.com.
MAY MARKETING HIGHLIGHTS We have released the latest edition of our monthly Marketing Highlights Report, sharing updates on recent marketing activities. You can view and download the report by clicking the button below or by visiting the Your Dollars at Work page in the Digital Toolkit for Industry (password: pecans18).
Download the May Marketing Report
CALENDAR OF EVENTS
Texas Pecan Growers Association Conference & Trade Show
July 14-17, 2019 Frisco, TX
American Pecan Council
Handler Regulatory & Reporting Course July 15-16, 2019
Frisco, TX
Pecan Association Congress Meeting August 20, 2019
Dallas/Fort Worth International Airport
American Pecan Council General Council Meeting
August 21, 2019 Dallas/Fort Worth International Airport
Arizona Pecan Growers 24th Annual Conference
September 5-6, 2019 Tucson, AZ
National Pecan Shellers Association
Annual Meeting September 11-12, 2019
Nashville, TN
3880 Hulen Street, Suite 105 Fort Worth, Texas 76107
PH: (817) 916-0020
Save the Date! The next Pecan Congress of industry associations will be held at the Hyatt Regency DFW International Airport on Tuesday, August 20, 2019, beginning at 8:30 am CST. Breakfast and lunch will be provided. There will be a reception on the 20th at 6:00 pm CST. The Council meeting will be on Wednesday, August 21st beginning at 8:30 am CST. Breakfast and lunch will be provided. It is open to public.
Follow us on social media: @americanpecan

189
IINN AA NNUUTTSSHHEELLLL Issue No. 24 July 2019
Grocery store chain Kroger features American Pecans heart-smart recipe for Pecan Crusted Honey Mustard Salmon.
HEART-HEALTHY PECANS
FEATURED IN KROGER MAGAZINE We’re excited to share that American Pecans is featured as a heart-healthy option in grocery store Kroger’s Live Naturally magazine this summer! We combined the educational information on the nutrition of pecans with the seasonal interests of our audience to create an engaging and delicious article, “Simple Planning for Easy, Heart-Smart Summer Meals.” The piece features our American Heart Association Heart-Check designation, as well as a tasty dinner recipe, Pecan Crusted Honey Mustard Salmon in Foil. Live Naturally is available throughout the store, as well as at the checkout counter and store entrance. Our American Pecans content was shared in stores in four major markets nationwide: Kroger Atlanta, Kroger Southwest (TX, LA), Ralph’s of California and Kroger Mid-Atlantic (WV, VA, NC, TN). Grocery magazines pose a great opportunity to reach our target audience as close as possible to their point of purchase. In fact, 93 percent of consumers surveyed by Kroger were inspired to try new products after reading the magazine. Consumers also stated that recipes and articles were “most helpful” and 55 percent of readers made a recipe after seeing it in the magazine. We are excited to promote pecans in these grocery store magazines that help to move pecans from consumer awareness to consumer sales. If you see the magazine in your store, we would love to hear about it. Send us a picture at [email protected], or call the office at (817) 916-0020 and let us know!
THE SCIENCE BEHIND THE SUPERNUT
A core component of our marketing program is educating consumers on the nutrition story of pecans. We actively promote pecans as a nutrient-dense nut and highlight their American Heart Association Heart-Check Certification; however, we are restricted in sharing certain health and nutrition claims, due to lack of associated nutrition research. This year, we began laying the groundwork to share more of the pecan’s nutrition story by commissioning nutritional research. We partnered with nutrition consultant Guy Johnson, Ph.D., to help us develop a Request for Proposal (RFP) for research related to pecans and cardiovascular health and weight management. Research like this will help us tell more of the pecan nutrition story and support our claim that American Pecans truly are The Original Supernut. We distributed this RFP to more than 70 researchers at universities and institutions across the country, both independently and through organizations like the Academy of Nutrition and Dietetics and the American Society for Nutrition. We’re thrilled to announce we received 21 proposals from top-tier researchers and institutions including Harvard, Yale, UC-Davis and Penn State. We are working with our consultant to review the detailed proposals and develop a recommendation for which researcher(s) will be awarded the research grant later this summer.
GETTING TO KNOW OUR MEAL PLANNING PARTNERS
In May, we introduced you to our Superweeks influencer program, where we partner with food and lifestyle bloggers to create new American Pecans recipes and spread the word about the versatility,
PUTTING THE BRAND TO WORK FOR YOU
Everything we create for our marketing efforts is yours to use for your own business. Most of these
resources live in the Industry Toolkit on the American Pecans website, where you can find campaign-
specific resources as well as logos, FAQs, and more. Print and share your favorite materials, and let us
know what you’d like to see next!
You can check out the toolkit here (password pecans18).

190
nutrition, and heritage of the pecan. Since May, the program has really taken off! If you follow American Pecans on social media, or have been checking in with our Superweeks blog on AmericanPecan.com, you likely noticed a collection of new recipes. These new creations came from a fresh group of partners whose blog content and readership line up with our target audience of Gen X and Y moms. These bloggers not only created new recipes, but also shared these recipes in the context of a full, American Pecans meal plan, or five days’ worth of meals all centered around pecans.
Yummy Mummy posted her mouth-watering Pecan Stuffed Bell Peppers recipe to her personal blog page, which has
more than 70,000 readers per month! The loyal followers of our pecan partners are learning how pecans can work in new and delicious ways for their families every day of the week. Check out some examples below!
Yummy Mummy Kitchen provided us with five days’ worth of pecan-filled, vegan meals, including this delicious recipe for Pecan-Stuffed Bell Peppers.
Wholesomelicious shared five gluten-free recipes for
weeknight meals, including Air-Fryer Pecan Crusted Pork Chops and Grilled Balsamic Chicken with Pecan Pesto.
Joyful Healthy Eats provided us with five yummy meals
that consumers can make in thirty minutes or less – perfect for our target audience of busy moms on the go.
Mom’s Kitchen Handbook just released the first recipe in
her series of energy-boosting recipes for consumers. Each of these partners appeals to a slightly different lifestyle or dietary preference – and together, they build a comprehensive picture for the consumer of the versatile power of pecans. Have a favorite? You can always go to AmericanPecan.com to print or email the recipe to share with family, friends and customers.
CALENDAR OF EVENTS
Texas Pecan Growers Association Annual Conference
July 14-17, 2019 Frisco, TX
American Pecan Council Handler Regulatory
and Reporting Couse July 15-16, 2019
Frisco, TX
Pecan Associations Congress August 20, 2019
Dallas, TX
American Pecan Council-General Council Meeting
August 21, 2019 Dallas, TX
Arizona Pecan Growers 24th Annual
Conference 2019 September 5-6, 2019
Tuscon, AZ
National Pecan Shellers Association Annual Meeting
September 11-12, 2019 Nashville, TN
3880 Hulen Street, Suite 105
Fort Worth, Texas 76107 PH: (817) 916-0020
Follow us on social media: @americanpecan
KNOW SOMEONE WHO SHOULD RECEIVE OUR NEWSLETTER?
Tell them to sign up by visiting AmericanPecan.com and entering their email in the “Let’s Stay in Touch”
field. They can also email us directly at [email protected] and ask to join our
mailing list.

191
IINN AA NNUUTTSSHHEELLLL Issue No. 25 AUGUST 2019
NEW STUDY REVEALS AN INVERSE ASSOCIATION BETWEEN NUT CONSUMPTION
AND CARDIOVASCULAR DISEASES The International Nut & Dried Fruit Congress just released a press release regarding a systematic review and meta-analysis of prospective cohort studies conducted by the Diabetes and Nutrition Study Group (DNSG) of the EASD (European Association for the Study of Diabetes) to summarize the evidence of the association between nut consumption and the incidence of, and mortality from, certain CVD outcomes 1. Results conclude that total nut consumption plays a beneficial role in reducing the incidence of, and mortality from, different CVD outcomes. Click here to view the official press release.
APC COMMITTEE MEETING UPDATES
On July 24-25, 2019, APC held Committee meeting conference calls for the five Committees: Governance, Marketing, International, Industry Relations, and Grades & Standards. Each committee approved recommendations which will be brought before the full Council for final approval on August 21, 2019 at the Hyatt Regency DFW hotel in Dallas, Texas. Areas of discussion at the Committee level have been outlined in brief, below: The Marketing Committee discussed topics such as health and nutrition marketing, the upcoming 2019-2020 FY proposed marketing activities, and the upcoming 2019-2020 FY marketing budget. The committee approved a recommendation in these areas to boost pecan presence in
the domestic, international, and health and nutrition markets. The Industry Relations Committee's topics of discussion included a review of the 2018-2019 FY activities such as Land IQ, reporting forms update, sponsorships, the Pecan Congress, and the upcoming 2019-2020 FY Industry Relations budget. The committee approved recommendations to the Council for compliance workshops and materials, industry relations activities, and funding for industry research. The Grades & Standards Committee discussed the following: the upcoming 2019-2020 FY activities and budget and revisions to the current inshell standards. The committee approved recommendations to the Council for a voluntary Quality Assurance Program for American Pecans as well as industry research. The International Committee's topics of discussion included USDA Unified Export Strategy and the 2019-2020 FY International Committee budget. The committee approved recommendations to the Council for a management contract regarding China, South Korea, and Southeast Asia, UES/EMP development, and the International Nut Congress Health Research. The Governance Committee discussed financials, compliance, and the upcoming 2019-2020 FY budget. All Committee Meetings are open to the public. Upcoming Committee Meetings, Council Meetings, and other industry events are published on the AmericanPecan.com website under the Industry Events tab. Click here to bookmark the page so you don't miss a thing!
Mark Your Calendar! The next Pecan Congress of industry associations will be held at the Hyatt Regency DFW on Tuesday, August 20,
2019, beginning at 8:30 am CST. Breakfast and lunch will be provided. APC will be handing out the 2017-2018 FY
Annual Report. The Annual Report will also be available on the AmericanPecan.com website following the Congress. The Council meeting will be on Wednesday, August 21st, beginning at 8:30 am CST. Breakfast and lunch will be
provided. It is open to public. Please join us!

192
APC Western Region Representative Deborah Ralls and APC staff Emma Garner at the Handler Regulatory and Reporting Course conducted at the Texas Pecan Growers Association Meeting on
July 15-16, 2019.
ON THE ROAD: APC ATTENDS TEXAS PECAN
GROWERS ASSOCIATION CONFERENCE APC staff attended and made a presentation highlighting aspects of APC’s recently completed Strategic Plan at the Texas Pecan Growers Association Annual Conference & Trade Show on July 15-16, 2019 in Frisco, TX. Executive Director Alex Ott presented a review and update on the programs and activities that are in progress and those that have been accomplished during 2018 and 2019. APC staff also conducted a Handler Regulatory & Reporting Course to provide further education and training on compliance activities required by the Federal Marketing Order 986, such as filling out the monthly reporting forms.
AMERICAN PECANS TO BE FEATURED IN RFD-TV'S CHASING DOWN MADISON BROWN
APC has worked with RFD-TV a few times before to share news with the pecan industry - and the broader ag industry - about the brand launch and Pecan-A-Thon on their Market Day Report broadcast. The network reaches more than 52 million homes and showcases agribusiness as well as rural lifestyle. Chasing Down Madison Brown is one of the network’s lifestyle shows, following Madison as she searches for the best farms, food and people in rural America. This segment will highlight the American Pecan Industry and APC. Filming for the Chasing Down Madison Brown segment will occur on September 19th-21st in San Saba,
TX. APC will notify industry once the air date has been announced. About Chasing Down Madison Brown Meet Madison Brown, a seasoned road warrior who grew up rolling down the highway with country band Sawyer Brown and her father Mark Miller, founder and lead singer. Madison’s unique and adventurous upbringing meant life on a tour bus, where each new stop brought new adventures, influenced her passion for food, and developed her love for exploring new places. Inspired by Madison’s longtime blog, chasingdownmadisonbrown.com, this new series takes viewers coast-to-coast with behind-the-scenes tours, celebrity interviews, sporting events, chefs, food, and more.
JUNE MARKETING HIGHLIGHTS The latest edition of our monthly Marketing Highlights Report was released this week, sharing updates on recent marketing activities. You can view and download the report by clicking the button below or by visiting the Your Dollars at Work page in the Digital Toolkit for Industry (password: pecans18).
Download the June Marketing Report
CALENDAR OF EVENTS Pecan Association Congress Meeting
August 20, 2019 Dallas/Fort Worth International Airport
American Pecan Council General Council
Meeting August 21, 2019
Dallas/Fort Worth International Airport
Arizona Pecan Growers 24th Annual Conference September 5-6, 2019
Tucson, AZ
National Pecan Shellers Association Annual Meeting
September 11-12, 2019 Nashville, TN
Have Questions Regarding the Monthly Reporting Forms?
If you have any questions regarding the reporting forms, please feel free to contact the Council office at any time. We are here to assist you in completing the
required documentation to ensure compliance with the FMO.

193
The Chicago Sun-Times shares a mouthwatering recipe for Creamy Chopped Chickpea Pecan Salad.
SIMPLIFYING BACK-TO-SCHOOL DINNERS
As summer comes to an end and kids prepare to head back to school, parents are looking for easy recipes with healthy, nutritious ingredients to add to their weeknight rotation.
We know that parents are busy – and according to Mintel research, 53 percent of consumers said they do not have the energy to cook. This makes it the perfect time to share tasty meal plans that incorporate The Original Supernut and take less than 30 minutes to prepare!
We released an article titled, “Simplify Back-to-School Dinners with Nutritious Meal Plans” to hundreds of news outlets nationwide. The piece features tasty favorites such as Pecan-Crusted Air Fryer Pork Chops and was distributed in July and August to coincide with the start of back-to-school season. Articles have run in print and online news outlets
such as the St. Louis Post-Dispatch, The Advocate (Baton Rouge, La.), and The Southern Maryland Chronicle.
The article shares the health benefits of pecans and explains how adding one bag to your grocery list creates an opportunity to explore a week’s worth of new and nutritious dishes. These recipes are quick and kid-friendly, making them an ideal fit for our Gen X and Y Mom target audience.
You can find the recipes in the article, or at AmericanPecan.com. If you try them, we would love to know what you think! Send us a note and photo at [email protected]. We cannot wait to see!
Pecan-Crusted Air Fryer Pork Chops make for a delicious back-to-school dinner on a busy weeknight.
ROUNDING OUT THE SUPERWEEKS INFLUENCER PROGRAM
You may recall the information shared about our influencer program back in May. We are excited to introduce our latest group of partners and the meal plans they’ve created exclusively for American Pecans.
Our influencers’ blog content and readership are well matched with our target audience of Gen X and Y Moms, who hold purchasing power for groceries in their households. Our research revealed that these mothers are health conscious and most likely to explore new ways to incorporate nutrients into family meals.
We also found that two out of three moms plan their weekly meals in advance, especially those with young kids. In fact, according to Mintel research, the most stressful time of day
Pecans are Part of the Plan! American Pecans’ recipe for Creamy Chopped
Chickpea Pecan Salad was featured as a part of the widely syndicated Sunday “Seven-Day Menu Planner.”
The article ran in papers nationwide, including Arkansas Democrat Gazette, Chicago Sun-Times
(below), and New Hampshire Sunday News.
IINN AA NNUUTTSSHHEELLLL Issue No. 26 August 2019

194
for parents is dinnertime – and 82 percent of working moms try to combat this with advanced meal planning.
We partnered with bloggers Mom’s Kitchen Handbook and Real Housemoms to show consumers that pecans are a superfood that can help fuel families throughout the day, which research shows moms are looking for.
Mom’s Kitchen Handbook shared a meal plan with five days of high-energy recipes that fight sugar slumps and afternoon grogginess, such as “Almost Vegan” Linguine with Cauliflower Pecan Alfredo and Grilled Pork Chops with Peach and Pecan Summer Salsa. These power-packed recipes show consumers how pecans can energize their days by providing “good” monounsaturated fat, plant-based protein, fiber and essential minerals (zinc, copper and manganese).* *One serving of pecans (28g) contains 18g unsaturated fat andonly 2g saturated fat.
Mintel research also shows that one in four Gen X and Y moms is inspired by their children when choosing meals. Real Housemoms shared recipes that fit the bill, such as Pecan Chicken Meatballs and Pecan Chicken Sheet Pan Dinner, that help introduce new and delicious options to kids.
Katie Morford of Mom’s Kitchen Handbook shares five energy-filled recipes full of pecans.
AMERICAN PECANS ON THE AIRWAVES
In July, American Pecans was featured in TV segments on News 4 San Antonio and WISH-TV in Indianapolis. Both cities are large, diverse markets with great opportunity to create new pecan lovers!
Registered Dietitians Amy Goodson and Annessa Chumbley showcased pecans as a source of protein that make for a delicious snack and great addition to recipes. Amy Goodson is the former sports dietitian for many Texas athletic teams, including the Dallas Cowboys and Texas Rangers. She is also an ambassador for the American Heart Association and has co-authored a sports nutrition book for triathletes.
Annessa Chumbley is a mother of two, recipe creator, spokesperson, and talk show host on WISH-TV. In their segments, our RDs explained the health benefits of pecans and how they are ideal for effortless summertime entertaining, sharing our Pecan Berry Green Salad as an easy example of the versatility of pecans.
Popular Pecan Berry Green Salad was one of the summer favorites featured in our RD segments.
The segments reached more than 25,000 viewers, connecting consumers in markets around the country with the superfood power and easy entertaining options of The Original Supernut.
PECAN COVERAGE: FILMING FOR RFD-TV'S CHASING DOWN MADISON
BROWN TELEVISION PROGRAM SET!
APC has worked with RFD-TV a few times before to share news with the pecan industry - and the broader ag industry - about the brand launch and Pecan-A-Thon on their Market Day Report broadcast. The network reaches more than 52 million homes and showcases agribusiness as well as rural lifestyle. Chasing Down Madison Brown is one of the network’s lifestyle shows, following Madison as she searches for the best farms, food and people in rural America.
This segment will highlight the American Pecan Industry and APC. Filming for the Chasing Down Madison Brown segment will occur on September 19th-21st in San Saba, TX. APC will notify industry once the air date has been announced.
About RFD-TV RFD-TV is the flagship network for Rural Media Group, the world’s leading provider of multimedia content dedicated to the rural and Western lifestyle. Launched in December of 2000, RFD-TV is the nation’s first 24-hour television network featuring programming focused on the agribusiness, equine and the rural lifestyles, along with traditional country music and entertainment.

195
Tell them to sign up by visiting AmericanPecan.com and entering their email in the “Register Now” field under
Industry News. They can also email us directly at [email protected].
Georgia Pecan Growers Field Day August 28, 2019Baxley, GA
Arizona Pecan Growers 24th Annual Conference September 5-6, 2019Tuscon, AZ
National Pecan Shellers Association Annual Meeting September 11-12, 2019Nashville, TN
Florida Pecan Field Day and Florida Pecan Growers Association Annual Meeting
October 3, 2019Monticello, FL
About Chasing Down Madison Brown Meet Madison Brown, a seasoned road warrior who grew up rolling down the highway with country band Sawyer Brown and her father Mark Miller, founder and lead singer. Madison’s unique and adventurous upbringing meant life on a tour bus, where each new stop brought new adventures, influenced her passion for food, and developed her love for exploring new places. Now, this recent college grad is tossing off the graduation cap, hitting the road, and taking you on the adventure of a lifetime.
Inspired by Madison’s longtime blog, chasingdownmadisonbrown.com, this new series takes viewers coast-to-coast with behind-the-scenes tours, celebrity interviews, sporting events, chefs, food, and more. Madison talks with family and friends, such as Toby Keith, Mark Hall of Casting Crowns, the Bellamy Brothers, Karl Malone, Greg Maddux, Ben Zobrist and Sawyer Brown.
Know someone who should get our newsletter? 3880 Hulen Street, Suite 105 Fort Worth, Texas 76107
PH: (817) 916-0020
Follow us on social media: @americanpecan
CALENDAR OF EVENTS

196
26
INDUSTRY TOOLKIT AND RESOURCES
In the 2018-2019 Fiscal Year, we furthered our commitment to making American Pecans marketing materials and campaigns accessible and comprehensive to industry through enhancements and continued updates to the Industry Toolkit on AmericanPecan.com (password: pecans18). At the launch of each consumer marketing campaign, we created resources for download and use on personal and business social channels, websites and in stores.
Enhancing Resources Based on Industry Feedback
We also added resources from the Pecan ThanksEverything Pie, Superweeks, Super-fy, Super American Pecan-A-Thon and Brand Launch campaigns, with more to come next year. In response to industry requests, we also added a dedicated Social Media Assets section, including evergreen content that is not specific to a particular marketing campaign and can be used throughout the year.

197
27
We concluded the year with a reorganization of the Industry Toolkit to ensure that resources are shared in a way that best fits industry needs. We updated the layout of the Toolkit to put the most frequently requested resources front and center. The new Industry Toolkit now contains six sections – Our Brand, American Pecans Marketing Campaigns, Nutrition Resources, Social Assets, Printable Resources and Your Dollars at Work, which includes the aforementioned Monthly Marketing Highlights.
We encourage you to continue harnessing the power of online platforms for yourself. All of the images and videos that American Pecans creates for social media are yours to use to promote your own business.

198
28
TRAINING AND COLLABORATION
To continue teaching our industry about the power of social media, representatives from our marketing team presented to national and state industry organizations at Pecan Congress in August. We shared insights on the digital media landscape and its implications for the pecan industry, and provided inspiration for industry members to join and continue to engage in the social media revolution.
Harnessing the Power of Social Media
Throughout the presentation, we discussed the importance of social media, how to best build your channels and grow your audience, best practices for engagement on social media, and how to curate content that will appeal to your
audience and business goals. In addition to a group discussion and Q&A, we conducted small group exercises so attendees could discuss how the ideas presented could benefit their own organizations and constituents.
We love hearing feedback and appreciate outreach to the office and APC staff. We encourage you get involved in marketing campaigns, and never hesitate to reach out to the office for support in leveraging the resources available to you and your business. Industry communications and resources are made with you in mind, so your input is valuable. If you have any thoughts, questions or feedback at any time, please email [email protected] or call the office at 817-916-0020.
Source - Cision
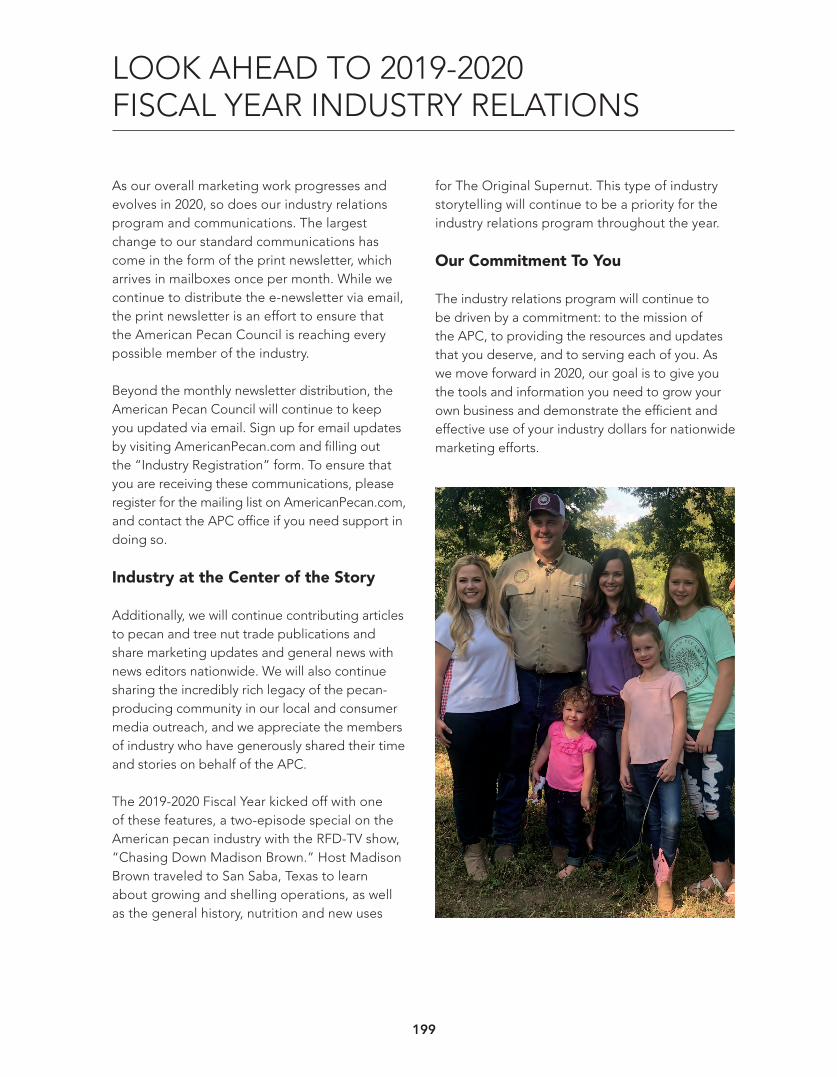
199
29
As our overall marketing work progresses and evolves in 2020, so does our industry relations program and communications. The largest change to our standard communications has come in the form of the print newsletter, which arrives in mailboxes once per month. While we continue to distribute the e-newsletter via email, the print newsletter is an effort to ensure that the American Pecan Council is reaching every possible member of the industry.
Beyond the monthly newsletter distribution, the American Pecan Council will continue to keep you updated via email. Sign up for email updates by visiting AmericanPecan.com and filling out the “Industry Registration” form. To ensure that you are receiving these communications, please register for the mailing list on AmericanPecan.com, and contact the APC office if you need support in doing so.
Industry at the Center of the Story
Additionally, we will continue contributing articles to pecan and tree nut trade publications and share marketing updates and general news with news editors nationwide. We will also continue sharing the incredibly rich legacy of the pecan-producing community in our local and consumer media outreach, and we appreciate the members of industry who have generously shared their time and stories on behalf of the APC.
The 2019-2020 Fiscal Year kicked off with one of these features, a two-episode special on the American pecan industry with the RFD-TV show, “Chasing Down Madison Brown.” Host Madison Brown traveled to San Saba, Texas to learn about growing and shelling operations, as well as the general history, nutrition and new uses
LOOK AHEAD TO 2019-2020 FISCAL YEAR INDUSTRY RELATIONS
for The Original Supernut. This type of industry storytelling will continue to be a priority for the industry relations program throughout the year.
Our Commitment To You
The industry relations program will continue to be driven by a commitment: to the mission of the APC, to providing the resources and updates that you deserve, and to serving each of you. As we move forward in 2020, our goal is to give you the tools and information you need to grow your own business and demonstrate the efficient and effective use of your industry dollars for nationwide marketing efforts.

200
GRADES & STANDARDS
201
GRADES & STANDARDS

202
As identified in the strategic plan, the US Pecan industry's “infrastructure” is less developed than that of othertree nuts, with unreliable data, outdated standards, and conflicts over grading practices inhibiting industrygrowth. During the 2018-2019 fiscal year, the Grades & Standards Committee has focused on strengtheningthe pecan industry’s infrastructure by improving and building industry data, creating uniform standardsuniversally accepted by growers and shellers, establishing a program to set domestic product apart frominternational product, and tracking and publishing pecan data for all stakeholders to access.
COMMITTEE SUMMARY_____________________________________________________________________
Mike AdamsGL StraleyTrent MasonRandy HudsonJohn HeulerDan YorkBruce Caris
Committee Chair
Committee Members
Larry Willson
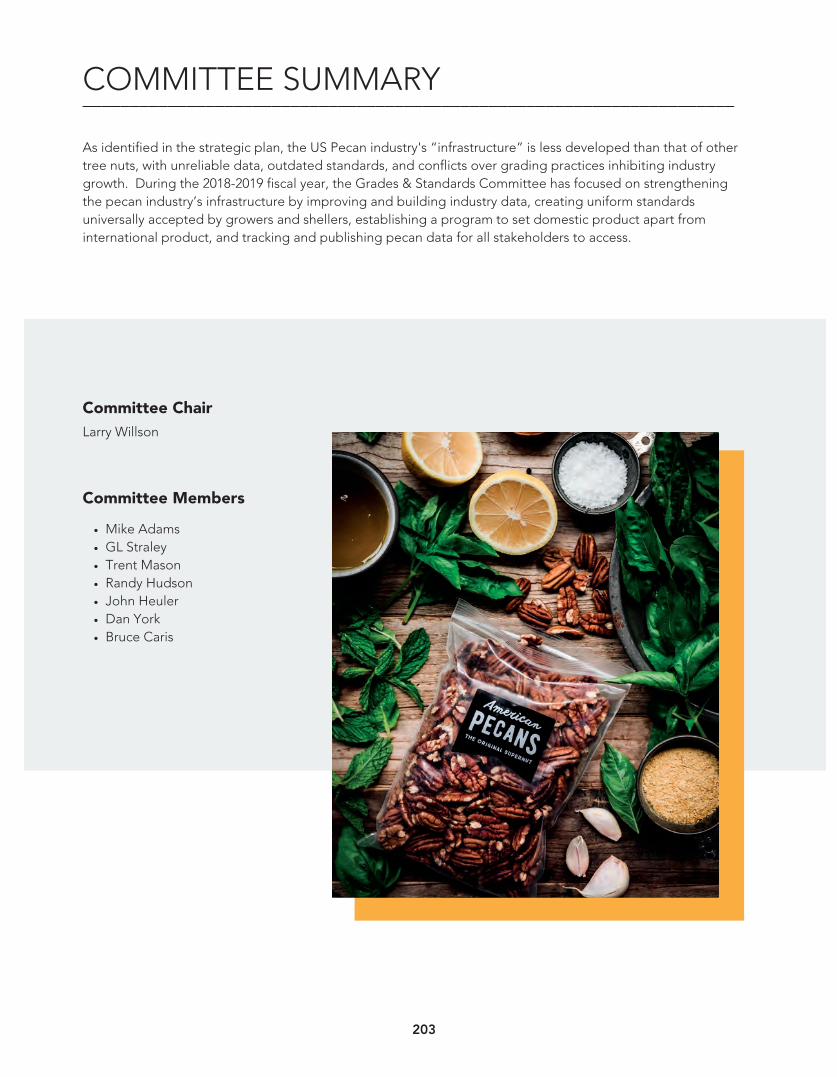
203
As identified in the strategic plan, the US Pecan industry's “infrastructure” is less developed than that of othertree nuts, with unreliable data, outdated standards, and conflicts over grading practices inhibiting industrygrowth. During the 2018-2019 fiscal year, the Grades & Standards Committee has focused on strengtheningthe pecan industry’s infrastructure by improving and building industry data, creating uniform standardsuniversally accepted by growers and shellers, establishing a program to set domestic product apart frominternational product, and tracking and publishing pecan data for all stakeholders to access.
COMMITTEE SUMMARY_____________________________________________________________________
Mike AdamsGL StraleyTrent MasonRandy HudsonJohn HeulerDan YorkBruce Caris
Committee Chair
Committee Members
Larry Willson

204
The original version of the voluntary U.S. standardsfor both in shell and shelled meats have beenutilized in the pecan industry for over 40 years. TheUnited States Standards for Grades of ShelledPecans (83 FR 50475) has been in effect since July15, 1969 and the United States Standards for Gradesof Pecans in the Shell (83 FR 50475) has been ineffect since October 15, 1976. The first revision to the pecan standards waseffective on December 10, 2018. USDA amendedboth standards by replacing the term “midget” with“extra small” in the Shelled Pecan standards andremoving references to plastic models of pecankernels and information on where the colorstandards may be examined from both standards.Prior to this amendment, no revisions or changeshad been made to either of the standards.
In 2018-2019 fiscal year, the American Pecan Council(APC) approved to update both set of standards inorder to make the language consistent with oneanother and streamline the classifications to thecurrent market grades. The approved standards areincluded on the next page.
The U.S. voluntary standards for grades of pecans inthe Shell and U.S. grades of Shelled pecans havebeen submitted to USDA and are awaiting approvalto be issued under the authority of the AgriculturalMarketing Act of 1946, which provides for thedevelopment of official U.S. grades to designatedifferent levels of quality. APC will send the officialversion of the standards to industry once they arepublished in the Federal Register.
UPDATED GRADES & STANDARDS_____________________________________________________________________

205
The original version of the voluntary U.S. standardsfor both in shell and shelled meats have beenutilized in the pecan industry for over 40 years. TheUnited States Standards for Grades of ShelledPecans (83 FR 50475) has been in effect since July15, 1969 and the United States Standards for Gradesof Pecans in the Shell (83 FR 50475) has been ineffect since October 15, 1976. The first revision to the pecan standards waseffective on December 10, 2018. USDA amendedboth standards by replacing the term “midget” with“extra small” in the Shelled Pecan standards andremoving references to plastic models of pecankernels and information on where the colorstandards may be examined from both standards.Prior to this amendment, no revisions or changeshad been made to either of the standards.
In 2018-2019 fiscal year, the American Pecan Council(APC) approved to update both set of standards inorder to make the language consistent with oneanother and streamline the classifications to thecurrent market grades. The approved standards areincluded on the next page.
The U.S. voluntary standards for grades of pecans inthe Shell and U.S. grades of Shelled pecans havebeen submitted to USDA and are awaiting approvalto be issued under the authority of the AgriculturalMarketing Act of 1946, which provides for thedevelopment of official U.S. grades to designatedifferent levels of quality. APC will send the officialversion of the standards to industry once they arepublished in the Federal Register.
UPDATED GRADES & STANDARDS_____________________________________________________________________
DRAFT Standards for Grades of Pecans in the Shell Effective ____________
Draft 07/03/2019
1 | P a g e
Definitions §51.---- Well cured §51.---- Moisture content §51.---- Well developed §51.---- Fairly well developed §51.---- Poorly developed §51.---- Uniform in color §51.---- Fairly uniform in color §51.---- Inedible kernels §51.---- Loose extraneous or foreign material §51.---- Rancidity §51.---- Damage §51.---- Serious damage Size Classification §51.---- Size Classification table Grades & Grade Classifications §51.---- Premier §51.---- Fancy §51.---- Choice §51.---- Standard Color Classifications §51.---- Kernel Color Classifications Tolerances for Defects §51.---- Tolerances for defects Sampling §51.---- Sampling procedure

206
DRAFT Standards for Grades of Pecans in the Shell Effective ____________
Draft 07/03/2019
2 | P a g e
Definitions §51. ---- Well Cured “Well cured” means that the kernel separates freely from the shell, breaks cleanly when bent without splintering shattering, or loosening the skin; and the kernel appears to be in good shipping or storage condition as to moisture content. §51. ---- Moisture Content For international shipments, moisture content should be no more than 4.5%. For domestic shipments, moisture content should be no more than 6%. §51. ---- Well developed “Well developed” means that the kernel is full-meated throughout its width and length. (see Photos) §51. ---- Fairly well developed “Fairly well developed” means that the kernel is full-meated in over fifty percent of the kernel’s width and length. (See Photos) §51. ---- Poorly developed “Poorly developed” means that the kernel is full-meated in less than twenty-five percent of its width and length. (See Photos) §51. ---- Uniform in color “Uniform in color” means that the shells do not show sufficient variation in color to materially detract from the general appearance of the lot and that 95 percent or more of the kernels in the lot have skin color within the range of one or two-color classifications. §51. ---- Fairly uniform in color “Fairly uniform in color” means that the shells do not show sufficient variation in color to materially detract from the general appearance of the lot and that 85 percent or more of the kernels in the lot have skin color within the range of one or two-color classifications. §51.---- Inedible Kernels “Inedible kernels” means that the kernel or pieces of kernels are rancid, moldy, decayed, injured by insects or otherwise unsuitable for human consumption. §51.---- Loose extraneous or foreign material “Loose extraneous or foreign material” means loose hulls, empty broken shells, rocks, wood, glass, plastic or any substance other than pecans in the shell or pecan kernels. §51. ---- Rancidity “Rancidity” refers to the tendency of the oil in a pecan kernel to become tainted as a result of oxidation or hydrolysis. While there is no definitive measure to determine rancidity, the tendency of the kernel to become rancid can be evaluated by testing the kernel’s peroxide and

207
DRAFT Standards for Grades of Pecans in the Shell Effective ____________
Draft 07/03/2019
3 | P a g e
free-fatty acid values. Peroxide values should be less than 5 mEq/kg. Free Fatty Acid should be less than 1%. §51. ---- Damage “Damage” means any specific defect described in this section; or an equally objectionable variation of any one of these defects, or any other defect, or any combination of defects, which materially detracts from the appearance or the edible or marketing quality of the individual portion of the kernel or of the lot as a whole. The following defects should be considered as damage:
(a) Adhering hull material or dark stains affecting an aggregate of more than 5 percent of the surface of the individual shell;
(b) Adhering material from inside the shell when firmly attached to more than one-third of the outer surface of the kernel and contrasting in color with the skin of the kernel;
(c) Split or cracked shells when the shell is spread apart or will spread upon application of slight pressure;
(d) Broken shells when any portion of the shell is missing; (e) Kernel which is not well cured; (f) Kernel which is “dark amber” or darker in color; (g) Kernel having more than one dark kernel spot, or one dark kernel spot more that one-
eighth inch (3 mm) in greatest dimension; (h) Shriveling when the surface of the kernel is very conspicuously wrinkled; (i) Internal flesh discoloration of a medium shade of gray or brown extending more than
one-fourth inch (6 mm) lengthwise beneath the center ridge, or any equally objectionable amount in other portions of the kernel: or lesser areas of dark discoloration affecting the appearance to an equal or greater extent; and,
(i) Poorly developed kernel. (See Photos) §51. ---- Serious damage “Serious damage” means any specific defect described in this section; or an equally objectionable variation of any one of these defects, or any other defect, or any combination of defects, which seriously detracts from the appearance or the edible or marketing quality of the individual portion of kernel or of the lot as a whole. The following defects shall be considered as serious damage:
(a) Adhering hull material or dark stains affecting an aggregate of more than 20 percent of the surface of the individual shell;
(b) Broken shells when the missing portion of the shell is greater in area than a circle one-fourth inch (6 mm) in diameter;
(c) Worm holes when penetrating the shell; (d) Rancidity when the kernel is distinctly rancid to the taste. Staleness of flavor shall
not be classed as rancidity; (e) Mold, on the surface or inside the kernel, which is plainly visible without
magnification; (f) Decay affecting any portion of the kernel; (g) Insects, web, frass or any distinct evidence of insect feeding on the kernel;

208
DRAFT Standards for Grades of Pecans in the Shell Effective ____________
Draft 07/03/2019
4 | P a g e
(h) Kernel spots when more than three dark spots on either half of the kernel, or when any dark kernel spot or the aggregate of two or more spots on one of the halve of the kernels affects more than 10 percent of the surface;
(i) Dark discoloration of the skin which is darker than “dark amber over more than 25% of the outer surface of the kernel;
(j) Internal flesh discoloration of a dark shade extending more than one-third the length of the kernel beneath the ridge, or an equally objectionable amount of dark discoloration in other portions of the kernel; and
(k) Undeveloped kernels having practically no food value, or which are blank (complete shell containing no kernel).
§51.---- Size Classification Table
Size of pecans may be specified in connection with the grade in accordance with one of the following classifications. To meet the requirements for any one of these classifications, the lot must conform to both the specified number of nuts per pound and the weight of the 10 smallest nuts per 100-nut sample.
Size Classification
Number of Nuts per Pound
Minimum Weight of the 10 Smallest Nuts per 100-Nut
Sample Jumbo 55 or less In each classification, the 10
smallest nuts per 100 must weight at least 7% of the total weight of a 100-nut sample
Extra Large 56 to 63 Large 64 to 77
Medium 78 to 100 Small 101 +
Grades and Grade Classifications
§51.---- Premier The highest quality, all product graded as Premier shall meet the following standards: (a) For quality: (1) Well cured;
(2) Kernels are well developed; (3) Both Shell and Kernels are uniform in color;
(4) Kernels not darker than “light” skin color. (5) Free from damage or serious damage by any cause; and (6) Comply with tolerances for defects (see §51.1404a) §51. ---- Fancy The second highest quality, all product graded as Fancy shall meet the following standards: (a) For quality: (1) Well cured;

209
DRAFT Standards for Grades of Pecans in the Shell Effective ____________
Draft 07/03/2019
5 | P a g e
(2) Kernels are well developed to fairly well developed; (3) Both Shell and Kernels are uniform in color;
(4) Kernels not darker than “light amber” skin color. (5) Free from damage or serious damage by any cause; and (6) Comply with tolerances for defects (see §51.1404a); and, §51. ---- Choice The third highest quality, Choice product shall meet the following standards: (a) For quality: (1) Well cured;
(2) Kernels are fairly well to poorly developed; (3) Both Shell and Kernels are fairly uniform in color;
(4) Kernels are not darker than “amber” skin color. (5) Comply with tolerances for defects (see §51.1404a); and, §51. ---- Standard The lowest quality product, Standard product shall meet the following standards: (a) For quality: (1) Well cured;
(2) No requirement for fullness of kernel (3) No requirement for uniformity of color
(4) May contain kernels dark-amber or darker in skin color. (5) Increased tolerances for defects (see §51.1404b); and, §51.---- Color classifications. (a) The skin color of pecan kernels may be described in terms of the color classifications provided in this section. When the color of kernels in a lot generally conforms to the “light” or “light amber” classification, that color classification may be used to describe the lot in connection with the grade.
(1) “Light” means that the kernel is mostly golden color or lighter, with not more than 25 percent of the surface darker than golden, and none of the surface darker than light brown. (2) “Light amber” means that the kernel has more than 25 percent of its surface light brown, but not more than 25 percent of the surface darker than light brown, and none of the surface darker than medium brown. (3) “Amber” means that the kernel has more than 25 percent of the surface medium brown, but not more than 25 percent of the surface darker than medium brown, and none of the surface darker than dark brown (very dark-brown or blackish-brown discoloration). (4) “Dark amber” means that the kernel has more than 25 percent of the surface dark brown, but not more than 25 percent of the surface darker than dark brown (very dark-brown or blackish-brown discoloration).

210
DRAFT Standards for Grades of Pecans in the Shell Effective ____________
Draft 07/03/2019
6 | P a g e
Tolerances for Defects §51.1404 Tolerances for defects. In order to allow for variations incident to proper grading and handling in each of the foregoing grades, the following tolerances, by weight, are provided as specified: (a) For Premier, Fancy and Choice grades:
(1) For shell defects, by count (i) 5 percent for pecans with damaged shells, including therein not more than 2 percent for shells which are seriously damaged.
(2) For kernel defects, by count (i) 12 percent for pecans with kernels which fail to meet the requirements for the grade or any specified color classification including herein not more than 7 percent for kernels which are seriously damaged: Provided, that not more than 6 percent shall be allowed for kernels which are rancid, moldy, decayed or injured by insects: And provided further, that included in this 6 percent tolerance not more than one-half of one percent shall be allowed for pecans with live insects inside the shell.
(b) For Standard grades:
(1) For shell defects, by count (i) 10 percent for pecans with damaged shells, including therein not more than 3 percent for shells which are seriously damaged.
(2) For kernel defects, by count (i) 30 percent for pecans with kernels which fail to meet the requirements for Premier, Fancy or Choice grades including herein not more than 10 percent for kernels which are seriously damaged: Provided, that not more than 7 percent shall be allowed for kernels which are rancid, moldy, decayed or injured by insects: And provided further, that included in this 7 percent tolerance not more than one-half of one percent shall be allowed for pecans with live insects inside the shell.
§51.---- Sampling In order to standardize the minimum sampling requirements, samples of pecans shall be taken at random from a composite sample drawn throughout the lot. The determination of edible kernel count, kernel development, color and moisture shall be based on a minimum sample of 500 grams of in-shell pecans after the sample is weighed and shelled with edible appearing half kernels and pieces being separated from the shell, center wall, other non-kernel material and inedible kernels and pieces. The grader will identify the amount of premier, fancy, choice and amber kernels as well as the amount of inedible material, kernels containing rot, mold insect damage and any other defects as enumerated in §51.----.
Upon the completion of the American Pecan Council’s (APC) Strategic Planning Process, the APC, with thehelp of the Boston Consulting Group (BCG), identified five main areas of change and opportunity for theindustry. One component—“the need to modernize the industry”—led the Council to recommend andapprove the vital development of a quality assurance program. Consequently, the APC has partnered withKCoe Isom to develop this quality assurance program. Phase 1 will involve a stakeholder survey, designed togather information on industry priorities, challenges, and key items to address in order to establish a qualityassurance program that is highly beneficial to industry members. The feedback we will receive from this surveywill be utilized to inform the development of the voluntary industry-wide standard in Phase 2 to ensure thequality assurance program is YOUR program. As it is a lengthy process to establish and fully implement theprogram, APC will continue to update industry on the program’s progress.
QUALITY ASSURANCE PROGRAM_____________________________________________________________________

211
Upon the completion of the American Pecan Council’s (APC) Strategic Planning Process, the APC, with thehelp of the Boston Consulting Group (BCG), identified five main areas of change and opportunity for theindustry. One component—“the need to modernize the industry”—led the Council to recommend andapprove the vital development of a quality assurance program. Consequently, the APC has partnered withKCoe Isom to develop this quality assurance program. Phase 1 will involve a stakeholder survey, designed togather information on industry priorities, challenges, and key items to address in order to establish a qualityassurance program that is highly beneficial to industry members. The feedback we will receive from this surveywill be utilized to inform the development of the voluntary industry-wide standard in Phase 2 to ensure thequality assurance program is YOUR program. As it is a lengthy process to establish and fully implement theprogram, APC will continue to update industry on the program’s progress.
QUALITY ASSURANCE PROGRAM_____________________________________________________________________

212
Project Summary
PRIVATE & CONFIDENTIAL – NOT FOR PUBLIC DISTRIBUTION
Appendix A: About Us
K·Coe Isom is a national food and agricultural consulting and business advisory company unlike any other. K·Coe Isom has an over 85-year history working with and for production agriculture and food companies. We are national experts in financial and business consulting, conservation, public policy, and sustainability. The firm serves over 2,600 businesses across the entire food-ag supply chain, from producers to processors that support the industry. Our firm works directly with many growers, helping them be successful in their farm businesses. With a deep history serving growers in the tree nut industry, we are deeply embedded throughout the U.S. K·Coe Isom helps sustain and grow food and ag operations in fluctuating conditions—weather, commodity price volatility, land values, and economic pressures. We make sure these businesses are strong for the next generation. In addition, we know that consumers are taking note of how products are produced and sold and businesses are increasingly pressured to track and report on sustainability metrics.
WE KNOW SUSTAINABLE FOOD AND AGRICULTURE SYSTEMS. We are experts in food and agricultural supply chain sustainability. But more importantly, we are “grounded,” and that makes all the difference. Let’s face it, sustainability is different on the farm. Biological systems and weather can’t always be predicted and controlled. Agricultural operators have special business needs and challenges. We know that and we get it. Our firm has worked on cutting-edge agricultural industry-wide sustainability efforts, advised non-governmental organizations and food companies, as well as worked with specific commodities and individual operations. Our firm specializes in sustainability solutions that can actually be implemented on individual operations, within organizations, or across an entire supply-chain or industry. Our Firm clients range from individual farming operations to TThhee IInnnnoovvaattiioonn CCeenntteerr ffoorr UU..SS.. DDaaiirryy,, CCaarrggiillll,, UUnniitteedd DDaaiirryymmeenn ooff AArriizzoonnaa,, BBlluuee DDiiaammoonndd GGrroowweerrss,, KKeelllloogggg CCoommppaannyy,, WWaallmmaarrtt,, NNaattiioonnaall MMiillkk PPrroodduucceerrss FFeeddeerraattiioonn,, tthhee UU..SS.. DDeeppaarrttmmeenntt ooff AAggrriiccuullttuurree,, VVaannnn BBrrootthheerrss,, TT && PP FFaarrmmss,, BBuurrrreessoonn FFaarrmmss,, and many others. We have relationships with industry experts, civil society organizations, producers and food companies that helps us ground-truth strategies that don’t show up in research papers. This makes us different. WE DEVELOP MEANINGFUL SUSTAINABILITY SOLUTIONS. Combining our boots-on-the-ground experience with extensive financial and business know-how, you can see why we successfully guide growers, industry groups, agribusinesses, and food companies toward meaningful sustainability frameworks that produce higher profitability and long-term viability. Just like you, we have the passion, good sense, and staying power to work in one of the world’s most important industries. Some of the highest value help we can give you includes:
SSOOLLUUTTIIOONNSS DDRRIIVVEENN.. We work in complex supply chains, along-side growers, producers, stakeholders, and customers, to bring practical sustainability solutions to the table. Our experts provide solutions that not only measure sustainability, but do so in a way that brings value above and beyond customer reporting. WWee bbeelliieevvee ssuussttaaiinnaabbiilliittyy iiss mmoorree tthhaann aa cchheecckklliisstt..

213
Project Summary
PRIVATE & CONFIDENTIAL – NOT FOR PUBLIC DISTRIBUTION
• AAsskkiinngg ggoooodd qquueessttiioonnss.. Your answers determine the strategies for appropriately measuring and communicating sustainability information on behalf of your business and industry.
• GGeettttiinngg tthhee rriigghhtt iinnffoorrmmaattiioonn.. True value is not in sustainability data; it is in what you do with it. We help food and agriculture identify where the industry or business should be in the future, to help feed a world with 9+ billion people.
• CCaappttuurriinngg aanndd ccrreeaattiinngg vvaalluuee.. We believe sustainability is not just about consumer and customer demands but about creating real business value and opportunities.
WE EDUCATE, INFORM, AND STRATEGIZE. Our experts actively participate in broad multi-stakeholder initiatives in the food and ag sector, such as Field to Market, National Council of Farmer Cooperatives, The Sustainability Consortium, Global Reporting Initiative, Carbon Disclosure Project, Sustainability Accounting Standards Board, U.S. and Global Roundtable on Sustainable Beef, and the Innovation Center for U.S. Dairy Sustainability Council.
OUR PEOPLE MAKE ALL THE DIFFERENCE. Our combined skills in accounting, financial, and sustainability consulting in the food and agriculture supply chain helps our clients navigate through difficult challenges in the marketplace. Because the challenges we face together need us to inspire action and bring people together for common solutions.
Our Key Personnel
Emily Johannes, Director Emily arms food and agricultural businesses and industry groups with valuable tools, plans, and analysis to increase their credibility in the marketplace. She leads K·Coe Isom’s teams to build sustainability programs for growers and food companies, enabling them to capture and report sustainability information to valued customers and the public. Emily has over 15 years of program / project management experience in environmental impact assessment and sustainability within the private and public sectors. Emily served as the Senior Environmental Technical Advisor for the NOAA, overseeing the national environmental and sustainability programs of the agency. Emily holds a M.S. in Ecology and Evolution from the University of Pittsburgh and a B.A. in Zoology from Miami University (OH).
Tommy Irvine, Partner Tommy integrates innovative processes with tax and accounting know-how, delivering measurable results for agriculture and manufacturing businesses, primarily permanent crop operations in the tree nut industries. He focuses on a business’ future financial performance so the owner has more time to devote to activities they do best or enjoy most. He visits facilities and gets to know key people to gain a full picture of the company, and bring advantageous operating structure and tax strategies, employing tools such as IC-DISC and R&D credits. With experience as a university instructor, he analyzes financial results in detail and explains them with utmost clarity. Tommy plays an integral role in establishing healthy business operations while bringing a lighthearted, fresh attitude to any situation.
Lisa Becker, Senior Associate Lisa focuses her time on serving permanent crop clients nationwide. She works closely with tree nut growers to provide business advising strategies and tax services. Inspired to drive innovation throughout our food system, Lisa lends her credentials as a CPA to bring value to clients seeking sustainability verification. She combines her skills in accounting, business advising and strategic planning for growers with her passion for sustainability consulting. This results in successful, long-term and value-add sustainability programs for our clients. Lisa is certified in the Global Reporting Initiative’s sustainability reporting framework. She earned her M.S. in Accounting and her B.S. in Business Administration from California Polytechnic State University, San Luis Obispo.

214
DATA & STATISTICS
215
DATA & STATISTICS

216

217
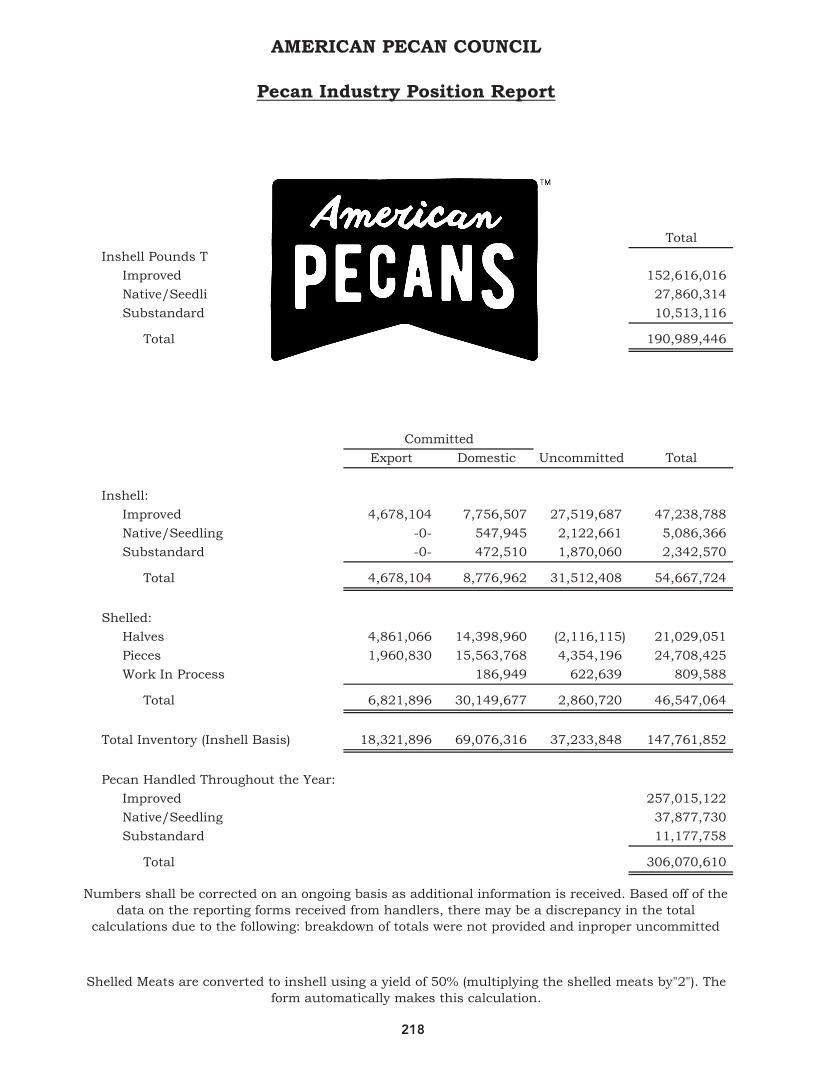
218
AMERICAN PECAN COUNCIL
Pecan Industry Position Report
For the Crop Year Ended August 31, 2017
TotalInshell Pounds Transferred:
Improved 152,616,016 Native/Seedling 27,860,314 Substandard 10,513,116
Total 190,989,446
Export Domestic Uncommitted Total
Inshell:Improved 4,678,104 7,756,507 27,519,687 47,238,788 Native/Seedling -0- 547,945 2,122,661 5,086,366 Substandard -0- 472,510 1,870,060 2,342,570
Total 4,678,104 8,776,962 31,512,408 54,667,724
Shelled:Halves 4,861,066 14,398,960 (2,116,115) 21,029,051 Pieces 1,960,830 15,563,768 4,354,196 24,708,425 Work In Process 186,949 622,639 809,588
Total 6,821,896 30,149,677 2,860,720 46,547,064
Total Inventory (Inshell Basis) 18,321,896 69,076,316 37,233,848 147,761,852
Pecan Handled Throughout the Year:Improved 257,015,122 Native/Seedling 37,877,730 Substandard 11,177,758
Total 306,070,610
INTER-HANDLER TRANSFERS OF PECANS
Committed
YEAR-END INVENTORY
Numbers shall be corrected on an ongoing basis as additional information is received. Based off of the data on the reporting forms received from handlers, there may be a discrepancy in the total
calculations due to the following: breakdown of totals were not provided and inproper uncommitted i t l l ti
Shelled Meats are converted to inshell using a yield of 50% (multiplying the shelled meats by"2"). The form automatically makes this calculation.

219
AMERICAN PECAN COUNCIL
Pecan Industry Position Report
For the Crop Year Ended August 31, 2017
inventory calculations.
§986.20 Inventory totals do not include pecans warehoused by growers.
Shelled Meats are converted to inshell using a yield of 50% (multiplying the shelled meats by"2"). The form automatically makes this calculation.

220
AMERICAN PECAN COUNCIL
Pecan Industry Position Report
For the Crop Year Ended August 31, 2018
TotalInshell Pounds Transferred:
Improved 113,976,572 Native/Seedling 16,193,194 Substandard 17,017,579
Total 147,187,345
Export Domestic Uncommitted Total
Inshell:Improved -0- 12,453,104 25,248,158.00 37,701,262 Native/Seedling -0- 2,004,305 4,945,834.00 6,950,139 Substandard -0- 957,471 1,346,546.00 2,304,017
Total -0- 15,414,880 31,540,538 46,955,418
Shelled:Halves 5,457,720 16,465,052 (1,037,448) 20,885,324 Pieces 2,450,530 20,837,600 15,655,964 38,944,094 Work In Process -0- 586,408 350,547 936,955
Total 7,908,250 37,889,060 14,969,063 60,766,373
Total Inventory (Inshell Basis) 15,816,500 91,193,000 61,478,664 168,488,164
Improved 261,524,162 Native/Seedling 42,549,603 Substandard 22,328,434
Total 326,402,198
Committed
YEAR-END INVENTORY
INTER-HANDLER TRANSFERS OF PECANS
U.S. PECAN HANDLED THROUGHOUT THE YEAR
The preliminary report regarding the 2017 crop year is based upon industry receipts, and may be subject to change as more information is provided.
§986.20 Inventory totals do not include pecans warehoused by growers.
Shelled Meats are converted to inshell using a yield of 50% (multiplying the shelled meats by"2"). The form automatically makes this calculation.

221
AMERICAN PECAN COUNCIL
Shipments and Inventory on Hand
For the Year Ended August 31, 2018
TotalNet Shipments:
Shelled Meats 102,690,925 Inshell 90,403,683
Total Net Shipments (Inshell Basis) 295,785,533
Total Pecans in Inventory:Shelled Meats 54,041,649 Inshell 31,999,774
Total (Inshell Basis) 140,083,072
Commitments to Ship:Shelled Meats
Domestic-Shelled Meats 34,479,550 Export-Shelled Meats 8,449,562
Total Meats 42,929,112
InshellDomestic-Inshell 262,550 Export-Inshell
Total Inshell 262,550
Less Contracts to PurchaseShelled Meats (4,875) Inshell
Total Commitments (Inshell Basis) 86,130,524

222
AMERICAN PECAN COUNCIL
Mexico Exports and Foreign Purchases
For the Crop Year Ended August 31, 2018
TotalInshell Exported for Shelling:
Mexico 20,057,645 Total Inshell Exported for Shelling 20,057,645
Shelled Meats - Produced in U.S. Inshell Returned to U.S.:Mexico 10,396,353
Total Shelled Meats - Produced in U.S. Inshell Returned to U.S. 10,396,353
TotalShelled Meats:
Country of Origin:Australia 101,770 Mexico 11,192,858 South Africa 192,470
Total Shelled Meats 11,487,098
Inshell:Country of Origin:
Australia 44,063 Mexico 49,746,846 South Africa -
Total Inshell 49,790,909
Total (Inshell Basis)Australia 247,603 Mexico 72,132,562 South Africa 384,940
Total (Inshell Basis) 72,765,105
INSHELL PECANS EXPORTED TO MEXICO FOR SHELLING AND RETURNED TO U.S. AS SHELLED MEATS
PECANS PURCHASED OUTSIDE THE U.S. BY U.S. HANDLERS
The preliminary report regarding the 2017 crop year is based upon industry receipts, and may be subject to change as more information is provided.

223
AM
ER
ICA
N P
EC
AN
CO
UN
CIL
Des
tina
tion
Rep
ort
For
the
Cro
p Y
ear
End
ed A
ugus
t 31
, 201
8
Wor
ld R
egio
n
Des
tin
atio
nS
hel
led
Insh
ell
Su
b-S
tan
dard
Tota
l (In
shel
l Bas
is)
Afr
ica
Alg
eria
-0-
-0
-
-0-
-0
-
Egy
pt4,
680
-0-
-0
-
9,36
0
To
tal A
fric
a4,
680
-0-
-0
-
9,36
0
Asi
a Ch
ina
390,
660
3,
397,
555
-0-
4,
178,
875
Hon
g K
ong
247,
830
40
,427
,223
-0
-
40,9
22,8
83
Indi
a49
,500
-0
-
-0-
99
,000
Ja
pan
431,
850
-0
-
-0-
86
3,70
0
Ku
wai
t14
4,69
0
-0-
-0
-
289,
380
M
alay
sia
450
-0
-
-0-
90
0
Phili
ppin
es3,
360
-0-
-0
-
6,72
0
Q
atar
6,63
0
-0
-
-0-
13
,260
S
inga
pore
27,7
20
-0-
-0
-
55,4
40
Sou
th K
orea
441,
690
-0
-
-0-
88
3,38
0
Thai
lan
d15
0
-0-
-0
-
300
Ta
iwan
178,
500
25
,000
-0
-
382,
000
V
ietn
am50
,195
3,
604,
834
-0-
3,
705,
224
Tota
l Asi
a1,
973,
225
47,4
54,6
12
-0-
51
,401
,062
2017
- 2
018
- YT
DS
epte
mbe
r 1
thro
ugh
Au
gust
31
2018
The
prel
imin
ary
repo
rt r
egar
din
g th
e 20
17 c
rop
year
is b
ased
upo
n in
dust
ry r
ecei
pts,
an
d m
ay b
e su
bjec
t to
ch
ange
as
mor
e in
form
atio
n is
pro
vide
d.

224
AM
ER
ICA
N P
EC
AN
CO
UN
CIL
Des
tina
tion
Rep
ort
For
the
Cro
p Y
ear
End
ed A
ugus
t 31
, 201
8
Wor
ld R
egio
n
Des
tin
atio
nS
hel
led
Insh
ell
Su
b-S
tan
dard
Tota
l (In
shel
l Bas
is)
2017
- 2
018
- YT
DS
epte
mbe
r 1
thro
ugh
Au
gust
31
2018
Au
stra
lia/O
cean
iaA
ust
ralia
130,
320
-0
-
-0-
26
0,64
0
Tota
l Au
stra
lia13
0,32
0
-0-
-0
-
260,
640
Eu
rope
Au
stri
a49
,800
-0
-
-0-
99
,600
B
elgi
um
338,
310
-0
-
-0-
67
6,62
0
Cze
ch R
epu
blic
23,5
50
-0-
-0
-
47,1
00
Den
mar
k83
0,04
0
-0-
-0
-
1,66
0,08
0
Fr
ance
2,06
2,77
0
-0
-
-0-
4,
125,
540
Ger
man
y4,
778,
370
-0-
-0
-
9,55
6,74
0
G
reec
e46
,800
-0
-
-0-
93
,600
It
aly
82,5
00
174,
000
-0
-
339,
000
Li
thu
ania
244,
500
-0
-
-0-
48
9,00
0
Net
her
lan
ds4,
200,
690
-0-
-0
-
8,40
1,38
0
Nor
way
81,6
00
-0-
-0
-
163,
200
Po
lan
d22
,800
-0
-
-0-
45
,600
Po
rtu
gal
10,0
80
-0-
-0
-
20,1
60
Ru
ssia
25,0
80
-0-
-0
-
50,1
60
Spa
in93
,600
-0
-
-0-
18
7,20
0
Sw
eden
251,
580
-0
-
-0-
50
3,16
0
Sw
itze
rlan
d49
7,76
0
-0-
-0
-
995,
520
U
nit
ed K
ingd
om3,
378,
030
311,
296
-0
-
7,06
7,35
6
To
tal E
uro
pe17
,017
,860
48
5,29
6
34,5
21,0
16
The
prel
imin
ary
repo
rt r
egar
din
g th
e 20
17 c
rop
year
is b
ased
upo
n in
dust
ry r
ecei
pts,
an
d m
ay b
e su
bjec
t to
ch
ange
as
mor
e in
form
atio
n is
pro
vide
d.

225
AM
ER
ICA
N P
EC
AN
CO
UN
CIL
Des
tina
tion
Rep
ort
For
the
Cro
p Y
ear
End
ed A
ugus
t 31
, 201
8
Wor
ld R
egio
n
Des
tin
atio
nS
hel
led
Insh
ell
Su
b-S
tan
dard
Tota
l (In
shel
l Bas
is)
2017
- 2
018
- YT
DS
epte
mbe
r 1
thro
ugh
Au
gust
31
2018
Mid
dle
Eas
tIs
rael
1,08
6,15
0
-0
-
-0-
2,
172,
300
Jord
an-0
-
-0-
-0
-
-0-
Le
ban
on65
,520
-0
-
-0-
13
1,04
0
Sau
di A
rabi
a20
3,42
0
-0-
-0
-
406,
840
Tu
rkey
24,0
00
-0-
-0
-
48,0
00
Un
ited
Ara
b E
mir
ates
282,
060
-0
-
-0-
56
4,12
0
Tota
l Mid
dle
Eas
t1,
661,
150
-0-
-0
-
3,32
2,30
0
Nor
th A
mer
ica
Can
ada
5,09
1,64
0
42
,750
-0
-
10,2
26,0
30
Mex
ico
483,
954
15
,179
,750
63
9,89
6
16,7
87,5
54
Tota
l Nor
th A
mer
ica
5,57
5,59
4
15
,222
,500
63
9,89
6
27,0
13,5
84
Sou
th A
mer
ica
Col
um
bia
7,56
0
-0
-
-0-
15
,120
Pe
ru12
4,02
0
-0-
-0
-
248,
040
To
tal S
outh
Am
eric
a13
1,58
0
-0-
-0
-
263,
160
Gra
nd
Tota
l Exp
orts
26,4
94,4
09
63,1
62,4
08
639,
896
11
6,79
1,12
2
The
prel
imin
ary
repo
rt r
egar
din
g th
e 20
17 c
rop
year
is b
ased
upo
n in
dust
ry r
ecei
pts,
an
d m
ay b
e su
bjec
t to
ch
ange
as
mor
e in
form
atio
n is
pro
vide
d.

226
AMERICAN PECAN COUNCIL
Pecans Received from Own Account
For the Crop Year Ended August 31, 2018
Variety Name Total PoundsInshell
Blends/Mixed Budded 68,540,987 Bradley 834,170 Caddo 524,154 Cape Fear 2,834,863 Cheyenne 339,203 Creek 140,109 Desired 18,282,406 Desirable Type 1,498,000 Eastern Schley 2,993,909 Elliott 1,980,582 Excel 687,741 Moneymaker 2,222,170 Pawnee 3,502,464 Stuart 19,064,886 Sumner 3,839,395 Western Schley 96,573,494 Wichita 10,630,593 Other 21,221,950
Native/Seedling 20,463,200 Substandard 54,100,987
Total Varieties 330,275,263
The preliminary report regarding the 2017 crop year is based upon industry receipts, and may be subject to change as more information is provided.
Variance in data may occur due to lack of variety breakdown provided. Data may be revised or updated as more information is provided.

227
AMERICAN PECAN COUNCIL
Shipments and Inventory on Hand
For the One Month Ended September 30, 2018
TotalShipments:
Shelled Meats:Retail/Grocery/Export 10,722,533 Inter-handler Transfers Shipped 798,727 Inter-handler Transfers Received (703,060)
Total Shelled Meats 10,818,200
Inshell:Retail/Grocery/Export 339,103 Inter-handler Transfers Shipped 5,442,327 Inter-handler Transfers Received (1,181,248)
Total Inshell Meats 4,600,182
Total Shipments (Inshell Basis) 26,236,582
Total Pecans in Inventory:Shelled Meats 53,769,375 Inshell 39,494,271
Total (Inshell Basis) 147,033,021
Commitments to Ship:Meats:
Domestic-Shelled Meats 36,081,779 Export-Shelled Meats 8,998,263
Total Meats 45,080,042
Inshell:Domestic-Inshell 5,697,351 Export-Inshell 5,344,532
Total Inshell 11,041,883
Less: Contracts to Purchase:Shelled Meats -0- Inshell -0-
Total Commitments (Inshell Basis) 101,201,967
Data may be revised or updated as more information is provided.§986.20 Inventory totals do not include pecans warehoused by growers.
Shelled Meats are converted to inshell using a yield of 50% (multiplying the shelled meats by"2"). The form automatically makes this calculation.

228
AMERICAN PECAN COUNCIL
Mexico Exports and Foreign Purchases
For the One Month Ended September 30, 2018
TotalInshell Exported for Shelling:
Mexico 4,487,077 Total Inshell Exported for Shelling 4,487,077
Shelled Meats - Produced in U.S. Inshell Returned to U.S.:Mexico 1,799,323
Total Shelled Meats - Produced in U.S. Inshell Returned to U.S. 1,799,323
TotalShelled Meats:
Country of Origin:Mexico 166,650
Total Shelled Meats 166,650
Inshell:Country of Origin:
Mexico 281,364 Total Inshell 281,364
Total (Inshell Basis)Mexico 614,664
Total (Inshell Basis) 614,664
INSHELL PECANS EXPORTED TO MEXICO FOR SHELLING AND RETURNED TO U.S. AS SHELLED MEATS
PECANS PURCHASED OUTSIDE THE U.S. BY U.S. HANDLERS
Shelled Meats are converted to inshell using a yield of 50% (multiplying the shelled meats by"2"). The form automatically makes this calculation.

229
AM
ER
ICA
N P
EC
AN
CO
UN
CIL
Des
tina
tion
Rep
ort
For
the
One
Mon
th E
nded
Sep
tem
ber
30, 2
018
Wor
ld R
egio
n
Des
tin
atio
nS
hel
led
Insh
ell
Su
b-S
tan
dard
Tota
l (In
shel
l Bas
is)
Afr
ica
Alg
eria
-0-
-0
-
-0-
-0
-
E
gypt
-0-
-0
-
-0-
-0
-
To
tal A
fric
a-0
-
-0-
-0
-
-0-
Asi
a Ch
ina
40,5
00
110,
231
-0
-
191,
231
H
ong
Kon
g-0
-
-0-
-0
-
-0-
Indi
a-0
-
-0-
-0
-
-0-
Japa
n22
,500
-0
-
-0-
45
,000
Ku
wai
t-0
-
-0-
-0
-
-0-
Mal
aysi
a-0
-
-0-
-0
-
-0-
Phili
ppin
es-0
-
-0-
-0
-
-0-
Qat
ar-0
-
-0-
-0
-
-0-
Sin
gapo
re-0
-
-0-
-0
-
-0-
Sou
th K
orea
99,0
00
-0-
-0
-
198,
000
Th
aila
nd
-0-
-0
-
-0-
-0
-
Ta
iwan
22,5
00
-0-
-0
-
45,0
00
V
ietn
am45
,000
-0
-
-0-
90
,000
Tota
l Asi
a22
9,50
0
110,
231
-0
-
569,
231
2018
- 2
019
- C
urr
ent
On
e M
onth
En
ded
Sep
tem
ber
30, 2
018
Sh
elle
d M
eats
are
con
vert
ed t
o in
shel
l usi
ng
a yi
eld
of 5
0% (m
ult
iply
ing
the
shel
led
mea
ts b
y"2"
). Th
e fo
rm a
uto
mat
ical
ly
mak
es t
his
cal
cula
tion
.

230
AM
ER
ICA
N P
EC
AN
CO
UN
CIL
Des
tina
tion
Rep
ort
For
the
One
Mon
th E
nded
Sep
tem
ber
30, 2
018
Wor
ld R
egio
n
Des
tin
atio
nS
hel
led
Insh
ell
Su
b-S
tan
dard
Tota
l (In
shel
l Bas
is)
2018
- 2
019
- C
urr
ent
On
e M
onth
En
ded
Sep
tem
ber
30, 2
018
Au
stra
lia/O
cean
iaA
ust
ralia
-0-
-0
-
-0-
-0
-
To
tal A
ust
ralia
-0-
-0
-
-0-
-0
-
Eu
rope
Au
stri
a-0
-
-0-
-0
-
-0-
Bel
giu
m7,
200
-0-
-0
-
14,4
00
C
zech
Rep
ubl
ic9,
000
-0-
-0
-
18,0
00
D
enm
ark
85,0
80
-0-
-0
-
170,
160
Fr
ance
126,
720
-0
-
-0-
25
3,44
0
Ger
man
y23
4,36
0
-0-
-0
-
468,
720
G
reec
e-0
-
-0-
-0
-
-0-
Ital
y-0
-
-0-
-0
-
-0-
Lith
uan
ia44
,100
-0
-
-0-
88
,200
Net
her
lan
ds36
6,81
0
-0-
-0
-
733,
620
N
orw
ay-0
-
-0-
-0
-
-0-
Pola
nd
-0-
-0
-
-0-
-0
-
Po
rtu
gal
-0-
-0
-
-0-
-0
-
R
uss
ia-0
-
-0-
-0
-
-0-
Spa
in60
,720
-0
-
-0-
12
1,44
0
Sw
eden
10,8
00
-0-
-0
-
21,6
00
S
wit
zerl
and
11,7
60
-0-
-0
-
23,5
20
U
nit
ed K
ingd
om44
3,94
0
-0-
-0
-
887,
880
To
tal E
uro
pe1,
400,
490
-0-
-0
-
2,80
0,98
0
Sh
elle
d M
eats
are
con
vert
ed t
o in
shel
l usi
ng
a yi
eld
of 5
0% (m
ult
iply
ing
the
shel
led
mea
ts b
y"2"
). Th
e fo
rm a
uto
mat
ical
ly
mak
es t
his
cal
cula
tion
.
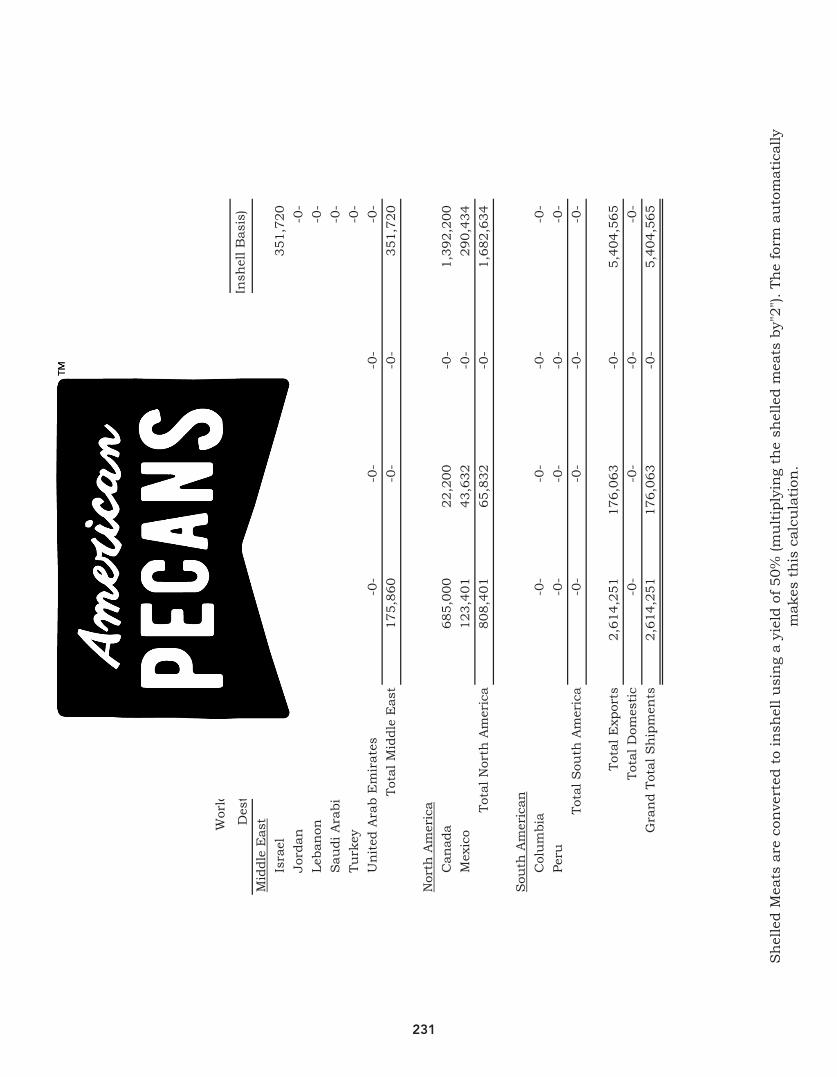
231
AM
ER
ICA
N P
EC
AN
CO
UN
CIL
Des
tina
tion
Rep
ort
For
the
One
Mon
th E
nded
Sep
tem
ber
30, 2
018
Wor
ld R
egio
n
Des
tin
atio
nS
hel
led
Insh
ell
Su
b-S
tan
dard
Tota
l (In
shel
l Bas
is)
2018
- 2
019
- C
urr
ent
On
e M
onth
En
ded
Sep
tem
ber
30, 2
018
Mid
dle
Eas
tIs
rael
175,
860
-0
-
-0-
35
1,72
0
Jord
an-0
-
-0-
-0
-
-0-
Leba
non
-0-
-0
-
-0-
-0
-
S
audi
Ara
bia
-0-
-0
-
-0-
-0
-
Tu
rkey
-0-
-0
-
-0-
-0
-
U
nit
ed A
rab
Em
irat
es-0
-
-0-
-0
-
-0-
Tota
l Mid
dle
Eas
t17
5,86
0
-0-
-0
-
351,
720
Nor
th A
mer
ica
Can
ada
685,
000
22
,200
-0
-
1,39
2,20
0
M
exic
o12
3,40
1
43,6
32
-0-
29
0,43
4
Tota
l Nor
th A
mer
ica
808,
401
65
,832
-0
-
1,68
2,63
4
Sou
th A
mer
ican
Col
um
bia
-0-
-0
-
-0-
-0
-
Pe
ru-0
-
-0-
-0
-
-0-
Tota
l Sou
th A
mer
ica
-0-
-0
-
-0-
-0
-
Tota
l Exp
orts
2,61
4,25
1
17
6,06
3
-0-
5,
404,
565
Tota
l Dom
esti
c-0
-
-0-
-0
-
-0-
Gra
nd
Tota
l Sh
ipm
ents
2,61
4,25
1
17
6,06
3
-0-
5,
404,
565
Sh
elle
d M
eats
are
con
vert
ed t
o in
shel
l usi
ng
a yi
eld
of 5
0% (m
ult
iply
ing
the
shel
led
mea
ts b
y"2"
). Th
e fo
rm a
uto
mat
ical
ly
mak
es t
his
cal
cula
tion
.

232
AMERICAN PECAN COUNCIL
Pecans Received from Own Account
For the One Month Ended September 30, 2018
Variety Name Total PoundsInshell
Blends/Mixed Budded 2,046,809 Bradley -0- Caddo -0- Cape Fear -0- Cheyenne -0- Creek -0- Desirable Type -0- Eastern Schley -0- Elliott -0- Excel -0- Moneymaker -0- Pawnee 80,606 Stuart -0- Sumner -0- Western Schley 967,869 Wichita 225,911 Other 452
Native/Seedling 92,555 Substandard 178,074
Total Varieties 3,592,276
Variance in data may occur due to lack of variety breakdown provided. Data may be revised or updated as more information is provided.

233
Pecan Production
ISSN: 2640-0014
Released March 14, 2019, by the National Agricultural Statistics Service (NASS), Agricultural Statistics Board, United States Department of Agriculture (USDA). Pecan Production Down 27 Percent From Previous Year Utilized production in 2018 totaled 221 million pounds, down 27 percent from 2017. Bearing acreage was estimated at 398,900, down 1 percent from the previous year. The average yield per acre was 555 pounds per acre, down 198 pounds from the previous year. The value of the crop totaled $423 million, down 40 percent from the previous season, with an average annual price of $1.91 per pound. Improved variety pecan production, at 207 million pounds, declined 26 percent from the previous season. Improved variety pecans account for 94 percent of the US total pecan production. Native and seedling variety production totaled 13.9 million pounds, down 47 percent from 2017. New Mexico pecan production surpassed Georgia for the first time since 2006. In Georgia, pecan production was the lowest since 2006. This was the result of Hurricane Michael negatively impacting much of the pecan growing region. In addition, wet conditions in the summer months increased disease pressure and later limited the harvest of nuts blown off trees.

234
2 Pecan Production (March 2019) USDA, National Agricultural Statistics Service
Pecan Bearing Acreage, Yield, Production, Price, and Value – States and United States: 2016-2018
State Bearing acreage Yield per acre 1
2016 2017 2018 2016 2017 2018
(acres) (acres) (acres) (pounds) (pounds) (pounds) Alabama ............................................. Arizona ............................................... California ............................................ Georgia ............................................... Louisiana ............................................ New Mexico ........................................ Oklahoma ........................................... Texas .................................................. United States ......................................
8,900 15,000 3,500
120,000 12,300 40,000 94,000
100,000
393,700
8,400 16,000 3,600
120,000 12,300 43,500 86,000
115,000
404,800
7,500 17,000 3,500
110,000 13,400 45,500 90,000
112,000
398,900
247 1,653 1,648
908 325
1,800 128 390
682
220 1,750 1,389
892 650
2,115 163 426
753
220 1,500 1,380
510 450
1,980 100 250
555
See footnote(s) at end of table. --continued

235
Pecan Production (March 2019) 3 USDA, National Agricultural Statistics Service
Pecan Bearing Acreage, Yield, Production, Price, and Value – States and United States: 2016-2018 (continued)
State Utilized production
2016 2017 2018
(1,000 pounds) (1,000 pounds) (1,000 pounds) Alabama .............................................. Improved ........................................... Native and seedling ........................... Arizona ................................................ Improved ........................................... California ............................................. Improved ........................................... Georgia ............................................... Improved ........................................... Louisiana ............................................. Improved ........................................... Native and seedling ........................... New Mexico ......................................... Improved ........................................... Oklahoma ............................................ Improved ........................................... Native and seedling ........................... Texas .................................................. Improved ........................................... Native and seedling ........................... United States ....................................... Improved ........................................... Native and seedling ...........................
2,200 1,900
300
24,800 24,800
5,770 5,770
109,000 109,000
4,000 1,500 2,500
72,000 72,000
12,000 3,000 9,000
39,000 32,000 7,000
268,770 249,970 18,800
1,850 1,600
250
28,000 28,000
5,000 5,000
107,000 107,000
8,000 3,000 5,000
92,000 92,000
14,000 3,000
11,000
49,000 39,000 10,000
304,850 278,600 26,250
1,650 1,518
132
25,500 25,500
4,830 4,830
56,100 56,100
6,030 2,515 3,515
90,090 90,090
9,000 2,970 6,030
28,000 23,800 4,200
221,200 207,323 13,877
See footnote(s) at end of table. --continued

236
4 Pecan Production (March 2019) USDA, National Agricultural Statistics Service
Pecan Bearing Acreage, Yield, Production, Price, and Value – States and United States: 2016-2018 (continued)
State Price per pound Value of utilized production
2016 2017 2018 2016 2017 2018
(dollars) (dollars) (dollars) (1,000 dollars) (1,000 dollars) (1,000 dollars) Alabama ............................................. Improved ........................................... Native and seedling ........................... Arizona ............................................... Improved ........................................... California ............................................ Improved ........................................... Georgia ............................................... Improved ........................................... Louisiana ............................................ Improved ........................................... Native and seedling ........................... New Mexico ........................................ Improved ........................................... Oklahoma ........................................... Improved ........................................... Native and seedling ........................... Texas .................................................. Improved ........................................... Native and seedling ........................... United States ...................................... Improved ........................................... Native and seedling ...........................
2.030 2.130 1.400
2.710 2.710
2.540 2.540
2.500 2.500
1.540 1.950 1.300
2.960 2.960
2.060 2.670 1.850
2.410 2.540 1.820
2.590 2.660 1.760
1.960 2.030 1.520
2.500 2.500
2.300 2.300
2.400 2.400
1.530 2.000 1.250
2.400 2.400
1.730 2.100 1.630
2.250 2.390 1.680
2.330 2.400 1.580
1.480 1.500 1.230
2.030 2.030
2.000 2.000
1.630 1.630
1.030 1.350 0.800
2.190 2.190
1.660 2.300 1.350
1.740 1.830 1.240
1.910 1.960 1.180
4,467 4,047
420
67,208 67,208
14,656 14,656
272,500 272,500
6,175 2,925 3,250
213,120 213,120
24,660 8,010
16,650
94,020 81,280 12,740
696,806 663,746 33,060
3,628 3,248
380
70,000 70,000
11,500 11,500
256,800 256,800
12,250 6,000 6,250
220,800 220,800
24,230 6,300
17,930
110,010 93,210 16,800
709,218 667,858 41,360
2,439 2,277
162
51,765 51,765
9,660 9,660
91,443 91,443
6,207 3,395 2,812
197,297 197,297
14,972 6,831 8,141
48,762 43,554 5,208
422,545 406,222 16,323
1 Yield is based on utilized production.

237
Information Contacts Listed below are the commodity statisticians in the Crops Branch of the National Agricultural Statistics Service to contact for additional information. E-mail inquiries may be sent to [email protected] Lance Honig, Chief, Crops Branch ....................................................................................................... (202) 720-2127 Jorge Garcia-Pratts, Head, Fruits, Vegetables and Special Crops Section............................................ (202) 720-2127 Vincent Davis – Apricots, Bananas, Cherries, Garlic, Lettuce, Mint, Papaya,
Pears, Strawberries, Tomatoes ................................................................................................... (202) 720-2157 Fleming Gibson – Avocados, Cauliflower, Celery, Citrus, Coffee, Dates,
Figs, Kiwifruit, Nectarines, Olives, Green Peas, Taro, Watermelons ....................................... (202) 720-5412 Greg Lemmons – Blackberries, Blueberries, Boysenberries, Cranberries,
Cucumbers, Potatoes, Pumpkins, Raspberries, Squash, Sugarbeets, Sugarcane, Sweet Potatoes ........................................................................................................ (202) 720-4285
Dan Norris – Artichokes, Austrian Winter Peas, Cantaloupes, Dry Beans, Dry Edible Peas, Honeydews, Lentils, Mushrooms, Peaches, Snap Beans ............................... (202) 720-3250 Daphne Schauber – Bell Peppers, Broccoli, Cabbage, Chile Peppers,
Floriculture, Grapes, Hops, Maple Syrup, Tree Nuts, Spinach ................................................. (202) 720-4215 Joshua Bates– Apples, Asparagus, Carrots, Lima Beans, Onions,
Plums, Prunes, Sweet Corn, Tobacco ........................................................................................ (202) 720-4288
Access to NASS Reports For your convenience, you may access NASS reports and products the following ways:
All reports are available electronically, at no cost, on the NASS web site: www.nass.usda.gov
Both national and state specific reports are available via a free e-mail subscription. To set-up this free
subscription, visit www.nass.usda.gov and click on “National” or “State” in upper right corner above “search” box to create an account and select the reports you would like to receive.
Cornell’s Mann Library has launched a new website housing NASS’s and other agency’s archived reports. The new website, https://usda.library.cornell.edu. All email subscriptions containing reports will be sent from the new website, https://usda.library.cornell.edu. To continue receiving the reports via e-mail, you will have to go to the new website, create a new account and re-subscribe to the reports. If you need instructions to set up an account or subscribe, they are located at: https://usda.library.cornell.edu/help. You should whitelist [email protected] in your email client to avoid the emails going into spam/junk folders.
For more information on NASS surveys and reports, call the NASS Agricultural Statistics Hotline at (800) 727-9540, 7:30 a.m. to 4:00 p.m. ET, or e-mail: [email protected].
The U.S. Department of Agriculture (USDA) prohibits discrimination against its customers, employees, and applicants for employment on the basis of race, color, national origin, age, disability, sex, gender identity, religion, reprisal, and where applicable, political beliefs, marital status, familial or parental status, sexual orientation, or all or part of an individual's income is derived from any public assistance program, or protected genetic information in employment or in any program or activity conducted or funded by the Department. (Not all prohibited bases will apply to all programs and/or employment activities.)
If you wish to file a Civil Rights program complaint of discrimination, complete the USDA Program Discrimination Complaint Form (PDF), found online at www.ascr.usda.gov/filing-program-discrimination-complaint-usda-customer, or at any USDA office, or call (866) 632-9992 to request the form. You may also write a letter containing all of the information requested in the form. Send your completed complaint form or letter to us by mail at U.S. Department of Agriculture, Director, Office of Adjudication, 1400 Independence Avenue, S.W., Washington, D.C. 20250-9410, by fax (202) 690-7442 or email at [email protected].

238
AMER
ICAN
PECA
NCO
UN
CIL
ACRE
AGE
& A
GESU
RVEY
Augu
st 2
0, 2
019
Pres
ente
d by
Joel
Kim
mel
shue
, PhD
, CPS
SCa
sey
Gude
l, M
SM
ica
Heilm
ann,
CPS
S, C
PESC
Conf
iden
tial a
nd P
ropr
ieta
ry In
form
atio
n Co
ntai
ned
With
inN
o Co
pyin
g or
Rep
rodu
ctio
n Al
low
ed w
ithou
t App
rova
l

239
PRES
ENTA
TIO
NO
UTLI
NE
•In
trod
uctio
n to
Land
IQ
•Pa
st W
ork
Effo
rts
•Ap
proa
ch
•Pe
can
Resu
lts
•Ac
reag
e
•Ag
e
•Pe
can
Appl
icatio
ns
•Fu
ture
Opt
ions

240
INTR
ODU
CTIO
NTO
LAN
DIQ
•Ag
ricul
tura
l Sci
entis
ts•
Crop
pro
duct
ion
and
nutr
ient
man
agem
ent
•Ag
ricul
tura
l wat
er q
ualit
y an
d qu
antit
y ev
alua
tion
•Sa
linity
man
agem
ent
•Ag
ricul
tura
l reu
se
•Re
gula
tory
supp
ort
•La
nd st
abili
zatio
n an
d er
osio
n co
ntro
l
•Re
mot
e Se
nsin
g an
d GI
S Te
chno
logi
sts
•Co
nsum
ptiv
e us
e es
timat
ion
and
crop
iden
tific
atio
n•
Larg
e la
ndsc
ape
eval
uatio
ns•
Irrig
atio
n an
d dr
aina
ge•
Prod
uctio
n ag
ricul
ture

241
RELE
VAN
TPR
OJE
CTEX
PERI
ENCE
•Ag
ricul
tura
l Lan
d U
se
•St
atew
ide:
CA
•Re
gion
al sc
ale:
CA,
TX,
AZ,
NM
, CO
, MT
•Co
mm
odity
Org
aniza
tion
Spec
ific:
Alm
ond,
Avo
cado
, Drie
d Pl
um,
Pist
achi
o,
Wal
nut,
Rice
, Wild
Ric
e
•U
rban
Lan
dsca
pe
•Re
gion
al sc
ale:
CA,
TX,
NM
•M
anag
ed W
etla
nds/
Ripa
rian
•St
atew
ide:
CA
•Re
gion
al sc
ale:
CA,
TX,
NM
, AZ
•Co
nsum
ptiv
e U
se/E
T•
Regi
onal
: CA
Delta
, Wes
tland
s Wat
er D
istric
t, Se
mitr
opic
Wat
er
Stor
age
Dist
rict,
Nor
th K
ern
Wat
er S
tora
ge D
istric
t, Sh
afte
r Was
co
Irrig
atio
n Di
stric
t

242
AGRI
CULT
URA
LLA
ND
USE
MAP
PIN
G•
Prov
en m
etho
d de
velo
ped
over
last
10
year
s
•Im
plem
ente
d on
larg
e pr
ojec
ts in
San
Joaq
uin
Valle
y, Sa
cram
ento
Val
ley,
Impe
rial V
alle
y
•Ce
nter
s on
a hi
erar
chic
al o
bjec
t bas
ed a
ppro
ach
•M
ulti-
tem
pora
l & m
ulti-
reso
lutio
n aw
are
•Al
low
s inp
ut o
f 400
+ pr
edic
tor v
aria
bles
•Le
vera
ges o
ur “
Spat
ial &
Spe
ctra
l Cro
p Li
brar
y”
•Re
sults
in a
ccur
ate
crop
map
s, st
atist
ics,
and
cro
p ch
ange
ava
ilabl
e fo
r Cal
iforn
ia
•Ex
ceed
s 96%
acc
urac
y on
app
roxi
mat
ely
50 c
rops

243
TREE
CRO
PM
APPI
NG
–HO
WIS
ITDO
NE?
•Hi
stor
ic m
appi
ng o
f tre
e cr
ops i
n Ca
lifor
nia
and
the
know
ledg
e on
how
to d
o th
at is
crit
ical
•In
a se
nse
… w
e kn
ow w
hat w
e’re
look
ing
at•
Part
ly a
utom
ated
and
par
tly m
anua
l•
Cond
uct g
roun
d tr
uthi
ng to
“kn
ow”
whe
re p
ecan
s are
•U
se “
know
n” p
ecan
orc
hard
s to
crea
te a
sign
atur
e or
fin
gerp
rint
•Lo
ok a
t the
rest
of t
he im
age
and
see
whe
re fi
nger
prin
t m
atch
es w
ell
•W
here
fing
er p
rint m
ay m
atch
, but
not
sure
, con
duct
a
man
ual e
valu
atio
n•
High
reso
lutio
n im
ager
y is
nece
ssar
y

244
PECA
NM
APPI
NG
•An
alyz
ed “
impr
oved
” or
char
d ac
reag
e an
d ag
e fo
r 201
7 an
d 20
18 c
rop
year
s
•“N
ativ
e” e
stim
ates
pro
vide
d
•Ei
ght S
tate
s Map
ped
–fr
om w
est t
o ea
st•
Calif
orni
a•
Arizo
na•
New
Mex
ico
•Te
xas
•O
klah
oma
•Al
abam
a •
Loui
siana
•Ge
orgi
a

245
PECA
NM
APPI
NG
•Av
aila
bilit
y of
nec
essa
ry U
SDA-
NAI
P im
ager
y
Stat
e20
1720
1820
1920
2020
2120
2220
2320
24
Geor
gia
XX
XX
Texa
sX
XX
X
New
Mex
ico
XX
XX
Arizo
naX
XX
X
Alab
ama
XX
XX
Loui
siana
XX
XX
Okl
ahom
aX
XX
X
Calif
orni
aX
XX
X

246
NAT
ION
WID
E“I
MPR
OVE
D” P
ECAN
ACRE
AGE
Stat
e
2017
2018
Acre
age
Orc
hard
s Ac
reag
eO
rcha
rds
Geor
gia
180,
192
10,3
19
Texa
s87
,349
5,94
0
New
Mex
ico
50,6
324,
572
51,4
104,
642
Arizo
na26
,093
788
27,0
7481
8
Alab
ama
18,0
441,
674
Loui
siana
15,8
312,
126
Okl
ahom
a9,
750
676
Calif
orni
a4,
831
263
5,16
628
1
TOTA
L39
2,72
526
,358
•Im
prov
ed p
ecan
acr
eage
in 2
017
and
2018

247
NAT
ION
WID
E“N
ATIV
E” P
ECAN
ACRE
AGE St
ate
2017
Acre
age
Geor
gia
10,0
00–
20,0
00
Texa
s30
,000
–50
,000
New
Mex
ico
0
Arizo
na0
Alab
ama
200
–80
0
Loui
siana
4,00
0 –
8,00
0
Okl
ahom
a65
,000
–85
,000
Calif
orni
a0
TOTA
L10
9,20
0 –
163,
800
•N
ot a
par
t of o
ur sc
ope
of se
rvic
es, b
ut …
•Ro
ughl
y es
timat
ed n
ativ
e pe
can
acre
age
in
2017
•N
ot a
ble
to b
e de
term
ined
via
rem
ote
sens
ing
•U
tilize
mul
tiple
line
s of e
vide
nce
to e
stim
ate
nativ
e ac
reag
e in
clud
ing:
•O
ur o
wn
rem
otel
y se
nsed
eva
luat
ion
•U
nive
rsity
rese
arch
art
icle
s
•Co
oper
ativ
e ex
tens
ion
publ
icat
ions
•U
SDA-
NAS
S re
port
s

248
NAT
ION
WID
E“N
ATIV
E” P
ECAN
ACRE
AGE
•Va
st d
iffer
ence
in n
ativ
e sy
stem
s fro
m “
man
aged
” to
“fo
rest
”

249
NAT
ION
WID
E“N
ATIV
E” P
ECAN
ACRE
AGE
•Va
st d
iffer
ence
in n
ativ
e sy
stem
s fro
m “
man
aged
” to
“fo
rest
”

250
CALI
FORN
IA
2017
2018
USD
A-N
ASS
13,
600
3,50
0
Land
IQ (i
mpr
oved
)4,
831
5,16
6
Diffe
renc
e+1
,231
+1,6
66
•U
SDA-
NAS
S an
d La
nd IQ
Acr
eage
Com
paris
on
•Ke
y Co
nclu
sions
:•
Calif
orni
a co
nsist
s of i
mpr
oved
orc
hard
s onl
y•
High
ly a
ccur
ate
map
ping
•Sl
ight
incr
ease
in 2
018
expe
cted
1U
SDA-
NAS
S ac
reag
e in
clud
es im
prov
ed a
nd n
ativ
e or
char
ds

251
ARIZ
ON
A
•U
SDA-
NAS
S an
d La
nd IQ
Acr
eage
Com
paris
on
2017
2018
USD
A-N
ASS
116
,000
17,0
00
Land
IQ (i
mpr
oved
)26
,093
27,0
74
Diffe
renc
e+1
0,09
3+1
0,07
4
•Ke
y Co
nclu
sions
:•
Arizo
na co
nsist
s of i
mpr
oved
orc
hard
s onl
y•
High
ly a
ccur
ate
map
ping
•In
crea
se in
201
8 ex
pect
ed
1U
SDA-
NAS
S ac
reag
e in
clud
es im
prov
ed a
nd n
ativ
e or
char
ds

252
NEW
MEX
ICO
•U
SDA-
NAS
S an
d La
nd IQ
Acr
eage
Com
paris
on
2017
2018
USD
A-N
ASS
143
,500
46,0
00
Land
IQ (i
mpr
oved
)50
,632
51,4
10
Diffe
renc
e+7
,132
+5,4
10
•Ke
y Co
nclu
sions
:•
New
Mex
ico
cons
ists o
f im
prov
ed o
rcha
rds
•Hi
ghly
acc
urat
e m
appi
ng•
Incr
ease
in 2
018
and
beyo
nd e
xpec
ted
1U
SDA-
NAS
S ac
reag
e in
clud
es im
prov
ed a
nd n
ativ
e or
char
ds

253
TEXA
S
•U
SDA-
NAS
S an
d La
nd IQ
Acr
eage
Com
paris
on
2017
2018
USD
A-N
ASS
111
5,00
011
2,00
0
Land
IQ (i
mpr
oved
)87
,349
TBD
Diffe
renc
e-2
7,65
1TB
D
•Ke
y Co
nclu
sions
:•
Texa
s con
sists
of i
mpr
oved
and
nat
ive
orch
ards
•W
est T
exas
diff
eren
t tha
n Ce
ntra
l/Eas
t TX
•W
est T
exas
is h
ighl
y ac
cura
te•
Cons
ider
div
idin
g Te
xas i
nto
two
area
s for
an
alys
is
1U
SDA-
NAS
S ac
reag
e in
clud
es im
prov
ed a
nd n
ativ
e or
char
ds

254
OKL
AHO
MA
•U
SDA-
NAS
S an
d La
nd IQ
Acr
eage
Com
paris
on
2017
2018
USD
A-N
ASS
186
,000
90,0
00
Land
IQ (i
mpr
oved
)9,
750
TBD
Diffe
renc
e-7
6,25
0TB
D
•Ke
y Co
nclu
sions
:•
Okl
ahom
a co
nsist
s of m
ainl
y na
tive
orch
ards
•Fe
w a
cres
of i
mpr
oved
orc
hard
s•
The
stat
e of
mos
t unk
now
n
1U
SDA-
NAS
S ac
reag
e in
clud
es im
prov
ed a
nd n
ativ
e or
char
ds

255
LOU
ISIA
NA
•U
SDA-
NAS
S an
d La
nd IQ
Acr
eage
Com
paris
on
2017
2018
USD
A-N
ASS
112
,300
13,4
00
Land
IQ (i
mpr
oved
)15
,831
TBD
Diffe
renc
e+3
,531
TBD
•Ke
y Co
nclu
sions
:•
Loui
siana
con
sists
of i
mpr
oved
orc
hard
s
1U
SDA-
NAS
S ac
reag
e in
clud
es im
prov
ed a
nd n
ativ
e or
char
ds

256
ALAB
AMA
•U
SDA-
NAS
S an
d La
nd IQ
Acr
eage
Com
paris
on
2017
2018
USD
A-N
ASS
18,
400
8,00
0
Land
IQ (i
mpr
oved
)18
,044
TBD
Diffe
renc
e+9
,644
TBD
•Ke
y Co
nclu
sions
:•
Alab
ama
cons
ists o
f mos
tly im
prov
ed o
rcha
rds
•So
me
nativ
e or
char
ds a
long
cre
eks a
nd st
ream
s•
Fairl
y ac
cura
te fo
r im
prov
ed o
rcha
rd m
appi
ng
1U
SDA-
NAS
S ac
reag
e in
clud
es im
prov
ed a
nd n
ativ
e or
char
ds
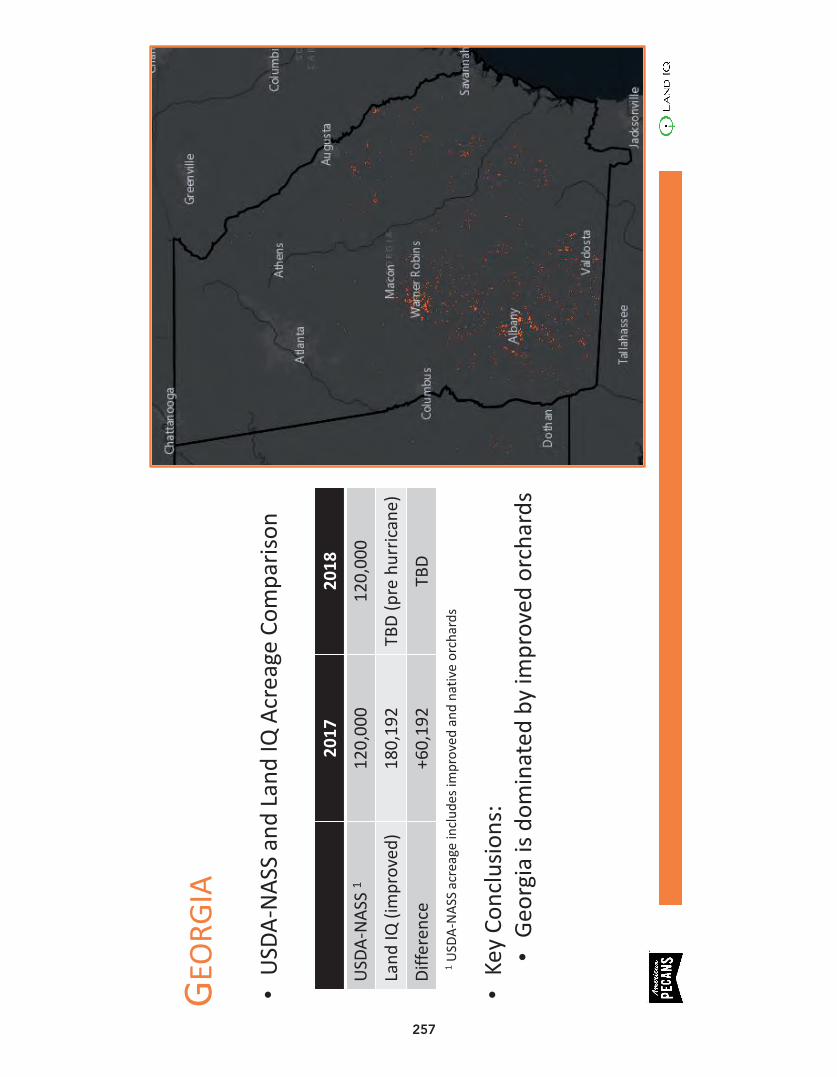
257
GEO
RGIA
•U
SDA-
NAS
S an
d La
nd IQ
Acr
eage
Com
paris
on
2017
2018
USD
A-N
ASS
112
0,00
012
0,00
0
Land
IQ (i
mpr
oved
)18
0,19
2TB
D (p
rehu
rric
ane)
Diffe
renc
e+6
0,19
2TB
D
•Ke
y Co
nclu
sions
:•
Geor
gia
is do
min
ated
by
impr
oved
orc
hard
s
1U
SDA-
NAS
S ac
reag
e in
clud
es im
prov
ed a
nd n
ativ
e or
char
ds

258
NAT
ION
WID
EPE
CAN
ACRE
AGE 20
1720
18
USD
A-N
ASS
–(im
prov
ed &
nat
ive)
404,
800
409,
900
Land
IQ –
(impr
oved
)39
2,72
5TB
D
Land
IQ –
(nat
ive
-ave
rage
of r
ange
)13
6,50
0TB
D
Land
IQ–
(tota
l)52
8,22
5TB
D
Diffe
renc
e–
(Lan
d IQ
gre
ater
)+1
23,4
25TB
D
•U
SDA-
NAS
S an
d La
nd IQ
Acr
eage
Com
paris
on (e
ight
map
ped
stat
es)
•Ke
y Co
nclu
sions
:•
USD
A-N
ASS
acre
age
incl
udes
surv
ey a
crea
ge e
stim
ates
of b
oth
impr
oved
and
nat
ive
orch
ards
•Im
prov
ed a
nd n
ativ
e sy
stem
s are
ver
y di
ffere
nt a
naly
ses f
or re
mot
e se
nsin
g•
Nat
ive
syst
ems g
ener
ally
can
not b
e de
term
ined
via
rem
ote
sens
ing
•Ev
ery
yea
r im
prov
ed sy
stem
s are
map
ped,
acc
urac
ies w
ill in
crea
se (n
ow a
t abo
ut 9
5% n
atio
nwid
e –
high
er in
the
wes
t)

259
NAT
ION
WID
EPE
CAN
ACRE
AGE
–W
EBVI
EWER

260
NAT
ION
WID
EPE
CAN
ACRE
AGE
CON
CLU
SIO
NS
•U
SDA-
NAS
S an
d La
nd IQ
acr
eage
com
paris
on (e
ight
map
ped
stat
es)
•La
nd IQ
acr
eage
, inc
ludi
ng a
n in
itial
est
imat
e of
“na
tive”
was
app
roxi
mat
ely
125,
000
–15
0,00
0 ac
res g
reat
er•
Expe
rienc
ed th
is w
ith a
lmon
ds, w
alnu
ts, a
nd p
istac
hios
in C
alifo
rnia
•Gr
ower
s “fe
lt” a
nd “a
ssum
ed” U
SDA-
NAS
S ac
reag
es w
ere
too
low
… tr
ue b
y 10
% fo
r al
mon
ds•
Impa
cted
the
mar
ket p
rice
initi
ally
•N
ow im
pact
ing
crop
vol
ume
estim
ates
4-5
yea
rs la
ter
•Ke
y to
cons
ider
is th
at c
urre
ntly
this
is ac
reag
e an
d N
OT v
olum
e of
cro
p

261
AGE
ANAL
YSIS
•O
nce
orch
ards
are
map
ped,
onl
y th
en
can
age
be d
eter
min
ed
•A
back
war
ds lo
okin
g ap
proa
ch (t
hrou
gh
1984
) at i
mag
ery
sour
ces i
s con
duct
ed
•O
nce
“sig
natu
re” a
ppea
rs a
s ope
n gr
ound
, the
n th
is es
tabl
ishes
pla
ntin
g da
te
•N
atio
nwid
e, o
ver h
alf t
he p
ecan
acr
eage
w
as p
lant
ed p
rior t
o 19
84

262
CALI
FORN
IA–
AGE
ANAL
YSIS
26%

263
ARIZ
ON
A–
AGE
ANAL
YSIS
22%

264
NEW
MEX
ICO
–AG
EAN
ALYS
IS
32%

265
TEXA
S–
AGE
ANAL
YSIS
43%

266
OKL
AHO
MA
–AG
EAN
ALYS
IS
62%

267
LOU
ISIA
NA
–AG
EAN
ALYS
IS72%

268
ALAB
AMA
–AG
EAN
ALYS
IS
85%

269
GEO
RGIA
–AG
EAN
ALYS
IS
70%
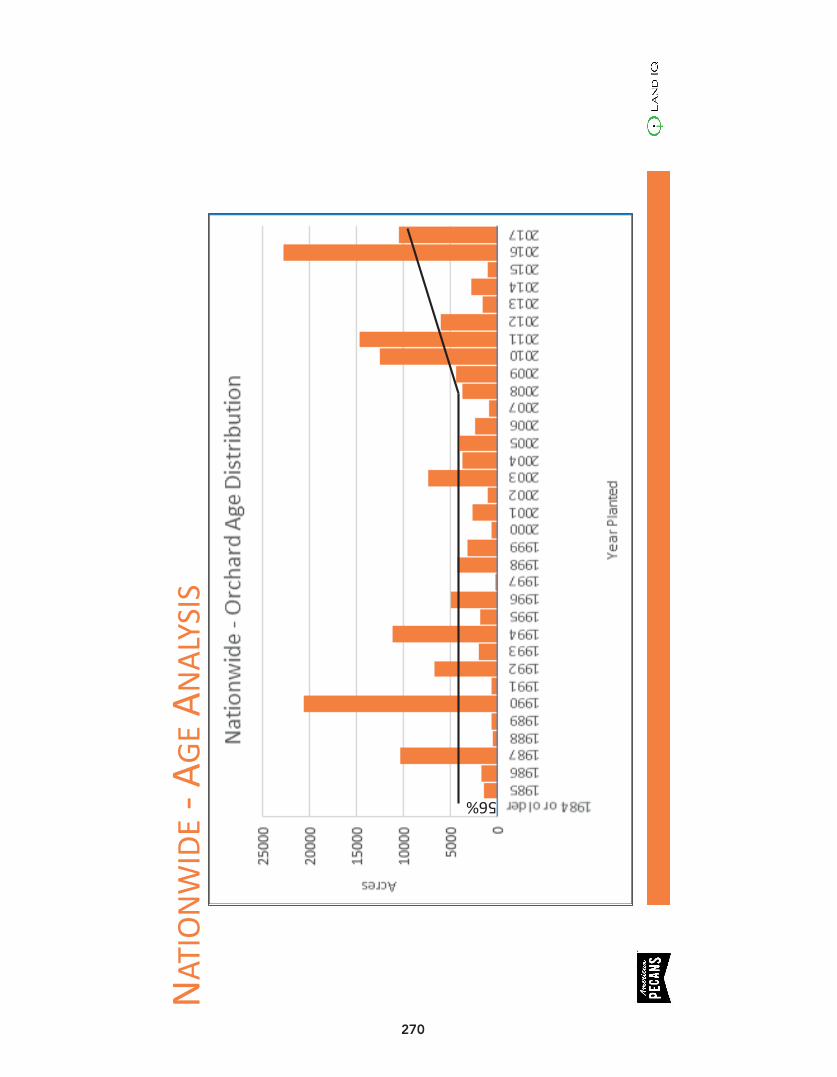
270
NAT
ION
WID
E-A
GEAN
ALYS
IS
56%

271
NAT
ION
WID
EPE
CAN
AGE
CON
CLU
SIO
NS
•O
ver 5
0% o
f pec
ans w
ere
plan
ted
in o
r bef
ore
1984
•M
ost r
ecen
t inc
reas
e in
you
ng p
ecan
pl
antin
gs is
occ
urrin
g in
the
wes
tern
US
(Cal
iforn
ia, N
ew M
exic
o, A
rizon
a, W
est T
exas
)•
How
will
wat
er su
pply
cha
lleng
es a
ffect
thes
e pl
antin
gs?
•O
rcha
rd a
ge is
a k
ey co
mpo
nent
to m
any
futu
re a
naly
ses

272
POTE
NTI
ALFU
TURE
APPL
ICAT
ION
SO
FM
APPI
NG
•Ex
pand
ed A
crea
ge A
sses
smen
t•
Expa
nd th
e fie
ld-b
y-fie
ld a
crea
ge a
sses
smen
t to
seve
n (7
) add
ition
al st
ates
incl
udin
g Ar
kans
as,
Flor
ida,
Kan
sas,
Miss
issip
pi, M
issou
ri, N
orth
Car
olin
a an
d So
uth
Caro
lina.
Stat
e20
1720
1820
1920
2020
2120
2220
2320
24
Arka
nsas
XX
XX
Flor
ida
XX
XX
Kans
asX
XX
X
Miss
issip
piX
XX
X
Miss
ouri
XX
XX
Nor
th C
arol
ina
XX
XX
Sout
h Ca
rolin
aX
XX
X

273
POTE
NTI
ALFU
TURE
APPL
ICAT
ION
SO
FM
APPI
NG
•Hu
rric
ane
Mic
hael
Impa
cts
•As
sess
men
t of t
he a
crea
ge th
at w
as im
pact
ed b
y Hu
rric
ane
Mic
hael
by
map
ping
the
2019
acr
eage
in G
eorg
ia.
•O
ther
Spa
tial A
pplic
atio
ns•
Not
pos
sible
with
tabu
lar,
surv
ey b
ased
info
rmat
ion
•Re
gion
al p
rodu
ctio
n tr
ends
•As
sess
men
t tra
ckin
g•
Whe
re is
gro
wth
hap
peni
ng•
Glob
al p
rodu
ctio
n op
port
uniti
es
•Yi
eld
Estim
atio
n•
In-s
easo
n pr
ojec
tion
of y
ield
usin
g ac
reag
e, a
ge, l
ocat
ion
and
varie
ty a
s wel
l as t
akin
g in
to a
ccou
nt e
nviro
nmen
tal f
acto
rs a
nd w
ater
supp
ly re
liabi
lity.

274
Appl
icat
ions
of M
appi
ng –
Alm
ond
Yiel
d Fo
reca
stin
g•
Basic
nee
d of
the
orga
niza
tion,
gro
wer
s & p
roce
ssor
s
•U
tilize
s the
follo
win
g co
mpo
nent
s to
fore
cast
yie
ld, w
ith th
e m
ost r
ecen
t inf
orm
atio
n av
aila
ble:
–Ac
reag
e–
Age
–Lo
catio
n–
Yiel
d Fu
nctio
n th
at is
bas
ed o
n ac
tual
yie
lds a
t the
cou
nty
leve
l
•Al
low
s use
rs to
adj
ust f
or e
nviro
nmen
tal a
nd w
ater
supp
ly im
pact
s
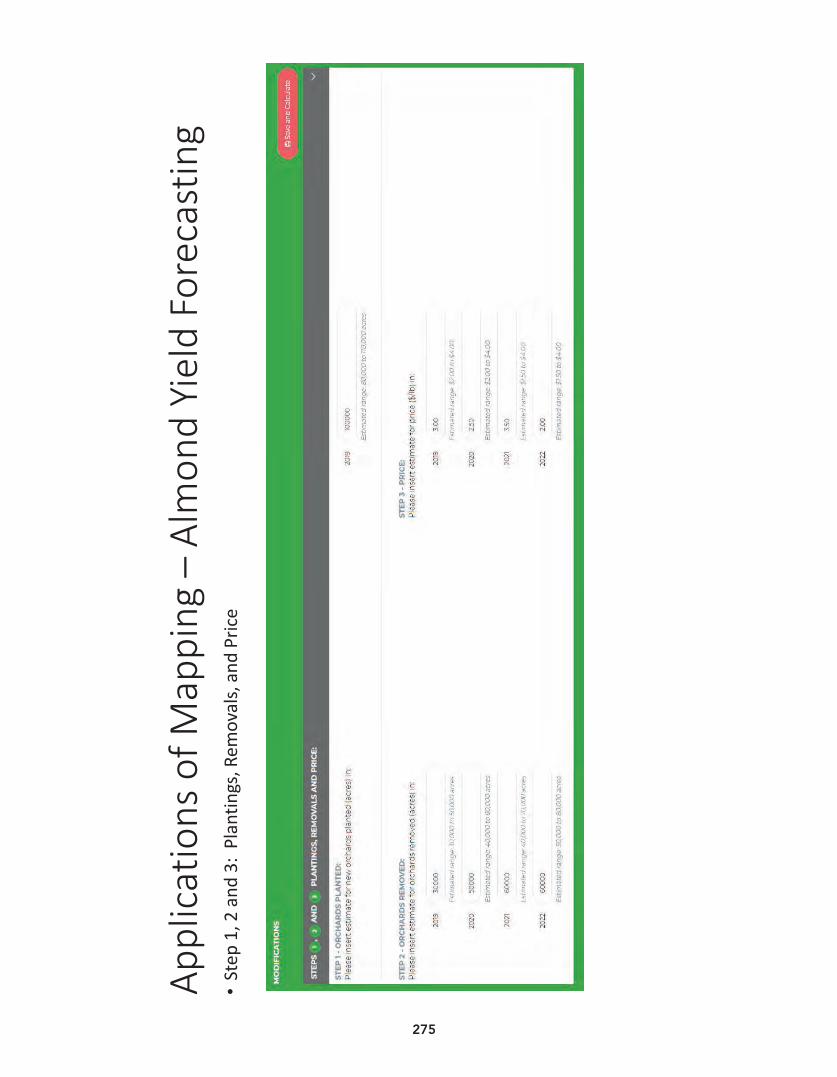
275
Appl
icat
ions
of M
appi
ng –
Alm
ond
Yiel
d Fo
reca
stin
g•
Step
1, 2
and
3:
Plan
tings
, Rem
oval
s, a
nd P
rice

276
Appl
icat
ions
of M
appi
ng –
Alm
ond
Yiel
d Fo
reca
stin
g•
Step
4 &
5:
Envi
ronm
enta
l Im
pact
s & W
ater
Sup
ply
Impa
cts

277
GLO
BAL
PECA
NM
APPI
NG
•La
nd IQ
was
rece
ntly
con
tact
ed b
y th
e In
tern
atio
nal N
ut a
nd D
ried
Frui
t Cou
ncil
•In
tere
sted
in d
iscus
sing
map
ping
tree
cro
ps g
loba
lly•
Alm
onds
•W
alnu
ts
•Pi
stac
hios
•Ca
shew
s
•Ha
zeln
uts
•Pe
cans
exi
st in
US
(41%
), M
exic
o (5
2%),
Sout
h Af
rica
(5%
), Au
stra
lia (1
%),
Oth
ers (
1%)
•Re
com
men
d th
at th
ey c
onsid
er p
ecan
s
•W
ill k
eep
APC
info
rmed
of p
rogr
ess

278
QU
ESTI
ON
S
Economic Benchmark Model and Analysis of the Effects of the Chinese Tariff on the U.S. Pecan Industry
DECEMBER 2019
Economic Benchmark Model and Analysis of the Effects of the Chinese Tariff on the U.S. Pecan Industry
Forecasting and Business Analytics, LLC Dr. Oral Capps, Jr. Executive Professor and AFCERC CO‐Director Texas A&M University Dr. Gary W. Williams Professor and AFCERC Co‐Director Texas A&M University Agribusiness, Food, and Consumer
Economics Research Center

279
Economic Benchmark Model and Analysis of the Effects of the Chinese Tariff on the U.S. Pecan Industry
DECEMBER 2019
Economic Benchmark Model and Analysis of the Effects of the Chinese Tariff on the U.S. Pecan Industry
Forecasting and Business Analytics, LLC Dr. Oral Capps, Jr. Executive Professor and AFCERC CO‐Director Texas A&M University Dr. Gary W. Williams Professor and AFCERC Co‐Director Texas A&M University Agribusiness, Food, and Consumer
Economics Research Center

280
i
Economic Benchmark Model and Analysis of the Effects of the Chinese Tariff on the U.S. Pecan Industry
ECONOMIC BENCHMARK MODEL AND ANALYSIS OF THE EFFECTS OF THE
CHINESE TARIFF ON THE U.S. PECAN INDUSTRY
Authors:Dr. Oral Capps, Jr. FABA Managing Partner and Executive Professor, Texas A&M University
Dr. Gary W. Williams FABA Team and Professor, Texas A&M University
Abstract:This report presents and describes the first economic model of the U.S. pecan industry ever developed. Known as PecanMod, the model replicates the functioning of the pecan industry for analysis of economic issues of importance to the pecan industry. After reviewing past research to analyze economic behavior in the U.S. pecan industry, the report discuss the structure of the U.S. pecan industry, identifies the data needed to model the economic activities of the industry, and evaluates the critical data gaps that exist. After laying out the structure and functioning of PecanMod, the report demonstrates the features and usefulness the model by performing an analysis with the model of the U.S. pecan industry impacts of the Chinese import tariffs in 2017/18 and 2018/19. At the end, the report offers some comments on future uses of PecanMod and the continued evolution of the model required to insure that the model captures the full dynamics of the U.S. pecan industry.
Acknowledgements: We gratefully acknowledge funding for this project from the American Pecan Council and for helping us to understand how the U.S. pecan industry functions. We also are greatly indebted to Loren Burns, AFCERC Program Manager, and student workers for excellent data and administrative support. Nevertheless, findings and conclusions are those of the authors and do not necessarily represent the views of the American Pecan Council or Texas A&M University.
A Limited Liability Company formed in Texas in 2001, FABA was founded on the belief that to utilize information effectively in a decision-making process, real world experience, sound econometric and statistical skills, and advanced analytical ability are necessary.
FABA provides a mix of theoretical horsepower and real world experience in designing and implementing research projects for its clients. FABA draws on resources with experience across many different private sector applications, with a common goal of utilizing econometric and statistical tools to create effective forecasting and other analytical tools that enable better decisions. FABA provides complete forecasting and business analytic solutions centering on the development of econometric/statistical models to aid decision-making in the business community in two ways: (1) analyses to better interpret the business, economic, and financial landscape and (2) forecasts to provide a better vison of the future.
ii
Economic Benchmark Model and Analysis of the Effects of the Chinese Tariff on the U.S. Pecan Industry
EXECUTIVE SUMMARY
This report presents and describes the first economic model of the U.S. pecan industry ever developed. We first summarize the findings of past research that analyzes economic behavior in the U.S. pecan industry. We then discuss the structure of the U.S. pecan industry, identify the data needed to model the economic activities of the industry, and evaluate the critical data gaps that exist. Next, we briefly discuss the model of the U.S. pecan industry developed to replicate the functioning of the industry known as PecanMod. To demonstrate the features and usefulness of PecanMod, we use the model to perform an analysis of the impact of the Chinese import tariffs in 2017/18 and 2018/19 on the U.S. pecan industry. At the end, we offer some comments on future uses of PecanMod and the continued evolution and uses of the model. While providing many important insights on the U.S. pecan industry, none of the previous economic research efforts on pecans attempted to develop a viable structural model of the U.S. pecan industry for at least two reasons: (1) a lack of needed data and (2) the on-off production behavior of pecan trees which tends to swamp the economic forces making statistical efforts to disentangle the economic drivers from the biological drivers in pecan markets quite difficult. A review of the structure of the pecan industry and available data concludes that while some data related to the pecan industry are available, much data needed to characterize many critical activities in the U.S. pecan industry are not. Missing are historical, consistent, and reliable data on critical activities such as acreage planted and harvested, and trees removed by pecan variety, purchases by accumulators, wholesalers, and shellers, purchases by various retailers by type or as a group, purchases by various industrial users by type or as a group, and exports to specifically identified destinations. Price data associated with most of those activities also are not available for analysis. In addition, some of the available data are not useful or reliable for analysis such as exports by destination and terminal prices. Other available data are not specific as to type, such as domestic utilization for which there is no breakdown by retail or industrial uses. We developed PecanMod as a relatively powerful economic model based on the available data. PecanMod is an econometric simulation model consisting of a set of equations that explain the movement over time of 13 key industry activities, including (1) improved pecan production (in-shell), (2) native pecan production (in shell), (3) total pecan production (in-shell), (4) total pecan production (shelled), (5) pecan import supply, (6) domestic pecan utilization, (7) ending stock demand, (8) export demand, (9) price of improved pecans (in-shell), (10) price of native pecans (in-shell), (11) average producer price of pecans (shelled), (12) import price of pecans, and (13) export price of pecans. Using statistical procedures (econometrics), the relationship between these key industry activities and the drivers that explain the economic behavior of each were determined.

281
i
Economic Benchmark Model and Analysis of the Effects of the Chinese Tariff on the U.S. Pecan Industry
ECONOMIC BENCHMARK MODEL AND ANALYSIS OF THE EFFECTS OF THE
CHINESE TARIFF ON THE U.S. PECAN INDUSTRY
Authors:Dr. Oral Capps, Jr. FABA Managing Partner and Executive Professor, Texas A&M University
Dr. Gary W. Williams FABA Team and Professor, Texas A&M University
Abstract:This report presents and describes the first economic model of the U.S. pecan industry ever developed. Known as PecanMod, the model replicates the functioning of the pecan industry for analysis of economic issues of importance to the pecan industry. After reviewing past research to analyze economic behavior in the U.S. pecan industry, the report discuss the structure of the U.S. pecan industry, identifies the data needed to model the economic activities of the industry, and evaluates the critical data gaps that exist. After laying out the structure and functioning of PecanMod, the report demonstrates the features and usefulness the model by performing an analysis with the model of the U.S. pecan industry impacts of the Chinese import tariffs in 2017/18 and 2018/19. At the end, the report offers some comments on future uses of PecanMod and the continued evolution of the model required to insure that the model captures the full dynamics of the U.S. pecan industry.
Acknowledgements: We gratefully acknowledge funding for this project from the American Pecan Council and for helping us to understand how the U.S. pecan industry functions. We also are greatly indebted to Loren Burns, AFCERC Program Manager, and student workers for excellent data and administrative support. Nevertheless, findings and conclusions are those of the authors and do not necessarily represent the views of the American Pecan Council or Texas A&M University.
A Limited Liability Company formed in Texas in 2001, FABA was founded on the belief that to utilize information effectively in a decision-making process, real world experience, sound econometric and statistical skills, and advanced analytical ability are necessary.
FABA provides a mix of theoretical horsepower and real world experience in designing and implementing research projects for its clients. FABA draws on resources with experience across many different private sector applications, with a common goal of utilizing econometric and statistical tools to create effective forecasting and other analytical tools that enable better decisions. FABA provides complete forecasting and business analytic solutions centering on the development of econometric/statistical models to aid decision-making in the business community in two ways: (1) analyses to better interpret the business, economic, and financial landscape and (2) forecasts to provide a better vison of the future.
ii
Economic Benchmark Model and Analysis of the Effects of the Chinese Tariff on the U.S. Pecan Industry
EXECUTIVE SUMMARY
This report presents and describes the first economic model of the U.S. pecan industry ever developed. We first summarize the findings of past research that analyzes economic behavior in the U.S. pecan industry. We then discuss the structure of the U.S. pecan industry, identify the data needed to model the economic activities of the industry, and evaluate the critical data gaps that exist. Next, we briefly discuss the model of the U.S. pecan industry developed to replicate the functioning of the industry known as PecanMod. To demonstrate the features and usefulness of PecanMod, we use the model to perform an analysis of the impact of the Chinese import tariffs in 2017/18 and 2018/19 on the U.S. pecan industry. At the end, we offer some comments on future uses of PecanMod and the continued evolution and uses of the model. While providing many important insights on the U.S. pecan industry, none of the previous economic research efforts on pecans attempted to develop a viable structural model of the U.S. pecan industry for at least two reasons: (1) a lack of needed data and (2) the on-off production behavior of pecan trees which tends to swamp the economic forces making statistical efforts to disentangle the economic drivers from the biological drivers in pecan markets quite difficult. A review of the structure of the pecan industry and available data concludes that while some data related to the pecan industry are available, much data needed to characterize many critical activities in the U.S. pecan industry are not. Missing are historical, consistent, and reliable data on critical activities such as acreage planted and harvested, and trees removed by pecan variety, purchases by accumulators, wholesalers, and shellers, purchases by various retailers by type or as a group, purchases by various industrial users by type or as a group, and exports to specifically identified destinations. Price data associated with most of those activities also are not available for analysis. In addition, some of the available data are not useful or reliable for analysis such as exports by destination and terminal prices. Other available data are not specific as to type, such as domestic utilization for which there is no breakdown by retail or industrial uses. We developed PecanMod as a relatively powerful economic model based on the available data. PecanMod is an econometric simulation model consisting of a set of equations that explain the movement over time of 13 key industry activities, including (1) improved pecan production (in-shell), (2) native pecan production (in shell), (3) total pecan production (in-shell), (4) total pecan production (shelled), (5) pecan import supply, (6) domestic pecan utilization, (7) ending stock demand, (8) export demand, (9) price of improved pecans (in-shell), (10) price of native pecans (in-shell), (11) average producer price of pecans (shelled), (12) import price of pecans, and (13) export price of pecans. Using statistical procedures (econometrics), the relationship between these key industry activities and the drivers that explain the economic behavior of each were determined.

282
iii
Economic Benchmark Model and Analysis of the Effects of the Chinese Tariff on the U.S. Pecan Industry
For example, the econometric procedure determined that price is a statistically significant driver of production, import supply, export demand, domestic demand, and pecan stock demand behavior. Even so, the procedure concluded that each of those market activities are price inelastic, that is, not highly responsive to price changes. Various statistical measures confirm PecanMod does an excellent job of tracking the historical functioning of the U.S. pecan industry. To demonstrate its features and usefulness, we use PecanMod to conduct a counter-factual simulation of the effects of the increased Chinese tariff in 2017/18 and 2018/19 on the U.S. pecan industry. The results indicate that over the two years, the main effect of the tariffs in those years was to reduce U.S. pecan exports and prices with some corresponding increase in domestic use and little or no effect on effect on production. The U.S. price declines plus the decline in exports and the small decline production all as a result of the tariffs led to sizeable declines in producer and export revenues of $215 million (16%) and $239 million (17%), respectively. We used the counterfactual simulation results to determine how much of the actual change in industry activities that occurred between 2017/18 and 2018/19 was due to the weather and other issues affecting production that year and how much was due to the tariff. The results indicate that nearly all of the declines in producer and export prices that actually occurred between 2017/18 and 2018/19 were due to the tariff and nearly half of the drop in export volume with the rest of the export decline due to other market forces such as the decline in production in 2018/19. The tariffs were also responsible for about half of the drop in producer revenue and two-thirds of the drop in export revenue with the remainder due to other market forces that year. PecanMod is a powerful analytical tool that is capable of analyzing the effects of many key economic forces on the U.S. pecan industry. The model is limited by a lack of data for key industry activities and by the consistency and reliability of available data. Like all models, PecanMod will need to evolve over time given changes that occur in the industry. As well, the model will need to expand to better capture the complex and extremely dynamic nature of the pecan industry. The analysis of the 2017/18 and 2018/19 Chinese tariffs on imports of U.S. pecans provides an excellent demonstration of what PecanMod can already do in analyzing the effects of economic events impacting the U.S. pecan industry. The attribution analysis demonstrates some of the additional insights that analysis with PecanMod can provide. PecanMod is the exclusive property of APC. The model will reside at Texas A&M University to allow researchers to update and refine the model over time. Future analysis using the PecanMod can be carried out but only at the request of APC under separate contracts for the work requested.
iv
Economic Benchmark Model and Analysis of the Effects of the Chinese Tariff on the U.S. Pecan Industry
TABLE OF CONTENTS
Abstract and Acknowledgements .................................................................................................... i
Executive Summary ........................................................................................................................ ii
Introduction ..................................................................................................................................... 1
Past Research on Modeling the U.S. Pecan Industry ...................................................................... 2
Structure of the U.S. Pecan Industry ............................................................................................... 3
PecanMod - A U.S. Pecan Industry Economic Benchmark Model .............................................. 16
The Statistical Model ................................................................................................................ 20 Using PecanMod for Analysis – Counterfactual Simulation .................................................... 22
Demonstration of the Use of PecanMod: Economic Effects of the Chinese Import Tariffs ........ 23
Background on the Chinese Import Tariff ................................................................................ 24 Expected Effects of the Chinese Import Tariff .......................................................................... 24 Simulation Analysis of the Effects of the Chinese Import Tariff ............................................... 29
Final Comments ............................................................................................................................ 34
References ..................................................................................................................................... 36
Appendix 1: Chronological Review of Past Economic Research on the U.S. Pecan Industry ..... 39
Appendix 2: PecanMod Baseline Simulation Validation Statistics .............................................. 45

283
iii
Economic Benchmark Model and Analysis of the Effects of the Chinese Tariff on the U.S. Pecan Industry
For example, the econometric procedure determined that price is a statistically significant driver of production, import supply, export demand, domestic demand, and pecan stock demand behavior. Even so, the procedure concluded that each of those market activities are price inelastic, that is, not highly responsive to price changes. Various statistical measures confirm PecanMod does an excellent job of tracking the historical functioning of the U.S. pecan industry. To demonstrate its features and usefulness, we use PecanMod to conduct a counter-factual simulation of the effects of the increased Chinese tariff in 2017/18 and 2018/19 on the U.S. pecan industry. The results indicate that over the two years, the main effect of the tariffs in those years was to reduce U.S. pecan exports and prices with some corresponding increase in domestic use and little or no effect on effect on production. The U.S. price declines plus the decline in exports and the small decline production all as a result of the tariffs led to sizeable declines in producer and export revenues of $215 million (16%) and $239 million (17%), respectively. We used the counterfactual simulation results to determine how much of the actual change in industry activities that occurred between 2017/18 and 2018/19 was due to the weather and other issues affecting production that year and how much was due to the tariff. The results indicate that nearly all of the declines in producer and export prices that actually occurred between 2017/18 and 2018/19 were due to the tariff and nearly half of the drop in export volume with the rest of the export decline due to other market forces such as the decline in production in 2018/19. The tariffs were also responsible for about half of the drop in producer revenue and two-thirds of the drop in export revenue with the remainder due to other market forces that year. PecanMod is a powerful analytical tool that is capable of analyzing the effects of many key economic forces on the U.S. pecan industry. The model is limited by a lack of data for key industry activities and by the consistency and reliability of available data. Like all models, PecanMod will need to evolve over time given changes that occur in the industry. As well, the model will need to expand to better capture the complex and extremely dynamic nature of the pecan industry. The analysis of the 2017/18 and 2018/19 Chinese tariffs on imports of U.S. pecans provides an excellent demonstration of what PecanMod can already do in analyzing the effects of economic events impacting the U.S. pecan industry. The attribution analysis demonstrates some of the additional insights that analysis with PecanMod can provide. PecanMod is the exclusive property of APC. The model will reside at Texas A&M University to allow researchers to update and refine the model over time. Future analysis using the PecanMod can be carried out but only at the request of APC under separate contracts for the work requested.
iv
Economic Benchmark Model and Analysis of the Effects of the Chinese Tariff on the U.S. Pecan Industry
TABLE OF CONTENTS
Abstract and Acknowledgements .................................................................................................... i
Executive Summary ........................................................................................................................ ii
Introduction ..................................................................................................................................... 1
Past Research on Modeling the U.S. Pecan Industry ...................................................................... 2
Structure of the U.S. Pecan Industry ............................................................................................... 3
PecanMod - A U.S. Pecan Industry Economic Benchmark Model .............................................. 16
The Statistical Model ................................................................................................................ 20 Using PecanMod for Analysis – Counterfactual Simulation .................................................... 22
Demonstration of the Use of PecanMod: Economic Effects of the Chinese Import Tariffs ........ 23
Background on the Chinese Import Tariff ................................................................................ 24 Expected Effects of the Chinese Import Tariff .......................................................................... 24 Simulation Analysis of the Effects of the Chinese Import Tariff ............................................... 29
Final Comments ............................................................................................................................ 34
References ..................................................................................................................................... 36
Appendix 1: Chronological Review of Past Economic Research on the U.S. Pecan Industry ..... 39
Appendix 2: PecanMod Baseline Simulation Validation Statistics .............................................. 45

284
v
Economic Benchmark Model and Analysis of the Effects of the Chinese Tariff on the U.S. Pecan Industry
TABLE OF FIGURES
Figure 1. Economic Structure of the U.S. Pecan Industry (No Data Gaps) .................................... 4
Figure 2. U.S. In-Shell Pecan Production by Type, 1919 – 2019 ................................................... 6
Figure 3. Total U.S. In-Shell Pecan Production, 1919 – 2019 ........................................................ 6
Figure 4. U.S. In-Shell Pecan Production by State and Total Production Value, 2009 – 2018 ...... 7
Figure 5. U.S. Pecan Bearing Acreage by State, 2016 – 2019 ....................................................... 7
Figure 6. U.S. Pecan Yields by State, 2016 – 2019 ........................................................................ 8
Figure 7. U.S. Pecan Supply and Utilization (Shelled Basis), 1980/81 – 2018/19 ....................... 10
Figure 8. U.S. Per Capita Consumption of Pecans (Shelled Basis), 1977/78 – 2018/19 .............. 10
Figure 9. U.S. Pecan Exports by Country (Shelled Basis), 1988/89 – 2018/19 ........................... 11
Figure 10. Pecan Prices (In-Shell) Received by Producers by Type, 1922/23 – 2018/19 ............ 12
Figure 11. Nominal and Inflation-Adjusted (1922=100) Pecan Price Received by Farmers (In-Shell), 1922/23 – 2018/19 ....................................................................................................... 13
Figure 12. Pecan Prices (Shelled Basis): Producer, Export, and Import, 1988/89 – 2018/19 ...... 13
Figure 13. Reduced Data-Supported Economic Structure of the U.S. Pecan Industry Due to Data Gaps .................................................................................................................................. 15
Figure 14. PecanMod Structure .................................................................................................... 17
Figure 15. PecanMod Equations ................................................................................................... 18
Figure 16. PecanMod Variable Definitions .................................................................................. 19
Figure 17. Effect of a Chinese Import Tariff on U.S. Pecan Export Quantity and Price .............. 26
Figure 18. Effect of a Chinese Import Tariff on U.S. Pecan Export Quantity and Price Given an ELASTIC Export Supply of U.S. Pecans ...................................................................... 26
Figure 19. Effect of a Chinese Import Tariff on U.S. Pecan Export Quantity and Price Given an INELASTIC Export Supply of U.S. Pecans .................................................................. 27
vi
Economic Benchmark Model and Analysis of the Effects of the Chinese Tariff on the U.S. Pecan Industry
TABLE OF TABLES
Table 1. PecanMod Short-Run and Long-Run Price Elasticities .................................................. 21
Table 2. Chinese Tariffs on Imports of U.S. Pecans, 2007 – 2019 ............................................... 25
Table 3. Effects of Chinese Import Tariff Increases on U.S. Pecan Industry in 2017/18 and 2018/19 ......................................................................................................................................... 30
Table 4. Contribution of Tariff to Changes in the Pecan Industry from 2017/18 – 2018/19 ....... 33
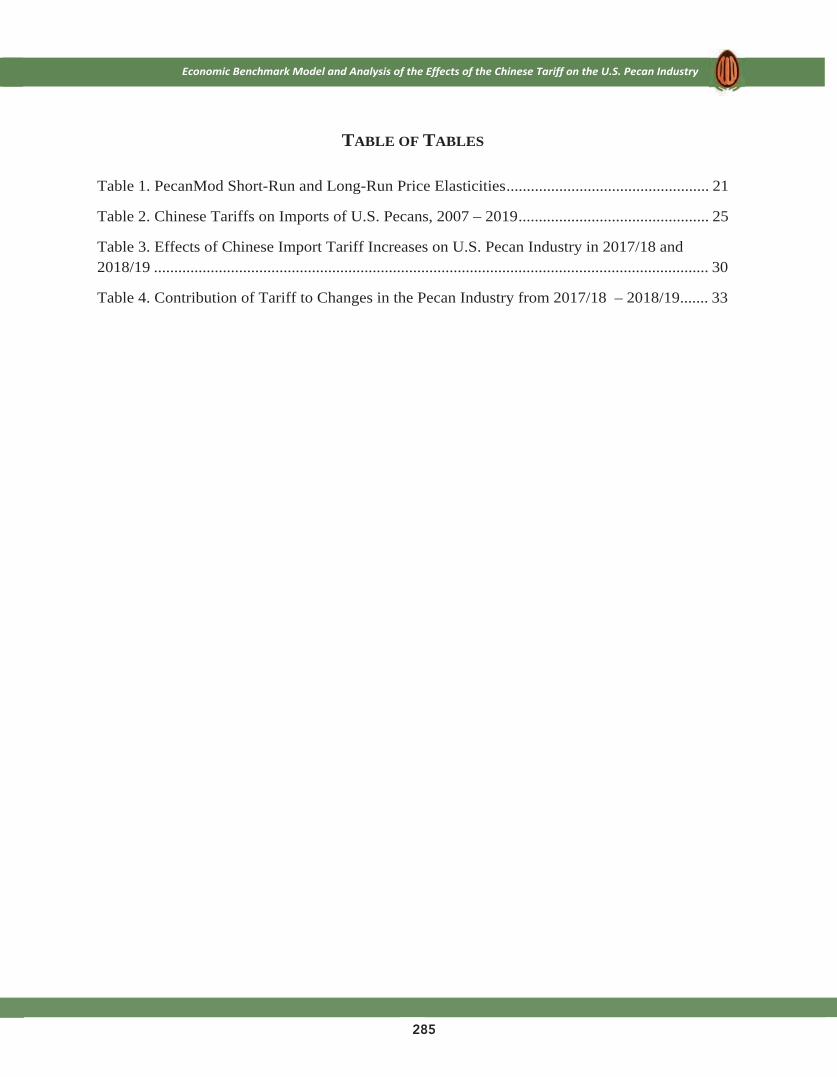
285
v
Economic Benchmark Model and Analysis of the Effects of the Chinese Tariff on the U.S. Pecan Industry
TABLE OF FIGURES
Figure 1. Economic Structure of the U.S. Pecan Industry (No Data Gaps) .................................... 4
Figure 2. U.S. In-Shell Pecan Production by Type, 1919 – 2019 ................................................... 6
Figure 3. Total U.S. In-Shell Pecan Production, 1919 – 2019 ........................................................ 6
Figure 4. U.S. In-Shell Pecan Production by State and Total Production Value, 2009 – 2018 ...... 7
Figure 5. U.S. Pecan Bearing Acreage by State, 2016 – 2019 ....................................................... 7
Figure 6. U.S. Pecan Yields by State, 2016 – 2019 ........................................................................ 8
Figure 7. U.S. Pecan Supply and Utilization (Shelled Basis), 1980/81 – 2018/19 ....................... 10
Figure 8. U.S. Per Capita Consumption of Pecans (Shelled Basis), 1977/78 – 2018/19 .............. 10
Figure 9. U.S. Pecan Exports by Country (Shelled Basis), 1988/89 – 2018/19 ........................... 11
Figure 10. Pecan Prices (In-Shell) Received by Producers by Type, 1922/23 – 2018/19 ............ 12
Figure 11. Nominal and Inflation-Adjusted (1922=100) Pecan Price Received by Farmers (In-Shell), 1922/23 – 2018/19 ....................................................................................................... 13
Figure 12. Pecan Prices (Shelled Basis): Producer, Export, and Import, 1988/89 – 2018/19 ...... 13
Figure 13. Reduced Data-Supported Economic Structure of the U.S. Pecan Industry Due to Data Gaps .................................................................................................................................. 15
Figure 14. PecanMod Structure .................................................................................................... 17
Figure 15. PecanMod Equations ................................................................................................... 18
Figure 16. PecanMod Variable Definitions .................................................................................. 19
Figure 17. Effect of a Chinese Import Tariff on U.S. Pecan Export Quantity and Price .............. 26
Figure 18. Effect of a Chinese Import Tariff on U.S. Pecan Export Quantity and Price Given an ELASTIC Export Supply of U.S. Pecans ...................................................................... 26
Figure 19. Effect of a Chinese Import Tariff on U.S. Pecan Export Quantity and Price Given an INELASTIC Export Supply of U.S. Pecans .................................................................. 27
vi
Economic Benchmark Model and Analysis of the Effects of the Chinese Tariff on the U.S. Pecan Industry
TABLE OF TABLES
Table 1. PecanMod Short-Run and Long-Run Price Elasticities .................................................. 21
Table 2. Chinese Tariffs on Imports of U.S. Pecans, 2007 – 2019 ............................................... 25
Table 3. Effects of Chinese Import Tariff Increases on U.S. Pecan Industry in 2017/18 and 2018/19 ......................................................................................................................................... 30
Table 4. Contribution of Tariff to Changes in the Pecan Industry from 2017/18 – 2018/19 ....... 33
286
1
Economic Benchmark Model and Analysis of the Effects of the Chinese Tariff on the U.S. Pecan Industry
ECONOMIC BENCHMARK MODEL AND ANALYSIS OF THE EFFECTS OF THE
CHINESE TARIFF ON THE U.S. PECAN INDUSTRYIntroduction
Strategic decision-making in any U.S. crop industry requires good information regarding the effects of changes in U.S. and foreign government policies, weather, macroeconomic conditions, disease issues, and other key market influencers on production, utilization, and prices not only in the domestic market but also in foreign markets. The extensive information and data available on the structure and functioning of major U.S. field crop and livestock markets have enabled both public (USDA) and private groups (FAPRI and others) to develop policy and forecast tools to analyze the impacts of policy shifts or market changes on markets and producer profitability. In contrast, the data and information relating to the structure and functioning of U.S. pecan markets is much more limited. In addition, the off-and-on-year behavior of pecan production has infused considerable year-to-year and long-term variability into U.S. pecan markets which swamps the influence of both economic and policy variables on those markets. With both limited data and a high degree of biologically induced market variability, little effort has been made in the past to develop reliable economic models for the pecan industry to aid in strategic economic and policy decision-making. The beginning point in developing a useful economic model for the pecan industry is to determine what relevant research may have already been done. Thus, for this project we first conducted an in-depth review of published pecan industry modeling efforts to gain insights on the state of research efforts, research challenges, and appropriate methodologies. The next step was to define the economic structure of the industry and the data needed to model how the industry functions. Gaps in the data were identified which required adjustments in the specification of the industry model. A database for the major activities in the pecan industry was developed to support the development of a baseline economic model that replicates the structure and functioning of the pecan industry to the extent of the available data. The model developed based on the available data (known as PecanMod) is capable of analyzing impacts on the U.S. pecan industry (production, utilization, price, trade, etc.) from major market changes and policy shifts. The model includes functions that identify the key factors (drivers) that influence U.S. pecan supply, demand, trade (exports and imports), and other supply chain activities as allowed by the data. The model will allow economic analyses of the impacts of various issues facing the U.S. pecan industry. In this report, we first review past research to analyze economic behavior in the U.S. pecan industry. We then discuss the structure of the U.S. pecan industry, identify the data needed to model the economic activities of the industry and evaluate the critical data gaps that exist. Next, we briefly discuss the model of the U.S. pecan industry developed to replicate the functioning of
2
Economic Benchmark Model and Analysis of the Effects of the Chinese Tariff on the U.S. Pecan Industry
the industry (PecanMod). A more detailed technical documentation of the model can be provided separately. Then, to demonstrate the features and usefulness of PecanMod, we use the model to perform an analysis of the impact of the Chinese import tariffs in 2017/18 and 2018/19 on U.S. pecan production prices, consumption, inventories, exports, imports, and industry revenue. At the end, we offer some comments on future uses of PecanMod and the continued evolution of the model required to insure that the model captures the full dynamics of the U.S. pecan industry.
Past Research on Modeling the U.S. Pecan Industry
A number of economic studies have analyzed various components of the U.S. pecan industry. In this section, we provide an overview of the main studies that have been done. A more detailed chronological review of these studies is provided in Appendix 1. Although providing insights on various aspects of the pecan industry, past studies have provided only a fragmented view of the key activities and functions of the U.S. pecan industry. Jones et al. (1932) was the first study to provide basic economic information to assist the development of the pecan industry through a survey focused on production, cost of production, and marketing. Palma and Chavez (2015) provided a more current overview of the pecan industry in the United States and the potential effects on supply and demand from the proposed Federal Marketing Order (FMO) for pecans. Florkowski, Purcell, and Hubbard (1992) surveyed pecan growers from Georgia to provide information about knowledge of and perceived adequacy of pecan quality standards. Wood (1993), Shafer (1996), Reid and Hunt (2000), and Wood (2001) all focused on production relationships for pecans. Onunkwo and Epperson (2000) dealt with the impacts of federal promotion programs on the foreign demand for U.S. pecans. Ibrahim and Florkowski (2005) analyzed the relationship between the pecan price and pecan cold storage inventory behavior. A 2007 study by the same authors examined the relationship between shelled pecan prices and inventories. Moore, Williams, Palma, and Lombardini (2009) conducted an evaluation of the economic effectiveness of the Texas Pecan Checkoff Program in expanding sales of Texas pecans. Kim and Dharmasena (2018) discussed price linkages across pecan producing states, particularly Georgia and Texas. Sumner and Hanon (2018) as well as Williams, Capps, and Salin (2018) considered the potential impacts of retaliatory tariffs on pecans. The majority of previous studies, however, centered attention on the demand for pecans (Lehrner, 1959; Dhaliwal, 1972; Wells, Miller, and Thompson, 1986; Florkowski, You, and Huang, 1999; Park and Florkowski, 1999; and Cheng, Dharmasena, and Capps, 2019). While providing many important insights on the U.S. pecan industry, none of the previous economic research efforts attempted to develop a viable structural model of the U.S. pecan industry for at least two reasons. First, the lack of critical data has made efforts to analyze more than a few

287
1
Economic Benchmark Model and Analysis of the Effects of the Chinese Tariff on the U.S. Pecan Industry
ECONOMIC BENCHMARK MODEL AND ANALYSIS OF THE EFFECTS OF THE
CHINESE TARIFF ON THE U.S. PECAN INDUSTRYIntroduction
Strategic decision-making in any U.S. crop industry requires good information regarding the effects of changes in U.S. and foreign government policies, weather, macroeconomic conditions, disease issues, and other key market influencers on production, utilization, and prices not only in the domestic market but also in foreign markets. The extensive information and data available on the structure and functioning of major U.S. field crop and livestock markets have enabled both public (USDA) and private groups (FAPRI and others) to develop policy and forecast tools to analyze the impacts of policy shifts or market changes on markets and producer profitability. In contrast, the data and information relating to the structure and functioning of U.S. pecan markets is much more limited. In addition, the off-and-on-year behavior of pecan production has infused considerable year-to-year and long-term variability into U.S. pecan markets which swamps the influence of both economic and policy variables on those markets. With both limited data and a high degree of biologically induced market variability, little effort has been made in the past to develop reliable economic models for the pecan industry to aid in strategic economic and policy decision-making. The beginning point in developing a useful economic model for the pecan industry is to determine what relevant research may have already been done. Thus, for this project we first conducted an in-depth review of published pecan industry modeling efforts to gain insights on the state of research efforts, research challenges, and appropriate methodologies. The next step was to define the economic structure of the industry and the data needed to model how the industry functions. Gaps in the data were identified which required adjustments in the specification of the industry model. A database for the major activities in the pecan industry was developed to support the development of a baseline economic model that replicates the structure and functioning of the pecan industry to the extent of the available data. The model developed based on the available data (known as PecanMod) is capable of analyzing impacts on the U.S. pecan industry (production, utilization, price, trade, etc.) from major market changes and policy shifts. The model includes functions that identify the key factors (drivers) that influence U.S. pecan supply, demand, trade (exports and imports), and other supply chain activities as allowed by the data. The model will allow economic analyses of the impacts of various issues facing the U.S. pecan industry. In this report, we first review past research to analyze economic behavior in the U.S. pecan industry. We then discuss the structure of the U.S. pecan industry, identify the data needed to model the economic activities of the industry and evaluate the critical data gaps that exist. Next, we briefly discuss the model of the U.S. pecan industry developed to replicate the functioning of
2
Economic Benchmark Model and Analysis of the Effects of the Chinese Tariff on the U.S. Pecan Industry
the industry (PecanMod). A more detailed technical documentation of the model can be provided separately. Then, to demonstrate the features and usefulness of PecanMod, we use the model to perform an analysis of the impact of the Chinese import tariffs in 2017/18 and 2018/19 on U.S. pecan production prices, consumption, inventories, exports, imports, and industry revenue. At the end, we offer some comments on future uses of PecanMod and the continued evolution of the model required to insure that the model captures the full dynamics of the U.S. pecan industry.
Past Research on Modeling the U.S. Pecan Industry
A number of economic studies have analyzed various components of the U.S. pecan industry. In this section, we provide an overview of the main studies that have been done. A more detailed chronological review of these studies is provided in Appendix 1. Although providing insights on various aspects of the pecan industry, past studies have provided only a fragmented view of the key activities and functions of the U.S. pecan industry. Jones et al. (1932) was the first study to provide basic economic information to assist the development of the pecan industry through a survey focused on production, cost of production, and marketing. Palma and Chavez (2015) provided a more current overview of the pecan industry in the United States and the potential effects on supply and demand from the proposed Federal Marketing Order (FMO) for pecans. Florkowski, Purcell, and Hubbard (1992) surveyed pecan growers from Georgia to provide information about knowledge of and perceived adequacy of pecan quality standards. Wood (1993), Shafer (1996), Reid and Hunt (2000), and Wood (2001) all focused on production relationships for pecans. Onunkwo and Epperson (2000) dealt with the impacts of federal promotion programs on the foreign demand for U.S. pecans. Ibrahim and Florkowski (2005) analyzed the relationship between the pecan price and pecan cold storage inventory behavior. A 2007 study by the same authors examined the relationship between shelled pecan prices and inventories. Moore, Williams, Palma, and Lombardini (2009) conducted an evaluation of the economic effectiveness of the Texas Pecan Checkoff Program in expanding sales of Texas pecans. Kim and Dharmasena (2018) discussed price linkages across pecan producing states, particularly Georgia and Texas. Sumner and Hanon (2018) as well as Williams, Capps, and Salin (2018) considered the potential impacts of retaliatory tariffs on pecans. The majority of previous studies, however, centered attention on the demand for pecans (Lehrner, 1959; Dhaliwal, 1972; Wells, Miller, and Thompson, 1986; Florkowski, You, and Huang, 1999; Park and Florkowski, 1999; and Cheng, Dharmasena, and Capps, 2019). While providing many important insights on the U.S. pecan industry, none of the previous economic research efforts attempted to develop a viable structural model of the U.S. pecan industry for at least two reasons. First, the lack of critical data has made efforts to analyze more than a few

288
3
Economic Benchmark Model and Analysis of the Effects of the Chinese Tariff on the U.S. Pecan Industry
aspects of the industry difficult if not impossible. Nevertheless, past studies have failed to address missing data issues for the key components of the pecan industry. Second, the dynamic nature of the pecan industry derived from the on-off production behavior of pecan trees has injected a high degree of variability into pecan markets over the years, which has swamped economic forces making statistical efforts to disentangle the economic drivers from the biological drivers in pecan markets quite difficult. This study bridges the gaps in the economic literature using available data. Specifically, we develop a model of the U.S. pecan industry taking into account production relationships, import supply, export demand, domestic demand, and price linkages consistent with available data. We address data issues and use available data for the period of 1980 to 2018 to conduct an empirical analysis of the key relationships in the industry as allowed by the data. To demonstrate the usefulness of the model, we analyze the effects of the Chinese import tariff on U.S. pecans.
Structure of the U.S. Pecan Industry
The structure of the U.S. pecan industry is complex as depicted in Figure 1. At the left of that figure, pecan growers across the U.S. Eastern and Western regions plant, remove, and maintain existing pecan trees and harvest both improved varieties as well as native/seedling pecans. Pecan production is highly variable from year to year due to the alternate bearing behavior of pecan trees (on/off production behavior). Alternate bearing is a biological phenomenon where trees bear heavy and light crops in alternate years. The consequence is a high degree of year-to-year variability in U.S. pecan production. The variability in production in transmitted through the supply chain to processing and handling and all the way to end uses and prices. U.S. pecan production is divided into two main groups, native/seedling (“wild”) and improved varieties. Native pecans tend to have thicker shells and smaller nuts than improved varieties (Nesbitt, Stein, and Kamas, 2013). The more thin-shelled improved varieties are preferred in commercial use because they are more easily shelled and tend to yield more pecan meat per pound of in-shell nuts. Different pecan varieties tend have varying oil content, which affects the texture and flavor of the pecan kernel (Nesbitt, Stein, and Kamas, 2013). Newly planted pecan trees will become harvestable in five to eight years and can be productive for 100 years or longer (Call, Gibson, and Kilby, 2006). Profit margins are often more narrow for native pecans (Nesbitt, Stein, and Kamas, 2010). Managed native pecan groves tend to produce 500 to 1,000 pounds of nuts per acre per year while native pecans can produce from 1,000 pounds to 2,000 pounds per acre per year, each with high yields one year and low the next.

289
3
Economic Benchmark Model and Analysis of the Effects of the Chinese Tariff on the U.S. Pecan Industry
aspects of the industry difficult if not impossible. Nevertheless, past studies have failed to address missing data issues for the key components of the pecan industry. Second, the dynamic nature of the pecan industry derived from the on-off production behavior of pecan trees has injected a high degree of variability into pecan markets over the years, which has swamped economic forces making statistical efforts to disentangle the economic drivers from the biological drivers in pecan markets quite difficult. This study bridges the gaps in the economic literature using available data. Specifically, we develop a model of the U.S. pecan industry taking into account production relationships, import supply, export demand, domestic demand, and price linkages consistent with available data. We address data issues and use available data for the period of 1980 to 2018 to conduct an empirical analysis of the key relationships in the industry as allowed by the data. To demonstrate the usefulness of the model, we analyze the effects of the Chinese import tariff on U.S. pecans.
Structure of the U.S. Pecan Industry
The structure of the U.S. pecan industry is complex as depicted in Figure 1. At the left of that figure, pecan growers across the U.S. Eastern and Western regions plant, remove, and maintain existing pecan trees and harvest both improved varieties as well as native/seedling pecans. Pecan production is highly variable from year to year due to the alternate bearing behavior of pecan trees (on/off production behavior). Alternate bearing is a biological phenomenon where trees bear heavy and light crops in alternate years. The consequence is a high degree of year-to-year variability in U.S. pecan production. The variability in production in transmitted through the supply chain to processing and handling and all the way to end uses and prices. U.S. pecan production is divided into two main groups, native/seedling (“wild”) and improved varieties. Native pecans tend to have thicker shells and smaller nuts than improved varieties (Nesbitt, Stein, and Kamas, 2013). The more thin-shelled improved varieties are preferred in commercial use because they are more easily shelled and tend to yield more pecan meat per pound of in-shell nuts. Different pecan varieties tend have varying oil content, which affects the texture and flavor of the pecan kernel (Nesbitt, Stein, and Kamas, 2013). Newly planted pecan trees will become harvestable in five to eight years and can be productive for 100 years or longer (Call, Gibson, and Kilby, 2006). Profit margins are often more narrow for native pecans (Nesbitt, Stein, and Kamas, 2010). Managed native pecan groves tend to produce 500 to 1,000 pounds of nuts per acre per year while native pecans can produce from 1,000 pounds to 2,000 pounds per acre per year, each with high yields one year and low the next.
4
Economic Benchmark Model and Analysis of the Effects of the Chinese Tariff on the U.S. Pecan Industry
Figure 1. Economic Structure of the U.S. Pecan Industry (No Data Gaps)

290
5
Economic Benchmark Model and Analysis of the Effects of the Chinese Tariff on the U.S. Pecan Industry
U.S. pecan production was almost equally split between native and improved varieties in the 1940s through the 1960s and 1970s (Figure 2). Since then, however, improved pecan production has continued to grow while that of native pecans has declined precipitously. From a high of 164.5 million in-shell pounds in 1981 (48.5% of U.S. production), native pecan production declined by nearly 92% to only 14.5 million in-shell pounds in 2018 (6.0% of U.S. production). Over the same period, improved pecan variety production grew by 20% to 228.5 million in-shell pounds, about 94.0% of all U.S. pecan production. In 2019, the production of both improved and native varieties recovered somewhat to 253.2 million pounds and 27.8 million pounds, respectively. The high degree of year-to-year variability of U.S. pecan production over the years resulting from the alternate bearing behavior of pecan tress is evident in Figure 2 for both native and improved varieties and in Figure 3 for all pecans. Despite the sharp decline in native pecan production that occurred over time, the growth in improved pecan variety production more than made up for the native production decline until the last decade (2009 – 2019). Since 2009, total production has demonstrated little trend and a marked decline in variability, varying between about 250 million pounds and 300 million pounds over that period (Figure 3). The average year-to-year variation in production since 2009 was only about 12% compared to nearly 50% between 1990 and 2008. Three states accounted for about 76% of U.S. pecan production (utilized) on average over the last decade, including Georgia (32.9%), New Mexico (26.8%), and Texas (16.4%) (Figure 4). The top five states (including Oklahoma and Arizona) accounted for nearly 90% over that period. As well as having the largest pecan production, Georgia accounted for the largest share of bearing acreage of any state (29.2%) over 2016 to 2018 followed by Texas (27.3%), Oklahoma (22.5%), New Mexico (10.8%), and Arizona (4.0%), and other states (6.2%) (Figure 5). Although Georgia accounted for the largest bearing acreage and the largest production over that same period, the three states with only improved pecan production accounted for the highest yields per acre including New Mexico (1,965 pounds), Arizona (1,717 pounds), and Georgia (770.0 pounds) (Figure 6). With improved varieties accounting for 58% of its bearing acreage and native/seedling 42%, Texas bearing acres yielded an average of 288.7 pounds per acre over 2016 to 2018. The native/seedling share of bearing acreage in Oklahoma is higher than in Texas at about 77% with only 23% in improved varieties. Consequently, the average pecan yield in Oklahoma was lower at 180.3 pounds per acre over 2016 to 2018. In 2018, U.S. pecan production dropped by 27.4% to 175 million pounds (see Figure 4). At the same time, U.S. pecan production value dropped nearly in half (45.5%). Hurricane Michael severely damaged pecan trees in Georgia, downing trees, breaking tree limbs, and blowing nuts off trees. In addition, USDA reported that wet conditions in the summer months fostered disease
6
Economic Benchmark Model and Analysis of the Effects of the Chinese Tariff on the U.S. Pecan Industry
Figure 2. U.S. In-Shell Pecan Production by Type, 1919 – 2019
Source: Developed by authors based on data from USDA (2019a). Figure 3. Total U.S. In-Shell Pecan Production, 1919 – 2019
Source: Developed by authors based on data from USDA (2019a).
0
50
100
150
200
250
300
350
mill
ion
poun
ds
Improved Varieties Native and Seedling
0
50
100
150
200
250
300
350
400
450
mill
ion
poun
ds

291
5
Economic Benchmark Model and Analysis of the Effects of the Chinese Tariff on the U.S. Pecan Industry
U.S. pecan production was almost equally split between native and improved varieties in the 1940s through the 1960s and 1970s (Figure 2). Since then, however, improved pecan production has continued to grow while that of native pecans has declined precipitously. From a high of 164.5 million in-shell pounds in 1981 (48.5% of U.S. production), native pecan production declined by nearly 92% to only 14.5 million in-shell pounds in 2018 (6.0% of U.S. production). Over the same period, improved pecan variety production grew by 20% to 228.5 million in-shell pounds, about 94.0% of all U.S. pecan production. In 2019, the production of both improved and native varieties recovered somewhat to 253.2 million pounds and 27.8 million pounds, respectively. The high degree of year-to-year variability of U.S. pecan production over the years resulting from the alternate bearing behavior of pecan tress is evident in Figure 2 for both native and improved varieties and in Figure 3 for all pecans. Despite the sharp decline in native pecan production that occurred over time, the growth in improved pecan variety production more than made up for the native production decline until the last decade (2009 – 2019). Since 2009, total production has demonstrated little trend and a marked decline in variability, varying between about 250 million pounds and 300 million pounds over that period (Figure 3). The average year-to-year variation in production since 2009 was only about 12% compared to nearly 50% between 1990 and 2008. Three states accounted for about 76% of U.S. pecan production (utilized) on average over the last decade, including Georgia (32.9%), New Mexico (26.8%), and Texas (16.4%) (Figure 4). The top five states (including Oklahoma and Arizona) accounted for nearly 90% over that period. As well as having the largest pecan production, Georgia accounted for the largest share of bearing acreage of any state (29.2%) over 2016 to 2018 followed by Texas (27.3%), Oklahoma (22.5%), New Mexico (10.8%), and Arizona (4.0%), and other states (6.2%) (Figure 5). Although Georgia accounted for the largest bearing acreage and the largest production over that same period, the three states with only improved pecan production accounted for the highest yields per acre including New Mexico (1,965 pounds), Arizona (1,717 pounds), and Georgia (770.0 pounds) (Figure 6). With improved varieties accounting for 58% of its bearing acreage and native/seedling 42%, Texas bearing acres yielded an average of 288.7 pounds per acre over 2016 to 2018. The native/seedling share of bearing acreage in Oklahoma is higher than in Texas at about 77% with only 23% in improved varieties. Consequently, the average pecan yield in Oklahoma was lower at 180.3 pounds per acre over 2016 to 2018. In 2018, U.S. pecan production dropped by 27.4% to 175 million pounds (see Figure 4). At the same time, U.S. pecan production value dropped nearly in half (45.5%). Hurricane Michael severely damaged pecan trees in Georgia, downing trees, breaking tree limbs, and blowing nuts off trees. In addition, USDA reported that wet conditions in the summer months fostered disease
6
Economic Benchmark Model and Analysis of the Effects of the Chinese Tariff on the U.S. Pecan Industry
Figure 2. U.S. In-Shell Pecan Production by Type, 1919 – 2019
Source: Developed by authors based on data from USDA (2019a). Figure 3. Total U.S. In-Shell Pecan Production, 1919 – 2019
Source: Developed by authors based on data from USDA (2019a).
0
50
100
150
200
250
300
350
mill
ion
poun
ds
Improved Varieties Native and Seedling
0
50
100
150
200
250
300
350
400
450
mill
ion
poun
ds

292
7
Economic Benchmark Model and Analysis of the Effects of the Chinese Tariff on the U.S. Pecan Industry
Figure 4. U.S. In-Shell Pecan Production by State and Total Production Value, 2009 – 2018
Source: Developed by authors based on data from USDA (2019a).
Figure 5. U.S. Pecan Bearing Acreage by State, 2016 – 2019
Source: Developed by authors based on data from USDA (2019a).
0
100
200
300
400
500
600
700
800
0
50
100
150
200
250
300
350
2009 2010 2011 2012 2013 2014 2015 2016 2017 2018
$ m
illio
ns
mill
ion
poun
ds
Georgia New Mexico Texas Oklahoma Arizona Other States U.S. Production Value
0
50,000
100,000
150,000
200,000
250,000
300,000
350,000
400,000
450,000
2016 2017 2018
acre
s
Georgia Texas Oklahoma New Mexico Arizona Other States
8
Economic Benchmark Model and Analysis of the Effects of the Chinese Tariff on the U.S. Pecan Industry
Figure 6. U.S. Pecan Yields by State, 2016 – 2019
Source: Developed by authors based on data from USDA (2019a).
issues and limited the harvest of nuts blown off trees (USDA, 2019a). As a result, Georgia’s production plunged by 47.6% and its share of U.S. production sank from 35.1% in 2017 to 25.4% in 2018. Despite a 2% drop in its production, New Mexico became the top U.S. pecan producing state with 40.7% of the lower U.S. production n 2018. A steep 42.9% decline in Texas pecan production that year was reportedly due to a low alternate-year bearing production cycle yield (NASS, 2019b). Oklahoma also suffered a sharp decline in production that year (35.7%), while Arizona experienced a smaller reduction (8.9%). As shown in the center of Figure 1, growers have historically sold the majority of their pecans to accumulators, companies that act as brokers, selling the nuts to shellers and paying the growers a percentage based on the final price they receive for the crop. In recent years, growers have increasingly diversified their sales portfolio to include wholesalers who sell to various users, direct to shellers or exporters, and even direct to retail destinations such as local farmer’s markets and on-line sales. Shellers sell the processed (shelled nuts) to end users both in U.S. markets including industrial users (confectioners, ice cream makers, bakeries, and others), retailers (local, regional, and national food/grocery stores, restaurants, and others) and in foreign markets (China, Hong Kong, Vietnam, Canada, Mexico, and the EU among many others) (right-hand side of Figure 1). Unfortunately, little historical, reliable, or consistent data for most of those activities are available.
0
500
1,000
1,500
2,000
2,500
2016 2017 2018
poun
ds p
er a
cre
New Mexico Arizona Georgia Texas Oklahoma

293
7
Economic Benchmark Model and Analysis of the Effects of the Chinese Tariff on the U.S. Pecan Industry
Figure 4. U.S. In-Shell Pecan Production by State and Total Production Value, 2009 – 2018
Source: Developed by authors based on data from USDA (2019a).
Figure 5. U.S. Pecan Bearing Acreage by State, 2016 – 2019
Source: Developed by authors based on data from USDA (2019a).
0
100
200
300
400
500
600
700
800
0
50
100
150
200
250
300
350
2009 2010 2011 2012 2013 2014 2015 2016 2017 2018
$ m
illio
ns
mill
ion
poun
ds
Georgia New Mexico Texas Oklahoma Arizona Other States U.S. Production Value
0
50,000
100,000
150,000
200,000
250,000
300,000
350,000
400,000
450,000
2016 2017 2018
acre
s
Georgia Texas Oklahoma New Mexico Arizona Other States
8
Economic Benchmark Model and Analysis of the Effects of the Chinese Tariff on the U.S. Pecan Industry
Figure 6. U.S. Pecan Yields by State, 2016 – 2019
Source: Developed by authors based on data from USDA (2019a).
issues and limited the harvest of nuts blown off trees (USDA, 2019a). As a result, Georgia’s production plunged by 47.6% and its share of U.S. production sank from 35.1% in 2017 to 25.4% in 2018. Despite a 2% drop in its production, New Mexico became the top U.S. pecan producing state with 40.7% of the lower U.S. production n 2018. A steep 42.9% decline in Texas pecan production that year was reportedly due to a low alternate-year bearing production cycle yield (NASS, 2019b). Oklahoma also suffered a sharp decline in production that year (35.7%), while Arizona experienced a smaller reduction (8.9%). As shown in the center of Figure 1, growers have historically sold the majority of their pecans to accumulators, companies that act as brokers, selling the nuts to shellers and paying the growers a percentage based on the final price they receive for the crop. In recent years, growers have increasingly diversified their sales portfolio to include wholesalers who sell to various users, direct to shellers or exporters, and even direct to retail destinations such as local farmer’s markets and on-line sales. Shellers sell the processed (shelled nuts) to end users both in U.S. markets including industrial users (confectioners, ice cream makers, bakeries, and others), retailers (local, regional, and national food/grocery stores, restaurants, and others) and in foreign markets (China, Hong Kong, Vietnam, Canada, Mexico, and the EU among many others) (right-hand side of Figure 1). Unfortunately, little historical, reliable, or consistent data for most of those activities are available.
0
500
1,000
1,500
2,000
2,500
2016 2017 2018
poun
ds p
er a
cre
New Mexico Arizona Georgia Texas Oklahoma

294
9
Economic Benchmark Model and Analysis of the Effects of the Chinese Tariff on the U.S. Pecan Industry
The domestic utilization of pecans across all end users (retailers and industrial users as shown in Figure 1) has varied substantially over the years with major peaks since 1980/81 occurring in 1988/89 (152.6 million pounds), 2010/11 (164.5 million pounds), 2014/15 (155.9 million pounds), and 2018/19 (174.5 million pounds) (Figure 7). Major lows over that period occurred in 1980/81 (97.8 million pounds), 1992/93 (101.3 million pounds), 1994/95 (98.8 million pounds), 2011/12 (114.0 million pounds), and 2013/14 (111.8 million pounds). Domestic utilization has exhibited a generally upward trend over the last decade, however, from an average of 120.2 million pounds in the 1980s to an average of 143.3 million pounds since 2010/11, an increase of 19.2%. Nevertheless, per capita consumption has varied little over that period, remaining between about 0.40 pounds and 0.50 pounds (Figure 8). Since the low of 111.8 million pounds in 2013/14, U.S. pecan consumption grew by half (56.1%) to a record 174.5 million pounds last year, despite the sharp drop in domestic production that year (Figure 7). The record consumption in 2018/19 was likely facilitated by several factors: (1) a 24.9% decline in the in-shell price of pecans, (2) an associated 19.8% reduction of pecan exports, (3) an increase in imports of 18.9% to a record 163 million pounds, and other factor such pecan promotion efforts under the auspices of the Federal Marketing Order for pecans. While generally considered a negative factor in U.S. pecan markets, the Chinese tariff increase nevertheless was well-timed to reduce export demand in 2018/19 when domestic production was at its lowest level since 2006/07. With growing demand from both export markets and domestic users and lack of growth in domestic production, shellers and other domestic users have increasingly turned to imports, almost all from Mexico, to meet domestic supply needs (bottom right corner of Figure 1). Imports accounted for 40% - 42% of total U.S. pecan supplies from 2015/16 through 2017/18 but jumped to nearly 47% with the drop in U.S. production in 2018/19 (Figure 7). Imports have exceeded exports in most years over the last several decades. Nevertheless, exports have grown in importance as an outlet for U.S. pecans (top right corner of Figure 1). As a share of the total utilization of pecans, exports have increased from around 10% in the mid-1990s to over 30% in most years since 2011/12 given the general lack of growth in domestic utilization (Figure 7). A combination of the increased tariff on U.S. pecan imports into China and the production drop in 2018/19 helped reduce the export share of total utilization that year to only 26% (Figure7). Although the United States exports pecans to numerous countries, generally 75% to 80% have been exported to two groups of countries over the last decade: (1) China, Vietnam, and Hong Kong (CVH) and (2) Mexico (Figure 9). Until last year, CVH accounted for 50% -60% of U.S. pecan exports and Mexico for 20% -25%. Hong Kong has been the largest export market for U.S. pecans although much of the pecans are transshipped to China. The same is likely the case for Vietnam. Because the extent of transshipments to China through Hong Kong and Vietnam is not
10
Economic Benchmark Model and Analysis of the Effects of the Chinese Tariff on the U.S. Pecan Industry
Figure 7. U.S. Pecan Supply and Utilization (Shelled Basis), 1980/81 – 2018/19
Source: Developed by authors based on data from USDA (2019b).
Figure 8. U.S. Per Capita Consumption of Pecans (Shelled Basis), 1977/78 – 2018/19
Source: Developed by authors based on data from USDA (2019b).
0
20
40
60
80
100
120
140
160
180
200
mill
ion
poun
ds
Utilized Production Domestc Utilization Exports Imports
0.00
0.10
0.20
0.30
0.40
0.50
0.60
0.70
poun
ds p
er c
apita

295
9
Economic Benchmark Model and Analysis of the Effects of the Chinese Tariff on the U.S. Pecan Industry
The domestic utilization of pecans across all end users (retailers and industrial users as shown in Figure 1) has varied substantially over the years with major peaks since 1980/81 occurring in 1988/89 (152.6 million pounds), 2010/11 (164.5 million pounds), 2014/15 (155.9 million pounds), and 2018/19 (174.5 million pounds) (Figure 7). Major lows over that period occurred in 1980/81 (97.8 million pounds), 1992/93 (101.3 million pounds), 1994/95 (98.8 million pounds), 2011/12 (114.0 million pounds), and 2013/14 (111.8 million pounds). Domestic utilization has exhibited a generally upward trend over the last decade, however, from an average of 120.2 million pounds in the 1980s to an average of 143.3 million pounds since 2010/11, an increase of 19.2%. Nevertheless, per capita consumption has varied little over that period, remaining between about 0.40 pounds and 0.50 pounds (Figure 8). Since the low of 111.8 million pounds in 2013/14, U.S. pecan consumption grew by half (56.1%) to a record 174.5 million pounds last year, despite the sharp drop in domestic production that year (Figure 7). The record consumption in 2018/19 was likely facilitated by several factors: (1) a 24.9% decline in the in-shell price of pecans, (2) an associated 19.8% reduction of pecan exports, (3) an increase in imports of 18.9% to a record 163 million pounds, and other factor such pecan promotion efforts under the auspices of the Federal Marketing Order for pecans. While generally considered a negative factor in U.S. pecan markets, the Chinese tariff increase nevertheless was well-timed to reduce export demand in 2018/19 when domestic production was at its lowest level since 2006/07. With growing demand from both export markets and domestic users and lack of growth in domestic production, shellers and other domestic users have increasingly turned to imports, almost all from Mexico, to meet domestic supply needs (bottom right corner of Figure 1). Imports accounted for 40% - 42% of total U.S. pecan supplies from 2015/16 through 2017/18 but jumped to nearly 47% with the drop in U.S. production in 2018/19 (Figure 7). Imports have exceeded exports in most years over the last several decades. Nevertheless, exports have grown in importance as an outlet for U.S. pecans (top right corner of Figure 1). As a share of the total utilization of pecans, exports have increased from around 10% in the mid-1990s to over 30% in most years since 2011/12 given the general lack of growth in domestic utilization (Figure 7). A combination of the increased tariff on U.S. pecan imports into China and the production drop in 2018/19 helped reduce the export share of total utilization that year to only 26% (Figure7). Although the United States exports pecans to numerous countries, generally 75% to 80% have been exported to two groups of countries over the last decade: (1) China, Vietnam, and Hong Kong (CVH) and (2) Mexico (Figure 9). Until last year, CVH accounted for 50% -60% of U.S. pecan exports and Mexico for 20% -25%. Hong Kong has been the largest export market for U.S. pecans although much of the pecans are transshipped to China. The same is likely the case for Vietnam. Because the extent of transshipments to China through Hong Kong and Vietnam is not
10
Economic Benchmark Model and Analysis of the Effects of the Chinese Tariff on the U.S. Pecan Industry
Figure 7. U.S. Pecan Supply and Utilization (Shelled Basis), 1980/81 – 2018/19
Source: Developed by authors based on data from USDA (2019b).
Figure 8. U.S. Per Capita Consumption of Pecans (Shelled Basis), 1977/78 – 2018/19
Source: Developed by authors based on data from USDA (2019b).
0
20
40
60
80
100
120
140
160
180
200
mill
ion
poun
ds
Utilized Production Domestc Utilization Exports Imports
0.00
0.10
0.20
0.30
0.40
0.50
0.60
0.70
poun
ds p
er c
apita

296
11
Economic Benchmark Model and Analysis of the Effects of the Chinese Tariff on the U.S. Pecan Industry
Figure 9. U.S. Pecan Exports by Country (Shelled Basis), 1988/89 – 2018/19
Source: Developed by authors based on data from USDA (2019c). known, the export volumes for the three countries are added together as a single importing group in Figure 9. With the drop in U.S. pecan supplies available for export in 2018/19 and the increase in the Chinese tariff on U.S. pecans, exports to CVH dropped from 76.8 million pounds in 2017/18 to just 16 million pounds in 2018/19, a drop of nearly 80%. Other major countries importing U.S. pecans (with 2018/19 percentages of total imports) include the Netherlands (11.6%), Canada (10.7%), Israel (5.2%), United Kingdom (4.8%), France (2.2%), and Japan (0.8%) (Figure 9). Although Figure 1 depicts the flow of pecans from production to end use, along with that flow are prices at each point along the value chain. At the production end are prices received by producers (in-shell) for native/seedling and improved varieties from each state (Figure 10). From an average of 98.5 cents/pound in the 1990s, the U.S. price of all pecans increased to an average of 206.0 cents/pound over the last decade (2009-2018) with an all-time high of 259.0 cents/pound in 2016. Improved variety prices have been above the average while prices of native pecans have traded at levels below the average. As the production of native pecans has declined over time, the average U.S. price and the price of improved varieties have become nearly the same.
0.0
20.0
40.0
60.0
80.0
100.0
120.0
mill
ion
poun
ds
China, Vietnam, Hong Kong Mexico Canada Netherlands Other
12
Economic Benchmark Model and Analysis of the Effects of the Chinese Tariff on the U.S. Pecan Industry
Figure 10. Pecan Prices (In-Shell) Received by Producers by Type, 1922/23 – 2018/19
Source: Developed by authors based on data from USDA (2019b). Although the increase in pecan prices over time appears impressive, when adjusted for inflation, the average price of pecans has changed little since the early 1920s (Figure 11). In fact, the inflation-adjusted (1922=100) price of pecans in 2018/19 (27.0 cents/pound) was nearly identical to the price of pecans in 1922 (26.6 cents/pound). In other words, the dollars earned from the sale of a pound of pecans in 2018 resulted in about the same purchasing power as the dollars earned from a pound of pecans in 1922. While the nominal price of pecans was increasing over time, the nominal prices of all other goods were increasing at about the same rate over time. That is, the price of pecans has increased at about the rate of inflation over time. Few other reliable, consistently available prices for pecans over a sufficiently long period of time to support empirical analysis are available at any level of the value chain. The Agricultural Marketing Service of USDA collects prices at various U.S. terminals (USDA 2019d). Those data are available only back to 1998 and are not well correlated with farm prices. Export prices and import prices for pecans are not available either. As proxies for those prices, export and import unit values can be calculated from export and import volume and value data (Figure 12). The pecan export unit value has been consistently higher than and closely correlated with the average U.S. pecan price received by producers on a shelled basis over time. The pecan import unit value
0.0
50.0
100.0
150.0
200.0
250.0
300.0
cent
s per
pou
nd
Improved Varieties Native and Seedling U.S. Average

297
11
Economic Benchmark Model and Analysis of the Effects of the Chinese Tariff on the U.S. Pecan Industry
Figure 9. U.S. Pecan Exports by Country (Shelled Basis), 1988/89 – 2018/19
Source: Developed by authors based on data from USDA (2019c). known, the export volumes for the three countries are added together as a single importing group in Figure 9. With the drop in U.S. pecan supplies available for export in 2018/19 and the increase in the Chinese tariff on U.S. pecans, exports to CVH dropped from 76.8 million pounds in 2017/18 to just 16 million pounds in 2018/19, a drop of nearly 80%. Other major countries importing U.S. pecans (with 2018/19 percentages of total imports) include the Netherlands (11.6%), Canada (10.7%), Israel (5.2%), United Kingdom (4.8%), France (2.2%), and Japan (0.8%) (Figure 9). Although Figure 1 depicts the flow of pecans from production to end use, along with that flow are prices at each point along the value chain. At the production end are prices received by producers (in-shell) for native/seedling and improved varieties from each state (Figure 10). From an average of 98.5 cents/pound in the 1990s, the U.S. price of all pecans increased to an average of 206.0 cents/pound over the last decade (2009-2018) with an all-time high of 259.0 cents/pound in 2016. Improved variety prices have been above the average while prices of native pecans have traded at levels below the average. As the production of native pecans has declined over time, the average U.S. price and the price of improved varieties have become nearly the same.
0.0
20.0
40.0
60.0
80.0
100.0
120.0
mill
ion
poun
ds
China, Vietnam, Hong Kong Mexico Canada Netherlands Other
12
Economic Benchmark Model and Analysis of the Effects of the Chinese Tariff on the U.S. Pecan Industry
Figure 10. Pecan Prices (In-Shell) Received by Producers by Type, 1922/23 – 2018/19
Source: Developed by authors based on data from USDA (2019b). Although the increase in pecan prices over time appears impressive, when adjusted for inflation, the average price of pecans has changed little since the early 1920s (Figure 11). In fact, the inflation-adjusted (1922=100) price of pecans in 2018/19 (27.0 cents/pound) was nearly identical to the price of pecans in 1922 (26.6 cents/pound). In other words, the dollars earned from the sale of a pound of pecans in 2018 resulted in about the same purchasing power as the dollars earned from a pound of pecans in 1922. While the nominal price of pecans was increasing over time, the nominal prices of all other goods were increasing at about the same rate over time. That is, the price of pecans has increased at about the rate of inflation over time. Few other reliable, consistently available prices for pecans over a sufficiently long period of time to support empirical analysis are available at any level of the value chain. The Agricultural Marketing Service of USDA collects prices at various U.S. terminals (USDA 2019d). Those data are available only back to 1998 and are not well correlated with farm prices. Export prices and import prices for pecans are not available either. As proxies for those prices, export and import unit values can be calculated from export and import volume and value data (Figure 12). The pecan export unit value has been consistently higher than and closely correlated with the average U.S. pecan price received by producers on a shelled basis over time. The pecan import unit value
0.0
50.0
100.0
150.0
200.0
250.0
300.0
cent
s per
pou
nd
Improved Varieties Native and Seedling U.S. Average

298
13
Economic Benchmark Model and Analysis of the Effects of the Chinese Tariff on the U.S. Pecan Industry
Figure 11. Nominal and Inflation-Adjusted (1922=100) Pecan Price Received by Farmers (In-Shell), 1922/23 – 2018/19
Source: Developed by authors based on data from USDA (2019b) and USDL (2019).
Figure 12. Pecan Prices (Shelled Basis): Producer, Export, and Import, 1988/89 – 2018/19
Source: Developed by authors based on data from USDA (2019b,c).
0.0
50.0
100.0
150.0
200.0
250.0
300.0
cent
s per
pou
nd
Nominal Real
0.0
100.0
200.0
300.0
400.0
500.0
600.0
700.0
cent
s per
pou
nd
Average Producer Price Import Unit Value Export Unit Value
14
Economic Benchmark Model and Analysis of the Effects of the Chinese Tariff on the U.S. Pecan Industry
(shelled basis) has been consistently lower than but still highly correlated with the producer price. While the producer price and the export unit value declined in 2018/19, the import unit value declined by less. In fact, the import unit value in 2018/19 was above the U.S. producer price for the first time since 2001/02 and approached the export unit value of U.S. pecans. Some of the support for the import price of pecans likely resulted from the demand by shellers and processors for imports to meet domestic pecan demand in a low domestic production year. However, some of the support may be due to Chinese demand for Mexican pecans as China’s pecan buyers shifted their purchasing habits to Mexico in the face of the increased cost to them of U.S. pecans due to the 47% tariff placed by the Chinese government on imports of U.S. pecans. According to one report, Mexico’s pecan exports to China increased by more than 3,000% in 2018 relative to the previous year (Produce Report, 2019). Mexican pecan exports to China are assessed only the 7% most favored nation (MFN) tariff. The preceding discussion demonstrates that while data related to the pecan industry are available, much data needed to characterize many critical activities in the U.S. pecan industry as depicted in Figure 1 are not available. Missing are historical, consistent, and reliable data on, for example, acreage planted and harvested, and trees removed (removals) by pecan variety or even by native and improved types, purchases by accumulators, wholesalers, and shellers, purchases by various retailers by type or as a group, purchases by various industrial users by type or as a group, and exports to specifically identified destinations. Price data associated with most of those activities also are not available for analysis. USDA has begun to collect data on pecan acreage and yield. However, given the long lag between the year when a pecan tree is planted and when that tree begins to produce, many years of acreage and yield data will need to be collected before those data are useful for empirical analysis. In addition, some of the available data are not useful or reliable for analysis such as exports by destination and terminal prices. Other available data are not specific as to type, such as domestic utilization for which there is no breakdown by retail or industrial uses. If we strip all activities of the pecan industry out of Figure 1 for which historical, consistent, and reliable quantity and price data are not available, then Figure 1 devolves to Figure 13. The result is a simplified depiction of the pecan industry. Note that much of what happens along the industry value chain between production and final utilization is missing from the picture. Major components of this smaller, more data-supported economic structure of the U.S. pecan industry include primarily utilized production (by improved and native/seedling varieties) and imports (by country of origin) on the supply side and ending stocks, U.S. disappearance, and exports on the demand side. Export data do not support an analysis of foreign demand by China specifically. Domestic utilization data do not support anything more than a crude analysis of total use other than exports and ending stocks.

299
13
Economic Benchmark Model and Analysis of the Effects of the Chinese Tariff on the U.S. Pecan Industry
Figure 11. Nominal and Inflation-Adjusted (1922=100) Pecan Price Received by Farmers (In-Shell), 1922/23 – 2018/19
Source: Developed by authors based on data from USDA (2019b) and USDL (2019).
Figure 12. Pecan Prices (Shelled Basis): Producer, Export, and Import, 1988/89 – 2018/19
Source: Developed by authors based on data from USDA (2019b,c).
0.0
50.0
100.0
150.0
200.0
250.0
300.0
cent
s per
pou
nd
Nominal Real
0.0
100.0
200.0
300.0
400.0
500.0
600.0
700.0
cent
s per
pou
nd
Average Producer Price Import Unit Value Export Unit Value
14
Economic Benchmark Model and Analysis of the Effects of the Chinese Tariff on the U.S. Pecan Industry
(shelled basis) has been consistently lower than but still highly correlated with the producer price. While the producer price and the export unit value declined in 2018/19, the import unit value declined by less. In fact, the import unit value in 2018/19 was above the U.S. producer price for the first time since 2001/02 and approached the export unit value of U.S. pecans. Some of the support for the import price of pecans likely resulted from the demand by shellers and processors for imports to meet domestic pecan demand in a low domestic production year. However, some of the support may be due to Chinese demand for Mexican pecans as China’s pecan buyers shifted their purchasing habits to Mexico in the face of the increased cost to them of U.S. pecans due to the 47% tariff placed by the Chinese government on imports of U.S. pecans. According to one report, Mexico’s pecan exports to China increased by more than 3,000% in 2018 relative to the previous year (Produce Report, 2019). Mexican pecan exports to China are assessed only the 7% most favored nation (MFN) tariff. The preceding discussion demonstrates that while data related to the pecan industry are available, much data needed to characterize many critical activities in the U.S. pecan industry as depicted in Figure 1 are not available. Missing are historical, consistent, and reliable data on, for example, acreage planted and harvested, and trees removed (removals) by pecan variety or even by native and improved types, purchases by accumulators, wholesalers, and shellers, purchases by various retailers by type or as a group, purchases by various industrial users by type or as a group, and exports to specifically identified destinations. Price data associated with most of those activities also are not available for analysis. USDA has begun to collect data on pecan acreage and yield. However, given the long lag between the year when a pecan tree is planted and when that tree begins to produce, many years of acreage and yield data will need to be collected before those data are useful for empirical analysis. In addition, some of the available data are not useful or reliable for analysis such as exports by destination and terminal prices. Other available data are not specific as to type, such as domestic utilization for which there is no breakdown by retail or industrial uses. If we strip all activities of the pecan industry out of Figure 1 for which historical, consistent, and reliable quantity and price data are not available, then Figure 1 devolves to Figure 13. The result is a simplified depiction of the pecan industry. Note that much of what happens along the industry value chain between production and final utilization is missing from the picture. Major components of this smaller, more data-supported economic structure of the U.S. pecan industry include primarily utilized production (by improved and native/seedling varieties) and imports (by country of origin) on the supply side and ending stocks, U.S. disappearance, and exports on the demand side. Export data do not support an analysis of foreign demand by China specifically. Domestic utilization data do not support anything more than a crude analysis of total use other than exports and ending stocks.

300
15
Economic Benchmark Model and Analysis of the Effects of the Chinese Tariff on the U.S. Pecan Industry
Figure 13. Reduced Data-Supported Economic Structure of the U.S. Pecan Industry Due to Data Gaps
ExportsUtilized
Production
Varieties Improved Native/
Seedling
Imports
U.S. Disappearance
Ending Stocks
(beginning stocks)
16
Economic Benchmark Model and Analysis of the Effects of the Chinese Tariff on t
PecanMod - A U.S. Pecan Industry Economic Benchmark Model
Despite the general lack of data available for modeling and conducting a detailed economic analysis of the complete U.S. pecan industry, we developed a relatively powerful economic model of the industry based on the available data, referred to as PecanMod. Building from Figure 13, reorganizing, and adding price linkages, the Structure of PecanMod is depicted in Figure 14. In the model, the supply-side activities (utilized native and improved variety pecan production (in- shell and converted to a shelled basis), beginning stocks, and imports) at the top of Figure 14 interact with demand-side activities (domestic utilization, export demand, and ending stocks) at the bottom of Figure 14 to determine producer prices (U.S. average, native, and improved) as well as export and import prices in a given year in the middle of Figure 14. The producer prices in that year then affect the production of improved and native pecans in the following year (dotted lines represent time lags). Together with import supplies and beginning stocks in the following year (which are ending stocks in the previous year), production in the following year interacts with demand activities in that year to determine prices in that year which then impact production in the following year and so on. Because no retail price of pecans is available (red box in Figure 14), we use the producer price (shelled basis) as a proxy assuming that the two prices are positively correlated to some extent. The schematic representation of PecanMod in Figure 14 can be laid out as a corresponding set of 13 equations in Figure 15. Each equation represents one of the 13 boxes in Figure 14. The variable names are defined in Figure 16. The relationships between the ten variables representing industry activities are represented in equations (1) and (2) (improved and native pecan production), equation (5) (pecan import supply), equation (6) (domestic pecan utilization), equation (7) (ending stock demand), and equation (8) (export demand) in Figure 14. Equations (10) through (13) represent the various price linkages in the model. The relationships between the variables on the left hand side of each equation (the industry activities) and the various drivers that explain the behavior of the respective industry activity on the right hand side of each equation are determined through the use of a statistical procedure known as econometric analysis. Three of the equations in the model represented in Figure 15 are identities to link various activities such as the addition of native and improved in-shell pecan supplies into a total in-shell pecan supply in equation (3) and the conversion of total in-shell supply to shelled supply in equation (4). Equation (9) is a market clearing condition requiring that total supply of shelled pecans equal the total demand for shelled pecans in each year. In the other ten equations, the econometric procedure identifies statistically significant drivers of each market activity and the statistical relationship between them. The estimated coefficients (structural parameters) provide measures of the change in each market activity in the model from a change in the respective explanatory (driver) variable.

301
16
Economic Benchmark Model and Analysis of the Effects of the Chinese Tariff on t
PecanMod - A U.S. Pecan Industry Economic Benchmark Model
Despite the general lack of data available for modeling and conducting a detailed economic analysis of the complete U.S. pecan industry, we developed a relatively powerful economic model of the industry based on the available data, referred to as PecanMod. Building from Figure 13, reorganizing, and adding price linkages, the Structure of PecanMod is depicted in Figure 14. In the model, the supply-side activities (utilized native and improved variety pecan production (in- shell and converted to a shelled basis), beginning stocks, and imports) at the top of Figure 14 interact with demand-side activities (domestic utilization, export demand, and ending stocks) at the bottom of Figure 14 to determine producer prices (U.S. average, native, and improved) as well as export and import prices in a given year in the middle of Figure 14. The producer prices in that year then affect the production of improved and native pecans in the following year (dotted lines represent time lags). Together with import supplies and beginning stocks in the following year (which are ending stocks in the previous year), production in the following year interacts with demand activities in that year to determine prices in that year which then impact production in the following year and so on. Because no retail price of pecans is available (red box in Figure 14), we use the producer price (shelled basis) as a proxy assuming that the two prices are positively correlated to some extent. The schematic representation of PecanMod in Figure 14 can be laid out as a corresponding set of 13 equations in Figure 15. Each equation represents one of the 13 boxes in Figure 14. The variable names are defined in Figure 16. The relationships between the ten variables representing industry activities are represented in equations (1) and (2) (improved and native pecan production), equation (5) (pecan import supply), equation (6) (domestic pecan utilization), equation (7) (ending stock demand), and equation (8) (export demand) in Figure 14. Equations (10) through (13) represent the various price linkages in the model. The relationships between the variables on the left hand side of each equation (the industry activities) and the various drivers that explain the behavior of the respective industry activity on the right hand side of each equation are determined through the use of a statistical procedure known as econometric analysis. Three of the equations in the model represented in Figure 15 are identities to link various activities such as the addition of native and improved in-shell pecan supplies into a total in-shell pecan supply in equation (3) and the conversion of total in-shell supply to shelled supply in equation (4). Equation (9) is a market clearing condition requiring that total supply of shelled pecans equal the total demand for shelled pecans in each year. In the other ten equations, the econometric procedure identifies statistically significant drivers of each market activity and the statistical relationship between them. The estimated coefficients (structural parameters) provide measures of the change in each market activity in the model from a change in the respective explanatory (driver) variable.

302
17
Economic Benchmark Model and Analysis of the Effects of the Chinese Tariff on the U.S. Pecan Industry
Figure 14. PecanMod Structure
Utilized Production Improved
In-shell
Utilized Production
Native In-shell
Total Utilized Production In-shell
Utilized Production Shelled
Beginning Stocks Shelled
Import Supply Shelled
Ending Stocks Shelled
Domestic Demand Shelled
Export Demand Shelled
Producer Price Shelled
Producer Price Native
In-shell
Producer Price Improved
In-shell
Producer Price Shelled
Retail Price
Shelled
Export Price
Shelled
Import Price
Shelled
conversion
conversion conversion
18
Economic Benchmark Model and Analysis of the Effects of the Chinese Tariff on the U.S. Pecan Industry
Figure 15. PecanMod Equations
(1) Si = Si (Pei, αsi) Improved pecan production (in-shell)
(2) Sn = Sn (P
en, αsn) Native pecan production (in-shell)
(3) Sp = Si + Sn Total in-shell pecan production identity (in-shell) (4) Su = Ø*Sp Total utilized production (in-shell conversion
to shelled identity) (Ø = conversion rate) (5) Sm = Sm (Pm, αsm) Import pecan supply (shelled) (6) Du = Du (Pu, βdu) Domestic pecan utilization (shelled) (7) Eu = Eu (Pu, βeu) Ending stock demand for pecans (shelled) (8) Dx = Dx (Px, βdx) Export demand for pecans (shelled) (9) Eut-1 + Su + Sm = Du + Dx + Eu Market clearing condition (shelled) (10) Pi = Pi(Pu/ Ø, θpi) Price linkage (Pimproved to Pshelled market ) (11) Pn = Pn(Pu/ Ø, θpn) Price linkage (Pnative to Pshelled market ) (12) Pm = Pm(Pu, θpm) Price linkage (Pimport to Pshelled market ) (13) Px = Px(Pu(1+τ), θpx) Price linkage (Pexport to Pshelled market )
13 unknowns: Si, Sn, Sp, Su, Sm, Du, Eu, Dx, Pi , Pn, Pm, Px, Pu

303
17
Economic Benchmark Model and Analysis of the Effects of the Chinese Tariff on the U.S. Pecan Industry
Figure 14. PecanMod Structure
Utilized Production Improved
In-shell
Utilized Production
Native In-shell
Total Utilized Production In-shell
Utilized Production Shelled
Beginning Stocks Shelled
Import Supply Shelled
Ending Stocks Shelled
Domestic Demand Shelled
Export Demand Shelled
Producer Price Shelled
Producer Price Native
In-shell
Producer Price Improved
In-shell
Producer Price Shelled
Retail Price
Shelled
Export Price
Shelled
Import Price
Shelled
conversion
conversion conversion
18
Economic Benchmark Model and Analysis of the Effects of the Chinese Tariff on the U.S. Pecan Industry
Figure 15. PecanMod Equations
(1) Si = Si (Pei, αsi) Improved pecan production (in-shell)
(2) Sn = Sn (P
en, αsn) Native pecan production (in-shell)
(3) Sp = Si + Sn Total in-shell pecan production identity (in-shell) (4) Su = Ø*Sp Total utilized production (in-shell conversion
to shelled identity) (Ø = conversion rate) (5) Sm = Sm (Pm, αsm) Import pecan supply (shelled) (6) Du = Du (Pu, βdu) Domestic pecan utilization (shelled) (7) Eu = Eu (Pu, βeu) Ending stock demand for pecans (shelled) (8) Dx = Dx (Px, βdx) Export demand for pecans (shelled) (9) Eut-1 + Su + Sm = Du + Dx + Eu Market clearing condition (shelled) (10) Pi = Pi(Pu/ Ø, θpi) Price linkage (Pimproved to Pshelled market ) (11) Pn = Pn(Pu/ Ø, θpn) Price linkage (Pnative to Pshelled market ) (12) Pm = Pm(Pu, θpm) Price linkage (Pimport to Pshelled market ) (13) Px = Px(Pu(1+τ), θpx) Price linkage (Pexport to Pshelled market )
13 unknowns: Si, Sn, Sp, Su, Sm, Du, Eu, Dx, Pi , Pn, Pm, Px, Pu

304
19
Economic Benchmark Model and Analysis of the Effects of the Chinese Tariff on the U.S. Pecan Industry
Figure 16. PecanMod Variable Definitions Endogenous Variables: Si = U.S. improved pecan production (in-shell) Sn = U.S. native pecan production (in-shell) Sp = U.S. total in-shell production Su = U.S. total utilized production (in-shell converted to shelled) Sm = U.S. pecan import supply (shelled) Du = U.S. domestic pecan utilization (shelled) Eu = U.S. ending stock demand for pecans (shelled) Dx = U.S. export demand for pecans (shelled) Pi = U.S. producer price of improved pecan varieties (in-shell) Pn = U.S. producer price of native pecans (in-shell) Pm = U.S. price (import unit value) of imported pecans Px = U.S. price (export unit value) of exported pecans Pu = U.S. average producer pecan price (shelled) Exogenous Variables:Ø = conversion rate (in-shell to shelled) α = drivers (shift variables) of the respective supply equations, including variables like inflation, prices of competing crops, technological change, etc. β = drivers (shift variables) of the respective demand equations, including variables like income, prices of other nuts, population, inflation, etc. θ = drivers (shift variables) of the respective price equations, including variables like exchange rates, transportation costs, etc. τ = Chinese pecan import tariff rate
20
Economic Benchmark Model and Analysis of the Effects of the Chinese Tariff on the U.S. Pecan Industry
The Statistical Model
In this report, we provide a summary of the estimated relationships previously discussed. The details of the full econometric model and parameters can be made available. The econometric model represents key industry activities such as improved and native pecan production, pecan import supply, domestic pecan utilization, ending stocks, and pecan export demand. The remaining equations represent the various price linkages in the model as well as identities. The model does an excellent job of tracking the historical functioning of the U.S. pecan industry. Appendix 2 provides the statistics normally used to gauge the reliability of an econometric model, including the goodness-of-fit statistics (R2 and adjusted R2), the within-sample mean absolute percent error (MAPE), and the Theil U2 statistics. Goodness-of-fit refers to the ability of any model to explain the variability in industry activities. The R2 statistics are close to 1, indicating that the model explains most of the variability in improved and native pecan production, pecan import supply, domestic pecan utilization, ending stocks, pecan export demand, and the various price linkages in the model. In addition, the MAPE statistics range from 1.89% to 19.76%, another indicator of excellent performance. In fact, most of the MAPE statistics are below 10%. Finally, a necessary condition for model validation is for Theil U2 statistics to be less than 1. This condition is met for each equation in the model as shown in Appendix 2. Hence, the set of estimated econometric equations mimics the actual behavior of key relationships in the pecan industry.
The key drivers of in-shell production of native and improved pecans were found to include inflation-adjusted grower prices, past production (a lag of two years for native pecans and lags of six and seven years for improved pecans). Key Influential factors associated with export demand of pecans were found to include inflation-adjusted export prices, inflation-adjusted world income, trend, and previous exports (a lag of two years). Similarly, key drivers of total U.S. imports were found to include inflation-adjusted import prices, trend, and the level of imports in the previous year. Domestic pecan utilization was found to depend on inflation-adjusted pecan prices, inflation-adjusted almond prices, inflation-adjusted U.S. income, and previous domestic pecan utilization (a lag of two years). Almonds and pecans were found to be substitutes. Pecans were found to be “normal” goods in that pecan consumption increases as income increases. Ending stocks were found to be dependent on inflation-adjusted producer prices of pecans, utilized production, and ending stocks in the previous year. The price linkage equations in the model reveal that import and export unit values of pecans as well as producer prices of native and improved pecans are all functions of the weighted average U.S. producer price of pecans. Table 1 provides the estimated short-run and long-run indicators of price responsiveness in terms of elasticities. An elasticity is the percentage change in a given market variable from a one percent

305
19
Economic Benchmark Model and Analysis of the Effects of the Chinese Tariff on the U.S. Pecan Industry
Figure 16. PecanMod Variable Definitions Endogenous Variables: Si = U.S. improved pecan production (in-shell) Sn = U.S. native pecan production (in-shell) Sp = U.S. total in-shell production Su = U.S. total utilized production (in-shell converted to shelled) Sm = U.S. pecan import supply (shelled) Du = U.S. domestic pecan utilization (shelled) Eu = U.S. ending stock demand for pecans (shelled) Dx = U.S. export demand for pecans (shelled) Pi = U.S. producer price of improved pecan varieties (in-shell) Pn = U.S. producer price of native pecans (in-shell) Pm = U.S. price (import unit value) of imported pecans Px = U.S. price (export unit value) of exported pecans Pu = U.S. average producer pecan price (shelled) Exogenous Variables:Ø = conversion rate (in-shell to shelled) α = drivers (shift variables) of the respective supply equations, including variables like inflation, prices of competing crops, technological change, etc. β = drivers (shift variables) of the respective demand equations, including variables like income, prices of other nuts, population, inflation, etc. θ = drivers (shift variables) of the respective price equations, including variables like exchange rates, transportation costs, etc. τ = Chinese pecan import tariff rate
20
Economic Benchmark Model and Analysis of the Effects of the Chinese Tariff on the U.S. Pecan Industry
The Statistical Model
In this report, we provide a summary of the estimated relationships previously discussed. The details of the full econometric model and parameters can be made available. The econometric model represents key industry activities such as improved and native pecan production, pecan import supply, domestic pecan utilization, ending stocks, and pecan export demand. The remaining equations represent the various price linkages in the model as well as identities. The model does an excellent job of tracking the historical functioning of the U.S. pecan industry. Appendix 2 provides the statistics normally used to gauge the reliability of an econometric model, including the goodness-of-fit statistics (R2 and adjusted R2), the within-sample mean absolute percent error (MAPE), and the Theil U2 statistics. Goodness-of-fit refers to the ability of any model to explain the variability in industry activities. The R2 statistics are close to 1, indicating that the model explains most of the variability in improved and native pecan production, pecan import supply, domestic pecan utilization, ending stocks, pecan export demand, and the various price linkages in the model. In addition, the MAPE statistics range from 1.89% to 19.76%, another indicator of excellent performance. In fact, most of the MAPE statistics are below 10%. Finally, a necessary condition for model validation is for Theil U2 statistics to be less than 1. This condition is met for each equation in the model as shown in Appendix 2. Hence, the set of estimated econometric equations mimics the actual behavior of key relationships in the pecan industry.
The key drivers of in-shell production of native and improved pecans were found to include inflation-adjusted grower prices, past production (a lag of two years for native pecans and lags of six and seven years for improved pecans). Key Influential factors associated with export demand of pecans were found to include inflation-adjusted export prices, inflation-adjusted world income, trend, and previous exports (a lag of two years). Similarly, key drivers of total U.S. imports were found to include inflation-adjusted import prices, trend, and the level of imports in the previous year. Domestic pecan utilization was found to depend on inflation-adjusted pecan prices, inflation-adjusted almond prices, inflation-adjusted U.S. income, and previous domestic pecan utilization (a lag of two years). Almonds and pecans were found to be substitutes. Pecans were found to be “normal” goods in that pecan consumption increases as income increases. Ending stocks were found to be dependent on inflation-adjusted producer prices of pecans, utilized production, and ending stocks in the previous year. The price linkage equations in the model reveal that import and export unit values of pecans as well as producer prices of native and improved pecans are all functions of the weighted average U.S. producer price of pecans. Table 1 provides the estimated short-run and long-run indicators of price responsiveness in terms of elasticities. An elasticity is the percentage change in a given market variable from a one percent

306
21
Economic Benchmark Model and Analysis of the Effects of the Chinese Tariff on the U.S. Pecan Industry
Table 1. PecanMod Short-Run and Long-Run Price Elasticities
Dependent Variable VariableSymbol
Time Period (Annual)
Short-RunElasticities
Long-RunElasticities
Native Production (In-Shell) Sn (1,000 lb) 1960 to 2018 0.134 0.196
Improved Production (In-Shell) Si (1,000 lb) 1960 to 2018 0.000 0.323
Import Supply (Shelled) Sm (1,000 lb) 1980 to 2018 0.516 0.646
Domestic Use (Shelled) Du (1,000 lb) 1979 to 2018 -0.148 -0.180
Ending Stock Demand (Shelled) Eu (1,000 lb) 1980 to 2018 -0.215 -0.320
Export Demand (Shelled) Dx (1,000 lb) 1990 to 2018 -0.625 -0.745
Improved Price (relative to Shelled Producer Price) Pi (cents/lb) 1980 to 2018 0.955 0.955
Native Price (relative to Shelled Producer Price) Pn (cents/lb) 1980 to 2018 1.010 1.010
Import Price of Pecans (relative to Shelled Producer Price) Pm (cents/lb) 1980 to 2018 0.443 0.827
Export Price of Pecans (relative to Shelled Producer Price)
Px (cents/lb)
1980 to 2018
0.658
0.658
Identities Total In-Shell Pecan Production = Improved Pecan Production (In-Shell) + Native Pecan Production (In-Shell). Total Utilized Production (In-Shell Conversion to Shelled Identity = Conversion Factor * Total In-Shell Production. Market Clearing Condition (Shelled): Beginning Stocks + Domestic Production + Imports = Domestic Use + Exports + Ending Stocks.
change in the associated driver. The elasticities presented in Table 1 reveal that improved, native, and, hence, total pecan production are not very sensitive to price changes. For example, a 1% change in their respective prices lead to a 0.13% change in native pecan production and no response of improved pecan production over the short-run. (Tthe short-run is the period over which pecan trees cannot or cannot fully respond to price changes). The same 1% change in their respective prices, however, leads to a 0.20% change in native pecan production and a 0.32%
22
Economic Benchmark Model and Analysis of the Effects of the Chinese Tariff on the U.S. Pecan Industry
change in improved pecan production over the long run. Further, a 1% percent change in the prices of imports and exports results in 0.52% and a -0.62% changes in the import supply and in the export demand for pecans, respectively, in the short-run and 0.65 and -0.75, respectively in the long run. Finally, a 1% change in the price of pecans leads to a -0.15% change in the domestic utilization of pecans. In summary, production relationships, import supply, export supply, and domestic utilization are not highly responsive to changes in prices in the short run or long run. In addition, the procedure quantifies the impacts of real (inflation-adjusted) income and real almond prices on the domestic utilization of pecans in terms of elasticities. A 1% change in real U.S. income leads to a 0.44% change in the domestic utilization of pecans meaning that pecans are necessities because the income elasticity is positive and less than one. At the same time, a one percent change in the real almond price leads to a 0.05% change in the domestic utilization of pecans meaning that pecans and almonds are considered to be substitutes by consumers. Through the procedure. Also, 1% change in real (inflation-adjusted) world income increases export demand for pecans by 9.56%, indicating that changes in real world income play a major role in affecting the export demand for U.S. pecans. Using PecanMod for Analysis – Counterfactual Simulation
The process of analyzing the effects of economic events on markets using an econometric model such as PecanMod is referred to as counter-factual simulation. The “simulation” of a model is simply the mathematical solution of a set of equations, such as the 13 equations of PecanMod. A baseline simulation is the simulation of the model to determine how closely the model replicates the actual, historical values of the variables in the model, such as the supply, demand, trade, and price variables in PecanMod, over the time period of the simulation. A number of statistical measures (known as validation statistics) are used to determine how closely the model comes to tracking the actual values of such market activities. A baseline simulation of PecanMod was conducted over the period of 1980/81 through 2018/19. The associated validation statistics for the baseline simulation indicate that the model does an excellent job of tracking the historical functioning of the U.S. pecan industry (see Appendix 2). To use PecanMod for measuring the industry effects of some economic event, a counterfactual simulation analysis is conducted with the model. A counterfactual simulation analysis actually requires two simulations of the model to analyze two scenarios. The first scenario simulation assumes that nothing has changed over the time period of analysis, that is, nothing in the market is different than what actually occurred over history. This simulation is actually just the baseline simulation generated to determine the validity of the model. In the context of a counterfactual analysis, the baseline simulation is referred to as the “with” simulation because the simulated

307
21
Economic Benchmark Model and Analysis of the Effects of the Chinese Tariff on the U.S. Pecan Industry
Table 1. PecanMod Short-Run and Long-Run Price Elasticities
Dependent Variable VariableSymbol
Time Period (Annual)
Short-RunElasticities
Long-RunElasticities
Native Production (In-Shell) Sn (1,000 lb) 1960 to 2018 0.134 0.196
Improved Production (In-Shell) Si (1,000 lb) 1960 to 2018 0.000 0.323
Import Supply (Shelled) Sm (1,000 lb) 1980 to 2018 0.516 0.646
Domestic Use (Shelled) Du (1,000 lb) 1979 to 2018 -0.148 -0.180
Ending Stock Demand (Shelled) Eu (1,000 lb) 1980 to 2018 -0.215 -0.320
Export Demand (Shelled) Dx (1,000 lb) 1990 to 2018 -0.625 -0.745
Improved Price (relative to Shelled Producer Price) Pi (cents/lb) 1980 to 2018 0.955 0.955
Native Price (relative to Shelled Producer Price) Pn (cents/lb) 1980 to 2018 1.010 1.010
Import Price of Pecans (relative to Shelled Producer Price) Pm (cents/lb) 1980 to 2018 0.443 0.827
Export Price of Pecans (relative to Shelled Producer Price)
Px (cents/lb)
1980 to 2018
0.658
0.658
Identities Total In-Shell Pecan Production = Improved Pecan Production (In-Shell) + Native Pecan Production (In-Shell). Total Utilized Production (In-Shell Conversion to Shelled Identity = Conversion Factor * Total In-Shell Production. Market Clearing Condition (Shelled): Beginning Stocks + Domestic Production + Imports = Domestic Use + Exports + Ending Stocks.
change in the associated driver. The elasticities presented in Table 1 reveal that improved, native, and, hence, total pecan production are not very sensitive to price changes. For example, a 1% change in their respective prices lead to a 0.13% change in native pecan production and no response of improved pecan production over the short-run. (Tthe short-run is the period over which pecan trees cannot or cannot fully respond to price changes). The same 1% change in their respective prices, however, leads to a 0.20% change in native pecan production and a 0.32%
22
Economic Benchmark Model and Analysis of the Effects of the Chinese Tariff on the U.S. Pecan Industry
change in improved pecan production over the long run. Further, a 1% percent change in the prices of imports and exports results in 0.52% and a -0.62% changes in the import supply and in the export demand for pecans, respectively, in the short-run and 0.65 and -0.75, respectively in the long run. Finally, a 1% change in the price of pecans leads to a -0.15% change in the domestic utilization of pecans. In summary, production relationships, import supply, export supply, and domestic utilization are not highly responsive to changes in prices in the short run or long run. In addition, the procedure quantifies the impacts of real (inflation-adjusted) income and real almond prices on the domestic utilization of pecans in terms of elasticities. A 1% change in real U.S. income leads to a 0.44% change in the domestic utilization of pecans meaning that pecans are necessities because the income elasticity is positive and less than one. At the same time, a one percent change in the real almond price leads to a 0.05% change in the domestic utilization of pecans meaning that pecans and almonds are considered to be substitutes by consumers. Through the procedure. Also, 1% change in real (inflation-adjusted) world income increases export demand for pecans by 9.56%, indicating that changes in real world income play a major role in affecting the export demand for U.S. pecans. Using PecanMod for Analysis – Counterfactual Simulation
The process of analyzing the effects of economic events on markets using an econometric model such as PecanMod is referred to as counter-factual simulation. The “simulation” of a model is simply the mathematical solution of a set of equations, such as the 13 equations of PecanMod. A baseline simulation is the simulation of the model to determine how closely the model replicates the actual, historical values of the variables in the model, such as the supply, demand, trade, and price variables in PecanMod, over the time period of the simulation. A number of statistical measures (known as validation statistics) are used to determine how closely the model comes to tracking the actual values of such market activities. A baseline simulation of PecanMod was conducted over the period of 1980/81 through 2018/19. The associated validation statistics for the baseline simulation indicate that the model does an excellent job of tracking the historical functioning of the U.S. pecan industry (see Appendix 2). To use PecanMod for measuring the industry effects of some economic event, a counterfactual simulation analysis is conducted with the model. A counterfactual simulation analysis actually requires two simulations of the model to analyze two scenarios. The first scenario simulation assumes that nothing has changed over the time period of analysis, that is, nothing in the market is different than what actually occurred over history. This simulation is actually just the baseline simulation generated to determine the validity of the model. In the context of a counterfactual analysis, the baseline simulation is referred to as the “with” simulation because the simulated

308
23
Economic Benchmark Model and Analysis of the Effects of the Chinese Tariff on the U.S. Pecan Industry
values of the industry variables (supply, demand, price, etc.) include the effects of the event being analyzed (such as the effect of the Chinese tariff). Thus, the with scenario represents actual history, that is, the level of supply, demand, prices, trade, etc. in the U.S. pecan industry that include any effects on those markets of the event being analyzed. The second scenario simulated with the model in a counter-factual analysis is the counterfactual simulation referred to as the without scenario analysis and is conducted by setting the value of some exogenous model variable (representing the event to be analyzed such as the Chinese import tariff) at a level different than its historical value and then simulating the model again over the same time period to generate new values for the industry variables (production, consumption, trade, prices, etc.). Because the changes in the industry model variables in the without scenario are generated by changing only the level of one (exogenous) variable representing an event like the Chinese import tariff, they represent the changes in the industry that would have occurred over history if changes in the event (like changes in the level of the Chinese tariff) had occurred. In the case of a Chinese tariff, the without scenario could simulate the effects of a zero Chinese import tariff in one period or over several periods. The simulated levels of the industry variables (supply demand, prices, etc.) in this example would represent the levels of those variables that would have occurred over time if there had been no Chinese import tariff. Differences in the simulated levels of the industry variables in the model (supplies, demand, prices, trade, etc.) in the with scenario from those in the without scenario are then taken as direct measures of the effects of the event being analyzed, such as the effects of the Chinese tariff. Because no other exogenous variable in the model (e.g., level of inflation, exchange rates, income levels, agricultural and trade policies, etc.) other than the event being analyzed is allowed to change in either scenario, this process effectively isolates the effects of the event of interest on the industry. That is, the simulated differences between the values of the endogenous (industry) variables from the with scenario and from the without scenario provide direct measures of the historical effects of the event being analyzed (and only that event).
Demonstration of the Use of PecanMod: Economic Effects of the Chinese Import Tariffs
To demonstrate the usefulness of PecanMod, we used the model to analyze the U.S. pecan industry effects of the Chinese tariff on imports of U.S. pecans following the counter-factual simulation process described in the previous section. We first provide some background on the Chinese tariff and then outline the theoretically expected effects of a Chinese tariff on U.S. pecan imports. A discussion of the counterfactual simulation of the tariff and the results of that simulation are followed by some concluding comments.
24
Economic Benchmark Model and Analysis of the Effects of the Chinese Tariff on the U.S. Pecan Industry
Background on the Chinese Import Tariff
On April 2, 2018, China announced tariffs on imports of a variety of U.S. products, including pecans, as countermeasures to the U.S. Section 232 tariffs on steel and aluminum product imports imposed on China by the United States. The trade dispute is important to the U.S. pecan industry because China had become the top foreign market destination for U.S. pecans. Actually, Chinese tariffs on imports of U.S. pecans are not a new phenomenon. Before 2007, pecans were rarely seen in China (Jun et al., 2013). However, the Chinese appetite for pecans exploded in 2007 when the price of walnuts jumped, making pecans a good substitute and a great bargain. China's pecan boom continued in following years as China's emerging middle-class consumer base, familiar with walnuts, found pecans to be similar to walnuts but more nutritious (Jun et al., 2013). At the time, China classified pecans as “other nuts” and assessed imports of U.S. pecans at the most favored nation (MFN) tariff rate of 13% (Table 2). As pecan imports began to increase, however, China increased the MFN tariff rate to 24% in 2008 and left it at that level through 2014. At the request of domestic industry in China, the government lowered the pecan MFN tariff rate to 10% where it remained until January 2018 when China again reduced the rate to 7%. Following the U.S.-China trade dispute in early 2018, however, the Chinese government subsequently added a new 15% tariff on April 2, 2018, bringing the total tariff to 22% for pecans of U.S. origin (Table 2). On July 6, 2018, China tacked an additional 25% onto the existing 22% tariff bringing the total tariff to 47%. On September 1, 2019, as part of the continuing U.S.-China trade dispute, China bumped up the tariff on imports of U.S. pecans by another 10%, increasing the total tariff facing Chinese buyers of U.S pecans to 57%. In a matter of about a year and a half, the tariff charged on imports of U.S. pecans into China rose from 7% to 57%. The incremental Chinese tariffs were not applied to pecans originating from other pecan exporting countries like Mexico, South Africa, and Australia. Expected Effects of the Chinese Import Tariff
China is the largest importer of in-shell pecans so any changes in China’s pecan trade policies have major implications for the U.S. pecan industry. In the short run (the year in which the tariff was imposed in this analysis, 2018/19), the 57% tariff on in-shell pecans had little effect on U.S. pecan production given that producers are unlikely to remove trees from production given a price decline which they hoped to be of short duration. The 2018/19 production reduction was more likely the effect of Hurricane Michael and a low, off-year, alternate-year bearing production cycle yield that year. If the tariff remains in place for over a prolonged period, however, the effects of the tariff on U.S. plantings, removals, and harvest could be substantial. Nevertheless, the short-run effect of a tariff included a reduction in the U.S. producer price for pecans to some extent, along with a drop

309
23
Economic Benchmark Model and Analysis of the Effects of the Chinese Tariff on the U.S. Pecan Industry
values of the industry variables (supply, demand, price, etc.) include the effects of the event being analyzed (such as the effect of the Chinese tariff). Thus, the with scenario represents actual history, that is, the level of supply, demand, prices, trade, etc. in the U.S. pecan industry that include any effects on those markets of the event being analyzed. The second scenario simulated with the model in a counter-factual analysis is the counterfactual simulation referred to as the without scenario analysis and is conducted by setting the value of some exogenous model variable (representing the event to be analyzed such as the Chinese import tariff) at a level different than its historical value and then simulating the model again over the same time period to generate new values for the industry variables (production, consumption, trade, prices, etc.). Because the changes in the industry model variables in the without scenario are generated by changing only the level of one (exogenous) variable representing an event like the Chinese import tariff, they represent the changes in the industry that would have occurred over history if changes in the event (like changes in the level of the Chinese tariff) had occurred. In the case of a Chinese tariff, the without scenario could simulate the effects of a zero Chinese import tariff in one period or over several periods. The simulated levels of the industry variables (supply demand, prices, etc.) in this example would represent the levels of those variables that would have occurred over time if there had been no Chinese import tariff. Differences in the simulated levels of the industry variables in the model (supplies, demand, prices, trade, etc.) in the with scenario from those in the without scenario are then taken as direct measures of the effects of the event being analyzed, such as the effects of the Chinese tariff. Because no other exogenous variable in the model (e.g., level of inflation, exchange rates, income levels, agricultural and trade policies, etc.) other than the event being analyzed is allowed to change in either scenario, this process effectively isolates the effects of the event of interest on the industry. That is, the simulated differences between the values of the endogenous (industry) variables from the with scenario and from the without scenario provide direct measures of the historical effects of the event being analyzed (and only that event).
Demonstration of the Use of PecanMod: Economic Effects of the Chinese Import Tariffs
To demonstrate the usefulness of PecanMod, we used the model to analyze the U.S. pecan industry effects of the Chinese tariff on imports of U.S. pecans following the counter-factual simulation process described in the previous section. We first provide some background on the Chinese tariff and then outline the theoretically expected effects of a Chinese tariff on U.S. pecan imports. A discussion of the counterfactual simulation of the tariff and the results of that simulation are followed by some concluding comments.
24
Economic Benchmark Model and Analysis of the Effects of the Chinese Tariff on the U.S. Pecan Industry
Background on the Chinese Import Tariff
On April 2, 2018, China announced tariffs on imports of a variety of U.S. products, including pecans, as countermeasures to the U.S. Section 232 tariffs on steel and aluminum product imports imposed on China by the United States. The trade dispute is important to the U.S. pecan industry because China had become the top foreign market destination for U.S. pecans. Actually, Chinese tariffs on imports of U.S. pecans are not a new phenomenon. Before 2007, pecans were rarely seen in China (Jun et al., 2013). However, the Chinese appetite for pecans exploded in 2007 when the price of walnuts jumped, making pecans a good substitute and a great bargain. China's pecan boom continued in following years as China's emerging middle-class consumer base, familiar with walnuts, found pecans to be similar to walnuts but more nutritious (Jun et al., 2013). At the time, China classified pecans as “other nuts” and assessed imports of U.S. pecans at the most favored nation (MFN) tariff rate of 13% (Table 2). As pecan imports began to increase, however, China increased the MFN tariff rate to 24% in 2008 and left it at that level through 2014. At the request of domestic industry in China, the government lowered the pecan MFN tariff rate to 10% where it remained until January 2018 when China again reduced the rate to 7%. Following the U.S.-China trade dispute in early 2018, however, the Chinese government subsequently added a new 15% tariff on April 2, 2018, bringing the total tariff to 22% for pecans of U.S. origin (Table 2). On July 6, 2018, China tacked an additional 25% onto the existing 22% tariff bringing the total tariff to 47%. On September 1, 2019, as part of the continuing U.S.-China trade dispute, China bumped up the tariff on imports of U.S. pecans by another 10%, increasing the total tariff facing Chinese buyers of U.S pecans to 57%. In a matter of about a year and a half, the tariff charged on imports of U.S. pecans into China rose from 7% to 57%. The incremental Chinese tariffs were not applied to pecans originating from other pecan exporting countries like Mexico, South Africa, and Australia. Expected Effects of the Chinese Import Tariff
China is the largest importer of in-shell pecans so any changes in China’s pecan trade policies have major implications for the U.S. pecan industry. In the short run (the year in which the tariff was imposed in this analysis, 2018/19), the 57% tariff on in-shell pecans had little effect on U.S. pecan production given that producers are unlikely to remove trees from production given a price decline which they hoped to be of short duration. The 2018/19 production reduction was more likely the effect of Hurricane Michael and a low, off-year, alternate-year bearing production cycle yield that year. If the tariff remains in place for over a prolonged period, however, the effects of the tariff on U.S. plantings, removals, and harvest could be substantial. Nevertheless, the short-run effect of a tariff included a reduction in the U.S. producer price for pecans to some extent, along with a drop

310
25
Economic Benchmark Model and Analysis of the Effects of the Chinese Tariff on the U.S. Pecan Industry
Table 2. Chinese Tariffs on Imports of U.S. Pecans, 2007 – 2019
Year MFNa Tariff Tariff Added
TotalAdditional
TariffMFN +
Additional Tariff ---------------------------------------- % --------------------------------------------
2007 13 13 2008 24 24 2009 24 24 2010 24 24 2011 24 24 2012 24 24 2013 24 24 2014 10 10 2015 10 10 2016 10 10 2017 7 7 Jan – March 2018 7 7 Apr – Dec 2018 7 15 15 22 Jan – May 2019 7 15 22 June – Aug 2019 7 25 40 47 Sept – Dec 2019 7 10 50 57
a MFN = most favored nation in both exports and export revenue. How much the tariff contributed to the price and export decline experienced in 2018 depends on the price responsiveness of U.S. pecan export supplies and of the Chinese import demand for U.S. pecans as illustrated in Figures 17, 18, and 19. In Figure 17, the price and quantity of U.S. pecans exported to China before the imposition of the retaliatory tariff by China are shown as P0 and Q0, respectively. The export supply curve (ES) in Figure 1 represents the quantity of U.S. pecans available at various prices. The curve is upward sloping because the U.S. is willing to supply more pecans to the world market only at higher prices. The export demand curve (EDwithout tariff) in Figure 17 represents the prices that importing countries are willing to pay for each level of U.S. pecans they import. This curve is downward sloping because the lower the price, the greater the quantity of U.S. pecan exports foreign importing countries are willing to buy. The effects of a tariff on U.S. pecan exports are illustrated with a lower ED demand curve (EDwith tariff) because the tariff leads to lower prices paid by importers for each level of pecan imports. Given the lower ED curve because of the tariff, the result is a reduction
26
Economic Benchmark Model and Analysis of the Effects of the Chinese Tariff on the U.S. Pecan Industry
Figure 17. Effect of a Chinese Import Tariff on U.S. Pecan Export Quantity and Price
Figure 18. Effect of a Chinese Import Tariff on U.S. Pecan Export Quantity and Price Given an ELASTIC Export Supply of U.S. Pecans
$/lb
million lbs of exports
ES
EDwithout tariff
P0
Q0Q1
EDwith tariff
tariffPChina1
PUS1
$/lb
million lbs of exports
ES
EDwithout tariff
Q0Qe
EDwith tariff
tariffPChinae
PUSe
P0
ESe

311
25
Economic Benchmark Model and Analysis of the Effects of the Chinese Tariff on the U.S. Pecan Industry
Table 2. Chinese Tariffs on Imports of U.S. Pecans, 2007 – 2019
Year MFNa Tariff Tariff Added
TotalAdditional
TariffMFN +
Additional Tariff ---------------------------------------- % --------------------------------------------
2007 13 13 2008 24 24 2009 24 24 2010 24 24 2011 24 24 2012 24 24 2013 24 24 2014 10 10 2015 10 10 2016 10 10 2017 7 7 Jan – March 2018 7 7 Apr – Dec 2018 7 15 15 22 Jan – May 2019 7 15 22 June – Aug 2019 7 25 40 47 Sept – Dec 2019 7 10 50 57
a MFN = most favored nation in both exports and export revenue. How much the tariff contributed to the price and export decline experienced in 2018 depends on the price responsiveness of U.S. pecan export supplies and of the Chinese import demand for U.S. pecans as illustrated in Figures 17, 18, and 19. In Figure 17, the price and quantity of U.S. pecans exported to China before the imposition of the retaliatory tariff by China are shown as P0 and Q0, respectively. The export supply curve (ES) in Figure 1 represents the quantity of U.S. pecans available at various prices. The curve is upward sloping because the U.S. is willing to supply more pecans to the world market only at higher prices. The export demand curve (EDwithout tariff) in Figure 17 represents the prices that importing countries are willing to pay for each level of U.S. pecans they import. This curve is downward sloping because the lower the price, the greater the quantity of U.S. pecan exports foreign importing countries are willing to buy. The effects of a tariff on U.S. pecan exports are illustrated with a lower ED demand curve (EDwith tariff) because the tariff leads to lower prices paid by importers for each level of pecan imports. Given the lower ED curve because of the tariff, the result is a reduction
26
Economic Benchmark Model and Analysis of the Effects of the Chinese Tariff on the U.S. Pecan Industry
Figure 17. Effect of a Chinese Import Tariff on U.S. Pecan Export Quantity and Price
Figure 18. Effect of a Chinese Import Tariff on U.S. Pecan Export Quantity and Price Given an ELASTIC Export Supply of U.S. Pecans
$/lb
million lbs of exports
ES
EDwithout tariff
P0
Q0Q1
EDwith tariff
tariffPChina1
PUS1
$/lb
million lbs of exports
ES
EDwithout tariff
Q0Qe
EDwith tariff
tariffPChinae
PUSe
P0
ESe

312
27
Economic Benchmark Model and Analysis of the Effects of the Chinese Tariff on the U.S. Pecan Industry
Figure 19. Effect of a Chinese Import Tariff on U.S. Pecan Export Quantity and Price Given an INELASTIC Export Supply of U.S. Pecans
in exports to Q1 and a decline in the U.S. export price of pecans to P1US. Adding the 57% tariff to the lower U.S. pecan price (P1US x 1.57) gives the price of pecans in China (P1China) which is higher because of the tariff. The U.S. price is lower because China imports fewer pecans, dampening the demand for U.S. pecans. The reduced level of imports of pecans by China results is a reduction in supplies available on the Chinese market which raises the price of U.S. pecans in that market. Note from Figure 17 that the tariff effects are shared by both the U.S. and China because the tariff acts as a wedge between their prices – raising price in China and lowering price in the United States. Thus, the U.S. pecan price does not drop by the full 57% of the tariff. While some of the tariff is paid by the U.S. in the form of a lower price on a smaller level of exports, China pays for part of the tariff in the form of a higher price on that lower level of exports. Thus, the tariff is the difference between the higher price in China (P1China) and the lower U.S. price (P1US). The result is also a lower volume of U.S. pecan exports (Q1) at a lower price (P1US) and, therefore, lower pecan export revenue. How far the volume and price of U.S. pecan exports drop as a result of the import tariff depends on the elasticities (that is, price responsiveness) of both U.S. pecan export supply (ES) and the Chinese demand for U.S. pecan exports (ED) as shown in the Figures 18 and 19.
$/lb
million lbs of exports
ES
EDwithout tariff
Q0Qi
EDwith tariff
tariff
PChinai
PUSi
P0
ESi
28
Economic Benchmark Model and Analysis of the Effects of the Chinese Tariff on the U.S. Pecan Industry
Figure 18 demonstrates that if the U.S. export supply of pecans is relatively responsive (elastic) to price (ESe), the same Chinese import tariff leads to a relatively smaller decline in the U.S. pecan export price to PeUS and a relatively larger decline in the volume of U.S. pecan exports to Qe. The extent of the subsequent drop in export revenue depends on how far both the price and quantity exported drop. Note that in this case China pays most of the tariff because the price of pecans in the U.S. declines relatively less than the price of U.S pecans in China increases. In this case, economists say that China bears the burden of the tariff. Figure 19 demonstrates that the opposite is the case for the same tariff with a less responsive (inelastic) U.S. export supply of U.S. pecans (ESi). In this case, the Chinese tariff leads to a relatively larger decline in the U.S. price of pecans to PeUS and a relatively smaller decline in the volume of U.S. pecan exports to Qi. Given the lack of price response of U.S. exports to the tariff, most of the effects of the tariff are manifest as a decrease in the price of U.S. pecans with relatively less effect on U.S. exports of pecans. In this case, the U.S. bears the burden of the tariff because U.S. pecan price drops by more than the price in China increases. U.S. pecan exports are little affected by the Chinese import policy in this case. Thus, in general, the more responsive (elastic) the U.S. supply of pecans is to the U.S. price of pecans, the more the cost of the tariff falls on China given the relatively large increase in their pecan price and the large drop in their imports of U.S. pecans. On the other hand, the more unresponsive (inelastic) the U.S. export supply of pecans is to the U.S. price, the greater the share of the cost of the tariff is borne by the U.S. pecan industry given the relatively large drop in the U.S. price of pecans. However, the drop in the volume of U.S pecan exports is relatively smaller, which limits the decline in export revenue as a result of the tariff. This case is most representative of the U.S. pecan industry in the short-run. Remember that the short-run is generally the period over which supply cannot change much given a price change. As discussed in connection with Table 1, the domestic demand, export demand, and ending stock demand are quite unresponsive to price (inelastic) and the production of pecans is unresponsive to price in the short-run. Thus, because any price change from a tariff would have only a small effect on production, the supplies available for export would not be much affected over that period either. Thus, the main effect of a tariff that is in place for only a year or two would be a decline in the price of pecans during that period since a change in the production of pecans would not occur much until after five to eight years as producers make tree removal decisions. If producers expected the tariff to be reduced for only a short period of time, little change in production over the short-run or long-run would likely occur. If the tariff persisted for some time, however, then U.S. pecan production would tend to decline over time and reduce the availability of U.S pecan supplies for exports, which, in turn, would tend to limit the price decline from the tariff over time.

313
27
Economic Benchmark Model and Analysis of the Effects of the Chinese Tariff on the U.S. Pecan Industry
Figure 19. Effect of a Chinese Import Tariff on U.S. Pecan Export Quantity and Price Given an INELASTIC Export Supply of U.S. Pecans
in exports to Q1 and a decline in the U.S. export price of pecans to P1US. Adding the 57% tariff to the lower U.S. pecan price (P1US x 1.57) gives the price of pecans in China (P1China) which is higher because of the tariff. The U.S. price is lower because China imports fewer pecans, dampening the demand for U.S. pecans. The reduced level of imports of pecans by China results is a reduction in supplies available on the Chinese market which raises the price of U.S. pecans in that market. Note from Figure 17 that the tariff effects are shared by both the U.S. and China because the tariff acts as a wedge between their prices – raising price in China and lowering price in the United States. Thus, the U.S. pecan price does not drop by the full 57% of the tariff. While some of the tariff is paid by the U.S. in the form of a lower price on a smaller level of exports, China pays for part of the tariff in the form of a higher price on that lower level of exports. Thus, the tariff is the difference between the higher price in China (P1China) and the lower U.S. price (P1US). The result is also a lower volume of U.S. pecan exports (Q1) at a lower price (P1US) and, therefore, lower pecan export revenue. How far the volume and price of U.S. pecan exports drop as a result of the import tariff depends on the elasticities (that is, price responsiveness) of both U.S. pecan export supply (ES) and the Chinese demand for U.S. pecan exports (ED) as shown in the Figures 18 and 19.
$/lb
million lbs of exports
ES
EDwithout tariff
Q0Qi
EDwith tariff
tariff
PChinai
PUSi
P0
ESi
28
Economic Benchmark Model and Analysis of the Effects of the Chinese Tariff on the U.S. Pecan Industry
Figure 18 demonstrates that if the U.S. export supply of pecans is relatively responsive (elastic) to price (ESe), the same Chinese import tariff leads to a relatively smaller decline in the U.S. pecan export price to PeUS and a relatively larger decline in the volume of U.S. pecan exports to Qe. The extent of the subsequent drop in export revenue depends on how far both the price and quantity exported drop. Note that in this case China pays most of the tariff because the price of pecans in the U.S. declines relatively less than the price of U.S pecans in China increases. In this case, economists say that China bears the burden of the tariff. Figure 19 demonstrates that the opposite is the case for the same tariff with a less responsive (inelastic) U.S. export supply of U.S. pecans (ESi). In this case, the Chinese tariff leads to a relatively larger decline in the U.S. price of pecans to PeUS and a relatively smaller decline in the volume of U.S. pecan exports to Qi. Given the lack of price response of U.S. exports to the tariff, most of the effects of the tariff are manifest as a decrease in the price of U.S. pecans with relatively less effect on U.S. exports of pecans. In this case, the U.S. bears the burden of the tariff because U.S. pecan price drops by more than the price in China increases. U.S. pecan exports are little affected by the Chinese import policy in this case. Thus, in general, the more responsive (elastic) the U.S. supply of pecans is to the U.S. price of pecans, the more the cost of the tariff falls on China given the relatively large increase in their pecan price and the large drop in their imports of U.S. pecans. On the other hand, the more unresponsive (inelastic) the U.S. export supply of pecans is to the U.S. price, the greater the share of the cost of the tariff is borne by the U.S. pecan industry given the relatively large drop in the U.S. price of pecans. However, the drop in the volume of U.S pecan exports is relatively smaller, which limits the decline in export revenue as a result of the tariff. This case is most representative of the U.S. pecan industry in the short-run. Remember that the short-run is generally the period over which supply cannot change much given a price change. As discussed in connection with Table 1, the domestic demand, export demand, and ending stock demand are quite unresponsive to price (inelastic) and the production of pecans is unresponsive to price in the short-run. Thus, because any price change from a tariff would have only a small effect on production, the supplies available for export would not be much affected over that period either. Thus, the main effect of a tariff that is in place for only a year or two would be a decline in the price of pecans during that period since a change in the production of pecans would not occur much until after five to eight years as producers make tree removal decisions. If producers expected the tariff to be reduced for only a short period of time, little change in production over the short-run or long-run would likely occur. If the tariff persisted for some time, however, then U.S. pecan production would tend to decline over time and reduce the availability of U.S pecan supplies for exports, which, in turn, would tend to limit the price decline from the tariff over time.

314
29
Economic Benchmark Model and Analysis of the Effects of the Chinese Tariff on the U.S. Pecan Industry
Simulation Analysis of the Effects of the Chinese Import Tariff
Using PecanMod, we analyzed the effects of the increased Chinese tariff in 2017/18 and 2018/19, assuming that if the Chinese had not increased their tariff on U.S. pecan imports then the Chinese tariff would have remained at the 7% MFN level that was in existence before April 2018 when China began the retaliatory increase in their pecan import tariff (see earlier discussion). In 2017/18, the tariff was at the MFN level from October 2017 through March 2018 (see Table 2). An additional 15% was added to the existing 7% tariff for a total tariff of 22% starting in April 2018, which remained through the end of that crop year (September 2018). Thus, the 15% increase in the Chinese tariff only affected the second half of the 2017/18 crop year. The 7% MFN tariff with the added 15% (total of 22%) continued from the beginning of the 2018/19 crop year in October 2018 through May 2019. In June 2019, an additional 25% was added to the 7% MFN tariff and the previously added 15%, a total tariff of 47%, which remained until August 2019. In the final month of the 2018/19 crop year (September 2019), an additional 10% was added for a total Chinese tariff on imports of U.S. pecans of 57% in that month and then on into the 2019/2020 crop year. Thus, the added Chinese tariff of 15% was in effect for the first eight months of 2018/19 and the next increase of 25% (a total increase of 40% above the 7% MFN) was in place for the next three months. Only in the last month of 2018/19 was the additional 10% added for a total increased tariff of 50% above the 7% tariff. In this counterfactual simulation analysis, the with simulation is represented by actual history with the Chinese import tariffs at the levels set in both 2017/18 and 2018/19 as previously discussed (also see Table 2). The without or counterfactual simulation assumes that the import tariff was set at the 7% MFN level in both crop years. In other words, we analyzed only the effects of the increase in tariffs above the 7% MFN during those two crop years. The simulated differences between the values for the U.S. pecan industry (supply, demand, exports, prices, etc.) are measures of the effects of the increases in Chinese tariffs in those two years. In other words, the results of the analysis indicate how the increases in the Chinese tariff on U.S. pecan imports affected the U.S pecan industry in those two years. The results of the analysis are shown in Table 3. Replicating economic behavior in the pecan industry, the counterfactual simulation with PecanMod results in little effect of the tariff increases on production because pecan production cannot change much in such a short period of time to price changes, particularly the production of improved varieties. In addition, producers were not likely to have removed trees within those two years in response to the price decline given that most observers assumed that the trade war with China was temporary and soon would be resolved so that the Chinese import tariffs would be lifted. The simulation results indicate that over the two
30
Economic Benchmark Model and Analysis of the Effects of the Chinese Tariff on the U.S. Pecan Industry
Table 3. Effects of Chinese Import Tariff Increases on U.S. Pecan Industry in 2017/18 and 2018/19
2017/18 2018/19 Two Year
Effects Change % Change % Change %
U.S. Pecan Supply (mil. lb) Utilized Production (in-shell) Two-Year Totals Native/Seedling -1.2 -4.3 -2.8 -16.4 -4.0 -9.0 Improved Varieties 0.0 0.0 0.0 0.0 0.0 0.0 Total -1.2 -0.4 -2.8 -1.2 -4.0 -0.7 Imports (shelled) -1.3 -0.9 -3.1 -1.9 -4.4 -1.5 U.S. Pecan Use (shelled) (mil. lb) Domestic Use 1.9 1.2 4.5 2.6 6.4 2.0 Exports -5.2 -4.4 -12.7 -12.2 -17.9 -8.1 Change in Stocks 1.5 17.0 3.8 n.d -5.4 75.0 Revenue ($ millions) Producer -69.8 -9.0 -145.5 -25.5 -215.3 -15.9 Export -75.5 -9.9 -163.1 -26.6 -238.6 -17.3
U.S. Pecan Prices (cents/lb) Producer Prices (in-shell) Two-Year Ave. Native/Seedling -15.7 -9.0 -41.0 -26.4 -28.3 -17.2 Improved Varieties -23.0 -8.7 -60.0 -25.1 -41.5 -16.5 U.S. average -21.9 -8.6 -57.2 -24.6 -39.6 -16.2
Export Price (shelled) -36.9 -5.7 -96.8 -16.4 -66.8 -10.8
Import Price (shelled) -20.7 -4.2 -53.9 -10.5 -37.3 -7.4
n.d. = a percentage change from a negative to a positive number which is undefined (cannot be calculated). years, native pecan production declined slightly by 4.0 million pounds (in-shell) (9.0%) as a result of the tariff increases given that native pecan production tends to be more price responsive in a shorter period of time than are improved varieties. The tariffs had no effect on the production of improved pecans over those two years. Because pecan production cannot respond quickly to price changes, the major consequences of the increases in the Chinese import tariff were declines in U.S. pecan prices as in the case illustrated

315
29
Economic Benchmark Model and Analysis of the Effects of the Chinese Tariff on the U.S. Pecan Industry
Simulation Analysis of the Effects of the Chinese Import Tariff
Using PecanMod, we analyzed the effects of the increased Chinese tariff in 2017/18 and 2018/19, assuming that if the Chinese had not increased their tariff on U.S. pecan imports then the Chinese tariff would have remained at the 7% MFN level that was in existence before April 2018 when China began the retaliatory increase in their pecan import tariff (see earlier discussion). In 2017/18, the tariff was at the MFN level from October 2017 through March 2018 (see Table 2). An additional 15% was added to the existing 7% tariff for a total tariff of 22% starting in April 2018, which remained through the end of that crop year (September 2018). Thus, the 15% increase in the Chinese tariff only affected the second half of the 2017/18 crop year. The 7% MFN tariff with the added 15% (total of 22%) continued from the beginning of the 2018/19 crop year in October 2018 through May 2019. In June 2019, an additional 25% was added to the 7% MFN tariff and the previously added 15%, a total tariff of 47%, which remained until August 2019. In the final month of the 2018/19 crop year (September 2019), an additional 10% was added for a total Chinese tariff on imports of U.S. pecans of 57% in that month and then on into the 2019/2020 crop year. Thus, the added Chinese tariff of 15% was in effect for the first eight months of 2018/19 and the next increase of 25% (a total increase of 40% above the 7% MFN) was in place for the next three months. Only in the last month of 2018/19 was the additional 10% added for a total increased tariff of 50% above the 7% tariff. In this counterfactual simulation analysis, the with simulation is represented by actual history with the Chinese import tariffs at the levels set in both 2017/18 and 2018/19 as previously discussed (also see Table 2). The without or counterfactual simulation assumes that the import tariff was set at the 7% MFN level in both crop years. In other words, we analyzed only the effects of the increase in tariffs above the 7% MFN during those two crop years. The simulated differences between the values for the U.S. pecan industry (supply, demand, exports, prices, etc.) are measures of the effects of the increases in Chinese tariffs in those two years. In other words, the results of the analysis indicate how the increases in the Chinese tariff on U.S. pecan imports affected the U.S pecan industry in those two years. The results of the analysis are shown in Table 3. Replicating economic behavior in the pecan industry, the counterfactual simulation with PecanMod results in little effect of the tariff increases on production because pecan production cannot change much in such a short period of time to price changes, particularly the production of improved varieties. In addition, producers were not likely to have removed trees within those two years in response to the price decline given that most observers assumed that the trade war with China was temporary and soon would be resolved so that the Chinese import tariffs would be lifted. The simulation results indicate that over the two
30
Economic Benchmark Model and Analysis of the Effects of the Chinese Tariff on the U.S. Pecan Industry
Table 3. Effects of Chinese Import Tariff Increases on U.S. Pecan Industry in 2017/18 and 2018/19
2017/18 2018/19 Two Year
Effects Change % Change % Change %
U.S. Pecan Supply (mil. lb) Utilized Production (in-shell) Two-Year Totals Native/Seedling -1.2 -4.3 -2.8 -16.4 -4.0 -9.0 Improved Varieties 0.0 0.0 0.0 0.0 0.0 0.0 Total -1.2 -0.4 -2.8 -1.2 -4.0 -0.7 Imports (shelled) -1.3 -0.9 -3.1 -1.9 -4.4 -1.5 U.S. Pecan Use (shelled) (mil. lb) Domestic Use 1.9 1.2 4.5 2.6 6.4 2.0 Exports -5.2 -4.4 -12.7 -12.2 -17.9 -8.1 Change in Stocks 1.5 17.0 3.8 n.d -5.4 75.0 Revenue ($ millions) Producer -69.8 -9.0 -145.5 -25.5 -215.3 -15.9 Export -75.5 -9.9 -163.1 -26.6 -238.6 -17.3
U.S. Pecan Prices (cents/lb) Producer Prices (in-shell) Two-Year Ave. Native/Seedling -15.7 -9.0 -41.0 -26.4 -28.3 -17.2 Improved Varieties -23.0 -8.7 -60.0 -25.1 -41.5 -16.5 U.S. average -21.9 -8.6 -57.2 -24.6 -39.6 -16.2
Export Price (shelled) -36.9 -5.7 -96.8 -16.4 -66.8 -10.8
Import Price (shelled) -20.7 -4.2 -53.9 -10.5 -37.3 -7.4
n.d. = a percentage change from a negative to a positive number which is undefined (cannot be calculated). years, native pecan production declined slightly by 4.0 million pounds (in-shell) (9.0%) as a result of the tariff increases given that native pecan production tends to be more price responsive in a shorter period of time than are improved varieties. The tariffs had no effect on the production of improved pecans over those two years. Because pecan production cannot respond quickly to price changes, the major consequences of the increases in the Chinese import tariff were declines in U.S. pecan prices as in the case illustrated

316
31
Economic Benchmark Model and Analysis of the Effects of the Chinese Tariff on the U.S. Pecan Industry
by Figure 19 (the case of an export supply that is highly unresponsive to price changes in the short-run). The tariff pushed native/seedling and improved variety prices (in-shell) down by 15.7 cents/lb (9.0%) and 23.0 cents/lb (8.7%), respectively, in 2017/18 and by 41.0 cents/lb (26.4%) and 60.0 cents/lb (25.1%), respectively, in 2018/19. The U.S. export price (shelled) declined by 36.9 cents/lb (5.7%) in 2017/18 and by 96.8 cents/lb (16.8%) in 2018/19 as a result of the tariff increases. The import price of pecans (shelled) declined by 20.7 cents/lb (4.2%) and 53.9 cents/lb (10.5%) in the two years, respectively, primarily because reduced exports as a result of the tariff increased the supplies available in the U.S. market which reduced the demand for imports. Over the two years, the tariffs reduced pecan exports by 17.9 million pounds (8.1%) (Table 3). The export decline was limited despite the Chinese import tariff due to increases in U.S pecan exports to other countries. The tariff-induced price declines boosted domestic use by 6.4 million pounds (2.0%). The reduction in exports, however, led to lower domestic demand for imports by 4.4 million pounds (1.5%) and a stock build-up of 5.4 million pounds despite the tariff-induced lower prices. The U.S. price declines as a result of the tariff plus the decline in exports and the small decline in production as a result of the tariffs led to sizeable declines in producer and export revenues. Over the two crop years, the Chinese import tariffs reduced producer revenues by a total of $215.6 million (15.9%) and export revenue by $238.6 million (17.3%). A common misperception is that a tariff of a given percentage should reduce the price in the exporting country by the same percentage. However, as discussed earlier, the tariffs insert a wedge between the prices of the importing and exporting countries. That is, the tariff drives up the price in the importing country and drives down the price in the exporting country down. The tariff is the percentage difference between the lower exporting country price and the higher importing country price. Thus, the percentage change in price is shared between the two countries. The exporting country price does not decline by the full amount of the tariff nor does the price in the importing country increase by the full amount of the tariff. There are other reasons that prices in an exporting country do not appear to decline the full amount of a tariff, such as in the case of the Chinese tariff on imports of U.S. pecans. For example, China is not the only country that imports pecans from the United States. Recall that China, Hong Kong, and Viet Nam together have accounted for only about 50% of U.S. pecan exports. Thus, when pecans exports dropped as a result of the tariff in 2017/18 and 2018/19, U.S. exports to other pecan importing countries increased, reducing the export impact and the price effect of the tariff. In addition, the tariffs were not constant but rather changed during each crop year. In 2017/18, the additional 15% tariff that was added in that crop year was only added in the last six months of the crop year. Consequently, over the full crop year, the implied tariff increased by only 7.5% (half of 15%). Then in 2018/19, the tariff was only 15% above the 7% MFN for eight months, 40% above
32
Economic Benchmark Model and Analysis of the Effects of the Chinese Tariff on the U.S. Pecan Industry
the 7% MFN for only three months, and 50% above the 7% MFN for only one month. Thus, the implied tariff addition to the 7% MFN for the full 2018/19 crop year was only 24.167%1. The 2018/19 crop year was unusual not only because of the Chinese tariff on U.S. pecans that year but also because of Hurricane Michael, wet weather, and disease issues that negatively impacted pecan production that same year. How much of the change in industry activities (production, consumption, prices, and trade, etc.) was due to the weather and other issues affecting production that year and how much was due to the tariff? We used the counterfactual simulation results to analyze the contribution of the tariff to industry changes that occurred between the 2017/18 and 2018/19 crop years. In essence, we calculated the simulated changes in the industry due to the tariff for each industry activity between 2017/18 and 2018/19 as percentages of the changes in the corresponding activities that actually occurred between those ow years. The results are in Table 4. Columns 1, 2, and 3 of Table 4 indicate actual outcomes for those two years. The last column indicates the share of the change that actually occurred between 2017/18 and 2018/19 that was due to the Chinese import tariff based on the counter-factual simulation results. For example, column three indicates that total U.S. utilized pecan production actually declined by 61.9 million pounds (in-shell) from all positive and negative events in 2018/19. The last column indicates that very little (about 4.6%), all from a decline in native pecan production, was due to the tariff. The rest was due to weather-related issues, a low alternate-year bearing production cycle yield in several states that year, and possibly other market forces. In addition, the results in Table 4 indicate that of the 20.4 million pound increase in U.S. domestic pecans use, about 22% was due to the tariff. The rest was likely due to other positive forces boosting consumer demand for pecans in 2018/19 over 2017/18 like the promotion efforts under the Federal Marketing Order for pecans, increasing consumer incomes, a relatively larger drop in the prices of other nuts (like walnuts), etc. The results in Table 4 also indicate that the tariff accounted for about half of the drop in exports, with the remainder due to other forces like the drop in pecan production that year. Almost all (nearly 100%) of the declines in the export and producer prices of pecans that occurred between 2017/18 and 2018/19 was also due the tariff. The results provide some additional insight on the tariff effects on the volume of pecan imports, indicating that the tariff pushed pecan imports down slightly (about 3 million pounds) but forces like the drop in production and the increase in domestic demand overwhelmed the negative tariff effect and resulted in a higher level of pecan imports in 2018/19.The tariff also created conflicting effects on the price of imports. While declining like other prices due to the tariff, the import price was supported by other forces such as the increased demand by China for pecans from Mexico. For that reason, perhaps, the import price of pecans declined by less than the producer and export prices between 2017/18 and 2018/19. 1 24.167= (8*0.15+3*0.4+0.5)/12

317
31
Economic Benchmark Model and Analysis of the Effects of the Chinese Tariff on the U.S. Pecan Industry
by Figure 19 (the case of an export supply that is highly unresponsive to price changes in the short-run). The tariff pushed native/seedling and improved variety prices (in-shell) down by 15.7 cents/lb (9.0%) and 23.0 cents/lb (8.7%), respectively, in 2017/18 and by 41.0 cents/lb (26.4%) and 60.0 cents/lb (25.1%), respectively, in 2018/19. The U.S. export price (shelled) declined by 36.9 cents/lb (5.7%) in 2017/18 and by 96.8 cents/lb (16.8%) in 2018/19 as a result of the tariff increases. The import price of pecans (shelled) declined by 20.7 cents/lb (4.2%) and 53.9 cents/lb (10.5%) in the two years, respectively, primarily because reduced exports as a result of the tariff increased the supplies available in the U.S. market which reduced the demand for imports. Over the two years, the tariffs reduced pecan exports by 17.9 million pounds (8.1%) (Table 3). The export decline was limited despite the Chinese import tariff due to increases in U.S pecan exports to other countries. The tariff-induced price declines boosted domestic use by 6.4 million pounds (2.0%). The reduction in exports, however, led to lower domestic demand for imports by 4.4 million pounds (1.5%) and a stock build-up of 5.4 million pounds despite the tariff-induced lower prices. The U.S. price declines as a result of the tariff plus the decline in exports and the small decline in production as a result of the tariffs led to sizeable declines in producer and export revenues. Over the two crop years, the Chinese import tariffs reduced producer revenues by a total of $215.6 million (15.9%) and export revenue by $238.6 million (17.3%). A common misperception is that a tariff of a given percentage should reduce the price in the exporting country by the same percentage. However, as discussed earlier, the tariffs insert a wedge between the prices of the importing and exporting countries. That is, the tariff drives up the price in the importing country and drives down the price in the exporting country down. The tariff is the percentage difference between the lower exporting country price and the higher importing country price. Thus, the percentage change in price is shared between the two countries. The exporting country price does not decline by the full amount of the tariff nor does the price in the importing country increase by the full amount of the tariff. There are other reasons that prices in an exporting country do not appear to decline the full amount of a tariff, such as in the case of the Chinese tariff on imports of U.S. pecans. For example, China is not the only country that imports pecans from the United States. Recall that China, Hong Kong, and Viet Nam together have accounted for only about 50% of U.S. pecan exports. Thus, when pecans exports dropped as a result of the tariff in 2017/18 and 2018/19, U.S. exports to other pecan importing countries increased, reducing the export impact and the price effect of the tariff. In addition, the tariffs were not constant but rather changed during each crop year. In 2017/18, the additional 15% tariff that was added in that crop year was only added in the last six months of the crop year. Consequently, over the full crop year, the implied tariff increased by only 7.5% (half of 15%). Then in 2018/19, the tariff was only 15% above the 7% MFN for eight months, 40% above
32
Economic Benchmark Model and Analysis of the Effects of the Chinese Tariff on the U.S. Pecan Industry
the 7% MFN for only three months, and 50% above the 7% MFN for only one month. Thus, the implied tariff addition to the 7% MFN for the full 2018/19 crop year was only 24.167%1. The 2018/19 crop year was unusual not only because of the Chinese tariff on U.S. pecans that year but also because of Hurricane Michael, wet weather, and disease issues that negatively impacted pecan production that same year. How much of the change in industry activities (production, consumption, prices, and trade, etc.) was due to the weather and other issues affecting production that year and how much was due to the tariff? We used the counterfactual simulation results to analyze the contribution of the tariff to industry changes that occurred between the 2017/18 and 2018/19 crop years. In essence, we calculated the simulated changes in the industry due to the tariff for each industry activity between 2017/18 and 2018/19 as percentages of the changes in the corresponding activities that actually occurred between those ow years. The results are in Table 4. Columns 1, 2, and 3 of Table 4 indicate actual outcomes for those two years. The last column indicates the share of the change that actually occurred between 2017/18 and 2018/19 that was due to the Chinese import tariff based on the counter-factual simulation results. For example, column three indicates that total U.S. utilized pecan production actually declined by 61.9 million pounds (in-shell) from all positive and negative events in 2018/19. The last column indicates that very little (about 4.6%), all from a decline in native pecan production, was due to the tariff. The rest was due to weather-related issues, a low alternate-year bearing production cycle yield in several states that year, and possibly other market forces. In addition, the results in Table 4 indicate that of the 20.4 million pound increase in U.S. domestic pecans use, about 22% was due to the tariff. The rest was likely due to other positive forces boosting consumer demand for pecans in 2018/19 over 2017/18 like the promotion efforts under the Federal Marketing Order for pecans, increasing consumer incomes, a relatively larger drop in the prices of other nuts (like walnuts), etc. The results in Table 4 also indicate that the tariff accounted for about half of the drop in exports, with the remainder due to other forces like the drop in pecan production that year. Almost all (nearly 100%) of the declines in the export and producer prices of pecans that occurred between 2017/18 and 2018/19 was also due the tariff. The results provide some additional insight on the tariff effects on the volume of pecan imports, indicating that the tariff pushed pecan imports down slightly (about 3 million pounds) but forces like the drop in production and the increase in domestic demand overwhelmed the negative tariff effect and resulted in a higher level of pecan imports in 2018/19.The tariff also created conflicting effects on the price of imports. While declining like other prices due to the tariff, the import price was supported by other forces such as the increased demand by China for pecans from Mexico. For that reason, perhaps, the import price of pecans declined by less than the producer and export prices between 2017/18 and 2018/19. 1 24.167= (8*0.15+3*0.4+0.5)/12

318
33
Economic Benchmark Model and Analysis of the Effects of the Chinese Tariff on the U.S. Pecan Industry
Table 4. Contribution of Tariff to Changes in the Pecan Industry from 2017/18 – 2018/19
2017/18 2018/19
Change from 2017/18 to
2018/19
Percent of Change due
to Tariff U.S. Pecan Supply (mil. lb) Utilized Production (in-shell) Native/Seedling 26.3 14.5 -11.8 24.1 Improved Varieties 278.6 228.5 -50.1 0.0 Total 304.9 242.9 4.6 2.2 Imports (shelled) 137.1 163.0 25.9 -12.1 U.S. Pecan Use (shelled) (mil. lb) Domestic Use 154.2 174.5 20.4 22.1 Exports 113.5 91.0 56.4 26.2 Change in Stocks 10.6 1.9 -8.7 -44.1 Revenue ($ millions) Producer 710.3 425.4 -284.9 51.1 Export 688.8 450.0 -238.9 68.3 U.S. Pecan Prices (cents/lb) Producer Prices (in-shell) Native/Seedling 158.0 114.0 -44.0 93.1 Improved Varieties 240.0 179.0 -61.0 98.3 U.S. average 233.0 175.1 -57.9 98.8
Export Price (shelled) 607.0 494.5 -112.6 86.0
Import Price (shelled) 476.6 460.9 -15.7 344.1
Finally, about half of the drop in producer revenue and over two-thirds of the drop in pecan export revenue from 2017/18 to 2018/19 were due to the tariff (Table 4). The rest was due to other market forces like the weather-related drop in production in 2018/19. In summary, the main effect of the tariff was to reduce U.S. pecan exports and prices with some increase in domestic use and little or no effect on effect on production. Most of the price decline experienced in 2018/19 from 2017/18 was the result of the tariff and about half of the decline in
34
Economic Benchmark Model and Analysis of the Effects of the Chinese Tariff on the U.S. Pecan Industry
exports and in producer revenue. The rest of the changes in those variables between 2017/18 and 2018/19 was due to other forces, including the production decline that occurred in 2018/19.
Final Comments
PecanMod is a powerful tool for analyzing the effects of economic and policy issues relating to the U.S. pecan industry. The intention is to continue developing PecanMod to become even more inclusive of activities relating to the U.S. pecan industry and to capture more robustly the dynamics and variability of the industry. Even so, PecanMod already can provide useful analyses of the effects of numerous types of events on the U.S. pecan industry such as the pecan checkoff program, the USDA Trade Aid package benefits to the industry through the Food Purchase and Distribution Program, exchange rate changes, U.S. economic growth and growing consumer incomes, and much more. In addition, the model can be customized to analyze the effects of various other economic events. Importantly, PecanMod is a tool for analyzing economic and not biologic events related to pecans. For example, even though pecan scab is the most economically significant disease of pecan trees in the southeastern United States, PecanMod is not designed to determine the biologic effects of the disease on U.S. pecan production. However, working with pecan tree pathologists and other pecan horticultural experts to develop an estimate of the effects of the disease on pecan production, PecanMod then can be used to determine the overall economic effects of an outbreak of the disease on the pecan industry, including the effects on price, consumption, exports, imports, ending stocks, producer revenue, and other key industry measures not only in the short-run but over time as well. The same is true for other biologic and other non-economic issues such as the short-run and long-run effects of hurricane damage and other weather events and new production technologies, among many others. The model is limited in its ability to analyze the full set of activities in the pecan industry not only by a lack of data for key industry activities but also by the consistency and reliability of available data. Nevertheless, PecanMod replicates well the behavior of the U.S. supply, demand, and prices of pecans. Like all models, PecanMod will need to evolve over time given changes that occur in the pecan industry and the availability of data. As well, the model will need to expand to better capture the complex and extremely dynamic nature of the pecan industry. The analysis of the 2017/18 and 2018/19 Chinese tariffs on imports of U.S. pecans provides an excellent demonstration of what PecanMod can already do in analyzing the effects of economic events impacting the U.S. pecan industry. The contribution analysis demonstrates some of the additional insights that analysis with PecanMod can provide.

319
33
Economic Benchmark Model and Analysis of the Effects of the Chinese Tariff on the U.S. Pecan Industry
Table 4. Contribution of Tariff to Changes in the Pecan Industry from 2017/18 – 2018/19
2017/18 2018/19
Change from 2017/18 to
2018/19
Percent of Change due
to Tariff U.S. Pecan Supply (mil. lb) Utilized Production (in-shell) Native/Seedling 26.3 14.5 -11.8 24.1 Improved Varieties 278.6 228.5 -50.1 0.0 Total 304.9 242.9 4.6 2.2 Imports (shelled) 137.1 163.0 25.9 -12.1 U.S. Pecan Use (shelled) (mil. lb) Domestic Use 154.2 174.5 20.4 22.1 Exports 113.5 91.0 56.4 26.2 Change in Stocks 10.6 1.9 -8.7 -44.1 Revenue ($ millions) Producer 710.3 425.4 -284.9 51.1 Export 688.8 450.0 -238.9 68.3 U.S. Pecan Prices (cents/lb) Producer Prices (in-shell) Native/Seedling 158.0 114.0 -44.0 93.1 Improved Varieties 240.0 179.0 -61.0 98.3 U.S. average 233.0 175.1 -57.9 98.8
Export Price (shelled) 607.0 494.5 -112.6 86.0
Import Price (shelled) 476.6 460.9 -15.7 344.1
Finally, about half of the drop in producer revenue and over two-thirds of the drop in pecan export revenue from 2017/18 to 2018/19 were due to the tariff (Table 4). The rest was due to other market forces like the weather-related drop in production in 2018/19. In summary, the main effect of the tariff was to reduce U.S. pecan exports and prices with some increase in domestic use and little or no effect on effect on production. Most of the price decline experienced in 2018/19 from 2017/18 was the result of the tariff and about half of the decline in
34
Economic Benchmark Model and Analysis of the Effects of the Chinese Tariff on the U.S. Pecan Industry
exports and in producer revenue. The rest of the changes in those variables between 2017/18 and 2018/19 was due to other forces, including the production decline that occurred in 2018/19.
Final Comments
PecanMod is a powerful tool for analyzing the effects of economic and policy issues relating to the U.S. pecan industry. The intention is to continue developing PecanMod to become even more inclusive of activities relating to the U.S. pecan industry and to capture more robustly the dynamics and variability of the industry. Even so, PecanMod already can provide useful analyses of the effects of numerous types of events on the U.S. pecan industry such as the pecan checkoff program, the USDA Trade Aid package benefits to the industry through the Food Purchase and Distribution Program, exchange rate changes, U.S. economic growth and growing consumer incomes, and much more. In addition, the model can be customized to analyze the effects of various other economic events. Importantly, PecanMod is a tool for analyzing economic and not biologic events related to pecans. For example, even though pecan scab is the most economically significant disease of pecan trees in the southeastern United States, PecanMod is not designed to determine the biologic effects of the disease on U.S. pecan production. However, working with pecan tree pathologists and other pecan horticultural experts to develop an estimate of the effects of the disease on pecan production, PecanMod then can be used to determine the overall economic effects of an outbreak of the disease on the pecan industry, including the effects on price, consumption, exports, imports, ending stocks, producer revenue, and other key industry measures not only in the short-run but over time as well. The same is true for other biologic and other non-economic issues such as the short-run and long-run effects of hurricane damage and other weather events and new production technologies, among many others. The model is limited in its ability to analyze the full set of activities in the pecan industry not only by a lack of data for key industry activities but also by the consistency and reliability of available data. Nevertheless, PecanMod replicates well the behavior of the U.S. supply, demand, and prices of pecans. Like all models, PecanMod will need to evolve over time given changes that occur in the pecan industry and the availability of data. As well, the model will need to expand to better capture the complex and extremely dynamic nature of the pecan industry. The analysis of the 2017/18 and 2018/19 Chinese tariffs on imports of U.S. pecans provides an excellent demonstration of what PecanMod can already do in analyzing the effects of economic events impacting the U.S. pecan industry. The contribution analysis demonstrates some of the additional insights that analysis with PecanMod can provide.

320
35
Economic Benchmark Model and Analysis of the Effects of the Chinese Tariff on the U.S. Pecan Industry
PecanMod is the exclusive property of the American Pecan Council (APC). The model will reside at Texas A&M University to allow researchers to update the database used to build and simulate the model and to refine and enhance the model over time. Future APC requests for analysis using the model can be carried out but only at the request of APC under separate contracts for the work requested.
36
Economic Benchmark Model and Analysis of the Effects of the Chinese Tariff on the U.S. Pecan Industry
References
Call, R.E., R. Gibson, and M.W. Kilby. 2006. “Pecan Production Guidelines for Small Orchards and Home Yards.” Cooperative Extension Publication AZ1400, College of Agriculture and Life Sciences, The University of Arizona, Tucson, Arizona, May. On-line at: https://extension.arizona.edu/sites/extension.arizona.edu/files/pubs/az1400.pdf
Cheng, G., S. Dharmasena, and O. Capps, Jr. 2019. “Demand Interrelationships of Peanuts and
Tree Nuts in the United States.” Working Paper, Department of Agricultural Economics, Texas A&M University.
Dhaliwal, H.S. 1972. “An Econometric Investigation of Demand Interrelationships among Tree
Nuts and Peanuts.” Ph.D. thesis, Oregon State University. Epperson, J.E. and J.R. Allison. 1980. “Price Futures for the United States Pecan Industry.”
HortScience 15(4): 475-478. Florkowski, W.J., J.C. Purcell, and E.E. Hubbard. 1992. “Importance for the U.S. Pecan Industry
of Communicating about Quality.” Hortscience 27(5): 462-464. Florkowski, W.J., Z. You, and C.L. Huang. 1999. “Consumer’s Selection of Retail Outlets in
Buying Pecans.” Journal of Food Distribution Research 30(2): 34-43. Ibrahim, M. and W. J. Florkowski. 2007. “Forecasting US Shelled Pecan Prices: A Co-Integration
Approach.” Selected Paper Presented at the Southern Agricultural Economics Association, Little Rock, Arkansas, 4-7 February.
Ibrahim, M. and W. J. Florkowski. 2005. “Testing for Seasonal Co-integration and Error
Correction: The US Pecan Price-Inventory Relationship.” Selected Paper presented at the Southern Agricultural Economics Association, Little Rock, Arkansas 5-9 February.
Jones, S.A., V.C. Childs, R.S. Washburn, B.H. Thibodeaux, J.W. Park, and H.E. Rutland. 1932.
An Economic Study of the Pecan Industry. Washington DC: U.S. Department of Agriculture, Technical Bulletin No. 324, September 1932.
Jun, W., C. Tang, J. Li, S. Zhang, J. Shen, R. Zhang. 2013. “China Food Manufacturing Annual
Report.” GAIN Report. Foreign Agriculture Service, US. Department of Agriculture. February 4. On-line at: https://gain.fas.usda.gov/.
Kim, Y. and S. Dharmasena. 2018. “Price Discovery and Integration in U.S. Pecan Markets.”
Journal of Food Distribution Research 49(1): 39-47. Lerner, E.B. 1959. “An Econometric Analysis of the Demand for Pecans with Special Reference
to the Demand Interrelationships among Domestic Tree Nuts. Ph.D. thesis, Oklahoma State University.

321
35
Economic Benchmark Model and Analysis of the Effects of the Chinese Tariff on the U.S. Pecan Industry
PecanMod is the exclusive property of the American Pecan Council (APC). The model will reside at Texas A&M University to allow researchers to update the database used to build and simulate the model and to refine and enhance the model over time. Future APC requests for analysis using the model can be carried out but only at the request of APC under separate contracts for the work requested.
36
Economic Benchmark Model and Analysis of the Effects of the Chinese Tariff on the U.S. Pecan Industry
References
Call, R.E., R. Gibson, and M.W. Kilby. 2006. “Pecan Production Guidelines for Small Orchards and Home Yards.” Cooperative Extension Publication AZ1400, College of Agriculture and Life Sciences, The University of Arizona, Tucson, Arizona, May. On-line at: https://extension.arizona.edu/sites/extension.arizona.edu/files/pubs/az1400.pdf
Cheng, G., S. Dharmasena, and O. Capps, Jr. 2019. “Demand Interrelationships of Peanuts and
Tree Nuts in the United States.” Working Paper, Department of Agricultural Economics, Texas A&M University.
Dhaliwal, H.S. 1972. “An Econometric Investigation of Demand Interrelationships among Tree
Nuts and Peanuts.” Ph.D. thesis, Oregon State University. Epperson, J.E. and J.R. Allison. 1980. “Price Futures for the United States Pecan Industry.”
HortScience 15(4): 475-478. Florkowski, W.J., J.C. Purcell, and E.E. Hubbard. 1992. “Importance for the U.S. Pecan Industry
of Communicating about Quality.” Hortscience 27(5): 462-464. Florkowski, W.J., Z. You, and C.L. Huang. 1999. “Consumer’s Selection of Retail Outlets in
Buying Pecans.” Journal of Food Distribution Research 30(2): 34-43. Ibrahim, M. and W. J. Florkowski. 2007. “Forecasting US Shelled Pecan Prices: A Co-Integration
Approach.” Selected Paper Presented at the Southern Agricultural Economics Association, Little Rock, Arkansas, 4-7 February.
Ibrahim, M. and W. J. Florkowski. 2005. “Testing for Seasonal Co-integration and Error
Correction: The US Pecan Price-Inventory Relationship.” Selected Paper presented at the Southern Agricultural Economics Association, Little Rock, Arkansas 5-9 February.
Jones, S.A., V.C. Childs, R.S. Washburn, B.H. Thibodeaux, J.W. Park, and H.E. Rutland. 1932.
An Economic Study of the Pecan Industry. Washington DC: U.S. Department of Agriculture, Technical Bulletin No. 324, September 1932.
Jun, W., C. Tang, J. Li, S. Zhang, J. Shen, R. Zhang. 2013. “China Food Manufacturing Annual
Report.” GAIN Report. Foreign Agriculture Service, US. Department of Agriculture. February 4. On-line at: https://gain.fas.usda.gov/.
Kim, Y. and S. Dharmasena. 2018. “Price Discovery and Integration in U.S. Pecan Markets.”
Journal of Food Distribution Research 49(1): 39-47. Lerner, E.B. 1959. “An Econometric Analysis of the Demand for Pecans with Special Reference
to the Demand Interrelationships among Domestic Tree Nuts. Ph.D. thesis, Oklahoma State University.

322
37
Economic Benchmark Model and Analysis of the Effects of the Chinese Tariff on the U.S. Pecan Industry
Moore, E.D. and G.W. Williams, M.A. Palma, and L. Lombardini. 2009. “Effectiveness of State-level Pecan Promotion Programs: The Case of the Texas Pecan Checkoff Program.” HortScience 44(7): 1914-1920.
Nesbitt, M., L. Stein, and J. Kamas. 2013. “Improved Pecans.” Texas Fruit and Nut Production
Report No. E-609, Texas A&M AgriLife Extension Service, Texas A&M University System, College Station, Texas, February. On-line at: https://agrilifeextension.tamu.edu/library/farming/texas-fruit-and-nut-production-improved-pecans/.
Nesbitt, M., L. Stein, and J. Kamas. 2010. “Native Pecans.” Texas Fruit and Nut Production.
Texas A&M AgriLife Extension Service, Texas A&M University System, College Station, Texas, February. On-line at: https://aggie-horticulture.tamu.edu/fruit-nut/files/2010/10/native-pecans.pdf.
Palma, M. and D. Chavez. 2015. “Economic Analysis of the Implementation of a Federal
Marketing Order for Pecans.” Unpublished, Department of Agricultural Economics, Texas A&M University.
Park, T. and W.J. Florkowski. 1999. “Demand and Quality Uncertainty in Pecan Purchasing
Decisions.” Journal of Agricultural and Applied Economics 31(1): 29-39. Produce Report. 2019. “3000% Increase in Mexican Pecan Exports to China.” M.Z. Marketing
Communications, Shanghai, China. August 12. On-line at: https://www.producereport.com/article/3000-increase-mexican-pecan-exports-china
Onunkwo, I.M. and J.E. Epperson. 2000. “Export Demand for U.S. Pecans: Impacts of U.S. Export
Promotion Programs.” Agribusiness 16(2): 253-265. Reid, W. and K.L. Hunt. 2000. “Pecan Production in the Northern United States.” HorTechnology
10(2): 298-301. Shafer, C.E. 1996. “Pecan Production and Price Trends 1979–1995.” Faculty Paper 24019,
Department of Agricultural Economics, Texas A&M University. Sumner, D.A. and T.M. Hanon. 2018. “Economic Impacts of Increased Tariffs that have Reduced
Import Access for U.S. Fruit and Tree Nuts Exports to Important Markets.” University of California Agricultural Issues Center and Department of Agricultural and Resource Economics, University of California, Davis, August.
U.S. Department of Agriculture (USDA). 2019a. “Pecan Production.” National Agricultural
Statistics Service (NASS), March 14. On-line at: https://downloads.usda.library.cornell.edu/ usda-esmis/files/5425kg32f/tt44pv533/v979v9335/pecnpr19.pdf
38
Economic Benchmark Model and Analysis of the Effects of the Chinese Tariff on the U.S. Pecan Industry
U.S. Department of Agriculture (USDA). 2019b. “Fruit and Tree Nut Yearbook Tables.” Economic Research Service. On-line at: https://www.ers.usda.gov/data-products/fruit-and-tree-nut-data/fruit-and-tree-nut-yearbook-tables/
U.S. Department of Agriculture (USDA). 2019c. “Global Agricultural Trade System (GATS).”
Foreign Agriculture Service. On-line at: https://apps.fas.usda.gov/gats/ U.S. Department of Agriculture (USDA). 2019d. “Specialty Crops: Custom Reports.”
Agricultural Marketing Service. On-line at: https://www.ams.usda.gov/market-news/fruits-vegetables.
U.S. Department of Labor (USDL). 2019. “Producer Price Indexes.” Bureau of Labor Statistics.
On-line at: https://www.bls.gov/ppi/data.htm. Wells, G.J., S.E. Miller, and C.S. Thompson. 1986. “Farm Level Demand for Pecans
Reconsidered.” Journal of Agricultural and Applied Economics 18(1): 157-160. Williams, G.W., O. Capps, Jr., and V. Salin. 2018. “Effects of the Chinese Retaliatory Tariff on
U.S. Pecan Exports.” Department of Agricultural Economics, Texas A&M University. Wood, B.W. 1993. “Production Characteristics of the United States Pecan Industry.” Journal of
the American Society of Horticultural Science 118(4): 538-545. Wood, B.W. 2001. “Production Unit Trends and Price Characteristics within the United States
Pecan Industry.” HortTechnology 11(1): 110–118.

323
37
Economic Benchmark Model and Analysis of the Effects of the Chinese Tariff on the U.S. Pecan Industry
Moore, E.D. and G.W. Williams, M.A. Palma, and L. Lombardini. 2009. “Effectiveness of State-level Pecan Promotion Programs: The Case of the Texas Pecan Checkoff Program.” HortScience 44(7): 1914-1920.
Nesbitt, M., L. Stein, and J. Kamas. 2013. “Improved Pecans.” Texas Fruit and Nut Production
Report No. E-609, Texas A&M AgriLife Extension Service, Texas A&M University System, College Station, Texas, February. On-line at: https://agrilifeextension.tamu.edu/library/farming/texas-fruit-and-nut-production-improved-pecans/.
Nesbitt, M., L. Stein, and J. Kamas. 2010. “Native Pecans.” Texas Fruit and Nut Production.
Texas A&M AgriLife Extension Service, Texas A&M University System, College Station, Texas, February. On-line at: https://aggie-horticulture.tamu.edu/fruit-nut/files/2010/10/native-pecans.pdf.
Palma, M. and D. Chavez. 2015. “Economic Analysis of the Implementation of a Federal
Marketing Order for Pecans.” Unpublished, Department of Agricultural Economics, Texas A&M University.
Park, T. and W.J. Florkowski. 1999. “Demand and Quality Uncertainty in Pecan Purchasing
Decisions.” Journal of Agricultural and Applied Economics 31(1): 29-39. Produce Report. 2019. “3000% Increase in Mexican Pecan Exports to China.” M.Z. Marketing
Communications, Shanghai, China. August 12. On-line at: https://www.producereport.com/article/3000-increase-mexican-pecan-exports-china
Onunkwo, I.M. and J.E. Epperson. 2000. “Export Demand for U.S. Pecans: Impacts of U.S. Export
Promotion Programs.” Agribusiness 16(2): 253-265. Reid, W. and K.L. Hunt. 2000. “Pecan Production in the Northern United States.” HorTechnology
10(2): 298-301. Shafer, C.E. 1996. “Pecan Production and Price Trends 1979–1995.” Faculty Paper 24019,
Department of Agricultural Economics, Texas A&M University. Sumner, D.A. and T.M. Hanon. 2018. “Economic Impacts of Increased Tariffs that have Reduced
Import Access for U.S. Fruit and Tree Nuts Exports to Important Markets.” University of California Agricultural Issues Center and Department of Agricultural and Resource Economics, University of California, Davis, August.
U.S. Department of Agriculture (USDA). 2019a. “Pecan Production.” National Agricultural
Statistics Service (NASS), March 14. On-line at: https://downloads.usda.library.cornell.edu/ usda-esmis/files/5425kg32f/tt44pv533/v979v9335/pecnpr19.pdf
38
Economic Benchmark Model and Analysis of the Effects of the Chinese Tariff on the U.S. Pecan Industry
U.S. Department of Agriculture (USDA). 2019b. “Fruit and Tree Nut Yearbook Tables.” Economic Research Service. On-line at: https://www.ers.usda.gov/data-products/fruit-and-tree-nut-data/fruit-and-tree-nut-yearbook-tables/
U.S. Department of Agriculture (USDA). 2019c. “Global Agricultural Trade System (GATS).”
Foreign Agriculture Service. On-line at: https://apps.fas.usda.gov/gats/ U.S. Department of Agriculture (USDA). 2019d. “Specialty Crops: Custom Reports.”
Agricultural Marketing Service. On-line at: https://www.ams.usda.gov/market-news/fruits-vegetables.
U.S. Department of Labor (USDL). 2019. “Producer Price Indexes.” Bureau of Labor Statistics.
On-line at: https://www.bls.gov/ppi/data.htm. Wells, G.J., S.E. Miller, and C.S. Thompson. 1986. “Farm Level Demand for Pecans
Reconsidered.” Journal of Agricultural and Applied Economics 18(1): 157-160. Williams, G.W., O. Capps, Jr., and V. Salin. 2018. “Effects of the Chinese Retaliatory Tariff on
U.S. Pecan Exports.” Department of Agricultural Economics, Texas A&M University. Wood, B.W. 1993. “Production Characteristics of the United States Pecan Industry.” Journal of
the American Society of Horticultural Science 118(4): 538-545. Wood, B.W. 2001. “Production Unit Trends and Price Characteristics within the United States
Pecan Industry.” HortTechnology 11(1): 110–118.

324
39
Economic Benchmark Model and Analysis of the Effects of the Chinese Tariff on the U.S. Pecan Industry
APPENDIX 1 Chronological Review of Past Economic Research on the U.S. Pecan Industry
This appendix provides a more detailed, chronological review of past economic research on U.S pecan markets. Jones, Childs, Washburn, Thibodeaux, Park, and Rutland (1932) “An Economic Study of the Pecan Industry.” U.S. Department of Agriculture, Technical Bulletin No. 324, September 1932.
This study is the earliest known economic analysis of the U.S. pecan industry. Conducted by the USDA Bureau of Agricultural Economics (now known as the Economic Research Service) in cooperation with various State agencies, the study covers the period of 1928-1930. The study reports the results of a survey focused on three basic pecan market activities: (1) production, which included estimates of the size of the pecan crop, a survey of the number of pecan trees by age groups and geographic distribution, and varieties grown; (2) cost of production, which dealt with practices and costs in the development of pecan orchards of improved varieties and in the operation of bearing orchards; and (3) marketing, which included a description of marketing practices in producing areas as well as a presentation of price and distribution data. The survey also included information on pecan-marketing conditions from the viewpoint of the retailer and consumer and a discussion of the competition of pecans with other nuts. The study provides data but no development of a U.S. pecan model. Lerner (1959) “An Econometric Analysis of the Demand for Pecans with Special Reference to the Demand Interrelationships among Domestic Tree Nuts.” Ph.D. thesis, Oklahoma State University.
This study is the first known attempt to investigate demand interrelationships of various tree nut products examining pecans, walnuts, filberts, and almonds using annual time-series data from 1927-1955, excluding the war years of 1942-1946. Using ordinary least squares regression, the estimated own-price elasticities were -1.19 for native pecans, -1.80 for walnuts, -23.04 for filberts, and -0.86 for almonds. The estimated income elasticities were 2.32 for pecans, 2.40 for walnuts, 20.12 for filberts, and 2.53 for almonds. Pecans and walnuts were found to be gross complements. Pecans and filberts, pecans and almonds, and walnuts and almonds were found to be gross substitutes. Although estimating demand relationships, the study does not consider production, price, or other pecan industry activities.
Dhaliwal (1972) “An Econometric Investigation of Demand Interrelationships among Tree Nuts and Peanuts.” Ph.D. thesis, Oregon State University.
This study examined single equation demand interrelationships among eight tree nuts, including almonds, filbert, pecans, walnuts, pistachios, Brazil nuts, and cashews using annual time-series data from 1947-1968. The estimated own-price elasticities for each type of nut were substantially lower than reported by Lerner in 1959. The price elasticities estimated by Dhaliwal were -0.91 for pecans, -0.29 for walnuts, -1.93 for filberts, and -0.55 for almonds. Pecans and walnuts, pecans and Brazil nuts, and Brazil nuts and cashews were found to be gross substitutes; almonds and filberts as well as pecans and pistachios were found to be gross complements.
40
Economic Benchmark Model and Analysis of the Effects of the Chinese Tariff on the U.S. Pecan Industry
Wells, Miller, and Thompson (1986) “Farm level demand for pecans reconsidered.” Journal of Agricultural and Applied Economics 18(1): 157-160.
This study estimated farm-level demand for pecans using annual data from 1970-1982 based on a price-dependent demand function. The own-price flexibility of pecans at the farm level they estimated was -0.97, similar to the estimate by Dhaliwai (1972). Florkowski, Purcell, and Hubbard (1992) “Importance for the U.S. Pecan Industry of Communicating about Quality.” Hortscience 27(5): 462-464.
The authors of this study surveyed pecan growers from Georgia to provide information about knowledge of and perceived adequacy of pecan quality standards. Logit models were used to identify variables influencing knowledge of pecan grades and their perceived adequacy. Larger and more experienced growers were more familiar with the USDA standards for grades than were smaller growers. The geographical location of growers within Georgia did not significantly affect the results.
Wood (1993) “Production Characteristics of the United States Pecan Industry.” Journal of the American Society of Horticultural Science 118(4): 538-545.
This study as well as those by Epperson and Allison 1980: Swink, 1991; Wood, 1991; and Young, 1991concludes that past efforts to forecast in-shell nut production and expanding domestic and export markets has been difficult. Forecasting-related problems have been largely associated with the alternative bearing tendency of the crop. This study characterized the cyclic, alternate bearing and correlative aspects of U.S. produced pecans and assessed the feasibility of solely using in-shell nut production to forecast future production based on stepwise autoregressive techniques. Univariate models will generally not be capable of satisfactorily forecasting production for the pecan industry. Past models, in general, failed to take into account the cyclic (alternate bearing) characteristic of pecan production. Shafer (1996)“Pecan Production and Price Trends 1979–1995.” Faculty Paper 24019, Department of Agricultural Economics, Texas A&M University.
A major conclusion of this study is that expected pecan production in the current season as well as beginning stocks affect pecan prices in each season. Relatively high pecan prices over the period from 1990 to 1995 were attributed to lower production and stocks in those years. In addition, the study notes a growing trend in international trade in pecans as well as a significant impact on U.S. pecan market prices from pecan import volumes. Florkowski, You, and Huang (1999) “Consumer’s Selection of Retail Outlets in Buying Pecans.” Journal of Food Distribution Research 30(2): 34-43.
This study identified differences in consumer characteristics and the selection of the type of a retail outlet in pecan purchases using a multinomial logit model. Data were collected through a

325
39
Economic Benchmark Model and Analysis of the Effects of the Chinese Tariff on the U.S. Pecan Industry
APPENDIX 1 Chronological Review of Past Economic Research on the U.S. Pecan Industry
This appendix provides a more detailed, chronological review of past economic research on U.S pecan markets. Jones, Childs, Washburn, Thibodeaux, Park, and Rutland (1932) “An Economic Study of the Pecan Industry.” U.S. Department of Agriculture, Technical Bulletin No. 324, September 1932.
This study is the earliest known economic analysis of the U.S. pecan industry. Conducted by the USDA Bureau of Agricultural Economics (now known as the Economic Research Service) in cooperation with various State agencies, the study covers the period of 1928-1930. The study reports the results of a survey focused on three basic pecan market activities: (1) production, which included estimates of the size of the pecan crop, a survey of the number of pecan trees by age groups and geographic distribution, and varieties grown; (2) cost of production, which dealt with practices and costs in the development of pecan orchards of improved varieties and in the operation of bearing orchards; and (3) marketing, which included a description of marketing practices in producing areas as well as a presentation of price and distribution data. The survey also included information on pecan-marketing conditions from the viewpoint of the retailer and consumer and a discussion of the competition of pecans with other nuts. The study provides data but no development of a U.S. pecan model. Lerner (1959) “An Econometric Analysis of the Demand for Pecans with Special Reference to the Demand Interrelationships among Domestic Tree Nuts.” Ph.D. thesis, Oklahoma State University.
This study is the first known attempt to investigate demand interrelationships of various tree nut products examining pecans, walnuts, filberts, and almonds using annual time-series data from 1927-1955, excluding the war years of 1942-1946. Using ordinary least squares regression, the estimated own-price elasticities were -1.19 for native pecans, -1.80 for walnuts, -23.04 for filberts, and -0.86 for almonds. The estimated income elasticities were 2.32 for pecans, 2.40 for walnuts, 20.12 for filberts, and 2.53 for almonds. Pecans and walnuts were found to be gross complements. Pecans and filberts, pecans and almonds, and walnuts and almonds were found to be gross substitutes. Although estimating demand relationships, the study does not consider production, price, or other pecan industry activities.
Dhaliwal (1972) “An Econometric Investigation of Demand Interrelationships among Tree Nuts and Peanuts.” Ph.D. thesis, Oregon State University.
This study examined single equation demand interrelationships among eight tree nuts, including almonds, filbert, pecans, walnuts, pistachios, Brazil nuts, and cashews using annual time-series data from 1947-1968. The estimated own-price elasticities for each type of nut were substantially lower than reported by Lerner in 1959. The price elasticities estimated by Dhaliwal were -0.91 for pecans, -0.29 for walnuts, -1.93 for filberts, and -0.55 for almonds. Pecans and walnuts, pecans and Brazil nuts, and Brazil nuts and cashews were found to be gross substitutes; almonds and filberts as well as pecans and pistachios were found to be gross complements.
40
Economic Benchmark Model and Analysis of the Effects of the Chinese Tariff on the U.S. Pecan Industry
Wells, Miller, and Thompson (1986) “Farm level demand for pecans reconsidered.” Journal of Agricultural and Applied Economics 18(1): 157-160.
This study estimated farm-level demand for pecans using annual data from 1970-1982 based on a price-dependent demand function. The own-price flexibility of pecans at the farm level they estimated was -0.97, similar to the estimate by Dhaliwai (1972). Florkowski, Purcell, and Hubbard (1992) “Importance for the U.S. Pecan Industry of Communicating about Quality.” Hortscience 27(5): 462-464.
The authors of this study surveyed pecan growers from Georgia to provide information about knowledge of and perceived adequacy of pecan quality standards. Logit models were used to identify variables influencing knowledge of pecan grades and their perceived adequacy. Larger and more experienced growers were more familiar with the USDA standards for grades than were smaller growers. The geographical location of growers within Georgia did not significantly affect the results.
Wood (1993) “Production Characteristics of the United States Pecan Industry.” Journal of the American Society of Horticultural Science 118(4): 538-545.
This study as well as those by Epperson and Allison 1980: Swink, 1991; Wood, 1991; and Young, 1991concludes that past efforts to forecast in-shell nut production and expanding domestic and export markets has been difficult. Forecasting-related problems have been largely associated with the alternative bearing tendency of the crop. This study characterized the cyclic, alternate bearing and correlative aspects of U.S. produced pecans and assessed the feasibility of solely using in-shell nut production to forecast future production based on stepwise autoregressive techniques. Univariate models will generally not be capable of satisfactorily forecasting production for the pecan industry. Past models, in general, failed to take into account the cyclic (alternate bearing) characteristic of pecan production. Shafer (1996)“Pecan Production and Price Trends 1979–1995.” Faculty Paper 24019, Department of Agricultural Economics, Texas A&M University.
A major conclusion of this study is that expected pecan production in the current season as well as beginning stocks affect pecan prices in each season. Relatively high pecan prices over the period from 1990 to 1995 were attributed to lower production and stocks in those years. In addition, the study notes a growing trend in international trade in pecans as well as a significant impact on U.S. pecan market prices from pecan import volumes. Florkowski, You, and Huang (1999) “Consumer’s Selection of Retail Outlets in Buying Pecans.” Journal of Food Distribution Research 30(2): 34-43.
This study identified differences in consumer characteristics and the selection of the type of a retail outlet in pecan purchases using a multinomial logit model. Data were collected through a

326
41
Economic Benchmark Model and Analysis of the Effects of the Chinese Tariff on the U.S. Pecan Industry
nationwide survey. The report concluded that age, household income, and household size are among the important consumer characteristics that influenced the selection of a retail outlet. Employment and the timing of pecan purchases also influenced the use of a specific type of retail outlet. In particular, mail-order purchases were made by older persons with higher incomes and from larger households in comparison to purchases at grocery stores or other outlets. The study also provided information needed to improve marketing strategies for different outlets and suggested that various strategies can be developed to reach different groups of pecan buyers by type of retail outlet. Park and Florkowski (1999) “Demand and Quality Uncertainty in Pecan Purchasing Decisions.” Journal of Agricultural and Applied Economics 31(1):29-39.
The authors of this study estimated a generalized Heckman model of purchase decisions incorporating perceived consumer quality attributes, ease of purchase, and familiarity with marketing outlets as factors influencing pecan purchases. A nationwide mail survey examining the purchases of raw, unprocessed pecans (shelled or unshelled) was conducted in the summer of 1993 based on a randomly drawn sample of consumers provided by marketing representatives from the pecan industry. The study concludes that marketing efforts encouraging consumers to spend more on nut products increased both the probability of pecan purchases and the amount purchased. They also found that consumers who used all types of nuts in a wider variety of foods tended to purchase pecans more frequently. In addition, a diverse set of marketing outlets were found to provide consumers with convenient sources of purchasing pecans and had a significant influence on the probability of pecan purchases but not on the amount of pecans purchased.
Onunkwo and Epperson (2000) “Export Demand for U.S. Pecans: Impacts of U.S. Export Promotion Programs.” Agribusiness16(2): 253-265.
In this study, the impacts of federal promotion programs on the foreign demand for U.S. pecans on a shelled basis were estimated over the period of 1986 to 1996. Attention was centered on Asia and the European Union, which together accounted for about 27% of U.S. pecan exports during that period. The own-price elasticities of export demand for pecans were estimated as -0.72 for Asia and -0.73 for the European Union. The returns per dollar of promotion expenditure for pecans were found to be $6.45 for Asia and $6.75 for the European Union. Reid and Hunt (2000) “Pecan Production in the Northern United States.” HorTechnology 10(2): 298-301.
This study finds that more than 93% of pecans produced in the United States are grown in the southeastern and southwestern states. However, the native range of the pecan tree extends northward into Kansas, Missouri, and Illinois. Reid and Hunt (2000) noted that in these northern states, commercial pecan production was expanding as additional acres of native trees were brought under cultivation, and orchards of short-season, cold-hardy cultivars were established. Native nut production dominated the northern pecan industry accounting for over 95% of nuts produced in the region. Cultural practices for native pecans had been developed for northern groves that feature low inputs and good yields.
42
Economic Benchmark Model and Analysis of the Effects of the Chinese Tariff on the U.S. Pecan Industry
Wood (2001) Wood, B. W., “Production Unit Trends and Price Characteristics within the United States Pecan Industry.” HortTechnology, (2001) 11(1):110–118.
A major finding of this study was that pecan’s alternate-bearing characteristic causes significant marketing problems in the U.S. pecan industry. The study also finds that pecan prices have a much stronger relationship with supply at the national level than at the state level. As well, the supply of pecans on-hand at the beginning of the season, plus the supply from the current season’s crop, plus the price of walnuts together accounted for 80% of the price variation of U.S. pecan prices. Ibrahim and Florkowski (2005) “Testing for Seasonal Co-integration and Error Correction: The US Pecan Price-Inventory Relationship.” Selected Paper Presented at the Southern Agricultural Economics Association, February 5–9, Little Rock, Arkansas.
This study analyzed the relationship between pecan price and pecan cold storage inventory by applying seasonal co-integration methods. Monthly data over the period 1991 to 2002 were used in this analysis. Inventories were found to be a driver of pecan prices.
Ibrahim and Florkowski (2007) “Forecasting U.S. Shelled Pecan Prices: A Co-Integration Approach.” Selected Paper Presented at the Southern Agricultural Economics Association, February 4–7, Mobile, Alabama, 2007.
The study examined the relationship between shelled pecan prices and inventories using monthly data over the period January 1992 to December 2004. Engle-Granger and Johansen co-integration tests found evidence of a long-run relationship between pecan prices and inventories. Moore, Williams, Palma, and Lombardini (2009) “Effectiveness of State-level Pecan Promotion Programs: The Case of the Texas Pecan Checkoff Program.” HortScience 44(7): 1914-1920.
This study evaluates the economic effectiveness of the Texas Pecan Checkoff Program in expanding sales of all Texas pecans and on sales of improved and native Texas pecan varieties. The analysis indicated that the Texas Pecan Checkoff Program had effectively increased sales of improved varieties of Texas pecans but had no statistically measureable impact on sales of native varieties of Texas pecans. A benefit-cost analysis determined that the additional sales revenues generated was relatively large compared to the dollar value invested in promoting pecans. Palma and Chavez (2015) “Economic Analysis of the Implementation of a Federal Marketing Order for Pecans.” Unpublished Manuscript, Department of Agricultural Economics, Texas A&M University.
The study provided an overview of the U.S. pecan industry and the potential effects on supply and demand from the proposed Federal Marketing Order (FMO) for pecans. The assessment under consideration was $0.02-$0.03 per pound of improved pecan varieties in shell to be collected from handlers and $0.01-$0.02 per pound for native/seedling varieties. The chief conclusion was that pecan prices at the grower level would increase by $0.63 for improved varieties and by $0.036 for native varieties due to the proposed FMO for pecans. This study described the economic and marketing state of the pecan industry using available secondary data. In addition, this study

327
41
Economic Benchmark Model and Analysis of the Effects of the Chinese Tariff on the U.S. Pecan Industry
nationwide survey. The report concluded that age, household income, and household size are among the important consumer characteristics that influenced the selection of a retail outlet. Employment and the timing of pecan purchases also influenced the use of a specific type of retail outlet. In particular, mail-order purchases were made by older persons with higher incomes and from larger households in comparison to purchases at grocery stores or other outlets. The study also provided information needed to improve marketing strategies for different outlets and suggested that various strategies can be developed to reach different groups of pecan buyers by type of retail outlet. Park and Florkowski (1999) “Demand and Quality Uncertainty in Pecan Purchasing Decisions.” Journal of Agricultural and Applied Economics 31(1):29-39.
The authors of this study estimated a generalized Heckman model of purchase decisions incorporating perceived consumer quality attributes, ease of purchase, and familiarity with marketing outlets as factors influencing pecan purchases. A nationwide mail survey examining the purchases of raw, unprocessed pecans (shelled or unshelled) was conducted in the summer of 1993 based on a randomly drawn sample of consumers provided by marketing representatives from the pecan industry. The study concludes that marketing efforts encouraging consumers to spend more on nut products increased both the probability of pecan purchases and the amount purchased. They also found that consumers who used all types of nuts in a wider variety of foods tended to purchase pecans more frequently. In addition, a diverse set of marketing outlets were found to provide consumers with convenient sources of purchasing pecans and had a significant influence on the probability of pecan purchases but not on the amount of pecans purchased.
Onunkwo and Epperson (2000) “Export Demand for U.S. Pecans: Impacts of U.S. Export Promotion Programs.” Agribusiness16(2): 253-265.
In this study, the impacts of federal promotion programs on the foreign demand for U.S. pecans on a shelled basis were estimated over the period of 1986 to 1996. Attention was centered on Asia and the European Union, which together accounted for about 27% of U.S. pecan exports during that period. The own-price elasticities of export demand for pecans were estimated as -0.72 for Asia and -0.73 for the European Union. The returns per dollar of promotion expenditure for pecans were found to be $6.45 for Asia and $6.75 for the European Union. Reid and Hunt (2000) “Pecan Production in the Northern United States.” HorTechnology 10(2): 298-301.
This study finds that more than 93% of pecans produced in the United States are grown in the southeastern and southwestern states. However, the native range of the pecan tree extends northward into Kansas, Missouri, and Illinois. Reid and Hunt (2000) noted that in these northern states, commercial pecan production was expanding as additional acres of native trees were brought under cultivation, and orchards of short-season, cold-hardy cultivars were established. Native nut production dominated the northern pecan industry accounting for over 95% of nuts produced in the region. Cultural practices for native pecans had been developed for northern groves that feature low inputs and good yields.
42
Economic Benchmark Model and Analysis of the Effects of the Chinese Tariff on the U.S. Pecan Industry
Wood (2001) Wood, B. W., “Production Unit Trends and Price Characteristics within the United States Pecan Industry.” HortTechnology, (2001) 11(1):110–118.
A major finding of this study was that pecan’s alternate-bearing characteristic causes significant marketing problems in the U.S. pecan industry. The study also finds that pecan prices have a much stronger relationship with supply at the national level than at the state level. As well, the supply of pecans on-hand at the beginning of the season, plus the supply from the current season’s crop, plus the price of walnuts together accounted for 80% of the price variation of U.S. pecan prices. Ibrahim and Florkowski (2005) “Testing for Seasonal Co-integration and Error Correction: The US Pecan Price-Inventory Relationship.” Selected Paper Presented at the Southern Agricultural Economics Association, February 5–9, Little Rock, Arkansas.
This study analyzed the relationship between pecan price and pecan cold storage inventory by applying seasonal co-integration methods. Monthly data over the period 1991 to 2002 were used in this analysis. Inventories were found to be a driver of pecan prices.
Ibrahim and Florkowski (2007) “Forecasting U.S. Shelled Pecan Prices: A Co-Integration Approach.” Selected Paper Presented at the Southern Agricultural Economics Association, February 4–7, Mobile, Alabama, 2007.
The study examined the relationship between shelled pecan prices and inventories using monthly data over the period January 1992 to December 2004. Engle-Granger and Johansen co-integration tests found evidence of a long-run relationship between pecan prices and inventories. Moore, Williams, Palma, and Lombardini (2009) “Effectiveness of State-level Pecan Promotion Programs: The Case of the Texas Pecan Checkoff Program.” HortScience 44(7): 1914-1920.
This study evaluates the economic effectiveness of the Texas Pecan Checkoff Program in expanding sales of all Texas pecans and on sales of improved and native Texas pecan varieties. The analysis indicated that the Texas Pecan Checkoff Program had effectively increased sales of improved varieties of Texas pecans but had no statistically measureable impact on sales of native varieties of Texas pecans. A benefit-cost analysis determined that the additional sales revenues generated was relatively large compared to the dollar value invested in promoting pecans. Palma and Chavez (2015) “Economic Analysis of the Implementation of a Federal Marketing Order for Pecans.” Unpublished Manuscript, Department of Agricultural Economics, Texas A&M University.
The study provided an overview of the U.S. pecan industry and the potential effects on supply and demand from the proposed Federal Marketing Order (FMO) for pecans. The assessment under consideration was $0.02-$0.03 per pound of improved pecan varieties in shell to be collected from handlers and $0.01-$0.02 per pound for native/seedling varieties. The chief conclusion was that pecan prices at the grower level would increase by $0.63 for improved varieties and by $0.036 for native varieties due to the proposed FMO for pecans. This study described the economic and marketing state of the pecan industry using available secondary data. In addition, this study

328
43
Economic Benchmark Model and Analysis of the Effects of the Chinese Tariff on the U.S. Pecan Industry
described the costs and benefits of the proposed FMO for pecan producers and handlers using a risk-based simulation model. Kim and Dharmasena (2018) “Price Discovery and Integration in U.S. Pecan Markets. “Journal of Food Distribution Research 49(1): 39-47.
Given the nature and the location of pecan production in the United States, the study postulates that the pecan price in one state likely affects or is affected by the pecan prices in other states. Using grower-level pecan price data on a biweekly basis from the October 2005/January 2006 through the October 2015/January 2016 seasons, pecan market integration patterns were estimated for Texas, Oklahoma, Georgia, and Louisiana using causality structures identified through machine-learning methods. Current pecan prices received by growers in Texas were found to be a direct cause of grower prices in Oklahoma, Georgia, and Louisiana. Past-period grower-level pecan prices in Georgia either directly or indirectly influenced current prices in other states.
Sumner and Hanon (2018) “Economic Impacts of Increased Tariffs that have Reduced Import Access for U.S. Fruit and Tree Nuts Exports to Important Markets.” University of California Agricultural Issues Center and Department of Agricultural and Resource Economics, University of California, Davis, August.
This report summarized potential impacts of higher tariffs facing major U.S. fruits and tree nuts, particularly almonds, pecans, pistachios, walnuts, apples, oranges, raisins, sour cherries, sweet cherries, and table grapes. The loss in revenue due to declines in U.S. prices resulting from tariff increases in affected markets (Hong Kong and China, Vietnam, India, Mexico, and Turkey) was found to be about $3.4 billion. Importantly, among tree nut commodities, almonds alone accounted for roughly $1.6 billion in losses, while pistachios, walnuts, and pecans faced losses of roughly $384 million, $315 million, and $224 million, respectively. Williams, Capps, and Salin (2018) “Effects of the Chinese Retaliatory Tariff on U.S. Pecan Exports.” White paper to the American Pecan Council.
The study considered the potential impacts of recent retaliatory tariffs on pecans. Commercially produced in 14 states, pecans are the only native tree nut grown in the United States. The study finds that the likely impacts of the Chinese 47% tariff on U.S. in-shell pecans are as follows: (1) Chinese imports of U.S. in-shell pecans will fall substantially; (2) exports of U.S. pecans to the European Union (EU) and to other countries likely will rise; (4) globally exports of U.S. pecans will fall but the rise of exports to the EU and to other countries will not cover the loss in exports experienced in China; (5) Mexico, South Africa, and Australia likely will capture more of the Chinese market but will not cover the loss in exports from the United States; and (6) exports of pecans from U.S. competitors to the EU and to the ROW likely will decline. As a consequence, U.S. pecan prices will drop and production likely will decline over time and led to a decline in producer revenues and profitability. Cheng, Dharmasena, and Capps (2019) “Demand Interrelationships of Peanuts and Tree Nuts in the United States.” Working Paper, Department of Agricultural Economics, Texas A&M University, 2019.
44
Economic Benchmark Model and Analysis of the Effects of the Chinese Tariff on the U.S. Pecan Industry
Cheng, Dharmasena, and Capps (2019) conducted a demand system analysis for peanuts and tree nuts in the United States. Monthly observations from 2004 through 2015 derived from the Nielsen Homescan Panel data were used. The nut categories in this analysis corresponded to peanuts, pecans, almonds, cashews, walnuts, macadamia nuts, pistachios, and mixed nuts. All of the own-price elasticities were statistically different from zero, ranging from -0.67 to -2.81. Income elasticities also were statistically different from zero, varying from 0.23 to 0.87, indicating that peanuts and tree nuts were necessities. In particular, the own-price elasticity for pecans was estimated to be -1.07, and the income elasticity for pecans was estimated to be 0.65. In addition, the issue of substitutability and complementarity of peanuts and tree nuts was examined in this analysis. Most nut types were found to be substitutes for each other. Specifically, pecans were found to be substitutes for peanuts, almonds, walnuts, macadamia nuts, pistachios, and mixed nuts. Pecans and cashews were found to be complements.

329
43
Economic Benchmark Model and Analysis of the Effects of the Chinese Tariff on the U.S. Pecan Industry
described the costs and benefits of the proposed FMO for pecan producers and handlers using a risk-based simulation model. Kim and Dharmasena (2018) “Price Discovery and Integration in U.S. Pecan Markets. “Journal of Food Distribution Research 49(1): 39-47.
Given the nature and the location of pecan production in the United States, the study postulates that the pecan price in one state likely affects or is affected by the pecan prices in other states. Using grower-level pecan price data on a biweekly basis from the October 2005/January 2006 through the October 2015/January 2016 seasons, pecan market integration patterns were estimated for Texas, Oklahoma, Georgia, and Louisiana using causality structures identified through machine-learning methods. Current pecan prices received by growers in Texas were found to be a direct cause of grower prices in Oklahoma, Georgia, and Louisiana. Past-period grower-level pecan prices in Georgia either directly or indirectly influenced current prices in other states.
Sumner and Hanon (2018) “Economic Impacts of Increased Tariffs that have Reduced Import Access for U.S. Fruit and Tree Nuts Exports to Important Markets.” University of California Agricultural Issues Center and Department of Agricultural and Resource Economics, University of California, Davis, August.
This report summarized potential impacts of higher tariffs facing major U.S. fruits and tree nuts, particularly almonds, pecans, pistachios, walnuts, apples, oranges, raisins, sour cherries, sweet cherries, and table grapes. The loss in revenue due to declines in U.S. prices resulting from tariff increases in affected markets (Hong Kong and China, Vietnam, India, Mexico, and Turkey) was found to be about $3.4 billion. Importantly, among tree nut commodities, almonds alone accounted for roughly $1.6 billion in losses, while pistachios, walnuts, and pecans faced losses of roughly $384 million, $315 million, and $224 million, respectively. Williams, Capps, and Salin (2018) “Effects of the Chinese Retaliatory Tariff on U.S. Pecan Exports.” White paper to the American Pecan Council.
The study considered the potential impacts of recent retaliatory tariffs on pecans. Commercially produced in 14 states, pecans are the only native tree nut grown in the United States. The study finds that the likely impacts of the Chinese 47% tariff on U.S. in-shell pecans are as follows: (1) Chinese imports of U.S. in-shell pecans will fall substantially; (2) exports of U.S. pecans to the European Union (EU) and to other countries likely will rise; (4) globally exports of U.S. pecans will fall but the rise of exports to the EU and to other countries will not cover the loss in exports experienced in China; (5) Mexico, South Africa, and Australia likely will capture more of the Chinese market but will not cover the loss in exports from the United States; and (6) exports of pecans from U.S. competitors to the EU and to the ROW likely will decline. As a consequence, U.S. pecan prices will drop and production likely will decline over time and led to a decline in producer revenues and profitability. Cheng, Dharmasena, and Capps (2019) “Demand Interrelationships of Peanuts and Tree Nuts in the United States.” Working Paper, Department of Agricultural Economics, Texas A&M University, 2019.
44
Economic Benchmark Model and Analysis of the Effects of the Chinese Tariff on the U.S. Pecan Industry
Cheng, Dharmasena, and Capps (2019) conducted a demand system analysis for peanuts and tree nuts in the United States. Monthly observations from 2004 through 2015 derived from the Nielsen Homescan Panel data were used. The nut categories in this analysis corresponded to peanuts, pecans, almonds, cashews, walnuts, macadamia nuts, pistachios, and mixed nuts. All of the own-price elasticities were statistically different from zero, ranging from -0.67 to -2.81. Income elasticities also were statistically different from zero, varying from 0.23 to 0.87, indicating that peanuts and tree nuts were necessities. In particular, the own-price elasticity for pecans was estimated to be -1.07, and the income elasticity for pecans was estimated to be 0.65. In addition, the issue of substitutability and complementarity of peanuts and tree nuts was examined in this analysis. Most nut types were found to be substitutes for each other. Specifically, pecans were found to be substitutes for peanuts, almonds, walnuts, macadamia nuts, pistachios, and mixed nuts. Pecans and cashews were found to be complements.

330
45
Economic Benchmark Model and Analysis of the Effects of the Chinese Tariff on the U.S. Pecan Industry
APPENDIX 2 PecanMod Baseline Simulation Validation Statistics1
Identities Total In-Shell Pecan Production = Improved Pecan Production (In-Shell) + Native Pecan Production (In-Shell) Total Utilized Production (In-Shell Conversion to Shelled Identity = Conversion Factor * Total In-Shell Production Market Clearing Condition (Shelled): Beginning Stocks + Domestic Production + Imports = Domestic Use + Exports + Ending Stocks 1 See Figure 16 for variable definitions.
Theil Decomposition Statistics Name of Dependent Variable
Time Period (Annual) R2
Adjusted R2 DW RMSE MAE MAPE
Bias Proportion
Variance Proportion
Covariance Proportion
TheilU2
Sn (1,000 lb) 1960 to 2018 0.925268 0.913311 2.041073 10,603.930 8,008.906 14.47 0.000029 0.021728 0.978243 0.1555
Si (1,000 lb) 1960 to 2018 0.881114 0.862092 1.934235 22,209.920 18,310.550 13.78 0.000651 0.050615 0.948735 0.2340
Sm (1,000 lb) 1980 to 2018 0.989127 0.986227 2.500473 4,215.100 3,306.466 19.76 0.000064 0.003094 0.996842 0.5193
Du (1,000 lb) 1979 to 2018 0.866537 0.836400 1.978798 6,187.479 5,010.276 3.99 0.000027 0.047910 0.952063 0.3238
Eu (1,000 lb) 1980 to 2018 0.862908 0.831951 1.768442 7,403.773 5,519.689 13.03 0.000013 0.043848 0.956140 0.2379
Dx (1,000 lb) 1990 to 2018 0.983503 0.978004 2.57888 4,521.947 3,432.311 9.60 0.000001 0.002938 0.997061 0.5123
Pi (cents/lb) 1980 to 2018 0.998229 0.998078 2.469824 2.558 2.116 1.89 0.000000 0.000443 0.999557 0.0789
Pn (cents/lb) 1980 to 2018 0.994715 0.993914 2.154009 2.714 2.137 2.99 0.000000 0.001325 0.998675 0.1235
Pm (cents/lb) 1980 to 2018 0.931914 0.923904 2.006546 27.342 20.650 8.40 0.001395 0.000004 0.998601 0.5581
Px (cents/lb) 1980 to 2018 0.987525 0.962605 1.918434 24.094 18.107 5.60 0.000000 0.008253 0.991747 0.4972

331

332
FIND US HERE:
Follow us @AmericanPecan for quick and easypecan recipes, nut news, videos, and more.
WWW.AMERICANPECAN.COM

333
FIND US HERE:
Follow us @AmericanPecan for quick and easypecan recipes, nut news, videos, and more.
WWW.AMERICANPECAN.COM