2013 GRADE 6 NATIONAL ASSESSMENT Report.pdf
33
MINISTRY OF EDUCATION AND HUMAN RESOURCE DEVELOPMENT DOMINICA CURRICULUM, MEASUREMENT AND EVALUATION UNIT REPORT ON CANDIDATE’S PERFORMANCE AT THE 2013 GRADE SIX NATIONAL ASSESSMENTS (G6NA) © SEPTEMBER, 2013
-
Upload
khangminh22 -
Category
Documents
-
view
0 -
download
0
Transcript of 2013 GRADE 6 NATIONAL ASSESSMENT Report.pdf
MINISTRY OF EDUCATION AND HUMAN RESOURCE DEVELOPMENT
DOMINICA
CURRICULUM, MEASUREMENT AND EVALUATION
UNIT
REPORT ON CANDIDATE’S PERFORMANCE AT THE
2013 GRADE SIX NATIONAL ASSESSMENTS (G6NA)
© SEPTEMBER, 2013
Contents
1 ADMINISTRATION AND ENTRY ....................................................................................... 1
1.1 INTRODUCTION....................................................................................................................... 1 1.2 OVERVIEW OF THE TEST DEVELOPMENT PROCESS. ................................................................. 1
Table 1: Structure of the G6NA .............................................................................................. 2 1.3 ADMINISTRATION ................................................................................................................... 3 1.4 ENTRY .................................................................................................................................... 3 1.5 MARKING ............................................................................................................................... 4
2 RESULTS .................................................................................................................................. 4
2.1 NATIONAL MEAN AND MEASUREMENT ERROR ...................................................................... 4 2.2 OVERALL PERFORMANCE BY CATCHMENT AND GENDER ....................................................... 5 2.3 SELECTION OF STUDENTS FOR SECONDARY EDUCATION ....................................................... 6 2.4 AWARD OF SCHOLARSHIPS ..................................................................................................... 7 2.5 WEAK PERFORMANCE ............................................................................................................ 8
3 SUBJECT REPORTS ................................................................................................................ 8
3.1 LANGUAGE ARTS ................................................................................................................... 8 3.1.1 Usage and grammar ...................................................................................................... 8 3.1.2 Vocabulary ..................................................................................................................... 9 3.1.3 Spelling .......................................................................................................................... 9 3.1.4 Study Skills ................................................................................................................... 10 3.1.5 Comprehension ............................................................................................................ 10
3.2 COMPOSITION ....................................................................................................................... 10 3.2.1 Strengths ..................................................................................................................... 11 3.2.2 Areas for improvements .............................................................................................. 11
3.3 RECOMMENDATIONS FOR THE TEACHING OF WRITING .......................................................... 12 3.4 MATHEMATICS ..................................................................................................................... 12
3.4.1 Number concepts .......................................................................................................... 12 3.4.2 Computation .................................................................... Error! Bookmark not defined. 3.4.3 Measurement ................................................................................................................ 14 3.4.4 Fractions and Decimals ............................................................................................... 15 3.4.6 Problem Solving .............................................................. Error! Bookmark not defined. 3.4.7 Statistics .......................................................................... Error! Bookmark not defined.
3.5 SCIENCE ............................................................................................................................... 15 3.5.1 Life Processes .............................................................................................................. 15 3.5.2 Earth and Atmosphere, ................................................................................................ 16 3.5.3 Physical Sciences ......................................................................................................... 16
3.6 SOCIAL STUDIES ................................................................................................................... 17 3.6.1 Geographic Location ................................................................................................... 17 3.6.2 People .......................................................................................................................... 18 3.6.3 Physical Environment .................................................................................................. 18 3.6.4 Culture ......................................................................................................................... 19 3.6.5 Economic Activity ........................................................... Error! Bookmark not defined.
3.6.6 Drugs and Communication ............................................. Error! Bookmark not defined.
APPENDICES ............................................................................................................................. 20
APPENDIX A ............................................................................................................................... 20 COMPOSITION MARKING SCHEME ................................................................................ 20
APPENDIX B ............................................................................................................................... 23 Subject Specifications ........................................................................................................... 23 Language Arts .......................................................................... Error! Bookmark not defined. Mathematics ............................................................................. Error! Bookmark not defined. Science ...................................................................................................................................... Social Studies ............................................................................................................................
APPENDIX C ............................................................................................................................... 27 Item Facility Index - G6NA 2013 Multiple Choice Papers ................................................... 27
APPENDIX D ........................................................................................................................... 29 Standardizing Test Scores ..................................................................................................... 29
APPENDIX E ..................................................................... ERROR! BOOKMARK NOT DEFINED. GRADES RECEIVED BY DISTRICT....................................... Error! Bookmark not defined.
Grade6NationalAssessmentReport2013Curriculum,MeasurementandEvaluationUnit Page1
1 Administration and Entry 1.1 Introduction The Grade Six National Assessment (G6NA) forms part of the National Assessment Programme comprising of the Grade Two National Assessment, the Grade Four National Assessment and the Grade Six National Assessment. The NAP is aimed at determining how students are learning at key stages throughout the primary level and their readiness to access secondary level education. Unlike the Grades two and four national assessments which are meant to be diagnostic, the Grade Six National Assessment is a high stakes test of achievement. The major purposes of the G6NA are to:
select high performing students for the award of scholarships or bursaries and monitor levels of achievement across the education system.
As such the use of this examination to assess students' achievement at the end of primary school is limited. A considerable amount of data is collected by the annual administration of the G6NA and it would appear inappropriate not to use it to give the much-requested feedback to teachers and principals. The purpose of this report, then, is to provide schools with this information on student performance so that they may strive to improve their performance based on the feedback given. The report concentrates on the general strengths and weaknesses observed nationally among students in the different subject areas assessed. Principals and instructional support teams are urged to study the report carefully together with the individual school reports. These reports should indicate the areas the school may wish to focus on and will be of assistance in the construction phase of the school improvement plan. Appendix C shows a complete list of the facility indices (i.e. the percent of students who got an item correct) for each question on each of the four multiple-choice papers. Principals, grade 6 teachers and others may wish to review the percent correct alongside the actual question papers (enclosed) to get a good idea of national strengths and weaknesses of grade 6 students. 1.2 Overview of the test development process. The technical development of the examination was shared by the subject committees and the CMEU. The subject committees were responsible for examination content and ensuring that key aspects of the subjects were tested. The personnel of the CMEU assisted the committees with item editing and statistical issues.
Grade6NationalAssessmentReport2013Curriculum,MeasurementandEvaluationUnit Page2
There are four major areas in the test development process:
(a) preparation of the test plan (b) development of test blueprint or test specifications (c) item development (d) test construction
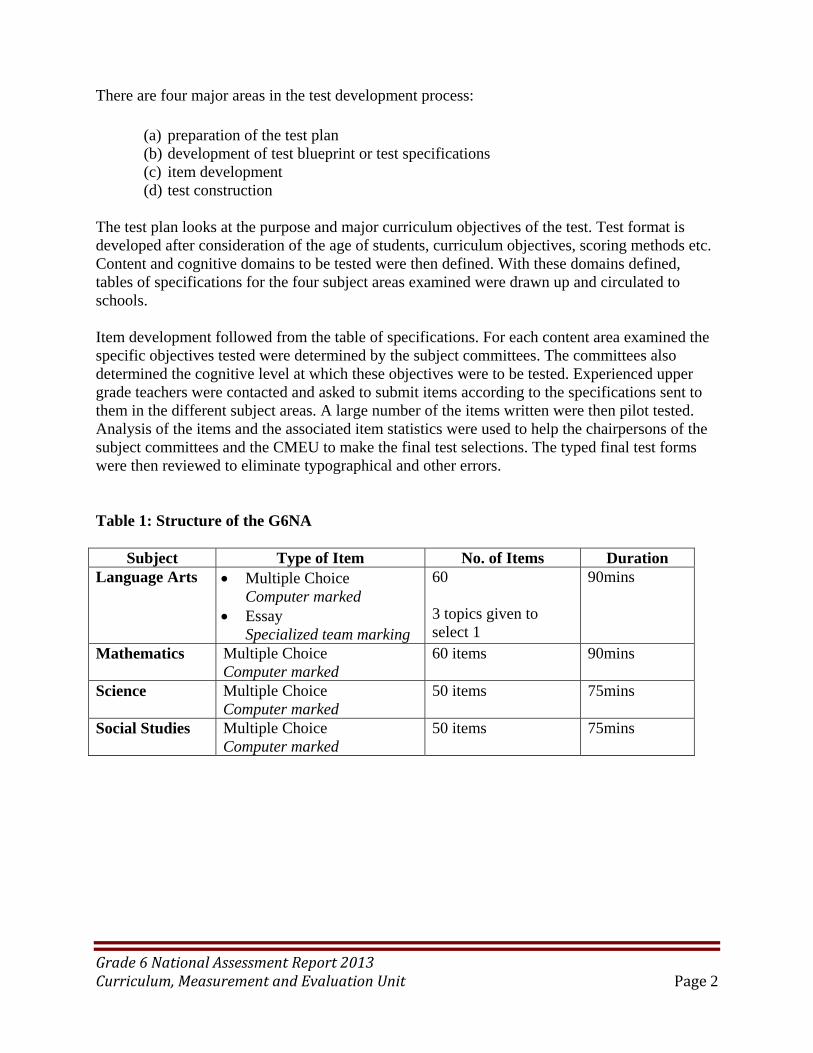
The test plan looks at the purpose and major curriculum objectives of the test. Test format is developed after consideration of the age of students, curriculum objectives, scoring methods etc. Content and cognitive domains to be tested were then defined. With these domains defined, tables of specifications for the four subject areas examined were drawn up and circulated to schools. Item development followed from the table of specifications. For each content area examined the specific objectives tested were determined by the subject committees. The committees also determined the cognitive level at which these objectives were to be tested. Experienced upper grade teachers were contacted and asked to submit items according to the specifications sent to them in the different subject areas. A large number of the items written were then pilot tested. Analysis of the items and the associated item statistics were used to help the chairpersons of the subject committees and the CMEU to make the final test selections. The typed final test forms were then reviewed to eliminate typographical and other errors. Table 1: Structure of the G6NA
Subject Type of Item No. of Items Duration Language Arts Multiple Choice
Computer marked Essay
Specialized team marking
60 3 topics given to select 1
90mins
Mathematics Multiple Choice Computer marked
60 items 90mins
Science Multiple Choice Computer marked
50 items 75mins
Social Studies Multiple Choice Computer marked
50 items 75mins
Grade6NationalAssessmentReport2013Curriculum,MeasurementandEvaluationUnit Page3
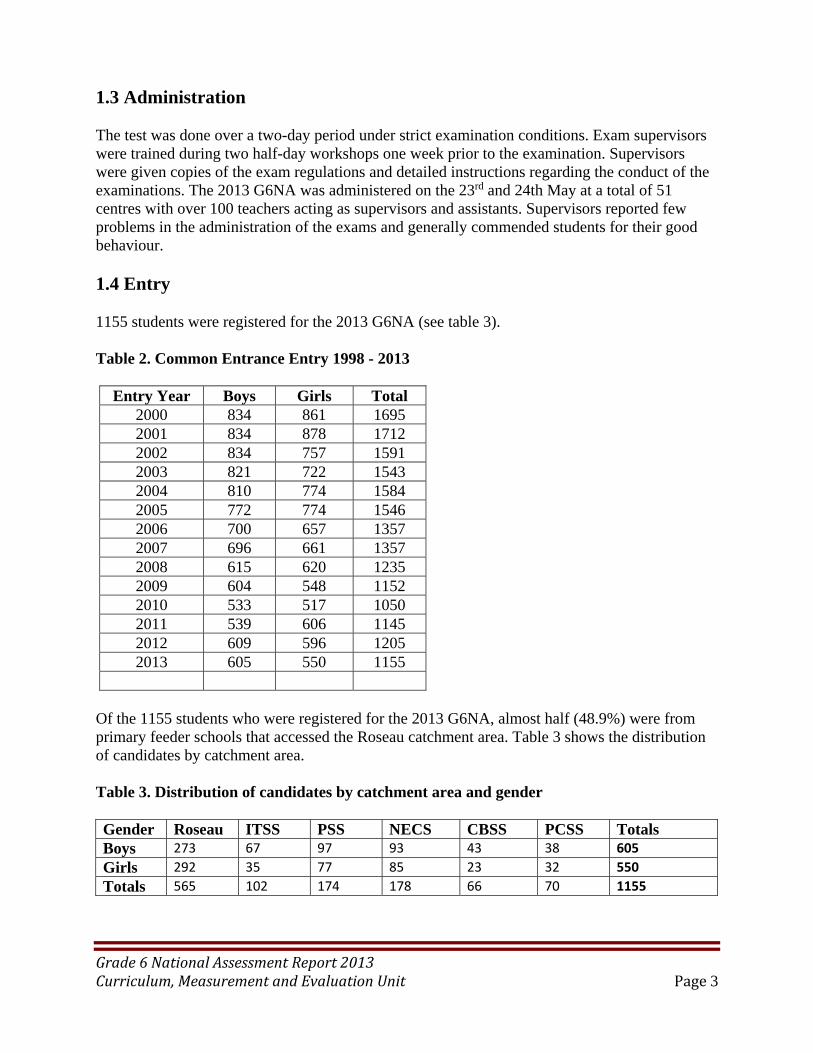
1.3 Administration The test was done over a two-day period under strict examination conditions. Exam supervisors were trained during two half-day workshops one week prior to the examination. Supervisors were given copies of the exam regulations and detailed instructions regarding the conduct of the examinations. The 2013 G6NA was administered on the 23rd and 24th May at a total of 51 centres with over 100 teachers acting as supervisors and assistants. Supervisors reported few problems in the administration of the exams and generally commended students for their good behaviour. 1.4 Entry 1155 students were registered for the 2013 G6NA (see table 3). Table 2. Common Entrance Entry 1998 - 2013
Entry Year Boys Girls Total 2000 834 861 1695 2001 834 878 1712 2002 834 757 1591 2003 821 722 1543 2004 810 774 1584 2005 772 774 1546 2006 700 657 1357 2007 696 661 1357 2008 615 620 1235 2009 604 548 1152 2010 533 517 1050 2011 539 606 1145 2012 609 596 1205 2013 605 550 1155
Of the 1155 students who were registered for the 2013 G6NA, almost half (48.9%) were from primary feeder schools that accessed the Roseau catchment area. Table 3 shows the distribution of candidates by catchment area. Table 3. Distribution of candidates by catchment area and gender Gender Roseau ITSS PSS NECS CBSS PCSS Totals Boys 273 67 97 93 43 38 605 Girls 292 35 77 85 23 32 550 Totals 565 102 174 178 66 70 1155
Grade6NationalAssessmentReport2013Curriculum,MeasurementandEvaluationUnit Page4
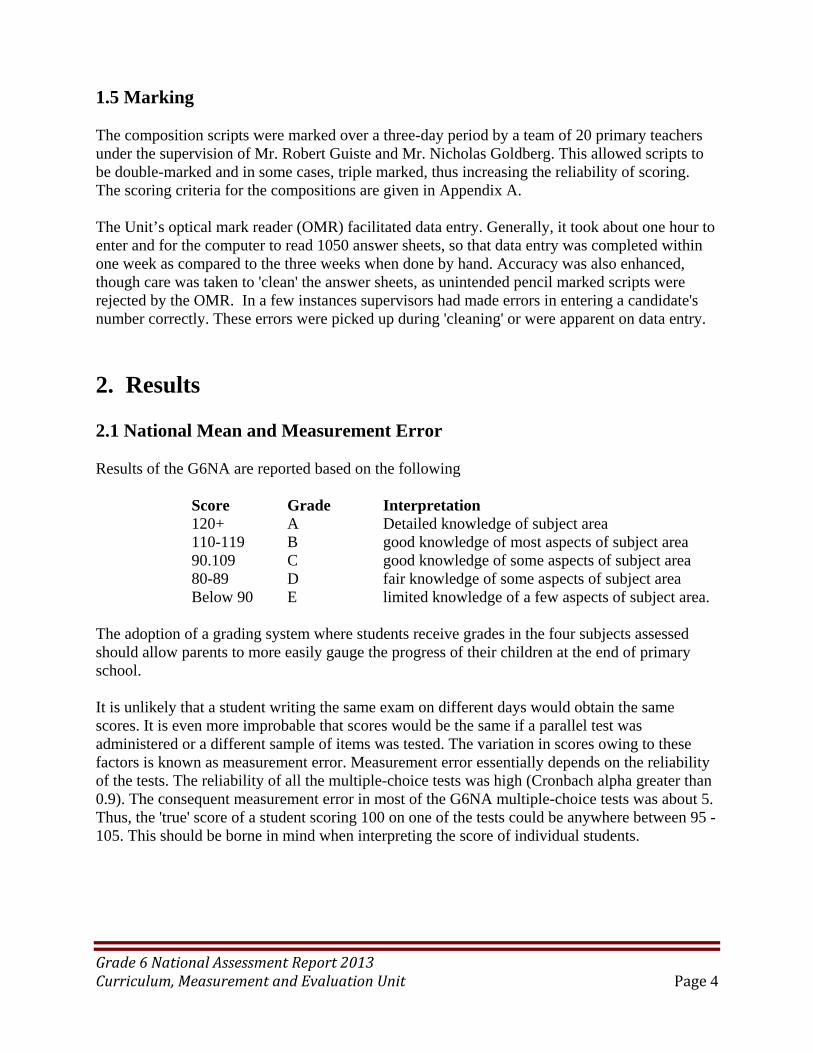
1.5 Marking The composition scripts were marked over a three-day period by a team of 20 primary teachers under the supervision of Mr. Robert Guiste and Mr. Nicholas Goldberg. This allowed scripts to be double-marked and in some cases, triple marked, thus increasing the reliability of scoring. The scoring criteria for the compositions are given in Appendix A. The Unit’s optical mark reader (OMR) facilitated data entry. Generally, it took about one hour to enter and for the computer to read 1050 answer sheets, so that data entry was completed within one week as compared to the three weeks when done by hand. Accuracy was also enhanced, though care was taken to 'clean' the answer sheets, as unintended pencil marked scripts were rejected by the OMR. In a few instances supervisors had made errors in entering a candidate's number correctly. These errors were picked up during 'cleaning' or were apparent on data entry.
2. Results 2.1 National Mean and Measurement Error Results of the G6NA are reported based on the following Score Grade Interpretation 120+ A Detailed knowledge of subject area
110-119 B good knowledge of most aspects of subject area 90.109 C good knowledge of some aspects of subject area 80-89 D fair knowledge of some aspects of subject area Below 90 E limited knowledge of a few aspects of subject area.
The adoption of a grading system where students receive grades in the four subjects assessed should allow parents to more easily gauge the progress of their children at the end of primary school. It is unlikely that a student writing the same exam on different days would obtain the same scores. It is even more improbable that scores would be the same if a parallel test was administered or a different sample of items was tested. The variation in scores owing to these factors is known as measurement error. Measurement error essentially depends on the reliability of the tests. The reliability of all the multiple-choice tests was high (Cronbach alpha greater than 0.9). The consequent measurement error in most of the G6NA multiple-choice tests was about 5. Thus, the 'true' score of a student scoring 100 on one of the tests could be anywhere between 95 - 105. This should be borne in mind when interpreting the score of individual students.
Grade6NationalAssessmentReport2013Curriculum,MeasurementandEvaluationUnit Page5
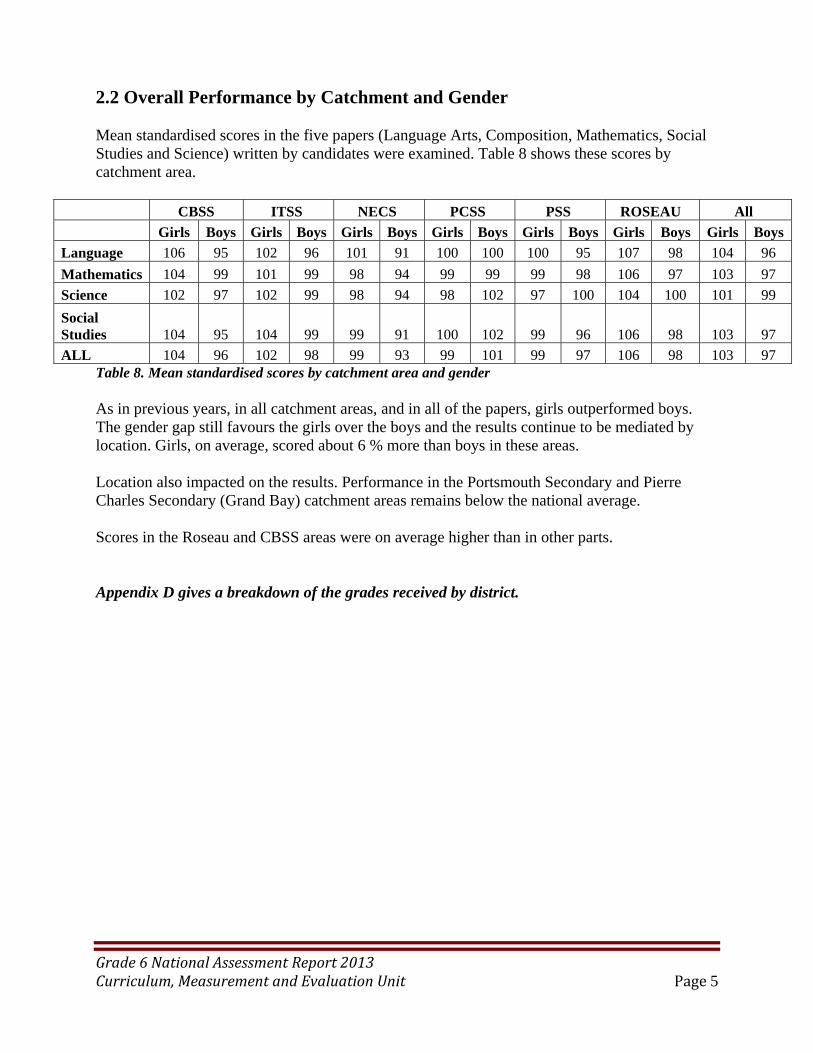
2.2 Overall Performance by Catchment and Gender Mean standardised scores in the five papers (Language Arts, Composition, Mathematics, Social Studies and Science) written by candidates were examined. Table 8 shows these scores by catchment area. CBSS ITSS NECS PCSS PSS ROSEAU All
Girls Boys Girls Boys Girls Boys Girls Boys Girls Boys Girls Boys Girls Boys
Language 106 95 102 96 101 91 100 100 100 95 107 98 104 96
Mathematics 104 99 101 99 98 94 99 99 99 98 106 97 103 97
Science 102 97 102 99 98 94 98 102 97 100 104 100 101 99
Social Studies 104 95 104 99 99 91 100 102 99 96 106 98 103 97
ALL 104 96 102 98 99 93 99 101 99 97 106 98 103 97 Table 8. Mean standardised scores by catchment area and gender As in previous years, in all catchment areas, and in all of the papers, girls outperformed boys. The gender gap still favours the girls over the boys and the results continue to be mediated by location. Girls, on average, scored about 6 % more than boys in these areas. Location also impacted on the results. Performance in the Portsmouth Secondary and Pierre Charles Secondary (Grand Bay) catchment areas remains below the national average. Scores in the Roseau and CBSS areas were on average higher than in other parts. Appendix D gives a breakdown of the grades received by district.
Grade6NationalAssessmentReport2013Curriculum,MeasurementandEvaluationUnit Page6
2.3 Selection of Students for Secondary Education As of 2005 all of the students who wrote the G6NA, were selected for secondary education. Table 9 shows the numbers selected over the past nineteen years. Table 9. Number of students selected for secondary school 1995 - 2013 by gender Year No. Boys
selected % Boys selected
No. Girls selected
% Girls selected
Total selected
% Cohort writing exam
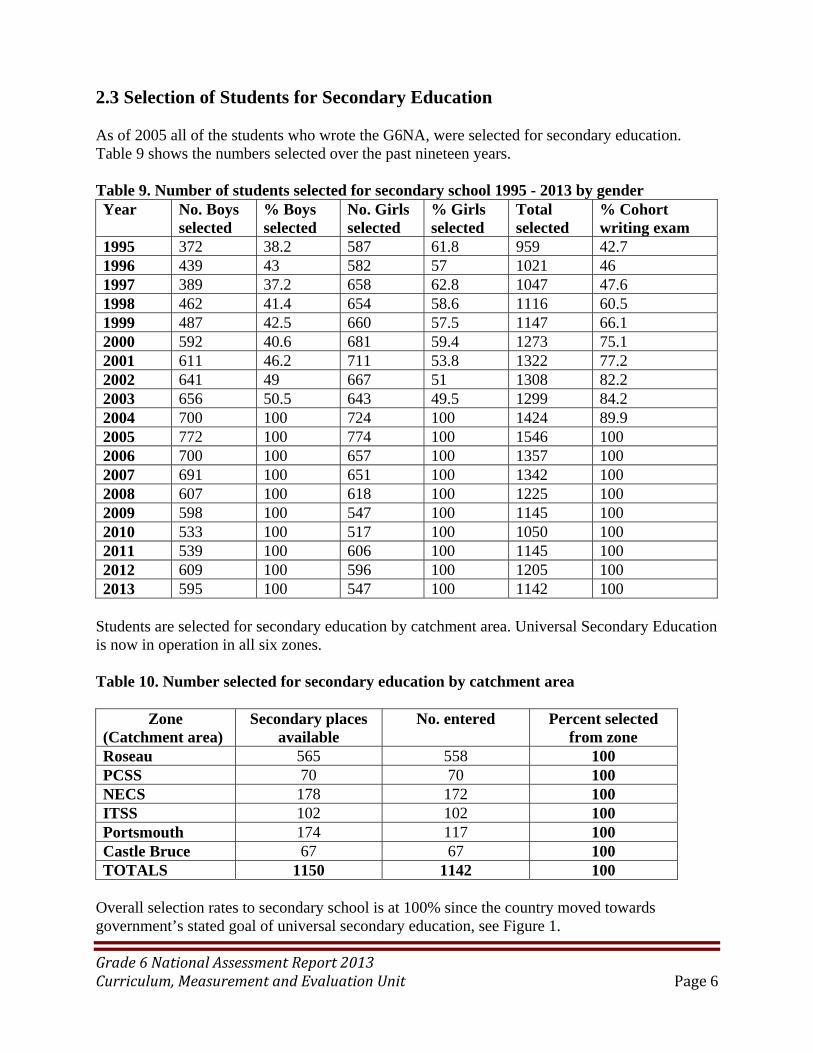
1995 372 38.2 587 61.8 959 42.7 1996 439 43 582 57 1021 46 1997 389 37.2 658 62.8 1047 47.6 1998 462 41.4 654 58.6 1116 60.5 1999 487 42.5 660 57.5 1147 66.1 2000 592 40.6 681 59.4 1273 75.1 2001 611 46.2 711 53.8 1322 77.2 2002 641 49 667 51 1308 82.2 2003 656 50.5 643 49.5 1299 84.2 2004 700 100 724 100 1424 89.9 2005 772 100 774 100 1546 100 2006 700 100 657 100 1357 100 2007 691 100 651 100 1342 100 2008 607 100 618 100 1225 100 2009 598 100 547 100 1145 100 2010 533 100 517 100 1050 100 2011 539 100 606 100 1145 100 2012 609 100 596 100 1205 100 2013 595 100 547 100 1142 100
Students are selected for secondary education by catchment area. Universal Secondary Education is now in operation in all six zones. Table 10. Number selected for secondary education by catchment area
Zone (Catchment area)
Secondary places available
No. entered Percent selected from zone
Roseau 565 558 100 PCSS 70 70 100 NECS 178 172 100 ITSS 102 102 100 Portsmouth 174 117 100 Castle Bruce 67 67 100 TOTALS 1150 1142 100
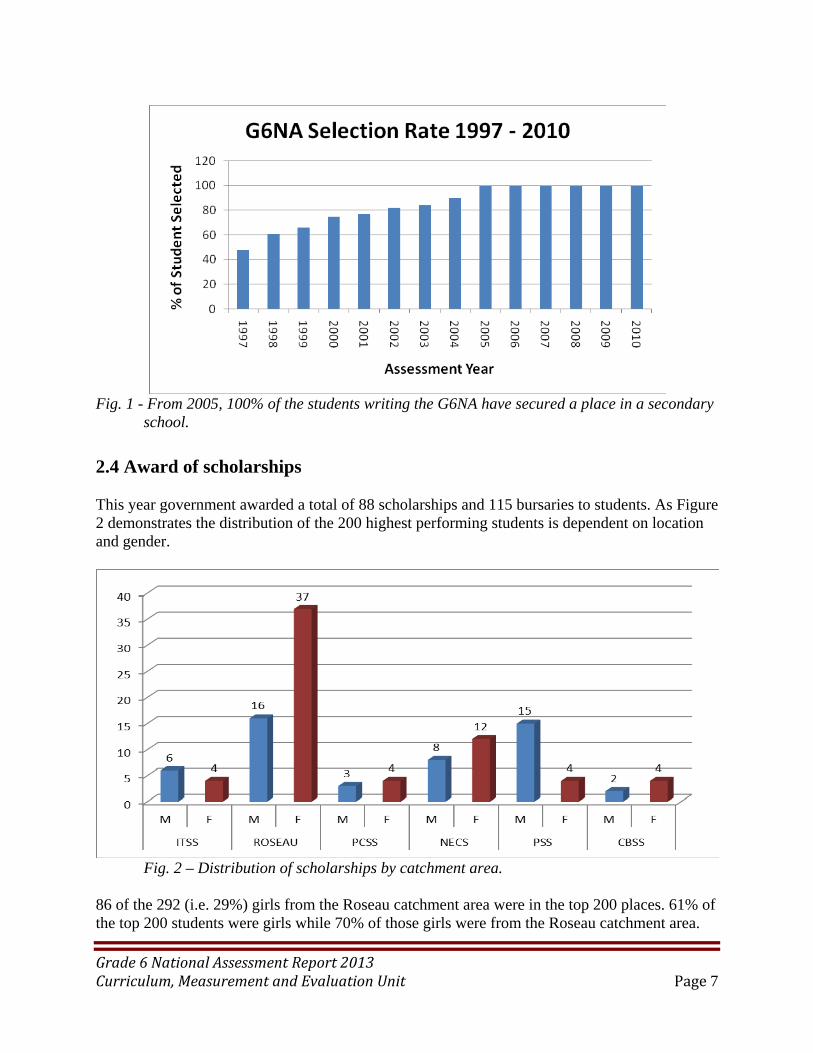
Overall selection rates to secondary school is at 100% since the country moved towards government’s stated goal of universal secondary education, see Figure 1.
Grade6NationalAssessmentReport2013Curriculum,MeasurementandEvaluationUnit Page7
Fig. 1 - From 2005, 100% of the students writing the G6NA have secured a place in a secondary school.
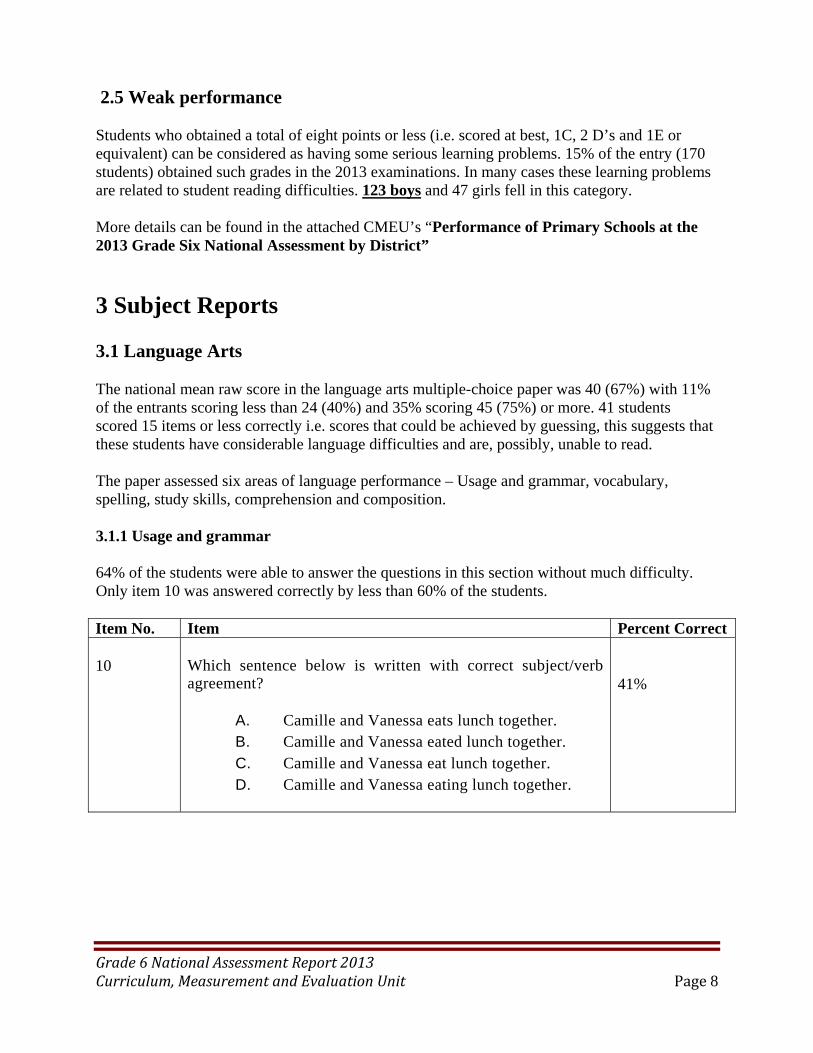
2.4 Award of scholarships This year government awarded a total of 88 scholarships and 115 bursaries to students. As Figure 2 demonstrates the distribution of the 200 highest performing students is dependent on location and gender.
Fig. 2 – Distribution of scholarships by catchment area.
86 of the 292 (i.e. 29%) girls from the Roseau catchment area were in the top 200 places. 61% of the top 200 students were girls while 70% of those girls were from the Roseau catchment area.
Grade6NationalAssessmentReport2013Curriculum,MeasurementandEvaluationUnit Page8
2.5 Weak performance Students who obtained a total of eight points or less (i.e. scored at best, 1C, 2 D’s and 1E or equivalent) can be considered as having some serious learning problems. 15% of the entry (170 students) obtained such grades in the 2013 examinations. In many cases these learning problems are related to student reading difficulties. 123 boys and 47 girls fell in this category. More details can be found in the attached CMEU’s “Performance of Primary Schools at the 2013 Grade Six National Assessment by District”
3 Subject Reports 3.1 Language Arts The national mean raw score in the language arts multiple-choice paper was 40 (67%) with 11% of the entrants scoring less than 24 (40%) and 35% scoring 45 (75%) or more. 41 students scored 15 items or less correctly i.e. scores that could be achieved by guessing, this suggests that these students have considerable language difficulties and are, possibly, unable to read. The paper assessed six areas of language performance – Usage and grammar, vocabulary, spelling, study skills, comprehension and composition. 3.1.1 Usage and grammar 64% of the students were able to answer the questions in this section without much difficulty. Only item 10 was answered correctly by less than 60% of the students. Item No. Item Percent Correct 10
Which sentence below is written with correct subject/verb agreement?
A. Camille and Vanessa eats lunch together. B. Camille and Vanessa eated lunch together. C. Camille and Vanessa eat lunch together. D. Camille and Vanessa eating lunch together.
41%
Grade6NationalAssessmentReport2013Curriculum,MeasurementandEvaluationUnit Page9
3.1.2 Vocabulary This section was also well done by the students. The average on this section was 71.3%. Only 29% were able to answer item 12 correctly. Item No. Item Percent Correct 12
Tim was elated when Thomas got promoted to senior manager.
A. angry B. happy C. sad D. surprised
29
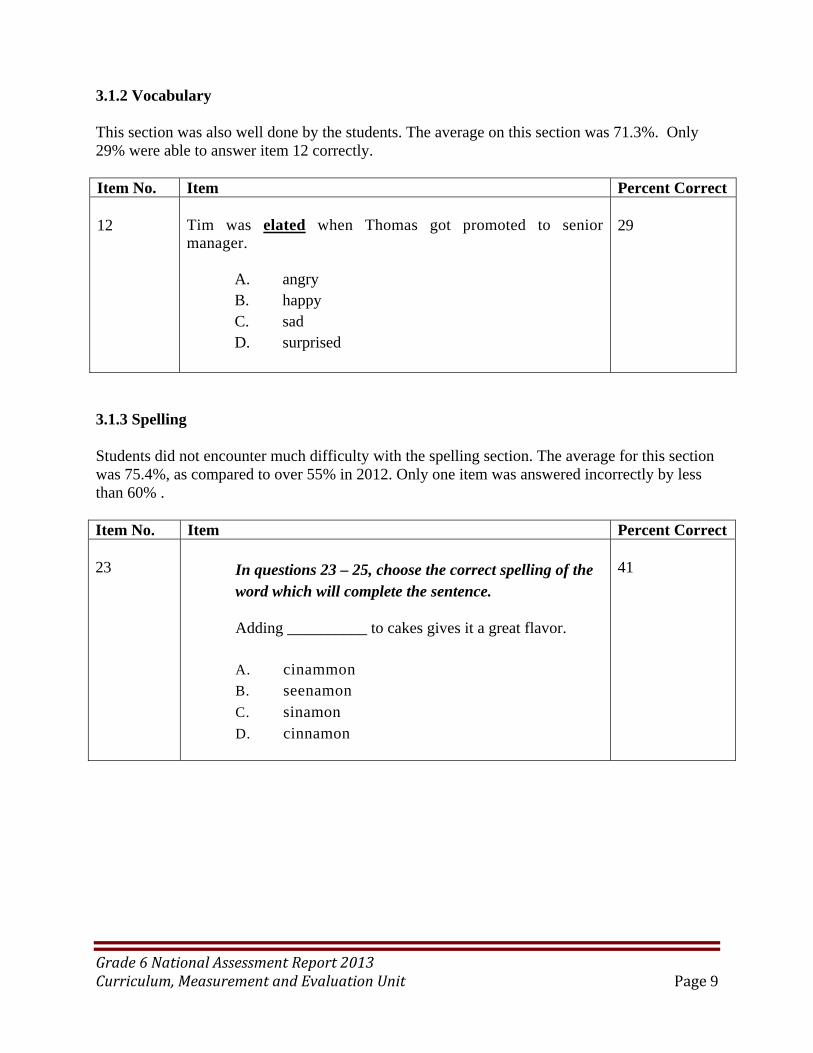
3.1.3 Spelling Students did not encounter much difficulty with the spelling section. The average for this section was 75.4%, as compared to over 55% in 2012. Only one item was answered incorrectly by less than 60% . Item No. Item Percent Correct 23
In questions 23 – 25, choose the correct spelling of the word which will complete the sentence.
Adding __________ to cakes gives it a great flavor.
A. cinammon B. seenamon C. sinamon D. cinnamon
41
Grade6NationalAssessmentReport2013Curriculum,MeasurementandEvaluationUnit Page10
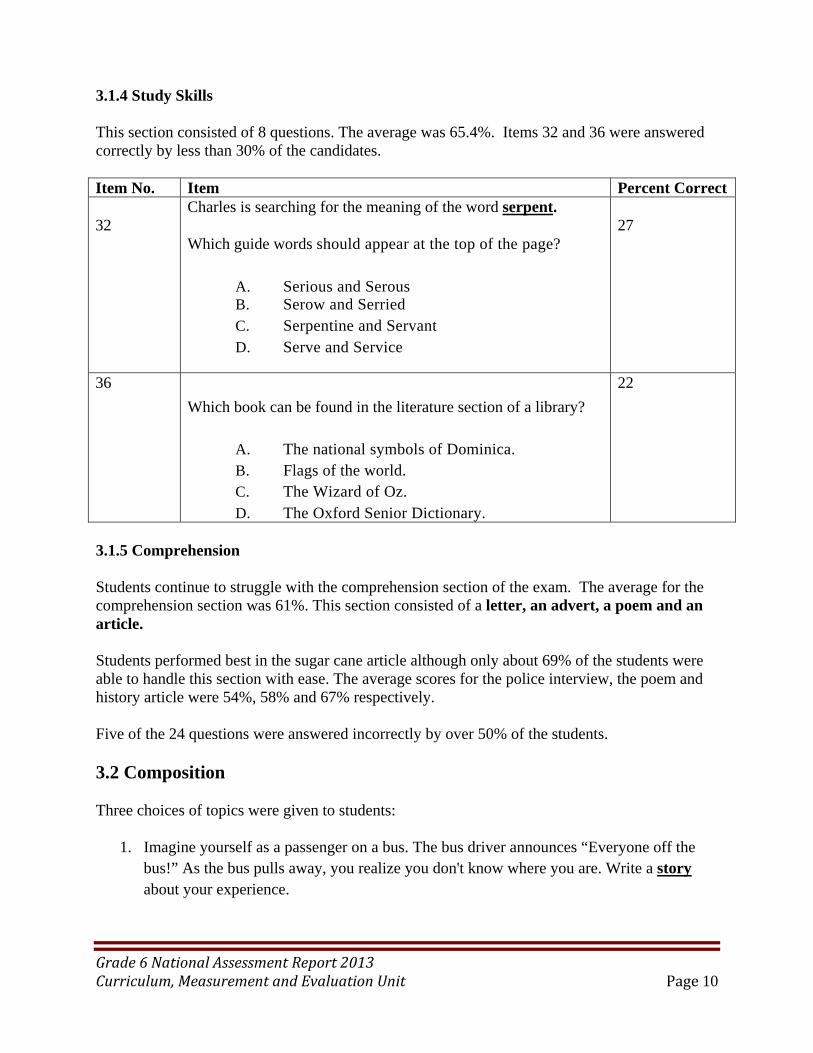
3.1.4 Study Skills This section consisted of 8 questions. The average was 65.4%. Items 32 and 36 were answered correctly by less than 30% of the candidates. Item No. Item Percent Correct 32
Charles is searching for the meaning of the word serpent.
Which guide words should appear at the top of the page? A. Serious and Serous B. Serow and Serried C. Serpentine and Servant D. Serve and Service
27
36
Which book can be found in the literature section of a library?
A. The national symbols of Dominica. B. Flags of the world. C. The Wizard of Oz. D. The Oxford Senior Dictionary.
22
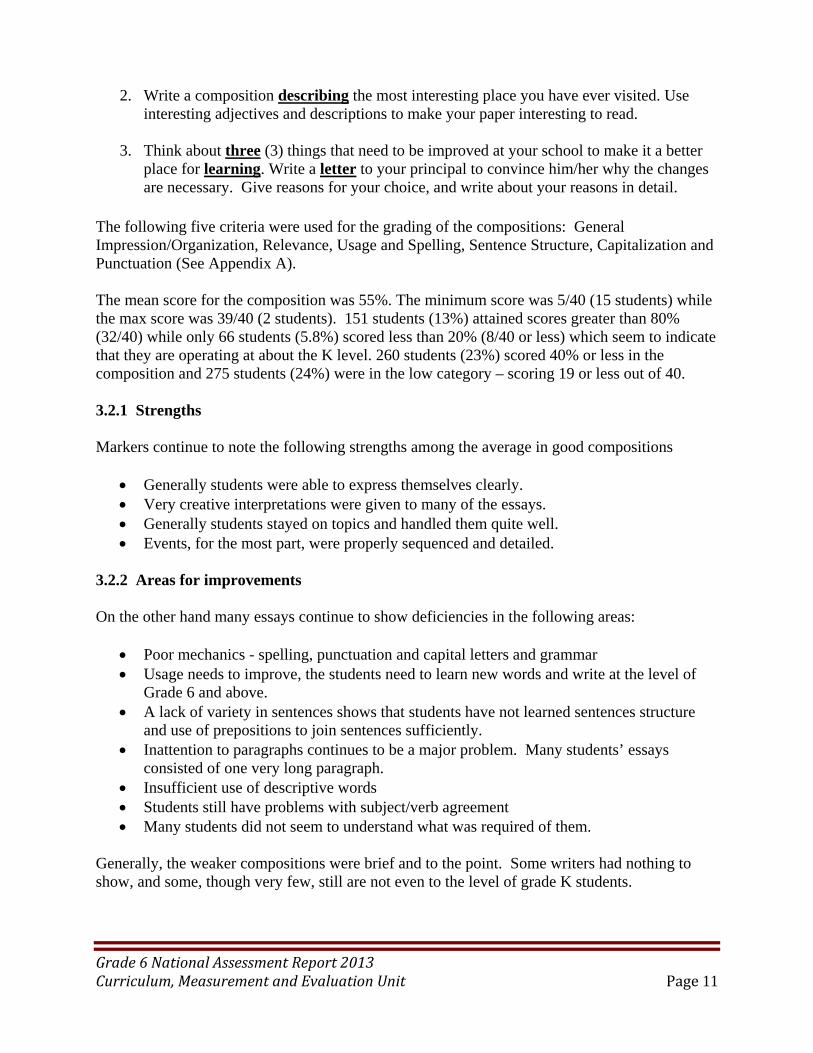
3.1.5 Comprehension Students continue to struggle with the comprehension section of the exam. The average for the comprehension section was 61%. This section consisted of a letter, an advert, a poem and an article. Students performed best in the sugar cane article although only about 69% of the students were able to handle this section with ease. The average scores for the police interview, the poem and history article were 54%, 58% and 67% respectively. Five of the 24 questions were answered incorrectly by over 50% of the students. 3.2 Composition Three choices of topics were given to students:
1. Imagine yourself as a passenger on a bus. The bus driver announces “Everyone off the bus!” As the bus pulls away, you realize you don't know where you are. Write a story about your experience.
Grade6NationalAssessmentReport2013Curriculum,MeasurementandEvaluationUnit Page11
2. Write a composition describing the most interesting place you have ever visited. Use interesting adjectives and descriptions to make your paper interesting to read.
3. Think about three (3) things that need to be improved at your school to make it a better place for learning. Write a letter to your principal to convince him/her why the changes are necessary. Give reasons for your choice, and write about your reasons in detail.
The following five criteria were used for the grading of the compositions: General Impression/Organization, Relevance, Usage and Spelling, Sentence Structure, Capitalization and Punctuation (See Appendix A). The mean score for the composition was 55%. The minimum score was 5/40 (15 students) while the max score was 39/40 (2 students). 151 students (13%) attained scores greater than 80% (32/40) while only 66 students (5.8%) scored less than 20% (8/40 or less) which seem to indicate that they are operating at about the K level. 260 students (23%) scored 40% or less in the composition and 275 students (24%) were in the low category – scoring 19 or less out of 40. 3.2.1 Strengths Markers continue to note the following strengths among the average in good compositions
Generally students were able to express themselves clearly. Very creative interpretations were given to many of the essays. Generally students stayed on topics and handled them quite well. Events, for the most part, were properly sequenced and detailed.
3.2.2 Areas for improvements On the other hand many essays continue to show deficiencies in the following areas:
Poor mechanics - spelling, punctuation and capital letters and grammar Usage needs to improve, the students need to learn new words and write at the level of
Grade 6 and above. A lack of variety in sentences shows that students have not learned sentences structure
and use of prepositions to join sentences sufficiently. Inattention to paragraphs continues to be a major problem. Many students’ essays
consisted of one very long paragraph. Insufficient use of descriptive words Students still have problems with subject/verb agreement Many students did not seem to understand what was required of them.
Generally, the weaker compositions were brief and to the point. Some writers had nothing to show, and some, though very few, still are not even to the level of grade K students.
Grade6NationalAssessmentReport2013Curriculum,MeasurementandEvaluationUnit Page12
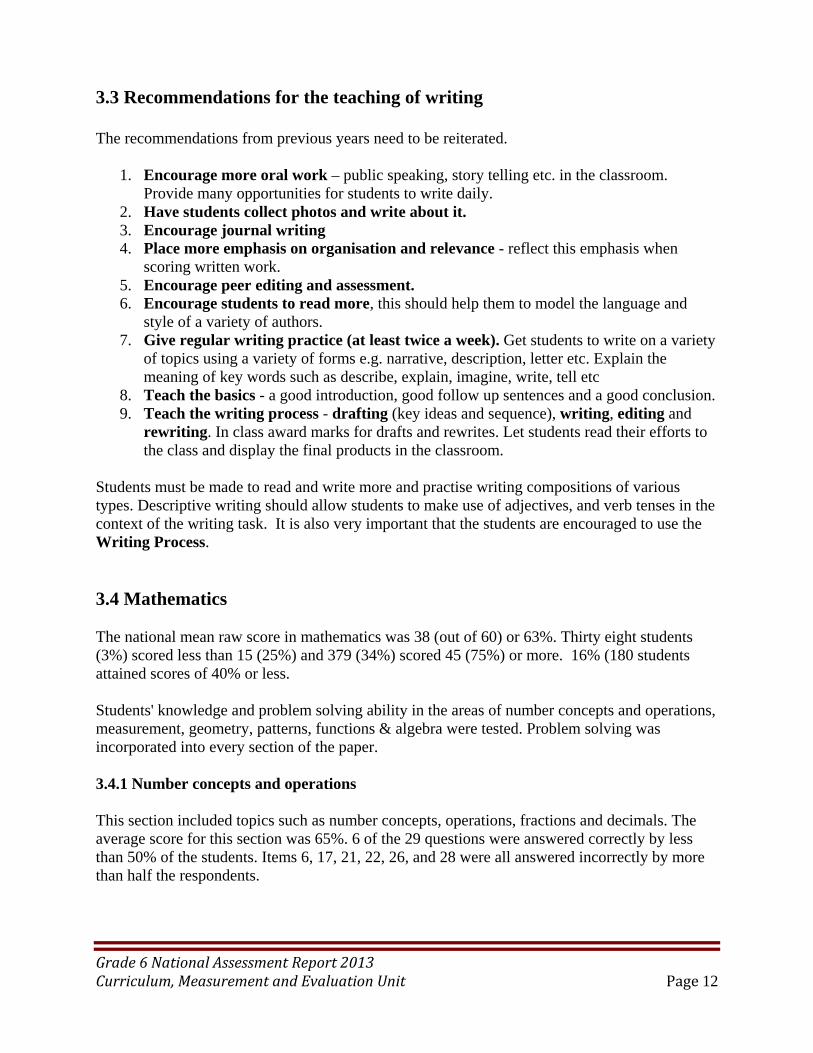
3.3 Recommendations for the teaching of writing The recommendations from previous years need to be reiterated.
1. Encourage more oral work – public speaking, story telling etc. in the classroom. Provide many opportunities for students to write daily.
2. Have students collect photos and write about it. 3. Encourage journal writing 4. Place more emphasis on organisation and relevance - reflect this emphasis when
scoring written work. 5. Encourage peer editing and assessment. 6. Encourage students to read more, this should help them to model the language and
style of a variety of authors. 7. Give regular writing practice (at least twice a week). Get students to write on a variety
of topics using a variety of forms e.g. narrative, description, letter etc. Explain the meaning of key words such as describe, explain, imagine, write, tell etc
8. Teach the basics - a good introduction, good follow up sentences and a good conclusion. 9. Teach the writing process - drafting (key ideas and sequence), writing, editing and
rewriting. In class award marks for drafts and rewrites. Let students read their efforts to the class and display the final products in the classroom.
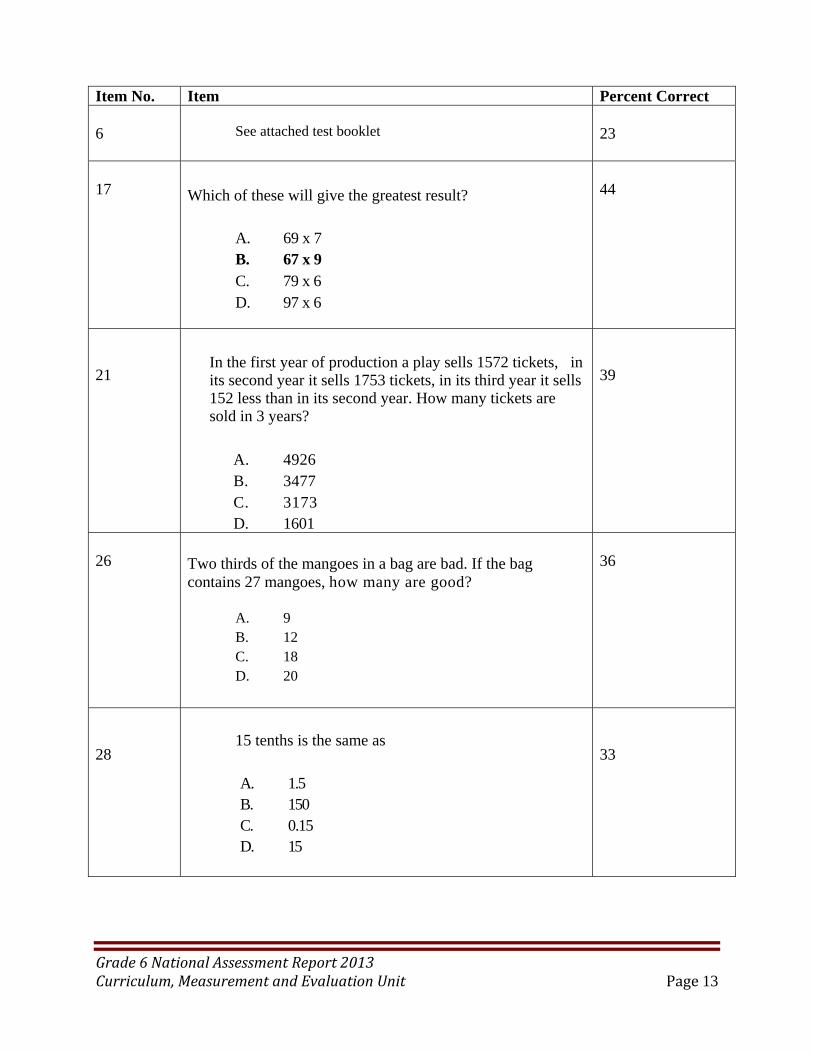
Students must be made to read and write more and practise writing compositions of various types. Descriptive writing should allow students to make use of adjectives, and verb tenses in the context of the writing task. It is also very important that the students are encouraged to use the Writing Process. 3.4 Mathematics The national mean raw score in mathematics was 38 (out of 60) or 63%. Thirty eight students (3%) scored less than 15 (25%) and 379 (34%) scored 45 (75%) or more. 16% (180 students attained scores of 40% or less. Students' knowledge and problem solving ability in the areas of number concepts and operations, measurement, geometry, patterns, functions & algebra were tested. Problem solving was incorporated into every section of the paper. 3.4.1 Number concepts and operations This section included topics such as number concepts, operations, fractions and decimals. The average score for this section was 65%. 6 of the 29 questions were answered correctly by less than 50% of the students. Items 6, 17, 21, 22, 26, and 28 were all answered incorrectly by more than half the respondents.
Grade6NationalAssessmentReport2013Curriculum,MeasurementandEvaluationUnit Page13
Item No. Item Percent Correct 6
See attached test booklet
23
17 Which of these will give the greatest result?
A. 69 x 7 B. 67 x 9 C. 79 x 6 D. 97 x 6
44
21
In the first year of production a play sells 1572 tickets, in its second year it sells 1753 tickets, in its third year it sells 152 less than in its second year. How many tickets are sold in 3 years?
A. 4926 B. 3477 C. 3173 D. 1601
39
26
Two thirds of the mangoes in a bag are bad. If the bag contains 27 mangoes, how many are good?
A. 9 B. 12 C. 18 D. 20
36
28
15 tenths is the same as
A. 1.5 B. 150 C. 0.15 D. 15
33
Grade6NationalAssessmentReport2013Curriculum,MeasurementandEvaluationUnit Page14
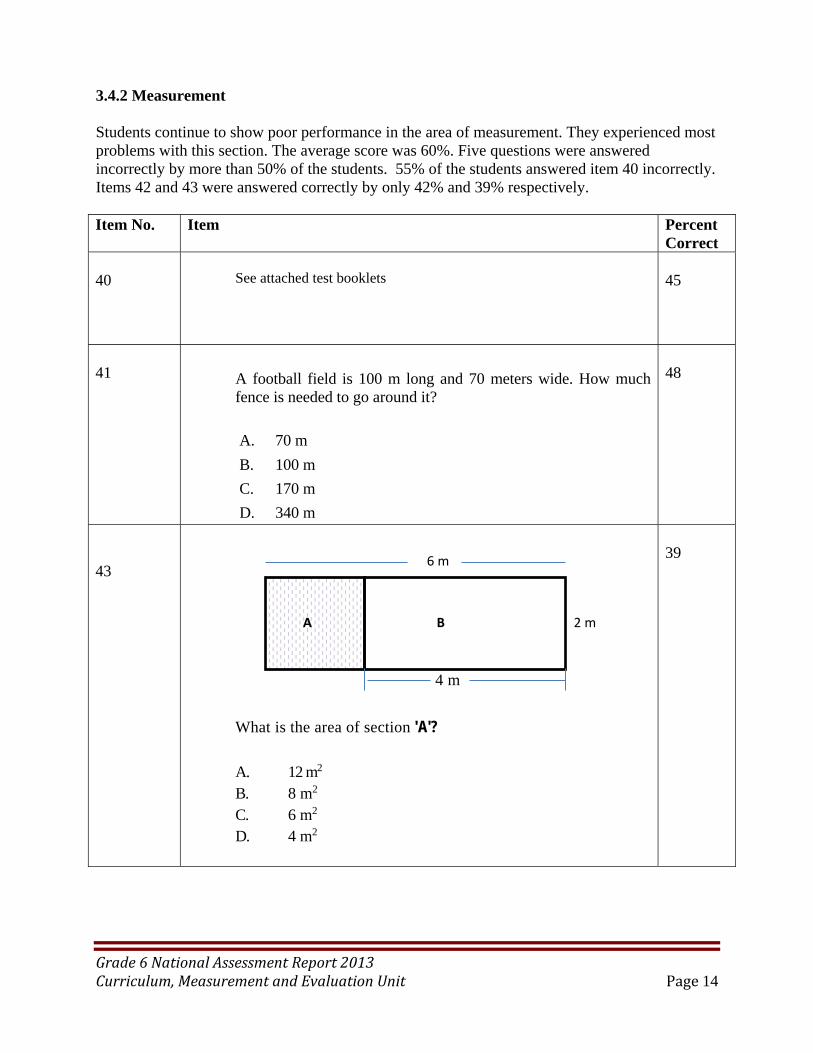
3.4.2 Measurement Students continue to show poor performance in the area of measurement. They experienced most problems with this section. The average score was 60%. Five questions were answered incorrectly by more than 50% of the students. 55% of the students answered item 40 incorrectly. Items 42 and 43 were answered correctly by only 42% and 39% respectively. Item No. Item Percent
Correct 40
See attached test booklets
45
41 A football field is 100 m long and 70 meters wide. How much
fence is needed to go around it?
A. 70 m
B. 100 m
C. 170 m
D. 340 m
48
43
6 m
A B 2 m
4 m
What is the area of section 'A'?
A. 12 m2 B. 8 m2 C. 6 m2 D. 4 m2
39

Grade6NationalAssessmentReport2013Curriculum,MeasurementandEvaluationUnit Page15
3.4.3 Statistics and data handling Students’ best performance was in the area of Statistics and data handling. 73% of the students handled this section with relative ease. All the questions in this section was answered correctly by more than 55% of the students 3.4.5 Patterns, Functions And Algebra This section posed the most problems to students. There were four items in this section and only 56% were able to answer these questions with relative ease. One item was answered correctly by only 20% of the students. Item No. Item Percent
Correct 58
If 2p - 6 = 0 then p is?
A. 0 B. 2 C. 3 D. 6
20
3.5 Science The national mean raw score in science was 33.4 or 67%. Eighty-seven students 7.5% of the entrants scored 20 or less and 26% scored 40 (80%) or more. The paper was divided into the four sub-areas of life processes, earth & space and the physical sciences and agriculture. 3.5.1 Life Processes The average for this section was 68%. Only one question was answered incorrectly by more than 50% of the candidates. 73% of the candidates answered item 7 incorrectly. Item No. Item Percent Correct 7
What is the largest organ in our body?
A. The stomach (31%)
B. The heart(22%)
C. The skin
D. The thigh muscle (19%)
27
Grade6NationalAssessmentReport2013Curriculum,MeasurementandEvaluationUnit Page16
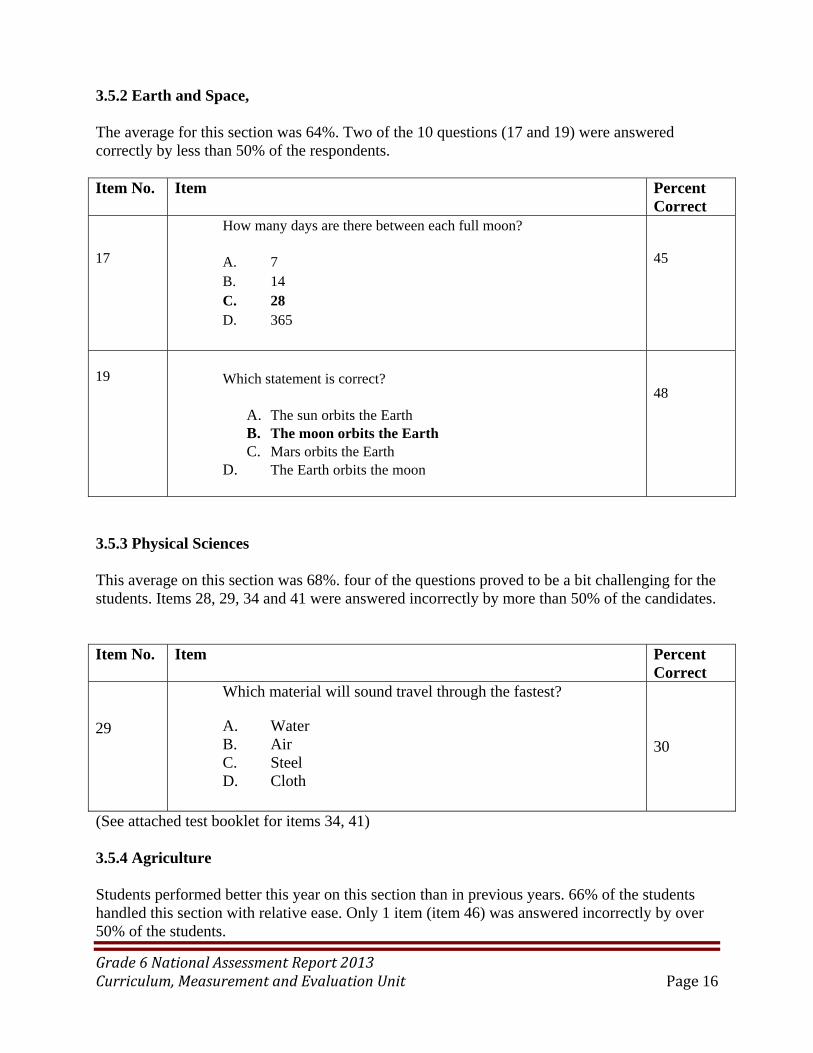
3.5.2 Earth and Space, The average for this section was 64%. Two of the 10 questions (17 and 19) were answered correctly by less than 50% of the respondents. Item No. Item Percent
Correct 17
How many days are there between each full moon? A. 7 B. 14 C. 28 D. 365
45
19
Which statement is correct?
A. The sun orbits the Earth B. The moon orbits the Earth C. Mars orbits the Earth
D. The Earth orbits the moon
48
3.5.3 Physical Sciences This average on this section was 68%. four of the questions proved to be a bit challenging for the students. Items 28, 29, 34 and 41 were answered incorrectly by more than 50% of the candidates. Item No. Item Percent
Correct 29
Which material will sound travel through the fastest?
A. Water B. Air C. Steel D. Cloth
30
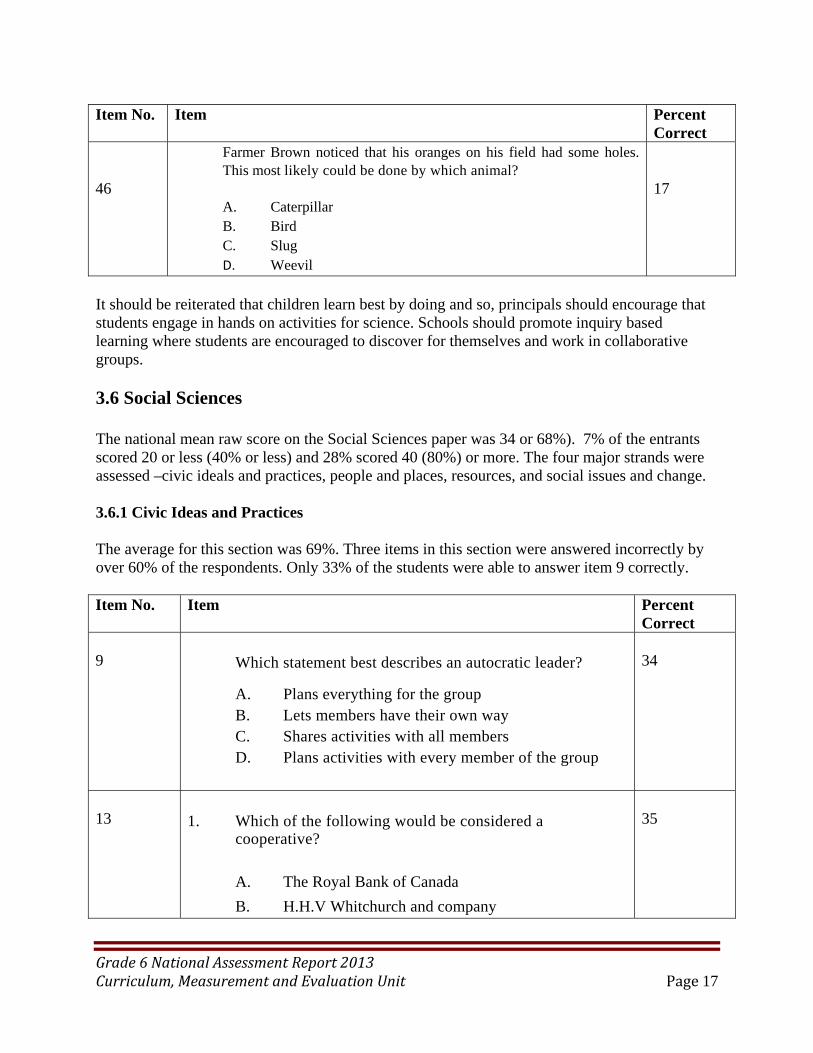
(See attached test booklet for items 34, 41) 3.5.4 Agriculture Students performed better this year on this section than in previous years. 66% of the students handled this section with relative ease. Only 1 item (item 46) was answered incorrectly by over 50% of the students.
Grade6NationalAssessmentReport2013Curriculum,MeasurementandEvaluationUnit Page17
Item No. Item Percent
Correct 46
Farmer Brown noticed that his oranges on his field had some holes. This most likely could be done by which animal? A. Caterpillar B. Bird C. Slug D. Weevil
17
It should be reiterated that children learn best by doing and so, principals should encourage that students engage in hands on activities for science. Schools should promote inquiry based learning where students are encouraged to discover for themselves and work in collaborative groups. 3.6 Social Sciences The national mean raw score on the Social Sciences paper was 34 or 68%). 7% of the entrants scored 20 or less (40% or less) and 28% scored 40 (80%) or more. The four major strands were assessed –civic ideals and practices, people and places, resources, and social issues and change. 3.6.1 Civic Ideas and Practices The average for this section was 69%. Three items in this section were answered incorrectly by over 60% of the respondents. Only 33% of the students were able to answer item 9 correctly. Item No. Item Percent
Correct 9
Which statement best describes an autocratic leader?
A. Plans everything for the group B. Lets members have their own way C. Shares activities with all members D. Plans activities with every member of the group
34
13
1. Which of the following would be considered a
cooperative?
A. The Royal Bank of Canada
B. H.H.V Whitchurch and company
35
Grade6NationalAssessmentReport2013Curriculum,MeasurementandEvaluationUnit Page18
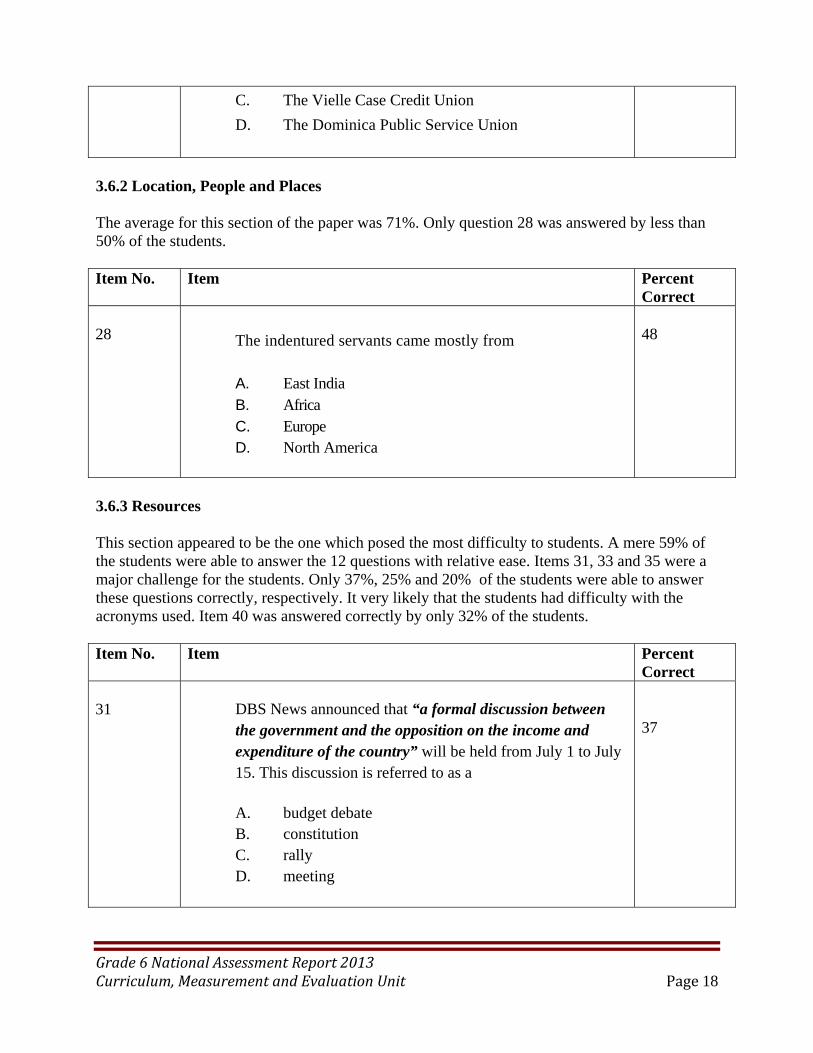
C. The Vielle Case Credit Union
D. The Dominica Public Service Union
3.6.2 Location, People and Places The average for this section of the paper was 71%. Only question 28 was answered by less than 50% of the students. Item No. Item Percent
Correct 28 The indentured servants came mostly from
A. East India B. Africa C. Europe D. North America
48
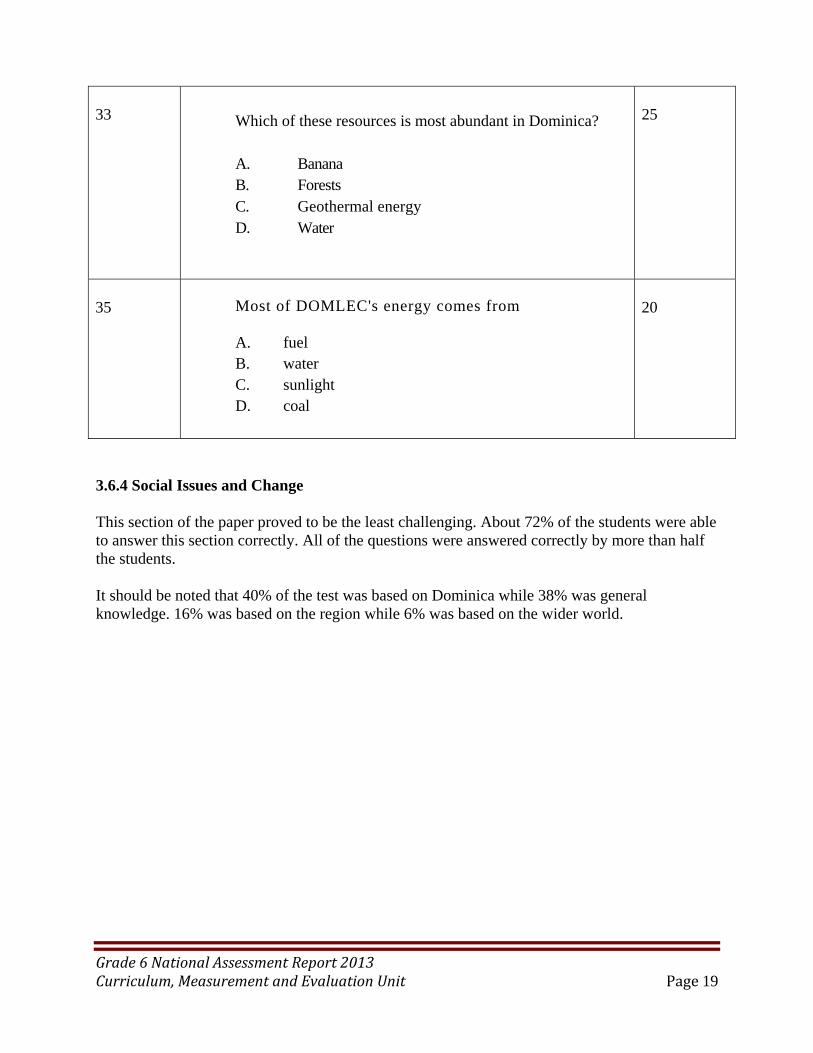
3.6.3 Resources This section appeared to be the one which posed the most difficulty to students. A mere 59% of the students were able to answer the 12 questions with relative ease. Items 31, 33 and 35 were a major challenge for the students. Only 37%, 25% and 20% of the students were able to answer these questions correctly, respectively. It very likely that the students had difficulty with the acronyms used. Item 40 was answered correctly by only 32% of the students. Item No. Item Percent
Correct 31 DBS News announced that “a formal discussion between
the government and the opposition on the income and expenditure of the country” will be held from July 1 to July 15. This discussion is referred to as a A. budget debate B. constitution C. rally D. meeting
37
Grade6NationalAssessmentReport2013Curriculum,MeasurementandEvaluationUnit Page19
33 Which of these resources is most abundant in Dominica?
A. Banana B. Forests C. Geothermal energy D. Water
25
35 Most of DOMLEC's energy comes from
A. fuel B. water C. sunlight D. coal
20
3.6.4 Social Issues and Change This section of the paper proved to be the least challenging. About 72% of the students were able to answer this section correctly. All of the questions were answered correctly by more than half the students. It should be noted that 40% of the test was based on Dominica while 38% was general knowledge. 16% was based on the region while 6% was based on the wider world.
Grade6NationalAssessmentReport2013Curriculum,MeasurementandEvaluationUnit Page20
Appendices Appendix A
GRADE SIX NATIONAL ASSESSMENT 2013
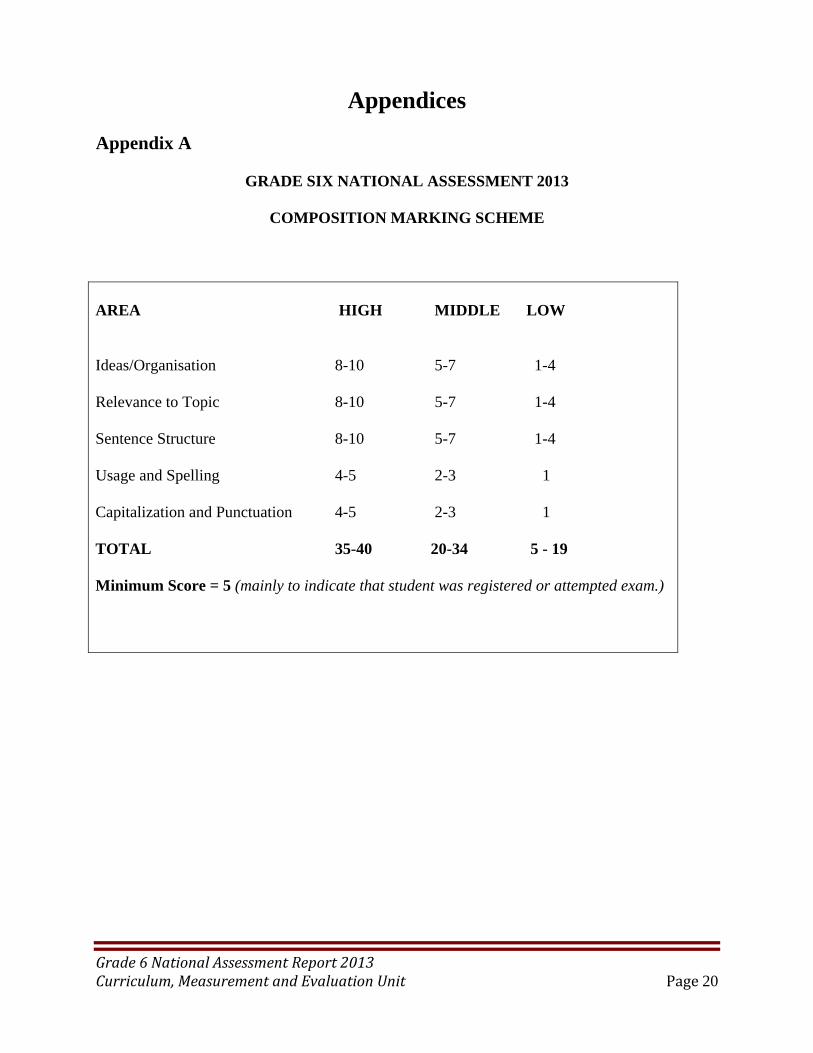
COMPOSITION MARKING SCHEME
AREA HIGH MIDDLE LOW Ideas/Organisation 8-10 5-7 1-4 Relevance to Topic 8-10 5-7 1-4 Sentence Structure 8-10 5-7 1-4 Usage and Spelling 4-5 2-3 1 Capitalization and Punctuation 4-5 2-3 1 TOTAL 35-40 20-34 5 - 19 Minimum Score = 5 (mainly to indicate that student was registered or attempted exam.)
Grade6NationalAssessmentReport2013Curriculum,MeasurementandEvaluationUnit Page21
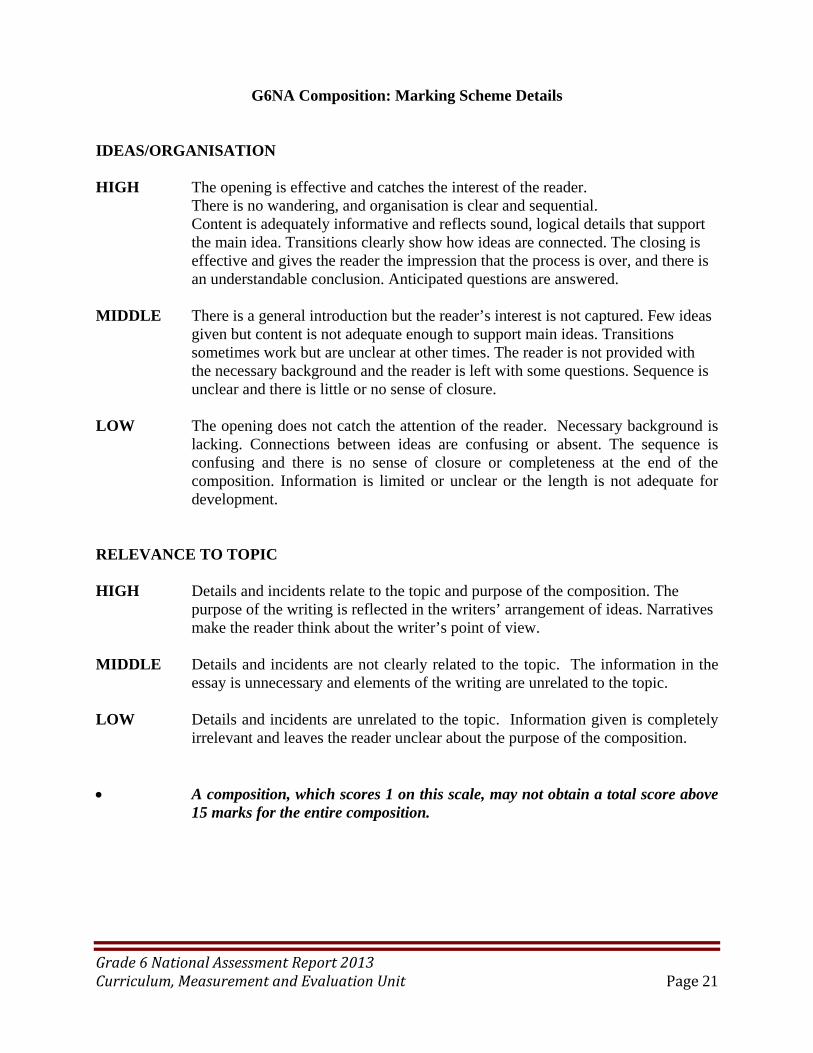
G6NA Composition: Marking Scheme Details
IDEAS/ORGANISATION HIGH The opening is effective and catches the interest of the reader. There is no wandering, and organisation is clear and sequential. Content is adequately informative and reflects sound, logical details that support the main idea. Transitions clearly show how ideas are connected. The closing is effective and gives the reader the impression that the process is over, and there is an understandable conclusion. Anticipated questions are answered.
MIDDLE There is a general introduction but the reader’s interest is not captured. Few ideas given but content is not adequate enough to support main ideas. Transitions sometimes work but are unclear at other times. The reader is not provided with the necessary background and the reader is left with some questions. Sequence is unclear and there is little or no sense of closure. LOW The opening does not catch the attention of the reader. Necessary background is
lacking. Connections between ideas are confusing or absent. The sequence is confusing and there is no sense of closure or completeness at the end of the composition. Information is limited or unclear or the length is not adequate for development.
RELEVANCE TO TOPIC HIGH Details and incidents relate to the topic and purpose of the composition. The purpose of the writing is reflected in the writers’ arrangement of ideas. Narratives make the reader think about the writer’s point of view. MIDDLE Details and incidents are not clearly related to the topic. The information in the
essay is unnecessary and elements of the writing are unrelated to the topic. LOW Details and incidents are unrelated to the topic. Information given is completely
irrelevant and leaves the reader unclear about the purpose of the composition. A composition, which scores 1 on this scale, may not obtain a total score above
15 marks for the entire composition.
Grade6NationalAssessmentReport2013Curriculum,MeasurementandEvaluationUnit Page22
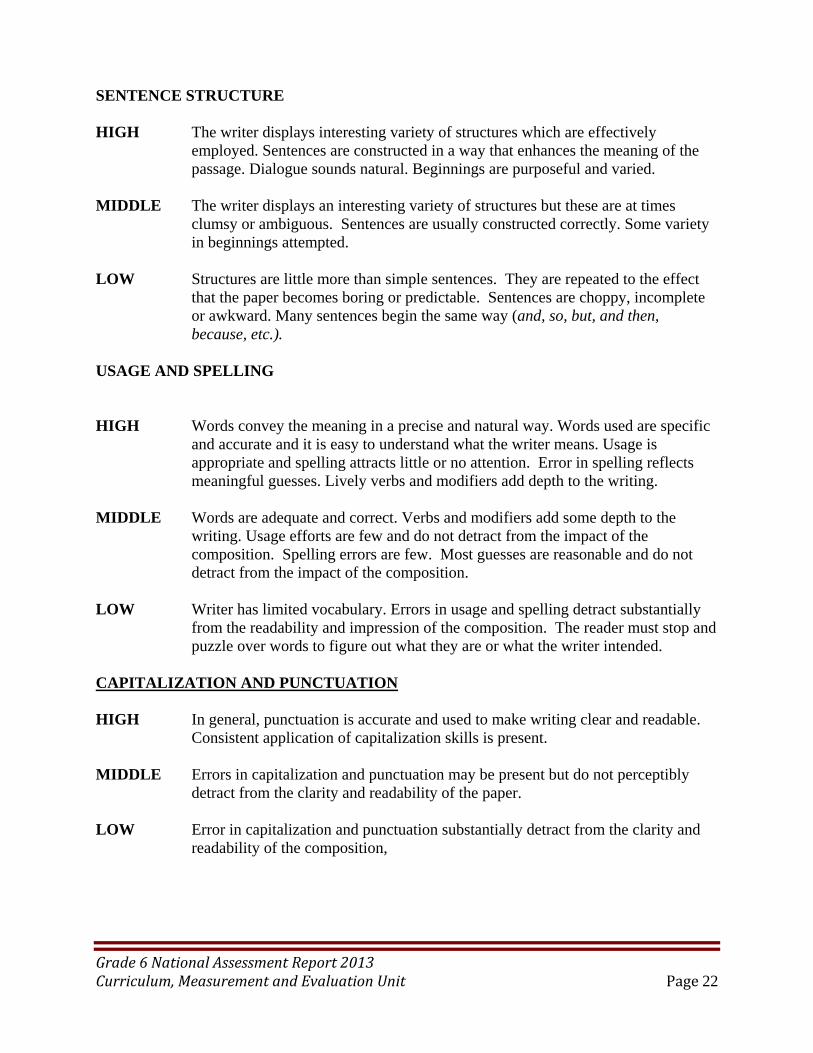
SENTENCE STRUCTURE HIGH The writer displays interesting variety of structures which are effectively
employed. Sentences are constructed in a way that enhances the meaning of the passage. Dialogue sounds natural. Beginnings are purposeful and varied.
MIDDLE The writer displays an interesting variety of structures but these are at times
clumsy or ambiguous. Sentences are usually constructed correctly. Some variety in beginnings attempted.
LOW Structures are little more than simple sentences. They are repeated to the effect
that the paper becomes boring or predictable. Sentences are choppy, incomplete or awkward. Many sentences begin the same way (and, so, but, and then, because, etc.).
USAGE AND SPELLING HIGH Words convey the meaning in a precise and natural way. Words used are specific
and accurate and it is easy to understand what the writer means. Usage is appropriate and spelling attracts little or no attention. Error in spelling reflects meaningful guesses. Lively verbs and modifiers add depth to the writing.
MIDDLE Words are adequate and correct. Verbs and modifiers add some depth to the
writing. Usage efforts are few and do not detract from the impact of the composition. Spelling errors are few. Most guesses are reasonable and do not detract from the impact of the composition.
LOW Writer has limited vocabulary. Errors in usage and spelling detract substantially
from the readability and impression of the composition. The reader must stop and puzzle over words to figure out what they are or what the writer intended.
CAPITALIZATION AND PUNCTUATION HIGH In general, punctuation is accurate and used to make writing clear and readable.
Consistent application of capitalization skills is present. MIDDLE Errors in capitalization and punctuation may be present but do not perceptibly
detract from the clarity and readability of the paper. LOW Error in capitalization and punctuation substantially detract from the clarity and
readability of the composition,
Grade6NationalAssessmentReport2013Curriculum,MeasurementandEvaluationUnit Page23
Appendix B
Subject Specifications
Science Paper
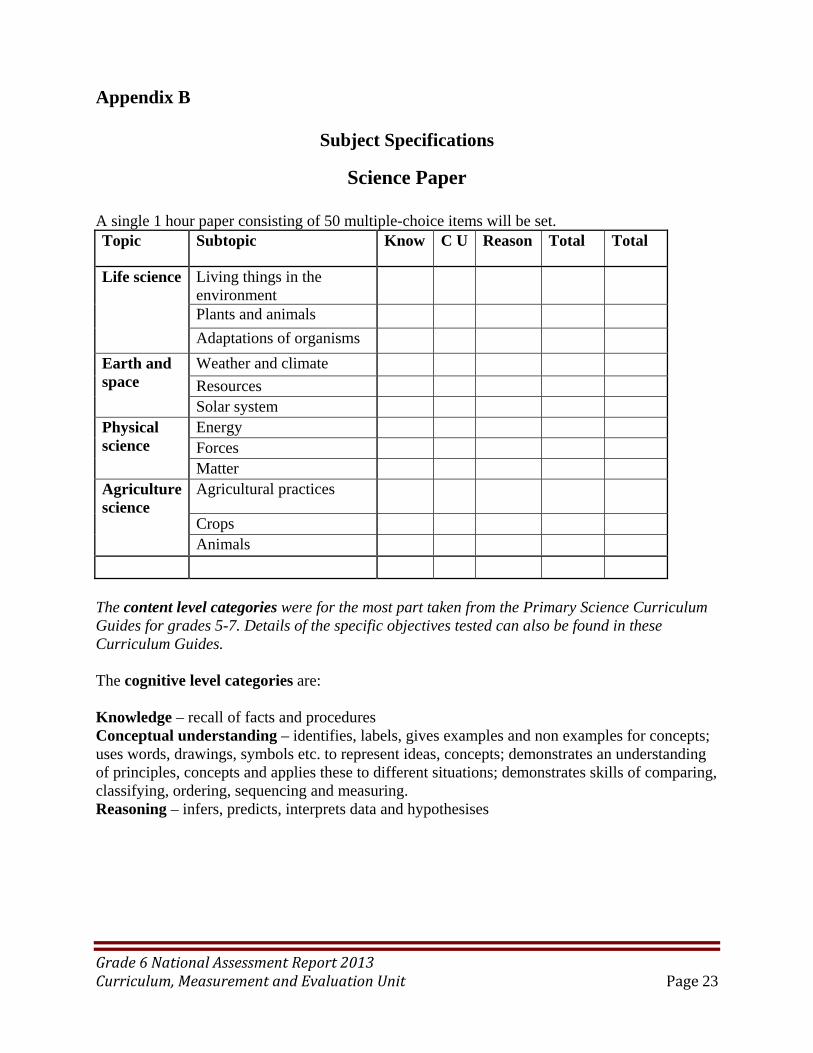
A single 1 hour paper consisting of 50 multiple-choice items will be set. Topic Subtopic Know C U Reason Total Total
Life science Living things in the environment
Plants and animals
Adaptations of organisms
Earth and space
Weather and climate
Resources Solar system
Physical science
Energy Forces Matter
Agriculture science
Agricultural practices
Crops Animals
The content level categories were for the most part taken from the Primary Science Curriculum Guides for grades 5-7. Details of the specific objectives tested can also be found in these Curriculum Guides. The cognitive level categories are: Knowledge – recall of facts and procedures Conceptual understanding – identifies, labels, gives examples and non examples for concepts; uses words, drawings, symbols etc. to represent ideas, concepts; demonstrates an understanding of principles, concepts and applies these to different situations; demonstrates skills of comparing, classifying, ordering, sequencing and measuring. Reasoning – infers, predicts, interprets data and hypothesises
Grade6NationalAssessmentReport2013Curriculum,MeasurementandEvaluationUnit Page24
Mathematics Paper
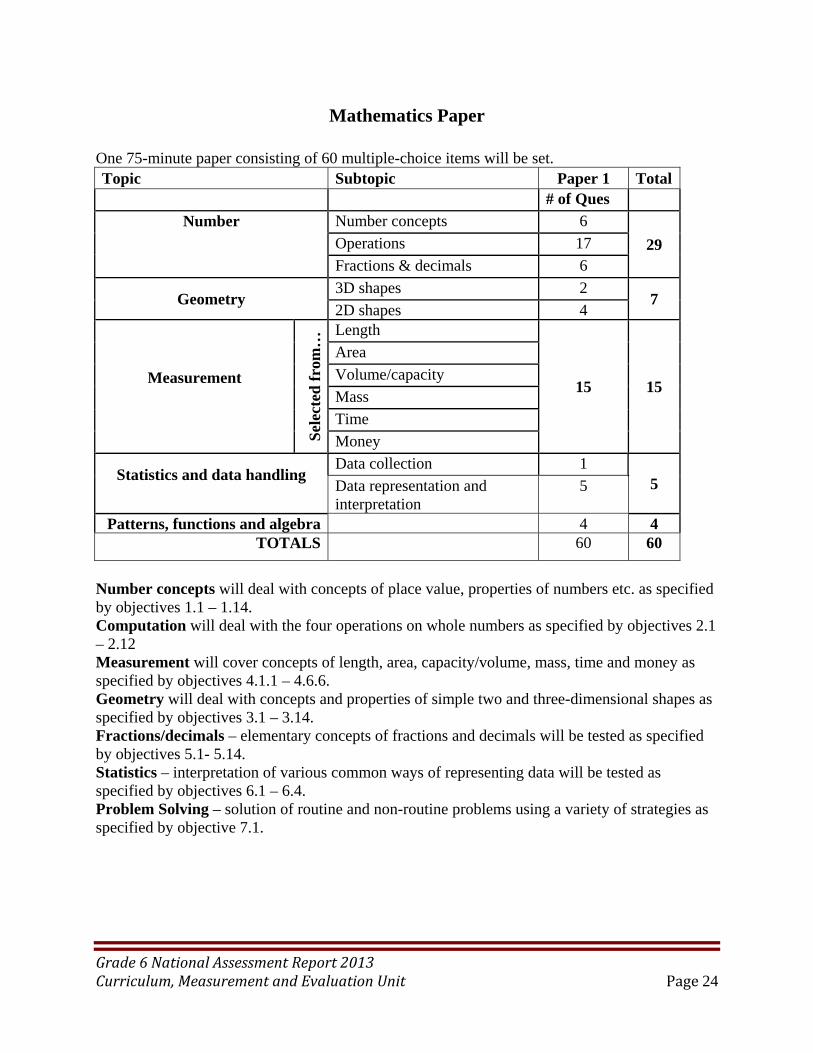
One 75-minute paper consisting of 60 multiple-choice items will be set. Topic Subtopic Paper 1 Total # of Ques
Number
Number concepts 6
29 Operations 17
Fractions & decimals 6
Geometry 3D shapes 2
7 2D shapes 4
Measurement
Sel
ecte
d f
rom
… Length
15 15
Area
Volume/capacity
Mass
Time
Money
Statistics and data handling
Data collection 1 5 Data representation and
interpretation 5
Patterns, functions and algebra 4 4 TOTALS 60 60
Number concepts will deal with concepts of place value, properties of numbers etc. as specified by objectives 1.1 – 1.14. Computation will deal with the four operations on whole numbers as specified by objectives 2.1 – 2.12 Measurement will cover concepts of length, area, capacity/volume, mass, time and money as specified by objectives 4.1.1 – 4.6.6. Geometry will deal with concepts and properties of simple two and three-dimensional shapes as specified by objectives 3.1 – 3.14. Fractions/decimals – elementary concepts of fractions and decimals will be tested as specified by objectives 5.1- 5.14. Statistics – interpretation of various common ways of representing data will be tested as specified by objectives 6.1 – 6.4. Problem Solving – solution of routine and non-routine problems using a variety of strategies as specified by objective 7.1.
Grade6NationalAssessmentReport2013Curriculum,MeasurementandEvaluationUnit Page25
Social Studies
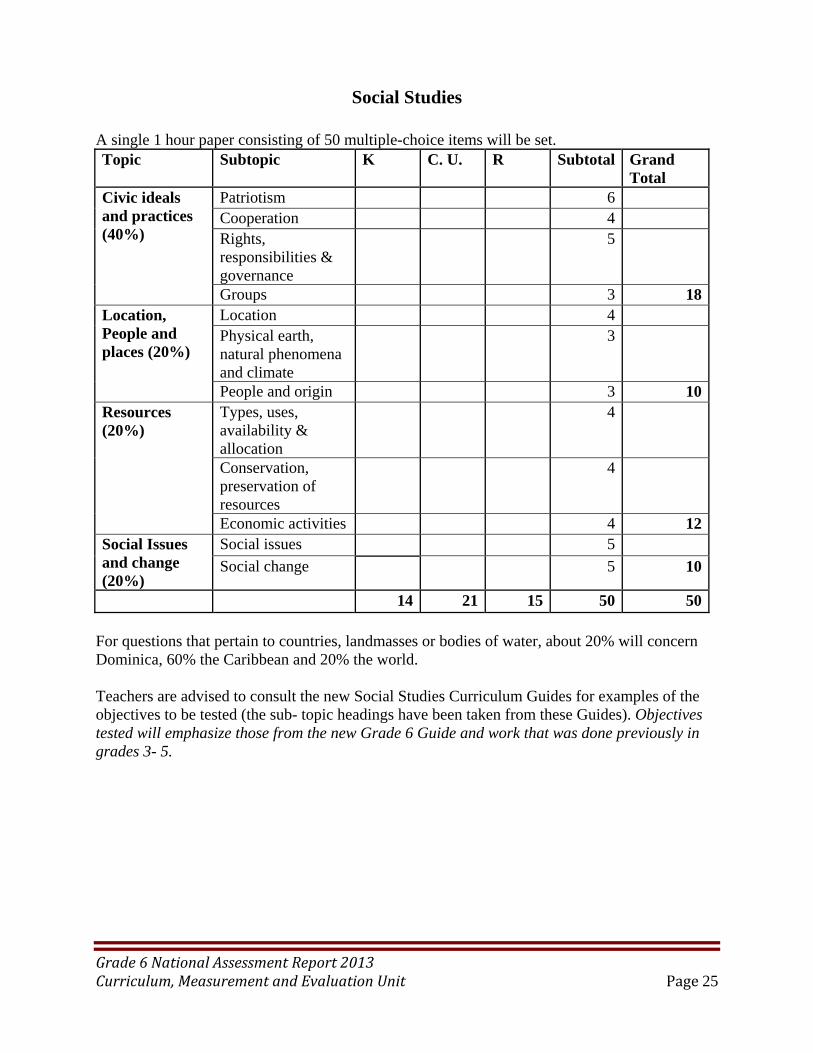
A single 1 hour paper consisting of 50 multiple-choice items will be set. Topic Subtopic K C. U. R Subtotal Grand
Total Civic ideals and practices (40%)
Patriotism 6 Cooperation 4 Rights, responsibilities & governance
5
Groups 3 18Location, People and places (20%)
Location 4 Physical earth, natural phenomena and climate
3
People and origin 3 10Resources (20%)
Types, uses, availability & allocation
4
Conservation, preservation of resources
4
Economic activities 4 12Social Issues and change (20%)
Social issues 5
Social change 5 10
14 21 15 50 50
For questions that pertain to countries, landmasses or bodies of water, about 20% will concern Dominica, 60% the Caribbean and 20% the world. Teachers are advised to consult the new Social Studies Curriculum Guides for examples of the objectives to be tested (the sub- topic headings have been taken from these Guides). Objectives tested will emphasize those from the new Grade 6 Guide and work that was done previously in grades 3- 5.
Grade6NationalAssessmentReport2013Curriculum,MeasurementandEvaluationUnit Page26
Language Arts Paper
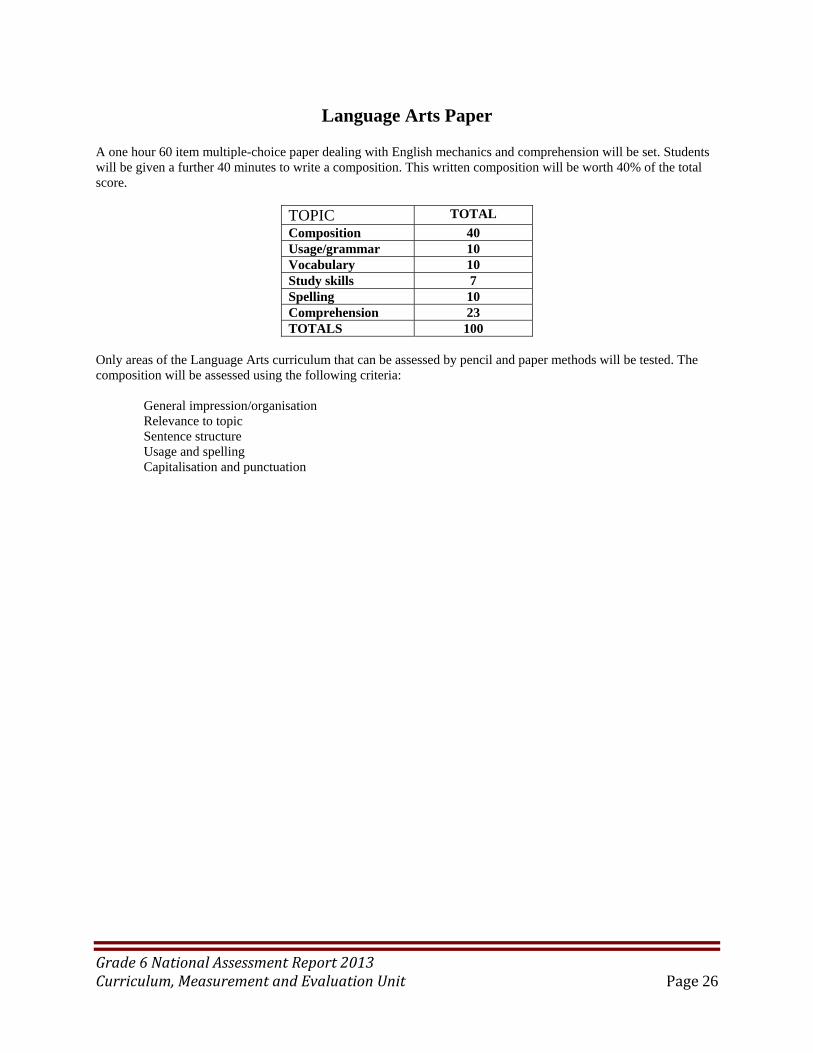
A one hour 60 item multiple-choice paper dealing with English mechanics and comprehension will be set. Students will be given a further 40 minutes to write a composition. This written composition will be worth 40% of the total score.
TOPIC TOTAL
Composition 40 Usage/grammar 10 Vocabulary 10 Study skills 7 Spelling 10 Comprehension 23 TOTALS 100
Only areas of the Language Arts curriculum that can be assessed by pencil and paper methods will be tested. The composition will be assessed using the following criteria: General impression/organisation Relevance to topic Sentence structure Usage and spelling Capitalisation and punctuation
Grade6NationalAssessmentReport2013Curriculum,MeasurementandEvaluationUnit Page27
Appendix C
Answer Keys - G6NA 2013 Multiple Choice Papers
Item Number Mathematics Language Arts Science Social Studies
1
2
3
4
5
6
7
8
9
10
11
12
13
14
15
16
17
18
19
20
21
22
23
24
25
26
27
28
29
30
31
32
33
34
Grade6NationalAssessmentReport2013Curriculum,MeasurementandEvaluationUnit Page28
35
36
37
38
39
40
41
42
43
44
45
46
47
48
49
50
51
52
53
54
55
56
57
58
59
60
Grade6NationalAssessmentReport2013Curriculum,MeasurementandEvaluationUnit Page29
APPENDIX D
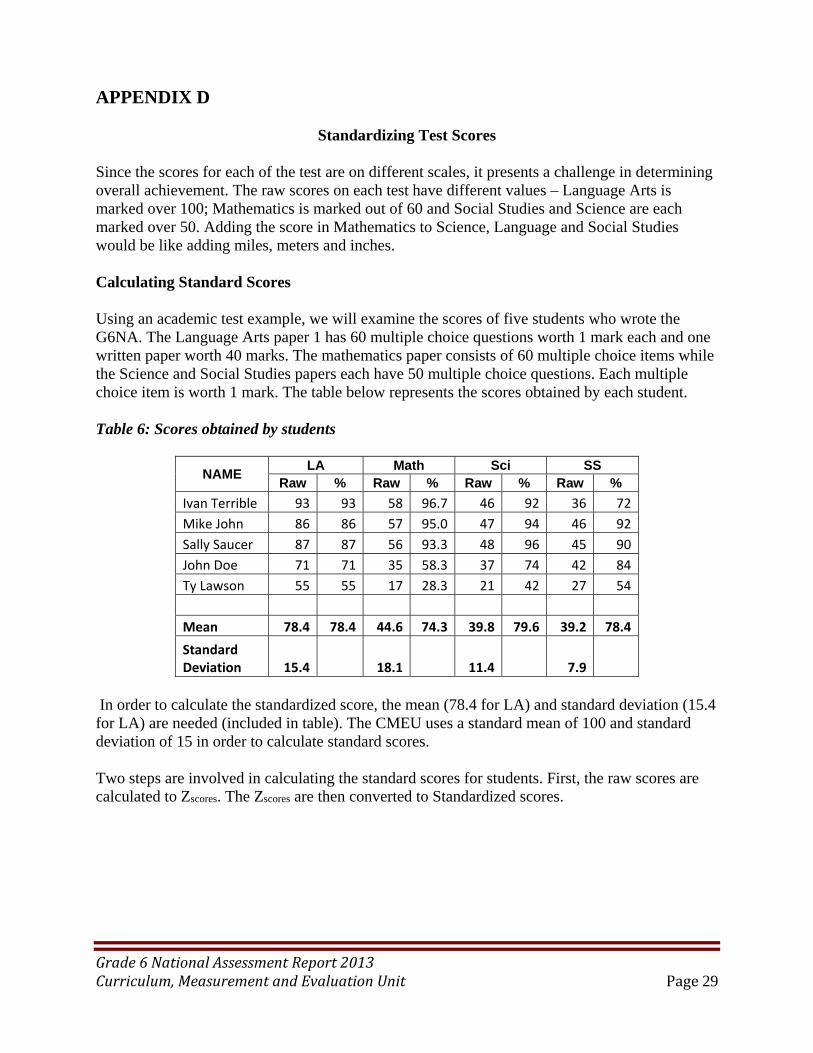
Standardizing Test Scores Since the scores for each of the test are on different scales, it presents a challenge in determining overall achievement. The raw scores on each test have different values – Language Arts is marked over 100; Mathematics is marked out of 60 and Social Studies and Science are each marked over 50. Adding the score in Mathematics to Science, Language and Social Studies would be like adding miles, meters and inches. Calculating Standard Scores Using an academic test example, we will examine the scores of five students who wrote the G6NA. The Language Arts paper 1 has 60 multiple choice questions worth 1 mark each and one written paper worth 40 marks. The mathematics paper consists of 60 multiple choice items while the Science and Social Studies papers each have 50 multiple choice questions. Each multiple choice item is worth 1 mark. The table below represents the scores obtained by each student. Table 6: Scores obtained by students
NAME LA Math Sci SS
Raw % Raw % Raw % Raw %
Ivan Terrible 93 93 58 96.7 46 92 36 72
Mike John 86 86 57 95.0 47 94 46 92
Sally Saucer 87 87 56 93.3 48 96 45 90
John Doe 71 71 35 58.3 37 74 42 84
Ty Lawson 55 55 17 28.3 21 42 27 54
Mean 78.4 78.4 44.6 74.3 39.8 79.6 39.2 78.4
Standard Deviation 15.4 18.1 11.4 7.9
In order to calculate the standardized score, the mean (78.4 for LA) and standard deviation (15.4 for LA) are needed (included in table). The CMEU uses a standard mean of 100 and standard deviation of 15 in order to calculate standard scores. Two steps are involved in calculating the standard scores for students. First, the raw scores are calculated to Zscores. The Zscores are then converted to Standardized scores.
Grade6NationalAssessmentReport2013Curriculum,MeasurementandEvaluationUnit Page30
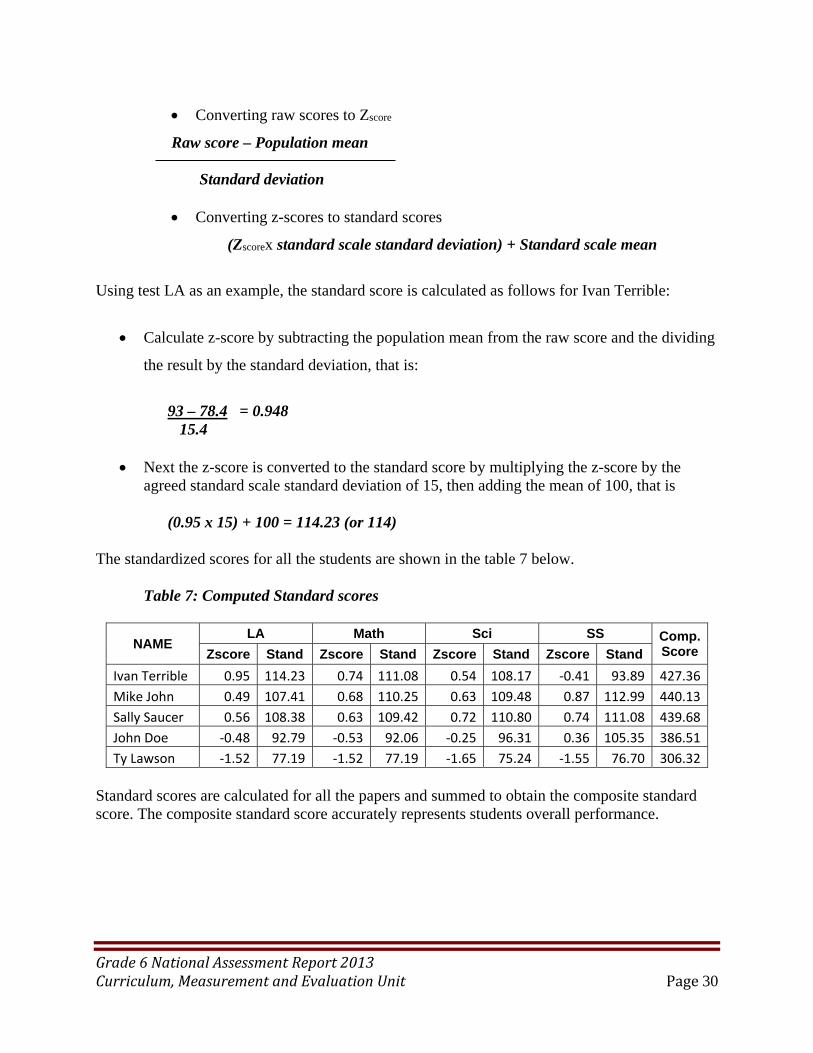
Converting raw scores to Zscore
Raw score – Population mean Standard deviation Converting z-scores to standard scores
(Zscorex standard scale standard deviation) + Standard scale mean
Using test LA as an example, the standard score is calculated as follows for Ivan Terrible:
Calculate z-score by subtracting the population mean from the raw score and the dividing
the result by the standard deviation, that is:
93 – 78.4 = 0.948 15.4
Next the z-score is converted to the standard score by multiplying the z-score by the
agreed standard scale standard deviation of 15, then adding the mean of 100, that is
(0.95 x 15) + 100 = 114.23 (or 114) The standardized scores for all the students are shown in the table 7 below. Table 7: Computed Standard scores
NAME LA Math Sci SS Comp.
Score Zscore Stand Zscore Stand Zscore Stand Zscore Stand
Ivan Terrible 0.95 114.23 0.74 111.08 0.54 108.17 ‐0.41 93.89 427.36
Mike John 0.49 107.41 0.68 110.25 0.63 109.48 0.87 112.99 440.13
Sally Saucer 0.56 108.38 0.63 109.42 0.72 110.80 0.74 111.08 439.68
John Doe ‐0.48 92.79 ‐0.53 92.06 ‐0.25 96.31 0.36 105.35 386.51
Ty Lawson ‐1.52 77.19 ‐1.52 77.19 ‐1.65 75.24 ‐1.55 76.70 306.32
Standard scores are calculated for all the papers and summed to obtain the composite standard score. The composite standard score accurately represents students overall performance.