United Nations Visiting Mission to the Trust Territories of the ...
Upload
khangminh22Category
view
0download
0
2010
CRES Visiting Scholar’s Paper Series
| Conference Proceedings 11-02 |
Edited by Yang-Hee Kim
2010CRES Visiting Scholar’s Paper Series
Edited by Yang-Hee Kim
ISBN 978-89-322-3056-6 978-89-322-3020-7 (Set)
Price USD 10
2011 CRES Visiting 표지.indd 1 2011-05-24 오전 9:33:16
The Korea Institute for International Economic Policy (KIEP) was founded in 1990 as a government-funded economic research institute. It is a leading institute concerning the international economy and its relationship with Korea. KIEP advises the government on all major international economic policy issues and serves as a warehouse of information on Korea’s international economic policies. Further, KIEP carries out research by request from outside institutions and organizations on all areas of the Korean and international economies by request.
KIEP possesses highly knowledgeable economic research staff. Now numbering over 168, our staff includes 52 research fellows with PhDs in economics from international graduate programs, supported by more than 66 researchers. Our efforts are augmented by our affiliates, the Korea Economic Institute of America (KEI) in Washington, D.C. and the KIEP Beijing office, which provide crucial and timely information on local economies. KIEP has been designated by the government as its Center for International Development Cooperation and the National APEC Study Center. KIEP also maintains a wide network of prominent local and international economists and business people who contribute their expertise on individual projects.
KIEP continually strives to increase its coverage and grasp of world economic events, and expanding cooperative relations has been an important part of these efforts. In addition to many joint projects in progress KIEP is aiming to become a part of a broad but close network of the world’s leading research institutes. Considering the rapidly changing economic landscape of Asia, which is leading to further integration of the world’s economies, we are confident that KIEP’s win-win proposal for greater cooperation and sharing of resources and facilities will increasingly become standard practice in the field of economic research.
Wook Chae, President
Price USD 10
108 Yangjaedaero, Seocho-Gu, Seoul 137-747, KoreaTel: 02) 3460-1114 / FAX: 02) 3460-1144,1199URL: http//www.kiep.go.kr
2011 CRES Visiting 표지.indd 2 2011-05-24 오전 9:33:16
2010CRES Visiting Scholar’s
Paper Series
| Conference Proceedings 11-02 |
Yang-Hee Kim
KOREA INSTITUTE FOR
INTERNATIONAL ECONOMIC POLICY (KIEP)
108 Yangjaedaero, Seocho-Gu, Seoul 137-747, Korea
Tel: (822) 3460-1178 Fax: (822) 3460-1144
URL: http://www.kiep.go.kr
Wook Chae, President
Conference Proceedings 11-02
Published May 30, 2011 in Korea by KIEP
ISBN 978-89-322-3056-6 94320
978-89-322-3020-7 (Set)
Price USD 10
ⓒ 2011 KIEP
Contents
Acknowledgement 7
Contributors 9
1. The Sphere of Services as the Main Factor of Maintenance Employment and a Diversification of Economy of Uzbekistan 11Tagaev BehzodIntroduction 11Body 12Conclusions 24
2. Education for Development: India and East Asia 27Shovan RayIntroduction 27Literacy Imperatives Around the World: A Brief Sketch 28The Chinese Experience 33Prologue on Japan 37Taiwanese Experience 39The South Korean Experience 41The Indian Experience 43Contributions to Endogenous Growth Theory and Human
Development 47Conclusions 49
3. Free Trade Agreement between Korea and Turkey:Challenges, Opportunities and Economic Cooperation 53Mahmut TekceIntroduction 53Economic Relations between Korea and Turkey 55Turkey’s Trade Policy in the Context of the EU’s Free Trade
Agreements 67
Effects of Korea-Turkey FTA: Risks and Opportunities 71Potential Exports to Korea for Turkish Products 83Beyond a Free Trade Agreement: Economic Cooperation
between Korea and Turkey 85Conclusion 88
4. ASEAN Economic Community: Prospect for Regional Monetary Cooperation in East Asia 91Umi Karomah YaumidinIntroduction 91ASEAN Economic Community 93The Prospectus of Regional Monetary Cooperation 98Future Implications for Indonesian and Korean Monetary
and Fiscal Management 119Concluding Remarks 124
5. Cross-Strait ECFA Should be the Stepping Stone for Taiwan Joining in the East Asia Economic Integration 129Chaw-Hsia TuIntroduction 129Economic Thinking of ECFA and the Possible Impacts on
Cross-Strait Relations 131ECFA and the Economic Effects on Taiwan 135Policy Implications for other East Asia Countries 147Conclusions 151
6. Korea's FTAs and their Implications for the Korean Wine Market 155Timothy John BealIntroduction 155Korea's FTAs and their Implications for the Korean Wine Market 160Conclusion 185
7. Korean Trade and Political Risk 207Whitney Haring-SmithIntroduction 207
International Country Risk Ratings 209Korea’s County Rating Systems 211Comparison of Korea ExIm Bank Rating System to
International Rankings 215Korea’s Increasing Exposure to Country Risk 217The Export-Import Risk Gap 220Korean FDI Exposure 224Case Study Review 231POSCO in India 231Daewoo Logistics in Madagascar 233Conclusions 234
8. Research on Exit and Transformation of China’s Economical Stimulus Policies in the Post-Crisis Era 239Du FeilunIntroduction 239China’s Macroeconomic Stimulus Policies after the International
Financial Crisis 240The Conditions of China’s Economic Stimulus Polices Exit 243The Route of China’s Economic Stimulus Polices Exit 252The Direction of China’s Economic Policies Transformation in
the Post-Crisis Era 254Conclusion 259
9. Research on the Urbanization Problem of South Korea 261Huang ZhengxueIntroduction 261The Phase of Urbanization Development 263To Upgrade Industrial Structure 266To Improve the Structure of the Urban Hierarchical System 275To Enhance the Construction of Infrastructure 282Coordinated Development Between Urban and Rural Areas 288To Play the Role of Government 295Conclusion 301
Acknowledgement
Korea Institute for International Policy (KIEP) has expanded its cooperative relations with the world since it took the role of the hub of regional studies in public research areas of Korea. The Center for Regional Economic Studies (CRES), the largest part of KIEP stands at the forefront of Korea’s regional economic research field, and has played a pivotal role of regional studies of the world in Korea.
As a part of our systematic efforts to foster international exchanges and build the knowledge based through interdisciplinary collaboration, CRES initiated a researcher-exchange program called CRES Visiting Fellows Program in 2008. The program brings together influential professionals from academia and the public sector to advance individual, institutional and national understanding of regional economic matters and to improve international cooperation on related research.
This volume is a part of our achievements through the program. It is comprised of nine papers written by visiting scholars participated in CRES Visiting Fellows Program in 2010. I hope this proceeding would work as another channel to deepen the understanding of regional economies in Korea.
Therefore, I would like to express my special thanks to all the scholars who participated in the program for their dedicated research and constant interest to contribute to the book. I would also deeply appreciate the Outreach Team in CRES for their devoted effort for publication of this volume.
Yang-Hee KimDirector
Center for Regional Economic Studies, KIEP
Notes on the Contributors
Dr. Tagaev Behzod is a manager of Project of the Institute for Social Researches under the Cabinet of Ministries of the Republic of Uzbekistan. He received his M.A. in International Relations and Ph. D in Economics at Academy of the State and Social Construction under the President of the Republic of Uzbekistan. He was Deputy of Head Department of the Ministry of Economy of the Republic of Uzbekistan from 2007 to 2009. He has published more than 10 articles on economy and labor issues in Uzbekistan to various journals.
Dr. Shavan Ray (PhD in Economics, University of Cambridge, UK) is a professor of Indira Gandhi Institute of Development Research. He published numerous books and papers including Backwaters of Development: Six Deprived States of India(2010). He was engaged as Director and Coordinator for the project “Strenthening State Plans for Human Development” for the three-year period (2006-09).
Dr. Mahmut Tekco is an assistant professor at Marmara University Department of Economics, where he completed his doctoral studies in Economics. He also worked as an associate research fellow on trade policy issues at Center for European Policy Studies in Belgium. His research interests cover international trade policy, agricultural policies, regional economic integration and political economy.
Ms. Chaw-Hsia Tu is a Research Fellow and a Head on Economic and Trade Research Section at Chung-Hua Institution for Economic Research. She studied at Western Illinois University (USA) where she received her M.A. in Economics in 1978.
Dr. Timothy John Beal is a Research Fellow of School of Marketing and International Business at Victoria University of Wellington. He completed his doctoral studies on China’s Terms of Trade, 1930-1969 at Department of Business Studies of University of Edinburgh. He has extensive research experiences in business, international trade and marketing, and international geopolitics in respect of Asia, with particular emphasis on Northeast Asia.
Dr. Whitney Haring-Smith is a consultant at the Boston Consulting Group in Sydney and he completed his doctoral studies in Politics at Oxford Univerisity, UK in 2010.
10 2010 CRES Visiting Scholar’s Paper Series
Dr. Du Feilun is a Research Associate at Institute of Economic Research of Academy of Macroeconomic Research, National Development and Reform Commission (NDRC), China. He completed doctoral studies on Macroeconomics at Graduate School of Chinese Academy of Social Science.
Dr. Zhengxue Huang is a Deputy Senior Researcher at Institute of Spatial Planning & Regional Economy of National Development and Reform Commission P.R.C. He graduated from Nankai University with Ph. D. in Region Economic.
The Sphere of Services as the Main Factor
of Maintenance Employment and
a Diversification of Economy of Uzbekistan
Tagaev Behzod
1. Introduction
Maintenance of employment rate for the population is a major social and economic issue for any country irrespective of its economic development. This issue is of special concern for Uzbekistan, which posses nearly half of the entire population of Central Asia (28 million out of 58 million). Uzbekistan is third place in terms of population (about 10% of total population of CIS countries) among the CIS countries, after Russia (51%) and Ukraine (17%). However, unlike the two countries above, Uzbekistan is higher in terms of birth rate (mid-annual growth of the population for 2000-2009 was 1.4%).
The state of Uzbekistan has defined acceleration of growth in services as a priority in the economic development of Uzbekistan and as a main potential source of additional employment and income. For example, in the developed countries, the share of services in gross domestic product is 60 to 80%; and services also employ 70% of total number of workers in their economies. As for the structure of consumer expenses, the expenses for services represent about 50-60%. Reaching a similar level of development in the services sector involves a serious and persistent effort, from the part of the state.
To this end, very favorable conditions including a number of privileges and preferential treatment on taxes and other payments have been created in Uzbekistan. In addition, efforts to streamline legislation towards placing greater priority on private property, elimination of bureaucratic barriers and obstacles are currently in progress.
12 2010 CRES Visiting Scholar’s Paper Series
Development of a small and private business as major elements in the formation of middle-class proprietors will lead to greater possibilities for increasing the significance of services.
2. Body
The serious qualitative changes occurring in the country as of late is intended to resolve the employment problem among the population. Thus the development of sphere of services assumes an important role. The special attention to development of services and its role in the diversification of economy and maintenance of employment levels in Uzbekistan has been underlined by the Uzbek President Islam Karimov: «The expansion of sphere of services has rendered extremely great value to the population. These do not depend on external contingencies, nor on weather conditions, and is steady against change of external factors».1)
Socioeconomic development of a country as a factor in improving living standards to a considerable extent can be provided by the ability of services to promote efficient growth. Therefore development of the realm of services is remains one of the priorities in the socioeconomic policy of Uzbekistan in the medium-term.
The services sector - can be divided into categories, subcategories and types of activities, which functional purpose manufacture and realization of services and the spiritual blessings for the population.
Also it may be characterized as follows: the sphere of services - is a result of direct interaction of businesses and consumer (client) in order to satisfy the latter’s needs. The outcome is restoration (change, maintenance) of consumption patterns of goods, creation of demand for new products, movement of goods and people, improve conditions for consumption, securing and maintenance of good health, spiritual or physical development, improvement of professional skills.
The services can be divided to two categories: material and social-cultural. Material services are those that satisfy material needs of consumers. Material services are restore (change, maintenance)
1) Our main task - the further development of the country and increase of people’s well-being. People’s word. 30 January 2010.
The Sphere of Services as the Main Factor of Maintenance Employment and a Diversification of Economy of Uzbekistan 13
consumption patterns of goods, creation of demand for new products, movement of goods and people, making conditions for consumption.
In particular, to the category of material services belong services for everyday life (repair/maintenance of goods, building and construction, photography, hairdressing) municipality services, public catering, transport and agricultural services and so on. Social-cultural services are services that satisfy spiritual/intellectual needs of people and help them maintain quality of life. Social-cultural services provide maintenance and restoration of health, spiritual and physical development, and improvement of professional skills. Services of this type include medicine, culture, tourism and education.
At the present time, services have become a very important sector of the economy. This was due to complication of production in the manufacturing sector, saturation of market with new goods, and rapid growth and progress in scientific techniques.
Services also have an essential role in revitalizing the human factor. As modernization of the economy progresses, this sector acts, at the present stage, as the important factor in balancing the consumer market, satisfaction of growing demand of the population, creation of new jobs and as a whole steady economic growth.
It is necessary to note the role of services in deep transformations in requirements of the economic system. Complication of techniques, technologies, manufacturing structures, growth of population’s living standards and its social activity, and also the need for personal perfection (increases in educational and cultural level), consistently expand the spectrum of manufacturing and the demands of the population. Formation of the service economy is a universal process found in all countries. But it manifests differently as internal preconditions mature, which in turn depends on the level of economic development and implementation of reforms. In developing countries, economic activities are directed mainly by manufacturing and real production. Higher the development level, higher the role of work activity involving non-material and intangible type of production, expressed within the economy in the form of services. As a result of long evolution, in the beginning of the 21
st century, the share of services in world gross national product has reached 68%.
Services have an important place in the maintenance of economic growth of the countries. Now the country cannot be considered as
14 2010 CRES Visiting Scholar’s Paper Series
developed if its share of services in the GDP is less than 65%. It is enough to say that in the USA, services represent about 73% of jobs, which in turn represent 85% of all ‘top skills.’ 40% of the basic production of the country concentrated in the sector. According to the US Bureau of Labor Statistics, in the near future the increase in number of empty workplace will occur at the expense of services sector. A similar tendency is observed in the countries of Europe, where services represent more than 66% of the employed population. In the EU countries, share of service is about 65-75% of GDP and 65% of the employed population; in Japan, the percentages are 62 and 60% respectively.
The various types of services in manufacturing are key factors for economic functioning in the long-term; as they have become veritable engines of steady social and economic development of the country. It is a question first of all of development of a science and scientific services, formation of public health services, various professional services, communication, information service etc. Traditional services, however, still have important roles in the economy - trade, personal services, etc.
With the growth of incomes, its educational - cultural potential increases, and also population’s needs for increased number of services. The developed and dynamic services - is attributive of a society which have reached of a sufficiently high level in terms of income and well-being in terms of its population’s part, meaning the country as a viable and extensive middle class.
Conducting economic reforms in Uzbekistan, restructuring of various sectors provides transfer of excess labor force from agriculture to other sectors of the economy. In 1991, the agricultural sector was the prevailing sector and employment rate in agriculture was 41.9%. Economic reforms were subsequently carried out and led to the diversification of the economy, with share of employment in the agricultural sector decreasing to 26.7% in 2009.
Also, the share of agriculture share in Uzbekistan’s GDP also decreased: from 30% in 2000 to 18.2% in 2009.2) In general, at the present stage of economic development in Uzbekistan, it becomes necessary to accelerate development of the services sector; as maintenance
2) Data of State Committee on Statistics of the Republic of Uzbekistan.
The Sphere of Services as the Main Factor of Maintenance Employment and a Diversification of Economy of Uzbekistan 15
employment rates, growth of incomes and well-being of the population, steady economic growth became basic priorities and the major issues related to deepening of economic reforms.
As a result of efforts for their realization, target programs aimed at providing a number of stimulus and preferences on development of the services sector were initiated and also developed were programs/ measures for their realization in all communities. According to the decree of the President of the Republic of Uzbekistan on April 17th, 2006, microfirms and the small enterprises rendering financial, household and other services are exempt from single tax payment till 2011. Also, money was allocated for the development of the services sector during the period 2007-2010, in the form of soft loans from the funds for employment assistance and social security under the Ministry of labor, and “Microcredits” from commercial banks. In the Anti-crisis program that was realized, to services sector took an important place as a element stimulating consumer demand.
A specific target and reference point for the Program on development of the services sector has been set: the growth of the share of the services sector in the volume of GDP by 2010 to 49 percent. Measures for development of the services sector sphere of services takes into account the experience of foreign countries, based on an estimation of the economic potential of developed countries, where the share of the services sector represents 60-80% in GDP.
Development of sphere of services leads to increased quality of life for the population, defined by quantity and a variety of services rendered by the population. In the structure of consumer expenses in 2009, the fee expended for services was 27.6%, an increase of almost 12% in comparison with 2000. For comparison, numbers in the said category in the developed countries is 50-60%. Social guarantees from the state in the form of free services have been one of the components of social security for the population.
The services sector also promotes improvement of manpower quality and competitiveness of labor force by way of development of various economic sectors, raising the educational level of the population, maintaining physical health and to developing culture. Within the boundaries of program, more than 33,000 businesses were created, including 9,600 in the retail trade, about 3,000 public catering establishments, 20,600 consumer services, 160 trading-household enterprises
16 2010 CRES Visiting Scholar’s Paper Series
for rendering of various services to the population. Toward the creation of a service infrastructure about 30 billion Uzbek soums (national currency) in credit were dispensed from commercial banks to the sector. For four years, 522,000 jobs were created in the services sector.
The expense of providing help in the form of the privileges through the program, as a sum total at the disposal of the enterprises rendering the services, annually adds up to more than 8 billion UZS, which promotes expansion and strengthening of the sector. However, there are regional differences as to the quantity of services that are rendered.
A city dweller receives 5.5 times more services rendered than a farmer, which is the result of the difference in economic activity between urban and rural areas, in addition to insufficient level of development of services in the countryside. This testifies to the high level of regional differentiation in terms of the amount of services that influence quality of lives, especially among the agricultural population.
The recent dynamism of volume of paid services per capita is attested by its stable growth in 18 times in the period 2000-2009 (from 12,600 UZS to 2,268,000 UZS). The highest rates can be seen in transport services, a telecommunication service, information, financial, bank services, in car repairs and home appliances. It is especially necessary to take note of the dynamic development of services in information & communication technologies, which increased by an annual average of 50 percent for the last four years.
For the period (2007-2009) the share of a telecommunication service has increased in the services sector; and information, financial and bank services other types of services, in particular. At the same time, the share of such progressive types of service as information, banking/ finance, and tourism remain insignificant.
In terms of the number of people in the service relative to population, tourist services is the most insignificant, which does not exceed 0.2% and explains the insufficiency of measures on attraction of foreign tourists to Uzbekistan as well as development of domestic tourism.
Development of the services sector serves directly the vital interests of people, is a reliable source of growth of incomes and well-beings of a great bulk of the population, not demanding thus considerable investment contributions.3)
3) State Committee on Statistics of the Republic of Uzbekistan.

The Sphere of Services as the Main Factor of Maintenance Employment and a Diversification of Economy of Uzbekistan 17
1,4
11,1
4,6
1
4
7
10
2000 2004 2005 2006 2007 2008 2009years
times
Growth of employment in the sphere of services
Growth of monthly average real wages
Growth of real monetary incomes per capita
Figure 1. Growth of Employment, Wages and Incomes Per Capita
Table 1. Dynamics of Main Indicators of the Services Sector Development in Uzbekistan4)
2006 2007 2008 2009
Share of services in GDP in% 39.5 42.5 45.3 47.0
Services - all in% 113.2 126.6 118.5 116.7
Trade and public catering 113.5 132.5 126.8 121.8
Transport services 123.8 121.1 112.7 110.4
Telecommunication and information 142.8 151.5 135.7 121.6
Financial, bank services 107.9 123.8 136.5 124.7
Tourist services 105.2 122.3 126.3 130.4
Services of hotels 114.3 133.5 122.5 112.3
Municipal services 102.7 111.1 113.1 103.2
Services in car repairs 113.2 138.7 134.8 130.2
Other services 121.9 142.5 130.6 128.6
Creation of jobs, thousand people 136.8 206.2 265.0 270.0
In% from created working places 24.0 32.7 40.2 28.7
4) Data of Ministry of economy of the Republic of Uzbekistan.
18 2010 CRES Visiting Scholar’s Paper Series
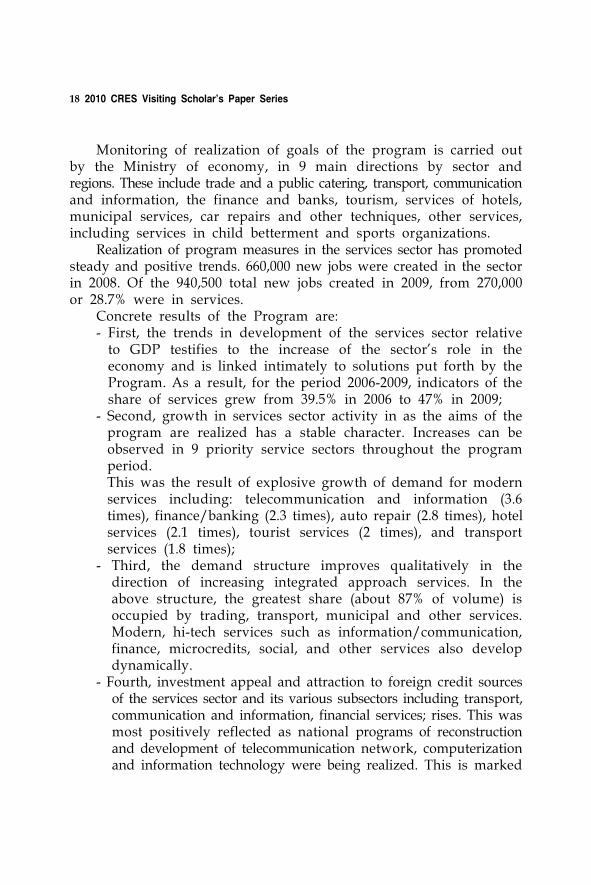
Monitoring of realization of goals of the program is carried out by the Ministry of economy, in 9 main directions by sector and regions. These include trade and a public catering, transport, communication and information, the finance and banks, tourism, services of hotels, municipal services, car repairs and other techniques, other services, including services in child betterment and sports organizations.
Realization of program measures in the services sector has promoted steady and positive trends. 660,000 new jobs were created in the sector in 2008. Of the 940,500 total new jobs created in 2009, from 270,000 or 28.7% were in services.
Concrete results of the Program are: - First, the trends in development of the services sector relative
to GDP testifies to the increase of the sector’s role in the economy and is linked intimately to solutions put forth by the Program. As a result, for the period 2006-2009, indicators of the share of services grew from 39.5% in 2006 to 47% in 2009;
- Second, growth in services sector activity in as the aims of the program are realized has a stable character. Increases can be observed in 9 priority service sectors throughout the program period.This was the result of explosive growth of demand for modern services including: telecommunication and information (3.6 times), finance/banking (2.3 times), auto repair (2.8 times), hotel services (2.1 times), tourist services (2 times), and transport services (1.8 times);
- Third, the demand structure improves qualitatively in the direction of increasing integrated approach services. In the above structure, the greatest share (about 87% of volume) is occupied by trading, transport, municipal and other services. Modern, hi-tech services such as information/communication, finance, microcredits, social, and other services also develop dynamically.
- Fourth, investment appeal and attraction to foreign credit sources of the services sector and its various subsectors including transport, communication and information, financial services; rises. This was most positively reflected as national programs of reconstruction and development of telecommunication network, computerization and information technology were being realized. This is marked

The Sphere of Services as the Main Factor of Maintenance Employment and a Diversification of Economy of Uzbekistan 19
by high growth of wireless telecommunication, number of subscribers of cellular communication, payphone communication, points of collective access to the Internet, on-air broadcasting-cable television services. The new infrastructure to facilitate rendering of services to consumers is created. As a result of the development of an infrastructure, profitable activities in new workplaces are created additionally. It is now necessary to ensure that the services sector represents more than 51% of workplaces for the employed in the republic. In 2006-2009, the services sector created about 900,000 workplaces;
- Fifth, certain positive influence allow state program regulations to maintain target parameters at the sectoral and regional levels, and lends support to formations of the markets by means of granting of privileges, preferences and financial assistance. As a result of optimal arrangements and emphases, separate types of services have shown a high degree of development. When mechanisms of credit support for businesses are generated in Uzbekistan, a microcredit system aimed at promoting family/ female businesses, expansion and strengthening of small business credit unions develop. From there emerges a new kind of credit targeting small and private businesses - master lease option. For the further expansion of services in microcrediting and microleasing to subjects of a small business, personal subsidiary, farmers on the basis of “Tadbirkorbank” has created a specialized “Mikrokreditbank”. In 2009 the volume of bank credit for small businesses has increased by 1.5 times compared to 2008, with the volume of allocated microcredit doubling during the same period. A problem arose in 2010 in that the sum needed for allocation to small and private businesses of credit resources was not less than 2.5 billion UzS, or 1.4 times the amount in 2009; the volume of microcredits increased further to 420 billion UzS, or 1.3 times relative to the previous year.5) The primary activity of the so-called “Microcredit Bank” is the delivery of credits for starting capital, preferential microcredits and microleases for development of small and private businesses.
5) Data of Central Bank of the Republic of Uzbekistan.
20 2010 CRES Visiting Scholar’s Paper Series
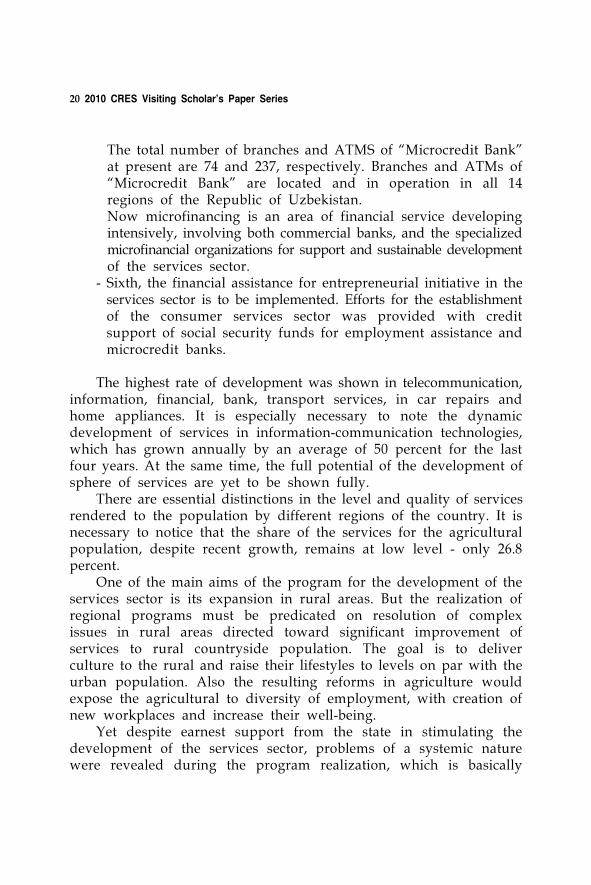
The total number of branches and ATMS of “Microcredit Bank” at present are 74 and 237, respectively. Branches and ATMs of “Microcredit Bank” are located and in operation in all 14 regions of the Republic of Uzbekistan.Now microfinancing is an area of financial service developing intensively, involving both commercial banks, and the specialized microfinancial organizations for support and sustainable development of the services sector.
- Sixth, the financial assistance for entrepreneurial initiative in the services sector is to be implemented. Efforts for the establishment of the consumer services sector was provided with credit support of social security funds for employment assistance and microcredit banks.
The highest rate of development was shown in telecommunication, information, financial, bank, transport services, in car repairs and home appliances. It is especially necessary to note the dynamic development of services in information-communication technologies, which has grown annually by an average of 50 percent for the last four years. At the same time, the full potential of the development of sphere of services are yet to be shown fully.
There are essential distinctions in the level and quality of services rendered to the population by different regions of the country. It is necessary to notice that the share of the services for the agricultural population, despite recent growth, remains at low level - only 26.8 percent.
One of the main aims of the program for the development of the services sector is its expansion in rural areas. But the realization of regional programs must be predicated on resolution of complex issues in rural areas directed toward significant improvement of services to rural countryside population. The goal is to deliver culture to the rural and raise their lifestyles to levels on par with the urban population. Also the resulting reforms in agriculture would expose the agricultural to diversity of employment, with creation of new workplaces and increase their well-being.
Yet despite earnest support from the state in stimulating the development of the services sector, problems of a systemic nature were revealed during the program realization, which is basically
The Sphere of Services as the Main Factor of Maintenance Employment and a Diversification of Economy of Uzbekistan 21
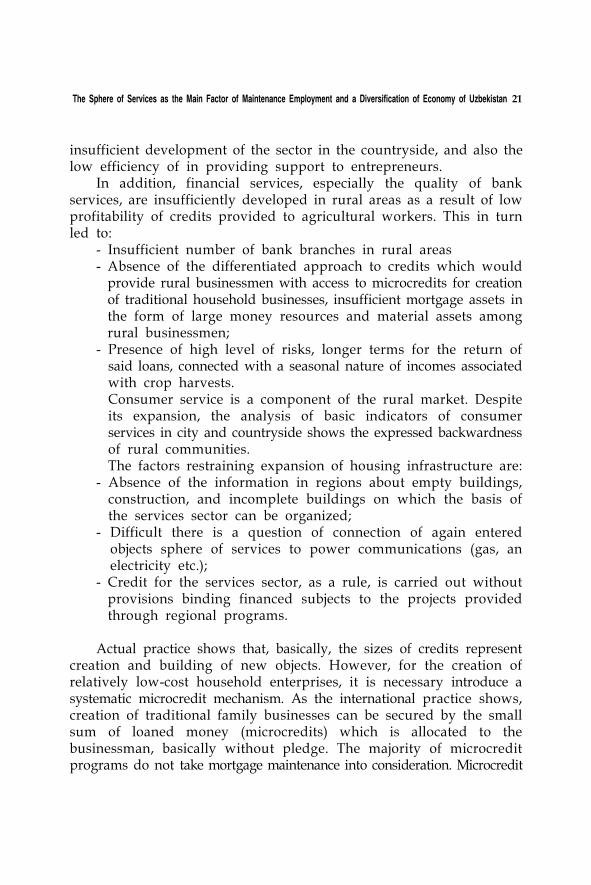
insufficient development of the sector in the countryside, and also the low efficiency of in providing support to entrepreneurs.
In addition, financial services, especially the quality of bank services, are insufficiently developed in rural areas as a result of low profitability of credits provided to agricultural workers. This in turn led to:
- Insufficient number of bank branches in rural areas- Absence of the differentiated approach to credits which would
provide rural businessmen with access to microcredits for creation of traditional household businesses, insufficient mortgage assets in the form of large money resources and material assets among rural businessmen;
- Presence of high level of risks, longer terms for the return of said loans, connected with a seasonal nature of incomes associated with crop harvests. Consumer service is a component of the rural market. Despite its expansion, the analysis of basic indicators of consumer services in city and countryside shows the expressed backwardness of rural communities.The factors restraining expansion of housing infrastructure are:
- Absence of the information in regions about empty buildings, construction, and incomplete buildings on which the basis of the services sector can be organized;
- Difficult there is a question of connection of again entered objects sphere of services to power communications (gas, an electricity etc.);
- Credit for the services sector, as a rule, is carried out without provisions binding financed subjects to the projects provided through regional programs.
Actual practice shows that, basically, the sizes of credits represent creation and building of new objects. However, for the creation of relatively low-cost household enterprises, it is necessary introduce a systematic microcredit mechanism. As the international practice shows, creation of traditional family businesses can be secured by the small sum of loaned money (microcredits) which is allocated to the businessman, basically without pledge. The majority of microcredit programs do not take mortgage maintenance into consideration. Microcredit
22 2010 CRES Visiting Scholar’s Paper Series
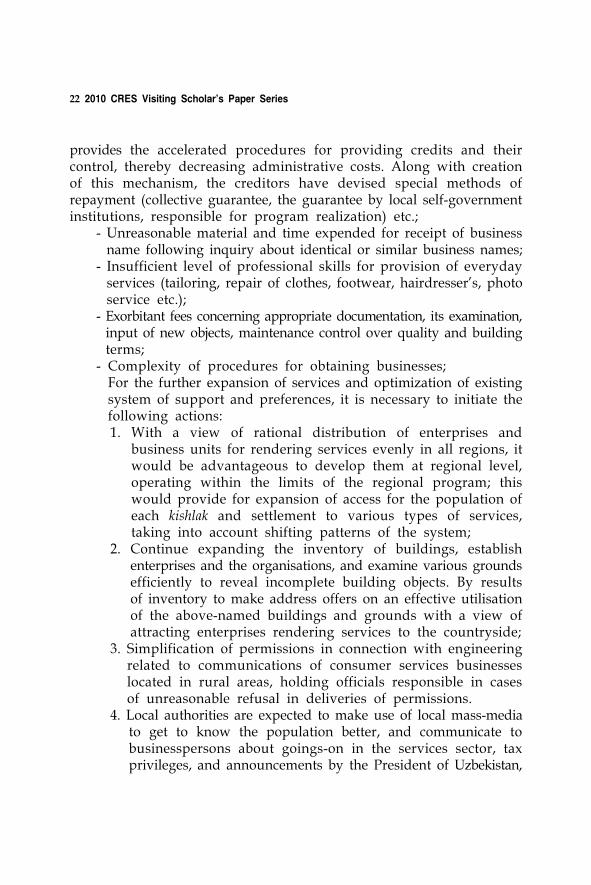
provides the accelerated procedures for providing credits and their control, thereby decreasing administrative costs. Along with creation of this mechanism, the creditors have devised special methods of repayment (collective guarantee, the guarantee by local self-government institutions, responsible for program realization) etc.;
- Unreasonable material and time expended for receipt of business name following inquiry about identical or similar business names;
- Insufficient level of professional skills for provision of everyday services (tailoring, repair of clothes, footwear, hairdresser's, photo service etc.);
- Exorbitant fees concerning appropriate documentation, its examination, input of new objects, maintenance control over quality and building terms;
- Complexity of procedures for obtaining businesses;For the further expansion of services and optimization of existing system of support and preferences, it is necessary to initiate the following actions:
1. With a view of rational distribution of enterprises and business units for rendering services evenly in all regions, it would be advantageous to develop them at regional level, operating within the limits of the regional program; this would provide for expansion of access for the population of each kishlak and settlement to various types of services, taking into account shifting patterns of the system;
2. Continue expanding the inventory of buildings, establish enterprises and the organisations, and examine various grounds efficiently to reveal incomplete building objects. By results of inventory to make address offers on an effective utilisation of the above-named buildings and grounds with a view of attracting enterprises rendering services to the countryside;
3. Simplification of permissions in connection with engineering related to communications of consumer services businesses located in rural areas, holding officials responsible in cases of unreasonable refusal in deliveries of permissions.
4. Local authorities are expected to make use of local mass-media to get to know the population better, and communicate to businesspersons about goings-on in the services sector, tax privileges, and announcements by the President of Uzbekistan,
The Sphere of Services as the Main Factor of Maintenance Employment and a Diversification of Economy of Uzbekistan 23
possibilities on financial, credit support for businesses more widely;
5. Working out of mechanisms for regional distribution of credit resources taking into account their primary aim in rural areas. As for additional measures and mechanisms for sustainable development of the services sector in local regions, they are to be done through regional distribution of microcredits, guarantees for local controls of credit granting, especially for the units included in the target program of development of sphere of services.
6. It is necessary to stir up activity of regional branches of commercial and industrial chambers, working out additional measures on sustainable development of the services sector, which are most needed in the following areas:
- Consulting services in carrying out market research, working out business plans, and information necessary for support and expansion of the network of small-scale business, including in the sphere of services;
- Services in hiring, selection and advancement of the personnel;- Services in collection and processing of wastes;- Services in processing agricultural produce;- Household services in repair and individual manufacturing of
sewing/fur products; tailoring of knitted, leather products, headdresses, textile dry goods; on repair and maintenance service of vehicles; furniture repair and manufacturing; dry cleaning, dyeing, laundries; car and equipment leasing, and rending items and household goods for private use.
Realization of the measures aimed at support of business in the services sector, stimulation of creation of services infrastructure and the expansion and advancement of services in rural areas will enhance the status of the sector in rural areas by virtue of fuller satisfaction of needs of the rural population, creation of additional workplaces and increase in quality of life for the rural population.
24 2010 CRES Visiting Scholar’s Paper Series
3. Conclusions
The ongoing policy to reform, liberalize and modernize; firstly, the nation’s economy and to diversify its structure has created a powerful barrier, a buffer that protects the country from negative impacts of crises and other threats. However, given the conditions of global financial and economic crisis creation of new workplaces, maintenance of population’s employment and consecutive increase of well-being of the people has taken on special urgency for any country, including Uzbekistan. As a result of measures in 2009 to counter the recession in 2009 created 940,000 new jobs, including 270,000 in the services sector.
In the decision to increase employment and effect steady growth of incomes in Uzbekistan, the priority has been given to development of the services sector.
There is no need to repeat once again in detail the significance attached to the development of the services sector in our social and economic policy. The dynamic character of the services sector, its ability to conform relatively easily to changes in the market conditions and consumer demand makes it an indispensable instrument for creating new jobs and increasing incomes of the population during the global economic crisis.
References
I.Karimov. 2009. The Global Financial-Economic Crisis, Ways and Measures to Overcome it in the Conditions of Uzbekistan. Uzbekistan.
Our Main Task - the Further Development of the Country and Increase of Well-being of the People. The Report of the President of Republic of Uzbekistan of Islam Karimov in a Government Meeting Devoted to Results of Social and Economic Development of the Country in 2009 and the Major Priorities of the Economic Program for 2010. Uzbekistan. (January 29)
The Decree of the President of the Republic of Uzbekistan No. 640 from 21 May 2006. On Additional Measures on Acceleration of Development of the Sphere of Services in the Republic of Uzbekistan till 2010.
The Sphere of Services as the Main Factor of Maintenance Employment and a Diversification of Economy of Uzbekistan 25
Balaeva A. 2008. The Sphere of Service in the World Economy: Tendencies of Development. World Economy and International Relations - 2000. Moscow, N3.
OECD. 2008. Employment Outlook. Paris: OECD.Reports of Ministry of Economy and Ministry of Labor and Social
Security on the population of the Republic of Uzbekistan.Dates of World Development Indicators. 2009.
Education for Development:
India and East Asia
Shovan Ray
1. Introduction
In my experience as academic and policy maker I have come to regard the paramount importance of education in economic development of communities and countries. Policy interventions to make this effective have not always been consistent with this observation, partly due to perceptions, but also owing to political and economic environments prevailing in various countries. It is for these reasons that the enduring contribution of education in economic development has not been leveraged in India. This point ought to come to the forefront of policy debate at this critical turn of India’s development. The present paper is prepared in the context of East Asia’s educational development vis-à-vis India’s, and we hope to carry the research agenda forward to study several major economies of Asia. This paper starts with a brief background of mass literacy development in Europe in Sixteenth century and its dynamics, and then goes on to extend the background to include education in USA, Japan and the Socialist bloc countries, particularly in the Soviet Union. These provide a variety of educational developments against which the Asian experience is pitted. This is useful partly because many of the Asian societies have been colonies of European nations and Japan and others have learnt from them. The Socialist bloc countries also provide an altogether different model of educational development not easily replicated by others. The paper then discusses the experience of China (PRC), Taiwan, South Korea and India. The paper concludes with a discussion relating education to recent developments in endogenous growth theory and human development and their intimate connections with the experience in East
28 2010 CRES Visiting Scholar’s Paper Series
Asia. Many lessons can therefore be learnt about the Indian education agenda that has acquired momentum in its quest to become a major emerging economy.
2. Literacy Imperatives Around the World: A Brief Sketch
It is now well documented that mass literacy movements started about four hundred years back in the mid-sixteenth century. It started with Protestant Reformations in what is now Germany, in Sweden and Scotland, and later on with Catholic Counter-Reformation in selected countries in Europe.1) It was a monumental change in human history, and it emerged then in response to some doctrines in the Catholic Church and the birth of Protestantism in Europe. At the time of mass literacy movements in these selected countries in Europe it was fortuitous that the printing revolution by the German inventor Gutenberg had been well established,2) and that helped the process considerably.3)
Note that the Renaissance in Europe had taken roots staring with the Italian Masters like Dante, da Vinci, and Michaelangelo providing an invigorating reawakening in several discourses; Copernicus and Galileo were breaking into the world of sciences and providing the foundation for Newtonian Physics and Astronomy and thereby questioning the Papal orthodoxy about the Geocentric (as opposed to their theory of Heliocentric) universe; Shakespeare and other literary geniuses were just about born; and the Church of England under King Henry VIII was to break away from the Roman Catholic Church, though
1) See Arnove and Graff (1987), Chapter 1: “Introduction”.
2) The printing press had been in place with written words being duplicated at considerable speed at that time. Johannes Gutenberg, a German born around the end of the 14
th century (c. 1398), introduced modern printing in mid-15th century. His invention of mechanical movable type printing started the Printing Revolution and is widely regarded as the most important event of the modern period. It played a key role in the development of the Renaissance, Reformation and the Scientific Revolution and laid the material basis for the modern
knowledge-based economy and the spread of learning to the masses.
3) As we discuss later, media and prevalent communications technology have a major influence on the spread and momentum of success in literacy movements.
Education for Development: India and East Asia 29
for an altogether different reason. This was a very momentous time indeed in the intellectual environment in Europe. However, by contrast education and literacy were then confined mostly to the elites in society and accessible mostly in classical languages. The religious imperatives of that period provided the wherewithal for a major boost to the spread of literacy for the masses to serve their goals. This provided the dynamism to the literacy movements in Germany, Sweden and Scotland, and subsequently to other countries in Europe.4)
Myron Weiner (1991) summarizes the early European experience in the following words: “Protestantism was the determining force for the early spread of education in central and northern Europe and in North America. In Austria, Germany, the United States, England, Scotland, the Netherlands, and the Scandinavian countries high rates of literacy (in some countries upto 80 percent) were achieved in the eighteenth century even before the establishment of compulsory education and state educational systems. In Catholic and Orthodox southern and eastern Europe less than 20 percent of the population could read. It was Protestantism that provided the moral fervor for compulsory education and the abolition of child labor and that shaped the moral content of elementary education.”
This period is structurally distinct from the mass literacy campaigns of nineteenth century USA and in Tokugawa and (later) Meiji Japan, and in the twentieth century political transformations in the newly emerging socialist countries of the Soviet Union, China, Vietnam, Cuba, Nicaragua, etc. on the one hand, and the newly independent (decolonized) countries such as India, South Korea, Taiwan, Tanzania, etc., on the other. When communist movements took over countries such as Russia, China, Vietnam, Cuba, and Nicaragua, the government in the respective country put considerable emphasis on literacy for the transformation of their society for both economic and social development and also ideological ‘tuning’ of the masses to prepare them for the socialist worldview. This was done from almost the beginning of their regimes with Lenin and Mao Zedong, respectively, declaring their agenda of education almost at the inauguration of taking over power; Mao had also started on the education agenda
4) For a good summary account on the backgrounds to literacy movements in various countries, see Weiner (1991).
30 2010 CRES Visiting Scholar’s Paper Series
during his transition governments in the provinces over which he had control and influence even before assuming power formally in 1949. Once they came into government the Chinese translated their rhetoric into practice, and typically earmarked far more resources on education and healthcare for the masses than even into their high profile military agenda. Newly decolonized countries such as India and South Korea have in their turn placed considerable emphasis on education, though I shall argue that India has achieved much less on this objective than it is desired. We shall return to this issue in greater detail later in the paper.
However, in all these instances in history, literacy campaigns have been triggered by major transformations in social structures and belief systems. This has been true in all the four major systems of campaigns listed above. In the German, Swedish, and Scottish campaigns from the mid-sixteenth century, they were intimately connected with, first the Protestant Reformations and then the Catholic Counter- Reformation, the latter most notably by the reinvigorated Order of Jesuits of the Catholic Church. In the United States of the 19th century, the competition of various religious denominations to ‘capture souls’, and a belief in republican government with its need for an educated citizenry, was keenly felt; but the extension of the franchise to the working class during the first three decades of the century was also felt during the years of the campaign. The need to prepare and educate the socialist man (and woman) in the communist regime (and the cultural transformation that was sought to be brought about in the Chinese case of the Cultural Revolution) and to transform him from the value system of the bourgeois society was the critical imperative of their campaigns for education. The developmental aspect, and what was to come out as the ‘empowerment approach’ subsequently in the literacy campaigns in the non-socialist developing countries were the key imperatives for education movement in the other select countries listed above - South Korea, Taiwan, India, Tanzania, etc.
Arnove and Graff (1987) hold the view that both historically and comparatively, literacy movements have formed part of larger transformations in society, involving large numbers of learners and teachers by centralized authorities, and they have used both elements of compulsion and social pressure to propagate a particular doctrine.
Education for Development: India and East Asia 31
Quoting a number of sources, they put forward the proposition that historically, “large-scale efforts to provide literacy have not been tied to the level of wealth, industrialization, urbanization, or democratization of a society, nor to a particular type of political regime. Instead, they have been more closely related to efforts of centralizing authorities to establish a moral or political consensus, and over the past two hundred years, to nation-state building.”5), 6) A number of scholars hold the view that a major distinguishing feature of the twentieth century campaigns from earlier educational movements, which spanned over two hundred years, is the ‘telescoped period of time’ in which the mobilization occurred. “The transformation of communications, including electronic technologies and economies of scale in the publishing industry, further facilitates printing and dissemination of literacy texts, and transmission of messages and symbols relating to a campaign. The combination of technology and concentration of political power also may portend greater opportunities for the monitoring of, and social control over, the uses of literacy.”7)
In the post-world war II era, there has been a change in the rhetoric and sometimes the ideology of the campaigns, when it embraced a large number of developing countries in the movement, partly assisted by international organizations such as the UNESCO. To summarize a long series of events, the most eloquent international statement on the goals of literacy appears in the 1975 Declaration of Persepolis (Iran) (quoted from Arnove and Graff op. cit., p. 9):
literacy … [is] not just the process of learning the skills of reading, writing, and arithmetic, but a contribution to the liberation of man and to his full development. Thus conceived, literacy creates the conditions for the acquisition of a critical consciousness of the contradictions of society in which man lives and of its aims; it also stimulates initiative and his participation in the creation of projects capable of acting upon
5) See the cited sources: Harvey J. Graff, The Legacies of Literacy (1986); Randall Collins (1977); J. Boli, F. Ramirez, J.W. Meyer (1985), and Yehudi Cohen (1970).
6) And this latter imperative also covers the Japanese from the Tokugawa to Meiji Restoration phase.
7) Arnove and Gaff op. cit., p. 3.
32 2010 CRES Visiting Scholar’s Paper Series
the world, of transforming it, and of defining the aims of an authentic human development.
The Declaration of Persepolis adopted in 1975 reads like the tenets of human development in contemporary literature and its emphasis on education. This literature emphasizes three important virtues of education for human development - in fostering instrumental, intrinsic, and agency values of education for human development.8)
An important and interesting departure of the early period of literacy campaigns is found in the Swedish movement. Launched in 1686 and national in scope, it was carried out almost entirely without the use of schools, and offers an example of a “domestically based but politically and religiously sponsored and enforced campaign ... Its unique features included a literacy based in reading ability but seldom in writing, and also a special stress on the mother’s educational role in the home. In early modern Sweden, as a result, the exceptional pattern of women’s rates of literacy paralleling men’s was achieved. This represents a historical and indeed a contemporary anomaly.”9)
In the 20th century, the Soviet Union stands out as the country that pioneered the eradication of illiteracy on a war footing. Although the Emancipation (of 1861) abolishing Serfdom in Russia set in motion several forces encouraging the spread of literacy and numeracy, it was not until the Bolsheviks came to power that the task was taken so seriously, and perhaps a little too cruelly during Stalin’s regime. In fact, Lenin had favoured a generally traditional education, putting emphasis on quality of learning and retention over haste and targets, as we would find in many movements in the post-colonial era replicated elsewhere, but Stalin had imposed speed, force and targets to achieve his goals.10) Stalin’s schools were designed to teach
8) See the ‘Overview’ chapter in Ray (2010) and its citations for the relevant issues in human development.
9) Arnove and Graff (op. cit., p. 10).
10) Lenin has been quoted in several sources as having said: “The illiterate person stands outside politics. First it is necessary to teach him the alphabet. Without it there are only rumours, fairy tales, prejudices, but not politics.” Eklof (op. cit., p. 134), puts forward his view on Lenin’s approach to literacy. “Confronted with the awesome task of rebuilding Russia after the Civil War, Lenin advocated gradualism, persuasion, and material amelioration in opposition to those
Education for Development: India and East Asia 33
the rudiments to as many children and adults as possible, and to provide political literacy as well - but of a Stalinist type. “ … it may well be that rote learning (decoding) has to precede independent thought (encoding), but the latter never came … The Soviet Union has changed immeasurably since the death of Stalin.11) Its human capital resources are impressive, and the education system has continued to expand … a nation has emerged far more sophisticated, skeptical, pluralistic, and demanding than the generation of newly literate, uprooted and traumatized peasants who bore the brunt of Stalinist development.12)
Weiner (op. cit., p. 152) also concluded that the notion of “education as a duty was more speedily adopted as policy when it was taken up by those within the state apparatus rather than those outside. Germany, postrevolutionary France, Meiji Japan, … the People’s Republic of China, … Taiwan, and South Korea moved swiftly to make education compulsory because the dominant elites … for whatever reasons, wanted education to be compulsory. England and the United States moved more slowly because the pressures for reform came largely from outside the state structure.” With this background on the history of literacy, we now turn to the Asian experience in the 20th century.
3. The Chinese Experience
On the inauguration of the People’s Republic of China on 1 October 1949, Mo Zedong stood on the Gate of Heavenly Peace and announced: “The era in which the Chinese people were regarded as uncivilized is now ended. We shall emerge in the world as a nation with advanced culture.”13) This statement of Mao was made at a time
pushing for an abrupt, forced march to socialism. He advocated … quality over speed in spreading education.”
11) Ben Eklof however concludes the Soviet experience thus: “The Soviet literacy campaign, massive and rapid as it was, could never have been carried out without the growth and consolidation which had occurred in the fifty years following the Emancipation and preceding the Revolution of 1917 … Benefits of the Stalinist campaign of the thirties there surely were, but the costs were also high, and the wastage extreme.” (op. cit., p. 145)
12) Ben Eklof writing in 1987 (chapter 2, p. 143) in Arnove and Graff (1987).

34 2010 CRES Visiting Scholar’s Paper Series
when illiteracy rates were reported at 85 percent among the adult population and as high as 95 percent in rural China. In 1951 the Anti-Illiteracy Commission was set up and the government vowed to make 200 million people between 18 and 40 years literate within five to seven years. Despite many ups and downs, and disruptions such as the Cultural Revolution, China’s anti-illiteracy has been marked by considerable success. Over 100 million illiterates of age 14 to 45 were made literate before the onset of the Cultural Revolution, and during that phase (1966-76) and despite many disruptions, another 38 million were made literate. China’s anti-illiteracy efforts clearly stand out as the greatest experiment in mass education in history, of over a billion people made literate in a space of about 30 years or so.
Anti-illiteracy crusade in China may be seen to fall in three phases: (a) from 1949 to 1966 - a period of 17 years from Liberation to beginning of Cultural Revolution; (b) the Cultural Revolution period from May 1966 to October 1976; and (c) from October 1976 to the present.14) According to Bhola (1984) it was in the 1950s that the role of literacy in the cultural development of China was clearly defined and elaborated in terms of concrete action, with an institutional framework established, and organization, methods and techniques were tried out. A model consisting of six interrelated principles emerged: (1) mobilization of the masses to fight against their own ignorance; (2) organization of a teachers’ contingent on the basis of ‘people teaching one another’; (3) utilization of a teaching method ‘integrating theory with practice and study for the purpose of application’; (4) adoption of flexible multiform organization for the conduct of anti-illiteracy work; (5) consolidation of achievements in anti-illiteracy by promoting programmes of literacy retention among new literates and ultimately establishing universal elementary education for children; and (6) action by the government to project a total commitment to literacy and give guarantees for the fulfillment of the task of anti-illiteracy.
When the People’s Republic of China was established in 1949, it
13) Quoted from Hayford (1987), p. 147.
14) H.S. Bhola (1984) cites the work of Bo Yu for this classification. For an insightful analysis of this campaign, see Bhola’s Unesco-sponsored work, Campaigning for Literacy (1984) in which he reviews eight national experiences of the twentieth century.
Education for Development: India and East Asia 35
ended a century of turbulent history, with many rebellions, invasions, and the reduction of a great empire to the status of a semi-colony. The Communists could not build upon the old rich traditions of Confucianism, but replace it completely. “Yet the homogeneity of the culture, and the respect for hierarchy and authority which Confucianism had ingrained among the people, helped the Communist leadership in the process of introducing Marxism.”15) Bhola continues, and I quote this important passage of his study on Chinese literacy:
“The new government had to contend with differences in nationalities, religions and languages; but while there were fifty-four different nationalities, the major ethnic group, Han, constituted 90 percent of the population. Linguistically, too, China’s situation was unique. While there are eight major dialects in Chinese, not mutually intelligible, all are written in the same way. It is only when spoken they differ. Most importantly for the Republic, there was no hostility towards the idea of a common language in any class or age group - rare circumstance in most developing countries. Religious groups included Buddhists, Muslims, Christians, Confucians and Taoists; yet no resistance seems to have appeared against the government or against its policies.” The imperative for the literacy campaign was succinctly put by Mao himself: “The necessary condition for establishing a new China is to sweep away illiteracy from the 80 percent portion of China’s population.” The challenge was vast in an economy that was in a shambles, but the opportunity was unique and tremendous and the administration went about achieving its goals with considerable zeal. The political revolution had to be consolidated by a cultural revolution, to be mediated by education to the masses.
For mobilization of mass literacy campaigns, the Chinese Communists had pre-liberation experience with them in the run up to October 1949 in the provincial areas under their control. Two important aspects emerged out of the exigencies of that situation faced as they were with limited resources and a vast task on hand. They had given priority to adult education over education of children, and that the education of the cadres, the vanguard of the revolution was to come first and then followed by those for the masses. Three other aspects related to mobilization for the national campaigns of the 1950s may
15) Bhola (1984), p. 75.
36 2010 CRES Visiting Scholar’s Paper Series
be noted: gradual expansion, the mass line, and responsiveness to local conditions. These were very important to the success of the effort.
‘Gradual expansion’ was itself divisible in three parts: selection of client groups, choice of geographical areas, and priority in terms of curricular emphasis. The cadres of worker-peasant origin (the vanguard) had to be educated first, and then workers and peasants. Urban- industrial sectors enjoyed priority over rural areas; and within rural areas, the choice was based on the principle of ‘readiness’. The need to respond to local condition was dictated by the vastness of the task and the multifaceted character of the challenge. The emphasis on the ‘mass line’ was a major part of the scheme of things, and Mao had laid down the ideological line: “All work done for the masses must start from their needs and not from the desire of any individual, howsoever well-intentioned.” This provided for both the approach and organization of literacy campaigns and the local support, participation, and funding of resources that was so critical to the effort’s success.16)
Another important task that the Chinese faced in their literacy campaign was the difficulty of the Chinese language for mass education, with the language containing some 50,000 characters a great majority of which are rarely used but vastly difficult to master all by even the most scholarly. The well-educated know no more than about 10,000, newspapers use up to about 4,000. In addition, while Chinese writing is ideographic, their spoken languages are phonetic and thus the same characters would be spoken differently by different linguistic groups which are themselves not mutually intelligible. This was a big challenge and they solved it by a series of innovations. In brief, they developed a ‘common speech’ (Mandarin dialect with Beijing pronunciation); they simplified the characters wherever possible; and they developed a phonetic alphabet (pinyin) to assist in the teaching of characters by annotating them phonetically. Definitions of illitrates, semi-literates and literates were defined quantitatively by means of these characters and their special classifications (1,500 character mastery makes one literate, which is a no mean task).17) The whole process was assisted by the
16) For further details on the Chinese campaign, see Bhola (1984, chapter 6). See also his piece for the conduct of adult education that is so critical for any literacy campaign, as part of the two critical lessons that the Chinese communists had learnt in the past mentioned above.
Education for Development: India and East Asia 37
printing of newspapers and magazines using horizontal as opposed to vertical printing from the New Year’s day of 1957. The Chinese achieved the commendable feat under the extraordinary guidance of Mao Zedong of making nearly a billion people literate in about three decades, a task that they had set out to do on 1 October 1949 at the Gate of Heavenly Peace.
4. Prologue on Japan
Before we discuss Taiwanese and Korean experiences it would be useful to mention a few facts about the Japanese thinking and practice of the time because these two countries were former colonies of Japan at a critical time in their histories till the end of World War II.18) Japan, an important maritime and military power at that time, annexed the Chinese island of Taiwan (then Formosa) in 1895 and the Korean peninsula - over which it had extended trade and commercial influence - was formally taken over in 1910.19) During the
17) Those who are “letter-blind or who know less than 500 words are considered illiterate; those who know more than 500 words but donot meet the required standard are considered semi-literate; peasants and housewives are considered litereate if they know 1,500 commonly used words, are able to read the simplest books and newspapers, and can write informal notes and receipts; cadres and workers to be considered literate must know 2,000 commonly used Chinese characters, read ordinary books and newspapers, and write essays of 200 or 300 words.” Bhola, p. 85.
18) Japan used to have an elite form of education of the classical variety which was patronized by the Samurai class and education was highly revered as in the Confucian traditions of China and the Brahmanical-Vedic traditions of India and other parts of Asia. However these traditions had a limited reach, and while the western European culture of mass orientation had an altogether different motivation and tradition, the Japanese elite saw it as a panacea for its development imperative. See the text for a broader historical picture.
19) There is controversy among Japanese scholars whether the annexation of these two, and a collection of a string of other pacific islands, was dictated by the Marxist-Leninist hypothesis of imperialism being a logical extension of the quest for expansion inherent in a capitalist economy; these are contested by others, including some American scholars who argue that this was dictated more by militarist-strategic considerations of Meiji elites.
38 2010 CRES Visiting Scholar’s Paper Series
Tokugawa period (1603-1867) Japan had a feudal system under the Shogun, who commanded total military power over the country and ran the system with the samurai class of warriors, which stood at the top of the social strata and comprised about 6 percent of the total population. The remaining 94 percent of commoners who comprised of all trade, artisan and cultivator strata and two groups of outcastes involved in certain other activities. The emperor remained as a figurehead and a class of nobility, but real power was wielded by the Shogun and his samurais.
As the system of education evolved two main structures reflecting the society emerged, one for the samurai ruling class and one for commoners.20) The samurai schools departed from an earlier Buddhist tradition of schooling by employing Confucian scholars to teach a number of disciplines including Chinese classics, elementary arithmetic, some Chinese and Japanese, and martial arts. The schools for commoners by contrast covered different syllabi, more appropriate for their callings besides some elementary literacy and numeracy, and most instructors were commoners. In both tracks, the schools were meant exclusively for boys, since girls were to be taught at home in the domestic arts. The Tokugawa period was marked by political isolationism by shoguns who “feared the intrusion of Western culture, particularly of Catholicism as introduced into China by Portuguese and Spanish missionaries.” The education system was thus not influenced by Western ideas of schooling. Through a series of events and the intrusion of Western trading powers, the hold of the Tokugawa shoguns was finally removed from the Japanese power structure, and the Meiji period recommenced with the restoration of the emperor in 1867 as the head of the government. With that the Western powers started influencing life and culture in Japan, including the system of education.
A new education order was imposed in Japan based on European and American systems, which made it clear that the functions of the schools would no longer be to further Confucian scholarship but impart practical knowledge and develop talent. The new system introduced common schools for all classes with three tiers of classes
20) The following account is based on ‘Part I: The case of Japan - A Prologue’ by R. Murray Thomas in Thomas and Postlethwaite (1983).

Education for Development: India and East Asia 39
- elementary, middle, and higher. Parents were held responsible for their children’s attendance at school, and this included education for girls as well. School attendance soared then onwards, and rose from 46 percent in 1886 to 97 percent 1906 and then to 99 percent in 1916. Japan advanced as an economic and military power again and ended up as a colonial power as well.
Japan extended variants of this model with the establishment of its empire in the colonies, though there were some critical differences with the metropolis of Japan. In both Taiwan and Korea colonial masters introduced elite education, first for the ruling class and subsequently for select natives but keeping very different tracks for the two. And in both countries, (Christian) missionaries were also significantly present in education. Initially, education for the limited masses was for the administration of colonial power and for training and vocational needs of the limited industries that prevailed in the colonies. Almost the entire rural and agricultural workers and most of the urban support were drawn from masses that had little or no exposure to education.
5. Taiwanese Experience
The experience of Taiwan was somewhat different from mainland China on one hand and South Korea on the other, with which it shared the status of a Japanese colony (from 1895 to 1945) and its policies on education. The Chinese natives of the island of Taiwan had been co-opted into the mainstream of economic life by the Japanese rulers by the time of its independence in 1945, but very soon circumstances changed as the Nationalists fled to this island nation when in October 1949 the Communist Party of China took over power in mainland China. With that many affluent Chinese as well as many who were ideologically differently inclined moved out of the mainland and set up base in Taiwan. With this change the Taiwanese administration also came under the strong influence and military protection of the United States, and some of its education policies changed.
In their metropolis, Japan followed a two-track policy of universal education for all at the primary level but a more elite education for
40 2010 CRES Visiting Scholar’s Paper Series
the select few (about 10 percent) for education beyond that. In case of Taiwan, while they kept the same system at the primary level, but reserved the higher education for the Japanese settlers in Taiwan. The Japanese created a system of government-run common schools as a counter to the Missionary and private-run Chinese schools. There they imparted Japanese medium instructions to middle- and upper- middle class Taiwanese pupils, where only 5 percent of them were enrolled in 1906 (Weiner, p. 165). But this system of common schools, following what they sought to achieve in their homeland was meant to cover all those Japanese who lived in Taiwan. While this two-track policy was followed in the early phase, the situation began to change somewhat. Between 1906 and 1918 the Japanese expanded and upgraded their common schools in that fashion but “under pressure from Taiwanese for more and better education, and in part influenced by the labor demands of the island’s economy, the Japanese authorities revamped the educational system in 1919 into a single, coordinated system. Under this system all children were to attend a common school for six years, and thereafter tracked into a variety of schools … The new system emphasized, in addition to the common educational experience for all children under the age of twelve, postprimary vocational training. Japanese was the medium of instruction and in time classical Chinese was dropped from the common schools. Assimilation was the goal. Separate schools, at all levels, were maintained for the Japanese residents on the island.” (Weiner, p. 166)
This system slowly but surely produced results and by 1943, 65.7 percent of school age children were attending elementary school, when the government introduced compulsory elementary education. The following year 71 percent of Taiwanese children were in school. When Taiwan was returned to China in 1945 the government revamped the educational system replacing Japanese with Mandarin as the official language. The six year compulsory education was replaced in 1968 with free compulsory education for nine years, but the strong emphasis of the Japanese on vocational subjects for postprimary and other select professional subjects continued. “The Japanese legacy to the newly independent government was one of the most developed elementary- school systems to be found in former colonial countries.” (op. cit., p. 167).

Education for Development: India and East Asia 41
With the Nationalist Government in power from 1949 the character of the island changed considerably and the new leadership considered education as critical to their development model. By 1980 all 6-12 year olds were in school, 90 percent of the 12-15 age group and 26 percent of the 18-22 year olds went to senior high school or a senior vocational school. Starting from an already high literacy rate of 66 percent in the 1950s, Taiwan’s literacy rate rose to 91 percent by the mid-1980s. All this had a tremendous effect on output, productivity and prosperity in the country, though it is difficult to find any good estimates of the contribution of a literate working class on these parameters. Surely many factors may have contributed, though such miraculous leaps have not been observed frequently in history. Weiner (op. cit., p. 167) speculates: “These developments were surely facilitated by the presence of a population with at least six years, and by the late 1960s nine years, of schooling.” The Taiwanese case should be seen in conjunction with the South Korean case with which it shared many common features of history.
6. The South Korean Experience
When Japan took over Korea in 1910 its education system was elitist; the educated were highly revered and it was a route to bureaucracy and political power. In a population of 20 million only 110,000 attended school and thus literacy levels were low. The system was based on the Chinese Confucian principles. The Japanese did not eliminate the traditional Confusian schools but created two new parallel systems of secular public education - one for the Japanese immigrants to Korea, the other for Koreans, but they imported Japanese teachers and introduced the Japanese language in place of Korean as the medium of instruction. School education expanded at a reasonable pace to about 1.8 million children in 1941, which was about one in three children despite the system providing free textbooks and lunches. A lot of parents preferred to send their children to private primary schools many of which were run by Catholic and Protestant missionaries, where Korean remained the medium of instructions though the authorities insisted that Japanese language be taught in them. The Korean youth remained committed to national consciousness irrespective of their
42 2010 CRES Visiting Scholar’s Paper Series
school affiliation, and they remained opposed to being assimilated into Japanese culture and ethos. The Japanese in turn did not look upon the Koreans with great admiration, unlike what they did in Taiwan.
When Korea was divided after independence at the end of World War II and then the Korean War of 1950-53, South Korea had 21 million people predominantly in farming and fishing (with industries in the North); but it quickly became a highly industrialized country alongside high productivity in agriculture, and was termed a miracle economy with phenomenal growth in per capita income. Besides other factors, education has been of paramount importance to the success story of South Korea in its economic and social development. Education in South Korea expanded at an unprecedented pace visualized unmistakably as instrument of development. From 1955 to 1970 the emphasis in South Korea was on quantitative expansion of primary schools and after 1965 greater attention was given to increasing the number of junior and senior secondary schools. At the beginning of 1980s, almost all its elementary school-age children were in school, from 5 million in 1960 to 11 million, accounting for all the children that entered the age cohort in its population. Compulsory education was extended to nine years of schooling. South Korea reached 93 percent literacy rate by 1981 with only a remainder of older cohorts of the population with no formal education. That is magnificent achievement by any measure of success!
Economists have argued about factors contributing to this miracle, ranging from trade and industrial policies, exchange rate regimes, savings and investment flows, etc., but the significant contribution of the highly literate labour force using modern methods has been largely ignored in the literature. “South Korea’s remarkable economic growth that started in the early 1960s - was accompanied by, and to a considerable extent facilitated by, an expanding educational system.”21) We shall return briefly to this theme in the context of assessing East Asian economic and social success stories in contemporary endogenous growth theory.
21) Weiner (1991), p. 171.
Education for Development: India and East Asia 43
7. The Indian Experience
The paramount importance of education in economic development is by now well recognized in the new growth theory in economics, which underlies growth of productivity through education, training, and skill formation. However, policy interventions to make this effective have not been in consonance with the emerging theory as well as experience. The enduring contribution of education in economic development has not been leveraged in India as it has been in several other countries and particularly in East Asia, including China and South Korea in recent decades.
In India the British masters introduced modern education, at first for the elite and subsequently for select natives, but the system had very different tracks for the two. In India as in many other countries in Asia, (Christian) missionaries were also significantly present in education for quite sometime. Initially, education for the limited masses was for the administration of colonial power and for training and vocational needs of the limited industries that prevailed in the colonies. Almost the entire rural and agricultural workers and most of the urban support were drawn from masses that had little or no exposure to education. For British India, in Lord Macaulay’s vision the rulers wished to create a class of persons “Indian in blood and colour, but English in taste, in opinions, in morals, and in intellect”, in addition to the handful of British masters resident in India. It was much like the Japanese conceptualisation of Korean and Taiwanese elites of a later era that we had the occasion to review above. Indeed emerging research on the history of Bengal Renaissance (reawakening) of the mid-nineteenth century India questions this very assumption, ascribing this arguably to false consciousness (Macaulaysque in character) and not native in origin; and quite unlike the European Renaissance originating in fourteenth-fifteenth century Italy referred to at the beginning of the paper. Thus education for the ordinary citizens was not state sponsored at all though what had been achieved was more due to the evangelical pursuits of then active Missionaries in India. And there was no question of vocational education being choreographed by the British Empire in India. That was to a limited extent provided by the Missionaries as an extension of elementary education for some. As in elite education, science,
44 2010 CRES Visiting Scholar’s Paper Series
engineering and medical education for Indians had to be received in the prestigious British institutions, in London, Cambridge, Oxford and elsewhere.
The progress in education in India has been more moderate in contrast with East Asian countries However, it must be admitted that the problems encountered in a country like India, of continental dimensions along with its diversity of languages, cultures and other parameters, are far more complex than these countries with the possible exception of the daunting task that China successfully completed. At the beginning of this period (1951) the literacy rate in India as a whole was 18 percent,22) with male literacy at 27 and female literacy at 9 percent (for those above 5 years). Indeed functional literacy increased considerably in India to reach 67 percent in 2004-05 (for 7 years and above) with 77 percent for males and 57 percent for females, but they were not impressive enough by East Asian standards. As for gross enrolment ratios (GER) at the elementary level (6-14 years age cohort) it was 32 in the year 1950-51 and reached an impressive figure of 94 percent in 2004-05. India has just enacted the Right to Education as a Fundamental Right for all its citizens, but it has miles to go before all 6-14 year old children are put in school. However, at last the Indian central and state governments are moving in on this paramount agenda of development. A brief outline of these developments is given below. By its very nature this paper will neither touch upon all major issues nor will it cover the available data on India in diverse sources comprehensively.23)
Sarva Shiksha Abhijan (SSA) is now Government of India's flagship programme for achievement of Universalization of Elementary Education (UEE) in a time bound manner. It is being implemented in partnership with State Governments to cover the entire country and address the needs of 192 million children in 1.1 million habitations. The programme seeks to open new schools in those habitations which do not have schooling facilities and strengthen existing school
22) This was comparable with the legacy that China faced on illiteracy around the time that Mao Zedong made his statement on 1 October at the Gate of Heavenly Peace.
23) For a comprehensive coverage of issues relating to various aspects of education in India and the related data see Mukhopadhyay and Parhar (2007).

Education for Development: India and East Asia 45
infrastructure through provision of additional class rooms, toilets, drinking water, maintenance grants and school improvement grants. It has a special focus on girl's education and children with special needs. In other words, as the name connotes it would cover all children supposedly in the manner of a mission. Education is a Fundamental Right in India now. As per the education Minister’s statement on 17 May 2010, Government is aiming to have 100 percent literacy by 2020. The minister has observed that 'nearly 70 percent of the workforce does not even have primary education’. The challenges therefore are huge, for providing formal schooling till elementary level, adult education and training programmes. It should be noted that ‘adult education’ which is a corner-stone of all successful literacy missions is an essential part of the universalisation goal but it has not received adequate attention in India despite all rhetoric in independent and pre- independent India.
Though there are differences across the country, getting children to school at the aggregative level is not a serious issue now; sustaining them in school is bigger issue in most regions still - the high dropout rate and increasing as we go up the grades. However, the gender gap in admissions and retentions have narrowed considerably. There are however deprived groups, which still face challenges. This may need a little elaboration. India is more stratified than other societies; traditionally there are major varna divisions, like Brahmins or Sudras within which individuals were born to specific castes or sub-castes; there was no mobility between them; education was infractuous to lower orders. Our caste system hangover continues. The Constitution of India banned discrimination by caste and creed, and provided for affirmative actions in education and employment for mainstreaming the deprived to climb back. The most backward are Dalits categorised as scheduled castes (SCs). The scheduled tribes (STs) are outside the pall of caste system but are more deprived, not even deserving of a caste order and pushed outside main areas of cultural habitations. They live mostly in forests and hills and on mineral deposits.
Children’s attendance in school, as observed on a random day in the school year, varies considerably across states. There are states like Bihar where less than 60% of enrolled children are attending in comparison to southern states where average attendance is well above 90%. Some of these are connected with supply side issues such
46 2010 CRES Visiting Scholar’s Paper Series
as infrastructure and provisions for schools. A fairly good number of schools, both in rural (11.04 percent) and urban areas (3.84 percent), had only one teacher in 2007-08. Water is available in 75% of government primary schools and 81% of upper primary schools. Usable toilets can be found in over 50% of government schools. Four out of ten government primary schools do not have separate toilets for girls. This number is lower for upper primary schools at 26%. The situation is changing rapidly, both on account of increased provisions by government and there is much dynamism on demand for education at the grassroots level.24)
In absolute numbers India has progressed impressively in professional, technical and vocational education since independence and it is now possible to get highest professional degrees in high performing institutions in the country. To give a feel for the orders of magnitude, enrolment in the year 1971 in engineering, technology and architecture institutions stood at 93 (all in ‘000 units), in medicines it was 91 and agriculture/forestry 25, but by the year 2002 these had reached levels of 692 (‘000 units) in engineering/tech/ architecture, 301 in medicines, and 55 in agriculture and forestry.
India set up some of the finest technical and professional institutions (IITs, IIMs, CSIR labs etc.) in collaboration with European and American institutions to serve its modern industries, initially set up mostly in the public sector, and these graduates were to serve what Prime Minister Nehru described as ‘temples of modern India’. These public sector enterprises were to play an important role in the import- substitution industrialization that India followed, though that did not turn out very successfully. However, these graduates mostly worked elsewhere and migrated to greener pastures abroad. In time opportunities opened up manifold in the private corporate sector as the Indian economy was opened up both domestically and globally, and recently in the technology intensive sectors of industry. The burgeoning demand for these personnel was met by a mushrooming growth of private educational institutions, though many of their professional credentials are suspect. The Indian state is brainstorming on the desired policy regime on this also. There is considerable scope for learning from East
24) For a recent account of how many of these changes are taking place among the most backward states and region of India, see Shovan Ray (2010).
Education for Development: India and East Asia 47
Asian experiences on these aspects. There are issues of infrastructure, funding, investment, foreign collaboration, partnerships with the private sector, teacher and professional training, pedagogy, the policy environment, and a host of other issues across disciplines.
In developed countries, the percentage of children moving into the university system between the age group of 18 - 24 years is above 40 and in some parts of the developed nations the figure is 53. In India the figure is 12.4 percent against the global average of 23. According to Kapil Sibal, India’s education Minister, India will need at least 800 more universities and another 35,000 colleges in the next ten years to increase the percentage of students going for higher education from the present 12.4 percent to 30 percent in the country (by 2020). In the allocation for higher and technical education, Rs.307 billion had been set apart for new initiatives - 16 central universities, 14 world-class universities, 370 colleges, eight Indian Institutes of Technology, seven Indian Institutes of Management, and 10 National Institutes of Technology, besides others (Eleventh Five Year Plan, 2007-12).
8. Contributions to Endogenous Growth Theory and Human Development
A very important literature has now developed in economic growth theory based on education and skill formation of workers. In the conventional neoclassical economic theory, labour and capital and land (natural resources) are the main factors of production with inherent limitations of land, and thus growth and hence trade was explained by augmentation of these factors and their productivity growth. Ultimately, these faced their limits to growth and the law of diminishing marginal returns came to dictate the nature of growth, which happened in conventional growth models as well. However, the East Asian miracle starting with Japan seemed to defy these growth predictions. Japan first, followed by other East Asian economies, seemed to grow on a sustained basis and this was mainly attributed to their investment in education and skill formation of labour. They also defied the law of economic gravity irrespective of their political ideology and institutional and governance mechanisms, with People’s Republic of
48 2010 CRES Visiting Scholar’s Paper Series
China, Vietnam and others pitted against Japan, South Korea, Taiwan, Hong Kong, Singapore and others. And countries like Japan having very little natural resources and had very unfavourable population density on land, but despite those handicaps growth continued to take place when the region had been completely decolonized in the conventional sense. Thus growth was possible only by augmenting labour and capital with higher productivity through education and skill formation. East Asian growth experience also put considerable emphasis on social development alongside or sometimes ahead of economic growth.
Thus emerged the new theory of endogenous growth, and spawned an important literature in economics, which also encapsulated human development in its fold, in as much as human resources through education, healthcare and other measures help these processes. Bhattacharya (2008, p. 5) in his Presidential Lecture to the Indian Economic Association, besides underlining the above process at work in East Asian economies, has also noted social development in its stride: “The social development through improvement of education and health of masses might have also contributed to the egalitarian growth in most East Asian countries … The synergy between economic and social development not only improved productivity of labour and capital but also led to a balanced growth” and “the East Asian countries have much better income distribution than in the rest of the world, except perhaps in Scandinavian welfare states.”
India’s economic growth has been robust in the last one decade or more and this is substantially due to the robust growth in the services sector. Unlike most of East Asia which followed the classical Kuznets’ sectoral growth path charted out by the West, where agriculture gave way first to manufacturing industry with their industrialization, and then over time the services sector held sway over other sectors, the Indian growth story has been services sector leading all the way25) even before India could compete in the world market
25) According to Bhattacharya (2008, p. 6): “During the last three decades, services GDP in India increased on an average by about 10 percent a year.” He also feels that productivity differences between India and East Asia could be substantially explained by differences in diffusion of education and training to the masses. “Agriculture using least skilled workers is having the slowest growth among all
Education for Development: India and East Asia 49
for manufacturing. This advance into a post-industrial economy in a ‘premature’ leapfrog was substantially the result of certain sectors of India’s services sector that are growing quite fast, and these are essentially education, skill, and knowledge based sectors in which India’s well-educated and trained workers have propelled growth and also remained competitive in the world market. This is the contribution of the elite and higher education that India nurtured right at its inception, and has been growing substantially by a demand driven system, including that of English education.
However, it is very important that education should be taken to the mass level for this process to percolate down and broaden the growth momentum. This would then induce growth in the agriculture sector, which is stagnating, and to the manufacturing sector, where productivity, exports and employment should increase considerably to take India’s growth into double digits in a sustained manner. Quite apart from that India’s seriously lagging human development performance ought to increase with improved education of the masses. Besides increasing productivity (instrumental value of education), it will help improve the intrinsic and agency values of education for the masses.
9. Conclusions
The literature on mass literacy movements shows that it started in the mid-sixteenth century with Protestant Reformations in Germany, Sweden and Scotland, followed later by the Catholic Counter- Reformation. Since both ideology (motivational force) as well as technology are important to its success, it was fortuitous that the printing revolution brought in by Gutenberg was well established in Europe of that period. That helped the process enormously. This was also a very momentous time in the intellectual environment in Europe. The Renaissance in Europe had taken deep roots; Copernicus and
sectors. While there may be many reasons for the differential growths among sectors, the differences in the levels of education of workers employed could be a major reason explaining differential productivity and growth. It also could be the basic reason behind differential spread of technology.”
50 2010 CRES Visiting Scholar’s Paper Series
Galileo in sciences provided the foundation for Newtonian Physics and Astronomy. Shakespeare and other literary geniuses were round the corner and provided a great stimulus to the intectual environment. Henry VIII was about to secede from the Roman Catholic Church and establish the Church of England. The subsequent Catholic Counter- Reformation provided the competitive edge to the rapid spread of education in Europe, America and elsewhere in the colonies and areas of their influence. In Austria, Germany, United States, England, Scotland, Netherlands, Scandinavia, high literacy rates (upto 80 percent) were achieved in the eighteenth century even before establishment of compulsory education and state educational systems in these countries. In Catholic and Orthodox southern and eastern Europe less than 20 percent of the population could read, but this was to change subsequently.
The above period is separated from mass literacy campaigns of nineteenth century USA and in Tokugawa and Meiji Japan. Then followed the twentieth century political transformations in newly emerging socialist countries of USSR, China, Vietnam, Cuba, Nicaragua, etc. as a separate model under the ideological and cultural motivation of building a socialist and communist society and spreading prosperity and welfare to all. The motivations in these countries were very different from the first two groups, and perhaps to some extent the zeal and speed of mass literacy campaigns. Then the models of educational development and mass literacy campaigns in the newly independent countries such as India, South Korea, Taiwan, Tanzania, etc., followed. These were motivated by a separate developmental perspective and subsequently the motivation for empowerment of men and women came to underline these campaigns. The most eloquent international statement on the goals of literacy was the Unesco- inspired 1975 Declaration of Persepolis (Iran): literacy … [is] not just the process of learning the skills of reading, writing, and arithmetic, but a contribution to the liberation of man and to his full development. Thus conceived, literacy creates the conditions for the acquisition of a critical consciousness of the contradictions of society in which man lives and of its aims; it also stimulates initiative and his participation in the creation of projects capable of acting upon the world, of transforming it, and of defining the aims of an authentic human development.
In all these instances in history, literacy campaigns have been
Education for Development: India and East Asia 51
triggered by major transformations in social structures and belief systems. The major distinguishing feature of the twentieth century campaigns from earlier educational movements, which spanned over two hundred years, is the ‘telescoped period of time’ in which the mobilization occurred. This was true of both the socialist country models and literacy campaigns of post-colonial societies. Both historically and comparatively, literacy movements have used both elements of compulsion and social pressure to propagate a particular doctrine and used them effectively for their objective. And in all these instances we found that both political power and motivation combined with the available technology helped enormously in achieving their goals. It is also true that most of the successful cases of mass literacy campaigns were sphere headed and frequently also orchestrated by some charismatic leaders of the masses. Perhaps the lack of such deep ideological motivations and the lack of a charismatic leader explain the relative lack of success in countries like India.
References
Arnove, Robert F. and Harvey J. Graff. 1987. “Introduction.” In Arnove and Graff .
Arnove, Robert F. and Harvey J. Graff eds. 1987. National Literacy Campaigns: Historical and Comparative Perspectives. New York and London: Plenum Press.
Eklof, Ben. 1987. “Russian Literacy Campaigns 1861-1939.” In Arnove and Graff .
Bhola, H. S. 1984a. “The Literacy Campaign in the Union of Soviet Socialist Republics, 1919-39.” In Bhola.
. 1984b. “The Anti-Illiteracy Campaigns in the People’s Republic of China: from the 1950s to the 1980s.” In Bhola.
. 1984c. Campaigning for Literacy: Eight National Experiences of the Twentieth Century, with a Memorandum to Decision Makers. Paris: UNESCO.
. 1987. “Adult Literacy for Development in India.” In Arnove and Graff .
Bhattacharya, B. B. 2008. “Education, Skill Formation and India’s Economic Development.” The Indian Economic Journal. Presidential
52 2010 CRES Visiting Scholar’s Paper Series
Lecture at the Indian Economic Association. (April-June)Boli John, Francisco O. Ramirez, and John W. Meyer. 1985.
“Explaining the Origins and Expansion of Mass Education.” Comparative Education Review, pp. 145-70. (May 29)
Cohen, Yehudi. 1970. “Schools and Civilisation States.” In J. Fischer ed. The Social Sciences and the Comparative Study of Educational Systems. Scranton, PA: International Textbook.
Graff, Harvey J. 1986. The Legacies of Literacy: Continuities and Contradictions in Western Societies and Culture. Bloomington: Indiana University Press.
Hawkins, John N. 1983. “The People’s Republic of China (Mainland China).” In Thomas and Postlethwaite.
Hayford, Charles W. 1987. “Literacy Movements in Modern China.” In Arnove and Graff.
Mukhopadhyay, Marmar and Madhu Parhar eds. 2007. Education in India: Dynamics of Development. Delhi: Shipra Publications.
Randall, Collins. 1977. “Some Comparative Principles of Educational Stratification.” Harvard Educational Review, 47, pp. 1-27. (February)
Ray, Shovan. 2010. Backwaters of Development: Six Deprived States of India. New Delhi: Oxford University Press.
Thomas, R. Murray. 1983. “Part I: The Case of Japan - A Prologue.” In Thomas and Postlethwaite.
Thomas, R. Murray and T. Neville Postlethwaite eds. 1983. Schooling in East Asia: Forces of Change. Oxford: Pergamon Press.
Weiner, Myron 1991. The Child and the State in India. New Delhi: Oxford University Press.
Free Trade Agreement between Korea and
Turkey: Challenges, Opportunities and
Economic Cooperation
Mahmut Tekce
1. Introduction
Turkey and Korea have started formal negotiations for a free trade agreement (FTA) in April 2010. The agreement, which will include bilateral trade liberalization in goods and services, removal of barriers to investment along with cooperation in legal and institutional issues like trade remedies, intellectual property rights and competition, is expected to be concluded by the end of 2010.
This FTA may look like a natural result of long-established economic, social and political relations between Korea and Turkey. However, that the main impetus for the launch of the negotiations was the result of the FTA between Korea and the EU, which was launched in 2007 and initialed on October 15, 2009. The Korea-EU FTA included a joint declaration on Turkey, called the “Turkey Clause”, which declared that Korea and Turkey would start negotiating an FTA based on the result of a joint feasibility study.
Turkey, a candidate country for full membership since December 1999, has been engaged in accession negotiations since December 2004, and has also been part of the Customs Union with the EU since 1996.1) With the Customs Union agreement, Turkey had adopted a common external tariff structure with the EU and consequently any change in the EU’s tariffs with third countries will affect Turkey directly. As stated in the Turkey clause, “Turkey has the obligations
1) Turkey-EU Customs Union does not include most agricultural products and services trade.
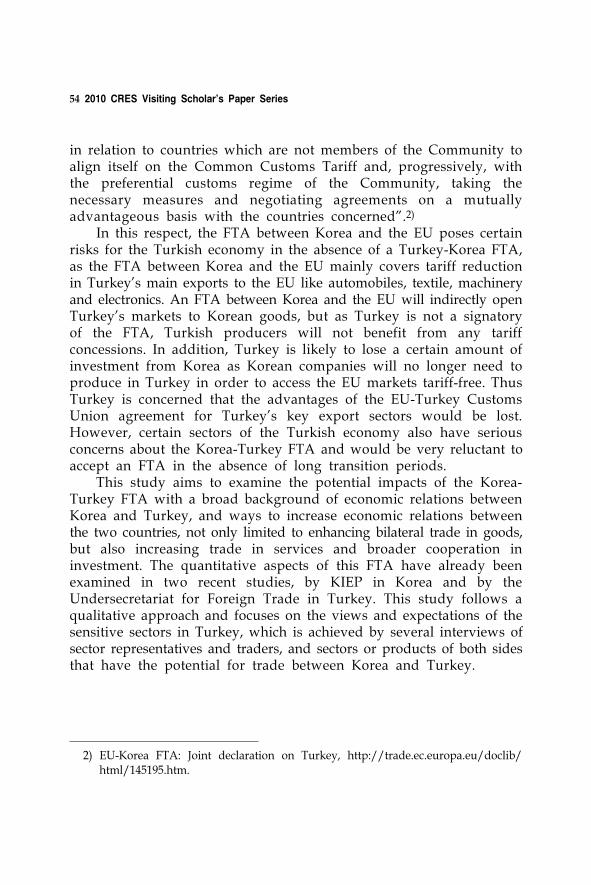
54 2010 CRES Visiting Scholar’s Paper Series
in relation to countries which are not members of the Community to align itself on the Common Customs Tariff and, progressively, with the preferential customs regime of the Community, taking the necessary measures and negotiating agreements on a mutually advantageous basis with the countries concerned”.2)
In this respect, the FTA between Korea and the EU poses certain risks for the Turkish economy in the absence of a Turkey-Korea FTA, as the FTA between Korea and the EU mainly covers tariff reduction in Turkey’s main exports to the EU like automobiles, textile, machinery and electronics. An FTA between Korea and the EU will indirectly open Turkey’s markets to Korean goods, but as Turkey is not a signatory of the FTA, Turkish producers will not benefit from any tariff concessions. In addition, Turkey is likely to lose a certain amount of investment from Korea as Korean companies will no longer need to produce in Turkey in order to access the EU markets tariff-free. Thus Turkey is concerned that the advantages of the EU-Turkey Customs Union agreement for Turkey’s key export sectors would be lost. However, certain sectors of the Turkish economy also have serious concerns about the Korea-Turkey FTA and would be very reluctant to accept an FTA in the absence of long transition periods.
This study aims to examine the potential impacts of the Korea- Turkey FTA with a broad background of economic relations between Korea and Turkey, and ways to increase economic relations between the two countries, not only limited to enhancing bilateral trade in goods, but also increasing trade in services and broader cooperation in investment. The quantitative aspects of this FTA have already been examined in two recent studies, by KIEP in Korea and by the Undersecretariat for Foreign Trade in Turkey. This study follows a qualitative approach and focuses on the views and expectations of the sensitive sectors in Turkey, which is achieved by several interviews of sector representatives and traders, and sectors or products of both sides that have the potential for trade between Korea and Turkey.
2) EU-Korea FTA: Joint declaration on Turkey, http://trade.ec.europa.eu/doclib/ html/145195.htm.

Free Trade Agreement between Korea and Turkey: Challenges, Opportunities and Economic Cooperation 55
2. Economic Relations between Korea and Turkey
2.1. Overview of Korea-Turkey Trade
The relations between Korea and Turkey date back to 1950, when Turkey sent troops to fight in the Korean War. This led to the formation of close ties between the peoples of two countries, with both Turks and Koreans being considered special guests when they visited each other’s countries. This close relationship has been reinforced by the rising volume of bilateral trade, increasing investment and by cultural and sports activities.
However, despite this exclusive interest on both sides, trade and investment have been lower than the expected potential. In this sense, the prospective FTA between Korea and Turkey is expected to go beyond a trade agreement and vitalize potential economic and social linkages. Trade between Turkey and Korea was at very low levels before the 1990s, where the ten-year average value of exports of Turkey to Korea was only $6 million in the 1970s and $10 million in the 1980s. On the other hand, the average value of imports of Turkey from Korea was $13.5 million in the 1970s and $42 million in the 1980s. In the 1990s, trade volume between Turkey and Korea surged; Turkey’s exports to Korea fluctuated around $120 million, whereas Turkey’s imports from Korea exceeded $300 million in 1990 and $1 billion in 1997. In the 2000s, Turkey’s exports to Korea fluctuated wildly; falling to around $50 million in 2002 and 2003, then rising to $155 million in 2005 and to $235 million in 2009; whereas Turkey’s imports from Korea increased constantly despite a short-term downfall in the early 2000s, from around $1 billion to $4 billion in 2008, and then, as a result of the global crisis, fell to $3.1 billion in 2009.3)
3) Trade values extracted from the UN COMTRADE database, http://comtrade. un.org/db.
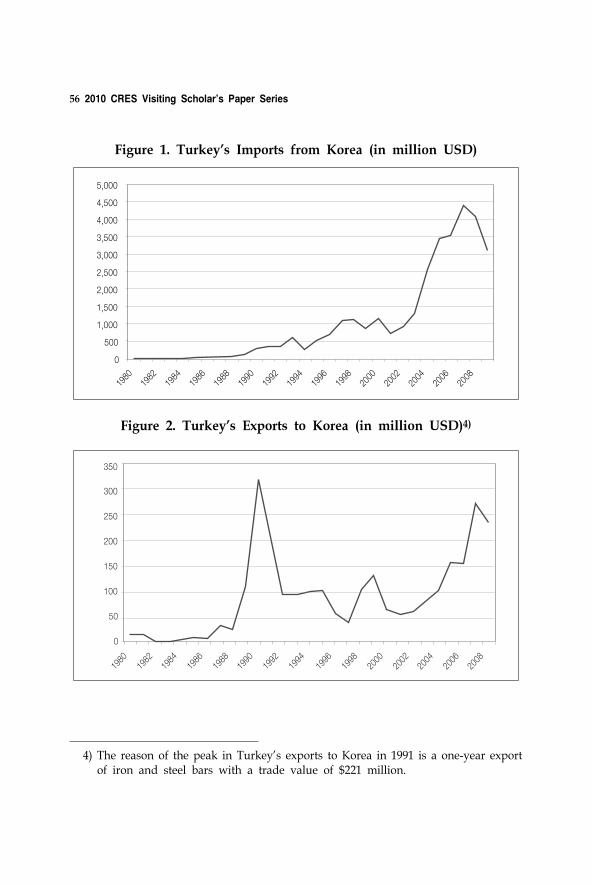
56 2010 CRES Visiting Scholar’s Paper Series
5,000
4,500
4,000
3,500
3,000
2,500
2,000
1,500
1,000
500
0
1980
1982
1984
1986
1988
1990
1992
1994
1996
1998
2000
2002
2004
2006
2008
Figure 2. Turkey's Exports to Korea (in million USD)4)
300
350
250
200
150
100
50
0
1980
1982
1984
1986
1988
1990
1992
1994
1996
1998
2000
2002
2004
2006
2008
Figure 1. Turkey's Imports from Korea (in million USD)
4) The reason of the peak in Turkey’s exports to Korea in 1991 is a one-year export of iron and steel bars with a trade value of $221 million.

Free Trade Agreement between Korea and Turkey: Challenges, Opportunities and Economic Cooperation 57
0
500
1,000
1,500
2,000
2,500
3,000
3,500
4,000
4,500
1980
1982
1984
1986
1988
1990
1992
1994
1996
1998
2000
2002
2004
2006
2008
Figure 3. Korea's Trade Surplus in its Trade with Turkey (in milion USD)
For Korean exporters, Turkey has been a stable market in the last decade. Turkey’s imports from Korea of several goods, especially motor vehicles for the transport of persons and goods, automobile parts, television receivers, mobile phones and synthetic textile yarns have increased almost constantly since 2000. Turkey, on the other hand is still in the process of forming a stable export market for its products in Korea. If we examine what Turkey exported to Korea in the last decade, we face an unstable list of products. The table below shows Turkey’s top ten exports to Korea at the four-digit SITC Rev. 3 level; for 2000, 2005, 2008 and 2009. The only products that appear in the list at all (or almost all) years since 2000 are tobacco, mollusks, marbles, parts of certain machines and medicaments. It is interesting that, some products that were important export items in the early 2000s have lost their importance over time. For example, Turkey’s exports of prepared and preserved vegetables to Korea was more than $4.5 million in 2000, but the figure fell to around $800,000 after 2004, and finally became $570,000 in 2009. On the other hand, some products, like liquefied petroleum gases, iron and steel bars, sunflower oil and wheat flour; products that were not exported to Korea before the late 2000s, appear to have become important export items in recent years.
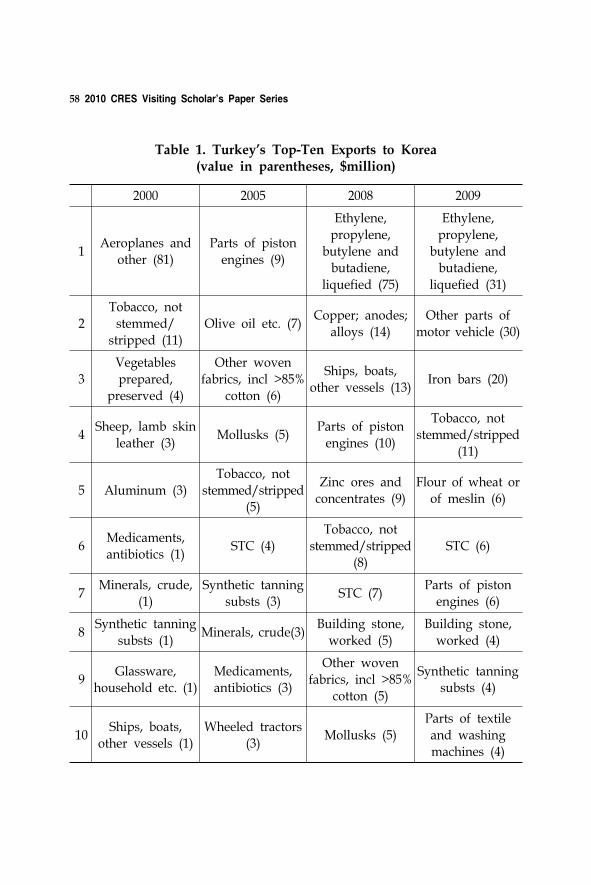
58 2010 CRES Visiting Scholar’s Paper Series
2000 2005 2008 2009
1Aeroplanes and
other (81)Parts of piston
engines (9)
Ethylene,
propylene, butylene and
butadiene,
liquefied (75)
Ethylene,
propylene, butylene and
butadiene,
liquefied (31)
2Tobacco, not
stemmed/stripped (11)
Olive oil etc. (7)Copper; anodes;
alloys (14)Other parts of
motor vehicle (30)
3
Vegetables
prepared, preserved (4)
Other woven
fabrics, incl >85% cotton (6)
Ships, boats, other vessels (13)
Iron bars (20)
4Sheep, lamb skin
leather (3)Mollusks (5)
Parts of piston
engines (10)
Tobacco, not stemmed/stripped
(11)
5 Aluminum (3)Tobacco, not
stemmed/stripped (5)
Zinc ores and concentrates (9)
Flour of wheat or of meslin (6)
6Medicaments, antibiotics (1)
STC (4)
Tobacco, not
stemmed/stripped (8)
STC (6)
7Minerals, crude,
(1)Synthetic tanning
substs (3)STC (7)
Parts of piston engines (6)
8Synthetic tanning
substs (1)Minerals, crude(3)
Building stone,
worked (5)
Building stone,
worked (4)
9Glassware,
household etc. (1)Medicaments, antibiotics (3)
Other woven fabrics, incl >85%
cotton (5)
Synthetic tanning substs (4)
10Ships, boats,
other vessels (1)Wheeled tractors
(3)Mollusks (5)
Parts of textile
and washing machines (4)
Table 1. Turkey's Top-Ten Exports to Korea (value in parentheses, $million)
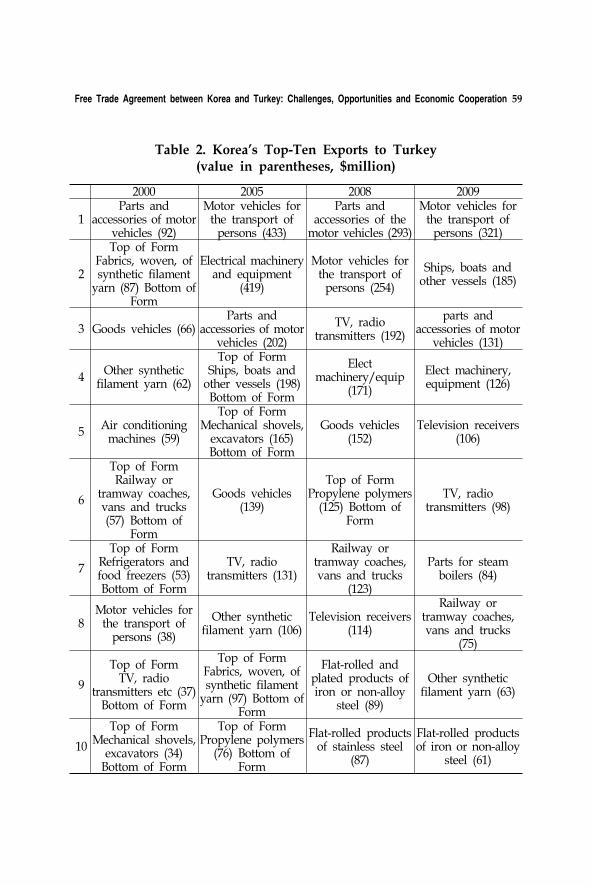
Free Trade Agreement between Korea and Turkey: Challenges, Opportunities and Economic Cooperation 59
2000 2005 2008 2009
1Parts and
accessories of motor vehicles (92)
Motor vehicles for the transport of
persons (433)
Parts and accessories of the
motor vehicles (293)
Motor vehicles for the transport of
persons (321)
2
Top of FormFabrics, woven, of synthetic filament
yarn (87) Bottom of Form
Electrical machinery and equipment
(419)
Motor vehicles for the transport of
persons (254)
Ships, boats and other vessels (185)
3 Goods vehicles (66)Parts and
accessories of motor vehicles (202)
TV, radio transmitters (192)
parts and accessories of motor
vehicles (131)
4Other synthetic
filament yarn (62)
Top of FormShips, boats and
other vessels (198) Bottom of Form
Elect machinery/equip
(171)
Elect machinery, equipment (126)
5Air conditioning
machines (59)
Top of FormMechanical shovels,
excavators (165) Bottom of Form
Goods vehicles (152)
Television receivers (106)
6
Top of FormRailway or
tramway coaches, vans and trucks (57) Bottom of
Form
Goods vehicles (139)
Top of FormPropylene polymers
(125) Bottom of Form
TV, radio transmitters (98)
7
Top of FormRefrigerators and food freezers (53) Bottom of Form
TV, radio transmitters (131)
Railway or tramway coaches, vans and trucks
(123)
Parts for steam boilers (84)
8Motor vehicles for
the transport of persons (38)
Other synthetic filament yarn (106)
Television receivers (114)
Railway or tramway coaches, vans and trucks
(75)
9
Top of FormTV, radio
transmitters etc (37) Bottom of Form
Top of FormFabrics, woven, of synthetic filament
yarn (97) Bottom of Form
Flat-rolled and plated products of iron or non-alloy
steel (89)
Other synthetic filament yarn (63)
10
Top of FormMechanical shovels,
excavators (34) Bottom of Form
Top of FormPropylene polymers
(76) Bottom of Form
Flat-rolled products of stainless steel
(87)
Flat-rolled products of iron or non-alloy
steel (61)
Table 2. Korea's Top-Ten Exports to Turkey (value in parentheses, $million)
60 2010 CRES Visiting Scholar’s Paper Series
Some trade products between Korea and Turkey need further examination. As stated above, Turkey’s exports to Korea are not only at low levels, but also unstable in terms of exported products. For Korea, Turkey has been an important market for motor vehicles, automobile parts, electronic equipments, iron and steel, television receivers and textile products especially in the last decade. In this study, Korean exports of these products to Turkey will be examined thoroughly.
2.2. Turkey’s Imports of Motor vehicles and their parts and accessories from Korea
Turkey’s imports of automobiles5) from Korea since 1990 are shown in the following graph. Between 1990 and 1996, the average value of Turkey’s automobile imports from Korea was around $24 million. The value was low, however, and Turkey’s automobile imports were also low in the 1990s; around 5.8% of Turkey’s imported cars were from Korea in the first half of the 1990s. Turkey’s imports of automobiles surged after 1996, tripling from $327 million to $1 billion. However, the share of Korean cars in imported automobiles fell sharply to less than 2% after 1997. This was not surprising, as Hyundai started producing automobiles in Turkey in 1997, and the consumers of Korean cars shifted from imported Korean automobiles to domestically produced Hyundai cars. Between 1998 and 2004, the average value of automobile imports from Korea was around $26 million. The situation would change after 2003; Turkey’s automobile imports almost doubled in 2004, where the value of imported Korean cars increased by more than eight times, from $40 million to $334 million. In 2005, the value reached record levels, $433 million, or 10% of Turkey’s total automobile imports for that year. Since 2004, Turkey imported, on average, $330 million worth of motor vehicles for personal transport, which is around 7.5% of Turkey’s total automobile imports.
5) Motor vehicles for the transport of persons (HS code 8703).
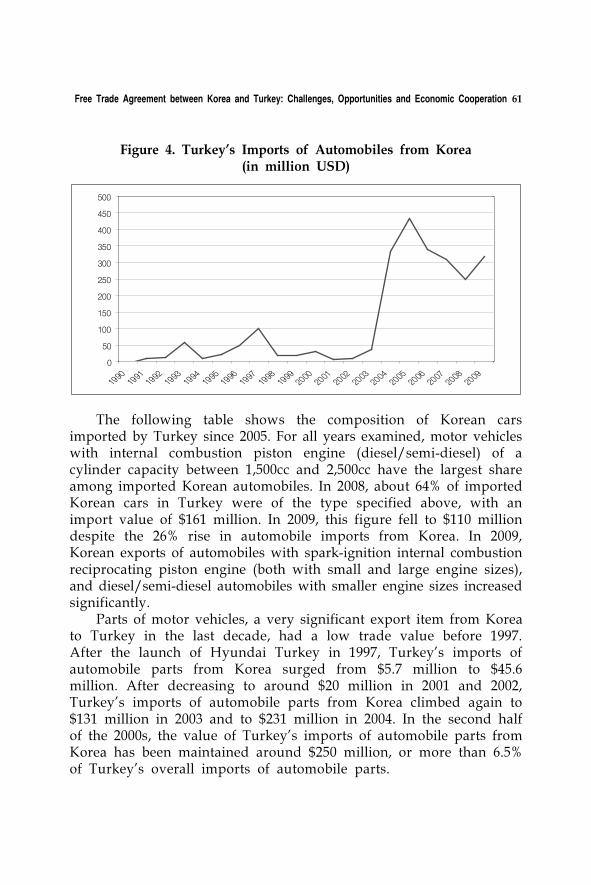
Free Trade Agreement between Korea and Turkey: Challenges, Opportunities and Economic Cooperation 61
0
50
100
150
200
250
300
350
400
450
500
1990
1991
1992
1993
1994
1995
1996
1997
1998
1999
2000
2001
2002
2003
2004
2005
2006
2007
2008
2009
Figure 4. Turkey's Imports of Automobiles from Korea (in million USD)
The following table shows the composition of Korean cars
imported by Turkey since 2005. For all years examined, motor vehicles with internal combustion piston engine (diesel/semi-diesel) of a cylinder capacity between 1,500cc and 2,500cc have the largest share among imported Korean automobiles. In 2008, about 64% of imported Korean cars in Turkey were of the type specified above, with an import value of $161 million. In 2009, this figure fell to $110 million despite the 26% rise in automobile imports from Korea. In 2009, Korean exports of automobiles with spark-ignition internal combustion reciprocating piston engine (both with small and large engine sizes), and diesel/semi-diesel automobiles with smaller engine sizes increased significantly.
Parts of motor vehicles, a very significant export item from Korea to Turkey in the last decade, had a low trade value before 1997. After the launch of Hyundai Turkey in 1997, Turkey’s imports of automobile parts from Korea surged from $5.7 million to $45.6 million. After decreasing to around $20 million in 2001 and 2002, Turkey’s imports of automobile parts from Korea climbed again to $131 million in 2003 and to $231 million in 2004. In the second half of the 2000s, the value of Turkey’s imports of automobile parts from Korea has been maintained around $250 million, or more than 6.5% of Turkey’s overall imports of automobile parts.
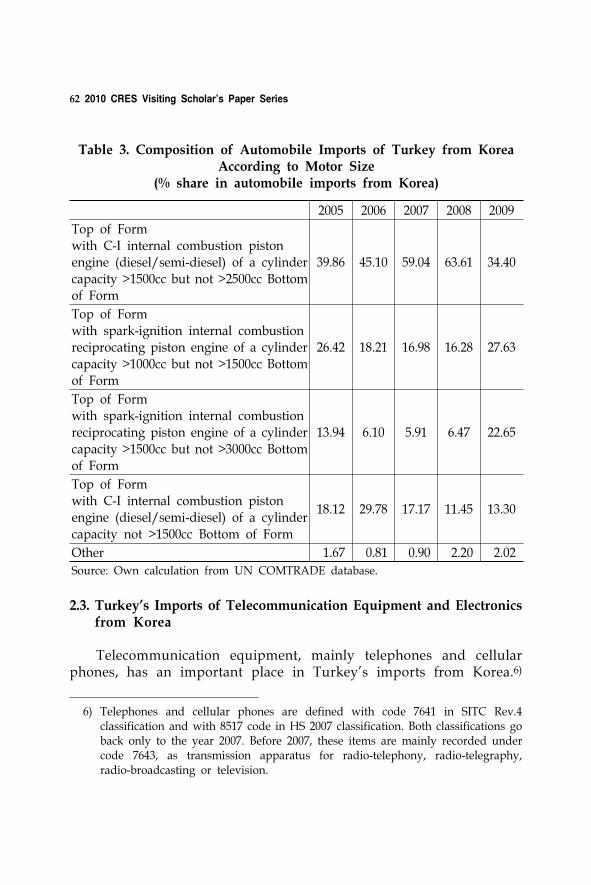
62 2010 CRES Visiting Scholar’s Paper Series
2005 2006 2007 2008 2009
Top of Formwith C-I internal combustion piston engine (diesel/semi-diesel) of a cylinder
capacity >1500cc but not >2500cc Bottom of Form
39.86 45.10 59.04 63.61 34.40
Top of Formwith spark-ignition internal combustion reciprocating piston engine of a cylinder
capacity >1000cc but not >1500cc Bottom of Form
26.42 18.21 16.98 16.28 27.63
Top of Formwith spark-ignition internal combustion reciprocating piston engine of a cylinder
capacity >1500cc but not >3000cc Bottom of Form
13.94 6.10 5.91 6.47 22.65
Top of Formwith C-I internal combustion piston engine (diesel/semi-diesel) of a cylinder
capacity not >1500cc Bottom of Form
18.12 29.78 17.17 11.45 13.30
Other 1.67 0.81 0.90 2.20 2.02
Source: Own calculation from UN COMTRADE database.
Table 3. Composition of Automobile Imports of Turkey from Korea According to Motor Size
(% share in automobile imports from Korea)
2.3. Turkey’s Imports of Telecommunication Equipment and Electronics from Korea
Telecommunication equipment, mainly telephones and cellular phones, has an important place in Turkey’s imports from Korea.6)
6) Telephones and cellular phones are defined with code 7641 in SITC Rev.4 classification and with 8517 code in HS 2007 classification. Both classifications go back only to the year 2007. Before 2007, these items are mainly recorded under code 7643, as transmission apparatus for radio-telephony, radio-telegraphy, radio-broadcasting or television.
Free Trade Agreement between Korea and Turkey: Challenges, Opportunities and Economic Cooperation 63
Turkey’s imports of telephone sets and cellular phones from Korea increased in 2006 and 2007, both in value and the share in total phone imports; around 16% of Turkey’s imported telephone sets and cellular phones were coming from Korea in those two years. However, the rise in China’s exports of these items to Turkey undermined Korea’s position and in 2009, Turkey’s imports of telephone sets and cellular phones from Korea fell to $107 million, or about 5% of Turkey’s overall imports of this item, where China increased its share from 29% in 2007 to 41% in 2009.
Another item in Turkey’s imports from Korea worth examining is televisions. In the early 1990s, Korean televisions represented a very significant share in Turkey’s imports, as leaders in imported TV market in 1990 and 1991. However, Korea lost its place to Japan, Germany, Spain and the Netherlands in Turkish TV markets and exported televisions on an average of $5 million in 1990s and the early 2000s. However, starting in 2004, especially with the rise in the consumption of LCD televisions, the value of Korean television exports increased rapidly from $11 million to $37 million in 2004, to $80 million in 2006 and to $114 million in 2008. The leadership in Turkey’s imported TV markets has shifted between China and Korea since 2004, but recently Slovakia has taken the lead with a 25% share. However, we should remember that this is actually due to the establishment of TV production plants by Samsung and Sony in Slovakia. Korean television producers (Samsung and LG) were the leaders in Turkish LCD television markets in 2009, with a total market share of 35.5%, surpassing global brands like Philips and Sony, and Turkish brands like Beko and Vestel.7)
2.4. Turkey’s Imports of Textile and Clothing from Korea
Textile and clothing sector has recently lost its importance in Korea’s trade when compared to the 1990s. Korea’s exports of clothing8) have fallen sharply since the early 1990s, from about $8 million to less than $2 million in 2008, where exports of textile yarns and fabrics9)
7) “Samsung ve LG, Vestel ve Beko’nun kabusu oldu” (Samsung and LG have become the nightmare of Vestel and Beko), Para magazine, March 12, 2010.
8) SITC code 84.
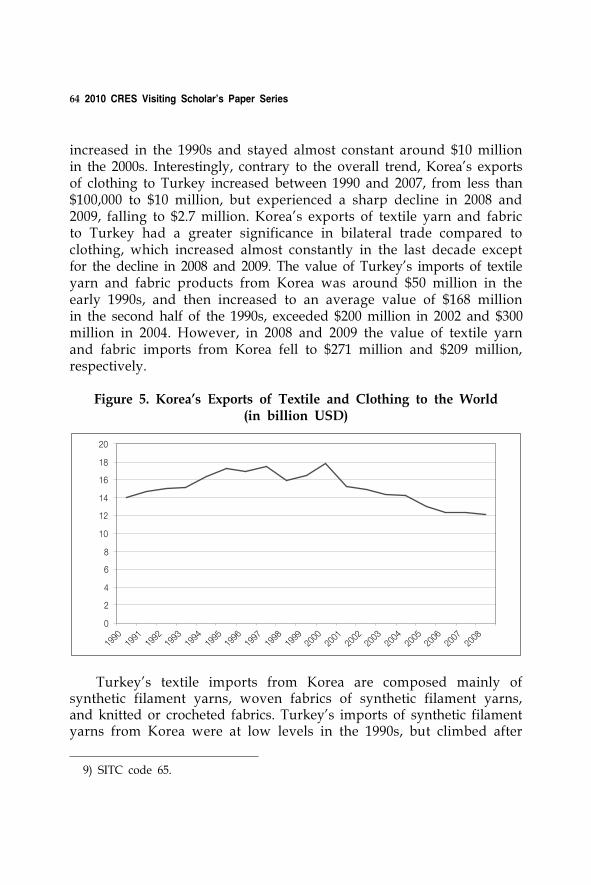
64 2010 CRES Visiting Scholar’s Paper Series
increased in the 1990s and stayed almost constant around $10 million in the 2000s. Interestingly, contrary to the overall trend, Korea’s exports of clothing to Turkey increased between 1990 and 2007, from less than $100,000 to $10 million, but experienced a sharp decline in 2008 and 2009, falling to $2.7 million. Korea’s exports of textile yarn and fabric to Turkey had a greater significance in bilateral trade compared to clothing, which increased almost constantly in the last decade except for the decline in 2008 and 2009. The value of Turkey’s imports of textile yarn and fabric products from Korea was around $50 million in the early 1990s, and then increased to an average value of $168 million in the second half of the 1990s, exceeded $200 million in 2002 and $300 million in 2004. However, in 2008 and 2009 the value of textile yarn and fabric imports from Korea fell to $271 million and $209 million, respectively.
0
2
4
6
8
10
12
14
16
18
20
1990
1991
1992
1993
1994
1995
1996
1997
1998
1999
2000
2001
2002
2003
2004
2005
2006
2007
2008
Figure 5. Korea's Exports of Textile and Clothing to the World (in billion USD)
Turkey’s textile imports from Korea are composed mainly of synthetic filament yarns, woven fabrics of synthetic filament yarns, and knitted or crocheted fabrics. Turkey’s imports of synthetic filament yarns from Korea were at low levels in the 1990s, but climbed after
9) SITC code 65.
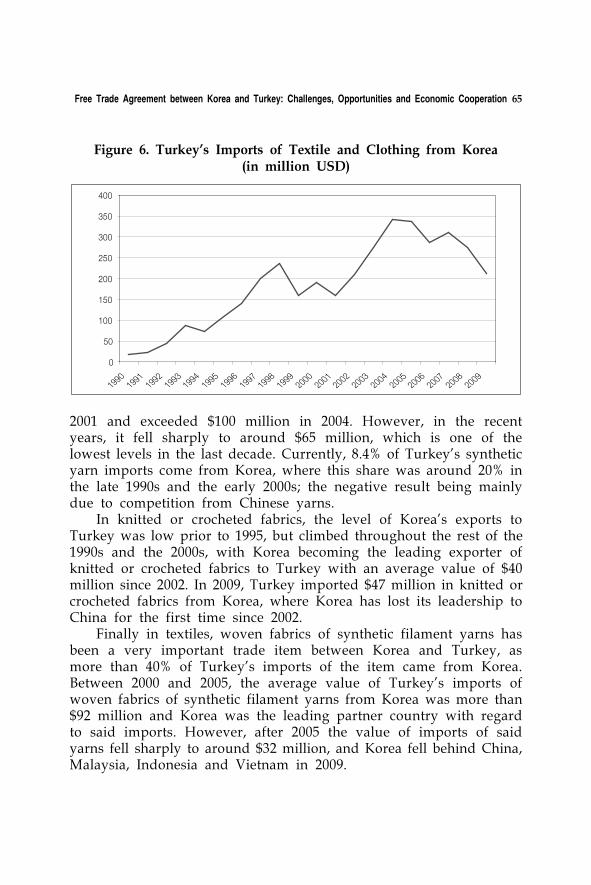
Free Trade Agreement between Korea and Turkey: Challenges, Opportunities and Economic Cooperation 65
0
50
100
150
200
250
300
350
400
19901991
19921993
19941995
19961997
19981999
20002001
20022003
20042005
20062007
20082009
Figure 6. Turkey's Imports of Textile and Clothing from Korea (in million USD)
2001 and exceeded $100 million in 2004. However, in the recent years, it fell sharply to around $65 million, which is one of the lowest levels in the last decade. Currently, 8.4% of Turkey’s synthetic yarn imports come from Korea, where this share was around 20% in the late 1990s and the early 2000s; the negative result being mainly due to competition from Chinese yarns.
In knitted or crocheted fabrics, the level of Korea’s exports to Turkey was low prior to 1995, but climbed throughout the rest of the 1990s and the 2000s, with Korea becoming the leading exporter of knitted or crocheted fabrics to Turkey with an average value of $40 million since 2002. In 2009, Turkey imported $47 million in knitted or crocheted fabrics from Korea, where Korea has lost its leadership to China for the first time since 2002.
Finally in textiles, woven fabrics of synthetic filament yarns has been a very important trade item between Korea and Turkey, as more than 40% of Turkey’s imports of the item came from Korea. Between 2000 and 2005, the average value of Turkey’s imports of woven fabrics of synthetic filament yarns from Korea was more than $92 million and Korea was the leading partner country with regard to said imports. However, after 2005 the value of imports of said yarns fell sharply to around $32 million, and Korea fell behind China, Malaysia, Indonesia and Vietnam in 2009.
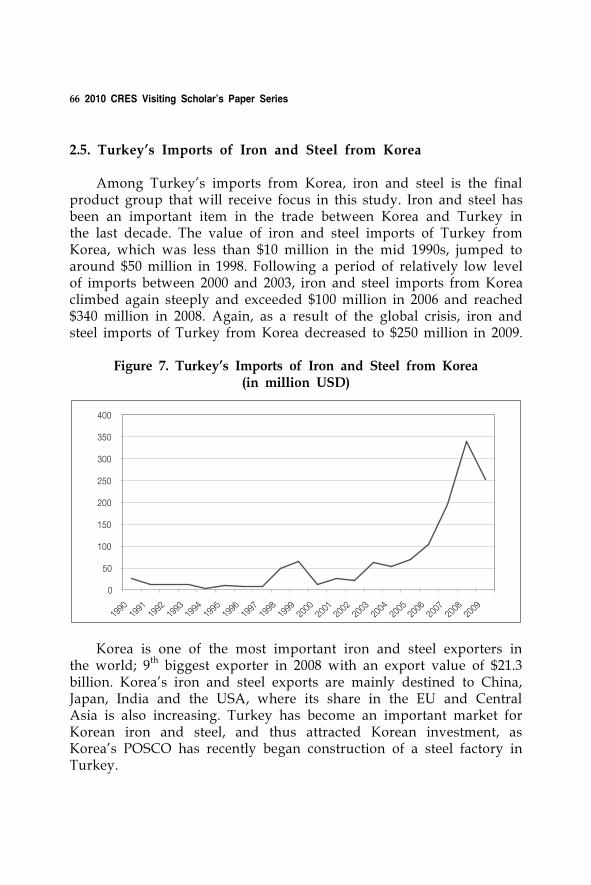
66 2010 CRES Visiting Scholar’s Paper Series
2.5. Turkey’s Imports of Iron and Steel from Korea
Among Turkey’s imports from Korea, iron and steel is the final product group that will receive focus in this study. Iron and steel has been an important item in the trade between Korea and Turkey in the last decade. The value of iron and steel imports of Turkey from Korea, which was less than $10 million in the mid 1990s, jumped to around $50 million in 1998. Following a period of relatively low level of imports between 2000 and 2003, iron and steel imports from Korea climbed again steeply and exceeded $100 million in 2006 and reached $340 million in 2008. Again, as a result of the global crisis, iron and steel imports of Turkey from Korea decreased to $250 million in 2009.
0
50
100
150
200
250
300
350
400
1990
1991
1992
1993
1994
1995
1996
1997
1998
1999
2000
2001
2002
2003
2004
2005
2006
2007
2008
2009
Figure 7. Turkey's Imports of Iron and Steel from Korea (in million USD)
Korea is one of the most important iron and steel exporters in the world; 9th biggest exporter in 2008 with an export value of $21.3 billion. Korea’s iron and steel exports are mainly destined to China, Japan, India and the USA, where its share in the EU and Central Asia is also increasing. Turkey has become an important market for Korean iron and steel, and thus attracted Korean investment, as Korea’s POSCO has recently began construction of a steel factory in Turkey.
Free Trade Agreement between Korea and Turkey: Challenges, Opportunities and Economic Cooperation 67
The majority of Turkey’s imports from Korea are composed of flat-rolled products of iron or non-alloy steel (HS codes 7208, 7210, 7219 and 7220); and Korea’s competitors in the Turkish market for the said products are China, Germany, Belgium, Ukraine and Russia. Customs duties for these products are not high in Turkey, varying between zero and 5%.
3. Turkey’s Trade Policy in the Context of the EU’s Free Trade Agreements
Turkey adopted an export-oriented growth strategy since 1980 and liberalized its foreign trade gradually over the years. The formation of the Customs Union with the EU in 1996 became a turning point in Turkey’s trade policy as Turkey brought its trade policies in line with the Common Commercial Policy of the EU. With the Customs Union, all customs duties and quantitative restrictions in the trade of industrial products between Turkey and the EU were removed, and Turkey adopted the common external tariffs of the EU on imports from third countries. According to the Decision No. 1/95 of the Turkey-EC Association Council,10) free movement will be valid for goods either wholly produced in either parts of the agreement or put in free circulation after their importation from third countries in either Turkey or the EC. The proof of this customs status of “goods in free circulation” is established by an ATR movement certificate. Customs Union also requires the approximation of customs law, intellectual property rights, competition and taxation regimes.
Turkey is also one of the founding members of the WTO in 1995 and accords MFN treatment to nearly all WTO Members. Turkey attaches great importance to the Doha Round of the WTO in terms of creating a fair, competitive and predictable trading environment where trade distorting support measures have been eliminated. Turkey sees agriculture as the key issue of the Doha Round and attaches great importance to non-agriculture market access (NAMA) negotiations and trade facilitation. In general, Turkey takes the position of the EC into consideration in the WTO negotiations, particularly on non-agricultural
10) http://www.abgs.gov.tr/files/_files/Gumruk_Isbirligi/okk1.pdf.
68 2010 CRES Visiting Scholar’s Paper Series
products, which are fully covered by its Customs Union with the EC.11)
The effects of the Customs Union to the Turkish economy have been discussed widely in Turkey since its implementation. The Customs Union had diverse effects in different sectors, but after the EU announced its new trade policy, Global Europe,12) in 2006, Customs Union suddenly and especially became a significant challenge for the Turkish economy. According to the Article 16 of the Customs Union agreement, Turkey has to align itself progressively with the preferential customs regime of the EC within five years from the date of entry into force of the Customs Union, where this alignment will concern both the autonomous regimes and preferential agreements with third countries. To this end, Turkey committed itself to taking the necessary measures and negotiate agreements on a mutually advantageous basis with the countries concerned.
As the EU paced its efforts for FTAs with larger countries and broadened the scope of its FTAs from only tariff liberalization to “new generation FTAs” including the removal of non-tariff barriers, liberalization in services trade, removal of the barriers on investment and regulatory convergence, Turkey faced a serious problem of “trade deflection”. Once the EU signs an FTA with a third country, the partner country accesses the EU market without any customs duties, and as Turkey is included in a Customs Union with the EU, this also means unrestricted access to Turkish markets. Turkey, on the other hand, finds itself in a position of opening its markets to countries that it did not even negotiate with, and under conditions determined by the interests of the EU and the partner country. Furthermore, it will face trade barriers on the markets of that country. This not only puts Turkey in an uneven position in its bilateral trade with the partner country, but also leads to a serious fall in its customs revenues. Turkey expressed its complaints to the European Commission, and demanded the EU to give Turkey a role in the FTA negotiations or to bind the partner to pursue simultaneous FTA talks with Turkey; however these attempts did not succeed. The European Commission states that it negotiates its free trade agreements on behalf of its 27 member states only, and the
11) WTO, Trade Policy Review: Turkey, 2007.
12) European Commission DG External Trade, Global Europe: Competing in the World, 2006. http://trade.ec.europa.eu/doclib/docs/2006/october/tradoc_130376.pdf.
Free Trade Agreement between Korea and Turkey: Challenges, Opportunities and Economic Cooperation 69
inclusion of Turkey is practically impossible.Before the announcement of the new “Global Europe” trade policy
strategy of the EU in 2006, Turkey also faced the problem of trade deflection, but the EU’s FTA partners were relatively small in economic size. As stated in Article 16 of the Customs Union agreement, Turkey would take the necessary measures and negotiate agreements with the EU’s FTA partners, but some of these counties, like Algeria, South Africa and Mexico, have been reluctant to start FTA negotiations with Turkey. As Turkey fails to come to an agreement with the country that signed an FTA with the EU, and the time lag between the FTAs of two parties expands, Turkey’s loss from trade deflection rises. The table below shows the completed FTAs of the EU after 2000 and their comparison with Turkey.
CountryYear the FTA Came into Force
EU Turkey
Mexico 2000 Negotiations did not start
Morocco 2000 2006
South Africa 2000 Negotiations did not start
Jordan 2002 Negotiations in progress
Lebanon 2003 Negotiations in progress
Egypt 2004 2007
Algeria 2005 Negotiations did not start
Table 6. FTA of the Partner Countires with the EU and Turkey
As seen in the table, there is a time lag between the partner countries’ FTAs with the EU and Turkey, that increases the costs of trade deflection for Turkey. Still, the relatively small economic size of these countries made this loss acceptable to some extent. However currently the EU is negotiating or has completed FTAs with larger economies and with a deeper coverage. Potential FTA partners of the EU are Central American countries, MERCOSUR, ANDEAN, ASEAN, Korea, India, Ukraine, Canada, GCC, Syria, Iraq and Libya. The EU’s FTA negotiations with some of these countries are still in progress, and some have been completed and are waiting to be approved.
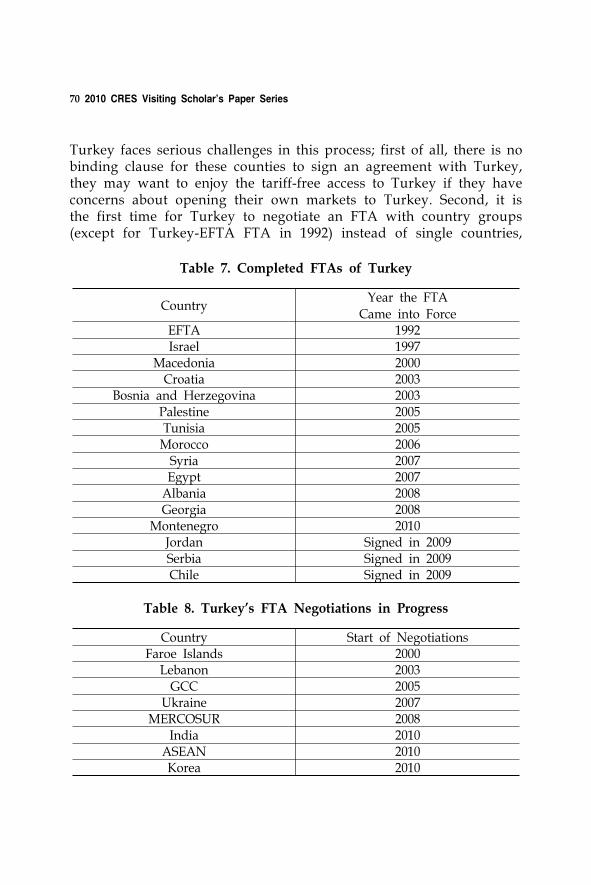
70 2010 CRES Visiting Scholar’s Paper Series
Table 7. Completed FTAs of Turkey
CountryYear the FTA
Came into ForceEFTA 1992Israel 1997
Macedonia 2000Croatia 2003
Bosnia and Herzegovina 2003Palestine 2005Tunisia 2005
Morocco 2006Syria 2007Egypt 2007
Albania 2008Georgia 2008
Montenegro 2010Jordan Signed in 2009Serbia Signed in 2009Chile Signed in 2009
Table 8. Turkey’s FTA Negotiations in Progress
Country Start of NegotiationsFaroe Islands 2000
Lebanon 2003GCC 2005
Ukraine 2007MERCOSUR 2008
India 2010ASEAN 2010Korea 2010
Turkey faces serious challenges in this process; first of all, there is no binding clause for these counties to sign an agreement with Turkey, they may want to enjoy the tariff-free access to Turkey if they have concerns about opening their own markets to Turkey. Second, it is the first time for Turkey to negotiate an FTA with country groups (except for Turkey-EFTA FTA in 1992) instead of single countries,
Free Trade Agreement between Korea and Turkey: Challenges, Opportunities and Economic Cooperation 71
and also to negotiate deep FTAs instead of agreements with only tariff and quota removal. So far, Turkey has completed 16 FTAs and is negotiating 8 FTAs at the moment.
Negotiating these FTAs with the broad coverage as the EU conducts will be a challenge for Turkey’s foreign trade policy in the forthcoming years. Each FTA has its own risks and opportunities which is and will be examined by policy makers and related institutions. But the current position of Turkey is as follows; as a result of the Customs Union with the EU, Turkey is unable to select its FTA partners in line with its economic interests, has to pursue the EU’s FTA partners for an agreement, and faces trade deflection especially as the EU completes FTAs with large economies like Korea and India unless Turkey signs FTAs with these countries immediately.
4. Effects of Korea-Turkey FTA: Risks and Opportunities
4.1. Positions of Korea and Turkey after the Korea-EU FTA
The negotiations for the free trade agreement between Korea and Turkey have been launched in April 2010 and it is expected to be concluded by the end of 2010. As expressed above, Turkey has a Customs Union with the EU and as the Korea-EU FTA proceeds, Turkey will stay in a disadvantageous position, where Korean products will have the opportunity to enter Turkish markets through the EU without any customs duties, but Turkish exporters will still face tariff barriers when entering Korean markets.
Here, if we consider this FTA as only a simple agreement aiming to remove barriers to trade among the signatory countries, we face two parties who would actually be less than motivated to abide by such an agreement for several reasons. The Korean side has already accessed Turkish markets without even negotiating an FTA with Turkey, through the FTA with the EU, so the main and only ‘gain’ for Korea from removing tariff barriers with Turkey would be a fall in the transportation and commission costs.
In the absence of a Korea-Turkey FTA, Korean exporters may choose to export their products first to the EU, and then enter Turkey tariff-free by taking advantage of the Customs Union, if the
72 2010 CRES Visiting Scholar’s Paper Series
transportation and commission costs of these transactions are below the costs arising from paying customs duties in Turkey. Even if the product in question is subject to customs duties when entering the EU, which has not been completely removed but has been lowered by the FTA, again Korean exporters to Turkish markets would choose to enter Turkey via the EU if the sum of the transportation and commission costs and the duties paid to the EU is lower than the duties paid to Turkey. In this case, an important part of Turkey’s customs revenues would shift to the EU countries. On the other hand, the Turkish side, at least for certain sectors, would not be motivated to conclude an FTA with Korea, as the benefits would be limited. Turkey’s exports to Korea is less than one tenth of its imports from Korea, and the main reason for this low value of exports is not seen as the level of the tariff barriers (except for the agricultural products), but mainly as the fact that, there is no actual market for Turkey’s main export items in Korea. In other words, the products that represent large shares in Turkey’s exports, like motor vehicles, iron and steel, textile products and electrical machinery, are already extensively produced in and exported from Korea, even in high amounts to Turkey. Thus, as it is obvious that the Korea-EU FTA would affect Turkey negatively; for some sectors, there is no reason to believe that an FTA between Turkey and Korea would compensate for these negative effects; the increase in Turkey’s exports of currently exported products to Korea would be very limited, whereas Korean exporters, who already hold an advantageous position after the Korea-EU FTA, would find it easier to access Turkish markets in the absence of transportation and commission costs of taking their products from the EU to Turkey. This is likely to affect Turkey’s production and exports of certain products in a negative manner.
4.2. Expectations of the Quantitative Models on Korea-Turkey FTA
For both parties to the agreement, gains from a simple FTA focusing only on tariff elimination and reduction in goods trade are very limited or in some cases even negative. Two recent studies have focused on the impact of the elimination or reduction of tariff rates for Turkey and Korea. The impact analysis made by the Undersecretariat for Foreign Trade of Turkey used a CGE analysis in order to examine
Free Trade Agreement between Korea and Turkey: Challenges, Opportunities and Economic Cooperation 73
both short-run and long-run effects of the FTA. The model examines two scenarios; a 50% reduction, and complete removal of bilateral tariff barriers in the manufacturing industries. According to their results, in the short-run, the welfare effect in both scenarios would be negative for Turkey. Production of mineral products, iron and steel, machinery and transport vehicles are expected to increase in the short-run both in tariff-reduction and tariff-removal cases. The study expects an increase in imports in all sectors of Turkey’s automotive and electronic industries, in the short-run. However, in the long-run, the welfare effect for Turkey is positive for both scenarios. Increase in production is expected in all sectors, except for automotive and electronics, if the tariffs are removed completely or reduced by 50%. Again for both scenarios, both Turkey’s exports and imports are expected to rise in all sectors in the long-run.
A KIEP study13) examines the effects of the Korea-Turkey FTA by focusing on the tariff reduction in the manufacturing sector only and uses two CGE models based on the GTAP database; a static CGE model that captures short-run effects, and a capital accumulation model that captures static effects as well as capital accumulation effects arising from higher savings and investment induced by static gains. Similar to the study by the Undersecretariat for Foreign Trade, KIEP’s model examines two scenarios; scenario I with the full elimination of tariffs, and scenario II with a 50% tariff reduction, where these tariff reductions are valid only for manufacturing sectors.
Static CGE model under the assumption of a fixed capital stock expects minor increases in the GDPs of both countries. Under scenario I, Turkey experiences a fall in welfare and in terms of trade, whereas welfare gain for Korea is calculated as $162 million. Imports of both countries are expected to rise more than their exports. Scenario II of the static model expects very small changes for Turkey in terms of the growth in GDP, welfare and terms of trade, and around $73 million in welfare gain for Korea. On the other hand, the capital accumulation model expects that Turkey’s GDP growth rates would be larger than Korea’s GDP growth rates after the FTA in both scenarios. This model also expects significant welfare gains for both countries; more than $250
13) Chung, C. et al., The Korea-Turkey FTA and Measures to Enhance the Economic Cooperation, KIEP Policy References No. 10-01, 2010.
74 2010 CRES Visiting Scholar’s Paper Series
million each for Turkey and Korea in scenario I, and around $125 million in scenario II. This model also expects a large increase in bilateral trade after the FTA. Scenarios in both models expect an increase in the exports of Korea in motor vehicles, textiles and chemical products, while the exports of electronic products, machinery, and other transport equipments are expected to decrease.
Econometric studies may be good indicators of the effects of FTAs dealing only with reductions of customs duties on goods. However, when we consider the effects of the FTA on cooperation in several areas like investment, legal convergence, services, competition and intellectual property rights, these models underestimate the overall effects on trade and welfare of the parties to the agreement. Quantitative studies on the Korea-Turkey FTA have another qualifying factor; the effect of the Korea-EU FTA. The study of the Undersecretariat for Foreign Trade of Turkey assumes a model with an FTA between Korea on one side, and Turkey and the EU on the other side. The welfare and GDP growth effects on both sides would thus show the combined impact of the Korea-EU and Korea-Turkey FTAs. It is worth noting that the expected positive effects for Korea mostly consist of gains from the FTA with the EU. The KIEP study, on the other hand, examines the effects of an FTA between Korea and Turkey in the absence of the Korea-EU FTA. However, the actual position is this; Korea has an FTA with the EU and this FTA gives Korea access to Turkish markets indirectly (except for agricultural goods) with the same conditions that they have in the EU markets, as Turkey is in a Customs Union with the EU. In this manner, a large portion of the expected positive effects for the Korean economy that the KIEP study expects would materialize even in the absence of an FTA with Turkey. Thus, a deeper qualitative analysis is needed to assess the real affects of a Korea-Turkey FTA as quantitative analyses have limited power in assessing the actual impacts.
4.3. Coverage of the Agreement
The prospective FTA between Korea and Turkey has been set up as an agreement that would go far beyond a simple FTA, instead having significant meaning for both sides in terms of economic cooperation. Both trade and investment between Korea and Turkey
Free Trade Agreement between Korea and Turkey: Challenges, Opportunities and Economic Cooperation 75
have been far below potential considering not only the size of two economies, but also the special relationship between the peoples of the two countries. In this respect, this FTA should be regarded as more than a trade agreement, but as the vitalization of the real potential economic relations between two countries.
In the Korea-Turkey FTA, agreement on the following elements is expected to take place: trade in goods, market access and national treatment, rules of origin, customs procedures, trade facilitation, technical barriers to trade, sanitary and phytosanitary measures, trade in services, investments, e-commerce, government procurement, intellectual property rights, competition policy, consultations and dispute settlement, transparency and institutional framework for policy dialogues. A simple FTA with only tariff reduction in goods would have only limited or negative effect on both sides; so the most important and mutually beneficial elements of the agreement presently being negotiated would be the liberalization and facilitation of trade in services and increased cooperation in investment and government procurement.
In terms of elimination of customs duties in the trade of goods, the coverage of the Korea-Turkey FTA should not be less than that of the Korea-EU FTA. In the Korea-EU FTA, the majority of customs duties on goods will be removed already at the entry into force of the agreement, and practically all customs duties on industrial goods will be fully removed in year 5 of the tariff elimination schedule. By year 7, both sides would have achieved, in overall terms, 98% duty elimination in terms of tariff lines. A limited number of highly sensitive agricultural and fisheries products have transitional periods longer than 7 years. Some agricultural products like rice, rice flour, onion, garlic and pepper are excluded from the agreement. Since all duty reductions or removals made by the EU side would indirectly be valid for Turkey because of the Customs Union, gains from longer transition periods than that of the EU would be minimal for Turkey. Korea’s duty reduction or removal scheme for the agreement with Turkey should also not be less restrictive than the conditions in the FTA with the EU, so that Turkey would also benefit from the FTA. In fact, Turkey needs to negotiate for more generous tariff reductions or shorter transition periods in Korea for some agricultural products.
76 2010 CRES Visiting Scholar’s Paper Series
4.4. Sensitive Sectors in Turkey: Expectations from the FTA
In this section, select sensitive sectors that are expected to be affected from the elimination of customs duties on the goods trade after the conclusion of the Korea-Turkey FTA are examined. The results and views stated here have been achieved after extensive research and interviews with the sector representatives, but after all, express the view of the author. The automobile, electronics, textile, and iron and steel were determined to be the sensitive sectors.
4.4.1. Automotive sectorTurkish automotive sector seems to be the most sensitive sector
that will be affected by Korea’s FTAs with both Turkey and the EU. Automotive sector has become one of the locomotive sectors and the country’s largest export earner in the last decade. Turkey’s exports of motor vehicles have constantly increased since 1990; except for the downfall in 2009 due to the global crisis. About 80% of Turkish vehicle production is exported, mainly to Europe, while about 70% of motor vehicle sales in Turkey in recent years were imported vehicles. This international aspect of the sector is the result of the rise of foreign investment by global automobile firms in Turkey, led by the good investment climate, availability of skilled labor, the unsaturated domestic market with massive growth potential, easy access to neighboring emerging markets in the Middle East, and the opportunity to access the EU markets tariff-free thanks to the Customs Union. Major global manufacturers from the US, the EU countries, Japan and Korea have integrated their plants in Turkey into their global production chains, where specific models are produced in Turkey for global or regional sale, while other vehicles not produced in Turkey are imported.14) This made Turkey a regional center for the production of motor vehicles. The sector increased its exports of vehicles15) in years, from $75 million in 1990 to $1 billion in 2000, and to $14.2 billion in 2008. With the effects of the global crisis, the value of Turkey’s exports of motor vehicles fell to $11.2 billion in 2009.
14) Investment Support and Promotion Agency, Turkish Automotive Industry Report, 2009.
15) Products with HS codes 8701 to 8705 only. Does not include parts and accessories, motorcycles and bicycles.
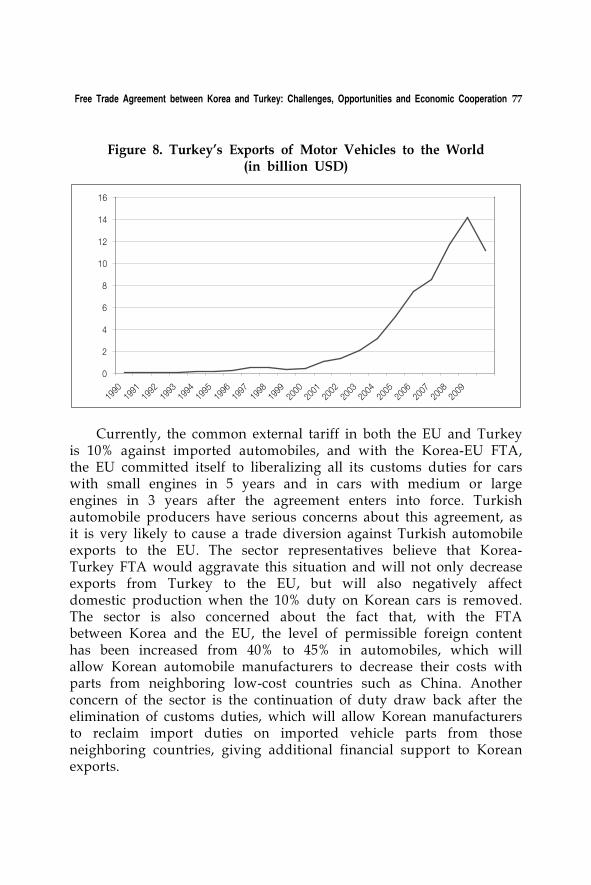
Free Trade Agreement between Korea and Turkey: Challenges, Opportunities and Economic Cooperation 77
0
2
4
6
8
10
12
14
16
1990
1991
1992
1993
1994
1995
1996
1997
1998
1999
2000
2001
2002
2003
2004
2005
2006
2007
2008
2009
Figure 8. Turkey's Exports of Motor Vehicles to the World (in billion USD)
Currently, the common external tariff in both the EU and Turkey is 10% against imported automobiles, and with the Korea-EU FTA, the EU committed itself to liberalizing all its customs duties for cars with small engines in 5 years and in cars with medium or large engines in 3 years after the agreement enters into force. Turkish automobile producers have serious concerns about this agreement, as it is very likely to cause a trade diversion against Turkish automobile exports to the EU. The sector representatives believe that Korea- Turkey FTA would aggravate this situation and will not only decrease exports from Turkey to the EU, but will also negatively affect domestic production when the 10% duty on Korean cars is removed. The sector is also concerned about the fact that, with the FTA between Korea and the EU, the level of permissible foreign content has been increased from 40% to 45% in automobiles, which will allow Korean automobile manufacturers to decrease their costs with parts from neighboring low-cost countries such as China. Another concern of the sector is the continuation of duty draw back after the elimination of customs duties, which will allow Korean manufacturers to reclaim import duties on imported vehicle parts from those neighboring countries, giving additional financial support to Korean exports.
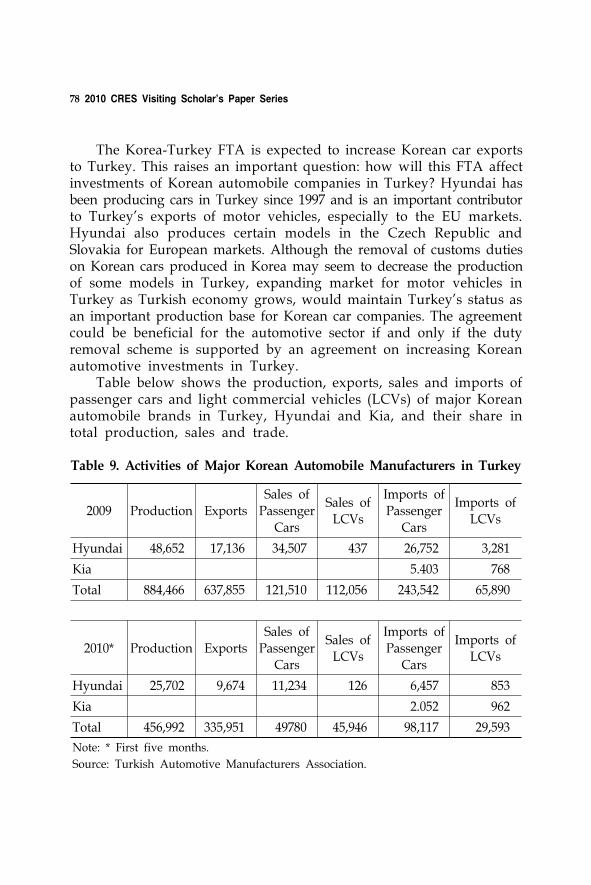
78 2010 CRES Visiting Scholar’s Paper Series
The Korea-Turkey FTA is expected to increase Korean car exports to Turkey. This raises an important question: how will this FTA affect investments of Korean automobile companies in Turkey? Hyundai has been producing cars in Turkey since 1997 and is an important contributor to Turkey’s exports of motor vehicles, especially to the EU markets. Hyundai also produces certain models in the Czech Republic and Slovakia for European markets. Although the removal of customs duties on Korean cars produced in Korea may seem to decrease the production of some models in Turkey, expanding market for motor vehicles in Turkey as Turkish economy grows, would maintain Turkey’s status as an important production base for Korean car companies. The agreement could be beneficial for the automotive sector if and only if the duty removal scheme is supported by an agreement on increasing Korean automotive investments in Turkey.
Table below shows the production, exports, sales and imports of passenger cars and light commercial vehicles (LCVs) of major Korean automobile brands in Turkey, Hyundai and Kia, and their share in total production, sales and trade.
2009 Production ExportsSales of
Passenger
Cars
Sales ofLCVs
Imports ofPassenger
Cars
Imports ofLCVs
Hyundai 48,652 17,136 34,507 437 26,752 3,281
Kia 5.403 768
Total 884,466 637,855 121,510 112,056 243,542 65,890
2010* Production ExportsSales of
Passenger Cars
Sales ofLCVs
Imports ofPassenger
Cars
Imports ofLCVs
Hyundai 25,702 9,674 11,234 126 6,457 853
Kia 2.052 962
Total 456,992 335,951 49780 45,946 98,117 29,593
Note: * First five months.
Source: Turkish Automotive Manufacturers Association.
Table 9. Activities of Major Korean Automobile Manufacturers in Turkey
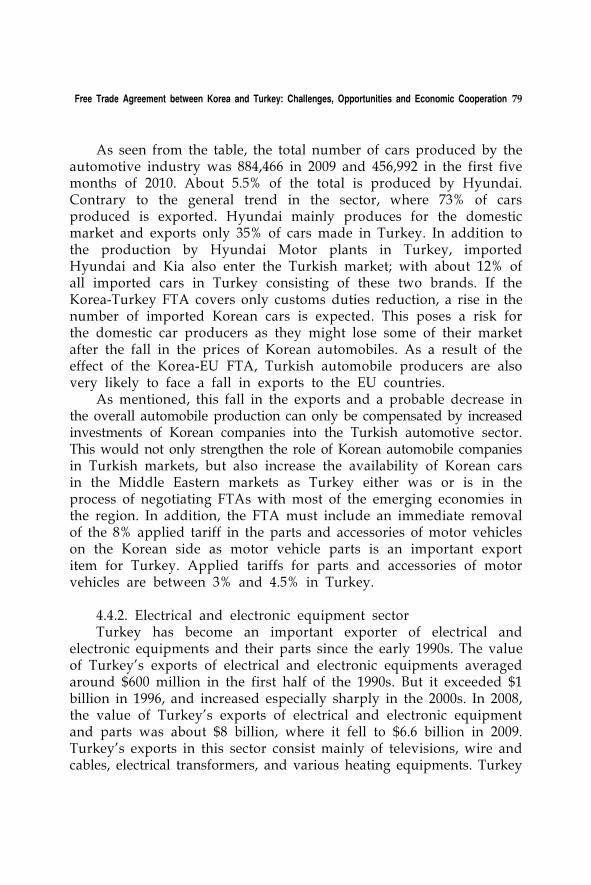
Free Trade Agreement between Korea and Turkey: Challenges, Opportunities and Economic Cooperation 79
As seen from the table, the total number of cars produced by the automotive industry was 884,466 in 2009 and 456,992 in the first five months of 2010. About 5.5% of the total is produced by Hyundai. Contrary to the general trend in the sector, where 73% of cars produced is exported. Hyundai mainly produces for the domestic market and exports only 35% of cars made in Turkey. In addition to the production by Hyundai Motor plants in Turkey, imported Hyundai and Kia also enter the Turkish market; with about 12% of all imported cars in Turkey consisting of these two brands. If the Korea-Turkey FTA covers only customs duties reduction, a rise in the number of imported Korean cars is expected. This poses a risk for the domestic car producers as they might lose some of their market after the fall in the prices of Korean automobiles. As a result of the effect of the Korea-EU FTA, Turkish automobile producers are also very likely to face a fall in exports to the EU countries.
As mentioned, this fall in the exports and a probable decrease in the overall automobile production can only be compensated by increased investments of Korean companies into the Turkish automotive sector. This would not only strengthen the role of Korean automobile companies in Turkish markets, but also increase the availability of Korean cars in the Middle Eastern markets as Turkey either was or is in the process of negotiating FTAs with most of the emerging economies in the region. In addition, the FTA must include an immediate removal of the 8% applied tariff in the parts and accessories of motor vehicles on the Korean side as motor vehicle parts is an important export item for Turkey. Applied tariffs for parts and accessories of motor vehicles are between 3% and 4.5% in Turkey.
4.4.2. Electrical and electronic equipment sectorTurkey has become an important exporter of electrical and
electronic equipments and their parts since the early 1990s. The value of Turkey’s exports of electrical and electronic equipments averaged around $600 million in the first half of the 1990s. But it exceeded $1 billion in 1996, and increased especially sharply in the 2000s. In 2008, the value of Turkey’s exports of electrical and electronic equipment and parts was about $8 billion, where it fell to $6.6 billion in 2009. Turkey’s exports in this sector consist mainly of televisions, wire and cables, electrical transformers, and various heating equipments. Turkey
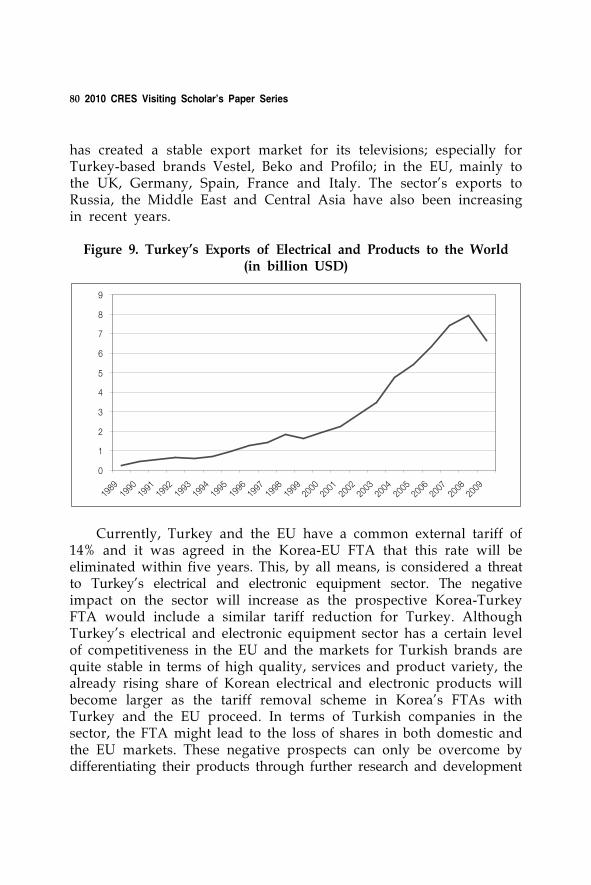
80 2010 CRES Visiting Scholar’s Paper Series
has created a stable export market for its televisions; especially for Turkey-based brands Vestel, Beko and Profilo; in the EU, mainly to the UK, Germany, Spain, France and Italy. The sector’s exports to Russia, the Middle East and Central Asia have also been increasing in recent years.
0
1
2
3
4
5
6
7
8
9
1989
1990
1991
1992
1993
1994
1995
1996
1997
1998
1999
2000
2001
2002
2003
2004
2005
2006
2007
2008
2009
Figure 9. Turkey's Exports of Electrical and Products to the World (in billion USD)
Currently, Turkey and the EU have a common external tariff of 14% and it was agreed in the Korea-EU FTA that this rate will be eliminated within five years. This, by all means, is considered a threat to Turkey’s electrical and electronic equipment sector. The negative impact on the sector will increase as the prospective Korea-Turkey FTA would include a similar tariff reduction for Turkey. Although Turkey’s electrical and electronic equipment sector has a certain level of competitiveness in the EU and the markets for Turkish brands are quite stable in terms of high quality, services and product variety, the already rising share of Korean electrical and electronic products will become larger as the tariff removal scheme in Korea’s FTAs with Turkey and the EU proceed. In terms of Turkish companies in the sector, the FTA might lead to the loss of shares in both domestic and the EU markets. These negative prospects can only be overcome by differentiating their products through further research and development
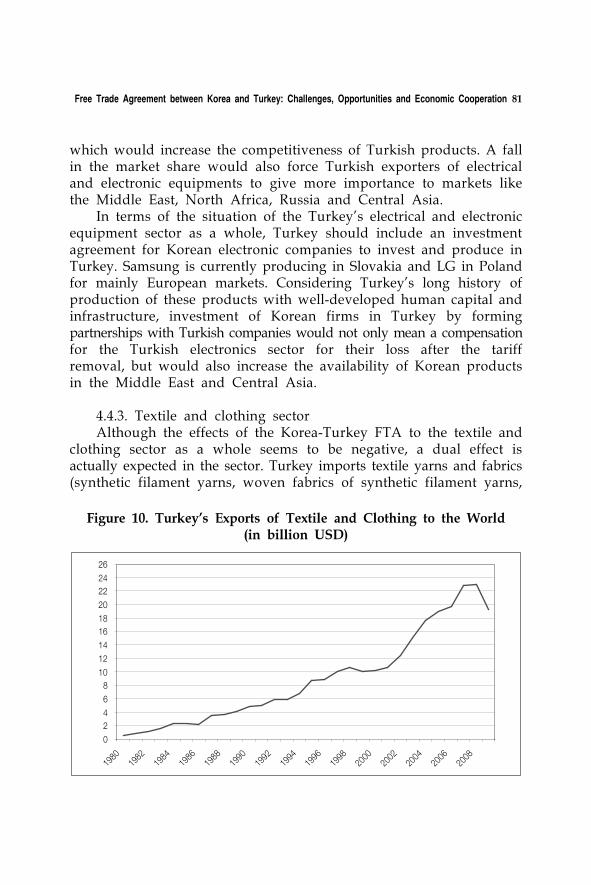
Free Trade Agreement between Korea and Turkey: Challenges, Opportunities and Economic Cooperation 81
0
2
4
6
8
10
12
14
16
18
20
22
24
26
1980
1982
1984
1986
1988
1990
1992
1994
1996
1998
2000
2002
2004
2006
2008
Figure 10. Turkey's Exports of Textile and Clothing to the World (in billion USD)
which would increase the competitiveness of Turkish products. A fall in the market share would also force Turkish exporters of electrical and electronic equipments to give more importance to markets like the Middle East, North Africa, Russia and Central Asia.
In terms of the situation of the Turkey’s electrical and electronic equipment sector as a whole, Turkey should include an investment agreement for Korean electronic companies to invest and produce in Turkey. Samsung is currently producing in Slovakia and LG in Poland for mainly European markets. Considering Turkey’s long history of production of these products with well-developed human capital and infrastructure, investment of Korean firms in Turkey by forming partnerships with Turkish companies would not only mean a compensation for the Turkish electronics sector for their loss after the tariff removal, but would also increase the availability of Korean products in the Middle East and Central Asia.
4.4.3. Textile and clothing sectorAlthough the effects of the Korea-Turkey FTA to the textile and
clothing sector as a whole seems to be negative, a dual effect is actually expected in the sector. Turkey imports textile yarns and fabrics (synthetic filament yarns, woven fabrics of synthetic filament yarns,
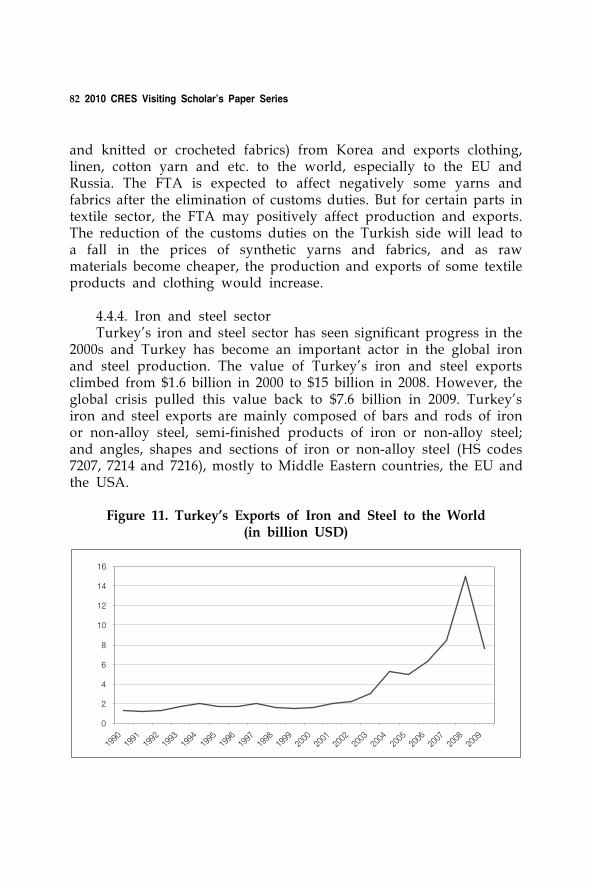
82 2010 CRES Visiting Scholar’s Paper Series
and knitted or crocheted fabrics) from Korea and exports clothing, linen, cotton yarn and etc. to the world, especially to the EU and Russia. The FTA is expected to affect negatively some yarns and fabrics after the elimination of customs duties. But for certain parts in textile sector, the FTA may positively affect production and exports. The reduction of the customs duties on the Turkish side will lead to a fall in the prices of synthetic yarns and fabrics, and as raw materials become cheaper, the production and exports of some textile products and clothing would increase.
4.4.4. Iron and steel sectorTurkey’s iron and steel sector has seen significant progress in the
2000s and Turkey has become an important actor in the global iron and steel production. The value of Turkey’s iron and steel exports climbed from $1.6 billion in 2000 to $15 billion in 2008. However, the global crisis pulled this value back to $7.6 billion in 2009. Turkey’s iron and steel exports are mainly composed of bars and rods of iron or non-alloy steel, semi-finished products of iron or non-alloy steel; and angles, shapes and sections of iron or non-alloy steel (HS codes 7207, 7214 and 7216), mostly to Middle Eastern countries, the EU and the USA.
0
2
4
6
8
10
12
14
16
1990
1991
1992
1993
1994
1995
1996
1997
1998
1999
2000
2001
2002
2003
2004
2005
2006
2007
2008
2009
Figure 11. Turkey's Exports of Iron and Steel to the World (in billion USD)
Free Trade Agreement between Korea and Turkey: Challenges, Opportunities and Economic Cooperation 83
Turkish iron and steel industry is deeply concerned about both the Korea-Turkey FTA and the Korea-EU FTA. The removal of trade barriers and rising competition from Korean iron and steel producers threatens the market shares of Turkish producers.
5. Potential Exports to Korea for Turkish Products
This section aims to determine the sectors and products that currently have low or no level of exports to Korea but have a potential place in Korean markets, and could benefit from the FTA. Of course more products may be added to this list by further research in market opportunities, but this study will only mention certain agricultural products. Of course, the potential trade values of these products are small, compared to major products exported, and would have little power to decrease Turkey’s trade deficit against Korea. Still, the availability of these products in Korean markets would mean significant gains for their exporters, and would increase the awareness for Turkish products in Korea.
A sample product from Turkey that has the potential to find itself a place in the Korean markets is wine. Korea is one of the biggest markets for alcoholic beverages in the world, and although wine is still consumed by a relatively small portion of the Korean population, its popularity is rising rapidly as the wealthy urban population increases, dietary habits change towards Western-style food, and large supermarkets with separate wine sections spread quickly in big cities, although beer and soju still dominate the alcoholic beverages market in Korea. All wines consumed in Korea are imported, and the majority of them are red wines. Korea’s wine imports have increased continuously and sharply since 1990, except for a fall in 1998 due to the effect of the Asian financial crisis. The value of Korea’s wine imports was $5 million in 1990, but exceeded $13 million in 1995 and surged after 1998; in 2008 Korea’s wine imports was $166.5 million. France has been the leading exporter in the sector, supplying about 40% of all imported wines in Korea. Chilean wines, which were very low in import volume before the early 2000s, have become very popular in Korea after 2004, the year Korea and Chile signed an FTA. Only 2.4% of wines imported in Korea originated
84 2010 CRES Visiting Scholar’s Paper Series
in Chile in 2000, with a trade value less than $500,000. However following a sharp rise after 2004, Chilean wines reached $30 million in 2008 with a share of 18% in the Korean wine market. US wines, which were in second place in the Korean market before 2004, have been surpassed by Chilean and Italian wines recently. Currently the applied customs duty for wine is 15% and with the Korea-EU FTA, this duty will be removed immediately as the agreement comes into force. This will decrease the prices of European wines and increase their competitiveness against Chilean, American and Australian wines.
Turkey has virtually no wine exports to Korea. In fact, despite the long history and high quality of Turkish wines, the sector is highly problematic both in terms of domestic sales and opening up to foreign markets. Still, Turkey has exported on average $7.5 million of wine in the last decade mainly to the EU countries. The problems of the sector and proposals for their solution are beyond the scope of this study, but by all means, Turkey has a great potential to create a stable and growing market for its wines in Korea. No doubt, there are formidable challenges for wine exporters coming into the Korean market. First of all, Korean consumers have close to zero recognition concerning Turkish wine. As wine culture is underdeveloped in Korea, consumers are mainly attracted by the wine’s country of origin rather than its taste, and it is difficult to compete with the wines of France, Chile and Italy in the short run. But once the initial stage passes, the fast-growing Korean wine market offers opportunities for Turkish wine producers. In this manner, Turkey should give priority to the immediate removal of the customs duties on wine exports to Korea and Turkish wine producers should create strategies to penetrate the Korean market in terms of marketing, promotion and awareness of Turkish wines.
Fruit, dried fruit and nuts may also find themselves a strong market in Korea. Korea is becoming an important market for the exports of fruit and nuts as Korean consumers become wealthier and the level of production of most fruits and nuts is insufficient to fulfill consumer demand. Korea’s imports of fruits and nuts have been increasing since 1998, by more than 20% each year. In 2008, Korea imported $662 million-worth of edible fruit and nuts. Korean fruit and nut imports are composed of bananas and pineapples from the Philippines; oranges, walnuts, almonds and cherries from the USA; grapes from Chile and kiwi fruit from New Zealand. The USA is the leading exporter of fruits
Free Trade Agreement between Korea and Turkey: Challenges, Opportunities and Economic Cooperation 85
and nuts to Korea, and has 40% of the market in 2008. Turkey has a very limited share in the Korean fruits and nuts market, exporting only hazelnuts and dried apricots with a total value of $3.4 million in 2008. Turkey is the world’s leading exporter of several fruits and nuts, such as hazelnuts, dried grapes, dried apricots and figs. Turkey is also an important producer and exporter of citrus fruits, cherries, walnuts and pistachios. Removal of customs duties on these products would create new market opportunities for Turkish exporters.
Another commodity group related to this category, where Turkey has a potential to find an export market in Korea is prepared products from fruits, nuts and vegetables. Turkey exported more than $7.5 million of this product group, mainly fruit juices and prepared nuts to Korea in 2008, which fell to $4 million in 2009. This trade volume is very low compared to the size of Korean imports in the sector. Other products worth mentioning in this study in terms of Turkey’s potential exports to Korea are organic products and vegetable oils.
6. Beyond a Free Trade Agreement: Economic Cooperationbetween Korea and Turkey
The FTA between Korea and Turkey is expected to be concluded by the end of 2010. The Korea-Turkey FTA, which will be the first of the new generation FTAs of Turkey, poses certain risks for some sectors in Turkey. On the other hand, the access given to Turkish markets without any restrictions by the Korea-EU FTA as a result of the Turkey-EU Customs Union has minimized the positive effects for Korea compared to an FTA with Turkey in the absence of an FTA with the EU. Therefore, the question arises: what are the motives, then, for Korea and Turkey for signing an FTA with each other? The answer lies in the coverage of the agreement; the FTA being considered is designed to cover broader areas, such as services trade, investment, non-tariff barriers, SPS measures, e-commerce, competition policy and creation of an institutional framework for policy dialogue between two countries. In this manner, this FTA could be an opportunity to improve bilateral economic relations and solidify cooperation between Korea and Turkey.
86 2010 CRES Visiting Scholar’s Paper Series
Investment is the one of most important parts of the agreement for both countries. As mentioned above, the probable losses in sectors like automotive and electronics can only be compensated to some extent by increased Korean investment in these sectors. In terms of attracting foreign direct investment, Turkey has been in competition with Central and Eastern European countries like the Czech Republic, Hungary and Slovakia over the recent years. Each country has its own strengths and weaknesses for foreign investment. According to Turkey’s International Investors Association, Turkey is a country offering significant opportunities for foreign investors with its geographically perfect position as a gateway between Europe, Middle East and Central Asia. The Association summarizes the advantages of investing in Turkey as: a large and growing domestic market, mature and dynamic private sector, leading role in the region, liberal and secure investment environment, supply of high quality and cost-effective labor force, developed infrastructure, institutionalized economy and competitive tax system.16) The spread of export-oriented development strategies and rising integration to the global economy forced the developing countries in Central and Eastern Europe to adopt liberal trade and investment policies since the early 1990s in order to attract more foreign investment. Thus, most countries in the region, including Turkey, have similar positive approaches to foreign investment with respect to their investment regimes, tax structures and labor forces; with their own advantages and disadvantages vis-à-vis other countries. Foreign firms, who seek profit maximization, will choose the best investment alternative according to their short-run and long-run aims and expectations. The advantage of Turkey lie with its large and growing domestic market, well-developed human capital and its proximity to the emerging economies in the Middle East; as well as positive and well-established economic relations with countries the region, which is of utmost importance in terms of the medium and long-run benefits of the investors. The FTA proceedings would present an opportunity for discussing the positions of both sides in terms of current barriers to investment, expectations of Korean and Turkish investors and partnership opportunities.
16) http://www.yased.org.tr/webportal/English/yoic/tnyy/Pages/TurkiyeyeNeden YatirimYapalim.aspx.
Free Trade Agreement between Korea and Turkey: Challenges, Opportunities and Economic Cooperation 87
Services trade is another important part of the Korea-Turkey FTA. It would be reasonable to expect an agreement on this section that is in line with the conditions agreed in the Korea-EU FTA, which covers such services sectors as transport, telecommunications, finance, legal services, environmental services and construction. Liberalization in financial services is important for the interests of Turkey, as Turkey has a strong financial sector with developed institutions, and has also undertaken commitments on the Understanding on Commitments in Financial Services of the General Agreement on Trade in Services (GATS). The Korea-EU FTA gives the European financial firms substantial market access to Korea, and Turkish financial firms will demand the same opportunity from this FTA, at minimum, access to Korea at the level of the GATS commitments list.
In terms of the services trade, enhanced partnership in construction services is also crucial both for Turkey and Korea. Turkish and Korean construction companies have created for themselves a strong place in world markets especially in the last decade. Turkish construction companies have conducted several projects in the Middle East, North Africa and Central Asia since the 1980s, where Korean companies are very competitive in South and Southeast Asia. Cooperation between Korea and Turkey in construction services would give both countries a strong competitive advantage concerning construction contracts in these regions in the future.
An important aspect of the increased economic cooperation with Turkey relates to Korea’s energy policies. As a country poor in natural resources, Korea has repeatedly faced difficulties when commodity prices became unstable. With respect to resource development in Central Asia, Korea has suggested a go-around-entry strategy via Turkey. Based on the country's historical relations with other countries in Central Asia, Turkey has been expanding its political and economic influence over the region, and it is crucial for Korea to form a strategic alliance with Turkish firms to facilitate its entry. Turkey has become a very important energy corridor from Russia and Central Asia to Europe.
A crucial factor related to the energy policies of both Turkey and Korea is cooperation for nuclear energy. Recently, Turkey announced that it will build two nuclear reactors, one in Northern Anatolia, in Sinop and one in Southern Anatolia, in Mersin. This contract has
88 2010 CRES Visiting Scholar’s Paper Series
attracted Korea, as the latter aims to become a major force in the global nuclear energy business by exporting technology and expertise around the world. Korea has placed great importance on nuclear energy since the late 1970s as a means to secure the country’s rapid economic development. After contracting the building of its nuclear power plants to companies from the US, France and Canada, Korea bolstered its efforts in nuclear research and by the late 1990s, Korea started to build its nuclear plants with its own resources and technology.17) Korea’s great leap in becoming an important actor in the global nuclear business came in 2009, after Korean consortiums won the contracts for the construction of nuclear power plants in Jordan and the UAE. The contract for the nuclear plant in the UAE has been the biggest contract that any Korean firm has ever secured overseas and is worth about $20.4 billion. In this sense, the construction of the nuclear plant in Turkey was crucial for Korea’s interests. After long negotiations, Turkey and Korea reached an agreement between their state-run firms, Korea Electric Power Corp. (KEPCO) and the Electricity Generation Company, about a bilateral study for the plants in Sinop, and signed a memorandum of understanding (MoU) in June 2010 to cooperate on nuclear power projects. After this MoU, although the final decision has not been reached, the possibility that Korea would win the contract has increased. Still, enhanced economic cooperation between Turkey and Korea that would be reached by the FTA could be crucial for the Korean side in securing this contract.
7. Conclusion
The year 2010 is the 60th anniversary of the Korean War. It has also been 60 years since Turkey and Korea have established close relations, and by the end of 2010 Turkey and Korea are expected to sign a free trade agreement that will increase bilateral trade, investment and economic cooperation. When considered as a simple tariff liberalization agreement, the gains for Korea are negligible, as the Korea-EU FTA already gives them indirect duty-free access to Turkey’s
17) Stott, D. A. (2010), “South Korea’s Global Nuclear Ambitions,” The Asia-Pacific Journal, 12-1-10. (March 22)
Free Trade Agreement between Korea and Turkey: Challenges, Opportunities and Economic Cooperation 89
markets in manufacturing goods. Turkey, on the other hand, expects negative impact in its vital sectors like automotive, electronics, and iron and steel. Still, other aspects of this FTA have the potential to create opportunities for both countries. First of all, the FTA is expected to increase awareness in both countries to the goods produced in the partner country. As exporters and export agencies in Korea and Turkey increase their efforts to create new markets by promotion of new goods, this FTA may lead to a rise in the exports of certain goods, like wine, olive oil, fruit juices and nuts from Turkey. Awareness of their respective goods should be raised in both sides by supporting common cultural, social and sporting activities; increasing bilateral tourism and formation of student exchange programs. If supported by bilateral investment agreements, the FTA would compensate the sectoral losses to some extent.
The FTA is also an opportunity for enhanced economic cooperation between Korea and Turkey in sectors like construction, financial services and shipbuilding. Turkey has attached great importance to its financial services sector and in order to compete with European firms in the Korean market, expects the same conditions that the EU achieved in the Korea-EU FTA. Both countries are strong in the shipbuilding sector, where cooperation between firms in the sector could give them the chance to compete with China in the market for small and medium sized ships. Finally, partnerships of Korean and Turkish construction firms would create a strong competitive power in contracts in the Middle East, Central Asia and South Asia.
The success of the FTA is crucial for the energy policy of Korea in two aspects; first, strong economic partnership with Turkey would give them secure access to energy markets in Central Asia, and second, the contract for the nuclear power plant in Turkey has utmost importance in Korea’s strategy to become a more important actor in the nuclear energy sector. Although not directly a part of the agreement, this FTA could be a chance for both countries to form a partnership in energy policies and a common development strategy for energy resources.
By all means, Turkey and Korea can expect significant potential gains, both in the short-run and the long-run, from an economic cooperation and partnership agreement that would go beyond the letter of the FTA. The FTA will be comprehensive and will have broad
90 2010 CRES Visiting Scholar’s Paper Series
coverage with vital elements like services trade and investment liberalization. Both sides in this FTA negotiation should be mindful of their responsibility, knowing that this agreement can become a starting point of a very strong economic partnership. With this agreement, Turkey and Korea will find a chance to rediscover each other.
References
Chung, Chul, Hankyung Sung, Chelwon Lee, and Tae Hyun Oh. 2010. The Korea-Turkey FTA and Measures to Enhance the Economic Cooperation. KIEP Policy References No. 10-01.
European Commission. 2006. Global Europe: Competing in the World, DG Trade, http://trade.ec.europa.eu/doclib/docs/2006/october/ tradoc_130376.pdf.
. 2009. EU-Korea Free Trade Agreement Online, DG Trade, http://trade.ec.europa.eu/doclib/press/index.cfm?id=443&serie=273&langId=en
International Investors Association. 2010. Why Invest in Turkey, http://www.yased.org.tr/webportal/English/yoic/tnyy/Pages/TurkiyeyeNedenYatirimYapalim.aspx.
Investment Support and Promotion Agency. 2009. Turkish Automotive Industry Repor.
Para magazine. 2010. “Samsung ve LG, Vestel ve Beko’nun kabusu oldu.” (March 12)
Secretariat General for EU Affairs. Turkey-EC Customs Union Agreement. http://www.abgs.gov.tr/files/_files/Gumruk_Isbirligi/okk1.pdf.
Stott, D. A. 2010. “South Korea’s Global Nuclear Ambitions.” The Asia-Pacific Journal, 12-1-10. (March 22)
Turkish Automotive Manufacturers Association website, http://www. osd.org.tr/index-english.htm
Undersecretariat of the Prime Ministry for Foreign Trade website. 2010. http://www.dtm.gov.tr/dtmweb/indexen.cfm
United Nations COMTRADE Statistics Database. 2010. http://comtrade. un.org/db.
World Trade Organization. 2007. Trade Policy Review: Turkey.
ASEAN Economic Community:
Prospect for Regional Monetary
Cooperation in East Asia
Umi Karomah Yaumidin
1. Introduction
The financial crisis that occurred in 1997 provides valuable lessons for countries in Asia. Countries affected by the contagion effect of the crisis become more aware of the need to stabilize their financial system and improve the performance of their banking sectors. Many economists agreed that the first phase of crisis involved increasing the momentum for the implementation of economic cooperation, which are no longer considers formal economic integration through bilateral cooperation, but plurilateral free trade agreements (FTAs) (Rana 2002; Wang 2004; Kawai and Takagi 2005; Plummer 2006; Kalra 2009; Kim et al., 2009). Feelings of frustration still linger among most Asian countries since this region remains vulnerable to future crises as they were before. Thus, strengthening cooperation to help each other became a matter of vital interest to East Asians, in the form of increasing regional integration through restructuring of financial institutions and adequate regulatory regimes.
With increased cooperation, ASEAN Economic Community (AEC) will finally be able to implement the enduring idea of grouping ten economies into a single, coherent community. Now, it is time for ASEAN to become more unified and cohesive to enable itself to move toward the next level of economic integration as ASEAN approaches 40 years of existence as a regional organization. Creation of a single market and production base, competitive economic region, achievement
92 2010 CRES Visiting Scholar’s Paper Series
of equitable economic development, and integration to the global economy are the main agenda in the ASEAN Economic Community blueprint. When ASEAN Economic Community is realized in 2015, ASEAN members will enjoy zero tariffs, and non-tariff barriers will be phased out gradually. The creation of the AEC would also allow free movement of professionals. ASEAN investors will be able to invest in sectors previously closed to foreigners and the services sector will also be opened. Customs clearance procedures will be streamlined and harmonized with the ASEAN single window.
However, additional research must be conducted before pronouncing that ASEAN, in the form of the ASEAN Economic Community, is sufficient to the task of creating create a monetary cooperation regime in East Asia. Also, ASEAN economies cannot act as a single actor in the context of regionalism in East Asia. Since the regionalism in this region will take the shape of FTAs and concomitant financial arrangements, the role of Japan, People’s Republic of China and Republic of Korea should be considered.
There are factors, such as the rise of China as a global powerhouse, Japan’s economic recovery, and the Hallyu (Korean wave); that are expected to initiate and promote regional monetary cooperation in East Asia. However, the historical background among three nations remains a challenge to pursuing regional harmonization. There are other challenges, in the western perspective, regarding the establishment monetary cooperation in East Asia that indicate that such cooperation is in its infancy; (i) lack of political will in the region (ii) wide development gaps (iii) no consensus on the degree of openness apt for real economic integration as of yet (iv) and lastly, there are no common unit of account and assurances of exchange rate stability as of yet (Kawai and Takagi 2005). Therefore, this paper aims to review the idea of establishing monetary cooperation in ASEAN and posit the role of the ASEAN Economic Community as preliminary model of regional monetary cooperation in ASEAN particularly and for Asia as a whole.
The paper is organized as follows. The first two sections contain brief historical and organizational sketches of the ASEAN Economic Community (section 2), the prospectus of regional monetary cooperation in East Asia, under the ASEAN Economic Community and the progress of ASEAN plus three (3). Then section 4 discusses rationales and future implications of regional monetary cooperation for Indonesia and
ASEAN Economic Community: Prospect for Regional Monetary Cooperation in East Asia 93
Korea, a review of several challenges that need addressed by Indonesia and Korea as individual countries. Finally, section 5 offers concluding remarks.
2. ASEAN Economic Community
2.1. The Evolution of ASEAN
Before ASEAN was formed in 1967, Southeast Asian countries have made various attempts to achieve regional cooperation both in and out of the region such as the Association of Southeast Asia (ASA), the Malaysia/Philippines/Indonesia (MAPHILINDO) group, the South East Asian Ministers of Education Organization (SEAMEO), South East Asia Treaty Organization (SEATO) and the Asian and Pacific Council (ASPAC). The main purpose of ASEAN was to increasing economic welfare among members by (i) accelarating the economic growth; (ii) promoting regional peace and stability; (iii) promoting active collaboration and mutual assistance on matters of common interest; (iv) providing assistance in the form of research and training; (v) collaborating for effective utilization of agriculture and industry; (vi) Promoting Southeast Asian studies; (vii) maintaining mutual cooperation between international and regional organizations with similar purposes.
According to Secretary General of ASEAN Rodolfo C Severino, Jr. (2007) there have been five moments that could be taken as signs of increasing cooperation among ten ASEAN members: ① The First ASEAN Summit in 1976 adopted the Treaty of Amity and Cooperation (TAC) in Southeast Asia and the Declaration of ASEAN Concord. ② The launching of the ASEAN Free Trade Area (AFTA) and the Common Effective Preferential Tariff Scheme as the main mechanism for AFTA in 1992 ③ The establishment of the ASEAN Regional Forum in 1994 is a historic event for the Asia-Pacific ④ The formulation of the ASEAN Vision 2020. In addition, there was the admission of Cambodia into ASEAN on April 30, 1999 that marked the culmination of ASEAN's efforts to bring all ten countries of Southeast Asia into the organization. All of these represent important and major events in the history of Southeast Asia.
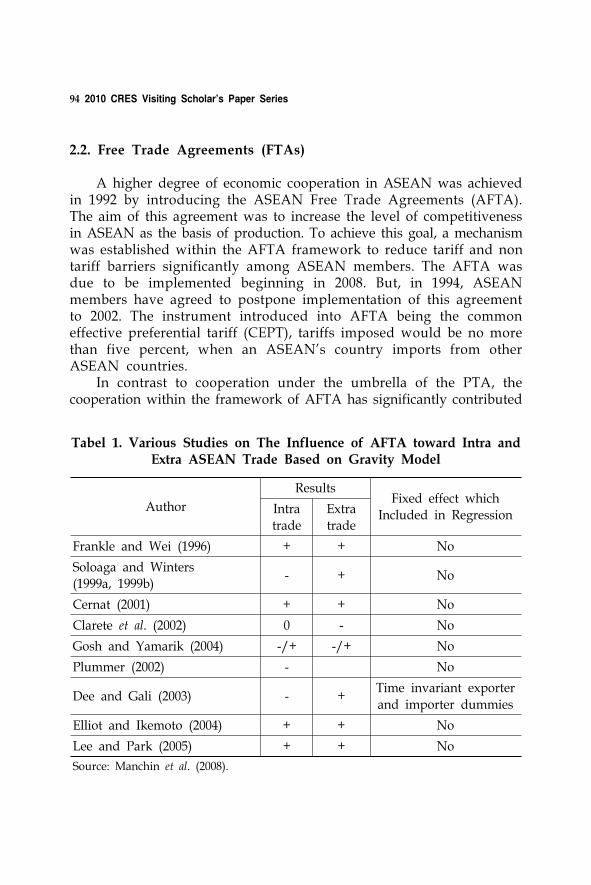
94 2010 CRES Visiting Scholar’s Paper Series
Author
ResultsFixed effect which
Included in RegressionIntra trade
Extra trade
Frankle and Wei (1996) + + No
Soloaga and Winters (1999a, 1999b)
- + No
Cernat (2001) + + No
Clarete et al. (2002) 0 - No
Gosh and Yamarik (2004) -/+ -/+ No
Plummer (2002) - No
Dee and Gali (2003) - +Time invariant exporter
and importer dummies
Elliot and Ikemoto (2004) + + No
Lee and Park (2005) + + No
Source: Manchin et al. (2008).
Tabel 1. Various Studies on The Influence of AFTA toward Intra and Extra ASEAN Trade Based on Gravity Model
2.2. Free Trade Agreements (FTAs)
A higher degree of economic cooperation in ASEAN was achieved in 1992 by introducing the ASEAN Free Trade Agreements (AFTA). The aim of this agreement was to increase the level of competitiveness in ASEAN as the basis of production. To achieve this goal, a mechanism was established within the AFTA framework to reduce tariff and non tariff barriers significantly among ASEAN members. The AFTA was due to be implemented beginning in 2008. But, in 1994, ASEAN members have agreed to postpone implementation of this agreement to 2002. The instrument introduced into AFTA being the common effective preferential tariff (CEPT), tariffs imposed would be no more than five percent, when an ASEAN’s country imports from other ASEAN countries.
In contrast to cooperation under the umbrella of the PTA, the cooperation within the framework of AFTA has significantly contributed
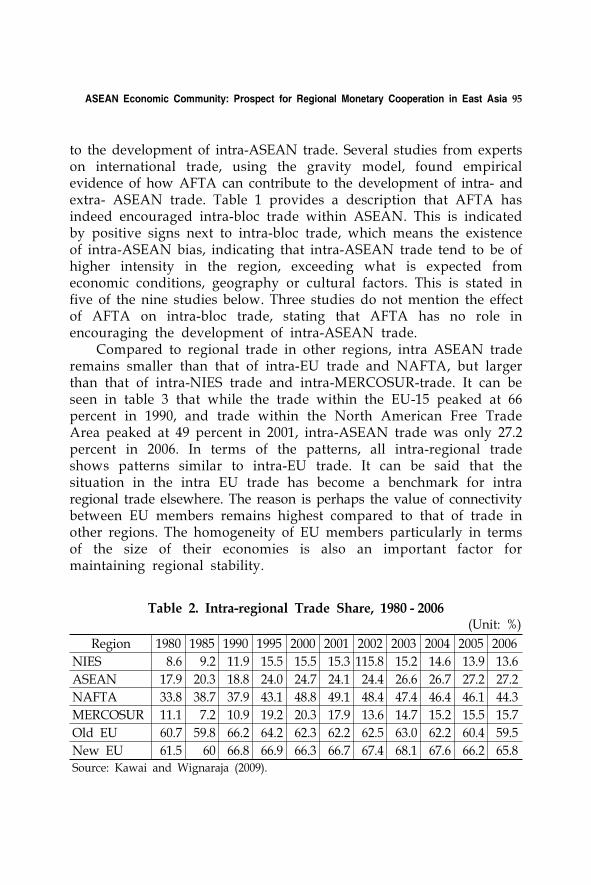
ASEAN Economic Community: Prospect for Regional Monetary Cooperation in East Asia 95
Region 1980 1985 1990 1995 2000 2001 2002 2003 2004 2005 2006
NIES 8.6 9.2 11.9 15.5 15.5 15.3 115.8 15.2 14.6 13.9 13.6
ASEAN 17.9 20.3 18.8 24.0 24.7 24.1 24.4 26.6 26.7 27.2 27.2
NAFTA 33.8 38.7 37.9 43.1 48.8 49.1 48.4 47.4 46.4 46.1 44.3
MERCOSUR 11.1 7.2 10.9 19.2 20.3 17.9 13.6 14.7 15.2 15.5 15.7
Old EU 60.7 59.8 66.2 64.2 62.3 62.2 62.5 63.0 62.2 60.4 59.5
New EU 61.5 60 66.8 66.9 66.3 66.7 67.4 68.1 67.6 66.2 65.8
Source: Kawai and Wignaraja (2009).
Table 2. Intra-regional Trade Share, 1980 - 2006(Unit: %)
to the development of intra-ASEAN trade. Several studies from experts on international trade, using the gravity model, found empirical evidence of how AFTA can contribute to the development of intra- and extra- ASEAN trade. Table 1 provides a description that AFTA has indeed encouraged intra-bloc trade within ASEAN. This is indicated by positive signs next to intra-bloc trade, which means the existence of intra-ASEAN bias, indicating that intra-ASEAN trade tend to be of higher intensity in the region, exceeding what is expected from economic conditions, geography or cultural factors. This is stated in five of the nine studies below. Three studies do not mention the effect of AFTA on intra-bloc trade, stating that AFTA has no role in encouraging the development of intra-ASEAN trade.
Compared to regional trade in other regions, intra ASEAN trade remains smaller than that of intra-EU trade and NAFTA, but larger than that of intra-NIES trade and intra-MERCOSUR-trade. It can be seen in table 3 that while the trade within the EU-15 peaked at 66 percent in 1990, and trade within the North American Free Trade Area peaked at 49 percent in 2001, intra-ASEAN trade was only 27.2 percent in 2006. In terms of the patterns, all intra-regional trade shows patterns similar to intra-EU trade. It can be said that the situation in the intra EU trade has become a benchmark for intra regional trade elsewhere. The reason is perhaps the value of connectivity between EU members remains highest compared to that of trade in other regions. The homogeneity of EU members particularly in terms of the size of their economies is also an important factor for maintaining regional stability.
96 2010 CRES Visiting Scholar’s Paper Series
2.2.1. ASEAN Economic Community The intra-ASEAN FTA faces hurdles in the view of ASEAN
members. The main reason being the relatively weak bargaining position of ASEAN countries to become more integrated and join in on the intra-ASEAN trade, and also important is the divergence of economic performance among countries. ASEAN has yet to find a center or core for the whole group. Yi (2005) argues that a core group is important for regional economic integration as a unifier or balancer to accelerate economic integration. In the ASEAN, it can be said no member of ASEAN has the capability to assume the role of a core. The ASEAN may consider creating a regional ‘board’ to manage its external relationship, rather choosing one country to be ASEAN’s representative.
Therefore, the main challenge for the ASEAN Economic Community is to ensure that the entire community will become more integrated and benefit to resulting increases in their welfare. The AEC blueprint has been signed by ten leaders of ASEAN countries in the 13th ASEAN Summit held in Singapore in November 2007.1) The main principles of explicitly mentioned in AEC blueprint AEC are openness, outward perspective, an inclusive and market driven economy. It will be applied widely in the transformation ASEAN in four strategic phases; (1) a single market and production base to be established in the 2008 - 2009 period; (2) highly competitive economic region will apply in 2010-2011; (3) achievement of parity in economic development among members by 2012-2013 and (4) lastly, full integration into the global economy by 2014-2015.
From the AEC's perspective, forming a single market and production base in the ASEAN region is a major issue that will have a direct and significant impact on the economy of ASEAN countries. Five main components in the process of formation of the ASEAN single market include: (1) free flow of goods (free flow of goods); (2) free
1) The terminology of “Economic Community” is open to debate. It is similar to the acronym APEC, which sought to reinvent itself from Asian Pacific Economic Cooperation to become Asia Pacific Economic Community. This idea was ejected explicitly, as this word did not recognize APEC as a non binding organization. This also gave the impression that APEC was intending to move in the direction of the European community model (Plummer 2006).
ASEAN Economic Community: Prospect for Regional Monetary Cooperation in East Asia 97
flow of services (free flow of services), (3) free flow of investment (free flow of investment), (4) free flow of capital (free flow of capital), and (5) the free flow of skilled labor.
According to Chaves (2008), the single market and production base will basically include the region as a whole as known to ASEAN member countries, and not just markets and resources within national boundaries and only involving economic actors at the national level. This means that a member state shall give goods and services originating from anywhere in ASEAN treatment equal to their national products. This will give the same privileges and access to all ASEAN investors as well as investors of the respective nations, and skilled workers and professionals will be free to offer their services anywhere in the ASEAN.
To accelerate the process of forming a single market and production base for ASEAN, the organization has agreed to liberalize 12 priority sectors in implementing ASEAN integration in accordance with the AEC scheme, namely: (1) agriculture-based products (agro-based goods), (2) Air Transportation (maritime transport), (3) automotive products (automotive products), (4) e-ASEAN, including communications and telecommunications equipment (including e-ASEAN ICT equipment), (5) electronic goods (electronic goods), (6) fisheries (fisheries), (7) Health Products (health care products), (8) rubber-based goods (rubber- based goods), (9) Textiles and clothing (textiles and clothing), (10) Tourism (tourism), (11) wood-based products (wood-based products), (12) Logistics (logistics). Cooperation framework for sectors number 1-11 was signed in November 2004, while the agreement for the logistics sector was reached in the year 2006.
To facilitate this process, ASEAN needs a monetary system and a system of payments which can be accessed equally by each member. Therefore, the AEC blueprint will pay more attention towards building up the financial sectors. This sector will take on importance with regard to free flow of trade in services and free flow of capital among members. There will be no substantial restriction to ASEAN services suppliers in providing services and in establishing companies across national borders with the region, nor will they be subject to domestic regulations. In liberalizing services, there should be no back loading commitments, and the flexibility previously agreed-upon shall be accorded to all ASEAN members. In particular for the financial
98 2010 CRES Visiting Scholar’s Paper Series
service sector, members should be allowed to take measures to ensure orderly financial sector development, and maintain financial and socio-economic stability. As a whole, assessment of financial services will consider prudential measures and balance of payment safeguard as provided for under the WTO General Agreement Trade in services. Although this kind of services has been mentioned in the ASEAN single market and base production plan, but in reality, there is no direct action that explicitly shows the form of financial sector cooperation. There was much dialogue and meeting but there was no call for action, since this plan for the financial services has yet to put in place prudential principles that would enable countries not to be interfered by the other country (AEC Blueprint 2008).
3. The Prospectus of Regional Monetary Cooperation
It should be understood that regional economic cooperation, of course, is not limited to FTA or derivative forms of the FTA. Investment and trade that will become an important element in regional economic cooperation, but there are other things that are also equally important, namely stability and sustainability of the country's economic development as well as regional economic development. If liberalization in regional cooperation liberalizations only pays attention to trade and investment issues and ignores cooperation in other areas like finance, the economy will not be able achieve balanced growth. In the state that is able to promote its economy quickly but does not engage in efforts to assist and cooperate with other countries, for example, in terms of financial assistance and increased capacity building, there will be a widening gap between a country that has advanced and countries that were left behind, in the framework of economic cooperation. The result will be that continuous economic cooperation will be difficult.2) However, it is debatable whether
2) The basics of the theory were summarized by the Hungarian economist Béla Balassa in the 1960s. Balassa believed that supranational common markets, with their free movement of economic factors across national borders, naturally generate demand for further integration, not only economically (via monetary unions) but also politically―and, thus, that economic communities naturally evolve into political unions over time The degree of economic integration can be

ASEAN Economic Community: Prospect for Regional Monetary Cooperation in East Asia 99
financial cooperation should come before than regional integration. Wang (2005) argues that “though financial cooperation focuses on issues pertinent to financial spheres, it cannot be sustained as a productive tool without broader economic integration at the regional level”. In short, many scholars agree that achieving strong economic interdependence at the regional level is the most important rationale for regional financial cooperation, regional spillover effects and externalities (Bayoumi et al., 2000; Kawai and Takagi 2005; Wang 2005).
In addition, Kawai and Takagi (2005) noted at least three rationales behind the willingness among countries to promote regional monetary cooperation in East Asia; first, the highest levels of regional trade integration imply higher degree of interdependence in the region in terms of both demand and supply shocks. Second rationale comes from the desire to create a new regional financial architecture to secure financial stability. The third rationale for regional monetary cooperation is the lower cost and greater effectiveness of discussing regional issues at the regional level. In sum, all of these reasons are aimed at preventing any future financial and monetary crises, since crises may lead to a contagions effect. Thus having secured financial stability, harmonization of financial sector regulations and the stabilization of exchange rates are the final goals for achieving regional monetary cooperation. One should be careful enough to be able to separate the meaning between monetary and financial cooperation, but these two kinds of cooperation should go together and one should not be left behind the other, to create a strong regional financial framework.
Actually, this is not a new idea, as it can be seen in literature as early as 1980 (see Dodsworth and Diamond 1980). But, at that time, most countries in ASEAN still adhered to the principle of nationalism, rejecting reforms and foreign interventions. Progressively, ASEAN has sought to pursue strong economic integration gradually, but unfortunately, all efforts were limited to the establishment of free trade areas that did not accompany activities for comprehensive trade facilitation such as cooperation in the area of finance, common
categorized into six stages: 1) Preferential trading area, 2) Free trade area, 3) Customs union, 4) Single market, 5) Economic and monetary union, 6) Complete economic integration. These differ in the degree of unification of economic policies, with the highest one being the political union of the states
100 2010 CRES Visiting Scholar’s Paper Series
currency and equal monetary cooperation for all members. There are two features that can be classified part of the framework
in promoting regional monetary cooperation in East Asia. First, ASEAN can begin regional monetary cooperation as part of the ASEAN Economic Community; Secondly, ASEAN can join with the prosperous East Asian countries in an ASEAN plus three framework. The following discussion will offer deep analyses on the progress in achieving financial and monetary cooperation in the context of the ASEAN Economic Community and ASEAN plus three.
3.1. Regional Monetary Cooperation Under ASEAN Economic Community
Overall, institution-building on the AEC, based on its score card for 2009 revealed that 73.6 percent of the work has been achieved. However, 82 percent of the work on creating a single market and production base slated for 2008-2009 in the blueprint has been achieved. The reason that the work remains incomplete is due to difficulties in handling freer flow of capital mobility, freer flow of labor and freer flow of financial sector. More obstacles remain for the financial sector since the current monetary policy in some ASEAN countries suffering from the crisis tend to become even tighter. But the progress being made currently shows that ASEAN member countries intend to be serious about implementing the stronger financial and monetary stability in the region.
Today, ASEAN has entered the second phase of implementing the AEC blueprint by 2015. The agreement on financial liberalization takes the region another step closer to implementing the Roadmap Commitment for Financial and Monetary Integration of ASEAN (RIA FIN).3) Before we move on to the details about the implementation of RIA FIN, it might be worthwhile to look at what might come about as a result of ASEAN achievements on financial liberalization.
In the AEC blueprint, the on national interests of the respective
3) RIA-FIN was launched by the ASEAN Leaders in October 2003 in Bali. Under the Roadmap, approaches and milestones have been identified in areas deemed crucial to finance and monetary integration, namely (a) capital market development, (b) capital account liberalization, (c) financial services liberalization and (d) ASEAN currency cooperation.

ASEAN Economic Community: Prospect for Regional Monetary Cooperation in East Asia 101
members is the basis for their participation in liberalizing their financial sectors (see table 3). It is clear that even though financial and monetary cooperation is important in for solid economic integration, not all ASEAN members would gladly join the financial liberalization sub sector under AEC in 2015. Therefore, the fact that creating ASEAN monetary cooperation is at its infancy is not only well documented, but is apparent in reality.
However, as it progresses, ASEAN will become more unified under AEC framework. Many scholars found that since 2003 ASEAN nations were favorably disposed to a monetary union in accordance with the criteria of Optimum Currency Agreement (see Ramayandi 2005; Baharaumshah et al., 2007). ASEAN, then, would continue to work together to enhance the competitiveness and depth of ASEAN’s financial markets, particularly in areas of capital market development, financial services liberalization and capital account liberalization.
The formation of bond market development has identified the indicators for benchmark reference points for measuring the state of ASEAN’s bond market. ASEAN will also promote dual listing of securities and cross borders offerings of debt securities and collective investment schemes.
The progress made also includes the establishment of ASEAN exchange linkages; initiative to develop a mutual recognition framework for movement of capital market professionals across the region. All of the progress in terms of capital market developments and integration is the result of the 14th ASEAN Finance Ministers’ Meeting (AFMM) in Nha Trang, Viet Nam, 8 April 2010.
For liberalization of financial services, the ASEAN Finance Ministers agreed to adopt the safeguards framework for the financial services sub-sector. Protection framework will serve as a modality in the fifth round of negotiations for financial services liberalization within the framework of the ASEAN Framework Agreement on Services (AFAS). This protection framework has flexibility built-in in the form of a list that allows member states to impose prudential policies or restrictions on certain areas in order to maintain the stability of national financial systems.

102 2010 CRES Visiting Scholar’s Paper Series
Financial Services
Sub - Sectors Member of Countries
Insurance
Direct Life insurance Indonesia, Phillipines
Direct Non-Life InsuranceBrunei, Cambodia, Indonesia, Malaysia, Philippines, Singapore and Vietnam
Reinsurance and RetrocessionBrunei, Cambodia, Indonesia, Malaysia, Philippines, Singapore and Vietnam
Insurance IntermediationCambodia, Indonesia, Malaysia, Singapore and Vietnam
Services Auxiliary to InsuranceBrunei, Cambodia, Indonesia, Malaysia, Philippines, Singapore and Vietnam
Banking
Acceptance of Deposit and other Repayable Funds from the Public
Cambodia, Laos and Vietnam
Lending of All Types Cambodia, Laos and VietnamFinancial Leasing Cambodia, Laos and VietnamAll payment and money transmission services
Cambodia, Laos and Vietnam
Guarantee and commitmentsCambodia, Laos, Myanmar and Vietnam
Capital market
Trading for own accounts of for account of customer
Brunei, Indonesia, Malaysia, Philippines, Singapore and Thailand
Participation in issues of all kinds of securities
Indonesia, Philippines (subject to constitutional and legislative limitations)
Asset managementIndonesia, Philippines, Singapore and Thailand
Settlement and clearing services for financial assets
Indonesia, Philippines, Singapore and Thailand
Others
Provision and transfer of financial information, financial data processing and related software by suppliers of other financial services
Philippines and Myanmar
Advisory, intermediation and other auxiliary financial services
Philippines, Singapore, Thailand and Viet Nam
Source: ASEAN Economic Community Blueprint (2008).
Table 3. Financial Services Sub - Sectors Identified for Liberalisation by 2015
ASEAN Economic Community: Prospect for Regional Monetary Cooperation in East Asia 103
ASEAN Central Bank Governors have also agreed on the formation of a Working Committee on Payment and Settlement System (WC- PSS). WC-PSS was formed because there is not currently a clear direction and plan for development of Payment and Settlement Systems (PSS) on Blueprint cross-border AEC 2015. Meanwhile, facilitating the flow of goods, services, energy, skills, investment and freer flow of capital required payment and settlement system of cross border transactions are efficient, safe, and reliable. The purpose of WC-PSS is to prepare the ASEAN Payment and Settlement Systems for the creation of the AEC in 2015 through study and assessment of the condition and needs of ASEAN-PSS users and provide policy recommendations for the development and harmonization of ASEAN- PSS.
However, also noted in the meeting was that ASEAN countries are still faced with several challenges such as (a) the potential instability of capital flows b) effort to boost domestic demand as a source of growth c) implementation of the exit policy. In response, strengthening ASEAN cooperation in finance and economic integration should enhance regional surveillance capacity, especially by establishing the Macroeconomic Finance Surveillance Office (MFSO) at the ASEAN secretariat. ASEAN also reaffirmed its commitment to infrastructure development to support the medium term and long term growth of the region. In 2010, ASEAN also has implemented insurance cooperation and customs integration as a mandate on AEC blueprint.
3.1.1. ASEAN Single Currency The Roadmap Commitment for Financial and Monetary
Integration of ASEAN in the beginning has been the subject of much interpretation. This commitment was set up to initiate ASEAN single currency, as ASEAN members believe that a single currency will contribute to the financial stability in the regional economy, including stabilization of prices. Moreover, a monetary union will give its members lower cost or risk of cross-border business through elimination of currency risk. However, monetary union requires attainment of two conditions as basic criteria: (i) the intensity of intra-regional trade and (ii) convergence of macroeconomic conditions.
In the case of ASEAN, some scholars are convinced that ASEAN is applicable for a monetary union. According to Bayaoumi et al. (2000)
104 2010 CRES Visiting Scholar’s Paper Series
ASEAN met the criteria for a monetary union because 1) the macroeconomic stability that had prevailed in the period preceding the crisis created a generally favorable backdrop against which to contemplate such a union. The major ASEAN economies had accumulated policy credibility as a result of achieving low inflation, small fiscal deficits, and modest government debt to GDP ratios. This rendered a number of ASEAN members attractive potential partners in a regional monetary arrangement, 2) the predicted level of exchange rate variability associated with fundamentals among the largest ASEAN economies (Malaysia, the Philippines, and Thailand) is uniformly in the 8-11% range. This is not much higher than the 6-9% range for intra-EU exchange rates calculated using the 1987 data and a similar methodology. From this point of view, the Asian economies do not lag far behind in terms of the level of preparedness compared to the monetary union in continental Europe in 1987.4)
However, ASEAN members are still hesitant about engaging in a monetary union. It is undeniable that ASEAN nations are diverse not only in size, cultures, histories, religions, races, values and traditions, but also in levels of development and national priorities. Monetary integration implies less control over national monetary and fiscal policy to stimulate the economy. Therefore, greater convergence in macroeconomic conditions would improve conditions and confidence concerning a common currency. Meanwhile, as mentioned before, intra-ASEAN trade is relatively small. Around 80 percent of ASEAN trade is conducted with countries outside of ASEAN. It is significant that ASEAN economies are more concerned about currency stability against major international currencies, like the US dollar, than among themselves.
From the ASEAN’s perspective, preventing future crises is more important than having a single ASEAN currency. There is also another reason, that although the ASEAN’s current economic performance are more convergent in terms of macroeconomic stability, there is less
4) This is consistent with the view (advanced by Frankel and Rose 1998) that the optimum currency area criteria are themselves related to decisions on economic integration, so that the desirability of a monetary union becomes itself partly a function of the underlying political choices, which helps to explain why monetary unions generally correspond to national borders.
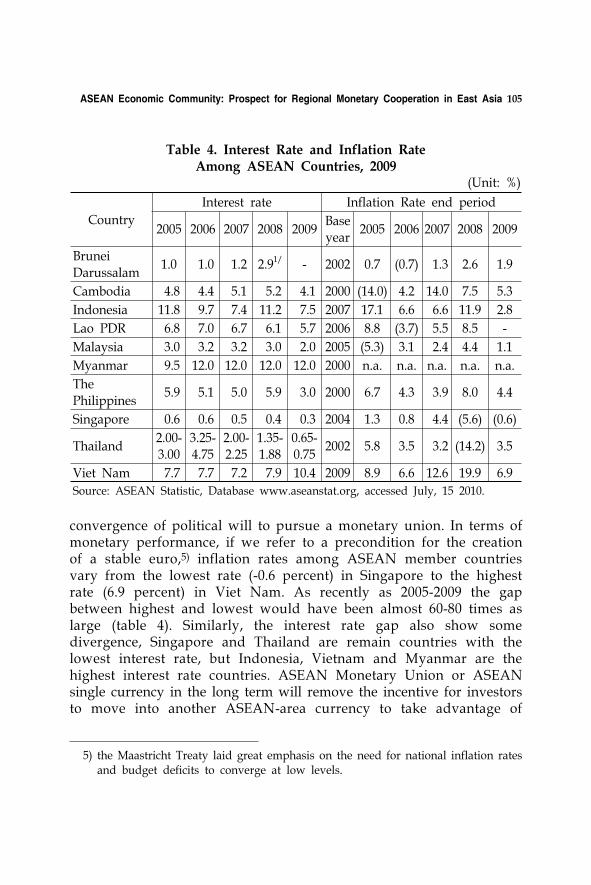
ASEAN Economic Community: Prospect for Regional Monetary Cooperation in East Asia 105
Country
Interest rate Inflation Rate end period
2005 2006 2007 2008 2009Base year
2005 2006 2007 2008 2009
Brunei Darussalam
1.0 1.0 1.2 2.91/ - 2002 0.7 (0.7) 1.3 2.6 1.9
Cambodia 4.8 4.4 5.1 5.2 4.1 2000 (14.0) 4.2 14.0 7.5 5.3
Indonesia 11.8 9.7 7.4 11.2 7.5 2007 17.1 6.6 6.6 11.9 2.8
Lao PDR 6.8 7.0 6.7 6.1 5.7 2006 8.8 (3.7) 5.5 8.5 -
Malaysia 3.0 3.2 3.2 3.0 2.0 2005 (5.3) 3.1 2.4 4.4 1.1
Myanmar 9.5 12.0 12.0 12.0 12.0 2000 n.a. n.a. n.a. n.a. n.a.
The
Philippines5.9 5.1 5.0 5.9 3.0 2000 6.7 4.3 3.9 8.0 4.4
Singapore 0.6 0.6 0.5 0.4 0.3 2004 1.3 0.8 4.4 (5.6) (0.6)
Thailand2.00-3.00
3.25-4.75
2.00-2.25
1.35-1.88
0.65-0.75
2002 5.8 3.5 3.2 (14.2) 3.5
Viet Nam 7.7 7.7 7.2 7.9 10.4 2009 8.9 6.6 12.6 19.9 6.9
Source: ASEAN Statistic, Database www.aseanstat.org, accessed July, 15 2010.
Table 4. Interest Rate and Inflation Rate Among ASEAN Countries, 2009
(Unit: %)
convergence of political will to pursue a monetary union. In terms of monetary performance, if we refer to a precondition for the creation of a stable euro,5) inflation rates among ASEAN member countries vary from the lowest rate (-0.6 percent) in Singapore to the highest rate (6.9 percent) in Viet Nam. As recently as 2005-2009 the gap between highest and lowest would have been almost 60-80 times as large (table 4). Similarly, the interest rate gap also show some divergence, Singapore and Thailand are remain countries with the lowest interest rate, but Indonesia, Vietnam and Myanmar are the highest interest rate countries. ASEAN Monetary Union or ASEAN single currency in the long term will remove the incentive for investors to move into another ASEAN-area currency to take advantage of
5) the Maastricht Treaty laid great emphasis on the need for national inflation rates and budget deficits to converge at low levels.
106 2010 CRES Visiting Scholar’s Paper Series
higher interest rates. On the other hand, in the short term, interest rates affect
economic activity and also inflation because of their impact on longer term rates. When longer-term rates are determined by conditions in the ASEAN-area as a whole, the tools of domestic monetary policy will survive only in a drastically weakened form. For ASEAN monetary authorities, this is the most challenging obstacle, as they may loss their independence. It can be argued that central banks of each respective member still can manage the transition to a single interest rate in a coordinated fashion, and there will be plenty of opportunity for central bank governors and presidents to meet informally. Based on the European Monetary Union experience, local monetary authority still can manage their domestic monetary policy to some extent by using reserve requirements, discount rates or even market operations. However, in the case of ASEAN, claims that pursuing ASEAN single currency would need to gain investors confidence is open to debate, as the futures markets will reflect the fact that currencies will be lock together in the ASEAN region.
The modality and the preparations made by ASEAN toward the achievement of ASEAN Economic Community appears to be far from idea of ASEAN single currency, and actually much closer to monetary cooperation, particularly among ASEAN central banks governors.
Compared to other monetary union in the world, the single ASEAN currency is big on profound thinking but rather weak on realization. But ASEAN as an association would still continue act on its desires rather than what other people say. This is also similar to what happened in the formation of the European single currency in 1997, rather like an economist's version of Frankenstein's monster, an attempt to create new life out of old body parts. But, because the leaders of Europeans countries had already agreed to implement European Monetary Union in 1992, and it would be completed and launched by 1998. That is why in spite of the indecision among Europeans countries, the EMU came into existence. Thus, considering the cost and benefit of the ASEAN single currency, ASEAN have more to learn from the European experience. ASEAN leaders are not only need political will to stick together in the region, but they need to commit themselves to an agreement establishing ASEAN Monetary Union.
ASEAN Economic Community: Prospect for Regional Monetary Cooperation in East Asia 107
3.1.2. Recent Study and Policy Implication for ASEAN Monetary Integration
Most studies in the last five years focused either on demand shock or supply shock.6) Aggregate demand shock among ASEAN economies tend to be highly correlated and already were during 1960-2002 particularly for the ASEAN5 (Bayoumi et al., 2000; Ramayandi et al., 2005; Baharumshah et al., 2007). Meanwhile, ASEAN become more synchronized in aggregate supply shock elements due to the massive capital inflow and over investment into the region since 2002 (Ramayandi 2005; Bayoumi 2000). The magnitude of this similarity led the author to come up with the suggestion that ASEAN, particularly ASEAN 5, should consider introducing a more integrated monetary system.
Convergence in economic development remains an impediment to the design and decision regarding political deliberations on regional monetary cooperation. After examining this issue, Bunyaratavej and Hahn (2003) conclude that common currency may not be proper for application in ASEAN.7) As discussed earlier, the gap between interest rate and inflation rate among ASEAN economies are altogether impediments to them in the monetary system. Study by Bunyaratavej and Hahn (2003) succinctly indicated this impediment by considering simple standard deviation of aggregate economic growth of the five ASEAN countries. The results show during 1994-2002 downward trends are particularly apparent in times of crises. This trend was more pronounced when one ignores the crises-affected measurement of 1997 and 1998. Pros and cons of the result of the recent study aside, it means that ASEAN should provide some room for more synchronized policy regimes, which would be necessary to maintain an arrangement such as the common currency regime.
On the other hand, there are numerous studies that opine that ASEAN does not have a strong regional incentive and weak prerequisites for monetary unification, but almost all economic indicators suggest
6) Demand shock is the component of macro-policy shocks and public reference shocks in private demand behavior, while supply shock is regarded as the supply or financing development such as foreign direct investment and capital inflow into the economies.
7) By applying the s and the b convergence model, they find that in terms of per capita income growth there is evidence of economic divergence in the region.
108 2010 CRES Visiting Scholar’s Paper Series
that ASEAN countries are ready for cooperation on economic grounds (Aminian 2005). Therefore, ASEAN alone may not favor trying for monetary cooperation, at least not for the purpose of preventing future crises, and even more for monetary unification; this is because ASEAN needs other countries to join in the monetary cooperation to cope with any shock that probably affect the region.
3.2. Regional Monetary Cooperation Under ASEAN Plus Three
Currently, there has been an unprecedented increase in ASEAN FTA activity as multilateralism and regionalism is pursued in East Asia. Even ASEAN FTA is a latecomer in the move toward FTAs compared to other similar agreements in the Americas, Europe and Africa. The ASEAN’s external economic relations began in 1997 when ASEAN built a network with Japan, Republic of Korea (South Korea) and People Republic of China; which would later be called ASEAN +3. Basically, the major factors behind the FTA initiatives in ASEAN are the deepening of market driven economic integration; the progress of European and North American economic integration; and the Asian financial crisis (Kawai and Wignaraja 2009).
At the informal meeting of ASEAN leaders in Singapore in 2000, efforts were made to conduct assessment on the cooperation between ASEAN and China.8) Japan quickly followed China by signing The Framework Agreement for Comprehensive Economic Partnership with ASEAN in Bali 2003.9) South Korea did not want to lag behind further in concluding an FTA with ASEAN. They started negotiation on the ASEAN-South Korea Comprehensive Economic Partnership in
8) CAFTA creates an economic region with about 1.7 billion potential consumers, combined GDP of about US$2 trillion, and the combined trade of about US$1.23 trillion, which makes it the world's largest FTA in terms of total population. ASEAN China's total trade was around US$42.8 billion and US$55.3 billion in 2002 and 2003.
9) This relationship is of vital importance to the Japanese economy whose two-way trade with the ASEAN nations totaled $125 billion in 2002. This makes ASEAN a larger trading partner with Japan than China (Tourk 2004). The fact that Japan suddenly also wanted to reach a plurilateral trade agreement with ASEAN as a whole, can therefore reflect Japan’s intention to counterbalance China’s growing economic and political importance in the East Asian region.

ASEAN Economic Community: Prospect for Regional Monetary Cooperation in East Asia 109
2005, which was implemented in 2007. This agreement hereafter becomes more popular as it puts into practice the plan by the East Asian Economic Caucus (EAEC), which was proposed by the former Malaysian Prime Minister Mahathir Muhammad in 1997. The basic framework of the ASEAN+3 Meeting has its origin in the EAEC proposal. The ASEAN+3 Summit was regarded as an arena that plays an important role in promoting regular communication and it has been held every year since. This agreement was to enhance the Intra-regional trade which, as mentioned before, intra ASEAN trade only represented 27.2 percent of the total trade. But by including Japan, China and Korea, intra ASEAN+3 trade increased to than 40 percent in 2006 and will rise even further if ASEAN widening its FTA with Australia, New Zealand and Canada (Figure 1).
1980 1985 1990 1995 2000 2001 2002 2003 2004 2005 2006
70
60
50
40
30
20
10
0
ASEAN
ASEAN+3
ASEAN+6
ASEAN+China+ROK+Hong Kong+China+Taiwan
ASEAN+3+Hong Kong+China+Taiwan
ASEAN+6+Hong Kong+China+Taiwan
40.542.3
46.3
54.5 54.5 54.5 56.3 57.3 58.5 58.4 57.655.4
36.8 39
43.1
51.9 51.9 53.855.4 54.555.9
52.1
23.7
???
22.3
39.140.343.4 44.3 45.2 45.5
42.4 43 43.145.842.6
30.2 30.2
37.6 37.3 37.1 37.9 39 39.2 38.9 38.3
33.3
17.920.3 18.8
24 24.3 24.1 24.426.6 26.3 27.7 27.2
34.6 34.8
40.8 40.6 40.6
Source: Kawai and Wignaraja (2009), has modified.
Figure 1. Trade Share between ASEAN and Its Trading Partners 1980-2006
However, some ASEAN countries are unhappy with the slow progress of these FTAs. China, Japan and Korea are likely to attempt to reach bilateral agreements rather than a multilateral agreement, which was not easy when negotiating with many countries with high heterogeneity. Thus, they began to seek bilateral agreement with
110 2010 CRES Visiting Scholar’s Paper Series
specific ASEAN members. Japan started negotiation with Singapore for such a bilateral agreement.10)
Despite the opinion of deteriorating trade due to the ASEAN FTA with its trading partners, there has actually been remarkable deepening and strengthening of monetary and financial cooperation in the East Asia region. There is a wide range of discussions in various policy forums concerning regional exchange rate policy coordination and monetary integration. These discussions, especially on the optimal exchange regime for the region, intensified after the Asian financial crisis erupted in 1997, since keeping the exchange rates fixed, while prematurely opening the capital account, was considered the mistaken policy that led to the crisis.
In theory, it has been mentioned that the benefit of financial development is to enhance the growth of financial globalization and reduce vulnerability to crises. This is particularly so for small open economies that have less than advantageous bargaining position in terms of trade and limited access to international financial institutions. In globalizing financial institutions, there is the issue of domestic and international constraints and their role in financing low-income economies. Numerous studies found that financing of this kind lead to unpredictable adverse effects in the form of capital account liberalization in the mismanaged domestic financial sector, which was in turn blamed as the cause of Asian Crises (Aghion and Banerjee 2005; Mishkin 2006; Kose 2009).
It is suggested that the formation of regional monetary cooperation in East Asia is to start with common currency, swap arrangement, financial surveillance and ultimately lead to the establish of a regional bond market (Nasution 2005). In the scheme of ASEAN plus three the cooperation would not begin with a common currency, as this idea was rejected by the IMF (International Monetary Fund) and the United States. However, for purposes of this analysis, we start with these stages outlined above to draw the progress of monetary cooperation in East Asia under ASEAN plus three schemes.
10) Singapore is one country in ASEAN which has concluded many bilateral agreements. The study by WTO (2008) reveals that in terms of trade facilitation, the only bilateral agreement in ASEAN that has pursued completed trade facilitation is the bilateral agreement between Singapore and Australia.
ASEAN Economic Community: Prospect for Regional Monetary Cooperation in East Asia 111
3.2.1. Asian Monetary Fund In September 1997, Japan forwarded a proposal to create an
Asian Monetary Fund (AMF). The members of this institution would contribute some share of their foreign reserves to a central fund, which would be used to provide financial assistance to countries affected by currency crises. The belief that the IMF could not monitor and respond appropriately to crises has led to support for a regional fund. The case for the creation of AMF is strong, suggesting that it could build on Asia’s savings surpluses, foreign exchange reserves, and net-creditor status (including reserves and Treasury bills). Currency crises tend to be more regional and spread along the lines of trade linkages, thereby disrupting regional trade flows. Since currency crises create regional costs, the region would have an incentive to mitigate these by providing a financial safety net.
Nasution (2005) summarized that the purposes of AMF was for (1) policy dialogue and discussions on mutual interests, monitoring and surveillance (2) liquidity assistance, and (3) exchange rate coordination. The above proposal was also intended to position Asia as a region free from interference. The AMF should take into consideration the character of the Asia in every aspect of its decision making process, particularly for prudential rules and regulations; as Asian corporations have some unique characteristics vis-a-vis with western corporations.
In the AMF proposal, it was mentioned that a $100 billion fund was to be created, half of which was to be provided by Japan and the remainder by the PRC; Hong Kong, China; Singapore; and Taiwan. It was argued that this would provide sufficient liquidity that could be quickly mobilized to forestall speculative attacks on the region's currencies. Shinohara (2000) points out three mechanisms that can be adopted by the AMF for this purpose. The first mechanism is borrowing from member countries, similar to the IMF’s General Agreement to Borrow (GAB). To create this facility, each country is required to place part of their external reserves at the AMF. The second mechanism is to help member countries of the AMF to mobilize funds from the capital market. AMF could receive credit enhancements from its rich member countries. The third mechanism for the AMF for providing emergency financial support to its member countries is through provision of guarantees to borrow directly from international markets. The first part of the process involves membership of the AMF being opened to those
112 2010 CRES Visiting Scholar’s Paper Series
countries with relatively well developed money markets in East Asia, Southeast Asia and the Pacific Rim countries, namely: Japan, Korea, PRC, NIEs and ASEAN five.
Although this proposal already includes a mechanism and structure, the AMF idea was strongly opposed by the US, Europe, People Republic of China and the IMF when it was presented in the Annual Meetings of the IMF and the World Bank in Hong Kong in 1997. The rejection by IMF was due to fear on the part of the US and the IMF of the possibility of losing their hegemony in Asia. On the contrary, Asia perceived that IMF miscarried in handling the crisis of 1997 - 1998. Asians found that their long history of cooperation and partnership with America during the Cold War was no longer considered valuable to America. This may be the reason why the IMF was selective in its response to the crisis and why it not able to garner the support of the US and Europe in dealing with the Asian financial crisis (Nasution 2005, p. 429).11)
Therefore Asian countries believe that they need to pool external reserves as a kind of collective action to help neighbors supplement existing IMF financial facility in meeting their liquidity needs. Then, the regional monetary fund or an equivalent structure continues to feature prominently in regional consultative meetings, and in academic papers and articles. Besides reaching the goal as mentioned in AMF, there have also been active discussions concerning the development of regional bond markets, Asian Currency Unit (ACU) or even the Asian Monetary Union.
Negative response of the AMF proposal was the culmination of the growing importance of the Asian countries in the world. A number of leading emerging countries in East and Southeast Asia were invited in 1999 to join a global world forum such as the BIS (Bank for International Settlements) and G20 as well as many committees in the IMF. In addition, in the IMF meeting of September 1999, the IMF board of directors stressed that “surveillance should pay
11) The United States, for example, did not bilaterally contribute to the Thai program and only provided the second line of defense to Korea and Indonesia packages. Thailand hosted the US military bases during the Vietnam War and Korea was a frontline country against communism during the Cold War and both countries supported America in Iraq War (Nasution 2005, p. 429).
ASEAN Economic Community: Prospect for Regional Monetary Cooperation in East Asia 113
more attention to the vulnerabilities of individual countries and to the international and regional aspects of surveillance”. It emphasized that IMF favors a regional surveillance process over a regional fund, while not completely ruling out a regional fund that could complement the IMF’s efforts in the region in the longer term.
3.2.2. Chiang Mai Initiatives and beyond In August 1997, ASEAN launched the ASEAN Swap Arrangement
(ASA). ASA provides some degree of collective defense against speculative pressure. In November 2000, the ASA was expanded to cover all ASEAN members and the total amount also increased from $200 million to $1 billion. Under the ASA, apart from the US dollar, other currencies available include the yen and euro, with euro/yen and euro LIBOR interest rates, respectively, as the applicable base rates. The contributions from participating countries are categorized into two groups based on their ability to pay. The maximum drawdown amount by each participating member remains limited to twice their committed amount under the ASA. The swap transactions have a maturity not exceeding 6 months, subject to rollover for a period not exceeding 6 months.
As the object of AMF proposal, ASEAN plus three would then enhance ASA facility under the Chiang Mai Initiative. The ASEAN+3 Finance Ministers Meeting (AFMM+3) in Chiang Mai 2001 led to results reiterating the need for strengthened policy dialogues and regional cooperation activities. The CMI called for:
i. An expanded ASEAN Swap Arrangement that would include all ASEAN countries and a network of bilateral swap and repurchase agreement facilities among ASEAN countries, PRC, Japan, and Korea.
ii. Use of the ASEAN+3 frameworks to promote the exchange of consistent and timely data and information on capital flows.
iii. Establishment of a regional financing arrangement to supplement existing international facilities.
iv. Establishment of an appropriate mechanism (early warning system) that could enhance the ability to provide sufficient and timely financial stability in the East Asian region.
114 2010 CRES Visiting Scholar’s Paper Series
Nasution (2005) noted that the bilateral swap facility is inadequate in terms of the size of financial resources which marginally added to the countries in this region for preventing from financial crises like it was happened in 1997-1998.12) In addition because of inherent rigidities concerning its use, the CMI facility is not a helpful device for tackling the crisis and does not open the way for building a collective institution in Asia. As the facility is not centralized and multilaterally administered, the use of BSA (Bilateral Swap Arrangement) requires approval from each lender or loan provider. In addition, only 10% of BSA facility is immediately available to the borrowers while the other 90% requires approval from the IMF and, therefore, is subject to IMF conditionality. The linkage of the use of BSA facility to the IMF programs preserves the US hegemony and the importance of the IMF conditionality, which is basically in line with the Washington Consensus, the agreements that were originally opposed by the AMF proposal. Although this effort did not effect a change, but ASEAN+3 members believe that it can be used as an urgent contingency solution when members are having difficulties in payment during the crises. CMI can be cited as a true attempt at cooperation among ASEAN members with the three North East Asian countries.
Furthermore, the ASEAN+3 Finance Ministers’ Meeting (AFMM +3) in May 2009 in Bali, Indonesia, has established Chiang Mai Initiative Multilateralization (CMIM), which will become effective when implemented in March 24, 2010. The core objectives of the CMIM are (i) to address balance-of-payments and short-term liquidity difficulties in the region and (ii) to supplement the existing international financial arrangements. The CMIM, with total resources amounting to USD 120,000,000,000 (one hundred and twenty billion), will provide financial support through currency swap transactions to CMIM participants facing balance-of-payments and short-term liquidity difficulties. Each CMIM participant is entitled, in accordance with procedures and conditions set out in the Agreement, to swap its local currency with the United States Dollars for the amount up to its contribution multiplied by its
12) The amount is also too small as compared to the losses of external reserves of the central banks in this region to defend their pegged exchange rates during that crisis years. The need for BSA for maintaining fixed exchange rates has been reduced as most of the countries in this region.

ASEAN Economic Community: Prospect for Regional Monetary Cooperation in East Asia 115
CountriesFinancial Contribution Purchasing
MultipleUSD (billion) (%)
China38.40
China (Excluding Hong Kong)=34.2
Hong Kong, China = 4.2
32.028.50
3.50
0.5
2.5
Japan 38.40 32.00 0.5
Korea 19.20 16.00 1
Plus 3 96.00 80.00
Indonesia 4.552 3.793 2.5
Thailand 4.552 3.793 2.5
Malaysia 4.552 3.793 2.5
Singapore 4.552 3.793 2.5
Philippines 4.552 3.793 2.5
Vietnam 1.00 0.833 5
Cambodia 0.12 0.100 5
Myanmar 0.06 0.050 5
Brunei 0.03 0.025 5
Lao PDR 0.03 0.025 5
ASEAN 24.00 20.00
Total 120.00 100.00
Source: ASEAN Secretariat (2010), Press Release Forum.
Table 5. CMIM Contribution and Purchasing Multiple
purchasing multiplier. This agreement, was then amended in the 13 ASEAN+3 Finance Ministers Meeting, Tashkent, Uzbekistan, May 2010 (see table 5). The adjustment in the contributions of Indonesia, Malaysia, Philippines, Singapore and Thailand so that they could contribute equally was the main object of the CMI amendment. Having developed from existing CMI bilateral swap network, the CMIM is in nature a
116 2010 CRES Visiting Scholar’s Paper Series
multilateral currency swap arrangement which covers all ASEAN+3 members.
This meeting has reached a consensus on reviewing the progress of regional financial cooperation; including CMIM, ABMI (Asian Bond Market Initiative), and establishing Credit Guarantee Investment Facilities (CGIF). Along with all the key elements of regional macroeconomic surveillance unit of the CMIM, called the ASEAN+3 Macroeconomic Research Office (AMRO), the CMIM will further enhance regional capacity to safeguard countries against downside risks and challenges in the global economy. The AMRO will be located in Singapore to monitor and analyze regional economies, which contributes to the early detection of risks, swift implementation of remedial actions, and effective decision-making of the CMIM.
3.3. International Financial Institution and the East Asian Monetary Cooperation
The financial institution in the Asian region is becoming more globalized, since Asia has become the priority place for investment. However, the facts may differ somewhat from the literature. Globalization advocates believe that financial globalization will drive economic growth significantly. Kose (2009) found that the correlation between financial integration and growth is weak or even slightly negative. He also found, however, at higher degrees of financial depth with the financial openness variable, the coefficient on the interaction term is shown to be strongly positive. Therefore, it is suggested that financial cooperation will be more advantageous for growth if only if the depth of financial institution is higher, for many emerging economies and even developing countries are perpetually characterized by the shallowness of financial institutions. There are ways to increase the depth of financial institutions, depending on the character of the country and the target of the monetary policy.
In connection with the result of study on the benefit of financial integrations, many international financial institutions such as IMF and Asian Development Bank (ADB) have also taken part in continuing regional financial integration. In the case of East Asia, the need for a regional monetary scheme has been a prominent feature in discussions inside and outside of Asia. On the one hand, various proposals and
ASEAN Economic Community: Prospect for Regional Monetary Cooperation in East Asia 117
institutional initiatives have been submitted to conduct the apparatus for regional monetary cooperation scheme. The ADB Institute in Tokyo and the Asia Policy Forum network, for instance, suggested the establishment of a regional financing arrangement to (i) serve as a lender of last resort, (ii) provide effective regional surveillance, and (iii) promote financial and corporate restructuring (Yoshitomi and Shirai 2000). In addition Asia should have a joint supervisory/ academic body as a precursor to a regional currency regime. The body can undertake economic surveillance and advise governments, in addition to prompting and coordinating their responses. It could even provide liquidity to countries during financial crises.
On the other hand, policy leaders in East Asia tend to have a short term perspective on monetary cooperation. So far, they have not taken into account regional economic development, but instead focus entirely on prevention and management of future currency crises. While leaders of East Asian countries have learnt from European Monetary Union experience, some authors argues that the European case has not entailed fundamental compromises of sovereignty because control of fiscal policy has not been transferred to the level of the monetary union. But given the high degree of heterogeneity and gaps in economic development, East Asian Leaders tend to prefer to deal with regional monetary cooperation first, then if there sufficient conditions have been met for all East Asian countries, they will move forward towards a monetary union, which is what is indicated by a regional common currency. In all of monetary union cases, the common currency is closely linked to that of a major regional currency (the franc, dollar, and rand), so that these unions act as a fixed exchange rate regime. The process by which the EMU came about, and its status as an independent currency, both seem more relevant for the case of ASEAN and North East Asia.
In line with this, cooperation with many international financial institutions or even the United State are continuing to get either ASEAN as a whole or North East Asia into the effort. Meanwhile, International Financial Institutions (IFIs) are also taking action concerning the reform. In the G-20 summit in Pittsburg, there were some agreements on governance reform and mandate review of IMF. The role of the IMF in helping a country having difficulties in payment and financing will be reviewed including its legal framework in order to establish

118 2010 CRES Visiting Scholar’s Paper Series
the role of IMF as a global economic stability safeguard; particularly for crisis prevention, crisis response and stability of reserve.
In connection with the role of the IMF in crises prevention, Asian countries have been experienced a wrong prescription on the part of the IMF in managing crises. The IMF objection for a number of proposals for Asian monetary integration (i.e. AMF) was due mainly to the surveillance process. IMF perceived that countries in Asia have no good ability and mechanism in the surveillance process. The difference between bilateral surveillance and multilateral surveillance are always marked by systemic risks. Bilateral surveillance is more easily done as it is possible through dialogue with partners, rather than multilateral surveillance that may involve an arduous process of dialogue, because it is always long and difficult to reach an agreement. The IMF should devote more attention to controlling financial system, particularly in identifying and giving priority to macro- systemic risks. The IMF shall go about this task by collaborating with other related institutions like the BIS.
Furthermore, the World Bank and Asian Development Bank has also made some progress not only in promoting regional monetary integration in East Asia, but also have taken part in giving thoughtful contribution through working committees and collaborative research with East Asian countries or bodies such as ASEAN and ASEAN+3. Moreover, ASEAN+3 with ADB also will soon subscribe for the financial contribution and finalize necessary technical details including the Operational Policies and the business plan for the CGIF to start operations before the end of 2010. Immediate assessment of previous achievements by the ASEAN+3 in regional financial cooperation is to follow as well as suggestions for the strategic direction of ASEAN+3 financial cooperation. They have also agreed to set up a “Taskforce on the Future Priorities of ASEAN+3 Financial Cooperation.”
To further enhance surveillance, it would require the establishment of the CGIF as a trust fund of ADB with an initial capital of US$700 million. The main objective of the CGIF is to support the issuance of corporate bonds in East Asian region, and thus contribute to the development of regional bond markets. As East Asian countries have become capital exporters, the idea of developing regional bond markets is considered particularly appealing. Instead of channeling their surplus capital to low-yield United States (US) Treasury bonds and
ASEAN Economic Community: Prospect for Regional Monetary Cooperation in East Asia 119
accumulating excessive foreign exchange reserves, efficient regional bond markets may enable better utilization of Asian savings for Asian investments. Under the Asian Bond Fund, foreign exchange reserves held by regional member central banks would be pooled together for investment in regional sovereign bonds. The region has also sought ways to spur issuance of basket currency bonds from a pool of sizable accumulated foreign exchange reserves of East Asian countries, especially the People Republic of China.
All the current progress gives indications that monetary cooperation in the East Asian region is interrelated with other international institutions. Being the member of G-20 (Japan, China, Korea and Indonesia) will require deliberate consideration when engaging in dialogue with other G-20 members for making decisions in the East Asian region. Thus, the implementation of a common currency in the East Asian region will be a long and slow process, as political will of not only for member countries but also outside of the region should be taken into consideration.
4. Future Implications for Indonesian and Korean Monetary and Fiscal Management
East Asian economies tend to focus on promoting greater economic integration through higher levels of trade and investment liberalization. A set of strategies moving at different speeds towards monetary co- operation in East Asia was recommended where smaller sub-groupings could first focus on internal harmonization amongst themselves and then external harmonization with other regional sub-groupings, respectively, as the intermediate and longer-term strategies. In the long run, economies participating in various regional currency areas may consider forming a single currency area once sufficient degree of harmonization and convergence is achieved.
At present, East Asian nations adopt a variety of exchange rate management systems.13) But in reality, all countries in this region
13) Several ASEAN countries seem to expect that they will continue to operate under a floating exchange rate regime, as evidenced by their recent move toward an inflation targeting framework.
120 2010 CRES Visiting Scholar’s Paper Series
remain in a “dollar zone” as they still closely pegged their exchange rates to the dollar, Singapore in the exception. Prior to the crisis in 1997, Indonesia and Korea formally adopted a managed floating exchange rate but, in reality, they still restrict movements of external values of their currencies to the dollar.
Moreover, some authors came up with the idea of using the Japanese yen as a common currency in the form of Asian Monetary Union (Lim 2005; Karras 2005, Baharumshah 2007). Lim (2005) point out that the currency of each country seems to move at a rather constant rate to the Japanese yen over the 1990-2001 period. Although none of the currencies of East Asian economies had a long-run cointegrating relationship with the Japanese yen, there was a common long-run trend for Hong Kong, South Korea, Philippines, Singapore and Thailand. This is an indication of a possible currency union for these economies. On the other hand, Karras (2005) examined the macroeconomic costs and benefits of adopting the Yen as a common currency among 18 Asian and Asia-Pacific countries. The main benefit of adopting the Yen as a common currency is the enhanced price stability and exchange rate stability, and thus a lower and steady inflation rate. However, adopting a common currency like the Yen would rule out the possibility of an independent monetary policy, which would contribute to higher business cycle volatility if the adopting country’s output is not sufficiently synchronized with that of Japan.
Baharumshah et al. (2007) examined the prospect of the Asian Monetary Union by comparing the composition of the AMU between the benchmark indicator that consists of ASEAN 10+3 currencies, and ASEAN 5+3 currencies from January 2001 to January 2007. The results show that the ASEAN 5+3 series tend to track closely (no delay), while ASEAN 10+3 also show an upward and stable trend. They also found concerning the volatility of each currency of East Asian countries that Indonesia, South Korea and the Philippines have the highest volatility. The high volatility of the Indonesia rupiah was attributable primarily to the prolonged aftereffects of 1997-1998 East Asia financial and currency crisis. The rupiah appreciated substantially when the financial crisis finally began to fade in recently. Nevertheless, the currency has once again come under pressure to depreciate due to concerns about Indonesia’s macroeconomic outlook.
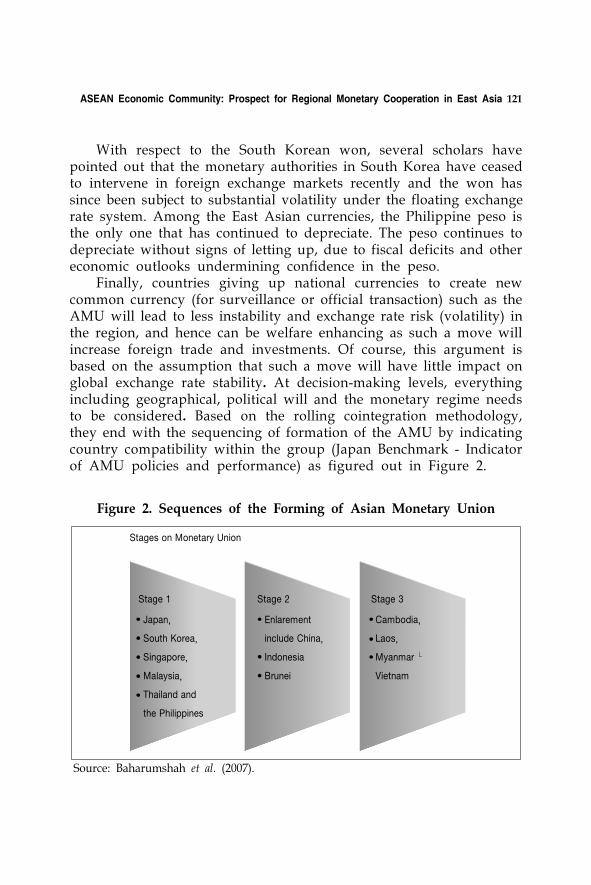
ASEAN Economic Community: Prospect for Regional Monetary Cooperation in East Asia 121
Stages on Monetary Union
Stage 1 Stage 2 Stage 3
Cambodia,
Laos,
�Myanmar
Vietnam
Enlarement
include China,
Indonesia
Brunei
Japan,
South Korea,
Singapore,
Malaysia,
Thailand and
the Philippines
Source: Baharumshah et al. (2007).
Figure 2. Sequences of the Forming of Asian Monetary Union
With respect to the South Korean won, several scholars have pointed out that the monetary authorities in South Korea have ceased to intervene in foreign exchange markets recently and the won has since been subject to substantial volatility under the floating exchange rate system. Among the East Asian currencies, the Philippine peso is the only one that has continued to depreciate. The peso continues to depreciate without signs of letting up, due to fiscal deficits and other economic outlooks undermining confidence in the peso.
Finally, countries giving up national currencies to create new common currency (for surveillance or official transaction) such as the AMU will lead to less instability and exchange rate risk (volatility) in the region, and hence can be welfare enhancing as such a move will increase foreign trade and investments. Of course, this argument is based on the assumption that such a move will have little impact on global exchange rate stability. At decision-making levels, everything including geographical, political will and the monetary regime needs to be considered. Based on the rolling cointegration methodology, they end with the sequencing of formation of the AMU by indicating country compatibility within the group (Japan Benchmark - Indicator of AMU policies and performance) as figured out in Figure 2.
122 2010 CRES Visiting Scholar’s Paper Series
4.1. Indonesia
Formation of the AEC brings certain advantages since it would provide opportunities and challenges for Indonesia. Opportunities include a broader economic scale, reduced poverty and socio-economic disparities, and increased attractiveness of ASEAN as a destination for investors and tourists, not to mention reducing trade transaction costs, improve trade and business facilities, and improve the competitiveness of the SME sector. In addition, the formation of the AEC will increase intra-ASEAN market access and make access to the market more convenient; and also increase transparency, as well as speeding up and standardizing the domestic regulations adjustment.
The challenge for Indonesia, among others, is the need for efforts to further improve public understanding about ASEAN. This is especially so concerning business, competitiveness and efficiency in all aspects, creation of good governance, determining the priority sectors for liberalization, and harmonizing Indonesia’s positions in a variety of goods negotiations; bilateral, regional or multilateral. In addition, Indonesia also must be able to implement and evaluate various FTAs that have been agreed, whether bilateral, regional or multilateral. It is expected that Indonesia will be able to benefit from regional economic integration that is highly competitive and integrated into the global economy, which in turn will provide broad economic benefits for all Indonesian people.
Indonesia is aware that greater financial market integration and abundant global liquidity initiated a surge in capital flows to developing countries. However, In Indonesia’s case, vast foreign capital inflows to Indonesia affected its financial sector and macroeconomic performance. For the financial sector, a rapid upsurge in foreign capital inflows significantly contributed to an increase in performance and lead to appreciation of the rupiah. Eventually, such growth dissipated market risk and helped maintain the banks' intermediation function, therefore, preserving financial system stability. Rupiah appreciation due to surging capital inflows also contributed to macroeconomic stability in the short run. This condition was supported by favorable social and political conditions, since the country already experienced in 1997 that capital inflows have the potential to trigger financial system instability in the event of a sudden capital reversal, therefore disrupting

ASEAN Economic Community: Prospect for Regional Monetary Cooperation in East Asia 123
macroeconomic stability.Internal financing forms another aspect of this issue. The
shallowness in Indonesia’s financial sector, that has been noted, is attributable to limited investment and financing alternatives, hedging facilities and risk reduction (insurance) facilities. The shallow financial sector enabled Indonesia to minimize the impact of the global financial crisis in 2008. On the other hand, high uncertainties coupled with a shallow financial sector can easily precipitate an exodus of market players. Therefore, a deep financial market can attract more investors to place their funds in the financial market, to yield positive impacts for economic financing. This can be accomplished through the enrichment of investment instruments, such as long-term instruments, structured products and derivative products that can be utilized as hedging instruments or insurance for financial transactions. Thus, it is familiar and customary for Indonesian investors to engage in investment alternative product such as in the Islamic financial sector. Since this sector prohibited interest rate and speculation transaction, it would be sufficient prescription to help Indonesia to minimize the global impact of crises. In summary, the regional monetary cooperation may be helpful in getting rid of crises, but macroeconomic stability in the domestic market should be geared toward maintaining a well-established monetary policy, understood and adapted by the interests of each member state.
4.2. Korea
The East Asia Vision Group was established in 1999 under the leadership of the Korean President Dae Jung Kim, and the group recommended; a) economic cooperation; b) financial cooperation; c) political and security cooperation; d) environmental cooperation; e) social and cultural cooperation, and f) institutional cooperation.
In terms of international relationship with ASEAN, the Republic of Korea has signed the ROK- ASEAN FTA that was implemented in 2010. However, some scholars are not quite confident in saying that the Republic of Korea will be the leading hub for monetary cooperation in East Asia. The reason is that the ROK has not been able to resolve its conflict with North Korea, which from an economic- political view, presents an obstacle. In addition, some studies found that the Republic of Korea will not gain much advantage from FTAs and other forms

124 2010 CRES Visiting Scholar’s Paper Series
of economic integration. Sohn and Lee (2008) found that the impact of FTAs in the relationship between trade structure and economic growth is not significant to the East Asian region. In East Asia, the effect of FTA seems very weak, although the estimated signs are correct.
However, some Korean scholars believe that pursuing monetary cooperation in East Asia should include the role of United States and other international financial institutions such as IMF and ADB. Korea is in the process of establishing an FTA with the United States, and engaged in dialogue and meeting. According to Hufbauer and Schott (2009), Korea stands to gain significantly from bilateral FTAs even without the FTAAP. If the Korea - US FTA is ratified, it will increase Korea’s two-way trade by an estimated US$70 billion (16 percent). Korea would gain a similar amount (US$63 billion) if the Japan- Korea and the Korea - ASEAN FTA are both agreed to. In percentage terms, the United States stands to gain far less than its proposed partners in future US-ASEAN and US-Japan agreements; not surprisingly, the smaller party shows larger gains in percentage terms.
Conversely, the trend of global economy proves the strength of regional economic integration. Remaining together with countries in the vicinity to maintain regional economic stability is something that should certainly be considered by Korea. Domestically, ROK has its own set of policies for preventing its economy from the impact of global crises. In late 2008, in the midst of the global crisis, Korea undertook special monetary policy by swapping the won with foreign reserve (US dollar). This policy may have been effective for the last crisis, but there is no guarantee that this policy will work for the next, and FED will be able to help. Therefore, it would be good for Korea to put its trust in maintaining economic stability in the region where ROK is a part of, which should be more effective for preventing future crisis.
5. Concluding Remarks
The establishment of the ASEAN Economic Community (AEC) is the culmination of a series of economic integration processes among ten countries in Southeast Asia. At first the term “economic community” became an important point for debate, but the ASEAN grasped it as necessary to improve collective cooperation, a point stated in ASEAN
ASEAN Economic Community: Prospect for Regional Monetary Cooperation in East Asia 125
vision 2020. It is undeniable that there are still gaps in terms of economic development among ASEAN members, but ASEAN as an organization has created a series of strategies and plans for the realization of the ASEAN economic community.
There are four phases total in realizing the AEC, and 73.6 percent of the desired objectives has already been achieved. Joining with the AEC will be beneficial for each member, since they may lack bargaining position in international trade as an individual country. On the other hand, as a group, ASEAN will be able to engage in various multilateral agreements, particularly with China and the United States. However, in the AEC blueprint, financial and monetary cooperation are issues far from being ‘favored,’ and thus at a disadvantage, as the AEC will only act as a facilitator for each member to build their financial cooperation with other ASEAN member based on their respective national interests, though monetary cooperation initiatives have begun many years ago. Some initiatives also involve China, Japan and Korea; such as initiatives for the Asian Monetary Fund, ASEAN Development Fund, CMI and CMIM. Unfortunately, there is no clear monetary cooperation and financing integration model that can guide each member to prevent crises and maintain regional macroeconomic stability. All policies are based on consensus with respect to private domestic policies for each member state.
In terms of monetary cooperation, it will not any additional affects on Indonesia’s current monetary performance. It is because Indonesia set own its policy regarding government preference and the domestic situation. However, Indonesia is aware that greater financial market integration and abundant global liquidity initiated a surge in capital flows to developing countries. Thus, Indonesia stated it would deepen its financial market through enrichment investment alternative product such as the developing Islamic financial sector.
As for Korea, the AEC will not create imbalances in Korea’s monetary performance. It would be good for Korea to put its trust in maintaining economic stability in the region where ROK is a part of, which should be more effective for preventing future crisis.
126 2010 CRES Visiting Scholar’s Paper Series
References
Aghion, P., and A. Banerjee. 2005. Volatility and growth: Clarendon Lectures in Economics. Oxford: Oxford University Press.
Aminian, Nathalie. 2005. “Economic Integration and Prospects for Regional Monetary Cooperation in East Asia.” Structural Change and Economic Dynamics, 16, pp. 91-110.
ASEAN Secretariat. 2007. ASEAN and The Growth Of Regional Cooperation In Southeast Asia. (January 23) www.aseansec.org (accessed July 12, 2008).
. 2008. “ASEAN Economic Community Blue Print.” Available at www.aseansec.org (accessed July 12, 2010).
. 2009. “ASEAN Economic Community Balance Score Card”, Available at www.aseansec.org (accessed July 12, 2010).
. 2010a. “ASEAN database.” Avalaible at www.aseansec.org (accessed July 12, 2010).
. 2010b. The Joint Ministerial Statement of The 13th ASEAN+3 Finance Ministers’ Meeting. edited by S. ASEAN: ASEAN.
Asian Development Bank. 2009. Key Indicators for Asian and Pacific. Key indicators, Mandaluyong City: Asian Development Bank.
Bayoumi, Tamim, Barry Eichengreen, Paolo Mauro. 2000. “On Regional Monetary Arrangement for ASEAN.” Journal of the Japanese and International Economics. Vol. 14, pp. 121-148.
Balassa, B. 1961. The Theory of Economic Integraion. Homewoeed, IL : Irwin.Baharumshah, Z Ahmad, Muzafar Shah Habibullah, Law Siong Hook.
2007. Toward Greater Financial Stabillity in the Asian Region: Exploring Steps to ccreate Regional Monetary Union, ASEAN+3 Research Group, available at www.aseansec.org/20730.pdf, accessed August, 02, 2010.
Bunyaratavej, K. and E. D. Hahn. 2003. “Convergence and Implications for a Common Currency in ASEAN.” ASEAN Economic Bulletin, 20(1), pp. 49-59.
Chaves, Jenina. 2008. Memahami Piagam ASEAN dan Cetak Biru Masyarakat Ekonomi ASEAN. AFA Filipina.
Cheong, Inkyo. 2005. “Evaluation of Recent Progress of FTAS in East Asia - A Korean Prespective.” In C.Y. Ahn et al. eds. East Asian Economic Regionalism, pp. 37-56. Netherland: Springer.
. 2009. “Comments on Multilateralizing Regional Trade Arrangement
ASEAN Economic Community: Prospect for Regional Monetary Cooperation in East Asia 127
in Asia.” Multilateralizing Regionalism: Challenges for the Global Trading System. WTO.
Cho, Lee-Jay, Chang Jae Lee. 2010. Financing Regional Economic Integration for Northeast Asia. Conference Proceedings 10-01. Korea Institute for International Economic Policy.
Dodsworth J.R. and J. Diamond. 1980. “Monetary Cooperation As A sources of Development Finance: The ASEAN Case.” Journal of Development Economics, 7, pp. 409-425.
Hufbauer Gary and Jeffrey Schott. 2009. Fitting Asia -Pacific Agreements into the WTO system, in Multilateralizing Regionalism: Challenges for the Global Trading System.
Indonesia Bank. 2010. The Role of Financial System Stability in Supporting Economic Activities, edited by Directorate of Economic Report and Monetary Policy. Bank Indonesia.
Kalra, Sanjay. 2009. ASEAN: A chronicle of Shifting trade Exposure and Regional Integration. IMF working Paper WP/10/119. International monetary fund.
Kawai and Wignaraja. 2009. Multilateralizing Regional Trade Arrangement in Asia in Multilateralizing Regionalism: Challenges for the Global Trading System. WTO.
Kawai, Mashahiro and Shinji Takagi. 2005. “Toward Regional Monetary Cooperation in East Asia: Lesson from Other parts of the World.” International Journal of Finance and Economics, Vol. 10, pp. 97-116.
Karras, Georgios. 2005. “Is there a Yen Optimum Currency Area? Evidence from 18 Asian and Pacific Economies.” Japan and te World Econom, 17, pp. 456-469.
Kim, Heungchong et al. 2009. “An Exploration of an Integration Index and its Application for Asian Regional Community.” Working Paper 09-10, Korea Institute for International Economic Policy.
Kose, M. Ahyan, Eswar S. Prasad, Ashley D. Taylor. 2009. “Threshold in the Process of International Financial Integration.” Working Paper 14916. National Bureau of Economic Research. Available at http://www.nber.org/papers/w14916, accessed by July, 31, 2010.
Lee, Chang Jae. 2008. “Characteristics and prospects for East Asian economic integration: a Korean perspective.” Econ Change Restruct, 41, pp. 331-344.
Lim, Lee K. 2005. “A Dollar or Yen Currency Union in East Asia.”
128 2010 CRES Visiting Scholar’s Paper Series
Mathematics and Computers in Simulation, 68 (5-6), pp. 507-516.Manchin, Miriam et al. 2008. “Clothes without an Emperor: Analysis
of the Preferential Tariffs in ASEAN.” Journal of Asian Economics, Vol. 19, pp. 213-223.
Michael, Plummer G. 2006. “An ASEAN Customs Union?” Journal of Asian Economics, Vol. 17, pp. 923-938.
Mishkin, F. S. 2006. The Next Great Globalization: How Disadvantaged Nations Can Harness Their Financial Systems to Get Rich. Princeton, N.J.: Princeton Univ. Press.
Ramayandi, Arief. 2005. “ASEAN Monetary Cooperation: Issues and Prospects.” Pacific Economic Papers, No. 349, 2005, available at http://dspace.anu.edu.au/bitstream/1885/43043/1/pep-349.pdf, accessed August, 2, 2010.
Nasution, A. 2005. “Monetary Cooperation in East Asia.” Journal of Asian Economic , 16, pp. 422-442.
Rana, Pradumna. 2002. “Monetary and Financial cooperation in East Asia: The Chiang Mai Initiative and Beyond.” ERD Working Paper No. 6.
Sohn, Chan-Hyun and Hongshik Lee. 2008. “Trade Structure, FTAs, and Economic Growth: Implication for East Asia.” In Meral Karasulu and Doo Yong Yang eds. Ten Years after the Korean Crisis: Crisis, Adjustment, and Long run Economic Growth. Korea Institute of International Economic Policy.
Shinohara, H. 2000. Regional Arrangements for Strengthening Financial Architecture in Asia. A Paper Presented at Asia Development Forum. East Asia: From Crisis to Opportunity. Co-organized by ISEAS, ADB, ADBI and World Bank Institute, Singapore, 5-8 June.
Shirai, S. 2001. 4. Overview of Financial Market Structure in Asia. Cases of the Republic of Korea, Malaysia, Thailand and Indonesia. ADB Institute Research Paper 25. Tokyo: ADB Institute. (September)
Tourk, Khairy. 2004. “The Political Economy of East Asian Economic Integration.” Journal of Asian Economics, Vol. 15, pp. 843-888.
Wang, Yunjong. 2004. “Financial Cooperation and Integration in East Asia.” Journal of Asian Economics, Vol. 15, pp. 930-955.
Yi, Xiaohong. 2005. ASEAN-China Free Trade Area: A Key Step Toward Pan-Asia Economic Integration From The Perspective of Comparison With NAFTA And EU, Thesis Series, James E. Roger College of Law, The University of Arizona.
Cross-Strait ECFA Should be the
Stepping Stone for Taiwan Joining in
the East Asia Economic Integration1 4)
Chaw-Hsia Tu*
1. Introduction
Given the prevailing trends of regional economic integration and liberalization in the international market, there is a need for Taiwan to participate in this trend in order to seek fair competition in the market. The process of such participation, however, is closely tied to the cross-strait relations between Taiwan and China. In order to improve cross-strait relations, the KMT government has, after regaining power in 2008, reached consensus with the Chinese government in various cooperative plans through cross-strait talks. These cooperative plans, include direct air transport, sea transportation, food inspection, financial cooperation, opening up Taiwan to Chinese investment, and the accreditation of metrology and inspection, etc. Most importantly, during the fifth round of Chiang-Chen Talks, the two sides have concluded the Cross-Strait Economic Cooperation Framework Agreement (ECFA), marking a milestone in the peaceful development and institutionalization of cross-strait ties. The ECFA serves as a preliminary agreement of the cross-strait Free Trade Agreement (FTA). Based on the ECFA, the two sides shall, within six months after it takes effect, proceed with consultation and negotiations on various issues including trade liberalization in goods and services, enhancement of investment protection, protection of intellectual properties rights and establishment of dispute settlement mechanisms. A framework for the normalization
* Research Fellow of Chung-Hua Institution for Economic Research, Taiwan WTO Center.
130 2010 CRES Visiting Scholar’s Paper Series
and liberalization of cross-strait relations, therefore, is gradually taking shape.
By opening up its market to China, the “World’s Factory”, Taiwan is inevitably bringing considerable competitive pressure to its domestic industries. In terms of productive resources and industrial structure, however, the two sides are to a great extent mutually complimentary. More and more business opportunities will naturally emerge, as cross-strait interaction increases and liberalization measures are successively implemented. Especially, with its rapid economic development, China’s role in the global economy became even more noticeable following the outbreak of the 2008 financial turmoil in the United States. In spite of the increasing competition to local products as a result of the ECFA, Taiwanese suppliers will enjoy tremendous business opportunities following the opening up of the China market to Taiwan. In addition, many Taiwanese enterprises have been active in the China market for a long time as Taiwanese investors. These will serve to build up more advantages for Taiwanese enterprises when expanding their business in China.
Since they complement each other in terms of natural resources, human capital, market size and technology etc., the two economies on opposite sides of Taiwan Strait will both benefit from the ECFA. Economic interdependence between them will thus increase because of the institutional integration under the ECFA. But stronger economic integration of Taiwan and China is only a prelude to Taiwan’s participation in the East Asian economic integration. In the future, Taiwan should participate more intimately in the East Asian economic integration. However, due to political reasons, Taiwan has been excluded from most of the prevailing Regional Trade Agreement (RTA) negotiations in the world. Since Taiwan has been one of the key members in the global supply chain of many manufacturing goods and extensive in terms of direct investment in this region for the past two decades, exclusion of Taiwan from participation in the East Asian economic integration would limit the benefits of specialization of labor and industry in the region. In addition, the cross-strait ECFA may have trade diversion and investment diversion effects on other East Asian economies as well. The road map towards an East Asia FTA (EAFTA) written by the Joint Expert Group as a feasibility study on EAFTA (Joint Expert Group on EAFTA 2006) declares that open
Cross-Strait ECFA Should be the Stepping Stone for Taiwan Joining in the East Asia Economic Integration 131
regionalism should be one of the principles to concluding the EAFTA. Therefore, if the ECFA could be the stepping stone for Taiwan to join the EAFTA, it will not only comply with the principles of forming the EAFTA, but also benefit all countries in East Asia. As far as political impediment of Taiwan’s joining the regional economic integration is concerned, the ECFA model of “ignoring the difference between China and Taiwan, only focus on economic issues and those have been reached consensus currently” could be the model of handling Taiwan’s participation in the East Asia economic integration.
This paper analyzes in-depth the economic reasons of why Taiwan signed ECFA with China, the possible impact on Taiwan, and the implications on other East Asian countries, including both qualitative and quantitative analyses. In section II, the author first analyzes the logic of economic integration between Taiwan and China and its possible impact on cross-strait relations. In Section III, the author provides quantitative analysis by providing specific data, as well as to further the impact on trade in services. Section IV outlines the policy implication of ECFA on other East Asian countries. Section V is the conclusion.
2. Economic Thinking of ECFA and the Possible Impacts on Cross-Strait Relations
2.1. Why Taiwan Signed ECFA with China?
Economic integration usually will generate positive economic effects on members and negative effects on non-members. Being excluded from the regional economic integration, market share of Taiwanese exports in the world has been reduced by 34 percent over the past ten years. In a study done by Tu (Tu 2008) showed that the GDP growth rate of Taiwan would decrease by 1.65 percent if Taiwan was not included in the ASEAN+China, Japan, Korea (10+3) FTA. And the negative impacts would increase to 1.8 percent of the Taiwanese GDP growth rate if the regional integration was expanded to include more members such as Australia, New Zealand and India, i.e. 10+6 FTA. Consequently there would be no surprise that Taiwan will pursue more FTA negotiations with her trading partners after the
132 2010 CRES Visiting Scholar’s Paper Series
signing of ECFA with China, to avoid the trade diversion and investment diversion effects where her neighboring countries are actively engaging in by setting up free trade areas with each other.
From a macro-economic point of view, the setting up of free trade areas among East Asian countries, would leave market access for Taiwanese exports relatively worse-off than most of the other countries. If we look at those tariff concession tables of each FTA that the East Asian countries have signed, it is not difficult to find that Taiwan’s export may face negative impacts in many industries, since those FTA member countries’ tariffs will be removed according to their FTA commitments, where Taiwanese products still have to pay duties. Such industries include the plastic & rubber industry, base metals industry, machinery and electrical equipment industries, and textile industry. If all the tariff concessions were realized, i.e. after the transition periods are over, the FTAs China, Japan, and Korea have signed with East Asian countries would lead Taiwan to spend more in tariffs: 150 to 210 million dollars for export to Japan, 37 million dollars for export to Korea, 420 million dollars for export to China, and 140 million dollars for export to ASEAN (Tu 2007). Furthermore, the rules of origin in FTAs may cause unfavorable effect on the inflow of Taiwan’s foreign direct investment. As an outward oriented economy, more than sixty percent of her exports go to East Asia; Taiwan must participate in the East Asia regional economic integration to avoid being marginalized from the region both in terms of trade and attracting foreign investment.
2.2. Development of ECFA Negotiations
The rapid development in cross-strait trade and investment activities over the past twenty years has manifested itself in the potential vitality of economic interaction between Taiwan and China. Before mid-2008, however, such interactions in trade and transportation were heavily restricted, owing to hostilities between Taiwan and China. Taiwan, notwithstanding its membership to the WTO and APEC, was barely able to take part in regional economic integration, which has been a growing trend in the world. To improve relations, President Ma has, after coming to office, resumed negotiations between Straits Exchange Foundation (SEF) and the Association for Relations
Cross-Strait ECFA Should be the Stepping Stone for Taiwan Joining in the East Asia Economic Integration 133
Across the Taiwan Straits (ARATS) that were discontinued for several years. From June 2008 to December 2009, the two sides have concluded four rounds of Chiang-Chen Talks, yielding twelve agreements and one consensus. The Chiang-Chen Talks have resulted in shortening of travel time and distances between the two sides, reducing trading costs, and the establishment of a basis for mutual-trust. As a result of these improvements, the expectations of further economic cooperation between the two sides in early 2009 would materialize, and, subsequently, the led to commencement of relevant academic research. In December 2009, the two entities respectively completed the individual and joint research on the ECFA. It was confirmed that the signing of the ECFA would have positive influence on the economic development of both sides (CIER 2009). It was therefore worthwhile to organize formal negotiations, which were rolled out in early 2010. On 29 June 2010, an agreement was reached during the fifth round of Chiang-Chen Talks. Pursuant to the ECFA, the two sides shall, within six months after it takes effect, roll out consultation and negotiations on trade liberalization in goods and services, which should be completed as soon as possible. The two sides also have agreed on various measures including: building a fair, transparent, and convenient investment environment, enhancing investment protections, and expanding cooperative mechanisms. They also agreed upon early harvest lists of market opening for certain goods and services, allowing both sides to reap the benefits as soon as possible. Considering the close economic ties between the two sides and the institutional integration in progress, we foresee deeper cross-strait interaction in the future and further specialization of labor and services.
3.3. ECFA Brings Tremendous Changes for Taiwan on Cross-Strait Relations
The consultation and negotiation process of the ECFA marks a good start for positive interaction between the two sides. The process also outlined potential patterns for further cooperation, market opening, investment and dispute settlement between the two sides. The ECFA’s influence on cross-strait relations can be viewed from several aspects. First, the ECFA and subsequent FTAs between the two sides will facilitate gradual liberalization and normalization of cross-strait economic
134 2010 CRES Visiting Scholar’s Paper Series
and trade relations; and further enhancement of labor specialization. It will also lead to substantial business and cooperative opportunities in the future, given the highly complimentary relationship of the two sides in terms of both resources and industrial development. The price advantages of Chinese products, however, will create competitive pressure on, and bring potential structural changes to, industries in Taiwan. Therefore, considerable resistance can be expected from those industries affected by such price pressures.
Second, through substantial contacts during the past two years, the economic and trade organizations of the two sides have established a good precedent for more positive and deeper interactions in future. Despite this, however, there still remain differences in the economic and trade systems of the two sides. In spite of the rapid and sweeping economic reforms made by the Chinese government in recent years, the operational model of their state-owned enterprises and the government’s domination of resource allocation would be considered rare in a traditional market economic system; and may cause major disputes of unfair competition between the two sides. The cross-strait FTA negotiation in the future, therefore, will remain a very challenging issue for Taiwan, given its economic system that relies heavily upon small and medium-size enterprises (SME). Taiwan must strive for fair treatment during the FTA negotiations on market opening and avoid the interference of any non-market related factor from China. These are issues that Taiwan must deal with very carefully.
Third, further integration of cross-strait economic and trade relations will result in Taiwan’s increasing dependence on the Chinese market. As such, another issue that Taiwan must seriously address after the signing of the ECFA is to expedite further economic integration and cooperation with other trade partners to avoid a high dependency on the Chinese market; i.e. Taiwan should take part in the regional economic integration both to avoid putting all its eggs in one basket and to seek fair competition when entering other markets. The post- ECFA negotiations of the FTA with other trading partners are therefore crucial to Taiwan. The development of cross-strait relationship between the two sides will be closely linked to the results of how they will solve the issues between them.
On the other hand, if Taiwan pursues an overall free trade policy, it will also impact the development of cross-strait economic

Cross-Strait ECFA Should be the Stepping Stone for Taiwan Joining in the East Asia Economic Integration 135
relations. In terms of the resultant impact, the latter two kinds as stated above will very much depend on the actual progress of future cross-strait relations; and the outcomes of the follow-up trade negotiations concerning how Taiwan will join in the regional economic integration. From the experience of the ECFA negotiations, however, we believe that the two governments will resolve this issue with wisdom and flexibility, somewhat like in the ECFA.
3. ECFA and the Economic Effects on Taiwan
Economic impacts of the ECFA on Taiwan have been discussed and raised heated debates in Taiwan because of recent improvements in cross-strait relations. If the economic impacts on Taiwan were not tangibly positive, the opposition party and most people will be unfavorably disposed toward the ruling party on the following elections. Thus both economic and non-economic analyses have been undertaken and examined by professional research institutes. Research results from these analyses show that the ECFA is expected to have a tremendous impact on the economies in this area and other regions around the world as well.
3.1. Influences on Cross-Strait Economic and Trade Relations
During the six-month negotiation for the ECFA, the two sides reached a consensus to gradually reduce or eliminate impediments to trade and investment between each other; while fully considering the economic conditions of both sides, the fundamental principles of sovereignty, mutual benefits, and full compliance with the WTO standards. The ECFA is designed as a widely-covered, preliminary agreement for the FTA, to be concluded in gradual steps. The major issues covered by the ECFA include market opening, investment protection, economic cooperation, and dispute settlement. The two sides, in the meantime, agree to tighten their cooperation in various aspects including intellectual property rights, financial services, trade facilitation, customs, electronics business, industries, and small and medium businesses. A Cross-Strait Economic Cooperation Committee will be established to administer the ECFA-related issues. In terms of
136 2010 CRES Visiting Scholar’s Paper Series
market opening, the two sides will commence the FTA negotiations on the trade of goods and services and complete the process as soon as possible. The influence of the ECFA on cross-strait relations, therefore, is multi-faceted. The ECFA, furthermore, was concluded in full compliance with the fundamental principles of the WTO, of which Taiwan is a member. An agreement signed by the two sides under the principles of the WTO; therefore, may serve as a precedent for other similar agreements signed in the future between Taiwan and other WTO members. In this context, the ECFA will help to strengthen further Taiwan’s ties with the world and improve its investment environment. From a long-term perspective, the ECFA will also help attract foreign direct investment.
3.2. Economic Impacts of ECFA on Taiwan
Many studies have applied the computable general equilibrium (CGE) analysis by using the Global Trade Analysis Project (GTAP) model to investigate the impact of trade policy changes on FTA parties or non-parties. It is well known that, in addition to trade creation and trade diversion effects, FTA/RTA might bring about capital movement among member countries and non-member countries, or among member countries. One of the limitations of CGE analyses is the neglect of foreign direct investment (FDI) in their analytical framework. Given the important role played by FDI around the world, a FTAP1) model developed by Dee (Dee 2007) and several other economists such as McDougall (1993), Verikios and Hanslow (Verikios 1999) can capture capital movement and service trade liberalization. Both the GTAP and FTAP analysis have been undertaken by the Chung-Hua (CIER 2009) research team to examine the possible impacts of the ECFA on Taiwan.
1) The FTAP is an empirical model extended from the GTAP model. FTAP model takes the standard GTAP framework as a description of the location of economic activity and then disaggregates this activity by ownership. One of the advantages of the FTAP model is its capability to deal with the issues related to liberalization in the trade of services.
Cross-Strait ECFA Should be the Stepping Stone for Taiwan Joining in the East Asia Economic Integration 137
3.2.1. Economic Impacts of Cross-Strait FTA on Taiwan The Cross-Strait ECFA serves as a preliminary agreement for the
cross-strait FTA. A GTAP simulation analysis (CIER 2009) was conducted using the assumptions that both Taiwan and Mainland China will remove all the commodity trade barriers, except that Taiwan will maintain the agriculture sector as is. In a static model, the simulation result shows that Taiwan’s GDP growth rate would increase by 0.24 to 0.28 percent, export would increase by around 3.4 percent, import would increase by around 5.9 percent, term of trade would be improved by 1.6 percent, and social welfare would increase by US$4.2 billion. In a dynamic model, which allows capital accumulation and the changes of demand would transfer to production; results show that Taiwan’s GDP growth rate would increase by 1.6 to 1.7 percent and all the other macroeconomic factors would improve further (shown as in table 1). The benefits of the ECFA would be boosted further when the effects of liberalized investment and service industries are taken into account. In a static simulation of the FTAP model, assuming that service trade is liberalized, results show that Taiwan’s GDP growth rate would increase by 0.57 percent (CIER 2009). And if industrial goods and service trades are liberalized together, results show that Taiwan’s GDP growth rate would increase by 1.03 percent, which is much larger than the benefits from the simulation result using the assumption that only the trade of industrial goods was liberalized.
While economic integration among members can create significant trade and social welfare benefits to each other, it is also possible that it would result in trade and investment diversion effects. The result of the FTAP simulation shows that almost all other countries or region’s GDP would face negative impact (Table 3). As far as social welfare is concerned, the formation of the cross-strait FTA would increase Taiwan’s and Mainland China’s social welfare by US$4.8 billion and US$180 million, respectively; while all other trading partners would face decreased social welfare except Japan. The major reason is that Japan has invested heavily in cross-strait trade and products that Japanese firms supply the most complements the products of the two FTA members, so Japan’s terms of trade would improve as a result of a cross-strait FTA.
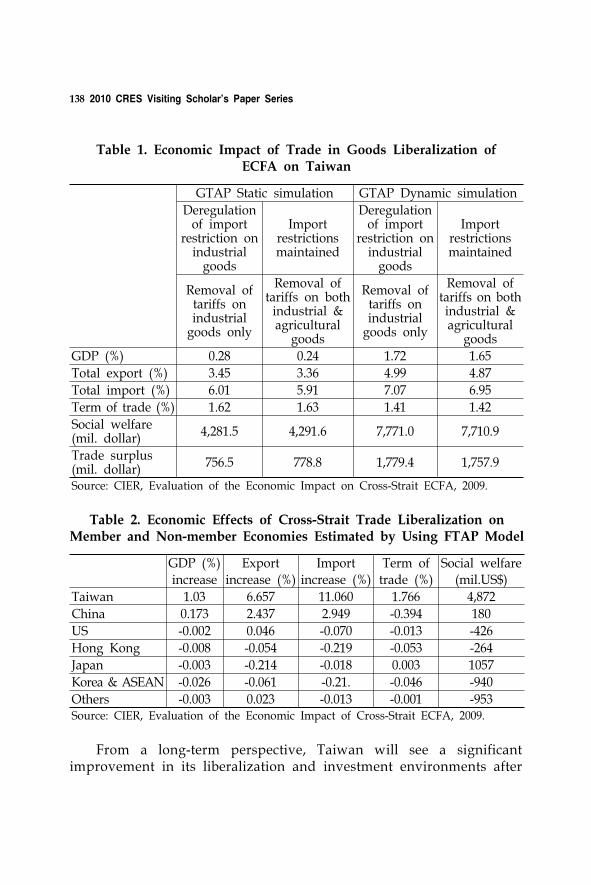
138 2010 CRES Visiting Scholar’s Paper Series
GTAP Static simulation GTAP Dynamic simulation
Deregulation of import
restriction on industrial
goods
Import restrictionsmaintained
Deregulation of import
restriction on industrial
goods
Import restrictionsmaintained
Removal of tariffs on industrial
goods only
Removal of tariffs on both
industrial & agricultural
goods
Removal of tariffs on industrial
goods only
Removal of tariffs on both industrial & agricultural
goods
GDP (%) 0.28 0.24 1.72 1.65
Total export (%) 3.45 3.36 4.99 4.87
Total import (%) 6.01 5.91 7.07 6.95
Term of trade (%) 1.62 1.63 1.41 1.42
Social welfare(mil. dollar)
4,281.5 4,291.6 7,771.0 7,710.9
Trade surplus(mil. dollar)
756.5 778.8 1,779.4 1,757.9
Source: CIER, Evaluation of the Economic Impact on Cross-Strait ECFA, 2009.
Table 1. Economic Impact of Trade in Goods Liberalization of ECFA on Taiwan
GDP (%)increase
Export increase (%)
Import increase (%)
Term of trade (%)
Social welfare (mil.US$)
Taiwan 1.03 6.657 11.060 1.766 4,872
China 0.173 2.437 2.949 -0.394 180
US -0.002 0.046 -0.070 -0.013 -426
Hong Kong -0.008 -0.054 -0.219 -0.053 -264
Japan -0.003 -0.214 -0.018 0.003 1057
Korea & ASEAN -0.026 -0.061 -0.21. -0.046 -940
Others -0.003 0.023 -0.013 -0.001 -953Source: CIER, Evaluation of the Economic Impact of Cross-Strait ECFA, 2009.
Table 2. Economic Effects of Cross-Strait Trade Liberalization on Member and Non-member Economies Estimated by Using FTAP Model
From a long-term perspective, Taiwan will see a significant improvement in its liberalization and investment environments after
Cross-Strait ECFA Should be the Stepping Stone for Taiwan Joining in the East Asia Economic Integration 139
the signing of the ECFA, when it is allowed to proceed with economic integration with more and more trade partners in the free trade zone. This will very likely make Taiwan an important gateway for foreign investors seeking to access the East Asian market. The potential investment benefits brought about by the ECFA; therefore, should not be underestimated.
3.2.2. Impacts on Industries OutputThe liberalization measures will cause structure changes in Taiwan’s
industrial output, because some industries are more competitive and some industries are less competitive in the bilateral trade. According to the GTAP analysis, because Mainland China will remove her relatively high tariffs in the bilateral free trade agreement with Taiwan, plastic and rubber, machinery, textile, iron and steel, crude oil and automobile parts industries are the industries that would benefit the most from the ECFA. And the electronics and machinery equipment, other transportation equipment, wood & paper, air transportation and other manufacturing goods industries in Taiwan are, relatively, more vulnerable to these measures and likely would suffer from shrinking production.
It is necessary to bear in mind, however, that the industries which are more vulnerable to the liberalization measures are receiving a higher level of protection at the present stage. Also, the analysis did not take into account the adaptive measures taken by the Government or the industries after market-opening. Such measures may include: improving production efficiency by applying advanced technologies; further differentiation of their products by elevating service quality and contents of the knowledge economy; encouraging creativity in developing new products, etc. The competitive pressure in an open market, therefore, will become the driving force for these protected industries to aggressively adapt to changes by developing diversified, user-friendly and value-adding products. These efforts will in turn lead to further diversification for cross-strait trade and industrial specialization.
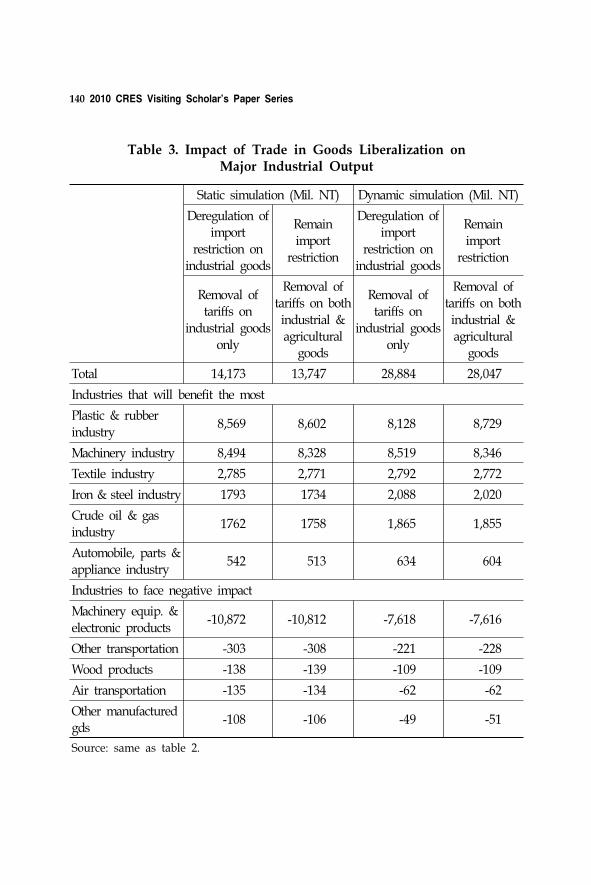
140 2010 CRES Visiting Scholar’s Paper Series
Static simulation (Mil. NT) Dynamic simulation (Mil. NT)
Deregulation of import
restriction on industrial goods
Remain import
restriction
Deregulation of import
restriction on industrial goods
Remain import
restriction
Removal of tariffs on
industrial goods only
Removal of tariffs on both
industrial & agricultural
goods
Removal of tariffs on
industrial goods only
Removal of tariffs on both
industrial & agricultural
goods
Total 14,173 13,747 28,884 28,047
Industries that will benefit the most
Plastic & rubber
industry8,569 8,602 8,128 8,729
Machinery industry 8,494 8,328 8,519 8,346
Textile industry 2,785 2,771 2,792 2,772
Iron & steel industry 1793 1734 2,088 2,020
Crude oil & gas industry
1762 1758 1,865 1,855
Automobile, parts & appliance industry
542 513 634 604
Industries to face negative impact
Machinery equip. &
electronic products-10,872 -10,812 -7,618 -7,616
Other transportation -303 -308 -221 -228
Wood products -138 -139 -109 -109
Air transportation -135 -134 -62 -62
Other manufactured gds
-108 -106 -49 -51
Source: same as table 2.
Table 3. Impact of Trade in Goods Liberalization on Major Industrial Output

Cross-Strait ECFA Should be the Stepping Stone for Taiwan Joining in the East Asia Economic Integration 141
3.2.3. Benefits of the ECFA Early Harvest ClausesThe ECFA is a framework agreement. It defines the goals and
areas that the two sides will negotiate in the future and the timelines for continued negotiations. In order to receive the benefits of trade liberalization, however, there is an “Early Harvest” list which will allow certain specific industries to enjoy more favorable treatments in advance. According to this early harvest list of goods in trade, China has offered Taiwan a total of 539 items (8-digit HS code basis) for tariff reductions, based on the demand for these industries and the trend of international competition. The 539 items include 18 agricultural products, 88 petrochemical material and plastic products, 107 machinery and tools, 136 textile products, 50 auto parts and 140 other products. The total export value of the above products from Taiwan to China in 2009 was USD13.8 billion, representing 16.14% of the Taiwan’s total exports to China (Table 4).
Industry Type
Early Harvest Items Agreed by China
Items
2009 Value of
Taiwanese Exports to China
Percentage of Total
Taiwanese Exports to China
Petrochemical 88 5,944.08 6.93%
Machinery 107 1,143.39 1.33%
Textile 136 1,588.34 1.85%
Transportation 50 148.44 0.18%
Others 140 4,997.21 5.84%
Agriculture 18 16.08 0.02%
Total 539 13,837.54 16.14%
Source: Industrial Development Bureau, Ministry of Economic Affairs.
Table 4. Early Harvest List of Tariff-Reduction Items Offered by China
(Unit: USD Million)
Taiwan, on the other hand, offered to open 267 items, including 42 petrochemical materials and plastic products, 69 machineries and equipments, 22 textile products, 17 transportation equipments, 117 items of chemicals, dyeing materials, and sports equipments, etc. The
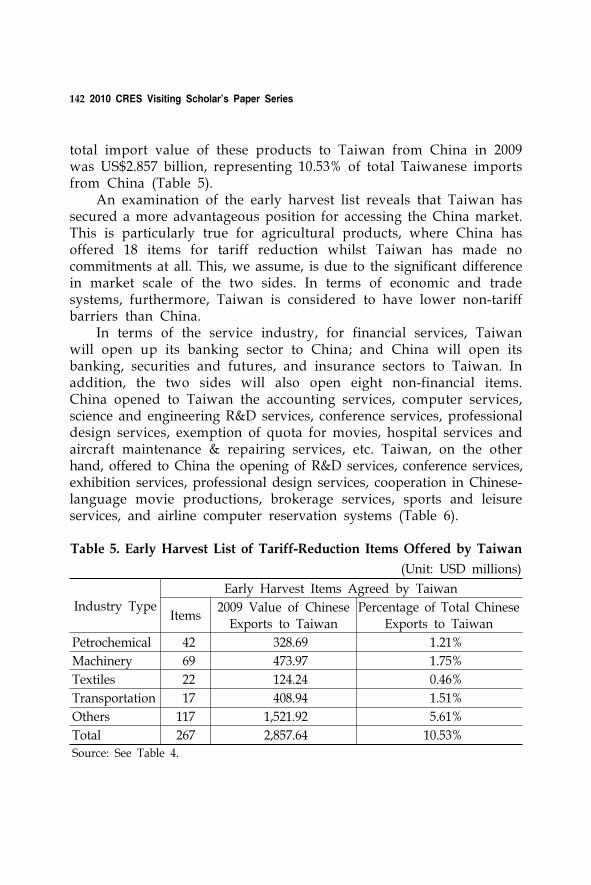
142 2010 CRES Visiting Scholar’s Paper Series
total import value of these products to Taiwan from China in 2009 was US$2.857 billion, representing 10.53% of total Taiwanese imports from China (Table 5).
An examination of the early harvest list reveals that Taiwan has secured a more advantageous position for accessing the China market. This is particularly true for agricultural products, where China has offered 18 items for tariff reduction whilst Taiwan has made no commitments at all. This, we assume, is due to the significant difference in market scale of the two sides. In terms of economic and trade systems, furthermore, Taiwan is considered to have lower non-tariff barriers than China.
In terms of the service industry, for financial services, Taiwan will open up its banking sector to China; and China will open its banking, securities and futures, and insurance sectors to Taiwan. In addition, the two sides will also open eight non-financial items. China opened to Taiwan the accounting services, computer services, science and engineering R&D services, conference services, professional design services, exemption of quota for movies, hospital services and aircraft maintenance & repairing services, etc. Taiwan, on the other hand, offered to China the opening of R&D services, conference services, exhibition services, professional design services, cooperation in Chinese- language movie productions, brokerage services, sports and leisure services, and airline computer reservation systems (Table 6).
Industry Type
Early Harvest Items Agreed by Taiwan
Items2009 Value of Chinese
Exports to TaiwanPercentage of Total Chinese
Exports to Taiwan
Petrochemical 42 328.69 1.21%
Machinery 69 473.97 1.75%
Textiles 22 124.24 0.46%
Transportation 17 408.94 1.51%
Others 117 1,521.92 5.61%
Total 267 2,857.64 10.53%
Source: See Table 4.
Table 5. Early Harvest List of Tariff-Reduction Items Offered by Taiwan
(Unit: USD millions)

Cross-Strait ECFA Should be the Stepping Stone for Taiwan Joining in the East Asia Economic Integration 143
Early Harvest Items Offered
by China
Early Harvest Items Offered
By Taiwan
Non-Financial Services
(8 items from each side)
Accounting and auditing (CPC862)-extending the
validity of permits for casual audits, computer services (842 and 843, excluding 8439)
Science and engineering R&D (851), conference services (87909), professional design
(87907), removal of quotas on imported Chinese films from Taiwan (96121), hospital
services (9311), aircraft maintenance and repairing (8868).
Research and development (851, 852 and 853), conference
services (87909), cooperation in professional exhibition services (87909), professional
design (excluding interior design) (87907), allowing release of China-made or
jointly-produced movies (10 films per year), brokerage services (excluding living
animals) (621), sports and leisure services (96411, 96412 and 96419), air services -
computer reservation systems.
Financial Services
(1 item offered by Taiwan and 3 items offered
by China)
Banking services, securities and futures services,
insurance services
Banking services
Source: Source: See Table 4.
Table 6. ECFA Early Harvest List for Trade of Services
To summarize, official estimates show that the economic benefits brought by the early harvest items offered by China to Taiwan would contribute to a 0.4 percent GDP growth in Taiwan and a 0.86 percent increase in its industrial productivity. Tariffs will be reduced by about NT$29.5 billion.
3.3. Effects of trade liberalization of the ECFA on Taiwan’s Industrial Structure Adjustments and the Development of Service Industries in China
The ECFA will facilitate reciprocal market opening between the

144 2010 CRES Visiting Scholar’s Paper Series
two sides. Once the trade barriers have been removed, professional specialization and trade between the two sides will be rearranged in accordance with the relative resource advantages of each side. That will speed up the structural adjustment in Taiwan.
3.3.1. Taiwan’s Industrial Structural AdjustmentsThe resources of the two sides are highly complimentary. China
is distinguished by its huge market, abundance in manpower, and rapidly-growing consumption power. Taiwanese products, on the other hand, have the advantage of being produced by high-standard, capital intensive technologies; and abundant creative talents. These facts suggest that there are considerable hidden benefits from the professional specializations of these two sides. Looking at the technical level of the manufacturing industries, Taiwanese suppliers possess first-class technology and significant international market shares in many hi-tech categories including electronics, electric machinery, computers, semiconductors, packaging, and testing. Owing to limited domestic demand, Taiwan’s investment in branding is scarce. In view of the copious manpower and market demand in China, cooperation between the two sides will help optimize profits and facilitate brand-building. In the future, Taiwan may even position itself as the standard setter for these products, taking into account such large market capacity. As for traditional manufacturing industries, Taiwanese suppliers enjoy advantages of higher technical expertise, abundant design talents, and integrated marketing services. They are, however, less competitive in production costs when compared with China. The cross-strait cooperation process will enable Taiwan to apply its advanced production technologies in China, thereby optimizing profits, expanding manufacturing scope, and elevating brand image. Furthermore, Taiwan’s superior marketing systems and strategies will contribute to the expansion of the international market and the establishment of a win-win position.
3.3.2. Development of Service Trade in Mainland China by Taiwanese Investors
In terms of general service industries, the production value of the service sector in Taiwan has exceeded 70% of its GDP, and 58% of Taiwan’s working population are employed by the service industries. In China, the service industries accounted for only 40% of its GDP in
Cross-Strait ECFA Should be the Stepping Stone for Taiwan Joining in the East Asia Economic Integration 145
2009, and the percentage employed in the service industries, was 33% of the total working population. Therefore, there is still much room for developing the service industries in China. On the other hand, the service industries in Taiwan, distinguished by their excellent service quality and high competitiveness, will create tremendous business opportunities, facilitate a boom in service industries and create jobs in China. With respect to the wholesale, retail and logistics industries; Taiwanese investors, such as RT Mart (the Ruentex Group), President Chain Store, Pacific Sogo Department Store, Tin Hsin International Group, Carrefour and Welcome Trust-Mart, etc. have successfully invested in China over the past few decades. One of the key success factors for these enterprises is the application of their “Taiwan Experience” in China in establishing important distribution channels (Tu & Fung 2009). Welcome Trust-Mart, for example, started their business in China in 1996 and has built several dozen discount stores for electrical and home appliances in Guangzhou, Chengdu, Shanghai and Beijing. Targeting middle-income families, the company has successfully achieved its goal of fast expansion by emphasizing the excellent value and discount prices of its products. It is therefore one of the most successful examples in the logistics industry of creating a distribution channel.
These successful examples highlight the fact that, for Taiwanese investors in China, the experience in managing department, discount, or retail stores is deemed an important competitive advantage in the logistics business. By nature, success in the service industry relies very much on the free circulation of goods and resources. The rapid development and growth of Taiwan’s economy and trade over the past years, therefore, is highly attributable to the free market economic system prevailing in the country. The free market economic system has created a very favorable environment for entrepreneurship and developed numerous successful business experts with high sensitivity and responsiveness to the market. When exploring markets in China, Taiwanese enterprises will have excellent opportunities to fully demonstrate their long-accumulated management expertise in these fields.
Effective distributor management is a key factor for success in developing domestic markets in China. Apart from this, manufacturers can also achieve optimal profit through rapidly-expanding economic

146 2010 CRES Visiting Scholar’s Paper Series
scale, if they can accurately position individual products and fully grasp the broad market in China. Successful examples include the Crown Enterprises Group, a manufacturer of suitcases and bags; the Prime Success International Group which specializes in the production of ladies’ shoes and handbags; and the Comestibles Co., Ltd. (85℃), a supplier of low-price coffee. Without exception, all these companies have appropriately positioned their products and fully grasped the attributes of the huge market in China, which resulted in the fast expansion of their business territories and market shares. Other well-recognized cases of success include the Want-Want Group, Master Kong, Airmate, and Ajisen Ramen Japanese Noodle.
On examining these cases, we discover that all successful companies share one thing in common, i.e., they have taken full advantage of the market features in China when positioning their products. The China market is characterized by its large population, recent market opening, and the lack of distinguished brands and distributors. As long as the quality of their products and services are considered good, stable and trustworthy by consumers, these companies will successfully attain their goals of fast expansion of business bases, enlarged business scope and optimized profit. At the initial stage of market development, these companies normally access the market via second or third tier cities. This is also the stage in which they will experience “low points” in their development process, and overcome various cultural barriers and interpersonal difficulties. Once they have won the trust of consumers, they will be able to rapidly expand their business bases and duplicate the successful experience in other cities. So far, it is said that Taiwan itself has been one of the brand that consumer would pay 30% more for.
Economic integration will push participants to open their markets, eliminate barriers, stimulate investment, and mutual trade; while the non-member countries or region will be crowded out. ASEAN is a competitor of China in terms of trade and attracting foreign direct investment. Other Asian countries, like South Korea is a competitor of Taiwan in many manufacturing goods. The impacts of the ECFA on cross-strait economic relations are obviously positive and the ECFA also encourages more trade and investment between member economies. Economic activities of Taiwan with the non- member economies, such as investment in ASEAN, and exports from South
Cross-Strait ECFA Should be the Stepping Stone for Taiwan Joining in the East Asia Economic Integration 147
Korea would be very likely substituted by trade and investment increasing resulted from ECFA.
4. Policy Implications for other East Asia Countries
4.1. The Implication of Trade and Investment Relation between Taiwan and East Asian Countries
The mutual trade and investment relations between Taiwan and East Asian countries are very close. Of the 243.2 billion US dollars in exports from Taiwan in 2008;2) more than 63.5 percent were exported to ten East Asian countries;3) and 49.1 percent of the 239.6 billion dollars in imports came from these ten East Asian countries (see Table 7). About 70 to 80 percent of Taiwan’s external investments were made in East Asian countries. A significant proportion of Taiwan’s export to East Asian countries is intermediate goods trade which is derived by overseas investment and overseas production. After the goods are processed in East Asian countries, they are then exported to ultimate consumer market, thus forming an important supply chain system globally and stimulating market-driven integration.
Table 8 shows that Taiwan’s accumulated investment in seven East Asian countries (China, Singapore, Thailand, Philippine, Malaysia, Vietnam and Indonesia) in 2008 has reached 140 billion US dollars, where ASEAN countries are competitive with mainland China in terms of foreign trade and alluring foreign direct investment from Taiwan. Since there are close trade and investment relationships between Taiwan and East Asia, if Taiwan’s economy is integrated with China only, some of the trade and foreign direct investment between Taiwan and Southeast Asia will be diverted to China.
Other than that, institutional integration after signing an FTA
should comply with market-driven integration to increase efficiency
2) Because of the financial crisis and the global economic downturn in 2009, trade statistics for 2009 seems an outlier in the time series data. So the author did not use the data of 2009.
3) 10 East Asian countries are China, Japan, Korea, Indonesia, Malaysia, Thailand, Philippine, Singapore, Vietnam and Hong Kong.
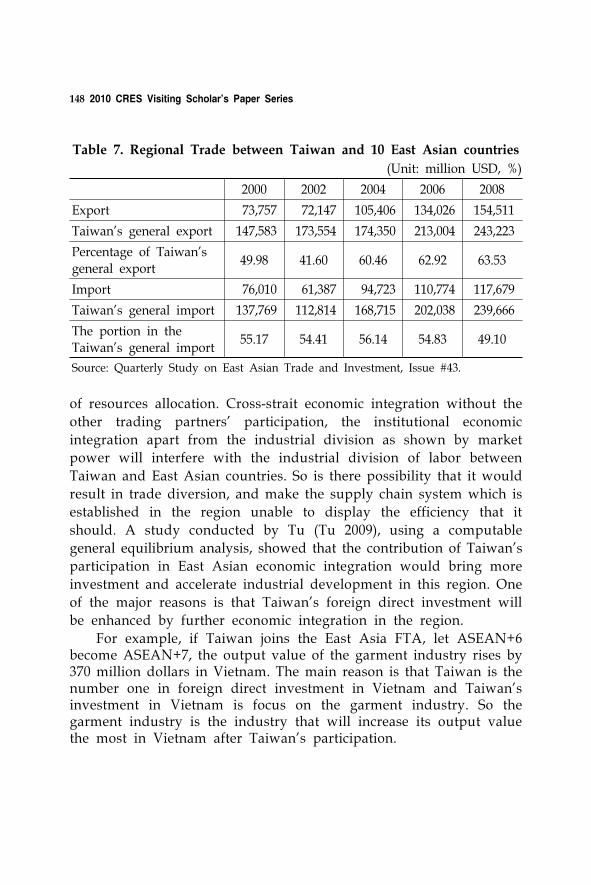
148 2010 CRES Visiting Scholar’s Paper Series
2000 2002 2004 2006 2008
Export 73,757 72,147 105,406 134,026 154,511
Taiwan’s general export 147,583 173,554 174,350 213,004 243,223
Percentage of Taiwan’s
general export49.98 41.60 60.46 62.92 63.53
Import 76,010 61,387 94,723 110,774 117,679
Taiwan’s general import 137,769 112,814 168,715 202,038 239,666
The portion in the Taiwan’s general import
55.17 54.41 56.14 54.83 49.10
Source: Quarterly Study on East Asian Trade and Investment, Issue #43.
Table 7. Regional Trade between Taiwan and 10 East Asian countries
(Unit: million USD, %)
of resources allocation. Cross-strait economic integration without the
other trading partners’ participation, the institutional economic
integration apart from the industrial division as shown by market
power will interfere with the industrial division of labor between
Taiwan and East Asian countries. So is there possibility that it would
result in trade diversion, and make the supply chain system which is
established in the region unable to display the efficiency that it
should. A study conducted by Tu (Tu 2009), using a computable
general equilibrium analysis, showed that the contribution of Taiwan’s
participation in East Asian economic integration would bring more
investment and accelerate industrial development in this region. One
of the major reasons is that Taiwan’s foreign direct investment will
be enhanced by further economic integration in the region.
For example, if Taiwan joins the East Asia FTA, let ASEAN+6 become ASEAN+7, the output value of the garment industry rises by 370 million dollars in Vietnam. The main reason is that Taiwan is the number one in foreign direct investment in Vietnam and Taiwan’s investment in Vietnam is focus on the garment industry. So the garment industry is the industry that will increase its output value the most in Vietnam after Taiwan’s participation.
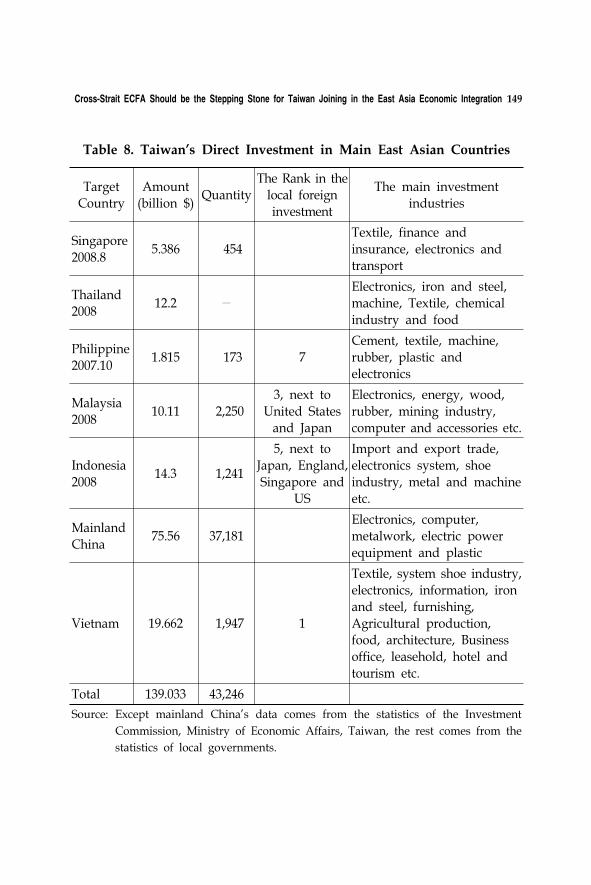
Cross-Strait ECFA Should be the Stepping Stone for Taiwan Joining in the East Asia Economic Integration 149
Target Country
Amount (billion $)
QuantityThe Rank in the
local foreign investment
The main investment industries
Singapore
2008.85.386 454
Textile, finance and
insurance, electronics and transport
Thailand2008
12.2 -Electronics, iron and steel, machine, Textile, chemical
industry and food
Philippine2007.10
1.815 173 7Cement, textile, machine, rubber, plastic and electronics
Malaysia
200810.11 2,250
3, next to
United States and Japan
Electronics, energy, wood,
rubber, mining industry, computer and accessories etc.
Indonesia
200814.3 1,241
5, next to Japan, England,
Singapore and US
Import and export trade, electronics system, shoe
industry, metal and machine etc.
Mainland China
75.56 37,181Electronics, computer, metalwork, electric power
equipment and plastic
Vietnam 19.662 1,947 1
Textile, system shoe industry, electronics, information, iron and steel, furnishing,
Agricultural production, food, architecture, Business office, leasehold, hotel and
tourism etc.
Total 139.033 43,246
Source: Except mainland China’s data comes from the statistics of the Investment
Commission, Ministry of Economic Affairs, Taiwan, the rest comes from the
statistics of local governments.
Table 8. Taiwan’s Direct Investment in Main East Asian Countries
150 2010 CRES Visiting Scholar’s Paper Series
Study results also show that Taiwan’s participation in the electronics industry and machine building industry would increase their output values and investments in Indonesia, Malaysia and Thailand, than without Taiwan’s participation.
On the contrary, since ASEAN and China are competitors with each other, economic integration between Taiwan and China may have negative effects not only for ASEAN’s macro-economy, foreign trade and its attractiveness to foreign direct investment; but also may destroy the industrial division that has been set up in the East Asian value supply chain. These negative impacts, however, will be removed if economic integration can be expanded to most East Asia countries, by not only decreasing the diversion effects, but also deepening the trade and economic relations and industrial division relations between Taiwan and East Asian countries. In addition, Taiwanese companies may turn out to be the best partners for foreign firms when they access the Chinese market.
4.2. Taiwanese Companies are Potential Strategic Partners for Other Countries’ Enterprises when they access the China Market
Possessing the aforementioned competitive advantages, Taiwanese enterprises are not only well-equipped to make a profit in China; they are also potential business partners of foreign companies who wish to access the market, because they have the same language, lineage and cultural background with China. Although economic and trade systems in China are moving towards a market-oriented environment, there still exists considerable differences between China and other countries in terms of cultural, political and social policies. Many foreign companies, therefore, face numerous problems when entering the China market, including statutory issues, state-business relations, copyright problems, intellectual property rights issues, and different standards in terms of human rights and social values, etc. The support from Taiwanese enterprises, no doubt, will help these foreign companies acquire a better grasp on the growing business opportunities in the China market. As a result, a joint venture agreement has been entered between the Metro Group, a large European chain store group, and the Hon Hai Group in early 2010, leading to the opening of the Metro Market shopping mall in Shanghai. The aim
Cross-Strait ECFA Should be the Stepping Stone for Taiwan Joining in the East Asia Economic Integration 151
is to wrest the growing market for electronics consumer products in China. With continuous progress in the normalization and liberalization of cross-strait relations, we anticipate more and more foreign companies seeking support from or strategic partnership with Taiwanese enterprises.
5. Conclusions
China was the only country in the world to achieve economic growth at an annual rate of 8 percent following the global financial crisis. The Chinese government, in the meantime, is actively expanding domestic demand. Considering all these facts, China will, no doubt, continue to be the most important and fastest-growing market in the world.
Taiwanese enterprises have long been tough competitors. Liberalization measures implemented in the past have turned out to be Taiwan’s opportunities to further upgrade its product quality and industrial structure in the international market. For most Taiwanese companies, market opening brings important opportunities for speedy growth and adjustments in production structure, rather than adverse impacts. This is particularly the case as countries around the world are actively engaged in economic integration. Taiwan’s major trading partners and competitors are also expediting the market opening process among one another. Excluded from participating in this trend, Taiwan faces the threat of marginalization of its trade and economy. China is Taiwan’s number one export market: exports to China (including Hong Kong) account for 40% of Taiwan’s total export value. The reciprocal tariff elimination resulting from the cross-strait ECFA will naturally have a significant positive effect on the island’s exports. When necessary, the government will design supportive measures or safeguard mechanisms for the limited, less-adaptive companies, aiming to improve their adaptability and minimize impacts. When constructing the relevant policies for a market opening, a government should simultaneously incorporate these supplementary measures into the plan.
Because of China’s relatively high tariffs and vast market, Taiwan will be in a better position to further develop its market following
152 2010 CRES Visiting Scholar’s Paper Series
the reciprocal market opening. The opening of China’s domestic market in recent years has necessitated the speedy expansion of its service industries. Taiwan has a well-developed, booming trade service industry. The economic and trade resources of the two sides are highly complementary. There is plenty of room in both the domestic and import markets of China for Taiwan to demonstrate its capabilities in trade and services. Taiwan looks forward to further progress in the professional specialization and trades, as well as developing deeper and more diversified economic cooperation between the two sides. It is believed that these will also contribute to expedited economic growth and development of the service industry in China.
However, since Taiwan has been one of the major foreign investors in the Southeast Asian region, if Taiwan and China reinforce economic integration without developing economic integration with other East Asian countries, the external trade and investment now going into Southeast Asian countries will be diverted to China. In addition, economic development and the structure of external trade between Taiwan and Korea are very similar; as a result, Korea’s exports to China may be substituted by Taiwan because of the trade diversion effect.
Economic theory and modeling results show that a larger FTA can create more benefits than a smaller one. Hence the economic benefits from the EAFTA are expected to exceed those from the AFTA, any ASEAN+1 FTA, or any other sub-regional arrangement. If Taiwan can join in the East Asian economic integration, the economic benefits among members resulting from regional integration can be expanded further.
Taiwan is not in the list of the EAFTA because of political reasons. The role Taiwan played in the supply chain of many manufactured goods will be affected and cause trade diversion and investment diversion effects, which will result in negative impacts not only on Taiwan’s macro-economy, foreign trade and attractiveness to foreign direct investment, but also on the industrial division of labor that has been set up in East Asia.
For the same reason, if Taiwan and China reinforce their economic integration without developing economic integration with other East Asian countries, the other East Asian countries’ external trade and foreign investment coming from Taiwan will be diverted to China.
Cross-Strait ECFA Should be the Stepping Stone for Taiwan Joining in the East Asia Economic Integration 153
Signing an FTA with China is not without its difficulties. China is huge. Chinese exports are very competitive in terms of prices. Certain weak and sensitive industries are likely to be affected by opening market under the FTA with China. Small and medium-sized business may face the threat of import surge from China, so domestic industries need to be prepared to upgrade their technology. Import relief system should be strengthened by the government in the case that sensitive industries are hurt by imports. However another issue worth thinking about even more is the status quo of Chinese market economy. According to reports issued by the U.S. and the EU, the Chinese government may have the power interfere in the market, with subsidization of some industries by Chinese government. This is due to the fact that China is in a period of transition from a centrally- planned to a market economy. Any economy concluding an FTA with China has to face the challenge and handle this issue carefully, while Taiwan seems the one that will accelerate China’s progress through this transition period.
Of course, there are also some advantages in an FTA with China, such as the huge size and fast growth of the latter’s domestic market. But the basic benefits mainly come from opening markets among FTA members by eliminating barriers, stimulating investment and trade with each other. In order to extend the benefits of economic integration and to maintain the division and cooperative relations formed in the East Asian supply chain, Taiwan and the East Asian countries should pursue a larger-scale economic integration in this region, to avoid not only the trade and investment diversion effects but also to enhance the supply chain system with the East Asian countries. That will speed up the development of ASEAN’s industries and enhance economic benefits of all members in this region.
ECFA is a milestone that will institutionalize cross-strait relations under the principle and framework of the WTO. The way that China and Taiwan has handled their relations in the ECFA is a good example and sign that the political impediments related to Taiwan joining in the regional economic integration will be solved by their mutual wisdom in the near future.
154 2010 CRES Visiting Scholar’s Paper Series
References
Chung-Hua Institution for Economic Research (CIER). 2009. Evaluation of the Economic Impact of Cross-Strait Economic Cooperation Framework Agreement, Taipei (in Chinese).
Dee, Phillip. 2005. “A Compendium of Barriers to Services Trade.” Available from: http://www.crawford.anu.edu.au/pdf.
. 2007. Hands across the Pacific― the Potential Benefits of a US- Taiwan Free Trade Agreement. East Asian Bureau of Economic Research, Crawford School of Economics and Government, Australian National University.
Industrial Development Bureau, Ministry of Economic Affairs, http:// www.ecfa.org.tw.
Joint Expert Group for Feasibility Study on EAFTA. 2006. “Towards an East Asia FTA: Modality and Road Map.”
Tu, Chaw-Hsia. 2009. “The Role of Taiwan in East Asian Economic Integration and APEC.” Paper presented in the Workshop on “Taiwan and South East Asia Relation.” Singapore.
Tu, Chaw-Hsia & Li-Wei Fung, 2009, Study on Chinese Domestic Market and the Economic Interest of Taiwanese Investors in China, project report commissioned by Ministry of Foreign Affairs and Bureau of Foreign Trade, Ministry of Economic Affairs, 2009, Taipei (in Chinese).
Tu, Chaw-Hsia, Pei-chow Lin & Shing-chen Lee. 2008. “East Asian Regionalism and Its Impact on Taiwan.” Economic Outlook. Taipei: Chung-Hua Institution for Economic Research. (in Chinese)
. 2007. Development of China, Japan, Korea Joining in the East-Asia Economic Integration and the Adaptive Policies Suggestion to Taiwan, project report commissioned by Ministry of Foreign Affairs, Dec. (in Chinese).
Verikios, George and Kevin Hanslow. 1999. “Modeling the effects of implanting the Uruguay Round: A comparison using the GTAP model under alternative treatments of international capital mobility.” Paper presented at the 2nd Annual Conference on Global Economic Analysis, 20-22 June, Demark.

Korea's FTAs and their Implications
for the Korean Wine Market
Timothy John Beal
1. Introduction
The primary objective of this research is to explore, from a marketing perspective, the impact of the Korea-Chile Free Trade Agreement (FTA) on the Korean wine market and implications of that impact for future FTAs, principally and most immediately, on the Korea-EU FTA. A second objective is to identify the differences between the Chile FTA and the EU (and subsequent) FTAs as they relate to wine. Thirdly, it is hoped that this study of the repercussions of the FTA, both past and what is to come, may shed light on future prospects of the Korean wine market. The Chile FTA was Korea’s first FTA, and although wine imports were a very small part of total imports from Chile, wine assumed a special significance as the symbol of the FTA. Despite the symbolism, the Chile FTA was but a minor driver of the expansion of the Korean wine market up to 2008. There were deeper underlying forces behind the growth of the wine market. Globalisation within the context of rising incomes and booming consumer confidence provided the environment in which the Chile FTA had a stimulating effect. In 2009 the global financial crisis produced a decisive slump in the market, from which it has yet to recover. If the Korean economy resumes rapid growth, and more importantly, if consumers recover confidence in their ability to engage in such discretionary spending, will the expected fall in wine prices in July 2011 propel the market to a higher stage? Will wine be on the way to becoming indigenised and a ‘normal’ part of life for a substantial proportion of Koreans as it has in recent generations for the English, the Australians, the New Zealanders and other people
156 2010 CRES Visiting Scholar’s Paper Series
from countries without a traditional wine culture?
1.1. FTAs
FTAs are predicated upon, and build upon, complementarities in economies. However there are inevitably large areas in the economies which are competitive and this contested terrain is where FTA negotiations, and implementations, falter. In the Korean case, wine stands outside this contested territory. Since Korea currently has no appreciable domestic wine production, and what little there is comes mainly from imported grapes, both the Korean side and its negotiating partner (in the case of wine exporting countries) have an incentive to advance the FTA.1) Indeed, if anything, the incentive may be stronger on the Korean side. Wine is a very small part of the exports to Korea even from the largest wine producing countries. France, for instance, has the leading position in the Korean wine market with 32.5% of wine imports in 2009, yet wine accounted for only 0.9% of Korea’s imports from France.2) For the Korean government, on the other hand, ‘cheaper wine’ is a good way to sell FTAs, which are inevitably contentious, to the Korea public; as a recent headline in the Korea Times exclaimed, ‘EU FTA to bring cheaper wine, luxuries’.3)
Korea currently has about 16 active FTAs in operation.4) An FTA has been signed with the European Union and a comprehensive economic partnership agreement with India.5) The ‘strategic partnership’ with India was predicted to double trade between the two countries
1) Gi-Cheol Song, “Grape production in the Republic of Korea,” in Regional office for Asia and the Pacific, Food and Agricultural Organization of the United Nations, ed. Minas K. Papademetriou and Frank J. Dent (Rome: FAO 2001).
2) See Appendix Table A7A. For clarity and ease of reading, detailed statistics such as these have been put in the appendix, with only summarised, or graphed, data in the main text.
3) Tong-hyung Kim, “EU FTA to bring cheaper wine, luxuries,” Korea Times, 7 October 2010.
4) Gang-yeon Lee, “Know the Rules to Make the Most of Korea's FTAs,” Chosun Ilbo, 5 November 2009. A further seven are ‘under consideration’; see Appendix Table A1.
5) “How N. Koreans Feel About Their 3 Generations of Leaders,” Chosun Ilbo, 2 October 2010.
Korea's FTAs and their Implications for the Korean Wine Market 157
by 2014.6) Korea is also negotiating FTAs with Australia, New Zealand, Peru and the Gulf Cooperation Council, and there are suggestions to develop trade negotiations with Japan and China.7) The biggest current FTA issue is the one signed with the United States (KORUS) but not ratified by the US. It is uncertain when it will be ratified; the consensus would seem to be that it will not happen in 2010.8) In contrast to the usual situation where it is agricultural forces that oppose an FTA, in this case the opposition is spearheaded by the US auto industry.9) The FTA with the European Union is now scheduled to come into operation in July 2011.10)
1.2. Wine market
Clearly this FTA framework has an uneven impact both on the Korean wine market and the wine trading implications for the FTA partners. The United States is a major wine exporter, yet wine is a very small portion of its export profile. Nevertheless, wine is specifically mentioned in the US Department of Agriculture material advocating the KORUS FTA, describing its benefits to American producers. It notes in particular that the current 15% tariff on wine would be abolished immediately on implementation of the FTA.11) New Zealand, on the other hand, is a much smaller exporter, but wine is quite an important export item. Wine’s share of New Zealand’s exports grew from 0.1% in 1988 to 2.18% in 2008, 22-fold over just two decades.12)
In addition, wines from different countries have quite distinctive
6) Jeong-ju Na, “Korea, India to Double Trade by 2014,” Korea Times, 25 January 2010.
7) Lee, “Know the Rules to Make the Most of Korea's FTAs.”
8) Jean H. Lee, “A rare glimpse at a different side of North Korea,” Washington Post, 15 October 2010.
9) Jeffrey Lewis, “The Cooling Tower,” 38 North (2010).
10) Troy Stangarone, “The Deadline is Set: EU-Korea FTA to Come into Force on July 1, 2011,” Korea Insight (2010).
11) “U.S.-Korea Free Trade Agreement: Pennsylvania Farmers Will Benefit,” US Department of Agriculture Foreign Agricultural Service Fact Sheet, September 2008.
12) Tim Beal and Rod, Michel, “Riding social change: The New Zealand experience in the evolving wine markets of Japan and Singapore,” Asia: NZ Foundation 2009.
158 2010 CRES Visiting Scholar’s Paper Series
marketing profiles. Wine from Chile sells to a large degree based on price (helped by its FTA), while wine from France is often marketed on its status. The anticipated FTA with the EU is predicted to ‘stir up competition’ but exactly what will happen is as yet unclear.13)
Comprehensive statistical data on the Korean wine market, and the alcoholic beverages market more generally, is not readily available. There is a limited amount of market research, at least in the public domain. The most substantial survey available in English is the US Department of Agriculture’s ‘Wine Market Brief’ of 2009.14)
Wine is usually thought of as grape wine but in the Korean context we must also consider rice wine, notably makgeolli, and indeed other alcoholic beverages which are considered to be substitutes for grape wine such as soju and beer. When wine imports are reported it is invariably in the context of market share with soju, whisky, beer, or makgeolli.15)
However, wine and its competitor drinks are not merely beverages. They are also iconic products with layers of meaning. Health is one aspect. Too much alcohol is bad but moderate wine drinking is often considered to be health-promoting. When Korean consumption of wine surpassed that of soju in 2008 it was reported that this was because Koreans were persuaded that wine was ‘healthy’.16)
1.3. Wine in the battle between globalisation and national identity
Wine is also widely seen as the ‘symbol of globalization’.17) When internationalisation and globalisation are fashionable, and when people strive to be considered global citizens, people in non-traditional markets (such as Korea) turn to wine as the expression of that wish. But of
13) “Free Trade to Stir Up Wine Competition,” Chosun Ilbo, 27 March 2009.
14) Sangyong Oh and Michael Fay, “Annual Wine Market Brief (Korea - Republic of),” Global Agricultural Information Network (GAIN) Report KS9049, 14 October 2009.
15) Hyun-cheol Kim, “Wine Outsells Soju for First Time,” Korea Times, 1 June 2008.
16) “Sales of wine pass soju as Koreans get healthy,” JoongAng Ilbo, 2 June 2008.
17) Kyuho Lee, “Is a glass of Merlot the symbol of globalization? An examination of the impacts of globalization on wine consumption in Asia,” International Journal of Wine Business Research 21, no. 3 (2009).
Korea's FTAs and their Implications for the Korean Wine Market 159
course, there are countervailing tendencies. Traditional alcohols are seen as assertions of national identity, and here makgeolli is the pre-eminent symbol. Makgeolli, the Chosun Ilbo proudly proclaims, is ’to Be Served at Davos Forum’
Makgeolli, or Korean traditional rice wine, will be served at the World Economic Forum which kicks off in Davos, Switzerland on Jan. 27. The Federation of Korean Industries chose makgeolli, which has recently enjoyed explosive popularity, as the official drink for a toast at an event to promote Korea on Jan. 28 during the five-day Forum, and will bring 150 bottles of the milky-white light alcoholic beverage via the president's jet. “Since Korea's image will be reflected in a glass of alcohol, we are carefully planning its selection and shipping procedure,” an FKI official said. Korean cuisine will accompany the drink at the event, and a band will play traditional Korean instruments such as the gayageum, a 12-stringed Korean harp, and janggu, a double- headed drum. “We aim to make the event an opportunity to promote not only the Korean economy but also Korean traditional food and culture,” the official said. Makgeolli was served at a number of political and economic events over the past year including the Korea-Japan Summit last October. The government also plans to serve makgeolli to the visiting heads of state during the G20 Summit scheduled to be held in Seoul in November this year.18)
In between these two positions - globalisation and nationalism - are those that argue that wine will transcend its cultural origins and become indigenised, much in the same way as beer; who now in Korea thinks of beer as a foreign product? Similarly, there are those who regard wine as a natural part of Korean life, and as compatible with Korea cuisine. The first Asian Master of Wine, the Korean Jeannie Cho Lee, even describes wines in terms of traditional Korean
18) “Makgeolli to Be Served at Davos Forum,” Chosun Ilbo, 21 January 2010.
160 2010 CRES Visiting Scholar’s Paper Series
flavours. Wine and hansik, it is claimed, are a ‘natural blend’.19)
1.4. Wine and FTAs
FTAs lower or eliminate tariffs and to the degree that wine is an important traded good between contracting countries, an FTA will have some impact. It will promote sales of wine from the FTA country to the detriment of competing domestic products and wine from countries without an FTA. However, wine is a very complex product with all sorts of cultural and lifestyle implications, so the impact of price change is difficult to predict. Korea’s only FTA with a wine exporting country, the Chile FTA, is the only guide and the lessons from it are discussed below. To complicate matters, Chile was a special case and it is unwise to seek to extrapolate, without caveats, the implications for subsequent FTAs, notably EU and KORUS.
2. Korea's FTAs and their Implications for the Korean Wine Market
2.1. FTA pipeline
Korea’s FTA environment might be thought of as a pipeline along which countries move. It can be considered to be divided into four parts
A: FTAs in effectB: Concluded FTAsC: FTAs under negotiationD: FTAs under consideration
Countries not in the pipeline might be considered to be in a fifth category (E). Some of these may enter the process, others may not. They do not concern us here because all of the actual and most of the potential, exporters of wine to Korea (wine source markets) are in the pipeline at some stage.
19) Jean Oh, “Wine and hansik: A natural blend” Korea Herald, 24 February 2010.
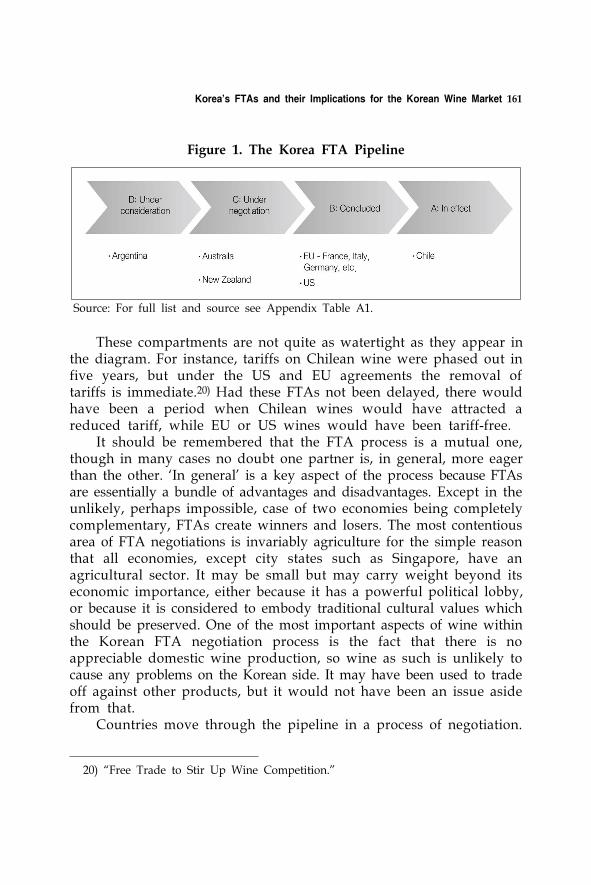
Korea's FTAs and their Implications for the Korean Wine Market 161
Source: For full list and source see Appendix Table A1.
Figure 1. The Korea FTA Pipeline
These compartments are not quite as watertight as they appear in the diagram. For instance, tariffs on Chilean wine were phased out in five years, but under the US and EU agreements the removal of tariffs is immediate.20) Had these FTAs not been delayed, there would have been a period when Chilean wines would have attracted a reduced tariff, while EU or US wines would have been tariff-free.
It should be remembered that the FTA process is a mutual one, though in many cases no doubt one partner is, in general, more eager than the other. ‘In general’ is a key aspect of the process because FTAs are essentially a bundle of advantages and disadvantages. Except in the unlikely, perhaps impossible, case of two economies being completely complementary, FTAs create winners and losers. The most contentious area of FTA negotiations is invariably agriculture for the simple reason that all economies, except city states such as Singapore, have an agricultural sector. It may be small but may carry weight beyond its economic importance, either because it has a powerful political lobby, or because it is considered to embody traditional cultural values which should be preserved. One of the most important aspects of wine within the Korean FTA negotiation process is the fact that there is no appreciable domestic wine production, so wine as such is unlikely to cause any problems on the Korean side. It may have been used to trade off against other products, but it would not have been an issue aside from that.
Countries move through the pipeline in a process of negotiation.
20) “Free Trade to Stir Up Wine Competition.”
162 2010 CRES Visiting Scholar’s Paper Series
Negotiation implies mutuality, but that does not guarantee equality. All the countries in the Korean pipeline are of differing economic and political power and this will affect the speed at which they move along the pipeline. However, this does mean that powerful countries such as the US will necessarily move at a commensurately faster rate than small ones such as New Zealand. A more powerful country may hold out for a better deal, hence slowing the process.
The negotiating strategy of partner countries will be influenced by the movement and position of the others. A bilateral FTA tends to be discriminatory - a country is disadvantaged in a target market if its competitors achieve an FTA before it does. For instance, Taiwan was anxious to sign an Economic Cooperation Framework Agreement (ECFA) with China because of fear of being marginalised as China constructed its web of FTAs with Taiwan’s trading partners.21) The Taiwan-China ECFA in turn impacts on other countries. Korea, for instance is concerned that the agreement will enhance the competiveness of both Chinese and Taiwanese economies. ‘China’s capital strength combined with Taiwan’s technological capabilities are expected to increase their competitiveness’.22) On top of which Korea expects that its sales of LCD panels, semiconductors, and cell phones in the Chinese market will be hurt by increased Taiwanese competition.23) All this adds pressure on Korea to expedite its FTA negotiations with China.
These concerns are at the industry level, not least in the wine industry. The Chile FTA advantaged Chilean wine exporters to the detriment of their competitors. When the EU FTA is implemented in July 2011, the French, Italians, and German winemakers, along with winemakers in the rest of the EU, will be on their way to enjoy the advantage of the Chileans, and the Australians, New Zealanders, and others will be disadvantaged. The industry is acutely aware of advantages that FTA implementation would give to the competition.
Typical of this anxiety is the memorandum from the California
21) The Military Balance 2010, vol. 110 (London: International Institute for Strategic Studies, 2010).
22) Kyeong-rak Kim, “China-Taiwan economic agreement to impact S.Korean industries,” Hankyoreh, 30 June 2010.
23) Ibid.
Korea's FTAs and their Implications for the Korean Wine Market 163
Association of Winegrape Growers to the office of the US Trade Representative (USTR).
The lack of a free trade agreement with Korea will impose a substantial competitive disadvantage for U.S. exports of wine and grape juice concentrate compared to other countries that have preferential trading agreements with Korea. Korea has high import tariffs. For wine it is 15 percent and for grape juice concentrate, it is 45 percent.24)
The USTR will in turn replicate these arguments with the administration and with Congress.
The Korean FTA pipeline does not exist in isolation. All the partner countries have their own pipelines, and what is happening in them may affect its bargaining strategy in the Korean one, although the ways in which that might happen is difficult to uncover.
The FTA environment is a dynamic in which all parts interact with each other and are influenced by (and themselves influence) external factors. The advantage it gives in competitive terms is often temporary; Chile’s advantage vis-a-vis the EU wine industry will disappear as the EU FTA is implemented. Sometimes initial advantages are more than lost if later signatories with greater bargaining power achieve better terms. For instance, it is reported that:
The market share for Korean products in Chile, however, has recently been on the decline, KITA said, due in part to Chile’s FTAs with China and Japan, which were signed later than the one with Korea and on terms that were more favorable to Korea’s two rivals.25)
However, not all is transience. FTAs may grow and transform markets, raising them to a new stage. This may have happened with
24) Karen Ross, “Comments Concerning Free Trade Agreement with the Republic of Korea as It Affects Wine (HTS 2204) and Grape Juice Concentrate (HTS 2009),” Memorandum to Office of US Trade Representative, 15 September 2009.
25) Gwang-lip Moon, “Korea-Chile FTA still boosting bilateral trade,” JoongAng Ilbo, 1 April 2010.
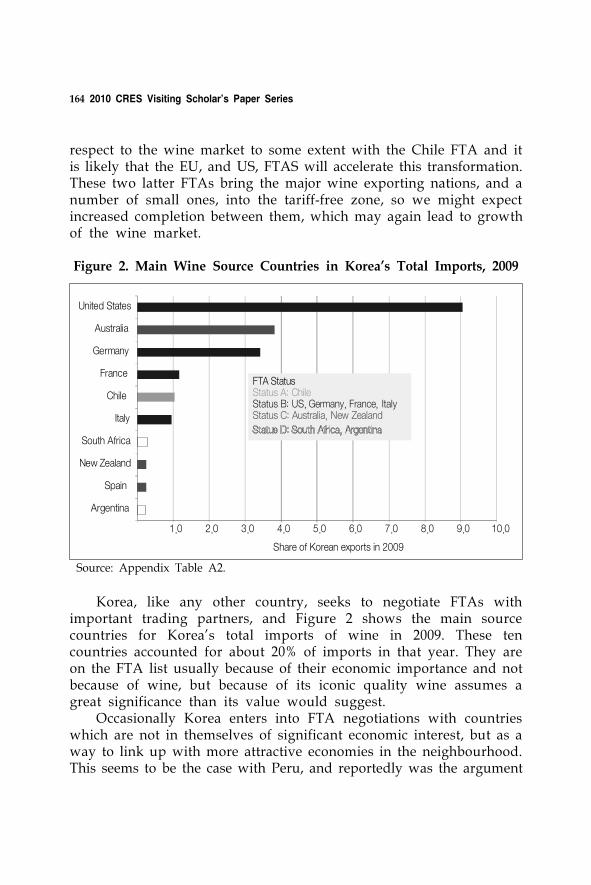
164 2010 CRES Visiting Scholar’s Paper Series
respect to the wine market to some extent with the Chile FTA and it is likely that the EU, and US, FTAS will accelerate this transformation. These two latter FTAs bring the major wine exporting nations, and a number of small ones, into the tariff-free zone, so we might expect increased completion between them, which may again lead to growth of the wine market.
1.0 2.0 3.0 4.0 5.0 6.0 7.0 8.0 9.0 10.0
Argentina
Spain
New Zealand
South Africa
Italy
Chile
France
Germany
Australia
United States
Share of Korean exports in 2009
FTA StatusStatus A: ChileStatus B: US, Germany, France, ItalyStatus C: Australia, New Zealand
Source: Appendix Table A2.
Figure 2. Main Wine Source Countries in Korea’s Total Imports, 2009
Korea, like any other country, seeks to negotiate FTAs with important trading partners, and Figure 2 shows the main source countries for Korea’s total imports of wine in 2009. These ten countries accounted for about 20% of imports in that year. They are on the FTA list usually because of their economic importance and not because of wine, but because of its iconic quality wine assumes a great significance than its value would suggest.
Occasionally Korea enters into FTA negotiations with countries which are not in themselves of significant economic interest, but as a way to link up with more attractive economies in the neighbourhood. This seems to be the case with Peru, and reportedly was the argument
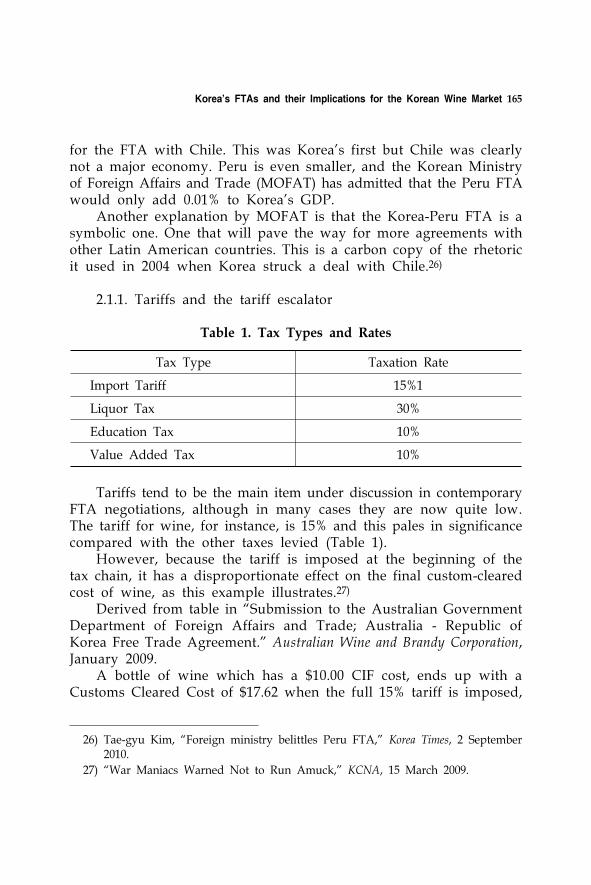
Korea's FTAs and their Implications for the Korean Wine Market 165
for the FTA with Chile. This was Korea’s first but Chile was clearly not a major economy. Peru is even smaller, and the Korean Ministry of Foreign Affairs and Trade (MOFAT) has admitted that the Peru FTA would only add 0.01% to Korea’s GDP.
Another explanation by MOFAT is that the Korea-Peru FTA is a symbolic one. One that will pave the way for more agreements with other Latin American countries. This is a carbon copy of the rhetoric it used in 2004 when Korea struck a deal with Chile.26)
2.1.1. Tariffs and the tariff escalator
Tax Type Taxation Rate
Import Tariff 15%1
Liquor Tax 30%
Education Tax 10%
Value Added Tax 10%
Table 1. Tax Types and Rates
Tariffs tend to be the main item under discussion in contemporary FTA negotiations, although in many cases they are now quite low. The tariff for wine, for instance, is 15% and this pales in significance compared with the other taxes levied (Table 1).
However, because the tariff is imposed at the beginning of the tax chain, it has a disproportionate effect on the final custom-cleared cost of wine, as this example illustrates.27)
Derived from table in “Submission to the Australian Government Department of Foreign Affairs and Trade; Australia - Republic of Korea Free Trade Agreement.” Australian Wine and Brandy Corporation, January 2009.
A bottle of wine which has a $10.00 CIF cost, ends up with a Customs Cleared Cost of $17.62 when the full 15% tariff is imposed,
26) Tae-gyu Kim, “Foreign ministry belittles Peru FTA,” Korea Times, 2 September 2010.
27) “War Maniacs Warned Not to Run Amuck,” KCNA, 15 March 2009.
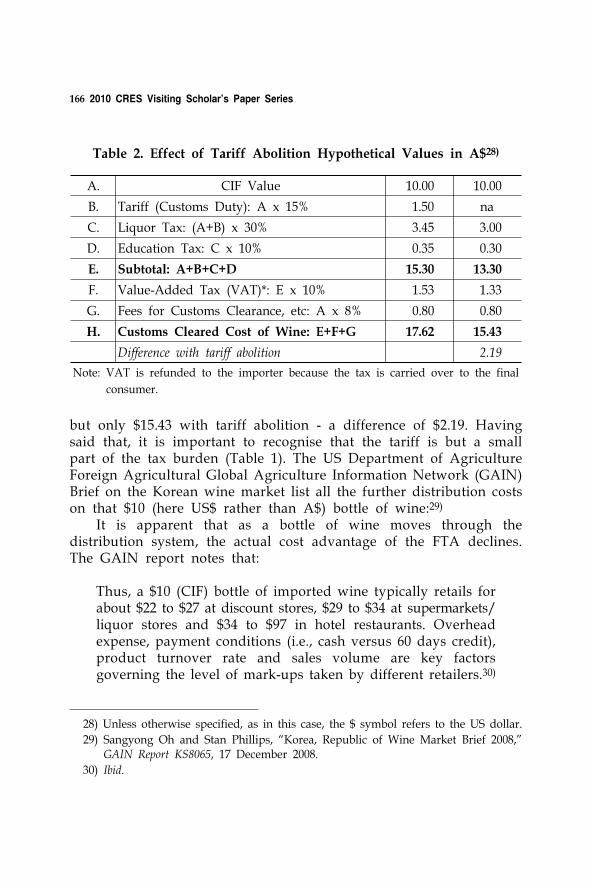
166 2010 CRES Visiting Scholar’s Paper Series
Table 2. Effect of Tariff Abolition Hypothetical Values in A$28)
A. CIF Value 10.00 10.00
B. Tariff (Customs Duty): A x 15% 1.50 na
C. Liquor Tax: (A+B) x 30% 3.45 3.00
D. Education Tax: C x 10% 0.35 0.30
E. Subtotal: A+B+C+D 15.30 13.30
F. Value-Added Tax (VAT)*: E x 10% 1.53 1.33
G. Fees for Customs Clearance, etc: A x 8% 0.80 0.80
H. Customs Cleared Cost of Wine: E+F+G 17.62 15.43
Difference with tariff abolition 2.19
Note: VAT is refunded to the importer because the tax is carried over to the final
consumer.
but only $15.43 with tariff abolition - a difference of $2.19. Having said that, it is important to recognise that the tariff is but a small part of the tax burden (Table 1). The US Department of Agriculture Foreign Agricultural Global Agriculture Information Network (GAIN) Brief on the Korean wine market list all the further distribution costs on that $10 (here US$ rather than A$) bottle of wine:29)
It is apparent that as a bottle of wine moves through the distribution system, the actual cost advantage of the FTA declines. The GAIN report notes that:
Thus, a $10 (CIF) bottle of imported wine typically retails for about $22 to $27 at discount stores, $29 to $34 at supermarkets/ liquor stores and $34 to $97 in hotel restaurants. Overhead expense, payment conditions (i.e., cash versus 60 days credit), product turnover rate and sales volume are key factors governing the level of mark-ups taken by different retailers.30)
28) Unless otherwise specified, as in this case, the $ symbol refers to the US dollar.
29) Sangyong Oh and Stan Phillips, “Korea, Republic of Wine Market Brief 2008,” GAIN Report KS8065, 17 December 2008.
30) Ibid.
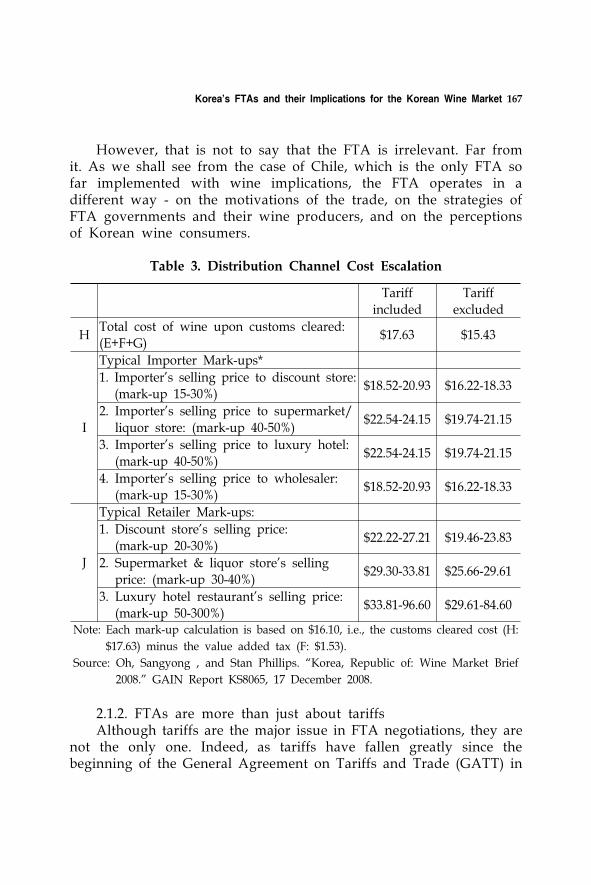
Korea's FTAs and their Implications for the Korean Wine Market 167
However, that is not to say that the FTA is irrelevant. Far from it. As we shall see from the case of Chile, which is the only FTA so far implemented with wine implications, the FTA operates in a different way - on the motivations of the trade, on the strategies of FTA governments and their wine producers, and on the perceptions of Korean wine consumers.
Tariff
included
Tariff
excluded
HTotal cost of wine upon customs cleared: (E+F+G)
$17.63 $15.43
I
Typical Importer Mark-ups*
1. Importer’s selling price to discount store: (mark-up 15-30%)
$18.52-20.93 $16.22-18.33
2. Importer’s selling price to supermarket/
liquor store: (mark-up 40-50%)$22.54-24.15 $19.74-21.15
3. Importer’s selling price to luxury hotel: (mark-up 40-50%)
$22.54-24.15 $19.74-21.15
4. Importer’s selling price to wholesaler: (mark-up 15-30%)
$18.52-20.93 $16.22-18.33
J
Typical Retailer Mark-ups:
1. Discount store’s selling price:
(mark-up 20-30%)$22.22-27.21 $19.46-23.83
2. Supermarket & liquor store’s selling price: (mark-up 30-40%)
$29.30-33.81 $25.66-29.61
3. Luxury hotel restaurant’s selling price: (mark-up 50-300%)
$33.81-96.60 $29.61-84.60
Note: Each mark-up calculation is based on $16.10, i.e., the customs cleared cost (H:
$17.63) minus the value added tax (F: $1.53).
Source: Oh, Sangyong , and Stan Phillips. “Korea, Republic of: Wine Market Brief
2008.” GAIN Report KS8065, 17 December 2008.
Table 3. Distribution Channel Cost Escalation
2.1.2. FTAs are more than just about tariffsAlthough tariffs are the major issue in FTA negotiations, they are
not the only one. Indeed, as tariffs have fallen greatly since the beginning of the General Agreement on Tariffs and Trade (GATT) in
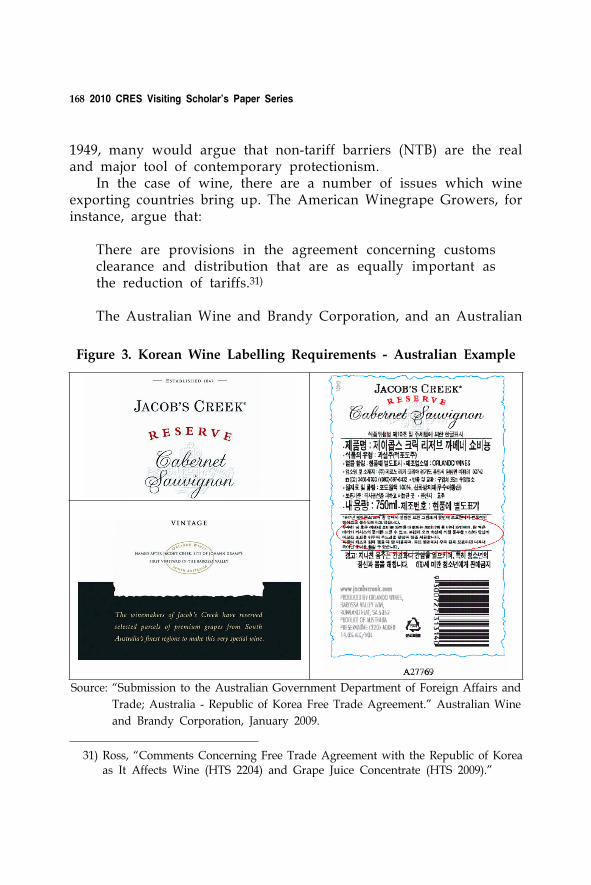
168 2010 CRES Visiting Scholar’s Paper Series
Source: “Submission to the Australian Government Department of Foreign Affairs and
Trade; Australia - Republic of Korea Free Trade Agreement.” Australian Wine
and Brandy Corporation, January 2009.
Figure 3. Korean Wine Labelling Requirements - Australian Example
1949, many would argue that non-tariff barriers (NTB) are the real and major tool of contemporary protectionism.
In the case of wine, there are a number of issues which wine exporting countries bring up. The American Winegrape Growers, for instance, argue that:
There are provisions in the agreement concerning customs clearance and distribution that are as equally important as the reduction of tariffs.31)
The Australian Wine and Brandy Corporation, and an Australian
31) Ross, “Comments Concerning Free Trade Agreement with the Republic of Korea as It Affects Wine (HTS 2204) and Grape Juice Concentrate (HTS 2009).”
Korea's FTAs and their Implications for the Korean Wine Market 169
Government agency, goes into some detail in its submission to the Australian FTA negotiators.
The Australian Wine and Brandy Corporation notes that:
In the above back-label, only the area circled in red is in fact marketing information. All other Korean language information is mandatory. In fact, the Korean back-label is required to contain no fewer than 15 different pieces of information (in Korean language):1. Brand name2. Type/Category of Product3. Volume4. Alcoholic strength5. Name of producer6. Name, address and telephone number of importer7. Country of origin8. Lot code (or date of bottling)9. Raw materials and content10. General Health warning “excessive drinking is harmful to
health”11. Specific health warning “the sale of alcohol to those
under 19 years of age is prohibited”12. Recycling mark32)
The submission continues:Many of South Korea's labelling requirements are unnecessary, costly, inconsistent with standard international practice, and therefore, constitute a barrier to trade.33)
Other Australian complaints relate to what they regard as unnecessarily restrictive alcohol/volume tolerance level - in Australia and the United States, amongst other countries, the alcohol/volume level must be accurate to 1.5%, whereas in Korea it is 0.5%. The alcohol/volume level can vary between vintages, so re-labelling is an added burden. Another issue is the allowed composition of wine,
32) “War Maniacs Warned Not to Run Amuck.”
33) Ibid.
170 2010 CRES Visiting Scholar’s Paper Series
and the permitted additives and preservatives.Many of these changes, if implemented, would have to be applied
across the board - they would apply to all wine imports, not merely from the FTA country that first achieved them.
2.2. Korean wine market
Wine is, of course, primarily a subset of the alcoholic beverages market, which is something that must be considered first.
2.2.1. Korean alcohol marketThere are problems and limitations with statistics on the Korean
alcoholic beverages market.34) We have statistics on imports, but consumption is another matter. There are also concerns in the industry about the lack of demographic statistics about wine consumption, and presumably other alcoholic beverages as well.35)
Korea is noted as a substantial market alcoholic beverages and a country in which liquor plays an important part in social life:
Korea is one of the biggest markets for alcoholic beverages in the world. For many, drinking is considered an important part of everyday life and is often encouraged at social and business occasions. Although drinking is decreasing among the elderly population mainly because of health concerns, the market is getting more new drinkers from the younger generation and the female population.36)
In per capita terms, Koreans occupy 11th place out of 16 OECD countries, at 8 litres a year, a long way behind front runner Ireland, with 13.4 litres.37)
34) What success I have achieved in piecing together the statistics is due to the unstinted assistance of Yeonju Jeong, KIEP librarian.
35) To preserve confidentiality, individuals whom I have interviewed are not directly cited in this paper. A list of people interviewed can be found in the acknowledgements.
36) Oh and Phillips, “Korea, Republic of Wine Market Brief 2008.”
37) “Korean Reputation for Heavy Drinking Proved Unfair,” 12 April 2010.
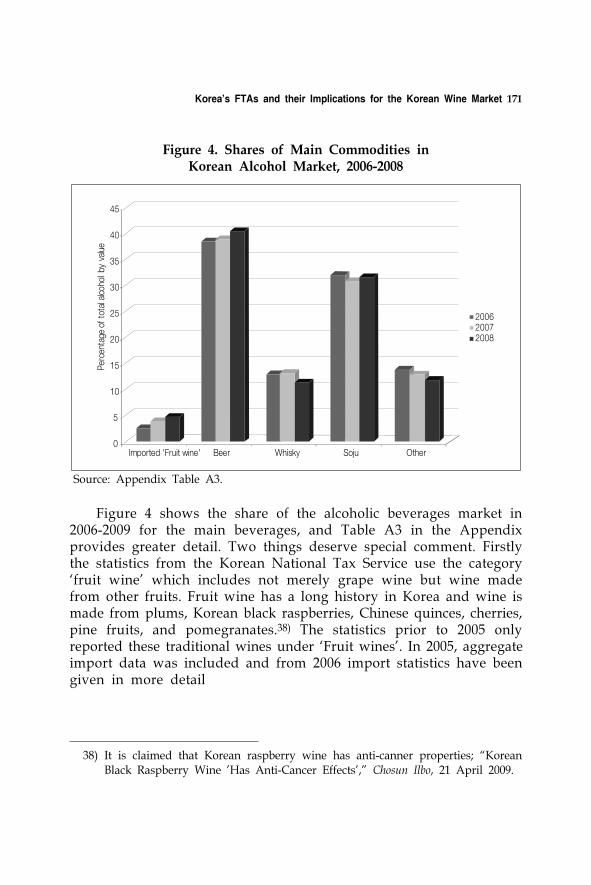
Korea's FTAs and their Implications for the Korean Wine Market 171
0
5
10
15
20
25
30
35
40
45
Imported 'Fruit wine' Beer Whisky Soju Other
Per
cent
age
ofto
tala
lcoh
olby
valu
e
200620072008
Source: Appendix Table A3.
Figure 4. Shares of Main Commodities in Korean Alcohol Market, 2006-2008
Figure 4 shows the share of the alcoholic beverages market in 2006-2009 for the main beverages, and Table A3 in the Appendix provides greater detail. Two things deserve special comment. Firstly the statistics from the Korean National Tax Service use the category ‘fruit wine’ which includes not merely grape wine but wine made from other fruits. Fruit wine has a long history in Korea and wine is made from plums, Korean black raspberries, Chinese quinces, cherries, pine fruits, and pomegranates.38) The statistics prior to 2005 only reported these traditional wines under ‘Fruit wines’. In 2005, aggregate import data was included and from 2006 import statistics have been given in more detail
38) It is claimed that Korean raspberry wine has anti-canner properties; “Korean Black Raspberry Wine 'Has Anti-Cancer Effects',” Chosun Ilbo, 21 April 2009.
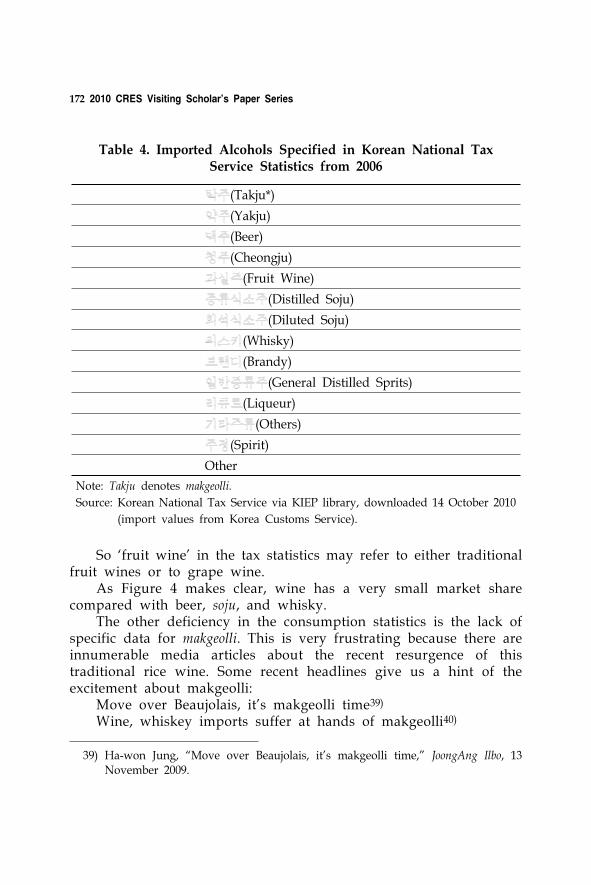
172 2010 CRES Visiting Scholar’s Paper Series
탁주(Takju*)
약주(Yakju)
맥주(Beer)
청주(Cheongju)
과실주(Fruit Wine)
증류식소주(Distilled Soju)
희석식소주(Diluted Soju)
스키(Whisky)
랜디(Brandy)
일반증류주(General Distilled Sprits)
리큐르(Liqueur)
기타주류(Others)
주정(Spirit)
Other
Note: Takju denotes makgeolli.
Source: Korean National Tax Service via KIEP library, downloaded 14 October 2010
(import values from Korea Customs Service).
Table 4. Imported Alcohols Specified in Korean National Tax Service Statistics from 2006
So ‘fruit wine’ in the tax statistics may refer to either traditional fruit wines or to grape wine.
As Figure 4 makes clear, wine has a very small market share compared with beer, soju, and whisky.
The other deficiency in the consumption statistics is the lack of specific data for makgeolli. This is very frustrating because there are innumerable media articles about the recent resurgence of this traditional rice wine. Some recent headlines give us a hint of the excitement about makgeolli:
Move over Beaujolais, it’s makgeolli time39)
Wine, whiskey imports suffer at hands of makgeolli40)
39) Ha-won Jung, “Move over Beaujolais, it’s makgeolli time,” JoongAng Ilbo, 13 November 2009.
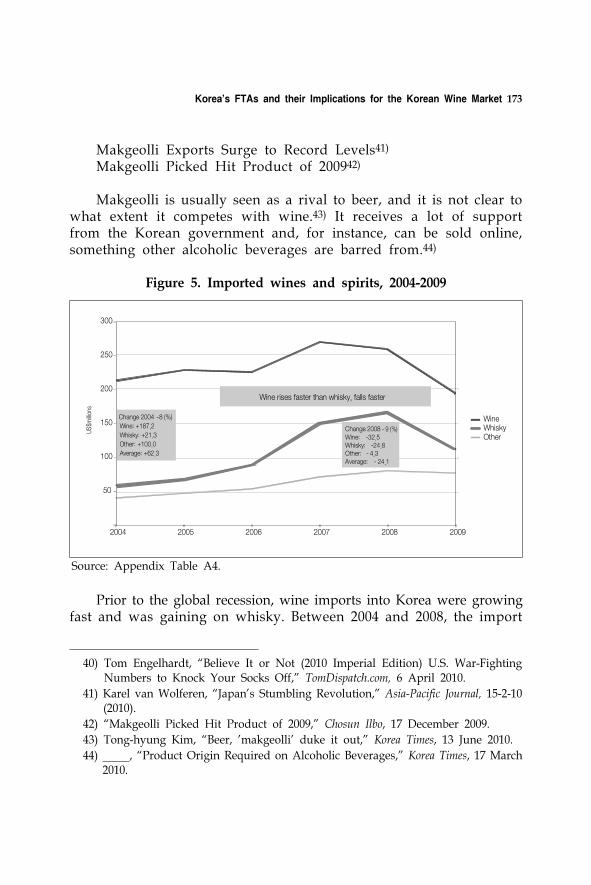
Korea's FTAs and their Implications for the Korean Wine Market 173
Makgeolli Exports Surge to Record Levels41)
Makgeolli Picked Hit Product of 200942)
Makgeolli is usually seen as a rival to beer, and it is not clear to what extent it competes with wine.43) It receives a lot of support from the Korean government and, for instance, can be sold online, something other alcoholic beverages are barred from.44)
50
100
150
200
250
300
2004 2005 2006 2007 2008 2009
WineWhiskyOther
Wine rises faster than whisky, falls faster
Change 2008 - 9 (%)Wine: -32.5Whisky: -24.8Other: - 4.3Average: - 24.1
Change 2004 -8 (%)Wine: +187.2
Whisky: +21.3Other: +100.0
Average: +62.3
US
$milli
ons
Source: Appendix Table A4.
Figure 5. Imported wines and spirits, 2004-2009
Prior to the global recession, wine imports into Korea were growing fast and was gaining on whisky. Between 2004 and 2008, the import
40) Tom Engelhardt, “Believe It or Not (2010 Imperial Edition) U.S. War-Fighting Numbers to Knock Your Socks Off,” TomDispatch.com, 6 April 2010.
41) Karel van Wolferen, “Japan’s Stumbling Revolution,” Asia-Pacific Journal, 15-2-10 (2010).
42) “Makgeolli Picked Hit Product of 2009,” Chosun Ilbo, 17 December 2009.
43) Tong-hyung Kim, “Beer, 'makgeolli' duke it out,” Korea Times, 13 June 2010.
44) , “Product Origin Required on Alcoholic Beverages,” Korea Times, 17 March 2010.
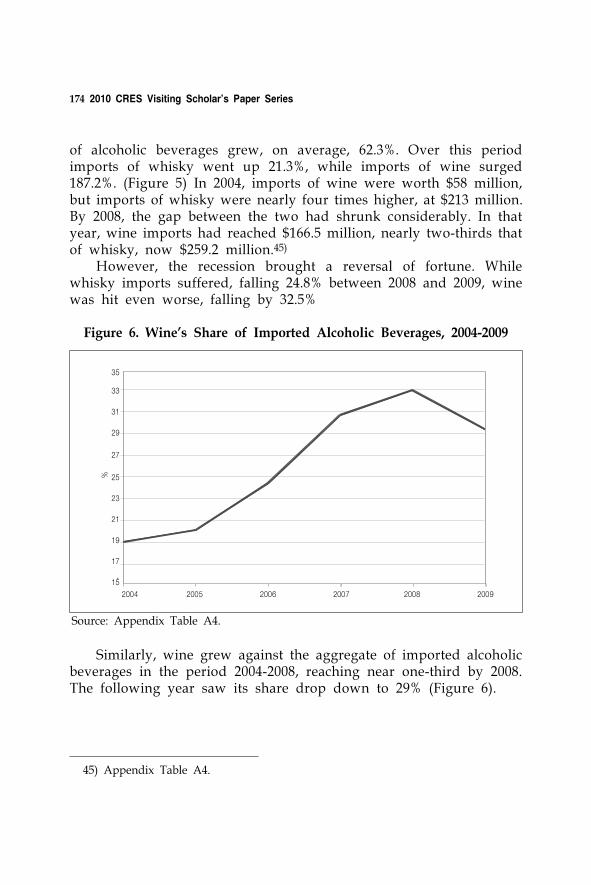
174 2010 CRES Visiting Scholar’s Paper Series
of alcoholic beverages grew, on average, 62.3%. Over this period imports of whisky went up 21.3%, while imports of wine surged 187.2%. (Figure 5) In 2004, imports of wine were worth $58 million, but imports of whisky were nearly four times higher, at $213 million. By 2008, the gap between the two had shrunk considerably. In that year, wine imports had reached $166.5 million, nearly two-thirds that of whisky, now $259.2 million.45)
However, the recession brought a reversal of fortune. While whisky imports suffered, falling 24.8% between 2008 and 2009, wine was hit even worse, falling by 32.5%
15
17
19
21
23
25
27
29
31
33
35
2004 2005 2006 2007 2008 2009
%
Source: Appendix Table A4.
Figure 6. Wine’s Share of Imported Alcoholic Beverages, 2004-2009
Similarly, wine grew against the aggregate of imported alcoholic beverages in the period 2004-2008, reaching near one-third by 2008. The following year saw its share drop down to 29% (Figure 6).
45) Appendix Table A4.
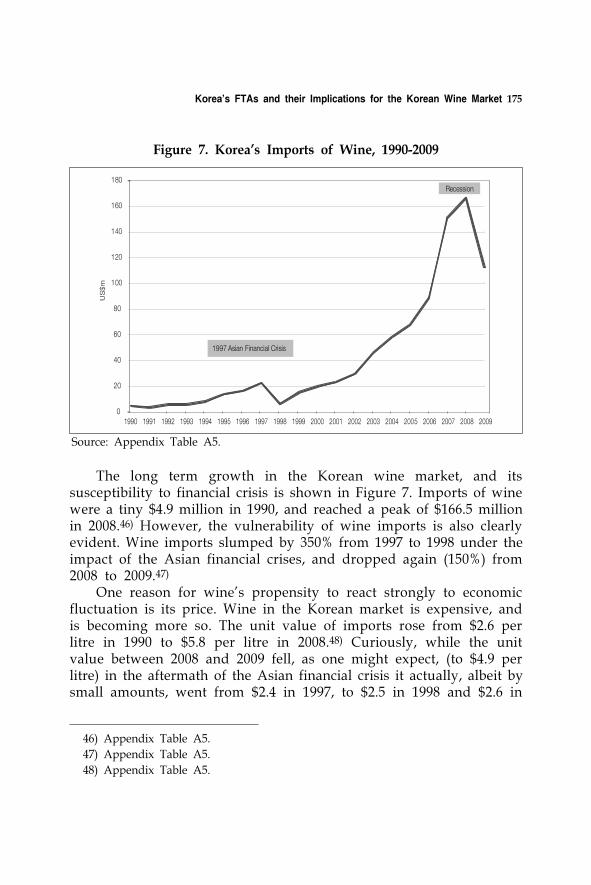
Korea's FTAs and their Implications for the Korean Wine Market 175
0
20
40
60
80
100
120
140
160
180
1990 1991 1992 1993 1994 1995 1996 1997 1998 1999 2000 2001 2002 2003 2004 2005 2006 2007 2008 2009
US
$m
1997 Asian Financial Crisis
Recession
Source: Appendix Table A5.
Figure 7. Korea’s Imports of Wine, 1990-2009
The long term growth in the Korean wine market, and its susceptibility to financial crisis is shown in Figure 7. Imports of wine were a tiny $4.9 million in 1990, and reached a peak of $166.5 million in 2008.46) However, the vulnerability of wine imports is also clearly evident. Wine imports slumped by 350% from 1997 to 1998 under the impact of the Asian financial crises, and dropped again (150%) from 2008 to 2009.47)
One reason for wine’s propensity to react strongly to economic fluctuation is its price. Wine in the Korean market is expensive, and is becoming more so. The unit value of imports rose from $2.6 per litre in 1990 to $5.8 per litre in 2008.48) Curiously, while the unit value between 2008 and 2009 fell, as one might expect, (to $4.9 per litre) in the aftermath of the Asian financial crisis it actually, albeit by small amounts, went from $2.4 in 1997, to $2.5 in 1998 and $2.6 in
46) Appendix Table A5.
47) Appendix Table A5.
48) Appendix Table A5.
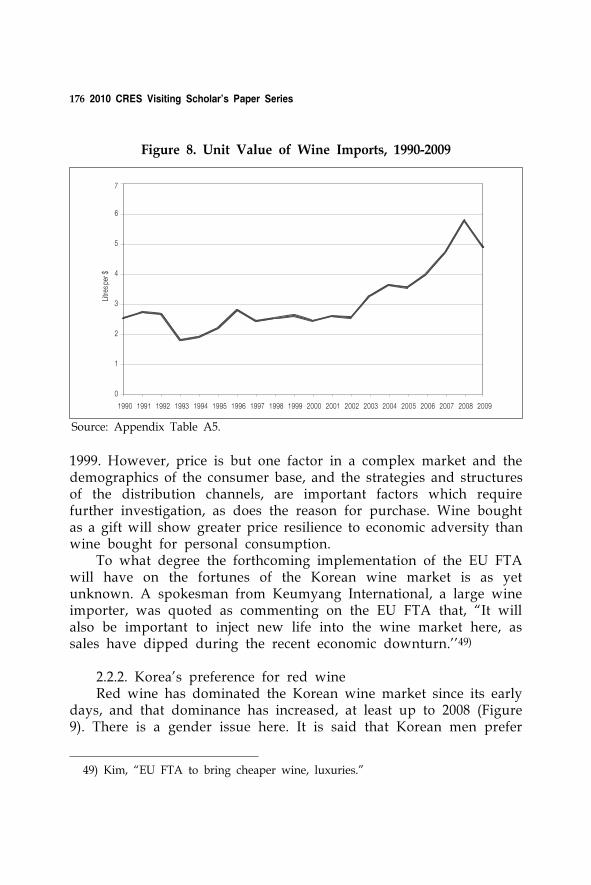
176 2010 CRES Visiting Scholar’s Paper Series
0
1
2
3
4
5
6
7
1990 1991 1992 1993 1994 1995 1996 1997 1998 1999 2000 2001 2002 2003 2004 2005 2006 2007 2008 2009
Litr
espe
r$
Source: Appendix Table A5.
Figure 8. Unit Value of Wine Imports, 1990-2009
1999. However, price is but one factor in a complex market and the demographics of the consumer base, and the strategies and structures of the distribution channels, are important factors which require further investigation, as does the reason for purchase. Wine bought as a gift will show greater price resilience to economic adversity than wine bought for personal consumption.
To what degree the forthcoming implementation of the EU FTA will have on the fortunes of the Korean wine market is as yet unknown. A spokesman from Keumyang International, a large wine importer, was quoted as commenting on the EU FTA that, “It will also be important to inject new life into the wine market here, as sales have dipped during the recent economic downturn.’’49)
2.2.2. Korea’s preference for red wineRed wine has dominated the Korean wine market since its early
days, and that dominance has increased, at least up to 2008 (Figure 9). There is a gender issue here. It is said that Korean men prefer
49) Kim, “EU FTA to bring cheaper wine, luxuries.”
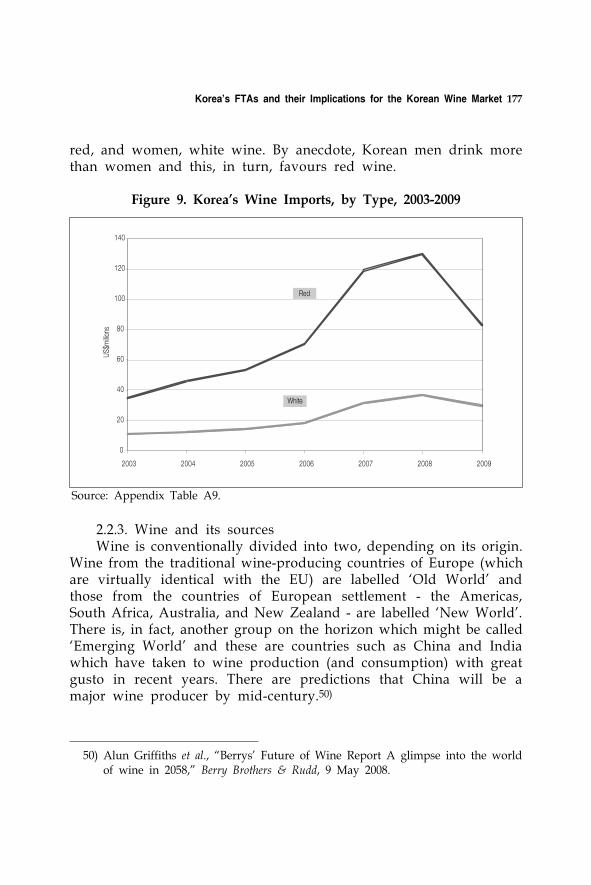
Korea's FTAs and their Implications for the Korean Wine Market 177
red, and women, white wine. By anecdote, Korean men drink more than women and this, in turn, favours red wine.
0
20
40
60
80
100
120
140
2003 2004 2005 2006 2007 2008 2009
US$
millio
ns
Red
White
Source: Appendix Table A9.
Figure 9. Korea’s Wine Imports, by Type, 2003-2009
2.2.3. Wine and its sourcesWine is conventionally divided into two, depending on its origin.
Wine from the traditional wine-producing countries of Europe (which are virtually identical with the EU) are labelled ‘Old World’ and those from the countries of European settlement - the Americas, South Africa, Australia, and New Zealand - are labelled ‘New World’. There is, in fact, another group on the horizon which might be called ‘Emerging World’ and these are countries such as China and India which have taken to wine production (and consumption) with great gusto in recent years. There are predictions that China will be a major wine producer by mid-century.50)
50) Alun Griffiths et al., “Berrys' Future of Wine Report A glimpse into the world of wine in 2058,” Berry Brothers & Rudd, 9 May 2008.
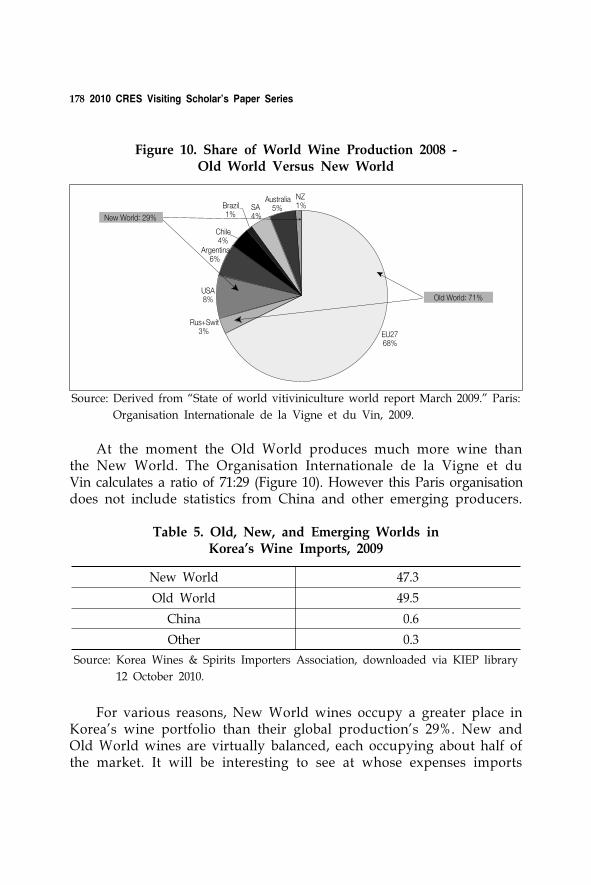
178 2010 CRES Visiting Scholar’s Paper Series
NZ1%SA
4%Brazil1%
Chile4%
Argentina6%
USA8%
Rus+Swit3% EU27
68%
Australia5%
New World: 29%
Old World: 71%
Source: Derived from “State of world vitiviniculture world report March 2009.” Paris:
Organisation Internationale de la Vigne et du Vin, 2009.
Figure 10. Share of World Wine Production 2008 - Old World Versus New World
At the moment the Old World produces much more wine than the New World. The Organisation Internationale de la Vigne et du Vin calculates a ratio of 71:29 (Figure 10). However this Paris organisation does not include statistics from China and other emerging producers.
New World 47.3
Old World 49.5
China 0.6
Other 0.3
Source: Korea Wines & Spirits Importers Association, downloaded via KIEP library
12 October 2010.
Table 5. Old, New, and Emerging Worlds in Korea’s Wine Imports, 2009
For various reasons, New World wines occupy a greater place in Korea’s wine portfolio than their global production’s 29%. New and Old World wines are virtually balanced, each occupying about half of the market. It will be interesting to see at whose expenses imports
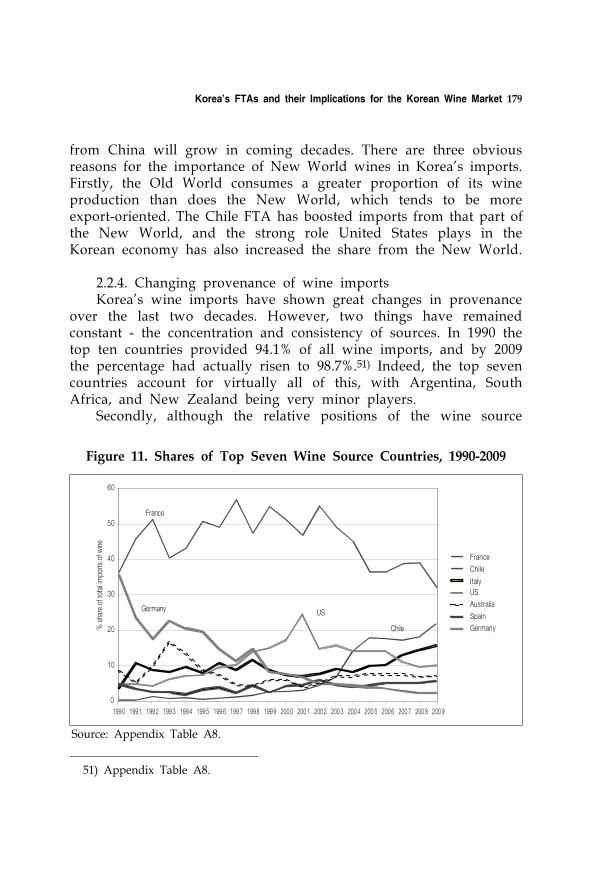
Korea's FTAs and their Implications for the Korean Wine Market 179
0
10
20
30
40
50
60
199 0 1991 199 2 199 3 1994 199 5 199 6 199 7 1998 199 9 200 0 2001 200 2 200 3 200 4 200 5 200 6 200 7 200 8 200 9
% s
hare
of t
otal
impo
rts o
f win
e
France
Chile
ItalyUS
Australia
Spain
Germany
France
Germany US
Chile
Source: Appendix Table A8.
Figure 11. Shares of Top Seven Wine Source Countries, 1990-2009
from China will grow in coming decades. There are three obvious reasons for the importance of New World wines in Korea’s imports. Firstly, the Old World consumes a greater proportion of its wine production than does the New World, which tends to be more export-oriented. The Chile FTA has boosted imports from that part of the New World, and the strong role United States plays in the Korean economy has also increased the share from the New World.
2.2.4. Changing provenance of wine importsKorea’s wine imports have shown great changes in provenance
over the last two decades. However, two things have remained constant - the concentration and consistency of sources. In 1990 the top ten countries provided 94.1% of all wine imports, and by 2009 the percentage had actually risen to 98.7%.51) Indeed, the top seven countries account for virtually all of this, with Argentina, South Africa, and New Zealand being very minor players.
Secondly, although the relative positions of the wine source
51) Appendix Table A8.
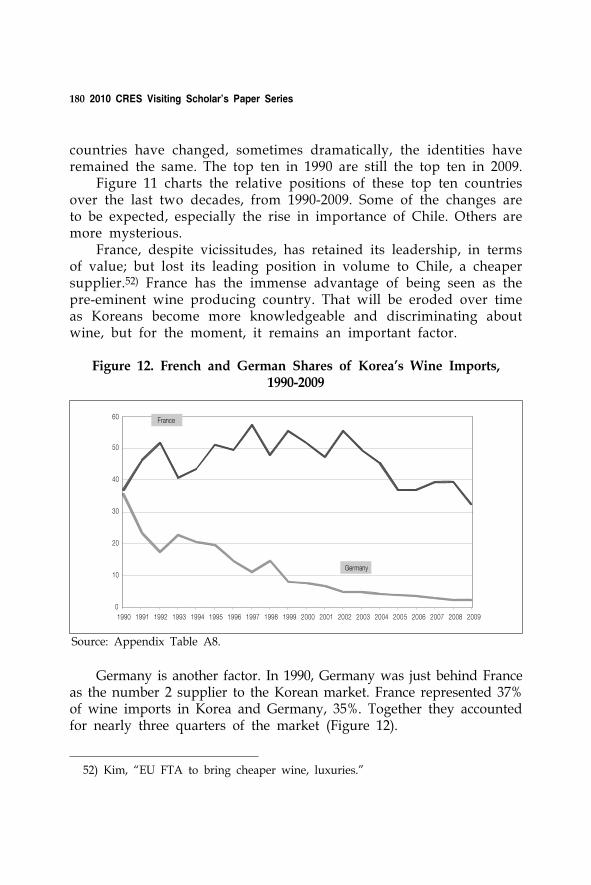
180 2010 CRES Visiting Scholar’s Paper Series
countries have changed, sometimes dramatically, the identities have remained the same. The top ten in 1990 are still the top ten in 2009.
Figure 11 charts the relative positions of these top ten countries over the last two decades, from 1990-2009. Some of the changes are to be expected, especially the rise in importance of Chile. Others are more mysterious.
France, despite vicissitudes, has retained its leadership, in terms of value; but lost its leading position in volume to Chile, a cheaper supplier.52) France has the immense advantage of being seen as the pre-eminent wine producing country. That will be eroded over time as Koreans become more knowledgeable and discriminating about wine, but for the moment, it remains an important factor.
0
10
20
30
40
50
60
1990 1991 1992 1993 1994 1995 1996 1997 1998 1999 2000 2001 2002 2003 2004 2005 2006 2007 2008 2009
Germany
France
Source: Appendix Table A8.
Figure 12. French and German Shares of Korea’s Wine Imports, 1990-2009
Germany is another factor. In 1990, Germany was just behind France as the number 2 supplier to the Korean market. France represented 37% of wine imports in Korea and Germany, 35%. Together they accounted for nearly three quarters of the market (Figure 12).
52) Kim, “EU FTA to bring cheaper wine, luxuries.”
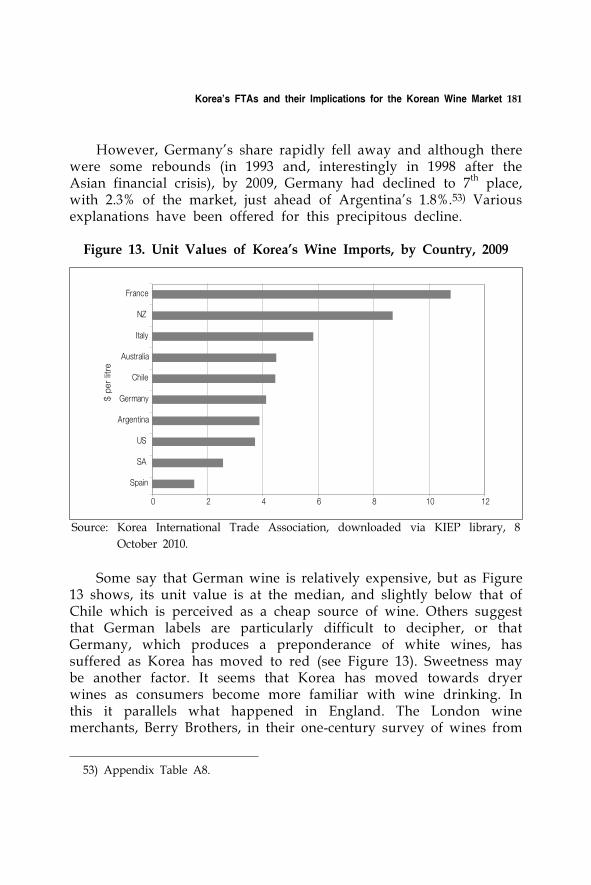
Korea's FTAs and their Implications for the Korean Wine Market 181
However, Germany’s share rapidly fell away and although there were some rebounds (in 1993 and, interestingly in 1998 after the Asian financial crisis), by 2009, Germany had declined to 7th place, with 2.3% of the market, just ahead of Argentina’s 1.8%.53) Various explanations have been offered for this precipitous decline.
0 2 4 6 8 10 12
Spain
SA
US
Argentina
Germany
Chile
Australia
Italy
NZ
France
$ p
er
litre
Source: Korea International Trade Association, downloaded via KIEP library, 8
October 2010.
Figure 13. Unit Values of Korea’s Wine Imports, by Country, 2009
Some say that German wine is relatively expensive, but as Figure 13 shows, its unit value is at the median, and slightly below that of Chile which is perceived as a cheap source of wine. Others suggest that German labels are particularly difficult to decipher, or that Germany, which produces a preponderance of white wines, has suffered as Korea has moved to red (see Figure 13). Sweetness may be another factor. It seems that Korea has moved towards dryer wines as consumers become more familiar with wine drinking. In this it parallels what happened in England. The London wine merchants, Berry Brothers, in their one-century survey of wines from
53) Appendix Table A8.
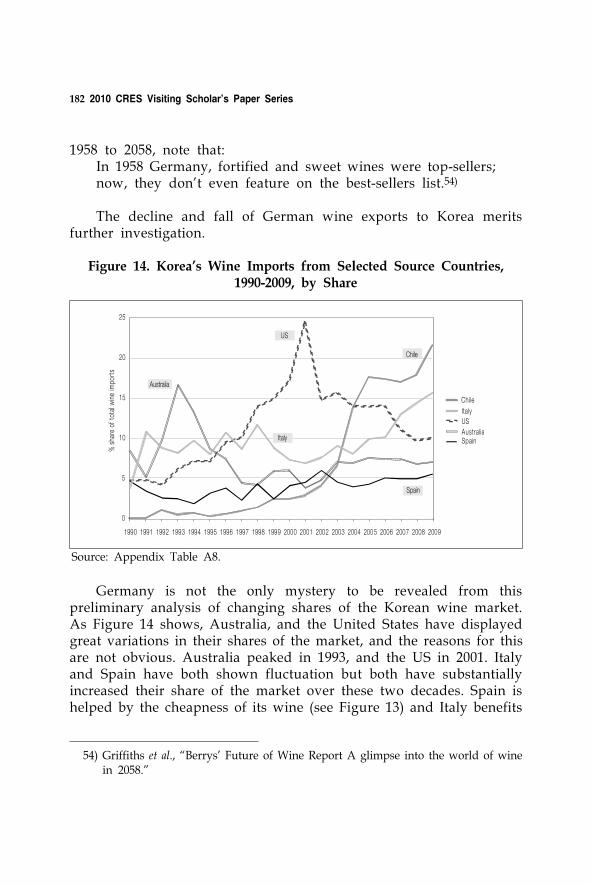
182 2010 CRES Visiting Scholar’s Paper Series
1958 to 2058, note that: In 1958 Germany, fortified and sweet wines were top-sellers; now, they don't even feature on the best-sellers list.54)
The decline and fall of German wine exports to Korea merits further investigation.
0
5
10
15
20
25
1990 1991 1992 1993 1994 1995 1996 1997 1998 1999 2000 2001 2002 2003 2004 200 5 2006 2007 2008 2009
%sh
are
ofto
talw
ine
impo
rts
Chile
ItalyUS
AustraliaSpain
US
Australia
Chile
Spain
Italy
Source: Appendix Table A8.
Figure 14. Korea’s Wine Imports from Selected Source Countries, 1990-2009, by Share
Germany is not the only mystery to be revealed from this preliminary analysis of changing shares of the Korean wine market. As Figure 14 shows, Australia, and the United States have displayed great variations in their shares of the market, and the reasons for this are not obvious. Australia peaked in 1993, and the US in 2001. Italy and Spain have both shown fluctuation but both have substantially increased their share of the market over these two decades. Spain is helped by the cheapness of its wine (see Figure 13) and Italy benefits
54) Griffiths et al., “Berrys' Future of Wine Report A glimpse into the world of wine in 2058.”
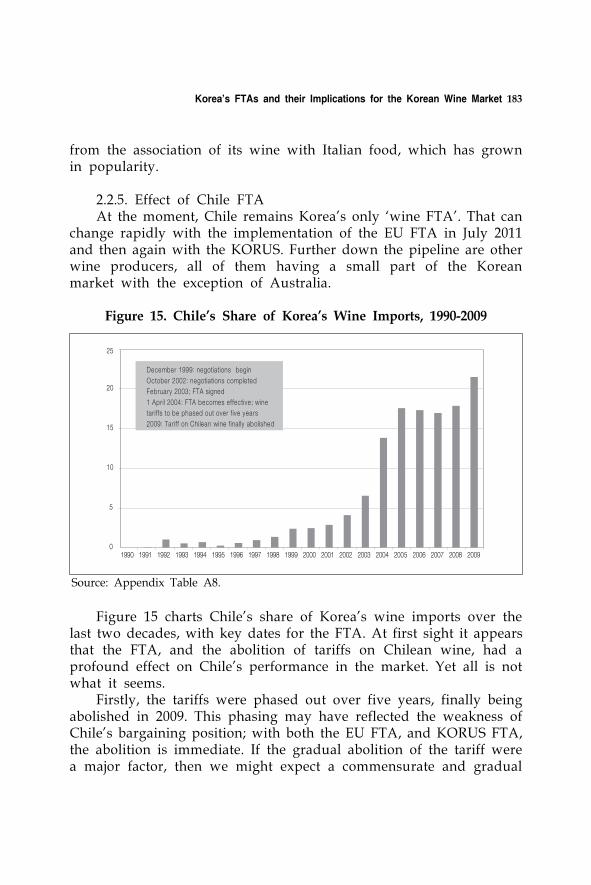
Korea's FTAs and their Implications for the Korean Wine Market 183
from the association of its wine with Italian food, which has grown in popularity.
2.2.5. Effect of Chile FTAAt the moment, Chile remains Korea’s only ‘wine FTA’. That can
change rapidly with the implementation of the EU FTA in July 2011 and then again with the KORUS. Further down the pipeline are other wine producers, all of them having a small part of the Korean market with the exception of Australia.
0
5
10
15
20
25
December 1999: negotiations begin
October 2002: negotiations completed
February 2003; FTA signed
1 April 2004: FTA becomes effective; wine
tariffs to be phased out over f ive years
2009: Tariff on Chilean wine finally abolished
1990 1991 1992 1993 1994 1995 1996 1997 1998 1999 2000 2001 2002 2003 2004 2005 2006 2007 2008 2009
Source: Appendix Table A8.
Figure 15. Chile’s Share of Korea’s Wine Imports, 1990-2009
Figure 15 charts Chile’s share of Korea’s wine imports over the last two decades, with key dates for the FTA. At first sight it appears that the FTA, and the abolition of tariffs on Chilean wine, had a profound effect on Chile’s performance in the market. Yet all is not what it seems.
Firstly, the tariffs were phased out over five years, finally being abolished in 2009. This phasing may have reflected the weakness of Chile’s bargaining position; with both the EU FTA, and KORUS FTA, the abolition is immediate. If the gradual abolition of the tariff were a major factor, then we might expect a commensurate and gradual
184 2010 CRES Visiting Scholar’s Paper Series
increase in Chile’s share, but this did not happen. In fact, according to sources familiar with the industry, there was no substantial reduction in the price of Chilean wine. The 2.5% tariff which dropped off each year was too small for the wine industry to move to price reductions. However, the FTA greatly benefited the fortunes of Chilean wine in Korea various ways
Chilean government and industryWith the FTA, the Chilean government and the wine industry (and other appropriate industries as well no doubt) saw Korea a target market. The number of Chilean wine makers and exporters travelling to Korea greatly increased
Korean wine tradeBecause margins on Chilean wine increased, the trade had an incentive to push Chilean product. Although, as noted, the decrease in tariff per year was small, it was continuing and getting bigger year after year.
Positive consumer perceptionIt seems that consumer perceptions of Chilean wine improved in three ways◦ Value for money
Consumers were very aware of the FTA (though perhaps not so conscious of the gradualness of the tariff reduction). There was a feeling that even if prices were unchanged, the value for money would increase, because of a perception that the tax on Chilean wine was lower than that in other countries. This perception is what drives travellers to duty free shops at airports.
◦ Endorsement effectBy signing an FTA with Chile, the Korean government was effectively endorsing Chilean products. This would have had little effect in countries such as New Zealand, where respect for the astuteness of governments and its officials is markedly less than in Korea. But in Korea, and perhaps East Asian countries in general, the official endorsement appears to be an influential factor.
Korea's FTAs and their Implications for the Korean Wine Market 185
◦ Representative product effectIt is said that in Korea there is a particularly strong tendency to categorise countries in terms of representative products. This is a global phenomenon - France is identified with wine and perfumes, Italy with fashions and luxury sports cars (Ferraris and Maseratis), and so forth. However, it is claimed that this plays a great role in Korea than in most other countries. With the FTA, wine became Chile’s representative product and so it was, to some extent, elevated to the French level.
◦ Attention effectThe FTA was newsworthy. It was, after all, Korea’s first FTA. With it, people became more aware of wine, and more willing to try it. Many consumers were introduced to wine as a result of the Chile FTA.
◦ Positive image effectChile has a positive image in the minds of Korean consumers. Whereas Chinese products are generally seen, at the moment at least, to be of inferior quality, Chile is viewed much more benignly.
3. Conclusion
It is clear that the Chile FTA effect will not be replicated exactly with other FTAs. It was the first one and happened at a time when wine consumption in Korea was growing for other reasons as well.
The EU FTA, which involves a number of wine exporting countries, both major and minor, will have distinctive effects, but they will differ from those with Chile. The Chilean FTA had effects that were psychological and motivational, rather than those related to price. In the case of the EU FTA, we are likely to see price reductions for a number of reasons. There is competition between the wine exporting countries of the EU. The tariff abolition is immediate. And finally, the industry is trying to recover from the global recession and the severe impact it had on the Korean wine market. It is now used to price reductions and discounts that had not been prevalent since the Asian financial crisis, when in any case the Korean wine industry was in its
186 2010 CRES Visiting Scholar’s Paper Series
infancy. Price reductions, which will be well-advertised, will in turn have an impact on consumer propensity to buy wine. That propensity will depend more on the economic climate at the time, and consumer confidence, than price reductions in and of themselves.
With the EU FTA, the Korean wine industry will be, in effect, entering its third decade. The FTA will in all likelihood give the wine market a boost but whether it will shift it to a higher stage; where wine drinking comes to be seen as an ordinary part of life instead of something for special occasions, or would make one feel particularly affluent (and so to be cast off when times are bad) is as yet uncertain. Will it still be seen as un-Korean, and, for good or bad, a symbol of globalisation? Or will it become indigenised like beer?
Acknowledgments
KIEPPresident Wook ChaeDr Heungchong Kim, Director, CRESDr Kitae Sohn, Associate Research Fellow, CRES, who reviewed and
commented on my working paperMs Hye Youn Park, Outreach Team, who looked after me during my
stay at KIEPDr Jin Kyo Suh, Director, Research Planning and CoordinationMs YouJin Baik, ResearcherDr Taeyoon Kim, Associate Research FellowDr Choongjae Cho, Team Leader, Southeast and South Asia, CRESDr Yeo Cheon Jeong, Vice PresidentSoowol Kim, CRESDr Nakkyun ChoiSpecial thanks go to Ms YeonJu Jeong, Librarian, who suffered with
great patience and good humour my frequent requests for information.
Thanks are also due to my colleagues who made comments and corrections
Mr Michel Rod, Carleton University, OttawaDr Lay Peng Tan, Victoria University of WellingtonInterviewees
Korea's FTAs and their Implications for the Korean Wine Market 187
Mr Sung-Ho Shin, Division Manager, Planning and Public Relations Division, Narafood/Dana Cellars
Ms Jean Nam, Manager, Marketing and Communications Division, Podi Plaza, PDP Wine Co Ltd
Mr Young-Gyun Shin, Business Development Manager, NZ Trade & Enterprise, Seoul
Dr Roger Dungan, Second Secretary (Trade and Economic), NZ Embassy, Seoul
Mr Graeme Solloway, Trade Commissioner, NZ Trade & Enterprise, Seoul
Mr Richard Mann, NZ AmbassadorMr Joshua Hall, NZ wine commentator and entrepreneur, who
provided much information on the Korean market, and many contacts
Mr Simon Walsh and Ms Sunny Myung, Tiwi Trade
References
Beal, Tim, and Rod, Michel. 2009. “Riding Social Change: The New Zealand Experience in the Evolving Wine Markets of Japan and Singapore.” Asia: NZ Foundation.
Chosun Ilbo. 2009a. “Free Trade to Stir Up Wine Competition.” Chosun Ilbo. (March 27)
. 2009b. “Korean Black Raspberry Wine 'Has Anti-Cancer Effects'.” Chosun Ilbo. (April 21)
. 2009c. “Makgeolli Picked Hit Product of 2009.” Chosun Ilbo. (December 17)
. 2010a. “Makgeolli to Be Served at Davos Forum.” Chosun Ilbo. (January 21)
. 2010b. “How N.Koreans Feel About Their 3 Generations of Leaders.” Chosun Ilbo. (October 2)
Engelhardt, Tom. 2010. “Believe It or Not (2010 Imperial Edition) U.S. War-Fighting Numbers to Knock Your Socks Off.” TomDispatch. com. (April 6)
“FTA Status of Korea.” Ministry of Foreign Affairs and Trade, http:// www.mofat.go.kr/english/econtrade/fta/issues/index2.jsp.
Griffiths, Alun , Jasper Morris, Simon Field, and David Berry Green.
188 2010 CRES Visiting Scholar’s Paper Series
2008. “Berrys' Future of Wine Report A glimpse into the world of wine in 2058.” Berry Brothers & Rudd. (May 9)
Jung, Ha-won. 2009. “Move over Beaujolais, it’s Makgeolli Time.” JoongAng Ilbo, (November 13)
JoongAng Ilbo. 2008. “Sales of wine pass soju as Koreans get healthy.” (June 2)
Kim, Hyun-cheol. 2008. “Wine Outsells Soju for First Time.” Korea Times. (June 1)
Kim, Kyeong-rak. 2010. “China-Taiwan Economic Agreement to Impact S.Korean Industries.” Hankyoreh. (June 30)
Kim, Tae-gyu. 2010. “Foreign Ministry Belittles Peru FTA.” Korea Times. (September 2)
Kim, Tong-hyung. 2010a. “Beer, 'makgeolli' duke it out.” Korea Times. (June 13)
. 2010b. “EU FTA to Bring Cheaper Wine, Luxuries.” Korea Times. (October 7)
. 2010c. “Product Origin Required on Alcoholic Beverages.” Korea Times. (March 17)
“Korean Reputation for Heavy Drinking Proved Unfair.” 2010. (April 12)
Lee, Gang-yeon. 2009. “Know the Rules to Make the Most of Korea's FTAs.” Chosun Ilbo. (November 5)
Lee, Jean H. 2010. “A Rare Glimpse at a Different side of North Korea.” Washington Post. (October 15)
Lee, Kyuho. 2009. “Is a Glass of Merlot the Symbol of Globalization? An Examination of the Impacts of Globalization on Wine Consumption in Asia.” International Journal of Wine Business Research, 21, no. 3.
Lewis, Jeffrey. 2010. “The Cooling Tower.” 38 North.International Institute for Strategic Studies. 2010. The Military Balance
2010, Vol. 110. London: International Institute for Strategic Studies.
Moon, Gwang-lip. 2010. “Korea-Chile FTA still Boosting Bilateral Trade.” JoongAng Ilbo. (April 1)
Na, Jeong-ju. 2010. “Korea, India to Double Trade by 2014.” Korea Times. (January 25)
Oh, Jean. 2010. “Wine and hansik: A natural blend.” Korea Herald. (February 24)
Korea's FTAs and their Implications for the Korean Wine Market 189
Oh, Sangyong, and Stan Phillips. 2008. “Korea, Republic of Wine Market Brief 2008.” GAIN Report KS8065. (December 17)
Oh, Sangyong, and Michael Fay. “Annual Wine Market Brief (Korea - Republic of).” Global Agricultural Information Network (GAIN) Report KS9049, 14 October 2009.
Ross, Karen. 2009. “Comments Concerning Free Trade Agreement with the Republic of Korea as It Affects Wine (HTS 2204) and Grape Juice Concentrate (HTS 2009).” Memorandum to Office of US Trade Representative. (September 15)
Song, Gi-Cheol. 2001. “Grape Production in the Republic of Korea.” In Minas K. Papademetriou and Frank J. Dent eds. Regional Office for Asia and the Pacific, Food and Agricultural Organization of the United Nations. Rome: FAO.
Stangarone, Troy. 2010. “The Deadline is Set: EU-Korea FTA to Come into Force on July 1, 2011.” Korea Insight.
“U.S.-Korea Free Trade Agreement: Pennsylvania Farmers Will Benefit.” 2008. US Department of Agriculture Foreign Agricultural Service Fact Sheet. (September)
van Wolferen, Karel. 2010. “Japan’s Stumbling Revolution.” Asia- Pacific Journal, 15-2-10. (2010).
“War Maniacs Warned Not to Run Amuck.” 2009. KCNA. (March 15)
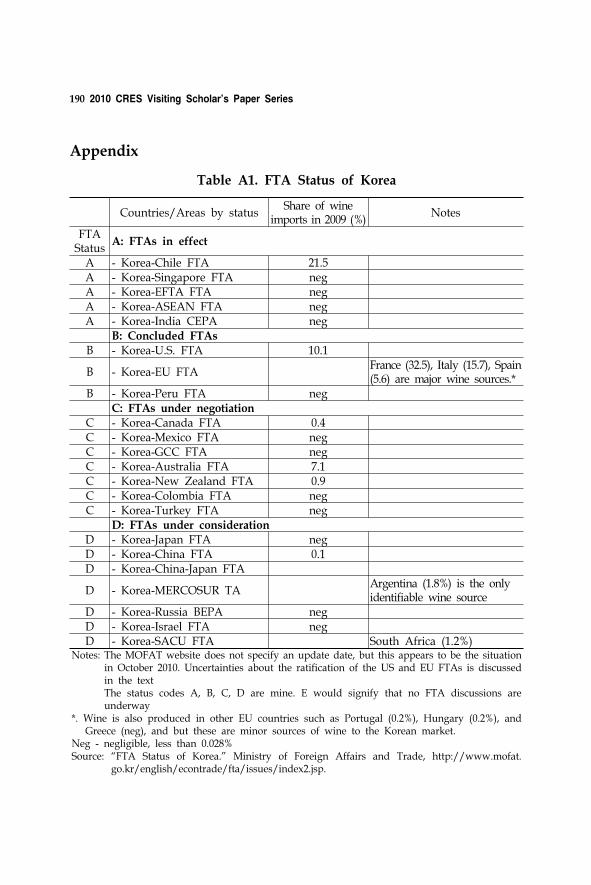
190 2010 CRES Visiting Scholar’s Paper Series
Appendix
Countries/Areas by statusShare of wine
imports in 2009 (%)Notes
FTA Status
A: FTAs in effect
A - Korea-Chile FTA 21.5A - Korea-Singapore FTA negA - Korea-EFTA FTA negA - Korea-ASEAN FTA negA - Korea-India CEPA neg
B: Concluded FTAs B - Korea-U.S. FTA 10.1
B - Korea-EU FTA France (32.5), Italy (15.7), Spain (5.6) are major wine sources.*
B - Korea-Peru FTA negC: FTAs under negotiation
C - Korea-Canada FTA 0.4C - Korea-Mexico FTA negC - Korea-GCC FTA negC - Korea-Australia FTA 7.1C - Korea-New Zealand FTA 0.9C - Korea-Colombia FTA negC - Korea-Turkey FTA neg
D: FTAs under consideration D - Korea-Japan FTA negD - Korea-China FTA 0.1D - Korea-China-Japan FTA
D - Korea-MERCOSUR TA Argentina (1.8%) is the only identifiable wine source
D - Korea-Russia BEPA negD - Korea-Israel FTA negD - Korea-SACU FTA South Africa (1.2%)
Notes: The MOFAT website does not specify an update date, but this appears to be the situation in October 2010. Uncertainties about the ratification of the US and EU FTAs is discussed in the textThe status codes A, B, C, D are mine. E would signify that no FTA discussions are underway
*. Wine is also produced in other EU countries such as Portugal (0.2%), Hungary (0.2%), and Greece (neg), and but these are minor sources of wine to the Korean market.
Neg - negligible, less than 0.028%Source: “FTA Status of Korea.” Ministry of Foreign Affairs and Trade, http://www.mofat.
go.kr/english/econtrade/fta/issues/index2.jsp.
Table A1. FTA Status of Korea
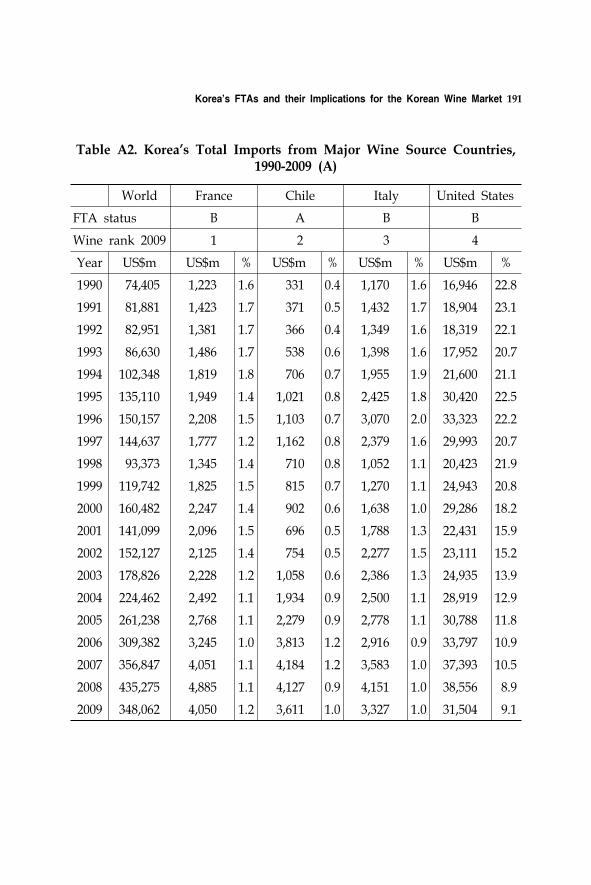
Korea's FTAs and their Implications for the Korean Wine Market 191
World France Chile Italy United States
FTA status B A B B
Wine rank 2009 1 2 3 4
Year US$m US$m % US$m % US$m % US$m %
1990 74,405 1,223 1.6 331 0.4 1,170 1.6 16,946 22.8
1991 81,881 1,423 1.7 371 0.5 1,432 1.7 18,904 23.1
1992 82,951 1,381 1.7 366 0.4 1,349 1.6 18,319 22.1
1993 86,630 1,486 1.7 538 0.6 1,398 1.6 17,952 20.7
1994 102,348 1,819 1.8 706 0.7 1,955 1.9 21,600 21.1
1995 135,110 1,949 1.4 1,021 0.8 2,425 1.8 30,420 22.5
1996 150,157 2,208 1.5 1,103 0.7 3,070 2.0 33,323 22.2
1997 144,637 1,777 1.2 1,162 0.8 2,379 1.6 29,993 20.7
1998 93,373 1,345 1.4 710 0.8 1,052 1.1 20,423 21.9
1999 119,742 1,825 1.5 815 0.7 1,270 1.1 24,943 20.8
2000 160,482 2,247 1.4 902 0.6 1,638 1.0 29,286 18.2
2001 141,099 2,096 1.5 696 0.5 1,788 1.3 22,431 15.9
2002 152,127 2,125 1.4 754 0.5 2,277 1.5 23,111 15.2
2003 178,826 2,228 1.2 1,058 0.6 2,386 1.3 24,935 13.9
2004 224,462 2,492 1.1 1,934 0.9 2,500 1.1 28,919 12.9
2005 261,238 2,768 1.1 2,279 0.9 2,778 1.1 30,788 11.8
2006 309,382 3,245 1.0 3,813 1.2 2,916 0.9 33,797 10.9
2007 356,847 4,051 1.1 4,184 1.2 3,583 1.0 37,393 10.5
2008 435,275 4,885 1.1 4,127 0.9 4,151 1.0 38,556 8.9
2009 348,062 4,050 1.2 3,611 1.0 3,327 1.0 31,504 9.1
Table A2. Korea’s Total Imports from Major Wine Source Countries, 1990-2009 (A)
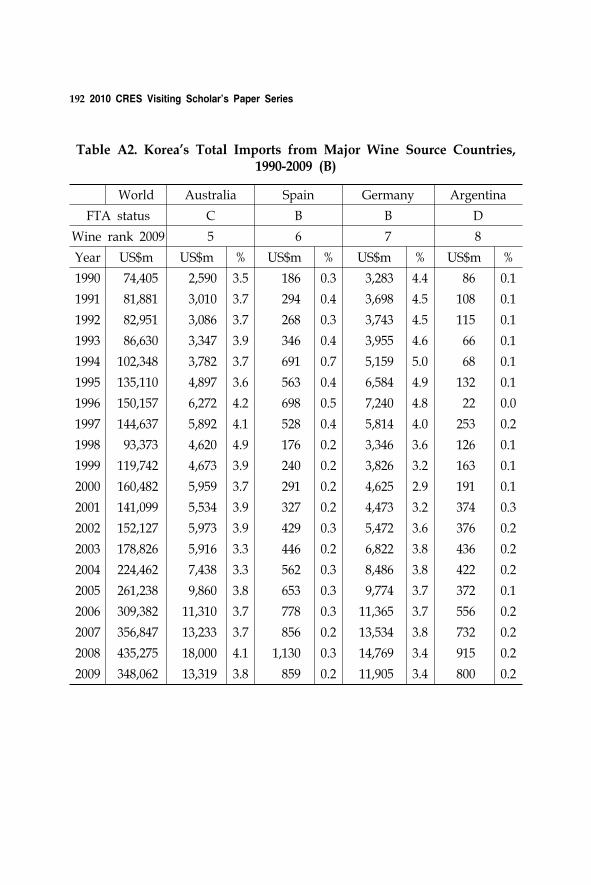
192 2010 CRES Visiting Scholar’s Paper Series
World Australia Spain Germany Argentina
FTA status C B B D
Wine rank 2009 5 6 7 8
Year US$m US$m % US$m % US$m % US$m %
1990 74,405 2,590 3.5 186 0.3 3,283 4.4 86 0.1
1991 81,881 3,010 3.7 294 0.4 3,698 4.5 108 0.1
1992 82,951 3,086 3.7 268 0.3 3,743 4.5 115 0.1
1993 86,630 3,347 3.9 346 0.4 3,955 4.6 66 0.1
1994 102,348 3,782 3.7 691 0.7 5,159 5.0 68 0.1
1995 135,110 4,897 3.6 563 0.4 6,584 4.9 132 0.1
1996 150,157 6,272 4.2 698 0.5 7,240 4.8 22 0.0
1997 144,637 5,892 4.1 528 0.4 5,814 4.0 253 0.2
1998 93,373 4,620 4.9 176 0.2 3,346 3.6 126 0.1
1999 119,742 4,673 3.9 240 0.2 3,826 3.2 163 0.1
2000 160,482 5,959 3.7 291 0.2 4,625 2.9 191 0.1
2001 141,099 5,534 3.9 327 0.2 4,473 3.2 374 0.3
2002 152,127 5,973 3.9 429 0.3 5,472 3.6 376 0.2
2003 178,826 5,916 3.3 446 0.2 6,822 3.8 436 0.2
2004 224,462 7,438 3.3 562 0.3 8,486 3.8 422 0.2
2005 261,238 9,860 3.8 653 0.3 9,774 3.7 372 0.1
2006 309,382 11,310 3.7 778 0.3 11,365 3.7 556 0.2
2007 356,847 13,233 3.7 856 0.2 13,534 3.8 732 0.2
2008 435,275 18,000 4.1 1,130 0.3 14,769 3.4 915 0.2
2009 348,062 13,319 3.8 859 0.2 11,905 3.4 800 0.2
Table A2. Korea’s Total Imports from Major Wine Source Countries, 1990-2009 (B)
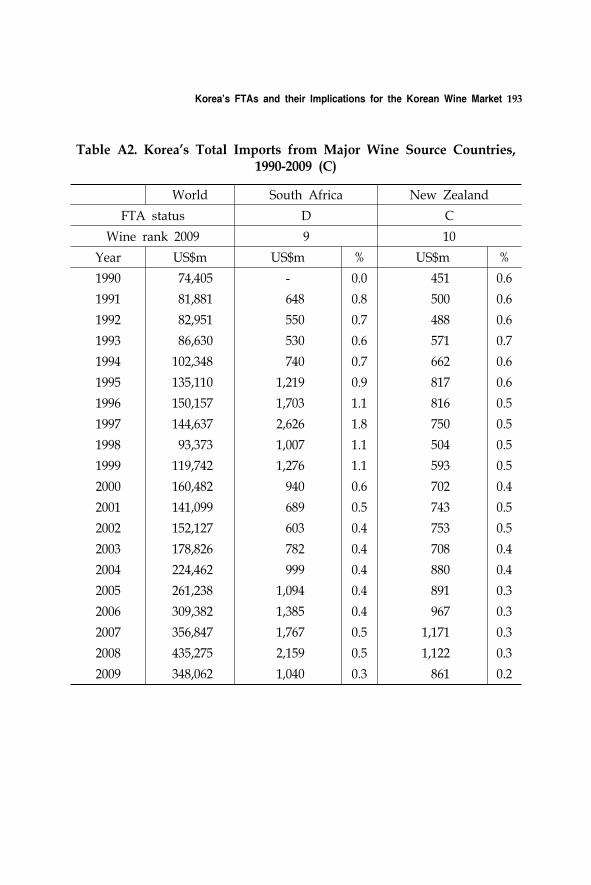
Korea's FTAs and their Implications for the Korean Wine Market 193
World South Africa New Zealand
FTA status D C
Wine rank 2009 9 10
Year US$m US$m % US$m %
1990 74,405 - 0.0 451 0.6
1991 81,881 648 0.8 500 0.6
1992 82,951 550 0.7 488 0.6
1993 86,630 530 0.6 571 0.7
1994 102,348 740 0.7 662 0.6
1995 135,110 1,219 0.9 817 0.6
1996 150,157 1,703 1.1 816 0.5
1997 144,637 2,626 1.8 750 0.5
1998 93,373 1,007 1.1 504 0.5
1999 119,742 1,276 1.1 593 0.5
2000 160,482 940 0.6 702 0.4
2001 141,099 689 0.5 743 0.5
2002 152,127 603 0.4 753 0.5
2003 178,826 782 0.4 708 0.4
2004 224,462 999 0.4 880 0.4
2005 261,238 1,094 0.4 891 0.3
2006 309,382 1,385 0.4 967 0.3
2007 356,847 1,767 0.5 1,171 0.3
2008 435,275 2,159 0.5 1,122 0.3
2009 348,062 1,040 0.3 861 0.2
Table A2. Korea’s Total Imports from Major Wine Source Countries, 1990-2009 (C)
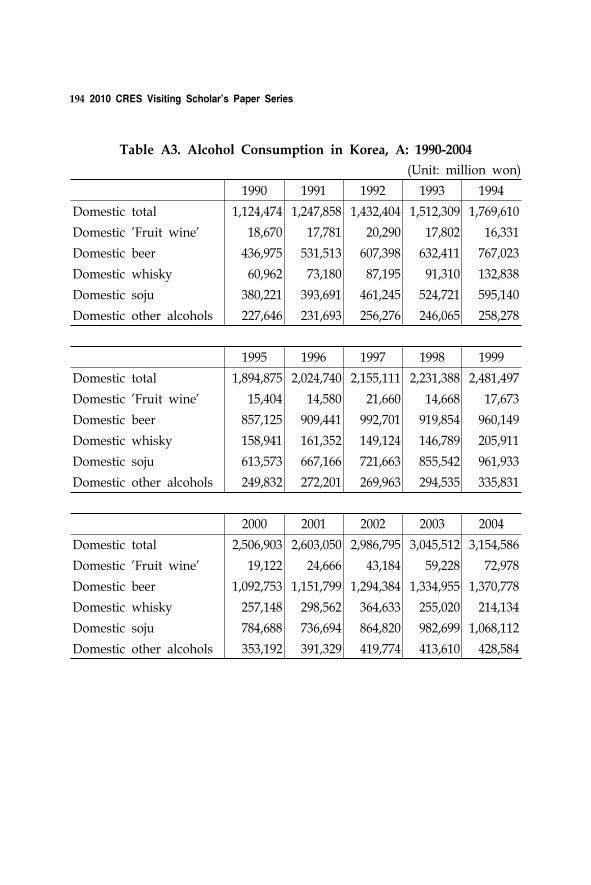
194 2010 CRES Visiting Scholar’s Paper Series
1990 1991 1992 1993 1994
Domestic total 1,124,474 1,247,858 1,432,404 1,512,309 1,769,610
Domestic 'Fruit wine' 18,670 17,781 20,290 17,802 16,331
Domestic beer 436,975 531,513 607,398 632,411 767,023
Domestic whisky 60,962 73,180 87,195 91,310 132,838
Domestic soju 380,221 393,691 461,245 524,721 595,140
Domestic other alcohols 227,646 231,693 256,276 246,065 258,278
1995 1996 1997 1998 1999
Domestic total 1,894,875 2,024,740 2,155,111 2,231,388 2,481,497
Domestic 'Fruit wine' 15,404 14,580 21,660 14,668 17,673
Domestic beer 857,125 909,441 992,701 919,854 960,149
Domestic whisky 158,941 161,352 149,124 146,789 205,911
Domestic soju 613,573 667,166 721,663 855,542 961,933
Domestic other alcohols 249,832 272,201 269,963 294,535 335,831
2000 2001 2002 2003 2004
Domestic total 2,506,903 2,603,050 2,986,795 3,045,512 3,154,586
Domestic 'Fruit wine' 19,122 24,666 43,184 59,228 72,978
Domestic beer 1,092,753 1,151,799 1,294,384 1,334,955 1,370,778
Domestic whisky 257,148 298,562 364,633 255,020 214,134
Domestic soju 784,688 736,694 864,820 982,699 1,068,112
Domestic other alcohols 353,192 391,329 419,774 413,610 428,584
Table A3. Alcohol Consumption in Korea, A: 1990-2004
(Unit: million won)
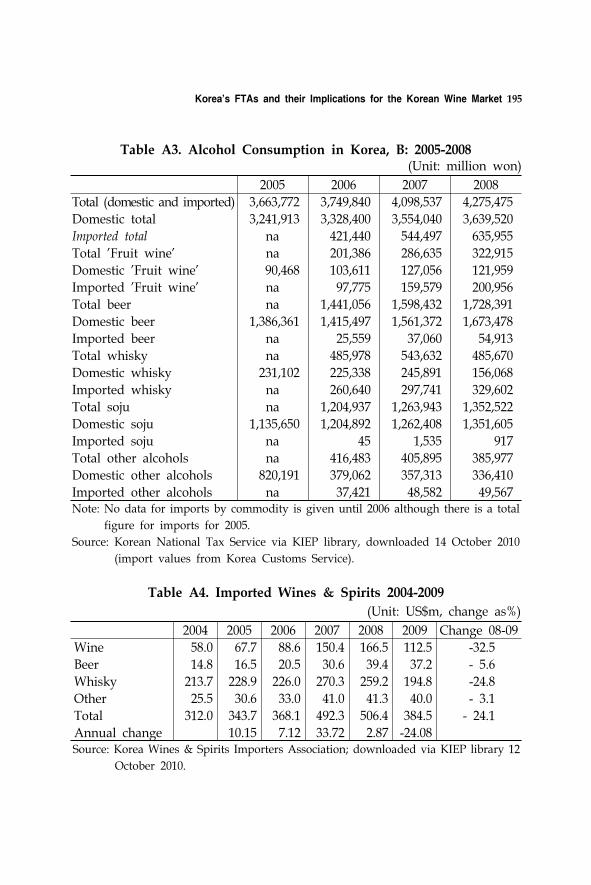
Korea's FTAs and their Implications for the Korean Wine Market 195
2005 2006 2007 2008
Total (domestic and imported) 3,663,772 3,749,840 4,098,537 4,275,475
Domestic total 3,241,913 3,328,400 3,554,040 3,639,520
Imported total na 421,440 544,497 635,955
Total 'Fruit wine' na 201,386 286,635 322,915
Domestic 'Fruit wine' 90,468 103,611 127,056 121,959
Imported 'Fruit wine' na 97,775 159,579 200,956
Total beer na 1,441,056 1,598,432 1,728,391
Domestic beer 1,386,361 1,415,497 1,561,372 1,673,478
Imported beer na 25,559 37,060 54,913
Total whisky na 485,978 543,632 485,670
Domestic whisky 231,102 225,338 245,891 156,068
Imported whisky na 260,640 297,741 329,602
Total soju na 1,204,937 1,263,943 1,352,522
Domestic soju 1,135,650 1,204,892 1,262,408 1,351,605
Imported soju na 45 1,535 917
Total other alcohols na 416,483 405,895 385,977
Domestic other alcohols 820,191 379,062 357,313 336,410
Imported other alcohols na 37,421 48,582 49,567Note: No data for imports by commodity is given until 2006 although there is a total
figure for imports for 2005.
Source: Korean National Tax Service via KIEP library, downloaded 14 October 2010
(import values from Korea Customs Service).
Table A3. Alcohol Consumption in Korea, B: 2005-2008 (Unit: million won)
2004 2005 2006 2007 2008 2009 Change 08-09
Wine 58.0 67.7 88.6 150.4 166.5 112.5 -32.5
Beer 14.8 16.5 20.5 30.6 39.4 37.2 - 5.6
Whisky 213.7 228.9 226.0 270.3 259.2 194.8 -24.8
Other 25.5 30.6 33.0 41.0 41.3 40.0 - 3.1
Total 312.0 343.7 368.1 492.3 506.4 384.5 - 24.1
Annual change 10.15 7.12 33.72 2.87 -24.08 Source: Korea Wines & Spirits Importers Association; downloaded via KIEP library 12
October 2010.
Table A4. Imported Wines & Spirits 2004-2009
(Unit: US$m, change as%)
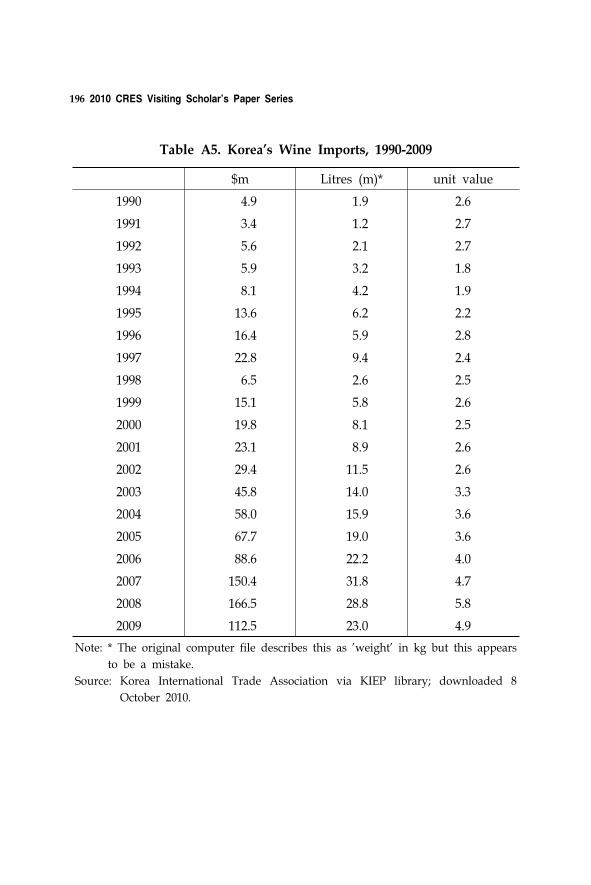
196 2010 CRES Visiting Scholar’s Paper Series
$m Litres (m)* unit value
1990 4.9 1.9 2.6
1991 3.4 1.2 2.7
1992 5.6 2.1 2.7
1993 5.9 3.2 1.8
1994 8.1 4.2 1.9
1995 13.6 6.2 2.2
1996 16.4 5.9 2.8
1997 22.8 9.4 2.4
1998 6.5 2.6 2.5
1999 15.1 5.8 2.6
2000 19.8 8.1 2.5
2001 23.1 8.9 2.6
2002 29.4 11.5 2.6
2003 45.8 14.0 3.3
2004 58.0 15.9 3.6
2005 67.7 19.0 3.6
2006 88.6 22.2 4.0
2007 150.4 31.8 4.7
2008 166.5 28.8 5.8
2009 112.5 23.0 4.9
Note: * The original computer file describes this as 'weight' in kg but this appears
to be a mistake.
Source: Korea International Trade Association via KIEP library; downloaded 8
October 2010.
Table A5. Korea’s Wine Imports, 1990-2009
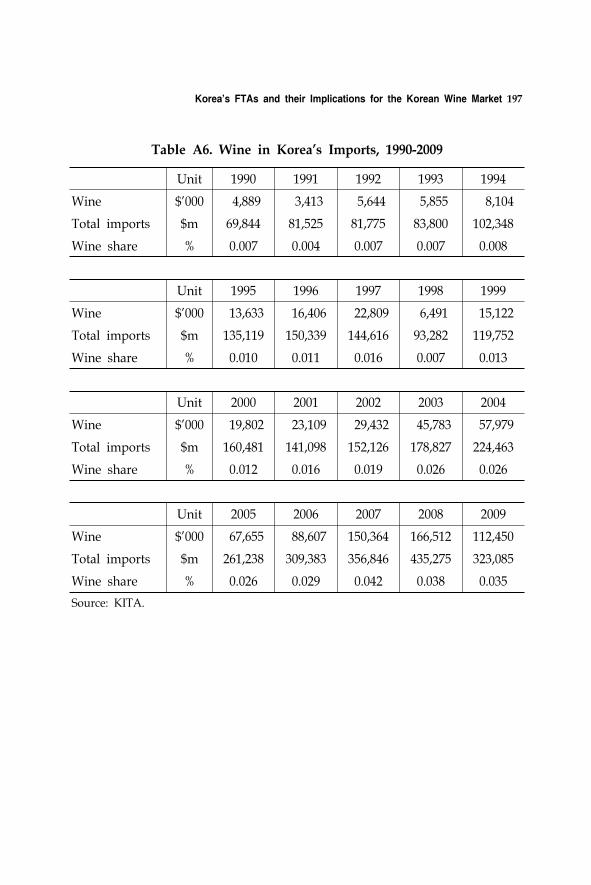
Korea's FTAs and their Implications for the Korean Wine Market 197
Unit 1990 1991 1992 1993 1994
Wine $'000 4,889 3,413 5,644 5,855 8,104
Total imports $m 69,844 81,525 81,775 83,800 102,348
Wine share % 0.007 0.004 0.007 0.007 0.008
Unit 1995 1996 1997 1998 1999
Wine $'000 13,633 16,406 22,809 6,491 15,122
Total imports $m 135,119 150,339 144,616 93,282 119,752
Wine share % 0.010 0.011 0.016 0.007 0.013
Unit 2000 2001 2002 2003 2004
Wine $'000 19,802 23,109 29,432 45,783 57,979
Total imports $m 160,481 141,098 152,126 178,827 224,463
Wine share % 0.012 0.016 0.019 0.026 0.026
Unit 2005 2006 2007 2008 2009
Wine $'000 67,655 88,607 150,364 166,512 112,450
Total imports $m 261,238 309,383 356,846 435,275 323,085
Wine share % 0.026 0.029 0.042 0.038 0.035
Source: KITA.
Table A6. Wine in Korea’s Imports, 1990-2009
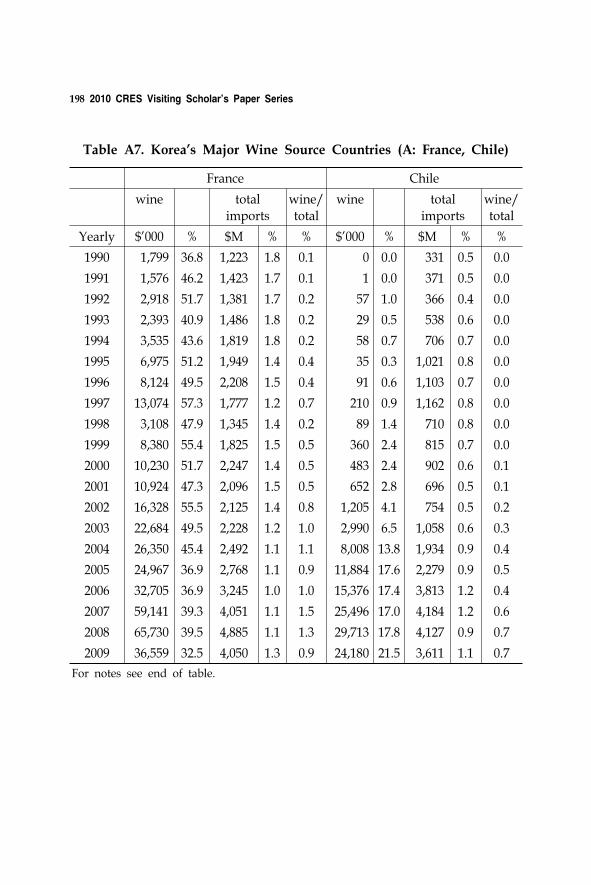
198 2010 CRES Visiting Scholar’s Paper Series
France Chile
wine total imports
wine/total
wine total imports
wine/total
Yearly $'000 % $M % % $'000 % $M % %
1990 1,799 36.8 1,223 1.8 0.1 0 0.0 331 0.5 0.0
1991 1,576 46.2 1,423 1.7 0.1 1 0.0 371 0.5 0.0
1992 2,918 51.7 1,381 1.7 0.2 57 1.0 366 0.4 0.0
1993 2,393 40.9 1,486 1.8 0.2 29 0.5 538 0.6 0.0
1994 3,535 43.6 1,819 1.8 0.2 58 0.7 706 0.7 0.0
1995 6,975 51.2 1,949 1.4 0.4 35 0.3 1,021 0.8 0.0
1996 8,124 49.5 2,208 1.5 0.4 91 0.6 1,103 0.7 0.0
1997 13,074 57.3 1,777 1.2 0.7 210 0.9 1,162 0.8 0.0
1998 3,108 47.9 1,345 1.4 0.2 89 1.4 710 0.8 0.0
1999 8,380 55.4 1,825 1.5 0.5 360 2.4 815 0.7 0.0
2000 10,230 51.7 2,247 1.4 0.5 483 2.4 902 0.6 0.1
2001 10,924 47.3 2,096 1.5 0.5 652 2.8 696 0.5 0.1
2002 16,328 55.5 2,125 1.4 0.8 1,205 4.1 754 0.5 0.2
2003 22,684 49.5 2,228 1.2 1.0 2,990 6.5 1,058 0.6 0.3
2004 26,350 45.4 2,492 1.1 1.1 8,008 13.8 1,934 0.9 0.4
2005 24,967 36.9 2,768 1.1 0.9 11,884 17.6 2,279 0.9 0.5
2006 32,705 36.9 3,245 1.0 1.0 15,376 17.4 3,813 1.2 0.4
2007 59,141 39.3 4,051 1.1 1.5 25,496 17.0 4,184 1.2 0.6
2008 65,730 39.5 4,885 1.1 1.3 29,713 17.8 4,127 0.9 0.7
2009 36,559 32.5 4,050 1.3 0.9 24,180 21.5 3,611 1.1 0.7
For notes see end of table.
Table A7. Korea’s Major Wine Source Countries (A: France, Chile)

Korea's FTAs and their Implications for the Korean Wine Market 199
Italy US
wine total importswine/total
wine total importswine/total
Yearly $'000 % $M % % $'000 % $M % %
1990 189 3.9 1,170 1.7 0.0 233 4.8 16,946 24.3 0.0
1991 371 10.9 1,432 1.8 0.0 165 4.8 18,904 23.2 0.0
1992 497 8.8 1,349 1.6 0.0 242 4.3 18,319 22.4 0.0
1993 481 8.2 1,398 1.7 0.0 363 6.2 17,952 21.4 0.0
1994 790 9.7 1,955 1.9 0.0 583 7.2 21,600 21.1 0.0
1995 1,094 8.0 2,425 1.8 0.0 982 7.2 30,420 22.5 0.0
1996 1,764 10.8 3,070 2.0 0.1 1,558 9.5 33,323 22.2 0.0
1997 1,991 8.7 2,379 1.6 0.1 2,307 10.1 29,993 20.7 0.0
1998 759 11.7 1,052 1.1 0.1 907 14.0 20,423 21.9 0.0
1999 1,337 8.8 1,270 1.1 0.1 2,256 14.9 24,943 20.8 0.0
2000 1,457 7.4 1,638 1.0 0.1 3,394 17.1 29,286 18.2 0.0
2001 1,599 6.9 1,788 1.3 0.1 5,672 24.5 22,431 15.9 0.0
2002 2,257 7.7 2,277 1.5 0.1 4,369 14.8 23,111 15.2 0.0
2003 4,187 9.1 2,386 1.3 0.2 7,192 15.7 24,935 13.9 0.0
2004 4,708 8.1 2,500 1.1 0.2 8,136 14.0 28,919 12.9 0.0
2005 6,747 10.0 2,778 1.1 0.2 9,471 14.0 30,788 11.8 0.0
2006 8,989 10.1 2,916 0.9 0.3 12,482 14.1 33,797 10.9 0.0
2007 19,608 13.0 3,583 1.0 0.5 16,756 11.1 37,393 10.5 0.0
2008 24,091 14.5 4,151 1.0 0.6 16,247 9.8 38,556 8.9 0.0
2009 17,689 15.7 3,327 1.0 0.5 11,312 10.1 31,504 9.8 0.0
For notes see end of table.
Table A7. Korea’s Major Wine Source Countries (B: Italy, US)
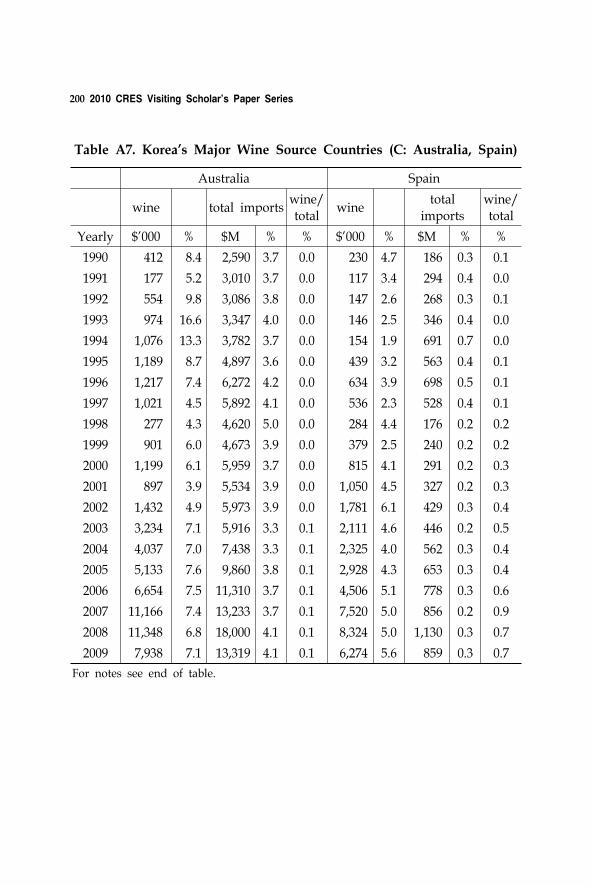
200 2010 CRES Visiting Scholar’s Paper Series
Australia Spain
wine total importswine/total
winetotal
importswine/total
Yearly $'000 % $M % % $'000 % $M % %
1990 412 8.4 2,590 3.7 0.0 230 4.7 186 0.3 0.1
1991 177 5.2 3,010 3.7 0.0 117 3.4 294 0.4 0.0
1992 554 9.8 3,086 3.8 0.0 147 2.6 268 0.3 0.1
1993 974 16.6 3,347 4.0 0.0 146 2.5 346 0.4 0.0
1994 1,076 13.3 3,782 3.7 0.0 154 1.9 691 0.7 0.0
1995 1,189 8.7 4,897 3.6 0.0 439 3.2 563 0.4 0.1
1996 1,217 7.4 6,272 4.2 0.0 634 3.9 698 0.5 0.1
1997 1,021 4.5 5,892 4.1 0.0 536 2.3 528 0.4 0.1
1998 277 4.3 4,620 5.0 0.0 284 4.4 176 0.2 0.2
1999 901 6.0 4,673 3.9 0.0 379 2.5 240 0.2 0.2
2000 1,199 6.1 5,959 3.7 0.0 815 4.1 291 0.2 0.3
2001 897 3.9 5,534 3.9 0.0 1,050 4.5 327 0.2 0.3
2002 1,432 4.9 5,973 3.9 0.0 1,781 6.1 429 0.3 0.4
2003 3,234 7.1 5,916 3.3 0.1 2,111 4.6 446 0.2 0.5
2004 4,037 7.0 7,438 3.3 0.1 2,325 4.0 562 0.3 0.4
2005 5,133 7.6 9,860 3.8 0.1 2,928 4.3 653 0.3 0.4
2006 6,654 7.5 11,310 3.7 0.1 4,506 5.1 778 0.3 0.6
2007 11,166 7.4 13,233 3.7 0.1 7,520 5.0 856 0.2 0.9
2008 11,348 6.8 18,000 4.1 0.1 8,324 5.0 1,130 0.3 0.7
2009 7,938 7.1 13,319 4.1 0.1 6,274 5.6 859 0.3 0.7
For notes see end of table.
Table A7. Korea’s Major Wine Source Countries (C: Australia, Spain)
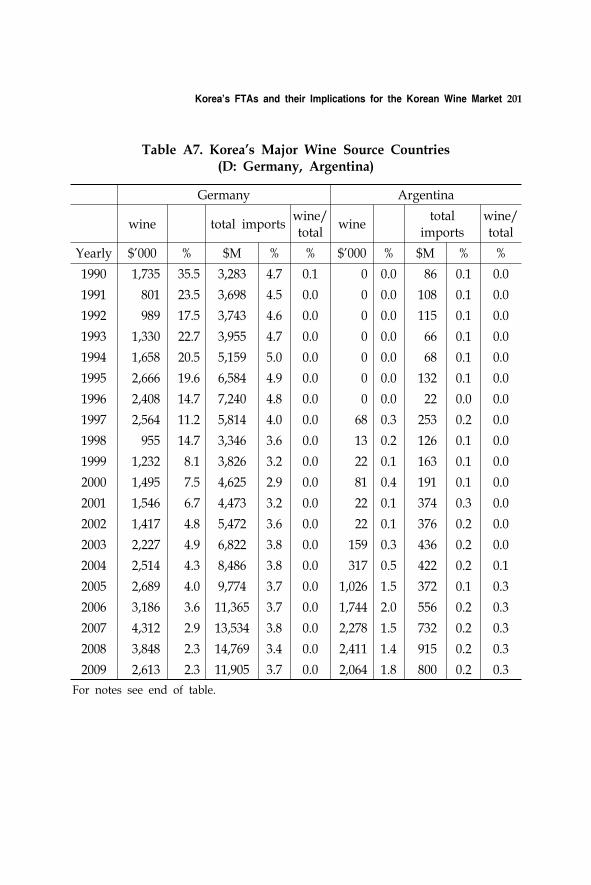
Korea's FTAs and their Implications for the Korean Wine Market 201
Germany Argentina
wine total importswine/total
winetotal
importswine/total
Yearly $'000 % $M % % $'000 % $M % %
1990 1,735 35.5 3,283 4.7 0.1 0 0.0 86 0.1 0.0
1991 801 23.5 3,698 4.5 0.0 0 0.0 108 0.1 0.0
1992 989 17.5 3,743 4.6 0.0 0 0.0 115 0.1 0.0
1993 1,330 22.7 3,955 4.7 0.0 0 0.0 66 0.1 0.0
1994 1,658 20.5 5,159 5.0 0.0 0 0.0 68 0.1 0.0
1995 2,666 19.6 6,584 4.9 0.0 0 0.0 132 0.1 0.0
1996 2,408 14.7 7,240 4.8 0.0 0 0.0 22 0.0 0.0
1997 2,564 11.2 5,814 4.0 0.0 68 0.3 253 0.2 0.0
1998 955 14.7 3,346 3.6 0.0 13 0.2 126 0.1 0.0
1999 1,232 8.1 3,826 3.2 0.0 22 0.1 163 0.1 0.0
2000 1,495 7.5 4,625 2.9 0.0 81 0.4 191 0.1 0.0
2001 1,546 6.7 4,473 3.2 0.0 22 0.1 374 0.3 0.0
2002 1,417 4.8 5,472 3.6 0.0 22 0.1 376 0.2 0.0
2003 2,227 4.9 6,822 3.8 0.0 159 0.3 436 0.2 0.0
2004 2,514 4.3 8,486 3.8 0.0 317 0.5 422 0.2 0.1
2005 2,689 4.0 9,774 3.7 0.0 1,026 1.5 372 0.1 0.3
2006 3,186 3.6 11,365 3.7 0.0 1,744 2.0 556 0.2 0.3
2007 4,312 2.9 13,534 3.8 0.0 2,278 1.5 732 0.2 0.3
2008 3,848 2.3 14,769 3.4 0.0 2,411 1.4 915 0.2 0.3
2009 2,613 2.3 11,905 3.7 0.0 2,064 1.8 800 0.2 0.3
For notes see end of table.
Table A7. Korea’s Major Wine Source Countries (D: Germany, Argentina)

202 2010 CRES Visiting Scholar’s Paper Series
South Africa NZ
wine total importswine/total
winetotal
importswine/total
Yearly $'000 % $M % % $'000 % $M % %1990 0 0.0 0 0.0 na 4 0.1 451 0.6 0.01991 0 0.0 648 0.8 0.0 1 0.0 500 0.6 0.01992 0 0.0 550 0.7 0.0 0 0.0 488 0.6 0.01993 0 0.0 530 0.6 0.0 0 0.0 571 0.7 0.01994 52 0.6 740 0.7 0.0 2 0.0 662 0.6 0.01995 53 0.4 1,219 0.9 0.0 8 0.1 817 0.6 0.01996 335 2.0 1,703 1.1 0.0 40 0.2 816 0.5 0.01997 259 1.1 2,626 1.8 0.0 61 0.3 750 0.5 0.01998 0 0.0 1,007 1.1 0.0 42 0.6 504 0.5 0.01999 23 0.2 1,276 1.1 0.0 48 0.3 593 0.5 0.02000 55 0.3 940 0.6 0.0 91 0.5 702 0.4 0.02001 69 0.3 689 0.5 0.0 57 0.2 743 0.5 0.02002 62 0.2 603 0.4 0.0 72 0.2 753 0.5 0.02003 116 0.3 782 0.4 0.0 70 0.2 708 0.4 0.02004 219 0.4 999 0.4 0.0 141 0.2 880 0.4 0.02005 895 1.3 1,094 0.4 0.1 238 0.4 891 0.3 0.02006 1,005 1.1 1,385 0.4 0.1 438 0.5 967 0.3 0.02007 1,016 0.7 1,767 0.5 0.1 963 0.6 1,171 0.3 0.12008 1,363 0.8 2,159 0.5 0.1 947 0.6 1,122 0.3 0.12009 1,312 1.2 1,040 0.3 0.1 1,067 0.9 861 0.3 0.1
Table A7. Korea’s Major Wine Source Countries (F: South Africa, New Zealand)
Total wine Imports of wine from all countries
Total M Total imports from all countries
By country
wine $'000 Imports of wine from specified country, in $1,000
Wine% Specified country's share of all wine imports
Total imports
$m Value of total imports from specified country in $m (DOTS)
% Specified country's share of total imports
wine/total Imports of wine as% of imports from specified country
Source is KITA unless otherwise specified.
Notes

Korea's FTAs and their Implications for the Korean Wine Market 203
Total wine France Chile Italy US Australia
Yearly $'000 % % % % %
1990 4,889 36.8 0.0 3.9 4.8 8.4
1991 3,413 46.2 0.0 10.9 4.8 5.2
1992 5,644 51.7 1.0 8.8 4.3 9.8
1993 5,855 40.9 0.5 8.2 6.2 16.6
1994 8,104 43.6 0.7 9.7 7.2 13.3
1995 13,633 51.2 0.3 8.0 7.2 8.7
1996 16,406 49.5 0.6 10.8 9.5 7.4
1997 22,809 57.3 0.9 8.7 10.1 4.5
1998 6,491 47.9 1.4 11.7 14.0 4.3
1999 15,122 55.4 2.4 8.8 14.9 6.0
2000 19,802 51.7 2.4 7.4 17.1 6.1
2001 23,109 47.3 2.8 6.9 24.5 3.9
2002 29,432 55.5 4.1 7.7 14.8 4.9
2003 45,783 49.5 6.5 9.1 15.7 7.1
2004 57,979 45.4 13.8 8.1 14.0 7.0
2005 67,655 36.9 17.6 10.0 14.0 7.6
2006 88,607 36.9 17.4 10.1 14.1 7.5
2007 150,364 39.3 17.0 13.0 11.1 7.4
2008 166,512 39.5 17.8 14.5 9.8 6.8
2009 112,450 32.5 21.5 15.7 10.1 7.1
Table A8. Korea's Wine Imports from Top Ten Source Countries, 1990-2009, by share (A)
(This is a summary of Table A7)
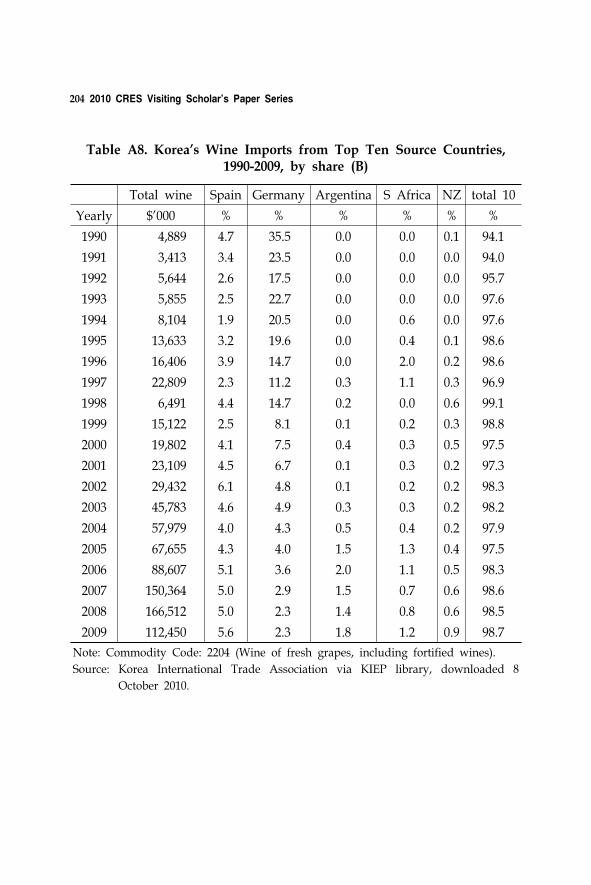
204 2010 CRES Visiting Scholar’s Paper Series
Total wine Spain Germany Argentina S Africa NZ total 10
Yearly $'000 % % % % % %
1990 4,889 4.7 35.5 0.0 0.0 0.1 94.1
1991 3,413 3.4 23.5 0.0 0.0 0.0 94.0
1992 5,644 2.6 17.5 0.0 0.0 0.0 95.7
1993 5,855 2.5 22.7 0.0 0.0 0.0 97.6
1994 8,104 1.9 20.5 0.0 0.6 0.0 97.6
1995 13,633 3.2 19.6 0.0 0.4 0.1 98.6
1996 16,406 3.9 14.7 0.0 2.0 0.2 98.6
1997 22,809 2.3 11.2 0.3 1.1 0.3 96.9
1998 6,491 4.4 14.7 0.2 0.0 0.6 99.1
1999 15,122 2.5 8.1 0.1 0.2 0.3 98.8
2000 19,802 4.1 7.5 0.4 0.3 0.5 97.5
2001 23,109 4.5 6.7 0.1 0.3 0.2 97.3
2002 29,432 6.1 4.8 0.1 0.2 0.2 98.3
2003 45,783 4.6 4.9 0.3 0.3 0.2 98.2
2004 57,979 4.0 4.3 0.5 0.4 0.2 97.9
2005 67,655 4.3 4.0 1.5 1.3 0.4 97.5
2006 88,607 5.1 3.6 2.0 1.1 0.5 98.3
2007 150,364 5.0 2.9 1.5 0.7 0.6 98.6
2008 166,512 5.0 2.3 1.4 0.8 0.6 98.5
2009 112,450 5.6 2.3 1.8 1.2 0.9 98.7
Note: Commodity Code: 2204 (Wine of fresh grapes, including fortified wines).
Source: Korea International Trade Association via KIEP library, downloaded 8
October 2010.
Table A8. Korea's Wine Imports from Top Ten Source Countries, 1990-2009, by share (B)
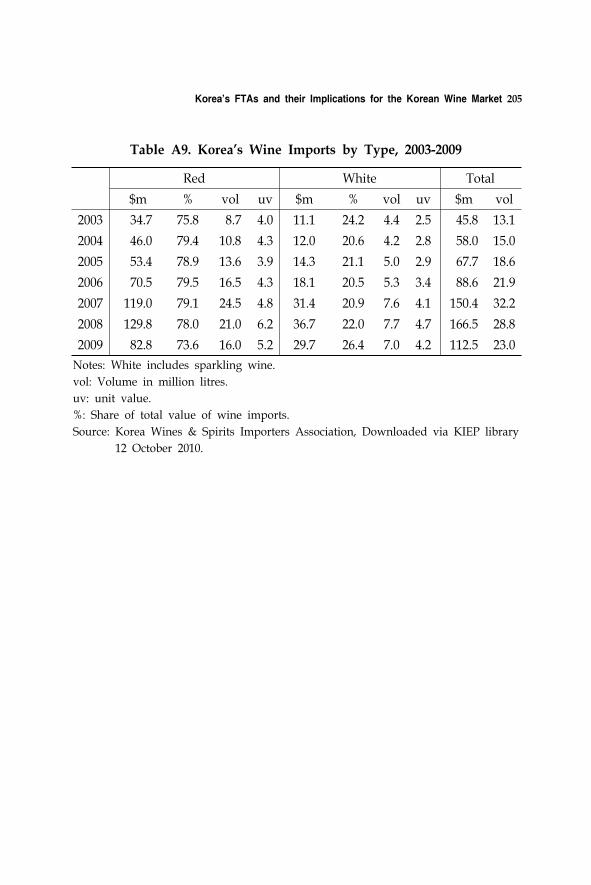
Korea's FTAs and their Implications for the Korean Wine Market 205
Red White Total
$m % vol uv $m % vol uv $m vol
2003 34.7 75.8 8.7 4.0 11.1 24.2 4.4 2.5 45.8 13.1
2004 46.0 79.4 10.8 4.3 12.0 20.6 4.2 2.8 58.0 15.0
2005 53.4 78.9 13.6 3.9 14.3 21.1 5.0 2.9 67.7 18.6
2006 70.5 79.5 16.5 4.3 18.1 20.5 5.3 3.4 88.6 21.9
2007 119.0 79.1 24.5 4.8 31.4 20.9 7.6 4.1 150.4 32.2
2008 129.8 78.0 21.0 6.2 36.7 22.0 7.7 4.7 166.5 28.8
2009 82.8 73.6 16.0 5.2 29.7 26.4 7.0 4.2 112.5 23.0
Notes: White includes sparkling wine.
vol: Volume in million litres.
uv: unit value.
%: Share of total value of wine imports.
Source: Korea Wines & Spirits Importers Association, Downloaded via KIEP library
12 October 2010.
Table A9. Korea’s Wine Imports by Type, 2003-2009
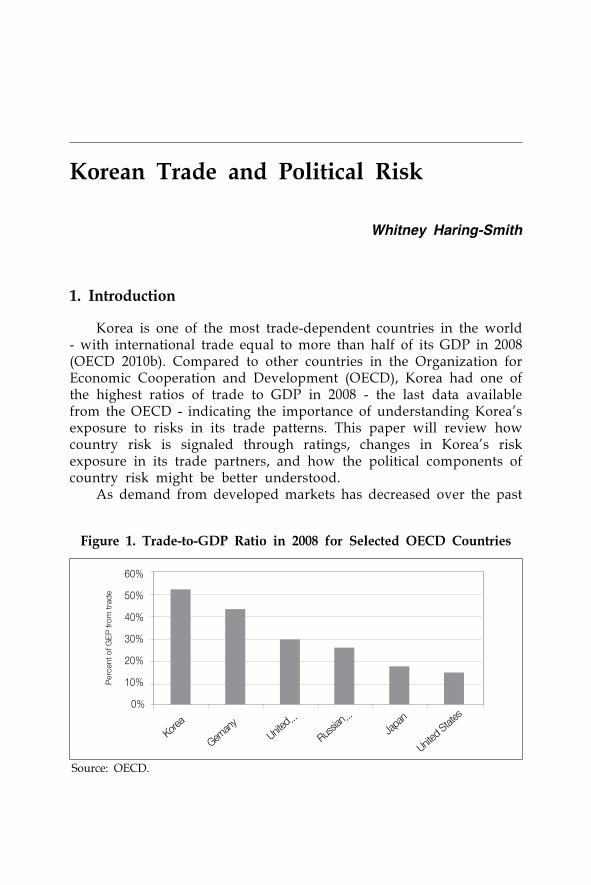
Korea
Geman
yUnit
ed...
Russia
n...
Japa
n
United
Stat
es
60%
50%
40%
30%
20%
10%
0%
Perc
ent
of G
EP
fro
m t
rad
e
Source: OECD.
Figure 1. Trade-to-GDP Ratio in 2008 for Selected OECD Countries
Korean Trade and Political Risk
Whitney Haring-Smith
1. Introduction
Korea is one of the most trade-dependent countries in the world - with international trade equal to more than half of its GDP in 2008 (OECD 2010b). Compared to other countries in the Organization for Economic Cooperation and Development (OECD), Korea had one of the highest ratios of trade to GDP in 2008 - the last data available from the OECD - indicating the importance of understanding Korea’s exposure to risks in its trade patterns. This paper will review how country risk is signaled through ratings, changes in Korea’s risk exposure in its trade partners, and how the political components of country risk might be better understood.
As demand from developed markets has decreased over the past

208 2010 CRES Visiting Scholar’s Paper Series
decade and demand from emerging markets has surged, particularly for heavy industry and infrastructure - two of Korea’s stronger industries, Korean firms have increased their exports and foreign direct investment to countries with increasing levels of risk. While much of this risk may be due to commercial risk in unpredictable markets, uncertain public finances for government procurers of infrastructure projects, or the challenges of confirming the trustworthiness of a foreign business partner, part of the risk exposure stems from political risk - the chance that a change in political conditions, whether the rise of opposition forces or the onset of political instability - will impact the value of the investment. As Korean firms operate in more uncertain environments, political risk represents an increasing share of the overall risk to investments.
To understand how political risk plays out in the market, the first section describes the system of rating for international sovereign credit and financing for overseas ventures. This rating system has significant impact on the ability of foreign governments to procure Korean exports through debt and insurance premiums charged to Korean firms operating in riskier countries.
The second section describes how Korea’s risk exposure has increased over the past decade, focusing on the specific risk classes and industries that have contributed to the greatest increases in exposure. In this assessment, I am careful enough to consider that the significant increases in China’s share of Korea’s overall trade can have a distorting impact on some perceptions of risk. As a result, some assessments are made both including China and excluding China to determine whether the trend is merely a “China effect.”
In the third section, the political components of political risk are considered, in light of the publicly known sovereign default history. This section focuses on understanding how Korea’s trade has changed by regime type, and which components of those regime types might pose the greatest risks to overseas Korean business.
Lastly, with that general background in mind, case studies such as POSCO in India and Daewoo Logistics in Madagascar are described to demonstrate the impact of these broader trends in the context of two Korean overseas investments that fall outside the sovereign default set.
Over the course of this review, it becomes evident that Korean
Korean Trade and Political Risk 209
trade is increasingly exposed to higher risk countries. In particular, from a political risk perspective, the countries of greatest concern appear to be borderline or weak democracies with partially constrained executives. These countries have more stakeholders and in a less well-defined order than others, providing a confusing and unpredictable environment for Korean businesses. In managing this risk, Korean firms may find the most protection by broadening outreach beyond traditional government channels to ensure that stakeholders including opposition leaders and civil society are sufficiently engaged.
As a general note, in this paper, when I refer to “country risk,” all non-market risks specifically associated with a given country are included. In the cases in which I refer to “political risk,” the reference concerns those traditional political risks such as changes in government and war but not commercial risk.
2. International Country Risk Ratings
In an age with increasing trade between countries and growth of trade into emerging markets, international country risk ratings have become a crucial element of international trade. Given the challenges of trying to understand each country’s risks individually, country risk ratings have developed to provide a quick and general sense of the risks involved in conducting a transaction in a given country. Because constructing such ratings is a time-consuming process and because users often benefit by using a common set of risk ratings, only a limited number of agencies exist that provide risk ratings. Although there are 74 credit rating agencies for countries, the three largest and most influential rating agencies are Moody’s Investors Service, Standard & Poor’s (S&P), and Fitch Ratings (International Monetary Fund 2010a). As governments have increased their borrowing to support a wide range of infrastructure projects - either through direct loans or through issuing sovereign bonds on open markets - the importance of country risk ratings has grown. Some international financial managers have become frustrated with the growing power of international rating agencies to affect capital flows. Thomas Friedman, New York Times columnist and an author on globalization, described the rise in importance of country risk ratings in this way:

210 2010 CRES Visiting Scholar’s Paper Series
50
40
30
20
10
0
Num
ber
of
Cou
ntrie
s
30
2
1517
1013
35
44
0 1 2 3 4 5 6 7
Figure 2. OECD Country Risk Classifications, 2009
In the 1960's the most important visitor a developing country could have was from the head of AID, the U.S. agency that doled out foreign aid. In the 1970's and 80's the most important visitor a developing country could have was from the I.M.F., to help restructure its economy. In the 1990's the most important visitor a developing country can have is from Moody's Investors Service Inc. (Friedman 1995)
The importance of a single country risk rating figure has become frustrating to some financial leaders for governments. In a 2004 Washington Post article on the growing rise of credit rating agencies, Jochen Sanio, then serving as the president of Germany’s financial regulatory agency BaFin, commented that Moody’s, S&P, and Fitch had become “uncontrolled world powers…who dominate the market” (Klein 2004). A 2010 report from the International Monetary Fund concluded that these credit rating agencies serve a reasonable track record - noting that “all sovereigns that defaulted since 1975 had noninvestment-grade ratings one year ahead of their default” - but changes in credit ratings can have a significant and immediate impact on the costs for a government in borrowing capital (International Monetary Fund 2010a).
In response to the rising power of private credit rating agencies, the OECD began developing country risk classifications through consensus at quarterly meetings. The OECD ratings covered 211 countries in October 2010, significantly more than were covered by
Korean Trade and Political Risk 211
the 127 countries covered by the S&P rankings (OECD 2010a; Standard & Poor's 2010). The OECD country risk classification system - which divides countries into 8 categories - is broader than the S&P or Fitch system, each of which uses 22 different categories (OECD 2010a).
The OECD country rating system serves to establish categories for minimum thresholds of premiums on insurance for official export credit agencies working in different countries. The OECD consensus classification has the stated purpose of achieving “premium rate convergence” so that countries do not use premiums on export insurance as a method for gaining a short-term trade advantage while exposing the official export credit agencies to long-term risks from non-repayment.
2.1. What are the components of these general country risks?
Country risk ratings are composed of a range of factors from public finances to risks of wars and natural disasters. The table below is excerpted from a 2010 IMF report on sovereign risk ratings to provide a sampling of the factors considered by the three major risk rating agencies - Moody’s, S&P, and Fitch (International Monetary Fund 2010b; Moody’s Investors Service 2008; Fitch Ratings 2010; Beers and Cavanaugh 2008).
In this lengthy list of factors considered by each of the major credit rating agencies, one area that stands out as particularly significant is political risk, which is one of the most difficult areas to measure and gauge. In an interview with a KSure official, political risk was described as “random” and one of the “soft factors” difficult to measure or gauge (Kyung-Chul 2010). Later in the paper, this topic is addressed in part by comparing sovereign default cases to political regime type and characteristics. Nonetheless, assessing political risk for any single transaction will benefit from field visits and direct interviews on the topic, regardless of how sophisticated the modeling system may become.
3. Korea’s County Rating Systems
In addition to the three main private rating agencies and the OECD
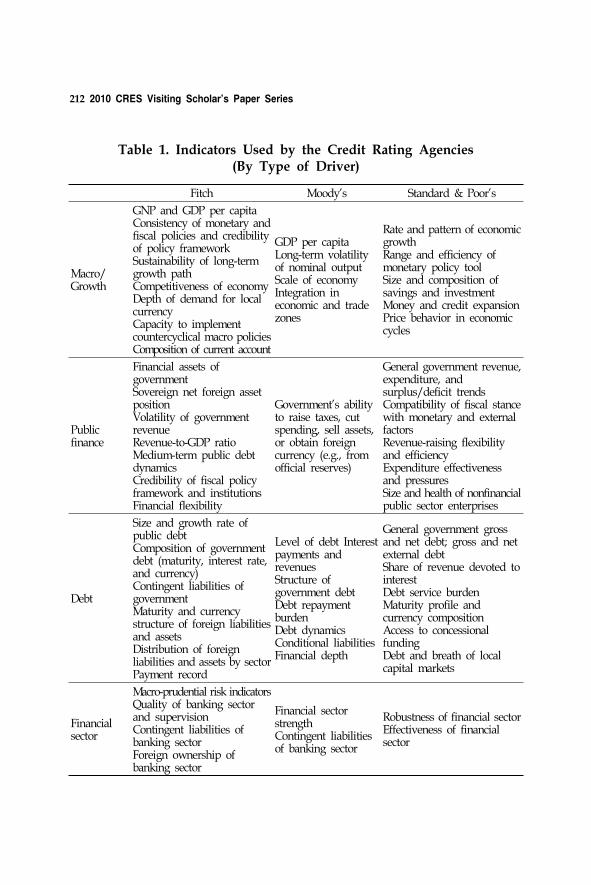
212 2010 CRES Visiting Scholar’s Paper Series
Fitch Moody’s Standard & Poor’s
Macro/ Growth
GNP and GDP per capitaConsistency of monetary and fiscal policies and credibility of policy frameworkSustainability of long-term growth path Competitiveness of economy Depth of demand for local currency Capacity to implement countercyclical macro policies Composition of current account
GDP per capita Long-term volatility of nominal output Scale of economy Integration in economic and trade zones
Rate and pattern of economic growth Range and efficiency of monetary policy tool Size and composition of savings and investment Money and credit expansion Price behavior in economic cycles
Public finance
Financial assets of government Sovereign net foreign asset position Volatility of government revenue Revenue-to-GDP ratio Medium-term public debt dynamics Credibility of fiscal policy framework and institutions Financial flexibility
Government’s ability to raise taxes, cut spending, sell assets, or obtain foreign currency (e.g., from official reserves)
General government revenue, expenditure, and surplus/deficit trends Compatibility of fiscal stance with monetary and external factors Revenue-raising flexibility and efficiency Expenditure effectiveness and pressures Size and health of nonfinancial public sector enterprises
Debt
Size and growth rate of public debt Composition of government debt (maturity, interest rate, and currency) Contingent liabilities of government Maturity and currency structure of foreign liabilities and assets Distribution of foreign liabilities and assets by sector Payment record
Level of debt Interest payments and revenues Structure of government debt Debt repayment burden Debt dynamics Conditional liabilities Financial depth
General government gross and net debt; gross and net external debt Share of revenue devoted to interest Debt service burden Maturity profile and currency composition Access to concessional funding Debt and breath of local capital markets
Financial sector
Macro-prudential risk indicators Quality of banking sector and supervision Contingent liabilities of banking sector Foreign ownership of banking sector
Financial sector strength Contingent liabilities of banking sector
Robustness of financial sector Effectiveness of financial sector
Table 1. Indicators Used by the Credit Rating Agencies (By Type of Driver)
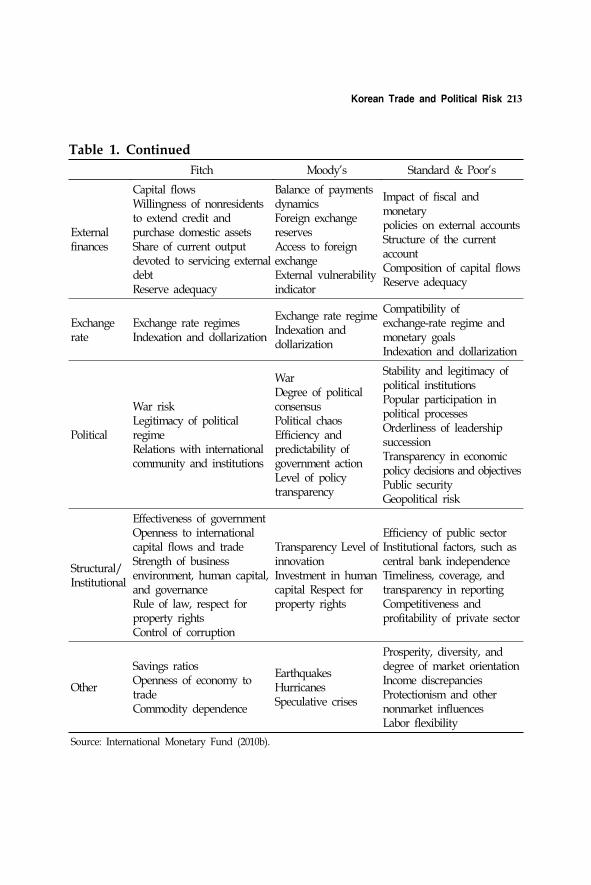
Korean Trade and Political Risk 213
Fitch Moody’s Standard & Poor’s
External finances
Capital flows Willingness of nonresidents to extend credit and purchase domestic assets Share of current output devoted to servicing external debt Reserve adequacy
Balance of payments dynamics Foreign exchange reserves Access to foreign exchange External vulnerability indicator
Impact of fiscal and monetary policies on external accounts Structure of the current account Composition of capital flows Reserve adequacy
Exchange rate
Exchange rate regimes Indexation and dollarization
Exchange rate regime Indexation and dollarization
Compatibility of exchange-rate regime and monetary goals Indexation and dollarization
Political
War risk Legitimacy of political regime Relations with international community and institutions
War Degree of political consensus Political chaos Efficiency and predictability of government action Level of policy transparency
Stability and legitimacy of political institutions Popular participation in political processes Orderliness of leadership succession Transparency in economic policy decisions and objectives Public security Geopolitical risk
Structural/ Institutional
Effectiveness of government Openness to international capital flows and trade Strength of business environment, human capital, and governance Rule of law, respect for property rights Control of corruption
Transparency Level of innovation Investment in human capital Respect for property rights
Efficiency of public sector Institutional factors, such as central bank independence Timeliness, coverage, and transparency in reporting Competitiveness and profitability of private sector
Other
Savings ratios Openness of economy to trade Commodity dependence
Earthquakes Hurricanes Speculative crises
Prosperity, diversity, and degree of market orientationIncome discrepancies Protectionism and other nonmarket influences Labor flexibility
Source: International Monetary Fund (2010b).
Table 1. Continued

214 2010 CRES Visiting Scholar’s Paper Series
country risk classifications, Korea has two main entities that are responsible for assessing country risk on behalf of Korean exporters looking to do business abroad. The first, Korea Export Import Bank (Korea ExIm Bank), was founded in 1976 as “an official export credit agency providing comprehensive export credit and guarantee programs to support Korean enterprises in conducting overseas business” (Korea ExIm Bank 2009). Korea ExIm Bank houses a country risk assessment team of approximately 20 staff who work on developing country risk assessments. In an interview with the head of country risk assessments for Korea ExIm Bank, Dr. Yang- hyeon Jo noted that one of the additional aims of the Korea ExIm Bank ratings is to provide a more refined understanding of the OECD country risk classifications, which are often heavily grouped in risk classes 6 and 7, the most risky classes. The Korea ExIm Bank country risk office works to help differentiate some of those countries in classes 6 and 7 so that the credit issuing departments of the bank have a better understanding of which countries pose the most severe risks (Jo 2010). While the bank has been conducting country risk assessments since its founding in the mid- 1970s, the public ratings have only become available in 2007. The number of countries assessed each year by Korea ExIm Bank varies: the bank assessed 82 countries in 2007 but only 57 countries in 2008.
The second rating agency responsible for country risk assessment is the Korea Trade Insurance Corporation, also known as KSure. The KSure split from the Korea ExIm Bank in 1992 to “operate export and import insurance programs for the purpose of facilitating global trade” (KSure 2009). In practice, KSure serves as an “insurer of last resort” for Korean exporters and investors looking to do business abroad by providing insurance for Korean exporters that cannot get insurance from the private market (Kyung-Chul 2010). In 2009, KSure covered 32% of total exports by Korea in fields ranging from shipbuilding to construction to consumer goods to cultural goods such as movies (KSure 2009). Given Korea’s heavy reliance on trade for raw materials, the Korea Trade Insurance Corporation also provides insurance on imports necessary for business functions such as energy and basic commodities.
The KSure country risk assessment team uses primarily the OECD country risk classifications to develop their own rankings, which are described as covering 258 countries, sometimes differing

Korean Trade and Political Risk 215
with the OECD on the basis of case-by-case modifications from additional data. KSure uses additional data sources from the IMF, World Bank, and private providers such as the three major rating agencies (Moody’s, S&P, Fitch) as well as the PRS Group, Economist Intelligence Unit, IHS Global Insight, and Oxford Analytica (Kyung- Chul 2010). A KSure representative was unwilling provide any data that might give insight into how KSure’s modifications align with external data or the Korea ExIm Bank.
Both agencies are public entities created by the Korean government to help facilitate Korea’s expanding trade presence, and both entities use financial support from the public purse to develop Korean overseas business, particularly exports.
4. Comparison of Korea ExIm Bank Rating System to International Rankings
This review of the country rating system should demonstrate that country risk rating is far from a precise science and that there are notable differences between Korea’s two export insurance organizations, KSure and the Korea ExIm Bank. In conversations with both, it does not appear that the two organizations coordinate their rating systems, and meetings on country ratings appear to occur only in the context of the OECD’s quarterly country risk review meetings.
OECD 2009
B1 B2 C1 C2 C3 D1 D2 E
2 1 1
3 1 3
4 4 4 1
5 2 3 3 1
6 2 3 12 7
7 1 6 7
Table 2. Korea ExIm Bank Country Risk Ratings, 2009
The Korea ExIm Bank system of country risk rating includes information from other rating sources such as OECD, Moody’s, S&P,
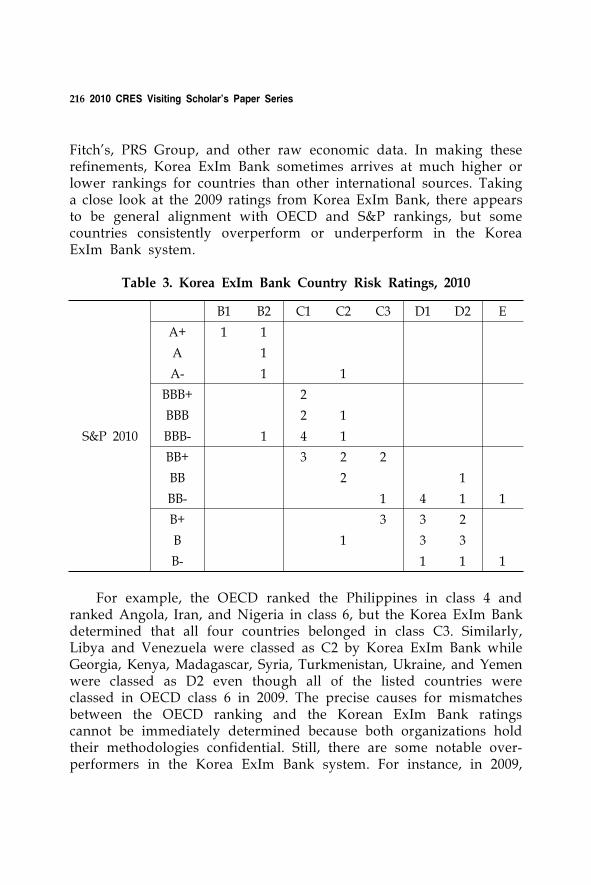
216 2010 CRES Visiting Scholar’s Paper Series
Fitch’s, PRS Group, and other raw economic data. In making these refinements, Korea ExIm Bank sometimes arrives at much higher or lower rankings for countries than other international sources. Taking a close look at the 2009 ratings from Korea ExIm Bank, there appears to be general alignment with OECD and S&P rankings, but some countries consistently overperform or underperform in the Korea ExIm Bank system.
B1 B2 C1 C2 C3 D1 D2 E
A+ 1 1
A 1
A- 1 1
BBB+ 2
BBB 2 1
S&P 2010 BBB- 1 4 1
BB+ 3 2 2
BB 2 1
BB- 1 4 1 1
B+ 3 3 2
B 1 3 3
B- 1 1 1
Table 3. Korea ExIm Bank Country Risk Ratings, 2010
For example, the OECD ranked the Philippines in class 4 and ranked Angola, Iran, and Nigeria in class 6, but the Korea ExIm Bank determined that all four countries belonged in class C3. Similarly, Libya and Venezuela were classed as C2 by Korea ExIm Bank while Georgia, Kenya, Madagascar, Syria, Turkmenistan, Ukraine, and Yemen were classed as D2 even though all of the listed countries were classed in OECD class 6 in 2009. The precise causes for mismatches between the OECD ranking and the Korean ExIm Bank ratings cannot be immediately determined because both organizations hold their methodologies confidential. Still, there are some notable over- performers in the Korea ExIm Bank system. For instance, in 2009,
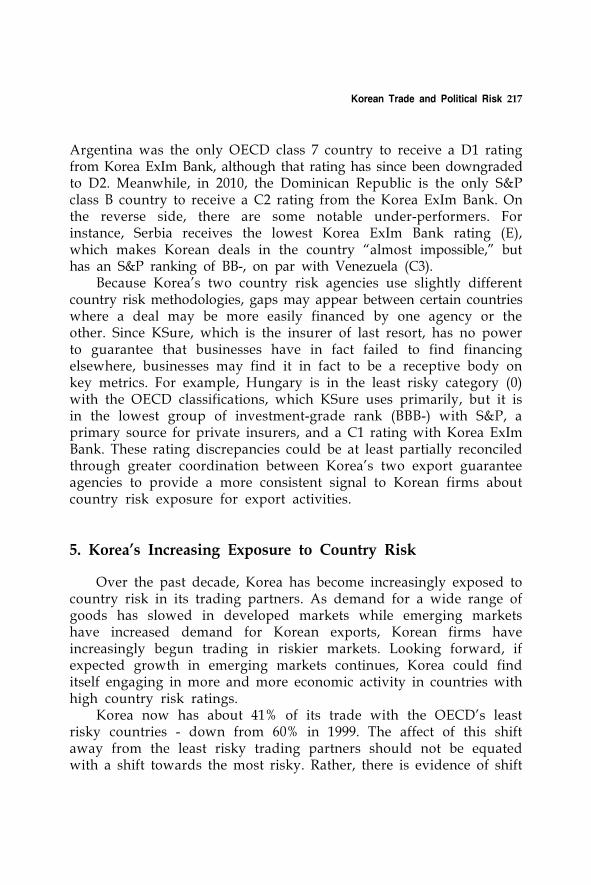
Korean Trade and Political Risk 217
Argentina was the only OECD class 7 country to receive a D1 rating from Korea ExIm Bank, although that rating has since been downgraded to D2. Meanwhile, in 2010, the Dominican Republic is the only S&P class B country to receive a C2 rating from the Korea ExIm Bank. On the reverse side, there are some notable under-performers. For instance, Serbia receives the lowest Korea ExIm Bank rating (E), which makes Korean deals in the country “almost impossible,” but has an S&P ranking of BB-, on par with Venezuela (C3).
Because Korea’s two country risk agencies use slightly different country risk methodologies, gaps may appear between certain countries where a deal may be more easily financed by one agency or the other. Since KSure, which is the insurer of last resort, has no power to guarantee that businesses have in fact failed to find financing elsewhere, businesses may find it in fact to be a receptive body on key metrics. For example, Hungary is in the least risky category (0) with the OECD classifications, which KSure uses primarily, but it is in the lowest group of investment-grade rank (BBB-) with S&P, a primary source for private insurers, and a C1 rating with Korea ExIm Bank. These rating discrepancies could be at least partially reconciled through greater coordination between Korea’s two export guarantee agencies to provide a more consistent signal to Korean firms about country risk exposure for export activities.
5. Korea’s Increasing Exposure to Country Risk
Over the past decade, Korea has become increasingly exposed to country risk in its trading partners. As demand for a wide range of goods has slowed in developed markets while emerging markets have increased demand for Korean exports, Korean firms have increasingly begun trading in riskier markets. Looking forward, if expected growth in emerging markets continues, Korea could find itself engaging in more and more economic activity in countries with high country risk ratings.
Korea now has about 41% of its trade with the OECD’s least risky countries - down from 60% in 1999. The affect of this shift away from the least risky trading partners should not be equated with a shift towards the most risky. Rather, there is evidence of shift

218 2010 CRES Visiting Scholar’s Paper Series
towards limited risk countries - those in OECD category 2 in particular.
70%
60%
50%
40%
30%
20%
10%
0%
1999 2000 2001 2002 2003 2004 2005 2006 2007 2008 2009
Least Risk C la sses (0,1 )Med ium Risk Cla sses (2)
H ighe r Risk C lasses (3,4,5)H ighe rs t Risk C lasses (6,7)
Per
cent
age
of to
tal t
rade
val
ue
Figure 3. Republic of Korea Trade Value by OECD Country Risk Class
Is this simply a China effect? China is currently scored in OECD class 2 - could it be that all the increased “risk” is simply a reflection of increased trade with China. China is clearly a significant component of the shift towards trade with more risky countries - but it is not the whole story. Excluding trade with China (mainland, Hong Kong,55) and Macao), Korea’s trade with the OECD’s least risk countries still declined from 69% to 54% of total trade value between 1999 and 2009, and most of the gains were made in medium risk countries, not the OECD’s most risky countries in classes 6 and 7. The medium-risk categories experience significant increases - from 3% of total trade value in 1999 to 20% in 2009. While a single country drove this change towards medium-risk countries, Saudi Arabia, the United Arab Emirates, Malaysia, Qatar and Mexico are all notable for increasing their share of Korea’s medium-risk trade.
Are other countries experiencing this trend? Based on a review of a set of developed and emerging markets, many countries have experienced a shift towards increasing trade with riskier markets. Still, when compared with Brazil, China, India, Japan, Germany, Russia, the United Kingdom, and the United States; Korea’s change over the past 10 years is more significant than any economy with an almost 30% drop
55) In mid-2007, the OECD re-categorized Hong Kong from class 2 to class 1 for its risk rating.
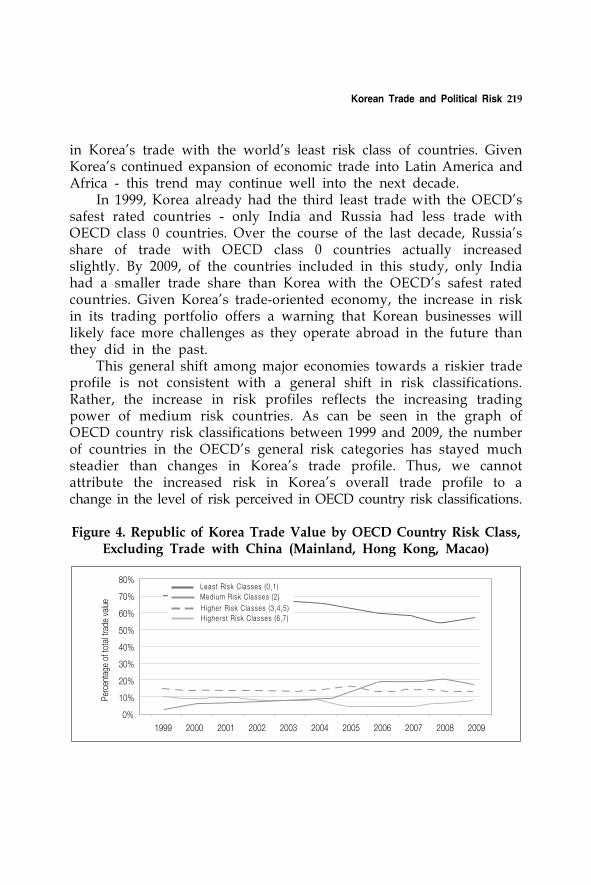
Korean Trade and Political Risk 219
in Korea’s trade with the world’s least risk class of countries. Given Korea’s continued expansion of economic trade into Latin America and Africa - this trend may continue well into the next decade.
In 1999, Korea already had the third least trade with the OECD’s safest rated countries - only India and Russia had less trade with OECD class 0 countries. Over the course of the last decade, Russia’s share of trade with OECD class 0 countries actually increased slightly. By 2009, of the countries included in this study, only India had a smaller trade share than Korea with the OECD’s safest rated countries. Given Korea’s trade-oriented economy, the increase in risk in its trading portfolio offers a warning that Korean businesses will likely face more challenges as they operate abroad in the future than they did in the past.
This general shift among major economies towards a riskier trade profile is not consistent with a general shift in risk classifications. Rather, the increase in risk profiles reflects the increasing trading power of medium risk countries. As can be seen in the graph of OECD country risk classifications between 1999 and 2009, the number of countries in the OECD’s general risk categories has stayed much steadier than changes in Korea’s trade profile. Thus, we cannot attribute the increased risk in Korea’s overall trade profile to a change in the level of risk perceived in OECD country risk classifications.
70%
80%
60%
50%
40%
30%
20%
10%
0%
1999 2000 2001 2002 2003 2004 2005 2006 2007 2008 2009
Least Risk Classes (0,1)Med ium Risk Classes (2)
H ighe r Risk Classes (3,4,5 )H ighe rs t Risk Classes (6,7)
Per
cent
age
of to
tal t
rade
val
ue
Figure 4. Republic of Korea Trade Value by OECD Country Risk Class, Excluding Trade with China (Mainland, Hong Kong, Macao)
220 2010 CRES Visiting Scholar’s Paper Series
90%
80%
70%
60%
50%
40%
30%
India Rep. ofKorea
Japan Brazil UnitedStates
RussianFedration
Indonesia China Germany UnitedKingdom
1999 2009
Figure 5. Trade with OECD Least Risky Class of Countries
70%
80%
90%
100%
60%
50%
40%
30%
20%
10%
0%
1999 2000 2001 2002 2003 2004 2005 2006 2007 2008 2009
Least R isk Classes (0 ,1 ) Medium R isk Classes (2 )
Higher R isk Classes (3 ,4 ,5 ) Higher st R isk Classes (6 ,7 )
Num
ber
of C
ount
ries
Figure 6. OECD Country Risk Classifications, 1999-2009
6. The Export-Import Risk Gap
While it is evident that Korea’s risk exposure is increasing, the increases are disproportionately falling on Korean exporting agencies. Comparing exports and imports by trade value and OECD country risk classification, the country risk exposure is greater in exports than imports.
This growing gap between the risk exposure of imports and exports suggests that country risk agencies in Korea will continue to see more business in the years ahead, particularly on export credits and trade insurance.
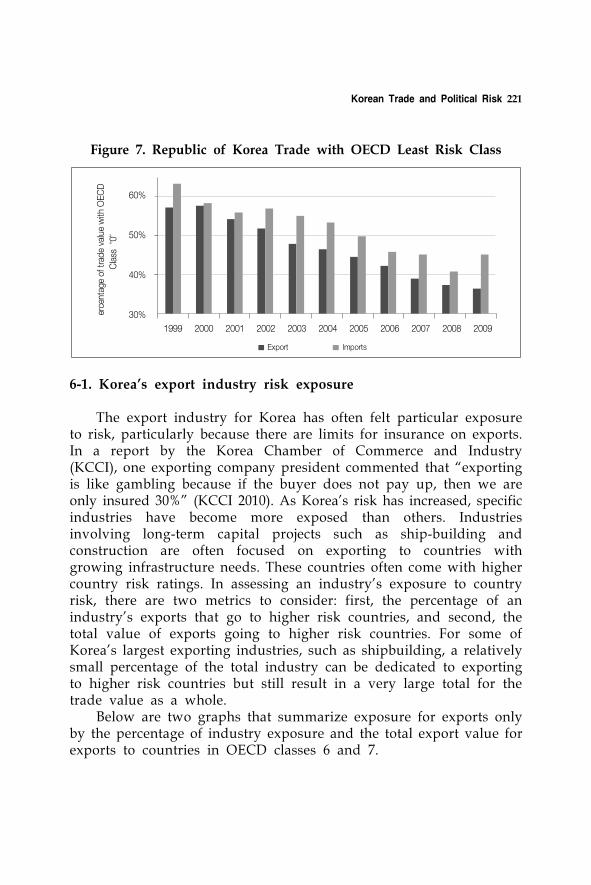
Korean Trade and Political Risk 221
60%
50%
40%
30%
1999 2000 2001 2002 2003 2004 2005 2006 2007 2008 2009
erce
ntag
e of
tra
de v
alue
with
OEC
DC
lass
“0”
Export Imports
Figure 7. Republic of Korea Trade with OECD Least Risk Class
6-1. Korea’s export industry risk exposure
The export industry for Korea has often felt particular exposure to risk, particularly because there are limits for insurance on exports. In a report by the Korea Chamber of Commerce and Industry (KCCI), one exporting company president commented that “exporting is like gambling because if the buyer does not pay up, then we are only insured 30%” (KCCI 2010). As Korea’s risk has increased, specific industries have become more exposed than others. Industries involving long-term capital projects such as ship-building and construction are often focused on exporting to countries with growing infrastructure needs. These countries often come with higher country risk ratings. In assessing an industry’s exposure to country risk, there are two metrics to consider: first, the percentage of an industry’s exports that go to higher risk countries, and second, the total value of exports going to higher risk countries. For some of Korea’s largest exporting industries, such as shipbuilding, a relatively small percentage of the total industry can be dedicated to exporting to higher risk countries but still result in a very large total for the trade value as a whole.
Below are two graphs that summarize exposure for exports only by the percentage of industry exposure and the total export value for exports to countries in OECD classes 6 and 7.
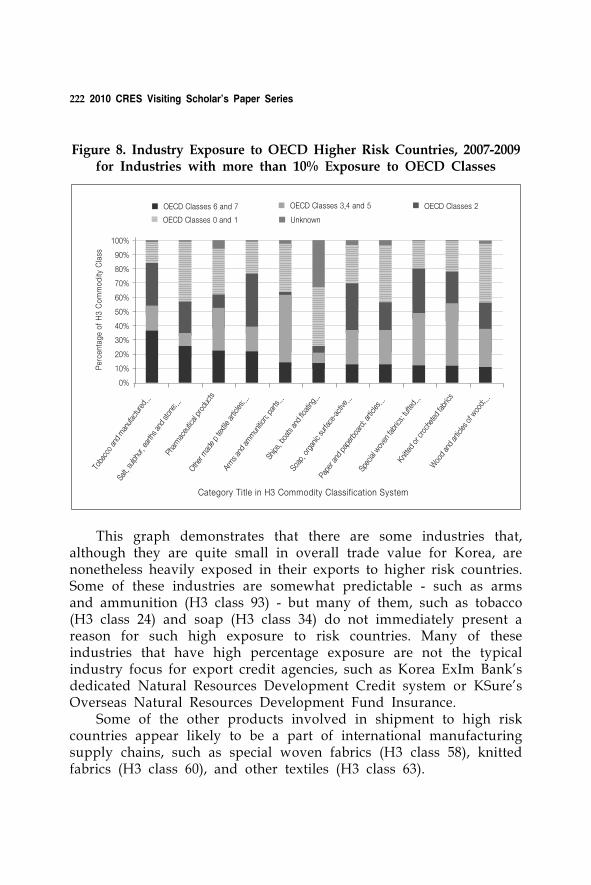
222 2010 CRES Visiting Scholar’s Paper Series P
erce
ntag
e of
H3
Com
mo
dity
Cla
ssTo
bacc
o an
d m
anuf
actu
red.
..
Salt,
sulph
ur, e
arth
s and
ston
e;...
Phar
mac
eutic
al pr
oduc
ts
Other
mad
e p
texti
le ar
ticles
;...
Arm
s and
am
mun
ition;
par
ts...
Ships
, boa
ts an
d flo
ating
...
Soap
, org
anic
surfa
ce-a
ctive
...
Pape
r and
pap
erbo
ard;
arti
cles..
.
Spec
ial w
oven
fabr
ics; t
ufte
d...
Knitte
d or
cro
chet
ed fa
brics
Woo
d an
d ar
ticles
of w
ood;
...
OECD Classes 6 and 7 OECD Classes 3,4 and 5 OECD Classes 2
UnknownOECD Classes 0 and 1
Category Title in H3 Commodity Classification System
100%
90%
80%
70%
60%
50%
40%
30%
20%
10%
0%
Figure 8. Industry Exposure to OECD Higher Risk Countries, 2007-2009 for Industries with more than 10% Exposure to OECD Classes
This graph demonstrates that there are some industries that, although they are quite small in overall trade value for Korea, are nonetheless heavily exposed in their exports to higher risk countries. Some of these industries are somewhat predictable - such as arms and ammunition (H3 class 93) - but many of them, such as tobacco (H3 class 24) and soap (H3 class 34) do not immediately present a reason for such high exposure to risk countries. Many of these industries that have high percentage exposure are not the typical industry focus for export credit agencies, such as Korea ExIm Bank’s dedicated Natural Resources Development Credit system or KSure’s Overseas Natural Resources Development Fund Insurance.
Some of the other products involved in shipment to high risk countries appear likely to be a part of international manufacturing supply chains, such as special woven fabrics (H3 class 58), knitted fabrics (H3 class 60), and other textiles (H3 class 63).
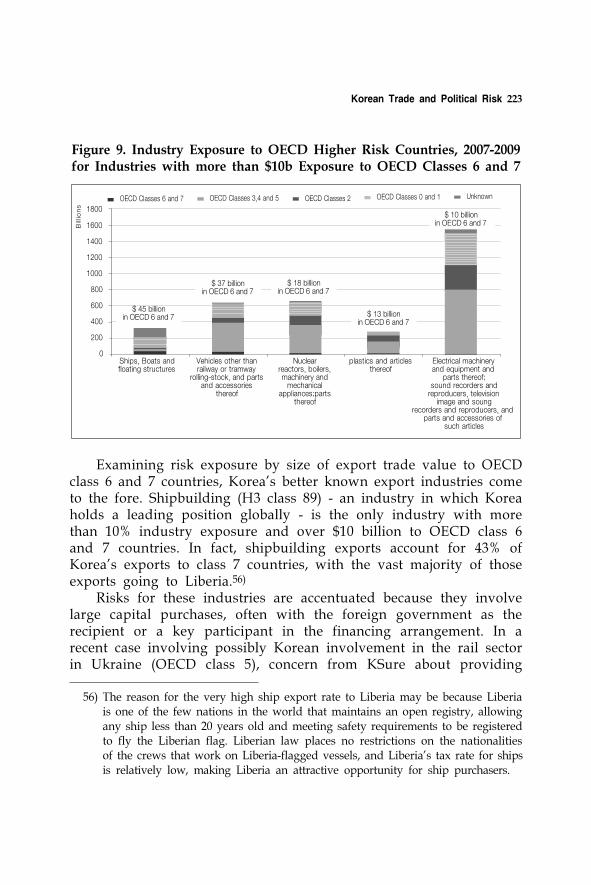
Korean Trade and Political Risk 223
Bill
ion
s
OECD Classes 6 and 7 OECD Classes 3,4 and 5 OECD Classes 2 UnknownOECD Classes 0 and 1
1800
1600
1400
1200
1000
800
600
400
200
0Ships, Boats andfloating structures
Vehicles other thanrailway or tramway
rolling-stock, and partsand accessories
thereof
Nuclearreactors, boilers,machinery and
mechanicalappliances;parts
thereof
plastics and articlesthereof
Electrical machineryand equipment and
parts thereof;sound recorders and
reproducers, televisionimage and soung
recorders and reproducers, andparts and accessories of
such articles
$ 45 billionin OECD 6 and 7
$ 37 billionin OECD 6 and 7
$ 18 billionin OECD 6 and 7
$ 13 billionin OECD 6 and 7
$ 10 billionin OECD 6 and 7
Figure 9. Industry Exposure to OECD Higher Risk Countries, 2007-2009 for Industries with more than $10b Exposure to OECD Classes 6 and 7
Examining risk exposure by size of export trade value to OECD class 6 and 7 countries, Korea’s better known export industries come to the fore. Shipbuilding (H3 class 89) - an industry in which Korea holds a leading position globally - is the only industry with more than 10% industry exposure and over $10 billion to OECD class 6 and 7 countries. In fact, shipbuilding exports account for 43% of Korea’s exports to class 7 countries, with the vast majority of those exports going to Liberia.56)
Risks for these industries are accentuated because they involve large capital purchases, often with the foreign government as the recipient or a key participant in the financing arrangement. In a recent case involving possibly Korean involvement in the rail sector in Ukraine (OECD class 5), concern from KSure about providing
56) The reason for the very high ship export rate to Liberia may be because Liberia is one of the few nations in the world that maintains an open registry, allowing any ship less than 20 years old and meeting safety requirements to be registered to fly the Liberian flag. Liberian law places no restrictions on the nationalities of the crews that work on Liberia-flagged vessels, and Liberia’s tax rate for ships is relatively low, making Liberia an attractive opportunity for ship purchasers.
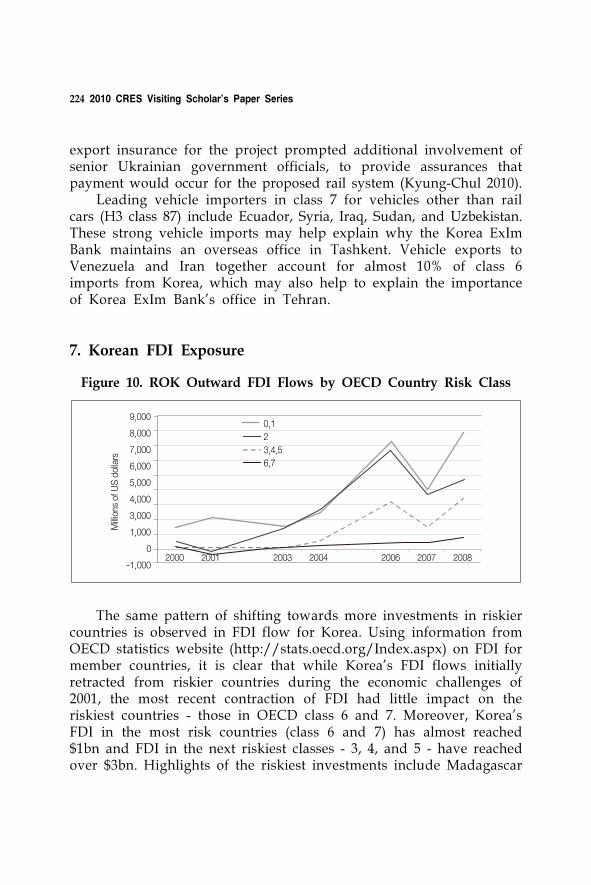
224 2010 CRES Visiting Scholar’s Paper Series
export insurance for the project prompted additional involvement of senior Ukrainian government officials, to provide assurances that payment would occur for the proposed rail system (Kyung-Chul 2010).
Leading vehicle importers in class 7 for vehicles other than rail cars (H3 class 87) include Ecuador, Syria, Iraq, Sudan, and Uzbekistan. These strong vehicle imports may help explain why the Korea ExIm Bank maintains an overseas office in Tashkent. Vehicle exports to Venezuela and Iran together account for almost 10% of class 6 imports from Korea, which may also help to explain the importance of Korea ExIm Bank’s office in Tehran.
7. Korean FDI Exposure
Millio
ns o
f US
dol
lars
9,000
8,000
7,000
6,000
5,000
4,000
3,000
1,000
0
-1,0002000 2001 2003 2004 2006 2007 2008
0,1
2
3,4,5
6,7
Figure 10. ROK Outward FDI Flows by OECD Country Risk Class
The same pattern of shifting towards more investments in riskier countries is observed in FDI flow for Korea. Using information from OECD statistics website (http://stats.oecd.org/Index.aspx) on FDI for member countries, it is clear that while Korea’s FDI flows initially retracted from riskier countries during the economic challenges of 2001, the most recent contraction of FDI had little impact on the riskiest countries - those in OECD class 6 and 7. Moreover, Korea’s FDI in the most risk countries (class 6 and 7) has almost reached $1bn and FDI in the next riskiest classes - 3, 4, and 5 - have reached over $3bn. Highlights of the riskiest investments include Madagascar
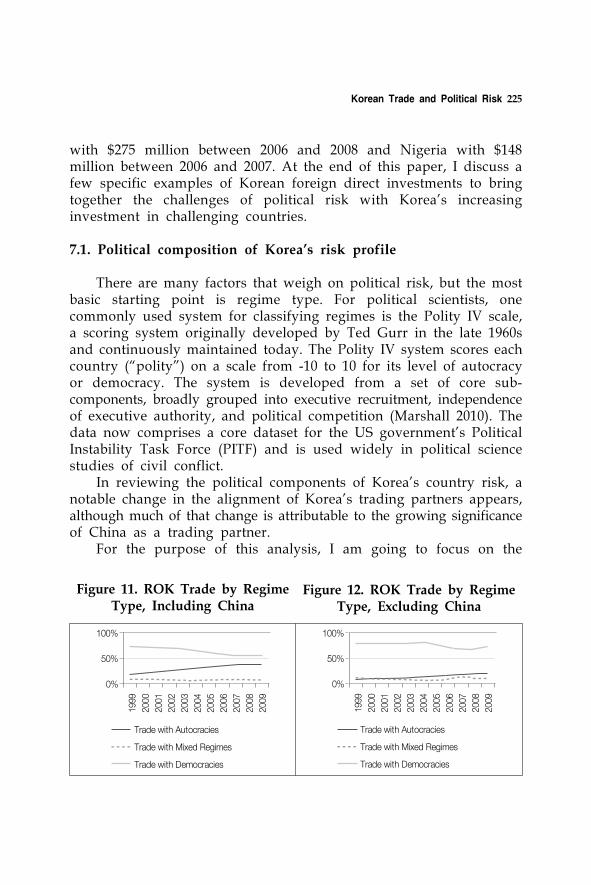
Korean Trade and Political Risk 225
Figure 11. ROK Trade by Regime Type, Including China
Figure 12. ROK Trade by Regime Type, Excluding China
100%
50%
0%
1999
2000
2001
2002
2003
2004
2005
2006
2007
2008
2009
Trade with Autocracies
Trade with Mixed Regimes
Trade with Democracies
100%
50%
0%
1999
2000
2001
2002
2003
2004
2005
2006
2007
2008
2009
Trade with Autocracies
Trade with Mixed Regimes
Trade with Democracies
with $275 million between 2006 and 2008 and Nigeria with $148 million between 2006 and 2007. At the end of this paper, I discuss a few specific examples of Korean foreign direct investments to bring together the challenges of political risk with Korea’s increasing investment in challenging countries.
7.1. Political composition of Korea’s risk profile
There are many factors that weigh on political risk, but the most basic starting point is regime type. For political scientists, one commonly used system for classifying regimes is the Polity IV scale, a scoring system originally developed by Ted Gurr in the late 1960s and continuously maintained today. The Polity IV system scores each country (“polity”) on a scale from -10 to 10 for its level of autocracy or democracy. The system is developed from a set of core sub- components, broadly grouped into executive recruitment, independence of executive authority, and political competition (Marshall 2010). The data now comprises a core dataset for the US government’s Political Instability Task Force (PITF) and is used widely in political science studies of civil conflict.
In reviewing the political components of Korea’s country risk, a notable change in the alignment of Korea’s trading partners appears, although much of that change is attributable to the growing significance of China as a trading partner.
For the purpose of this analysis, I am going to focus on the
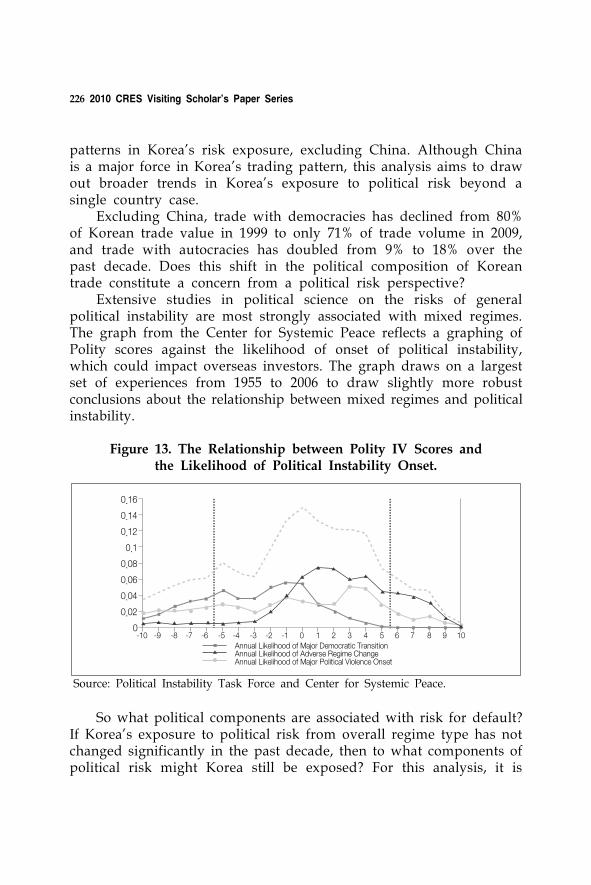
226 2010 CRES Visiting Scholar’s Paper Series
patterns in Korea’s risk exposure, excluding China. Although China is a major force in Korea’s trading pattern, this analysis aims to draw out broader trends in Korea’s exposure to political risk beyond a single country case.
Excluding China, trade with democracies has declined from 80% of Korean trade value in 1999 to only 71% of trade volume in 2009, and trade with autocracies has doubled from 9% to 18% over the past decade. Does this shift in the political composition of Korean trade constitute a concern from a political risk perspective?
Extensive studies in political science on the risks of general political instability are most strongly associated with mixed regimes. The graph from the Center for Systemic Peace reflects a graphing of Polity scores against the likelihood of onset of political instability, which could impact overseas investors. The graph draws on a largest set of experiences from 1955 to 2006 to draw slightly more robust conclusions about the relationship between mixed regimes and political instability.
0.16
0.14
0.12
0.1
0.08
0.06
0.04
0.02
0-10 -9 -8 -7 -6 -5 -4 -3 -2 -1 0 1 2 3 4 5 6 7 8 9 10
Annual Likelihood of Major Democratic TransitionAnnual Likelihood of Adverse Regime ChangeAnnual Likelihood of Major Political Violence Onset
Source: Political Instability Task Force and Center for Systemic Peace.
Figure 13. The Relationship between Polity IV Scores and the Likelihood of Political Instability Onset.
So what political components are associated with risk for default? If Korea’s exposure to political risk from overall regime type has not changed significantly in the past decade, then to what components of political risk might Korea still be exposed? For this analysis, it is
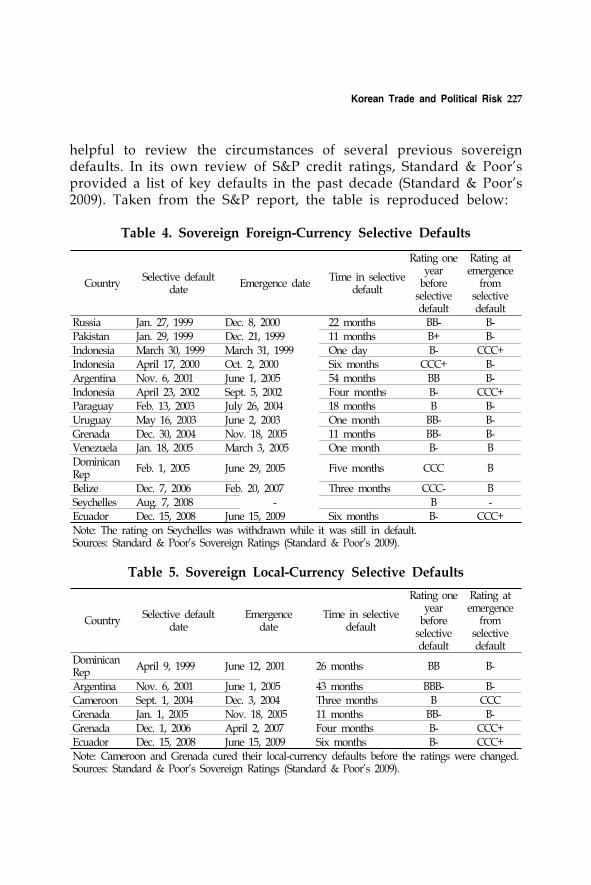
Korean Trade and Political Risk 227
helpful to review the circumstances of several previous sovereign defaults. In its own review of S&P credit ratings, Standard & Poor’s provided a list of key defaults in the past decade (Standard & Poor's 2009). Taken from the S&P report, the table is reproduced below:
CountrySelective default
dateEmergence date
Time in selective default
Rating one year
before selective default
Rating at emergence
from selective default
Russia Jan. 27, 1999 Dec. 8, 2000 22 months BB- B-Pakistan Jan. 29, 1999 Dec. 21, 1999 11 months B+ B-Indonesia March 30, 1999 March 31, 1999 One day B- CCC+Indonesia April 17, 2000 Oct. 2, 2000 Six months CCC+ B-Argentina Nov. 6, 2001 June 1, 2005 54 months BB B-Indonesia April 23, 2002 Sept. 5, 2002 Four months B- CCC+Paraguay Feb. 13, 2003 July 26, 2004 18 months B B-Uruguay May 16, 2003 June 2, 2003 One month BB- B-Grenada Dec. 30, 2004 Nov. 18, 2005 11 months BB- B-Venezuela Jan. 18, 2005 March 3, 2005 One month B- BDominican Rep
Feb. 1, 2005 June 29, 2005 Five months CCC B
Belize Dec. 7, 2006 Feb. 20, 2007 Three months CCC- BSeychelles Aug. 7, 2008 - B -Ecuador Dec. 15, 2008 June 15, 2009 Six months B- CCC+Note: The rating on Seychelles was withdrawn while it was still in default.Sources: Standard & Poor's Sovereign Ratings (Standard & Poor's 2009).
Table 5. Sovereign Local-Currency Selective Defaults
CountrySelective default
dateEmergence
dateTime in selective
default
Rating one year
before selective default
Rating at emergence
from selective default
Dominican Rep
April 9, 1999 June 12, 2001 26 months BB B-
Argentina Nov. 6, 2001 June 1, 2005 43 months BBB- B-Cameroon Sept. 1, 2004 Dec. 3, 2004 Three months B CCCGrenada Jan. 1, 2005 Nov. 18, 2005 11 months BB- B-Grenada Dec. 1, 2006 April 2, 2007 Four months B- CCC+Ecuador Dec. 15, 2008 June 15, 2009 Six months B- CCC+Note: Cameroon and Grenada cured their local-currency defaults before the ratings were changed. Sources: Standard & Poor's Sovereign Ratings (Standard & Poor's 2009).
Table 4. Sovereign Foreign-Currency Selective Defaults
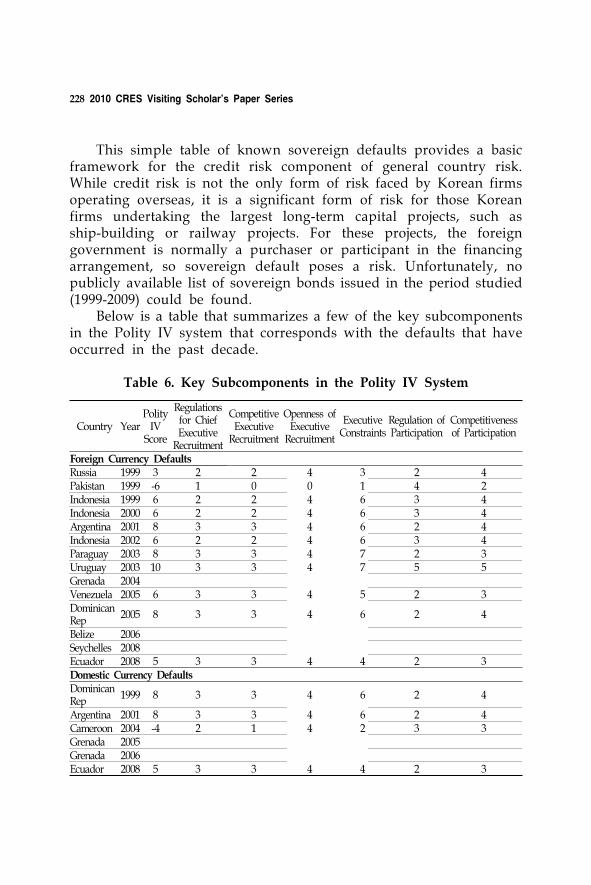
228 2010 CRES Visiting Scholar’s Paper Series
This simple table of known sovereign defaults provides a basic framework for the credit risk component of general country risk. While credit risk is not the only form of risk faced by Korean firms operating overseas, it is a significant form of risk for those Korean firms undertaking the largest long-term capital projects, such as ship-building or railway projects. For these projects, the foreign government is normally a purchaser or participant in the financing arrangement, so sovereign default poses a risk. Unfortunately, no publicly available list of sovereign bonds issued in the period studied (1999-2009) could be found.
Below is a table that summarizes a few of the key subcomponents in the Polity IV system that corresponds with the defaults that have occurred in the past decade.
Country YearPolity
IV Score
Regulations for Chief Executive
Recruitment
Competitive Executive
Recruitment
Openness of Executive
Recruitment
Executive Constraints
Regulation of Participation
Competitiveness of Participation
Foreign Currency DefaultsRussia 1999 3 2 2 4 3 2 4Pakistan 1999 -6 1 0 0 1 4 2Indonesia 1999 6 2 2 4 6 3 4Indonesia 2000 6 2 2 4 6 3 4Argentina 2001 8 3 3 4 6 2 4Indonesia 2002 6 2 2 4 6 3 4Paraguay 2003 8 3 3 4 7 2 3Uruguay 2003 10 3 3 4 7 5 5Grenada 2004Venezuela 2005 6 3 3 4 5 2 3Dominican Rep
2005 8 3 3 4 6 2 4
Belize 2006Seychelles 2008Ecuador 2008 5 3 3 4 4 2 3Domestic Currency DefaultsDominican Rep
1999 8 3 3 4 6 2 4
Argentina 2001 8 3 3 4 6 2 4Cameroon 2004 -4 2 1 4 2 3 3Grenada 2005Grenada 2006Ecuador 2008 5 3 3 4 4 2 3
Table 6. Key Subcomponents in the Polity IV System
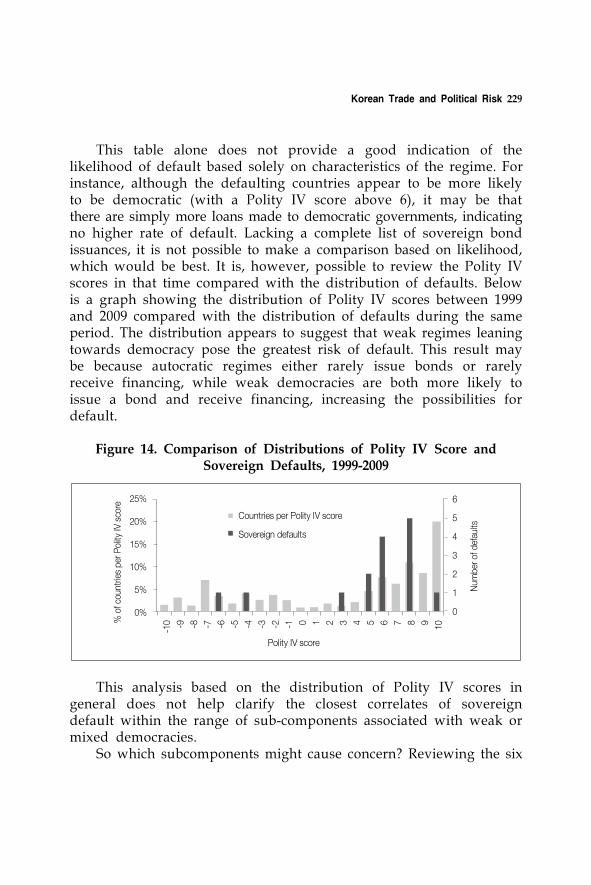
Korean Trade and Political Risk 229
This table alone does not provide a good indication of the likelihood of default based solely on characteristics of the regime. For instance, although the defaulting countries appear to be more likely to be democratic (with a Polity IV score above 6), it may be that there are simply more loans made to democratic governments, indicating no higher rate of default. Lacking a complete list of sovereign bond issuances, it is not possible to make a comparison based on likelihood, which would be best. It is, however, possible to review the Polity IV scores in that time compared with the distribution of defaults. Below is a graph showing the distribution of Polity IV scores between 1999 and 2009 compared with the distribution of defaults during the same period. The distribution appears to suggest that weak regimes leaning towards democracy pose the greatest risk of default. This result may be because autocratic regimes either rarely issue bonds or rarely receive financing, while weak democracies are both more likely to issue a bond and receive financing, increasing the possibilities for default.
% o
f cou
ntrie
s pe
r Pol
ity IV
sco
re
25%
20%
15%
10%
5%
0%
6
5
4
3
2
1
0
Polity IV score
Num
ber o
f def
aults
-10 -9 -8 -7 -6 -5 -4 -3 -2 -1 0 1 2 3 4 5 6 7 8 9 10
Countries per Polity IV score
Sovereign defaults
Figure 14. Comparison of Distributions of Polity IV Score and Sovereign Defaults, 1999-2009
This analysis based on the distribution of Polity IV scores in general does not help clarify the closest correlates of sovereign default within the range of sub-components associated with weak or mixed democracies.
So which subcomponents might cause concern? Reviewing the six
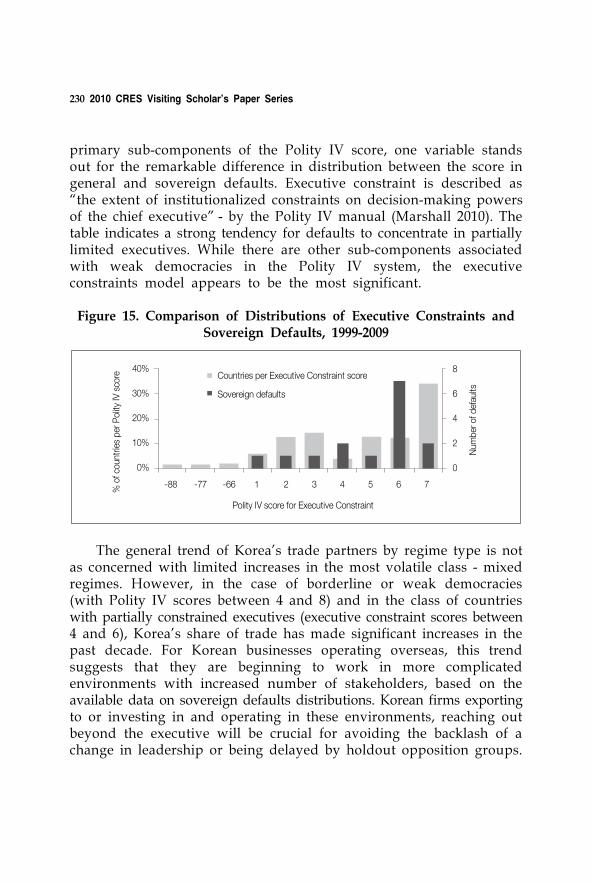
230 2010 CRES Visiting Scholar’s Paper Series
primary sub-components of the Polity IV score, one variable stands out for the remarkable difference in distribution between the score in general and sovereign defaults. Executive constraint is described as “the extent of institutionalized constraints on decision-making powers of the chief executive” - by the Polity IV manual (Marshall 2010). The table indicates a strong tendency for defaults to concentrate in partially limited executives. While there are other sub-components associated with weak democracies in the Polity IV system, the executive constraints model appears to be the most significant.
% o
f cou
ntrie
s pe
r Pol
ity IV
sco
re
40%
30%
20%
10%
0%
8
6
4
2
0
Polity IV score for Executive Constraint
Num
ber o
f def
aults
Countries per Executive Constraint score
Sovereign defaults
-88 -77 -66 1 2 3 4 5 6 7
Figure 15. Comparison of Distributions of Executive Constraints and Sovereign Defaults, 1999-2009
The general trend of Korea’s trade partners by regime type is not as concerned with limited increases in the most volatile class - mixed regimes. However, in the case of borderline or weak democracies (with Polity IV scores between 4 and 8) and in the class of countries with partially constrained executives (executive constraint scores between 4 and 6), Korea’s share of trade has made significant increases in the past decade. For Korean businesses operating overseas, this trend suggests that they are beginning to work in more complicated environments with increased number of stakeholders, based on the available data on sovereign defaults distributions. Korean firms exporting to or investing in and operating in these environments, reaching out beyond the executive will be crucial for avoiding the backlash of a change in leadership or being delayed by holdout opposition groups.
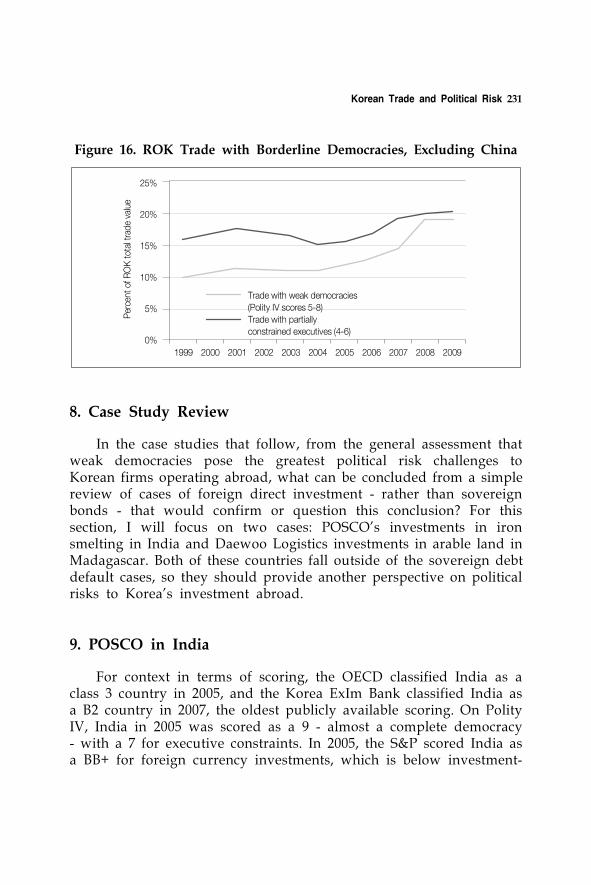
Korean Trade and Political Risk 231
Per
cent
of R
OK
tot
al tr
ade
valu
e
25%
20%
15%
10%
5%
0%1999 2000 2001 2002 2003 2004 2005 2006 2007 2008 2009
Trade with weak democracies(Polity IV scores 5-8)Trade with partiallyconstrained executives (4-6)
Figure 16. ROK Trade with Borderline Democracies, Excluding China
8. Case Study Review
In the case studies that follow, from the general assessment that weak democracies pose the greatest political risk challenges to Korean firms operating abroad, what can be concluded from a simple review of cases of foreign direct investment - rather than sovereign bonds - that would confirm or question this conclusion? For this section, I will focus on two cases: POSCO’s investments in iron smelting in India and Daewoo Logistics investments in arable land in Madagascar. Both of these countries fall outside of the sovereign debt default cases, so they should provide another perspective on political risks to Korea’s investment abroad.
9. POSCO in India
For context in terms of scoring, the OECD classified India as a class 3 country in 2005, and the Korea ExIm Bank classified India as a B2 country in 2007, the oldest publicly available scoring. On Polity IV, India in 2005 was scored as a 9 - almost a complete democracy - with a 7 for executive constraints. In 2005, the S&P scored India as a BB+ for foreign currency investments, which is below investment-
232 2010 CRES Visiting Scholar’s Paper Series
grade (“Infosys scores over India in S&P rating” 2005). These scores overall suggest moderate risk. The S&P has since increased its rating of India in 2007 to BBB-, which is the lowest level of investment- grade rating (“S&P marks up India's rating to investment grade” 2007). In 2010, the Korea ExIm Bank held its B2 rating for India, making it the highest S&P-rated country in the B2 category.
In November 2005, Soung Sik Cho, an executive vice president at POSCO, one of the world’s largest steelmakers, confidently told the Wall Street Journal, “The project in India is going smoothly. We don’t see any obstacles” (Glader 2005). Five years later, despite numerous interventions by the South Korean government, the POSCO steel project in Orissa, India - is years behind schedule and not yet operational, costing the firm millions of US dollars. POSCO was an experienced steelmaker with a long and successful track record of project completion, and newspaper articles from 2005 - when the project was announced - show little concern about challenges in completing the project.
Although the POSCO steel project is likely to be the largest foreign direct investment into India in history, with an estimated value of $12 billion, the firm could not successfully navigate the complicated political situation at the local, state, and federal level in India, according to Choong-Jae Cho, KIEP’s head for South and Southeast Asian studies (Cho 2010). Local opposition groups formed in Orissa to protest the handover of land to the Korean-based steelmaker, and on 11 May 2007, opponents of the plant briefly kidnapped three POSCO employees to reinforce their opposition to the project (Wonacott 2007). POSCO has engaged in an extensive campaign, involving both public relations and providing social services to local residents. Gee-Wong Sung, the chief POSCO executive in India in 2007, reported that he had drank tea and chewed local spices with village leaders in the area “more than 100 times” (Wonacott 2007). Nonetheless, political opposition to the project has remained strong enough to prevent the POSCO plant from becoming operational for the past five years, and construction only began recently, designed to coincide with the visit of South Korean president Lee Myung Bak’s visit to India in January 2010 for Republic Day celebrations with Indian Prime Minister Manmohan Singh. Nonetheless, while POSCO’s project is considerably delayed, it is still ahead of
Korean Trade and Political Risk 233
many other projects seeking to access that region of India, based on Cho’s recent visit to the country (Cho 2010).
In assessing the problems in India, it appears to be a case of the challenges of a partially constrained executive that had enough power to approve the agreement with POSCO to develop the land but not sufficient authority to ensure its enforcement. So, although Polity IV may score India overall as a 7, that score should be understood with caution. As the Polity IV handbook notes, as researchers coded Polity IV cases, “the most common coding discrepancies involved assigning scale values to the executive constraints variables” (Marshall 2010). According to Marshall, “Some of this ‘oscillation’ or ‘fuzziness’ can be explained by the fact that executive power often varies from year to year according to variations in political circumstances and dynamics” (Marshall 2010). The case of POSCO’s investment in India may be just such an example where the executive slipped into a riskier mixed role with enough authority to commence projects but not to ensure their completion.
For Korean firms operating abroad, and particularly in India, a takeaway point for this case may be that planning major investments will require increasing engagement outside of government sources - both to collect assessments independent of Korean government sources and to ensure that relevant state officials and civil society members are also willing to support major investments.
10. Daewoo Logistics in Madagascar
Following the food crisis in 2007-2008 that caused South Korea to use some of its grain reserves to maintain stable prices while reports surfaced of shortages of noodles in Seoul supermarkets, South Korea began looking to expand its supply of arable land, particularly for staple crops other than rice (Goodspeed 2008). The priority given to accessing more arable land from outside Korea has led to the acquisition of 690,000 hectares in Sudan for wheat production and the widely-publicized effort by Daewoo Logistics to lease 1.3 million hectares of arable land in Madagascar for 99 years, equivalent to half of the island country’s arable land (“South Korea's Daewoo unsure of Madagascar deal” 2008; Outsourcing's third wave: buying farmland
234 2010 CRES Visiting Scholar’s Paper Series
abroad” 2009). The Daewoo case, which cost the firm millions of US dollars when the deal collapsed and helped fuel an overthrow of the government in Antananarivo (“Daewoo Logistics to lose millions after Madagascar coup” 2008). Korean investment in overseas agricultural resources is likely to continue, continuing risks that investments in agriculture, traditionally a very nationalistic industry, will continue to raise political risks for Korean investors abroad.
The Daewoo Logistics circumstance is similar to that in India. Not only did the government of Madagascar change hands, but it did so in part because of the proposed Daewoo Logistics agreement. This example also demonstrates the nature of a constrained executive where it appears that Daewoo Logistics conducted limited outreach beyond the executive.
11. Conclusions
Korea’s risk profile in its trade and investment profiles has increased notably over the past decade. While there are certainly financial explanations for the increasing risk, one of the political risk components of the risk is doing business with constrained executives in weak democracies. These political situations have the potential to put Korean firms in a challenging position of getting agreement from foreign governments for trade and foreign direct investment but find challenges executing the deal because of opposition from either governing political forces outside the executive, such as state and local officials, or non-governmental members of civil society.
From this review of the increasing risk in Korea’s trade profile suggests that there are several key areas for Korean agencies and businesses to focus on:
Increase engagement outside of government sources○ Korean investments abroad have encountered political
challenges when they have faced opposition from outside the foreign country’s government. In some cases, this opposition appears that it may have been foreseeable, or, at the very least, broadening the scope of engagement prior to a major investment to include sources outside of the government could help protect Korean investors from political turmoil,
Korean Trade and Political Risk 235
particularly in weak democracies.○ Potential strategies for increasing Korean businesses’
understanding of emerging markets would be to continue support field visits and trade missions that include representatives from both large Korean conglomerates, who can more easily enter risky markets, and small-to-medium size enterprises, who often struggle to get reliable information about emerging market opportunities. In a survey conducted by the Korean Chamber of Commerce and Industry (KCCI), 50% of small and medium size enterprises reported that “'foreign marketing support such as exhibitions and business delegation for market development” was the most effective government support policy for their entrance into emerging markets (KCCI 2010). These trips, some of which have already occurred, should be sure to include meetings with figures outside of government - including academics, civil society leaders, journalists, and other stakeholders to help gain a better understanding of potential risks and opposition to Korean investment.
○ Another option for increasing information sharing in emerging markets would be to foster the establishment of Korean Chambers of Commerce for businesses working in specific countries. For example, a starting point could be to establish these associations in countries where Korea has a free trade agreement, such as Chile and Peru, to help Korean businesses share information in these countries.
Continue expansion of KSure and Korea ExIm Bank’s overseas offices○ Based on the data collected, exports are likely to experience
a higher exposure to country risk than imports, although both are increasing. As Korean businesses continue to expand, both agencies will need in-depth information on overseas markets, particularly on the issue of exports.
○ KSure currently has 13 overseas offices, including Beijing, Shanghai, New Delhi, Moscow, Sao Paulo, Dubai, Jakarta, and Ho Chi Minh City. KSure’s fourteenth office is planned for South Africa next year. Korea ExIm Bank has 17 overseas offices, including most of KSure’s locations as well as
236 2010 CRES Visiting Scholar’s Paper Series
Tehran, Tashkent, Mexico City, Washington DC and Hong Kong.
○ Continued expansion of the network of overseas offices, particularly to Latin America outside of Brazil and West Africa, both areas with increasing trade for Korea and weak democracies with partially constrained executives.57) In particular, Liberia in West Africa appears to be an export destination for much of Korea’s ship-building industry and Nigeria, home to roughly one-sixth of Africa’s population, is also a growing trade partner for natural resources.
Harmonize KSure and Korea ExIm Bank ratings and increase sharing of information○ The two major Korean rating agencies - Ksure and Korea
ExIm Bank - have little coordination in their country risk rating structures and occasionally rely on different interpretations of key countries. While KSure relies primarily on OECD country risk classifications, Korea ExIm Bank uses those classifications as a starting point for developing its own country risk ratings, which sometimes diverge significantly from the OECD classifications. For the sake of efficiency and providing a consistent signal to Korean investors abroad, KSure and Korea ExIm Bank may want to coordinate their country risk ratings.
○ Korea ExIm Bank and KSure representatives overseas may also find it useful to coordinate their activities more often to assure a more consistent business message to Korean investors.
References
Beers, David, and Marie Cavanaugh. 2010. Sovereigns: Sovereign Credit Ratings: A Primer. Standard & Poors 2008 [cited 18 November 2010]. Available from http://www.standardandpoors.com/prot/ratings/ articles/en/us/?assetID=1245199876050.
Cho, Choong-Jae. 2010. Interview. Seoul, 12 November.
57) KSure recently moved its office from Santiago, Chile to Panama.
Korean Trade and Political Risk 237
“Daewoo Logistics to Lose Millions after Madagascar Coup.” 2008. Yonhap English News. (March 19)
Financial Times. 2008. “South Korea's Daewoo unsure of Madagascar Deal.” (December 5)
Fitch Ratings. 2010. Sovereign Rating Methodology. Fitch Ratings 2010 [cited 18 November 2010]. Available from www.fitchratings. com/creditdesk/reports/report_frame.cfm?rpt_id=547765.
Friedman, Thomas. 1995. “Don't Mess With Moody's.” New York Times. (February 22)
Glader, Paul. 2005. “POSCO Aims to Expand beyond South Korea.” Wall Street Journal. (November 1)
Goodspeed, Peter. 2008. “Food crisis being felt around the world.” National Post (Canada). (April 2).
International Monetary Fund. 2010a. “Chapter 3: The Uses and Abuses of Sovereign Credit Ratings.” Global Financial Stability Report: Sovereigns, Funding, and Systemic Liquidity. Washington DC: International Monetary Fund.
. 2010b. “Global Financial Stability Report: Sovereigns, Funding, and Systemic Liquidity.” Washington DC: International Monetary Fund.
Jo, Yang-hyeon. 2010. Interview. Seoul. (November 16)KCCI. 2010. Report on the Realities of the SMEs Entry into the Foreign
Market and its Policy Tasks. Korea Chamber of Commerce and Industry, 3 August 2010 [cited 18 November 2010]. Available from http://webdb02.korcham.net/korchamnetEng/bbs/files/reports/ Report%20on%20the%20Realities%20of%20the%20SMEs%20Entry%20into%20the%20Foreign%20Market%20and%20its%20Policy%20Tasks.doc.
Kim, Kyung-Chul. 2010. Interview. Seoul. (November 15)Klein, Alec. 2004. “Credit Raters Exert International Influence.” Washington
Post. (November 23)Korea ExIm Bank. 2010. Overview. Korea ExIm Bank 2009 [cited 18
November 2010]. Available from http://www.koreaexim.go.kr/ en2/01_exim/01_exim/01.jsp.
KSure. 2010. Profile of K-sure. Korea Trade Insurance Corporate 2009 [cited 18 November 2010]. Available from http://www.ksure. or.kr/english/jsp/about/about_01_02.jsp.
Marshall, Monty. 2010. “Polity IV Project: Dataset Users’ Manual.”
238 2010 CRES Visiting Scholar’s Paper Series
Center for Systemic Peace.Moody’s Investors Service. 2010. Sovereign Bond Ratings. Moody’s
Investors Service 2008 [cited 18 November 2010]. Available from http://v3.moodys.com/viewresearchdoc.aspx?docid=PBC_ 109490.
OECD. 2010a. Country Risk Classifications of the Participants to the Arrangement on Officially Supported Export Credits. OECD, 22 October 2010a [cited 18 November 2010]. Available from http://www.oecd.org/dataoecd/47/29/3782900.pdf.
. 2010b. International Trade in Goods and Services. OECD Publishing 2010b [cited 18 November 2010]. Available from http://dx.doi.org/10.1787/824333188522.
Standard & Poor's. 2010. Sovereign Defaults And Rating Transition Data, 2009 Update. Standard & Poor's, 17 March 2009 [cited 18 November 2010]. Available from http://www2.standardandpoors. com/spf/pdf/fixedincome/SovereignDefaultsAndRatingTransitionData2009Update.pdf.
. 2010. Sovereigns Ratings List. Standard & Poor's Financial Services LLC 2010 [cited 18 November 2010]. Available from http://www.standardandpoors.com/ratings/sovereigns/ratings-list/en/us/?sectorName=null&subSectorCode=.
The Economist. 2009. “Outsourcing's Third Wave: Buying Farmland Abroad.” The Economist. (May 21)
The Hindu Business Line. 2005. “Infosys Scores over India in S&P Rating.” The Hindu Business Line. (April 4)
. 2007. “S&P Marks up India's Rating to Investment Grade.” (January 30)
Wonacott, Peter. 2007. “In India, Clashes Erupt as Industry Expands - South Korea's POSCO Wants Farmers to Move.” Wall Street Journal. (May 21)
Research on Exit and Transformation of
China’s Economical Stimulus Policies in
the Post-Crisis Era
Du Feilun
1. Introduction
After the international financial crisis of 2008, the international economic situation deteriorated sharply, with great impact and influence on China’s real economy. Faced with the possibility of economic recession, investment and consumption fell sharply, and unemployment increased dramatically. The Chinese government enacted a proactive fiscal policy, a loose monetary policy, as well as initiating massive stimulus measures to maintain stable economic growth. Expanding domestic demand by increasing financial investments, tax breaks and credit loans on the one hand; while increasing effective market supply through the implementation of industrial revitalization plans on the other. Meanwhile, the government introduced a series of strong policies in support, such as expanding consumption and maintaining steady growth of foreign trade indices to promote rapid economic recovery.
The proactive fiscal policy and the loose monetary policy have promoted rapid macroeconomic recovery, and their effect was remarkable. But the stimulus plan is, after all, a temporary anti-crisis policy and an “unconventional” macro-control behavior. It also brought many worries such as financial risk, inflation expectations, and asset bubbles. In order to avoid the stimulus policies exerting a negative influence on economical development in long term, it must be exited and transformed. So the paper mainly discusses how to exit and change the macroeconomic stimulus policies in the post-financial-area.
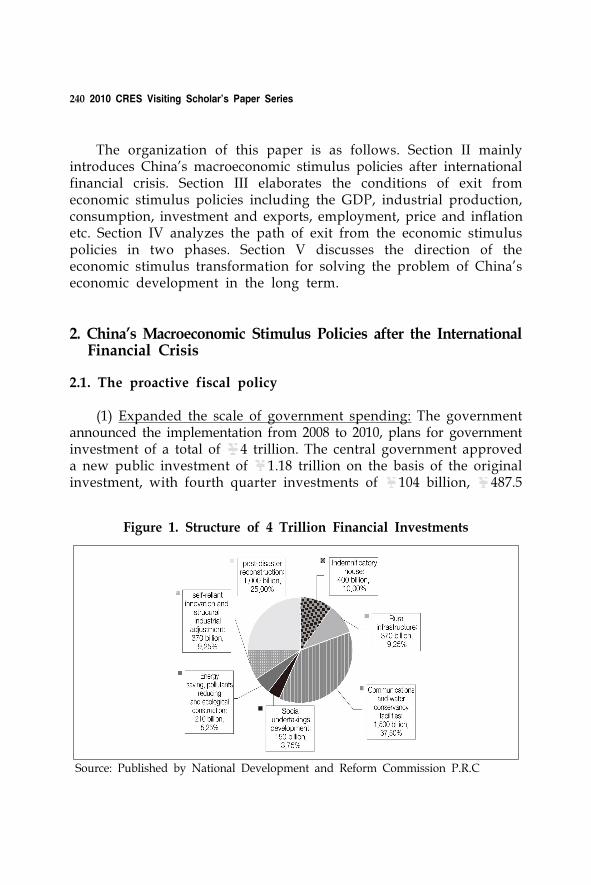
240 2010 CRES Visiting Scholar’s Paper Series
Source: Published by National Development and Reform Commission P.R.C
Figure 1. Structure of 4 Trillion Financial Investments
The organization of this paper is as follows. Section II mainly introduces China’s macroeconomic stimulus policies after international financial crisis. Section III elaborates the conditions of exit from economic stimulus policies including the GDP, industrial production, consumption, investment and exports, employment, price and inflation etc. Section IV analyzes the path of exit from the economic stimulus policies in two phases. Section V discusses the direction of the economic stimulus transformation for solving the problem of China’s economic development in the long term.
2. China’s Macroeconomic Stimulus Policies after the International Financial Crisis
2.1. The proactive fiscal policy
(1) Expanded the scale of government spending: The government announced the implementation from 2008 to 2010, plans for government investment of a total of ¥4 trillion. The central government approved a new public investment of ¥1.18 trillion on the basis of the original investment, with fourth quarter investments of ¥104 billion, ¥487.5
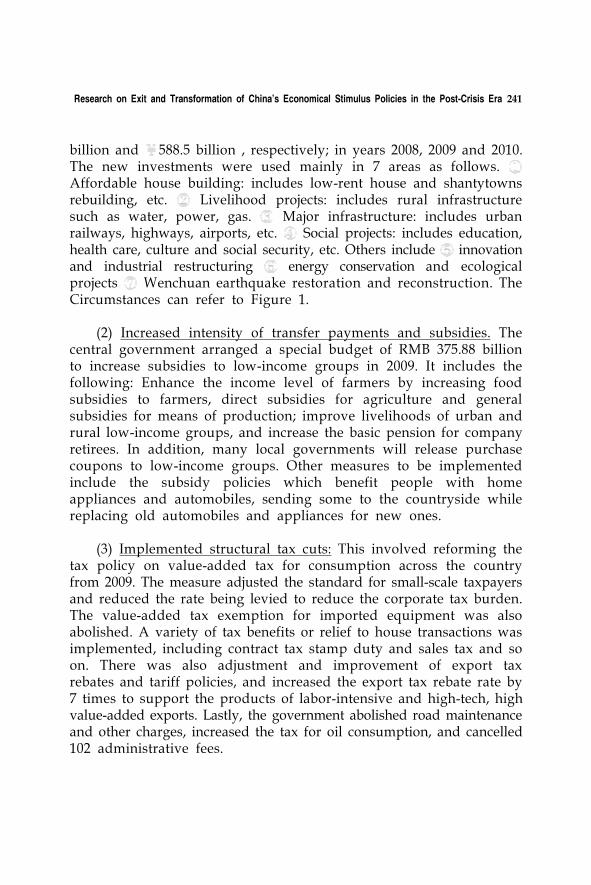
Research on Exit and Transformation of China’s Economical Stimulus Policies in the Post-Crisis Era 241
billion and ¥588.5 billion , respectively; in years 2008, 2009 and 2010. The new investments were used mainly in 7 areas as follows. ① Affordable house building: includes low-rent house and shantytowns rebuilding, etc. ② Livelihood projects: includes rural infrastructure such as water, power, gas. ③ Major infrastructure: includes urban railways, highways, airports, etc. ④ Social projects: includes education, health care, culture and social security, etc. Others include ⑤ innovation and industrial restructuring ⑥ energy conservation and ecological projects ⑦ Wenchuan earthquake restoration and reconstruction. The Circumstances can refer to Figure 1.
(2) Increased intensity of transfer payments and subsidies. The central government arranged a special budget of RMB 375.88 billion to increase subsidies to low-income groups in 2009. It includes the following: Enhance the income level of farmers by increasing food subsidies to farmers, direct subsidies for agriculture and general subsidies for means of production; improve livelihoods of urban and rural low-income groups, and increase the basic pension for company retirees. In addition, many local governments will release purchase coupons to low-income groups. Other measures to be implemented include the subsidy policies which benefit people with home appliances and automobiles, sending some to the countryside while replacing old automobiles and appliances for new ones.
(3) Implemented structural tax cuts: This involved reforming the tax policy on value-added tax for consumption across the country from 2009. The measure adjusted the standard for small-scale taxpayers and reduced the rate being levied to reduce the corporate tax burden. The value-added tax exemption for imported equipment was also abolished. A variety of tax benefits or relief to house transactions was implemented, including contract tax stamp duty and sales tax and so on. There was also adjustment and improvement of export tax rebates and tariff policies, and increased the export tax rebate rate by 7 times to support the products of labor-intensive and high-tech, high value-added exports. Lastly, the government abolished road maintenance and other charges, increased the tax for oil consumption, and cancelled 102 administrative fees.
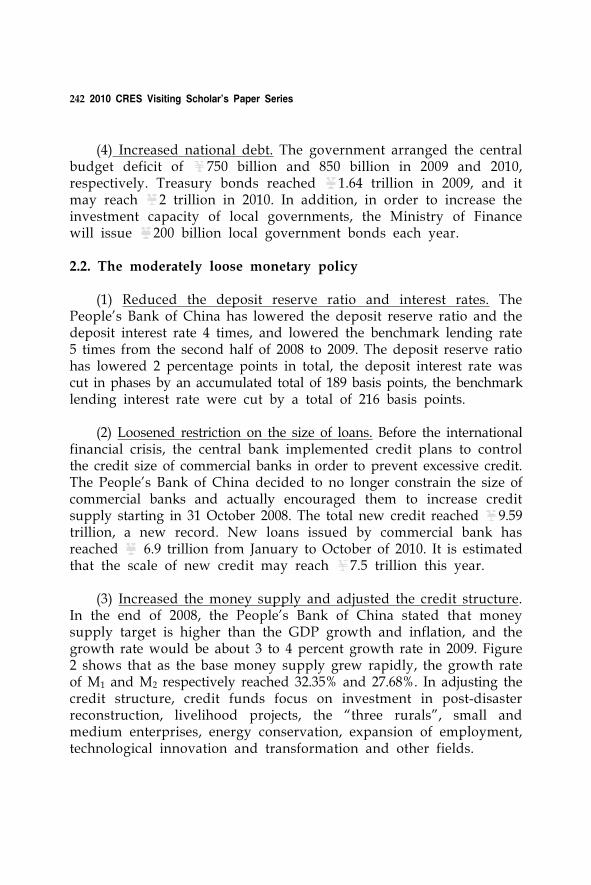
242 2010 CRES Visiting Scholar’s Paper Series
(4) Increased national debt. The government arranged the central budget deficit of ¥750 billion and 850 billion in 2009 and 2010, respectively. Treasury bonds reached ¥1.64 trillion in 2009, and it may reach ¥2 trillion in 2010. In addition, in order to increase the investment capacity of local governments, the Ministry of Finance will issue ¥200 billion local government bonds each year.
2.2. The moderately loose monetary policy
(1) Reduced the deposit reserve ratio and interest rates. The People's Bank of China has lowered the deposit reserve ratio and the deposit interest rate 4 times, and lowered the benchmark lending rate 5 times from the second half of 2008 to 2009. The deposit reserve ratio has lowered 2 percentage points in total, the deposit interest rate was cut in phases by an accumulated total of 189 basis points, the benchmark lending interest rate were cut by a total of 216 basis points.
(2) Loosened restriction on the size of loans. Before the international financial crisis, the central bank implemented credit plans to control the credit size of commercial banks in order to prevent excessive credit. The People’s Bank of China decided to no longer constrain the size of commercial banks and actually encouraged them to increase credit supply starting in 31 October 2008. The total new credit reached ¥9.59 trillion, a new record. New loans issued by commercial bank has reached ¥ 6.9 trillion from January to October of 2010. It is estimated that the scale of new credit may reach ¥7.5 trillion this year.
(3) Increased the money supply and adjusted the credit structure. In the end of 2008, the People's Bank of China stated that money supply target is higher than the GDP growth and inflation, and the growth rate would be about 3 to 4 percent growth rate in 2009. Figure 2 shows that as the base money supply grew rapidly, the growth rate of M1 and M2 respectively reached 32.35% and 27.68%. In adjusting the credit structure, credit funds focus on investment in post-disaster reconstruction, livelihood projects, the “three rurals”, small and medium enterprises, energy conservation, expansion of employment, technological innovation and transformation and other fields.
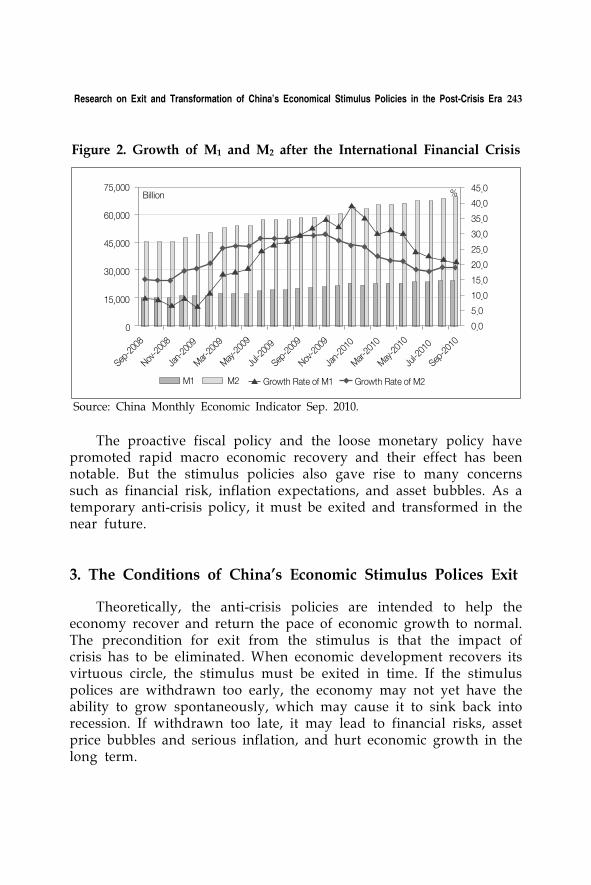
Research on Exit and Transformation of China’s Economical Stimulus Policies in the Post-Crisis Era 243
75,000
60,000
45,000
30,000
15,000
0
Billion % 45.0
40.0
35.0
30.0
25.0
20.0
15.0
10.0
5.0
0.0
Sep-
2008
Nov-2
008
Jan-
2009
Mar-
2009
May
-200
9
Jul-2
009
Sep-
2009
Jan-
2010
Mar-
2010
May
-201
0
Jul-2
010
Sep-
2010
Nov-2
009
M1 M2 Growth Rate of M1 Growth Rate of M2
Source: China Monthly Economic Indicator Sep. 2010.
Figure 2. Growth of M1 and M2 after the International Financial Crisis
The proactive fiscal policy and the loose monetary policy have promoted rapid macro economic recovery and their effect has been notable. But the stimulus policies also gave rise to many concerns such as financial risk, inflation expectations, and asset bubbles. As a temporary anti-crisis policy, it must be exited and transformed in the near future.
3. The Conditions of China’s Economic Stimulus Polices Exit
Theoretically, the anti-crisis policies are intended to help the economy recover and return the pace of economic growth to normal. The precondition for exit from the stimulus is that the impact of crisis has to be eliminated. When economic development recovers its virtuous circle, the stimulus must be exited in time. If the stimulus polices are withdrawn too early, the economy may not yet have the ability to grow spontaneously, which may cause it to sink back into recession. If withdrawn too late, it may lead to financial risks, asset price bubbles and serious inflation, and hurt economic growth in the long term.
244 2010 CRES Visiting Scholar’s Paper Series
21
17
13
9
5
1
-3
Mar
-200
0
Sep
-200
0
Mar
-200
1
Sep
-200
1
Mar
-200
2
Sep
-200
2
Mar
-200
3
Sep
-200
3
Mar
-200
4
Sep
-200
4
Mar
-200
5
Sep
-200
5
Mar
-200
6
Sep
-200
6
Mar
-200
7
Sep
-200
7
Mar
-200
8
Sep
-200
8
Mar
-200
9
Sep
-200
9
Mar
-201
0
Sep
-201
0
%
GDP Add-value of Industry
Source: Calculated on the basis of CEIC data.
Figure 3. Growth Rate of GDP and Add-Value of Industry (2000-2008)
Viewing the current situation as a whole; the GDP indices, consumption, investment and exports, and employment indicate that China's economic operation is currently changing for the better and the basic conditions of stimulus exit gradually have been met.
3.1. Industrial production rebound rapidly, economic growth recover to potential level
China’s industrial production declined rapidly, and industrial added value dropped significantly after the financial crisis. Industrial output slowed to 5.1% in January 2009, the lowest level in 10 years. But with the gradual recovery of industrial inventory beginning in the second quarter of 2009, the housing and auto markets of heated up, providing a pull for iron and steel, and building materials and home appliances industry also recorded substantial growth; industrial production recovered rapidly as a result. Figure 3 shows that the growth rate of industrial added value reached a high of 19.6%. Although industrial growth has declined, the amount of new orders to continue the growth in manufacturing is still significant, and rapid growth of industrial production is expected to be maintained.
Because of the relatively stable long-term relationship between industrial value added and GDP, rapid rise in industrial production will cause economic growth to pick up. China’s GDP has achieved a
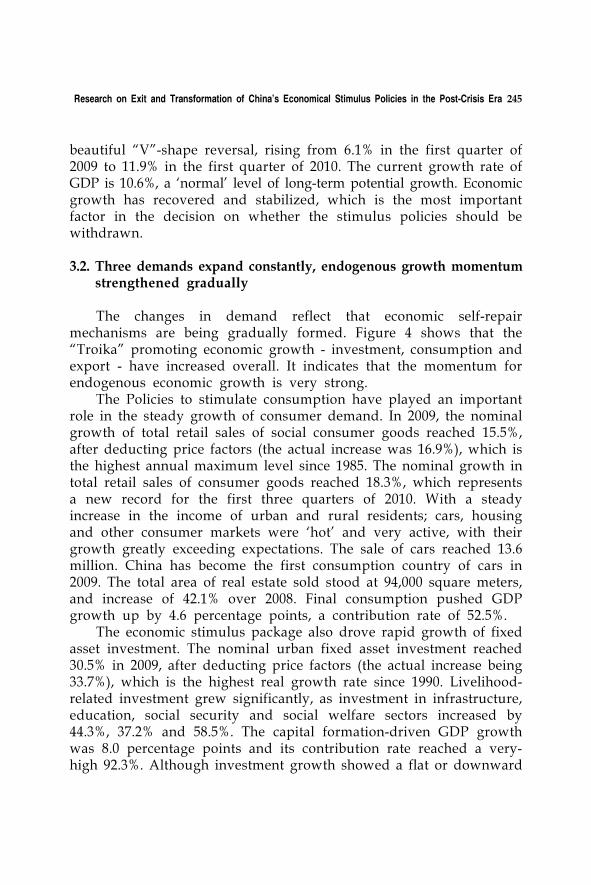
Research on Exit and Transformation of China’s Economical Stimulus Policies in the Post-Crisis Era 245
beautiful “V”-shape reversal, rising from 6.1% in the first quarter of 2009 to 11.9% in the first quarter of 2010. The current growth rate of GDP is 10.6%, a ‘normal’ level of long-term potential growth. Economic growth has recovered and stabilized, which is the most important factor in the decision on whether the stimulus policies should be withdrawn.
3.2. Three demands expand constantly, endogenous growth momentum strengthened gradually
The changes in demand reflect that economic self-repair mechanisms are being gradually formed. Figure 4 shows that the “Troika” promoting economic growth - investment, consumption and export - have increased overall. It indicates that the momentum for endogenous economic growth is very strong.
The Policies to stimulate consumption have played an important role in the steady growth of consumer demand. In 2009, the nominal growth of total retail sales of social consumer goods reached 15.5%, after deducting price factors (the actual increase was 16.9%), which is the highest annual maximum level since 1985. The nominal growth in total retail sales of consumer goods reached 18.3%, which represents a new record for the first three quarters of 2010. With a steady increase in the income of urban and rural residents; cars, housing and other consumer markets were ‘hot’ and very active, with their growth greatly exceeding expectations. The sale of cars reached 13.6 million. China has become the first consumption country of cars in 2009. The total area of real estate sold stood at 94,000 square meters, and increase of 42.1% over 2008. Final consumption pushed GDP growth up by 4.6 percentage points, a contribution rate of 52.5%.
The economic stimulus package also drove rapid growth of fixed asset investment. The nominal urban fixed asset investment reached 30.5% in 2009, after deducting price factors (the actual increase being 33.7%), which is the highest real growth rate since 1990. Livelihood- related investment grew significantly, as investment in infrastructure, education, social security and social welfare sectors increased by 44.3%, 37.2% and 58.5%. The capital formation-driven GDP growth was 8.0 percentage points and its contribution rate reached a very- high 92.3%. Although investment growth showed a flat or downward

246 2010 CRES Visiting Scholar’s Paper Series
trend in 2010, the investment growth does not appear to be experiencing a sharp drop because there are a large number of investments pending in new projects construction.
80
60
40
20
0
-20
-40
2008
01
2008
02
2008
03
2008
04
2009
01
2009
02
2009
03
2010
01
2010
02
2010
03
2009
04
%
Consumption ImportInvestment Export
Source: Calculated on the basis of CEIC data.
Figure 4. Growth Rate of Consumption, Investment, Export and Import from First Quarter of 2008 to the Third Quarter of 2010
After more than a year of negative growth, import and export has become the most active factor in promoting economic growth in 2010. China's exports rebounded rapidly, and the rate of export growth rate reached 34% in the first three quarters of 2010, the highest level in recent years. Enterprises have many export order pending at present, delivery value of industrial exports continues to rise, and the prospect of export growth is good. Import growth has returned to positive from November 2009 and reached 64.6% in the first quarter of 2010, which is the highest recorded ever. Although growth in imports has declined, it was still 42.4% through the first three quarters of 2010, still a high rate growth in recent years.
3.3. Private investment grow steadily, market driving force enhance constantly
Government investment constitutes the core of China’s stimulus
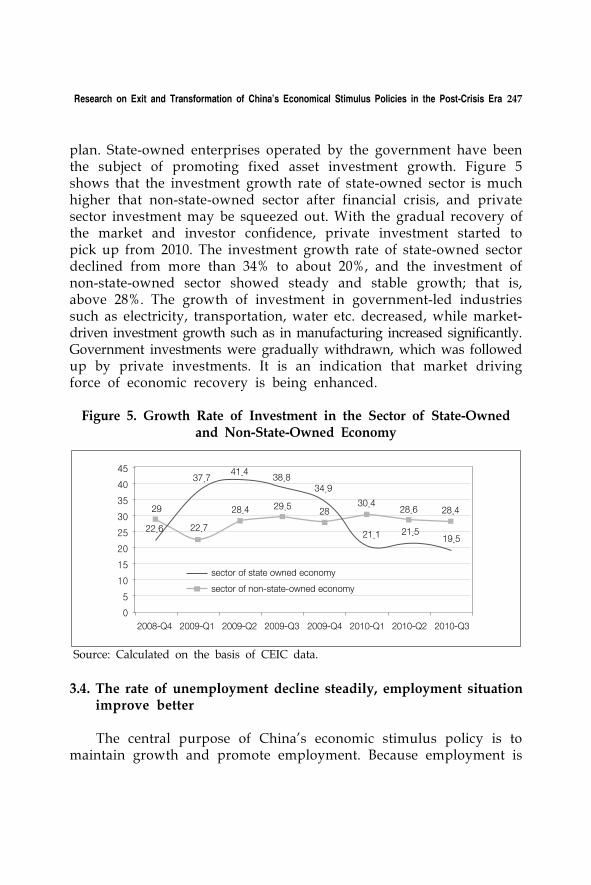
Research on Exit and Transformation of China’s Economical Stimulus Policies in the Post-Crisis Era 247
plan. State-owned enterprises operated by the government have been the subject of promoting fixed asset investment growth. Figure 5 shows that the investment growth rate of state-owned sector is much higher that non-state-owned sector after financial crisis, and private sector investment may be squeezed out. With the gradual recovery of the market and investor confidence, private investment started to pick up from 2010. The investment growth rate of state-owned sector declined from more than 34% to about 20%, and the investment of non-state-owned sector showed steady and stable growth; that is, above 28%. The growth of investment in government-led industries such as electricity, transportation, water etc. decreased, while market- driven investment growth such as in manufacturing increased significantly. Government investments were gradually withdrawn, which was followed up by private investments. It is an indication that market driving force of economic recovery is being enhanced.
45
40
35
30
25
20
15
10
5
0
2008-Q4 2009-Q1 2009-Q2 2009-Q3 2010-Q2 2010-Q32009-Q4 2010-Q1
sector of state owned economy
sector of non-state-owned economy
29
22.6 22.7
28.4 29.528
21.1 21.519.5
37.741.4
38.834.9
30.428.6 28.4
Source: Calculated on the basis of CEIC data.
Figure 5. Growth Rate of Investment in the Sector of State-Owned and Non-State-Owned Economy
3.4. The rate of unemployment decline steadily, employment situation improve better
The central purpose of China’s economic stimulus policy is to maintain growth and promote employment. Because employment is
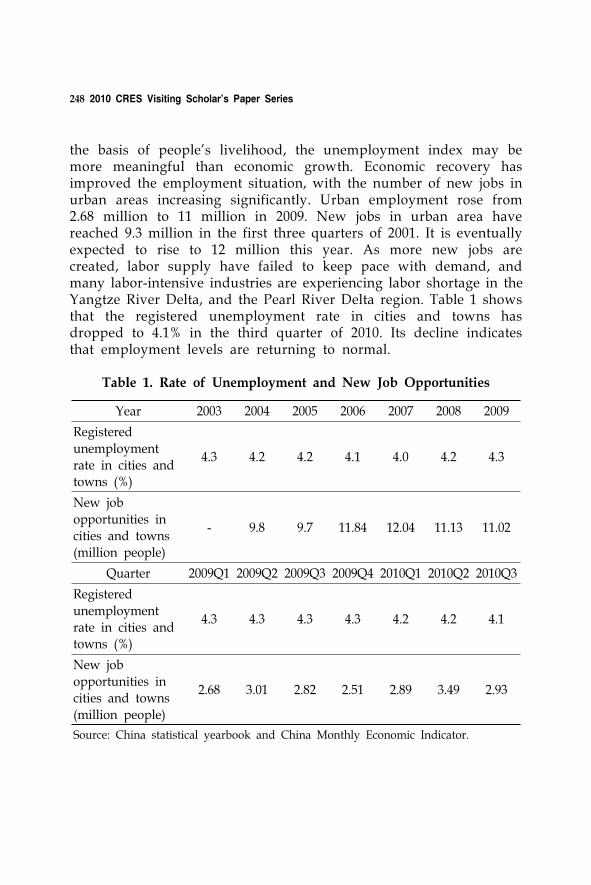
248 2010 CRES Visiting Scholar’s Paper Series
the basis of people's livelihood, the unemployment index may be more meaningful than economic growth. Economic recovery has improved the employment situation, with the number of new jobs in urban areas increasing significantly. Urban employment rose from 2.68 million to 11 million in 2009. New jobs in urban area have reached 9.3 million in the first three quarters of 2001. It is eventually expected to rise to 12 million this year. As more new jobs are created, labor supply have failed to keep pace with demand, and many labor-intensive industries are experiencing labor shortage in the Yangtze River Delta, and the Pearl River Delta region. Table 1 shows that the registered unemployment rate in cities and towns has dropped to 4.1% in the third quarter of 2010. Its decline indicates that employment levels are returning to normal.
Year 2003 2004 2005 2006 2007 2008 2009
Registered
unemployment rate in cities and towns (%)
4.3 4.2 4.2 4.1 4.0 4.2 4.3
New job
opportunities in cities and towns (million people)
- 9.8 9.7 11.84 12.04 11.13 11.02
Quarter 2009Q1 2009Q2 2009Q3 2009Q4 2010Q1 2010Q2 2010Q3
Registered
unemployment rate in cities and towns (%)
4.3 4.3 4.3 4.3 4.2 4.2 4.1
New job
opportunities in cities and towns (million people)
2.68 3.01 2.82 2.51 2.89 3.49 2.93
Source: China statistical yearbook and China Monthly Economic Indicator.
Table 1. Rate of Unemployment and New Job Opportunities
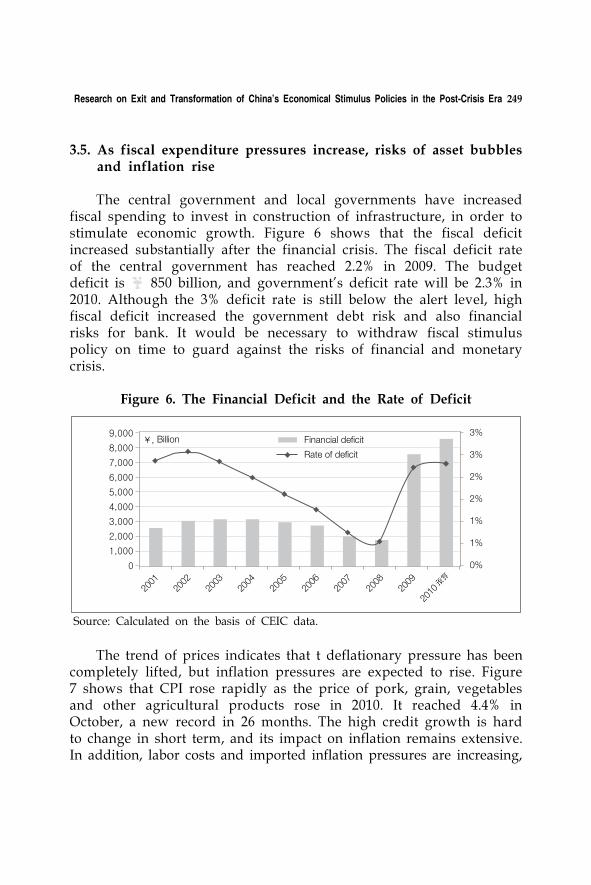
Research on Exit and Transformation of China’s Economical Stimulus Policies in the Post-Crisis Era 249
3.5. As fiscal expenditure pressures increase, risks of asset bubbles and inflation rise
The central government and local governments have increased fiscal spending to invest in construction of infrastructure, in order to stimulate economic growth. Figure 6 shows that the fiscal deficit increased substantially after the financial crisis. The fiscal deficit rate of the central government has reached 2.2% in 2009. The budget deficit is ¥ 850 billion, and government’s deficit rate will be 2.3% in 2010. Although the 3% deficit rate is still below the alert level, high fiscal deficit increased the government debt risk and also financial risks for bank. It would be necessary to withdraw fiscal stimulus policy on time to guard against the risks of financial and monetary crisis.
9,000
8,000
7,000
6,000
5,000
4,000
3,000
2,000
1,000
0
¥, Billion Financial deficit
Rate of deficit
2001
2002
2003
2004
2005
2006
2007
2008
2009
2010
3%
3%
2%
2%
1%
1%
0%
Source: Calculated on the basis of CEIC data.
Figure 6. The Financial Deficit and the Rate of Deficit
The trend of prices indicates that t deflationary pressure has been completely lifted, but inflation pressures are expected to rise. Figure 7 shows that CPI rose rapidly as the price of pork, grain, vegetables and other agricultural products rose in 2010. It reached 4.4% in October, a new record in 26 months. The high credit growth is hard to change in short term, and its impact on inflation remains extensive. In addition, labor costs and imported inflation pressures are increasing,
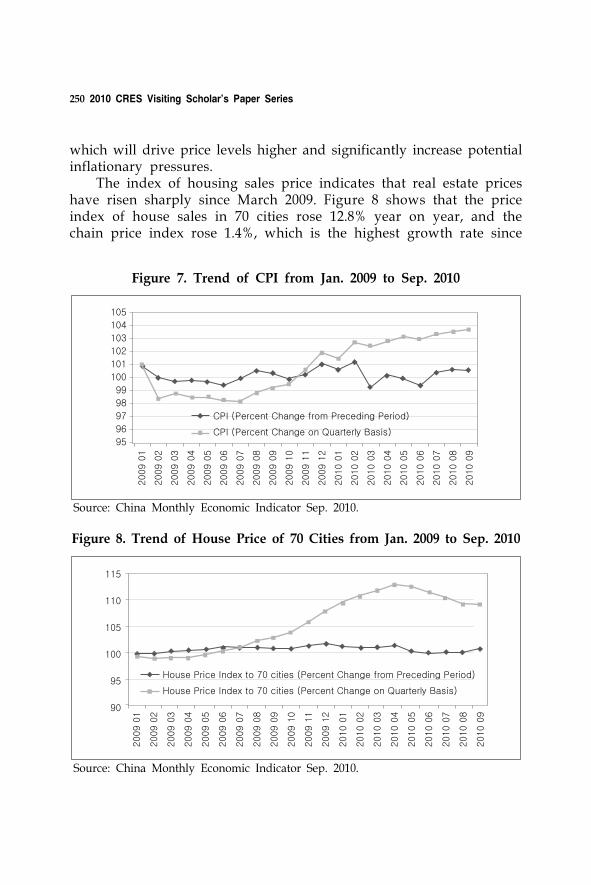
250 2010 CRES Visiting Scholar’s Paper Series
105
104
103
102
101
100
99
98
97
96
95
2009 0
1
2009 0
2
2009 0
3
2009 0
4
2009 0
5
2009 0
6
2009 0
7
2009 0
8
2009 0
9
2010 0
1
2010 0
2
2010 0
3
2010 0
4
2010 0
5
2010 0
6
2010 0
7
2010 0
8
2010 0
9
2009 1
0
2009 1
1
2009 1
2
CPI (Percent Change from Preceding Period)
CPI (Percent Change on Quarterly Basis)
Source: China Monthly Economic Indicator Sep. 2010.
Figure 7. Trend of CPI from Jan. 2009 to Sep. 2010
House Price Index to 70 cities (Percent Change from Preceding Period)
House Price Index to 70 cities (Percent Change on Quarterly Basis)
115
110
105
100
95
90
2009 0
1
2009 0
2
2009 0
3
2009 0
4
2009 0
5
2009 0
6
2009 0
7
2009 0
8
2009 0
9
2010 0
1
2010 0
2
2010 0
3
2010 0
4
2010 0
5
2010 0
6
2010 0
7
2010 0
8
2010 0
9
2009 1
0
2009 1
1
2009 1
2
Source: China Monthly Economic Indicator Sep. 2010.
Figure 8. Trend of House Price of 70 Cities from Jan. 2009 to Sep. 2010
which will drive price levels higher and significantly increase potential inflationary pressures.
The index of housing sales price indicates that real estate prices have risen sharply since March 2009. Figure 8 shows that the price index of house sales in 70 cities rose 12.8% year on year, and the chain price index rose 1.4%, which is the highest growth rate since

Research on Exit and Transformation of China’s Economical Stimulus Policies in the Post-Crisis Era 251
6
4
2
0
-2
-4
-6
-8
-10
2008
-Q4
2009
-Q1
2009
-Q2
2009
-Q3
2010
-Q1
2010
-Q2
2010
-Q3
2009
-Q4
%
USA
Euro Zone
Japan
6
4
2
0
-2
-4
-6
-8
2008
-Q4
2009
-Q1
2009
-Q2
2009
-Q3
2010
-Q1
2010
-Q2
2010
-Q3
2009
-Q4
%
USA
Euro Zone
Japan
Percent Change on Quarterly Basis Percent Change from Preceding Period.
Source: China Monthly Economic Indicator Sep. 2010.
Figure 9. Economic Growths of Three Main Economies in the World after International Financial Crisis
2008. Although the regulation of real estate market curbs the pace of rapid increases in housing prices, the current price of housing in all first-tier cities is still high; and housing prices in some second and third tier cities also exceeded the high point of 2007. There may also be some bubbles in the real estate market. This will have a greater negative impact on investment, consumption and economic development.
3.6. The major economies in the world recover significantly, external environment for development get better
Economic recovery in developed economies is an important external condition for China in exiting its stimulus policies. In early 2010, the European sovereign debt crisis exacerbated the concerns of market, but the major economies in the world recovered well; as can be seen in the case of the United States, Japan and Germany. Figure 9 shows that economic growth in the United States, Japan and the Euro zone have continued to rebound since the second half of 2009. Their economic growth rates remained positive through the first three quarters of 2010, indicating that the recession has come to the end.
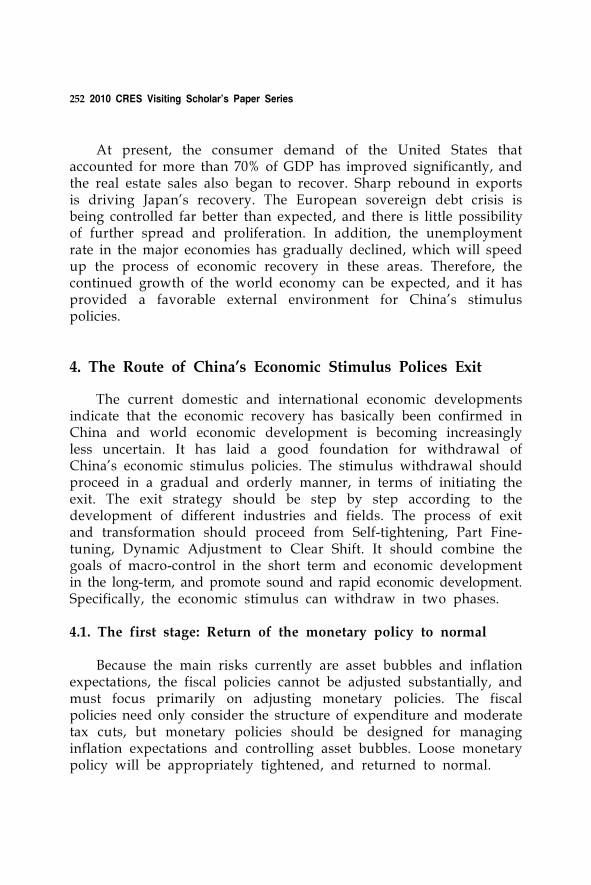
252 2010 CRES Visiting Scholar’s Paper Series
At present, the consumer demand of the United States that accounted for more than 70% of GDP has improved significantly, and the real estate sales also began to recover. Sharp rebound in exports is driving Japan's recovery. The European sovereign debt crisis is being controlled far better than expected, and there is little possibility of further spread and proliferation. In addition, the unemployment rate in the major economies has gradually declined, which will speed up the process of economic recovery in these areas. Therefore, the continued growth of the world economy can be expected, and it has provided a favorable external environment for China’s stimulus policies.
4. The Route of China’s Economic Stimulus Polices Exit
The current domestic and international economic developments indicate that the economic recovery has basically been confirmed in China and world economic development is becoming increasingly less uncertain. It has laid a good foundation for withdrawal of China’s economic stimulus policies. The stimulus withdrawal should proceed in a gradual and orderly manner, in terms of initiating the exit. The exit strategy should be step by step according to the development of different industries and fields. The process of exit and transformation should proceed from Self-tightening, Part Fine- tuning, Dynamic Adjustment to Clear Shift. It should combine the goals of macro-control in the short term and economic development in the long-term, and promote sound and rapid economic development. Specifically, the economic stimulus can withdraw in two phases.
4.1. The first stage: Return of the monetary policy to normal
Because the main risks currently are asset bubbles and inflation expectations, the fiscal policies cannot be adjusted substantially, and must focus primarily on adjusting monetary policies. The fiscal policies need only consider the structure of expenditure and moderate tax cuts, but monetary policies should be designed for managing inflation expectations and controlling asset bubbles. Loose monetary policy will be appropriately tightened, and returned to normal.
Research on Exit and Transformation of China’s Economical Stimulus Policies in the Post-Crisis Era 253
(1) Control the size of credit and optimize credit structure. Proper controls should be established concerning investment projects of local governments, and control of bank loans flowing to speculative demand of real estate in particular. Support is to be offered to banks to increase loans on economic restructuring, technological innovation, SMEs; and credit discrimination is to be eliminated on rural areas, and central and western regions. Services for small and medium financial institutions should be developed, and provide convenient and efficient financial services to solve the difficult problem of financing for SMEs.
(2) Manage inflation expectations. According to trends in credit growth, open market operations slightly raise the deposit reserve rate. In addition, using the means of interest rates to regulate the commercial bank credit will properly recover monetary mobility.
(3) Guard against financial risks. Prevent the risks of speculative real estate loans, and prevent the sharp asset price bubble generation and the rapid rebound in bad assets of banks. Reform exchange rate formation mechanisms and improve capital control against the inflow of international hot money.
4.2. The second stage: Transform the direction of fiscal policy
China's macroeconomic performance is expected to return to normal in the future, so macroeconomic policies should accordingly be restored to their natural conditions, and remain relatively stable at this stage. The monetary policy can only maintain the money supply adapting to normal needs of economic growth. Meanwhile, fiscal policy must adjust its structure, and allow the endogenous momentum of economic growth to catch up.
(1) Control the relative scale of national debt and optimize the issuing structure of treasury bonds and using structure of funds. According to the requirements of economic development, mainly issue short term debt, which possesses strong liquidity for investing in continued construction of the project that has been started. Adjust the term structure of interest rates and methods of interest payment in the time available.
(2) Guide and encourage private investment and promote endogenous economic growth. Support the development of SMEs by tax relief, interest subsidy, government procurement, credit guarantees
254 2010 CRES Visiting Scholar’s Paper Series
and other incentives, and reduce the burden on SMEs. Regulate the development of local financing platforms, broaden the fields and channels of social investment, and allow private capital to enter financial, railway, highway, aviation, telecommunications, electricity and urban water supply and other industries by share cooperation.
In addition, because the countries are different in terms of losses in the financial crisis, the economic stimulus policies exit cannot be completely consistent. Therefore, the withdrawal of China’s stimulus policies must consider international economic developments. It is necessary to strengthen communication and cooperation with the major economies in the world. International coordination mechanisms must be established for exit from stimulus policies, and prevent the negative chain reaction that can be produced as a result of policy games between countries.
5. The Direction of China’s Economic Policies Transformation in the Post-Crisis Era
The problem of China’s economic development is that the demand structure is unbalanced, industry structure is not good, the gap between urban and rural areas is relatively large, and the quality of economic growth is low. In the post-crisis era, the direction of transformation of China's economic stimulus policies is make the resolution of the problem of long-term economic development a starting point, promote the structural adjustment and optimization of the economy, and facilitate healthy and stable macro-economic sustainable development.
5.1. Expand domestic demand (especially consumer demand) and improve demand structure
Focus on improving the structure of demand, adjust the relationship between domestic and external demand, and transform the “export- oriented” model to “domestic demand-led” model; balance imports and exports, international payments; optimize the investment structure to improve the relationship between investment and consumption, and change the “investment-led” model to a “consumer driven” model,
Research on Exit and Transformation of China’s Economical Stimulus Policies in the Post-Crisis Era 255
to upgrade the consumption structure.(1) Reverse the growth model based on over-reliance on exports.
Adjust the export structure, and increase export efficiency. Strictly limit high energy consumption, high pollution, and capital goods exports. Encourage and promote exports of high-tech, labor-intensive value- added products and other advantages. Adjust the policies for attracting foreign investment, and change the current situation involving long-term surpluses. In addition, the processing trade should be reduced according to changes in labor supply and demand. Support qualified enterprises in “going out”, strengthen the foreign exchange control of capital projects, and promote capital account deficit and trade surplus for effective integration. Then improve the formation mechanism of RMB exchange rate, expand the floating range of RMB exchange rate, and accelerate the establishment of a balanced and rational exchange rate level.
(2) Promote upgrade of the consumption structure. Adjust the structure of national income distribution, and increase the income of low-income people. Expand employment actively to stabilize income expectations, and enhance consumer capability. Promote basic public services for equalization, and improve consumer confidence and eliminate the worries of the consumer. Regulate the market order to improve the consumption environment and protect the interests of consumers. Nurture and develop new consumption hot spots; promote expansion of hot consumption areas such as automobile, housing and other spots to spread. Expand consumer credit and potential for growth of consumer demand.
(3) Maintain moderate growth in investment and optimize investment structure. Limit investment in industries with excess production capacity, increase investments in new energy, new materials, biomedicine and other strategic emerging industries, and foster new areas for economic growth. Increase investment to water conservancy, electric power, transportation, communications and other infrastructure construction and renovation in the rural areas, especially in central and western regions, and narrow the gap between urban and rural areas. Increase the investment intensity to improve people's livelihoods, mainly in areas such as employment, education, health care, social security and so on. Increase investment in ecological construction and environmental protection; strengthen efforts at energy conservation,
256 2010 CRES Visiting Scholar’s Paper Series
pollution prevention, and ecological and environmental construction projects.
5.2. Improve supply management and promote industrial upgrades
Improve production and supply management, and build a modern industrial system that has modern agriculture as its support base, advanced manufacturing industry as the leading force, and a service industry that develops comprehensively.
(1) Accelerate the transformation of traditional agriculture to modern agriculture. Increase the public financial investment in agriculture, strengthen agricultural infrastructure construction, and improve overall agricultural production capacity. Along with changes in agricultural development, the industrialization of agriculture is to be expedited, the transformation of value-added processing of agricultural products promoted, and agricultural economic benefits must be increased. Strengthen the agricultural service system construction centered on agricultural science and technology, information, finance, logistics, inspection and quarantine.
(2) Accelerate the pace of industrial transformation and upgrades. Reduce the blind expansion of enterprises and curb excess production capacity. Promote industrialization and integration in informatization, use informatization to stimulate industrialization and industrialization to promote informatization. Break through and move beyond constraints in research and development, marketing, brand development, technical services and other key links; transform traditional industries, and promote the optimization and upgrading of industrial structure. Actively develop the recycling economy and low-carbon economy, and enhance the capacity for sustainable industrial development.
(3) Accelerate the development of a modern service industry. This would involve the acceleration of the development of knowledge- based services and producer services such as financial, insurance, consulting, logistics and other services which has great potential market demand. Accelerating the development of tourism, education and training, culture, sports and other intermediary services industry; and improvement of service levels and technical content should also take place.
Research on Exit and Transformation of China’s Economical Stimulus Policies in the Post-Crisis Era 257
5.3. Optimize the spatial structure and coordinate regional economic development
Expedite the development of industrialization and urbanization in central and western regions, in addition to strengthening regional economic cooperation and narrowing regional economic disparities through regionally-coordinated development of industrialization and urbanization.
(1) Accelerate the development of central and western regions. Promote industrial transfer from the eastern coastal areas to central and western in accordance with the comparative advantages of different regions to promote industrialization, improve the environment for industrial development, and enhance the capabilities of central and western regions to undertake domestic and international industrial transfer. Make good use of the advantages of central and western regions in labor and natural resources, strengthen collaboration with the surrounding areas, develop local advantage industries, and established a number of energy and resource base, special agriculture base.
(2) Promote regional urbanization and coordinated development. Accelerate urban agglomeration in central and western regions, foster regional economic core area, and increase carrying capacity of urban centers to accommodate larger populations. Promote simultaneous development of urbanization with respect to population and land and enhance the quality of urbanization, as the focus is to change migrant workers into proper residents.
(3) Guide production factors for rational concentration and improve the efficiency of factor allocation. Promote cross-regional mobility of production factors and optimal industrial combination through improved information, technology, logistics and other support services measures.
5.4. Improve people's livelihoods, and balance urban and rural development
Increase the public investment in social development to narrow the gap between urban and rural public services, and coordinate economic and social development for both urban and rural areas.
258 2010 CRES Visiting Scholar’s Paper Series
(1) Raise level of modernization in education. Accelerate the development of vocational education and strengthen skills training, gradually popularize senior high school education, and expand the scale of higher education to enhance supply of highly educated talent.
(2) Consider urban and rural employments as single issue. Accelerate the reform of the household registration system, and establish a unified registration system of employment and unemployment. Implement the employment policies of generalized system of preferences (GSP), and ensure that rural and urban population enjoy equal employment opportunities.
(3) Improve public health and medical service systems. Integrate urban health resources, and establish close cooperation among the urban health service network. In addition, improve the rural health service network and promote rural health care services.
(4) Expand social security coverage. As the goal is provision of basic social security for all, there should be efforts to promote social security to fully cover urban and rural areas, with focus on integrating resident pension and medical insurance.
5.5. Implement innovative strategies and enhance the quality of economic growth
Establish the system for mutual promotion of technology and economic growth as driving forces for innovation of the economic dynamic and system. Increase the capability of independent innovation, create a number of innovative enterprises and build an innovative country.
(1) Improve the capability for independent innovation. Encourage independent research and innovation among enterprises, with emphasis on the weak links such as variety, quality, energy saving, environmental protection, equipment levels and safe production. Support the transformation of traditional production process and equipment among enterprises by adopting new technology. Encourage innovation in enterprises on the basis of introduction and assimilation (secondary innovation), and promote overall progress of industrial technology.
(2) Create a number of innovative enterprises. Implement innovative,
Research on Exit and Transformation of China’s Economical Stimulus Policies in the Post-Crisis Era 259
start-up projects on new energy, new materials and bio-pharmaceutical industry, and nurture a number of innovative enterprises with international competitiveness.
(3) Strengthen human capital investment and human resource development and improve the level of human capital. Improve the mechanism of education, training and incentives, enhance introduction of top talent, and increase the capability of intelligence support.
6.Conclusion
As a whole, the basic conditions of China’s stimulus policies exit have been met. China’s industrial production rebounded rapidly and economic growth has risen to its expected levels; the momentum for endogenous growth strengthened with demand expanding constantly; the market driving force was enhanced as the private investment grew steadily; employment situation improved as the unemployment rate decline steadily; external environment for development became better while major economies in the world showed significant recovery. All of these provide favorable internal and external environment for China’s exit from its stimulus policies.
Exit of China’s stimulus policies should follow the principle of gradual and orderly progress, and withdrawn in two phases. In the first stage, we would see normalization of the monetary policy and the second stage would involve a change in the direction of fiscal policy. Meanwhile, it is necessary to strengthen policy coordination with other countries.
The direction of change in economic stimulus measures should concentrate on solving some problem associated with China’s economic long-term development, consisting of several major measures: to improve the demand structure and expand domestic demand, especially consumer demand. Optimize the spatial structure and achieve coordinated development of regional economies. Improve supply management and promote upgrades in industries. Improve people's livelihoods and balance urban and rural development. Lastly, implement innovative strategies and build an innovative country.
260 2010 CRES Visiting Scholar’s Paper Series
References
BA, Shusong. 2009. “The Timely Withdraw of Chinas' Loose Monetary Policy in the View of Monetary Policy Rule.” Journal of Central University of Finance and Economics, No. 10.
CHEN, Hua. 2010. “The Research on Exit Timing, Route and Policies for the Economic Stimulus Plan in China.” Journal of Shanghai Business Schoo,. No. 1.
SONG, Li. 2010. “Change Recovery Driving Force from the Stimulus Policies to System and Mechanisms.” Journal of Macro-economic Administration, No. 3.
WANG, Guangyu. 2010. “The Exit Strategy of China’s Macro-economic Stimulus Polices in Post Crisis Era.” Journal of Bankers, No. 3.
YAN, Fushan. 2010. “Thinking of Economic Stimulus Polices Exit.0. Economic Research Guide, No. 12.
Research on the Urbanization Problem of
South Korea
Huang Zhengxue
1. Introduction
South Korea initiated the industrialization strategy that characterized it as exporting-oriented economy in 1960s. After 30 years of sustained development till the middle part of the 1990s, Korea’s GDP per capita surpassed 10000$, and the level of urbanization reached about 80 percent. South Korea had become a newly industrialized country.
The urbanization process of South Korea is the process of interaction of the market and the government. Such a process is marked by five characteristics: gradual upgrading of the industrial structure, constant improvement of the urban hierarchical system, rapid increase in the level of infrastructure level, coordinated development between urban and rural regions, and significant government role. The urbanization process in South Korea is also the process of optimization of spatial structure and is the process of integration of urban and rural areas. As for the agglomeration of urban population, South Korea exhibited a pattern of concentration, dispersion, and relative concentration. As for the spatial distribution of the urban system, South Korea took the strategy of comprehensive national territory development by developing satellite cities and effectively alleviated the pressure of excessive population concentration in big cities, and thus the pressure of urbanization upon society, economic, resource and environment actually guaranteed the harmonious development of different regions. At the same time, in order to maintain the driving force of urbanization, South Korea constantly optimizes the industrial structure to enhance international industrial competitiveness. In order to improve national competitiveness, the
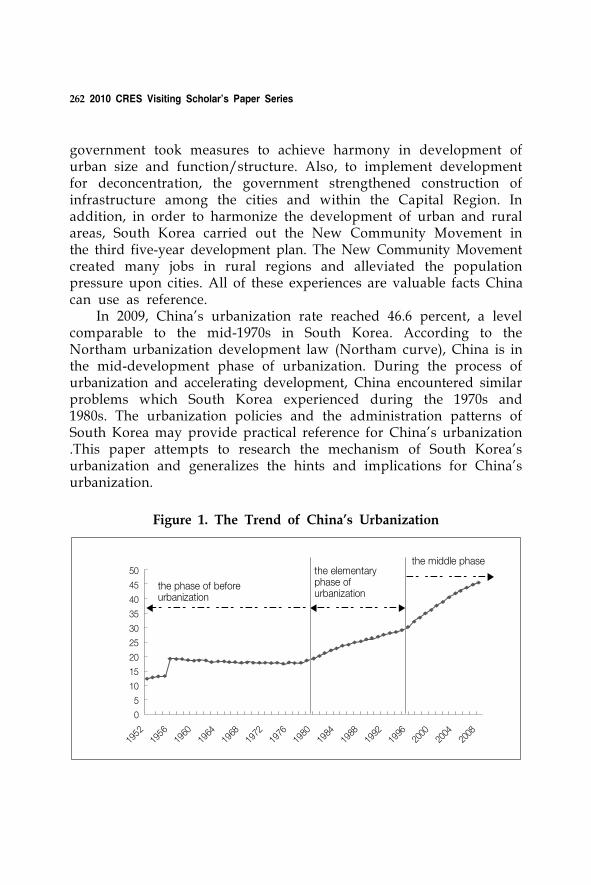
262 2010 CRES Visiting Scholar’s Paper Series
government took measures to achieve harmony in development of urban size and function/structure. Also, to implement development for deconcentration, the government strengthened construction of infrastructure among the cities and within the Capital Region. In addition, in order to harmonize the development of urban and rural areas, South Korea carried out the New Community Movement in the third five-year development plan. The New Community Movement created many jobs in rural regions and alleviated the population pressure upon cities. All of these experiences are valuable facts China can use as reference.
In 2009, China’s urbanization rate reached 46.6 percent, a level comparable to the mid-1970s in South Korea. According to the Northam urbanization development law (Northam curve), China is in the mid-development phase of urbanization. During the process of urbanization and accelerating development, China encountered similar problems which South Korea experienced during the 1970s and 1980s. The urbanization policies and the administration patterns of South Korea may provide practical reference for China’s urbanization .This paper attempts to research the mechanism of South Korea’s urbanization and generalizes the hints and implications for China’s urbanization.
50
45
40
35
30
25
20
15
10
5
0
1952
1956
1960
1964
1968
1972
1976
1980
1984
1988
1992
1996
2000
2004
2008
the phase of beforeurbanization
the elementaryphase ofurbanization
the middle phase
Figure 1. The Trend of China’s Urbanization
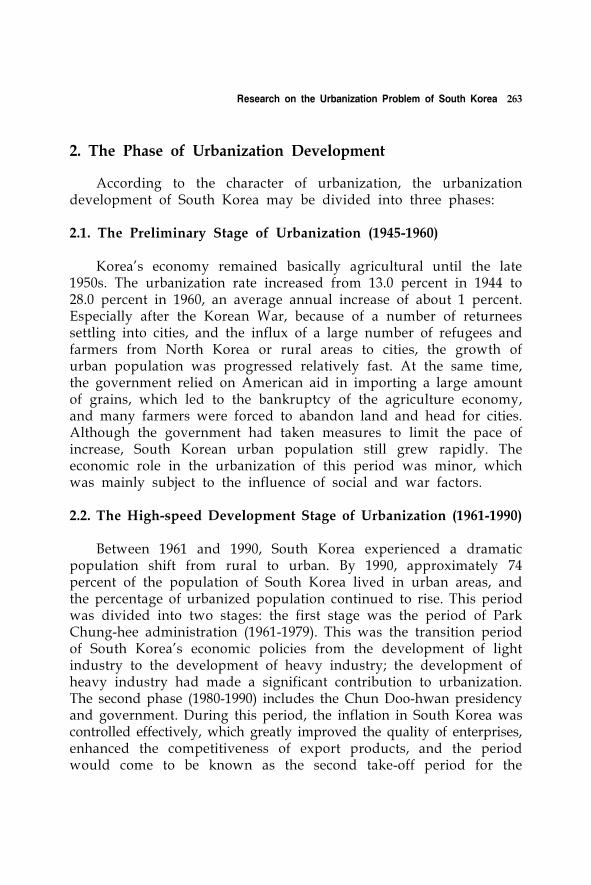
Research on the Urbanization Problem of South Korea 263
2. The Phase of Urbanization Development
According to the character of urbanization, the urbanization development of South Korea may be divided into three phases:
2.1. The Preliminary Stage of Urbanization (1945-1960)
Korea’s economy remained basically agricultural until the late 1950s. The urbanization rate increased from 13.0 percent in 1944 to 28.0 percent in 1960, an average annual increase of about 1 percent. Especially after the Korean War, because of a number of returnees settling into cities, and the influx of a large number of refugees and farmers from North Korea or rural areas to cities, the growth of urban population was progressed relatively fast. At the same time, the government relied on American aid in importing a large amount of grains, which led to the bankruptcy of the agriculture economy, and many farmers were forced to abandon land and head for cities. Although the government had taken measures to limit the pace of increase, South Korean urban population still grew rapidly. The economic role in the urbanization of this period was minor, which was mainly subject to the influence of social and war factors.
2.2. The High-speed Development Stage of Urbanization (1961-1990)
Between 1961 and 1990, South Korea experienced a dramatic population shift from rural to urban. By 1990, approximately 74 percent of the population of South Korea lived in urban areas, and the percentage of urbanized population continued to rise. This period was divided into two stages: the first stage was the period of Park Chung-hee administration (1961-1979). This was the transition period of South Korea’s economic policies from the development of light industry to the development of heavy industry; the development of heavy industry had made a significant contribution to urbanization. The second phase (1980-1990) includes the Chun Doo-hwan presidency and government. During this period, the inflation in South Korea was controlled effectively, which greatly improved the quality of enterprises, enhanced the competitiveness of export products, and the period would come to be known as the second take-off period for the
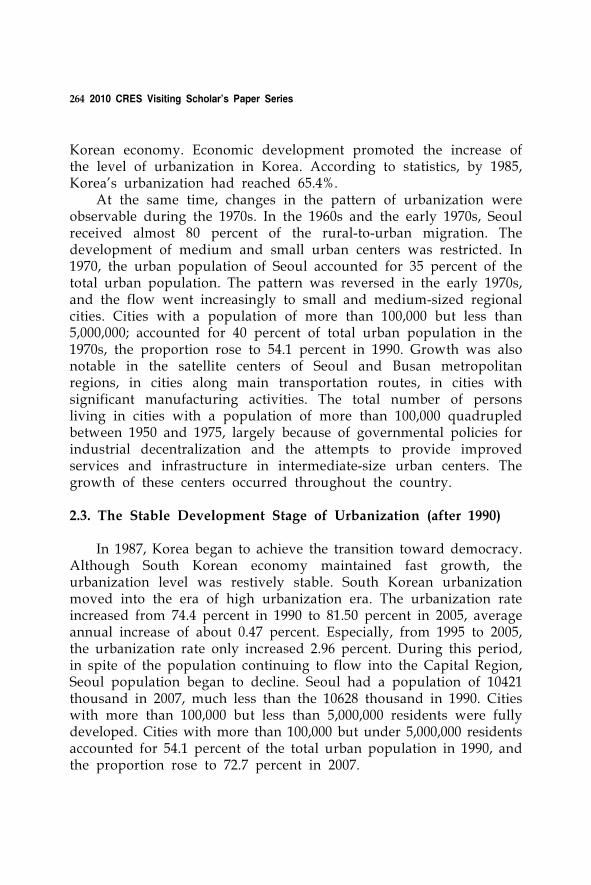
264 2010 CRES Visiting Scholar’s Paper Series
Korean economy. Economic development promoted the increase of the level of urbanization in Korea. According to statistics, by 1985, Korea's urbanization had reached 65.4%.
At the same time, changes in the pattern of urbanization were observable during the 1970s. In the 1960s and the early 1970s, Seoul received almost 80 percent of the rural-to-urban migration. The development of medium and small urban centers was restricted. In 1970, the urban population of Seoul accounted for 35 percent of the total urban population. The pattern was reversed in the early 1970s, and the flow went increasingly to small and medium-sized regional cities. Cities with a population of more than 100,000 but less than 5,000,000; accounted for 40 percent of total urban population in the 1970s, the proportion rose to 54.1 percent in 1990. Growth was also notable in the satellite centers of Seoul and Busan metropolitan regions, in cities along main transportation routes, in cities with significant manufacturing activities. The total number of persons living in cities with a population of more than 100,000 quadrupled between 1950 and 1975, largely because of governmental policies for industrial decentralization and the attempts to provide improved services and infrastructure in intermediate-size urban centers. The growth of these centers occurred throughout the country.
2.3. The Stable Development Stage of Urbanization (after 1990)
In 1987, Korea began to achieve the transition toward democracy. Although South Korean economy maintained fast growth, the urbanization level was restively stable. South Korean urbanization moved into the era of high urbanization era. The urbanization rate increased from 74.4 percent in 1990 to 81.50 percent in 2005, average annual increase of about 0.47 percent. Especially, from 1995 to 2005, the urbanization rate only increased 2.96 percent. During this period, in spite of the population continuing to flow into the Capital Region, Seoul population began to decline. Seoul had a population of 10421 thousand in 2007, much less than the 10628 thousand in 1990. Cities with more than 100,000 but less than 5,000,000 residents were fully developed. Cities with more than 100,000 but under 5,000,000 residents accounted for 54.1 percent of the total urban population in 1990, and the proportion rose to 72.7 percent in 2007.
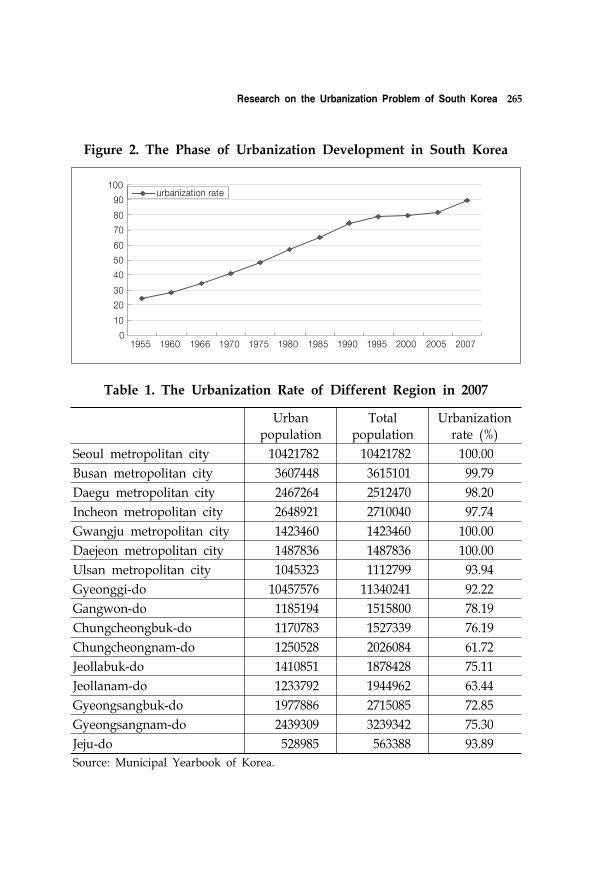
Research on the Urbanization Problem of South Korea 265
0
10
20
30
40
50
60
70
80
90
100
1955 1960 1966 1970 1975 1980 1985 1990 1995 2000 2005 2007
urbanization rate
Figure 2. The Phase of Urbanization Development in South Korea
Urban population
Total population
Urbanization rate (%)
Seoul metropolitan city 10421782 10421782 100.00
Busan metropolitan city 3607448 3615101 99.79
Daegu metropolitan city 2467264 2512470 98.20
Incheon metropolitan city 2648921 2710040 97.74
Gwangju metropolitan city 1423460 1423460 100.00
Daejeon metropolitan city 1487836 1487836 100.00
Ulsan metropolitan city 1045323 1112799 93.94
Gyeonggi-do 10457576 11340241 92.22
Gangwon-do 1185194 1515800 78.19
Chungcheongbuk-do 1170783 1527339 76.19
Chungcheongnam-do 1250528 2026084 61.72
Jeollabuk-do 1410851 1878428 75.11
Jeollanam-do 1233792 1944962 63.44
Gyeongsangbuk-do 1977886 2715085 72.85
Gyeongsangnam-do 2439309 3239342 75.30
Jeju-do 528985 563388 93.89
Source: Municipal Yearbook of Korea.
Table 1. The Urbanization Rate of Different Region in 2007
266 2010 CRES Visiting Scholar’s Paper Series
year agriculture industry services
1962 36.6 14.3 50.9
1970 29.1 26.6 44.3
1980 16.0 36.0 48.0
1990 8.7 39.8 51.5
2000 4.6 38.1 57.3
2009 2.6 36.5 60.9
Source: www.kostat.go.kr/eng.
Table 2. Structure of South Korea Economy (Unit: %)
Although South Korea’s urbanization has been completed, the problem of the imbalance in urbanization remains. The urbanization rate of northeast and southwest regions of South Korea is lower than the northwest and southeast regions. For example, the urbanization rate of South Chungcheong province was only 61.7 percent in 2007, and was the lowest in South Korea. The urbanization rate of South Jeolla province was 63.4 percent in 2007. However, the urbanization rate of Seoul metropolitan city, Gwangju metropolitan city and Daejeon metropolitan city reached 100 percent in 2007.
3. To Upgrade Industrial Structure
In order to ensure the sustainable development of urbanization and enhance the quality of urbanization, South Korea constantly optimizes the industrial structure during the process of urbanization, and has achieved remarkable results.
3.1. The Change Trend of Industrial Structure
The trend of changes in South Korean industrial structure highlighted the share of agricultural decline and the proportion of services increasing. The share of agriculture in GDP has dropped from 36.6 percent in 1962 to 2.6 percent in 2009. In spite of the gradually smaller amplitude of decline, the trend is expected to

Research on the Urbanization Problem of South Korea 267
continue. The proportion of services has increased from 50.9 percent of GDP in 1962 to 60.9 percent of GDP in 2009. The proportion of services was high because of the weakness of the industry base.
Within the secondary industry, the role of mining, manufacturing, electricity, and construction has grown mightily since the early 1960s, and their shares of GDP seem to have stabilized in recent years. The share of mining is about 28 percent of GDP. The share of manufacturing is about 27.5 percent of GDP. The proportion of electricity is about 2 percent of GDP. The proportion of construction is about 7.5 percent of GDP.
0
10
20
30
40
50
60
70
1970
1972
1974
1976
1978
1980
1982
1984
1986
1988
1990
1992
1994
1996
1998
2000
2002
2004
2006
2008
agricultureminingmanufacturingelectricityconstructonservices
Figure 3. The Change Trend of Industrial Structure
However, Korea’s manufacturing and industrial sector has been in the process of change for some time. In 1970, low-end heavy industrial commodity products, such as bulk chemicals, accounted for 27.3 percent of the sector’s production; mid-range products, such as textiles, represented 21.2 percent; and high-end, high-value-added products, such as electrical goods and components, produced the remaining 51.5 percent. By 1990 the contribution of low-end commodities had declined to 9.6 percent, while mid-range items had moved up to 29.4 percent, and sophisticated upper-end items contributed 61 percent of the sector’s output. At the same time, the share of product with advanced technology has always been increasing. The manufacturing of high-tech products increased from 10.7 percent of total value-
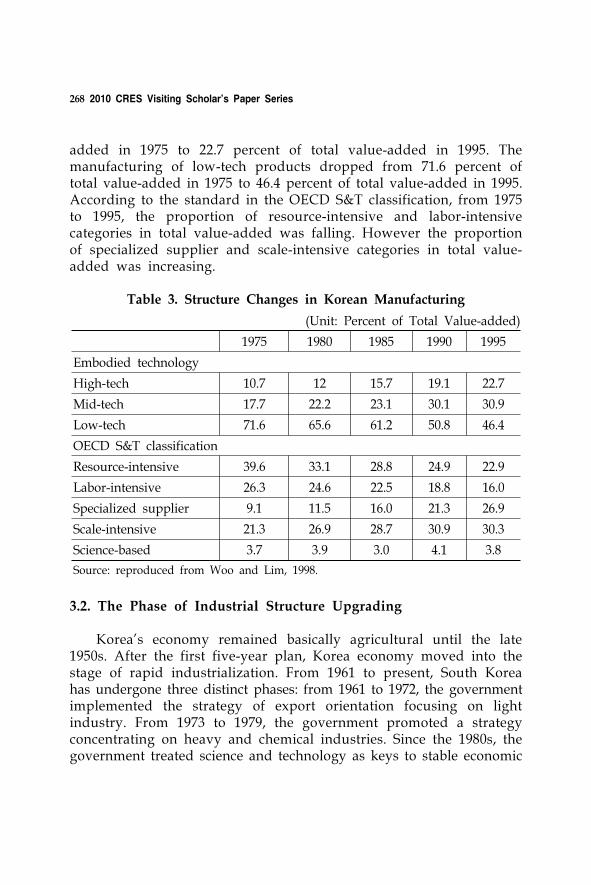
268 2010 CRES Visiting Scholar’s Paper Series
added in 1975 to 22.7 percent of total value-added in 1995. The manufacturing of low-tech products dropped from 71.6 percent of total value-added in 1975 to 46.4 percent of total value-added in 1995. According to the standard in the OECD S&T classification, from 1975 to 1995, the proportion of resource-intensive and labor-intensive categories in total value-added was falling. However the proportion of specialized supplier and scale-intensive categories in total value- added was increasing.
1975 1980 1985 1990 1995
Embodied technology
High-tech 10.7 12 15.7 19.1 22.7
Mid-tech 17.7 22.2 23.1 30.1 30.9
Low-tech 71.6 65.6 61.2 50.8 46.4
OECD S&T classification
Resource-intensive 39.6 33.1 28.8 24.9 22.9
Labor-intensive 26.3 24.6 22.5 18.8 16.0
Specialized supplier 9.1 11.5 16.0 21.3 26.9
Scale-intensive 21.3 26.9 28.7 30.9 30.3
Science-based 3.7 3.9 3.0 4.1 3.8
Source: reproduced from Woo and Lim, 1998.
Table 3. Structure Changes in Korean Manufacturing
(Unit: Percent of Total Value-added)
3.2. The Phase of Industrial Structure Upgrading
Korea’s economy remained basically agricultural until the late 1950s. After the first five-year plan, Korea economy moved into the stage of rapid industrialization. From 1961 to present, South Korea has undergone three distinct phases: from 1961 to 1972, the government implemented the strategy of export orientation focusing on light industry. From 1973 to 1979, the government promoted a strategy concentrating on heavy and chemical industries. Since the 1980s, the government treated science and technology as keys to stable economic
Research on the Urbanization Problem of South Korea 269
growth. With the completion of upgrades in industrial structure, South Korean industry changed from light to heavy and from labor-intensive to knowledge- and technology-intensive in character.
3.2.1. The light industry development phase: 1961-1972Before 1961, South Korean authorities encouraged import-substitution
in non-durable consumer-goods industries. In 1962, because of the small domestic market but relatively well-trained labor force, Korea began the switch to export-oriented economic development strategy. The growth rate increased sharply to 9.1 percent and the economy entered a phase of high growth and rapid industrialization. Under the above strategy, most policies were made consistent with the goals of export-orientation. For example, the currency was devalued in May 1964 from 130 to 255 won per United States dollar and in March 1965, a unitary floating exchange rate was adopted. In September 1965, interest rates on both bank deposits and loans were raised sharply to increase voluntary private savings and discourage unproductive use of bank credit. During the 1960s, the Government nationalized all commercial banks and established many specialized banks that were state owned. Tariffs and import controls had to be rationalized due to low competitiveness in this phase. Most domestic markets were protected until the end of the 1970s. Meanwhile, the export incentive system allowed exporters relief from various taxes (domestic commodity taxes, business taxes and income taxes), giving them accelerated depreciation allowances. A formal system of wastage allowances permitted exporters to import, on preferential terms, a greater amount of intermediate inputs than required in production. Among these incentives, the export credit subsidy was the most significant incentive scheme.
In order to make full use of comparative advantage in labor- intensive products to achieve the goal of export expansion, the government focused on exports of low-tech light manufactures, such as textiles, toys, and footwear; and industrial commodities, such as cement and mining products. Besides, Korea established many types of Industrial Complexes in Seoul, Incheon, and the southeastern coast; including export processing zones, large industrial base, and free trade zones and so on. Korea’s first Industrial Complex was established in Ulsan in 1962. The government promulgated the
270 2010 CRES Visiting Scholar’s Paper Series
“Export Industrial Zone Promotion Act” in 1964 which promoted the establishment of export processing zones in Seoul and Incheon. The construction of Ulsan Petrochemical Corporation promoted the development and improvement of the textile industry. In the 1960s, light industry was the heart of the Korean economy, and became the main production sector for its export-oriented industry. Strong policy support helped Korea maintain an average growth rate of 8.9 percent from 1963 to 1972.
3.2.2. The “Heavy and Chemical Industry” promotion phase: 1973-1979
In order to meet the needs for deepening industrialization and national security, in 1973, Korea shifted from the general export promotion to a drive to promote heavy and chemical industries (HCI); including steel, shipbuilding, petrochemicals, and heavy equipment. The promotion of HCI was supported by many policy instruments. In 1975, the new Tax Exemption and Reduction Control Law gave five-year tax exemptions and investment tax credits, and accelerated depreciation allowances to designated industries. The commodity tax exemption previously available to all exporters was withdrawn. Important export privileges were reduced, including wastage allowances, public utility subsidies and the scope of export credit. Among various forms of government support, financing was the most critical factor since HCI requires huge amounts of capital. With limited domestic savings, the Korean government had to actively seek foreign capital. At that time, the country’s entrepreneurs’ abilities to attract foreign capital were very limited owing to the low creditworthiness of domestic firms. The Government, in response, began to guarantee the reimbursement of all foreign loans, regardless of whether they were initiated by public or private companies. Along with the massive credit support, the Government overhauled the education and training systems to promote and secure engineers and skilled workers for HCI. Training centers, technical high schools and engineering colleges were expanded in both quality and quantity. The Government also introduced a skill-licensing system to encourage all workers to possess at least one skill. In addition, for each field of engineering the Government actively recruited outstanding Korean scientists abroad and established a modern laboratory where research
Research on the Urbanization Problem of South Korea 271
on the improvement of production technologies was encouraged in collaboration with industry researchers and university professors. Under the impetus of preferential policies, the Korean economy and HCI achieved strong progress. In this period, the rate of economic growth reached an average of 8.9 percent. By 1980, heavy industry’s share in the economy surpassed the share of light industry.
At the same time, in order to speed up the development of heavy and chemical industries, the government began to establish a series of major industrial bases in intense efforts to establish industrial cities along the Southeast coast. By the end of the 1970s, the central government had constructed 30 Industrial Complexes. The area of Industrial Complexes increased from 102 square kilometers in 1971 to 332 square kilometers in 1980. The concentration of the automobile industry in Ulsan, of the steel industry in Pohang and Gwangyang, of electronics in Gumi and of petrochemical industries and other major leading industry concentration in Incheon, attracted a large numbers of people away from rural regions and expanded the size of cities.
3.2.3. The knowledge-and technology-intensive industry development phase: after 1980
In the 1980s, South Korea’s economy faced serious macroeconomic and structural problems such as inflation and over-capacity in the HIC. The government initiated tight monetary and fiscal policies, which was actually tightened during the process of the HCI drive. Deregulation and market opening were also advocated and adopted as part of the general economic policy. In order to develop domestic financial markets, the government sold nearly of its commercial banks to the private sector, abolished all preferential interest rates and credit, and gradually reduced its role in credit allocation. Flexibility in interest rate management was introduced in 1984 and strengthened by deregulation in 1988. The tax reform in 1981 also sharply reduced the scope of special tax treatment for key industries. With the completion of the five-year liberalization program for 1984-1988, the import liberalization ratio was raised from 80 percent in 1983 to over 95 percent in 1989. About three quarters of the items remaining under restriction were primary products, foods and beverages, and the average nominal tariff rate was gradually lowered from 24
272 2010 CRES Visiting Scholar’s Paper Series
percent to 13 percent between 1983 and 1989. After the Foreign Capital Inducement Act was revised in 1984, the Government gradually relaxed the restrictions on foreign direct investment. While the government was engaged in deregulation and market opening, it played an active role in restructuring distressed industries, promoting competition and supporting the development of technology. In 1981, the government announced the Technology Development Promotion Act. Since then, a number of research institutes were established, and the government’s budgetary expenditures on R&D (research and development) and S&T (science and technology) were increased. As the South Korean government stated in the “Concept of Economic Prospects for the 21st Century”, the government would increase investment in education, and science/ technology; and investment in these fields accounted for 5 percent of GDP to 6 percent of GDP, respectively, in 2020.
The change of industrial structure led to a change in the regional structure. The shift of industries toward the Capital Region (including Seoul, Incheon and Gyeonggi Provice) became more and more obvious. The number of high-tech enterprises in the Capital Region accounted for about 69.7 percent of all high-tech enterprises in Korea, the output of high-tech enterprises in Capital Region accounted for about 62.8 percent out of the total for the whole country. However, the manufacturing sector in the Capital Region was about 57 percent of the entire country’s; the share of output of manufacturing in the Capital Region represented about 43.7 percent of the national total. The concentration of industries attracted an even greater portion of the population. The population of the Capital Region continued to increase.
3.3. The Main Experience of Industrial Structure Upgrading
South Korea adopted many policies in the process of industrial structure upgrading, the following aspects standout in particular:
3.3.1. To build an export-oriented industrial structureThe export-orientation policies in South Korea have always
comprised an important pillar of its policy. Whether theybe direct encouragement of the light industry exports in 1960s, HCI development
Research on the Urbanization Problem of South Korea 273
in the 1970s, or technology intensive industrial exports after 1980, all of these policies were meant to enhance the respective products’ export competition. The strategy played an important role in accelerating Korean industrialization. Because the export-oriented policy in South Korea was not simply limited to stimulating economic growth through export growth, but emphasized the interaction between industrial structure and export structure, namely, the government promoted and induced industrial structure upgrading according to information on pressure or changes of export structure; and at the same time, drive the change of export structure through reference to advanced and international industrial structures, which lead to sustained export growth potential.
3.3.2. To cultivate mainstay industriesThe goal of Korean industrial policy is to effectively allocate resources
and maximize the potential for economic growth. The practical method is to establish a leading industry in accordance with changes in economic environments in order to stimulate the national economy.
The choice of leading industry in South Korea is mainly based on the following rationale: first, choosing the leading industry depends on industrial linkage. The Bank of Korea announced an input-output table every 3 to 5 years, which provided empirical information for determining the leading industry. Second, it depended on the demand at home and abroad. In different stages of economic development, the requirements of industrial structure are different. So, the choice of leading industry must be geared toward the structure of demand in order to ensure good development prospects. Third, choose leading industry depends on factor conditions. Productions factors are different, comparative advantages are different. So, the choice of leading industries must take into consideration the international division of labor and trends of change in industrial structure.
3.3.3. Emphasizing industrial innovationIndustrial innovation is the fundamental driving force of
advancement of industrial structures. South Korea paid close attention to the cultivation of the creativity. In the 1960s and 1970s, South Korea emphasized introduction of technology following the model of introduction - digestion - absorption. However, the government ignored
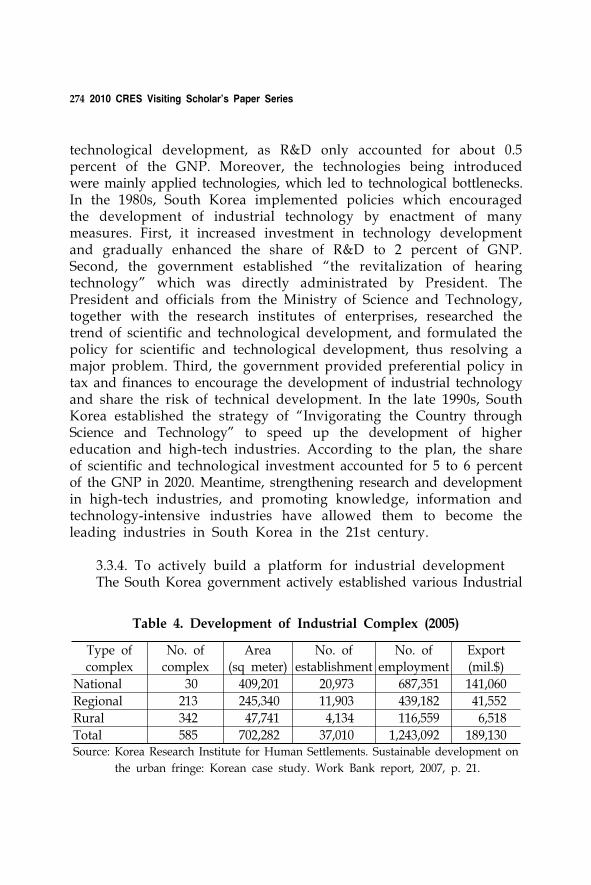
274 2010 CRES Visiting Scholar’s Paper Series
Type of
complex
No. of
complex
Area
(sq meter)
No. of
establishment
No. of
employment
Export
(mil.$)
National 30 409,201 20,973 687,351 141,060
Regional 213 245,340 11,903 439,182 41,552
Rural 342 47,741 4,134 116,559 6,518
Total 585 702,282 37,010 1,243,092 189,130Source: Korea Research Institute for Human Settlements. Sustainable development on
the urban fringe: Korean case study. Work Bank report, 2007, p. 21.
Table 4. Development of Industrial Complex (2005)
technological development, as R&D only accounted for about 0.5 percent of the GNP. Moreover, the technologies being introduced were mainly applied technologies, which led to technological bottlenecks. In the 1980s, South Korea implemented policies which encouraged the development of industrial technology by enactment of many measures. First, it increased investment in technology development and gradually enhanced the share of R&D to 2 percent of GNP. Second, the government established “the revitalization of hearing technology” which was directly administrated by President. The President and officials from the Ministry of Science and Technology, together with the research institutes of enterprises, researched the trend of scientific and technological development, and formulated the policy for scientific and technological development, thus resolving a major problem. Third, the government provided preferential policy in tax and finances to encourage the development of industrial technology and share the risk of technical development. In the late 1990s, South Korea established the strategy of “Invigorating the Country through Science and Technology” to speed up the development of higher education and high-tech industries. According to the plan, the share of scientific and technological investment accounted for 5 to 6 percent of the GNP in 2020. Meantime, strengthening research and development in high-tech industries, and promoting knowledge, information and technology-intensive industries have allowed them to become the leading industries in South Korea in the 21st century.
3.3.4. To actively build a platform for industrial developmentThe South Korea government actively established various Industrial
Research on the Urbanization Problem of South Korea 275
Complexes in order to build a platform for industrial development. In 2005, there were 585 industrial complexes with 30 national complexes, 213 regional complexes, and 342 rural complexes. Industrial complexes accounted for 66 percent of the country’s total exports of 284.7 billion dollars in 2005.
4. To Improve the Structure of the Urban Hierarchical System
During the process of urbanization, South Korea paid more attention to coordinating development among cities, and took many measures to promote economic activity away from regions with high population density, such as Seoul and Busan, and rearranged the urban system of size according to a reasonable and clear system of division.
4.1. To Optimize the Size Structure of the Urban Hierarchical System
During the initial stage of urbanization, Korea aimed to foster spatial polarization and supported industrial agglomeration in cities around Seoul, which led to a sharp increase of population. The population of Seoul increased from 1,568,746 in 1955 to 9,625,755 in 1985. In order to combat the polarization and promote balanced regional development, South Korea introduced policies for multi- centre and west coast development, respectively, in the second and third Comprehensive National Territorial Development Plan. At the same time, the First Capital Region Management Plan1) (1984-1996) was introduced by the central government, which increased the transfer of industry away from inner-city industrial concentrations to outside Seoul city limits. This not only brought the growth of large cities under control, but also accelerated the development of small cities, creating a relatively rational urban system.
Under the Capital Region Management Plan, the region was divided into five zones with varying degrees of development control.2)
1) The Plan defined the jurisdictions of the Seoul Special City, the city of Incheon, and the Gyeonggi province as the Capital Region.
2) The five zones are dispersal encouragement zone, limited redevelopment zones,

276 2010 CRES Visiting Scholar’s Paper Series
Tax typeCompaneis evacuated from
Seoul and Busan
Companies newly-established in
designated places
corporate tax
Three-year exemption and 50
percent reduction in the fourth and fifth year.
--------
Sales taxThree-year exemption and 50 percent reduction in the fourth
and fifth year.
--------
Property tax Five-year exemption Five-year exemption
Registration tax Five-year exemption One-time exemption
Purchase tax Five-year exemption two-year exemption
Capital investment tax 60 percent reduction --------
Source: 李东华.韩国的产业集聚与城市化进程. ≪当代韩国≫, 2003年第21期。
Table 5. Preferential Policies in Local Industry Promotion Act
In addition to dividing zones, the government took many restriction measures, mainly in the form of a residence tax on persons living in metropolitan region,3) discriminatory taxes on factories constructed there, discriminatory school fees based on city size, and an aggregate development ceiling system.4) Aside from these measures, the government expedited the branching out of schools and institutes. At the same time, the government actively promoted the equalization of
development reservation zone, growth promotion zone, and natural conservation zone. Later in the second plan, these five zones were divided into three zones, i.e., congestion relief, natural conservation, and growth management.
3) Congestion charges are imposed on development activities likely to induce population concentration within the congestion relief zone. Business offices, department stores, and public facilities above a certain size are subject to congestion charges, which are usually 10 percent of total construction costs.
4) The aggregate ceiling system is designed to control the growth of industrial activities. At the beginning of the year, an aggregate ceiling of factory construction is set by the Capital Region Management Review Committee. With portions of the total development ceiling allotted to different localities, heads of local government screen applications and permit factory construction.
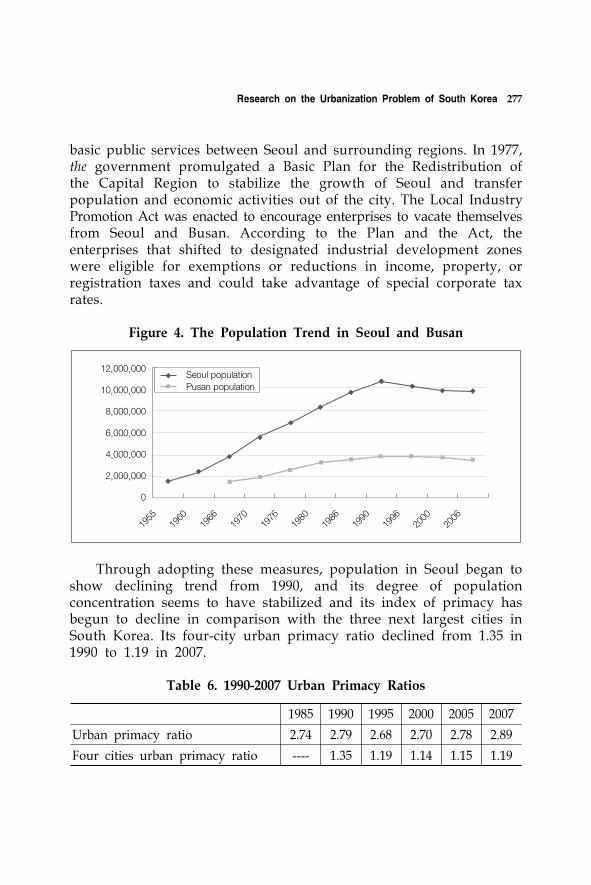
Research on the Urbanization Problem of South Korea 277
basic public services between Seoul and surrounding regions. In 1977, the government promulgated a Basic Plan for the Redistribution of the Capital Region to stabilize the growth of Seoul and transfer population and economic activities out of the city. The Local Industry Promotion Act was enacted to encourage enterprises to vacate themselves from Seoul and Busan. According to the Plan and the Act, the enterprises that shifted to designated industrial development zones were eligible for exemptions or reductions in income, property, or registration taxes and could take advantage of special corporate tax rates.
12,000,000
10,000,000
8,000,000
6,000,000
4,000,000
2,000,000
0
1955
1960
1966
1970
1976
1980
1986
1990
1996
2000
2006
Seoul populationPusan population
Figure 4. The Population Trend in Seoul and Busan
Through adopting these measures, population in Seoul began to show declining trend from 1990, and its degree of population concentration seems to have stabilized and its index of primacy has begun to decline in comparison with the three next largest cities in South Korea. Its four-city urban primacy ratio declined from 1.35 in 1990 to 1.19 in 2007.
1985 1990 1995 2000 2005 2007
Urban primacy ratio 2.74 2.79 2.68 2.70 2.78 2.89
Four cities urban primacy ratio ---- 1.35 1.19 1.14 1.15 1.19
Table 6. 1990-2007 Urban Primacy Ratios
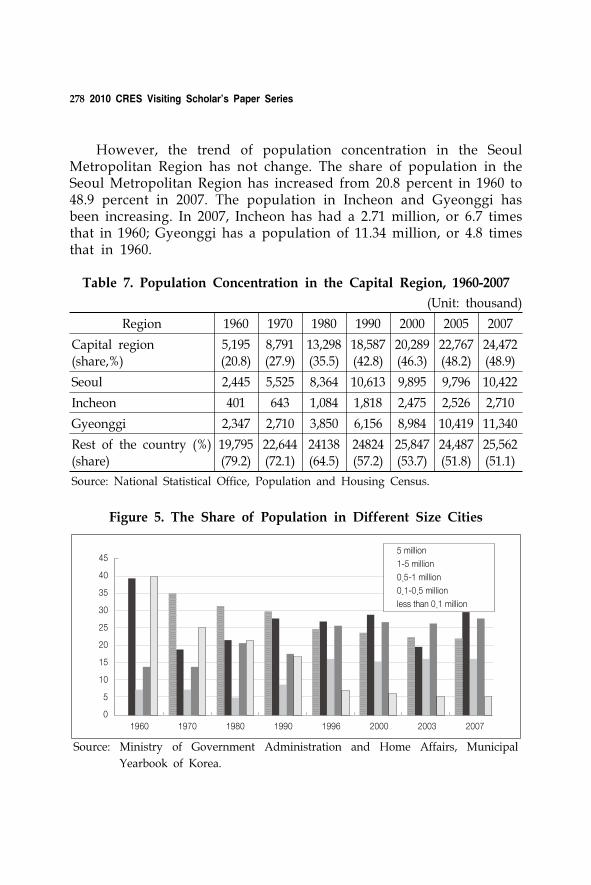
278 2010 CRES Visiting Scholar’s Paper Series
However, the trend of population concentration in the Seoul Metropolitan Region has not change. The share of population in the Seoul Metropolitan Region has increased from 20.8 percent in 1960 to 48.9 percent in 2007. The population in Incheon and Gyeonggi has been increasing. In 2007, Incheon has had a 2.71 million, or 6.7 times that in 1960; Gyeonggi has a population of 11.34 million, or 4.8 times that in 1960.
Region 1960 1970 1980 1990 2000 2005 2007
Capital region(share,%)
5,195(20.8)
8,791(27.9)
13,298(35.5)
18,587(42.8)
20,289(46.3)
22,767(48.2)
24,472(48.9)
Seoul 2,445 5,525 8,364 10,613 9,895 9,796 10,422
Incheon 401 643 1,084 1,818 2,475 2,526 2,710
Gyeonggi 2,347 2,710 3,850 6,156 8,984 10,419 11,340
Rest of the country (%)(share)
19,795(79.2)
22,644(72.1)
24138(64.5)
24824(57.2)
25,847(53.7)
24,487(51.8)
25,562(51.1)
Source: National Statistical Office, Population and Housing Census.
Table 7. Population Concentration in the Capital Region, 1960-2007
(Unit: thousand)
45
40
35
30
25
20
15
10
5
01960 1970 1980 1990 1996 2000 2003 2007
5 million
1-5 million
0.5-1 million
0.1-0.5 million
less than 0.1 million
Source: Ministry of Government Administration and Home Affairs, Municipal
Yearbook of Korea.
Figure 5. The Share of Population in Different Size Cities

Research on the Urbanization Problem of South Korea 279
In spite of almost half of Korea’s population being concentrated in the Seoul Metropolitan Region, the size structure of the urban hierarchical system is relatively reasonable. In 1960, big cities with populations of 1-5 million and small cities with less than 0.1 million hold a leading post. It was difficult to carry out the division of labor and collaboration. In 2007, the number of cities or the proportion of population among different size cities have changed, which is conducive to creating rational divisions of labor and collaboration among city.
4.2. To Format the Rational Function Structure of Urbana’s Hierarchical System
Through a long development process, South Korea formed an urban hierarchical system with rational division of labor and the complementarity of function.
As the capital of South Korea, Seoul has played an important role of leading the development of Korea’s economy. In a long time, Seoul focused on the domestic service industry, so that the economic development of the nation as a whole is maintained. The service output of Seoul accounted for 63.2 percent of all services in Korea. As for the state of services in 2007, the world’s leading global companies such as Samsung, LG, Hyundai and so on, are headquartered in Seoul.
As a port city, Busan has played a crucial role in Korea’s export-oriented development strategy. At the same time, the city has actively developed port-related industries so as to help give form to the structure of heavy and chemical industries. So far, the main industries in the city are automotive, petroleum chemistry, mechanical equipment, electronic components, fiber, clothing, leather, footwear, rubber, papering making, tobacco, logistics, etc. The city of Busan intends to become the centre of maritime transport and logistics in Northeast Asia
Daegu also has an industry-and-business-oriented economy, known mostly for its textile industry. The city’s other major industries include machinery, metals, fiber, automotive parts, rubber, plastics and so on. In 2007, services contributed to 68.6 percent of the city’s economic output; mining industry accounted for 20.5 percent, construction
280 2010 CRES Visiting Scholar’s Paper Series
industry represented 10.5 percent, with the remaining 0.5 percent taken up by agriculture and forestry. To speed up the upgrade of its textile industry, Daegu city proposed the famous “Milan Plan’ to transform it into a high value-added base for the fiber and garment industry, stating its intentions to become a fashion centre emulating Milano.
Incheon is a major city nearest to Seoul. The city is often referred to as the gateway to Northeast Asia because of the Port of Incheon and Incheon International Airport. The Port of Incheon, with an annual volume of 75,000,000 tons unloaded, makes it Korea’s second largest trading port. Incheon International Airport, after its official opening in 2001, currently operates two runways; and is the third largest in the world in cargo volume, one of the top 10 in passenger traffic, making it Asia’s busiest the transport hub. As an important industrial city in Korea with 1.6% primary industry, 43.5% secondary industry, and the tertiary industry constituted 54.9%. Main products are automobile manufacturing, steel, electronic products, machinery, logistics industry, information and communication industries and so on. Incheon has played a central role during South Korea’s rapid economic development in the 1960s.
Gwangju not only is the fifth largest city in South Korea, but also the administrative, military, economic, social, and cultural hub of southwestern Korea. The city is located near Korea’s great agricultural plain and is known as the “Land of Three” namely rice, cotton, and silk. Its industrial structure is dominated by tertiary industries. Agriculture accounted for 2.4 percent, mining and manufacturing account for 27.7 percent, and the services sector accounted for 69.9 percent. In recent years, the city is actively developing light industry, design industry, high-tech parts and components industries, and other three core strategic industries on grounds of upgrading its automotive, mechanical, electrical, electronics industries and so on.
Daejeon in central South Korea is Korea’s sixth largest city. It has played the role of hub role in urban hierarchical system because of convenient transportation; all other cities in Korea are a half-day’s travel from Daejeon. 2.5 percent of the city’s GDP is from primary industry, 15.5 percent from secondary industry, and 82 percent is from tertiary industries including retail, dining and other major sectors of the industry. Major industrial categories are fiber, machinery
Research on the Urbanization Problem of South Korea 281
and chemical. Technology-driven high-tech industrial base is now redoubling its efforts to become established in Daejeon; electronics, telecommunication and other new industries have begun to take shape. The city has a well-developed science and technology field, and is often referred to as “Korea’s Silicon Valley”.
Ulsan is the largest industrial city in South Korea. Industry in the city boomed after Ulsan was designated Korea’s the first special industry zone in 1962. Its industrial structure is dominated by the secondary industry. The main industries include automotive, petroleum chemistry, mechanical equipment, steel, shipbuilding, and nonmetals and so on. The city is developing fine chemical, environmental, and other value-added industries. Hyundai autom plant in Ulsan produces 1.6 million cars a year, the greatest output by a single automobile producing facility in the world. Hyundai Heavy Industries is the largest shipbuilding enterprise in the world. SK Petrochemical Enterprise’s facility in Ulsan is the largest factory in the field in South Korea.
city Main industry
SeoulCultural and creative industry; finance; economic headquarters; tourism;
Busanautomotive, petrochemical, mechanical equipment, electronic components, fiber, clothing, leather, footwear, rubber, papermaking, tobacco, logistics, etc
DaeguMachinery & metal, fiber, automotive parts, rubber, plastics, business, tourism
IncheonAutomobile manufacturing, steel, electronic products, machinery, logistics industry, information and communication industries, etc
GwangjuAutomotive, mechanical, electrical, electronics, light industry, design industry, high-tech parts and components industries,
culture and tourism industries, etc.
DaejeonRetail, dining, fiber, machinery and chemical, electronics,
telecommunication, high-tech industry and so on.
UlsanAutomotive, petrochemical, mechanical equipment, steel,
shipbuilding, fine chemical, environmental industry and so on.
Source: the introduction of each city.
Table 8. The Function Structure of the Urban Hierarchical System
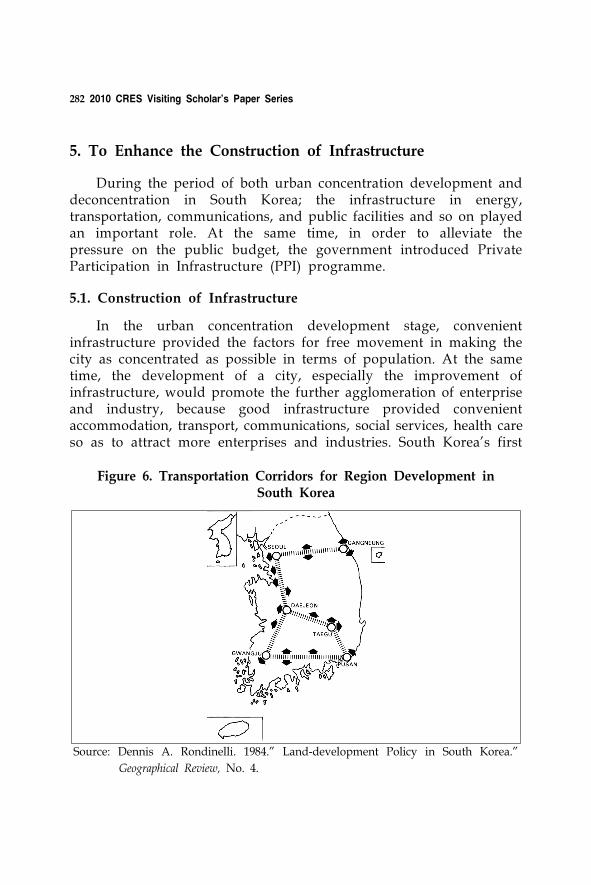
282 2010 CRES Visiting Scholar’s Paper Series
Source: Dennis A. Rondinelli. 1984.” Land-development Policy in South Korea.”
Geographical Review, No. 4.
Figure 6. Transportation Corridors for Region Development in South Korea
5. To Enhance the Construction of Infrastructure
During the period of both urban concentration development and deconcentration in South Korea; the infrastructure in energy, transportation, communications, and public facilities and so on played an important role. At the same time, in order to alleviate the pressure on the public budget, the government introduced Private Participation in Infrastructure (PPI) programme.
5.1. Construction of Infrastructure
In the urban concentration development stage, convenient infrastructure provided the factors for free movement in making the city as concentrated as possible in terms of population. At the same time, the development of a city, especially the improvement of infrastructure, would promote the further agglomeration of enterprise and industry, because good infrastructure provided convenient accommodation, transport, communications, social services, health care so as to attract more enterprises and industries. South Korea’s first
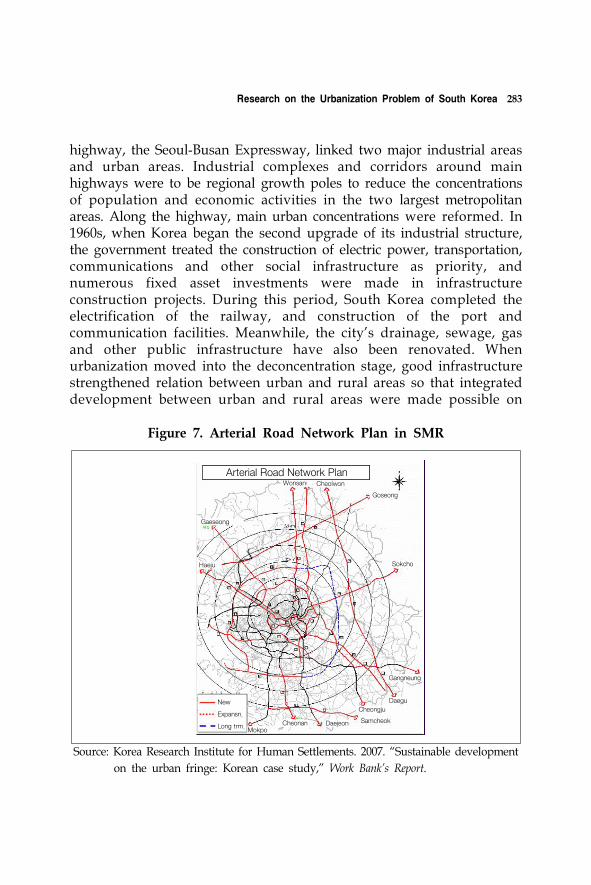
Research on the Urbanization Problem of South Korea 283
Gaeseong
Wonsan Cheolwon
Goseong
Sokcho
Gangneung
Daegu
Samcheok
Cheongju
DaejeonCheonanMokpo
New
Expansn.
Long trm.
Haeju
Arterial Road Network Plan
Source: Korea Research Institute for Human Settlements. 2007. “Sustainable development
on the urban fringe: Korean case study,” Work Bank’s Report.
Figure 7. Arterial Road Network Plan in SMR
highway, the Seoul-Busan Expressway, linked two major industrial areas and urban areas. Industrial complexes and corridors around main highways were to be regional growth poles to reduce the concentrations of population and economic activities in the two largest metropolitan areas. Along the highway, main urban concentrations were reformed. In 1960s, when Korea began the second upgrade of its industrial structure, the government treated the construction of electric power, transportation, communications and other social infrastructure as priority, and numerous fixed asset investments were made in infrastructure construction projects. During this period, South Korea completed the electrification of the railway, and construction of the port and communication facilities. Meanwhile, the city's drainage, sewage, gas and other public infrastructure have also been renovated. When urbanization moved into the deconcentration stage, good infrastructure strengthened relation between urban and rural areas so that integrated development between urban and rural areas were made possible on
284 2010 CRES Visiting Scholar’s Paper Series
one hand, but on the other hand, impacted the framework of urban hierarchical structure, changing the number of regional centers and the radius of radiation and promotion scope. For example, in order to deconcentrate many industrial activities from Seoul to surrounding areas or satellite cities in the capital region, or to the southeastern coastal belt in case of Busan, and to various cities along the northwest and southeastern coasts, the government constructed many highways to link industrial-promotion areas in twenty-four cities and towns. Substantial portions of the nationwide highway system linking the various regions in South Korea-more than 4,500 kilometers of expressways and highways- were constructed during the 1970s. Infrastructure and services such as water, sewage and electricity were extended to large cities and towns in almost every part of the country. By the late 1970s, the satellite urban centers in the Seoul metropolitan area were growing more rapidly than the city itself. In 1982, the Capital Region Management Act was introduced to optimize distribution of population and industries away from the Seoul region. During the late 1980s, five new towns were developed in the Seoul metropolitan region to accommodate 293,000 housing units and 1,173 thousand people. In recent years, in order to relieve housing shortage and reckless land development, the government plans to develop another five new towns surrounding the capital. Meanwhile, to strengthen the linkage among towns and between Seoul and the new towns, expressways, railroads, construction of transfer parking spaces, and public garages were focused on. According to the Special Act on the Management of the Regional Transportation System, emphasis was placed on the improvement of bottlenecks and cut-off sections of regional roadways that run through different administrative boundaries. During the first five-year transportation plan for the capital region, two-thirds of the planned region-wide roads were completed. For the second plan, 11 new roads were proposed and most of them are currently under construction. In provincial metropolitan areas, 15 regional roadways were proposed. Now Seoul metropolitan region has relatively good public transportation networks, like subway and public buses, which provide commuters with cheap transportation and easy access. All adjacent cities are also well connected to Seoul via either direct trunk roads (e.g., exclusive bus roads, highways, and subways) or circulation roads, which played an important role during deconcentration, and the
Research on the Urbanization Problem of South Korea 285
share of Seoul’s population out of the national total decreased from 24.45 percent in 1990 to 20.75 percent in 2005. In the early 1990s, during the third comprehensive national territorial development plan, the plan for development of the West Coast Expressway was another typical example of expanding the infrastructure to stimulate the comprehensive development of regional economies. Infrastructure including highways, airports and ports was rapidly constructed. The West Coast Highway, with the length of 483 km went from Incheon to Mokpo, and was connected to Suncheon and Gwangyangn (South Jeolla province), whose container port in Jeollanam-do is the second largest logistics center of in South Korea, next only to Busan. A large number of inputs in transportation, information, and communication partly alleviated the restrictions from natural and regional factors, and promoted the deconcentration of economic activity.
5.2. To Launch Related Laws in Infrastructure Construction
It was worth noting that the South Korean government had promulgated various laws and ordinances to discipline and control the construction of infrastructure, which built a solid foundation for transcending administrative boundaries and the functional organization of metropolitan areas. For example, as early as 1963, South Korea promulgated the “Comprehensive Land Construction Law” in order to have a master plan for urban and industrial development. In 1964, the Government has promulgated and implemented the “Industrial Park Export Promotion Act”. The Act allowed the sale of state-owned land in planned industrial complexes and to concentrate limited funds on road, water supply and other infrastructure. At the same time, also enacted were the “Land Use Management Law”, “Regional Industrial Development Act”, “Urban Revitalization Law” and “Environmental Protection Law”, in addition to the amendment of the “City Planning Act” to encourage the greening around the city and remedy the chaos of urban construction.
5.3. To Innovate Financial Patterns of Infrastructure
Provision of adequate infrastructure facilities was one of the main policies of the government to achieve economic growth and
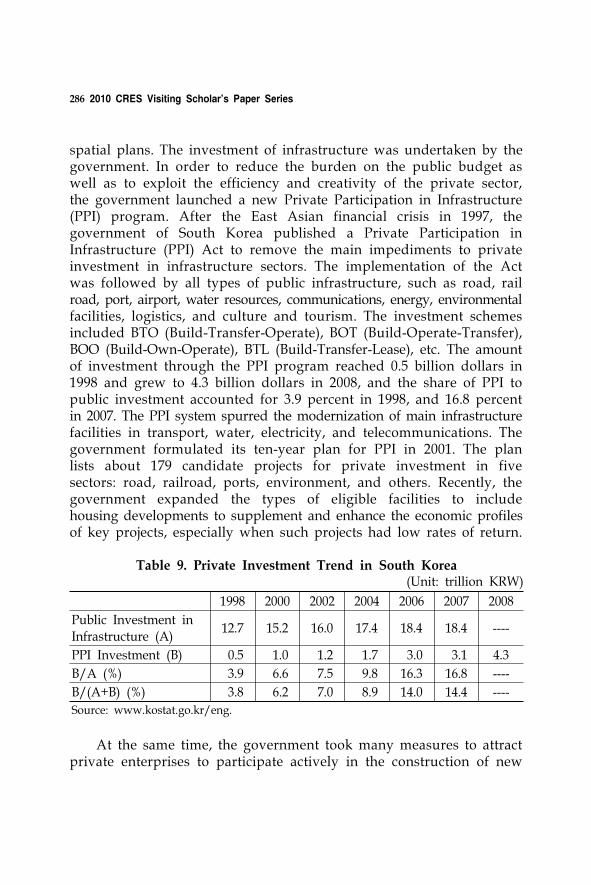
286 2010 CRES Visiting Scholar’s Paper Series
spatial plans. The investment of infrastructure was undertaken by the government. In order to reduce the burden on the public budget as well as to exploit the efficiency and creativity of the private sector, the government launched a new Private Participation in Infrastructure (PPI) program. After the East Asian financial crisis in 1997, the government of South Korea published a Private Participation in Infrastructure (PPI) Act to remove the main impediments to private investment in infrastructure sectors. The implementation of the Act was followed by all types of public infrastructure, such as road, rail road, port, airport, water resources, communications, energy, environmental facilities, logistics, and culture and tourism. The investment schemes included BTO (Build-Transfer-Operate), BOT (Build-Operate-Transfer), BOO (Build-Own-Operate), BTL (Build-Transfer-Lease), etc. The amount of investment through the PPI program reached 0.5 billion dollars in 1998 and grew to 4.3 billion dollars in 2008, and the share of PPI to public investment accounted for 3.9 percent in 1998, and 16.8 percent in 2007. The PPI system spurred the modernization of main infrastructure facilities in transport, water, electricity, and telecommunications. The government formulated its ten-year plan for PPI in 2001. The plan lists about 179 candidate projects for private investment in five sectors: road, railroad, ports, environment, and others. Recently, the government expanded the types of eligible facilities to include housing developments to supplement and enhance the economic profiles of key projects, especially when such projects had low rates of return.
1998 2000 2002 2004 2006 2007 2008
Public Investment in Infrastructure (A)
12.7 15.2 16.0 17.4 18.4 18.4 ----
PPI Investment (B) 0.5 1.0 1.2 1.7 3.0 3.1 4.3
B/A (%) 3.9 6.6 7.5 9.8 16.3 16.8 ----
B/(A+B) (%) 3.8 6.2 7.0 8.9 14.0 14.4 ----
Source: www.kostat.go.kr/eng.
Table 9. Private Investment Trend in South Korea (Unit: trillion KRW)
At the same time, the government took many measures to attract private enterprises to participate actively in the construction of new
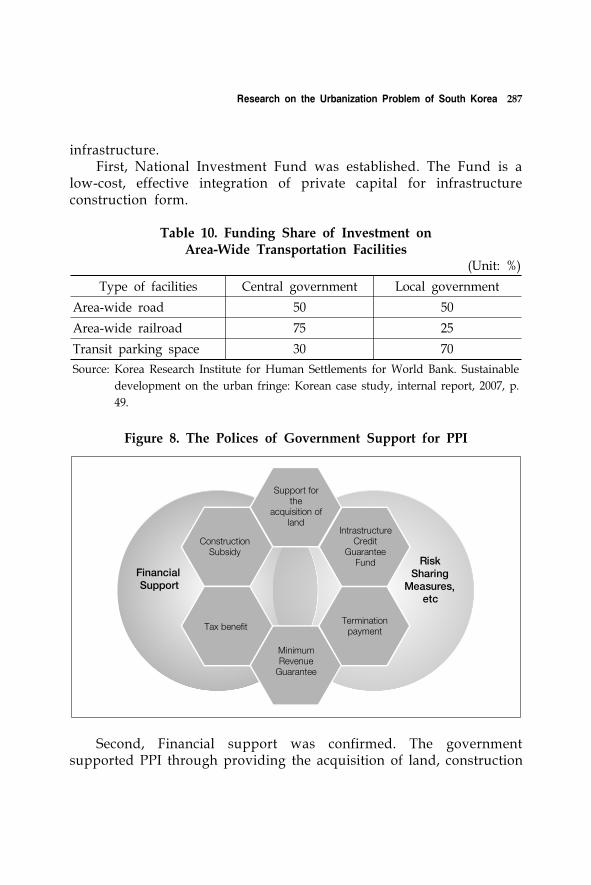
Research on the Urbanization Problem of South Korea 287
infrastructure.First, National Investment Fund was established. The Fund is a
low-cost, effective integration of private capital for infrastructure construction form.
Type of facilities Central government Local government
Area-wide road 50 50
Area-wide railroad 75 25
Transit parking space 30 70
Source: Korea Research Institute for Human Settlements for World Bank. Sustainable
development on the urban fringe: Korean case study, internal report, 2007, p.
49.
Table 10. Funding Share of Investment on Area-Wide Transportation Facilities
(Unit: %)
FinancialSupport
Support forthe
acquisition ofland
ConstructionSubsidy
Tax benefit
MinimumRevenue
Guarantee
Terminationpayment
IntrastructureCredit
GuaranteeFund Risk
SharingMeasures,
etc
Figure 8. The Polices of Government Support for PPI
Second, Financial support was confirmed. The government supported PPI through providing the acquisition of land, construction
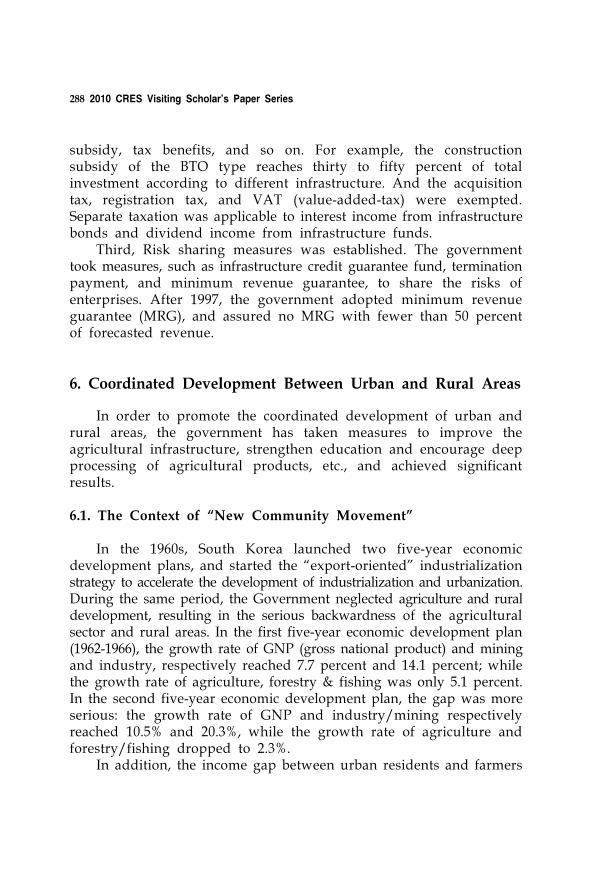
288 2010 CRES Visiting Scholar’s Paper Series
subsidy, tax benefits, and so on. For example, the construction subsidy of the BTO type reaches thirty to fifty percent of total investment according to different infrastructure. And the acquisition tax, registration tax, and VAT (value-added-tax) were exempted. Separate taxation was applicable to interest income from infrastructure bonds and dividend income from infrastructure funds.
Third, Risk sharing measures was established. The government took measures, such as infrastructure credit guarantee fund, termination payment, and minimum revenue guarantee, to share the risks of enterprises. After 1997, the government adopted minimum revenue guarantee (MRG), and assured no MRG with fewer than 50 percent of forecasted revenue.
6. Coordinated Development Between Urban and Rural Areas
In order to promote the coordinated development of urban and rural areas, the government has taken measures to improve the agricultural infrastructure, strengthen education and encourage deep processing of agricultural products, etc., and achieved significant results.
6.1. The Context of “New Community Movement”
In the 1960s, South Korea launched two five-year economic development plans, and started the “export-oriented” industrialization strategy to accelerate the development of industrialization and urbanization. During the same period, the Government neglected agriculture and rural development, resulting in the serious backwardness of the agricultural sector and rural areas. In the first five-year economic development plan (1962-1966), the growth rate of GNP (gross national product) and mining and industry, respectively reached 7.7 percent and 14.1 percent; while the growth rate of agriculture, forestry & fishing was only 5.1 percent. In the second five-year economic development plan, the gap was more serious: the growth rate of GNP and industry/mining respectively reached 10.5% and 20.3%, while the growth rate of agriculture and forestry/fishing dropped to 2.3%.
In addition, the income gap between urban residents and farmers
Research on the Urbanization Problem of South Korea 289
became more and more pronounced. The proportion of a farmer’s average income compared to an urban resident dropped from 71% in 1962 to 61% in 1970. At that time, the percentage of the rural population operating less than 1 hectare of arable land was 67% of the total, with their average income less than 50% of urban resident incomes. The prevalence of the income gap between urban and rural populations was a growing trend. The sharp contrast between urban and rural life forced a large number of young farmers to leave their home regions for the cities. After that, there was a critical lack of young rural labor. According to the Statistics of Korea Institute of Spatial Development, in 1978, women accounted for 45% of all labor in rural areas and the proportion of the rural workforce aged over 50 increased to 30%, which pushed agricultural production in some areas to the edge of collapse. The relative backwardness of agriculture led to a shrinking market for industrial products and the waste of foreign exchange for excess food imports, which posed a significant threat to sustainable economic growth. Faced with these serious problems, the Korean government had launched the “New Community (Saemaul) Movement.” In 1972, “balanced development between industry and agriculture” and “Economic Development in Agricultural and Fishery Sectors” were treated as the foremost tasks in the third five- year plan.
6.2. The Main Experiences of “New Community Movement”
6.2.1. To improve rural infrastructure In April 22 1970, the New Community Movement began under the
slogan, “self-help in rebuilding our communities”. The main content of the New Community Movement included five aspects, namely, increasing investment in infrastructure, welfare improvement, environmental improvement, spiritual inspiration and cities and plant construction. Meanwhile, Korea’s local governments sought advice from more 33,000 villages to confirm issues which needed to be resolved in the process of agricultural modernization. 16 projects were ultimately confirmed, involving mostly construction of roads, bridges, ditches and other agricultural infrastructure and housing, drinking water, electrification and other infrastructure for modern living. The South Korean Ministry of the Interior based its projections in accordance with the order of
290 2010 CRES Visiting Scholar’s Paper Series
priority among these 16 projects. The Government paid for cement and steel for more than 33,000 villages, and allowed the villagers to use these materials to improve the village facilities; but land, fee, labor and working hours would have to be arranged by the villagers themselves. At the beginning of the New Community Movement, majority of the investment was undertaken by farmers, for example, as the burden on farming communities was more double the government investment in 1971, up to 83.7 percent of total payment. In order to guide the competition between the villages, the Government adopted a “selective support” strategy. After the implementation of the policy of improving agricultural infrastructure and rural living environment, investment was mainly undertaken by government. In addition, the South Korean government has also formed a the highest governing body for the “New Village Movement” - “New Village Movement Central Council.”
6.2.2. To increase agriculture technology content and adjust agriculture structure
From 1974 to 1976, the “New Community Movement” moved into the development stage as incomes increased. The movement also gradually spread from rural areas to major cities, and became a nationwide, and not just rural, modernization activity. During this period, the focus of reform transferred from the improvement of the rural environment and living conditions of farmers to increasing farmer incomes, structural adjustments in agriculture, and advancement of technology. From 1972 to 1976, in order to increase non- agricultural incomes for farmers, the South Korean government launched the “Second Plan for increasing Agricultural and Fishing Incomes”, also known as “the Plan for Increasing Income from the New Community Movement”, which developed 21 varieties of products including poultry, cattle, aquaculture, mushrooms and other forest products. On using the county (gun) as a unit, the plan was carried out in 137 regions. More than 750,000 households took part in the plan. The government supported the farmers through providing more financial capital and technology. Each region also made full use of comparative advantages to operate local businesses. For example, vigorously promoted in arable plains regions were the cultivation of crops such as fruit trees, and vegetables and so on; however, animal husbandry, forestry and cash crops were promoted for mountain regions. Meanwhile, the

Research on the Urbanization Problem of South Korea 291
government also encouraged the construction of factories in local rural areas for deep processing of agriculture products. To increase crop production and achieve self-sufficiency on rice, South Korea began to popularize high-yielding new strains such as the “Unification” variety in rural areas in 1972. The government supported the action through scientific breeding, cultivation, management, and technical advising. Increases in crop production, rising food prices and planting of cash crops all led to the rising of farm incomes. In 1974, Korea achieved self-sufficiency in rice, and production outstripped consumption from 1975 to 1978. Animal husbandry, fisheries, forestry also underwent rapid development. In 1974, the incomes of Korean farmers had basically reached levels comparable to urban workers. The Korean farming household incomes increased from 12,456 won in 1967 to 96,355 won in 1976, and the range of increase reached 774 percent. During this period, the income of an average Korean worker increased from 20,720 won to 95,980 won, an increase of only 462 percent. Bountiful agricultural production year after year leading to increases in farmer incomes was the main result of the “New Community Movement” in this stage.
6.2.3. Deepening of agricultural processing The third stage of the “New Community Movement” mainly
involved the development of rural industry focusing on agro-processing from 1977 to 1979. The government confirmed that farmer’s income should reach 140,000 won in this period, and expanded the slogan “New Community Movement, increasing income” to “New Community Movement, increasing comprehensive income”. In order to develop rural industry and expand production, the government changed the production base from small farms to the county and towns; with production, marketing and processing as an integrated operation. Most rural industry now engaged in export processing, such as processing of agricultural or aquatic products. The achievement of rural self- reliance, which was targeted for 1981, was achieved 4 years ahead of schedule in 1977 because of the development of rural industry and significant increases in non- agricultural incomes of farmers. The 98 percent of rural villages (34,656 villages) achieved self-reliance. The number of rural enterprises increased from 384 in 1978 to 790 in 1980.
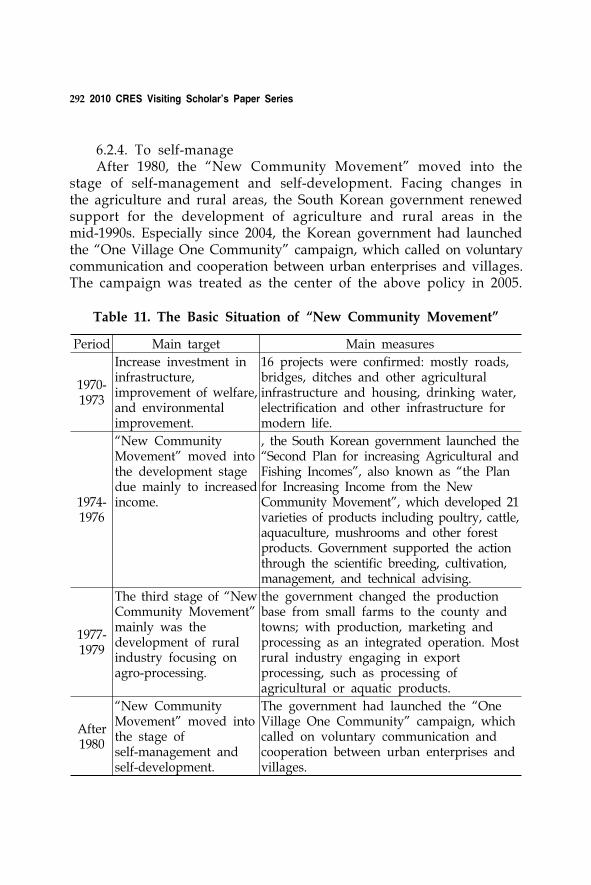
292 2010 CRES Visiting Scholar’s Paper Series
Period Main target Main measures
1970-1973
Increase investment in infrastructure, improvement of welfare, and environmental improvement.
16 projects were confirmed: mostly roads, bridges, ditches and other agricultural infrastructure and housing, drinking water, electrification and other infrastructure for modern life.
1974-1976
“New Community Movement” moved into the development stage due mainly to increased income.
, the South Korean government launched the “Second Plan for increasing Agricultural and Fishing Incomes”, also known as “the Plan for Increasing Income from the New Community Movement”, which developed 21 varieties of products including poultry, cattle, aquaculture, mushrooms and other forest products. Government supported the action through the scientific breeding, cultivation, management, and technical advising.
1977-1979
The third stage of “New Community Movement” mainly was the development of rural industry focusing on agro-processing.
the government changed the production base from small farms to the county and towns; with production, marketing and processing as an integrated operation. Most rural industry engaging in export processing, such as processing of agricultural or aquatic products.
After 1980
“New Community Movement” moved into the stage of self-management and self-development.
The government had launched the “One Village One Community” campaign, which called on voluntary communication and cooperation between urban enterprises and villages.
Table 11. The Basic Situation of “New Community Movement”
6.2.4. To self-manage After 1980, the “New Community Movement” moved into the
stage of self-management and self-development. Facing changes in the agriculture and rural areas, the South Korean government renewed support for the development of agriculture and rural areas in the mid-1990s. Especially since 2004, the Korean government had launched the “One Village One Community” campaign, which called on voluntary communication and cooperation between urban enterprises and villages. The campaign was treated as the center of the above policy in 2005.
Research on the Urbanization Problem of South Korea 293
Meantime, the Korean government plans to enact “Urban and Rural Communication and Promotion Law”, through which the “One Village One Community” campaign was carried out
6.3. The Effect of “New Community Movement”
During the 10 years from 1970 to 1980, the cumulative investment by South Korean government for the “New Community Movement” totaled about 2.8 trillion won, or 1 percent of its financial expenditure. In the meantime, the cumulative participants in the movement reached 1.1 billion persons. The effect was very obvious, as it lead to visible improvement in production and living conditions of farmers.
6.3.1. Enhancement of rural life and living environmentAt the beginning of the “New Community Movement” in 1971,
about 80 percent of the farmers resided in thatched cottages. Roads, bridges, drainage, water supply facilities and other infrastructure were either antiquated or lacking. To improve the living environment and infrastructure in rural areas, the Government promoted housing reconstruction, paving of roadways, bridge building, construction of water supply facilities, etc. These were no small achievements. By the late 1970s, 35950 new ‘Community Halls’ have been built, rural electricity supply increased from 24 percent in 1970 to 98 percent in 1979, all rural communities were open to outside traffic, and nearly all farmers used tap water. The thriving agricultural sector laid a solid foundation for the comprehensive development of the national economy. GDP rose from 9 billion U.S. dollars in 1971 to 66.8 billion U.S. dollars in 1981; per capita GDP jumped from 277 U.S. dollars in 1971 to 1734 U.S. dollars during the same period. During the period 1970~1987, South Korea was ranked second in the world in economic growth, and maintained high economic growth rate for an extended period.
6.3.2. To improve agricultural infrastructure and the increase of farmer income
In 1979, rural road construction reached 61,201km, which outstripped the original goal. From 1970 to 1979, the government built 4,440km’s of new irrigation canals; 44,000km’s of new roads; and widened 40,000km’s of existing roads. Through the promotion of high-yield

294 2010 CRES Visiting Scholar’s Paper Series
Effect Main indicator
The improvement
in rural life and living environment
35950 new ‘Community Halls’ have been built, rural
electricity supply increased from 24 percent in 1970 to 98 percent in 1979, all rural communities were open to outside traffic, and nearly all farmers used tap water. The thriving
agricultural sector laid a solid foundation for the comprehensive development of the national economy. GDP rose from 9 billion U.S. dollars in 1971 to 66.8 billion U.S.
dollars in 1981; per capita GDP jumped from 277 U.S. dollars in 1971 to 1734 U.S. dollars during the same period.
The improvement
of agricultural infrastructure and the
increase of farmer incomes
In 1979, rural road construction reached 61,201 km, which outstripped the original goal. 4,440 km’s of new irrigation canals; 44,000 km’s of new roads; and widening 40,000 km’s
of existing roads., agriculture economy moved away from self-sufficiency into a commodity economy through promotion of high-yield seeds. The promotion of high-yield seeds
reduced the labor required, increased food supply and promoted agricultural mechanization. The average income of farmers increased 10.5 times from 260,000 won in 1970 to 2.7
million won in 1980.
Placing importance on education and
training
Both central and local governments established corresponding
education and training institutions. Education and training forms larger background for regional development, increased awareness of reform, and technology promotion. Education
and training nurtures “self-reliance, self-help, diligence, and cooperation” among farmers.
Table 12. The Effect of “New Community Movement”
seeds, agriculture economy moved away from self-sufficiency into a commodity economy. At the same time, the promotion of high-yield seeds also reduced the labor required, increased food supply and promoted agricultural mechanization. According to statistics, the average income of farmers increased from 260,000 won in 1970 to 2.7 million won in 1980, an increase of 10.5 times.
6.3.3. Placing priority on education and trainingThe core of the “New Community Movement” was education
Research on the Urbanization Problem of South Korea 295
and training. Both central and local governments established corresponding education and training institutions. Education and training formed the larger background for regional development, increased awareness of reform, and technology promotion. Education and training nurtured ideas on “self-reliance, self-help, diligence, and cooperation” among farmers.
7. To Play the Role of Government
In addition to a series of policies and measures, South Korea also adopted the five-year plan and the Comprehensive National Territorial Development Plan to strengthen guidance for industrial and spatial development. Although South Korea has not formulated a five-year plan since the 1990s, Comprehensive National Territorial Development Plan has been playing an important role.
7.1. Formulating the Five-Year Plans
Korea’s economy remained basically agricultural until the late 1950s. In 1961, in order to speed up economic development, a mixed economic system where planning and market regulation existed alongside market forces was adopted. The point which became “first priority” was to building the economy, namely placing the building of the economy at the center of all things. At the same time, the central government established the Economic Planning Board to strengthen government intervention in economic activities and guide economic development. It was responsible for coordinating relationship among central government departments, submitting economic proposals to cabinet meetings, a variety of important economic policies, submitting reports for economic planning, and its chairman presided as the president of the “Economic Ministries Executive Council” and so on. Although the Korean government does not have a mandatory program, it is also very effective. It was under this system that the government began to make five-year economic development plans.
In 1962, in order to break the national economy out of its high dependence on imports and U.S. aid, Korea formulated its first five-year plan to implement the so-called “non-balanced growth
296 2010 CRES Visiting Scholar’s Paper Series
strategy”. From 1962 to 1966, the focus of the first five-year plan was to develop import substitution industries, increase investment, and to improve self-sufficiency in industrial products and reduce dependence on foreign products. Turning towards its vast pool of labor, Korea actively developed labor-intensive industries. Korean textiles soon became successes in the international market. The strategy not only speeded economic growth, but also accelerated migration. In 1964, the Korean government established the first domestic export processing zones, namely the Guro Industrial zone. In 1967, another industrial zone was established in Seoul. Seoul attracted more and more people due to the construction of industrial zones. During the period, the annual growth of manufacturing sector reached 15 percent, the annual growth of merchandise exports reached 44 percent, the share of investment accounted for 20 percent of the GDP, agriculture and fisheries sector employed about 60 percent of Korea’s total workforce.
In 1967, Korea initiated the second five-year plan. The plan focused on the policy of export-led growth, and especially emphasized on the development of heavy industry. In 1968, the Korean government promulgated the “Automotive Industry Development Act”; and a series of laws were enacted in 1969 including the “Steel Industry Development Act”, “Machinery Industry Development”, “Electronic Industry Development Act”, “Shipbuilding Industry Development Act”; laws which regulated development plans for heavy industries, concessions, construction site, financing, product direction, technology transfer and national direct investment. In 1970, an integrated steel facility and Gumi Electronic Industrial complex began to be built in North Gyeongsang Province. In the same year, Hyundai set up its shipbuilding arm and an auto parts company in Ulsan, South Gyeongsang province. From then on, capital-intensive and heavy industry became concentrated in South and North Gyeongsang provinces. At the same time, in order to coordinate the relationship between urban and rural areas, and heavy industries and light industries, the government transferred more and more profits from heavy industry to large-scale rural development programs in 1971, and also actively supported the rapid expansion of export-oriented light industry sector. During the second five-year plan, Korean economy achieved an amazing level of success. The annual growth of the manufacturing sector reached 21.1 percent, the annual growth of merchandise export reached 35 percent, the share of investments

Research on the Urbanization Problem of South Korea 297
accounted for more than 30 percent of the GDP, the proportion of the workforce employed in agriculture and fisheries sectors decreased to 49 percent, the share of agriculture in total GDP dropped to 29 percent.
To accelerate the movement toward heavy and chemical industries, the third and fourth five-year plans maintained the general direction of the second five-year plan, but with emphasis on industrial layout and organization policy. In 1973, the Korean government launched the “Heavy Chemical Industry Declaration”, which strengthened such industries as steel, shipbuilding, non-metals, electronic, petrochemical, cement, automobiles, mechanical, ceramics; and made other investments and concessions attempting to establish these industries as mainstay industries in a short time. So, Korea established the preferential tax policy, strengthened education and scientific research, launched financial slave-based system to provide low-interest loan policy and so on for the development of these industries. The proportion of heavy and chemical industries output in total manufacturing output rose from 29.5 percent in 1971 to 51.6 percent in 1980. The heavy industry in Korea surpassed light industry in 1976, and Korea's heavy chemical industry base has been fully established from then on. The growth rate of heavy chemical industry remained significantly higher than light industry. During the period, the proportion of manufacturing in total industrial output rose from 20 percent in 1972 to 25 percent in 1981. At the same time, Korea formulated the “Industrial Distribution Law” and “Laws for Promotion of Industrial Base Development”, which encouraged industry to abstain from the excessive concentration of industrial land zoned to designated areas. In order to evacuate the population and plants from the “Capital Circle” to other locations, Korea began to construct new industrial complexes and industrial cities.
In the 1980s, due to the new condition of international variation and domestic economic fluctuations, the basic objectives of economic growth and social development began shifting from “high growth” to “stability, efficiency and balance”. The economic policy concentrated on structural adjustment. In the fifth and sixth five-year plans, the rate of economic growth respectively reached 9.2 percent and 9.3 percent. Korea’s export growth rate would exceed import growth rate in the early 1980s, and the trade deficit decreased in 1986. After that, export sector rapidly increased because of low exchange rates, low oil
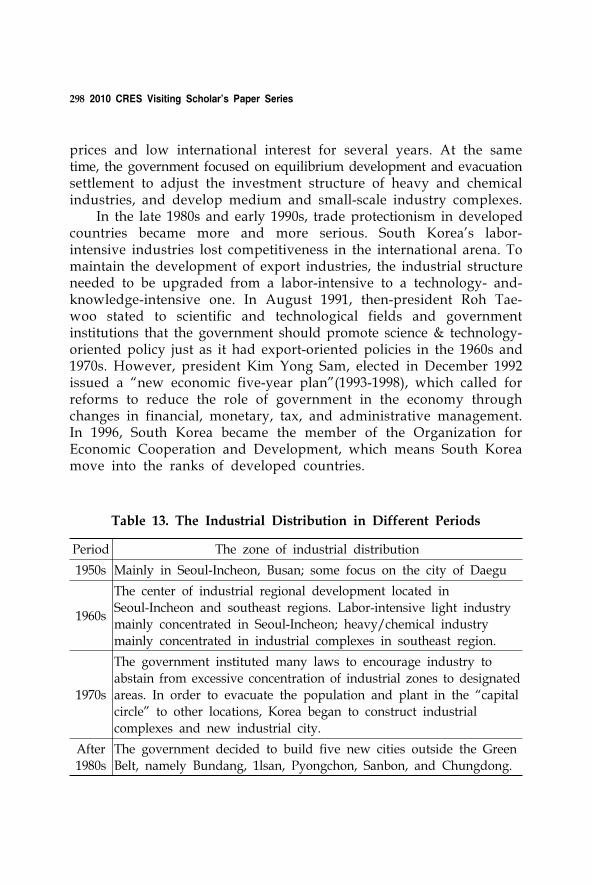
298 2010 CRES Visiting Scholar’s Paper Series
Period The zone of industrial distribution
1950s Mainly in Seoul-Incheon, Busan; some focus on the city of Daegu
1960s
The center of industrial regional development located in
Seoul-Incheon and southeast regions. Labor-intensive light industry mainly concentrated in Seoul-Incheon; heavy/chemical industry mainly concentrated in industrial complexes in southeast region.
1970s
The government instituted many laws to encourage industry to
abstain from excessive concentration of industrial zones to designated areas. In order to evacuate the population and plant in the “capital circle” to other locations, Korea began to construct industrial
complexes and new industrial city.
After 1980s
The government decided to build five new cities outside the Green Belt, namely Bundang, 1lsan, Pyongchon, Sanbon, and Chungdong.
Table 13. The Industrial Distribution in Different Periods
prices and low international interest for several years. At the same time, the government focused on equilibrium development and evacuation settlement to adjust the investment structure of heavy and chemical industries, and develop medium and small-scale industry complexes.
In the late 1980s and early 1990s, trade protectionism in developed countries became more and more serious. South Korea’s labor- intensive industries lost competitiveness in the international arena. To maintain the development of export industries, the industrial structure needed to be upgraded from a labor-intensive to a technology- and- knowledge-intensive one. In August 1991, then-president Roh Tae- woo stated to scientific and technological fields and government institutions that the government should promote science & technology- oriented policy just as it had export-oriented policies in the 1960s and 1970s. However, president Kim Yong Sam, elected in December 1992 issued a “new economic five-year plan”(1993-1998), which called for reforms to reduce the role of government in the economy through changes in financial, monetary, tax, and administrative management. In 1996, South Korea became the member of the Organization for Economic Cooperation and Development, which means South Korea move into the ranks of developed countries.
Research on the Urbanization Problem of South Korea 299
7.2. To Make Comprehensive National Territorial Development Plan
Aside from its five-year plans, the Korean government also formulated, respectively, the First Comprehensive National Territorial Development Plan (1972-1981), Second Comprehensive National Territorial Development Plan (1982-1991), Third Comprehensive National Territorial Development Plan (1992-2001), and the Fourth Comprehensive National Territorial Development Plan (2000-2020). The main goal of the First Comprehensive National Territorial Development Plan was to support infrastructure construction and pursue basic development in the metropolitan area and the southeast coast industrial zones with economic growth.
In the early 1980s, in order to achieve comprehensive development and promote the growth of more cities, the Korean government proposed the concept of multi-center space in the “Second Comprehensive National Territorial Development Plan” (1982-1991), and introduced strategic plan with development of two parts-the integrated living sphere and the growth center. However, due to insufficient financial resources of the central government and low competitiveness and other reasons, the central government realized the plan could not be implemented on time, leading the government to amend the “Second Comprehensive National Territorial Development Plan” (1987-1991) in 1987, and cancelling the models which pursued single-city growth and the central development of regional living circle; and divided the entire areas outside of the “capital circle” into southwest, southeast and middle areas, and took measures to promote the development of regional city centers. In 1982, Korea proclaimed the “Capital Region Management Law”, intended for centralized management for capital economic development, land use and infrastructure construction instead of previous local management. The law confirmed the boundaries of the capital region, and treated the urban zone of rapid development as the metropolitan area, which covered the city of Seoul, Incheon, Gyeonggi-dong and 64 lower administrative districts - an area of 11,235 square kilometers, with a population of 16,000,000. At the same time, the law proposed that a “metropolitan plan” and the Capital Region Management Committee should be set up.
In 1992, the Korean government announced the Third Comprehensive National Territorial Development Plan, which aimed to decentralize

300 2010 CRES Visiting Scholar’s Paper Series
Period
GNP
per capita
Main goal
First Comprehensive National Territorial
Development Plan (1972-1981)
$319
Support infrastructure construction and pursue basic development of metropolitan
area and the southeast coast industrial zone with economy growth.
Second Comprehensive National Territorial
Development Plan (1982-1991)
$1824
Restrain the development of Seoul metropolitan area; promote the local
economic development; improve local lifestyle,
Third Comprehensive National Territorial
Development Plan (1992-2001)
$7007decentralize spatial development by fostering the west coast industry belt and
local cities
Fourth Comprehensive National Territorial
Development Plan (2000-2020)
$9988Resolve the problem of spatial development associated with unbalanced
and environment damage in the past.
Table 14. Comprehensive National Territorial Development Plan
spatial development by fostering the west coast industry belt and local cities. At the same time, the Korean government introduced the concept of “regional development circles” into the policy of regional development; suggesting that if the cities having function relation were bundled as an urban agglomeration, which could not only complement insufficiencies in city function, improve investment efficiency and access to symbiotic development effect, but also compete with international urban agglomerations.
In 2000, with the liberalization of the world economy and rapid progress in information technology in the background, the fourth Comprehensive National Territorial Development Plan aimed to resolve the problem of unbalanced spatial development and environmental damage in the past. The plan focused on balanced regional development and strengthening Korea’s position in Northeast Asia in the 21st century.
Research on the Urbanization Problem of South Korea 301
In a word, Korean government played an important role during the process of urbanization. First of all, although South Korea is a market economy, the government has always dominated the development of space-time structure. Government sector provided plans for regional economic development and also spatial plans by setting up industrial complexes to promote population concentration, which seems a typical “spatial plan” structure. This was an important mechanism in the implementation of Korea’s industrialization strategy, especially in emerging industrial cities. In the 1960s and 1970s, the reason that populations rapidly migrated to the southeastern coastal areas was due to Korea’s industrialization model-open industrialization. Furthermore, the characteristic of centralization is obvious in the Korean political system, which is the main factor in urban development concentration. As a symbol of this institution, the capital region has played an important role in the economy, politics and culture. Also, Seoul possessed a prominent function in the urban system.
8. Conclusion
All of these experiences in the process of urbanization have played an important role in promoting the steady and orderly development of urbanization. Summing up these experiences does constitute a ‘look back’, but provides reference for China’s urbanization. At present, Chinese urbanization is accelerating, currently encountering a lot of issues which are similar to South Korea during the middle phase of urbanization such as industrial structure optimization, urban system rationalization, infrastructure improvement, and urban-rural disparity reduction, etc. China is also trying to solve these problems. For example, in order to optimize industrial structure, the government is formulating plans for mainstay industries and strategic emerging industries. South Korea’s many experiences concerning upgrades of industrial structure are worthy references for China. In addition to a series of preferential policies to support industrial development, emphasis was placed on personnel training and introduction, S&T and R&D. In order to rationalize the urban system, the Chinese government is ready to formulate the first Comprehensive National Territorial Development Plan in 2011. South Korea has produced four
302 2010 CRES Visiting Scholar’s Paper Series
Comprehensive National Territorial Development Plans, and there were many successful approaches, which will bring forth important implications for China. However, China is simultaneously a developing country and a transition country; the problems in the process of urbanization are also very complicated. When we learn from the experience of South Korea, it should be combined with actual circumstances in China. At the same time, South Korean urbanization also has some lessons that must not be ignored, such as high housing prices and excessive concentration of population in the Capital Region and so on. We have to foresee and take active measures to avoid such problems.
References
Christine Genzberger. 1994. “Korea business: the portable encyclopedia for doing business with Korea.” World Trade Press.
Seong Somi. The republic of Korea’s industrial development, globalization and the prospects for regional and global integration. www.unescap.org/tid/publication/chap5_2126.pdf.
Qi Jianguo, Li Jingwen. “Korea’s industrial development policies and economic growth.” http://bic.cass.cn/info/Arcitle_Show_Study_ Show.asp?.
Woo, C. 2001. “Industrial Upgrading of Korea: Process, Prospects, and Policies, Restructuring in Asia's Newly Industrialized Economies.” In Masuyama et al. eds.
Korea Research Institute for Human Settlements.2007. “Sustainable development on the urban fringe: Korean case study.” Work Bank’s Report.
Dennis A. Rondinelli. 1984. “Land‐development Policy in South Korea.” Geographical Review, No. 4.
Junglim Hahm. 2003. “Private Participation in the Infrastructure Programme of the Republic of Korea.” Transport and Communications Bulletin for Asia and the Pacific, No. 72.
马常娥. “韩国产业结构调整及启迪.”世界经济与政治论坛, 2001年第2期。李京文.“齐建国.”韩国的产业发展政策与经济增长.” http://bic.cass.cn/info/
Arcitle_Show_Study.王德禄. “浅析韩国产业发展模式及政府产业政策.” http://gov.finance.sina.com.
Research on the Urbanization Problem of South Korea 303
cn/zsyz/2006‐11‐14/93317.html.张介岭. “韩国的“二元经济”转型之路.” http://theory.people.com.cn/BIG5/
40557/49139/49143/4154204.html.赵丛霞,金广君,周鹏光. “首尔的扩张与韩国的城市发展政策.” 城市问题,2007
年第1期。吴伟,许美婷,俞慰刚. “韩国城市化道路的分析与思考.” http://rurc.suda.edu.cn/
ar.aspx?AID=458.郑新立. “韩国“新村运动”启示录.” 人民论坛,2006年第2期。党国英. “韩国新村运动真相及对中国的启示.”http://theory.people.com.cn/GB/49169/49170/4594667.html.李东华/. “韩国的产业集聚与城市化进程.” 当代韩国,2003年第23期。
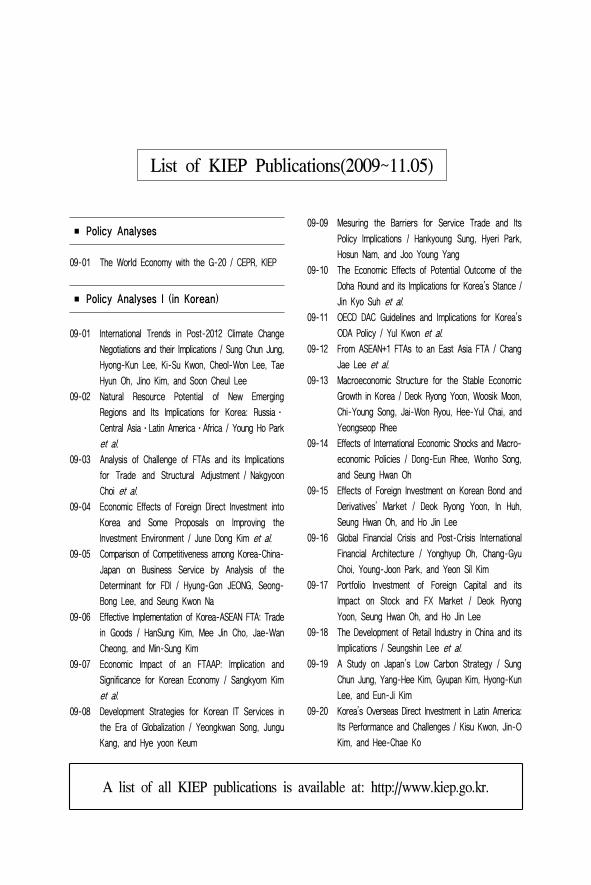
■ Policy Analyses
A list of all KIEP publications is available at: http://www.kiep.go.kr.
List of KIEP Publications(2009~11.05)
■ Policy Analyses I (in Korean)
09-01 The World Economy with the G-20 / CEPR, KIEP
09-01 International Trends in Post-2012 Climate Change
Negotiations and their Implications / Sung Chun Jung,
Hyong-Kun Lee, Ki-Su Kwon, Cheol-Won Lee, Tae
Hyun Oh, Jino Kim, and Soon Cheul Lee
09-02 Natural Resource Potential of New Emerging
Regions and Its Implications for Korea: Russiaㆍ
Central AsiaㆍLatin AmericaㆍAfrica / Young Ho Park
et al.
09-03 Analysis of Challenge of FTAs and its Implications
for Trade and Structural Adjustment / Nakgyoon
Choi et al.
09-04 Economic Effects of Foreign Direct Investment into
Korea and Some Proposals on Improving the
Investment Environment / June Dong Kim et al.
09-05 Comparison of Competitiveness among Korea-China-
Japan on Business Service by Analysis of the
Determinant for FDI / Hyung-Gon JEONG, Seong-
Bong Lee, and Seung Kwon Na
09-06 Effective Implementation of Korea-ASEAN FTA: Trade
in Goods / HanSung Kim, Mee Jin Cho, Jae-Wan
Cheong, and Min-Sung Kim
09-07 Economic Impact of an FTAAP: Implication and
Significance for Korean Economy / Sangkyom Kim
et al.
09-08 Development Strategies for Korean IT Services in
the Era of Globalization / Yeongkwan Song, Jungu
Kang, and Hye yoon Keum
09-09 Mesuring the Barriers for Service Trade and Its
Policy Implications / Hankyoung Sung, Hyeri Park,
Hosun Nam, and Joo Young Yang
09-10 The Economic Effects of Potential Outcome of the
Doha Round and its Implications for Korea's Stance /
Jin Kyo Suh et al.
09-11 OECD DAC Guidelines and Implications for Korea's
ODA Policy / Yul Kwon et al.
09-12 From ASEAN+1 FTAs to an East Asia FTA / Chang
Jae Lee et al.
09-13 Macroeconomic Structure for the Stable Economic
Growth in Korea / Deok Ryong Yoon, Woosik Moon,
Chi-Young Song, Jai-Won Ryou, Hee-Yul Chai, and
Yeongseop Rhee
09-14 Effects of International Economic Shocks and Macro-
economic Policies / Dong-Eun Rhee, Wonho Song,
and Seung Hwan Oh
09-15 Effects of Foreign Investment on Korean Bond and
Derivatives' Market / Deok Ryong Yoon, In Huh,
Seung Hwan Oh, and Ho Jin Lee
09-16 Global Financial Crisis and Post-Crisis International
Financial Architecture / Yonghyup Oh, Chang-Gyu
Choi, Young-Joon Park, and Yeon Sil Kim
09-17 Portfolio Investment of Foreign Capital and its
Impact on Stock and FX Market / Deok Ryong
Yoon, Seung Hwan Oh, and Ho Jin Lee
09-18 The Development of Retail Industry in China and its
Implications / Seungshin Lee et al.
09-19 A Study on Japan's Low Carbon Strategy / Sung
Chun Jung, Yang-Hee Kim, Gyupan Kim, Hyong-Kun
Lee, and Eun-Ji Kim
09-20 Korea's Overseas Direct Investment in Latin America:
Its Performance and Challenges / Kisu Kwon, Jin-O
Kim, and Hee-Chae Ko
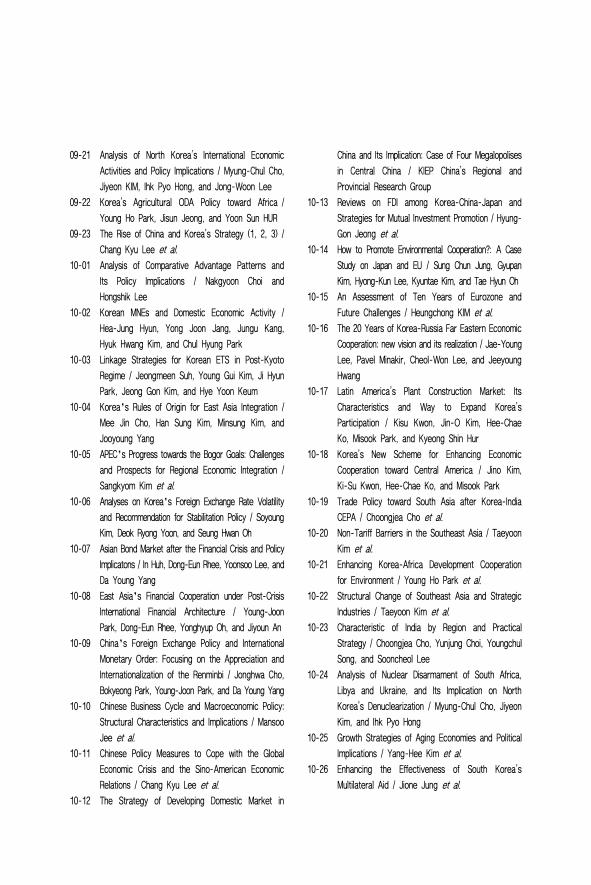
09-21 Analysis of North Korea's International Economic
Activities and Policy Implications / Myung-Chul Cho,
Jiyeon KIM, Ihk Pyo Hong, and Jong-Woon Lee
09-22 Korea's Agricultural ODA Policy toward Africa /
Young Ho Park, Jisun Jeong, and Yoon Sun HUR
09-23 The Rise of China and Korea's Strategy (1, 2, 3) /
Chang Kyu Lee et al.
10-01 Analysis of Comparative Advantage Patterns and
Its Policy Implications / Nakgyoon Choi and
Hongshik Lee
10-02 Korean MNEs and Domestic Economic Activity /
Hea-Jung Hyun, Yong Joon Jang, Jungu Kang,
Hyuk Hwang Kim, and Chul Hyung Park
10-03 Linkage Strategies for Korean ETS in Post-Kyoto
Regime / Jeongmeen Suh, Young Gui Kim, Ji Hyun
Park, Jeong Gon Kim, and Hye Yoon Keum
10-04 Korea’s Rules of Origin for East Asia Integration /
Mee Jin Cho, Han Sung Kim, Minsung Kim, and
Jooyoung Yang
10-05 APEC’s Progress towards the Bogor Goals: Challenges
and Prospects for Regional Economic Integration /
Sangkyom Kim et al.
10-06 Analyses on Korea’s Foreign Exchange Rate Volatility
and Recommendation for Stabilitation Policy / Soyoung
Kim, Deok Ryong Yoon, and Seung Hwan Oh
10-07 Asian Bond Market after the Financial Crisis and Policy
Implicatons / In Huh, Dong-Eun Rhee, Yoonsoo Lee, and
Da Young Yang
10-08 East Asia’s Financial Cooperation under Post-Crisis
International Financial Architecture / Young-Joon
Park, Dong-Eun Rhee, Yonghyup Oh, and Jiyoun An
10-09 China’s Foreign Exchange Policy and International
Monetary Order: Focusing on the Appreciation and
Internationalization of the Renminbi / Jonghwa Cho,
Bokyeong Park, Young-Joon Park, and Da Young Yang
10-10 Chinese Business Cycle and Macroeconomic Policy:
Structural Characteristics and Implications / Mansoo
Jee et al.
10-11 Chinese Policy Measures to Cope with the Global
Economic Crisis and the Sino-American Economic
Relations / Chang Kyu Lee et al.
10-12 The Strategy of Developing Domestic Market in
China and Its Implication: Case of Four Megalopolises
in Central China / KIEP China's Regional and
Provincial Research Group
10-13 Reviews on FDI among Korea-China-Japan and
Strategies for Mutual Investment Promotion / Hyung-
Gon Jeong et al.
10-14 How to Promote Environmental Cooperation?: A Case
Study on Japan and EU / Sung Chun Jung, Gyupan
Kim, Hyong-Kun Lee, Kyuntae Kim, and Tae Hyun Oh
10-15 An Assessment of Ten Years of Eurozone and
Future Challenges / Heungchong KIM et al.
10-16 The 20 Years of Korea-Russia Far Eastern Economic
Cooperation: new vision and its realization / Jae-Young
Lee, Pavel Minakir, Cheol-Won Lee, and Jeeyoung
Hwang
10-17 Latin America's Plant Construction Market: Its
Characteristics and Way to Expand Korea's
Participation / Kisu Kwon, Jin-O Kim, Hee-Chae
Ko, Misook Park, and Kyeong Shin Hur
10-18 Korea's New Scheme for Enhancing Economic
Cooperation toward Central America / Jino Kim,
Ki-Su Kwon, Hee-Chae Ko, and Misook Park
10-19 Trade Policy toward South Asia after Korea-India
CEPA / Choongjea Cho et al.
10-20 Non-Tariff Barriers in the Southeast Asia / Taeyoon
Kim et al.
10-21 Enhancing Korea-Africa Development Cooperation
for Environment / Young Ho Park et al.
10-22 Structural Change of Southeast Asia and Strategic
Industries / Taeyoon Kim et al.
10-23 Characteristic of India by Region and Practical
Strategy / Choongjea Cho, Yunjung Choi, Youngchul
Song, and Sooncheol Lee
10-24 Analysis of Nuclear Disarmament of South Africa,
Libya and Ukraine, and Its Implication on North
Korea's Denuclearization / Myung-Chul Cho, Jiyeon
Kim, and Ihk Pyo Hong
10-25 Growth Strategies of Aging Economies and Political
Implications / Yang-Hee Kim et al.
10-26 Enhancing the Effectiveness of South Korea's
Multilateral Aid / Jione Jung et al.
■ Korea's Mid- to Long-term Economic
Strategy (in Korean)
■ Regional Study Series (in Korean/English)
■ Trade and Investment Study Series
(in Korean/English)
■ Policy References I (in Korean/English)09-01 The World Economy after the Global Economic
Crisis: Current Status and its Prospects / Heungchong
KIM et al.
09-01 The Relationship between Outward Direct Investment
and Exports in the German Manufacturing Sector /
Kyuntae Kim and Hyun Jean Lee
09-02 The World Economy after the Global Economic
Crisis: Current Status and its Prospects / Heungchong
KIM et al.
10-01 The Review of the History and Structure of ‘New
Energy Policy’ of Europe Union Since 2005 /
JINHONG Joo, Kyuntae Kim, and Hyun Jean Lee
10-02 Development of European Lobbying and Case Studies /
Yoo-Duk Kang
10-03 The Problems and Reforms of Japanese Public Pension
Scheme in Connection with Population Aging and Low
Economic Growth / Yanghee Kim and Eunji Kim
10-04 Renewable Energy Policy in Germany and Its
Implications for Korea / Hyun Jean Lee and Sung-
Won Yoon
09-01 Russia's Anti-dumping System and Its Implications
for Korea / Sherzod Shadikhodjaev and Joo young Yang
09-02 Study on ways to Utilize Skilled Foreign Workers in
Korea Through Policy of Recruiting Foreign Students /
Yeongkwan Song, and Jooyoung Yang
09-03 An Evaluation of the Revised Draft Modalities for DDA
Agricultural Negotiations and Policy Implications / Jin
Kyo Suh and Ji Hyun Park
10-01 The Current State of WTO's DDA Negotiation on
Rules and Policy Implications / Nohyoung Park and
Sung-Hoon Park
10-02 The Study on Korea's Preferential Scheme for
LDCs / Mee Jin Cho and Min-Sung Kim
09-01 Nordic Aid Untying Policy: Implications on Korea's
Aid Strategy / Yul Kwon and Jisun Jeong
09-02 India's Professional Manpower and Growth of Service
Industry: Implication for Development of Knowledge
Service Industry of Korea / Soon-Cheul Lee and
Young-Chul Song
09-03 The Current Status of Covered MEAs under KORUS
FTA and Its Implications / Chang-In Yoon
09-04 Structural Changes of Japan's Economy after the
Prolonged Recession and the Global Economic
Crisis / Yang-Hee Kim and Eun-Ji Kim
09-05 ODA as a Soft Power Instrument: The EU Experience
and its Relevance for Asia / Silviu Jora
09-06 The Impacts of Enlargement on the Central and
Eastern European Countries / András Inotai09-07 A Comparative Study of the Services Sectors of
Singapore, Malaysia, and Indonesia / Kitae Sohn
and Minhee Kim
09-08 Korean FX Rates Analysis During the Financial Crisis:
Effects of Foreign Bond Investments and FX Hedged
Foreign Fund / In Huh and Young-Joon Park
09-09 Analysis on the Effects of Logistics Efficiency on
Trade Flows in East Asian Countries / Ho-Kyung Bang
09-10 An Analysis of Micromechanisms for Efficient ODA
and Its Policy Implications / Kitae Sohn and Minhee
Kim
09-11 Structural Impacts of the Global Financial Crisis
and Implications for Trade Policies / June Dong
Kim et al.
09-12 An Analysis of Investment Environment in the Area
of Central Asia's Energy Resources and its policy
Implications / Young Kwan Jo et al.
09-13 A Strategic In-Depth Study of Central Asia: Trade,
Investment Strategy Report / Sung Hak Yoon et al.
09-14 The Political Elite and Power Structure of Kazakhstan /
Jae-Young Lee et al.
09-15 Studies in Comprehensive Regional Strategies Collected
Papers I Central Asia: PoliticsㆍSocietyㆍHistoryㆍ
Culture / KIEP
09-16 Studies in Comprehensive Regional Strategies Collected
Papers II Central Asia: EconomyㆍEnergyㆍEnvironment /
KIEP
10-01 The Korea-Turkey FTA and Measures to Enhance
the Economic Cooperation / Chul CHUNG, Hankyung
SUNG, Chelwon LEE, and Tae Hyun OH
10-02 Agriculture Policies in Central Asia and Korean
Strategies for Agriculture Cooperation Improvement
with Central Asia: Kazakhstan, Uzbekistan, and
Kyrgyzstan / Young Kwan Jo and Si Young Lee
10-03 Recent Trends of Technical Barriers to Trade (TBT)
in WTO Member Countries and Policy Implications /
Yong Joon Jang and Hosun Nam
10-04 Strategic Economic Cooperation between Korea
and Mongolia in the New-Asia Era / Jae-Young
Lee and Si Young Lee and D. Ganbaatar
10-05 The Study of Characteristics on the Plant Market in
the Central Asia and Participating Strategy of
Korea / Sung Hak Yoon
10-06 The Indonesian Politics and Economy since the
Asian Financial Crisis / Ki Tae Sohn, You Jin Baik,
and Min Hee Kim
10-07 Climate Change Financing for Developing Countries:
Issues and Implication / Jione Jung and Sukyung
Park
10-08 Potential and Perspectives of Bioenergy in Africa /
Yeongho Park and Yoonsun Hur
10-09 Employment-Oriented Green Aid: Case Studies and
Implications / Baran Han and Min Hee Kim
10-10 China's Aid Policy and Strategy / Yul Kwon and
Sukyung Park
10-11 The Strategy for Economic and Development Cooperation
between Korea and Major African Countries: Ghana,
DRC, South Africa, Ethiopia / Youngho Park, Minhee
Kim and Hyelin Jeon
10-12 Economic Impact of Asia Pacific Trade Agreement /
Han Sung Kim and Hye Yoon Keum
10-13 Non-Tariff Barriers in Indonesia and Ad-Valorem
Equivalents of Non-Tariff Measures on Steel Products /
Taeyoon Kim and Jaeho Lee
10-14 A Study on the Movement of Persons in China's
FTA Negotiations / Jina Yeo
10-15 An Analysis of OECD Countries' Service Industries:
Industrial Structure, Linkage Effects, and Productivity
in Input-Output Framework / Jungu Kang
10-16 Assessment of Greater Tumen Initiative (GTI) and
Policy Roadmap / Myung-Chul CHO and Jiyeon KIM
10-17 A Study on FDI Attractiveness in Central Asia and
Entry Strategies of Korea into Central Asia / Young
Kwan Jo et al.
10-18 The Study of Prospects on the Energy Plant
Market in the Central Asia and Participating Strategy
of Korea / Sung Hak Yoon et al.
10-19 A Study on the Dominant Group and Power Elites
in Uzbekistan / Jae-Young Lee, Seok Hwan Kim,
Sang-Nam Park, and Young-Hoon Son
10-20 The Image of Korea in Central Asia / Sung Hak
Yoon, Gisoo Eun, Soomi Park, Geun Park, and
Wongbong Jang
10-21 A Framework for Sharing Korea's Socio-economic
Development Experience with ODA Recipient
Counties and its Application to Uzbekistan / In Soo
Kang, Yoocheul Song, Hosaeng Rhee, and Hongyul
Han
10-22 Studies in Comprehensive Regional Strategies Collected
Papers I Central Asia: PoliticsㆍCulture / KIEP
10-23 Studies in Comprehensive Regional Strategies Collected
Paper II Central Asia: Economyㆍ ResourceㆍScience /
KIEP
10-24 The Belarusian Economy and its Economic Relations
with the EU / Jeeyoung Hwang and Ji Sang Chang
10-25 Rising India - Recent Development and its Implications
to Korea / Yoon Dho Ra, Ocksoon Lee, Chanwahn Kim,
and Tae Hwan Yoo
10-26 Development and Development Cooperation of
ASEAN from Koreans' Viewpoints / Yul Kwon, Jaeho
Lee, and Hung-guk Cho
10-27 Korea-Latin America Economic Cooperation: Current
Status and Future Prospects / Kisu Kwon, Won-Ho
Kim, Sung Hyong Rhee, and Chong-Sup Kim
10-28 Environmental Assessment for Entering India Market
by Region: Eastern Area / Bong Hoon Kim, Kun Jun
Lee, Jin Gyu Choi, Eun Kyoung Jung, Jeong Min Byeon,
and Ahmad Ishaque
10-29 Environmental Assessment for Entering India Market
by Region: Western Area / Bong Hoon Kim, Kun Jun
Lee, Jin Gyu Choi, Eun Kyoung Jung, Jeong Min Byeon,
and Ahmad Ishaque
10-30 Environmental Assessment for Entering India Market
by Region: Southern Area / Bong Hoon Kim, Kun Jun
Lee, Jin Gyu Choi, Eun Kyoung Jung, Jeong Min Byeon,
and Ahmad Ishaque
10-31 Environmental Assessment for Entering India Market
by Region: Northern Area / Bong Hoon Kim, Kun Jun
Lee, Jin Gyu Choi, Eun Kyoung Jung, Jeong Min Byeon,
and Ahmad Ishaque
10-32 Strategic Industries of Southeast Asia: Automotive
Industry / Sung Shin Lee and Won Jang Park
10-33 Strategic Industries of Southeast Asia: IT / In Soo
Kang, Tae Eun Kim, and Seung Yeon Hong
10-34 Strategic Industries of Southeast Asia: Finance /
Kyeh Ryong Chung, Seung Ho Sohn, Jin Kyung
Lee, and Sea Rhin Lee
10-35 Strategic Industries of Southeast Asia: Medical Tourism /
Jang Sup Shin
10-36 Korea's New Scheme for Enhancing Economic
Cooperation toward Central America: Green Industry /
Sang Sub Ha, Kyung Won Chung, and Hye Hyun Son
10-37 Korea's New Scheme for Enhancing Economic
Cooperation toward Central America: Development /
Young Chul Kim, Gyong Mo Gu, You Kyoung Kim, and
Chong Wook Park
10-38 Korea's New Scheme for Enhancing for Economic
Cooperation toward Central America: SME / Nam
Kwon Mun, and Jae Ryang Woo
10-39 Korea's New Scheme for Enhancing Economic
Cooperation toward Central America: IT Industry /
Yoon Kook Choi
10-40 Korea's New Scheme for Enhancing Economic Cooperation
toward Central America: Green Industry / Sang Sub Ha,
Kyung Won Chung, and Hye Hyun Son
10-41 A Study of Korea-Vietnam Environmental Education
Cooperation Strategy (I): Environmental Training Pilot
Program for Public Officers in Vietnam / Kang Yim
Kim, Tae Yoon Park, and Yoon Jung Kim
10-42 Efficient ODA Strategy of Transport Projects in
ASEAN Countries / Hunki Lee, Jeehyung Park,
Dongmin Lee, Yoohyung Joo, and Jongshin Kim
10-43 The Cultural and Economic Implications on the
Eastern India / Kwangsu Lee, Soon Cheul Lee, and
Ki Chul Kwon
10-44 Self-Perceptions of Communities in India / Jongchan
Choi, Hongkeun Kho, Hawon Ku, Hyeongjun Kim,
Geumpyo Park, Myeongmu Lee, Eungu Lee, and
Choonho Lee
10-45 Indian Industrial Development Strategy and Economic
Governance / Jiho Jang, Jung-Yul Kim, and Younghee
Cho
10-46 Who is Indian? A Realm of Indian's Spirit Focused
on the Yogaśāstra / Soon-Keum Kim and Mee- Kyung Kim
10-47 A Study on the Claims of Local Communities in Special
Economic Zones in India: Focusing on Economic,
Social, and Environmental Sustainability / Kyootai Lee,
Jiyeon Bae, and Yule Heo
10-48 Research on India's Diplomatic Strategies and
Korea-India Future Collaboration Plan / Chae-Sung
Chun, Soo-Hyung Lee, and Suk-Ki Kong
10-49 Nations in National Museums and Monuments: A
Study of the Construction of National Identities in
Southeast Asia / Yoon Hwan SHIN, Heejung Kang,
Eun-Young Kim, Seung-Won Song, Sang Kook LEE,
Hanwoo LEE, and Horim CHOI
10-50 Separatism Movement and Conflict Management in
Southeast Asia: with Focus on the ASEAN's Regional
Cooperation / Dong-Yoon Lee and Young-Il Kim
10-51 An Assessment of Socio-Economic Development
Capacities of the ASEAN Underdeveloped Countries:
Vietnam, Cambodia, Myanmar / Jai Won Ryou, Sung-
Hoon Park, Hongyul Han, In Soo Kang, Yoocheul Song,
and Hosaeng Rhee
10-52 Research on India's Diplomatic Strategies and Korea-
India Future Collaboration Plan / Chae-Sung Chun,
Soo-Hyung Lee, and Suk-Ki Kong
10-53 Regional Cooperation Measures to Resolve Transnational
■ Conference Proceedings
■ Working Papers
Threats in Southeast Asia such as Drug, Organized
Crime, Human Trafficking, and Piracy / Yong-Sup Han,
Shin-Wha Lee, Gyun Yeol Park, and Hong-Je Cho
10-54 A Framework to Analyse and Enhance S&T ODA for
Sustainable Development in Three ASEAN Countries:
Cambodia, Vetnam, and Philippines / WooSung Lee,
Jungtae Hwang, and Wonjoon Kim
10-55 A Study on Korea's ODA Strategies toward Cambodia:
Basic Survey and Strategy Development / Hyuk-Sang
Sohn and Hyunsuk Yoo
10-56 Prospects for Regime Change and Korea's Expansion
Strategies in Myanmar after the Myanmar's General
Elections / Jun Young Jang
10-57 Research for the Development of Nuclear Industry
in Latin America and Policy Proposals for Korean
Nuclear Industry toward this region: Focusing on
Mexico, Brazil and Argentina / Hee Moon Jo,
Sang-Sub Ha, and Hye-Hyun Son
10-58 The Energy and Environmental Problems of Latin
America: Status and Tasks / Kyung-Soo Chun et al.
10-59 Health Care Reform in Latin America: Chile, Argentina
and Mexico / Sang-Rae Lim, Sang-Hyun Yi, and
Yun-Joo Park
10-60 A Study on the Social and Cultural Codes and
Consumption Patterns of the Broadcasting Industry
in Latin America: A Proposal for the Efficient
Settlement of‘Korean Wave’/ Kyung Won Chung,
Yong Gab Jeon, Gu Ho Cho, and So Ra Lim
10-61 Comparative Analysis on State-owned Enterprises
Policy in Korea, China, and Japan / Hyung-Gon
Jeong et al.
09-01 Changes in North Korea and Policy Responses of
the International Community toward North Korea /
Myung-Chul Cho and Jiyeon Kim eds.
10-01 Financing for Regional Economic Integration for
Northeast Asia / Lee-Jay Cho & Chang Jae Lee
10-02 2009 CRES Visiting Scholar's Paper Series /
Heungchong KIM
10-03 Korea-China Economic Cooperation with the Rising of
Central China / Youngrok Cheong and Changsheng Xu
eds.
11-01 Financing for Regional Economic Integration for
Northeast Asia II / Lee-Jay Cho & Chang Jae Lee
11-02 2010 CRES Visiting Scholar’s Paper Series / Yang-
Hee Kim
09-01 Determinants of Staging Categories for the Tariff
Elimination in the FTA Negotiations / Nakgyoon Choi
09-02 Using Panel Data to Exactly Estimate Income
Under-Reporting by the Self Employed / Bonggeun
Kim, John Gibson, and Chul Chung
09-03 Firm Heterogeneity in the Choice of Offshoring:
Evidence from Korean Manufacturing Firms / Hea-
Jung Hyun
09-04 What can North Korea Learn from Transition
Economies' Reform Process? / Hyung-Gon Jeong
09-05 Impacts of Free Trade Agreements on Structural
Adjustment in the OECD: Panel Data Analysis /
Nakgyoon Choi
09-06 Transport Costs, Relative Prices, and International
Risk Sharing / Inkoo Lee and Yonghyup Oh
09-07 The Impact of Mutual Recognition Agreements on
Foreign Direct Investment and Export / Yong Joon Jang
09-08 Trade Openness and Vertical Integration: Evidence
from Korean Firm-Level Data / Hea-Jung Hyun and
Jung Hur
09-09 External Adjustment under Increasing Integration in
Korean Economy / Inkoo Lee and In Huh
09-10 An Exploration of an Integration Index and its
Application for Asian Regional Community / Heungchong
Kim, Minhee Kim, and Jehoon Park
10-01 General Equilibrium Analysis of DDA Trade Liberalization:
Assessment of Alternative Scenarios / Nakgyoon Choi
10-02 Intra-industry Trade in an Enlarged Europe: Trend
of Intra-industry Trade in the European Union and
its Determinants / Yoo-Duk Kang
10-03 Democracy and Trade Policy: the Role of Interest
■ CNAEC Research Series
■ MonographGroups / Kyounghee Lee
10-04 East Asian Financial and Monetary Cooperation and
Its Prospect: Beyond the CMI / Young-Joon Park
and Yonghyup Oh
10-05 Regionalism within Multilateralism: WTO Review
Mechanisms for RTAs / Sherzod Shadikhodjaev
10-06 Determinants of Exports: Productivity or Fixed Export
Costs / Young Gui Kim and Jeongmeen Suh
10-07 Learning in Trade Negotiations?: An Experimental
Study on Veto Games / Hankyoung Sung
10-08 Impact of Rules of Origin on FTA Utilization in
Korean FTAs / HanSung Kim and Mee Jin Cho
10-09 Considering Happiness for Economic Development:
Determinants of Happiness in Indonesia / Kitae Sohn
10-10 Information and Capital Flows Revisited: the Internet
as a Determinant of Transactions in Financial Assets /
Changkyu Choi, Dong-Eun Rhee, and Yonghyup Oh
10-11 Who Goes Where and How? Firm Heterogeneity
and Location Decision of Korean Multinationals /
Hea-Jung Hyun and Jung Hur
09-01 Development Cooperation for Social Safety Nets in
East and Southeast Asia / Kye Woo Lee
09-02 Outward Processing Scheme under FTAs: “Domine,
QuoVadis?” / Norio Komuro
09-03 Intra-Industry Trade between Japan and Korea: Vertical
Intra-Industry Trade, Fragmentation and Export Margins /
Yushi Yoshida
09-04 Analysis on the Effects of UN Economic Sanctions
against North Korea / Hyung-Gon Jeong and Hokyung
Bang
10-01 Customs Administration Cooperation between Korea-
China-Japan for Trade Facilitation: Strategy for Mutual
Recognition of AEO between Korea-China-Japan /
Hyung-Gon JEONG, Seung Kwon Na, and YooYeon Noh
▪An Economic History of Twentieth Century Europe / KIEP
▪KIEP Annual Report 2008 / KIEP
▪Стратегии проникновения нароссийскийрынок:
опыт компаний РеспубликиКорея / Jae-Young
Lee and Sooncheul Lee
KOREA INSTITUTE FOR INTERNATIONAL ECONOMIC POLICY
ORDER FORM
KIEP is on-line. Access http://www.kiep.go.kr for details of our latest publications.
■ Fax number: 822-3460-1144
■ Address:
Publication Section, Department of Information & Library Services
Korea Institute For International Economic Policy
108 Yangjaedaero, Seocho-Gu, Seoul 137-747,
Korea
■ E-mail: [email protected]
■ Please call: 822-3460-1142 if you have any questions.
ALL ORDERS MUST BE PREPAID
Date of Order:
Name: Mr / Ms
Department/Institution:
Street Address: City:
State / Post Code: Country:
Telephone: Fax:
E-mail:
Quantity Title/Author/Series No. ISBN Price
ㆍTotal Cost of book(s) is US$ .
ㆍCos t of postage is US$ .
* Postage charge per copy is US$ 5 within Asia. For all other countries, the postage charge per copy is US$ 9.
All orders will be shipped by airmail.
Payment
Check (payable to KIEP) International Money Order
Visa Card Master Card
ㆍCard Number
ㆍExpiry date
ㆍSignature
Type of Membership(One-Year)
Standing Order for Residents Outside Korea
All publications(60-70 titles, including periodicals, annually )
US$ 500 US$ 250
* Airmail charges are included.
* Subject to change without prior notice.
Annual Fee*Institutions Individuals
108 Yangjaedaero, Seocho-Gu, Seoul 137-747 Tel: (822) 3460-1080 Fax: (822) 3460-1144

2010
CRES Visiting Scholar’s Paper Series
| Conference Proceedings 11-02 |
Edited by Yang-Hee Kim
2010CRES Visiting Scholar’s Paper Series
Edited by Yang-Hee Kim
ISBN 978-89-322-3056-6 978-89-322-3020-7 (Set)
Price USD 10
2011 CRES Visiting 표지.indd 1 2011-05-24 오전 9:33:16
Copyright © 2022 FDOKUMEN