2010-0720.pdf - CA.gov
262
NEW ISSUE BOOK-ENTRY ONLY RATING Moody’s: “MIG 1” (see “RATING”) In the opinion of Jones Hall, A Professional Law Corporation, San Francisco, California, Bond Counsel, subject, however to certain qualifications described herein, under existing law, the interest on the Notes is excluded from gross income for federal income tax purposes and such interest is not an item of tax preference for purposes of the federal alternative minimum tax imposed on individuals and corporations. In the further opinion of Bond Counsel, such interest is exempt from California personal income taxes. See “TAX MATTERS” herein. $50,000,000 CITY OF BERKELEY 2010-11 TAX AND REVENUE ANTICIPATION NOTES Dated: Date of Delivery Due: June 30, 2011 The Notes will be issued in denominations of $5,000 or any integral multiple thereof. Principal of and interest on the Notes will be payable upon maturity. The Notes are to be delivered as fully registered Notes, without coupons and, when delivered, will be registered in the name of Cede & Co., as nominee of The Depository Trust Company (“DTC”), New York, New York (as described in APPENDIX E – Book-Entry Only System). DTC will act as securities depository of the Notes. Purchases will be made in book-entry form only, in the principal amount of $5,000 or any integral multiple thereof. The Notes are not subject to redemption prior to maturity. The Notes are by statute general obligations of the City of Berkeley, California (the “City”), payable solely from taxes, income, revenues, cash receipts and other moneys which are received by the City for the General Fund for Fiscal Year 2010-11 and which are generally available for the payment of current expenses and other obligations of the City (the “Unrestricted Moneys”). The Notes are secured by a pledge of Unrestricted Moneys to be received by the City in (a) an amount equal to fifty percent (50%) of the principal amount of the Notes in the month of January, 201 ; (b) ) an amount equal to fifty percent (50%) of the principal amount of the Notes in the month of May, 2011; and (c) an amount sufficient to pay interest as due on the Notes at their maturity, in the month of June, 2011 (such pledged amounts being hereinafter called the “Pledged Revenues”). The Pledged Revenues shall be deposited and held by the City, in a special fund designated “City of Berkeley, California, 2010-11 Tax and Revenue Anticipation Notes Special Account,” as defined in the City’s Resolution adopted on June 1, 2010. Principal of and interest on the Notes are payable in lawful moneys of the United States of America upon maturity, and interest on the Notes will be computed on the basis of a 360-day year comprised of twelve 30-day months and accrues from the date of delivery. The Notes are legal investments for commercial banks in California and are eligible to secure deposits of public moneys in California. THIS COVER PAGE CONTAINS CERTAIN INFORMATION FOR QUICK REFERENCE ONLY. IT IS NOT A SUMMARY OF THIS ISSUE. INVESTORS MUST READ THE ENTIRE OFFICIAL STATEMENT TO OBTAIN INFORMATION ESSENTIAL TO THE MAKING OF AN INFORMED INVESTMENT DECISION. The following firm, serving as financial advisor to the City, has structured this issue. MATURITY SCHEDULE Principal Interest Rate Reoffering Yield $50,000,000 2.00% 0.400% The Notes are offered when, as and if issued and received by the Underwriter, subject to the approval of legality by Jones Hall, A Professional Law Corporation, San Francisco, California, Bond Counsel. Certain legal matters will be passed upon for the City by the City Attorney. It is anticipated that the Notes, in definitive form, will be available for delivery through DTC in New York, New York on or about July 1, 2010. Dated: June 17, 2010
-
Upload
khangminh22 -
Category
Documents
-
view
6 -
download
0
Transcript of 2010-0720.pdf - CA.gov

NEW ISSUE BOOK-ENTRY ONLY RATING Moody’s: “MIG 1” (see “RATING”)
In the opinion of Jones Hall, A Professional Law Corporation, San Francisco, California, Bond Counsel, subject, however to certain qualifications described herein, under existing law, the interest on the Notes is excluded from gross income for federal income tax purposes and such interest is not an item of tax preference for purposes of the federal alternative minimum tax imposed on individuals and corporations. In the further opinion of Bond Counsel, such interest is exempt from California personal income taxes. See “TAX MATTERS” herein.
$50,000,000CITY OF BERKELEY
2010-11 TAX AND REVENUE ANTICIPATION NOTES
Dated: Date of Delivery Due: June 30, 2011The Notes will be issued in denominations of $5,000 or any integral multiple thereof. Principal of and interest on
the Notes will be payable upon maturity. The Notes are to be delivered as fully registered Notes, without coupons and, when delivered, will be registered in the name of Cede & Co., as nominee of The Depository Trust Company (“DTC”), New York, New York (as described in APPENDIX E – Book-Entry Only System). DTC will act as securities depository of the Notes. Purchases will be made in book-entry form only, in the principal amount of $5,000 or any integral multiple thereof. The Notes are not subject to redemption prior to maturity.
The Notes are by statute general obligations of the City of Berkeley, California (the “City”), payable solely from taxes, income, revenues, cash receipts and other moneys which are received by the City for the General Fund for Fiscal Year 2010-11 and which are generally available for the payment of current expenses and other obligations of the City (the “Unrestricted Moneys”). The Notes are secured by a pledge of Unrestricted Moneys to be received by the City in (a) an amount equal to fifty percent (50%) of the principal amount of the Notes in the month of January, 201 ; (b) ) an amount equal to fifty percent (50%) of the principal amount of the Notes in the month of May, 2011; and (c) an amount sufficient to pay interest as due on the Notes at their maturity, in the month of June, 2011 (such pledged amounts being hereinafter called the “Pledged Revenues”). The Pledged Revenues shall be deposited and held by the City, in a special fund designated “City of Berkeley, California, 2010-11 Tax and Revenue Anticipation Notes Special Account,” as defined in the City’s Resolution adopted on June 1, 2010.
Principal of and interest on the Notes are payable in lawful moneys of the United States of America upon maturity, and interest on the Notes will be computed on the basis of a 360-day year comprised of twelve 30-day months and accrues from the date of delivery.
The Notes are legal investments for commercial banks in California and are eligible to secure deposits of public moneys in California.
THIS COVER PAGE CONTAINS CERTAIN INFORMATION FOR QUICK REFERENCE ONLY. IT IS NOT A SUMMARY OF THIS ISSUE. INVESTORS MUST READ THE ENTIRE OFFICIAL STATEMENT TO OBTAIN INFORMATION ESSENTIAL TO THE MAKING OF AN INFORMED INVESTMENT DECISION.
The following firm, serving as financial advisor to the City, has structured this issue.
MATURITY SCHEDULE
Principal Interest Rate Reoffering Yield$50,000,000 2.00% 0.400%
The Notes are offered when, as and if issued and received by the Underwriter, subject to the approval of legality by Jones Hall, A Professional Law Corporation, San Francisco, California, Bond Counsel. Certain legal matters will be passed upon for the City by the City Attorney. It is anticipated that the Notes, in definitive form, will be available for delivery through DTC in New York, New York on or about July 1, 2010.
Dated: June 17, 2010
abenge
Text Box
1

No dealer, broker, salesman or other person has been authorized by the City to give any information or to make any representations with respect to the Notes other than those contained herein and, if given or made, such information or representation must not be relied upon as having been authorized by the City. This Official Statement does not constitute an offer to sell nor the solicitation of an offer to buy, nor shall there be any sale of the Notes by any person to make such offer, solicitation or sale.
This Official Statement is not to be construed as a contract with the purchasers of the Notes. Statements contained in this Official Statement which involve estimates, forecasts or matters of opinion, whether or not expressly so described herein, are intended solely as such and are not to be construed as a representation of facts.
The information set forth herein has been obtained from sources that are believed to be reliable, but is not guaranteed as to accuracy or completeness, and is not to be construed as a representation by the Underwriter. The information and expressions of opinion stated herein are subject to change without notice and neither delivery of this Official Statement nor any sale made hereunder shall, under any circumstances, create any implication that there has been no change in the information or opinions set forth herein or in the affairs of the City since the date hereof. This Official Statement is submitted in connection with the sale of the Notes referred to herein and may not be reproduced or used, in whole or in part, for any purpose, unless authorized in writing by the City.
The Notes have not been registered under the Securities Act of 1933, in reliance upon an exemption contained in such Act. The Notes have not been registered under the securities laws of any state.
IN CONNECTION WITH THIS OFFERING, THE UNDERWRITER MAY OVERALLOT OR EFFECT TRANSACTIONS THAT STABILIZE OR MAINTAIN THE MARKET PRICE OF THE NOTES AT LEVELS ABOVE THOSE WHICH MIGHT OTHERWISE PREVAIL IN THE OPEN MARKET. SUCH STABILIZING, IF COMMENCED, MAY BE DISCONTINUED AT ANY TIME. THE UNDERWRITER MAY OFFER AND SELL THE NOTES TO CERTAIN DEALERS AND BANKS AT PRICES LOWER THAN THE PUBLIC OFFERING PRICE STATED ON THE COVER PAGE HEREOF AND SAID PUBLIC OFFERING PRICE MAY BE CHANGED FROM TIME TO TIME BY THE UNDERWRITER.
Certain statements included or incorporated by reference in this Official Statement constitute “forward-looking statements” within the meaning of the United States Private Securities Litigation Reform Act of 1995, Section 21E of the United States Securities Exchange Act of 1934, as amended (the “Exchange Act”), and Section 27A of the United States Securities Act of 1933, as amended (the “Securities Act”). Such statements are generally identifiable by the terminology used such as “plan,” “expect,” “estimate,” “budget” or other similar words.
The Underwriter has provided the following sentence for inclusion in this Official Statement. The Underwriter has reviewed the information in this Official Statement in accordance with, and as part of, its responsibilities to investors under the federal securities laws as applied to the facts and circumstances of this transaction, but the Underwriter does not guarantee the accuracy or completeness of such information.
THE ACHIEVEMENT OF CERTAIN RESULTS OR OTHER EXPECTATIONS CONTAINED IN SUCH FORWARD-LOOKING STATEMENTS INVOLVE KNOWN AND UNKNOWN RISKS, UNCERTAINTIES AND OTHER FACTORS WHICH MAY CAUSE ACTUAL RESULTS, PERFORMANCE OR ACHIEVEMENTS DESCRIBED TO BE MATERIALLY DIFFERENT FROM ANY FUTURE RESULTS, PERFORMANCE OR ACHIEVEMENTS EXPRESSED OR IMPLIED BY SUCH FORWARD-LOOKING STATEMENTS. THE CITY DOES NOT PLAN TO ISSUE ANY UPDATES OR REVISIONS TO THOSE FORWARD-LOOKING STATEMENTS IF OR WHEN ITS EXPECTATIONS, OR EVENTS, CONDITIONS OR CIRCUMSTANCES ON WHICH SUCH STATEMENTS ARE BASED OCCUR.

CITY OF BERKELEY, CALIFORNIA
ELECTED OFFICIALS
Tom Bates, MayorLinda Maio, Councilmember District 1
Darryl Moore, Councilmember District 2Maxwell Anderson, Councilmember District 3
Jesse Arreguín, Councilmember District 4Laurie Capitelli, Councilmember District 5Susan Wengraf, Councilmember District 6
Kriss Worthington, Councilmember District 7Gordon Wozniak, Councilmember District 8
CITY OFFICIALS
Phil KamlarzCity Manager
Robert HicksDirector of Finance
Christine DanielDeputy City Manager
Zach CowanActing City Attorney
Ann-Marie HoganAuditor
PROFESSIONAL SERVICES
Financial Advisor
Northcross, Hill & Ach, Inc.San Rafael, California
Bond Counsel
Jones Hall, A Professional Law CorporationSan Francisco, California

(THIS PAGE INTENTIONALLY LEFT BLANK)

TABLE OF CONTENTS INTRODUCTORY STATEMENT.................................................................................................1 THE NOTES ...............................................................................................................................1
Description of the Notes ........................................................................................................1 Purpose of Issue ...................................................................................................................2 Book-Entry Form...................................................................................................................2
SECURITY FOR AND SOURCES OF PAYMENT OF THE NOTES ...........................................2 Security for the Notes............................................................................................................2 Available Sources of Repayment ..........................................................................................3 Monthly Cash Flows..............................................................................................................4
CITY INVESTMENT POLICY AND PORTFOLIO........................................................................7 SPECIAL RISK FACTORS .........................................................................................................8
Bankruptcy Considerations ...................................................................................................8 Limitations on Remedies .......................................................................................................9
CONSTITUTIONAL AND STATUTORY PROVISIONS AFFECTING CITY REVENUES AND APPROPRIATIONS ....................................................................................................................9
Limitations on Revenues .......................................................................................................9 Expenditures and Appropriations ........................................................................................10 Future Initiatives..................................................................................................................11
LEGAL OPINION ......................................................................................................................11 TAX MATTERS.........................................................................................................................12 CONTINUING DISCLOSURE ...................................................................................................13 ABSENCE OF MATERIAL LITIGATION ...................................................................................13 UNDERWRITING .....................................................................................................................14 FINANCIAL ADVISOR ..............................................................................................................14 RATING ....................................................................................................................................14 ADDITIONAL INFORMATION ..................................................................................................15
APPENDIX A – CERTAIN INFORMATION CONCERNING THE CITY OF BERKELEY APPENDIX B – THE CITY’S COMPREHENSIVE ANNUAL FINANCIAL REPORT FOR THE
FISCAL YEAR ENDED JUNE 30, 2009 APPENDIX C – FORM OF OPINION OF BOND COUNSEL APPENDIX D – FORM OF CONTINUING DISCLOSURE CERTIFICATE APPENDIX E – BOOK-ENTRY ONLY SYSTEM

(THIS PAGE INTENTIONALLY LEFT BLANK)

OFFICIAL STATEMENT
$50,000,000CITY OF BERKELEY
2010-11 TAX AND REVENUE ANTICIPATION NOTES
INTRODUCTORY STATEMENT
This Official Statement, which includes the cover page, appendices hereto and thisIntroductory Statement, is provided to furnish information in connection with the sale by the Cityof Berkeley, California (the "City") of its 2010-11 Tax and Revenue Anticipation Notes (the"Notes") issued by the City in the principal amount of $50,000,000.
The Notes are issued in full conformity with the Constitution and laws of the State ofCalifornia (the "State"), including Article 7.6, Chapter 4, Part 1, Division 2, Title 5 (commencingwith Section 53850 of the Government Code of the State), (the "Law") and under the Law aregeneral obligations of the City payable solely from those taxes, income, revenues, cash receiptsand other moneys intended as receipts for the City’s General Fund for fiscal year 2010-11 andwhich are generally available for the payment of current expenses and other obligations of theCity (the "Unrestricted Moneys"). The Notes are authorized by a resolution adopted by the CityCouncil on June 1, 2010 (the “Resolution”). The City may, under the Law, issue the Notes onlyif the principal of and interest on the Notes will not exceed 85% of the estimated amount of theuncollected Unrestricted Moneys which will be available for the payment of said Notes.Proceeds from the sale of the Notes will be deposited in a segregated account in the GeneralFund and used and expended by the City for any purpose for which it is authorized to expendfunds from the General Fund.
THE NOTES
Description of the Notes
The Notes will be issued in the principal amount of $50,000,000 and at the interest rateshown on the cover page of this Official Statement. Principal of and interest on the Notes arepayable in lawful moneys of the United States of America upon maturity, and interest on theNotes will be computed on the basis of a 360-day year comprised of twelve 30-day months andaccrues from the date of delivery.
The Notes will be dated the date of delivery and will mature on June 30, 2011. TheNotes are to be delivered as fully registered Notes, without coupons, and, when delivered, willbe registered in the name of Cede & Co., as nominee of The Depository Trust Company(“DTC”), New York, New York. DTC will act as securities depository of the Notes. Purchaseswill be made in book-entry form only, in the principal amount of $5,000 or any integral multiplethereof.

2
Purpose of Issue
Proceeds of the Notes will provide moneys to meet the City’s General Fund cash flowrequirements during the 2010-11 fiscal year commencing July 1, 2010 and ending June 30,2011, including current expenses, capital expenditures, and the discharge of other obligationsor indebtedness.
Book-Entry Only System
DTC will act as securities depository for the Notes. The Notes will be issued as fully-registered certificates registered in the name of Cede & Co. (DTC’s partnership nominee). Onefully-registered certificate will be issued for each maturity of the Notes, each in the aggregateprincipal amount of such maturity, and will be deposited with DTC. See “APPENDIX E – BOOK-ENTRY ONLY SYSTEM.”
So long as the Notes are registered in the name of Cede & Co., as nominee of DTC, allpayments with respect to the principal and interest with respect to the Notes will be made toDTC as provided as in the representation letter delivered on the date of issuance of the notes.The City cannot and does not give any assurances that DTC, DTC Participants or others willdistribute payments of principal, interest or premium, if any, with respect to the Notes paid toDTC or its nominee as the registered owner, or will distribute any prepayment notices or othernotices, to the Beneficial Owners, or that they will do so on a timely basis or will serve and act inthe manner described in this Official Statement. The City is not responsible or liable for thefailure of DTC or any DTC Participant to make any payment or give any notice to a BeneficialOwner with respect to the Notes or an error or delay relating thereto.
SECURITY FOR AND SOURCES OF PAYMENT OF THE NOTES
Security for the Notes
The principal amount of the Notes, together with the interest thereon, is payable fromUnrestricted Moneys, being the first taxes, income, revenue, cash receipts, and other moneysintended as receipts for the General Fund for Fiscal Year 2010-11 and which are generallyavailable for the payment of current expenses and other obligations of the City. EstimatedUnrestricted Moneys exceed estimated payment requirements by more than eight to one. See“THE NOTES – Available Sources of Payment.”
As security for the repayment of principal of and interest on the Notes, the City haspledged to deposit in a special fund designated as the “2010-11 Tax and Revenue AnticipationNote Special Account” (the “Special Account”) the first Unrestricted Moneys to be received bythe City as follows: (a) an amount equal to fifty percent (50%) of the principal amount of theNotes in the month of January, 2011; (b) an amount equal to fifty percent (50%) of the principalamount of the Notes in the month of May, 2011; and (c) an amount sufficient to pay interest asdue on the Notes at their maturity, in the month of June, 2011 (such pledged amounts, the“Pledged Revenues.”). The Notes are equally and ratably secured by the City's pledge of thePledged Revenues.
The principal of the Notes and the interest thereon shall constitute a first lien and chargeagainst and shall be paid from the first moneys received by the City from such PledgedRevenues, and to the extent not so paid shall be paid from any other moneys of the City

3
lawfully available therefor. In the event there are insufficient Unrestricted Moneys received bythe City to permit the deposits in the Special Account of the full amount of the PledgedRevenues to be deposited in the applicable month, by the last business day of such month,then the amount of such deficiency shall be satisfied and made up from any other moneys ofthe City lawfully available for the payment of the Notes and the interest thereon.
All Pledged Revenues, as and when received, shall be deposited by the City in theSpecial Account, which will be held by the Director of Finance of the City for the payment of theprincipal of and interest on the Notes at maturity. Amounts deposited by the City in the SpecialAccount shall be applied solely for the purpose of paying the principal of and interest on theNotes. Such amounts shall be invested by the City in legal investments, as permitted bySection 53601 of the Government Code of the State. See “CITY INVESTMENT POLICY ANDPORTFOLIO.”
Available Sources of Repayment
The Notes, in accordance with State law, are general obligations of the City, but arepayable only out of Unrestricted Moneys, which include the taxes, income, revenues, cashreceipts and other moneys intended as receipts for the General Fund for fiscal year 2010-11and which are generally available for payment of current expenses and other obligations of theCity. The Constitution of the State substantially limits the City's ability to levy ad valorem taxes.See "CONSTITUTIONAL AND STATUTORY PROVISIONS AFFECTING CITY REVENUESAND APPROPRIATIONS." The City may, under existing law, issue the Notes only if theprincipal of, and interest on, the Notes will not exceed 85% of the estimated uncollectedUnrestricted Moneys which will be available for the repayment of the Notes.
The Note coverage ratio is the ratio of estimated Unrestricted Moneys to the amount ofUnrestricted Moneys needed to pay principal of and interest on the Notes. The City expects toreceive a projected $220,634,759 in Unrestricted Moneys on a cash basis (including carry-overbalances and transfers, and proceeds of the Notes). The amount needed to repay the Notesand the interest thereon is estimated to be $50,997,222.22. Based on an amount ofUnrestricted Moneys needed to pay principal of and interest on the Notes, the Note coverageratio is approximately 4.33:1.
The table below gives detail as to the sources of Unrestricted Moneys and the NoteCoverage Ratio.

4
CITY OF BERKELEYEstimated Unrestricted Moneys
SourceAmount
Available Cash Balance, July 1, 2010 $ 23,815,548
Taxes (including property tax, sales tax and other taxes) 102,501,977Other Revenue 34,947,135Transfers from other City funds 8,631,098Proceeds of the Notes (1) 50,739,001
TOTAL UNRESTRICTED MONEYS $220,634,759
ESTIMATED PRINCIPAL PLUS INTEREST NEEDED FOR NOTEREPAYMENT
$50,997,222.22
NOTE COVERAGE RATIO 4.33:1
(1) Excluding underwriter’s discount and costs of issuance.Source: City of Berkeley Finance Department.
Monthly Cash Flows
The City has prepared the accompanying monthly General Fund cash flow statementscovering the 2009-10 fiscal year and the projected 2010-11 fiscal year. The General Fund isused to finance the ordinary operations of the City and is available for any legal authorizedpurposes. While expenditures generally occur evenly throughout the fiscal year, cash receiptsoccur unevenly. As a result the General Fund cash balance tends to show a deficit during partsof the fiscal year. The projections are based on the City’s budget as well as the City’s currentfinancial condition.

5
City of Berkeley
FY 2009-10 Estimated Actual General Fund Cash Flows
July August September October November December January February March April May June TOTALBeginning Balance $23,870,410 $18,231,329 $11,874,669 $6,748,193 $23,175,386 $12,283,859 $33,155,986 $17,966,368 $18,673,643 $23,654,381 $34,776,709 $24,774,272 $23,870,410
CASH RECEIPTS
Property/Other Taxes $3,080,587 $4,031,891 $5,333,973 $3,279,399 $4,170,389 $22,907,405 $5,093,731 $11,382,144 $10,640,477 $16,123,709 $6,000,000 $8,303,590 $100,347,295License and Permits 26,342 41,193 20,101 80,796 29,103 41,889 84,434 28,924 45,296 147,453 20,000 20,000 585,531Subventions & Grants 127,340 20,719 72,410 23,810 401 4,265,986 0 37,529 206,299 4,169,404 126,958 206,299 9,257,155Service Fees 592,994 548,209 469,522 487,039 464,028 462,599 753,883 550,404 458,750 568,632 657,546 750,000 6,763,606
Fines and Penalties 1,196,175 748,049 652,241 633,598 955,654 1,016,140 597,403 754,663 868,181 629,564 989,508 989,509 10,030,685Miscellaneous 3,586 112,707 10,453 23,377 5,657 590 12,422 21,137 94,189 528,896 90,000 90,000 993,014Interest Income 326 (103,955) 1,805,467 1,117,921 107,863 22,506 295,898 359,686 554,194 712,874 163,610 163,610 5,200,000
Rents and Royalties 1,507 5,687 8,304 9,211 17,925 8,545 9,161 18,995 13,178 6,453 9,027 9,027 117,020Franchises 220,959 0 0 214,668 0 0 221,148 0 0 1,034,378 0 274,356 1,965,509Transfers In/Indirect Costs 571,301 601,380 764,909 598,662 751,963 940,957 595,295 585,699 582,431 729,460 585,699 1,854,259 9,162,015Sale of Receivable for the State Borrowing (Prop.1A) 0 0 0 0 0 0 2,155,363 0 0 0 2,155,363 0 4,310,726
Loan Repayment from others 14 14 13,515 15 15 42,145 15 15 15 2,265 0 188,046 246,074TRAN Proceeds 0 0 0 25,097,638 0 0 0 0 0 0 0 0 25,097,638TOTAL RECEIPTS $5,821,131 $6,005,894 $9,150,895 $31,566,134 $6,502,998 $29,708,762 $9,818,753 $13,739,196 $13,463,010 $24,653,088 $10,797,711 $12,848,696 $174,076,268
CASH DISBURSEMENTS
General Government $2,811,117 $2,070,793 $2,548,141 $2,749,977 $2,554,309 $3,292,706 $2,662,502 $2,122,804 $2,946,709 $2,646,886 $3,500,000 $4,953,717 $34,859,661Public Safety 4,771,267 5,693,015 6,035,271 5,872,415 6,041,938 9,057,306 6,016,004 6,081,443 5,851,652 6,120,915 6,600,000 8,948,721 77,089,947
Highways and Streets 84,574 97,519 116,462 121,827 176,665 177,827 119,845 210,342 123,330 118,657 118,657 157,950 1,623,655Health and Human Service 449,794 536,393 546,726 548,874 551,080 721,447 507,579 527,809 539,441 549,713 420,000 550,417 6,449,273Culture - Recreation 538,422 545,127 401,142 390,101 492,603 508,555 323,107 369,761 381,888 420,743 420,743 565,007 5,357,199
Urban Redevelopment/Housing 548,510 551,327 456,915 571,715 492,778 687,039 561,395 554,598 573,930 534,888 534,888 718,587 6,786,570Econ Dev & Assistance 608,502 163,556 201,725 85,609 100,899 274,229 89,110 125,882 193,813 151,124 151,124 197,769 2,343,342Debt Service 0 0 0 899,584 0 0 710 0 0 0 143,116 0 1,043,410Transfers Out/Other 162,752 162,752 2,673,152 162,752 1,823,152 2,248,152 162,752 162,751 162,752 1,068,377 162,751 162,752 9,114,847
State Borrowing (Prop.1A) 0 0 0 0 0 0 2,155,363 0 0 2,155,363 0 0 4,310,726TRAN Principal Pledge 0 0 0 0 0 0 12,500,000 0 0 0 12,500,000 0 25,000,000TRAN Interest Pledge 0 0 0 0 0 0 0 0 0 0 0 152,500 152,500
Advances from GF/(Repayment to GF) 1,485,274 2,542,072 1,297,837 3,736,087 5,161,101 (8,130,626) (89,996) 2,876,531 (2,291,243) (235,905) (3,751,131) (2,600,000) 0TOTAL DISBURSEMENTS $11,460,212 $12,362,554 $14,277,371 $15,138,941 $17,394,525 $8,836,635 $25,008,371 $13,031,921 $8,482,272 $13,530,761 $20,800,148 $13,807,420 $174,131,130
Interfund Borrowings $0 $0 $0 $0 $0 $0 $0 $0 $0 $0 $0 $0 $0
Net Cash Flow ($5,639,081) ($6,356,660) ($5,126,476) $16,427,193 ($10,891,527) $20,872,127 ($15,189,618) $707,275 $4,980,738 $11,122,327 ($10,002,437) ($958,724) ($54,862)
Ending Balance $18,231,329 $11,874,669 $6,748,193 $23,175,386 $12,283,859 $33,155,986 $17,966,368 $18,673,643 $23,654,381 $34,776,709 $24,774,272 $23,815,548 $23,815,548
Source: City of Berkeley
Actual Projected

6
City of BerkeleyFY 2010-11 Projected General Fund Cash Flows
(Including Projected 2010 TRAN)
July August September October November December January February March April May June TOTAL
Beginning Balance $23,815,548 $43,817,581 $38,476,931 $32,342,583 $27,039,841 $16,450,726 $40,050,327 $14,676,278 $18,166,048 $25,674,338 $45,670,143 $23,602,683 $23,815,548
CASH RECEIPTSProperty/Other Taxes $3,146,734 $4,118,465 $5,448,505 $3,349,815 $4,259,937 $23,399,278 $5,203,105 $11,626,544 $10,868,952 $16,469,921 $6,128,833 $8,481,887 $102,501,977License and Permits 13,406 20,965 10,230 41,120 14,812 21,319 42,972 14,721 23,053 75,045 10,179 10,179 298,000Subventions & Grants 125,561 20,430 71,398 23,477 395 4,206,388 0 37,005 203,417 4,111,155 125,184 203,417 9,127,827Service Fees 620,101 573,269 490,985 509,302 485,240 483,745 788,344 575,564 479,720 594,625 687,604 784,284 7,072,783Fines and Penalties 1,275,954 797,940 695,742 675,856 1,019,392 1,083,912 637,247 804,996 926,085 671,553 1,055,504 1,055,505 10,699,685Miscellaneous 2,474 77,747 7,211 16,126 3,902 407 8,569 14,581 64,973 364,843 62,084 62,084 685,000Interest Income 310 (98,957) 1,718,666 1,064,175 102,677 21,424 281,672 342,393 527,550 678,601 155,744 155,744 4,950,000Rents and Royalties 1,404 5,298 7,736 8,581 16,700 7,961 8,535 17,696 12,277 6,012 8,410 8,410 109,020Franchises 225,378 0 0 218,961 0 0 225,571 0 0 1,055,066 0 279,843 2,004,820Transfers In 538,195 566,531 720,584 563,971 708,389 886,431 560,799 551,759 548,681 687,190 551,759 1,746,809 8,631,098Other 0 0 0 0 0 0 0 0 0 0 0 0 0TRAN Proceeds 50,739,001 0 0 0 0 0 0 0 0 0 0 0 50,739,001TOTAL RECEIPTS $56,688,519 $6,081,688 $9,171,058 $6,471,386 $6,611,443 $30,110,865 $7,756,814 $13,985,259 $13,654,708 $24,714,010 $8,785,301 $12,788,161 $196,819,211
CASH DISBURSEMENTSGeneral Government $3,335,297 $2,345,336 $2,609,688 $2,463,862 $2,288,552 $2,950,124 $2,385,489 $1,901,942 $2,640,126 $2,044,835 $2,645,858 $4,007,071 $31,618,181Public Safety 5,013,183 5,910,529 6,237,551 6,022,561 6,196,418 9,288,883 6,169,821 6,236,933 6,001,267 6,229,445 6,696,794 10,033,199 80,036,583Highways and Streets 219,569 181,749 176,172 130,249 188,878 190,120 128,130 224,883 131,856 75,200 49,370 61,141 1,757,316Health and Human Service 542,666 595,793 588,936 556,447 558,683 731,401 514,582 535,091 546,884 522,631 373,795 552,026 6,618,934Culture - Recreation 545,806 530,475 388,133 356,581 450,275 464,856 295,343 337,988 349,073 363,130 352,400 523,235 4,957,295Urban redevelopment/Housing 591,914 560,614 456,369 528,609 455,624 635,238 519,067 512,783 530,657 460,655 443,703 657,078 6,352,310Econ Dev & Assistance 493,800 145,898 166,424 63,877 75,285 204,615 66,489 93,926 144,613 96,853 88,899 129,372 1,770,050Debt Service 0 0 0 0 0 0 0 0 0 0 0 0 0Transfers Out/Other 228,866 228,866 3,759,058 228,866 2,563,765 3,161,411 228,866 228,865 228,866 1,502,380 228,865 228,866 12,817,541TRAN Principal Pledge 0 0 0 0 0 0 25,000,000 0 0 0 25,000,000 0 50,000,000TRAN Interest Pledge 0 0 0 0 0 0 0 0 0 0 0 997,222 997,222PERS Prepayment 26,000,000 0 0 0 0 0 0 0 0 0 0 0 26,000,000CalPERS Repayments from Departments (2,284,615) (2,076,923) (2,076,923) (2,076,923) (2,076,923) (3,115,385) (2,076,923) (2,076,923) (2,076,923) (2,076,923) (2,076,923) (2,907,692) (27,000,000)Advances from GF/(Repayment to GF) 2,000,000 3,000,000 3,000,000 3,500,000 6,500,000 (8,000,000) (100,000) 2,500,000 (2,350,000) (4,500,000) (2,950,000) (2,600,000) 0TOTAL DISBURSEMENTS $36,686,486 $11,422,338 $15,305,406 $11,774,128 $17,200,557 $6,511,264 $33,130,864 $10,495,488 $6,146,418 $4,718,205 $30,852,760 $11,681,518 $195,925,432
Interfund Borrowings $0 $0 $0 $0 $0 $0 $0 $0 $0 $0 $0 $0 $0
Net Cash Flow $20,002,034 ($5,340,650) ($6,134,348) ($5,302,743) ($10,589,114) $23,599,601 ($25,374,050) $3,489,771 $7,508,290 $19,995,805 ($22,067,460) $1,106,643 $893,779
Ending Balance $43,817,581 $38,476,931 $32,342,583 $27,039,841 $16,450,726 $40,050,327 $14,676,278 $18,166,048 $25,674,338 $45,670,143 $23,602,683 $24,709,326 $24,709,326

7
CITY INVESTMENT POLICY AND PORTFOLIO
The authority to invest the City’s funds is derived from a resolution adopted annually bythe City Council delegating to the Director of Finance and the Treasurer of the City the authorityto invest these funds within the guidelines of Section 53600 et seq. of the Government Code ofthe State (the “Government Code”). The Government Code also directs the City to present anannual investment policy (the “Investment Policy”) for confirmation to the City Council. The CityCouncil last revised the City’s Investment Policy for on February 10, 2009. The InvestmentPolicy may be revised by the City Council at any time.
The objectives of the Investment Policy are preservation of capital, liquidity and yield. TheInvestment Policy addresses the soundness of financial institutions in which the City may depositfunds, types of investment instruments permitted by the City and the Government Code, investmentduration and the amount which may be invested in certain instruments. The Investment Policy alsoreflects and supports the City’s policy positions on important social and environmental issues, ascontained in formal City Council actions including the Nuclear-Free Berkeley Act, the ResponsibleInvestment Ordinance and the Oppressive States Contract Resolution. Summarized below are thepermitted investments under the Investment Policy. These policies may further restrict investmentoptions available to the City.
Authorized Investment TypeMaximumMaturity
MaximumPercentage/Dollar
of Portfolio
MaximumInvestment
In OneIssuer
Local Agency Bonds 5 years 5% N/AU.S. Treasury Securities 5 years 25% N/AU.S. Agency Securities 5 years 100% N/ABanker’s Acceptances 180 days 40% 30%Commercial Paper 180 days 25% $5M or 2%Negotiable Certificates of Deposit 5 years 30% N/ARepurchase Agreements 1 year 10% N/AReverse Repurchase Agreements 92 days 10% N/AMedium-Term Notes 5 years 30% N/AGuaranteed Investment Contracts 5 years 25% N/AMutual Funds N/A 10% 10%Money Market Mutual Funds N/A 10% N/AMortgage Pass-Through Securities 5 years 20% N/ACounty Pooled Investment Funds N/A N/A N/ALocal Agency Investment Fund (LAIF) N/A N/A $40 millionJPA Pools (other investment pools) N/A N/A N/A
As of March 31, 2010, the City portfolio included $179,949,348 in pooled investments.The average life of the investments was 1,298 days and the weighted yield was 4.462% for thequarter. The following is a list of investments held by the City:

8
CITY OF BERKELEYCity Pooled Investments(As of March 31, 2010)
SecurityMarketValue
% of TotalPortfolio
Medium Term Notes and Commercial Paper $60,306,930 33.5%Federal Agency Coupon Notes 79,167,818 44.0Money Market Fund and Loans 34,000,000 19.0Bank Accounts 6,474,600 3.5TOTAL: $179,949,348 100.0%
Source: City of Berkeley Finance Department
SPECIAL RISK FACTORS
The following information should be considered by prospective investors in evaluatingthe Notes. However, this information does not purport to be an exhaustive listing of the risksand other considerations, which may be relevant to an investment in the Notes.
Bankruptcy Considerations
In 1994, Orange County, California issued its 1994-1995 Tax and Revenue AnticipationNotes (the “Orange County Notes”) under the same statutory authority as the Notes. OnDecember 6, 1994, Orange County filed a petition in bankruptcy. Subsequently, OrangeCounty declined to set aside the taxes and revenues it had pledged for the repayment of theOrange County Notes and a noteholder brought suit to compel Orange County to do so. AMarch 8, 1995 ruling of the United States Bankruptcy Court for the Central District of California,held that the lien securing the Orange County Notes did not attach to revenues received byOrange County after the filing of its bankruptcy petition on December 6, 1994, and therefore,Orange County was not required to set aside the revenues pledged under the note resolutionfollowing the bankruptcy. The Bankruptcy Court ruled that under the United States BankruptcyCode, the lien did not attach to revenues received by Orange County after December 6, 1994because the lien was a consensual security interest rather than a statutory lien. In July 1995,the United Stated District Court for the Central District of California reversed the decision of theBankruptcy Court. Orange County appealed the decision of the City Court to the United StatesCourt of Appeals for the Ninth Circuit. Before the Ninth Circuit rendered a decision the partiessettled their disputes. Accordingly, if the City were to file for bankruptcy, it is not clear whetherit would be required to set aside revenues pledged under the Resolution as described above.
In addition, the Pledged Revenues and other moneys that will be set aside to pay theNotes will be held in the City’s General Fund, and these funds will be invested in the pooledinvestment fund. Should the City go into bankruptcy, a court might hold that the owners of theNotes do not have a valid lien on the Pledged Revenues. In that case, unless the owners could“trace” the funds, the owners would merely be unsecured creditors of the City. There can be noassurance that the owners of the Notes could successfully so “trace” the Pledged Revenues.

9
Limitations on Remedies
The rights of the owners of the Notes are subject to the limitations on legal remediesagainst cities in the State, including a limitation on enforcement of judgments against fundsneeded to serve the public welfare and interest. Additionally, enforceability of the rights andremedies of the owners of the Notes and the obligations incurred by the City, may becomesubject to the following: the Federal Bankruptcy Code and applicable bankruptcy, insolvency,reorganization, moratorium, or similar laws relating to or affecting the enforcement of creditor’srights generally, now or hereafter in effect; equity principles which may limit the specificenforcement under State law of certain remedies; the exercise by the United States of Americaof the powers delegated to it by the Constitution; and the reasonable and necessary exercise incertain exceptional situations, of the police powers inherent in the sovereignty of the State andits governmental bodies in the interest of serving a significant and legitimate public purpose.Bankruptcy proceedings, or the exercise of powers by the federal or State government, ifinitiated, could subject the owners of the Notes to judicial discretion and interpretation of theirrights in bankruptcy, and consequently may entail risks of delay, limitation, or modification oftheir rights.
CONSTITUTIONAL AND STATUTORY PROVISIONS AFFECTING CITY REVENUESAND APPROPRIATIONS
Limitations on Revenues
Article XIIIA of the California Constitution. Article XIIIA of the State Constitution,adopted and known as Proposition 13, was approved by the voters in June 1978. Section 1(a)of Article XIIIA limits the maximum ad valorem tax on real property to one percent of “full cashvalue,” and provides that such tax shall be collected by the counties and apportioned accordingto State law. Section 1(b) of Article XIIIA provides that the one-percent limitation does not applyto ad valorem taxes levied to pay interest and redemption charges on (i) indebtednessapproved by the voters prior to July 1, 1978, or (ii) bonded indebtedness for the acquisition orimprovement of real property approved on or after July 1, 1978, by two-thirds of the votes caston the proposition, or (iii) bonded indebtedness incurred by a school district or communitycollege district for the construction, reconstruction, rehabilitation or replacement of schoolfacilities or the acquisition or lease of real property for school facilities, approved by 55% of thevoters of the district, but only if certain accountability measures are included in the proposition.The tax for payment of the District’s general obligation bonds falls within the exception forbonds approved by a two-thirds vote.
Section 2 of Article XIIIA defines “full cash value” to mean the county assessor’svaluation of real property as shown on the Fiscal Year 1975-76 tax bill, or, thereafter, theappraised value of real property when purchased, newly constructed, or a change in ownershiphas occurred. The full cash value may be adjusted annually to reflect inflation at a rate not toexceed two percent per year, or to reflect a reduction in the consumer price index orcomparable data for the area under taxing jurisdiction, or may be reduced in the event ofdeclining property value caused by substantial damage, destruction or other factors.Legislation enacted by the State Legislature to implement Article XIIIA provides that,notwithstanding any other law, local agencies may not levy any ad valorem property tax exceptthe 1% base tax levied by each County and taxes to pay debt service on indebtednessapproved by the voters as described above.
Since its adoption, Article XIIIA has been amended a number of times. Theseamendments have created a number of exceptions to the requirement that property bereassessed when purchased, newly constructed or a change in ownership has occurred. These
10
exceptions include certain transfers of real property between family members, certainpurchases of replacement dwellings for persons over age 55 and by property owners whoseoriginal property has been destroyed in a declared disaster, and certain improvements toaccommodate disabled persons and for seismic upgrades to property. These amendmentshave resulted in marginal reductions in the property tax revenues of the District.
Both the California State Supreme Court and the United States Supreme Court haveupheld the validity of Article XIIIA.
Article XIIIC and Article XIIID of the California Constitution. On November 5, 1996,the voters of the State approved Proposition 218, the so-called “Right to Vote on Taxes Act.”Proposition 218 added Articles XIIIC and XIIID to the State Constitution, which contain anumber of provisions affecting the ability of local agencies, including school districts, to levy andcollect both existing and future taxes, assessments, fees and charges. Among other things,Article XIIIC establishes that every tax is either a “general tax” (imposed for generalgovernmental purposes) or a “special tax” (imposed for specific purposes); prohibits specialpurpose government agencies such as school districts from levying general taxes; and prohibitsany local agency from imposing, extending or increasing any special tax beyond its maximumauthorized rate without a two-thirds vote. Article XIIIC also provides that no tax may beassessed on property other than ad valorem property taxes imposed in accordance with ArticlesXIII and XIIIA of the California Constitution and special taxes approved by a two-thirds voteunder Article XIIIA, Section 4.
Article XIIIC also provides that the initiative power shall not be limited in matters ofreducing or repealing local taxes, assessments, fees and charges. The State Constitution andthe laws of the State impose a duty on the County to levy the 1% ad valorem property tax andto distribute proceeds of the tax to local agencies in the County, including school districts. Theinitiative power cannot be used to reduce or repeal the authority and obligation to levy suchtaxes or to otherwise interfere with performance of the duty of the County with respect to suchtaxes. Legislation adopted in 1997 provides that Article XIIIC shall not be construed to meanthat any owner or beneficial owner of a municipal security assumes the risk of or consents toany initiative measure which would constitute an impairment of contractual rights under thecontracts clause of the U.S. Constitution.
Article XIIID deals with assessments and property-related fees and charges. ArticleXIIID explicitly provides that nothing in Article XIIIC or XIIID shall be construed to affect existinglaws relating to the imposition of fees or charges as a condition of property development;however it is not clear whether the initiative power is therefore unavailable to repeal or reducedeveloper and mitigation fees imposed by the District. Developer fees imposed by the Districtare restricted as to use and are generally unavailable for repayment for the Notes.
The interpretation and application of Proposition 218 will ultimately be determined by thecourts with respect to a number of the matters discussed above, and it is not possible at thistime to predict with certainty the outcome of such determination.
Expenditures and Appropriations
Article XIIIB of the California Constitution. In addition to the limits Article XIIIAimposes on property taxes that may be collected by local governments, certain other revenuesof the State and local governments are subject to an annual “appropriations limit” or “GannLimit” imposed by Article XIIIB of the State Constitution, which effectively limits the amount ofsuch revenues that government entities are permitted to spend. Article XIIIB, approved by thevoters in June 1979, was modified substantially by Proposition 111 in 1990. The appropriationslimit of each government entity applies to “proceeds of taxes,” which consist of tax revenues,state subventions and certain other funds, including proceeds from regulatory licenses, usercharges or other fees to the extent that such proceeds exceed “the cost reasonably borne by

11
such entity in providing the regulation, product or service.” “Proceeds of taxes” exclude taxrefunds and some benefit payments such as unemployment insurance. No limit is imposed onthe appropriation of funds which are not “proceeds of taxes,” such as reasonable user chargesor fees, and certain other non-tax funds.
Article XIIIB also does not limit appropriation of local revenues to pay debt service onbonds existing or authorized by January 1, 1979, or subsequently authorized by the voters,appropriations required to comply with mandates of courts or the federal government,appropriations for qualified capital outlay projects, and appropriation by the State of revenuesderived from any increase in gasoline taxes and motor vehicle weight fees above January 1,1990, levels. The appropriations limit may also be exceeded in cases of emergency; however,the appropriations limit for the three years following such emergency appropriation must bereduced to the extent by which it was exceeded, unless the emergency arises from civildisturbance or natural disaster declared by the Governor, and the expenditure is approved bytwo-thirds of the legislative body of the local government.
The State and each local government entity has its own appropriations limit. Each year,the limit is adjusted to allow for changes, if any, in the cost of living, the population of thejurisdiction, and any transfer to or from another government entity of financial responsibility forproviding services. Each school district is required to establish an appropriations limit eachyear. In the event that a school district’s revenues exceed its spending limit, the district mayincrease its appropriations limit to equal its spending by taking appropriations limit from theState.
Proposition 111 requires that each agency’s actual appropriations be tested against itslimit every two years. If the aggregate “proceeds of taxes” for the preceding two-year periodexceed the aggregate limit, the excess must be returned to the agency’s taxpayers through taxrate or fee reductions over the following two years. If the State’s aggregate “proceeds of taxes”for the preceding two-year period exceed the aggregate limit, 50% of the excess is transferredto fund the State’s contribution to school and college districts.
Future Initiatives
Article XIIIA, Article XIIIB, Article XIIIC, Article XIIID and Proposition 111 were eachadopted as measures that qualified for the ballot pursuant to California's initiative process.From time to time other initiative measures could be adopted, further affecting City revenues orthe City's ability to expend revenues. The nature and impact of these measures cannot beanticipated by the City.
LEGAL OPINION
The statements of law and legal conclusions set forth in this Official Statement underthe heading "TAX MATTERS" have been reviewed by Bond Counsel. Bond Counsel'semployment is limited to a review of the legal proceedings required for the authorization of theNotes and to rendering the opinion discussed below. Such opinion will not consider or extendto any documents, agreements, representations, offering circulars or other material of any kindconcerning the Notes not mentioned in this paragraph. Bond Counsel takes no responsibilityfor the accuracy, completeness or fairness of this Official Statement. Bond Counsel’scompensation is contingent upon the delivery of the Notes. Certain legal matters will be passedupon for the City by the City Attorney.

12
TAX MATTERS
In the opinion of Jones Hall, A Professional Law Corporation, San Francisco, California,Bond Counsel, subject, however, to the qualifications set forth below, under existing law, theinterest on the Notes is excluded from gross income for federal income tax purposes and suchinterest is not an item of tax preference for purposes of the federal alternative minimum taximposed on individuals and corporations.
The opinions set forth in the preceding paragraph are subject to the condition that theCity comply with all requirements of the Internal Revenue Code of 1986 (the “Code) that mustbe satisfied subsequent to the issuance of the Notes in order that such interest be, or continueto be, excluded from gross income for federal income tax purposes. The City has covenantedto comply with each such requirement. Failure to comply with certain of such requirements maycause the inclusion of such interest in gross income for federal income tax purposes to beretroactive to the date of issuance of the Notes.
If the initial offering price to the public (excluding bond houses and brokers) at whicheach Note is sold is greater than the amount payable at maturity thereof, then such differenceconstitutes "original issue premium" for purposes of federal income taxes and State ofCalifornia personal income taxes. Under the Code, original issue premium is amortized on anannual basis over the term of the Note (said term being the shorter of the Note's maturity dateor its call date). The amount of original issue premium amortized each year reduces theadjusted basis of the owner of the Note for purposes of determining taxable gain or loss upondisposition. The amount of original issue premium on a Note is amortized each year over theterm to maturity of the Note on the basis of a constant interest rate compounded on eachinterest or principal payment date (with straightline interpolations between compounding dates).Amortized Note premium is not deductible for federal income tax purposes. Owners ofPremium Notes, including purchasers who do not purchase in the original offering, shouldconsult their own tax advisors with respect to State of California personal income tax andfederal income tax consequences of owning such Notes.
The difference between the initial offering prices to the public (excluding bond housesand brokers) at which the Notes are sold and the amount payable at maturity thereofconstitutes "original issue discount" for purposes of federal income taxes and State of Californiapersonal income taxes. Purchasers should be aware that the Internal Revenue Service hasissued Notice 94-84 which may have federal income tax consequences with respect to theNotes. This Notice provides generally that, in the case of short-term tax-exempt obligations(such as the Notes), the Service is studying whether interest payable at maturity on theobligations should, or should not, be included in stated redemption price at maturity, forpurposes of the rule that original issue discount represents the excess of stated redemptionprice at maturity over issue price.
Notice 94-84 states that until the Internal Revenue Service provides further guidance,taxpayers may treat stated interest on certain short-term obligations, such as the Notes, eitheras includible in stated redemption price at maturity or as not included in stated redemption priceat maturity. A taxpayer, however, must treat stated interest payable at maturity on all short-term tax-exempt bonds in a consistent manner. A short-term tax-exempt bond is defined as atax-exempt bond with a term that is not more than 1 year from the date of issue.
Purchasers of the Notes are cautioned that the opinion of Bond Counsel does notidentify the amount of interest that is excluded from gross income for federal income tax

13
purposes.
Purchasers of the Notes should consult their tax advisors regarding the application ofNotice 94-84 to individual tax circumstances.
Owners of the Notes should also be aware that the ownership or disposition of, or theaccrual or receipt of interest on, the Notes may have federal or state tax consequences otherthan as described above. Bond Counsel expresses no opinion regarding any federal or statetax consequences arising with respect to the Notes other than as expressly described above.
In the further opinion of Bond Counsel, interest on the Notes is exempt from Californiapersonal income taxes.
A copy of the proposed form of opinion of Bond Counsel is attached hereto asAPPENDIX C.
CONTINUING DISCLOSURE
The City will covenant for the benefit of owners of the Notes to provide notices, duringthe time the Notes are outstanding, of the occurrence of certain enumerated events, if deemedby the City to be material. The notices of material events will be filed by the City with theMunicipal Securities Rulemaking Board, and the appropriate State information depository, ifany. These covenants will be made in order to assist the Underwriter in complying with S.E.C.Rule 15c2-12(b)(5). The City has never failed to comply in any material respect with anyprevious undertaking with regard to said Rule to provide annual reports or notices of materialevents. See “APPENDIX D - FORM OF CONTINUING DISCLOSURE CERTIFICATE.”
ABSENCE OF MATERIAL LITIGATION
No litigation is pending or threatened concerning the validity of the Notes, and acertificate to that effect will be furnished to the underwriter at the time of the original delivery ofthe Notes. The City is not aware of any litigation pending or threatened questioning the politicalexistence of the City or contesting the City's ability to receive ad valorem taxes or to collectother Unrestricted Moneys or contesting the City's ability to issue and retire the Notes.
There are a number of lawsuits and claims pending against the City. The aggregateamount of the uninsured liabilities of the City, and the timing of any anticipated payments ofjudgments which may result from suits and claims, will not, in the opinion of the City, materiallyaffect the finances of the City or impair its ability to repay the Notes. A certificate of the City tothis effect will be available at the time of original delivery of the Notes.

14
UNDERWRITING
The Notes were purchased by Morgan Stanley & Co., Incorporated (the "Underwriter")at a price of $50,789,001 (representing $50,000,000 aggregate principal amount of the Notesplus a purchase premium of $794,500 less an underwriter’s discount of $5,499). The PurchaseContract provides that the Underwriter will purchase all of the Notes if any are purchased, theobligation to make such purchase being subject to certain terms and conditions set forth in thePurchase Contract, the approval of certain legal matters by counsel and certain otherconditions.
The Underwriter may offer and sell Notes to certain dealers and others at prices lowerthan the offering price stated on the cover page hereof. The offering price may be changedfrom time to time by the Underwriter.
Morgan Stanley, parent company of Morgan Stanley & Co. Incorporated, an underwriterof the Bonds, has entered into a retail brokerage joint venture with Citigroup Inc. As part of thejoint venture, Morgan Stanley & Co. Incorporated will distribute municipal securities to retailinvestors through the financial advisor network of a new broker-dealer, Morgan Stanley SmithBarney LLC. This distribution arrangement became effective on June 1, 2009. As part of thisarrangement, Morgan Stanley & Co. Incorporated will compensate Morgan Stanley SmithBarney LLC for its selling efforts with respect to the Notes.
FINANCIAL ADVISOR
The City has retained Northcross, Hill & Ach, Inc., San Rafael, California, as financialadvisor (the “Financial Advisor”) in connection with the preparation of this Official Statementand with respect to the issuance of the Notes. The Financial Advisor is not obligated toundertake, and has not undertaken to make, an independent verification or assumeresponsibility for the accuracy, completeness, or fairness of the information contained in thisOfficial Statement. Northcross, Hill & Ach, Inc. is an independent financial advisory firm and isnot engaged in the business of underwriting, trading or distributing municipal securities or otherpublic securities. The Financial Advisor’s compensation is contingent upon the delivery of theNotes.
RATING
Moody's Investors Services Inc. has assigned a rating to the Notes as shown on thecover to this Official Statement. Certain information was supplied by the City to said ratingagency which was considered in evaluating the Notes. The rating issued reflects only the viewsof such rating agency, and any explanation of the significance of such rating should be obtainedfrom the rating agency. There is no assurance that the rating will be retained for any givenperiod of time or that the same will not be revised downward or withdrawn entirely by suchrating agency if, in its judgment, circumstances so warrant. Any downward revision orwithdrawal of the rating obtained may have an adverse effect on the market price of the Notes.

15
ADDITIONAL INFORMATION
The purpose of this Official Statement is to supply information to purchasers of theNotes. Quotations from and summaries and explanations of the Notes and the Resolutionauthorizing the Notes and of statutes and documents contained herein do not purport to becomplete, and reference is hereby made to said Resolution, statutes and documents for full andcomplete statements of their provisions. Additional information can be obtained from the City’sDirector of Finance.
This Official Statement speaks only as of its date and the information presented hereinis subject to change. Any statements in this Official Statement involving matters of opinion,whether or not expressly stated are intended as such and not as representations of fact. ThisOfficial Statement is not to be construed as a contract or agreement among the City and thepurchaser of the Notes or owners of any of the Notes. This Official Statement and itsdistribution have been authorized and approved by the City Council of the City.
CITY OF BERKELEY, CALIFORNIA
By: /s/ Phil KamlarzCity Manager

(THIS PAGE INTENTIONALLY LEFT BLANK)
A-1
APPENDIX A
CERTAIN INFORMATION CONCERNING THE CITY OF BERKELEY
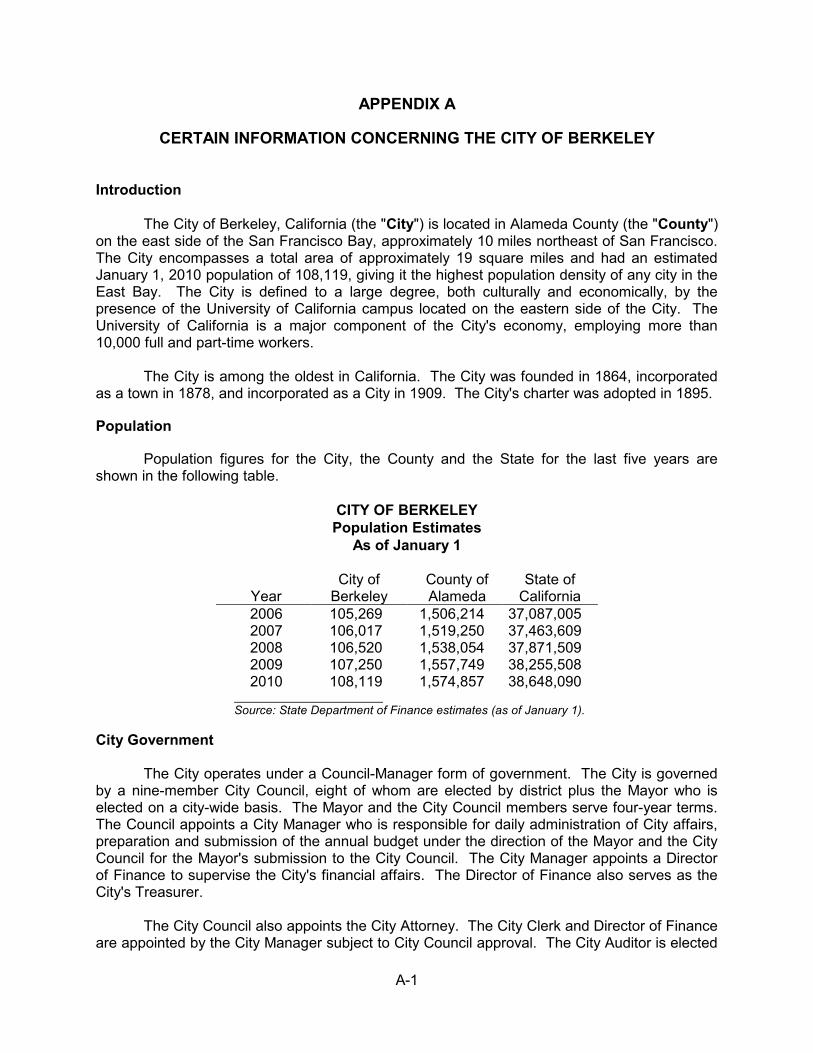
Introduction
The City of Berkeley, California (the "City") is located in Alameda County (the "County")on the east side of the San Francisco Bay, approximately 10 miles northeast of San Francisco.The City encompasses a total area of approximately 19 square miles and had an estimatedJanuary 1, 2010 population of 108,119, giving it the highest population density of any city in theEast Bay. The City is defined to a large degree, both culturally and economically, by thepresence of the University of California campus located on the eastern side of the City. TheUniversity of California is a major component of the City's economy, employing more than10,000 full and part-time workers.
The City is among the oldest in California. The City was founded in 1864, incorporatedas a town in 1878, and incorporated as a City in 1909. The City's charter was adopted in 1895.
Population
Population figures for the City, the County and the State for the last five years areshown in the following table.
CITY OF BERKELEYPopulation Estimates
As of January 1
YearCity of
BerkeleyCounty ofAlameda
State ofCalifornia
2006 105,269 1,506,214 37,087,0052007 106,017 1,519,250 37,463,6092008 106,520 1,538,054 37,871,5092009 107,250 1,557,749 38,255,5082010 108,119 1,574,857 38,648,090
Source: State Department of Finance estimates (as of January 1).
City Government
The City operates under a Council-Manager form of government. The City is governedby a nine-member City Council, eight of whom are elected by district plus the Mayor who iselected on a city-wide basis. The Mayor and the City Council members serve four-year terms.The Council appoints a City Manager who is responsible for daily administration of City affairs,preparation and submission of the annual budget under the direction of the Mayor and the CityCouncil for the Mayor's submission to the City Council. The City Manager appoints a Directorof Finance to supervise the City's financial affairs. The Director of Finance also serves as theCity's Treasurer.
The City Council also appoints the City Attorney. The City Clerk and Director of Financeare appointed by the City Manager subject to City Council approval. The City Auditor is elected
A-2
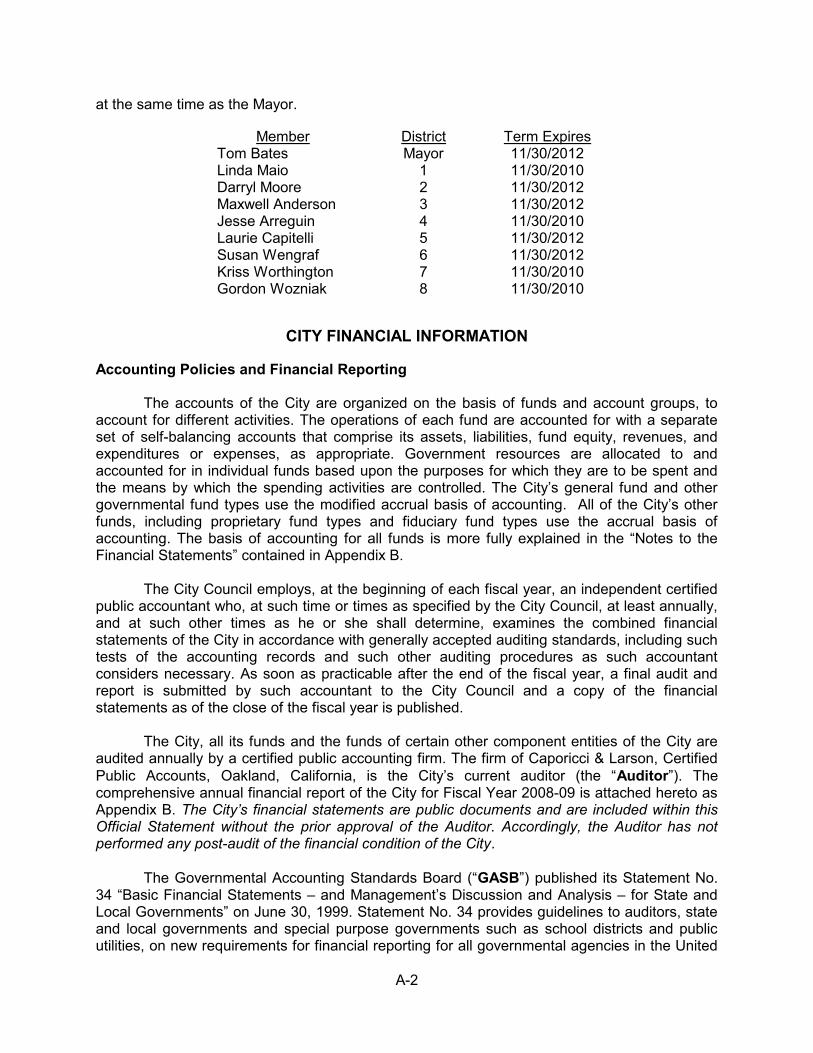
at the same time as the Mayor.
Member District Term ExpiresTom Bates Mayor 11/30/2012Linda Maio 1 11/30/2010Darryl Moore 2 11/30/2012Maxwell Anderson 3 11/30/2012Jesse Arreguin 4 11/30/2010Laurie Capitelli 5 11/30/2012Susan Wengraf 6 11/30/2012Kriss Worthington 7 11/30/2010Gordon Wozniak 8 11/30/2010
CITY FINANCIAL INFORMATION
Accounting Policies and Financial Reporting
The accounts of the City are organized on the basis of funds and account groups, toaccount for different activities. The operations of each fund are accounted for with a separateset of self-balancing accounts that comprise its assets, liabilities, fund equity, revenues, andexpenditures or expenses, as appropriate. Government resources are allocated to andaccounted for in individual funds based upon the purposes for which they are to be spent andthe means by which the spending activities are controlled. The City’s general fund and othergovernmental fund types use the modified accrual basis of accounting. All of the City’s otherfunds, including proprietary fund types and fiduciary fund types use the accrual basis ofaccounting. The basis of accounting for all funds is more fully explained in the “Notes to theFinancial Statements” contained in Appendix B.
The City Council employs, at the beginning of each fiscal year, an independent certifiedpublic accountant who, at such time or times as specified by the City Council, at least annually,and at such other times as he or she shall determine, examines the combined financialstatements of the City in accordance with generally accepted auditing standards, including suchtests of the accounting records and such other auditing procedures as such accountantconsiders necessary. As soon as practicable after the end of the fiscal year, a final audit andreport is submitted by such accountant to the City Council and a copy of the financialstatements as of the close of the fiscal year is published.
The City, all its funds and the funds of certain other component entities of the City areaudited annually by a certified public accounting firm. The firm of Caporicci & Larson, CertifiedPublic Accounts, Oakland, California, is the City’s current auditor (the “Auditor”). Thecomprehensive annual financial report of the City for Fiscal Year 2008-09 is attached hereto asAppendix B. The City’s financial statements are public documents and are included within thisOfficial Statement without the prior approval of the Auditor. Accordingly, the Auditor has notperformed any post-audit of the financial condition of the City.
The Governmental Accounting Standards Board (“GASB”) published its Statement No.34 “Basic Financial Statements – and Management’s Discussion and Analysis – for State andLocal Governments” on June 30, 1999. Statement No. 34 provides guidelines to auditors, stateand local governments and special purpose governments such as school districts and publicutilities, on new requirements for financial reporting for all governmental agencies in the United

A-3
States. Generally, the basic financial statements and required supplementary informationshould include (i) Management’s Discussion and Analysis; (ii) financial statements preparedusing the economic measurement focus and the accrual basis of accounting and fund financialstatements prepared using the current financial resources measurement focus and the modifiedaccrual method of accounting and (iii) required supplementary information. The City’s financialstatements are prepared in conformance with the requirements of Statement No. 34.
Comparative Financial Statements
The following tables provide a four-year history of the City’s Comparative BalanceSheet, General Fund revenues, expenditures, transfers, and ending fund balances.
CITY OF BERKELEYGENERAL FUND BALANCE SHEET
(As of June 30)
Actual Actual Actual Actual2005-06 2006-07 2007-08 2008-09
ASSETS:Cash and investments in treasury $54,705,802 $60,562,407 $62,483,357 $62,156,359Receivables (net of allowance whereapplicable):
Accounts 1,773,699 1,818,013 4,639,450 3,085,498Accrued interest 1,264,948 1,655,814 1,611,253 2,013,751Taxes 4,424,108 5,312,035 5,235,740 4,913,871Due from other funds 6,540,034 7,549,777 9,534,271 7,155,244Advance to other funds 1,107,900Due from Components Units 211,243 247,077Notes receivable 3,235,977 2,931,842 2,925,580 2,825,135Other 7,455 114,094 113,268 124,769
Total assets 73,059,923 79,943,982 86,754,162 82,521,705
LIABILITIES:Accounts payable 1,801,381 1,066,465 1,637,048 2,089,909Accrued salaries and wages 3,125,189 2,821,028 4,848,335 5,319,269Deposits held 378,718 306,768 490,289Deferred revenue 2,225,371 2,495,131 4,830,914 2,991,872Other liabilities 2,370,364 2,458,139 1,828,455 1,638,942Tax and revenue anticipation notes 25,000,000 25,000,000 25,000,000 25,000,000
Total liabilities 34,522,305 34,219,482 38,451,521 37,530,282
FUND BALANCESReserved for:
Encumbrances 1,540,338 1,953,803 3,693,269 2,765,499Due from and advances to other funds 7,647,934 7,549,777 9,534,271 7,155,244Due from Component Units -- -- -- 247,077Notes receivable 3,235,977 2,931,842 2,925,580 2,825,135Lawsuits -- 2,500,000 -- --Shortfall for utility undergrounding -- 800,000 -- --
Unreserved, report in:General fund 26,113,369 29,989,078 32,149,521 31,998,467
Total fund balances 38,537,618 45,724,500 48,302,641 44,991,423
Total liabilities and fund balances $73,059,923 $79,943,982 $86,754,162 $82,521,705
Source: City Audited Financial Statements.

A-4
CITY OF BERKELEYSTATEMENT OF GENERAL FUND
REVENUES, EXPENDITURES AND BALANCES(Fiscal Year Ending June 30)
(Dollar amounts in thousands)
Actual Actual Actual Actual Budgeted2005-06 2006-07 2007-08 2008-09 2009-10
REVENUES:Taxes $ 93,078 $ 98,043 $100,442 $97,988 $103,695
Licenses and Permits 297 236 272 343 305Subvention and Grants 6,546 8,900 8,617 9,051 9,042Service Fees 5,354 5,690 6,138 7,214 6,681Fines and Forfeitures 9,801 12,408 10,625 10,553 12,027Rents 132 124 101 113 109Franchises 1,532 1,686 1,732 1,848 1,965Interest 3,469 5,504 6,323 8,746 5,200Indirect Cost reimbursements -- 4,493 5,109 5,388 --Transfers In/Other 11,548 2,865 4,949 1,053 8,383TOTAL REVENUES 131,757 139,949 144,307 142,296 147,407
EXPENDITURES:General Government 26,527 27,904 29,993 31,563 34,289Public Safety 65,070 67,785 73,425 74,982 78,050Highways and Streets 598 550 1,513 2,204 1,885Health and Human Services 8,960 9,088 9,513 10,291 7,065Culture-Recreation 4,524 4,710 6,113 5,952 5,240Community Development 2,611 2,988 3,347 3,661 3,666Economic Development 1,434 1,457 1,790 2,200 2,011Debt Service 1,112 1,274 1,306 1,033 1,035Transfers Out/Other 16,382 18,285 17,354 -- 15,261TOTAL EXPENDITURES 127,218 134,041 $144,354 131,885 148,502
Excess Revenues Over (Under)Expenditures
4,539 5,908 (47) 10,411 (1,095)
Transfers In(out)/other -- -- -- (13,238) --
Fund Balance, July 1 33,999 38,538 45,725 48,303 44,991Prior Period Adjustment -- 1,279 2,625 (485) --
Fund Balance, June 30 $ 38,538 $ 45,725 $ 48,303 $ 44,991 $ 43,896
Source: City Audited Financial Statements; City of Berkeley for 2009-10 Budgeted.

A-5
Budgetary Process and Administration
The City employs a two-year budget process. In year one of the biennial budget cycle,the City Council formally adopts authorized appropriations for the first Fiscal Year and approves“planned” appropriations for the second Fiscal Year. In year two, the City Council considersrevisions and formally adopts authorized appropriations for the second Fiscal Year. Althoughthe budget cycle covers a two-year period, the City Charter requires that the City Council adoptan annual appropriations ordinance for each budget year.
From about January to May of each year, the City Council meets in public to discusspolicies and priorities for the upcoming budget. The City Manager prepares a proposed budgetbased on input from department heads, and presents this to the City Council by the firstMonday in May of a budget year or as fixed by the City Council. The City also maintainsadditional budgetary controls to ensure compliance with the annual appropriated budget. TheCity Manager is authorized to transfer budgeted amounts within funds as deemed necessary tomeet the City’s needs. However, revisions that alter the total budget or move amounts fromone fund to another must be approved by the City Council.
On June 23, 2009, the City Council adopted its two-year budget for Fiscal Year 2009-10and Fiscal Year 2010-11. On May 4, 2010, the City Manager plans to present a Third QuarterBudget Review to the City Council. According to the Budget Review, the City is experiencing aGeneral Fund short-fall of $4.5 million over what was budgeted for Fiscal Year 2009-10. In theshort term, the City intends to avoid layoffs by holding positions vacant to generate increasedsalary savings, eliminate all non-essential non-personnel costs, defer capital projects andreallocate capital funding, use bond funds for Fire Department eligible overtime, use some one-time reserve funds set-aside for retirement rate increases, and allocate one-time funding for twocritical programs as directed by Council and discussed later in the report, and advanceavailable funds until long-term balancing solutions are developed for the Public Health andRefuse Funds. City staff is working with the City Council to develop a long term budgetsolution, which is expected to include General Fund expenditure reductions of 5%.
Revenues and expenditures relating to the City’s general governmental operations arebudgeted and accounted for in the City’s general fund, including public safety, highways andstreets, health and welfare, culture and recreation, community development, housing andeconomic development. General taxes and fees support most of these activities. The“business” or proprietary activities of the City are accounted for in each of eight enterprisefunds, which include those established for Refuse Collection, Marina Operations, SanitarySewers, Clean Storm Water, Permit Service Center, Off-Street Parking, Parking Meter, andBuilding Purchases & Management. These activities are intended to be completely or largelyself-supporting through user fees and charges. The balance of this “CITY FINANCIALINFORMATION” section is concerned with the operations and performance of the City’sGeneral Fund, unless otherwise noted.
State Budget and its Impact on the City
Set forth in the following paragraphs are descriptions of the State budget process, thecurrent State budget situation, and the potential impacts on the City.
The Budget Process. Through the State budget process, the State can enact

A-6
legislation that significantly impacts the source, amount and timing of the receipt of revenues bylocal agencies, including the City. As in recent years, State budget deficits can result inlegislation that adversely impacts local agency budgets.
The State’s fiscal year begins on July 1 and ends on June 30. The annual budget isproposed by the Governor by January 10 of each year for the next fiscal year (the “Governor’sBudget”). Under State law, the annual proposed Governor’s Budget cannot provide forprojected expenditures in excess of projected revenues and balances available from prior fiscalyears. Following the submission of the Governor’s Budget, the Legislature takes up theproposal.
Under the State Constitution, money may be drawn from the Treasury only through anappropriation made by law. The primary source of the annual expenditure authorizations is theBudget Act as approved by the Legislature and signed by the Governor. The Budget Act mustbe approved by a two-thirds majority vote of each House of the Legislature. The Governor mayreduce or eliminate specific line items in the Budget Act or any other appropriations bill withoutvetoing the entire bill. Such individual line item vetoes are subject to override by a two-thirdsmajority vote of each House of the Legislature.
Appropriations also may be included in legislation other than the Budget Act. Billscontaining appropriations (except for K-14 education) must be approved by a two-thirds majorityvote in each House of the Legislature and be signed by the Governor. Bills containing K-14education appropriations only require a simple majority vote. Continuing appropriations,available without regard to fiscal year, may also be provided by statute or the StateConstitution.
Funds necessary to meet an appropriation need not be in the State Treasury at the timesuch appropriation is enacted; revenues may be appropriated in anticipation of their receipt.
Recent State Budgets. Certain information about the State budgeting process and theState Budget is available through several State of California sources. A convenient source ofinformation is the State’s website, where recent official statements for State bonds are posted.The references to internet websites shown below are shown for reference and convenienceonly; the information contained within the websites has not been reviewed by the City and is notincorporated herein by reference.
The California State Treasurer’s Internet home page at www.treasurer.ca.gov, under theheading “Financial Information,” posts the State’s audited financial statements. In addition, the“Financial Information” section includes the State’s Rule 15c2-12 filings for State bond issues.The “Financial Information” section also includes the “Overview of the State Economy andGovernment, State Finances, State Indebtedness, Litigation” from the State’s most currentOfficial Statement, which discusses the State budget and its impact on school districts.
The California Department of Finance’s Internet home page at www.dof.ca.gov, underthe heading “California Budget,” includes the text of proposed and adopted State Budgets.
The State Legislative Analyst’s Office the (“LAO”) prepares analyses of the proposedand adopted State budgets. The analyses are accessible on the Legislative Analyst’s Internethome page at www.lao.ca.gov under the heading “Products.”

A-7
2008-09 State Budget. On September 23, 2008, the Governor signed the 2008-09State Budget into law (the “2008-09 Budget”). The 2008-09 Budget resolved the $24.3 billionbudget deficit identified in the May (2008) revision to the Governor’s Proposed Budget. The2008-09 Budget, as adopted, projected revenues of $103.027 billion in fiscal year 2007-08 and$101.991 billion in fiscal year 2008-09 (representing an increase of $1.837 billion in fiscal year2007-08 and a decrease of $996 million in fiscal year 2008-09, compared with the MayRevision), provided a modest reserve of $1.7 billion, but projected a deficit of $1.0 billion infiscal year 2009-10.
Special Session - Revisions to 2008-09 Budget; 2009-10 Adopted State Budget.Through a series of legislative actions that occurred from November 5, 2008 through February20, 2009, the State legislature and the Governor enacted a budget package addressing the2008-09 Budget deficit, and adopting a budget for fiscal year 2009-10.
On March 13, 2009, the LAO updated its revenue forecast and projected that revenueswould fall short of the assumptions in the 2009-10 Budget by $8 billion and that number of theadopted solutions—revenue increases and spending reductions—are of a short-term duration.Thus, without corrective actions, the State’s huge operating shortfalls will reappear in futureyears—growing from $12.6 billion in 2010–11 to $26 billion in 2013.
On May 7, 2009, the LAO reported that, as result of the budget and cash pressures ofrecent months, the General Fund’s “cash cushion”—the monies available to pay State bills atany given time—currently is projected to end fiscal year 2008‑09 at a much lower level than normal. Without additional legislative measures to address the State’s fiscal difficulties orunprecedented amounts of borrowing from the short-term credit markets, the State will not beable to pay many of its bills on time for much of fiscal year 2009‑10.
May 14, 2009 Budget Revision. Under California law, in May of each year theGovernor issues a revised budget with changes he or she can support, based on the debate,analysis and changes in the economic forecasts. On May 14, 2009, the Governor released theMay Revision, which included two alternative proposals to revise the State budget to addressthe State’s increasing deficit. The specific proposal to be considered depended, in part, on theresult of certain statewide ballot measures decided by the voters on the May 19, 2009 specialelection ballot.
Because State voters rejected the three propositions on the special election ballot thatwould have helped balance the State’s budget, the Governor estimates a budget shortfall of$21 billion in 2009-10.
Governor Declares Fiscal Emergency. The Governor announced on July 1 that thebudget deficit had grown by $2 billion to $26.3 billion due to the failure of State lawmakers toadopt immediate education cuts and money-shifting plans by the June 30 fiscal year end. Hedeclared a fiscal emergency and ordered a Proposition 58 special session of the Legislature tosolve the State’s deficit. To address the State’s cash crisis, on July 2 the State began issuingregistered warrants, or IOUs, to several classes of creditors, including certain localgovernments.
A-8
2009-10 State Budget Amendments; Proposition 1A Borrowing. On July 24, 2009,the California legislature approved amendments to the 2009-10 Budget involving 30 separatepieces of legislation to close the $26.3 billion shortfall. The Governor signed the budget plan onJuly 28, 2009. Total general fund spending in fiscal year 2009-10 will be more than $84 billion,down from nearly $91.7 billion in fiscal year 2008-09 and nearly $103 billion in fiscal year 2007-08. The budget amendments combine deep spending cuts, borrowing from local governmentsand accounting maneuvers.
The approved amendments include borrowing from local governments and variousaccounting maneuvers to generate additional revenues in the 2009-10, including (among manyothers) $2 billion borrowed from cities’ and counties’ property tax collections under provisions ofProposition 1A (approved by the voters in 2004), but the State must repay the borrowing withinterest within three years (see “ – Property Taxes” above).
The accounting shifts rely on the assumption that an economic recovery will be wellunderway in the next fiscal year and some economists believe that they produce a significantbudget shortfall next year. Additionally, borrowing revenues from local governments is likely toresult in litigation.
Governor’s Proposed Fiscal Year 2010-11 Budget. The Governor submitted hisproposed 2010-11 Budget (the “2010-11 Proposed Budget”) to the State Legislature onJanuary 8, 2010. The 2010-11 Proposed Budget assumes that, without corrective action, theState will face a deficit of $19.9 billion, comprised of a shortfall of $6.6 billion from the 2009-10fiscal year, a 2010-11 shortfall of $12.3 billion and a proposed reserve of $1 billion. The 2010-11 Proposed Budget proposes initial spending reductions of $8.5 billion. Proposed reductionsinclude program eliminations, further reductions to various health and human servicesprograms, a $2.4 billion reduction to the anticipated level of funding for Proposition 98 (over atwo-year period), substantial changes to employee compensation, and reductions to theDepartment of Corrections and Rehabilitation. In addition, the 2010-11 Proposed Budget relieson $6.9 billion in additional federal funding and proposes an additional $4.6 billion in spendingreductions if the federal funding is not received. The 2010-11 Proposed Budget also includes$2.4 billion in increased revenues and requires external borrowing to meet cash needs duringthe fiscal year.
The Governor called the Legislature to a special session to adopt $8.9 billion of theproposed $19.9 billion in budget solutions and to put measures on the June 2010 ballot tofacilitate $1 billion in general fund budget relief from Proposition 10 early childhooddevelopment funds and Proposition 63 mental health funds.
LAO Report on Proposed Budget. On January 12, 2010, the LAO commented on the2010-11 Proposed Budget, stating that the Governor's estimate of an $18.9 billion budgetproblem is reasonable but is a $3.1 billion smaller shortfall than the LAO estimates and may beexacerbated by various lawsuits. The LAO also noted that the Governor’s plan relies heavily onfederal relief, which the state is unlikely to receive in the amounts requested. The Legislatureneeds to assume that the federal relief will total billions less than the Governor budgets for andwill need to make difficult decisions regarding both revenues and spending and needs to makemany key decisions by the end of March in order to implement them for the next fiscal year.

A-9
2010-11 Special Session. On March 11, 2010, the California Legislature adjourned thespecial session called by the Governor. The Legislature adopted a package of bills that theLegislature said would reduce the deficit by more than $4 billion. Since then, the Governorvetoed two bills that contained a majority of the deficit reductions.
May Revision. The Governor’s May Revision estimates a general fund budget gap of$19.1 billion, $7.7 billion for the 2009-10 fiscal year and $10.2 billion for the 2010-11 fiscal year,and a modest reserve of $1.2 billion. The May Revision proposes $12.4 billion in spendingreductions and alternative funding solutions. Additionally, the May Revision proposes borrowingand fund shifts and relies on new revenues to further bridge the deficit gap. Major spendingreduction proposals include reductions of $4.3 billion of Proposition 98 spending, including theelimination of need-based, subsidized childcare, reductions of $2.1 billion by reducing stateemployees pay and staffing and shifting pension costs to employees, and the elimination of theCalWORKs program, which provides cash grants and welfare-to-work services, representing$1.2 billion in savings.
LAO Report on May Revision. On May 18, 2010, the LAO stated that the Governor’sestimate of the budget shortfall in the May Revision is reasonable. However, the LAO Reportadvises the Legislature to reject the Governor’s most drastic spending cuts, particularly theelimination of CalWORKs and child care funding, instituting instead the LAO’s alternativespending reduction proposals, and adopting selective revenue increases from fee increasesand other non-tax revenues and targeted tax increases. Additionally, the LAO Report urges theLegislature to suspend Proposition 98 if the minimum guarantee is above the level that the statecan afford. The LAO predicts that even if the Legislature approves all of the painful cuts andrealizes the savings assumed by the Governor’s May Revision, a multibillion-dollar operatingdeficit between $4 billion and $7 billion is likely to persist in future years.
Future State Budgets. The City cannot predict what actions will be taken in futureyears by the State Legislature and the Governor to address the State’s current or future budgetdeficits. Future State budgets will be affected by national and state economic conditions andother factors over which the City has no control. To the extent that the State budget processresults in reduced revenues to the City, the City will be required to make adjustments to itsbudget. Decrease in such revenues may have an adverse impact on the City’s ability to pay theNotes.
Information about State budgets is regularly available at various State-maintainedwebsites. See: www.dof.ca.gov, under the heading “California Budget”. Additionally, animpartial analysis of the budget is posted by the Office of the Legislative Analyst atwww.lao.ca.gov. The information referred to is prepared by the respective State agencymaintaining each website and not by the City, and the City takes no responsibility for thecontinued accuracy of the internet addresses or for the accuracy, completeness or timeliness ofinformation posted there, and such information is not incorporated herein by these references.
Ad Valorem Property Taxes
Tax Levies and Collections. Property taxes account for approximately 24% of theCity’s general fund revenues. Taxes are levied for each fiscal year on taxable real andpersonal property which is situated in the City as of the preceding January 1. A supplementalroll is developed when property changes hands which produces additional revenue.

A-10
A ten percent penalty attaches to any delinquent payment for secured roll taxes. Inaddition, property on the secured roll with respect to which taxes are delinquent becomes tax-defaulted. Such property may thereafter be redeemed by payment of the delinquent taxes andthe delinquency penalty, plus a redemption penalty to the time of redemption. If taxes areunpaid for a period of five years or more, the property is subject to auction sale by the CountyTax Collector.
In the case of unsecured property taxes, a 10% penalty attaches to delinquent taxes onproperty on the unsecured roll, and an additional penalty of 1.5% per month begins to accruebeginning November 1st of the fiscal year, and a lien is recorded against the assessee. Thetaxing authority has four ways of collecting unsecured personal property taxes: (1) a civil actionagainst the taxpayer; (2) filing a certificate in the office of the County Clerk specifying certainfacts in order to obtain a judgment lien on specific property of the taxpayer; (3) filing acertificate of delinquency for recording in the County Recorder’s office in order to obtain a lienon specified property of the taxpayer; and (4) seizure and sale of personal property,improvements or possessory interests belonging or assessed to the assessee.
The County levies (except for levies to support prior voter-approved indebtedness) andcollects all property taxes for property falling within that county’s taxing boundaries.
The following is a table summarizing the historical and current assessed valuation of thetaxable property in the City.
CITY OF BERKELEYASSESSED VALUATION
2000-01 TO 2009-10
Fiscal Year Local Secured Utility Unsecured Total Percent Change2000-01 $6,614,346,666 $2,639,989 $371,034,275 $6,988,020,930 --2001-02 7,110,938,434 2,522,621 399,742,169 7,513,203,224 7.52%2002-03 7,646,957,900 2,463,388 391,087,713 8,040,509,001 7.022003-04 8,251,039,596 2,526,768 402,174,941 8,655,741,305 7.652004-05 8,687,909,495 3,075,097 571,603,260 9,262,587,852 7.012005-06 9,499,976,877 2,520,396 574,192,669 10,076,689,942 8.792006-07 10,377,045,760 2,335,203 592,977,821 10,972,358,784 8.892007-08 11,160,531,045 1,324,910 606,785,227 11,768,641,182 7.262008-09 11,918,409,630 473,910 671,983,004 12,590,866,544 6.992009-10 12,085,578,735 473,910 720,264,455 12,806,317,100 1.71
Source: California Municipal Statistics, Inc.

A-11
The property tax levies and collections for the City for 2000-01 through 2008-09 areshown in the following table:
CITY OF BERKELEYSECURED TAX CHARGES AND DELINQUENCIES
2000-01 TO 2008-09(Dollar amounts in thousands)
Fiscal YearSecured Tax
Charge(1)
Amount DelinquentJune 30
% DelinquentJune 30
2000-01 $21,396,029.31 $420,904.01 1.972001-02 22,855,012.30 559,616.90 2.452002-03 24,637,551.31 570,260.58 2.312003-04 25,985,291.16 515,310.65 1.982004-05 28,028,117.55 552,435.47 1.972005-06 30,573,949.35 684,004.33 2.242006-07 33,552,146.54 1,189,361.30 3.542007-08 36,038,297.51 1,680,289.97 4.662008-09 38,438,858.24 1,757,281.78 4.57
(1)1% General Fund apportionment.
Source: California Municipal Statistics, Inc.
Tax Rates. The table below shows historical property tax rates within the City:
CITY OF BERKELEYTYPICAL TAX RATE PER $100 ASSESSED VALUATION
(TRA 13-000 – 2009-10 Assessed Valuation: $12,431,372,854)
FiscalYear
2005-06
FiscalYear
2006-07
FiscalYear
2007-08
FiscalYear
2008-09
FiscalYear
2009-10Countywide Rate 1.0000 1.0000 1.0000 1.0000 1.0000Berkeley Unified School District Bonds .1426 .1352 .1405 .1450 .1502Peralta Community College District .0238 .0272 .0223 .0362 .0430Bay Area Rapid Transit .0048 .0050 .0076 .0090 .0057East Bay Municipal Utility District .0072 .0068 .0065 .0064 .0065East Bay Regional Park District .0057 .0085 .0080 .0100 .0108City of Berkeley .0650 .0525 .0450 .0550 .0506Total 1.2491 1.2352 1.2299 1.2616 1.2668
Source: California Municipal Statistics, Inc.

A-12
Alternative Method of Tax Apportionment. The Board of Supervisors of the Countyhas not approved the implementation of the Alternative Method of Distribution of Tax Leviesand Collections and of Tax Sale Proceeds (the “Teeter Plan”); therefore, the City’s propertytax collections reflect actual delinquencies, plus penalties collected for prior year’sdelinquencies.
Principal Taxpayers. The twenty largest taxpayers in the City, as shown on the 2009-10 secured tax roll, and the amounts of their assessed valuation for all taxing jurisdictions withinthe City, are shown below.
CITY OF BERKELEYLARGEST 2009-10 LOCAL SECURED TAXPAYERS
Primary 2009-10 % ofProperty Owner Land Use Assessed Valuation Total (1)
1. Bayer Healthcare LLC Industrial $277,453,098 2.30%2. EQR Berkeley LP Apartments 102,585,117 0.853. Granite Library Gardens LP Apartments 78,064,549 0.654. GBC University Associates Office Building 46,818,000 0.395. SC Hillside Berkeley Inc. Apartments 45,380,200 0.386. Hanumandla R. & Hanumandla J. Reddy, Trustees Apartments 33,628,597 0.287. GAIA Building LLC Apartments 30,194,455 0.258. BVP Fulton LLC Apartments 27,755,039 0.239. Kaiser Foundation Health Plan Inc. Industrial 27,636,398 0.23
10. Oxford Street Development LLC Commercial 27,521,700 0.2311. Durant Investors LP Commercial 27,089,569 0.2212. 2600 Tenth Street LLC Office Building 26,514,892 0.2213. Seventh Street Properties II Light Industrial 24,717,552 0.2014. Prasad R. & Santi Lakireddy Apartments 24,423,142 0.2015. Pyramid Gilman Street Property LLC Industrial/Brewery 23,837,568 0.2016. John K. Gordon & Janis L. Mitchell, Trustees Office Building 23,540,985 0.1917. Fifth & Potter Street Associates LLC Light Industrial 22,331,654 0.1818. Jayaprakash R. & Annapurna Lakireddy Apartments 21,263,768 0.1819. First Shattuck LLC Office Building 19,597,269 0.1620. NFLP Berkeley Center DE LLC Movie Theater 18,617,624 0.15
$928,971,176 7.69%
(1) 2009-10 Local Secured Assessed Valuation: $12,085,578,735.Source: California Municipal Statistics, Inc.
Other General Fund Revenues
In addition to property taxes, the City has several other major tax and fee revenuesources, as described below. The following table summarizes the City’s actual or budgetedgeneral fund revenues from Fiscal Year 2006-07 through 2008-09 (actuals) and 2009-10(budgeted).

A-13
CITY OF BERKELEYGENERAL FUND REVENUES
ActualRevenue
ActualRevenue
ActualRevenue
AdoptedRevenue
FY 2007 FY 2008 FY 2009 FY 2010
Real Property $ 31,690,025 $ 34,717,302$37,119,822
$ 37,384,652
Property Transfer Tax 17,612,248 11,880,512 7,881,209 10,000,000Unsecured Property 1,974,876 2,114,996 2,474,119 2,384,369Supplemental Taxes -- -- 1,109,577 1,600,000Sales Tax 14,165,288 15,171,335 13,907,220 14,416,706Business License 11,024,918 13,562,868 13,388,429 13,518,529Hotel Tax 3,305,969 3,588,753 3,671,362 4,960,105Utility Users 14,091,521 15,310,895 14,669,480 15,838,522Vehicle In-Lieu 7,748,232 8,040,640 8,396,886 8,544,383Parking Fines 11,860,190 10,186,889 10,029,602 11,397,000Moving Violations 519,643 405,306 491,365 600,000Interest 5,503,531 6,323,199 8,745,699 5,200,000Service Fees 5,690,054 6,138,085 7,214,275 5,570,509
SUB-TOTAL $125,186,495
$127,440,780
$129,099,045
$131,414,770
Other Revenues/Transfers 14,762,081 16,865,953 16,548,575 16,163,160
TOTAL $139,948,576
$144,306,733
$145,647,620
$148,107,935
Source: City of Berkeley.
Sales and Use Tax. The sales tax is an excise tax imposed on retailers for theprivilege of selling or leasing tangible personal property. The use tax is an excise tax imposedfor the storage, use, or other consumption of tangible personal property purchased from anyretailer. The total sales tax rate within the City is currently 9.75%. The proceeds of sales anduses taxes imposed within the City are distributed by the State to various agencies, with theCity receiving 1.0% of the amount collected less 0.25% shifted to the State pursuant to amechanism commonly known as “Triple Flip.” The 0.25% reduction in local sales tax is used topay State economic recovery bonds, but cities and counties are then provided with ad valoremproperty tax revenues in lieu of these revenues. See “RISK FACTORS – Impact of State Salesand Use Tax Redirection.”
Collection of the sales and use tax is administered by the California State Board ofEqualization. Under its procedures, the State Board of Equalization projects receipts of thesales and use tax on a quarterly basis and remits an advance of the receipts of the sales anduse tax to the City on a monthly basis. The amount of each monthly advance is based upon theState Board of Equalization’s quarterly projection. During the last month of each quarter, theState Board of Equalization adjusts the amount remitted to reflect the actual receipts of thesales and use tax for the previous quarter. The Board of Equalization receives anadministrative fee based on the cost of services provided by the Board to the City inadministering the City’s sales tax, which is deducted from revenue generated by the sales anduse tax before it is distributed to the City.
Factors that have historically affected sales tax revenues include the overall economicgrowth of the Bay Area, competition from neighboring cities, the growth of specific industrieswithin the City, the City’s business attraction and retention efforts, and catalog and Internet

A-14
sales. In the first half of Fiscal Year 2009-10, revenues from sales and use taxes declined13.0% from the first half of Fiscal Year 2008-09.
A summary of historic taxable sales within the City during the past five calendar years isshown in the following table.
CITY OF BERKELEYTAXABLE TRANSACTIONS
(Figures in Thousands)
2004 2005 2006 2007 2008
Retail Stores:Apparel Stores $50,623 $56,438 $55,572 $57,539 $56,735Gen. Merchandise Stores 51,641 52,949 58,017 61,427 56,729Food Stores 58,599 60,024 62,193 63,256 63,315Eating and Drinking Places 189,494 201,489 216,900 230,566 236,391Home Furnishings and Appliances 73,306 74,273 71,330 67,632 54,595Bldg. Materials, Farm Implements 96,432 88,188 91,568 87,127 82,177Auto Dealers, Auto Supplies 147,650 142,830 130,088 122,122 109,791Service Stations 58,872 72,142 75,623 79,962 86,391Other Retail Stores 250,160 256,300 266,053 272,605 269,252Retail Store Totals 976,777 1,004,633 1,027,344 1,042,236 1,015,377All Other Outlets 279,496 271,378 310,374 310,560 324,421
TOTAL ALL OUTLETS $1,256,273 $1,276,011 $1,337,718 $1,352,796 $1,339,797
Source: State Board of Equalization.
Utility Users Tax. The City imposes a 7.5% tax on users of gas, electricity, telephoneand water, as well as cellular telephone services for billing addresses within the City. The tax isnot applicable to State, County, or City agencies, or to insurance companies and banks. Someof the factors affecting this revenue stream include consumer demand for these utilities,legislative and regulatory action, rate changes, and the evolution of technology.Telecommunications and cable generated approximately 40% of this revenue in Fiscal Year2008-09, with revenue from gas and electricity usage generating approximately 60%. Electricityrates are expected to remain stable, with steady increases anticipated over the next severalyears; gas prices have been volatile, although an increase in rates is also anticipated. In thefirst half of Fiscal Year 2009-10, revenues from utility users taxes declined 6.3% from the firsthalf of Fiscal Year 2008-09.
Business License Tax. The City requires all businesses within the City to be licensedand imposes a business license tax on all business locations and a new license registration feeon applicants for a new license. The annual tax is generally determined based on the type ofbusiness and the business’s gross receipts. The tax rate varies between $0.60 per $1000gross receipts for grocers, on the low end, and $10.81 per $1000 gross receipts for rental ofreal property on the high end. Most types of businesses are required to pay a minimum tax ofat least $51 per year. The overall revenue from this tax is dependent on the number of licenserenewals each year and the growth of businesses and industries within the City and the BayArea more generally. Revenues from the business license tax declined in Fiscal Year 2008-09.
Property Transfer Tax. The City collects a 1.5% tax on the value of any documentedsale or transfer of real property within the City. The tax is due when the transfer is recordedwith the County. Title companies collect the tax as part of the sale closing process and remitthe funds to the County when sales or transfers are finalized. The County remits the amounts

A-15
due monthly, and the amounts are credited to the general fund. A buyer of residential housingbuilt before 1989 may voluntarily choose to reserve up to one-third of the transfer tax to performseismic upgrades. Buyers typically have up to one year to complete the work and file for arebate. Previously the title companies held the reserved amount in escrow until the work wascompleted, but since May 2007, the City has held the money in escrow accounts, with theinterest going to the City. In the last two years, real property transfer tax revenue has declineddramatically as a result of reduced sales of residential and commercial property. In the first halfof Fiscal Year 2009-10, revenues from the property transfer tax declined 5.2% from the first halfof Fiscal Year 2008-09.
Parking Fines. The City issues and adjudicates citations and civil penalties for parkingviolations through its own administrative structure. It has a great degree of control over theadministration of parking fines, although issuing agencies within the County try to standardizeparking penalties to the extent possible. Revenue from parking fines is affected by thepenalties imposed for violations, the number of employees issuing tickets, how many ticketsemployees are able to issue, and the number of working parking meters, among other factors.Effective January 1, 2009, the City must remit an additional $3 per citation to the State due tothe enactment of SB 1407. In the first half of Fiscal Year 2009-10, revenues from parking finesdeclined 4.4% from the first half of Fiscal Year 2008-09.
Vehicle In Lieu Fees. Vehicle license fees (“VLF”) imposed for the operation ofvehicles on state highways are collected by the State Department of Motor Vehicles in lieu ofpersonal property taxes on vehicles. In connection with the offset of the VLF, the StateLegislature authorized appropriations from the State General Fund to “backfill” the offset so thatlocal governments, which receive all of the vehicle license fee revenues, would not experienceany loss of revenues. The legislation that established the VLF offset program also provided thatif there were insufficient State General Fund moneys to fully “backfill” the VLF offset, thepercentage offset would be reduced proportionately (i.e., the license fee payable by driverswould be increased) to assure that local governments would not be underfunded.
As part of the 2004 Budget Act negotiations, an agreement was made between theState and local government officials under which the VLF rate was permanently reduced from2% to 0.65%. In order to protect local governments, the reduction in VLF revenue to cities andcounties from this rate change was replaced by an increase in the amount of property tax theyreceive. Commencing in fiscal year 2004-05, local governments began to receive their fullshare of replacement property taxes, and those replacement property taxes now enjoyconstitutional protection against certain transfers by the State because of the approval ofProposition 1A at the November 2004 election.
Other Revenues. The City also collects additional general fund revenues fromfranchise fees, transient occupancy taxes, ambulance fees, and other more minor sources.Under the City’s cable and electric and gas franchise fee arrangements, the local cable providerpays an annual franchise fee of 5% of gross revenues, and the electricity and gas providers paythe greater of 2% of gross receipts attributable to miles of line operated or .5% of grossreceipts. The transient occupancy tax, also known as the hotel tax, is a 12% tax on the roomcharge for rental of transient lodging; it is paid by the hotel guest. The City also has anagreement with the County to be the exclusive provider of all emergency ground ambulanceservices within the City; the specific ambulance fee depends on the type of service deliveredand is billed to clients or their insurance companies. Finally, other more minor revenue sourcesinclude payments for moving violations, interest on existing funds, and other service fees.

A-16
Retirement Programs
The City contributes to the Public Employees' Retirement System ("PERS") of the Stateof California, a defined benefit plan. All full-time and part-time benefited employees are eligibleto participate in PERS. The City’s contribution to PERS for the fiscal year ended June 30, 2009was $26,607,091, and for the year ending June 30, 2010 the City’s contribution is estimated tobe $25,692,261.
The City also maintains the Berkeley Police Supplemental Retirement Plan (“BPSRP”),a single-employer defined benefit income plan, for its police retirees and surviving spouses.During Fiscal Year 2008-09, the City contributed $822,000 to BPSRP. The City’s contributionto BPSRP for fiscal year ending June 30, 2010 is estimated to be $1,268,081.
In addition, the City maintains the Safety Member Pension Fund ("SMPF"), a definedbenefit plan for fire and police officers who retired prior to March 1973. In March 1973, allactive fire and police officers were transferred from SMPF to PERS. The City pays the benefitsto SMPF members on a pay-as-you-go basis, primarily through a Funding Agreement,purchased by the Berkeley Civic Improvement Corporation on behalf of the City in 1989. For theFiscal Year ended June 30, 2009, the City’s annual required contribution was $1,736,185, ofwhich $745,376 was paid through the Funding Agreement and $990,809 was paid from theCity’s general fund. The City’s contribution to SMPF for fiscal year ending June 30, 2010 isestimated to be $951,940.
For a more detailed discussion of the City’s retirement plans, see Appendix B, NoteIV(d).
Post-Employment Health Benefits
The City offers certain post-employment health benefits to retirees. The City hasadopted Government Accounting Standards Board Statement 45 which requires governmentalagencies to change their accounting for Other Post-Employment Benefits (“OPEB”) from pay-as-you-go to an accrual basis. See Appendix B, Note IV(e) for information about the City’sOPEB liabilities.
Defined Contribution Plans
The City offers certain supplemental retirement and income plans to retirees. SeeAppendix B, Note IV(f) for information about the City’s defined contribution plans.
Labor Relations
As of April 1, 2010, the City employed approximately 1,600 full-time employees. Thereare six employee associations as shown below. In addition, the City employs approximately 40management employees who are not represented by a union or other collective bargainingagent. The City has not experienced any work stoppages or strikes by its employees.

A-17
CITY OF BERKELEYLabor Relations
Labor Organization EmployeesContract Expiration
Date
Berkeley Fire Fighters Association/I.A.F.F. Local1227
118 June 26, 2010
Berkeley Police Association 176 June 30, 2011I. B. E. W. Local 1245 16 June 23, 2012Service Employees International Local 1021Maintenance and Clerical Chapters
490 June 28, 2012
Service Employees International Local 1021Community Services and Part-Time RecreationLeaders Association Chapters
620 June 28, 2012
Public Employees Local 1 156 June 23, 2012
Source: City of Berkeley
Risk Management
The City is exposed to various risks of loss related to torts; theft of, damage to, orrestriction of assets; errors or omissions; injuries to employees; or acts of God.
The City is self-insured for liability claims below $350,000. The City is also a member ofthe Bay Cities Joint Powers Insurance Authority (“BCJPIA”). The BCJPIA consists of 19municipal or public agency members, all located within the metropolitan San Francisco BayArea. The BCJPIA provides general liability, auto liability, and errors and omissions coveragebetween $350,000 and $1,000,000. The California Affiliated Risk Management Authority(“CARMA”) provides additional coverage to the BCJPIA and its member entities for claims inexcess of $1,000,000, up to $29,000,000.
The City is self-insured for workers’ compensation. Payments are made to the Workers’Compensation Self-Insurance Internal Service Fund by transfers from the City’s general fundand other funds of the City on a pay-as-you-go basis. As part of its Risk ManagementProgram, the City has excess coverage insurance for Workers' Compensation claims in excessof $250,000 per occurrence; Medical/Dental claims in excess of $75,000 per participant andPublic Liability claims with a maximum of $10,000,000. The City paid approximately $5.4million, covering all incurred claims, for the Fiscal Year ended June 30, 2009.
The City requires pre-employment physical examinations for all employees as well asannual examination for all uniformed officers. As part of its Medical Care ManagementProgram, copies of all injured employee medical reports are monitored by a third party agent toinsure that injured employees receive proper care.
City Debt Structure
Short-Term Debt. The City has issued Tax and Revenue Anticipation Notes (“TRANs”)in each recent year. The City’s TRANs are a general obligation of the City, payable from theCity’s general fund and any other lawfully available moneys. For Fiscal Year 2009-10, the Cityissued TRANs in the amount of $25,000,000. The TRANs mature on October 28, 2010.

A-18
Outstanding General Fund Obligations. The City currently has outstanding long-termgeneral fund debt and lease obligations described below. The City has never defaulted on thepayment of principal of or interest on any of its indebtedness.
Certificates of Participation. In April 2003, the Berkeley Joint Powers FinancingAuthority (the “Authority”) issued certificates of participation on behalf of the City in theaggregate principal amount of $27,950,000. The City’s underlying rental obligation is a generalobligation payable from any available funds of the City, but is budgeted as an expense in therespective funds of the various City department tenants. The certificates bear interest at ratesbetween 2.50%-5.00% and the final maturity date is February 1, 2033. As of March 31, 2010,the principal balance outstanding was $26,080,000.
On June 2, 2010, the Authority issued certificates of participation on behalf of the City inthe aggregate principal amount of $5,750,000. The City’s underlying rental obligation is ageneral obligation payable from any available funds of the City. The certificates bear interest atrates between 3.00%-5.75% and the final maturity date is August 1, 2040.
Lease Revenue Bonds. In October 1999, the Authority issued lease revenue bonds onbehalf of the City in the aggregate principal amount of $9,125,000. The City’s underlying rentalobligation is a general fund obligation of the City. The bonds bear interest at rates between4.10%-5.70% and the final maturity date is October 1, 2029. As of March 31, 2010, theprincipal balance outstanding was $7,460,000.
Pension Obligation Bonds. In May 1998, the City issued pension obligation refundingbonds in the aggregate principal amount of $12,415,000 to refund the City’s certificates ofparticipation issued in February 1989. The certificates were sold to satisfy a portion of theCity’s obligations under an ordinance adopted to provide payments to the Safety MembersPension Fund. The bonds bear interest at rates between 3.80%-5.25% and the final maturitydate is June 1, 2018. As of March 31, 2010, the principal balance outstanding was $3,265,000.The obligation to repay the bonds is a general fund obligation of the City.
Statement of Direct and Overlapping Debt
The ability of land owners within the City to pay property tax installments as they comedue could be affected by the existence of other taxes and assessments imposed upon the land.
The statement of direct and overlapping debt (the “Debt Report”) set forth below wasprepared by California Municipal Statistics, Inc. as of June 15, 2010. The Debt Report includesonly such information as has been reported to California Municipal Statistics, Inc. by the issuersof the debt described therein and by others. The Debt Report is included for general informationpurposes only. The City takes no responsibility for its completeness or accuracy.

A-19
Direct and Overlapping Bonded Debt(As of June 15, 2010)
2009-10 Assessed Valuation: $12,806,317,100Redevelopment Incremental Valuation: 177,320,992Adjusted Assessed Valuation: $12,628,996,108
DIRECT AND OVERLAPPING TAX AND ASSESSMENT DEBT: % Applicable Debt 4/1/10Bay Area Rapid Transit District 2.892% $ 12,146,400East Bay Municipal Utility District, Special District No. 1 21.009 5,726,003Peralta Community College District 22.771 101,477,823Berkeley Unified School District 99.997 213,752,809City of Berkeley 100. 68,700,000City of Berkeley Community Facilities District No. 1 100. 6,990,000East Bay Regional Park District 4.407 8,671,874City of Berkeley Thousand Oaks Heights AFUU Assessment District 100. 1,370,000
TOTAL DIRECT AND OVERLAPPING TAX AND ASSESSMENT DEBT $418,834,909
DIRECT AND OVERLAPPING GENERAL FUND DEBT:Alameda County and Coliseum Obligations 7.404% $ 31,023,204Alameda County Pension Obligations 7.404 13,207,760Alameda-Contra Costa Transit District Certificates of Participation 8.980 3,622,083Peralta Community College District Pension Obligations 22.771 35,379,095City of Berkeley Lease Revenue Bonds and Certificates of Participation 100. 39,290,000(1)City of Berkeley Pension Obligations 100. 2,755,000
TOTAL DIRECT AND OVERLAPPING GENERAL FUND DEBT $125,277,142
COMBINED TOTAL DEBT $544,112,051(2)
Ratios to 2009-10 Assessed Valuation:Direct Debt ($68,700,000) ................................................................. 0.54%
Total Direct and Overlapping Tax and Assessment Debt ...................... 3.27%
Ratios to Adjusted Assessed Valuation:Combined Total Direct Debt ($110,745,000) ................................... 0.88%Combined Total Debt ........................................................................... 4.31%
(1) Excludes Notes to be sold.(2) Excludes tax and revenue anticipation notes, enterprise revenue, mortgage revenue and tax allocationbonds and non-bonded capital lease obligations.
STATE SCHOOL BUILDING AID REPAYABLE AS OF 6/30/10: $0
Source: California Municipal Statistics, Inc.

A-20
Employment
The unemployment rate in the Oakland-Fremont-Hayward MD was 11.9 percent inMarch 2010, up from a revised 11.6 percent in February 2010, and above the year-agoestimate of 9.8 percent. This compares with an unadjusted unemployment rate of 13.0 percentfor California and 10.2 percent for the nation during the same period. The unemployment ratewas 11.9 percent in Alameda County, and 12.0 percent in Contra Costa County. The tablebelow shows the civilian labor force and industry employment for Alameda County.
ALAMEDA COUNTYCivilian Labor Force, Employment and Unemployment; Employment by Industry
(Annual Averages)
2005 2006 2007 2008 2009
Civilian Labor Force(1)
735,700 738,500 749,700 760,900 762,600
Employment 697,900 705,800 717,600 714,100 681,300
Unemployment 37,800 32,700 35,100 46,800 81,300
Unemployment Rate 5.1% 4.4% 4.7% 6.2% 10.7%
Wage and Salary Employment:(2)
Agriculture 700 800 800 700 N/A
Manufacturing 75,800 75,600 73,700 72,500 N/A
Wholesale Trade 39,700 39,700 39,600 39,300 N/A
Retail Trade 68,100 69,300 68,900 66,800 N/A
Transportation, Warehousing, Utilities 26,700 26,600 28,500 27,700 N/A
Information 17,200 16,700 16,000 15,900 N/A
Finance and Insurance 24,400 24,700 23,000 20,500 N/A
Real Estate and Rental and Leasing 11,100 10,900 10,200 9,900 N/A
Professional and Business Services 103,900 104,400 108,600 112,000 N/A
Educational and Health Services 77,700 79,100 79,500 82,000 N/A
Leisure and Hospitality 51,500 53,200 54,800 56,200 N/A
Other Services 23,300 23,800 23,600 22,200 N/A
Federal Government 11,400 10,800 10,600 10,500 N/A
State Government 45,300 44,900 43,500 38,300 N/A
Local Government 73,000 77,400 77,600 76,200 N/A
Total, All Industries(3)
693,400 702,400 702,800 690,900 N/A
(1) Labor force data is by place of residence; includes self-employed individuals, unpaid family workers,household domestic workers, and workers on strike.
(2) Industry employment is by place of work; excludes self-employed individuals, unpaid family workers,household domestic workers, and workers on strike.
(3) Totals may not add due to rounding.Source: State of California Employment Development Department.

A-21
The following tables show the major employers in the City and the County.
CITY OF BERKELEYMajor Employers
2009
EmployerNumber ofEmployees
% of TotalEmployment
University of California Berkeley 14,444 19.01Lawrence Berkeley NationalLaboratory 3,735 4.91Alta Bates Medical Center 3,100 4.08City of Berkeley 1,658 2.18Bayer Corporation 1,500 1.97Berkeley Unified School District 1,200 1.58Kaiser Permanente Medical Group 700 0.92Pacific Steel Casting Company 600 0.79Andronico’s Market 325 0.43Berkeley City College 300 0.39
Source: City of Berkeley, Comprehensive Annual Financial Report for the Fiscal YearEnded June 30, 2009.

A-22
COUNTY OF ALAMEDAMajor Employers (Listed alphabetically)
2010
Employer Name Location IndustryAlameda County Law Enforcement Oakland SheriffAlameda County Sheriff Dept Pleasanton SheriffAlameda County Sheriff's Ofc Oakland SheriffAlta Bates Medical Ctr Inc Berkeley HospitalsBayer Corp Berkeley Drug Millers (Mfrs)Berkeley Coin & Stamp Berkeley Coin Dealers Supplies & EtcChildren's Hospital & Research Oakland HospitalsClorox Co Pleasanton Specialty Clng Plshng/Sanitation (Mfrs)Clorox Co Oakland Specialty Clng Plshng/Sanitation (Mfrs)Cooper Vision Inc Pleasanton Contact Lenses-ManufacturersEast Bay Water Oakland Transit LinesEMC Corp Pleasanton Computer Storage Devices (Mfrs)Fairmont Hospital San Leandro HospitalsKaiser Permanente Hospital Hayward HospitalsKaiser Permanente Medical Ctr Oakland HospitalsLawrence Berkeley National Lab Berkeley Physicians & SurgeonsLawrence Livermore Natl Lab Livermore Laboratories-TestingNew United Motor Mfg Inc Fremont Automobile & Truck Brokers (Whls)Oracle Pleasanton Computer Software-ManufacturersResidential & Student Svc Prog Berkeley Giftwares-ManufacturersTransportation Dept-California Oakland State Government-Transportation ProgramsUC Berkeley Extension Berkeley Schools-Universities & Colleges AcademicUniversity of CA-Berkeley Berkeley Schools-Universities & Colleges AcademicWaste Management Inc Oakland County Government-Environmental ProgramsWestern Digital Corp Fremont Computer Storage Devices (Mfrs)
Source: State of California Employment Development Department, extracted from The America's Labor Market Information System(ALMIS) Employer Database, 2010 2nd Edition.
Effective Buying Income
“Effective Buying Income” is defined as personal income less personal tax and nontaxpayments, a number often referred to as “disposable” or “after-tax” income. Personal income isthe aggregate of wages and salaries, other labor-related income (such as employercontributions to private pension funds), proprietor’s income, rental income (which includesimputed rental income of owner-occupants of non-farm dwellings), dividends paid bycorporations, interest income from all sources, and transfer payments (such as pensions andwelfare assistance). Deducted from this total are personal taxes (federal, state and local),nontax payments (fines, fees, penalties, etc.) and personal contributions to social insurance.According to U.S. government definitions, the resultant figure is commonly known as“disposable personal income.”

A-23
The following table summarizes the total effective buying income for the City ofBerkeley, the County of Alameda, the State and the United States for the period 2004 through2008. Data for 2009 is not yet available.
CITY OF BERKELEY AND COUNTY OF ALAMEDAEffective Buying Income
As of January 1, 2004 through 2008
Year Area
Total EffectiveBuying Income(000’s Omitted)
Median HouseholdEffective Buying
Income
2004 Berkeley $ 2,777,715 $42,432Alameda County 34,827,010 51,415California 705,108,410 43,915United States 5,692,909,567 39,324
2005 Berkeley $ 2,750,045 $42,829Alameda County 34,772,822 52,295California 720,798,106 44,681United States 5,894,663,364 40,529
2006 Berkeley $ 2,825,268 $43,457Alameda County 35,772,898 53,171California 764,120,963 46,275United States 6,107,092,244 41,255
2007 Berkeley $ 2,965,218 $44,217Alameda County 37,572,278 54,688California 814,894,438 48,203United States 6,300,794,040 41,792
2008 Berkeley $ 3,033,685 $45,264Alameda County 38,889,500 55,987California 832,531,445 48,952United States 6,443,994,426 42,303
Source: Sales & Marketing Management Survey of Buying Power for 2004;Claritas Demographics for 2005 and thereafter.
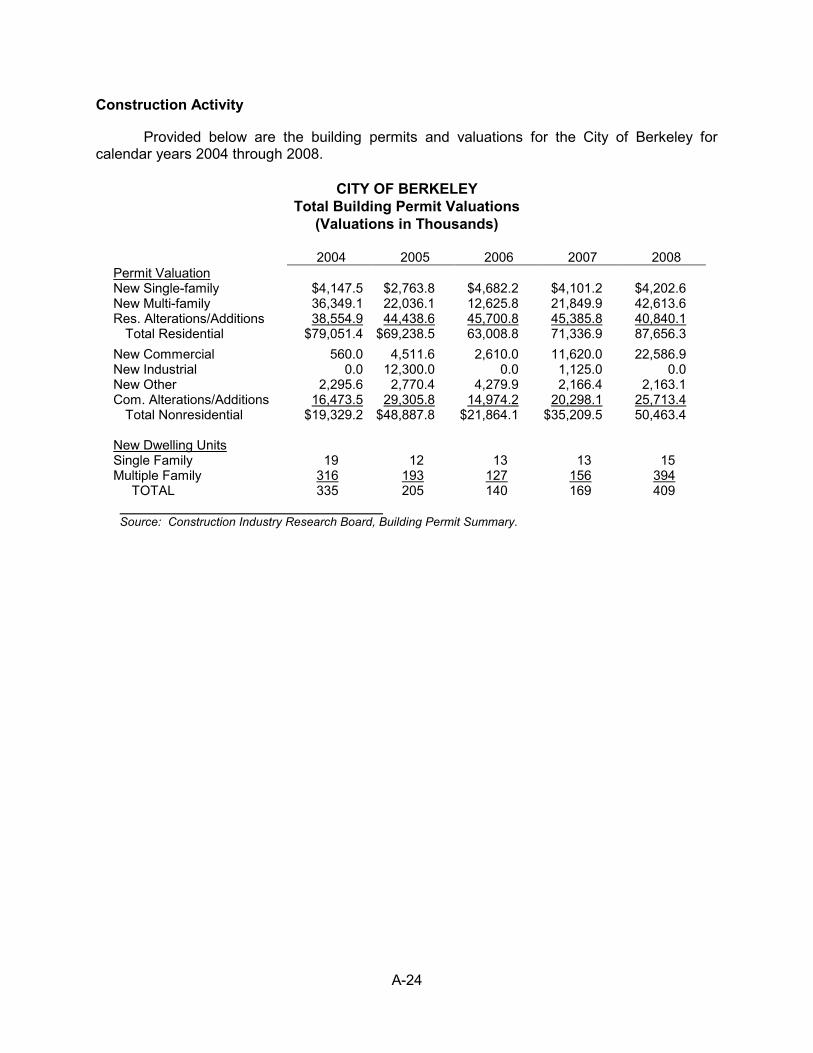
A-24
Construction Activity
Provided below are the building permits and valuations for the City of Berkeley forcalendar years 2004 through 2008.
CITY OF BERKELEYTotal Building Permit Valuations
(Valuations in Thousands)
2004 2005 2006 2007 2008Permit ValuationNew Single-family $4,147.5 $2,763.8 $4,682.2 $4,101.2 $4,202.6New Multi-family 36,349.1 22,036.1 12,625.8 21,849.9 42,613.6Res. Alterations/Additions 38,554.9 44,438.6 45,700.8 45,385.8 40,840.1
Total Residential $79,051.4 $69,238.5 63,008.8 71,336.9 87,656.3
New Commercial 560.0 4,511.6 2,610.0 11,620.0 22,586.9New Industrial 0.0 12,300.0 0.0 1,125.0 0.0New Other 2,295.6 2,770.4 4,279.9 2,166.4 2,163.1Com. Alterations/Additions 16,473.5 29,305.8 14,974.2 20,298.1 25,713.4
Total Nonresidential $19,329.2 $48,887.8 $21,864.1 $35,209.5 50,463.4
New Dwelling UnitsSingle Family 19 12 13 13 15Multiple Family 316 193 127 156 394
TOTAL 335 205 140 169 409
Source: Construction Industry Research Board, Building Permit Summary.

B-1
APPENDIX B
THE CITY’S COMPREHENSIVE ANNUAL FINANCIAL REPORTFOR YEAR ENDED JUNE 30, 2009

(THIS PAGE INTENTIONALLY LEFT BLANK)

CITY OF BERKELEY CALIFORNIA
Comprehensive Annual Financial Report
For the fiscal year ended June 30, 2009
Prepared by Finance Department Robert Hicks Director of Finance

lNTRODlJCTORY SECTION Letter ofTransmltt<ll GFOA Ct:>:rtifk-ate of Achievement Gov~:rnmcnt Stru~turc
List of Elected and Appointed Ofilcials Organi?.ational Chart
HNANCIAL SECTION Independent Auditor's Rcptlt1
CITY OF HERKELEY Comprehensive Annual I1inancial Report For tho Fisclll Ycur Ended June 30, 2009
TABLE OF CONTENTS
Managemcnt1S Discussion and Analysis (Required Supplementary lnform~tlon- Unaudited)
Ba:;i~C Finan~ial Statements Uovcmmcnl-widc Financial Statements:
Statement of Net Asset::; Stat~ment of Activities
Fund financial Statements Governmental funds:
Balance Shuct Reconciliation of the Govemmental Funds Balance Sheet
to the GovernmcnHvide Statement of Net Assct3- Govcrnmcntiil Activilh.:~ StJtemcnt of Revenues, Expenditures, and Change.,.;; in Fund Balances Reconciliation of the Statement of Rcv(.;nucs, Expenditures, and Changes in
Fund Bal;tm:cs of Governmental founds to the Statement of Activities~ Govcrnmt:ntat Activities
Propril:t;~ry Funds: Statement or Net A:-;scl:s Statement of Revenues, Expenses and Ch;.mges In Fund Net Assets Statement of Cash Flow:.;
Fh.Judar)' Fund::;: Statement of Fiduciary Net Assets Statement of Changes in Fiduciary Net Assets
Notes to the Financial Statements
Required Supplementary Information (other thfln MD&!\): Schedule of Revenues, Expenditures and Changes in Fund Balances~ General Fund~ Budgetary Dasis Schedule of Revenues, Expenditure:> and Changes in Fund llalances ~Other Major Special Revenue Funds- Bullgc;tary Basis
Schedul~ of Funding Progrc~::; M CAI.PRRS, Safety Members Pension Fund (SMPF), Police Retirement Income Bcnctlt Plun, and OPEB Plans Note to Required Supplementary Informaiton
Other Supplementary Information: Combining and Individual Fund Statements and Schedules:
Schedule of Revenue;.;, ~xpcnditures. and Changes in Fund Balanc\"!'S ~ Budget and Actual- Major Capital Project fund· Budgetary Basis
Non~major Ciov(,.~rnrm:nta! Funds: c~)mbining Balan,;c Sheet Combining Statement of Revenues. Exptmditun:~ !1-nd Clnmgcs in Fund Balance!\
1-18 19 20 21 22
23-24
25-41
43
44 45
46-47
48 49-50
51
52 53
54-55
56 57
58· t 17
119 120
121-124
I 25-126 127
129
130
J:ll-138 139· I 45

CITY OF BERKELEY Compr~:hensiv~ Annual Financial Report !'or the Fi,col Yc.rl•:ndcd June 30. 2009
TABLE OF CONTENTS
Schedule of Rcv~;nuc!'i, Expenditures, and Changes in Fund Bulanc().s ~ Budget and Actual ~ Budgetal)' Basis
lntr::rnal Service Funds: Combining ShtlcrncrH of Net Assets~ Tntemal Service Funds Combining Statcm~nt of Revenues. P.xpenses and Changes in Fund Net Assets~ lntemal Service Funds u Budg(,)"\ary Hasis
Combining Statem~nt of Cash Flows- Internal Servict: Funds
Fiduciary Fund:<: Combining Statement of Fiduciary Net Assets Pensions and
Other Employee Denetit Trust Funds Combining Stoitcrncnt of Fiduciary Net Assets· Agency Funds Combining Stat1;:ment ofCh<.mgcs in Fiduciary Net Assets~ Pension and
Other Employee Benefit Trust Funds Statement of Changes in /\s::;cls and Liabilitit:~fl ~ Agency Funds
STATISTICAL SECTION lnd~.:x to Statistical Sec!ion Financial Trends:
Net Assets by Component Cho.mgt:s in Net Ass~ts Fund Balance, Govc:mrnental Funds Changes in fund Baluncc:s, Govcmmenta! Fund::;
Revenu~ Capacity: Assess Value and E!-itimalcd Actual Values ofTax:Jb!e Properly Direct and Overlapping Propet1y Tax Rates Principle Property Ta" Payers Property Tax levies and Collections
Debt Capacity: Ratios of Ontstanuing Debt by Type Ratios of General Bonded Debt Outstanding Direct and Overlapping Governmental Ac:Hvities Debt Legal Debt Margin lnforrnaticm f'lcdged Revenue Coverage
Demographic and Economic Information: Demographic and Economic Statistics Principal Employers Fuii-Timc~Equivalcnt City (Jovernmi!nt Employees by Function/Program
Operating Information: Op~rating Indicators Cupital Asset Statistics by Functiun/Program
146-166
167
16& 169·170
171
172
173 174
175
176 177~179
180 181-182
183 184 185 186
IH7 188 189 190 191
192 193 194
195-197 198

MEMORANDUM
DATE:
TO:
FROM:
RE:
September 28, 2009
Honorable Mayor and Members of the City Council, City Manager, and Citi;r.cns of the City of Berkeley
Robert Hicks, Director of Finance
Presentation of tbe Comprehensive Annual Financial Report
Attached is the Comprehensive Annual Financial Report (CAFR) of the City of Berkeley for the fiscal year ended June 30, 2009. The CAFR has been prepared by the Finance Department in confonnance with the principles and standards for financial reporting set forth by the Governmental Accounting Standards Board (GASB). Responsibility for the accuracy, comprehensiveness and fairness of the presented data, including all disclosures, rests v.ith the City's management. 1be report has been compiled in a manner designed to fairly set forth the financial position and results of operations of the City as measured by the financial activity of its various funds. All disclosures necessary to enable the reader to grun an understanding of the City's financial affairs have been included.
The City prepared the CAFR in accordance v.ith generally accepted accounting principles, which included using the financial reporting requirements prescribed by GASB Statement No. 34, Basic Financial Statements and Management's Discussion and Analysis for State and Local Governments (GASB 34). "Ibis statement requires that management provide a narrative overview and analysis to introduce the basic financial statements in the form of Management's Discussion and Analysis (MD&A ). Tiris letter of transmittal is designed to complement the MD&A and should be read in conjunction with it. The MD&A can be found immediately following the independent auditor's report.
THE REPORTING ENTITY
This report combines tbe financial statements of the City, the Berkeley Redevelopment Agency (BRA), the Berkeley Housing Authority (BHA), and the Rent Stabilization Board (RSB) in accordance v.ith principles defining the governmental reporting entity adopted by the Governmental Accounting Standards Board (GASB). The Rent Stabilization Board is a discretely presented component unit because the citizens elect its nine member Board of Commissioners. Tbc Berkeley Housing Authority is a discretely presented component unit because HUD required the City to appoint an independent board responsible for oversight of BHA, and the City provides significant financial support to BHA. 'lbc financial openttions of the BRA, though legally separate from the City, are closely related to the City. In fact, in separate sessions, the City Council members serve as the governing board of the BRA. As a result, the

September 28, 2009 Presentation of the Comprehensive Annual Financial Report Page 2
BRA is presented as a blended component unit in the financial statements. The financial activities of the BRA arc included with the capital project and debt service fund types.
PROFILE OF THE CITY
The City of Berkeley is located in Alameda County on the cast side of the San Francisco Bay approximately ten (1 0) miles east of San Francisco. 1be City encompasses a total area of approximately 19 square miles and has an estimated population of 107,000, giving it the highest population density of any city in the East Bay. The City is defined to a large degree, both culturally and economically, by the presence of the University of California campus located on the eastern side of the City.
The City of Berkeley is among the oldest cities in California. It was founded in 1864, incorporated as a town in 1878, and incorporated as a city in 1909, The original City Charter was adopted in 1895. At the geographic midpoint of the Greater Bay Area, Berkeley is 20 minutes from San Francisco and close to population centers in Contra Costa County and the Silicon Valley. The City is governed by a City Council composed of members elected from eight districts to serve tour-year terms, and a Mayor who serves as the president of the City Council, elected citywide to a four-year term. The City's FY 2009 adopted budget included $320,953,621 of expenditures and reserves, of which $145,851 ,244 was allocated to the General rund of the City and $175,102,377 to all other funds. The City employs approximately 1,500 career full-time equivalent employees.
The City provides a full range of services exceeding that of most similarly sized cities in California: services include public safety (police and fire); sanitation and sewer; housing; leisure (parks, recreation and marina); health and human services including City funded health clinics; animal control; public improvements; planning and zoning; general and administrative services; and library services. In addition, the City's reporting entity includes the financial activities of the Redevelopment Agency, the Housing Authority and the Rent Stabilization Hoard.
ECONOMIC CONDITION AND OUTLOOK
As of June 30, 2009, the financial position of the City's General Fund decreased from that of June 30, 2008. The fund balance decreased $3,311,218 ($2,826,426 from operations and $484,792 from a prior period adjustment), as total assets decreased by $4,232,457, and total liabilities decreased by $921,239. 111is change in the General Fund's financial position is primarily the result of the following:
• Revenues in FY 2009 totaled $142,296,411 and expenditures totaled $131,885,171, with excess revenues totaling $1 0,411,240;
• Operating transfers out in FY 2009 totaled $16,590,858, which exceeded operating transfers in of $3,351,209, for net transfers out of $13,239,649;
• Sale of fixed assets of $1,983; and • Prior period adjustments totaling $484,792.
A $1, n I ,443 decrease in property-related revenues was offset by a $1 ,854,544 increase in economically-sensitive income. However, the total for economically-sensitive income included a $3.9 million incre<tse in the market value of City investments, as an increase in investment income. Excluding that amount, economically-sensitive income declined by over $2 million. The
2

September 28, 2009 Presentation of the Comprehensive Annual Financial Report Page 3
drop in property-related tax revenues resulted primarily from a $3,999,303 decline in Property Transfer Tax revenues.
'fa hit I
; PR0PE'R1~v:RELATEiJ~-yAXEs(;~;;rn:;d-;~;~~;r;~·i~T;;;~trng);~-~~~·~~~~-·~ i ··· ri~;~;ipti~~ · ····""""~,AA~ .. :--··w2o09 .. ". rF¥2008-r-:~iri;: .. , .. H •
Real property • $ 36;635}> I I $ 34,7 I 7,352 · ·· i $ 1 ,91S,6o9 ··· · fs%·- · Personal property 2,468,138 2,114,996 353,142 16.7%
Suppkmental 1,109,577 1,907,33I (797,754) (41.8)% ~
Property transfer 7,881,209 I 11,880,512 I (3,999,303) (33.7)% ·~ Redemptions 1,706,890 963,027 743,863 77.2% I
Total . , . , __ ... ,$,~~~.~7::~.~-::2:~~~.-~:~~-~-~:~~.:~~-·~·-(3.5)~J I<1blli..f
··E~ONO~I~~-~~~:~!·~~~I!~~!~~~~B~~.!iE~~~~~~=~'if= I Description ... . F!' 2009 . . FY 2~08 ... :..... .... .... Dif!c~~llc~---- ___ I Sales tax $ 13,907,220 . $ 15,171,335 ($ 1,264,115) · (8.3)% ·······! Business license tax 13,388,429 13,562,868 (I 74,439) ( 1.3)% . -!_'
Transient occupancy 3,671,362 3,588,753 82,609 2.3% 1 ~ I
58.0% ... ! 4.9% ·· ··1 ,,
Investment income 8,745,699 ""''" ' """
• $39,712,710
5,535,210 " 13,210,489
Total $ 37,858,166 '" """''""""'""'""' .. ,.
$ 1,854,544 . ·, ,,, ,., .• , ., '" ,.,. '•'• ,, ' ,, ''"•' 4>" ~,.,_,,-,, fl'"'fV"~">""""''"""""'"'"'"""'"'"""''""'"""'~'-'"W""""'',""~!MI. ..... '-"~"'"'~~-IIl·,oJolt:'-t•»f'>\'tm;& ,,.-,~.-.... fl'>oiMlN.oll<lt'~,tK..''""''O""•"""~~)if.;-\.~-ru.J
0' lndNfks apprf.J.~;mf(Jtely $3 9 million in Ol?e-timi: increase in the market vahu,· vf invrmmellls held by 1h11 General FUnd, m· a result of 1.1
.1'!./hstwtfit.li Jedinl1 If/ r'nterest 1'1.1/e.)' a/lrU the c,-ry /)tiYChased the inve:mm.mfs GAS/;J S/i:Jt?lnl,!nl Number 31 requires thai investmenh held af yearend b!J' mt.ltAftd-1,;-m,lrkd, and th~t m~·rer,.lS~ or dt:(.'taa.~e m rhe market value ojtfw it~wtsrment.t he added to or ~·ubtractedfram imerest income.
Despite the decrease in the financial position of the City's General Fund in FY 2009, the City of Berkeley continued to be linancially strong and to benefit from participation in the Bay Area's diverse and stable economy. During FY 2009, the City's bond rating from Standard and Poors, one of the national rating agencies, was raised from AA to Akl·; the rating from Moody's remained the same at Aa3.
The City is home to the main campus of the University of Cali1{1rnia. With over 35,000 students and approximately 14,400 employees, the University provides a high degree of economic stability for the City and has spurred growth in the high technology and biotechnology sectors. The Lawrence Berkeley Laboratory also has 3,735 employees, and the Alta Bates Medical Center has approximately 3, I 00 employees. Despite the large student population, the City has an average median family income of$93,297.
During the liscal year, the local economy slumped consistent with regional and national trends. Berkeley's current economic base consists of approximately 12,000 licensed businesses operating in the City. These businesses include private manufacturing, technology research, retail and service businesses, along with several state, federal, and non-profit institutions. These businesses provide employment for 53,300 (down from 55,600 in June 2008), according to the

September 28, 2009 Presentation of the Comprehensive Annual Financial Report Page 4
State Economic Development Department. Tb.is economic base generated slightly over $4.34 billion in gross business receipts in the 2008 calendar year, down approximately $500 million or 10.4% from 2007. Also, the City had over $1.42 billion in taxable sales during the fiscal year, compared to $1.47 billion in FY 2008. In addition, the City's unemployment rate (as reported by the State of California Employment Development Department) rose from 5.4% in June 2008 to I 0.8% in June 2009, compared to 11.4% for the County, I 1.6% for the state and 9.5% for the U.S.
Assessed valuation on secured property continued to rise in FY 2009, increasing at an average of over 7.4% annually during the last live years from $8.3 billion to $11.9 billion in FY 2009, or a strong $105,316 per capita. The tax base is diverse, with the top ten property taxpayers accounting lor only 5.0% of total assessed valuation. Residential and commercial construction remains strong with the estimated value of permits issued totaling $113,415,612 and $40,785,465, respectively.
The City takes an active role in guiding economic development to serve the business and residential community. The City manages a number of programs intended to assist in local business expansion and retention efforts, provides permit assistance to new businesses, seeks appropriate sites, and works directly with local businesses and merchant organizations to improve the local business climate. Major implementation programs have also been initiated and are funded, in part, by a grant from the Metropolitan Transportation Commission (MTC), including development of financing programs to pay for street and open space improvements, managing parking for greater efficiency, and the construction of new shared parking facilities as new development occurs.
Since 1994, the City Council has resolved to promote envirotunentally sustainable businesses in Berkeley and tormally adopted the Precautionary Principle based on the outcomes of the Kyoto /\ceo rd.
Community Planning-- City Work Plan. One of the major components of the City's efforts to develop an integrated budget process is the establishment of policy priorities by the City CounciL One outcome of this process is an attempt, through the budget, to align City Council and community expectations with resources available to the City to deliver desired results.
The City Council approves a composite of Citywide Critical Initiatives and Special Projects for the upcoming ftscal year and reviews its top priorities. Establishment of clear City Council priorities helps ensure that certain programs and initiatives receive the management and resources needed to deliver timely results. Council c.onfcrs with the City Manager and stall regarding priorities and maintenance of the work plan projects.
Moving Toward an Integrated Budget Process. The City is continually improving its budget process and service delivery to align policy goals, program objectives and resources, and service delivery-- including establishing useful performance goals and integrating them with sustainable pertormancc goals. The two-y~:ar budget allows time to dfectivcly integrate goal-setting and policy-making processes, with the cstablisluncnt of performance targets and the allocation of resources. Short-term program and service objectives can be developed, and resources to meet these objectives can be appropriately allocated through the budget process. To complete the cycle, p~rrormance measures will be used to evaluate if services were effective and policy goals
4

September 28, 2009 Presentation of the Comprehensive Annual Financial Report Page 5
met. This information can feed the subsequent assessment of community conditions and trends for the next budget and performance cycle.
• Developing a Service-Based Outcomes Budget. An effective budget process provides for allocation of limited resources to maximize the benefits of programs and services that improve the quality of life in the community. Traditional city budgets, employed by most municipalities, present funding information across organizational units such as departments and divisions. The focus of this budget is inputs, or dollars and staffing levels provided. Present efforts to supplement this financial information with performance measures often emphasize measur~s of workload, or quantity, instead of quality, or effectiveness. Rarely are performance measures linked to stated policy goals, further limiting useful resource allocation decisions.
Over the next few budget cycles, the City will continue to design a budget process, which focuses on services and includes performance and benchmark information to assist in evaluating program outcomes and how effectively resources arc used. Full implementation and benei1ts of a performance-based budget cannot be achieved without organizational changes in other areas.
ACCOUNTING AND BUDGETARY SYSTEMS
The City's accounting systems arc designed to provide reasonable but not absolute assurance regarding ( 1) the safeguarding of the City's assets against loss from unauthorized usc or disposition: and (2) the reliability of the City's financial records for preparing t1nancial statements and maintaining accountability for assets. The concept of reasonable assurance recognizes that (I) the cost of controls should not exceed the benefits likely to be derived; and (2) the evaluation of costs and bene !its requires estimates and judgments by management. All internal control evaluations occur within this framework. We believe the City's internal accounting controls adequately safeguard assets and provide reasonable assurance of proper recording of financial transactions,
As a recipient of federal and state funds, the City is responsible for ensuring that an adequate internal control structure is in place to ensure compliance with applicable laws and regulations related to these programs. This internal control structure is subject to periodic evaluation by management and the Elected Auditor's Oftice of the City.
The budget process is the vehicle through which the City establishes goals and objectives, and prioritizes the desired programs or services that the City should provide, and which can be financed by the City's projected revenue tor the budget year. It is the vehicle through which policy decisions are made, effected, controlled and monitored, Under the City Charter, the City Manager is responsible for preparing and recommending an operating budget and a capital improvements budget for City Council consideration and adoption.
The City of Berkeley employs a two" year budget process. In year one of the biennial budget cycle, the City Council formally adopts authorized appropriations for the first year of the twoyear budget and approves "planned" appropriations for the second fiscal year, In year two of the budget cycle, the City Council considers revisions and formally adopts authorized appropriations
5

September 28, 2009 Presentation of the Comprehensive Annual Financial Report Page 6
for the second fiscal year, Although the budget cycle covers a two-year period, the City Charter requires that the City Council adopt an annual appropriations ordinance for each budget year.
The City's Capital Budget is considered as part of the City's Five-Year Capital Improvement Plan. Upon adoption each year by Council, the projects included in the annual budget represent legal appropriations. Capital expenditures are not fully "consumed" in the year of expenditure but instead produce long-term, tangible, future benefits.
In addition to this budget planning process, the City maintains budgetary controls. The City's objective in maintaining budgetary control is to ensure compliance with legal provisions embodied in the annual appropriated budget approved by the City Council. The City Manager is authorized to transfer budgeted amounts within funds as deemed necessary in order to meet the City's needs. However, revisions that alter the total budget or move amounts from one fund to another must be approved by the City Council. Activities of the General Fund, Special Revenue Funds, Debt Service Funds, Capital Project Funds, and Proprietary Funds are included in the annual appropriated budget.
The City maintains an encumbrance accounting system as one technique of accomplishing budgetary control. Purchase orders, contracts, and other commitments for the expenditure of money arc secured in order to reserve that portion of the applicable appropriation. Encumbrances outstanding at year-end arc reported as reservations of fund balance. Unencumbered amounts lapse at year-end and may be appropriated as part of the following year's budget.
CASH MANAGEMENT
The City invests its temporarily idle cash in investments legally permissible by the State of Calili.lmia and in accordance with its own investment policy. Those authorized investments arc detailed in Note I El of the Notes to the Financial Statements.
The City's investment policy seeks the preservation of capital, liquidity, and yield, in that order of priority. Maturities are selected to anticipate cash needs, thereby avoiding the need t\.lr forced liquidations. Within the constraints of safety and liquidity, the highest yields are sought. In addition, the City's investment policy is designed to reflect and support the City's policy position on important social and environmental issues. Cash is invested on a pooled basis and the related income allocated to funds on the basis of cash provided for investment.
For internal control purposes, the City has adopted the practice of having all purchased securities wire-transferred in book entry fom1 over the Federal Reserve Board's wire system to its safekeeping bank before funds are wire-transferred in payment of the investments (delivery versus payment method).
RISK MANAGEMENT
The City is exposed to various risks of loss related to tmts; theft of, damage to, or restriction of assets; errors or omissions; injuries to employees; or unforeseen events referred to as "acts of God." As part of its risk management program, the City is 100% permissibly selt~insurcd for workers' compensation. The City has excess coverage for public liability claims between $350,000 and $1 million through Bay Cities Joint Powers Insurance Authority (llCJPIA). The
6

September 28, 2009 Presentation of the Comprehensive Annual Financial Report Page 7
California Affiliated Risk Management Authority (CARMA) provides additional coverage to BCJPIA and its member entities for claims in excess of $1 million to $29 million. The program is accounted for in the Public Liability Internal Service Fund through transfers from the General fund. Disbursements from the fund are restricted to the payment of liability claims, personnel and other investigation costs.
The City is self-insured fi.1r workers' compensation. Payments are made to the Workers' Compensation Self-Insurance Internal Service Fund by transfers from the City's General Fund and other funds. The City works with a Bickmore Risk Services actuary to determine funding rates for five workers' compensation classification categories, including a percentage to account for future liability, and then assesses the applicable funding rate for the City's applicable positions through payroll. This ensures that positions with the highest exposure to loss pay the correct portion of the overall expense and that the expense is spread proportionally to the correct funding sources. l'unds are available to pay claims and administrative costs of the program. At June 30, 2009, the date of the most recent actuarial study, the net present value of the City's unfunded workers' compensation liability was $21,194,000. The City paid approximately $5.1 million to cover all incurred claims for the !I seal year ended June 30, 2009.
The City has procured property and boiler and machinery insurance coverage through the Public Entity Property Insurance Program (PEPIP) through Bay Cities Joint Powers Insurance Authority. Coveragt:' consists of $1 billion per occurrence with sublimits of coverage for various perils and occurrences. The total insured value for all BCJPIA member entities as of June 26, 2008 was $1,185,430,811. On January II, 1994, the City and the Redevelopment Agency entered into a Joint Exercise of Powers Agreement to fom1 the Authority. The Authority has the power to enter into contracts, incur debts and to issue bonds on behalf of the City for a number of purposes.
SI'ENIHNG LIMITATION
Article XlllB of the California Constitution, also known as the GANN spending limit, restricts the amount of "proceeds of taxes" California governments may spend. As of June 30, 2009, the City was $23.6 million or \4.2% under the total Article XIIIB (Gann) spending limitation.
FIDUCIARY OPERATIONS
Safety Members Pension Fund. "Inc City administers a defined benefit retirement plan called Safety Members Pension Fund (SMPF). The plan is a single-employer defined benefit pension plan for fire and police officers who retired before March 1973. In March 1973, all active fire and police officers were transferred from SMPF to the California Public Employees Retirement System (CaiPERS). At June 30, 2009, the date of the most recent actuarial valuation, there were 31 retired members and surviving spouses, an actuarial accrued liability of $7,611,896, and plan assets of $3,042,688. This compares with 34 retired members and surviving spouses, an actuarial accrued liability of $8,153,217, and plan assets of $3,496,723 as of July 1, 2007.
The City pre-funds a Fire Employees Retiree health plan and a Miscellaneous Employee Retiree health plan. (See Note IV (D) to the financial statement for disclosures related to the implementation of OASB 45). In addition, the City provides a pre,funded Retiree Income Benefit plan for Police retirees. This plan provides defined income benefits for Police employees
7

September 28, 2009 Presentation of the Comprehensive Annual Financial Report Page 8
who retired from the City on or after July I, 1989, who were also vested in a CaiPERS pension, who had ten years of service with the Berkeley Police Department and retire from the City on or after age 50. Benetits commence five years after retirement. (See Note IV (D) 2 to the financial statement for additional disclosures).
~~NTERPRISE OPERATIONS
The City's enterprise operations comprise eight (8) separate and distinct activities: Off-Street Parking; Parking Meters; Marina Operations and Maintenance; Sanitary Sewer; Refuse Collection and Disposal; Clean Storm Water; Permit Service Center; and Building Purchase and Management. The Clean Storm Water Fund continues to receive a subsidy from the General Fund.
MAJOR IMPACTS AND INITIATIVES
1. CUSTOMER SERVICE- 311 CALL CENTER
Implementation of phase 1 and 2 of a citywide customer service improvement initiative continued in FY 2009. ln order to improve the service employees provide to the community, the City has established a centralized Customer Service Center (called the 311 Customer Service Call Center) designed to provide first-call resolution for 80% of all routine requests for service and information. Instead of having to figure out which of the City's 390 published telephone numbers to call, members of the public will be able to simply dial 311 within the City of lkrke1ey. This single access numher is being tested and should be available to the public in October 2009. Using Community Relationship Management software, trained Customer Service Reps answer questions, process business transactions, and track service requests to the appropriate City Department. This helps free up Departmental staff to work on more complicated, non-routine customer service issues. Phase I and Phase 2 arc complete with the Call Center taking calls for Finance Customer Service, Refuse Collection, City Center, the Corporation Yard customer service phone line as well as administrative main line phone numbers for the Human Resources and Finance departments. The City Manager's Customer Service Division is working vo/ith other City Departments to identify the next phases of integration. The 311 Customer Service Call Center increased the number of call representatives at the call center from 7 to 9 in 2009. Once fully implemented it is anticipated that a total of 13 staff members will respond to all City calls and transactions. The 311 Call Center is also working with the Information Technology Department to connect the CRM to existing City programs and also working to increase On-Line Services for the public via the web and on the phone via Interactive Voice Response (IRV) programs.
2. MAJOR CAPITAL PRO.JECTS
a. Marina Plan and Waterfront Overview The Parks Recreation & Waterfront Department continut!S to work with the Waterfront Commission to rtofine the Marina Fund financial forecasts, making rt"commcndations to increase fees and reviewing critical Capital Projects. The basis for these recommendations comes from the Marina Plan, which was adopted by Council on July 8, 2003 and continues to guide the division.
8

September 28, 2009 Presentation of the Comprehensive Annual Financial Report Page 9
The Marina Plan identities major capital costs associated with maintaining and enhancing the Berkeley Marina and associated parklands. Sine~ the Marina is funded through an enterprise lund, I 00% of the costs associated with its operation and maintenance arc funded through revenues generated from Marina operations, leases or alternative sources such as grants or loans. Financial fbrecasts indicate that shortfalls will occur and that new revenue sources are needed. Without infrastructure improvements, docks will be removed from service and the Marina basin may eventually fill with sill.
In response to the City's effort to meet the critical need for infrastructure repair, the Department of Boating and Waterways has awarded the City a $9,000,000 loan (initial $7 million loan with an additional $2 million awarded in FY 2005). $7 million of these funds became available in early FY 2004, following the adoption of the necessary Collateral Agreement and arc being used for the design and construction to replace the A·E and H & I docks and related restrooms. A grant trom the Department of Boating and Waterways for $290,000 was awarded in 2002 for the renovation of the restroom located at the Marina Launch Ramp. Other capital improvement projects are also planned and/or in progress for Marina facilities and infrastructure, as outlined in the Marina Plan. All of this information is incorporated into the Marina Plan documents, including the annual loan debt service, which will be approximately $500,000 over the repayment life of the loan.
b. Parks Funding for parks and recreation facilities infrastructure improvements is limited and the City has developed a greater reliance on outside grant funding. The passage of Measure WW, which is an extension of Measure AA provides funding for major capital projects. In 2008, City of Berkeley was allocated $4,876,584 in funding. The department is currently working on the project selection and community process.
c. Camps The Parks, Recreation and Waterfront Department is continuously working with the Department of Forestry on their recommendations to make the crunps compliant. The Department is in the process of completing the Tuolumne Master Plan, which identifies all the necessary capital improvement. All costs for the operation and maintenance as well as the capital improvements comes from the Playground Camp Fund, which is directly funded by camp fees. A recently approved fcc increase by the City Council should help alleviate the fund's projected funding shortfall.
d. Anif11a/ Shelter The City's Animal Services operations are currently housed at 2013 2"d, Street, in a facility that was built in 1940. It is in poor condition, seismically unsafe, suboptimal for the maintaining of healthy animals, and is not conducive for promoting animal adoptions or attracting members of the public to visit. In 2002 Measure I was passed and authori~cd a General Obligation Bond for $7.2 million for land acquisition and constmction of a new municipal animal shelter. The City Council appointed a subcommittee composed of members of the City Council and the Citizens' Humane Commission to explore possible locations for a new animal shelter. Recently, widespread agreement was reached among all stakeholders that the location at I Bolivar Drive is an ideal location for a new animal shelter facility. It is adjacent to Aquatic Park, affords easy access to areas for exercising and socializing animals and is not in close proximity to any rcside11tial uses. The General Obligation Bonds in the amount of $7.2 million were issued 0n January 9, 2008, and the City has bought the property at I Bolivar Drive to construct a new animal shelter. Construction is expected to be completed by Fall 20 I 0.
9

September 28, 2009 Presentation of the Comprehensive Annual Financial Report Page 10
3. COMMUNITY EMERGENCY PREPARATION
The following overview describes the City's comprehensive efforts to reduce risk, to better prepare for disasters and safety actions taken last year to ensure community safety and preparedness. Other City efforts include staff training, response preparations, exercises, community preparedness initiatives, local and regional coordination and other preventive programs that are underway or are in development.
a. Pre-Disaster Mitigation EffOrts The community has the highest per capita investment in risk reduction in California. Since 1989, Berkeley has invested in community sustainability on many fronts. The City Council established an Office of Emergency Services in July 1989 and convened the commission that later became the Disaster Fire and Safety Commission. This leadership continued and acted to make risk reduction and community sustainability a priority.
Thus far, the City's mitigation efforts include addressing soft-story and masonry earthquake retrofits, pandemic flu response, global warming, disaster preparedness and response, and vegetation management. The City is also working with multiple departments in updating its Mitigation Plan to mitigate potential risks for all hazards in Berkeley. Hazards include earthquakes, wildfire, landslides, floods, hazardous materials accidents, terror attacks and other multi-hazard events.
b. Emplovee Disaster Res(?.onse Training Training for City staff is required to meet the mandates of California Code of Regulations Title 19 Section 2401, 2930 and 2935, and the Homeland Security Presidential Directive 5 that requires workers to use the Standardized Emergency Management System and the National Incident Management System. All local government staff are designated Disaster Service Workers, according to State law. Consequently, it is critical that the City provide adequate training for staff to know their disaster response responsibilities and have learning opportunities to deepen that knowledge. Keeping training and disaster exercises on the organization's larger schedule is a challenge when months of advance planning and practice must be maintained. In FY 2008, the City's training programs included National Incident Management (NIMS), the Response Information Management System (RIMS), and Incident Command System (ICS) 300 and 400 courses.
c. Communiry Disaster Preparedness The City has always been a leader in engaging community and neighborhood groups to be disaster ready. The City offered training classes, made presentations to the public, updated the City's website infonnation, and engaged in other outreach activities to strengthen disaster preparedness for the Berkeley community. The free year-round Community Emergency Response Training (CERT) classes arc offered to anyone living or working in the Berkeley community and cover basic preparedness, disaster mental health, disaster first aid, fire suppression, light search and rescue, shelter operations, and radio communication/incident command system. In 2008, the City of Berkeley established 7 additional disaster caches within the student housing community and work in partMrship with the University of California and student group leadership to train students in disast~r preparedness. In addition, the City provides annual refresher training to the disaster cache groups to maintain their emergency response skills.
Berkeley voters approved Measure GG in November of 2008, providing critical resources to ensure minimum staffing of all sire suppression companies; enhance the city's Emergency
10

September 28, 2009 Presentation of the Comprehensive Annual Financial Report Page II
Operations Center; and to continue to focus on community preparedness, including resources for Community Emergency Response Training (CERT) and community caches.
d. Response The City uses an emergency notification system to keep people informed during disasters. The Berkeley Emergency Notification System (BENS) is a telephone notification system that can contact residents and businesses through an automatic message service center in the event of an emergency. Berkeley's emergency radio station is 1610 AM. Over the years, the City has activated its Emergency Operations Center (EOC) and responded to a number of disasters. The most recent disaster was the Oil Spill in November 2007.
e. Recovery The City's Finance Dcpattmcnt has established procedures and protocols to document expenditures accrued during disaster operations. These procedures were very effective fbr submitting documentation for FEMA approval for all disaster reimbursements.
f Health and Human Service Programs The Public Health Division (I'll) receives CDC and sHttc health dept grants (Total: $268,000 in 08-09) to develop plans for large PH emergencies such as bioterrorism or pandemic influenza, to plan for needs of special needs and vulnerable populations, and coordinate with health care providers, clinics and hospitals on emergency surge capacity. In 08-09 PH has planned and conducted several large exercises: Full Scale Flu Clinic Exercise (Oct 08), Functional Mass Prophylaxis Exercise (PODs) (March 09-funded by Bay Area SUASI and involving 10 Bay Area Counties at the Oakland Coliseum with over 1500 volunteers and DSWs) and several drills and smaller exercises. PH is working with UC Berkeley to develop a mass prophylaxis agreement (MOU) in which the campus would be part of the distribution of SNS supplies (antibiotics) in a biotcrror event. In April-May 09 PH responded to the HI N I (Swine flu) incident and the Pll DOC was fully activated for over 2 weeks. PH staff also teach a Pandemic Flu Preparedness CERT class.
g. Disaster Fire ProJ.ec/ion ln November 2000 election, Berkeley voters approved Measure Q, which provided $8,000,000 in funding for an Above Ground Portable Water System. This system is designed to provide water for firdighting independent of the domestic water system provided by the local water district. The engineering studies of the domestic water system infrastructure determined that after a m(\jor earthquake or in events of high flre llow demands that can occur during wildland/urban fircstorms the system may not be usable or able to support firetighting operations. The City has contracted with Hytrans Systems located in Holland for a pump and hose system that will allow use of salt or fresh water sources like the San Francisco Bay or lakes to provide water for firefighting.
The system includes two 6,000-gpm pumps (HS 900) and six containers each with one mile of 12 inch ultra large diameter hose. The pumps and containers can be moved and deployed by trucks using a lift am1 loading systems. For more information on the system go to the Hytrans website at Hytrans.com. In addition to the mobile water system an 8,000 square foot warehouse for storage of the equipment is in the design phase and property for the warehouse has been secured. The water system and warehouse should both be operational by the end of2009.
h. Other DisasterMiligation E([orts The City's Corporation Yard facility plays a crucial role in the City's overall operations and serves as a center for emergency response and disaster recovery operations. The building is seismically unsafe. In July 2006, the City was awarded a FEMA PreDisaster Grant for $2.8 million to reconstruct the building to be seismically safe. City matching
II

September 28, 2009 Presentation of the Comprehensive Annual Financial Report Page 12
funds of $962,633 is required by FEMA. The project is expected to be completed no later than July 2009.
4. ECONOMIC DEVELOPMENT
Berkeley's economic development strategy seeks to build on existing strengths to accomplish goals that have been identit1ed by the City Council and citizen planning processes:
a. Revitalize Downtown Berkeley and strengthen ii5JO/e in the local and regional enmomy. Despite the nation's recent economic challenges, the Downtown Arts District continues to build on its success in attracting regional nighttime attendance and attracting new quality restaurants .. Housing growth continues in the Downtov,n and several hundred units are currently under construction. Additions to the current inventory include 143 new condo units at the Arpeggio project on Center Street (now under construction) and Resources for Community Development has recently completed I 00 units of affordable housing at the Brower Center on Oxford Street Hudson. McDonald is also constructing 148 units of rental housing on the NW comer of University and Martin Luther King Jr. Way. The City and the University recently completed a Downtown planning process that will allow the University to build 800,000 square feet of new ofticc, research and public service space on the west side of the campus. The City and the University are also continuing to work together to build a new hotel and conference center and relocate the Berkeley Art Museum/Pacific Film Archive to a new facility in the Downtown that will cost in excess of $100 million. The historic Shattuck Hotel is undergoing a complete $20 million renovation of its 200 hotel rooms and was due to open in June, 2009.
b. Strenzthen neighborhood commercial districts such as Solano, H/mwood. Telegraph, Fourth Street, San Pablo. North Shattuck and University Avenue. The City seeks to encourage shopping opportunities clos~: to residential neighborhoods, which reduces the need to drive. Efforts arc underway to support expansion of district-based niche marketing campaigns that recognize local strengths and "district identity". An active "Buy Local Berkeley" campaign works to encourage residents to shop at locally-owned businesses to help retain money and tax revenues in the community. The Buy Local effort aims for over 500 affiliated businesses by the end of 2009. There are currently 2, 700 subscribers to the monthly newsletter of Buy Local Berkeley that adve1tises special events and promotions. The City facilitates four business improvement districts (BIDs) in the Downtown, Telegraph, Elmwood, and North Shattuck commercial districts that generate funds through a self assessment to help promote and maintain their districts.
c. Support creation of good iobs fi1r local residents. While about 40 percent of the jobs in Berkeley are in the public sector (14,400 at UC Berkeley, 3,735 at LBL, 1,500 City of Berkeley, 1,200 Berkeley Unified School District, 300 Berkeley City College), about 32,165 are in the private sector. Large private sector employers include Alta Bates Summit Medical Center (Alta Bates and Herrick campuses) with 3,100, the Bayer Corporation with 1,775, Kaiser Perrnanente with 760 and Pacific Steel Casting with 660. However. more than 85% of Berkeley's 3,700 private employers have fewer than 20 employees. Berkeley's strong sectors include biomedical/ biopharmaceutical, computer systems design services, printing and publishing, environmental consulting services, and arts and entertainment. More than 300 "Green" businesses (i.e., businesses that either help the environment or enterprises that have instituted environmentfriendly practices) have located in Berkeley. The City's Work Source employment program requires certain new and expanding businesses to consider Berkeley residents tlrst in their hiring.
12

September 28, 2009 Presentation of the Comprehensive Annual Financial Report Page 13
d. lnc:rease lechnologv transtiJr fi'om UC Berkeley and Lawrence Berkeley National Labora/01y and encourage slarlups in the Down/own and Wesl Berkeley. In recent years growth in computer science, bioscience and biomedical industries have stimulated local startups and attracted national companies to set up research centers in Berkeley. These companies benefit from the City's entrepreneurial climate and from interaction with UC faculty and graduate students. The City is working with developers to make certain that appropriate workspace will be available for the startups that will result from new research initiatives in growing sectors such as biofuels.
e. (ienerate useful GIS-based economic data rhat will be used to monitor and analyze local business trends. In 2008 Economic Development staff completed a complete GIS ground tloor space inventory in all the City's commercial districts. This effort has proven very valuable as an analytic tool and the results have enabled staff to generate reports that outline and assess sectoral and sub-sectoral trends within specitk commercial neighborhoods. Metrics such as sales per square foot by type of retail use or total space occupied by restaurants give insight into the health of the district or potential marketing opportunities. And over time, staff will be able to produce longitudinal trends analysis that should prove a very valuable marketing and policy tool. Stall has now created reports for every retail district in Berkeley and a number of sub-district nodes. Stall' is now developing a complete GIS.based inventory and contact listing of all small commercial spaces that arc located within 5 blocks of the U.C. Berkeley Campus and that can incubate new companies emerging from the University and Lawrence Berkeley National Lab. Staff is also exploring ways to generate similar data for the West Berkeley industrial area and for upper tloors in structures throughout the City .
.f Market Bcrkelev 's visitor appeal and ourrort Berkeley's Hotel/Motel 1n.d.¥.§1ry. The City provides annual support to the Berkeley Convention and Visitors' Bureau for its comprehensive marketing efforts aimed at promoting local tourism and hospitality services. The Con/Vis Bureau also runs the Berkeley I'ilm Ofllcc that markets the City to the tilm and television industry
g. Build on Berkeley's strength as a regional hub o( arts and culwre. More than 130 arts and cultural organizations comprise an arts community that collectively is among the largest employment sectors in Berkeley. The arts provide some 3,400 jobs, reach an annual audience of 1.7 million people, and have a combined budget of $70 million. Arts, culture, entertainment and restaurants help drive the City's economic engine. In addition, the City promotes the arts and has helped established the Downtown as a regional center for the arts, culture and cntcrtainn1cnt. The Addison Street Arts District is now a major venue for theatr~ performances and includes the 160-seat Aurora Theatre, the original Berkeley Repertory's 400·seat theatre, the Berkeley Repertory's 600·seat Roda Theatre, the Jazz school (a nationally recognized school for jazz performance and study) and the current construction of a new 400 + seat venue for the Freight & SHlvagc. The Berkeley Poetry Walk was installed in the sidewalks on Addison Street, and public art projects continue to appear in the Downtown and adjacent areas of Berkeley.
5. CLIMATE ACTION PLAN
Jn November 2006, 81% of Berkeley voters endorsed Measure G, which sets the goal of reducing the community's greenhouse gas emissions by 80% by 2050. The measure also directs the Mayor to develop a Climate Action Plan to reach that target.
13

September 28, 2009 Presentation of the Comprehensive Annual Financial Report Page 14
A full draft of the Berkeley Climate Action Plan was considered for Council adoption on June 2, 2009, The plan was designed under the premise that local governments and the communities they represent arc uniquely capable of addressing the main sources of the emissions that cause global warming: the energy consumed in buildings and automobiles and the solid waste sent to the landfilL
The purpose of the plan is to guide the development, enhancement, and ultimately the implementation of actions that aggressively cut Berkeley's greenhouse gas emissions. The plan does the following:
• Describes where Berkeley's GHG emissions come from
• Provides an estimate of how those emissions could be expected to grow
• Recommends goals, policies and actions that we as a community can implement to achieve GHG reductions and other community benefits such as inc.reased green job opportunities and improved public health
• Provides a timeline for the plan's implementation, including identifying existing and potential costs and funding sources
• Defines a strategy for turning this plan into action
Once adopted the plan will serve as a dynamic guide lor achieving the Measure G targets.
6. BERKELEY REDEVELOPMENT AGENCY
D Active Projects
The Berkeley Redevelopment Agency adopted a Fivc"Year Implementation Plan on June 28, 2005 authorizing completion of the West Berkeley Rail Stop and Transit Plaza, the refinancing of existing bonds to capture up to $1.5 million toward affordable housing projects, and prioritization of the expenditure of the remaining bond proceeds and net available tax increment funding to complete other capital projects including the Aquatic Park Connection (APC).
In FY 2006, the Project Area Committee re-evaluated capital priorities and commissioned a West Berkeley Circulation Master Plan Rcpmi and Quiet Zone Feasibility Study. To pursue these priorities, as well as consider reuse of the Agency's vacant lot, the Five-Year Implementation Plan was revised on December 5, 2006.
The FY 2005-2009 Implementation Plan proposes how tax increment and the proceeds from the refinanced bonds will be used to meet the Agency's financial obligations. Refinancing of Agency debt triggered new pass through payments of tax increment to other taxing entities just as supplemental Educational Revenue Augmentation Fund (ERAF) payments were sunscttcd. As part of the bond refinancing actions, the Agency Board passed resolutions to extend the ability of the Agency to collect tax increment revenue through December 31, 2015. The FY 2008 mid-year review indicated that the net proceeds available to augment Bond proceeds for support of capital projects, the restructured debt service, the new pass-through payments and 20% set-aside were sufl1cicnt to conclude the priorities of the Five" Year Implementation Plan. The FY 2008 midyear review did not reflect additional ERAF payments required by the state in FY 2009, which an initial court ruled against, but which are currently under appeal.
• Rail Stop and Transit Plaza The purpose of the project was to develop infrastructure improvements for the West Berkeley Amtrak Rail Stop and Transit
14

September 28, 2009 Presentation of the Comprehensive Annual Financial Report Page 15
Plaza, including an ADA compliant and multi-modal transportation stop for the City of Berkeley. Agency support resulted in construction of permanent infrastructure and dramatically improved the existing under-utilized facility to encourage rail, bus, bicycle, and pedestrian use, and to facilitate the growth and success of nearby businesses. Total project costs for the rail stop and transit plaza was approximately $2.5 million with just over $1 million covered by grants to the Agency. Construction on the project was primarily completed in September 2005, with lighted kiosks completed by the spring of 2006. Construction included lighting, seating, paving, curb ramps, trees, landscaping, signage, and platform enhancements. Art commissioned by the Arts Commission with Redevelopment funds were completed during FY 2007. Eight electronic bike lockers were installed and opened in September 2008 with the support of Alameda County Transportation Improvement Authority (ACTIA) Measure B Funding.
• Aquatic Park Connection The Aquatic Park Connection is a set of pedestrian and bike enhancements within the public right of way between the West Berkeley Redevelopment Project Area and the new 1-80 Bicycle and Pedestrian Overpass that joins Aquatic Park to the Marina. Although this proposed project extends outside of the West Berkeley Project Area, the Agency has identified it as a development project that will enhance the overall Redevelopment Area, as well as the immediate Rail Stop and Transit Plaza area. The total estimated project cost is $4 million, with the Agency initially allocating $989,000 for the design and construction of priority elements. With the revised Implementation Plan in FY06, the Agency allocated $1.4M to APC design and construction of priority improvements, adding undergrounding to the preliminary components for FY09 Agency construction. Wayfinding signage included in this project was designed in FY07, manufactured at the end of FY09 and will be installed in the very beginning on FY l 0. Construction drawings are 90% complete, under grounding specifications will be completed in FY09, and construction is expected to be completed in FY!O.
Agency sponsored construction of streetscape improvements and undcrgrounding is targeted to the west end of Addison at Aquatic Park's north entrance and the rail crossing on Addison. Adjacent proposed development is responsible for adjacent streetscape development, compliant with the Master Plan's design. This will significantly reduce the gap in funding for the Agency, leaving pockets of unimproved areas that may be fundable with grant sources. The first compliant project was completed in FY09 including all the APC strcctscape elements and manufacturing of unique design clements such as bike rack/tree guards, scat walls with Ohlonc weaving design clements, and skate stoppers. Two additional blocks will constructed in PYIO with the completion of private development at the comer of Addison and Fourth Streets.
• West Berkeley Circulation Master Plan Report, Quiet Zone and Seed Money In PY08, the Agency contracted with Wilbur Smith and Associates to complete a comprehensive multimodc Circulation Master Plan Report for West Berkeley with City support for geography extending beyond the Project Area. The WBCMP Report's area is bounded by San Pablo Avenue to West Frontage Road and i\lbany and Emeryville borders. The \VHCMP Report included a description
15

September 28, 2009 Presentation of the Comprehensive Annual Financial Report Page 16
of ex1sttng and future conditions, a ranked capital improvements list, Implementation Plan Report, Transportation Demand Management Report, Financing Strategy and Improvement Plan. The City also received a simulation model to be used in analyzing development in the Project Area and in areas proximate to the Project Area. A Feasibility Study for a Quiet Zone (QZ), in which trains do not blow horns at vehicle crossings, was also provided. The WBCMP Report and QZ Study identified prioritized needs for $55M and up to $1 0.5M in their respective reports. Implementation Plan revisions also included $500,000 in funding for the capital needs and revisions to the Report identified by the WBCMP. In FY09, the ranked list of capital priorities of the Wl:lCMP Report and Implementation Plan were reviewed by the Agency.
PAC recommended using a portion of the Seed Money for the transportation analysis of an Environmental Impact Report (EIR) of the West Berkeley Project (a separate land usc project of the City's Planning and Development Department) that requires updating of the land usc assumptions of the WBCMP Report for it to remain a current analytic tool. Further the PAC supported usc of the seed money for a Nexus Study for a West Berkeley Transportation Services Fcc. Finally, the PAC has begun review for FYI 0 recommendations for the remaining Seed Monies and potentially additional bond funds and excess tax increment not expended under the FY 05-09 Implementation Plan. These recommendations and further consideration of other projects will the basis for the West Berkeley FY 10-14 Implementation Plan discussed below.
• 1631 Fifth Street The revised FYOS-09 Implementation Plan identified up to $650,000 for use in the development of the vacant lot at 1631 Fifth Street. In FY09, a development team including Northern California Land Trust (NCL T), Berkeley Architectural Heritage Association and the newly formed friends of Kenney Cottage Gardens was recommended by the PAC to the Agency for sale of the property for $1 contingent on development of a business plan for a historic cottage (Kenney Cottage currently stored on University Avenue) to be moved to the lot and the surrounding gardens. Given that the partners have not yet completed a Business Plan for the building, Agency staff prepared a lease for NCL T's usc of the lot as a Community Garden. In FYI 0 Agency staff expect that the partners will submit a Business Plan for the Kenney Cottage's usc complimentary to the garden lease and the Agency will sell the land for $1 to the partnership to support both gardening and artistic community activities as well as historic preservation.
D Inactive Projects
New Implementation P/anFYIO-FY/4 The Agency had several identified projects in the FY05-09 Implementation Plan that haw been inactive for some time. With revision of the Implementation Plan in FY06, the following Projects were removed from Agency consideration:
• Establish a Residential Parking Permit Program • Determine alternatives to an Assessment District for a parking garage • Install parking meters and gateway signs (partially implemented) • Construct strectscape improvements on Fifth Street between Cedar and Hearst
Streets 16
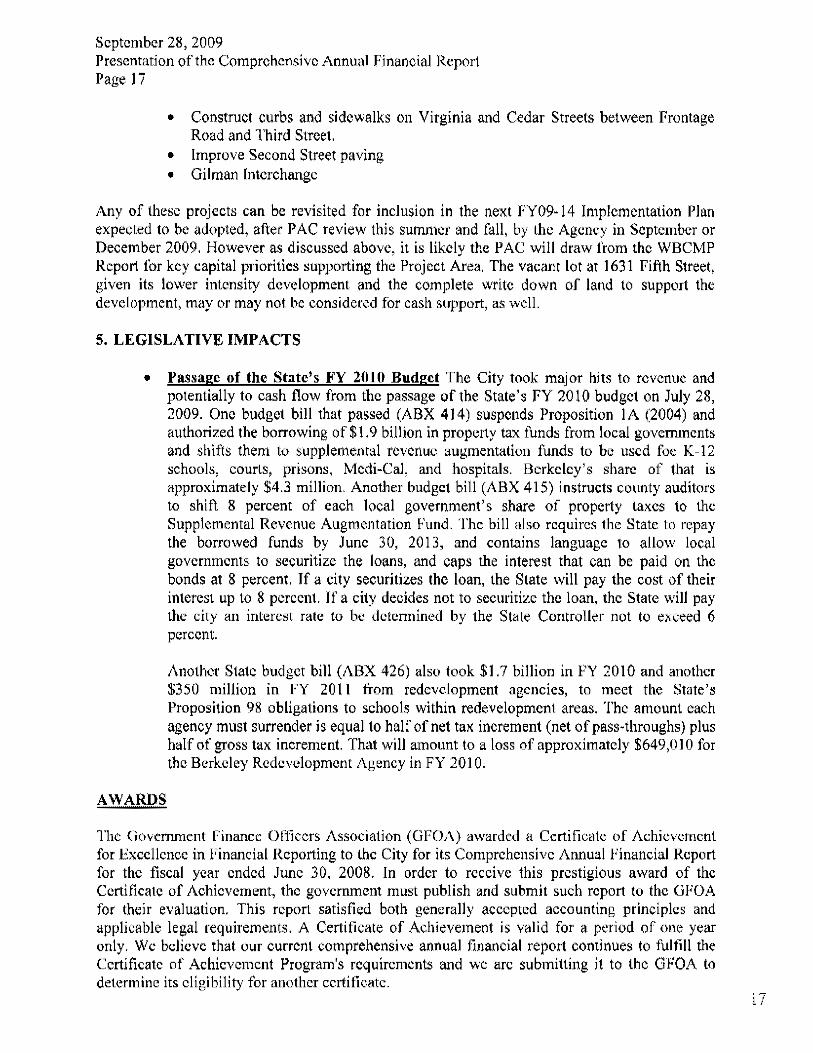
September 28, 2009 Presentation ofthe Comprehensive Annual Financial Report Page I 7
• Construct curbs and sidewalks on Virginia and Cedar Streets between frontage Road and Third Street.
• Improve Second Street paving • Gilman Interchange
Any of these projects can be revisited for inclusion in the next FY09-14 Implementation Plan expected to be adopted, after PAC review this summer and fall, by the Agency in September or December 2009. However as discussed above, it is likely the PAC will draw from the WBCMP Report for key capital priorities supporting the Project Area. The vacant lot at 1631 fifth Street, given its lower intensity development and the complete write down of land to support the development, may or may not be considered for cash support, as well.
5. LEGISLATIVE IMPACTS
• Passage of the State's I<'Y 2010 Budget The City took major hits to revenue and potentially to cash flow from the passage of the State's FY 2010 budget on July 28, 2009. One budget bill that passed (ABX 414) suspends Proposition !A (2004) and authorized the borrowing of$ I. 9 billion in property tax funds from local governments and shifts them to supplemental revenue augmentation funds to be used foe K-12 schools, courts, prisons, Medi-Cal, and hospitals. Berkeley's share of that is approximately $4.3 million. Another budget bill (ABX 415) instructs county auditors to shift 8 percent of each local government's share of property taxes to the Supplemental Revenue Augmentation Fund. The bill also requires the State to repay the borrowed funds by June 30, 2013, and contains language to allow local governments to securitize the loans, and caps the interest that can be paid on the bonds at 8 percent. If a city securitizes the loan, the State will pay the cost of their interest up to 8 percent. If a city decides not to securitize the loan, the State will pay the city an interest rate to be determined by the State Controller not to exceed 6 percent.
AWARDS
Another Slate budget bill (ABX 426) also took $1.7 billion in FY 20 I 0 and another $350 million in FY 2011 from redevelopment agencies, to meet the State's Proposition 98 obligations to schools within redevelopment areas. The amount each agency must surrender is equal to half" of net tax increment (net ofpass·throughs) plus half of gross tax increment. That will amount to a loss of approximately $649,010 for the Berkeley Redevelopment Agency in FY 2010.
The Government Finance Officers Association (GFOA) awarded a Certificate of Achievement for Excellence in Financial Reporting to the City for its Comprehensive Annual Financial Report for the fiscal year ended June 30, 2008. In order to receive this prestigious award of the Certificate of Achievement, the government must publish and submit such report to the GFOA for their evaluation. This report satisfied both generally accepted accounting principles and applicable legal requirements. A Certificate of Achievement is valid for a period of one year only. We believe that our current comprehensive annual financial report continues to fulfill the Certificate of Achievement Program's requirements and we arc submitting it to the GFOA lo determine its eligibility for another certificate.
17

September 28, 2009 Presentation of the Comprehensive Annual Financial Report Page 18
The City also received the GFOA's award for Distinguished Budget Presentation for the biennium (twa. year period) beginning July I, 2007. We believe that our current budget continues to conform to program requirements and we have submitted it to the GFOA to determine its eligibility for another award,
ACKNOWLEDGMENTS
The preparation of this report could not be accomplished without the efforts of the following individuals: The Accounting Manager, Marvin Tam and the entire Accounting Division of the Finance Department; the accounting tlrm of Caporicci & Larson, CPAs; and the continued support of sound financial management by Mayor Tom Bates and the City Council, the City Manager, Phil Kamlarz, and his staft~ particularly the Budget Manager, Tracy Vesely.
Due to the efforts of the entire City staff, the City's accounting and llnancial reporting systems continue to improved along with the quality of the information being reported to our citizens, the City Council, Department heads and managers, bond-holders, Federal, State and county agencies, and to other users of the City's financial reports.
Rcs.pectfull)jSUbmi~te1, -
/~)"~, Robert Hicks / 1: Director of Finance
18
Certificate of Achievement for Excellence
in Financial Reporting
Presented to
City of Berkeley California
For its Comprehensive Annual
Financial Report
for the Fiscal Year Ended June 30, 2008
A Certificate of Achievement for llxcellcnce itt Financial Reporting is presented by the Govemment Fin;~nce Officers
Association of the United States and Canada to government wlits and public employee retirement systems whose comprehensive ammal financial
reports (CAFRs) achieve the highest standardti in govcrnmc.-nt accounting
and f111ancial reporting.
President
~/.~ Executive Director
19
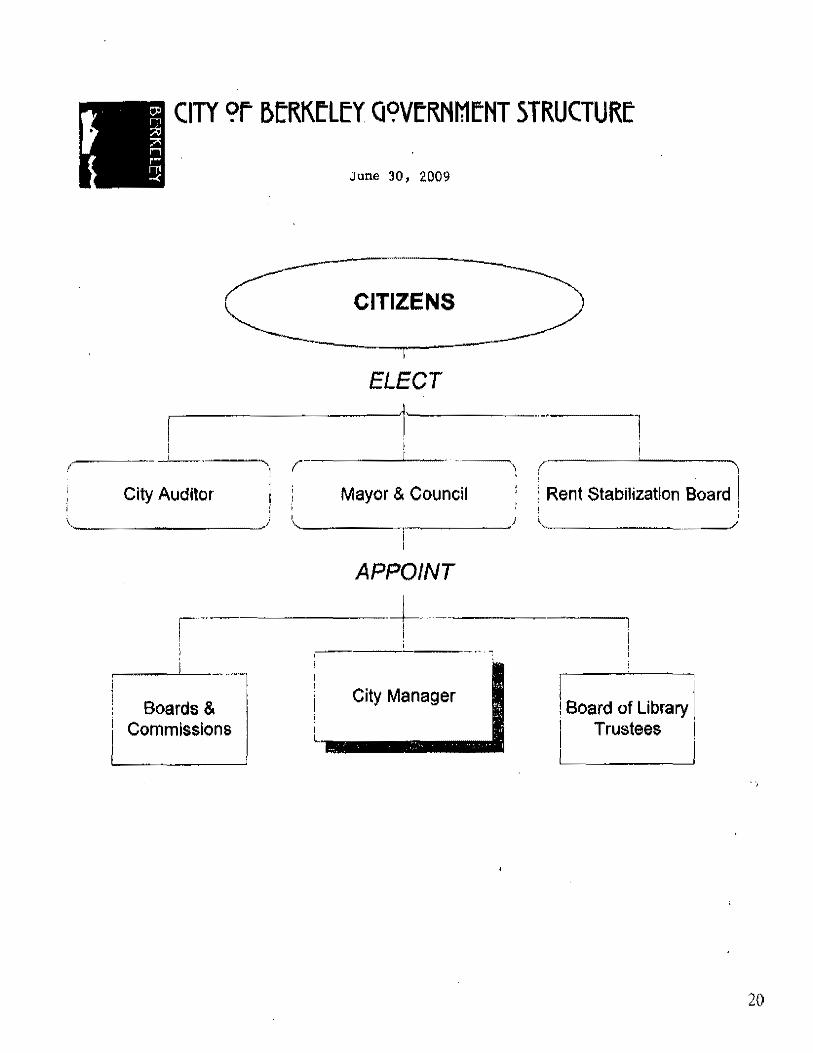
CITY <?i ~L'RKL'LL'Y G<?VtR.Nii'lL'NT STRUCTURL'
June 30, 2009
CITIZENS
ELECT
( ': (
City Auditor ' Mayor & Council ! Rent Stabilization Board I I : ', -) \..
"
APPOINT
______ J_, .-·~---------, I __ , __
I Boards & i City Manager
l Board of Library Commissions L------ J Trustees
20

______________ , _____________________ ,, ___ ,,
DIRECTORY OF CITY OFFICIALS ---------- ----·---------
ELECTED OFFICIALS
City Auditor- Ann-Marie Hogan
Mayor Tom Bates Vice-Mayor- Linda Maio
Council members
Linda Maio Darryl Moore Max Anderson Jesse Arreguin Laurie Capitelli Susan Wcngraf
Kriss Worthington Gordon Wozniak
APPOINTED BY CITY COUNCIL
City Manager- Phil Kamlarz
21

ORGANIZATIONAL CHART
RENT I I STABILIZATION -- CITIZENS OF BERKELEY
BOARD !b.....~"""""'=='!"'F=r======~ _~~,,,, .......... , .....
BERKELEY HOUSING
AUTHORITY \ ~====dJ \
' BOARD OF
\
'
CITY AUDITOR
LIBRARY MAYOR & COUNCIL - _ _ _ _ BOARDS & COMMISSIONS
I
TRUSTEES
LIBRARY
PLANNING & DEVELOPMENT
I
PUBLIC WORKS/ TRANSPORTATION
PARKS RECREATION, & WATERFRONT
HEALTH & HUMAN SERVICES
HOUSING DEPARTMENT
CITY MANAGER'S OFFICE
POLICE DEPARTMENT
FIRE DEPARTMENT
CITY ATTORNEY'S
OFFICE
CITY CLERK'S OFFICE
FINANCE DEPARTMENT
INFORMATION J TECHNOLOGY
HUMAN RESOURCES??

IC&L Caporicci & Larson Certified .Publtc .AccOlmtr.mts
INDEPENDENT AUDITORS' REPORT
To the Honorable Mayor and Members of City Council of the City of Berkeley
Berkeley, California
We have audited the accompanying financial statements o.f the governmental activities, the business-type activities, the discretely presented component units, each major fund, and the aggregate remaining fund information of the City o£ Berkeley, California (City), as of and for the year ended June 30, 2009, which collectively comprise the City's basic financial statements as listed in the table of contents. These financial statements are the responsibility of the City's management. Oux responsibility is to express an opi.nlon on these financial statements based on ou.r attdit. We did not audit the financial statements of the following discretely presented component unit;
Berkeley Housing Authority, which represents $13,967,479 of assets, $11,604,640 of net assets and $24,125,397 of revenues of the City.
Those financial statements were audited by other auditors whose reports have been furnished to us, and our opinion on the basic financial statements of the City, insofar as it related to those amounts included for the above mentioned component unit in the accompanying basic financial statements of the City, is based solely on the reports of the other auditors.
We conducted our audit in accordance with generally accepted auditing standards in the United States and the startdards applicable to financial audits contained in Government Auditing Standards, issued by the Comptroller General of the United States. Those standards require that we plan and perform the audit to obtain reasonable assurance about whether the financial statements are free of material misstatement. An audit includes examining, on a test basis, evidence supporting the amounts and disclosures in the basic financial statements. An audit also includes assessing the accounting principles used and significant estimates made by management, as well as evaluating the overall financial statement presentation. We believe that our audit provides a reasonable basis for oux opinions.
In our opinion, based on our audit and the reports of other auditors, the financial statements referred to above present fairly, in all material respects, the respective financial position of the governmental activities, the business-type activities, the discrete component units, each major fund, and the aggregate remaining fund information of the City as of June 30, 2009, and the respective changes in financial position and cash flows, wh<'re applicable, thereof for the year then ended in conformity with generally accepted accounting principles in the United States.
·roll Free Ph;(677) 862-2200
Oakl11od lBO Gl'llrtdAVC, S\1/le 1~5 O<tk.laml, a.uiforni~ 9-161Z
Onmgc:~Counf.}·
9 Corporl.ltc Park, Suite 100 Irvine, Callfom.!a 926o6
Tolll'ree Vo.x: (866) H6-0927 S.«uu,.,ntu
777 Campus C:onunmm R1!., 1-iultr. 200 Sllcramt:nto, C;Lll.lhrnl~ 9SR2~
su D:leao 4BS8Mercucy,Suht: 1()(5
SWJ D!egu,ca.lilOmr~ 92:111 23

To the I !onorable Mayor and Members of City Council of the City of Berkeley
Berkeley, California Page Two
As described in Note 1 to the basic financial statements, the City adopted Statement of Governmental Accounting Standards Board No. 49, Accounting and Financial Reporting for Polh1tion Remediation Obligations, No. 55, TI1e Hierarchy of Generally Accepted Accounting Principles for State and Local Governments and No, 56, Codification of Accounting and Financial Reporting Guidance Contained in the AI CPA Statement on Auditine Standards.
In accordance with Government Auditing Standards, we have also issued ou1' report dated September 28, 2009 on our consideration of the City's internal control over financial reporting and on our tests of its compliance with certain provisions of laws, regulations, contracts, and grant agreements and other matters. The purpose of that report is to describe the scope of our testing of internal control over financial reporting and compliance and the results of that testing, and not to provide an opinion on the internal control over financial reporting or on compliance. That report is an integral part of an audit performed in accordance with Gtmernment Auditing Standards and should be read in conjunction with this report in considering the results of our audit.
The accompanying Required Supplementary Information, such as Management's Discussion and Analysis, budgetary comparison information and other information as listed in the table of contents are not a required part of the basic financial statements but are supplementary information required by the Governmental Accounting Standards Board. We have applied certain limited procedures, which consisted principally of inquiries of management regarding the methods of measurement and presentation of the Required Supplementary Information. Ilowcver, we did not audit the information and express no opinion on it.
Our audit was conducted for the purpose of forming an opinion on the financial statements that collectively comprise the City's basic financial statements. The accompanying supplementary information is presented for purpose of additional analysis and is not a required part of the basic financial statements. The supplementary information has been subjected to the auditing procedures applied in the audit of the basic financial statements and, in our opinion, arc fairly stated in all material respects in relation to the bask financial statements taken as a whole. The Introductory and Statistical Sections have not been subjected to the auditing procedures applied in the audit of the basic financial statements and, accordingly, we express no opinion. on then1.
Oakland, California September 28, 2009
24
MANAGEMENT'S DISCUSSION AND ANALYSIS
As management of the City of Berkeley, we offer readers of the City of Berkeley's l1nancial statements this narrative overview and analysis of the 11nancial activities of the City of Berkeley for the 11scal year ended June 30, 2009. We encourage readers to consider the information presented here in conjunction with additional information that we have furnished in our letter of transmittal, which can be found on pages 1-18 of this report. All amounts, unless otherwise indicated, are expressed in millions of dollars.
J<'inancial Highlights
• The City's assets exceeded its liabilities (net assets) by $402.6 million at the close of the fiscal year ended June 30, 2009. Included in this amount was a balance of $120.2 million in unrestricted net assets. Unrestricted net assets arc net assets that may be used to meet the City's ongoing obligations to citizens and creditors.
• During the year, the City's total net assets decreased by $1.2 million from $403.8 million to $402.6 million. Governmental activities revenues decreased by $5.3 million while governmental activities expenses increased $6.7 million. Business-type activities revenues decreased by $1.8 million, while business activities expenses increased by $5.7 million.
• As ofJune 30, 2009 the City's governmental funds reported a combined ending fund balance of $155.3 million, an increase of $8.3 million. Approximately 48.7 percent of this total amount ($75.4 million) is available for spending at the government's discretion (unreserved fund balance).
• The total cost of all City program~ increased by $12.4 million from $276.2 to $288.6 million. This was accounted for primarily by increases (decreases) of $2.1 million in General Government, $2.0 million in Public Safety, ($2.7) in Highways and Streets, $1.1 million in Health and Welfare, $4.4 million in Community Development/Housing, ($0.3) million in Culture and Recreation, $3.3 million in Refuse Service, $.9 million in Parking-related, and $.6 million in Sewer Services.
• At June 30, 2009 unreserved fund balance for the General fund was $32.0 million or 24.3% of FY2009 total General fund expenditures.
• The City's total long-term debt increased by $16.0 million during the current fiscal year. This increase was accounted for by the following: ( 1) Proceeds from the Library General Obligation Bond issue of $10 million (Measure FF); (2) principal payments of ($6,503,802); (3) increase in claims and judgments payable of $2,204,416; (4) increase in compensated absences payable of $752,552; (5) increase in loan proceeds of $2,280,271; (6) Increase in capital lease obligations of $4,439,583 (7) increase in other postemployment benefit obligation of $656,084, and (8) increase in net pension obligation of Police Retirement Income Benefit Plan of $2, I 03,396.
Overview of the Financial Statements
This discussion and analysis is intended to serve as an introduction to the City of Berkeley's basic financial statements. The City's basic financial statements are comprised of tlucc components: 1) government-wide 11nancial statements, 2) fund financial statements, and 3) notes to financial statements. This report also contains other supplementary information in addition to the basic financial statements themselves.
Government-wide financial statements. The government-wide financial statements arc designed to provide readers with a broad overview of the City's finances, in a manner similar to a private sector business.
The statement of net assets presents information on all of the City's assets and liabilities, with the difference between the two rcpmtcd as net assets. Over time, increases or decreases in net assets
25

may serve as a useful indicator of whether the financial position is improving or deteriorating. You will need to consider other nonfinancial factors, such as changes in the City's property tax base and the condition of the City's roads, to assess the overall health of the City.
The statement of activities presents information showing how the government's net assets changed during the fiscal year. All changes in net assets arc reported as soon as the underlying event giving rise to the change occurs, regardless of the timing of related cash flows. Thus, revenues and expenses arc reported in this statement for some items that will only result in cash Dows in future fiscal periods (e.g., uncollected taxes and earned but unused vacation leave).
Both of the government-wide financial statements distinguish functions of the City that are principally supported by taxes and intergovernmental revenues from other functions that are intended to recover all or a significant portion of their costs through user fees and charges (business-l:ype activities). The governmental activities of the City include all of the City's basic services that are considered to be goverruncntal activities: general government, public safety, highways and streets, health and welfare, culture-recreation, community development/housing and economic development. Property taxes, business license taxes, transient occupancy taxes, sales taxes, utility users' taxes, ambulance fees and franchise fees finance most of these activities. The business-type activities of the City include a Parking related operation, a Clean Storm Water operation, a Marina, a Sanitary Sewer operation, a Refuse Collection and Disposal operation, a Permit Service Center, and Building Purchase and Management.
The government-wide tinandal statements include not only the City itself (known as the primary government), but also a legally separate Rent Stabilization Board and Housing Authority for which the City is financially accountable. Financial information for these component units arc reported separately from the financial information presented lor the primary government itself, The Berkeley Redevelopment Agency, although also legally separate, function for all practical purposes as a department of the City of Berkeley, and therefore has been included as an integral part of the primary government.
The government-wide financial statements can be found on pages 44-45 of this report.
Fund financial statements. Ajimd is a grouping of related accounts that is used to maintain control over resources that have been segregated for specific activities or objectives. The City of Berkeley, like other state and local governments, uses fund accounting to ensure and demonstrate compliance with finance-related legal requirements. Some funds arc required to be established by State law and by bond covenants. However, the City Council establishes many other funds to help it control and manage money for particular purposes or to show that it is meeting legal responsibilities for using certain taxes, grants, and other money. All of the funds of the City of Berkeley can be divided into three categories: governmental, proprietary, and fiduciary.
• Governmental funds-Governmental jimds arc used to account for essentially the same functions reported as governmenllll uc:tivities in the government-wide financial statements. However, unlike the government-wide financial statements, governmental fund financial statements focus on near-term inflows and outflows of spendable resources, as well as on balances of spendable resources available at the end of the j)scu/ year. Such information may be us~ful in evaluating a government's near-term financing requirements.
Because the focus of governmental funds is narrower than that of the government-wide tlnancial statements, it is useful to compare the information presented for governmental funds with similar information presented for governmental activities in the government-wide financial statements. By doing so, readers may better understand the long-term impact of the government's near"term financing decisions. Both the governmental fund balance sheet and the governmental lund statement of revenues, expenditures, and changes in fund balances provide a reconciliation to facilitate this comparison between governmental funds and governmental act ivil ies.
The City of Berkeley maintains 84 individual governmental funds. Information is presented separately in the governmental fund balance sheet and in the governmental fund statement of revenues, expenditures, and changes in lund balances for the General lhnd, Grant fund, Library fund, CDBG fund, Park Tax fund, and Capital Improvements fund, all of which arc considered
26

to be major funds. Data from the other 78 governmental funds are combined into a single, aggregated presentation.
The City of Berkeley adopts an annual appropriated budget for all its special revenue funds, (Except Sales Tax Street Improvement, Fire Assessment District, UC Berkeley Reimbursement/People's Park; Lillie Wall Memorial, East Bay Public Utility; Dept. of Justice Block Grant; Other Special Deposits; Impounded Neuter), capital project funds (except public Education!Govt. access Fac.; Capital Improvement Administration; Street Improvement Fund; Theatre/Park Acquisition; Low & Moderate Income Project Fund; and Savo Island Project). The budgetary comparison schedules have been provided for the General Fund and major Special Revenue Funds to demonstrate compliance with this budget under "Required S~tpplemcntary Information other than MD&A section". Th~: basic governmental fund financial statements can be found on pages 46-51 of this report.
• Proprietary funds--The City of Berkeley maintains two different types of proprietary funds. Enterprise funds arc used to report the same functions presented as business-type activities in the government-wide financial statements. The City of Berkeley uses enterprise funds to account for its, Refuse Collection/Disposal, Marina Operation/Maintenance, Sanitary Sewer, Clean Storm Water, Permit Service Center, Off-Street Parking, Parking Meter, and Building Purchase and Management operations, which arc all considered to be major funds of the City of Berkeley. Internal service funds arc an accounting device used to accumulate and allocate costs internally among the City" of Berkeley's various functions. The City of Berkeley uses internal service funds to account for its equipment maintenance, building maintenance, supply warehouse, electrical warehouse, computer replacement, workers compensation program, sick leave and vacation payout, public liabilities, and catastrophic loss reserves. Because these services predominantly benefit governmental rather than business-type functions, they have been included within governmenral activities in the government-wide financial statements.
Proprietary funds provide the same type of information as the government-wide financial statements, only in more details. The nine internal service funds are combined into a single, aggregated presentation in the proprietary fund financial statements. Individual fund data for the internal service funds is provided in the form of combining statements elsewhere in this report.
The basic proprietary fund statements can be found on pages 52-55 of this report.
Fiduciary fimds. Fiduciary funds are used to account for resources held for the benefit of parties outside the government. Fiduciary funds are not reflected in the government-wide financial statement because the resources of those funds are not available to support the City of Berkeley's own programs. The accounting used for fiduciary funds is much like that for proprietary funds.
The basic fiduciary fund !lnancial statements can be found on pages 56-57 of this report.
Notes to the financial statements. The notes provide additional information that is essential to a full understanding of the data provided in the government-wide and fund financial statements. The notes to the financial statements can be found on pages 58-117 of this report.
Other information. In addition to the basic financial statements and accompanying notes, this report also presents certain required supplementary iriformation conccming the City of Berkeley's progress in funding its obligation to provide pension benefits and other postcmployment benefits to its employees. Required supplementary information can be found on pages l 19-127 of this report
The combining statements referred to earlier in connection with non~ major governmental funds and internal service funds are presented immediately following th~ required supplementary information on pensions and other postcmployment benefits. Combining and individual fund statements and schedules can be found on pages l 29-174 of this report.
27
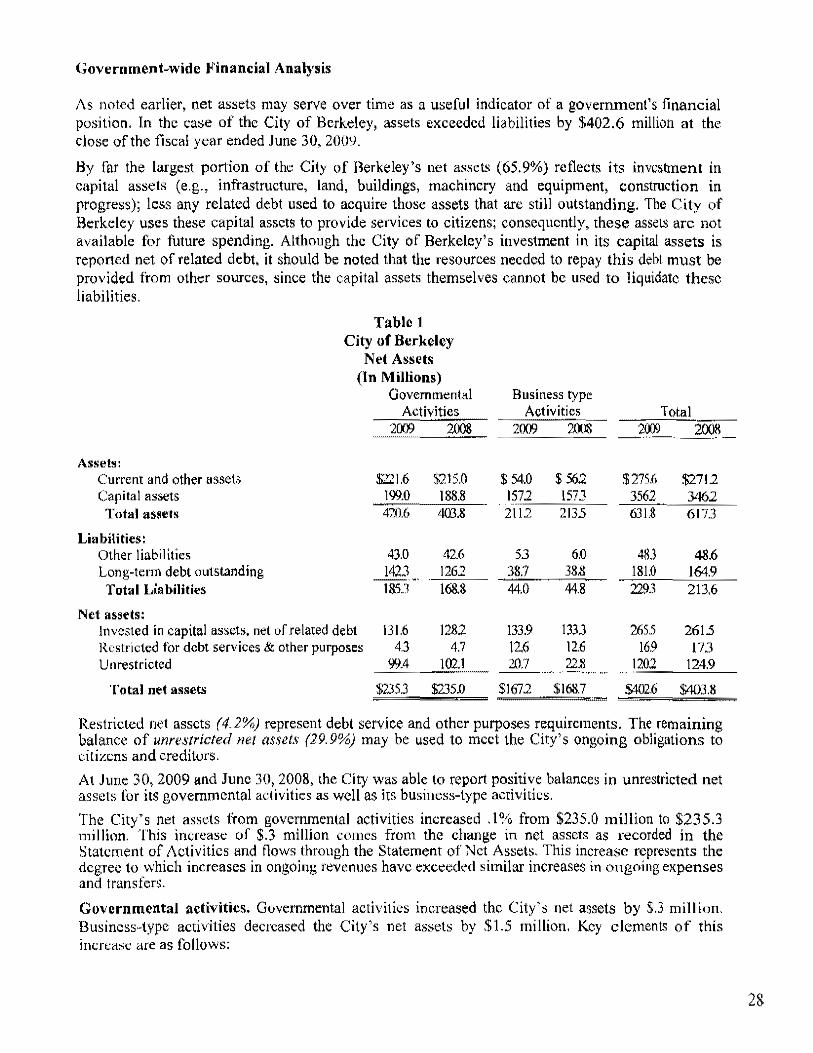
Government-wide Financial Analysis
/\s noted earlier, net assets may serve over time as a useful indicator of a goverrunent's financial position. In the case of the City of Berkeley, assets exceeded liabilities by $402.6 million at the close of the fiscal year ended June 30, 2009.
By far the largest portion of the City of Berkeley's net assets (65.9%) reflects its investment in capital assets (e.g., infrastructure, land, buildings, machinery and equipment, construction in progress); less any related debt used to acquire those assets that are still outstanding. The City of Berkeley uses these capital assets to provide services to citizens; consequently, these assets arc not available for future spending. Although the City of Berkeley's investment in its capital assets is reported net of related debt, it should be noted that the resources needed to repay this debt must be provided from other sources, since the capital assets themselves cannot be used to liquidate these liabilities.
Assets: Current and other assets Capital assets Total assets
Liabilities: Other liabilities Long-term debt outstanding Total Liabilities
Net assets:
Table 1 City of Berkeley
Net Assets (In Millions)
Governmental Activities
2001 2008
$221.6 $215.0 199.0 188.8 420.6 403.8
43.0 42.6 142.3 1262 ---· 185J 168.8
Invested in capital assets, net of related debt 131.6 1282 Restricted for debt services & other purposes 43 4.7 Unrestricted 99.4 102.1
Total net assets $2353 $235.0
Business type Activities Total
2009 2008 200! 2008 -·-·
$54.0 $562 $275.6 $2712 1572 1573 3561 3462 2112 2135 631.8 617.3
5.3 6.0 483 48.6 38.7 38.8 181.0 164.9 44.0 44.8 2293 213.6
133.9 133.3 265.5 2615 12.6 12.6 16.9 17J 20.7 22.8
$1672 $168.7 $402.6 $403.8 ~·
Restricted net assets (4.2%) represent debt service and other purposes requirements. The remaining balance of unrestricted net assets (29.9%) may be used to meet the City's ongoing obligations to citizens and creditors.
At June 30, 2009 and June 30, 2008, the City was able to report positive balances in unrestricted net assets for its governmental activities as well as its business-type activities.
The City's net assets from governmental activities increased . I% from $235.0 million to $235.3 million. This increase of $.3 million comes from the change in net assets as recorded in the Statement of /\ctivitics and flows through the Statement of Net Assets. This increase represents the degree to which increases in ongoing revenues have exceeded similar increases in ongoing expenses and transfers.
Governmental activities. Governmental activities incn:ased the City's net assets by $.3 million. Business-type activities decreased the City's net assets by $1.5 million. Key clcment1 of this increase are as follows:
28
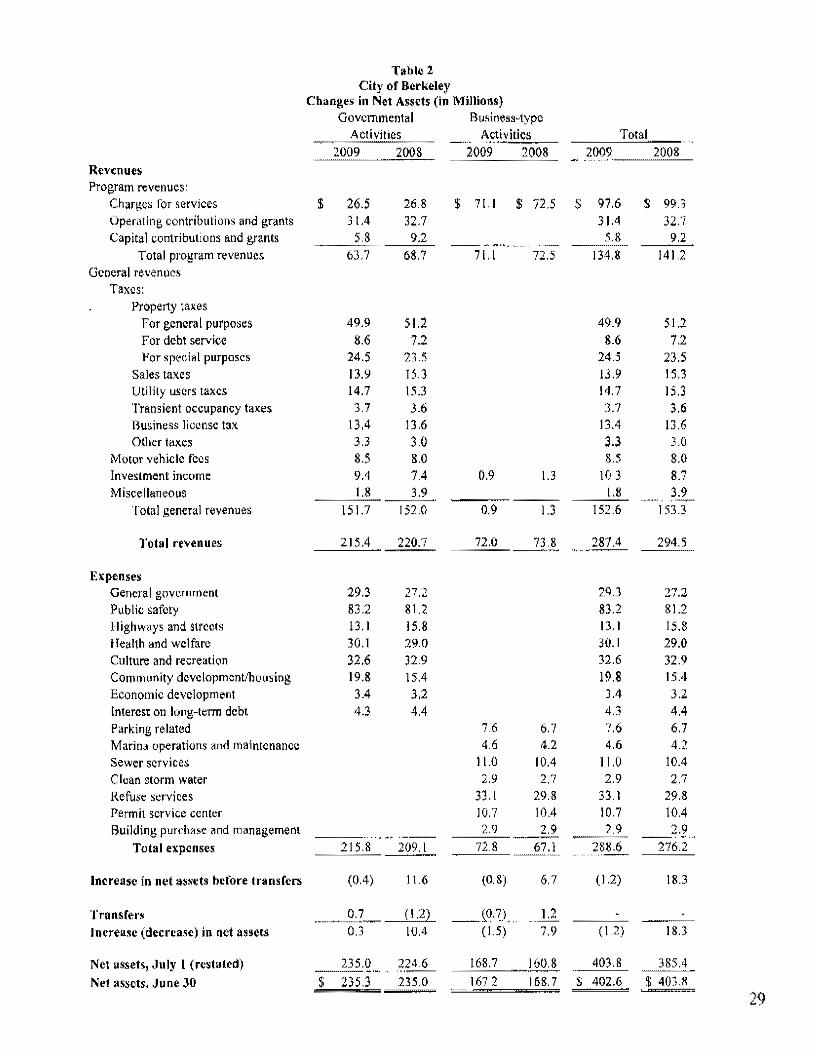
Table 2 City of Berkeley
Changes in Net Assets (in Millions) Governmental Bu<iness"typc
A!'!i.Yitics Total 2009 2008 2009 2008 2009 2008
Revenues Program revenues:
Charges ror services $ 26.5 26.8 $ 71.1 $ 72.5 $ 97.6 $ 99.3 Operating contributions and grants 31.4 32.7 3 I .4 32.7 Capital contributions and grants 5.8 9.2 5.8 9.2 -----·-····
Total program revenues 63.7 68.7 7 I. I 72.5 134.8 141.2 General revenues
Taxes: Property taxes
For general purposes 49.9 51.2 49.9 51.2 For debt service 8.6 7.2 8.6 7.2 For special purposes 24.5 23.5 24.5 23.5
Sales taxes 13.9 15 3 13.9 I 5.3 Utility users taxes 14.7 15.3 14.7 15.3 Transient occupancy taxes 3.7 3.6 3.7 3.6 Business license tax 13.4 13.6 13.4 13.6 Other taxes 3.3 3.0 3.3 3.0
Motor vehicle fees 8.5 8.0 8.5 8.0 Investment income 9.4 7.4 0.9 1.3 103 8.7 Miscellaneous 3.9
Total general revenues 151.7 152.0 0.9 1.3 152.6 I 53.3
Total revenues 215.4 220.7 72.0 287.4 294.5 .. ---
Expenses General government 29.3 27.2 29.3 ?O? .. I,.;.
Public safety 83.2 81.2 83.2 81.2 Highways and streets 13, I 15.8 13. I 15.8 Health and welfare 30.1 29.0 30.1 29.0 Culture and recreation 32.6 32.9 32.6 32.9 Community dcvclopmcnlihousing 19.8 15.4 19.8 15.4 Economic development 3.4 3,2 3.4 3.2 Interest on long-term debt 4.3 4.4 4.3 4.4 Parking related 7.6 6.7 7.6 6.7 Marina operations and maintenance 4.6 4.2 4.6 4.2 Sewer services I 1.0 10.4 11.0 10.4 Clean storm water 2.9 2.7 2.9 2.7 Refuse services 33.1 29.8 33.1 29.8 Permit service center 10.7 10.4 10.7 10.4 Building purchase and management 2.9 2.9 2.9
. ···~~ ·---Total expenses 21 209.1 72.8 67.1 288.6 276.2
lnereasc in net assds before transfers (0.4) 11.6 (0.8) 6.7 (1.2) 18.3
Transfers 0.7 (1.2) _(0.7) .. 1.2 ....... -~ .......... -~ Increase (decrease) in net assets 0.3 10.4 (1.5) 7.9 (1.2) 18.3
Net assets, July 1 (restated) 235.0 224.6 168.7 160.8 403 8 385.4 ----Net assets, June 30 $ 235.3 235.0 167 2 168 7 $ 402.6 $ 403.8
29

Total governmental activities revenues decreased approximately $5.3 million. Key factors in that decrease were the following:
• Charges for service::; decreased by $.3 million or I, I%, which was primarily attributable to: o 1\n increase of$160,498 or 5.5% in general governmental fees.
o An increase of $2 I 3,698 or 1.4% in public safety tees.
o A decrease of$925,706 or 37.8% in community development/housing fees.
o 1\n increase of$149,069 or 5.2% in culture and recreation fees.
o An increase of$ I 35,249 or 13.4% in health and welfure fees.
• Operating grants and contributions decreased $1.3 million. This was due to the completion of a few large grant projects in FY 2008, resulting in lower grant revenue in FY 2009. For example,
o The 9'h St. Bike Blvd. Congestion Mitigation & Air Quality Improvement Project: $1 million
o The Federal Services transportation Gilman Repaving Project: $.7 million
• Capital grants and contributions decreased $3.4 million due partly to the completion of the Gilman Ports Fields project, which was largely completed in FY 2008. $3.5 million was spent, and $2.4 million was billed in FY 2008.
• Property taxes for general purposes decreased $1.3 million or 2.3%. Key components of that decline are as follows:
o Real Property Transfer Tax revenues declined $3,999,303 to $7,881,209 in FY 2009, from $11,880,512 in FY 2008, a decrease of33.7 %. The decline in Real Pruperty Transfer Tax revenue was due to a sharp decline in the real estate market, which produced a decline in property sales of $368,839,560 or 40.8% in FY 2009 to $536,045,520, from $904,885,080 in FY 2008, and a 20.6% decline in the number of sales, to 719 in FY 2009, from 906 in FY 2008.
o Real Property Tax revenues increased $1.918,609 or 5.5 %to $36,635,911 in FY 2009, from $34,717,302 in FY 2008, primarily due to a 6.9% increa~e in assessed values. The FY 2008 total included the payment of approximately $400,000 in FY 2007 nnderpayments.
o Supplemental Tax revenues declined $797,754 or 41.8% to $1,109,577 in FY 2009, from $1,907,331 in FY 2008, in line with the sharp decline in the real estate market, as reflected in the drop in Real Property Transfer Tax revenues.
o Redemptions (i.e., collections 011 prior years' real property taxes) increased $743,863 or 77.2%.
o Unsecured property taxes increased $353,142 or 16.7%
30

• Property taxes for debt service increased $1.4 million primarily due to (I) the issuance of $7.2 million in Animal Shelter General Obligation bonds, which resulted in total collections of$1.8 million, However, it should be pointed out that the incorrect tax rate of0.0140% was used in FY 2009 for the Animal Shelter General Obligation Bond issue, instead of .004%. As a result, approximately $1 million was over-collected in FY 2009. It is being refunded in fY 20 I 0 and FY 20 II, in the form of a substantially lower tax rate; (2). The tax rates for Measure S General Obligation Bonds declined in FY2009 due to the refinancing of the bonds at lower interest rates in FY 2007. This resulted in a reduction of $424,942 in the taxes collected in FY 2009,
• Property taxes for special purposes increased $1.0 million due to cost of living increases for the Park Tax (2.8873%), Library Tax (4,29%) and Paramedic Tax (2.8873%).
• Business License Tax (BLT) revenues decreased $174,439 or 1.3% to $13,388,429 in FY 2009, from $13,562,868 in FY 2008. However, the FY 2008 total included approximately $725,000 of one-time revenue that resulted from the City's Business License Tax miscoding project.
• Investment income increased $2.0 million or 27.0% in FY 2009. Investment income is the total interest income earned plus the change in the market value of investments during the fiscal year. GASB Statement No. 31 requires governments to mark investments to market value, whether or not the intent is to hold them to maturity. Interest income during FY 2009 actually declined, as the Federal Reserve Board cut short-tenn rates to nearly zero and kept them there. However, Investment income increased by $2.0 million due primarily to a $4.2 million increase in the market value of the City's investments. Since interest rates declined significantly during FY 2009, the market values of the investments held by the City increased by approximately $4.2 million. GASB Statement No. 31 requires that this increase be added to the total interest income, to calculate investment income for the year.
• Sales Tax revenues decreased by $1.4 million or 9.2%. Due to the recession, there were sharp declines in all retail and building product categories.
• Utility Users Tax revenues decreased $.6 million as the sharp decline in gas rates and a slight decline in gas usage more than offset an increase in electric rates and a slight decline in electric usage.
• Motor vehicle fees increased $.5 million or 6.3%, due to the 6.9% growth in assessed values.
• Other taxes increased $.3 million or I 0%, led by a $.6 million increase in parking lot taxes.
• Miscellaneous income decreased $2, J million primarily due to the receipt of $2 million in advertising revenues from Cl3S Outdoor in FY 2008.
• Total expenses increased by $6.7 million for governmental activities primarily due to salary and employee benefit increases.
General Governmen~ expenses increased by $2.1 million for the following reasons:
• Salaries and wages increased, due to the increase of 4 - 5% in COLAs.
• Infrastructure assets totaling $756,534 were capitalized, which reduced expenses by the same amount.
PLtblic Safety expenses increased by $2.0 million in FY 2009. Contributing factors were as follows: 31
• Salaries and wages increased, due to the increase of 4- S% in COLAs.
• The City contributed $1,934,206 less than the Annual Required Contribution for the Police Retirement Income Benefit Plan. Governmental Accounting Standards Board Statement No. 27 requires that this difference be recognized as a liability and an expense on the City's government-wide Statement of Net Assets and Statement of Activity.
Highway and Streets expenses decreased by $2.7 million as follows:
• Salaries and wages increased, due to the increase of 4- 5% in COLAs.
• There was no spending for CDBG CIP SWAP in FY 2009, down from the $892,201 spent in FY 2008.
• Infrastructure assets totaling $2,931,660 were capitalized, which reduced expenses by the same amount.
Health and Welfare expense increased by $1.1 million as follows:
• Salaries and wages increased, due to the increase of 4 - 5% in COl ,As.
• There was a decrease of $265,440 in grant expenses.
Conununity Development/Housing expenses increased $4.4 million primarily for the following reason:
• Expenses of $3,535,580 on the Ed Roberts Campus grant.
Interest Expense on Long-Term D~l?.! decreased by $.1 million as follows:
• An increase in interest payments on the Animal Shelter bonds, which was otfset by lower interest payments on the Tax and Revenue Anticipation Notes and Measure S General Obligation bonds.
32

The following charts illustrate the City's governmental expenses by function and revenues by source. As shown, public safety is the largest function in terms of expenses (38.55%). followed by culture and recreation (15.10%), health and welfare (13.95%), and general government (13.59"/o). General revenues such as property, sales, utility users and business license taxes are not shown by function but are effectively used to support citywide programs. Taxes arc by far the largest segment of revenues (61.28%) followed by grants and subventions (21.22%) and charges tor services (12.30%) .
. Fiscal Year 2009 Govenunental Activities (Sc.,-e Table 2)
Sources of Revenue
• Chargos for setvices 12.30%
Grants& Subvnooos
21.22%
a lrw¢Stment Income 4.36%

--- ---. ···----------······--·-·· ··---------
[conorn1c:
1 51,30/o
g 1
Culturo &
15 10%
• Ht~~ltt1 & Welfare 13 95%
Functional Expenses Interest 1 ggo;.J
.::-----. Government
13.59%
• ~'l.;blic f.;aJety 38 S5%
-------"~---------- ·--- -··
Business-type activities. Business-type activities decreased the City's net assets by $1,471,318 as follows: sanitary sewer $3,256,954, parking-related functions ($486,624 ), refuse operations ($3,875,651 ), building purchase and management $125,182, marina activities $859,822, clean storm water ($749,043), pennit service center ($601,958).
• The most significant factor in the net increase of $3,256,954 in the Sanitary Sewer fund was that a significant portion of the operation's budget, or $2,555,858 was used for capital expenditures (i.e. infrastmcturc which is required to be capitalized on an accrual basis), resulting in less operating expense reported using the accrual basis of accounting. In addition, there was a $\,254,603 decrease in sewer service fees due to EBMUD's mandatory water rationing (i.e., less water usagc~less sewer revenue), and an $813,226 increase in connection fees.
• The net decrease in the net assets of ($486,624) for the Parking-related Operation consisted of a $77,787 increase for Off-Street Parking Operations, and a decrease of ($564,411) in net assets for Parking Meter operations. This was compared to an increase in net assets of $586,955 in FY 2008 ($547,651 for the Off-Street Parking Fund and $39,304 for the Parking Meter Fund).
o Key factors for the Off-Street Parking Operations were: Operating revenues ($2,723, Ill) exceeded operating expenses ($2,471,613) by $251,498.
o Key factors for the decrease in Parking Meter Operations: Operating revenues ($4, 768,252) ·were exceede-d by operating expenses ($4,924,013) by $155,761. While revenues in FY 2009 increased by $423,900 or 9.8% over those in FY 2008, operating expenses increased by $624,914 or 14.5%. In addition, there was a $400,000 Transfer Out to the General Flllld. These factors lead to the decline in net assets of$564,411 during the fiscal year.
34

• The net decrease of ($3,875,651) in net assets in the Refuse fund resulted from the following:
o Fcc income that was nearly the same total as that in FY 2008.
o However, operating costs increased by $3,953,083. Factors contributing to this increase were the following: (I) S<tlaries and Wages increased by $497,468 or 5.4%, in line v-~th COLAs; (2) Landfill disposal services increased by $2,278,974; (3) Recycling services increased by $955,604; and (4) Indirect costs increased by $107,816, as the allocation base (Direct salaries and Wages) increased.
• The net increase of $859,822 in the Marina fund net assets was primarily due to the following:
o Operating income increased by $979,798, as revenues ($5,343,851) exceeded operating expenses ($4,364,053).
o Operating revenues increased by $713,459 or 15.4%. Factors causing the increase were as follows: ( 1) A $422,663 lease settlement made in FY 2008 was recorded as revenue in FY 2009; (2) A $201,697 increase in berth rentals. In 2008, the Marina replaced H&I docks, and the new configuration resulted in a net increase in rentable berths from 40 to 63; (3) a $108,335 incrcMe in live-aboard fees, The Marina is legally allowed 113 Jive-aboard permits by the Bay Conservation and Development Commission, but the Marina was only using a portion of the available permits. An intensive advertising campaign to promote the available pcnnits has increased occupancy to near capacity.
o Operating expenses increased by $275,509 or 6.7%. Factors causing the increase were as follows: (1) Salmics and wages increased by $205,331 and employee benefits increased by $134,272, as a result ofCOLi\s ranging between 4-5%, In addition, the fund added one FTE position: Assistant Recreation Coordinator, a .25 FTE position: Recreation Program Supervisor, and there was a 50% increase in Public Works' Electrician charges to the Park Department's projects. Employee benefits increased as a result of increases in medical insurance, retirement payments, workers' compensation, and other employee benefits.
• The net decrease of ($60 I ,958) in the Penn it Service Center Fund net assets was primarily due to the following:
o There wM an operating loss of ($566,153), as operating revenues ($10,157,832) were exceeded by operating expenses ($10,723,985).
o Operating revenues decreased by $1,110,189 or 9.9%, primarily due to a big increase in plan check fees in PY 2008 that was due to more restrictive changes in the code that went into effect on January I, 2008. It caused a rush by contractors to submit their projects before the deadline tbr the code changes. Residential and commercial building permits fees also increased as a result of change. This decline more than offset Building Permits fees and Other Permits fees increases of$421,533 and $332,947, respectively. These increases resulted from a 5% increase in Building Permits fees and a 25% increase in Land Usc Planning fees.
o Operating expenses increased by $301,975 or 2.9%. Factors causing the increase were the following: (1) Salaries and wages increased by $298,350 and employee benefits increased by $178,182, primarily as a result of COLAs ranging between 4-5%; (2) Specialized and Professional Services decreased by $250,910 due to the decline of $255,109 in a plan check service contract, !i·om $315,967 in FY 2008 to $60,858 in FY 2009; and (3) Indirect costs increased by $58,866 due to the increase in the allocation base (Direct salaries and wages).

'J>
"'
• G? c f;,
o'gw o~::J •#3,....,. -4;J~;fl ~ 0--
" ~
• " ~
"'" -->.3 ~~
""" ~= => ,, 0 3 •>
Ill ~(/'I -,0 ::I c 11> .... tJJ n tJJ t1) ,Ul
~s_ "1:l;;o 11> t1)
)>< on> ~:J <C ;:n. tJJ
ll .f;4 ~ ih ~ .£fl ~ l
Parking
Marina
Sewer
Clean Storm Water
Refuse Services
Permit Center
Building Purchase & Management
"' 0
~ ~ ~ N N ~ ~ ~ o ~ o ~ o m 0 0 0 b 0 0 0 0 0 0 0 0 0 0 0 0 0 0 0 0 0 oOOOO"oO 0 0 8 8 0 0 0 0 0 0 0 0
7,509,527 7,579,581
10,159,268 10,723,985
~ I [i) ;;; ;X: ~., < .
I : ~ ~I I ~
"'tJ ~
lllo c~ !J)l:ll :;·3 <!>;a "'<D "'< '11> ~::I ,c (D<D
J>"' 0::::1 ,...a.
~:~ -·, <l>tl) "'::::~
"' 11>
.275 140.056

Financial Analysis of the City's Funds
As noted earlier, the City uses fund accounting to ensure and demonstrate compliance with finance-related legal requirements.
Governmental funds. The focus of the City's governmentalfi;nds is to provide inf01mation on ncaNcrm inflows, 0<1tflows, and balances of spendable resources. Such information is useful in assessing the City's financing requirements. In particular, unreserved fund balance may serve as a useful measure of a government's net resources available for spending at the end of the liscal year.
As of June 30,2009, the City's governmental funds reported combined fund balances of$155.3 million, an increase of $8.3 million from the prior fiscal year. The bulk of the increase came from a $10 million Library General Obligation Bond issue (Measure FF).
The General Fund is the chief operating fund of the City. As of June 30, 2009 unreserved fund balance of the General Fund was $32.0 million and total fund balance was $45.0 million. As a measure of the General Fund's liquidity, it may be useful to compare both unreserved fund balance and total fund balance to total expenditures. Urnescrvcd fund balance represents 24.3% of total General Fund expenditures of $131.9 million, while total fund balance represents 34. I percent of that same amount.
• The fund balance of the City's General Fund decreased by $3.3 million ($2.8 million from operations and $0.5 million from a prior period adjustment). The increase in operations was primarily accounted for by the following:
o The General Fund generated an excess of revenues over expenditures in FY 2009 of $10,411,240, as operating revenues totaled $142,296,411 and operating expenditures totaled $131,885,171; however,
o General Fund operating transfers out in FY 2009 totaled ($16,590,858), which exceeded operating transfers in of$3,351 ,209, for net transfers out of ($13,239,649).
o Proceeds from the sale of capital assets of $1 ,983; and o Prior period adjustments to the Notes Receivable account totaling $484,792.
• The fund balance of the City's Library Fund increased by $10.2 million. The increase was primarily accounted for by the following:
o Proceeds from a $I 0 million General Obligation bond issue during the tlscal year (Measure I'F); and
o An excess of revenues over expenditures in FY2009 of $203,129, as operating revenues totaled $14,369,418 and operating expenditures totaled $14, J 66,289. Operating revenues increased primarily as a result of a 4.29% cost of living increase in the special tax for the provision of library services, which offset personnel COLAs ranging between 4-5%.
37

General Fnnd Budgetary Highlights:
The City Council approved an original annual appropnauon ordinance of $145,851,244, including transfers out for FY 2009, and made supplementary budget appropriations totaling $9,254,379 during the year. Ibe supplementary budget appropriatiom consisted of the following: (I) FY 2008 outstanding encumbrances of $3,423,388; (2) unencumbered carryovers of$2,609,898, which were re-appropriated; (3) other budget adjustments of$3,221,093.
General fund expenditures were $3.9 miJlion Jess than the approved budget, and the !allowing functions accounted for most of this total:
• General government - $2.5 million under budget: These savings were mainly attributable to the salary savings from vacant positions (largely attributed to a hiring freeze) and under spending of non-personnel expenditures.
• Public Safet>·- $.2 over budget: This was due to Police Department bcnc11t and overtime expenditures in excess of the budgets.
• Highways & Streets- $.4 million under budget: This was due to vacancies in the P\1blic Works Department and non-personnel funds not fully spent due to a hold on some capital projects pending State budget actions.
• Health & Welfare- $.03 million under budget: This was due to non-personnel budget in the Health and lluman Services Department not fully spent.
• Culture & Recreation- $.3 million under budget: This was due to non-personnel funds for Gilman Sports Field project not fully spent. This is a capital project that will be completed in FY 2010.
• Community Development & Housing- $.3 million under budget: This was due to salary savings and under spending of non-personnel funds. The non-personnel funds are attributed to Housing Trust Fund projects that will go forward in FY 2010.
• Economic Development· $.4 million under budget: This was due to one-time funds for economic development activities and non-personnel not fully spent.
• Interest and fiscal charges-$.2 million under budget: This was due to a lower interest rate on the Tax and Revenue Anticipation Notes issued by the City during the fiscal year.
Proprietary funds. The City's proprietary funds provide the same type of information found in the government-wide financial statements, but in more detaiL
Unrestricted net assets of the enterprise funds as of June 30, 2009 totaled $20,776,974, as follows:
Fund
Refuse Collections Marina Operations Sanitary Sewer Clean Storm Water Permit Service Center Off-street Parking Parking Meter lluilding Purchase and Management
Total
Ilalance (Deficit) Unrestricted Net Assets
$ 356,867 3,213,608
18,324,576 675,840
5,155,619 3,237,617 (335,885)
-:;;-___ .f2c~_!,} 6 8]___ $ 20,776,974
38

CAI'IT AL ASSETS AND DEBT ADMINISTRATION
Capital assets The City's investment in capital assets for its govcmmcn!al and business-type activities us of June 30, 2009 amounts to $356.2 million (net of accumulated depreciation), which is $10.0 million more than the total as June 30, 2008. This investment in capital assets includes land, buildings, improvements, machinery and equipment, infrastructure, and construction in progress (Sec Tabk 3 below.).
Capital assets for governmental activities increased by $10.1 million primadly due to an increase in infrastructure assets, machinery and equipment and construction in progress. Total Capital assets for business type activities were unchanged.
Land Buildings and improvements
Table 3 City of Berkeley
Capital Assets at Year-End (Net of Depreciation, in Millions)
Government Activities
2009 2008
$ 22.3 $ 20.3 71.1 74.1
Business-Type Activities
2009 2008
$ 3.0 26.4
Improvements other than buildings 7.6 6.7 5.5
$ 3.0 27.1
2.1 1.1
120.7 3.4
Machinery and equipment 11.2 9.6 1.5
Infrastructure 80.5 78.1 120.9 Construction in progress 6.2
$199.0 $ 188.8 $157.2 $ 157.3
Total 2009 2008
····--· ··-·--
$ 25.3 $ 23.3 97.5 101.1 13.1 8.8 12.7 10.7
201.4 198.8 6.2 3.4
$356.2 $ 346.2
Additional information on the City's capital assets can be found in note III C on page 78,80 of this report.
Long-term debt. At year-end, the City had total long-term obligations from governmental activities of $142.2 million, an increase of $16.0 million or 12.7% from the previous year (as shown in table 4). The June 30,2009 total included: $71.4 million in general obligation bonds, $7.6 million in lease revenue bonds, $3.3 million in pension refunding bonds, $6.0 million in tax allocation bonds, $4.4 million in capital lease obligations, loans and notes payable of $6.8 million, $14.3 million in compensated ;~bsences, and $22.1 million in workers' compensation and public liability judgments and daims. 1\ net OPEB Obligation and Net Pension Obligation of $0.8 million and $5.5 million, respectively, were added due to the implementation or GASB 45. Please refer to Note 1.0 to the Financial Statements for more details.
39

General obligation bonds Lease revenue bonds Pension refunding bonds Certificates of participation Tax allocation bonds Capital leases Loans and notes payable Compensated absences Judgments and claims Net OPEB Obligation Net Pension Obligation
Table 4 City of Berkeley
Outstanding Debt, at Y car-End (In Millions)
Government Business-Type Activities
2009
$ 71.4 $ 64.2 7.6 7.9 $ 4.5 $ 4.8 3.3 3.8
26.8 27.4 6.0 6.7 4.4 0.4 6.8 5.6 4.7 4.4
143 13.9 2.4 2.1 22.1 20.0
0.8 0.3 0.3 0.1 5.5 3.4
Total 2009 2008
$ 71.4 $ 64.2 12.1 12.7 3.3 3.8
26.8 27.4 6.0 6.7 4.4 0.4
11.5 10.0 16.7 16.0 22.1 20.0
1.1 0.4 5.5 3.4
181.0
Standard & Poor's Corporation and Moody's Investors Service assigned the general obligation bonds ratings of AA+I Aa3 upon their issuance.
Additional information on the City's long-tenn debt can be found in note Ill D on pages 84-92 of this report.
ECONOMIC FACTORS AND NEXT YEAR'S BUDGET AND RATES
The City's current economic base consists of approximately 12,000 licensed businesses operating in the City. ·rhese businesses include private manufacturing, technology research, retail and service businesses, along with several state, federal, and non-profit. The City is home to the main campus of the University of California, with over 35,000 students and approximately 14,400 employees. The University provides a high degree of economic stability for the City and has spurred growing high technology and biotechnology sectors. The economic base generates slightly mon: than $4.34 billion in gross business receipts and about $1.42 billion in taxable sales. Taxable property values continue to rise, increasing an average 7.4% annually during the last five years to $11.9 billion in FY 2009. However, job picture worsened in Berkeley according to tht State Economic Development Department, with the City's unemployment rate rising to 10.8% in June 2009 from 5.4'% in June 2008.
The City's two-year budget (2010-11) balances the forecasted two-year General Fund deficit of $5.66 million through a combination of recurring cuts (about 2% of the General fund budget), while managing the City's unfunded liabilities. Several of the underlying budget assumptions are
40

very sensitive t11 economic changes and assume a mild economic recovery in FY 20 I 0. This includes assuming that Property Transfer Tax revenue rebounds from the $8 million level to back up to $10 million a year. The budget also forecasts an increase in the Transient Occupancy Tax (llotcl Tax) based on the reopening of a major hotel; and it assumes stable sales tax and business license tax revenue. The City expects General Fund revenues in FY 2010 to increase by 4% to approximately $147.1 million, from $141.5 million in FY 2009. Expenditures were projected to total $147.7 million for I'Y 2010, down $.7 million !rom tbe $148.4 million in FY 2009. Revenues do not include fund balance, which is used to balance with expenditure appropriations.
REQUESTS FOR INFORMATION
This financial report is designed to provide our citizens, taxpayers, customers, investors, and creditors with a general overview of the City's finances and to show the City's accountability for the money it receives. If you have questions about this report or need additional financial information, contact the City's Finance Department, at the City of Berkeley, 2180 Mil via Street, Third Floor, California 94 704.
41

THIS PAGE LEFT INTENTIONALLY BLANK
42

BASIC FINANCIAL STATEMENTS
43

City of Berkeley Statement of Net Assets
June 30, 2009
Prima!1 Government Comeonent Units Governmental Business· Type Rent Berkeley
Activities Activities Total Stabilization Housing Authority ASSETS Cash and investments $144,885,759 $ 38,314,316 $183,200,075 $ 3,666,150 $ 1,303,395 Receivables (net of allowance for uncollec;tibles) 70,123,272 3,369,693 73,492,965 212,807 Due from Component Unit 247,077 247,077
Due frorn Agency Funds 64,610 64,810 Internal balances. 271,128 (271 ,128) Inventories 16,986 16,986 Property held for resale 458,550 458,550 Deferred costs 1,283,490 1,263,490
Restricted assets: Cash and investments 4,255,485 12,620,752 16,876,237 7,182,519
Capital assets not being depreciated' lond 22,327,797 2,979,050 25,306,847 2,579,621 Construction in progress 6,134,545 6,134,545 41,787
Capital assets r1et of accumulated depreciation: Buildings 71 '156,267 26,372,658 97,528,926 2,544,780 Improvements other than buildings 7,598,626 5,483,445 13,062,071 57,737 Machinery and equipment 11,216,139 1,467,442 12,683,580 56,731 44,833 Infrastructure 80,508,903 120,931 ,275 201,440,178
Net OPF.B assets - Fire 79,313 79,313 Total assets 420,628,148 211,267,503 631,895,650 3,722,881 13,957,479
LIA81LITIFS Accounts payable 5,324,119 2,006,183 7,330,302 61,408 131,387 Accrued salaries and wages 8,163,128 1,926,043 10,089,171 141,082 Advances - Rent Registration 2,776,427
Due to pri~ary government 247,077
Other liabilities 29,530,489 1,388,701 30,919,190 229,464 320,416 Noncurrent liabilities (Note Ill F):
Due within one year 12,877,650 1,453,089 14,330,739 19,678 156,611 Due in more than one year 129,420,215 37,216,039 166,636,253 239,695 1,507,348
Total liabilities 185.315,601 43,990,054 229,305,654 3.467,754 2,362,839
NET ASSETS Invested in cap1tal assets, net of related debt 131,597,270 133,879,724 265,476,993 56,731 3,696,069 Restricted for
Debt service 4,255,485 12,620,752 16,876,237
Other purposes 6,764,380 Unreotricted (deficit) 99,459,793 20,776,974 120,236,766 198,396 1,144,191 Total net assets $235,312,549 $ 167,277,449 $402,589,998 $ 255,127 $ 11,604,640
44 The accompanying notes are an integral part of these financial statements.
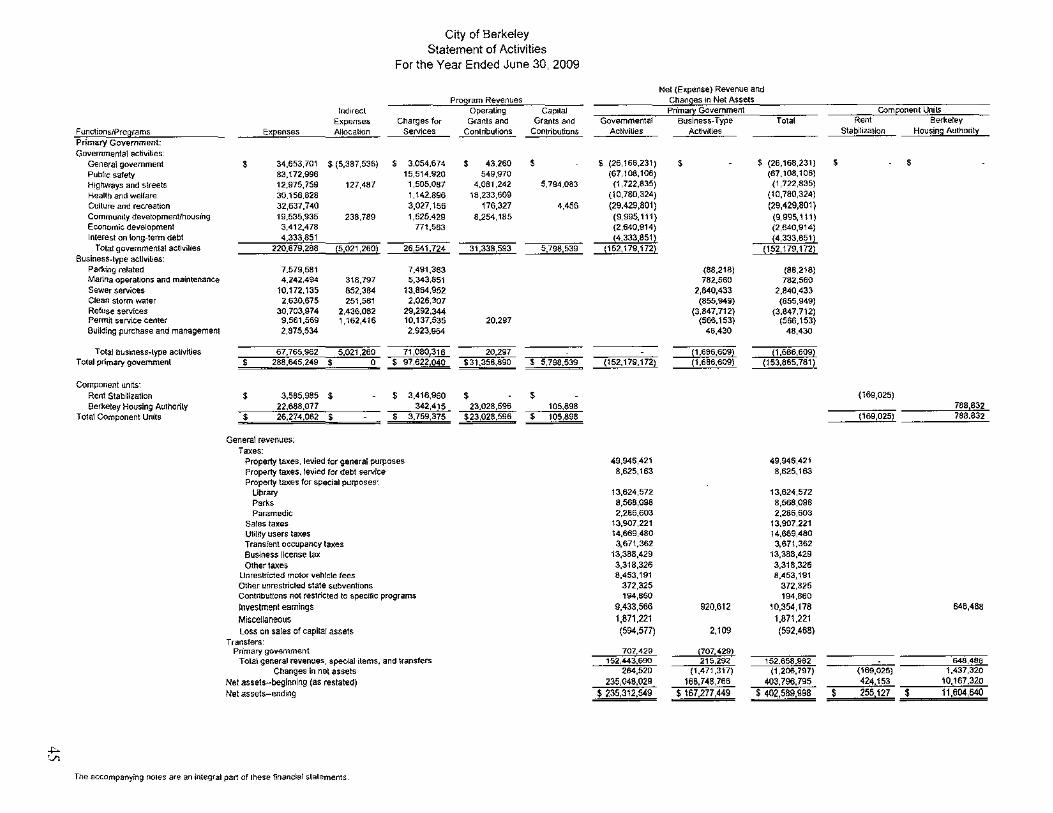
City of Berkeley Statement of Activities
For the Year Ended June 30, 2009
Net (Expense) Revenue and Pr<>;~ram Revenues Chan es 1n Net Assets
tndlfect Operating Caprtal Pn'mary Government Component lklrts Expenses Charges for Grants and Grants and Governmental Busineso-Type Total Renl Berl<.eley
Ex~enses Allocatron Serv1ces ContribuiiOOS Contributions Aclrvi~es Actrvr~es Stabilization Housins Authont~
Governmental act1vitres Generai government ' 34,653,701 $ (5,387,536) ' 3,054,674 ' 43.260 ' ' (2£,166,231) $ $ (26,168,231) ' ' Publtc safety 83,172.996 15,514.920 549,970 (67,108.106) (67,108,106) Highways and streets 12,975,759 127,487 1,505.087 4,08t ,242 5,794.083 (1,722,835) (1,722,835)
Health and welfare 30,156.828 1,142.896 18,233,609 (10,780,324) (10,780,324) Culture and recreation 32,637,740 3,027,156 176,327 4,456 {29.429,801) (29,429,801) Communrly development/housing 19,535,935 238,789 1,525.429 8,254,185 (9,995,111) (9,995,111) Economic development 3,412,478 771,563 (2,640.914) (2,640,914) Interest on long-term debt 4,333,851 !4,333,851) {4,333,851)
Total governmental act1vitoes 220,879,288 !5.021 ,260) 26 541.724 31,338,593 5,798,539 !152,179,172) (152 179.172) Business-type acllvitoes:
Palldng related 7.579,581 7,491,363 (88.218) (88.218) Manna opera~ons and maintenance 4.242,494 318,797 5,343,851 782,550 782,560 Sewer services 10.172.135 852,3!14 13,8&1,952 2,!140,433 2,840,433 Clean storm water 2.630,675 251,561 2.026,307 (855,949) (855,949) Refuse services 30,703,974 2.436.082 29,292.344 (3,847,712) (3.847,712) Permit service center 9,561,569 1,162,416 10,137,535 20.297 (500.153) (566,153) Building purchase and management 2,875,5:>4 2.923,964 46,430 48,430
Total busrness-lype ac~vtties 67,765.S62 5.021,260 p,6B6,609) Total primary government ' 288,645,249 ' 0 ' 5,798,539 (152,179,172) (153.865,781)
Component unrts: Rent Stabililation $ 3.585,985 $ $ 3,416,960 ' ' (169,025) Berkeley Housing Au1horily 342,415
T01al Component Units ' 3,759,375 (169,025)
General revenues: Taxes:
Property taxes, levied for general purposes 49,946,421 49,946,421 Property taxes. levied for debt service 8,625,163 8,625,163 Property taxes for spacial purposes·
Library 13,624,572 13,624,572 Parks 8,568,098 8,568,096 Paramedic 2,286,603 2,286,603
Sales taxes 13,%7,221 13,507,221 Ulilrty users taxes 14,669,480 14,669,480 Transient occupancy taxes 3.671,362 3.671,362 Business license Ia>< 13,388,429 13,368,429 Other taxes 3,318,326 3,316,326
Unrestficted motor vehicle fees 8.453,191 8,453,191 Other unrestricted state subventions 372,325 372,325 Contributions n01 restricted to specffic programs 194,660 194,860 Investment earnings 9.433,566 920.612 10,354,178 646,488
MiscellarteOus 1,671.221 1,671.221 Loss on sales of capital assets (594,577) 2,109 (592.468)
Transfers· Pnmary government F07.429!
Total general revenues, specoal <lems. and transfers 215,292 152.658.982 648,488 Changes in nat assets (1,471,317) (1,206,797) (169,025) 1,437,320
Net assets-beginning (as restated) 166.746,766 403.796.795 424153 10,167,320
Net asse1s-end1ng s 167.277,44g $ 402.589.g98 $ 255127 $ 11.604,640
The accompanying notes are an integral part of these financial >latements

City of Berkeley Fund Balance Sheets Governmental Funds
June 30, 2009
Special Revenue
General Fund Grants Library CDBG
ASSETS Cash and investments in treasury $ 62,156,359 $ 6,267,071 $ 12,867,116 $ Cash and investments with fiscal agent Receivables (net of allowance
where applicable): Accounts 3,085,498 Accrued interest 2,013,751 228,390 Taxes 4,913,871 Special assessments 164,160 Subventions/grants 10.215,986 29,895 Due from other funds 7,155,244 Due from Components Units 247,077 Advance to other funds 72,866 Notes receivable 2,825,135 21,842.838 4,685,130 Other 124,769
Property held for resale
Total assets 82.521,705 38,325,895 13,031,275
LIABILITIES Accounts payable 2,089,909 1,223,057 181.226 8,791 Accrued salaries and wages 5,319,269 702,449 576,618 57,303
Due to other funds 10,198,295 251 Due to Component Units Advance from other funds Deposits held 490,289 Deferred revenue 2,991,872 318,928 18.554 228,390 Other liabilities 1,638,942 132,180 7,640 Tax and revenue anticipation notes 25.000 000
Total liabilities 37,530,282 12,574,908 784,038 294,736
FUND BALANCES Reserved for:
Noncurrent assets Encumbrances 2,765,499 4.461,428 1,127,861 113,223 Due from/ advance to other funds 7,155,244 72,866 Due from Component Units 247,077 Property held for resale Notes receivable 2,825,135 21,842,838 4,685,130 Debt service
Unreserved, reported in: General fund 31,998.467 Special revenue funds Capital projects funds
(553,279) 11,119,376 (149,673)
Total fund balances 44 991.423 25?50,987 12,247,237 4,721 545
Total liabilities and fund balances $ 82,521,705 $ 38,325,895 $ 13,0;Jj.275 $ 5,016 281
46 The eccompanying notes are an integral part of these financial statements.

City of Berkeley Fund Balance Sheets Governmental Funds
June 30, 2009
Sf>ecial Revenue CaRital Projecl Other Total
Capital Governmental Governmental Park Tax I mQrovement Funds Funds
ASSETS Cash and investments in treasury $ 3,279,289 $ 8,563,140 $ 31,946,729 $ 125,079,704 Cash and investments with fiscal agent 4,255,485 4,255,485 Receivables (net of allowance
where applicable): Accounts 914,809 4,000,307 Accrued interest 501,304 380,561 3,124,006 Taxes 118,397 5,032,269 Special assessments 107,489 55,226 326,875 Subventions/grants 504,271 10,750,152 Due from other funds 4,273.983 11,429,228 Due from Components Units 247,077 Advance to other funds 72,866 Notes receivable 7,610.422 9,792,255 46,755,780 Other 124,769
Property held for resale 458 550
Total assets 3,386,778 20,948,849 48.426,280 211,657,066
LIABILITIES Accounts payable 136,276 363.062 520,806 4,523,127 Accrued salaries and wages 329,988 47,876 739,078 7,772,581
Due to other funds 894,743 11,093,290 Due to Component Units Advance from other funds 72,866 72,866 Deposits held 12,933 90,827 594,049 Deferred revenue 9,701 502,303 1,023,743 5,093,492 Other liabilities 445,373 2.224,135 Tax and revenue anticipation notes 25,000 000
Total liabilities 926,174 3,787,437 56,373,539
FUND BALANCES Reserved tor:
Noncurrent assets Encumbrances 449,441 1,407,853 1,558,036 11,883,341 Due from/ advance to other funds 4,273,983 11,502,094 Due from Component Units 247,077
Property held for resale 458,550 458,550 Notes receivable 7,610,422 9,792,255 46,755,780 Debt service 9,723,843 9,723,843
unreserved, reported in: General fund 31,998,467 Special revenue funds 2,461,372 12,394,011 25,271,807 Capital proJects funds 6,730,417 10,712,149 17.442.566
Total fund balances 2 910.813 20,022,675 44,638.844 155,283,524
Total liabilities and fund balances $ 3,386,776 $ 20,948,849 $ 48,426,280 $ 211,657,066
47 rhc a.ctl"lmpanying notes are an integral part of these fmanciaf statements.

City of Berkeley Reconciliation of the Balance Sheet of Governmental Funds
To the Statement of Net Assets June 30, 2009
Fund balances··· total governmental funds (Page 47)
Amounts reported for governmental activities in the Statement of net assets arc different
Capital assets used in governmental activities are not tinancial resources and, not reported in the funds (Note IIA).
Net OPEB assets and Net pension obligation in governmental activities arc not resources and therefore, are not reported in the funds (Note IIA).
Other long-term assets arc not availble to pay for current period expenditures and, therefore, arc deferred in the funds (Note l!A).
$
Internal service funds are used by management to charge the costs of public liability, equipment maintenance, building maintenance, supply warehouse, workers compensation. clcc\rical warehouse and catastrophic loss services to individual funds. The assets and liabilities of the internal services funds are included in governmental activities in the statement of net assets (Note II A).
Long-term liabilities, including bonds payable, are not due and payable in the current period and, therefore, are not reported in the funds (Note IIA).
Net asset< of governmental activities (Page 45)
The accompanying notes arc an integral part of these tlnancial statements.
155,283,524
185,604,624
(6,116,136)
6,376,982
4,813,202
(110,649,647)
48

City of Berkeley Statement of Revenues, Expenditure$,
and Changes in Fund Balanc .. s (Deficit) Governmental Funds
For the fiscal year ended June 30, 2009
Revenues. Taxes Licenses and permits Intergovernmental Charges for SerJice Fines and Penalties Rents and royalties Franchise Private contributions and donations Indirect cost reimbursements trwe$tment income Miscellaneous
Total revenues
Expenditures: Current
General government Public safety Highway and streets HC"alth and welfare Culture~recreation
Communtty development/housing EconomiC development
Debt serv1ce Pnncipal repayment Interest and fiscal charges Cost of Issuance
Total expenditures
Excess{ deficiency) over( under) expenditures
Other financing sources(uses); Transfers 1n Transfers out Issuance of debt
Sales of capital assets
Total other financing sources{ uses}
Net change in fund balances
Fund Balance. July 1, 2008 as restated
Fund Balance, June 30, 2009
General ~·~,.~~~M·~~•~••~•n~~-
$ 97,987,823 342,748
9,050,604 7,214,275
10,553,328 112,868
1,848,246 100,185
5,387,536 8.745,699
953,099 ~~~~~------------------
142,296.411 ---------------------~-
31,563,282 74,981,686
2,203,708 10,290,591 5,951,586 3,661.400 2,200,088
364,623 638,206
30,000 -~~-------------~~
131.885,171 ~-~~--~-~"----------
10,411,240 ··········--~~~-------
3,351,209 (16,590,858)
1,983 ~---~------------~----
(13,237,666) ·----------------------~
(2,826,426)
47,817,849
----~-~-~-·-·-·---·---
$ 44,991,423 ====-=;.::;;,:;;;:;;:;;;;;;;;;;;;;;;;;;;;;
The accompanying notes are an mtegral part of these finMc1a1 stattH'Illf'i!l'lt\1
Special Revenue
Grants Libral'f CDBG ---~--~------------- --~--~~~-•~•••ku-- ••-~••~~~u·~~ww••••
$ $ 13,797,362 $
25,037,777 163.638 2,877,365 133,086 1.006
275,309 195
48.477
22,073 32,967 3,719 22,381 50,464
-~--~~~~~~uu~~u•••~~• M~O~MWM~-MMM~M-~~- --------~-~~-~----
25,215.318 14,369,418 2.881.0S4 ~---·--~-~~UWMMMMMM ••••••••••n-~~---~•• ----------·------~·
35,363 12,758 16,000 706,508
2.308,376 16,952,165
596.552 13,997,438 7,076,177 2,809,889
108,468 2,924
44,702 uuu~~~Mu•~-•~••~••• OM~WWW~Fn~F·--------- --~~~----------·~-
27,677,140 14,166.289 2.825,889 --------~~~-~u~•••••• •••--wo~••••--~---••• --~~u~---------•••-
(2.461,822) 203,129 55,195 ----------~~----~-· ----~------------- -~~-~~~---------~---
4,103,793 (321 ,688)
10,000,000
476 ••~wMMMnw•~~••-•nn ·--------------~----- ··-~----~--~------
3,782,105 10.000,476 •••••u•••-••••~••-••• ----------------------- -~~-~~~~------·-----
1,320,282 10,203,605 55, t95
24,430,704 2,043,632 4,666,350
----------------- ~•••~--~•••n••~nwwww -------------~·--
$ 25,750,987 $ 12,247,237 $ 4,721,545 ;;;;;;;;;;:;;;;;,;;;;;;;;;;;;;:;;;;;;;;;:::;:::::::::::: ::=::=:="""'"'=====::<: ::;:;;;;;;;;;:=:=:::::::::::;:;;;;::;;;;;;
49
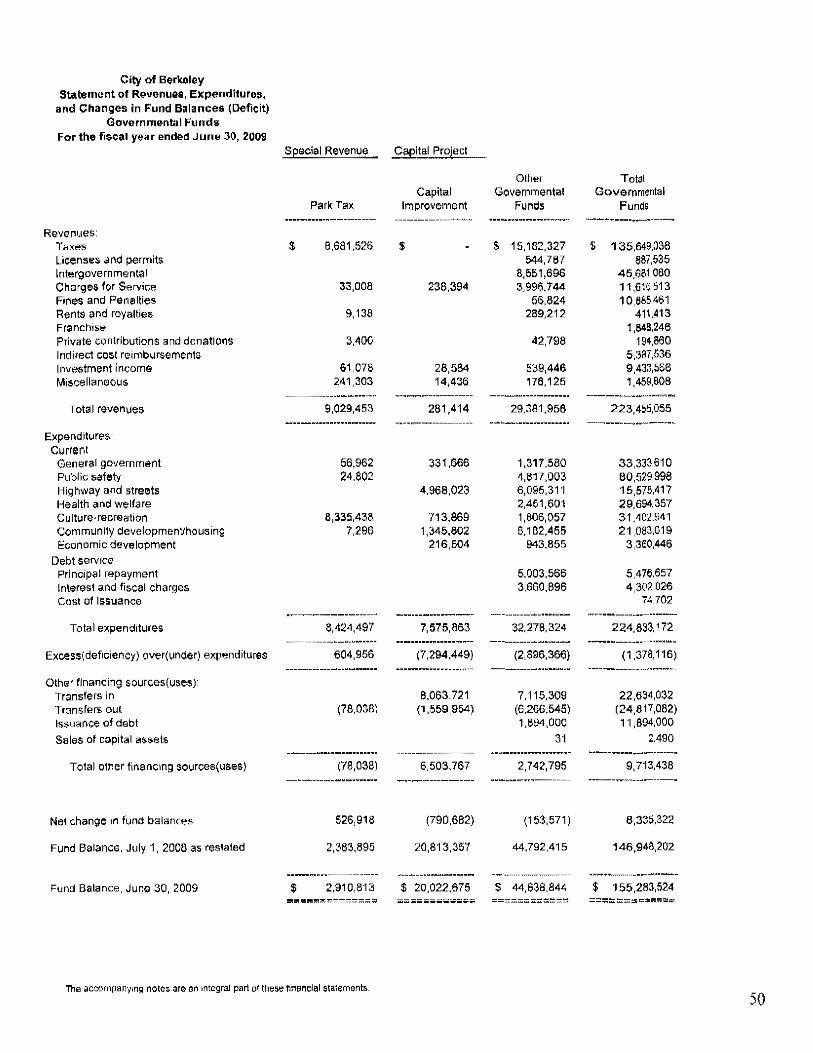
City of Berkeley Statement of ReV'enues, E)(penditures,
and Changes in Fund Balance• (Deficit) Governmental Funds
For the fiscal year ended June 30, 2009
Revenues: Taxes Ucenses and permits Intergovernmental Charges for Service Fines and Penalties Rents and royalties Franchise Private contributions and donations Indirect cost reimbursements Investment income Miscellaneous
Total revenues
Expenditures· Current
General government Public safety Highway and streets Health and welfare Culture-recreation Community development/housing Econo~ic development
Debt serv1ce Principal repayment Interest and fiscal charges Cost of Issuance
Total expenditures
Excess( deficiency) over{under) expenditures
Other financing sources(uses): Transfers in Transfers out lsstJance of debt
Sales of capital assets
Total other financmg sources(uses)
Net change 1n fund balances
Fund Balance, July 1, 2008 as restated
Fund Balance, June 30, 2009
Special Revenue
Park Tax
$ 8,681,526
33,008
9,138
3,400
61,078 241,303
--------------~~~~~~nr~"
9,029,453 *M~n•~~~~~••••••••u~•-
56,962 24,802
8,335,438 7,296
8,424,497 ---------------M·-~--~-~
604,956 -------------•-•~••-••n
(78,038)
--------~-.. -·~ .. ·--~~-(78,038)
•••M•M•••••••~MMMMnMMnM
526,918
2,383,895
2,910,813
The accompanv1ng note:; are a!'\ 1nt12gral part of these Maru::.ial stal~mt;~nts.
Caeital Project
Capital Improvement
$
238,394
28,584 14,436
~-~~~~~---~---------
281,414 -~-•w--•-----------
331,666
4,968,023
713,869 1,345,802
216,504
~~M~-~-~~~-~M~~~-~-
7,575,863 ••~•n••~•••~~ww•~·-·
(7,294.449) wwo•~ww-n••••••~---
8,063,721 (1 ,559,954)
-------------------6,503,767
~--~---------------
(790,682)
20,813,357
$ 20,022,675
Other Governmental
Funds
$ 15,182,327 544,767
8.551,696 3,996,744
56,824 289,212
42,798
539,446 178,125
-~---~~MMMM~MMWMWW~~·
29,381,958 ~~w~~-~••••--••~•••••
1,317,580 4,617,003 6,095,311 2,451,601 1,606,057 6,182,455
943,855
5.003,566 3,660,896
--------------·~--~-·
32,278,324 ---------------~---~~
(2,896,366) -----------~-~MMW-MW
7,115,309 (6,266,545) 1,894,000
31 Mn~wn••n-wnwwwww•
2,742,795 ---~-----~-~-~-----
(153,571)
44,792,415
$ 44,638,844
Total Governmental
Funds
$ 135,649,038 887,535
45,681,080 11 ,616,513 1 0,885,461
411,413 1,848.246
194,860 5,387,536 9,433,566 1,459,808
-··--w~•~~~-··•••~~~•"'
223,455,055 ~-~•••~---~---r~~
33,333,610 80,529,998 15,575,417 29,694,357 31 ,402,941 21,083,019
3,360,446
5,476.657 4,302,026
74,702 ~-~~~~--------··~-~---
224,833,172 ~--~----~·--··--~~-
(1,378,116) ---~-------~----·-~---
22,634,032 (24,817,082) 11,894,000
2,490 ··-----------·--------
9,713.436 •~u----~~~~--~-~--~
8,335,322
146,948,202
$ 155,283,524
50
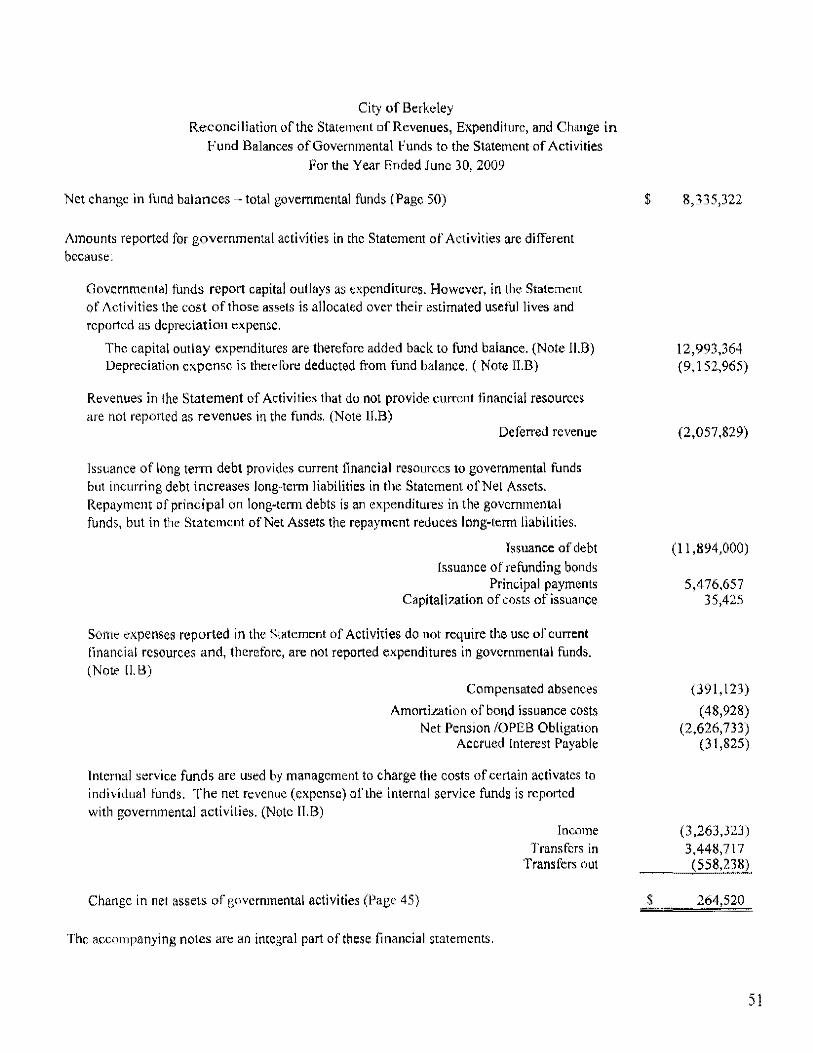
City of Berkeley Reconciliation of the Statement of Revenues, Expenditure, and Change in
Fund Balances of Governmental Funds to the Statement of Activities For the Year Ended June 30, 2009
Net change in hmd balances- total governmental funds (Page 50)
Amounts reported for governmental activities in the Statement of Activities are different because:
Ciovcrnmental funds report capital outlays as expenditures. However, in the Statement of Activities the cost of those assets is allocated over their estimated useful lives and reported as depreciation expense.
The capital outlay expenditures are therefore added back to fund balance. (Note ll.B) Depreciation expense is therefor~ deducted from fund balance. (Note II.B)
Revenues in the Statement of Activities that do not provide current tinancial resources are not rep011ed as revenues in the funds. (Note ll.B)
Deferred revenue
Issuance of long term debt provides current financial resources to governmental funds but incurring debt increases long"term liabilities in the Statement uCNet Assets. Repayment of principal on long-ten11 debts is an expenditures in the governmental funds, but in the Statement of Net Assets the repayment reduces long-tenn liabilities.
hsuance of debt Issuance of refunding bonds
Principal payments Capitalization of costs of issuance
Some expenses reported in the Statement of Activities do not require the usc of current linaneial resources and, therefore, are not reported expenditures in governmental funds. (Note II. B)
Compensated absences
Amortization of bond issuance costs Net Pension /QPEB Obligation
Accrued Interest Payable
Internal service funds are used by management to charge the costs of certain activates to individual funds. The net revenue (expense) orthe internal service tunds is reported with governmental activities. (Note li.B)
Change in net assets of governmental activities (Page 45)
'T'hc accompanying notes are an integral part of these financial statements.
Income Transfers in
Transfers out
$
$
8,335,322
12,993,364 (9, I 52,965)
(2,057,829)
(II ,894,000)
5,476,657 35,425
(391,123)
(48,928) (2,626,733)
(31 ,825)
(3,263,323) 3,448,717 (558,238)
264,520
51
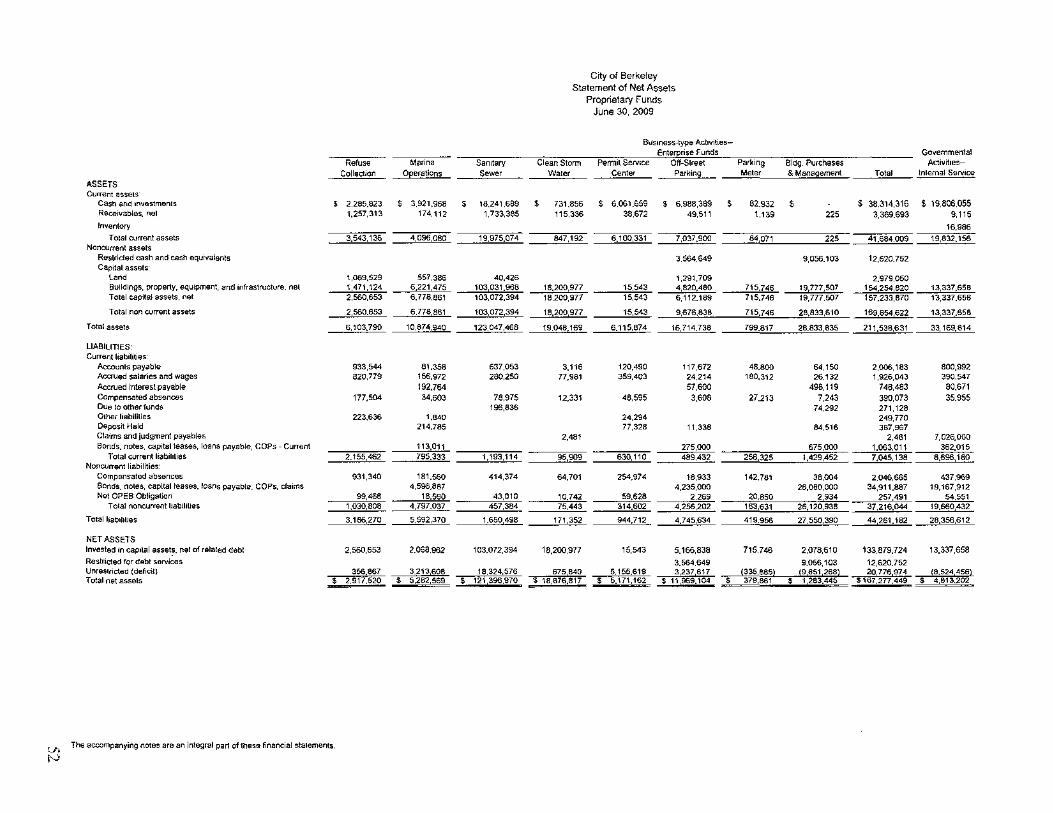
City of Berkeley Statement of Net Assets
Proprietary funds June 30, 2009
Busoness-lype Ac:toV1!Les-Ente nse Funds Governmental
Refuse Manna Sanotary Clean Storm Permot Servoce Off-Street Parloong Bldg Purchases Actovotoes--
Collactoon O~erations Sewer Waler Center Parkon9 Meter & Manasement Total lnlernal Servoce
ASSETS Current assets
Cash anO onvestmenis ' 2.285.823 ' 3,921,968 ' t8.241,669 ' 731.856 $ 6,061.659 $ 6,988,369 ' 62.932 $ $ 38.314,316 $ 19.806.055 Receivables. net 1.257,313 t74.112 1.733,385 115,336 38.672 49,5tt t,139 "' 3,369.693 9,1t5
Inventory 16,986 Total current assets 3.5<13,136 4,096,080 t9,975.074 847,192 6.100,331 7,037,900 84 07t "' 41 684,009 19,832,156
Noncurrent assets Restricled cash and cash equivalents 3,564,649 9,056.103 12,620.752 Capaal assets
land 1,069,529 557.386 40,426 1,291,709 2.979,050 BuiiOings, property, equipment. and onfrastructure. ""' 1.471.124 6,221,475 103031.96a 15,543 4,820,480 715.746 19777,507 Total capotal assets. net 2,560,653 6.778.861 103,072,394 15,543 6,112.189 715.746 19,777,507
Total non current as.ets 2,560.653 6.778 861 103,072,394 15,5<13 9,676.838 715.746 28,833,610
Total assets 6,103,79{) 10,874940 123,047,468 19,048 169 6.115,874 16,714.738 799.817 28.833,835 211.538,631 33,169,814
liABiliTIES· Current haboloties
Accounts payable 933,544 81.358 637,053 3.116 120,490 117,672 48.80{) 64,150 2,006,183 800,992 Accrued salanes and wages 820,779 156,972 280,250 77,981 359,403 24.214 180,312 26,132 1,926,043 390,547 Accrued interest payable 192.764 57,600 498,119 748,483 80,671 Compensated absences 177.504 34,603 78,975 12,331 48,595 3,608 27.213 7,243 3W,073 35.955 Due to other funds 196,836 74,292 271,128 Olhsr liabilities 223.638 1,840 24,294 249,770 Deposit Hsld 214,711S 77,328 11,338 84,516 387,967 Claoms and judgment payable• 2,481 2.481 7,026,0()0 Bonds. notes. capilalleasas. loans payable, COPs- Current 275,000 675,000 1.063,011 362,015
Total current habollt1as 2.155,462 1,193,114 95.909 630,110 489.432 256.325 1,429,452 7.045,138 8,696 180 Noncurrsnt l1ablillies·
Compensated absences 931,340 181.560 414,374 64.701 254.974 18,933 142.781 38,004 2,046,665 437,969 BoMs. notes, capital leases. loans payable. COPs, <:laoms 4,596,887 4.235,000 26.080,000 34,911.887 19,167,912 Net OPEB Obligation 99,468 18.560 43,010 257,491 54,551
Total noncurrentloaboloties 1.030,808 4,797.037 457,384 37,216.044 19.660432
Total habohiJes 3.186,270 5,592,370 1.650498 44 261.182 28,356,612
NET ASSETS Invested on capotal assets. nel of relaled debt 2,560,653 2.068.962 103.072,394 18,200.977 15,543 5.166,838 715.746 2,078,610 133,879.724 13,337,658
Reslncted for debt services 3.564,649 9.056,103 12,620.752 Unresor~cted (def1cil) 356 867 18,324,576 675 840 5,155.619 3,237 617 (336.885) !\l651 266) 20,776974 !8.524 456) Total nat assets ' 2.917,520 ' 121 396,970 • 16,876,817 $ 5.171,162 ' 11 969.104 ' 379,861 ' 1 263.445 $167,277.449 ' 4,813.202
T~e accompanying notes are an integral pa~ of these financ1al stalements.

City of Berlleley Statement of Revenues, Expenses, and Changes in Net Assets
Proprietary Funds For the Year Ended June 30, 2009
8usinesS·!ype ACliOIIIeS-Eote lise Funds
Refuse Manna San1tary Clean Stonn Permit Sefllice Off-Street Parking ~dg_ Purchases Governmental Activities Collection 0Eerations Sewer Water Center Parlong Meter & Management Total lotemal Sefllice Funds
Opera~ng revenues: Park.ng related revenues ' ' ' ' ' ' 2,723.111 ' 4,768,252 • ' 7.491,363 ' Manna operabons and maintenance 5343,851 5,343.851 Sewer sefllice fees 13,864,952 13,864,952 Clean stonn water fees 2.026.307 2.026,307 Refuse Sefllice fees 29.292.344 29.292,344 Building penn1ts 3,943,245 3,943,245 0111erperm1ts 2,174.471 2,174,471 Plan checl<1ng fees 2,138,513 2,138,513 Otherfeas 1,881,306 1,881,300 Contract 2.923,964 2,923.964 Equipment rentals Sefllice charge 9,747,859 Build1ng maintenance 3.491,301 Central store sefllice charge 970.460 Worl<ers' compensation fees 7,691.239 Other revenues 1.834,417
Total opera~ng revenues 29.292.344 5,343,851 13.864,952 2,026,307 10.137,535 2.723.111 4,768,252 2.923.964 71,080.316 23.735 276
Operating expenses: Personnel sef\llces 9,777,319 1,645,946 3.714,637 987.007 5,074,171 227,594 2.199.829 295.429 24,121,932 6,678.227 Employee benefits 6,101.642 1,067,509 2,282,958 638,261 2.644,728 120.124 1,453,162 162,010 14.490,394 3,103.181 Specialized and professional seflllces 8,647,667 236,974 1,108,261 39,748 727,979 1.061,361 310,783 90.157 12,242.930 1,613,984 Repairs and maintenance 63,373 26,945 37,193 23,138 42,861 10,888 53,426 257.824 871.908 Materials, supplies 1,177.325 130,000 565,989 251,517 997,570 682,153 379,047 194,017 4,357,618 3,026,917 Communica1ion 16,233 11.891 19,395 19,479 6,994 5,883 3,227 83,102 2,966 Uijl1ties 453.003 370,510 12.890 140,114 "' 257,743 1,234.618 69,712 Transportaban 4,351.215 98,868 256,672 157.312 60.473 360,006 "' 5.285.015 37,112 General adminis1ration 2.429.579 301,635 845.012 251,584 1 '162.421 4,990.231 Depreeiabon 120,062 232.S36 2,181,512 556,827 14,026 190.412 204,057 589,168 4,089,000 1,564,884 Judgments and claims 8,462,747 Insurance 2,638 20,839 " 23.520 969,894
T oral operating expenses 33.140,056 4,364.053 11.024.519 2.882.256 10,723,985 2.471.613 4,924,013 1,645,689 71.176,184 26,401.532
Opera~ng 1ncome (loss) (3.847,712) 979.798 2.840,433 !855,949) (586,450) 251.498 !155,761) 1,278,275 !95,866) ~2.666,256)
Nonoperaljng revenues (ex...,nse•J. Investment eammgs 82,728 110.466 587,321 18,700 18.164 103,233 920,612
Interest expense (197,238) (183.955) (1.229,846) (1,611,039) Operating grants 20,297 20.297 Gaio(loss) on d1sposal of capital assets '~ '" 1,436 2.109 ~597.067)
Total nonoperating revenue (expenses) 82.931 (86,772) 587,791 18.700 21,733 (165,791) (1,1:ZS.613) (666.021) (597.067} Net Income (loss) beforecontribu~ans
and transfers (3,764,761) 893,026 3.428,224 (837,249) {564,717) 85,707 (155,761) 151,662 (763,889) (3,263,323)
Transfers 10 113,291 113,291 3,448,717
Transfers out (110.870) (171,270) (25,085) !7.920) (408.650) (26.480) (820,720) (558.238) Change in net assets (3.875,651) 3,256,954 {749,043) 77,787 (584.411) 125,182 (1,471.318) (372,844)
Tolal net assets-beginning as res1ated 6.793,171 118,140.016 19625.860 11,891.317 944.271 1,158,264 168,748,766 Total net assets-ending ' 2,917,520 • $121,396970 $18,876.817 • S 1U69.104 ' 379.861 • 1.283,445 $ 167,277.449
The accompanying notes are an integral part of these ftnane~al statements.

CITY OF BERKELEY Slalemenl of CasM Flaws
Pmpnelary Funds For the year ended June 30. 2009
CasM flows from operatong aclovoloas CasM receoved from customers Cas~ paod for goods aruJ se-voces Cas~ o.aod for employees' servoces Oapasols receoveo fro"n customers Claims and Judgments Paod Refu/1ds
Net cash proVIded (used) by operating actovol1es
Cash flows from non cepllalflnanclng actovot1es Transfers in Transfers out Grants rece•ved
lntertund repayments
lnlertund advance
Net cash prov>ded by (use<! in) non cepotal fonatlCif\Q act,.i(les
Cash fiows from c:apotal and related financong acloV~t<es· Interest paid Purc:llases Of cepolal assets Pm""'<'ds from loans Deb! repayment
Proceeds from sale of capital assets
Net cash provoded by (used on) capital and related financir~g act1vo11es
Cash flows from inveslin9 actwilles Interest rece,vM
Netoncrease (decrease) in cash and cash equivalents
Cash and cash equovalenls, July 1, 2008 (Restated)
Casll and cesh equovalents, June 30. 2009
Refuse CollectionS
$ 29,307,788 (17.765,680) (15574,554)
57.723
---··-·--· (3,975.723)
----·--·
(110.870)
-------(110,870)
··-------
(4,661)
'" ---··---
(4,478)
82,728
(4.008,343)
6,2S4,167
$ 2.285,823
Manna Operations
s 5.377,784 (1.677,808) {2.840,313)
19.225
·-------878,888
--··-·-·--
(33.204)
----·-·-(33,204)
-------
(197,238) (259.247) 3S6,273
(108,143)
(178,355)
110,466
777.795
3,144,173
$ 3,921.968
Samtary Sewer
$ 14,047,027 (2.571 ,OB8) (5.867 339)
5,608,600 --------
(171.270)
116.359
(54.911) ··----·--
(2.572,930)
1.007
(2,571.923)
587.321
3.569.087
14,672.602
$ 18.241.889
Clean StO<m Wale!
$ 2,348,086 (709.270)
p 630 22~)
8.592
(25,085)
(25,085)
(261,415)
BuSiness-Type Att1v111eS Entemnse Funds
Permo( Servo<:e Center
$ 10 159.188 (7.228,160) (3,343.443)
(411.800)
(37,241) 35,571
(1.670)
(9.237)
1,436
0~-Stree:
Parlung
$ 2.739,284 (2,018.749)
(329 092)
391,423
(7,920)
(7.920)
(183.955)
(127.360)
(270,000)
--·--·----- ----·-- ----·-·
1261.415) (7,601)
18.700 18,164
(259,208) (421.280) (179,848)
991,064 6,482,939 10,732,685
' 731,856 $ 6,061.659 $ 10,553,038
$4.767.113 (1_058,154) (3.569,610)
139,149
(406.650)
(406,650)
(638,961)
'" -----
(908.452)
991,383
Bldg Purct>ases & Management
$ 2.924.447 (655.268) (416,716)
1,852,463
(26,480)
(23.436)
(49,916)
(1,229,846)
(655,000)
------(1 ,884,846)
103,23-3
20,934
9,035,169
• 82.932 $ 9.056,103
===~~------- =====~----- ----========= -------======= --------===== ------------ ====-------- ======------
The accompanymg notes are an Integral pa~ of these financial statements_
Total
' 71.670,697 (33,685.177) (33,571 491)
76S48
606 ---------
4,491.663
(820.720) 35,571
(23,436)
116,359
(692,226)
1381,193)
(5,103.677) 386.273
(1,033.143)
2,656 ------·-
16.129,08~)
920,612
(1,409.115)
52,344.182
$ 50,935.006
Govemme>"ltal Act1VU1as Internal Servo<:e Funds
' 24.319,73.5 (9,709,535) {7 695_ 175)
15.972,639)
-------942.387
3,448,717 (558,238)
2.890,479
(4,149,697)
526.260 ----·----
(3,621 .~37)
211,429
19,594,626
' 19,806,055

CITY OF BERKELEY Statement of Cast> Flows
Propnetary Funds F<>< ll"le year ended June 30, 2009
Reconcohallon of operalong oncome (loss) to net operating cash
Income (toss)lrom operatoons
AdJUStments to reconcole income (loss) from operatoons to net cash pro.odad (used) by operating activotoes·
Oeprecoatoon Accruals Change on
Accounts '"""'"able lnventones Accounts payable Accrued salanes Compensalad absences Net OPEB Oblogat1on Other IJabolotoesldeferred revenue
Net cash provoded (usa<!) by operating actovitoes
Refuse Collectoons
--~------
$ 13.847,712)
120,062
9,512
(619,715) 93,354
144,165 00.-57,723
·--~---
$ (3,975.723) ======~~·~M:
Manna Operahons
-~----·--
$ 979.797
232,936
(2,496)
(24,649) 36,091 43,676 12,531
(400,998) ------
$ 878,888
===========
Th~ accompanyong notes are an Integral part of ll1ese IJnancial stalsrnents_
sa~otary
Sewer ········-------
$ 2.640.433
2.181,512
154,560
:>Ol,a35 18,064 85,079 27.114
··-·-·---$ 5,608.6(){)
=============
Clean Storm Water
--·-·····-·-·-
$ (855,949)
556.827
321,778
(9,108) 19,549
(32.466) 7.961
Busoness-Type Actovohes
Enter se Fu.~ds
Permot Servoce orr-Street Center Parl<ong
------ ------··-··--·
$ (586.450) $ 251,496
14,026 190.412
33.191 119,300
38.829 (140,690) 40,225 9,578 11.375 7,340 38.737 1,725 (1.740) (47,741)
- ·----- ------
$ 8,592 $ (411.809) $ 391,423 ============== ============= ============
PM<~ng Bldg Purchases Meter & Management
----~--- ··-·-·------
$ (155.761) $ 1,278,275
204,057 589.168
(1.139) '"' 8,811 (56.186)
39,395 11.814 29,616 26.769 14,170 2.140
------· -----·
' 139,149 $ 1,652.463 ===-== .. ==== ============
Total
(95,868)
4,089,000
635.189
(500.873) 270,070 315.554 171,266
(392,756)
Governmental ActoVIIJes Internal Servoce Funds
' (2,666,255)
1.564,884
14,450 20.707
(411,261) 46,890
2,347,356 (5,538) 31,174
-·-·--- -------------$ 4,491,583 $ 942,387
============ ==========·=======

CITY OF BERKELEY Statement of Fiduciary Net Assets
Fiduciary Funds June 30, 2009
Assets Cash and cash equivalents Restricted cash Investments, at fair value
Guranteed Investment Contract Government Sponsored Enterprises Local Agency Loans
Corporate notes Taxes Receivable Interest Receivable Other Accounts Receivable Total assets
Liabilities Agency obligations Pension benefits payable Due to other funds Total liabilities
Net Assets Held 1n trust for pension benefits Held rn trust for OPEB benefits
Total net assets
Pension and Other Post-employment
Benefit Trust Funds
~~~~~~~~M~MM~~~~~~~M-~W-
$ 3,893,562 3,042,685
3,947,425 154,979 533,000
7,743,784
359,567
19,675,002
45,220
45,220
8,197,730 11,432,052
$ 19,629,782
The accompanying notes are an integral part of these financial statements,
Agency Funds ~~-F~----~~------------
$ 3,258,556
51,661
64,810 $ 3,375 027
3,310,217
64 810 $ 3,375,027
56

CITY OF BERKELEY Statement of Changes in Fiduciary Net Assets
Fiduciary Funds For the year ended June 30, 2009
ADDITIONS;
Contributions: Employer Investment income
Total Additions
DEDUCTIONS:
Benefits: Service Disability
Administrative Expenses Total Deductions
Change in net assets
Net Assets • beginning
Net Assets- ending
Pension and Other Post-employment
Benefit Trust Funds
~~~W~MW~M~-~~-~~~~~ff~--
$ 3,994,739 1,798,060 0,792,799
2,807,384 506,183 82,380
3,395,947
2,396,852
17,232,930
$ 19,629,782
The accompanying notes are an integral part of these financial statements.
57

CITY OF BERKELEY
Notes to the Basic Financial Statements
June 30, 2009
I) Summary of Significant Accounting Policies
A. Description oftlte Reporting Entity
The City of Berkeley (the City) is a municipal corporation created under the laws of the State of California, The City operates under its own charter. The current charter provides for a Council-Manager form of government and the City is governed by an elected mayor and eight-member counciL The City provides the following services; public safety (police and fire); sanitation and sewer; housing; leisure (parks, recreation, and marina); health and human services, including City funded health clinics; animal control; public improvements; planning and zoning; library services; and general and administrative services.
As required by generally accepted accounting principles, these financial statements present the City of Berkeley and its component units, entities for which the City is considered to be financially accountable. Blended component units, although legally separate entities, are, in substance, part of the City's operations. The City is considered to be financially accountable for an organization if the City appoints a voting majority of that organization or there is a potential for that organization to provide specific financial benefits to or impose specific financial burdens on the City. The City is also considered to be financially accountable for an organization if that organization is fiscally dependent (i.e., it is unable to adopt its budget, levy taxes, set rates or charges, or issue bonded debt without approval from the City). In certain cases, other organi~..atians are included as component units if the nature and significance of their relationship with the City are such that their exclusion would cause the City's financial statements to be misleading or incomplete. Each discretely presented C\Jmponent unit is reported in a separate column in the government-wide financial statements (see note below for description) to emphasize that it is legally separate li·om the City.
Blended Component Units. The Redevelopment Agency (BRA) serves all the citizens of the City and is governed by a board comprised of the City of B¢rkeley's elected council. Budgeting, acc<Junting and administrative functions arc pcrforn1ed by the City. The BRA is a duly and validly existing redevelopment agency under the Community Development Law (Part l of Division 24, sections 3300 et seq) of the Health and Safety Code of the State of California. The BRA has two active project areas: West Berkeley and Savo Island. Tho BRA is reflected as a Capitall'roject and Debt Service funds.
Discretely Presented Component Units. The Rent Stabilization Board (Rent Board) is responsible for the proper administration of programs to regulate residential rents; protecting tenants from unwarranted rent increases and arbitrary, discriminatory or retaliation evictions; helping maintain the diversity of the Berkeley community; and to ensure compliance with legal obligations relating to the rental of housing. The nine member Board of Commissioners is elected by the citizens. However, the Rent Board is fiscally dependent upon the City because the City Council must approve its annual budgets and authorize any bonded debt.
The Berkeley Housing Authority (BHA) was established to administer rental assistance programs with the objective of providing affordable, decent, safe, and sanitary housing for low-income residents ofthe City. 58

(I) Summary of Significant Accounting Policies (Continued)
The Berkeley Housing Authority (fll-IA) is a Public Housing Agency as defined in Section 8 of the United States Housing Act of 1937, and a public body corporate and politic established pursuant to the California Housing Authorities Law, Health and Safety code Section 34200 et seq. It was organized in 2007 under the laws of the State of California and was established to administer rental assistance programs with the objective of providing atl'ordable, decent, safe, and sanitary housing for low-income residents of the City. The flHA has a 7-member Board of Commissioners appointed by the Mayor of the City. Although the Bl-IA is a legally distinct entity operating within the geographical jurisdiction of the City of Berkeley, it has been determined that the 131-lA's tlnancial statements would be presented as a discrete component unit of the City's financial statements in response to the oversight change and the signillcant llnancial assistance provided by the City to the BHA. On June 12, 2007, the City Council adopted Resolution Number 63,714-N.S. authorizing the City Manager to enter into a contract with BHA to provide for a subsidy subject to the Council's future approval of the portion of the subsidy allocated in the budget for FY 2009. The City's F'Y 2010 budget includes a General Fund operating subsidy in the amount of $300,000 for the BHA. The subsidy will be revocable in the event of BHA's default in the agreement with the City. i\s a condition of providing the subsidy, the City will impose requirements to ensure that BHA is continuing to meet its federal obligations and that the new Board is functioning properly. In addition, because BHA operations are not self-supporting, the City agreed to continue to provide som•• of the ongoing support services to BHA, including human resources, payroll, information technology and llnance. The term of this agreement is one year from the date of the execution of the agreoment by both parties.
Complete financial statements for each of the individual component units may be obtained at the entity's administrative ofllces:
Rent Stabilization Board 2125 Milvia Street Berkeley, California
Berkeley Redevelopment Agency 2118 Milvia Street Berkeley, Califomia
Berkeley Housing Authority 1901 Fairview Street Berkeley, California
B. Government-wide Financial Statements
The government-wide fmancial statements (i.e., the statement of net assets and the statement of activities) report information on all of the non-fiduciary activities of the primary government and its component w1its. For the most part, the effect of intcrfund activity has been removed from these statements except in thC' case of interfund services provided and used, which arc not eliminated in the consolidation process. Governmental aclivities, which normally are supported by taxes and intergovernmental revenues, arc reported separately from btm'ness-type activities, which rely to a significant extent on fees and charges for support. Likewise, the primary governmenl is reported separately from certain legally separate component units for which the primary government is financially accountable.
The statement of activities demonstrates the degree to which the direct expenses of a given function arc offset by program revenues, Direct expenses are those that are clearly identifiable with a specific function. Proxram revenues include 1) charges to customers or applicants who purchase, use, or directly
59
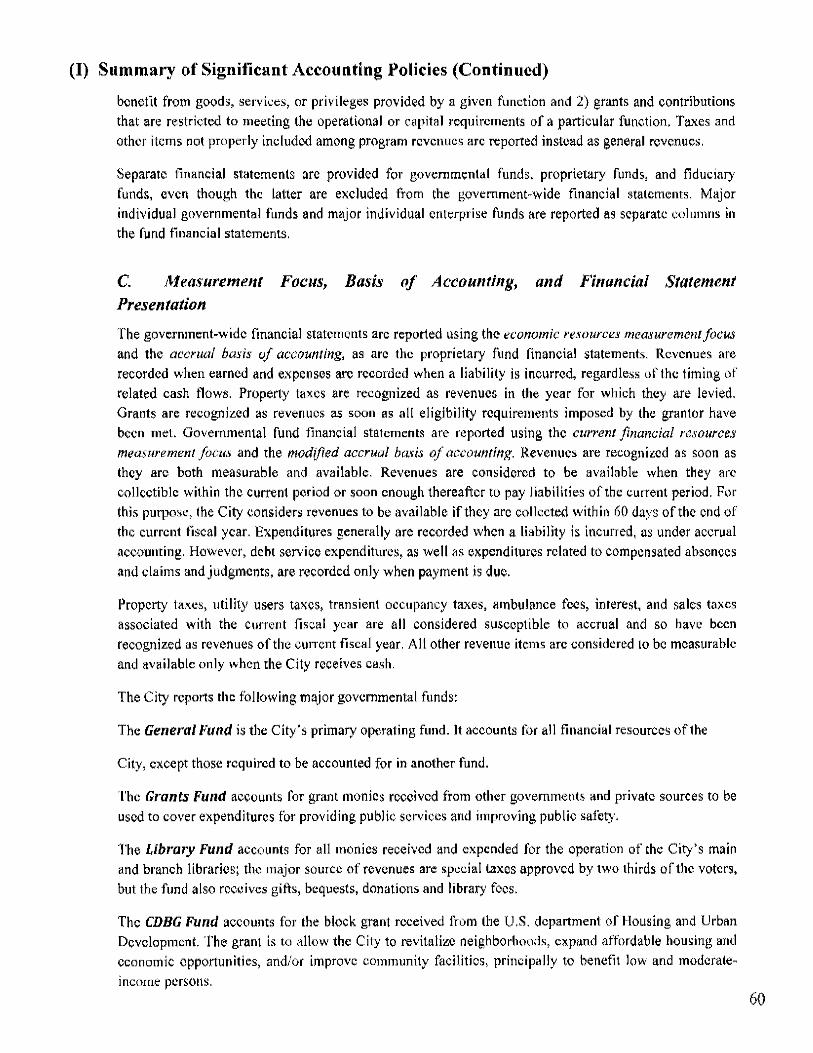
(I) Summary of Significant Accounting Policies (Continued)
benefit from goods, services, or privileges provided by a given function and 2) grants and contributions that are restricted to meeting the operational or capital requirements of a particular function, Taxes and other items not properly included among program revenues arc reported instead as general revenues.
Separate financial statements arc provided for governmental funds, proprietary funds, and fiduciary funds, even though the latter are excluded from the government-wide financial statements. Major individual governmental funds and major individual enterprise funds are reported as separate columns in the fund financial statements.
C. Measurement Focus, Basis of Accounting, and Financial Statement Presentation
The government-wide financial statements arc reported using the economic resources measurement focus and the accrual basis of accounting, as arc the proprietary fund financial statements. Revenues are recorded when earned and expenses a•·c recorded when a liability is incurred, regardless of the timing of related cash flows. Property taxes arc recognized as revenues in the year for which they are levied. Grants are recognized as revenues as soon as all eligibility requirements imposed by the grantor have been meL Governmental fund financial statements are reported using the current financial resources measurement focus and the modified accrual basis of accounting. Revenues are recognized as soon as they arc both measurable and available. Revenues are considered to be available when they arc collectible within the current period or soon enough thereafter to pay liabilities of the current period. For this purpose, the City considers revenues to be available if they arc collected within 60 days of the end of the current fiscal year. Expenditures generally nre recorded when a liability is incurred, as under accrual accounting. However, debt service expenditures, as well as expenditures related to compensated absences and claims and judgments, are recorded only when payment is due.
Property taxes, utility users taxes, transient occupancy taxes, ambulance fees, interest, and sales taxes associated with the current fiscal year are all considered susceptible to accrual and so have been recognized as revenues of the current fiscal year. All other revenue items arc considered to be measurable and available only when the City receives cash.
The City reports the following major governmental funds:
The Geneml Fund is the City's primary operating fund. It accounts for all financial resources of the
City, except those required to be accounted for in another fund.
The Grants Fund accounts for grant monies received from other governments and private sources to be used to cover expenditures for providing public services and improving public safety.
The Library Fund accounts for all monies received and expended for the operation of the City's main and branch libraries; the major source of revenues are special taxes approved by two thirds of the voters, but the fund also receives gifts, bequests, donations and library fees.
The CDBG Fund accounts for the block grant received from the U.S. department of Housing and Urban Development. The grant is to allow the City to revitalize neighborhoods, expand affordable housing and economic opportunities, and/or improve community facilities, principally to benefit low and moderateincome persons.
60

(I) Summary of Significant Accounting Policies (Continued)
The Park Tax Fund is used to account for the receipt and expenditure of the special tax approved by two
thirds of the voters on May 6, 1997 and re-authorized in November 2000 and November 2008. It is used
for the direct cost of acquisition and maintenance of improvements related to parks and landscape in the
City.
The Capita/Improvement Fund accounts for expenditures for land, buildings, major reconstruction
and renovation of structures, and for major landscaping or park improvements financed by local
revenues.
The government reports the following major proprietary funds:
The Refuse Collection/Disposal Fund accounts for the monies received and expended from refuse
collection services, including the surcharge to provide for expenses incurred in the collection and
disposal of solid waste materials as well as for plans, surveys, engineering expenses, property acquisition
and construction costs of facilities for future refuse disposal.
The Marina Operations Fund accounts for the day-to-day operations of the Berkeley Marina.
The Sanitary Sewer Fund accounts for the collection of revenues from sanitary sewer charges, and the
expenses related to the operation, maintenance, replacement, reconstruction, and repair of sanitary
facilities.
The Off Street Parking Fund accounts for the operations of the City's Center Street garage, Sather Gate
garage, Sather Gate Mall leases, and Oxford/Fulton parking lot.
The Building Purchases & Management Fund accounts for the purchase and management of the
building at 1947 Center Street.
The Clean Storm Water Fund accounts for the fees collected to improve the quality of stonn water discharged from the City's stonn drainage system.
The Permit Service Center Fund accounts for revenues from customers processing development penn it
application (i.e., building and zoning pennits) and the funds expended to operate the pennit review
functions of the Penn it Service Center.
The Parking Meter Fund accounts for the collection of coins from the City's parking meters and for the
purchasing, leasing, installing, repairing, maintaining, operating, removing, and policing of the meters.
Additionally, the City reports the following fund types:
Internal Service Funds account for equipment maintenance, building maintenance and replacement,
supply warehouse, electrical warehouse, computer replacement, workers' compensation, sick and
vacation payoffs, public liability, and catastrophic loss services to other departments ofthe City on a cost
reimbursement basis.
The Pension Trust Funds accounts for the activities of the Safety Members Pension Fund, Police
Retirement and Pension Annuity Fund, which provides pension benefits on a pay-as-you-go basis for fire
and police employees hired on or before February 28, 1973; and the Police Retirement Income Benefit
Plan.
61

(I) Summary of Significant Accounting Policies (Continued)
The Medical Trust Funds account for the Retiree Medical Benefit Trust and Fire Medical Trust funds and allocated sources to provide medical benefits for retirees.
The Agency Funds account for the Community Facilities District No. I Disaster Fire Protection special assessment tax monies, the Thousand Oaks Heights Applicant Funded Utility Undergrounding special assessment tax monies, District 47 Underground/Miller, Sick Leave Entitlement, and Measure H School Tax.
Private-sector standards of accounting and financial reporting issued prior to December 1, 1989 generally are followed in both the government-wide and proprietary fund financial statements to the extent that those standards do not conflict with or contradict guidance of the Governmental Accounting Standards Board. Governments also have the option of following subsequent private sector guidance for their business-type activities and enterprise funds, subject to this same limitation. The City has elected not to follow subsequent private-sector guidance.
The effect of interfund activity has been eliminated from the government-wide financial statements.
Amounts reported as program revenues include I) charges to customers or applicants for goods, services, or privileges provided, 2) operating grants and contributions, and 3) capital grants and contributions,
including special assessments. General revenues include all taxes.
Proprietary funds distinguish operating revenues and expenses from nonoperating items. Operating revenues and expenses generally result from providing services and producing and delivering goods in connection with a proprietary fund's principal ongoing operations. The principal operating revenues for all the enterprise funds and internal service funds are charges to customers for sales and services. Operating expenses for enterprise funds and internal service funds include personnel services, employee benefits, repairs and maintenance, professional services, transportation, materials and supplies, claims and judgments, rent, insurance, utilities, communications, general administration and depreciation on
capital assets. All revenues and expenses not meeting this definition are reported as non-operating revenues and expenses.
When both restricted and unrestricted resources are available for use, it is the City's policy to use restricted resources first, and then unrestricted resources as they are needed.
D. Implementation of Accounting Principles
During fiscal year 2009, the City adopted the following GASB Statement:
ln November 2006, OASB issued Statement No. 49, Accounting and Financial Reporting for Pollution Remediation Obligations, which addresses accounting and financial reporting standards for pollution (including contamination) remediation obligations, which arc obligations to address the current or potential detrimental effects of existing pollution by participating in pollution remediation activities such as site assessments and cleanups. The scope of the statement excludes pollution prevention or control obligations with respect lo current operations, and future pollution remediation activities that are required upon retirement of an asset, such as landfill closure and post closure care and nuclear power plant decommissioning. This statement was implemented for the City's fiscal year ending June 30, 2009.
62

(I) Summary of Significant Accounting Policies (Continued)
In Apri12009, GASB issued Statement No, 55 and 56, In an e!l'ort to make it easier tor preparers of state
and local government financial statements to locate and apply accounting and financial reporting
guidance that they previously had to find in certain auditing literature, the Governmental Accounting
Standards Board has issued GASB Statement No, 55, The Hierarchy a_( Generally Accepted Accounting
Principles for State and Local Governments, and GASB Statement No. 56, Codification of Accounting
and Financial Reporting Guidance Contained in the A/CPA Statements on Auditing Standards. These
new statements incorporate the hierarchy of generally accepted accounting principles for state and local
governments and certain issues dealing with related-party transactions, going concern considerations, and
subsequent events into the GASB's authoritative literature, in an effort to codify all GAAP for state and
local governments so that they derive from a single source.
Up until now, the GAAP hierarchy and the other accounting and financial reporting issues were only set
forth in the AICPA Statements on Auditing Standards, and were not included in the GASB authoritative
literature. Statements No. 55 and 56 move relevant portions of the SASs to the GASB literature without
substantive changes, Because the GASB chose not to reconsider the guidance provided in the SASs, the
order of priority for accounting and financial reporting guidance (i.e., levels A, B, C and D GAAP)
remains unchanged in practice. Statements No, 55 and 56 are effective immediately and the adoption of
GASB Statements No.55 and 56 did not have an impact on the financial position, results of operations, or
cash flows of the reporting entity.
During fiscal year 2008, the City adopted the following GASB Statements:
In September 2006, GASB issued Statement No. 48, Sales and Pledges of Receivables and Future Revenues and Intra-Entity Transfers of Assets and Future Revenue, which establishes criteria that governments will use to ascertain whether proceeds received should be reported as revenue or as a liability. The criteria should be used to detennine the extent to which a transferor government retains or relinquishes control over the receivables or future revenues through its continuing involvement with those receivables or future revenues. This Statement also provides additional guidance for sales of receivables and future revenues within the same financial reporting entity. The requirements of this Statement are effective for fiscal periods beginning after December 15, 2006, The adoption of GASB Statement No. 48 did not have an impact on the financial position, results of operations, or cash flows of the reporting entity.
In May 2007 GASB issued Statement No. 50, Pension Disclosures, which more closely aligns the financial reporting requirements for pensions with those for other postcmployment benefits (OPEB) and, in doing so, enhances information disclosed in notes to financial statements or presented as required supplementary information (RSI) by pension plans and by employers that provide pension benefits. The reporting changes required by this Statement amend applicable note disclosure and RSI requirements of Statements No. 25, Financial Reporting for Defined Benefit Pension Plcms and Note Disclosures fur
Defined Contribution Plans, and No. 27, Accounting for Pensions by State and Local Governmental Employers, to cont'onn with requirements of Statements No. 43, Financial Reporting for Postemployment
Benefit Plans Other Than Pension Plans, and No. 45, Accounting and Financial Reporting by Employers for Postemploymenl Benefits Other Than Pensions.
63

(I) Summary of Significant Accounting Policies (Continued)
The City is currently analyzing its accounting practices to determine the potential impact on the financial statements for the following GASB Statement:
In June 2007, GASB issued Statement No. 51, Accounting and Financial Reportingfor lmangible Assets. This Statement requires that all intangible assets not specifically excluded by its scope provisions be classified as capital assets. Accordingly, eKisting authoritative guidance related to the accounting and financial reporting for capital assets should be applied to these intangible assets, as applicable, This Statement also provides authoritative guidance that specifically addresses the nature of these intangible assets. Such guidance should be applied in addition to the existing authoritative guidance for capital assets. Application of this statement is effective for the City's fiscal year ending June 30,2010.
E. Assets, Liabilities, and Net Assets or Equity
I. Deposits and lm•estmentl' The City's cash and cash equivalents are considered to be cash on hand, demand deposits, and shortterm investments with original maturities of three months or less from the date of acquisition.
State of California statutes authorize the City to invest in obligations of the U.S. Treasury, its agencies and instrumentalities, certificates of deposits, commercial paper rated A-1/P-1, medium term corporate notes rated A or its equivalent or better by Moody's or Standard & Poor's, asset backed corporate notes, negotiable certificates of deposits, bankers' acceptances, mutual funds, guaranteed investment contracts, repurchase agreements, reverse repurchase agreements when authorized by the City Council, and the State Treasurer's investment pool (Local Agency Investment Fund).
The City does not utilize the Local Agency Investment Fund, as this fund is not in compliance with the City's nuclear tree ordinance. As a matter of investment policy, the City does not borrow funds through the use of reverse repurchase agreements.
Investments for the City, as well as for its component units, arc reported at fair value. The value is determined based upon market closing prices, The fair value of mutual funds is stated at share value. Income from pooled investments is allocated to the individual funds based on the fund average monthly balance in relation to the total pooled investments.
1. Receivables and Payahles Transactions between funds that are representative of lending/borrowing arrangements outstanding at the end of the fiscal year are referred to as "advances to/advances from other funds". All other outstanding balances between funds are reported as "due to/from other funds".
Advances between funds and due from/to other funds are offset by a fund balance reserve account in applicable City funds to indicate the extent to which they are not available for appropriation and are not expendable available financial resources.
All trade accounts receivable are presented net of allowance for doubtful accounts. No allowances for doubtful accounts have been provided for taxes or rental registration fees. Property taxes are
64

(I) Summary of Significant Accounting Policies (Continued)
levied as of July l on property assessed on the same date. Alameda County assesses properties, bills for, collects and distributes property taxes as follows:
Secured Unsecured
Valuation/lien dates January I January 1
Levy dates July 1 July l
Due dates 50% on Nov. 1 July I
50% on Feb. 1
Delinquent as of Dec. 10 (for Nov.) August 31 Apr. I 0 (for Feb)
The term "unsecured" refers to taxes on businesses' furniture and equipment. Property taxes are secured by liens on the property being taxed.
Property taxes are recorded as revenue when they become both measurable and available to linance expenditures in the liscal year. Deferred revenue is recorded for the amount included in taxes
receivable, which is not collected within 60 days after fiscal year-end.
3. Inventories and Prepaid Items All inventories are valued at the lower of cost or market on a lirst-in-first-out basis. Inventory in the Supplies Warehouse Fund consists of postage supplies held for consumption by all departments of the City. Inventory in the Electrical Warehouse Fund consists of electrical materials and supplies
used by the Public Works Department. The cost is recorded as an expenditure or expense in the appropriate fund at the time inventory items are withdrawn for use (consumption method).
4. Property Held for Resale Property held for resale in the Berkeley Redevelopment Agency Capital Projects Fund is recorded at the lower of cost or market value, with an equal amount recorded as a reservation of fund balance.
5. Restricted Assets Certain proceeds of the City's Off Street Parking enterprise fund revenue bonds, the Building Purchases and Management enterprise fund Certilicates of Participation, Berkeley Redevelopment Agency's debt service and capital project funds revenue bond proceeds, as well as certain resources
set aside for their repayment, are classified as restricted assets on the balance sheet/statement of net assets because they are maintained in separate bank accounts and their use is limited by applicable bond covenants.
The debt service account is used to segregate resources accumulated for principal payments; the construction account is used to report those proceeds of the revenue bond issuance that are restricted for use in construction; the interest account is used to segregate resources accumulated for interest payments; the debt service reserve account is used to segregate resources set aside to make up potential future deliciencies in the interest account and the debt service account; and the cost of
65
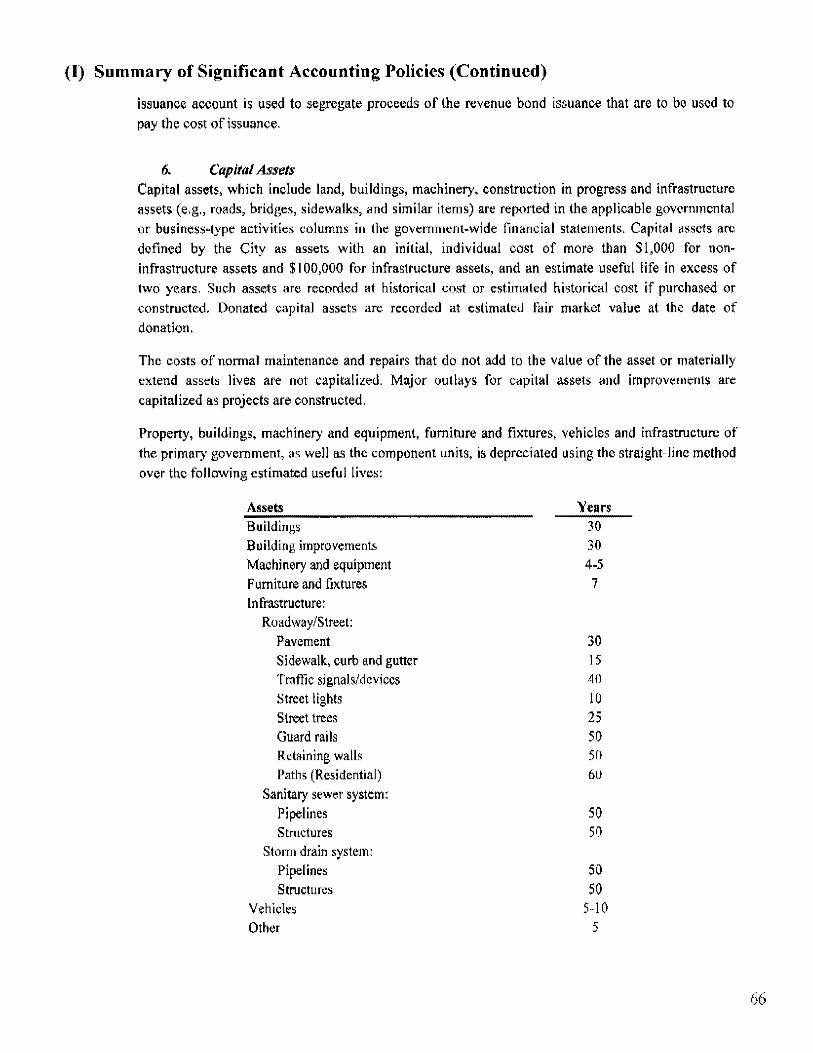
(I) Summary of Significant Accounting Policies (Continued)
issuance account is used to segregate proceeds of the revenue bond issuance that are to be used to pay the cost of issuance.
6. Capital Assets Capital assets, which include land, buildings, machinery, construction in progress and infrastructure assets (e.g., roads, bridges, sidewalks, and similar items) are reported in the applicable governmental or business-type activities columns in the government-wide financial statements. Capital assets arc defined by the City as assets with an initial, individual cost of more than $1,000 for noninfrastructure assets and $100,000 for infrastructure assets, and an estimate useful life in excess of two years. Such assets are recorded at historical cost or estimated historical cost if purchased or constructed. Donated capital assets are recorded at estimated fair market value at the date of donation,
The costs of normal maintenance and repairs that do not add to the value of the asset or materially extend assets lives are not capitalized. Major outlays for capital assets and improvements are capitalized as projects are constructed.
Property, buildings, machinery and equipment, furniture and fixtures, vehicles and infrastructure of
the primary government, as well as the component units, is depreciated using the straight-line method over the following estimated useful lives:
Assets Buildings Building improvements Machinery and equipment Furniture and fixtures Infrastructure:
Roadway/Street: Pavement Sidewalk, curb and gutter Traffic signals/devices Street lights Street trees Guard rails Retaining walls Paths (Residential)
Sanitary sewer system: Pipelines Structures
Sto1111 drain system: Pipelines Structures
Vehicles Other
Years 30 30 4-5 7
30 15 40
10 25 50 50 60
50 50
50 50
5-10 5
66

(I) Summary of Significant Accounting Policies (Continued)
7. Compensated Absence.~ H is the City's policy to permit employees to accumulate earned but unused vacation and sick pay
benefits. Vacation pay is accrued when incurred in proprietary funds and is reported as a fund liability.
In governmental funds, compensated absences arc recorded as expenditures in the year paid, as it is the
City's policy to liquidate any unpaid compensated absences at June 30 from future resources, rather
than currently available financial resources. The City has established an Internal Service Fund (Sick
and Vacation Payout Fund) to pay for compensated absences when a worker leaves the City or retires.
The City uses the vested method for calculating compensated absences.
The personnel policies of the City do not allow employees to accrue vacation in excess of eight weeks
(320 hours). For example, when a Miscellaneous employee (Police and Fire sworn employees have
different tormulas) is terminated or retires, with a vested pension with twenty years of service, an
employee is entitled to be paid 38% of the accrued sick leave balance and 62% of the balance can be
used for CALPERS credit. Employees with at least twenty eight (28) years of benefited City service or
employee retiring on permanent disability arising out of and incurred in the course and scope of their
employment with City with at least twenty-eight (28) years of benefited service shall be entitled to
receive payment in an amount equal to lift)' percent (50%) of their accrued sick leave days up to a
maximum of (200) unused sick leave days. The employee has the option of using the payout
entitlement for re!iree medical insurance premium payments. The liability for retirees who do not
choose the payout option is paid from the medical sick leave entitlement trust fund.
8. Long-term Obligation$ In the government-wide financial statements, and proprietary fund types in the fund financial
statements, long-tenn debt and other long-term obligations are reported as liabilities in the applicable
governmental activities, business-type activities, or proprietary fund type statement of net assets. Bond
premiums and discounts, as well as issuance costs, arc deferred and amot1ized over the lifo of the bonds
using the effective interest method. Bonds payable arc reported net of the applicable bond premium or
discount.
In the fund financial statements, governmental fund types recognize bond premiums '1nd discounts, as
well as bond issuance costs, during the current period. The face amount of debt issued is reported as
other financing sources. Premiums received on debt issuances arc reported as other financing sources
while discounts on debt issuances are reported as other financing uses. Issuance costs, whether or not
withheld from the actual debt proceeds received, are reported as debt service expenditures.
9. Fu11d Equity In the fund tlnancial statements, governmental funds report reservations of fund balance for amounts
that arc not available for appropriation or are legally restricted by outside parties for use lor a specific
purpose. Designations offund balance represent tentative management plans that arc subject to change.
Foll<>wing is a brief description of the nature of cetiain reserves as of June 30, 2009:
Reserved.for Encumbrances- Reserves have been established in all funds to account !or the portion of
purchase ordcr.s and contracts awarded for which the goods or services had not yet been received as of
June 30, 2009.
67

(I) Summary of Significant Accounting Policies (Continued)
Resaved for Lung-Term Accounts/Notes Receivable- A reserve has been established in the General, CDBG, Grants, Citywide Revolving Loan, Capital Improvement and Business and Economic Development special revenue funds for the amount of loan principal due more than one >'ear from the end of the fiscal year.
Reserved for l'roperrv lleld for Resale " The fund balance of the capital projects funds has been reserved for land and improvements held for resale by the Berkeley Redevelopment Agency, to indicate that it does not represent a currently available expendable !1nancial resource.
Reserwd for Debt Service -_Reserves have been established in the debt service funds to account for cash and investments held by flscal agents restricted solely for paying debt service.
Reserved for Pension Benefits - A reserve has been established in the fiduciary fund type (Safety Members Pension) for the amount of cash restricted solely for the payment of safety members pension benefits.
Reserved for Due From Other Funds/Advances To Other Funds- A reserve has been established in the General Fund for amounts due from Grant funds, which are not expected to be repaid during the fiscal year and, as a result, arc nut appropriable.
Designations of fund balances indic.atc that portion of fund equity that is not available for appropriation based on management's plans for future use of the funds.
10. Other Po•·t-employment Benefits Other post-employment benefits (OPEB) cost for healthcare is measured using the accrual basis of accounting (Sec note IV C). Annual OPEB cost is equal to the Annual Required Contributions (ARC) to the OPEB plans, adjusted for interest and amortiz<Jtion of the net OPEB obligation/assets.
68

CITY OF BERKELEY
Notes to the Basic Financial Statements (Continued)
June 30, 2009
II) Stewardship, Compliance, and Accountability
a) Excess of Expenditures I Over Appropriations
The following non-major governmental funds expenditures exceeded appropriations at the legal level of budgetary control:
State Gas Tax 21 06 Fund
lnclusionary Housing Program
Sales/ Lease Financing 2007 GO Bands Series B
2007 GO Bands Series A
Workforce Investment Act
Section I 08 HUD Loan
Paramedic Assessment Dist.
UC Settlement
Measure FF Library
Repertory Theatre Bonds
Amount
$ (16,520) <•J (1,388)(2
)
( 4,450) (2)
(849) (:)
(330,320) (2)
(9,535) (2)
(252) ("J
(366,437) (I)
(5,943) (2)
(35,425) (2)
(4,838) (2)
(IJ An amendment to the appropriations ordinance was not prepared. A transfer from the General
Fund will be needed to cover the excess.
(l) An amendment to the appropriations ordinance was not prepared. The fund balance was used to
cover the excess.
(J) An amendment to the appropriations ordinance was not prepared. Loan advances will be used to
ClWCr the shortfall.
(4J An amendment to the appropriations ordinance was not prepared. State Gas Tax proceeds will be used to cover the shortfall.
B. Deficit Fund Balances/Net Assets
The following funds had deficit fund balances I net assets on June 30,2009:
(I) Special Revenue Fund>·
69

(H) Stewardship, Compliance, and Accountability (Continued)
The CFD #I Oist. Fire Protection Bond Fund has a deficit fund balance of $651,716, which will be eliminated by a transfer from the debt service fund.
The State Gas Tax 2106 Fund has a deficit lund balance of$103,003, which will be eliminated when the tax allocation is received.
The Paramedic Assessment District Fund has a deficit fund balance of $235,347, which will be eliminated by a subsidy from the General Fund.
The Underground Districl Fund has a deli cit timd balance of $108,871. The Budget Office will review the fund and determine the course of action in FY 2010.
The UC Berkeley Reimbursement For People's Park Fund has a dcticit balance of $126, which will be eliminated by a transfbr from the General Fund,
The Tobacco Control Fund has a deficit balance of $5,123, which will be eliminated by more timely expenditure reimbursements.
}) Capital Project Funds The Capital Improvement Administration Fund has a fund balance deficit of $1,611, which will be eliminated by better allocation of project management fees to the appropriate City projects.
Park Acquisition Fund has a fund balanc.e deficit of $2,880, which will be eliminated by the receipt of rental income.
k) Internal Service Funds The Workers' Compensation Fund has a deficit in net assets of $12,957,724. Total projected current year claims incurred but not paid arc recorded as an expense resulting in negative net assets. As a matter of policy, current year claims are paid from current year revenues from all operating departments. For the Workers' Compensation Fund, a workers· compensation actuarial study is being conducted and the rates charged to departments will be consistent with that study.
70

CITY 01<' BERKELEY
Notes to the Basic Financial Statements (Continued) June 30, 2009
III. Detailed Notes on All Funds
A. Cash and Investments
Cash and investments as of June 30, 2009 arc classified in the accompanying financial statements at fuir value as follows:
Unrestricted Restricted Total Primary Government $ 183,200,075 $ 16,876,237 $ 200,076,312 Component Units
Berkeley Housing Authority 1,303,395 7,182,519 8,485,914 Rent Stabilization Board 3,666, ISO 3,666,150
Fiduciary Funds 19,531,306 3,042,685 22,573,991
Total cash and investments $ 207,700,926 $ 27,101,441 $ 234,802,367
Cash and investments as of June 30, 2009 consist of the following:
Cash on hand $ 23,019 Deposits with financial institutions 16,764,398
Total cash and deposits 16,787,417 Investments:
Investments for City govemment, excluding trust ftmds 205,635,762 Investments held in trust for police retirement and retiree medical 12,379,188
Total investments 218,014,950
Total cash, deposits and investments $ 234,802,367
Equity in pooled cash and investments held by treasury $ [ 98,610,695
Cash and invc;tments held by fiscal agent 16,876,237 Cash and investments of retirement plans 19,315,435
Total cash, deposits and investments $ 234,802,367
Pooled Cash and Investments Held in City Treasury- The City maintains a cash and investment pool that is available for use by all funds and component units. Each fund's porti1m of this pool is displayed on the govemmcntal fund balance sheets and proprietary fund statement of net assets as "cash and investments held in City Treasury."
Cash and Investments with Fiscal Agent - The City has other investments, not held by the City Treasury, that arc invested pursuant to governing bond covenants.
71

(Ill) Detailed Notes on All Funds (Continued) Investments in Retiremelll Plans . The funds of the retirement plans and retiree medical plans arc invested pursuant to City investment policies established specifically for those plans by the City Council. The objective of the investment policies is to maximize the expected return of the plans' at the acceptable level of risk.
1. Investments Investments Authorized by the California Government Code and tbe City of Berkeley Investment Policies:
The table below identifies the investn1cnt types that are authorized for the City of Berkeley's pooled investment policies. The table also identifies certain provisions of the California Government Code and/or the City's investment policies that address interest rate risk, credit risk, and concentration of credit risk. This table does not address investments of debt proceeds held by bond trustees that are governed by the provisions of debt agreements of the City, rather than the general provisions of the California Government Code.
Maximum Maximum
Maximum Percentage/Dollar Investment Authorized Investment Type Maturity Of Portfolio In One Issuer
Local Agency Bonds 5 years 5°/o NIA U.S. Treasury Securities 5 years 25o/o N/A U.S. Agency Securities 5 years 100% NIA Banker's Acceptances 180 days 40% 30% Commercial Paper 180 days 25%> $5M or2% Negotiable Certificates of Deposit 5 years 30% N/A Repurchase Agreements l year 10~/0 N!A Reverse Repurchase Agreements 92 days 10% N!A Medium-Term Notes 5 years 30jY'o NIA Guaranteed Investment Contracts 5 years 25% NIA Mutual Funds N/A 10% 10% Money Market Mutual Funds N/A 10% N/A Mortgage Pass-Through Securities 5 years 20%; NIA County Pooled tiwcstment Funds N/A N/A NIA Local Agency Investment Fund (LAIF) N/A NIA $40 million JPA Pools (other investment pools) NIA N/A N/A
72

(III) Detailed Notes on All l<'unds (Continued) Investments Authorized by Debt Agreements
Investments of debt proceeds held by bond trustees are govcmed by provisions of the debt agreements,
rather than the general provisions of the California Government Code or the City's investment policies.
The table below identifies the investment types that are authorized for investments held by bond trustee.
The table also identifies certain provisions of these debt agreements that address interest rate risk,
credit risk, and concentration of credit risk.
Maximum Maximum Maximum Percentage/Dollar Investment
Authorized Investment Type Maturity Of Portfolio In One Issuer U.S. Treasury Securities 5 years 25% N!A U.S. Agency Securities 5 years 100'1., NIA Money Market Mutual Funds N/A I 0% in any fund NIA Guaranteed Investment Contracts 5 years 25% NIA
Disclosures Relating to Interest Rate Risk
lnterest rate risk is the risk that changes in market interest rates will adversely affect the fair value of an
investment. Generally, the longer the maturity of an investment, the greater the sensitivity of its fair value
to changes in market interest rates. One of the ways that the City manages its exposure to interest rate risk
is by purchasing a combination of shorter term and longer term investments and by timing cash flows
from maturities so that a portion of the portfolio is maturing or coming close to maturity evenly over time
as necessary to provide the cash !low and liquidity needed for operations.
• The City has the intention to hold all investments to maturity. The average maturity of the City's
pooled investments governed by the Investment Policies was approximately 22.9 months as of June 30, 2009.
• Commercial paper is limited by the City's investment policies to a maturity of ISO days (not the
270 days allowed by the State). In practice, Commercial Paper maturities arc limited to a few
days.
7' . .J

(III) Detailed Notes on All Funds (Continued) Information about the sensitivity of the fair values of the City's investments (excluding investments held in trust for retiree medical plans) to market interest rate fluctuations is provided by the following table that shows the distribution of the City's investments by maturity:
Investment Maturities \in !cars)
To~l Lc~5 than I I • 2 2. J H H S or more
Loc11 Agency Bond• 1,000,000 $ $ $ 1,000,000
U.S. Treasmy Securities
U.S. Agen~)' Securities 17,006,700 5,298,450 11,633,140 4,215,000 45,961,810 9,898,300
Commercial Paper
M~dium T~nn Nl1tcs 64,110,140 11,555,240 39,503,360 13.651,540
Money Market Funds 59,230,365 59,230,365
Guarantc~d Investment Contmcts 3,688,557 6,032,195
"I otal investments $ 205,635,762 l 59,230,365 I 5,193,450 $ 43,718,360 I 59.613,350 I 16,930,495
Disclosures Relating to Credit Risk
Generally, credit risk is the risk that an issuer of an investment will not fulfill its obligation to the holder of the investment. This is measured by the assignment of a rating by a nationally rccogni~cd statistical rating organization. Presented below is the minimum rating required by the California Government Code, the City's investment policies, or debt agreements and the actual rating as of year end for each investment type.
Minimum Legal Amount Rating
Investment Rating Held at June 30, 2009 Local Agency Bonds NIA $ I ,000,000 Not rated U.S. Treasury Securities Exempt Exempt U.S. Agency Securities N/A 77,006,700 AM Commercial Paper Medium Tonn Notes A 64,710,140 A
Money Market Funds NIA 59,230,365 Not rated Guaranteed Investment Contracts NIA 3,688,557 Not rated
Total investments $ 205,635,762
• The issuer of Commercial paper must have the highest rating from two nationally recognized rating agencies, not one (as required by the State).
• Purc-hases of corporate notes shall be limited to securities rated "A" or higher by Moody's and "A" or higher by Standard and Poor's.
• Purchases of long-term (i.e .. bcy<md five years) corporate bonds arc limited to the Retiree Medical Plan Trust Fund and debt service reserve funds. Issuers must have a Moody's credit rating of''A3" or higher and Standard and Poor's rating of"A-"or higher.
74

(Ill) Detailed Notes on All Funds (Continued) Concentration of Credit Risk
The investment policies of the City contain no limitations on the amo\Jnt that can be invested in any one
issuer beyond that stipulated by the California Government Code. No more than $5 million or 2%
(whichever is higher) of the short-term portfolio can be in the commercial paper of any single corporation
or group under essentially common ownership or control. Investments in any one issuer (other than U.S.
Treasury securities, mutual funds, and external investment pools) that represent 5% or more of total City
investments are as follows;
Issuer
FNMA
Federal Home Loan Bank
Federal Farm Credit Agency
Federal! lome Loan Mortgage Corp.
Custodial Credit Risk
Investment Type
Federal Agency Securities
Federal Agency Securities
Federal Agency Securities
l'cdcral Agency Securities
Reported Amount
$ 14,530,650 3, 133,140
22,939,710 36,403,200
For an investment, custodial credit risk is the risk that the City will not be able to recover the valuo of its
investments or collateral securities that are in the possession of an outside party if the counter party fails.
All of the City's investments except money market funds and guaranteed investment contracts arc subject
to custodial risk. However, the California Government Code and the City's investment policies do not
contain legal or policy requirements that would limit the exposure to custodial risk for investments. The
City's investments are held by Wells Fargo, in the Trust and Custody Department, which is scpamte from
the operations of the bank. In addition, Wells Fargo maintains a Financiallnstitution Bond of at least
$100 million which provides protection from losses sustained by employee dishonesty, burglary,
robbery, check forgery, securities forgery, computer crime, safe deposit, etc.
2. Depositl· Custodial credit risk for deposits is the risk that, in the event of the failure of a depository financial
institution, the City will not be able to recover its deposits. Included as deposits are bank deposits. In
accordance with the California Government Code demand deposits that aren't insured must be
collateralized with governmental securities at II 0 percent of all such deposits or pledging of first deed
m011gage notes equal to 150% of the City's deposits. The collateral must be held by the bank in the City's
name. The following chart presents bank deposit balances for the primary government and its component
units as of June 30,2009. Deposits are listed in lenns of whether they are exposed to custodial credit risk (i.e., the risk that in the event of a bank failure, the City's deposits may not be returned. Deposits are
exposed to custodial credit risk if they arc either, (1) uninsured and uncollateralized, (2) uninsured and
collaterali~ed with securities held by the pledging financial institution, or (3) uninsured and
collateralized with securities held by the pledging financial institution's trust department or agent, but
not in the name of the City.
7" .)

(III) Detailed Notes on All Funds (Continued) !.lank Deposit Balances
Deposits Exposed to Custodial Credit Risk
Description
Primary
Government
Component Units BHA Rent l.loard
Insured andlor collateralized $ 515,702 $ 500,000
Uninsurc<l and collatcrali;zed with securities held by pledging institution's trust department or agent, but not in City's name 4,096,632 7,985,914 3,666,150
$
Total Bank
Balances
1,015,702
15,748,696 Total bank balance -all deposits $ 4,612,334 $ 8,485.914 $ 3,666,150 $ 16,764,398
The City applies the provision ofGASB 31, Accounting and Financial Reporringfvr Certain Investments
andfor l:'xternallnvestment Pools, which requires governments to present investments at fair value. For
the fiscal year ended June 30, 2009, the City had substantial increases in the fair value of investments
based on quoted market prices for tho sccur·ities held, which are included as investment income in the
General fund, "' follows:
Interest income Net increase in the fair value of investments
Total investment income
$ 4,894,597
3,851,102
$ 8,745,699
76

(III) Detailed Notes on All Funds (Continued) B. Receivables
Receivables as of year-end for tho City's individual governmental activities major funds, non-major fund, and internal service fund, including the applicable allowance for uncollectible accounts, arc as follows:
Capital No11major Internal Total R~:Jceivahles. General Grant Library CO~C Park 'fa~ Improvement Governmental S<:rvice Governmental Governmental Activities Fund Fund Fund Fund fund Fund Funds Funds Activities
Accounts $ 8,025,69t 5,268 s 929,264 $ 9.3'9 s 8,969,602 Interest 2,0t3,151 229,053 501,304 380,561 3, t24,669 '!'axes 4,913,871 118,391 5,032,268 Special assessmcng 164,160 107,489 55,226 326,875 Subvcntbns/grants 10,215,986 29,895 504,271 10,750,t52 Notes 2,825,135 21,842,838 4,685,130 7,610,422 10,601,154 41,564,679 Other 124,169 124,76~
Gross receiv~blcs 17,903,2t7 32,058,824 164,160 4,949,346 107,489 8,111,126 12,588,873 9,379 75,893,014 Less: allowance for uncollectible (4,940,193) (5,931! (823)54) (264) \5,769,742)
Tolal receivables, net 12,963,024 $ 32,058,824 s 164,160 $ 4,943,415 $ t07,489 $ 8,111,726 $ 11,765,519 $ 9,115 $ 10,t23,272
Details of Notes Receivable as of June 30, 2009 are as follows: Capital Nonmajor lntem~l Total
Notes Roomablc~ · General Gr~t Library CDBG Park r~ Improvement Gov~rnmental Semce Govcrnmen(~l
Govcmmemol Activities F~11d Fond Fun~ FLmd Fund Fund Fund$ runds Activities Dr:veJQpml!lll Loans.
BElli 1,161.000 I I $ 1,161,000 CDBG 3,016,601 3,076,601 Ot;ner~l Fund 2,417,886 2,417.886 IIO~E 16,736,727 16_736.727 t849Sha11Uck t04.lt0 104,510 Hou~ing Trust Fund 7,452,271 7,452,2/1 MITIG. 1,394,799 t,J94,799 State HTF 994,453 994,453 BRA 3,170,210 l,t70.270 HELP 582,401 582,40t Sc~tion 108 5,813,6t7 S,8t3,617
S. B, Rental Rchahilil&tion 260,000 438,875 748,875 CALl tOME._ Senior Hom<: Repair 729,8.19 1,058,t47 53,642 t,841,647 Rchabilita!ion·Emctgency Rcp<tir 41,508 41,508 Rchabrlit3tion-Semor Disable<! 20,000 20,000 l ~I Time Ht;m,:buy~t horne loans llO,OOO llO,OOO ADD! OCD-Cityw1tic l-oan,~ 53,026 652,661 705,681 OED· WB llulldlilg Acqui~ition Funt 94,223 91,223 OW-Mortgage Lo~n 17,000 17.000 OED· Revolving Loan 29t,532 291.lll Emp Comput¢r Loan 13,673 t3,67l lotal te<:civabk:;., gross $ 2.825,135 $ 2t,84l.8l8 $ 4,685, t30 $ l 7,6t0,4l1 $ 10,60t,t54 $ 47,564,679 Less: Allowance for
unoollcclible 1808,899 Total rc~civa.bks, net $ 2,82Wl $ 21,842,838 $ 4,68WO ! 7,610,422 s 9,79).,255 l
Business~'!' y pe A c1 ivilic' Refuse Marine~ Sanitdl)' Clean Stonn Permit Service Off Street Patking lltdgPurch Enterprise Activities Cull(.:~iion Operations St!wer Wo.ter Center P~king Meter &M(ll111 l'<>tul
AccoLmh Rf.l~.:~.:ivabk $ 1,271,174 $ 510,637 s 1.791.221 t)l,il6 $ 94,6J(i I 159,553 $ t,ll9 $ 225 I 3,982,421
Les~: nllowancc !'or ( 13,8611 (J)6,l25) (57,8361 (38,)001 (55,964) (II 0,042) (6t2,728)
Total receivable~, net 1,251,313 I t74,112 l 1.733,385 s 115,336 $ 38,672 $ 49,511 $ I ,tJ9 $ 225 ! 3,369,693
77

(Ill) Detailed Notes on All Funds (Continued)
c. Capital Assets
Capital asset activity for the year ended June 30, 2009 was as follows:
Balance, Balance, Jul~ 1,2008 lncrease Decrease June 30, 2009
Go~rnmental acthiti'-1S Capital as::NUS, not being deprecimed:
Land $ 20,327,797 $ 2,000,000 $ $ 22,327,797 Constmction in progress 6,134,545 6,134,545
Total capital assets, not being depreciated 20,327,797 8,134,545 28,462,342
Capital assets, being depreciated: Buildings 125,651,050 478,268 126,129,318 lmproven..,nts other than buildings 7,562,808 1,166,027 8,728,835 Machinery and equipment 52,391,597 5,415,142 (2,138,045) 55,668,694 Infrastructure 152,916,484 6,777,116 159,693,600
Total capital assets, being depreciated 338,521,939 13,836,553 12, 138,045) 350,220,447
Less accrmmlated deprecia(ionfor: Buildings (51,599,764) (3,373,2&7) (54,973,051) LmprovetYk.;:nts other than buildings (876,973) (253,236) (1,130,209) Machinery and equipment (42,792,010) (2,673,263) 1,012,718 (44,452,555) infrastructure (74,766,633) (4,418 064) (79, 18•!,697)
Total accumulated depreciation (170,035,380) (10,717,850) 1,012,718 (179,740,512)
Total capital assets, being depn:ciatcd, net 168,486,559 3,118,703 (1,125,32Z) 170,479,935
Governmental activities, capital assets, net $ 188,814,356 $ 11,253,248 $ (1,125,321) $ 198,942,277
Business-type acthHies Capital assets, not being deprt:cimed:
Land $ 2,979,050 $ $ $ 2,979,050 Construction in progress 3,394,478 (3,394,478)
Total capital assets, not being depreciat~d 6,37:),528 (3.394,478) 2,979,050
Capital assets, beinx deprec:iMed: Buildings 37,726,886 124,001 37,850,887 lmproveJrents other than buildings 3,032,593 3,622,673 6,655,266 Machinery and equipment 8,208,474 704,365 (36,878) 8,875,961 Infrastructure 157,780,113 2,930,564 160,710,677
Total capital assets, being depreciated 206,748,066 7,381,603 (36,878) 214,092,791
Less accumulated deprer:iafionfor: BuHdings (10,659,577) (818,652) (II ,4 78,229) Improvements other than buildings (952,531) (219,290) (1,171,821) Machinery and equip""'nt (7,073,791) (371,052) 36,330 (7,408,519) lnfrastructur~ (37,099,396) (2,680,006) (39,779,402)
Total accumulated depreciation (55,785,301) (4,089,000) 36,330 (59,837,971)
Total capital assets~ being depreciated, net I 50,962,765 3,292 603 (548) 154,254,820
Ousincss·type activities, capital assets~ net $ 157,336,293 $ (101,875) $ (548) $ 157,233,870
78

(Ill) Detailed Notes on All Funds (Continued)
C. Capital Asset.
Depreciation expense was charged to functions/programs of the primary government as follows;
Government Activities General government Public safety Highways and streets Health and human services Culture and recreation Community development/housing & economic development Amount reported in the internal service funds
Total depreciation expense· governmental activities
Business-type Activities Refuse services Marina operations Sanitary sewer Building purchases and managem~nt Clean storm water Permit service center Parking·related
Total depreciation expense- business-type activities
Discretely Presented Component Units
$ 915,783 896,063
4,509,632 128,684
I ,644,896 I ,057,909 I ,564,883
$ I 0,717,850
$ 120,062 232,936
2,181,512 589,168 556,827
14,026 394,469
$ 4,089,000
Capital asset activity for the Rent Stabilization Board for the fiscal year ended June 30,2009 was as follows:
Balance, Balance, Jul~ I, 2008 Increase Decrease June 30, 2009
Capilal a>sets, being depreciated Machinery and Equipment $ 322,002 $ 9,702 $ (2, 164) $ 329,540
Less accumulated depreciation for: Machinery and Equipment (270,220) (4,753) 164 (272,809)
Rent Stabilization Board, capital assets, net $ 51,782 $ 4,949 $ $ 56,731
79
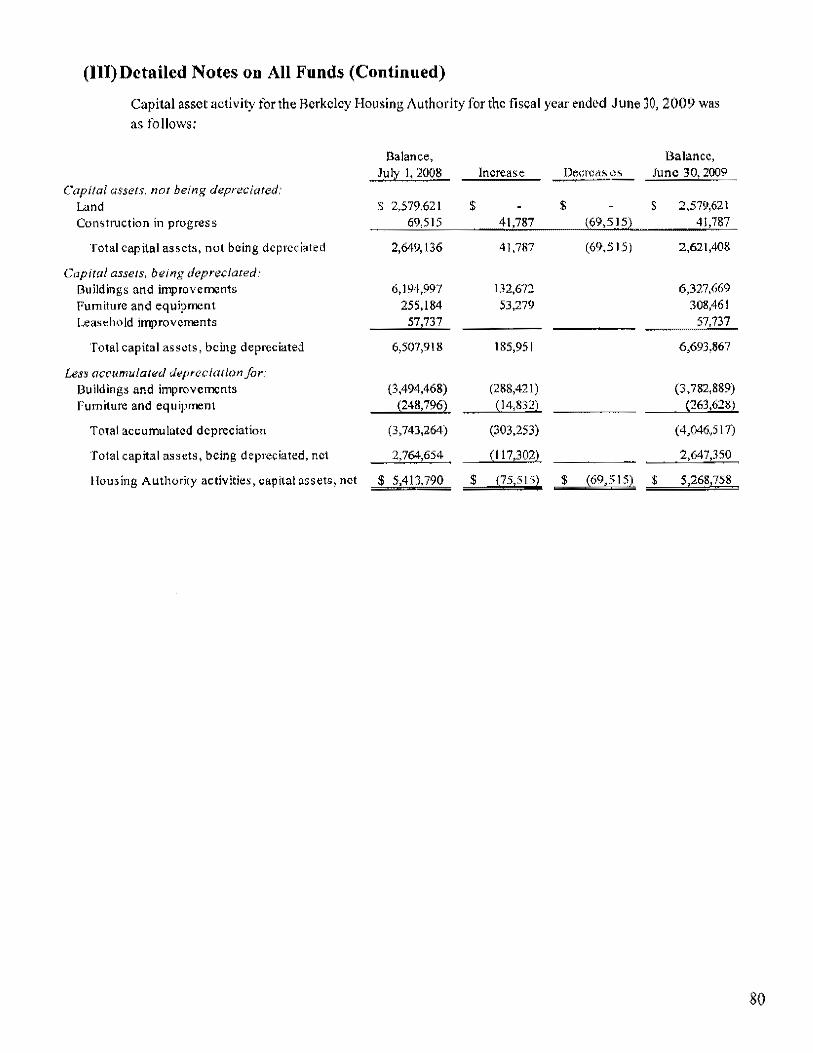
(Ill) Detailed Notes on All Funds (Continued)
Capital asset activity for the Berkeley Housing Authority for the fiscal year ended June 30, 2009 was
as follows:
Balance, Balance, Jull' I, 2008 Increase Decreases June 30, 2009
Capital assets, not being depreciated: Land s 2,579,621 $ $ $ 2,579,621 Cons.truction in progress 69,515 41,787 (69,515) 41,787
Total capital assets, not being depreciated 2,649,136 4!,787 (69,515) 2,621,408
Capitcll assets, being depreciated: [luildings and improvements 6,194,997 132,672 6,327,669 Furniture and equipment 255,184 53,279 308,461 Leasehold improvements 57.737 57,737
Total capital as sots, being depreciated 6,507,918 185,951 6,693,867
Less accumulatf!d depreciation for. Buildings and improvements (3,494,468) (288,421) (3,782,889) furniture and equipment (248,796) (14,832) (263,628)
Total accumulutcd depreciation (3,743,264) (303,253) (4,046,517)
Total capital assets, being depreciated, net 2,764,654 (117,302) 2,647,350
llous ing Authority activities, capital assets, net $ 5,413,790 $ (75,515) $ (69,5 I 5) $ 5,268,758
80

(Ill) Detailed Notes on All Funds (Continued)
The composition of intcrfund balances as of June 30, 2009, is as follows:
Puc to Due from Due Due Advance Advance Component Component
~·und To From From Units Units Primal')' Government: General Fund $ $ 1,155,244 $ $ $ 247.077 Grants Fund I 0,198,295 CDBG Fund 251 72.866 Capital Improvement Fund 4,273,983 NonmaJor governmental funds 894,743 72,866 Enterprise Funds:
Sanitary Sewer Fund tlolldmg ~urcllase &
196,836
Management Fund 14,292 Fiduciary Funds 64,810
Total $ II ,429,228 I 11,429,228 $ 72,866 $ 72,866 $ $ 247,077
Due to Due from Primary Primary
Government Government Component Units: Berkeley Housing Authority $ 247,017
(i) The advances to other funds consisted of Community Development Block Grant loans to Berkeley R~devclopment Agency, which the Berkeley Redevelopment Agency uses to make low-income property loans to City residents. As the loans arc repaid or properties sold, the proceeds arc used to repay the Community Development Block Grant Fund.
81

(Ill) Detailed Notes on All Funds (Continued)
lnterfund TransFers:
Capital Nonmajor Clem Stonn water lntemal Total
General Grant Improve. Governmental Enterprise Service Transfer-
Fund Fund Fund Funds Fund Funds Out
General Fund $ $ 1,522,915 $ 8,000,000 $ 4,714,467 $ $ 2,353,476 $ 16,590,858
Capital Improvement Fund 1,309,680 113.291 136,983 1,559,954
CDBG Gran\ Fund 311,688 321,688
Park Tax fund 28,981 2,813 46)43 78,038
Nonmajor Governmemal Fund 2,607,024 2,551,897 1,080,192 21,432 6)66,545
Enterprise Funds:
Refuse Collections 110,870 110,870
Marina Operations 8,157 25,047 33,204
Sanitary Sewer 171,170 111,110
Clean S\onn Water 25,085 25,085
Pennit Service Center 37,141 31,241
Parking Meter 400,000 8,650 408,650
Off Street Parking 7,920 7,920
Building and Building Maintenance 16,480 26,480
Internal Service Funds 22,497 535,741 558,238
Total Transfer-In $ 3,351,109 $ 4,103,794 $ 8,063,721 $ 7,115,309 $ lll,291 $ 3,448,117 $ 26,196,040
The $16,590,858 General Fund transfers out include (I) subsidies of $700,000 to Paramedic Fund;
(2) $8,000,000 to pay for capital improvement projects; (3) transfer of $756,938 to pay debt service
for the refunding pension bonds; (4) $1,853,476 to the Public Liability Fund and $500,000 to the
Catastrophic Loss Fund; and (5)$1 ,953,018 in matching funds for public health programs; (6)
$516,000 subsidy to State Lighting Assessment District; and (7) $2,311,426 to other nonmajor
governmental funds.
The General Fund received transfers in of$22,497 from Equipment Maintenance Fund, $2,607,024
ti·om the Health State Realignment Fund, $400,000 from the Parking Meter Fund, and $321,688
from the Grant Fund.
82

(III) Detailed Notes on All Funds (Continued)
D. Leases
Operating Leases
The government leases building and office facilities and other equipment under non-cancelable operating leases. Total costs for such leases were $1,448,462 for !he year ended June 30,2009. The future minimum lease payments for these leases are as follows:
Capital Leases
Year Ending June 30 2010 2011 2012
Total
Amount $ 1,597,254
1,482,657 830,377
$ 3,910,288
The City has entered into leases for financing the acquisition of energy efficient equipment, computer upgrades, parking meters and copiers. These lease agreements qualify as capital leases for accounting purposes and therefore, have been recorded at the present value of their future minimum lease payments as of the inception date. The assets acquired through capital leases are as follows:
Governmental Business-type Activities Activities
Assets: Machinery and Equipment $ 4,912,673 $ N/A Less: Accumulated depreciation i473,090)
Total $ 4,439,583 $ N/A
The future minimum lease obligations and the not present value of these minimum lease payments as of June 30, 2009, were as follows:
Year Ending June 30 2010
Total Minimum Lease Payment Less: Amount Representing Interest
Present Value of Minimum Lease Payments
Governmental Activates
$4,630,662
4,630,662 (191,079)
$ 4,439,583
83

(III) Detailed Notes on All Funds (Continued) E. Bonds, Capital Leases, Notes, Loans and Other Payables
The following is a summary of Long-term obligations of the City as of June 30, 2009:
Type of Obligation and Purpose: Governmental Activities Long-Term Obligations
General Obligation Bonds 1'1:
Governmetnal Activities
Refunding 00 Uonds, ?007, Series A, Fire Safety (Me.asure G) Refunding 00 Bonds, 2002, Fire Safety (Measure G)
Refunding GO Bonds, 2007, Series B (MeasureS): Library, Martin Luther King, Jr. Civic Center and Downtown
Animal Shelter GO Bonds 2008 Neighborhood Branch Library Improvement Project (Mea>urc FF)
General obligation bonds
Revenue llonds: Theatre facility and park land acquisition
Refunding pension bonds 1"
2005 Refunding Tax Allocation Bonds- BRA'"
WlliP Subordinated Tax Allocation Bonds- BRA 12'
Revenue bonds
Capital Lease Payable: Fire Engines and Trucks
Capital kase payable
Loans Payable: CHFA !IUD J 08- Adeline Street H\JD I 08 - UNA H\JD lOB-David Brower H\!0 lOB ll-02-MC-06·008· BIIA Retiree Medical
Loans payable Other Payables:
Accrued Vacation and Sick Leave Accrued Workers' Compensation Calaims and Judgmcn\1; Accrued Public Liability Claims and Judgments Net Pension Obligation-Police Retirement Income Benetlt Net OPEB Obligation-MRHP
Other payab\es
Govcrruncotal Actlvitcs Total Long-Term Obligations
!II Property tax levy l!:i recorded in the Debt Service Funds
1'1 Revenues arc recorded in the Debt Service Funds
Final Maturity
Date
2027 202
2029
2037 2040
2029 2018
2015
2012
2019
2012 2023 2025 2025 2013 2025
Remaining Interest Rates
3.90%·5.00% 2.00%·4.40%
3.50%·4.40%
3.50%·4.30% 1.25%-5.30%
4.10%-5.70%
J.i0%-5.25%
2.80%-4.75%
4.30%·5.40%
4.3811/ij
3.00% 4.25% 4.25°/o
3.646%·6.320% 4.55% 8.00%
$
Principal
4,000,000 12,650,000
37,580,000
7,200,000 10,000,000
71,430,000
7,675,000
3,265,000
4,970,000
1,000,000
\6,910 000
4,439,583
4,439 583
500,000 170,000 603,860
4,000,000 809,000 533 000
6,8\5860
14,336,077 21,194,000
922,344 5,487,194
762 807 42,702,422
$ \42,297,865
84

(III) Detailed Notes on All Funds (Continued)
Business-Type Activates final
Entity, Type of Obligation and Purpose Business-Type Activities Long-Term Obligations Revenue Bonds· Garage Improvements• Certificates of Participation* Notes Payable -llarbor Construction 4' Notes Payabl~ ·II arbor Construction s• Compensated absences Net OPEB Obligation-MRI IP
Business-T)·pc Activities Long-Tern> Obligations
Maturity Oate
2022 2033 2016
until paid
Remaining Interest Rates
3.25%--4,25% 2.50%·5,00% 4.50%-7,90%
4,50%
Principal Amount
$ 4,510,000 26,755,000
I ,060,040 3,649,858 2,436,738
257 491
$ 38,669,128
Source of funds to meet debt scrv1c~ requirements arc revenue derived from user fees and charges for service recorded in the respective Enterprise Funds
Debt Cont pliancc
There are a number of limitations and restrictions contained in the bonds' indentures, The City believes it is in compliance with all significant limitations and restrictions,
Arbitrage
The Tax Reform Act of 1986 instituted arbitrage restrictions related to the issuance of tax-exempt bonds issued after August 31, 1986. Those regulations relate to the investment of tax-exempt bond proceeds at an interest yield greater than the interest yield paid to bondholders. An independent firm performs arbitrage rebate calculations to determine the applicability of federal arbitrage regulations. There were no bond issues with a positive arbitrage rebate liability during the fiscal year.
General Obligation Bonds
The City issues general obligation bonds to provide funds for the acquisition and construction of major capital facilities, General obligation bonds have been issued for governmental activities. The original amount of general obligation bonds issued in prior years was $81,500,000. General obligation bonds arc direct obligations and pledge the full faith and credit of the goventmcnt. These bonds generally are issued as 25-30 year serial bonds with amounts of principal maturing each year. General obligation bonds currently outstanding are as follows:
Purpose Governmental Activities. Measure G (2002 & 2007 Series A) Governmental Activities· MeasureS (2007 Series H)
Governmental Activities· Animal Shelter 2008 Governmental Activities· Neighborhood Branch Library 2009
Interest Rates 2.00%-7.5% 4,04%-5,6%
3,50%-4.30%
1.25%-5.30%
Arnount $ 16,650,000
37,580,000
7,200,000 10,000,000
$ 71,430,000
85

(III) Detailed Notes on All Funds (Continued) The 2007 Series B Bonds were issued by the City to (I) refund its City of Berkeley 1997 General Obligation Bonds (Election of 1996, Series A), dated June I, 1997, in the principal amount of $10,000,000, of which $8,370,000 is currently outstanding (the "1996 A Bonds"): (2) its City of Berkeley 1998 General Obligation Bonds (Election of 1996, Series B), dated December l, 1998, in the principal amount of $25,000,000, of which $20,890,000 is currently outstanding (the "1996 B Bonds'): (3) its City of Berkeley 1999 General Obligation Bonds (Election of 1996, Series C), dated August 1, 1999, in the principal amount of $14,000,000, of which $12,085,000 is currently outstanding (the "1996C Bonds" and, with the 1996A Bonds and the 1996B Bonds, the "1996 Bonds"), and ( 4) and to pay for costs of issuance of Bonds. The 1996 Bonds were issued to acquire property, expand and retrofit the Main Library, internally retrofit (as the most cost-effective means to achieve earthquake safety) and improve the Martin Luther King, Jr. Civic Center building, and revitalize the downtown/ Civic Center area. On June 7, 2007, the City of Berkeley issued $41,245,000 of General Obligation Bonds with interest rates ranging from 4.000% to 5.000% to advance refund prior General Obligation Bonds with interest rates ranging from 5.375% to 5.375% and a par value of $42,425,000.
The net proceeds from the issuance of the General Obligation Bonds were used to purchase U.S. government securities and those securities were deposited in an irrevocable trust with an escrow agent to provide debt service payments until the bonds were called on July 9, 2007 and September 9, 2007. The advance refunding met the requirements of an in-substance defeasance and the term bonds were removed from the City's government-wide flnancial statements.
2008 Animal Shelter Bonds
On January 9, 2008, the City of Berkeley issued $7,200,000 of General Obligation Bonds with interest rates ranging from 3.50% to 4.30%. Interest is payable semi-annually on March 1 and September I, and principal is payable annually on September I. The bonds were issued to finance a new Animal Shelter to replace the existing shelter in the City of Berkeley, and to pay for costs o!' issuing the bonds. The General Obligation bonds mature on September 1, 2037, but are callable on or after September 1, 2017.
2009 Neighborhood Branch Library Improvement Project Bonds
On April 14, 2009, the City ofBerkelcy issued the first series of bonds to be issued from an aggregate authorized amount of$26,000,000 of General Obligation Bonds duly approved by at least two-thirds of the voters voting on Measure FF at an election held on November 4, 2008, to provide funds to finance renovations, construction, seismic and access improvemonts, and expansion of program areas at four neighborhood branch libraries in the City. The interest rates on the bonds range from 1.25% to 5 .30%. Interest is payable semi-annually on March I and September 1, and principal is payable annually on September I. The General Obligation bonds mature on September I, 2039, but are callable on or af\er September I, 2019.
86

(III) Detailed Notes on All Funds (Continued) Annual debt service requirements to maturity for general obligations bonds are as follows:
Governmental Activities Y cars Ending June 30 Principal Interest
2010 $ 2,730,000 $ 2,973,202 2011 2,695,000 2,928,697 2012 2,675,000 2,822,153 2013 2,855,000 2,713,895 2014 3,015,000 2,586,134
2015-2019 16,845,000 10,849,834 2020-2024 15,365,000 7,438,486 2025-2029 15,635,000 4,078,998 2030-2034 3,565,000 1,783,110 2035-2039 3,605,000 712,079
2040 2,445,000 17,325 Total $ 71,430,000 $ 38,903,913
On November I, 2002, the City issued $17,865,000 in General Obligation Rcfmtding bonds to refund
its 1996 Measure G (Series A) and 1995 Measure G (Series B) General Obligation bonds. The
interest rates on the Refunding bonds range between 1.35%-4.50% and the final maturity is
September l, 2020.
The 2002 General Obligation bonds were issued to finance facilities to increase the level of fire
protection in the City, including the construction of a jointly funded, multi-jurisdictional fire station,
the seismic retrofitting of City buildings which house public safety personnel and equipment, the
replacement of water mains and the seismic retrofitting of other City buildings.
Advance Refunding of General Obligation Bonds:
The 2007 Series A llonds were issued by the City to ( l) refund its City of Berkeley 1997 General
Obligation Bonds (Election of 1992, Series C), dated July 1, 1997, in the principal amount of
$10,500,000, of which $8,740,000 is currently outstanding (the "1992C Bonds'), and (2) and to pay
for costs of issuance of the Series A Bonds. On June 07, 2007, the City of Berkeley issued $4,340,000 of General Obligation Bonds with interest rates ranging from 4.000% to 5.000% to
advance refund prior General Obligation Bonds with interest rates ranging from 4.800% to 5.625%
and a par value of $8,975,000.
The net proceeds from the issuance of the Refunding General Obligation 2007 Series A Bonds were
used to purchase U.S. government securities and those securities were deposited in an irrevocable
trust with an escrow agent to provide debt service payments until the bonds were called on July 9,
2007. The advance refunding met the requirements of an in,substance defeasance and the tcnn bonds
were removed from the City's government-wide financial statements.
87

(III) Detailed Notes on All Funds (Continued) Revenue Bonds
The government also issues bonds where the government pledges income derived from the a<:quired or constructed assets to pay debt service.
Revenue bond debt service requirements to maturity are as follows:
Governmental Activites Business·t~EC Activitcs Year Ending
June JO Princi£al Interest PrinciEal Interest
2010 $ 1,485,000 $ 770,307 $ 275,000 $ 175,180 2011 1,480,000 707,780 285,000 166,243 2012 2,455,000 647,078 300,000 156,624 2013 1,460,000 585,931 305,000 146,124 2014 1,470,000 522,930 320,000 135,143
2015-2019 3,515,000 1,815,436 1,780,000 483,494 2020-2024 1,925,000 1,171,547 1,245,000 106,900 2025"2029 2,525,000 545,632
2030 595,000 16,958
$ 16,910,000 $ 6,783,599 $ 4,510,000 $ 1,369,708
Certificates of Participation
On April 1, 2003, Berkeley Joint Powers Financing Autlmrity issued $27,950,000 in Certificates of Participation on behalf of the City to purchase and renovate the building at 1 94 7 Center Street. Annual principal payments on the debt will range from $265,000 in FY 2007 to $1,795,000 in FY
2033. Interest rates will range from 2.5% in FY 2005 to 5.00% in FY 2033, The Certificates of Participation will be repaid from the income derived from leasing floors in the acquired building and the leasing costs saved by housing some City departments' staff in the building. Certificates of Participation debt service requirements to maturity are as follows:
Year Ending Business-type Activities
June 30 Principal Interest
2010 $ 675,000 $ I ,21 0,196
2011 695,000 I, 189,946
2012 720,000 1,167,011
2013 745,000 I, 141,811
2014 770,000 I, 114,805
2015-2019 4,340,000 5,090,345
2020-2024 5,365,000 4,067,581
2025.2029 6,755,000 2,683,275
2030-2033 6,690,000 856,250
$ 26,755,000 $ 18,521,220
88

(III) Detailed Notes on Alll!'unds (Continued) Lease Revenue Bonds
Theatre facility and park acquisition: On October 1, 1999, BJPFA issued $9,125,000 in lease
revenue bonds, on behalf of the City, to acquire a new theatre facility and a 6.4 acre park and park
facilities. Interest rates ranging from 4.1%-5.7% are payable semi-annually on April I st. and October 1st. Principal is due annually on October I st.
Garage improvements: On July 19, 2005, BJI'FA issued $5,620,000 in lease revenue• bonds, on
behalf oft he City, to refund, at a lower interest rate, the outstanding bonds that were issued to finance
improvements to the Center Street and Sather Gate garages, and to finance certain new
improvements to the garages. Interest rates ranging from 3.25%-4.25% arc payable semi-annually on
March I st. and September 1st. Principal is due annually on October 1st. The bonds mature March I, 2022 and are collateralized solely by the City's pledge of the net revenues of the City's Off Street
Parking Fund.
Refunding Pension Bonds
The City has an obligation pursuant to an ordinance to make payments, on behalf of the Safely
Members Pension Board, to certain retired City police and fire personnel. On May l, 1998, the City
issued debenture bonds in the amount of $12,415,000 to rd'und certificates of participation, which
were issued to purchase a funding and risk agreement that provides payments to the Safety Members
Pension fund to as~ist in funding the City's pension obligation. Interest rates range from 3.8%-5,25% and are payable semi-annually on June I st. and December I sL Principal is payable annually on June
I st.
Tax Allocation Bonds
The Berkeley Redevelopment Agency (BRA) had two tax allocation bond issues outstanding as of June 30, 2009, as follows:
• West Berkeley &development Project Refunding Bonds of2005: On October 6, 2005, BRA
issued $7,880,000 in bonds to dofcasc and redeem the outstanding I996 West Berkeley
Development Project bonds and the I997 Subordinated Tax Allocation Bonds. The
refunding bonds will mature on June I, 2015, and interest is payable semi~annually on
December 1st and June lsi. Interest rates range from 2.8%,4.75% and arc payable
semi-annually on June I st. and December 1st. Prinoipal is payable 1mnually on June 1st. The
bonds are secured by Tax increment revenues.
• West Berkeley Redevelopment Project Subordinated Taxable Tw: Allucatiun Bonds of 1997:
On December I, I997, BRA issued $1,000,000 of subordinated taxable tax allocation bonds
with variable interest rates to finance the cost of implementing the Redevelopment Plan. The
bonds are term bonds and will mature on December 15, 2012. 'J'hc bonds arc secured by Tax
increment revenues.
89

(III) Detailed Notes on All Funds (Continued) Changes in Long-Term Liabilities
Long-tcnn liability activity for the year ended June 30, 2009, was as follows:
Governmental Activities Bonds payable:
General obligation bonds Revenue bonds
Total bonds payable
Capital leases Notes and loans payable Claims and judgments Compensated absences Net OPEB obligation Net pension obligation
Governmental Activities
$
Beginning llalance
64,255,000 \8,420,000
82,675,000
473,090 5,590,426
19,911,928 13,899,080
217,992 3,383,798
$
Additions
10,000,000
10,000,000
4,439,583 1,894,000 8,261,416 9,275,883
484,815 2,103 396
$
Reduttions
(2,825,000) $ (I ,51 0,000)
(4,335,000)
(473,091) (668,566)
(6,057,000) (8,838,887)
Ending Balance
71,430,000 16,9\0,000
88.340,000
4,439,583 6,815,860
22,116,344 14,336,077
762,807 5 487,194
Due Within One Yr
$ 2,730,000 1.485,000
4,215,000
362,015 187,000
7,026,000 1,087,635
Long-term Liabilities $ 126,211,314 $ 36,459,093 $ (20,372,544) $ 142,297,865 $ 12,877.650
Business-type Activities Certificates of participation Revenue bonds Notes payable Compensated absences Net OI'EB obligations
Business-type Activities Long-tenn Liabilities
$
$
27,410,000 4,780,000 4,431,772 2,121,\84
86,222
38,829,178
Compcns"tcd Absences
$
$
386,271 1,823,849
171,269
2,381,389
$
$
(655,000) $
(270,000) (108,\45)
(1,508,293)
26,755,000 4,510,000 4,709,898 2,436,738
251,491
(2,541,438) ""$~J,.s,6,.69;,;, 1::2s'=
I
$
675,000 275,000 113,011 390,078
1,453,089
It is the policy of the City to record the cost of vested vacation and sick leave as earned. Earned vacation and sick leave that is taken during the year and the amount of the vacation that can be sold back to the City (the greater of one half the balance or 160 hours) is payable from the fund(s) the employee's salary or wage is chargeable to. The vested compensated absences balances for employees who retire or otherwise leave the City are paid from the Sick Leave and Vacation Payouts Internal Service Fund at the time of departure.
Internal Service Funds
These funds predominantly serve the governmental funds. Accordingly, long-term liabilities for them are included as part of the totals above for governmental activities. At June 30, 2009, $473,924 in compensated absences, $22, J 16,344 in claims and judgments payables, and $54,552 in Net OPEB
Obligation arc included in the above amounts. The liabilities for workers' comp~nsation arc paid tl·om the Workers' Compensation Internal Service Fund and the liabilities for public. liability claims are paid from the Public Liability Internal Service Fund.
90

(lU) Detailed Notes on All Funds (Continued) Special Assessment Debt Without City Commitment
On June 1, 2002, the City issued $9,750,000 in Community Facilities District No. I bonds (for disaster tire protection), pursuant to the Mcllo-Roos Community Facilities Act of 1982 (being section 53311 et seq. of the California Government Code and City Council Resolution #66,615-N .S). The bonds were issued to finance a mobile disaster fire protection system for the delivery of auxiliary fire fighting water, including transpot1ation pumping units, ultra large diameter hose, transport and support vehicles, portable hydrants, accessory fittings, hose bridges, and a storage site or sites, together with incidental expenses related thereto. These bonds will be repaid from amounts levied against property owners benefited by the disaster fire protection system. The amounts levied against property owners to repay the bonds arc accounted for in an agency fund. The faith and credit or taxing power of the City is not pledged to the payment of the bonds. Accordingly, the debt has not been included in the basic financial statements. The bonds are due in annual installments ranging from $270,000 to $760,000, and have an interest rate ranging between 3.0% and 4.75%. The City is not obligated in any way to repay the debt in the event of a default. The total principal outstanding as of June 30,2009 was $7,435,000.
Conduit Bond Issues
On June l, 1992, the City issued refunding revenue bonds on behalf of Alta Bates Medical Center in the amount of $93,200,000. This issue was refinanced in August 1997 for $88,660,000. The amount outstanding at June 30, 2009 totaled $62,140,000 and is due as follows:
August 30, 2008 to August 15, 2009 August 20, 2009 to August 30, 2023
$ 3,125,000 59,015,000
$ 62, 140,000
In addition, on June I, 1993, the City issued variable rate revenue bonds on behalf of the Berkeley Young Men's Christian Association in the amount of $10,755,000. The bonds were re-oiTcrcd on June l, 1998. The amount outstanding at June 30, 2008 totaled $8,515,000 but it was fully paid in July 2008 by a re·oiTcring of bonds in July 2008. The amount outstanding at June 30, 2009 totaled $15,865,000. These bonds are not included in the accompanying financial statements as neither the faith and cr~dit nor the taxing power of the City of Berkeley have been pledged to the payment of these obligations.
91

(111) Detailed Notes on All Funds (Continued) Tax Revenue Anticipation Notes Payable
The City issued $25,000,000 of tax revenue anticipation notes with a coupon rate of 4.0% and a yield of 2.25% in October 2008, in order to alleviate the strain on working capital prior to the receipt of property tax revenues in December, The notes are recorded in the General Fund. Interest and principal on these notes are payable on October 29, 2009 by the General Fund. The City has maintained a MIG-I rating on its short-term issues. 1\ schedule of changes in the Tax Revenue Anticipation Note follows:
July !, 2008 Increases Decreases June 30, 2009 $ 25,000,000 $ 25,000,000 $ 25,000,000 $ 25,000,000
Pledged Revenue
• City Pledge to Berkeley Joint Powers Financing Authority: On July 19, 2005, the City issued $5,620,000 of bonds called the Revenue Honds, 2005 Series A (City of Berkeley Parking System Financing Project), which were collateralized solely by the City's pledge of the net revenues of the City's Off Street Parking Fund. The bonds were issued to refund, at a lower interest rate, the outstanding bonds that were issued to finance improvements to the Center Street and Sather Gate garages, and to finance certain new improvements to the garages. The City payments pledged as of June 30, 2009 total $7,349,634, and the pledged City payments are scheduled from fiscal years 20 I 0 to 2022. The City has pledged and assigned to Berkeley Joint Powers Financing t.uthority approximately 68.6 percent of the City's rights to the net revenues of the Off Street Parking Fund. For FY 2009, the pledged revenues totaled $562,725 compared with debt service of$450, 180.
• City Pledge to The Bank of New York Trust Company: On October 5, 2005, the Berkeley Redevelopment Agency (BRA) issued $7,880,000 of bonds called tho West Berkeley Redevelopment Project 2005 Refunding Tax Allocation Bonds. The bonds were issued to fund various redevelopment projects of the BRA's West Berkeley Redevelopment Project and to refund, at a lower interest rate, some outstanding bonds. Tax increment revenues are pledged in their entirety to the payment of principal and interest on the bonds. Pledged BRA payments arc scheduled from fiscal years 2010 to 2015. BRt. has pledged and assigned to The Bank of New York Trust Company (on behalf of the bondholders) approximately $8,970,204 or 100 percent of the BRA's rights to the tax increment revenues. For FY 2009, the pledged revenues totaled $1,495,034 compared with debt service of $948,855.
• City Pledge to Depository Trust Company (DTC): On October2l, 2008, the City of Berkeley issued $25,000,000 of FY 2009 Tax and Revenue Anticipation Notes. The Notes were issued to provide moneys to meet the City's General Fund cash flow requirements during the 2008-09 fiscal year commencing July 1, 2008 and ending June 30, 2009, including current expenditures, capital expenditures, and the discharge of other obligations or indebtedness. The City pledges to deposit in a special fund (a) an amount equal to 50% of the principal amount of the Notes in January 2009; (b) an amount equal to 50% of the principal amount of the Notes in the month of May 2009; and (c) an amount sufficient to pay interest
92

(III) Detailed Notes on All Funds (Continued) as due on the Notes at their maturity, in the month of May 2009, The City pledges $26 million in General Fund taxes and other revenue received in 2008-09. Pledged City payments arc scheduled from fiscal years 2009 to 2010. The City has pledged and assigned to DTC (on behalf of the note holders) approximately $26 million or 11.5 percent of the
City's rights to the General Fund annual revenues. For FY 2009, the pledged revenues totaled $26 million compared with debt service of$26 million.
Restricted assets
The balance of the restricted asset accounts in the enterprise and governmental funds arc as follows:
Revenue bond construction account Revenue bond debt service reserve account
Building Acquisition Fund: COP acquisition and construction account COP lease principal payment account COP debt service reserve account
Governmental Funds: RDA 2005 Proceeds Account RDA 2005 Redevelopment Fund Account RDA 2005 Reserve Account RDA 2005 Interest Account RDA 2005 Special Fund Account RDA 2005 Principal Account
Subtotal
Other debt service fund accounts
Grand Total
$
$
3,108,026 456,624
3,564,650
7' 166,503
1,889,600
9,056,103
1,481,738 521,977 788,000
18 654,246
904 3 446,883
808,602
16,876.237
93

CITY OF BERKELEY
Notes to the Basic Financial Statement (Continued) June 30, 2009
IV. Other Information
A. Restatement of Fund Balance and Net Asset.~
1. Governmental ActMtie~·:
Bala01e She<!
G"'rn"""lall'unds uthor Other
Oenerru 011111~ Libory CDBO P•k Ca~I!J Ooveml1l!ntat Adjuslment on Governmental
fund fund Fund Fund Tax Improvement l'unds Activities fund b•Mee1Nct Assets, at June 30, 2008, ~ pre;io~ly r<fl'lrted
I 48,302,641 $24,430,705 $2,043,632 !4,181,558 $2,383,895 $21,213,835 l44,m,m $89,186,101
Rcstatt.:"ments:
C•h (484,792) 4&4,792
D~erred Revenue (470,478)
Notes Receivable (ll,818)
Inter~! P'Yable 470,418 (470,478)
Nctc payable (6,000)
Interest payable·
internal ~rvicc fund (80,61t)
Interest accrued (\,129,33 I) fund J.IMcos.~clloscb, atlune JO, 2008, as restated I 47,311,849 $24,410,101 $2,043,612 14,666,350 12,383,895 l20,ill,J51 144,792,411 $38,['19,827
S~lem<ol of
N<t !"et
Govemrocntal
Aclil'ilies
$ 2)6,748,328
(170,478)
iJJ,818)
(6,000)
(80,67t)
(1,129,331)
I lli,048,029
94

(IV) Other Information (Continued)
2. Business-tvpe Activities: .
Refuse Marina Clean Stonn Penn it Servk< Off-street P~king Bldg. Pu•~a~ Description Collection Operations Sonitary Sewer Water Center Parking Meter &Mtt~ Total
rund balance at 6!30108 $ 6,793,111 $ 4,615.511 $ 118,140,016 $ 19,625,860 $ 5,113,120 $ 11,948,911 s 944,211 $ I ,656.l8l $ 169,491,249
Restatements:
Interest Payable (192,764) (51,600] (493,119) (148,483)
Restated net asscts at 6/30103 $ 6,793,171 $ 4,422,147 $ 118,140,016 $ 19,625,360 $ 5,773,120 $ 11,891,317 ! 944,271 $ I, I 58,264 $ 168,748,166
B. Risk Management
The City is exposed to various risks of loss related to torts; theft oJ; damage to and destruction of assets; errors and omissions; injuries to employees; and natural disasters.
1. Public Liability The City has excess coverage for Public Liability claims between $350,000 and $1,000,000 through Bay Cities Joint Powers Insurance Authority (BCJPIA). The California Aililiated Risk Management Authority (CARMA) provides additional coverage to BCJPII\ and its member entities !rom claims in excess of $1 million to $29 million. The program is administered through the Public Liability Internal Service Fund which is funded through transfers from the General Fund on a budgetary basis, retained earnings of$175,000 is required as of August I" each year. Disbursements from the Public Liability Internal Service Fund are restricted to the payment of liability claims, personnel and other investigation costs.
The City is a member of the Bay Cities Joint Powers Insurance Authority (BCJPIA) for its liability coverage. BCJI'IA was created in l986to develop effective risk management programs to reduce the amount and frequency of losses; to provide for pooled self-insurance among member agencies, to share the risk of self-insured losses; and to jointly purchase and provide administrative and other services including, but not limited to claims adjusting, data processing, risk management, loss prevention, "''counting services, actuarial services, and legal services in connection with the program. BCJPIA consists of I 5 cities, three towns, one joint recreation committee, one redevelopment agency and one police authority all located within the metropolitan Bay Area.
BCJPIA provides General Liability, Auto Liability, and Errors & Omissions coverage for its members in excess of the member's retained limit, or Self-Insured Retention (SIR), up to $1,000,000 per occurrence.
Each Member retains the portion of every loss that falls within their SIR, ranging from $5,000 to $500,000. The City's SIR is $350,000. BCJP!A is also a member of the California Aftiliated Risk Management Authorities (CARMA), a risk-sharing joint powers authority. When losses exceed the
95

(IV) Other Information (Continued) $1,000,000 per occurrence limit, CARMA provides coverage up to $25,000,000. BCJPIA is governed by a Board of Directors, which is comprised of appointed officials from the member entities.
Condensed audited accrual basis financial information of BCJPIA as of and for the year ended June 30, 2009 is as follows (amounts expressed in thousands):
Total assets
Totalliabilties
Net assets
Total revenues
Total expenses
Net income
$
$
$
$
22,789
(14,599)
8,190
10,255
10,377
(122)
To the extent that allocated losses and administrative expenses exceed contributions previously paid and other income, the BCJPIA may assess its member's additional premiums. Complete financial statements of BCJPIA can be obtained from: Bay Cities Joint Powers Insurance Authority, 6371 Auburn Blvd., Suite B, Citrus Heights, CA 95621-0488.
2. Workers' Compensation The City is self insured for workers' compensation. Payments are made to the Workers' Compensation Self-Insurance Internal Service Fund by transfers from all City funds. Funds are available to pay claims and administrative costs of the program.
At June 30, 2009, $922,344 and $21,194,000 have been accrued for public liability, and workers' compensation claims, respectively.
These accruals represent estimates of amounts to ultimately be paid for reported claims and upon past experience, recent claim settlement trends and other information. It is the City's practice to obtain an actuarial study on an annual basis. Although the amount of actual losses incurred through June 30, 2009 are dependent on future developments, based upon infonnation from the administrators and others involved with the administration of the programs, the City's management believes that the aggregate accrual is adequate to cover such losses.
96

(IV) Other Information (Continued) Changes in the balance of claim liabilities during the fiscal year for all sell~ insurance funds arc as follows:
Public Worker's Liability Compensation Total
l:lalanc", July I, 2007 $ 1,852,366 $ 18,137,000 $ 19,989,366 Incurred claims and changes in estimates 996,481 5,158,956 6,155,437 Claims paid (1,073,919) (5, 158,956) (6,232,875)
Balance, June, 30,2008 1,774,928 18,137,000 19,911,928 Incurred claims and changes in estimates (285,692) 8,462,747 8,177,055 Claims paid (566,892) (5,405,747) (5,972,639)
Balance, June, 30, 2009 $ 922,344 $ 21,194,000 $ 22,116,344
There were no significant reductions in insurance coverage from the prior year in public liability and there were no settlements exceeding the limits of the City's excess coverage for the past three years.
C. Contingent Liabilities
Grants
Amounts received or receivable from grant agencies are subject to audit and adjustment by grantor agencies, principally the federal government Any disallowed claims, including amounts already collected, may constitute a liability of the applicable funds. The amount, if any, of expenditures which may be disallowed by the grantor cannot be determined at this time although City management expects such amounts, if any, to be immateriaL
Lawsuits and Claims
There are a number oflawsuits and claims pending against the City. Included in these arc a number of property damage, civil suits, and personal injury seeking damages in excess of the City's insurance limits. The aggregate amount of the uninsured liabilities of the City which may result from all suits and claims will not, in the opinion of City management, materially affect the City's finances, or impair its ability to otherwise meet its obligations.
D. Defined Benefit Pension Plans
1. California Public Employee.<' Retirement System Plan Description
The City contributes to three plans in California Public Employees' Retirement System (Call'ERS). The first plan covers all of the City's fi1ll-time and part-time benefited sworn uniformed iire employees and all chiefs (Safety Fire Plan). The second covers all of the City's full-time and part-time benciited sworn uniformed police employees and all chiefs (Safety Police Plan). The third plan covers all remaining eligible City employees (Miscellaneous Plan). These plans arc agent multiple-employer defined benefit pension plans administered by CaiPERS, which acts as a common investment and administrative agent for participating public employers within the State of
97
(IV) Other Information (Continued) California. State statutes within the Public Employees' Retirement Law establish a memo of benefit
provisions as well as other requirements. The City may select optional benetits provisions from the
benefit menu by contract with CaiPERS and adopted through City ordinance. Optional benefits that
the City has contracted for the Miscellaneous Plan include, but are not limited to, the 2.7% at age 55
retirement benefit formula, single highest year final compensation credit for unused sick leave, and
post retirement survivor allowance. The benefits include (amount others) service retirement,
non-industrial disability retirement, industrial disability retirement, post-retirement death bcnetit,
and pre-retirement death benefits. CaiPERS issues a separate comprehensive annual flnancial report,
which may be obtained from the Ca!PERS Executive Office· 400 P Street, Sa~ramcnto, CA 95814.
All full,time and part-time benefited sworn uniformed fire employees and all chiefs are eligible to
participate in CalPERS Safety Fire Plan and all full-time and part-time benetited sworn uniformed
police employees and all chiefs are eligible to participate in Ca!PERS-Safety Polke Plan. All other
full-time, regular "at will" and part-time employees in tho career service are required to be enrolled
in the Cali'ERS Miscellaneous Plan. CaiPERS pension benefits vest after five years of service. The
Safety Plans pension benefits arc based on the employees' years of service, age and final
compensation and the Miscellaneous Plan pension benefits arc based on the employee's years of
Call'ERS bcnct1ted service, age at retirement, and single highest year of compensation. These benefit
provisions and all other requirements arc established by State statute and City ordinance.
Part-time and hourly employees working less than half time are excluded from Ca!PERS
participation regardless of the number of hours worked through an hourly exclusion contract
amendment. These employees are enrolled in the Public Agency Retirement System, (PARS), which
is established under lntcmal Revenue Code Section 40l(a) as a tax qualified multiple employer trust.
Funding Policy
Miscellaneous Plan members are required by statuto to contribute 8% of their annual covered salary.
The Employer Paid Member Contribution (EPMC) is the method the City uses for reporting the
employee contribution for Miscellaneous Plan employees. CaiPERS' recognizes the liPMC method
of making the employee contribution in Public Employment Retirement Law (PERL) Section 20691.
The 8% employee contribution is not included in base pay but is instead made through a separate
payroll transaction to CalPERS as "special compensation" and is not subject to federal or state taxes
until the money is distributed at time of retirement or when otherwise withdrawn from Ca!PERS.
Ca!PERS' recognizes the EPMC as "special compensation'' in the California Code of Regulations (Chapter 2 of Division I of Title 2, Subchapter!, ArticleS) Section 571(a)(l). Safety Fire Plan and
Safety Police Plan members are required to contribute 9% of their annual covered salary.
The City is required to contribute the actuarially dctennined remaining amounts necessary to fund
the benefits for its members. The actuarial methods and assumptions used arc those adopted by the Ca!PERS Board of Administration. The required employer contribution rate for the year ended
June 30, 2009 was 16.293%, 25.329%, and 36.003% for Miscellaneous Plan, Safety Fire Plan and
Safety Policy Plan employees, respectively. The contribution requir~ments oft he plan members arc
established by State statute, and the employer contribution rates are established and may be amended
by Ca!PERS.
98
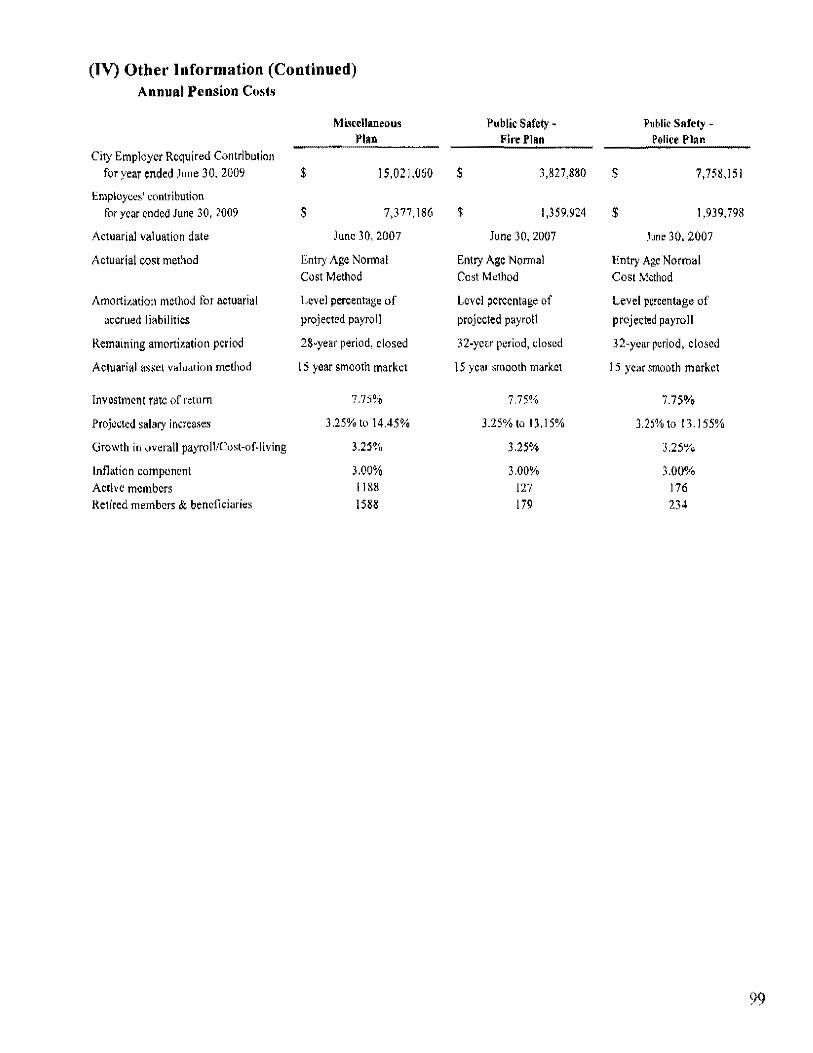
(IV) Other Information (Continued) Annual Pension Costs
City Employer Required Contribution for year ended June 30, 2009
Employees' contribution
tbr year ended June 30, 2009
Actuarial valuation date
Actuarial cost method
Amortization method for a.:tuarial
accrued liabilities
Remaining amortization period
Actuarial asset valuation method
Investment rate ofretum
Projected salary increases
Growth in overall payroll/Cost-of-living
Inflation component Active members Retired members & beneficiaries
$
$
Miscelhmeous Plan
15,021,060
7,377,186
June 30, 2007
Entry Age Normal Cost Method
Level percentage of
projected payroll
28·year period, closed
15 year smooth market
7.75%
3.25% to 14.45%
3.25%
3.00% 1188 1588
Public Safety - Public Snfety -fire Plan P•lice Plan
$ 3,827,880 $ 7,758,151
$ I,J59,924 $ I ,939,798
June 30. 2007 June 30, 2007
Entry Age Nonnal Entry Age Normal Cost Method Cost Method
Level pcrecntage of Level percentage of
projected payroll projected payroll
32-ycar pcriodj closed 32-ycar period, closed
15 year smooth market I 5 )'Carsmooth market
7.75% 7.75~/o
3.25%to 13.15% 3.25% to 13.155%
3.25% 3.25%
3.00% ~.00%.)
127 176 179 234
99

(IV) Other Information (Continued) Thrcc"ycar trend information for the CaiPERS Plans arc as follows:
Annual Percentage Net Fiscal Year Pension ofAPC Pension
Ended Cost !APCj Contributed Obligation Miscellaneous Plan
6/30/2007 $ !2,351 ,276 100% $ N/A 6/30/2008 13,568.559 100% $ N/A 6/30/2009 15,021,060 100% $ N/A
Public Safety- Fire Plan 6/30/2007 $ 3,362,255 100% $ N/A
6/30/2008 3,664,818 100% $ N/A 613012009 3,827,880 100% $ N/A
Public Safety- Police Plan 6/30/2007 $ 6,486,421 100% $ N/A 6/30/2008 6,855,811 100% $ N/A 6130/2009 7,758,151 100% $ NIA
Funded Status and Funding Progress-CaiPERS Plans
The status and funding progress of the Ca!PERS plans arc as follows:
• Miscellaneous Plan: As of Juno 30, 2007, the date of the most recent actuarial report, the plan was 87.9% funded. The actuarial accrued liability for benefits was $521.0 million, and the actuarial value of the assets was $457.9 million, resulting in an unfunded actuarial accrued liability (UAAL) of $63.1 million. The covered payroll (annual payroll of active employees covered by the plan) was $81,759,740.
• Fire Plan: As of June 30, 2007, the date of the most recent actuarial repori, the plan was 90.9% funded. The actuarial accrued liability for benefits was $167.2 million, and the actuarial value of the assets was $152.0 million, resulting in an unfunded actuarial accrued liability (UAAL) of $15.2 million. The covered payroll (annual payroll of active employees covered by the plan) was $13,263,627.
• Police Plan: As of June 30, 2007, the date of the most recent actuarial report, the plan was 75.4% funded. The actuarial accrued liability for benefits was $238.1 million, and the actuarial value of the assets was $179.6 million, resulting in an unfunded actuarial accrued liability (UAAL) of $58.5 million. The covered payroll (annual payroll of active employees covered by the plan) was $19,033,451.
100

(IV) Other Information (Continued)
2. Berkeley Police Retirement Income Benefit Pltm Plan Description
The City sponsors a Retiree Income Benefit Plan for its Police retirees. This plan is a single employer
plan which provides defined income benefits for Police employees who retired from the City on or
after July I, I 9&9, who were also vested in a Call'ERS pension, who had ten years of service with the
Berkeley Pol ice Department and retire from the City on or after age 50.llenefits commence 1 0 years
after retirement for retirements before July 6, 1997, five years after retirement for retirements before
July 1, 2007, and two years after retirement for retirements after July I, 2007. In addition, retirees
receiving a disability or industrial disability retirement benefit from CaJPERS are eligible.
The plan is administered by The Lipman Company (TLC). The establishment and amendments of
benefit provisions are negotiated berwcen the employee bargaining units and the City, and are
approved by the City Council. The plan docs not issue a publicly available financial report that
includes financial statements and required supplementary information. At July 1, 2008, the date of
the most recent actuarial valuation, there were 184 active members, 85 retired employees receiving
current benefits and 39 retired employees in deferred pay status. The City pays a monthly income
benefit equal to the City's active employee two party Kaiser rate ($877.08 for calendar year FY 2009) regardless of marital status. The income benefit is prorated by service based on the following
years of service of the retiree, effective July 1, 2007 (prior to July 1, 2007, the vesting percentage was 75% for 20-24 years of service):
Years of Service
Less than 10 10 to 14 l5tol9
20 or more
Citv Percentage 0%
25% 50% 100%
Bcne11ts are paid from a Section 40 I (a) trust and are therefore taxable to the retiree when paid.
Benefits are payable for the retiree's lifetime, and continue to the retiree's surviving spouse for his or
her li fctime.
Funding Policy
The City's current targeted funding policy is equal to the service cost for active employees plus an
amount to amortize unfunded liabilities over an open 40-ycar period (rolling 40 yoar amortization) as
a level percentage of payroll. Plan members arc not required to contribute to the Plan. The estimated
r~quired employer contribution rate for the year ended June 30, 2009 was 3.26% of covered payroll
for Police employees. For I'Y 2009, the City contributed $822,000, which was $1,934,206 less than
the ARC of$2,756,206 for this plan. The unpaid contribution as of June 30,2009 of$5,487,194to
fund this pcnskm obligation is recorded as a liability. Any changes to the contribution requirements
of the plan arc negotiated by the bargaining units and City Labor Negotiating team, and apprc>vcd by the City Manager and City Council.
101

(IV) Other Information (Continued) The following shows the calculation of the Annual Required Contributions for FY 2009:
Normal Cost at Year End Amortization of UAAL
Annual Required Contribution (ARC)
Amount
$ 958,905 1,797,301
$ 2,756,206
The actuarial cost method used for detennining the benefit obligations is the Projected Unit Benefit Cost Method. Under this method, the actuarial present value of projected benellts is the value of benefits expected to be paid for current actives and retirees and is calculated based on certain assumptions and census data. The Actuarial Accrued Liability (AAL) is the actuarial present value of benefits attributed to employee service rendered prior to the valuation date. The AAL equals the present value of benefits multiplied by a fraction equal to service to date divided by service expected at retirement. The Normal cost is the actuarial present val~•c of benefits attributed to one year of service. This equals the present value of benefits divided by service at expected retirement. Since retirees are not accruing any more service, their normal cost is zero. In detem1ining the Annual Required Contribution, the unfunded AAL is amortized as a level percentage of payrolls over 30 years. The actuarial assumptions included (a) 6.5% investment rate of return (net of administrative expenses); (b) intlation increases are tied to the City's 2-party Kaiser premium and are assumed to be 8% for FY 20 I 0, with increases grading down by .5% per year to 5% for FY 2016 and thereafter; (c) 3% annual payroll increase; (d) 60% of retirees are assumed to retire with a covered spouse; and (c) female spouses arc assumed to be three years younger than male spouses. The actuarial value of assets was determined using market values.
The following tables show the annual pension cost and Net Pension Obligations for the three prior years and the increase in the net pension obligation for the year:
Determination of Net Pension Obligation Annual Required Contribution
Interest on prior year Net Pension Obligation Adjustment to ARC
Annual Pension Cost Contributions Made
Increase in Net Pension Obligation Net Pension Obligation • beginning of year
Net Pension Obligation • end of year
Status and Funding Progress
$ 2,756,206 169,190
2,925,396 822,000
2,103,396 3,383,798
$ 5,487,194
As of July I, 2008, the most recent actuarial valuation date, the plan was 12.7% f.lmdcd. The actuarial accrued liability for benefits was $37.2 million, and the actuarial value of assets was $4.7 million, resulting in an unfunded accrued liability of $32.5 million.
102

(IV) Other Information (Continued)
3. Safety Members Pension Fund Plan Description
The City maintains the Safety Members Pension Fund (SMPF). This plan is a single-employer defined benefit pcnsicm plan for tire and police officers that retired before March 1973. In March 1973, all active fire and police officers were transferred from SMPF to Call'ERS. The Safety Members Pension Board administers the plan. The authority under which benefit provisions are established or may be amended is the Berkeley Municipal Code chapters 4.20, 4.24, 4.28 and 4.32. At July 1, 2009, the date ofthc most recent actuarial valuation, there were 30 retired members and surviving spouses.
Service and disability retirement benefits are based on a percentage of salary at retirement, multiplied by years of service. Benefits arc adjusted annually by either:
(a) Current active salary increases (based on the same rank at retirement) or
(b) The increase in the California Consumer Price Index (with a 1% minimum and a 3% cap). SMPF also provides surviving spouse benefits.
Funding Policy
The City pays SMPF bendits on a pay-as-you-go basis. In February 1989, the B~rkcley Civic Improvement Corporation (BCIC) purchased, on behalf of the City, a Guaranteed Income Contract (GIC) from Massachusetts Mutual. This contract provides annual payments through 2018 and an annual guaranteed 9.68% rate of return (net of expenses). The City pays the difference between actual benelit payments and contract provided annual payments, from the General Fund. Additional amounts may be paid, in 2008 through 2017, under a Risk Agreement to compensate the City for the difference between the amounts paid by the City to its pensioners and the actuarially determined
amounts.
The City is required to determine the plan's annual pension cost (APC) based on the most recent actuarial valuation. The APC equals the plan's annual required contribution (ARC), adjusted for historical differences between the ARC and amounts contributed. The actuary has determined the City's annual required contribution and amounts contributed. The actuary has determined the City's ARC is the greater of (a) a 20-year amorti7.ation of the unfunded actuarial liability, or (b) actual benefit payments made for the year. For the year ended June 30, 2009, the City's ARC was $1,736,185 and was equal to the benefit payments during the year. The City contributed this amount for the year through a $745,376 payment from the GIC plus $990,809 paid from the General Fund. The actuarial liability was determined using the unit credit actuarial cost method.
103

(IV) Other Information (Continued) The actuarial assumptions included (a) 8.0% investment return, (b) 1992 CalPERS Experience Table, (c) projected annual benefit increases of 5% a year for full fluctuating and 3% a year for CPI COLAs. Both (a) and (c) include a 3% annual inflation component. The following table provides historical information of the Annual Pension Cost:
Annual Percentage Net }"'iscal Year Pension ofAPC Pension
Ended Cost jAPCj Contributed Obligation 6/30/2007 $1,816,236 100% Nit\ 6/30/2008 1,783,940 100% N/A 6/30/2009 I ,736,185 100% Nit\
Prior to 1997, the actuarial valuation did not calculate an Annual Pension Cost. Consequently, c.onsistent with GASB 27, the Net Pension Obligation at transition (July I, 1996) equaled zero, The plan's unfunded actuarial accrued liability is being amortized as a level percentage of projected payrolls on a closed basis. The amortization period of the unfunded actuarial liability ends June 30, 2017. A copy of the stand-alone financial report may be obtained at 2180 Milvia Street,
Berkeley, CA.
Contributions and benefits arc recognized in the Statement of Changes in fiduciary net assets using the accrual basis of accounting. The fair value of the SMPF assets was determined by the provisions of the guaranteed investment contract with Massachusetts Mutual.
Funded Status and Funding Progress
As of June 30, 2009, the date of the most recent actuarial report, the plan was 40.0% funded. The actuarial accrued liability for benefits was $7.6 million, and the actuarial value of the assets was $3.0
million, resulting in an unfunded actuarial accrued liability (UAi\L) of$4.6 million.
E. Other Po~·t-Employment Benefits
The City has adopted the provisions of GASB Statement No. 45 (Gi\SB 45), Accounting and
Financial Reporting for Post-employment Benefits Other 71wn Pensions. The Statement establishes standards for the measurement, recognition, and display of OPEI3 costs/contributions and related liabilities (assets), note disclosures, and if applicable, required supplementary information in the 1inancial reports of state and local government employers. See Implementation of Accounting Principles note I D for an overview ofGASB 45. The City has also adopted GASB Statement No. 43 (GASB 43), Fincmcial Reporting fiJr Post-employment Benefit Plans Other 1hcm Pension Plans.
GASB 43 applies to the City's post-employment hcalthcare plans and requires additional disclosures with respect to the hcalthcarc plans.
104

(IV) Other Information (Continued)
1. Berkeley Fire Employees Retiree Heath Plan Plan Description
The City of Berkeley Fire Employees Retiree llealth Plan (FRHF) is a single-employer dct1ned benefit medical plan administered by The Lipman Company (TLC). It is reported in an Other
Employee Benefit Trust Fund of the City. To be eligible for benefits, sworn Fire employees must
retire from the City on or after July I, 1997, be vested in a Call'ERS pension, and retire from the City
on or after age 50. Benefits commence immediately upon retirement. Benefits are payable for the
retiree's lifetime and continue tor his or her covered spousc's/domestic partner's lifetime. The
amount the City contributes toward the Fire Employees Retiree Health Plan is 4.5% per year
regardless of the amount of increase in the underlying premium rate. The establishment and
amendments of benefit provisions are negotiated between the employee bargaining units and the City
Labor Negotiating Team, and arc approved by the City Manager and City Council. The FRIIF docs not issue a publicly available financial report that includes financial statements and required
supplementary information. The City's portion of the benefit is based on the following years of service of the retiree:
Years of Service Less than I 0
!Oto 14 15 to 19 20 to 24
25 or more
City Percentage 0% 25% 50% 75% 100%
The City makes a contribution towards the medical premium. For employees who retired on or
after July l, 2006: The maximum City payment is equal to the City's percentage of the base rates of
$374.o3 per month (single pm1y) and $746.16 per month (two party) as of July 1, 2009. After Age 65
(eligible for Medicare): For all Medicare eligible retirees of retirement age, the maximum payment
is equal to the City's percentage of the 2001 single or 2·party Health Net Senior Plus rate (depending
on whether retiree has a C(lVCrcd dependent) increased by 4.5% per year. The maximum City
payment is equal to the City's percentage of the base rates of$224.27 per month (single party) and
$~48.53 per month (two party) as of July I, 2009. As of htly I, 2008, there were 117 active
employees, 3 8 retirees receiving benefits and zero terminated employees entitled to receive benefits
in the future.
Funding Policy
FRJIF plan members are not required to contribute to the plan. The City's targeted funding policy is
equal to the service cost for active employees plus an amount to amortize unfunded liabilities over 30 years (rolling 30 year amortization) as a level percentage of payroll. The employer contribution
rate for the year ended June 30, 2009 was 4.55% of covered payroll for Fire employees. The City
strives to contribute the annual required contribution oft he employer (ARC), an amount actuarially
determined in accordance with the parameters ofGASB Statement 45. The ARC represents a level of
funding that, if paid on an ongoing basis, is projected to cover normal cast each year and amortize
any unfunded actuarial liabilities (or funding excess) over a period not to exceed 30 years. The
current ARC rate is 4.60% of annual covered payroll. For FY 2009 the City contributed $620,347,
105

(IV) Other Information (Continued) which was $75,225 less than the ARC of $695,572 for this plan. Any changes to the contribution requirements ofthe plan arc negotiated by the bargaining units and City Labor Negotiating team, and approved by the City Manager and City Council.
Annual OPJ3B Cost and Net OPEB Obligation
The City's annual OPRB cost (expense) is calculated based on the ARC of the City, an amount that was actuarially determined by using the Projected Unit Benefit Cost method (one of the actuarial cost methods in accordance with the parameters of GASB Statement No. 45). Under this method, the actuarial present value of projected benefits is the value of bene tits expected to be paid for current active employees and retirees and is calculated based on certain assumptions and census data. The following tables show the components of the City's annual OPEB cost for the year, the amount actually contributed to the plan, and changes in the City's net OPEB asset to FRHF:
Determination of Net OPEU As§et Annual Required Contribution
Interest on prior year Net OPEB Obligation Adjustment to ARC
Annual OPEB Cost Contributions Made
Increase (Decrease) Net OPED Asset Net OPEB Asset· beginning of year
Net OPEB Asset • end of year
$
$
695,572 (6,281)
t
694.422 620,347
(74,075) 153,388
79,313
The following table shows the calculation of the Annual Required Contributions and employers' schedule of contributions for FY 2009:
Norma\ Cost at Year End Amortization oflJAAL
Annual Required Contribution (1\RC)
$
$
389,760 305,812
695,572
106

(IV) Other Information (Continued) Employers' Schedule of Contributions. Berkeley Fire Employees Retiree Health Plan (FRHF)
Fiscal Year Required Percentage Ended Contribution Contributed
6/3012007 $488,502 110% 6130/2008 488,502 121% 6/30/2009 695,572 89%
The City's annual Ol'FiB cost, the percentage of annual OPEB cost contributed to the plan, and the net OI'EH asset flW FY 2009 and the two preceding years were as follows:
Annual Pcrccota~c Net Fiscal Year OPED of Annual OPEB Pension
Ended Cost Contributed Asset 6/3012007 $ 488,502 110% $ 48,705 6130/2008 488,502 121% 153,388 613012009 694,422 89% 79,313
Funded Status and Funding l'rogrcss
As of July I, 2008, the date of the most recent actuarial report, the plan was 3 7.0% funded. The actuarial accrued liability for benefits was $9.3 million, and the actuarial value of the assets was $3.5 million, resulting in an unfunded actuarial accrued liability (UAAL) of $5.9 million. The covered payroll (annual payroll of active employees covered by the plan) was approximately $15, I 07,000.
Funded S lotus of the Plan Actuarial Accrued Liability (A At) Actuarial Value ofl>ian Assets
Unti.Jndcd Actuarial Accrued Uability (UAAL)
~·undcd Ratio (Actuarial Value of Plan Assetsi\JAAL)
Covered Payroll (Payroll of Active Plan Members) Ui\AL as a Percentage ofCovered Payroll
$
$
$
9,340,812 3,455,055
5,885,757
37.0%
15,107,000 39.0'(•
Actuarial valuations of an ongoing plan involve estimates of the value of reported amounts and assumptions about the probability of occurrence of events far into the future. Examples include assumptions about futur~ employment, mortality, and the healthcare cost trends. Amounts determined regarding the funded status of the plan and the annual required contributions of the employer are subject to continual revision as actual results are compared with past expectations and new estimates are made about the future. The schedule of funding progress, presented as required supplementary information following the nutes to the financial statements, presents multi-year trend information about whether the actuarial value of plan assets is increasing or decreasing over time relative to the actuarial accrued liabilities for bcnetlts,
107

(IV) Other Information (Continued) Actuarial Methods and Assumptions
Projections of benefits for financial reporting purposes are based on the substantive plan (the plan as understood by the employer and the plan members) and include the types of benefits provided at the time of each valuation and the historical pattern of sharing of benefit costs between the employer and plan members to that point. The actuarial methods and assumptions used include techniques that arc designed to reduce the effects of short-term volatility in actuarial ace. rued liabilities and the actuarial value of assets, consistent with the long-term perspective of the calculations.
The actuarial cost method used for determining the benefit obligations is the Projected Unit Benefit Cost Method. Under this method, the actuarial present value of projected benefits is the value of benefits expected to be paid for current actives and retirees and is calculated based on certain assumptions and census data. The Actuarial Accrued Liability (AAL) is the actuarial present value of benefits attributed to employee service rendered prior to the valuation date. The 1\AL equals the present value of benefits multiplied by a fraction equal to service-to-date over service at expected retirement. The Normal Cost is the actuarial present value of benefits attributed to one year of service. This equals the present value of benefits divided by service at expected retirement. Since retirees arc not accruing any more service, their normal cost is zero. ln determining the Annual Required Contribution (ARC), the unfunded AAL is amortiled as a level percentage of payrolls over 30 years on an open basis.
The actuarial value of assets was determined using market values. The actuarial assumptions included (a) 6.0% investment rate of return (net of administrative expenses); (b) annual healthcare cost trend is projected to increase at a rate higher than ·1.5% (c) benefit increases arc t1xed at 4.5% per year, based on the bargaining agreement; (d) 70% of retirees arc assumed to retire with a covered spouse; and (e) female spouses are assumed to be three years younger than male spouses.
2. Berkeley Miscellaneous Employees Retiree Health Plan Plan Description
The City of Berkeley Retiree Health Premium Assistance Plan (RHPAP) is a single-employer del] ned benefit medical plan administered by The Lipman Company (TLC). It is an Other Employee Benefit Trust Fund ofthe City, which provides retiree health benel1ts to eligible retirees and his/her spouse or domestic pattncr. The establishment and amendments of benefit provisions arc negotiated between the employee bargaining units and the City, and are approved by the City Council. The RliPAP does not issue a publicly available financial report that includes financial statements and required supplementary information.
Employe~s arc eligible for retiree health benefits if they satis(y the following requirements:
• Retirees who are at least age 50, with at least 8 years service with the City at the time of separation from service are eligible to receive retiree health benellts commencing at age 55.
• l:lenefits arc payable for the retiree's lifetime and continue for his or her covered spousc's/domcstic partner's lifetime. The City pays the monthly cost of the monthly premiums up to a participant's applicable percentage of the base dollar amount and subject to annual 4.5% increases as spcciiied in the Retiree llcalth Premium Assistance Plan
108

(IV) Other Information (Continued) document regardless of the amount uf increase in the underlying premium rate. The base monthly dollar amount paid by the City for l'Y 2008 was as Jc1llows
Age 55 to 65
Single Party
Two Party
Age 65 +
Single Party
Two Party
One Over 65/0nc Under 65
Base Dollar Amount (Rounded)
$247
$494
Base Dollar Amount (Rounded)
IBEW Local1245, SEnJ SEIU Local 1021 Local I 021 Maintenance Community
and Clerical, Public Services Employees Local 1
$24 $96
$48 $192
$271 $343
Career Benefited Unrepresented
Employees
$127
$254
$374
The City's portion of the benefit is based on the following years of service of the retiree:
Fully Completed Years of Service Ci!l: Percentage
8 30% 9 40% 10 50% 11 58% 12 66% 13 74% 14 82% 15 90% 16 92% 17 94% 18 96% 19 98%
20+ 100%
As of July I, 2008, there were I, 154 active employees, 181 terminated participants and 190 retirees.
109

(IV) Other Information (Continued) Funding Policy
RHPAP plan members are not required to contribute to the plan. The City's targeted funding policy is equal to the normal cost for active employees plus an amount to amortize unfunded liabilities over 30 years as a level percentage of payrolls. The employer contribution rate for the year ended June 30, 2009 was 1.080% of covered payroll for Miscellaneous Local 1021 Maintenance and Clerical employees and 2.16% for Miscellaneous Local I 021 Community Services and career benefited unrepresented employees. The City is required to contribute the annual required contribution of the employer (ARC), an amount actuarially determined in accordance with the parameters of GASB Statement 45.Thc ARC represents a level of funding that, if paid on an ongoing basis, is projected to cover normal cost each year and amortize any unfunded actuarial liabilities (or funding excess) over a period not to exceed 30 years. The current ARC rate is 2.44%
of annual covered payroll. For FY 2009, the City contributed $1,561,583, which was $634,551 less than the ARC of $2,196,134 for this plan. Any changes to the contribution requirements of the plan are negotiated by the bargaining units and City negotiating staff, and approved by the City Council.
Annual OPEB Cost and Net OPEB Obligation
The City's annual OPEB cost (expense) is calculated based on the ARC of the City, an amount that was actuarially determined by using the Projected Unit Benefit Cost method (one of the actuarial cost methods in accordance with the parameters of GASB Statement No. 45). Under this method, the actuarial present value of projected benefits is the value of benefits expected to be paid for current active employees and retirees and is calculated based on certain assumptions and census data.
The following table shows the components of the City's annual OPEfl cost for the year, the amount actually contributed to the plan, and changes in the Cit)·'s net OPEB obligation to RHPAP:
Determination of Net OPEB Oblieation
Annual Required Contribution Interest on prior year Net OPEB Obligation Adjustment to ARC
Annual Pension Cost Contributions Made
Increase in Net OPEB Obligation
Net OPEB Obligation- beginning of year
Net OPEB Obligation- end of year
$2,196,134 1,409
20,123
2,217,666 1,561,583
656,083
366,643
$1,022,726
II 0

(IV) Other Information (Continued)
The following shows the calculation of the Annual Required Contributions and schedule of employer contributions for FY 2009:
Normal Cost at Year End Amllrtization ofUAAL
Annual Required Contribution (ARC)
Amount
$ 1,136,834 I ,059 300
$ 2,196,134
Employers' Schedule of Contributions Berkeley Miscellaneous Retiree Health Premium Assistance Plan (RHP AP)
Fis~al Year F:ndcd
6/3012006 6/30/2007 6/3012008 6/3012009
Required Contribution
NIA $! ,269,504
I ,378,827 2,196,134
Percentage Contributed
NIJ\ 83.40% 89.50% 71.11%
The City's annual OPEB cost, the percentage of annual OPEB cost contributed to the plan, and the
net OPEB obligation fo•· FY 2009 and the two preceding years were as follows:
Annual Percentage Net t'iscal Year ort:a of Annual OPEB Pension
•:nded Cost Contributed Obligation 613012007 $ 1,269,504 89'% $ 211,324 6130/2008 I ,389,393 90% 366,643 613012009 2,217,666 701110 1,022,726
Ill

(IV) Other Information (Continued) Funded Status and Funding Progress
As of July 1, 2008, the date of the most recent actuarial report, the plan was 24.6% funded. The
actuarial accrued liability for benefits was $22.1 million, and the actuarial value of the asst:ts was
$5.5 million, resulting in an unfunded actuarial accrued liability (UAAL) of $16.7 million. The
covered payroll (annual payroll of active employees covered by the plan) was approximately $89,867,000.
Funded Status of the Plan Actuarial Accrued Liability (AAL) Actuarial Value of Plan Assets Unfunded Actuarial Accrued Liability (UAA.I,)
Funded Ratio (Actuarial Value of Plan Assets/UA.AL)
Covered Payroll (Payroll of Active Plan Members) UAAL as a P~:rcentagc ofC<:m.m;d Payroll
$
$
$
22,133,755 5.450 647
16,683,108
24,{)%
89.867,000 18.6%
Actuarial valuations of an ongoing plan involve estimates of the value of reported amounts and
assumptions about the probability of occurrence of events far into tho future. Examples include
assumptions about future employment, mortality, and the hcalthcare cost trends. Amounts
determined regarding the funded status of the plan and the annual required contributions of the
employer arc subject to continual revision as actual results are compared with past expectations and
new estimates are made about the future. The schedule of funding progress, presented as required
supplementary infonnation following the notes to the financial statements, presents multi"year trend
information about whether the actuarial value of plan assets is increasing or decreasing over time
relative to the actuarial accrued liabilities for benefits.
Actuarial Methods and Assumptions
Projections of benefits tor financial reporting purposes arc based on the substantive plan (the plan as
understood by the employer and the plan members) and include the types ofbcnctits provided at the
time of each valuation and the historical pattern of sharing ofbcnctit costs between the employer and
plan members to that point. The actuarial methods and assumptions used include techniques that are
designed to reduce the effects of short-term volatility in actuarial accrued liabilities and the actuarial
value of assets, consistent with the long"terrn perspective of the calculations.
The actuarial cost method used for determining the benefit obligations is the Projected Unit Benefit
Cost Method. Under this method, the actuarial present value of projected benefits is the value of
benefits expected to be paid for current actives and retirees and is calculated based on certain
assumptions and census data. The Actuarial Accrued Liability (AAL) is the actuarial present value of
benefits attributed to employee service rendered prior to the valuation date. The AAL equals the
present value of benefits multiplied by a fraction equal to service-to-date over service at expected
retirement. The Normal Cost is the acmarial present value of benc!its attributed to one year of service. This equals the present value of benefits divided by service at expected retirement. Since
retirees arc not accruing any more service, their normal cost is <.ero. ln determining the Annual Required Contribution (ARC), the unl\mded AAL is amorti£ed as a level percentage of payrolls over
30 years on an open basis.
The actuarial value of assets was determined using market values. The actuarial assumptions
included (a) 7.0% investment rate of return (net of administrative expenses); (b) annual hoalthcare
112

(IV) Other Information (Continued) cost trend is projected to increase at a rate higher than 4.5% (c) bcnelit increases are fixed at 4.5%
per year, based on the bargaining agreement; (d) 70% of retirees are assumed to retire with a covered
spouse; and (e) female spouses are assumed to be three years younger than male spouses.
t'inancial Statements For OPEB Plans
Statement of OPEB Net Assets and Statement of Changes in OPEB Net Assets as of and for the year
ended June 30, 2009 arc as follows:
Asset. Cash and cash equivalents Investments, at fair value
Government Sponsored Enterprises Local Agency Loans Corporate notes
Interest Re<'eivab\c
Total assets
Liabilities Retiree pension
Total liabilities
Net Assets Held in trust for OPEB benefits Total net assets
Statement of OPEB Net Assets June 30, 2009
Miscellaneous Retiree
Medical Plan
$ 1,797,002
154,979 533,000
4,518,944 253,127
7,257,052
7,257,052 $ 7,257,052
Fire Retiree Medical Plan
$ 905,827
3,224,840 44,333
~ .. H,. .. .,.,..,...,..,.,. ... .., .. .,.w.,..,..,~
4,175,000
4,175,000 $ 4,175,000
Total
$ 2,702,829
154,979 533,000
7,743,784 297,460
I I ,432,0S2
11,432,052 $ 11,432,052
113
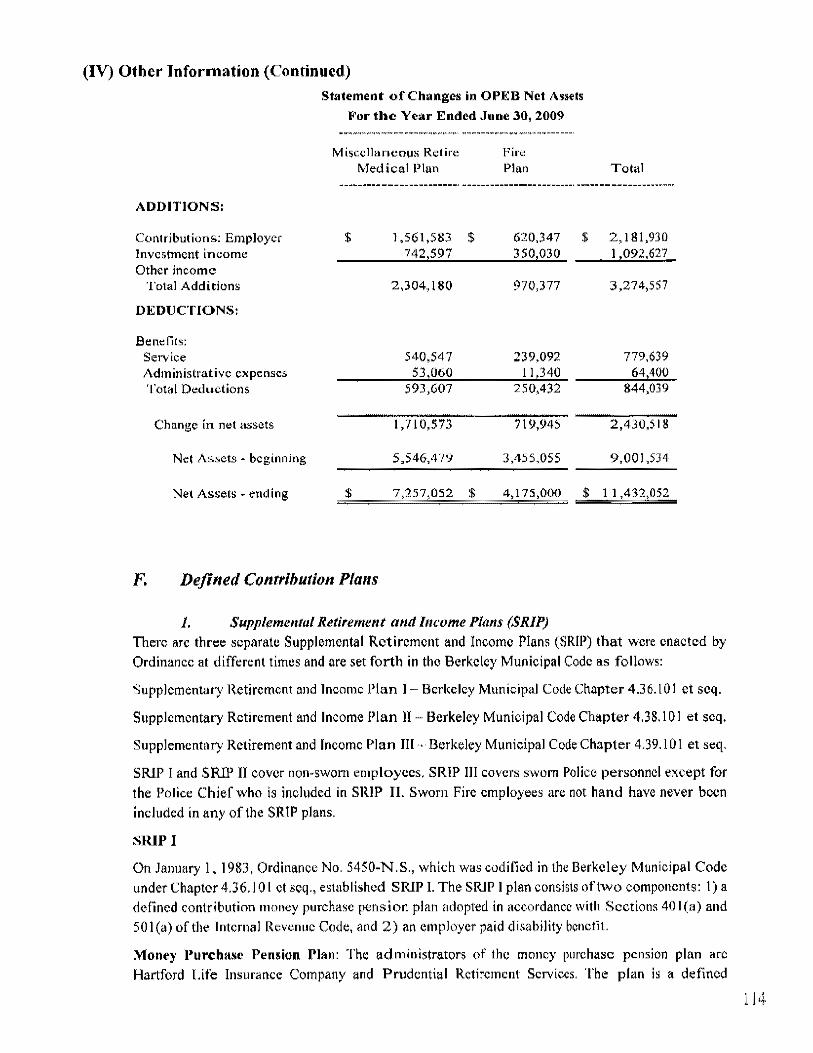
(IV) Other Information (Continued)
ADDITIONS:
Statement of Changes in OPI:B Net Assets
F'or the Year Ended June 30, 2009
Misccllanco~m Retire Medical Plan
Pire Plan Total
Contributions: EmpJoyer Jnvcstment income Other income
$ 1,561,583 $ 742,597
620,347 350,030
$ 2,181,930
Total Additions
DF;DUCTIONS:
Benefits: Service Administrative expenses Total Deductions
Change in net assets
Net Assets· beginning
Net Assets -ending
F. Defined Contribution Plans
2,304,180 970,377
540,547 239,092 53,060 11,340
593,607 250,432
I, 710,573 719,945
5,546,479 3,455,055
1. Supplcmmtul Retirement and Income P/(lns (SRJP)
I ,092,627
3,274,557
779,639 64,400
844,039
2,430,518
9,001,534
$ I I ,432,052
There arc three separate Supplemental Retirement and Income Plans (SRIP) that were enacted by
Ordinance at different times and are set forth in the Berkeley Municipal Code as follows:
Supplementary Retirement and Income Plan I- Berkeley Municipal Code Chapter 4.36.101 et seq.
Supplementary Retirement and Income Plan II- Berkeley Municipal Code Chapter 4.38. 101 et seq.
Supplementary Retirement and Income Plan III · Berkeley Municipal Code Chapter 4.39. I 0 l et seq.
SRlP I and SRIP II cover non-sworn employees, SRIP III covers sworn Police personnel except for
the Police Chief who is included in SRIP IL Sworn Fire employees are not hand have never been
included in any of the SRIP plans,
SRIP I
On January 1, !983, Ordinance No. 5450-N.S., which was codified in the Berkeley Municipal Code
under Chapter 4.36. I 01 ct seq., established SRlP I. The SRIP I plan consists of two components: 1) a
defined contribution money purchase pension plan adopted in accordance with Sections 40 I (a) and
50 I (a) of the Internal Revenue Code, and 2) an employer paid disability bene til.
Money l'urchasc l'ension !'Ian: The administrators of the money purchase pension plan arc
Hartford Life Insurance Company and Prudential Retirement Services. The plan is a defined
114

(IV) Other Information (Continued) contribution plan whereby the City contributes 5.7% of salary up to a salary of $32,400 into a tax
deferred savings account and I% of salary up to a salary of $32,400 into a self directed investment account for each covered employee. The total assets ofSRIP I available for bene tits at June 30, 2009, was $8,183,202, which was comprised of participant accounts, in the amount of $8,183,202. These assets arc the property of the individual account holders and not the property of the City. These assets
cannot be used to pay disability benefits.
Disability Benefit: Employees hired after January 1, 1983 but prior to July 22, 1988, who became disabled in their own occupation arc entitled to receive a disability income benefit equal to 60% of their highest compensation, reduced by any disability payments they receive from Social Security, State Disability Insurance, or Workers' Compensation. Employees hired after July 21, 1988 are not eligible for benefits under this plan which was closed to new enrollees.
Benefits arc payable for the disabled participant's lifetime or until recovery from disability. The third party administrator is Cigna. Currently, the City pays the monthly cost of the monthly disability benefits on a pay-as-you-go basis, There were a total of 134 closed group of participants, 56 active
employees and 78 disabled participants receiving benetlts. The unfunded liability for SRJP I at July l, 2008, the date of the last actuarial study, was $13,055,000. For FY 2009, the City paid total SIUP I disability payments of $1,657,924.
With the inception of SRJP II, the City contracted with Standard Insurance Company of Oregon to
provide a portion of disability benefits through a Long Term Disability plan for those active employees remaining in SRIP I on or after July 22, 1988. Subsequently, the City prospectively dropped the Long Term Disability plan provided by Standard Insurance Company of Oregon and purchased a r .ong Term Disability plan from Hartford Life Insurance Company. Later, the City
dropped the Long Term Disability plan provided by Hartford Life and purchased a Long Term Disability Plan from UNUM Provident. Ultimately, the City chose to delete the Long Term Disability plan and self fund the benefit. The disability benefits of all those in SRIP I disabled prior to July 22, 1988 as well as the self-insured portion of SRJP I disability benefits arising on or after July 22, 1988 applicable to SRIP I coverage, arc paid from City contributions.
SRIP II
On July 22, 1988, Ordinance No. 5900-N.S., which was codified in the Berkeley Municipal Code
under Chapter 4.38. 101 et seq., established SRIP It, a defined contribution money purchase pension plan adopted in accordance with Sections 40 I (a) and 501 (a) of the Internal Revenue Code. The plan is a defined contribution money purchase pension plan, whereby the City contributes 6.7% of salary up to a salary of $32,400 into a tax deferred savings account for each eligible employee. Enrollment in the plan is mandatory for all eligible persons hired on or after July 22, 1988, and elective for those eligible and hired prior to July 22, 1988.
SRJP Ill
Eff~ctivc January I, 1989, the City established SRJP lll, which was codilled in the Berkeley Municipal Code under Chapter 4.39. I 0 I et seq., a de tined contribution money purchase pension plan adopted in accordance with Sections 401(a) and 50l(a) of the Internal Revenue Code. The plan is a defined contribution plan, whereby tho City contributes 2% of salary up to a salary of $32,400 into a
tax deferred savings account for all sworn police officers except the Police Chief.
115

(IV) Other Information (Continued) The total assets of SRIP II and SRJP III avai I able for benefits at June 30,2009 were $50,818,420, and there were 2, I I 0 participants.
The City Council is responsible for establishing or amending (through changes in the Berkeley Municipal Code) retirement provisions and contribution requirement for all SRIP plans. These investments are held by trustees for the benefit of the participants and arc not included in the City's basic financial statements.
The City's contributions (required and actual) and covered payroll for the year ended June 30, 2009 were as follows;
City's Plan
SRlP l SRJP II SRIP III
City's Contributions
$ 103,572 $ 2,710,501
123,732
Covered %of Covered Pa~roll Pa~roll
I ,817,040 5.7% 40,456,746 6.7%
6,186,488 2.0%
116

(IV) Other Information (Continued)
2. Public Agency Retirement System (PARS) On September 14, 1993, the City Council adopted Resolution II 57,141- N.S. authorizing contract with the Public Ag~ncy Retirement System (l'ARS) to administer a 401(a) retirement plan for the City's hourly and daily employees, effective October I, 1993. This retirement plan is an alternative to participation in Social Security. The plan is a defined contribution plan wh..,reby the City and employee each contribute 3.5% of salary into a tax deferred savings account These benefits are non-forfeitable at all times, meaning that the benefit may be distributed to the employee only upon retirement or separation from service or death (with certain restrictions). All temporary and hourly employees are eligible and enrolled in the plan. There were a total of I ,062 active and I ,215 inactive participants in this plan as of June 30,2009.
Tho total assets of PARS available for benefits at June 30, 2009, was $2,860,150, which was comprised of participant accounts. The City Council is responsible for establishing or amending (through changes in the Berkeley Municipal Code) retirement provisions and contribution requirements for the PARS plan. These investments are held by trustees for the benefit of the participants and arc not included in the City's basic financial statements.
The City's contribution (required and actual) and covered payroll for the three years ended June 30, 2009 were as follows:
Contributions as Fiscal City's Covered a% of Covered Year Contributions Pa~roll Pa~roll
2007 $ 225,086 $ 5,965,517 3.75% 2008 235,521 6,280,492 3.75% 2009 243,429 6,491,367 3.75%
117

THIS PAGE LEFT INTENTIONALLY BLANK
118

REQUIRED SUPPLEMENTARY INFORMATION
(Other than MD&A)
119

CITY OF B£RKEL£Y Required Supplementary Jnlbrmui\IJo
Schedule of Revenues, Expenditures and Changes in Fund Balan~es- DuQg~t i\nd actual General Fund- Budgetary Basi~
Por the Fiscal Year Ended June 30,2009
Variance with Final ll.u(.\gct
Original Pinal Acwai 11ositivc 0Udflel Bud~l1t Amount )Ne~\\tivc)
Revenu('s: Ta~w::; $ 102,110,673 $ I 00,628,331 $ 97,673,202 {2,955, 129) Licenses and permits 283,000 283.000 342,747 59,747 lntcrgovemmcntal 9, 169,127 9, 169,127 8,959,932 (209, 195) Charge:l fOr services 5,946,797 5,853,5?5 7,666,294 1,812,719 r·mes and penalties 10,630,685 [ 0,630,685 10,553,.129 (77,356) Rents and royalties 1 I 7,020 I 17,020 112,867 (4, 153) Franchise I ,755,564 1 ,766.!79 1,848,246 82.061 lndireu C(>St retmbur~ement 4.906,977 4,!)06,977 5,3R7,S37 480.560 Investment mcome 4,800,000 4,800,000 11,546,062 (253,938) Private: C·Orttrib~ltions and donation 140,000 40.000 100,185 60,185 Mi!.lcellaneous 100,000 100,000 9S7.723 857.723
Total revenues 139,959,843 138,294.894 138,148.125 (146. 7691
J!,xp~ndltures;
Current: General govemmcnt 34,041.287 33,960,756 31.463.008 2.497,748 Public saiCTy 12.841,365 74,750,400 74,981,690 (231 ,290) Highw~;~y um.! litreets 1,860,718 2,636,963 2,203,708 433,255 Hellhh and w~lf3rc 9,970,808 l 0,3\8,007 \0,290,.591 27,416 CLJ\ture·TI"CrCMion 5,037.138 6,205,)48 5,951.586 253,762 Communny dcvelopmeht/housmg 3.205.747 3,956.~ 12 3,661,400 295,212 Economic development 2.61.5,18!1 2.200,088 415,100
D.:bt s~.:rvicc: Principnl retirement 364,624 364,624 364,623 lnt~tr!!:>l 1.1nd fbc<.~l cht~rg(::> 872,497 872.497 668,?01) 204.291
Total expenditures 1 )0,316,270 135.680.395 131,784,901 3,895,494
Excess (deficit:ncy) ofreven~,.~es over (undt•r) cxpt•nditure~ 9,643.573 2,614,499 6,363.224 3,748,725
Other financin~ soun:cs (uses):
Tr~nsfers in 3.626.521 3,626,521 3.35 I ,209 (275,31 :l)
Tr~mfcrs ou1 (15.534.971) (16,590,!SS!S) (16.590,857) I lnt~rfund rcpuyrnenlli 12.201.21! 12.201,211 lntcrfund ~dv~nces (9,8S8.018) (9.858,0 18) S~ll.': of i.:<'lpit>Jl assets I ,983 1,983
Total other nnancmg: inflows (outflows) (11,908,453) ~IO,i94,411) 2,069.866
Net changes in fund balancets (2,264,880) (10,349,1~38) (4,531 ,247) 5,818,591
Fund bttla.nces, beginning of year, as rclmm:cl 28,652,539 28,652,539 28.652.539
Fund bttlan<:c, end or year $ 26,387,659 $ 18,302,701 $ 24,121.292 $ 5.818,591
F.:xplanation or differences bttween budgetary b~tsl~ I(! modin~"tl accn.1ftl bll!~l~;: Net ch~11_ge in fund balanccti- budgetary basJs $ (4,531,247)
R,eceivable accrual 4,148,459 Due to/from adwm.:;!;l~ 9,858,018
!)ue to/from repnyments (12,201.212)
Note rec:e1v~blcs ac~ruals (I 00,44$) Net charltt: in fund balances · GAAf' bas1s I (2,826,426)
120

CITY 011 UERKELI!::Y
Rt111.1in:d SUJ)plementary ln(ormalton Schedule or Reven\Jes, EixpenOiture$ ~nd Changes in Fund Balances· Budgii!'t and actual
Special Revenue hmds (irnnt..~ Fund- Budg!!tary l3o.sis
Fot tht: Fiscal Year Ended June 30, 2009
VAriance with FinalBudg.et
OrlginBI Final Achnd Positive Bud£tl Budget Amount {Nesatlve~
Rt'VC)HJtsl
Taxes L1censes and permits lntergovernmentl11 $ 21,568,072 $ 29,050,683 $ 25,862,.528 $ (3,188, I 55! Charges for services 124,864 124,864 129,134 4,270 Fines and penalties Rents illnd royuliies. Franchise Indirect cost reimbursement Investment income 12,300 12,300 22,073 9,773 1~rivate contribution> ltnd donation 9,286 9,286 Miscellaneous 13,095 IJ,095
lotal revenue~ 21,705,236 29,200,942 26,036,116 p,164.826l
l£xpenditures: Current:
Gcm:r!:!l government 8,000 51,164 31,&64 19,300 Public ~afety 189,454 786,598 706,508 80,090 H1ghway and streets 3,360,285 2,896,538 2,220,031 676.507 Hc!:!lth and wclf"re 17,355,754 18,887,199 16,256,760 2,630,439 Cu lture-rt\:rtfltion 153,472 L419,DI .'J98,552 820,779
Commun1ty dc:vclopmcnt!housLn!.l 3.716,494 9,548.401 7,1 S5,221 2,363.240 £t:onr.>mk. dcv(;\opment 1,071,784 1.959.520 1$37,000 1,122520
ToUll expenditures 25.855,243 35,548,811 :;:?,835,93.5 7,712,876
Ex~e$s ( dcfi~.:lc:ncy) of revenues over (under) c:><pr:ndLlures !'· 150,007) 16.347,869) (1,799,819) 4,548,051
Other financing sourc~s (usts);
Transfer~ in 2,651,897 4,103,794 4,103,793 (I) rransfers out (32\,688) (321 ,689) (I)
lntl·rfund rcpaymmts 2.700 2,700 (2,700)
Sf1lc of Cllpital as~ets
Total other financmg inflows (outflows) 2,654,597 3,7&4,806 3,782,104 ~2,70ll
Nd ~hllnges in fund balances (I ,495,41 0) (2,503,063) 1.982.286 4,545,349
Fund balance~. beginning of year, as resu~ted (1.9S2.443)
f~r!>d b~l~nce, end or year $ (9,447,853) $ (10.51S,S06l (5,970, I 57) l 4,54.'>,349
Exphtll~tion of difference!!. between budget~ry l)psis to modified scCI'IUII basb: Net r.:htmge in fund balances· budgtntry b.asis $ 1,982.2~6
R¢Ct:Jvable accrual (1,615,501] N!)t!;': receivables accruals 9$3,497
N~t ch<mgt: in l'und balan.:es- GAAP b1;1s1s 1,320,2~2
121

CITY 01' BERKELEY Required Supplementltry lnform11iton
Schedule of Revenues. Expenditures and Changes 111 Fund Balances. Budget ancl tJctu~l Special Revenue funds
Library Fund Budgetary Bans For the Fl~cal Year Ended June 30, 2009
Original J•'lnnl
B11datt Budget Rcl't'RU(..":i;
TnKes $ 13,520,415 $ 13,520,415 $ Li\;Cili:iCS and pt:rmilti
lnlcr~ovcmmcntal 164,000 321.000 Charges for services Fin~&s and penalties 250,000 250,000 Rcms and roynltics Pranchise Indirect C05t reimbursement lnYestrnent tncome Private contributions and donation Miscellaneou$
Total revenulls 14,097,415
l!.xpenditures: Current
General govemrtit.:nt 26,)07 26,307 Public. safety llighway and strccls llealttl and welfare Culture-recreation 14,098,951 14,.506,!11 Comm1.m1ty O:evelopmcntlhousing Ecunomic dt:velopmcnt
Debt scrvi•·e· Pnncipal retirement Interest and fiscal charges Cost of Issuance
Total expenditures 14,125,258 14.533,118
E:>.:Cei1s (de.ficicn~y) or revenues OV!;ll (und~:r) ~:xpl:nditures (190,843) (135,103)
01ht::r fintmting souttes (lists): Proct::t:ds of Loans Si~le of i:I.IPiial assets
Total other flnancmg lnt1ows(0\1t0ows)
Ntt rhanges in fund balancel!i (190,843) (4)5,703) Fund balances, beginning of year. as r~stated 2.041,646 2.041.646
f'und balance; end ofyeMr $ l ,850,803 $ J ,605,943
Explanation of differenres tK•tween budKctAry ba~iii to mOOIOcd ac!:rual basi\; Net change in fund balan.:es - budgetary bn~ is
Rt·ccivablc ucctual
N~1 ~;.hangc m fund balance5 . OAAP basis $
Variance wiih Final Budget
Actunl P!tSitivc Amount fNegative~
13,651,761 1l1,346
173,264 (153,736) 1,006 1,006
l75,307 25,307 195 195
32.967 32.967 48.477 48.477 50,463
14.233.440 1)6,02.5
12,758 13,549
14,1 1&,106 388,705
35,425 (35,425) 14,166,289 366,829
67,1.'51 502,854
10,000,000 10,000,000
10,067,627 502,8$4 2.Q41 ,646
12,109.273 $ 502.8:54
10,067 ,6].7
135,978
)0,203,605
122
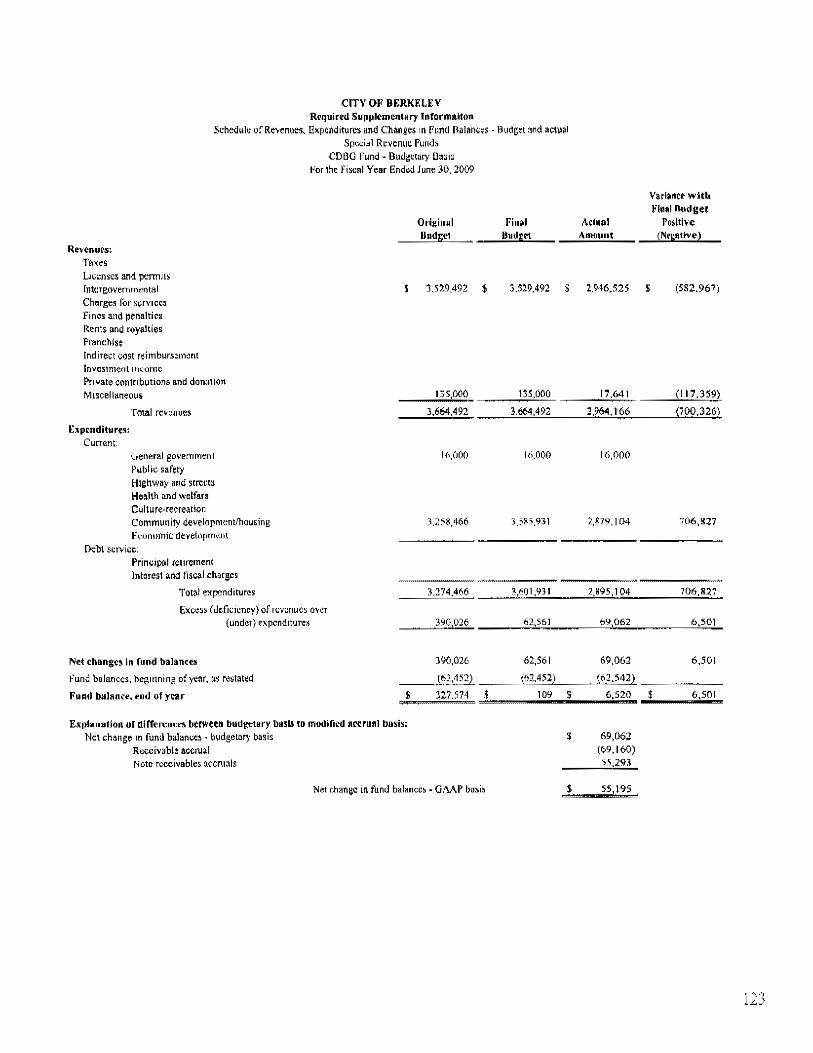
CITY OF DF.RKF.LEV
Rl1quirtd Sur•1dementary llifor•naiton Schedule of Revenues. Expenditurelio and Changes 10 fund B<~lrmc~:s- Uudget ~nd actuill
Special Revenue Funds COIJG Fund~ Budgetary 13u:;is
t•or the fiscal Year Ended June 30,2009
OriginMI
Dudgel
Revenues: Ti\x.es Llc~.:mcs and penn as rntcrgovemmental 1529,492 Charges for scrv1cc5 Fines and penalties Rents anO royalties franchis-e Indirect CQSt r~;;imburs~rncnt lnvestm~;nt mcome Private contnbutions and donation Miscellaneous ll5,000
Total revenues 3,664,492
[;,pcndltures: Current:
General government 16,000 Pub I ic safety Highway and streets Health and welfare Culture-recreation Community de.velopmcntlhousing 3,258,466 Economic development
Debt service Princ1pul remement lnttlrcsl and fis~l charges
Total expenditures 3.274,466
Exce~s (ddkicncy) of revenue~ O\ICr (underf "'"pcndtture,o;
Net change!. In rund balance!!
f'und bnlances, hegmning ofye~r. as restattld
Fund balance, end of year $
E~~:phmation of di(fcrcnccs berw<een budgetary basis 10 modified accrual busis: Net change in fund bal~nce~- budgetary basis
Receivable &.lX:rual Note receivables accruals
390,026
390,026
(62,452)
127,514
$
.I
Net chan~c in fund balanccb- GAAP bt~si~
Final Bud£~1
),529,492 $
3.664,492
16.000
3,585,931
3,601,931
62,561
62,561
(6::\,452)
109 I
$
$
Act~al
A,mQUIIt
2,946,525
2,964,166
16,000
2,879,104
2,M95, l 04
69,062
69,062
i62.542)
6,520
69,062 (09,160) 55,293
55,195
Vari~utce witll l'"lnallludget
Po<h·e ~Ne&!llive~
$ (582,967)
(700,326)
706,s::n
706,8'47
6,501
6,501
6,501
123

CITY Oto' 8EKK1.:lK\" Required Supplementary Xntormalton
Scht:dule of Rev<:nues, E;xpenditures and Ch~nges in Fund Balances· Budget und at;tual Special Revenue Fund$
Park Tax· Budgetary Basis Fm the F1~ca! Year Ended June 30, 2009
Original l<imtl
u~rtset Uud&et Revel'luts:
Tl\10\es $ 8,502,545 $ S,502,54S $ Licensc~ und pt:rmit~ Intergovernmental Charges for services 30,000 30,000 Pines aniJ p-.:naltit:~ Rents and royalties MOO 6,000
Frant;his..: Indirect co~t rcimbur~ement Investment income 48.454 48,454
Private contributions and donation Miscellaneous
Total revenues 8.586,999 8 . .186.999
Expenditures: Current
General ~o-.·emment 35,590 63,6:50 Public gafCty 24,379 24.379 Highway and streets Health and welfare Culturo·wcreati<Hl 8,430,602 8,934.017 Community developmem/housmg 36,841 Economic development
Debt service !'Jrincipal retiremt!nt lntere~t !lnd 11sca\ charges
Total expenditures 8,490,571 9,058,887
Exr;ess ( dcftcmncy) of revenues owr (under) expenditures 96,428 (471.8881
Oth~:r rmandn& 5-oun:es (us~:li):
Tran.sfm 111
Transfers oul (2.813} (31,7~5)
Tt>tal other financm& inflows (oulflow~) (2,813) (31,795)
Nll't .;-"ti~UI&es h\ fUnd balances 9M15 (503,683)
fwnd balances., begmnlng of year, as restated 2,384,207 2,384,207
Fund balance, end Qfy~ar $ 2,477,822 I 1.880.524 $
E:q>l.attiUlort or differenets between budgetary ba~i.s fo modified a~::crual ba"ls: N~:l r;hungc in fund bul(lnces • budget~:~ry basis
Receivable accrual
Net cl'laut;e in fund halatt¢¢S . GAAP basi~ $
Vari~nce w•th Final Budget
Actual Posltiv~
Amount !~"eaattve!
8.:583,427 $ 80,882
ll,ODB 3,008
9,138 3.138
61.078 12.624 3.400 3.400
241,303
1.931 ,353 344,354
56,962 6,688 ~4,802 (423)
8.378,868 555,149 7,296 29,54!i
8_467,927 590,960
463,426 935.314
(34.608) (2.813)
iJ4,608} (2,813)
428.818 932.501
2,384,207
2.813,025 932,501
428,81 s 9$.1QQ
526,918
124

CITY OF BERKELEY
Required Supplementary Information (Unaudited) Schedules of Funding Progress
June 30, 2009
REQUIRED SUPPLEMENTARY INFORMATION
I. Defined Pe11.1·ion Benefit Plan.\' - Scltedl//e)· of F11nding Progres.v Unfunded
Actuarial Actuarial Actuarial Actuarial Accrued Accrued Valuation Asset Liobility· Liability· Funded Covered
Date Value l':ntrr Age l!AAL Ratio PHJ::rOII C•IPERS · Miscelloneous Plan
613012004 $ 3$7,304,381 $ 408.971,423 $ 51,667,042 87.4% $ n. 712.339 613012005 385,672,520 441,277,883 55,60;,363 87.4% 72,105,102 6130/2006 418,618,449 481.343,029 62,724,580 87.0% 76,605,875 6/J0/2007 457,881,7>1 520,958,627 63,076,896 87.9% 81,759,740
CaiPERS · Pub1i< Safety· •·ire Plan 6130/2004 $ 128,333,519 $ 146,034,709 $ 17,701,190 87.9% $ 11,390,372 0/3012005 135,306,578 153,414,869 18,108,291 88.2% 11,737,911 6/3012006 143,235,774 162, 199,258 18,963,484 88.3% 12,845,910 6/3012007 152,029,266 167,177,150 15,147,884 90.9% 13,263,627
C•IPERS- Pub II< Safety- Police Plan 6130/2004 $ 145,130,198 $ 194,487,m $ 49,356,914 74.6% $ 16,638,253 6130/2005 155,076,488 208,291,410 53,214,922 74.5% 17,075,698 (>/30/2006 166,753.852 223,237,577 56,483.725 74.7% 18,079,875 6/30/2007 179,644,843 238,151,498 58,506.655 75.4% 19,033,451
Berkeley Police Retirement htcome Benefit Plan 7/112004 $ 2,906,452 $ 11,542,756 $ 8,636,304 25.2% NIA 7/IIZ006 4,008,562 28,981,990 24,973,428 138% 16,387,000 711/2008 4,734,673 37,241,858 32,507,185 12.7% 21,898,343
Berkeley Safety Members Pension Fund 613012005 $ 5,137,982 $ 11,458,099 $ 6,320,117 44.8% NIA 6130121106 4.540,267 10,509,882 5,969,615 43.2% N/A 6130/2007 3,994,202 8,748,286 4,754,084 45.7% NIA 6/30/2008 3,496,723 8,153,217 4,656,494 42.9% NIA 6/3012009 3.042,685 7,611,896 4,569,211 40.0% NIA
UAAL as
Penentage of Covered
Parroll
71.1% 77.1'% 81.9% 77.1°/0
155.4% 154.3% 147.6% 114.2%
296.6% 311.6% 312.4% 307.4%
NIA 152.4% 148.4%
NIA N/A N/A N/A N/A
125
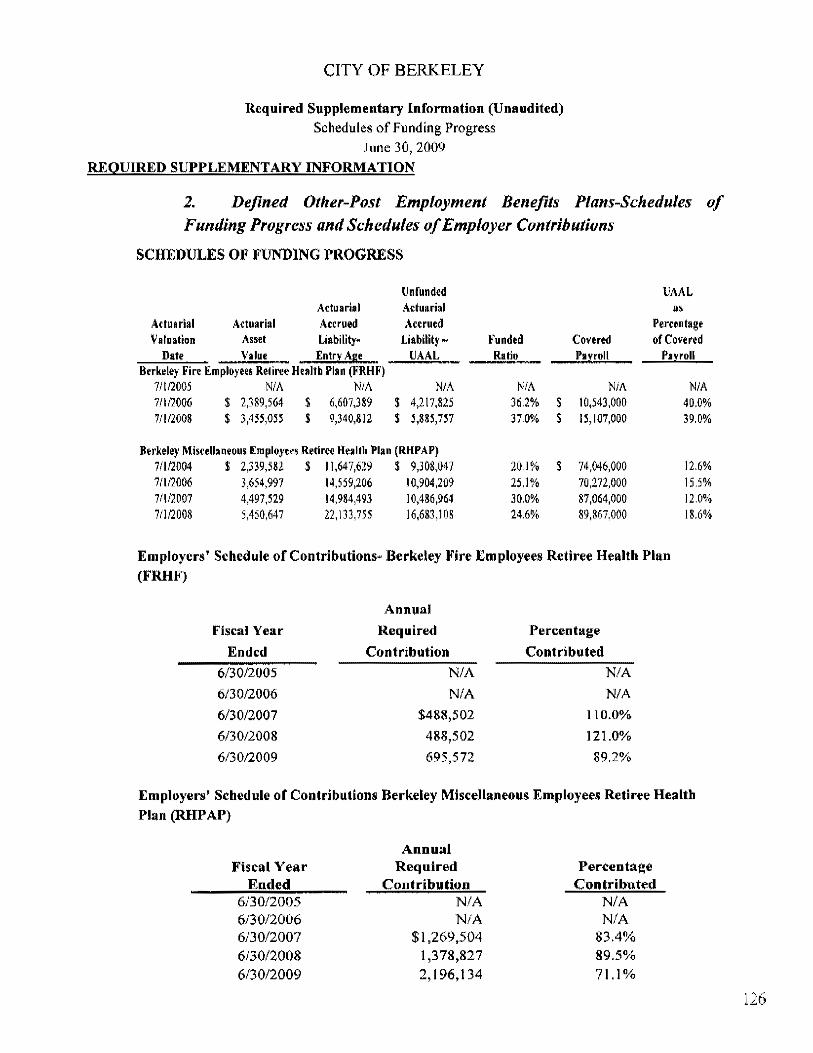
CITY OF BERKELEY
Required Supplementury Information (Unaudited) Schedules of Funding Progress
June 30, 2009 REQUIRED SUPPLEMENTARY INFORMATION
1. Defined Other-Post Employment Benefits Plans-Schedules of Funding Progress and Schedules of Employer Contributions
SCHEDULES OF FUNDING PROGRESS
Unfunded UAAL Actuarial Aduarial ••
A.dullrial Actuarial Accrued Accrued Percentage Valuation Asset Liability· Liability- ··unded Covered ofCovmd
Date Value Entr~ Ase UAAL Ratio Pa;troll P.11!roll Berkeley Fire Employees Retiree Health Plan (FRHF)
7/1/2005 N/A N/A N/A N/A N/A N/A 7/112006 $ 2,389,564 $ 6,607,389 $ 4,217,825 36.2% $ 10,543,000 40.0% 7!112008 $ 3,455.055 $ 9,340,812 $ 5,885, 757 37.0% $ 15,107,000 39.0%
Berkeley MiS<etlaneous Employees Retiree Health Plan (RHPAP) 71112004 $ 2,339,582 $ 11,647,629 $ 9,308,047 201% $ 74,046,000 12.6% 71112006 3,654,997 14,559,206 10,904,209 25.1% 70,272,000 15.5% 71112007 4,497,529 14.984,493 10,486,964 30.0% 87,064,000 12.0% 71112008 5,450,647 22,133,755 16,683,108 24.6% 89,867,000 18.6%
Employers' Schedule of Contributions· Berkeley J<'ire Employees Retiree Health Plan (FRHF)
Annual
Fiscal Year Required Percentage
Ended Contribution Contributed
6/30/2005 N/A N/A 6/30/2006 N/A N/A 6/30/2007 $488,502 110.0%
6/30/2008 488,502 121.0%
6/30/2009 695,572 89.2%
Employers' Schedule of Contributions Berkeley Miscellaneous Employees Retiree Health Plan (RIIP AP)
Annual Fiscal Year Required Percentaj~C
Ended Contribution Contributed 6/30/2005 N/A N/A 6/30/2006 N/A NIA 6/30/2007 $1,269,504 83.4% 6/30/2008 I ,378,827 89.5% 6/30/2009 2,196,134 71.1%
126

CITY OF BERKELEY
Notes to Required Supplementary Information June 30, 2009
REQUIRED SUPPLEMENTARY INFORMATION (Continued)
Budgetary Information
Prior to June 1, the City Manager submits to the City Council a proposed operating budget or the upcoming fiscal year. The proposed budget includes a summary of the proposed expenditures and
forecasted revenues, and available cash balances (i.e. budget basis fund balance/net assets) for the City's General Fund, Special Revenue Funds (Except Fire Assessment District; UC Berkeley Reimbursement/People's Park: Lillie Wall Memorial; Other Special Deposits; Impounded Neuter; and East Bay Public Utility); Capital Project Funds (except Public Education/Government Access Facilities; Street Improvement Fund: and Theatre !Park Acquisition; all Enterprise Funds, and all Internal Service Funds (except Electrical Warehouse Fund and the Catastrophic Loss Fund).
The City Council adopts an annual budget by resolution prior to July I of each fiscal year. The annual b11dget indicates appropriations by fund. The Council may adopt supplemental appropriations during the year. At the fund level, expenditures may not legally exceed appropriations. The City Manager is authorized to transfer budgeted amounts between departments or programs within any fund. Any revisions or transfers that alter the total appropriations of any fund must be approved by the City Council.
The City utilizes a five-year capital plan, which is updated annually. Capital Project Funds are appropriated annually as part of the regular budget process. Any unused funds are re-appropriated to the following fiscal year until the project is completed.
The City Council approved an original annual appropriation ordinance of $320,953,621 and made supplementary budget appropriations totaling $70,334,981 during the year. The supplementary budget appropriations consisted of the following: ( 1) FY2008 outstanding encumbrances of$19,993,881; (2) unencumbered carryovers of $24,212,989; and (3) other budget adjustments of $26,128,111.
Encumbrance accounting, under which purchase orders, contracts and other commitments for the expenditure of money are recorded in order to reserve that portion of the applicable appropriation, is employed as an extension of fonnal budgetary integration in governmental fund types.
Encumbrances outstanding at year-end are reported as reservations of fund balances. They do not constitute expenditures or liabilities because the commitments will be honored during the subsequent year.
Budgetary Results Reconciled to Results in Accordance with GAAP
The adopted budget adopted and actual results reported in the governmental fimds' budgetary schedules are on a modified cash basis, which is inconsistent with generally accepted accounting principles (UAAI'), Under this budget basis, revenues arc recorded when rcoeived, and interlund loans and repayments are roc\!rdcd as other financing sources/uses, instead of increases and decreases in the due to/due from accounts,
127

THIS PAGE LEFT INTENTIONALLY BLANK
128

Combining and Individual Fund Statements and
Schedules
129

CITY Of BERKELI':Y Budgetary Companson Schedule
Ciiplt<~l Pto)ects Fund Schedule of Revenues, Expenditures and Chane~s in Fund Balances· Budget und actual
For the Fiscal Yt:u.r Ended June 30, 2009
Re¥eoues: Tf:lx-.":i Licenses and permits lntcrgovcmm~;ntal
Charge-s f(lr scrvH.:es $
rines and penalties Rents and royalties Franchtse Indirect c.os1 reimbursement lnvestmetlt incornr Priv;ue cantributwn~ and donati(ln Miscellaneous
Total revenue~
£xpenditures: Current·
General government Public $1lfety l-lighway and streets Health and welfare Culture-recreation Clunrnunity dc:velopmentfhousing Economi,; Oevelopm.:nl
D~:bt ~~rvicc.
Prmcipal reuremcm tr~teresl and t1scR! ch~:~rgc~
leta! cxpendLtureJ>
Excess (deficiency) ~lf reYenues over (under) expenditures
Other finanting sources (u!!e.s);
Transfers in Transths out
Total other flnancin~ 1ntlows (outnows)
Net changes in fund balun<:es
fund balances, bc~inning of year, as re$tated
Fund I.H1hmce, (,!Jld (If year
Explanation ofdiff~:.•reoet:.~t betwe~o budgetary bt~sis 10 modified accrll~tl ba.~i.'>; Net change in fund balances- budgetary ba~is
Note rcceivftbles accruals
Orlghud Budget
25,000
2,328,786
3,281,308
588,149 986.609
\1.204.205)
8,QOO,OOO
(786,98))
7.~13,017
8,812
13,176,931!:
13,18:5,750
$
$
Net change in rund bal~nces- (JAA.P bam
Final lJudg:e1
$
25,000
25.000
1,518,081
9,274,',M2
2,198,604 1.998.fl77 1.171.481
16.161,985
8,000,000 ( 1,309,680)
6,690,320
(9,446,665)
13,176,938
3,730,273 $
$
$
AduaJ Amount
238,395
14,435
$5,579
308,409
J31.666
5,017,593
713,869 1,345,802
216,504
7,625,433
8,000,000 ( 1,446,663)
6,553.337
(763,686)
13,176,938
12.41.3,2.52
(763,686)
\26,99>)
(790,682)
VllriRnce with
F"inal Budgtt Positive
(Negotiv~~
238,395
30,579
268.974
1,186.415
4.257,349
1,484,735 653,075 954,977
8.536552
(136.98))
(136.983)
8,668,544
8.668,544
130
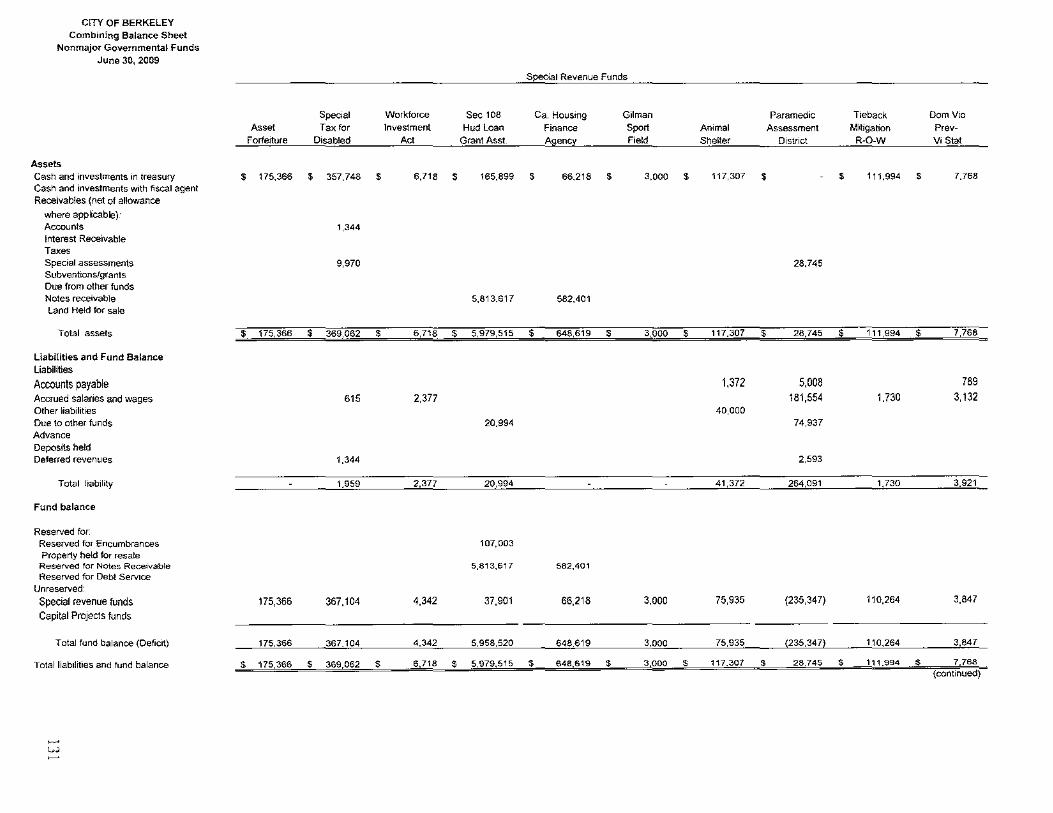
CITY OF BERKELEY Combining Balance Shoot
Nonmajor Governmental Funds June 30, 2009
Special Revenue Funds
Spe~al Workforce Sec 108 Ca. Housmg Gilman Paramedic Tieback DomV10 Asset Tax for Investment Hud Loan Finance Spo" An• mal Assessment Mitigation Prev-
Forfeiture Disabled Act Grant Ass! Agenc~ Field Shelter D1stnct R-0-W V• Stat
Assets Cash and investments on treasury ' 175,366 $ 357.748 $ 6.718 s 165.899 $ 66.218 $ 3,000 s 117,307 $ $ 1,1.994 $ 7.768 Cash and investments woth fiscal agent Receivables (net of allowance
where applicable)· Accounts 1,344 Interest Receivable Taxes Spec1al assessments 9,970 28.745 Subvenllonslgrants Due from other funds Notes receivable 5,813.617 582,401 Land Held for sale
Total assets $ 175,366 $ 369.062 $ 6,718 s 5,979,515 $ 648,619 s 3.000 $ 117.307 $ 28.745 $ 111,994 $ 7,768
Liabilities and Fund Balance Liabilities
Accounts payable 1,372 5,008 789
Accrued salanes and wages 615 2,377 181,554 1.730 3,132
Other liabiht1es 40,000 Due to other funds 20.994 74,937 Advance Deposits held Deferred revenues 1,344 2,593
Total liability 1,959 2.377 20,994 41,372 264,091 1.730 3.921
Fund balance
Reserved for Reserved for Encumbrances 107,003 Property held for resale Reserved for Notes Rece•vable 5,813,617 582,401 Reserved for Debt Service
Unreserved· Special revenue funds 175,366 367,104 4,342 37,901 66,218 3,000 75,935 (235,347) 110,264 3,847
Capital ProJects funds
Total fund balance (Oefic•t) 175,366 367.104 4.342 5,958,520 648.619 3.000 75,935 (235,347) 110,264 3,847
Total liabilitieS and fund balance s 175,366 $ 369,062 s 6.718 $ 5.979,515 $ 648,619 $ 3 000 $ 117.307 $ 28,745 $ 111.994 $ 7 768 (continued)

CITY OF BERKELEY Combining Balance Sheet
Nonmajor Governmental Funds June 30, 2009
Special Revenue Funds
Affordable lnclusionary Condo! Special Gas Spec•al Gas ChEid Housing Conversion Playground T" T" State State Slate State Care Program Program Cam!=J Fund (30) Fund (Disc) 2106 2107 2107.5 SB 300
Assets Cash and mvestments •n treasury $ 92,590 $ 520,658 $ 44,629 $ 985.579 $ 13,724 $ 64,745 $ $ 381,980 $ 129.873 s 401.197 Cash and Envestments w1th fiscal agent Rece•vables (net of allowance
where apph'cable). Accounts 7,990 7,291 Interest Receivable Taxes Special assessments Subventions/grants 30,997 27,714 57,853 10,000 Due from other funds Notes receivable Land Held for sale
Total assets $ 123.587 $ 520,658 $ 44,629 s 985,579 $ 13,724 $ 64 745 $ 35,704 $ 447 124 $ 139,873 $ 401.197
Liabilities and Fund Balance L•abll•\les
Accounts payable 147,995 10,951 15,119
Accrued salaries and wages 1,833 532 116.527 19,958 16,694 Other liabilities Due to other funds 99,807 Advance Deposits held Deferred revenues 30,997 7,991 7,293
Total liability 30,997 1,833 '" 264,521 138.707 39,106
Fund balance
Reserved lor ReseTVed lor Encumbrances 54,574 "' '" Property held for resale Reserved for Notes Rece•vable Reserved for Debt Serv•ce
Unreserved Special revenue funds 92.590 518,825 44,097 666,483 13,724 64,745 (103,445) 407,838 139,873 401,197
Capital Projects funds
Total fund balance (Deficit) 92,590 518.825 44,097 721,057 13,724 64.745 (103,003) 408,018 139,873 401,197
TotaiiEabEIEtEeS and fund balance $ 123,587 $ 520,658 $ 44 629 $ 985,579 $ 13,724 $ 64,745 $ 35,704 $ 447,124 $ 139.873 $ 401,197 (continued)


CITY OF BERKELEY Combining Balance Sheet
Nonmajor Governmental Funds June 30, 2009
Spec•al Revenue Funds
Downtown Telegraph No Shatck Underground Business Business Business Business Employee
Street Solano Ave. Distnct Improvement Improvement Improvement Economic Citywide Computer M1les lighting Bid Fund D1stnct DIStrict Distnct DeveiOJ;~ment Rlf Loan Fund ,,b
Assets Cash and investments in treasury $ 417.750 $ 1.459 $ $ 300.755 $ 63,339 $ 3,914 • 484.230 • 99,564 $ 31,059 $ 193.641 Cash and investments with fiscal agent Receivables (net of allowance
where applicable): Accounts 5,512 Interest Receivable Taxes Special assessments 12,940 Subventions/grants Due from other funds Notes receivable 291,533 729,661 Land Held for sale
Total assets • 436.202 $ 1,459 $ $ 300,755 $ 63,339 $ 3,914 $ 775,763 $ 829 224 • 31,059 • 193,641
Liabilities and Fund Balance Liabilities
Accounts payable 61,257 125,000 265 Accrued salaries and wages 41.140 Other habilotoes Due to other funds 108,871 11,124 Advance Deposots held Deferred revenues 5.514
Total liability 107,912 108,871 125,000 '" 11,124
Fund balance
Reserved for· Reserved for Encumbrances 4,109 125,000 93,396 40,972 Property held for resale
Reserved for Notes Receovable 291,533 729,661 Reserved for Debt Servoce
Unreserved: Special revenue funds 324,182 1,459 (108,871) 50,755 {30,057) 3,914 483,965 88,438 31,059 152,669
Capital Projects funds
Total fund balance (Deficit) 328.291 1.459 (108,871) 175.755 63.339 3.914 775,498 31,059 193,641
Total liabilities and fund balance

CITY OF BERKELEY Combining Balance Sheet
Nonmajor Governmental Funds June 30, 2009
Special Revenue Funds
UC Berk Employee Pnvate Public Lillie B. East Bay Dept of Other
Retmb Tra1mng uc Party Art Wall Vital Health Public Justice Special
Peo!=lle's Park Fund Settlement Stdewalks Fund Memorial Stahsltc Util1t~ Block Grant De!=lOSLts
Assets Cash and investments m treasury $ $ 946.252 $ 940,519 $ 3,971 • 136,739 $ 5,172 • 176,790 $ 3,554 $ • 89.215 Cash and investments With ftscal agent Receivables (net of allowance
where applicable). Accounts 83,106 Interest Receivable Taxes Special assessments Subventions/grants Due from other funds Notes receivable Land Held for sate
Total assets $ $ 946,252 $ 940,519 $ 87.077 $ 136,739 $ 5,172 • 176,790 $ 3.554 $ • 89,215
Liabilities and Fund Balance Liabilot•es
Accounts payable 126 17,977 6,838 1,660
Accrued salaries and wages 12,384 8,539 1.815 1.147 Other liabilities Due to other funds Advance Deposits held 89,215 Deferred revenues 83.108
Total hab1111y "' 30,361 8,539 84,923 7,985 1,660 89.215
Fund balance
Reserved for· Reserved for Encumbrances 76,566 8,892 Property held for reS8Ie
Reserved for Notes Receivable Reserved for Debt Serv1ce
Unreserved.
SpeCial revenue funds (126) 839,325 931,981 2,155 119,862 5,172 175,131 3,554
Capital Projects funds
Total fund balance (Deficot) (126) 915,891 931,981 2 155 128.754 5,172 175,131 3.554
Totall,ab•loties and fund balance $ • 946 252 $ 940.519 $ 87,077 • 136,739 $ 5 172 $ 176.790 $ 3 554 • ' 89,215 (continued}


CITY OF BERKELEY Combining Balance Sheet
Non major Governmental Funds June 30, 2009 Debt Se!Vice
Ca ital ProJect Funds Funds
Theatrel West Berk. Low & Moderate Save Low & Moderate An1mal Sale
Street 97 GO Bonds Park Park Improvement Income Island Save Shelter lease lmpwvement MeasureS A~u,s•tion Acgu,s•tion Fund Protect Fund Project Island Fund land/Bldg F1nancing
Assets Cash and mvestments in treasury $ 108,619 $ 877,109 $ $ $ 1,038,760 $ 114,525 $ ' 86.373 $ 4,116,073 $ 95,112 Cash and Investments with fiscal agent 2.003.715 96,970 Receivables (net of allowance
where applicable) Accounts 1,302 Interest Receivable 162.700 217.862 Taxes Special assessments Subventions/grants 17.127 Due from other funds Noles receivable 108,779 1,825,124 275,000 166,140 land Held for sale 458,550
Total assets $ 108,619 $ 877.109 • ' $ 3.789,631 $ 2,157,510 $ 275,000 $ 252,513 • 4,116073 $ 193,384
Liabilities and Fund Balance l1ab1l1~es
Accounts payable 33,658 35.271 Accrued salanes and wages 16,486 6,509 Other habol1t1es 229,053 176,320 Due to other funds 6,297 2,880 Advance 72,866 DepOSits held Deferred revenues 168.488 217,862
Total liability 6,297 2,880 520,551 217,862 218,100
Fund balance
Reserved for. Reserved for Encumbrances 286,058 80.798 Propeny held for resale 458,550
Reserved for Notes Receivable 108,779 1,825,124 275,000 166,140 Reserved for Debt Servtce 193,384
Unreserved
Special revenue funds
Cap1tal Projects funds 108,619 870,812 (2.880) 2,415.693 114.524 86,373 3,817,175
Total fund balance (Defic•t) 108,619 870,812 (2,880) 3,269,080 1.939,648 275.000 252,513 3,897.973 193.384
Total liabilities and fund balance $ 108,619 • 877,109 $ $ $ 3,789.631 $ 2,157.510 • 275,000 $ 252.513 $ 4,116,073 ' 193 384
(contmued)

CITY OF BERKELEY Combining Balan.;e Sheet
Nonmajor Governmental Funds June 30, 2009
Debt Serv1ce Funds
Total
09 Measure West Berk Savo 2007 GO 2002 2007 GO 2008GO NonmaJOr
FF Improvement Island Refund•ng Bonds Berk Repertory GO Refunding Refunding Bonds Animal Shelter Governmental
L•bra!1 Fund ProJect Series B Theatre Bonds Series A Measure l Funds
Assets Cash and investments m treasury ' $ 1,668 $ 151,145 $ 3,395,998 $ 188.024 $ 1,492,998 $ 575,420 $ 1,452,009 $ 31,946,729 Cash and investments w1th fiscal agent 1,443,168 35,980 645,878 29,774 4,255.485 Receivables (net of allowance
where applicable)· Accounts 914,609 Interest Receivable 380,561 Taxes 58,123 24,479 5,659 30,137 118 397 Special assessments 55.226 Subventions/grants 504.271 Due from other funds Notes receivable 9,792,255 Land Held for sale 458.550
Total assets $ $ 1.444,836 $ 151 145 • 3,490,100 • 833,902 • 1.517.477 • 610 853 ' 1.482.146 • 48.426,281
Liabilities and Fund Balance L1abih\les Accounts payable 520,806 Accrued salaries and wages 739,078 Other liab•h\les 445.373 Due to other funds 894,743 Advance 72,866
DepositS held 90,827 Deferred revenues 1,023,743
Total hab1l1ty 3.787.437
Fund balance
Reserved for. Reserved for Encumbrances 1,558,036 Property held for resale 458,550
Reserved for Notes Rece1vable 9,792.255 Reserved for Debt Service 1.444.836 151,145 3,490,100 833.902 1,517.477 610.853 1 ,482,146 9,723,843
Unreserved. Special revenue funds 12,394,011
Capital Projects funds 10,712.149
Total fund balance (Deficit) 1,444,836 151,145 3,490,100 833.902 1,517,477 610,853 1 ,482,146 44,638.844
Total liabilities and fund balance $ $ 1,444.836 $ 151,145 3,490,100 ' 833,902 ' 1 517.477 • 610,853 $ 1 ,482,146 • 4B,426 281 {concluded)

CITY OF BERKELEY Combining Statement of Revenues, Expt'llditures, and Changes in Fund Salance(Oeflcit) NonMajorGovernmental Funds For the year ended June 30, 2009
s c1al Revenue Funds
Special Workforce SEC 108 HUD CA HOUSII!Q G1lman Animal Paramedic Tieback Com Vio Affordable lndUSIOil31)' A~set Tax lor Investment Loan Grant Fmance ""' Shelter Assessment Mitigation Prev- Child Housing
Forfeiture Disabled "' Ass! Agenc;y F1eld Fund 01stnct R-0-W VI Stat Co• Program
Revenues: Taxes ' ' 887,212 $ $ s $ $ $ 2,317,180 $ $ ' ' License and permits Intergovernmental 3.000 Charges lor seiVice 39,000 39,966 23,806 3,000 Fmes and penalties 35,843 Rents and royalties Pnvate contributiOns and dona11ons 39,448 Investment 1ncome 72.411 65,892 Miscellaneous 70.616
Total revenues 35843 887212 143 027 65 892 0000 39448 2 317180 39000 39966 23808 0000
Expendilures Current
General government 7.471 32,995 7.420 Pubhc safety 14,082 3.493,900 Highway and streets 194,358 Health and welfare 49.363 Cullure-recreatiOil Community development and housing 828,501 " 35,634 Economic development 54,741 2,058 Debt Se1V1ce Pnncipal repayment 159,000 494,586 Interest arid fiscal charges 57.212 S, 109
Total expenditures 14 082 835 972 """ 218 270 499 675 32 995 3 501 320 194358 49 363 35634
Excess(def1c1ency) of revenues over (under) expend it 21,561 51,240 (54.840) (75,243) {433,783) 3,000 6.453 (1,184,140) (155.358~ {9,397) 23,808 (32,634)
Otherfonanc1ng sources {uses). Transfers m 361,152 700,000 Transfers out (10,712) Proceeds of Loans 1,894,000
Sale Of Fixed Assets
Total Other fmanc1ng sources (uses) 361152 I 894 000 689288
Change tn fund balance 21,561 51,240 306.312 1,818.757 (433,783) 3,000 6,453 (494,852) (155.358) (9,397) 23,808 (32,634)
Fund balance (defiCit). June 30, 2008 as restated 153.805 315,864 (301,970) 4.139.763 1,082.402 69,482 259,505 265,622 13,244 68,782 551.459
Fund balance (deficit), June 30, 2009 ' 175 366 ' 367 104 s 4 342 ' 5 958 520 ' 648619 ' 3 000 $ 75935 ' {235 347) s 110264 ' 3847 $ 92 590 s 518 825
(continued)

CITY OF BERKELEY Combining Statement of Revenues, E~pendltures, and Changes In Fund Balance(Defi< NonMajorGovemmental Funds for the yearend&<! June 30, 2009
S ecral Revenue funds
Condo Special Special Traffic Renlal Sales Tax Connversat1on Playground Gas Tax Gas Tax State Stale State State State State Prop Congestion Housrng Street
Program Cam~ Fund Fund 2106 2107 2107 5 SB 300 Pro~ 111 m Rel!el Fund Safe!J! lm~rovement
Revenues: ;~~ $ $ $ ' $ ' $ $ ' ' 656,524 s 667,772 ' ' Locense and permrts Intergovernmental 367,564 762.420 10,000 572.842 Charges for servoce 47,072 1,625,489 11,934 753,975 F1nes and penal~es 21,181 Rents and royalties 241,987 Private conlri~Ullons and donations 3,350 Investment Income "" 2,207 4,345 4,904 8,912 Miscellaneous ' 1,330
Total revenues 47 072 1 870 832 '"" 2 207 358 894 774 353 14345 577 746 656 524 696564 775 155
Expenditures: Current
General government 101,265 159,087 41,525 57,347 Public safety 416,169 Highway and streets 366,170 546,745 403,516 603,401 Health and welfare Culture-recteatlon 1.805.397 Commumty development and housrng 2,975 689,596 Economic development Debt Service_ Pnncipal repayment Interest and fiscal charges
Total expendotures 2 975 1 805 397 467 435 705 832 445 041 416169 603 401 74§,942
E~cess(deficiency) of revenues over (under) expendit 44,097 65,434 "" 2,207 (98,541) 68,521 14,345 132,705 240,355 93,283 28,213
Other financing sources (uses) Transfers in 471,806 "' Transfers out (4,600) Proceeds of Loans
Sale of Fixed Assets " Total other financing sources (uses) (4,600) " 471 806 "'
Change on fund balance 44,097 60,834 "" 2,207 (98,541) 68,552 14,345 132,705 240,355 93,283 500.019 "' Fund balance (deficit), June 30, 2008 as restated 660,223 13,256 62,538 (4,462) 339.466 125,528 401,197 217,158 245,326 472,192 (386,806) (691)
Fund balance {deficit), June 30, 2009 ' 44097 $ 721 057 $ 13 724 ' 64 745 s (103 003) ' 408 018 $ 139873 $ 401197 $ 349 863 $ 485 681 s 565 475 $ 103213 $ {0)
(continued)
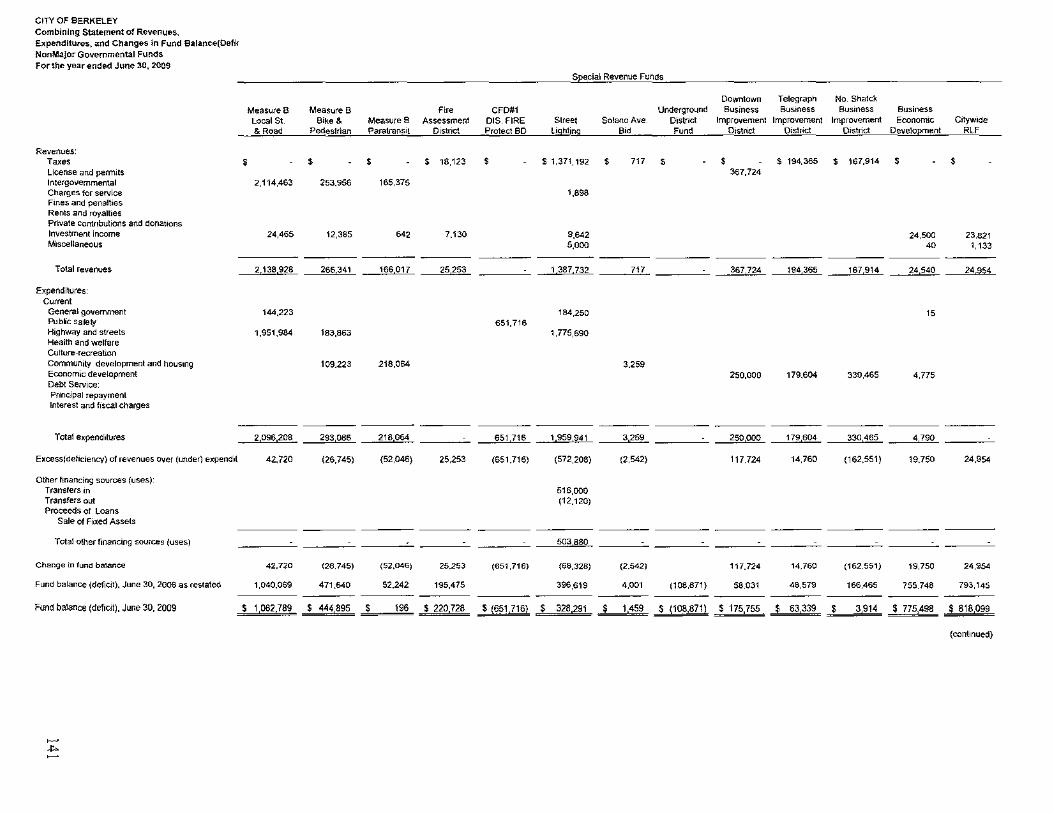
CITY OF BERKELEY Combining Statement of Revenues, Expenditures, and Changes in Fund Satance(Oefi< NonMajor Governmental Funds For the year ended June 30, 2009
s dal Revenue Funds
Downtown Telegraph No Shalck
MeasureS Measure B Fire CF0#1 Un<lerground Business Bus1ness Bus.ness Business LocalS! Bike & MeasureS Assessmenl DIS FIRE S!reet Solano Ave D1stnct Improvement Improvement Improvement Economic C•tyw•de & Road Pedeslrian Paratrans1t DIStnct Protect 80 Lighting Bid Fund o,stnct Dislrict OEstrid Deve1o2menl "'
Revenues:
·~~ ' $ $ ' 18,123 $ s 1.37t, 192 $ m $ ' s 194,365 $ 167,914 ' $ License and perrmts 367,724 Intergovernmental 2,114,463 253,956 165,375 Charges for service 1,898 Fmes and penalbes Rents and roy allies Pnvate conlnbul10ns and donatoons Investment income 24,465 12,385 '" 7.130 9,642 24,500 23.821 Miscellane¢US 5,000 " 1,133
Tolal revenues 2138928 266341 166017 25253 1 387 732 m 367 724 194 365 167 914 24 540 24 954
Expenditures: Current
General government 144,223 184,250 " Pub~c safety 651.716 Highway and streets 1,951,984 183,863 1,775,590 Health and welfare Cullure-recreaiEOn Commumty development and housong 109,223 218,084 3.259 Economoc development 250,000 179.604 330,465 4,775 Debt Serv1ce: Pnndpal repayment Interest and f1scat charges
Total expendotures 2 096 208 293 086 218064 651 716 1959941 3259 250000 179 604 330 465 4 790
Excess(de!ociency) of revenues over (under) expendol 42,720 (26,745) (52,Q46) 25,253 (651.716) (572,208) (2,542) 117,724 14,760 (162.551) 19.750 24,954
Other !Enancing sources (uses)· T rans!ers on 516,000 Transfers out (12,120) Proceeds o! Loans
Sale of Foxed Assets
Total other financing sources (uses) 503 880
Change <n fund balance 42,720 {26,745) (52,046) 25.253 (651,716) (68,328) (2.542) 117.724 14.760 (162,551) 19,750 24,954
Fund balance (defi~t), June 30, 2008 as restated 1,040.069 471,640 52.242 195,475 396,619 4,001 (108,871) 56.031 48,579 166,465 755.748 793,145
Fund balance (del1c1t), June 30, 2009 • 1 082 789 • 444 895 ' 196 s 220 728 s (651 716) ' 328 291 $ 1459 s (108,871) • 175 755 ' 63339 ' 3914 ' 775 498 $ 818099
(cont1nued)

CITY OF BERKELEY Combining Statement of Revenues, Expenditun;os, and Ch<lllges in Fund Balance(Oefl< NonMajorGovernmental Funds For the year ended June 30, 2009
S ectal Revenue Funds
Employee UC Serk Pnvale Lillte B East Say Dept of Olher Compuler Mtles Reimburse men! Employee uc "'" Public Wall Vi!al Heal!h PubliC Jus!oce Special Health Tobacco Loan Fund '"" Peo~le's Park Training Settlement Sidewalks "" Memonal Statistic U~li!1 Bloc!<. Grant Oe~OSitS State Aod Control
Revenues Taxes $ $ $ ' $ $ • ' $ $ • • $ $ 150,000 License and penmts ln1ergovemmental 12.690 1,772,821 30,764 Charges for seovoce 400,957 798,091 86,039 32,350 Fines and penalties Rents and royalt1es Pnvate contnbutions and donaloons lnvestmenl1ncome 1.407 "' Miscellaneous 100,000
Total revenues 12690 400 957 798 091 86039 100 000 1 407 32 350 "' 1 772 821 180 764
E•pendilures: Curren1 General government 13.672 480,898 1,200 Public safely Highway and slreets 69,582 Heal!h and welfare 10,120 2,138,146 160.942 Cullure-recreatlon "" Commu111ty development and housing 320,915 Economic developmenl 122,211 Debt Service: Pnncopal repayment lnleresl and fiscal charges
Total expenditures 13672 ""' 480 898 320915 69 582 123411 10120 2 138 146 160942
Excess( deficiency) of revenues over (under) expend1t (13,672) 12,030 (79,941) 477,176 16,458 (23,411) 1,407 22,231 '" (~65,325) 19,822
Other f1nanc1ng sources (uses)· Transfers in 88,772 '"' 1,953,018 T ransters out (2,604,024) Proceeds of Loans
Sale of F1xed Assets
Total other f1nancmg sources (uses) 887n '"' (651,006)
Change '" fun<! balance (13,672) 12.030 (79,941) 477,176 16,459 65.361 1,407 22.231 '" '"' (1,016,331) 19,822
Fund balance (deficit), June 30, 2008 as restated 44,731 181,611 (126) 995,832 454,805 (14.303) 63,393 3,765 152,900 3,433 (961) 2,298,035 (24,945)
Fund balance {deficil), June 30, 2009 $ 31 059 ' 193641 ' (126) $ 915 891 $ 931981 ' 2155 s 128 754 ' 5172 s 175131 • 3 554 ' ' $ 1 281 704 ' (5123)
(continued)

CITY OF BERKELEY Combining Statement of Revenues, Expenditures, and Changes In Fund Balance{Defic NonMajor GovOJmmuntal Funds For the y&arended June 30, 2009
Sf!eCial Revenue Funds Ca it<JI Pro-eel Funds
Alameda Cty Mental Health Abandoned PubiTC MeasureG "GO capital 97GO Theatre/
State Atd PubliC lmpoundl>d Vehicle Education/ Fire Seismic Bonds Improvement Slreet Bonds '"' Park Realignment Safe!X Neuter Abatement Govt Access Fac_ Project Series 8 Administration lm~rovement MeasureS AsguisWon A<;:gUISIIIOn
Revenues. Taxes ' • $ • ' ' • ' ' ' ' $ license and permits 177,063 lntergovemmenlal 2,354,265 104,738 Charges fer seNice '"' 132,278 Fones and penalties Rents and royalties 1,812 Private ccnlribulions and donations Investment income 8,595 50,330 59,316 3.702 28,067 Miscellaneous
Total revenues 2 354 265 113333 '"' 132 278 177 063 50330 59 316 3 702 28087 1 812
Expenditures· Current General government 53.455 Public safety 241,136 Htghway and streets Health and welfare 93.030 Culture-recreation Community development and housing 112,794 Economic development Debt Service: Princtpat repayment Interest and fiscal charges
Total expenditures 241136 93030 166 249
Exoess(defideocy) of revemres over (urnler) expendtt 2,354.285 (127,802) '" 39,248 177,063 50,330 (106,933) 3,702 28,087 1,812
Other financing sources {uses): Transfers en 522,697 13,082 Transfers out (2,551,897) (3,000) Proceeds of Loans
Sale o! Foxed Assets
Total other financing sources (uses) (2 551 897) 522697 13082 (3000)
Change in fund balance (197,632) (127,802) '" 39,248 177,063 50,330 (106,933) 522,697 3,702 28,087 13,082 (1,188)
Fund balance (deficit), June 30, 2008 as restated 2,924,491 244,343 27,592 194,765 45.452 1,492,139 1,806,732 (524,308) 104,917 842.725 {13,082) (1,692)
Fund balance (defictl), June 30, 2009 • 2 726 859 $ 116541 • 28478 $ 234013 • 222 515 • 1 542 489 ' 1 699 799 ' (1,611) ' 108619 • 870812 ' ' (2,880)
(continul>d)
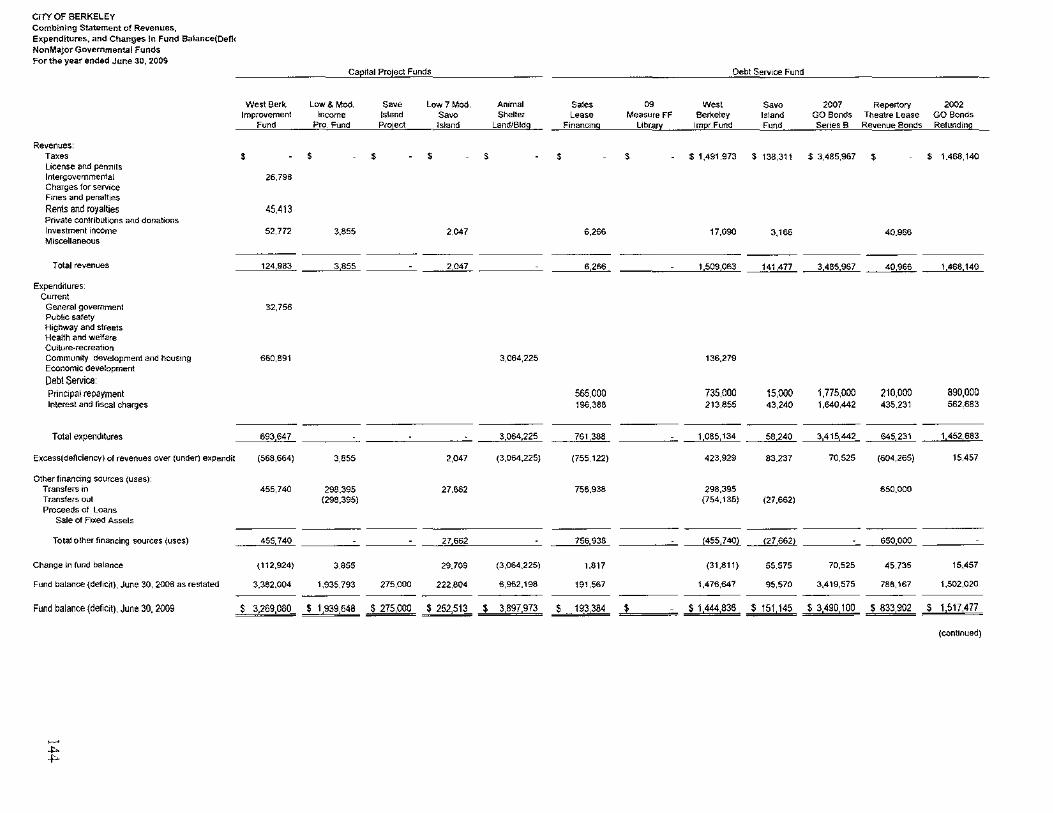
CITY OF BERKELEY Comhining Statement of Revenues, Expenditures, and Changes In Fund Salance(Defl< NonMajor Governmental Funds For the year ended June 30, 2009
Ca 1ta! Pro-ect Funds Oebl Semce Fund
West Berk. Low& Mod. Save Low7 Mod. Anomal Sates "' West $avo 2007 Repertory 2002 Improvement Income Island Savo Shelter Lease Measure FF Berkeley Island GO Bonds Theatre Lease GO Bonds
Fund Pro Fund Protect Island LandiBtdg Financmg Libra[Y 1m2rFund Fund Senes B Revenue Bonds Refunding
Revenues: Taxes ' $ ' $ $ $ $ $ 1,491.973 $ 138,311 $ 3,485,967 ' ' 1.468,140 L1cense and perm1ts lnlergovemmentat 26,798 Charges for servoce Fones and penall,es
Rents and royalties 45.413 Pnvate contribUtions and donations lnvestment1ncome 52.772 3,855 2.047 6,266 17,090 3,166 40.966 Moscellaneous
Total revenues 124 983 3855 2047 ""' 1 509 063 141 477 3 485 967 40966 1 468 140
Expenditures Current
General government 32,756 Pubhc safety H1ghway and streets Health and welfare Culture-recreatoon Communoty development and housmg 660,891 3,064,225 136,279 Economic development
Debt Service:
PrinCipal repayment 555,000 735,000 15,000 1.775,000 210,000 890,000 Interest and fiscal charges 1%,388 213.855 43,240 1,640,442 435.231 562.683
Total expendotures 693 647 3 064 225 76t 388 1 085 134 58 240 3415442 645 231 1 452 683
Excess(defidency) of revenues over (under) expendit (568.664) 3,855 2,047 (3,064,225) (755, 122) 423,929 83.237 70,526 (604,265) 15.457
Otherf<rtMC<ng sources (uses) Transfers 10 455,740 298.395 27,662 755,938 298,395 850,000 Transfers out (298,395) (754,135) (27,662) Proceeds of loans
Sale of FIXed Assets
To tat other fonancing sources (uses) 455 740 27662 756 938 (455 740) (27 662) 650 000
Change in fund balance (112,924) 3.855 29.709 (3,064.225) 1,817 (31,811) 65.575 70,525 45.735 16.457
Fund balance (def1C1t), June 30, 2008 as restated 3.362.004 1,935.793 275,000 222.804 6,9-62.198 191,567 1,476,647 95,570 3.419,575 786,167 1,502,020
Fund balance (defiCit), June 30, 2009 $ 3 269 080 $ 1 939 648 $ 275 000 $ 252513 • 3 897,973 $ 193 384 • $ 1444835 ' 151145 $3490100 $ 833 W2 ' 1 517 477
(ccntinued)

CITY OF BERKELEY Combining Statement of Revenues, Expenditures, and Changes in Fund Balance(Oefl< Non Major Governmental Funds For the year ended June 30, 2009
Debt Serv.ce Fund
Total 2007 2008 GO Nonma1or
GO Bonds Animal Shelter Governmental Series A Measure I Funds
Revenues_ Taxes ' 339.399 $ 1,807,539 $ 15,t82,327 License and permits 544,787 Intergovernmental 8,55t ,697 Charges for serv<ce 3,996,744 Ftnes and penalties 56,824 Rents and royalties 28!1,212 Pnvate contnbut<ons and donat1ons 42,798 Investment income 539.446 Miscellaneous 178.125
Total revenues 339 399 1 807 539 29 381 959
Expenditures: Current General government 1.317,580 Pubhc safety 4.817,003 H<ghway and str!!<'IS 6,095.311 Health and welfare 2.451,601 Culture·rec/eahon 1,806,057 Communlty development and houstng 6,182,455 Economic development 943,855
Debt Sel"'lice: Principal repayment 160,000 5,003,5$6 lnteresland fiscal charges 176,417 330,320 3.660,89&
T olal expenditures 336 417 330 320 32 278 324
Excess{ deficiency) of revenues over (under) expendtt 2,982 1,477.218 (2,896,365)
Other f1nancmg sources (uses)-Transfers tn 7,115.309 Transfers out (6,266,545) Proceeds of Loans 1,894,000
Sale of Fixed Assets " Total Otherftnanclng sources (uses} 2 742 795
Change tn fund balance 2.982 1,477.218 (153.5711
Fund balance (deficit), Jun<! 30, 2006 as restated 607.871 4,928 44.792,415
Fund balance {defiCit), June 30, 2009 ' 610 853 ' 1482146 $ 44 638 844
(concluded)

CITY OF BERKELEY Schedule of Revenues, Expenditures and Changes in Fund Balance- Budget and Actual (Budget Basis)
Nonmajor Governmental Funds For the Year Ende<l June 30, 2009
----------Final
Budget ----·
Revenues: Taxes ' License and ,..,its lnlergovemmontal Charges for service Finos and penalties 200.000 lnt~resl
Rents and myatt1es Franchise Private contnbulions and donaloons Miscellaneous
--------Total reV<~nuos 200,000
------· Expond.Wres:
Currem: Gonoral government Public safety 200,000 Highway and stree\5 Kea~h and wolf ore
CYHU"'·"'c"'atlon Community development and housong
Economic development Debt Sorvoce
Pnncopal ""payment lnte,.,st and Fiscal Charges
------Total expena~o.-.s 200,000
------·-Excess over(un~er) @~p•md~u"'s
01her financing sou""'s (uses): T"'ns!ers in
Transfers out loans advanced Safe of Cap!tal Assets
-·-··---Total other fonanc<ng soYrces (uses)
·--·-·---~
""''Chan.,.. in fun~ ba>•nces
Fund balance (def<e•l) as of Jyne 30,2008 153,805
Fund balance (deftclt)as of June 30.2009 ' 153,805
-~-=---==
Asset Forfe.Wre
-·-----Actual -----
'
35,643
·---·----35,643
14,082
--------14,0a2
21,56\
--·-·------··--
21,561
153,805
' 175,356
--~-----------
s,.cool Disabled Ta~
------· ---- . -------- . ··-·----Vanance Final Vanance Pos/IN"'ll Bud!>Ot
_., Posi(Neg)
·--·····---- -----. ------·-. ----··
' 871,213 ' 877,241 ' 6,0211
(154,357)
------- ----- ------- ---·--(1&4,357) 871,213 877,241 6,0211
----- ----·--- ------
11.827 7.471 4,356 185,918
859,386 8211.501 :10,885
------- ---- ·--------- --------185,918 871,213 &3s.sn 35,241
--·--- ------ ------ ------21.561 41,269 41,269
----·-- ---- .. , ______ ---·-·----·-·- ------ -·-··---- -----
21,5GI 41.26g 41.269
315,863 315,863 -------------
' 21,561 ' 315,863 ' 357,132 41.269
-=-----== ---------- --------------- --·--=----
Wotkforce lnvestmenl AC! Sec 108 HUD loan GTY As~.
-----· ------- . ---·--- ------. ·-·---. -----Final Vanance Final Vanance
Budget _., Pos/(Neg) Bud !I<'! AC!ual Posi(Neg)
---- ----·-· --·---· ----· -----
' ' ' ' '
57,344 12.411 15,0S7
63,000 70.616 7,616
·------ ------ ------ ---·--120,344 143,027 22,683
·--·-- ------ ------ ------ -----
'' (99)
45,305 S4,741 (9,436) 1,896,000 1,8~6,058 (58)
159,000 159,000 57,018 57,212 (194)
----· ----- ----- ---··-·- ------45,305 S.,MO (9,535) 2,112,018 2,112,270 (252]
----- ---- ----- ----- -----/45.3051 (!54.840) (9,535) (1,991,674) (\.989,2431 22,431
361.152 361,152
159,000 2,045,005 1.886,005
----- ----- ----·-·- ------361,152 361,152 159,000 2,045,005 1,886,005
----· ----·-·- ----··-- -----
315,847 300,312 (9,535) (1,832,674) 75,763 1,908,437
(301,970) (301,970) 69,260 69,260
' 13,sn 4,342 ' (9,535) $ (1,7$3,414] ' 145,023 $ 1,938,437
-=--·---- -=---=--· ·------==-- --=·=-----· -========· (conltnued)

C!TY OF BERKELEY Sclt&dule of Revenues, Expenditures and Changes
Fund Balance- Budget and Actual {Budget Basls) Nonmajor Governmental Funds Specral Reven~e Fun~•
For the Year Endrxl June 30, 2009
CA Housrng Fmance Agency Grlman Spor1 Freid Anrm21 Shetter Fund Paramedic A~~es~ment Oistnc! ----- -------- ------- ------- ----- ·------ -------- ·----- -------- ---- . -----------
Final Variance Fmat Variance Fo!\'11 Variance Fin2l Vanance Budget -·' Pos/(N0>/1 Budge! Actual Posi(N"fll Budget Actual Pos/(Neg) Budget Actual Posi(Negl
------- -------- ----- . ------- ------- ---- ----- ---- ------ ---------·· Revenues·
Ta>~< ' • ' • ' ' • • 2,274,380 $ 2,29\,029 \6,S49 Li""nse and Pl!.-mds Intergovernmental 3,000 3,000 40,000 40,000 Charges lor servtce Fines and penalfle-s Interest 65,892 65,892 Rents and roya~tes Franchise Prwate contributions and dona~ons 45,000 39,448 ]5,552) M'"celloneous
----- ------ ----- --------- ------ ---- ----- ----- ------- -------- -------Total revenues 65,!92 65,892 3,000 3.000 45,000 79,448 34,448 2,274,380 2,291,029 16,U9
---------- ··----- ----- ----- ------ ----- ------ ------ ----·· -------E>pendnures: Cum~nl:
General government 62,707 32,995 29,712 11,827 7,420 4,407 Publtc sale!)' 3,133,768 3,S04,6t2 P70,8441 Highw2y 2nd slr<!els Heolth •nd we~a,.
Cultu"'·"'c"'~~~n Community development and housing
Economit development 499,675 49S,S75 Debt Servie..
P~nclp2l "'t»~men! lnterost•nd F,.eal Ch•'lles
-~----- ---------- ------ ------ ------ ------- -------- ----- ------~-- ----- ---------Total ex~nd~""'' 49g,675 499,675 62,707 32.995 29,712 3,145,595 3,512,037 (36-6,437)
------ --------- ----- ---- ----- ---- ----- ---·-- ----- -------Excess over(under) expenditures (433,783) (433,783) 3,000 3,000 (17,707) 46,453 &4,t&l (871.2151 (1,221,0031 (349,788)
Other financing source> (use>): Transfers on 700,000 700,000 TransferS out Loans advanced 500,000 500,000 S2ie of Capital A5Sels
------- ------- ------- ----- ------- ----- ----- ----- ------- ----- ------ --------Total other financing sources (uses) 5-00,000 500,000 700,000 700,000
------- -------- ------ ----- ----- --------- ------- ----- ----- ------ -----
No! Change >n fund bolo nee• 6$,217 66,217 3.000 3,000 (17.7071 4$,453 64,160 (171,215) (521,003) (349,7881
Fund ba!ar>ee (dofoclt) as of June JO, 2008 69,481 69,461 259,505 259,505 ----------------
Fund balance (deficit)as ol June $0,2009 $ 66,218 ' SS,218 $ $ ' 3,000 3,001) $ 51,774 $ 115,934 '<'M $ 88,290 ' (2<i1,498) $ (349,7881
·------=-- =-=······ •u••==--== ----·=--· ou~•••--= ·=------- =•--n••• ----···--- ---=------ -=:noon: ---------= (contmued)

CITY OF BERKELEY Schedule of Revenues, Expenditures and Changes Fund Balance. Budget and ActualfBudget Basis)
Nonmajor Governmental Funds For !he Year Ended June 30,2009
Re"""""'' To""s Looen"" and pennru. tntetqo...,mmon!al Charges for service Fme> and pena~.,. ln!e,.,st Rent> and royalties Franchise
MiscellartOous
Cum>nt. General go...,mrnent Pu~lic safety Hoghway and stnlol> Healtn and wella..e Cultu"'·"'creation Communtty development and housmg Economic development Debt Service
Principal "'payment lnlen>sl and Fiscal Charges
E•CO$• o.erjunder) expend~ure>
Other financing sources (<>So>): Transfen; In Transfocs out Loans advanced Sa~ oiCap~•l Assets
Total <>!her financing sources (uses)
•
TieBack M;titgat•"" R-Q-W
Finol Budget
:ro4,6:.l2
3()4,622
•
Actual
39,000
39.000
194,358
194,358
(155,35!1)
Vanane10 Posl(flleg)
• 39,000
39.000
110,:154
110,254
14~.264
•
Oom V<o Prev·V• Stat
Final B~dget
40.000
40,000
53,054
53,0&4
(13,054)
•
Actual
~9,966
49,363
(9,397)
•
Variance Posi(Neg)
(J4)
,~,
3,701
3,701
3,667
---- ------- ------
(304,622) (155.~08) 149,264 [13,0641 19,391) 3,667
Fund balance !deficit) as of June 30, :1008 265,622 265,622 13.244 13,244
fund b.alance jdeFtcit) as of June 30, 2009 (39.000) 110,2&4 149,254 • , .. s 3,847 • 3,SS7 , ~~--~------ ~ .. ~~ .....
--------~-~ ~·-··--= ·---------
•
s
Allon:!a~le Child Ca"'
Final B~dget
11,851
11.851
11,851
11.851
Actual
23,808
23,808
23,808
23,M8
68,782
Vanance Po&i(NegJ
•
11,957
11,957
11.957
80,633 s 92,590 $ 11,957
lnclusoon•'\' Housing Program
•
Fmal Budget
46,S58
4S,658
12.412
12.412
551.459
•
Actual
3,000
3.000
35,634
35,634
(32,634)
(32,6~4)
551,459
s 563,871 $ 518,825
•
Vorian..e Po<!( Neg)
(43,658)
(43,658)
(1,388)
(1,31181
(45,()4$)
145.046)
(contint>ed)

CITY OF BERKELEY
Schedule of Revenues, EKpenditures and Changes Fund Balance- Budget and Actual (Budget Basis)
Nonmajor Governmental Funds For tlte Year Ended June 3G, 2009
R@"em>e~.
Taxes License and perm;ts •~te<go,emmen\al
Charges lor serv1ce Fme• and penatlles lnoere•t Rents and royalt<es franchise
Miscella""ous
Total revenues
Expend'"'"'"' Cu..,.. no· GeMral government Pubhc safety Higt>way and st""'ls KealtM and wolfa,.. Cul!uro.,.,c,.,ation Ccmmumty development and housing
Economic development Deb! Service
Pnn«p.al ,..payment lrrte"'SI and F.scal Charge•
T c!al expendrtu"'s
Excess over( under] expend~u"'s
Othor ftnancmg •ourcestuses)o T<anst.o,. in
Transr..,.. out Loans advanced Sale 01 Capctal Assets
Total other fmanoing soureestuses)
Fund balance (deftcol) as ot June JO. 2008
Fund balance [deftci!) as of June 30.2009
'
'
Condo ConvetSion Program
Fino I Budget
47.072
41.072
9,414 37,658
47.012
47,072
47.072
2,975
2.975
44.097
Variance P<>SI(Neg)
'
6.439
37,658
44,097
(44,091)
44,097
$ 44,1)97 $ 44.097
Playground Camp Spee<al Ga• Ta> lJO) Spo«ol Gas Ta• Fund-Oisc ---·-----. ------ -·--· ---. --:;-c----·--. ----
Final Vaflance Final Variance Final Budget Actual P<>SI(Neg) Budget Actual Pooi(Neg) Budget
' 1,695,559
W7.728
···----1.904.2117
-----
2,521,796
--------·-·-· ---·--------- ----
' 1,712,594
241,987
3,350
• -------
1,957,937
-------
1,789,121
' 16,035
34.259
3.350
•
' ' ' '
2,207
·-··--------------------------:c 53,650 468 4GS 2,207
--·------·----- ··------
13.300 62,940
732.675
Vanance Poo/(Neg)
2.:.l07
2,207
---- ··--- ----------------·--··-·-------------2.521.796 1,789.121 732.675 13,300 13.300 62.940 62.940 ------- _____________ :__ (617.509) 1GS.81S 786.324 13,300 468 13.7GS 62.940 2.207 65.147
(57.105) (87,105)
-·--·-- -----·------------------(87,105) 187.105)
(617.5091 81.711 699.220 13.300 (12.832) 62 .... 0 2,207 (&e.7JJI
660,224 £50,223 13.256 13,256 62,538 62,538
$ 42,715 741,934 $ 699,219 26,556 $ 13,724 $ [12,632) 125,478 $ 64.745 $ (60,733)
(continue<!)

CITY OF BERKELEY Schedule of Revenues, Expenditures and Changes Fund Balance. Budget and Actual {Budget Basis)
Non major Governmental Funds SP<>e<al Re•enue Fun~s
For the Year Ended June 30, 2009
State 2100 State 2107 State 2107.5 Sta!eSS 300 ---- -------- ------ ----- ·-·-·-··-· --------- ------· -------- ----- --------
Final Variance Fmol Variance Final Vanance Finol Variance 8udget Aetu•l Posl(l>logl Sudr.<>l Actual Pcsi(Neg) Budget Actuol Posi(N&gl Budget Actual PcoJ(NogJ
-----· . ------· - ---- ---------- ---·--- -------- ------ ----- -----·- ------· -----· Revenues:
Tox~ ' ' ' ' ' ' ' ' Lteense and perm<ts lnte.-go•emmert\al 447,000 472,692 25,692 850,000 980,550 1~0.550 10,000 10,000 Charges lor service 11,9~4 11,9:!4 Fines aM ponattles lnte"''' 5,181 4,345 I83S) Rents aM rcyame• Franchise Pfivate contri~trtlons ond donat<ons Mise<!llane<>us 1,330 1,330
----·- ------ ----- ---·--·- ------ ------ ----- ----- ---·------ ------· Totol revenues 447,000 474,022 27,022 85-0,000 992,4&1 142,484 15,181 14,345 (8361
·--·-- ------- ----- ----- ---·-·- ----- ----- ----- ------- ----- -----Expend~unos:
O..m>rtt: General government 90,11J 101,265 111.0921 241!,194 159,087 89,107 Public salety Highway and sh-eets 3S0,742 $6,170 (5,428) 674,240 546,745 127,495 401,197 401,197 Health ond W<l~2"' CuHure-rec"'~~on
Comm~nrty <le,.lopment an<! housing Economic development De~1 Se"''""
Pnncipal rep.ayment Interest and Foscal Charges
------ --·-·--- ------· ------ -·-·--- -------··--- ------ ----- ---·-- ----- ------ ----Total expend~ures 450,915 467,4~5 (16,520) 922,434 705,832 216,602 401,1'17 401,197
---- ----- ------ ---·--· -----· ·----- _____ , __ ----- ----- ----- ---- --·--· Excess cvefjun<lerl expendttures (~.915) 6,587 10,502 172.4341 256,652 359,056 15,181 14,345 (83S) (401,197) 401,197
Otherfonanoing sources jusesj. Tronsl<lr.;in Transfe,.. otrt Loans odvanoed Sale ol Capotal Assets " " -------- ----- ----- ---- ----- ----- ------- ---- ----- ----- -------- -----Tot>l othor financmg sources (usesl " " ------ ------ -------- ------ ----- ------ ----- ------ -------- ------- -----·- ------
N&t Ch•n9& m lund b•l~noes (3,9151 6,587 10,502 (72,434) 28S,68J J59,1H 15,181 ••• 345 lelGJ 1401,1971 401,197
Fund balanee (deficit] as of June 30, 2008 11J7,30ll (137,302) 63,484 63,484 115,528 115,528 •ot,197 401,1'17 ---------··-· ··----------
Fund balance (def.:~) as of June 30, 2009 ' (141,217) $ (130,715) ' 10,502 (8,950) 3$1),167 ' 359,111 $ 1~0,709 ' 129,873 ' (836] ' ' 401,197 ' 401,197
------=-- =-------- ---=----- --··--=-- ------··-- ------=--· ------------- ···------- ··------= --··--=-- -------··-- ~~----··-(eom,nuod)

CITY OF BERKELEY Schedule of Revenues, Expenditures and Changes
Fund Balance. Budget and Actual (Budget Basis) Nonmajor Governmental Funds
For the Year Ende<l June lO, 2009
Revenues-
beonse and pocmds lnte,.ovemmontol Charqes for service Fones and penalties Interest Rent< and myal!oes Franchose P~vate contributoon> and donations Mi>cellanoous
Totol revenues
Cum>nt General govommen! Publoe safety Koghwoy and stn>ots Hoalth and -~are Cullu,...-re<:realion
Community development and housing
Economic development Debt Service
P.-lne<pol repayment Interest and FIScal Chaflje>
Tot.olexpenditures
Ott"'r finanemg source> (uses): Trnnsfers on
Ttonsfer.<o<II Loons advanced Sate of CapMI Assets
Net Chango m fund "'"•neu
Fund balance (defie~la> Of Juno 30,2008
Fund balance (defic~l as Of June 30, 2009
'
Final Sudgo!
600,0.00
5,341!
43,695
626,4S8
670,163
StateSB 300
Actual
' 733,640
41,525
403,516
445,041
'
Vanance Posi(NO'II)
·~·
133,196
2,170
222.as2
225,122
Spe«al Revenue funds
State-Prop l72 Public Safety
Final Budgel
$ 795,1!14
795,1~
Ac!Yal Va.-lanoe Posl(~g)
s 666,7gJ s (128,4011 s 1,023,758
£66,793 1128,401) 1,023,758
416,169 444,839 1,419,184
41&,16g 444,83g 1,41$,184
687,772 $
8,912
696,684
603,401
603,401
-·-- ---·-··- --- --------- ··------·c-:::---(64,815] 293,502 358,31? (65,814) 250,624 316,438 (JgS,42Sl gJ,283
Valiance Posi(Neg)
!335,986)
8,912
1327.074)
815,783
815,783
4118,709
---·--------------
Rental Housmg Safely
Final Budget
732,700
·-··----732,700
------
35.993
771,164
807,157
(74,457)
471,9&3
'
Actual
751,745 21,181
------772,925
------
57,347
e.ag,sge
25,g8J
471,80}6
471,963 471,806
Variance Pos/(Neg)
19,045 21,181
40,225
121,354)
81,568
80,215
100,440
{157)
(157)
----····-----··-----·- --·-·· ---·--
29~,501 350.317 165,814) {424.131) 1395,426) (395.426) 397,506 497,789 100,283
12,677 12,677 \90,646 190,646 472,192 472,192 (396,804) {396,8<)4)
$ (52,138] 30&,179 $ 358,317 $ 124,832 $ 441,270 $ (233,485) $ $ 565,475 $ $ 702 $ 100,985 $ 100,283
(eonhnuod]

CITY OF BERKELEY Schedule of Revenues, E~pendituros and Changes Fund Balance- Budget and Actual (Budget Basis)
Nonmajor Governmental Funds For the Year Ended June 30, 2009
R~ve~ues:
Taxes Ltcens.e and permit< lnlergovemmontal
Cl\a'9<'S for •~"'"'" Fmes and penalties lnfe,.sl Ren!< and roya~ies
Pnvale contfibutton> and dMa!<ons M,.~ellaneous
Expend~Ur&S:
Ctm~nt: General government Publtc safety Htghway ~nd st""'l$ Health and we~a"' CuHu"'-~"'aiiM
Community development and housmg Economic de,..,lopmenl Debt Sentice
Principal repayment Interest and Flsc•l Ch>fl,l<S
Total expenditure>
Other financmg ooucce> (uses): Tr.nsf~"'"
Transfers oul Loan• advanced Sale of Caprtal A$s.el$
Total other ~nancing soun;;e> (uses)
Fund balance (d<lftc~) as of June 30,2008
Fund balance (delle~] as of June 30, 20IXI
Measure 8 Sales Tax State !mpn'"emont Local St & Ro•d
Measure El Bike & P<Mie>lrian
Measur& B Paratrans~
---··-. ·---·-. -~- ---- ·---·-··-- ----·-· --.----. --·-·--:::-c--··------· fln>l Vari>.nce Final VananC<O Final Vanance Final Var>>nce B~dgel Actual Pesi(Neg) Budget Actu~l Pe,.,jflk!g) Budget Actual Posi(Nag) Budget Aetual Pe,.,(Neg)
---- ·----·---
' ' ' ' ' ' ' ' ' ' ' <,<aS,639 2,225,083 (61,556) 623,500 4JO,a44 (192,656) 329,100 171,202 (157,898)
:14,465 24.465 12,3!15 "' .. , --------- -------- -··-------- ----- ·--------·------------
2,286,639 2,:149,548 (37.1)91) 623,500 443,229 (180,2711 329,100 171,844 (157,256)
--·---- ---·------ ------ ---·---- ----- ------- -------
:166,623 144,:123 122,400 18,140 18,140
2,485,734 1,951,984 533,750 383,055 183,863 1S'J.1n
91,403 W9,<23 (17,820) 222,710 218.~4 4,646
2,752,357 2,096,208 656,149 474,458 181,372 240,8SO 218,064 22,786
---·---- ---····- ----· (485,718) 153,340 619,058 150,143 1,101 88,250 (46,220) (134,470)
"' "'
"' '"
"' "' (455,718) 153,340 619,058 149,042 150,143 1,101 88,250 (46,220) (134,4701
(691) (691) 645,592 645,592 241,085 241,085 22.110 22.110
' ' $ 179,874 $ 798,932 $ 619,058 $390,127 $ J$1,228 $ 1,101 $ 110,J6ll s (24,110] s (134,470)

CITY OF BERKELEY Schedule of Revenues, Expenditures and Changes in
Fund Balance- Budget and Actual jBudget Basis) Nonmajor Governmental Funds
For the Year Ended June 30, 2009
Fire Assessment District
Revenues: Ta~es
Lrcense and permits Intergovernmental Charge,. for service Fine'S and penalties Interest Rents and royalhes Franchise Private contributions and donations Misc<!l!aneous
Total revenues
Expenditures: Current:
General government Public safety Highway and streets Health and welfare Culture·re<:reation Community development and housing Economic dev<!lopment Debt Service
Principal repayment Interest and Fiscal Charge'S
Total expenditures
Excess over{ under) expenditures
Other financing sources (uses): Transfers in Transfers out Loans advanced Sale of Capitol Assets
Total other financing sources (uses)
Net Chang" in fund balances
Fund balance (deficit) as of June 311, Z008
Fund balance {deficit) as of June 30, 2009
Final Budget
•
195,475
$195,475
•
•
Actual Variance Pos/(Neg)
16,782 $ 16,782
7,130 7,130
23,912 23,912
23,912 23,912
23,912 23,912
195,475
219,387 $ 23,912
Special Revenue Funds
Measure GG- Fire Prep Tax ST LT Assm! District
•
Final Budget
650,000
850,000
(850,000)
{850,000)
$ {850,000)
Actual
•
651,716
........ -........ 651,716
(651,716)
{651,716)
$ (651,716)
Vari~nce
Pos/(Neg)
1!8,264
.. , __ ,_ ....... 198,284
.................. 196,284
198,284
$ 198,284
Final Budget
$ 1,326,000
9,744
1,335,744
309,712
1,750,244
.............. - ..
2,059,956 .. _ .. _ .. ,_ .....
(724,212)
516,000
516,000
(208,212)
396,622
$ 188,410
Actual
$ 1,358,252
9,842
5,000
1,374,792
185,826
1,786,234
................... 1,972,061 __ .... _ .. ___ , (597,268)
516,000
516,000
(81,268)
396,622
$ 315,354
Variance Posi{Neg)
$ 32,252
1,898
(102)
5,000
39,048
123,686
{35,990)
67,895 .. ...............
126,944
126,944
$ 126,944
•
Final Budget
3,259
3,259
(3,259)
{3,259)
4,001
Solano Ave Bid
Actual
• 717
3,259
3,259
(2,542)
{2,542)
4,001
Variance Posi(Neg)
•
{continued)

C!TY OF BERKELEY Schedule of Revenues, E:.:penditures and Changes i
Fund Balance- Budget and Actual (Budget Basis) Nonmajor Governmental Funds
For the Year Ended June 30,2009
Underground District Fund
Revenues: Taxes License and permits lnteryovemment..l Charyes for se.,ice Fines and pomalties Interest Rents and royalties Franchise Private contributions and donations Miscellanoous
To!.ll revenues
Expenditures: Current:
General government Public safety Highway and streets Health ami welfare Culture-re<oreation Commumty development and housing Econom<c development Debt Service
Principal repayment Interest and Fiscal Cha>ges
Total expenditures
Excess over{ under) expenditures
Other financing sources {uses): Transfers in Transfers out Loans advanced Sal<> of Capital Asse~
Total other flnanc!ng sources {uses)
Net Change in fund balances
Fund balance (dfficit) as of June 30, 2008
Fund balance {deficit) as of June 30,2009
Final Budget Actual
$ 42,500 $
42,500
.................
................. 42,500
{42,500)
--------------· ................. {42,500)
.................
(106,671) {108,871) .................
' {108,871) $ {108,871) ======== =======
Variance Posi{Neg)
$ {42,500)
{42,500)
----------·-{42,500)
42,500
42,500 .. ..............
' =========
Special Revenue Funds
Downtown Business Improvement DisU'lct
•
Final Budget
250,000
250,000
125,000
................. 125,000
................. 125,000
.................
125,000
58,031
$ 183,031 =======
Actual
• 367,724
367,724
125,000
.................. 125,000
................ _ 242,724
. .................
. ................ _
242,724
58,031
' 300,755
=========
Vanance Posi{Neg)
$ 117,724
117,724
117.724
117,724
$117,724
Telegraph Business Improvement District
Final Budget
$ 259,830
259,830
212,774
................... 212,T74
................... 47,056
47,056
41!,578
$ 95,634 =========
Actual
$ 1S4,365
194,365
179,604
179,S04
14,T60
. ................
. ................
14,760
48,578 .................
$ 63,338 =======
Variance Pos/{Neg)
$ {65,465)
33,110
.................. 33,170
................. -33,170
{32,296)
.. ................
$ {32,296) ========
No. Shatuck Business Improvement District
$
Final Budget
164,000
164,000
330,465
330,465
(166,465)
{166,465)
166,465 ----------------·-
$ ==========
Actual
$ 167,914
167,914
330,465
330,465
{162,551)
{162,551)
166,465
$ 3,914 ========
Variance Posi{Neg)
• 3,914
3,914
.. ...............
. ................. 3,914
3,914
$ 3,$14
========= (continued)

CITY OF BERKELEY Schedule of Revenues, Expenditures and Changes i
Fund Balance· Budget and Actual (Budget Basis) Nonmajor Governmental Funds
For the Year Ended June 30, 2009
Revenu.,s: Ta~"s
Ucens" and permits Intergovernmental Charges for service Fines and penalties Interest Rents and royalti..,. Franchise Private contributions and donations Miscellaneous
Total revenues
E~penditures:
Current: General govemm.,nt Public safety Highway and streets Health and w"llare Culture-recreation Community do>velopmentand housing Economic development Debt Service
Principal r.,paym.,nt Interest and Fiscal Charges
Total expendltures
Excess overjunder) e~penditures
Other financing soui'C<!s {uses); Transfers in Transfers out Loans advanced Sale ofCapl,.l Assets
Total other financing sources (uses)
Net Change in fund balances
Fund balance (del;cit) as of June 30, 2008
Fund balance {deficit) as ol June 30,2009
SP"Cial Revenu" Funds
Business Economic Development
'
Final Budget
55,040
................. 55,040
(55,040)
50,000
50,000 .................
{5,040)
441,429
$ 438,369
'
Actual
" 24,063
24,103
"
4,775
________ ...... 4,790
................ 19,313
22,785
22,785 ................
42,098
441,429
$ 483,527
Variance Posi{N.,g)
'
" 24,063
24,103
(15)
50,265
.................. 50,250
74,353
(27,215)
.................. (27,215)
47,138
$ 47,138
$
Final Budget
100,000
100,000
{100,000)
96,315
96,315 .................
(3,685)
72,069
$ 88,364
======= """"""""" ==""""""" =="""""""
Citywide RLF
$
Actual
1,133 24,258
25,392
45,000
.................. 45,000
{19,606)
38,416
36,416 ....... --------
18,807
72,069
$ 88,878 =:=====
Variance Posi(Neg)
$
1,133 24,256
25,392
55,000
55,000 ..................
80,392
(59,899)
.. ................ (59,899)
. .................
20,492
$ 20,492 =:===== {continued)

CITY OF BERKELEY Schedule of Revenues, Expenditures and Changes in
Fund Balance- Budget and Actual (Budget Basis) Nonmajor Governmental Funds
For the Year Ended June 30, 2009
R..venues: T~xes
license and pennits lntergovemmental Charges for se,...ice Fines and j>enallies Interest Rents and royalties Franchise Private contributions ~nd donaMns Miscellaneous
Total revenues
Expenditures: Cur«!nt:
General govemment Public safety Highway and streets Health and welfare Cultu re -recreation Community development and housing Economic development Debt se,...ice
Principal repayment Interest and Fis~al Charges
Total expenditures
Ex~ess over{ under) expenditures
Other financing sources (uses): Transfer>: in Transfers out Proceeds of loans Sate of Capital Assets
Total otherfinancong sou«:es juses)
Net Change in lund balances
Fund balance (deficit) as of June 30, 2008
$
Final Budget
Employee Computer Loan Fund
Actua! Variance Posi{Neg)
' $
43,000 43,000
43,000 43,000
(43,00{)) 43,000
43,000 "' 42,682
43,000 42,662
"' 318
30,740 30,740
Fund balance (defi~it) as of June 30, 2009 $ 30,740 $ 31,058 • "'
'
Final Budget
5,1()0
5,100
252,055
252,055
(246,955)
!246,955)
181,611
Miles Lab
A<:tual
' 12,690
12,690
""
"" 12,030
12,030
181,611
$ 16~.344) $ 193.641
Special Revenue Funds
Variance ?os/{Neg)
• 7,590
7,590
251,395
251,395
258,985
258,985
$ 25B,S85
'
'
UC. Berk. Reimbursement People's Park
final Budget
(126)
'
Actual
•
{126)
{126) $
Vanance Pos/(Neg)
•
•
Final Budget
555,124
555,124
(555,124)
360,957
JG0,957
{194,167)
995,829
801,662
Employee Training FD
Actual
$
480,898
480,898
(480,898)
400,957
_________ ........ 400,957 ___________ .. _ ......
(19,941)
995,829
' 911>,UB
'
•
Variance Pos/(Neg)
74,226
74,226
74,226
40,000
40,000
114,226
114,226
{Continued)
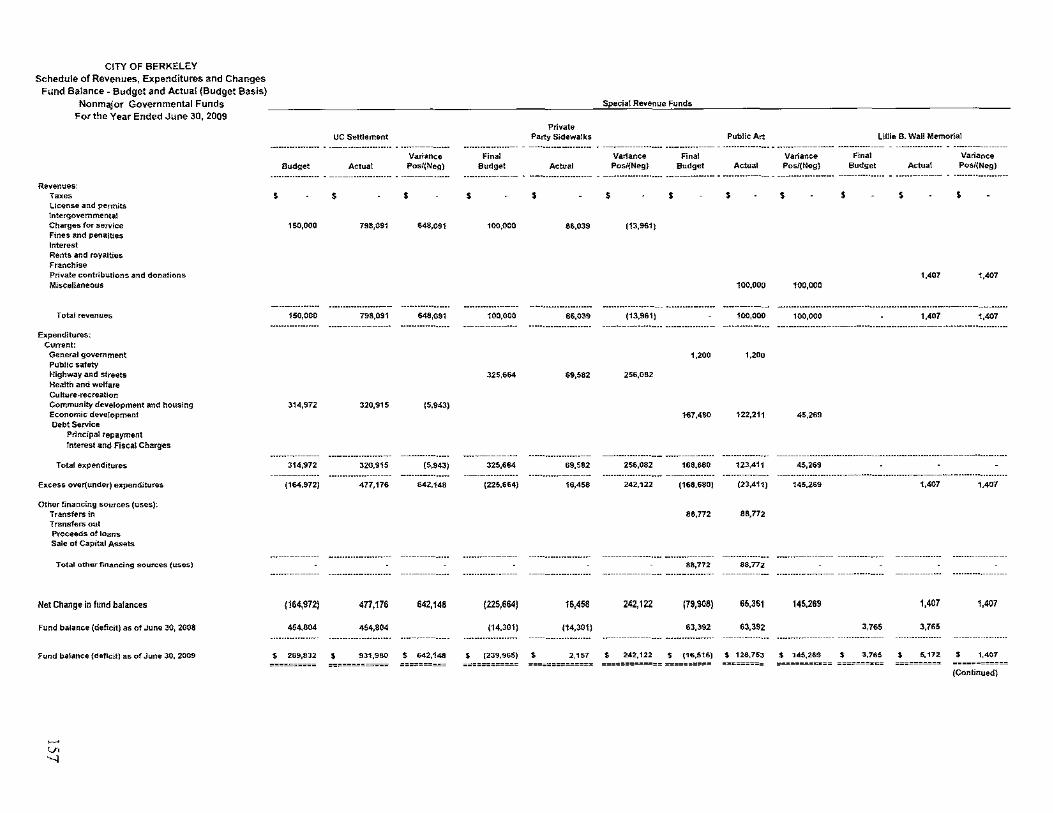
CITY OF BERKELEY
Schedule of Revenues, Expenditures a:nd Changes
Fund Balance- Budget a:nd Actual (Budget Basis)
Nonma:jor Governmental Funds
For the Yea:r Ended June 30, 2009
Revenues: Taxes Lic<mse and permits Intergovernmental Charges for service Fines and penalt<es Interest Rents and royalties Franchise Pnvate contributions and donations Miscellaneous
Total revenues
Expenditures: Cum!nl:
General government Public safety Highway and streets Health and welfare Culture-recreatk>n Community development and housing Economic development Debt S..rvice
Principal repayment Interest and Fiscal Charges
Total expenditures
E~cess OV<!r(under) expenditures
Other financing sources (uses): Transfers in Tf"nsfers out Proce<!ds of loans Sale of Capital Assets
Total otherMancing soun::es (uses)
Net Change in fund balances
Fund balance (deficit) as of June~(), 2008
Fund balance (deficit) as of June 30, 2009
Budget
' 15(),000
150,()00
314,972
314,972
(164,972)
{164,972)
454,61)4
$ 289,832
UC Settlement
Actual
' 798,091
798,091
320,915
3Z0,9fS
477,176
454,804
Variance Posi~Neg)
' 848,091
648,()91
15.943)
15,943)
642,148
642,148
' 931,9&1 $ 642,148
'
'
Final Bu<lget
100,()00
100,000
325,664
325,664
{225,664)
(225,664)
(14,301)
(239,965) ---------=-
Private Party Sidewalks
Actual
' 86,039
86,039
89,582
69,592
16,4S8
16,458
(14,301)
' 2,157 --------=----
Special Revenue Funds
'
'
Variance Posi{Neg)
(13,961)
(13,961)
256,082
256,082
242,122
242,122
---------------
242,122
'
Final Budget
1,200
167.460
168,680
(168,680)
88,772
88,772
{79,908)
63,392 ............... -
' (16,516) -------==-- =--------
Public Art
Actual
'
100,000
fOO,OOO
1,200
122,211
(23,411)
66,772
65,361
63,392
' 128,753
--~------
Variance Posi(Neg)
'
1()0,000
100,000
45,269
45,269
145,269
145,269
' 145,269 :=::=::E::
'
'
Lillie B. Wall Memorial
Final Budget
3,765
'
'
Actual
1,407
1,407
1,407
1,407
3,765
5,172
Variance Posi(Neg)
'
1,407
1,407
1,407
1,407
' 1,407
(Continued)

CITY OF BERKELEY Schedule of Revenues, Expenditures and Changes
Fund Balance- Budget and Actual (Budget Basis) Nonmajor Governmental Funds
For the Year Ended June 30, 2009
Re~enues'
Taxes License and permits Intergovernmental Charges for ser;ice Fines and penalties Interest Rents and royalties Franchise Private contributions and donations Miscellaneous
Tot. I revenues
Expenditures: Current
General go~emm<!nt Public safety Highway and streets Health and welfare Culture·recreation Community development and housing Economic <!evelopment Debt Se...,.ice
Principal n!payrnenl Interest and Fis~al Charges
Total expMditures
Exc.,.,;s overjunder) upen<!itures
Other financing sources (uses): Transfers in Transfers out Procee<ls of loans Sale of Capitol Assets
Total other financing sources (uses)
Net Change in fund balances
Fund balance (deficit) as of June 30, .20¢11
Fund balance (deficit) as of June ~0, zoog
'
'
Final Budget
32,000
32,000
33,000
33,000
(1,000)
(1,000)
152,901
151,901
Vital Health Statistic
Actual
• 32,350
32,350
10,120
10,120
22,231
22,231
152,901
' 175,132
'
'
Variance Posi(Neg)
""
22,880
22,880
23,231
23,231
23,231
•
'
Special Revenue Funds
final Budget
3,433
East Bay Public Utility
Actual
'
'"
"' 3,433
'
l,433 $ 3,554 $
Variance Posi(Neg)
'"
'"
'
'
Dept. of Jus!ic Bloc~ Grant
Final Bu<!get
'" (961)
'
'
Actu~t
'
'"
'"
'" {961)
'
Variance Posi(Neg)
'
Final Budget
2,08t512
2,081,512
2,141,689
2,141,6119
(6!1,177)
1,953,018 !2,604,024)
(651,006)
(711,183)
2,225,843
$ 1,S14,...,S
Health State Aid
'
'
1,786,187
1,786,187
2,138,146
2,138,146
(351,959)
1,953,018 (2,6!14,024)
(651,006)
(1,002,965)
2,225,848
1,222,883
Variance Pos4Neg)
• (295,325)
(295,325)
3,543
(291,782)
(291,782)
(continued)
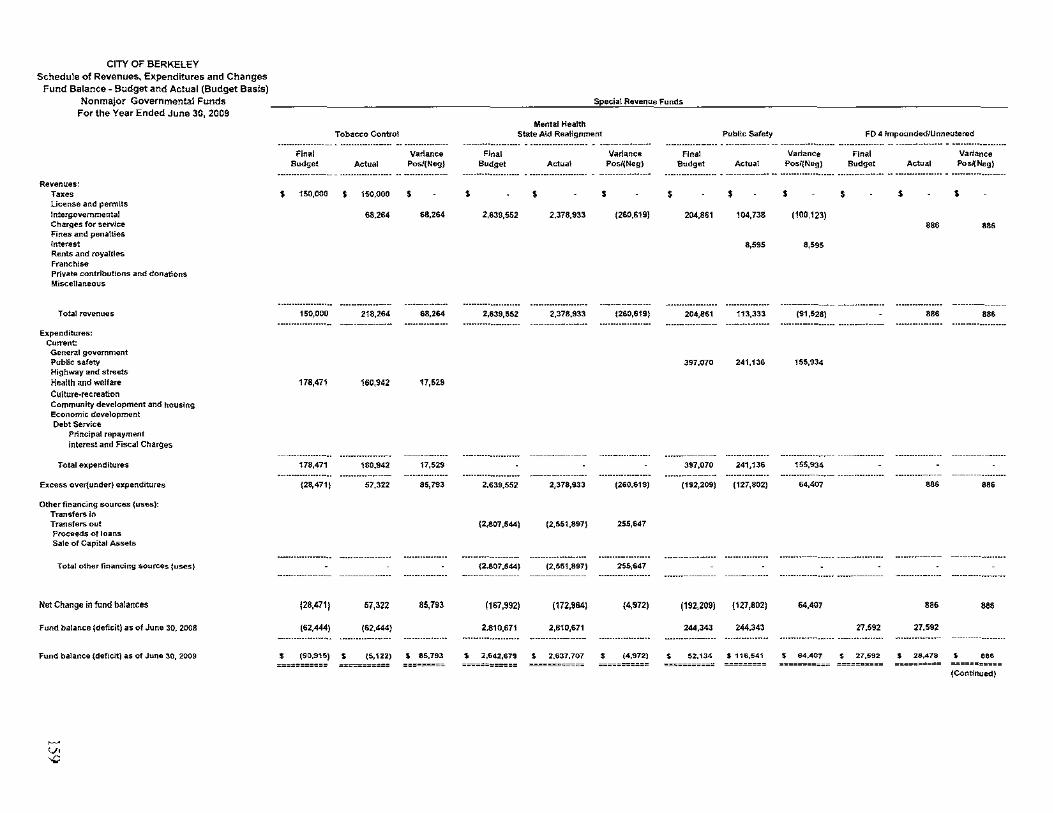
CITY OF BERKELEY Schedule of Revenues, Expenditures and Changes
Fund Balance- Budget and Actual (Budget Basis) Nonmajor Governmental Funds
For the Year Ended June 30, 2009
Revenues: Taxes License and permits Intergovernmental Charges for service Fines and penat!ies Interest Rents and royatii&S Franchise Private contribut<ons and donations Miscellaneous
Total revenues
Expenditures: Current: General government Public safety Highway and streets Health and welfare Culture-recreation Community development and housing Economic development Debt Service
Principal repayment Interest and Fiscal Charges
Total expenditures
Excess over{ under) expenditures
Other financing sourees {uses): Transfers In Transfers out Pro.,..e<ls of loans Sale of capital Assets
Net Change in fund balances
Fund balance (deficit) as of June 30, 2008
Fund balance (deficit) as of June 30, 2009
Final Budget
$ 150,000
150,000
178,471
.... -.............. 178,471
................ {28,471)
128,4711
(6Z,444)
Tobacco Control
Actual
s 150,000
68,264
Z1S,264
160,942
................... 160,942
................ _ 57,322
57,322
(62,444)
Variance Posi(Neg)
' 68,Z64
{18,264
17,529
................ 17,529
................ a5,ro3
85,793
' (90,915) $ (5,122) $ 86,793
Special Revenue Funds
Mental Health State A;d Realignment
'
Final Budget
2,639,552
2,639,552
.....................
..................... 2,639,55~
(2,807,544)
(2.807,544)
(167,992)
2.810,671
$ 2,642,679
Act~al
' 2,378,933
2,37{1,933
Z,378,933
(2,551,897)
(2,551,897)
(172,964)
2,810,671
$ 2,637,707
'
Variance Posi(Neg)
(Z60,619)
(260,619)
...................
................... {260,619)
255,647
255,647
{4,972)
' (4,972)
'
Final Budget
204,861
204,861
3S7,070
-----------397,070
................... (192,Z09)
(192,209)
244,343
' 52,134
Public Safety
Actual
' 104,738
8,595
113,333
241,136
................ 241,136
................ (1Z7,802)
{127,802)
244,343
$ 116,541
Variance Posi(Neg)
' (100,123)
8,595
(91,528)
155,934
................. 155,934
64,407
64,407
$ 64.407
. .
FD 4 !mpounded/Unneutered
'
Final Budget
.. ...............
.. ...............
27,592
$ 27,592
Actual
' ...
...
... 27,59Z
$ 28,478
Variance PosJ(Neg)
• ...
...
...
' ...
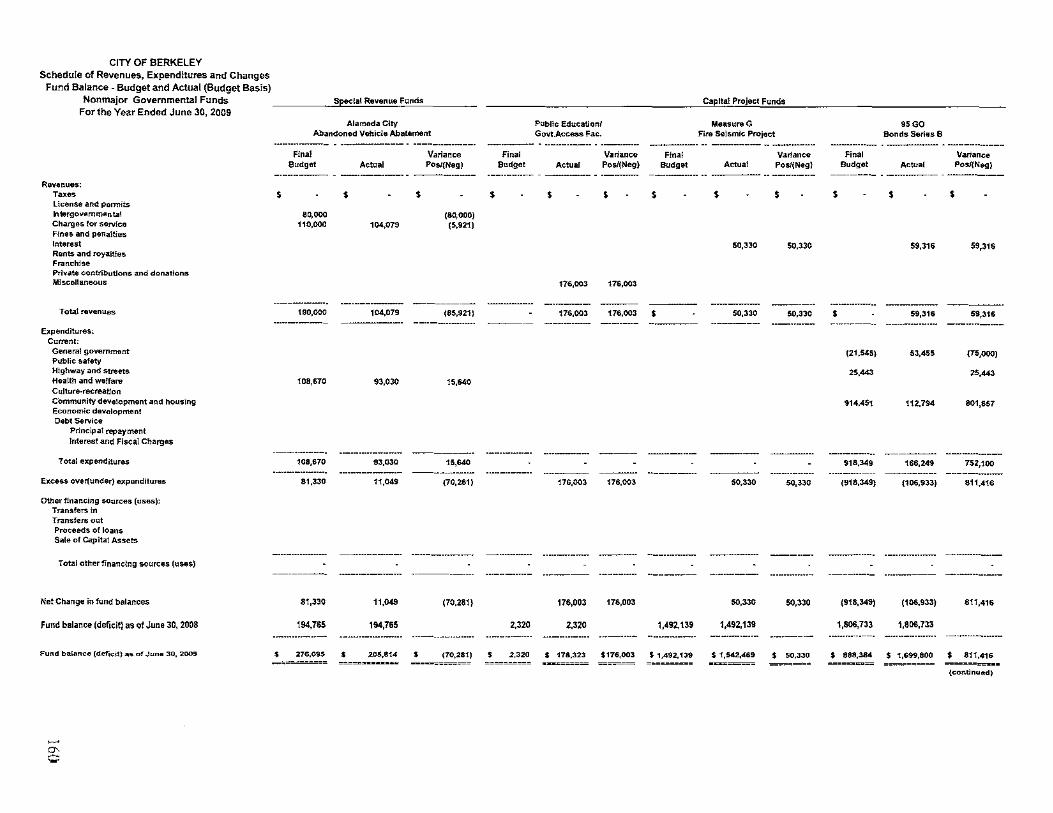
CITY OF BERKELEY Schedule of Revenues, Expenditures and Changes
Fund Balance- Budget and Actual (Budget Basis) Nonmajor Governmental Funds
For the Year EndGd June 30, 2009
Revenues:
·~~ license and permits lnlergovemmental Charges for service Fines and penalties lnterut Rents and r»yaltles FrnnchiS<> Private contributions and donations Miscellaneous
Total <t~venues
E~pendltur.,s:
Current: Genernl govemmont Public safety Highway and Streets Health and welfare Cultu<tl-rec<tlation Community development and housing Economic development Deb! Service
Principal repayment Interest and Fiscal Chargf!S
Total expenditures
Excess overjunder) expenditures
other financing sources (~ses): TransferS in Transfers o~1 Proceeds of loans s~le of Capital Assets
Total other financing sources (uSII$)
Net Change in fund balances
Fund balance (deficit) as of June 30, 2008
Fund l>alan~e (defi~!l)"s of Juna 30. 2009
Special Revenue Funds
Alameda City Abandone-d Vehicle Abatement
$
Final Budg"t
"~ 110,000
190,00{)
108,670
----·-·---· 108,870
--···-·-·-----·--81,330
81,330
194,765
• 276.09$
Actual
$
104,071)
104,079
93,(130
-----------------S3.030
------------11.049
11,049
194,765
• 2115,814
$
VarianC<! Pos/{Neg]
(8(1,000) (5,921)
{85,921)
15,64(1
------·· 15,64(1
-------·-·--·-(70,261)
(70.281)
$ (70,281)
$
Final Budget
----··--·------·-----------
2,320
• 2.320
Publlc Educa~onl Govt.Access Fac.
Actual
$
176,003
176,(){13
--·------·
··----176,003
176,003
2,32(1
Variance Pos/(Neg)
$
176,003
178,003
176.003
176,003
s 178.323 $176,003
$
$
Final Budget
-----·----·--------
1,492,139
$ 1.492.139
Capital Pro"ect Funds
Measure G Fire Seismic Pr»ject
Actual
$
50,330
50,331)
-----·-----
50,331)
50,330
1,492,139
---·---·-··-$ 1.5-42,469 -~~=
Variance Posi(Neg)
$
50.l30
50,330
-·------· ----··-·----·
50,330
50,l30
----~---
$ 50,330 ~~~==
$
$
Final Budget
(21,545)
25,443
914.451
-------·--· 518.349
-·-------·---(918,349)
(918,349)
1,806,733 ···-···---·----·
• 888.J84 =~~=~~
95GO Bonds Seriea B
Actual
$
59,316
59,316
53,455
112.794
----~--
166,249 ---------
(106,533)
(106,933)
1,8()6,733 -····----·----" $ 1,699,800 -~~--==
$
Variance Pos/(Negl
59,316
59,318
{75,000)
8(11,857
------------752,100
----------·--811,416
811,416
---····----··----$ 811.416 ==~=~--
(eon~nultd)

CITY OF BERKELEY Schedule of Revenues, Expenditures and Changes
Fund Balance- Budget and Actual (Budget Basis) Nonmajor Governmental Funds
For the Year Ended June 30, 2009
Revenues: Taxes License and permils
Intergovernmental Charges for service Fines and l'&llalties Interest Rents and royames Franchise Privale contributions and donations Miscellaneous
Total revenuu
Expenditures: Current
General govem,.,nt Public safety Highway and streets
Health and welfare Culture-recreation Comm<>nity development and housing Economic development Debt Service
Principal repayment Interest and F>scal Charges
Total expenditures
Excess over( under) expendiWrn
Other financing sources (usesj: Transfers in Transfers out Proceeds of loans Sale of Capital Assets
Total other financing sources (uses)
Net Change in fund balances
Fund balance (deficit) as of June 30,2008
Fund balance (deficit) as of June 30, 2009
$
$
$
Capital Project Admin
Final Budget
522,697
sn.ss7
522,697
(524,308)
$
(1,6111 $
Actual
$
522,697
522,697
(524,308)
(t,611) $
Variance Posi(Neg)
$
$
C~pital Project Funds
Street Improvement
Final Budget
104,917
•
104,917 s
Actual
'
3,702
3,702
3,702
3,702
104,917
108,619 $
Variance Pos/{Neg)
3,702
3,702
3,702
3,702
•
97GO Bonds Series S Main library
Final Budget
7,886
7,886
(7,886)
{7,288)
(6,297)
Actual
' '
(6,297)
3,702 $ {14,1831 $ (6.297) '
Variance Posi(Neg)
1,886
7,886
7,886
7,886
7,866
'
Flnal Budget
97GOBo~ds
Series S Civic Center
Actual
'
5,630
5,630
5,630
5,530
Variance Posi{Neg)
•
5,630
5,630
5,830
197,545 197,545
$ 197,5-45 $ 203,175 $ 5,630
(Contmued)

CITY OF BERKELEY
Schedule of Revenues, Expenditures and Changes
Fund Balance- Budget and Actual (Budget Basis)
Nonmajor Governmental Funds
For the Year Ended June 30, 200S
Revenues: Taxes License and permits lnl<!rgovemm~tal
Charges for servoce Fones and penalties Interest Rents and royalties Franchise Private contributu>ns and donations Miscellaneous
Total revenues
l':xpenditures: Current:
General government Public safety Highway and streets
Health and welfare Cul!um-recrealion Community development and housmg Economic development Debt Service
Principal repayment Interest and Fiscal Charges
Total ...:pendl!ures
Excess overjunder) expenditures
Other financing sources {uses): Transfen< in Transfen< out Proceeds of loans Sale of Capital Assets
Total olhar financing sources (uses)
Net Change in fund balances
Fund balance (deficit) as of June 30, 2008
Fund balance (deficit) as of June 30, :WOS
'
Final Budget
'>7GOBcnds Series S Donwtown
Actual Variance Posi~Negj
' '
22,457 22.457
22,457 22,457
39,770 39,770
Final Budge!
'
Capital Project Funds
Theater FACIParl< ACOBJPF
Actual
'
Variance Final Pos/~Negj Budget
' • 3,000
3,000
... Acquisition
Actual
'
1,812
1,812
'
Variance Posi(Neg)
(3,000)
1,812
(1,186)

CITY OF BERKELEY Schedule of Revenues, Expenditures and Changes in
Fund Balance- Budget and Actual (Budget Basis)
Nonmajor Governmental Funds ---------------------------------------------------------------''''''''''''''''"'''"'"'«'''""""''''----------------------------------------------------------------Forthe Year Ended June 30, 2009
Revenues: T~xes
License and pennits Intergovernmental Cha<ges for service Fines and penalties Interest Rents and royalties Franchise Private contributions and donations Miscellaneous
Total revenues
Expenditures: Current: General government Public safety Highway and streets
Health and welfare Culture-re<:reation Community development and housing Economic development Debt Service
Principal repayment Interest and Fiscal Charges
T o!.ill expenditures
Excess oveo'lunder] expenditures
Other financing sources {uses): Transfers in
Transfers out Proceeds of loans Sale of Capital Assets
Total other fin~nclng soun;es (uses)
Net Change In fund balances
Fund balance {deficit) as of June 30, 2008
Fun<l balance (deficit) as of June 30, 2009
'
Final Budge1
50,000 46,500
Si,5W
29,069
1,167,062
839,151
2,055,282
West Berlce!ey Improvement Fund
'
Actual
25,008
52,772 45,413
123,193
32,756
660,891
693,647
(1,!!58,782) (570,454)
380,000 455,740
'" 360,000 455,885
{1,578,782) 1114,569)
2,804,981 2,804,981 --------------·--····
• 1,226,1S9 • 2,6~0.412
'
'
Variance Posi(Neg)
25,006
2,772 (1,087)
26,6!!3
(3,667)
1,187,062
178,260
1,361,635
1,3-88,318
75,740
'" 75,885
1,454,213
1,464,213 ~~~~=~~~:~~ ~~~=~~~:: ~=~~-~:::::
'
'
Final Budget
30!!,939 (309,939)
110,670
11G,670 "~==~~-
Low& Mod_ Savo Island
'
Actual
3,855
3,855
3,855
298,395
(298,395)
3,855
110,670 ---------------
• 114,525 :~~~~~~~-:
Variance Posi{Neg)
'
(3,855)
(3,855)
(3,855)
(11,544) (11,544)
(23,088)
3,855
------------·---
' 3,85li "~=~=--
'
'
Final Budget
29,000
29,000
29,000
56,664
85,664 ::~~=---
Low& Mod. Savo Island
Actu~l
'
2,047
2,047
2,047
27,862
27,662
Z$,709
56,664
' 86,373 ::~~~~~~-=
'
(2,047)
{2,1)47)
(2,047)
(1,338)
(1.338)
70S
' "' ~:~~~~~~--
Budget
'
3,277.810
3,277,810
(3,277,810)
j3,277,610)
6,962,197 -----··--······--
' 3,684,387 .... :~~~~~--
Animal Sheller Land/Bldg
Actual
' 176,320
176.320
3,064,225
3,064,225
(2,887,905)
{2,687,905)
6,962,197
s 4,074,292
Variance Pos/(Neg)
• {176,320)
(176,320)
213,585
213,585
37,265
389,905
S 389,90S
(continued)

CITY OF BERKELEY Schedule of Revenues, Expenditures and Changes
Fund Balance- Budget and Actual (Budget Basis) Nonmajor Governmental Funds
For the Year Ended June 30, 2009
Revenues' Taxes License and j>ermo~s
Intergovernmental Charges for service Fines and penalties ln~erest
Rents and royalties Franchise Private conlnbutions and donaUons Miscellaneous
Total revenues
Expenditures: Corrente
Genera\ government Public satety Highway and streets
Heallli and welfare Cullllre..-ecreation Community development and housing Economic development Oebl Ser;ice
Principal repayment Interest and F1scal Charges
Total eXj)enditures
Excess oveoiunder] expenditures
Other financing sources {uses): Transfe"' in
Transfe"' out Proceeds ofloans Sale of Capital Assets
Total Other financing S<>urces (u...,s)
Net Change in fund balances
Fund balance (defidl) as of June 30, 2008
Fund balance (deficit) as of June JO, 200~
$
Final Budget
565,000 191,938
···------------· 756,93.8
------------------(756,938)
964,313
--------·--·----964,3t3
207,375
191,5-67
$ 398,942
----======
Sales Lease Financing
Actual
•
6,.266
567,597 193,791
----------------761,3.88
--------------------{755,122)
756,938
756,938 ··--·-------------
1,a1e
191,567
$ 193,383
---======"=
Variance Posi(Neg)
•
6,266
6,266
(2,597) (1,853)
-----·--··-------(4,450)
1,816
(207,375)
----------------(207,375)
-----------·--··--
{205,559)
.................
$ (205,559)
=--======
$
Final Budget
----------------
$
====-=====
09 Measure FF Library
Actual
$
35.425
35,425 ---------------
(35,425)
35,425
35,425 ...................
$ :<•=-=--
Cebt Ser;ice Funds
$
Variance Posi(Neg)
(35,425) -----------------
{35,425) -----------------·
(35,425)
-------·--··------------------------
$ ====··====-
West Berl<e!ey Improvement Fund
Budget
$ 1,549,694
20,000
1,51;9,694
150,202
735,000 214,385 .... ._ _________
1,099,587
470,107
309,939
{689,939)
(380,000) ----------------
90,107
688,647
• 778,754 ----====··
Actual Variance Pos/(Neg)
s 1,491,971 $ (57,721)
17,o90 {2,910)
1.~09,063 (60,631)
136,279 13,923
735,000 213,855 '"
1,085,134 14,453 ----------------- -----------------
4.23,929 (46,178)
298,395 (11,544) (754,135) (64,196)
{455,740) (75,740) .................. ---------··--·--·
(31,811) {121,918)
688,&47 ------------·---·
• 656,836 • (121,918\ -=----=== ·==-----==
Final Budget
s 145,000
145,000
15,000 43,240
58,240 ................
86,760
{29,000)
-------------· (29,000}
--------------
57,760
%,570
• 153,330
"--~---=
Savo Island Fund
Actual
s 138,311
3,166
14t,477
15,000 43,240
58,240
83,237
(27,662)
(27,662}
55,575
95,570
$151,145
=·=-----
Variance Posi(Neg)
$ (6,669)
3,166
{3,523)
................
-------------(3,523)
t,338
----------------1,338
----·-----------
(2,185)
• (2,185) "'"""""""E (continued)

CITY OF BERKELEY Schedule of Revenues, Expenditures and Changes
Fund Balance- Budget and Actual (Budget Basis) Nonmajor Governmental Funds
For the Year Ended June 30, 2009
Revenues: Ta.es License and permits Oltergovemmental Charges for service Fines and penalties Interest Rents and royalties Franchise Private contributions and do>naHo>ns Misce!laneo>us
Total revenues
Expenditures: Current:
General government Public safety H<ghway and Streets
Health and welfare Culture-recreation Community development and housing Economic deYelopment Debt Service
Principal repayment Interest and Fiscal Charges
Total e>Q>endttures
Excess over( under) sxpenditures
Other financing sources {uses): T<ansfers In
Transfers out Proceeds of lo>ans Sale of Capital Assets
Total otl>erfinan~ing sou,~<>& (uses)
Net Change in fund balances
Fund ba!~nce (deficit) as of June 30, 2008
Fund batanc<> (d<>ficit) as of June 30, 2009
Final Budget
$3,378,240
3,378,240
1,775,000 1,639,593
---·············· 3,414,593
----·········· (36,3531
(36,3531
3,419,575
$3,383,22Z =--------
2007 GO Bonds Series B
Actual
$ 3,427,844
3,427,844
1,775,000 1,640,442
3,415,442
12,403
............... --
12,41)3
3,419,575 ------·---··········
' 3,431,978 =-------=
'
Variance Posi(Neg)
49,604
49,604
{849)
{8491
48,756
----············-·
···············---
48,756
' 4a,756
----=--==-
Debt Service Funds
Repertory Theatre Lease Revenue Bonds
'
Final Budget
;.!10,000 430,393
640,393
(640,393)
650,000
650,000
9,607
788,167
$ 797,774
"'==-====
Actual
'
40,966
40,966
210,000 435,231
--------··-· 645,231
(604,265)
850,000
6S0,000
45,735
786,167
• 833,902 =----==·-
Variance Posi(Neg)
'
40,966
40,966
(4,838) -··-······· .. --
{4,8381
36,128
---------········
36,128
• 38,128
==·=--"=
'
Final Budget
890,000 564,070
1,454,070
(1,454,0701
(1,454,070)
1,502,020
' 47,S50 ===~-=-"
2002 GO Bonds Refunding
Actual
$ 1,443,661
1,443,661
890,000 562,683
1,452,683
{9,022)
······--·····--
(9,022)
1,502,020
' 1.4S2,998 ===------==
Variance Po>si(Neg)
s 1,443,661
1,443,661
1,387
-----·-·---· 1,387
1,445,048
------·-········
1,445,048
$ 1,445,04a
"""""""""'"
F02 GO BOS Animal Shelter
Final Budget
$1,757,932
1,7S7,93l
160,000 179,568
................. 339,568
-················ 1.418,364
1,418,364
607,871
$2,026,235 ====--=--
Actual
' 333,741)
333,741)
160,000 176,417
-··············-··· .. -336.417
-----··-······--····· .. (2,677)
(2,677)
607,871
' 605,194 ==·-------====
Variance Posi(Neg)
$(1,424,1S21
(1,424,1U)
3,151
···-···-··-·-··· 3,151
-·-·--··-······· (1,421.041)
(1,421,041)
------··········
$(1,421,041) ---=-·=== (continued)

CITY OF BERKELEY Schedule of Revenues, Expenditures and Changes
Fund Balance- Budget and Actual {Budget Basis) Nonmajor Governmental Funds
For the Year Ended June 30, 2009
Revenues: Taxes License and pe=its llltergovemmental Charges for service Fines and penalties Interest Rents and royalties Frnnchise Ptwate contr>buhons and donations Miscellan,..,us
Total revenues
Expenditures: Current:
General government Public safety Htghway and streets
Health and welfare Culture-recreation Community development and housing Economic development Debt Service
Principal repayment
'
Final Budge!
Debt Servioo F~nds
2!J07 GO Bonds Series A
Actual
$ t.m.40t
1,777,401
Variance Posi(Neg)
1,W,401
1,777,401
Interest and Fiscal Charges 330,320 (330,320)
Total expenditures 330,320 (330,320)
Excess oveflunder) expenditu"'s
Other financing sources (uses): T<ansfers; in
Transfe"' out Proceeds of loans Sale of Capital Assets
Total otherflnancong $0Uf<'&S {u,..s)
Net Change in fund balances
Fund balance (deficit) as of June 30,20()8
Fund balance (de!ic<ll as of June 30, 201)9
1,447,081 1,447,081
1,447,081 1,447,081
4,928 4,928
' 4,926 $ 1,452,009 $ 1,447,061 ======= "======== ==========
(conclude<!)
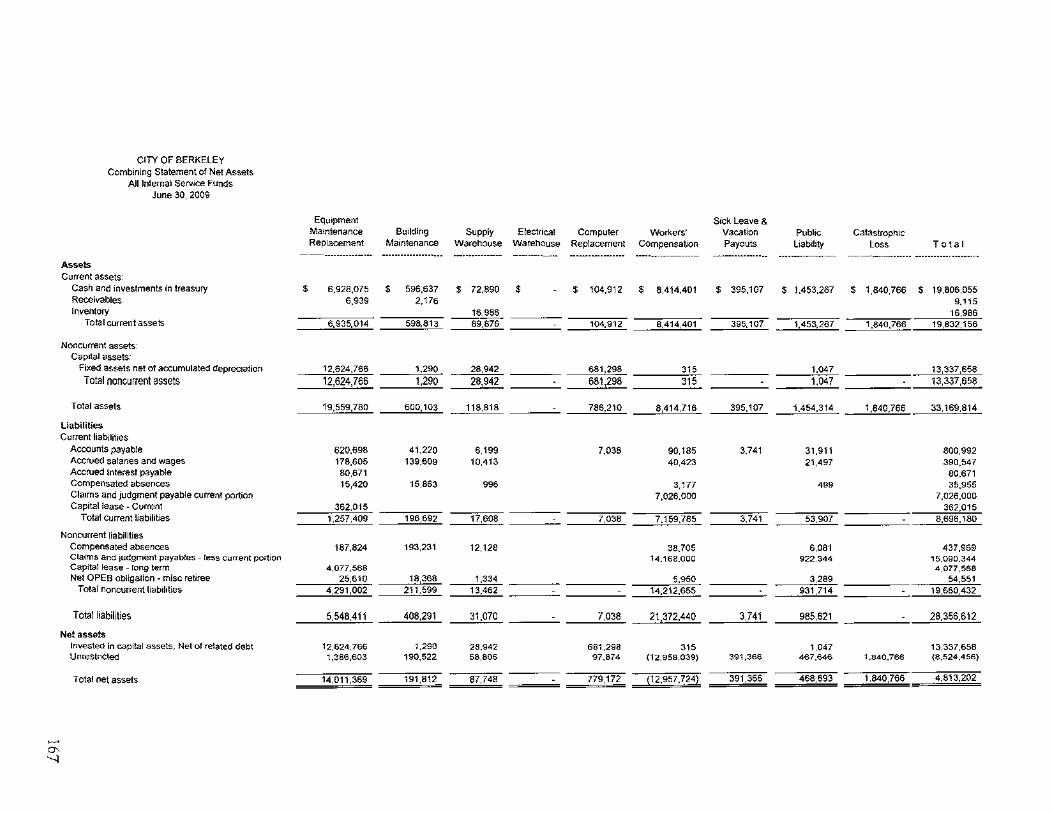
CITY OF BERKELEY Combming Statement of Net Assets
All Internal Serv•ce Funds June 30, 2009
Equ,pment Sick Leave & Maontenance Bwlding Supply Electncat Computer Worl<.ers' Vacation Pubhc Catastrophic Replacement Mamtenance Warehouse Warehouse Replacement CompensaUon Payouts L1ab•hty Loss To Ia I
-------------~--- -········-··--··-··· -----···-···-···-- -----------~- ------------------ ----------------- ---------------------------------------Assets Current assets·
Cash and mvestments in treasury ' 6,928,075 $ 596,637 $ 72.890 $ $ 104,912 ' 8,414,401 $ 395,107 ' 1.453.267 s 1,840,766 s 19,806,055 Receivables 6,939 2,176 9,115 Inventory 16.986 16,986
Total current assets 6,935,014 598.813 89,876 104,912 8,414,401 395.107 1,453,267 1,840,766 19,832,156
Noncurrent assets· Caprtal assets·
Fixed assets net of accumulated depreciation 12,624,786 1,290 28,942 681,298 "' 1,047 13,337,658 Total noncurrent assets 12,624}66 1,290 28,942 681,298 '" 1.047 13,337,658
Total assets 19,559,780 600,103 118,818 786.210 8,414,716 395,107 1,454,314 1,840,766 33,169,814
Liabilities Current liabilitieS
Accounts payable 620,698 41,220 6.199 7,038 90,185 3.741 31,911 800,992 Accrued salanes and wages 178,605 139.609 10,413 40,423 21,497 390,547 Accrued Interest payable 80,671 80.671 Compensated absences 15,420 15,863 '" 3,177 "' 35,955 Cla1ms and JUdgment payable current portion 7,026.000 7,026,000 Cap1tallease- Current 362,015 362,015
Total current liab•ht•es 1.257,409 196,692 17,608 7,038 7.159,785 3.741 53,907 8,696,180
Noncurrent liabilities Compensated absences 187,824 193,231 12,128 38,705 6,081 437,969 Cla•ms am! JUdgment payables- less current portton 14.168.000 922,344 15.060.344 Capital lease- long term 4,077,568 4,077,566 Net OPEB obligation- mise ret•ree 25,610 18,368 1,334 5,950 3,289 54,551
Total noncurrent liabilities 4,291,002 211,599 13,462 14,212,655 931,714 19,660.432
Total liabilities 5,548,411 408,291 31,070 7,038 21,372.440 3,741 985,621 28,356,612
Net assets Invested in capital assets, Net of related debt 12,624,766 1,290 28.942 661,298 "' 1.047 13,337,658 Unrestncted 1,386,603 190,522 58,806 97,874 (12,958,039) 391,366 467.646 1,840.766 {8,524,456)
Total net assets 14,011,369 191,812 87,748 779,172 (12.957,724) 391,366 468,693 1,840,766 4,813,202
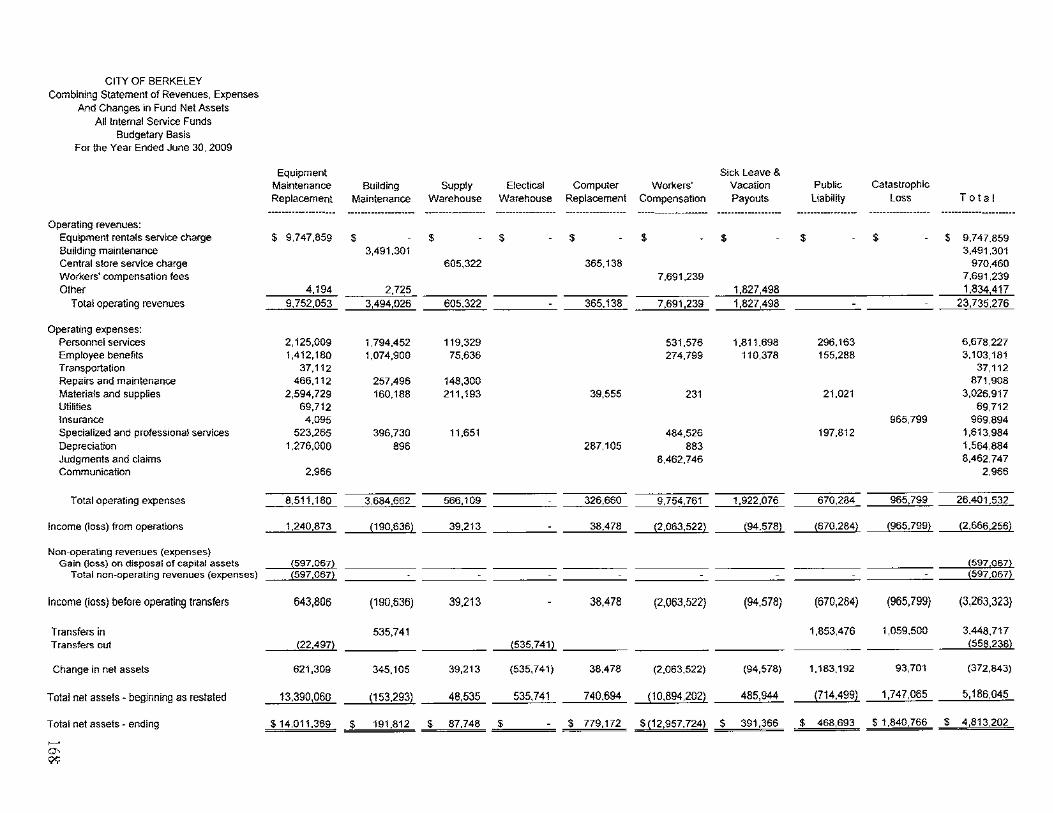
CITY OF BERKELEY Combining Statement of Revenues, Expenses
And Changes in Fund Net Assets All internal Service Funds
Budgetary Basis For the Year Ended June 30, 2009
Equipment Sick Leave & Maintenance Building Supply Electical Computer Workers' Vacation Public Catastrophic
Replacement Maintenance Warehouse Warehouse Replacement Compensation Payouts liability Loss T ota I -------··-········· ··············-··- ~~ ················--- --·--··------·-··· ---------------------
Operating revenues: Equipment rentals service charge $ 9,747,859 $ $ $ $ $ $ $ $ $ 9,747.859 Building maintenance 3,491.301 3,491,301 Central store service charge 605,322 365,138 970,460 Workers' compensation fees 7,691,239 7.691,239 Other 4,194 2,725 1,827,498 1,834417
Total operating revenues 9,752,053 3,494,026 605.322 365,138 7,691,239 1,827,498 23,735,276
Operating expenses: Personnel services 2,125,009 1,794,452 119,329 531.576 1,811,698 296.163 6,678.227 Employee benefrls 1,412,180 1,074,900 75,636 274.799 110,378 155,288 3,103,181 Transportation 37,112 37,112 Repairs and maintenance 466,112 257,496 148,300 871,908 Materials and supplies 2,594,729 160,188 211,193 39,555 231 21.021 3,026,917 Utilities 69,712 69,712 Insurance 4,095 965,799 969,894 Specialized and professronal services 523,265 396,730 11,651 484,526 197.812 1,613,984 Depreciation 1,276.000 896 287,105 883 1,564,884 Judgments and claims 8.462.746 8,462,747 Communication 2.966 2,966
Total operating expenses 8.511.180 3,684.662 566,109 326,660 9,754,761 1,922,076 670,284 965,799 26.401,532
Income (loss) from operations 1,240,873 (190,636) 39.213 38,478 (2,063,522) (94.578) {670.284) (965,799) (2,666,256)
Non-operatrng revenues (expenses) Gain (loss) on d!sposal of caprtal assets (597,067) (597,067)
Total non-operating revenues (expenses) (597,067) (597,067)
Income (loss) before operating transfers 643,806 (190,636) 39,213 38,478 (2,063,522} (94,578) (670,284) (965,799) (3,263,323}
Transfers in 535,741 1,853,476 1,059.500 3.448,717 Transfers out (22,497) (535,741) (558 238)
Change in net assets 621,309 345,105 39,213 (535,741) 38,478 (2,063,522) (94,578) 1,183,192 93,701 (372,843)
Total net assets- beginning as restated 13,390,060 (153.293) 48,535 535,741 740.694 (10,894,202) 485,944 (714,499) 1,747,065 5,186,045
Total net assets- ending s 14,011,369 $ 191,812 $ 87.748 $ $ 779,172 $(12,957,724) $ 391,366 $ 468,693 $ 1,840,766 $ 4,813,202
~
"' ""
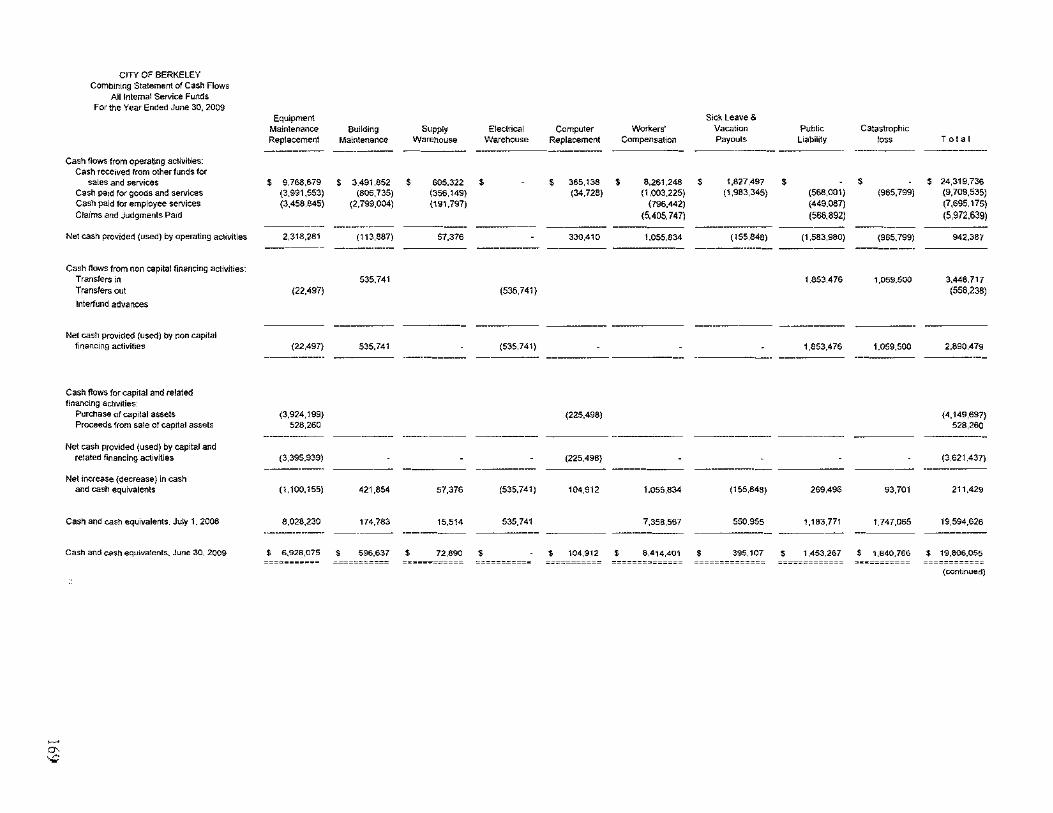
CITY OF BERKELEY Combmtng Statemeflt of Cash Flows
All Internal Service Funds For the Year Ended June 30, 2009
Cash fiows from operating aclivities: Cash receoved from other funds for
sales and servoces Cash paod for goods and services Cash paid for employee services
Claims and Judgments Pa1d
Net cash Provided (used) by operating aclovities
Cash news from non capital financing aclivities· Transfers on Transfers out
lnterfund advances
Net cash provoded (used) by non cal"lal finan~tng activities
Cash flows for cap1tal and related f•nanctng a~tovities
Purchase of cap1tal assets Proceeds from sale of capttal assets
Net cash Provided (used) by capital and related financing acl1viUes
Neltncrease {decrease) in cash and cash equivalents
Cash and cash equivalents. July 1. 2006
Cash and cash equovalents . .lune 30, 2009
Equipment Maintenance Replacement ~----·-
$ 9,768,679 {3,991,553) (3.458.845)
--------2,318,281
------
(22.497)
(22,497) ---------
{3.924,199) 528,260
(3,395.939)
(1.100,155)
8,028.230
Bwldong Supply Maintenance Warehouse
------- -----
$ 3.491,852 $ 605,322 {806,735) (3515,149)
(2,799,004) (191,797)
----------- -----~
(113,887) 57,376 ~----------
535.741
------535.741
---------
421,854 57,376
174,783 15.514
Electrical Computer Worl<ers' Warehouse Replacement Compensatoon
--------------
$ ' 365,138 $ 8.261,248 (34,728) (1 ,003,225)
{796,442) (5.405, 747)
----- ------ ------330,410 1.055,834
------
(535,741)
------(535,741)
----- ------
{225.498)
(225,496)
(535,741) 104,912 1.055,834
535,741 7,358,567
$ 6,9211,075 $ 596.637 $ 72,1190 $ $ 104.912 $ 8,414,401
Sick Leave & Vacation Public Payouts LLabitoty
---~----
' 1,827,497 $ (1 ,983,345) (568,001)
{449.087) (56$,892)
------- ------(155.848) (1 ,583,980)
------------ ------
1.853.476
-------- ~------
1,853,476
(155,848) 269,496
550.955 1,183,771
Catastroph>c toss Total
' (965,799)
-----(965.799)
-------
1,059.500
1.059,500 ~------
93,701
1.747,055
$ 24,319.736 (9,709,535) (7,695, 175)
(5,972.639) -----
942,387
3.448,717 {558.236)
2,890,479
(4,149,697) 528,260
(3.621.437)
211.429
19,594,626
' 395,107 $ 1,453,267 $ 1,1140,766 $ 19.806.055
(oomonued)

CITY OF BERKELEY Comb•mng Statement of Cash Flows
All Internal Serv1ce Funds For the Year Ended June 30. 2009
Eqwpment Building Supplies Electrical Computer Worke~s Sick Leave & Public Catastrophic
Maintenance Maintenance Warehouse Warehouse Replacement CompensaliOn Vacation Payouts Liability loss T ota I
-·--··--- ~~--- --··-----·-----·--· -------- -----~
Reconc•hat10n of operating Income to net operatong cash:
Income (loss) from operations ' 1.240.873 $ (190.636) ' 39.213 $ $ 38.478 ' (2.063.522) ' (94.578) $ (670.284) $ (965.799) • (2.666.255)
Adjustments lo reconcile mcome (loss)
from operations to net cash provided (used) by operating activities
Deprec1a~on 1.276,000 "" 287.105 "" 1.564.884
Change in: Acoounts receivable 16.626 (2.176) 14.450
Inventory 20.707 20.707
Acoounts payable (257.723) 7.682 (5.712) '"" (37.728) (61.270) (63.476) (411.281)
Accrued salanes 24.369 9.560 1.470 8.927 2.564 46.890
Compensated absences 1.666 48.862 "" 3.146.270 (850.325) 2.347.356
Other habil1!1es (3.079) (2.459) (5.538)
Net OPEB Obl1gatoon. m1sc retoree 16.470 11.925 "" (2.119) 4.D83 31.174
Nel cash provoded (used) by operatong -----·- ~---·---- -------activilies $ 2.318.281 $ (113.887) ' 57.376 ' ' 330.410 ' 1.055.834 $ (155.848) $ {1.583.980) ' (965,799) ' 942.387
""""""""==== =-----===== =-----====== ===""'"'""""= =========-= =-============ -============= ==========--- --========= """"==--=== (conc1uded)

CITY OF BERKELEY Combining Statement of Fiduciary Net Assets
Pension and Other Employee Benefit Trust Funds June 30, 2009
Pension Other Post-employment Benefit
Trust Funds Trust Funds Miscellaneous
Safety Members Police Retiree Fire Retiree Pension/Pension Retirement Medica! Medical Total
Annuity Fund --------------------------------------------------- ------------ --------- ------------------ - -------------------
Assets Cash and cash equivalents $ 45,220 $ 1,145,513 $ 1,797,002 $ 905,827 $ 3,893,562
Restricted cash 3,042,685 3,042,685 Investments, at fair value
Guaranteed Investment Contract 3,947,425 3,947,425 Government Sponsored Enterprises 154,979 154,979 Local Agency Loans 533,000 533,000
Corporate notes 4,518,944 3,224,840 7,743,784 Interest Receivable 62,107 253,127 44,333 359,567
Total assets 3,087,905 5,155,045 7,257,052 4,175,000 19,675,002
Liabilities Retiree pension 45,220 45,220
Total liabilities 45,220 45,220
Net Assets Held in trust for pension benefits 3,042,685 5,155,045 8,197,730 Held in trust for OPES benefits 7,257,052 4,175,000 11,432,052
Total net assets $ 3,042,685 $ 5,155,045 $ 7,257,052 $ 4,175,000 $19,629,782

CITY OF BERKELEY Combining Statement of Fiduciary Net Assets
Agency Funds June 30, 2009
Agency Funds
------------------------ -------------------- - ----------------------------- ----------------------- .. -------------------
Assets Cash and cash equivalents Taxes Receivable Other Account receivable
Total assets
liabilities Other Agency obligations Due to Other funds Totalliabihties
District 47 Underground/Miller
$ 152,244 $
1,419
Sustainable Energy
Thousand Oaks Undergrounding
Measure H School Tax
79,442 $ 156,139 $ 189,650 37,366
:!•==='~'~'~-'~'I:' :!•==~79~4~4~2[ :•c=='~'~'J-']'[9 s 227.016
$ 153,663 $ 79,442 $ 156,139 $ 227,016
J:•==='~'~'~-'~'I:' :!•==~79[.4~4~2[ :~•==I''~'[-'~'~9: s 221,o16
CFD No_ 1 Disaster F1re Protection Sick Leave
$
$
'
Mello-Roos Entitlement
2,681,081 s 12,876
2,693,957
2,693,957 s 64,810
:•c==:J:2.~,9~3~,9~s~7: :!•=j"~-!·,~ot
Agency Funds
$ 3,258,556 51,661 64,810
$ 3,375,027
$ 3,310,217 64,810
$ 3,375,027

CITY OF BERKELEY Combining Statement of Changes in Fiduciary Net Assets
Pension and Other Employee Benefit Trust Funds For the year ended June 30, 2009
ADDITIONS:
Contributions: Employer Investment income
T ota! Additions
DEDUCTIONS:
Benefits: Service Disability
Administrative Expenses Total Deductions
Change in net assets
Net Assets - beginning
Net Assets - ending
Pension Trust Funds
Safety Members Pension/Pension
Annuity Fund
$ 990,809 $ 291,339
1,282,148
1,222,403 506,183
7.600 1,736,186
(454,038)
3,496,723
$ 3,042,685 $
Police Retirement
822,000 414,094
1,236,094
805,342
10,380 815,722
420,372
4,734,673
5,155,045
Other Post-employment Benefit Trust Funds
Retire Medical
Fire Medical
$ 1,561,583 $ 742,597
620,347 350,030
2,304,180 970,377
540,547 239,092
53,060 11,340 593,607 250,432
1,710,573 719,945
5,546,479 3,455,055
$ 7,257,052 $ 4,175,000
$
$
total
3,994,739 1,798,060 5,792,799
2,807,384 506,183 82,380
3,395,947
2,396,852
17,232,930
19,629,782

D1stnct 47 Underground/Miller
-----------------
Assets
Cash and Investments in treasury, July 1. 2008 $ 226,356 $ Add1t1ons 74,544 Deletions (148,656)
Cash and Investments 1n treasury, June 30, 2009 152.244
Taxes Receivable. July 1. 2008 1,372 Additions 1.419 Deletions (1.372)
Taxes Receivable, Jurte 30, 2009 1,419
Other Accounts Receivable. July 1, 2008 Add•tlorts Deletions
Other Accounts Receivable, June 30, 2009
Total Assets, June 30, 2009 $ 153,663 $
Liabilities
Agency obligations, July 1. 2008 $ 227,728 $ Additions 75,963 Dele\tons (150,028)
Agency obhgahons, June 30, 2009 153,663
Total Liabilities, Jurte 30, 2009 $ 153,663 $
CITY OF BERKELEY Statement of Changes in Assets and liabilities
Agency Funds For the year ended June 30, 2009
------------··------ ----------------- ---------------------
Sustamable Thousand Oaks Measure H Energy Undergroundmg School Tax
----------------
$ 252,917 $ 156.179 192.767 4.555 189.650
(113.325) (101.333) (156,179) 79.442 156,139 189,650
39,373 162,312
(164.319) 37,366
79,442 $ 156,139 $ 227,016
$ 252,917 $ 195,552 192,767 4,555 351,962
(113,32500) (101,333) (320,498) 79.442 00 156,139 227,016
79,442 $ 156,139 $ 227,016
----------- --------------- -----------------CFD No Total
Disaster Fire Protection Sick Leave Agency Mello-Roos Enbtlemenl Funds
-------------------· -- ----------------······ ---------------
$ 1,073,171 $ 147,860 $ 1,856.483 2,785.552 257,582 3,504,650
(1177,642) (405.442) (2.102,577) 2,681,081 3,258,556
14,386 55,131 15,574 179,305
(17,084) (182,775) 12,876 51,661
64,810 64,810
64,810 64,810
$ 2 693 957 $ 64,810 $ 3.375,027
$ 1,087,557 $ 147,860 $ 1,911,614 2,801,126 322,392 3,748.765
(1,194,726) (405,442) (2,285,352) 2,693,957 64,810 3,375,027
$ 2,693,957 $ 64,810 $ 3,375,027

Index to Statistical Section
This part of the comprehensive annual financial report presents detailed information as a context for understanding what the information in the financial statements, note disclosures, and required supplementary information says about the City's overall financial health.
Contents
Financial Trends 176-182 These schedules contain trend information to help the reader understand how the City's financial performance and well-being have changed over time.
Revenue Capacity 183-186 These schedules contain information to help the reader assess the factors affecting the City's ability to generate its propc1ty tax.
Debt Capacity 187-191 These schedules present information to help the reader assess the affordability of the City's current levels of outstanding debt and the City's ability to issue additional debt in the future.
Demographic and Economic Information 192-194 These sch~dulcs offer demographic and economic indicators to help the reader understand the environment within which the City's financial activities take place and to help make comparisons over time and with other governments.
Operating lnfonnation 195- J 98 These schedules contain information about the City's operations and resources to help the reader understand how the City's financial information relates to the services the City provides and the activities it performs,
Sources: Unless otherwise noted, the infom1ation in these schedules is derived from the comprehensive annual financial reports for the relevant year. The City implemented Statement 34 in fy2002; schedules presenting government-wide information include information b;;ginning in that year.
175

City of Berkeley Net Assets by Component. Last E'ght Fiscal Years (Accrual Bas1s of Accountmg)
F1scat Year 2002 2003 2004 2005 2006
Governmental activities Invested in capital assets. net of related debt • 123,773,416 $ 127.262,988 s 120,354.829 • 118,077,829 s 116,173,114 Restricted 4,843,267 720,139 2,792,509 1,563,274 Unrestricted 63,540,732 40,459,266 60,263,548 71,993,628
Total governmental actovities net assets (as restated) $ 187,314,148 • 172.565,521 • 181,338,516 • 192,863,967
Business-type activities Invested in cap1tal assets, net of related debt • 112,750,870 $ 147,898,650 $ 135,601,751 $ 132,931,688 • 134,279,309 Restricted 270.417 2,566,760 2,357,251 Unrestricted 10,073,443 (9.851,459) 7.788,989 19,865,598 25.253,701
Total business-type activities net assets (as restated) ' 122,824,313 $ 138,047,191 $ 143.661,157 • 155.364.046 $ 161,890,261
Pro mary government Invested m capital assets, net of related debt s 236,524,286 $ 275,161,638 • 255,956,580 $ 251,009,518 $ 250,452,423
Restricted 4.843,267 720,139 3,920,525 Unrestncted 73,614.175 30,607.807 68,322,954 115,140,682
Total pnmary government net assets (as restated) $ 310,138.461 $ 310,612.712 • 324,999,673 $ 369.513,630
The city began to report accrual infom1ation when it implemented GASB Statement 34 in foscal year 2002. Information pnor to the Implementation of GASB 34 is not available. • Restated 2006, 2007 and 2008 ©Berkeley housing Authority became Doscrete Component un1t in FY08, prior to that it was an Enterpnse fund of the Pnmary Government
Source· City of Berkeley, Fmance Deparlment
Schedule I
2007 2008 2009
' 119,501,487 $ 128,227,860 $ 131,597,270 6,816,326 4,675,040 4,255,485
92,306,119 102,0&4.459 99,459.793
• 218,623,932 • 234,967,359 • 235,312,547
• 138,876,029 • 133,301,364 $ 133,879,724 3,650,091 12,586,834 12,620,752
26,306.174 22,860.569 20,776,974 $ 168,832,294 • 168.748.767 © • 167,277,449
• 258,377,517 $ 261,529,224 $ 265,476,993
10,466,417 17,261,874 16,876,237
118,612,293 124,925,028 $ 387,456,227 • 403,716,126

Schedule !I City of Berkeley Changes in Net Assets last Eight Fiscal Years {Accrual Basis of Accounting) Fiscal Year
2002 2003 2004 2005 2006 2007 2008 2009
Expenses Governmental activities:
General government $ 18,222,154 $ 19,572,189 $ 21,300,795 • 20,009,187 $ 23,737,019 $ 25,380,703 • 27,163,852 s 29,266,165 Public safety 56,574,112 60,259,913 62,776,926 65.924,262 70,198.107 74.872,926 81,244,204 83,172,996 Highways and streets 9,884,872 8,329,067 12,734,736 14,147,769 12,618,115 13,036,473 15,755,378 13,103,246 Health and welfare 20,726,933 22.604,804 22,688,767 24,678,821 24,384,895 27.344,501 28,952,978 30,156,828 Culture and recreation 25,968,658 28.071,439 30,495,373 26,690,760 27,959,448 30,957,018 32,870,746 32,637,740 Community development/housing 17,988,785 16.706,510 18,404,154 14,417,831 13,162,293 15,563,578 15.433.912 19,774,724 Economic development 2,163,302 2.358,346 2,679,686 2,706,552 1,935,691 2,961,942 3,208.496 3.412,478 Interest on long-term debt 6,962.202 6,682 857 6,102,845 5.368,380 6.927 491 4,333,851
Total governmental activities 158.491,018 164,585,125 177,183,281 179,363,947 197,044632 215,858,028 Business-type activities:
Parking related 5,564,215 5,298,146 5,541.188 5,951,064 6,582.206 6,355,523 ' 6,741,263 s 7,579,581 Marina operations and maintenance 3,836,350 3,288,576 3,783,046 4,426,180 4,045,602 3,895,374 4,157,414 4,561,291 Sewer services 15,561,040 9,157,561 8,866,172 9,713,581 10,359,961 10,023,197 10,351,107 11,024,519 Clean storm water 2,070,008 2,355.583 1,763,376 2,067,609 2,068,087 2,297,733 2,703,970 2,882,256 Refuse services 20,475,799 22,025,127 23,571,482 24,824,928 25,786,615 26,564,445 29,816,972 33,140,056
Perml! se!Vice center 6,273,662 6,253,095 6,704,832 7,227,440 8,903,637 9,849,515 10.407,986 10,723,985 Building purchase and management 1,184,591 3,594,161 2,955,853 3.474,788 2,919,162 2,875,534 Housing authonty 19,710 638 23,902,806 23,839,825 24,497,462 ©
Total business-type act1v1b'es 69,273 317 77,727,060 81,006,480 85,718,358 67,097,874 Total primary government expenses (as restated) $ 233.858,442 $254,910,341 $254,538,101 $ 265.082,305 $ 276,107,910
Program Revenues Governmental activities:
Charges for services: General government s 2,832,082 ' 1,956,831 s 6,286,727 s 1,601,178 ' 3,101,701 ' 2,828,121 ' 2,894,176 ' 3,054,674 Public safety 9,756,599 10,025,689 11,213,917 12,940,137 12,866,458 15,974,825 15,301,222 15.514,920 Highways and streets 20,277 48,623 1,643,923 1,679,570 1,799,346 1,510,382 1,505.087 Health and welfare 590,256 931,518 1,399.349 1,016,728 1,060,604 1,104,234 1,007,647 1,142,896 Culture and recreation 2,122,438 2,158,152 2,641,480 2,563,785 2,577,201 2,564,813 2,878,087 3,027,156 Community development/hoUsing 90,949 (369,350) 163,045 2,238,445 1,623,028 3,317,101 2,451,135 1,525,429 Economic development 232,096 268,457 289,244 459,963 492,162 714.769 771,563
Operating grants and con!nbutions 24,577,749 20,204,290 23,727,264 21,783,960 32,821.127 32,328,025 32,694,861 31,338,593 Capital grants and contributions 3,698,059 2,648,815 1,237,230 3,196,612 3,127,042 9,223,690 5,798,539
Total governmental activities program revenues 43,668,132 37,818 318 45,314,630 59,386,274 63,535,667 68,675.969 63,678,856
Continued

Schedule II City of Berkeley Changes in Net Assets last Eight FISCal Years (Accrual Basis of Accounting) Fiscal Year
2002 2003 2004 2005 2006 2007 2008 2009 Busmess-type activities.
Charges for services. Parking related 5,339,753 4,986,372 5,625,043 5,933,890 6,262,246 6,579,472 7,228,080 7,491,363
Marina operations and maintenance 3,510,083 3.677,618 3,493,512 4,428,619 3,959,829 4,403,372 4,708,412 5,343,851 Sewer services 12,693,862 13,573,031 13,346,848 15,791,868 14,291,484 13,214,799 15.119.555 13,864.952 Clean storm water 1.952,588 2,099,784 1,903,397 2.256,770 2,103.895 2.012,753 1,950,637 2,026,307 Refuse services 20,225,343 21,864,115 23,243,474 24,374,069 26,943,113 29.286,719 29,591,397 29.292,344 Permit service center 4,984,835 5,812,873 6,850,135 9,768,619 9,011,732 8.930,408 11.268,021 10,137,535 Building purchase and management 832,452 2.231,092 2.132,243 2,668,506 2,642,140 2,634,594 2.923,964 Housing authority 16,408,936 19,480,501 23.976,774 24,429,603 24,747,553 23,840,526 ©
Operating grants and contributions 382.440 20,297 Total business-type activities program revenues 65,115.400 72,326 746 80,670,275 89,115,681 90,370.799 72,500.696 71,100,613 Total primary government revenues $ 108,783,532 s 110,145,064 $ 126,687,137 $ 134,430,311 $ 149,757,073 $ 141,176,665 s 134,779.469
Net (EKpense)/Revenue
Governmental activities $(114,822,886) $(126,766,807) $(131,166,421) $(128,216,991) $(119,977,673) $(133,508,965) $ (140,334,006) $(152,179,172)
Business-type activities (5,464,225) 3,053,429 2,943.215 8,109.201 4,652.440 5,185.253 5,402,822 (1 ,686,609)
Total primary government net expense (as restated) $(120,287, 11 1) $(123,713,378) $(128,223,207) $(120,107,790) $(115,325,233) $(128,323,711) $ (134,931.245) $(153,865,781)
Continued
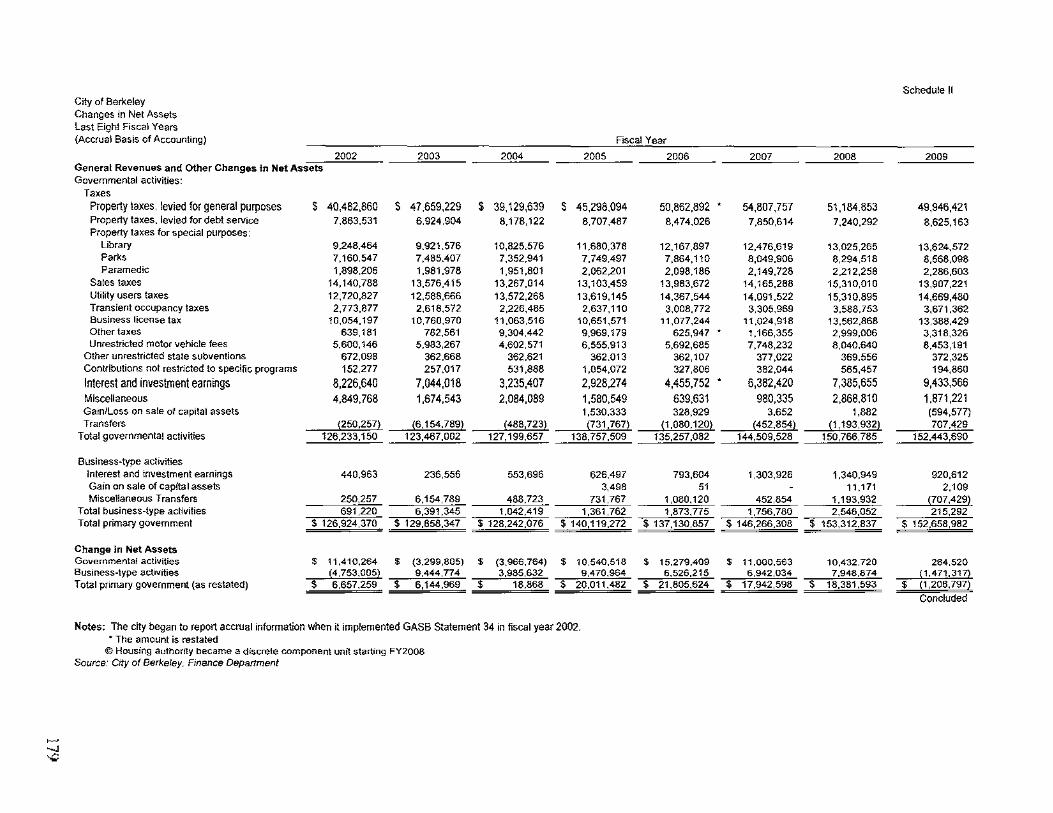
City of Berkeley Changes in Net Assets Last Eight Fiscal Years (Accrual Basis of Accounting) Fiscal Year
2002 2003 2004 2005 General Revenues and Other Changes in Net Assets Governmental activities:
Taxes Property taxes. levied for general purposes $ 40.482,860 s 47,659,229 $ 39,129,639 $ 45,298.094 Property taxes. levied for debt service 7,863.531 6,924,904 8,178,122 8,707,487 Property taxes for special purposes:
Library 9,248,464 9.921,576 10,825.576 11,680,378 Parks 7,160,547 7,485.407 7,352,941 7,749.497 Paramedic 1,898.205 1.981.978 1,951,801 2.062,201
Sates taxes 14,140,788 13,576,415 13,267,014 13,103,459 Utility users taxes 12,720,827 12,588,666 13,572.268 13,619.145 Transient occupancy taxes 2,773,877 2,618,572 2,226,485 2,637,110 Business license Ia~ 10,054,197 10,760,970 11.063,516 10,651,571 Other taxes 639,181 782,561 9,304,442 9,969,179 Unrestricted motor vehicle fees 5,600,146 5,983,267 4,602,571 6,555,913
Other unrestncted state subventions 672,098 362,668 362.621 362,013 Contributions not restricted to specific programs 152,277 257.017 531,888 1,054,072
Interest and investment earnings 8,226,640 7,044,018 3,235,407 2,928,274
Miscellaneous 4,849,768 1,674,543 2,084,089 1,580,549 Garnlloss on sale of capital assets 1,530,333 Transfers (6, 154,789) (488,723) (731,767)
Total governmental activities 123,467,002 127,199,657 138,757.509
Business-type activities Interest and investment earnings 440,963 236,556 553,696 626.497 Gain on sale of capital assets 3,498 Miscellaneous Transfers 250,257 6,154,789 488,723 731.767
Total business-type activities 691,220 6,391,345 1.042,419 1,361,762 Total primary government s 126.924,370 s 129,858,347 $ 128,242,076 $ 140,119,272
Change in Net Assets Governmental activities ' 11,410,264 • (3,299,805) • (3,966,764) $ 10,540,518 Busmess-type actovoties 9,444,774 3,985,632 9.470,964 Total pnmary government (as restated) $ 6,144,969 $ 18,868 s 20.011,482
Notes; The city began to report accrual information when it implemented GASB Statement 34 in fiscal year 2002. • The amount is restated
©Housing authority became a discrete component unrl starting FY2008 Source: City of Berkeley. Fmance Department
2006
50,862,892
8,474.026
12.167,897 7,864,110 2.098,186
13,983,672 14,367,544 3,008,772
11,077,244 625,947
5,692,685 362,107 327,806
4,455,752
639,631 328,929
(1.080,120) 135,257,082
793,604 51
1,080,120 1,873,775
$ 137,130,857
• 15,279,409
Schedule II
2007 2008 2009
54,807,757 51,184.853 49,946,421
7,850,614 7,240,292 8,625,163
12,476,619 13,025,265 13,624,572 8,049,906 8,294,518 8,568,098 2,149.728 2,212,258 2,286,603
14,165,288 15,310,010 13,907,221 14.091,522 15,310,895 14,669,480 3,305,969 3,588,753 3,671,362
11,024,918 13,562,868 13,388,429 1,166,355 2,999,006 3,318,326 7,748,232 8,040,640 8,453,191
377,022 369,556 372,325 382,044 565,457 194,860
6,382,420 7,385,655 9,433,566
980,335 2,868.810 1.871,221 3,652 1,882 (594,577)
(452.854) (1,193,932) 707.429 144,509,528 150,766,785 152.443,690
1,303,926 1,340,949 920,612 11,171 2.109
452,854 1,193,932 (707,429) 1,756,780 2,546,052 215,292
$ 146,266,308 $ 153,312,837 $ 152,658,982
• 11,000,563 10,432,720 264,520 7,948,874 (1.471,31!)
s 18,381,593 $ p ,206.797)
Concluded

City of Berkeley Fund Balance, Governmental Funds Last Eight F1scal Years (Modified Accrual Bas1s of Accounting)
General Fund Reserved
Unreserved
Total general fund (as restated)
All Other Governmental Funds
Reserved
Unreserved, reported in:
Special revenue funds
Capital project funds Total an other governmental funds (as restated)
2002 2003
$ 15,153,741 $ 17,267.809 ' 11,940,001 8,091,603
s 27,093,742 ' 25,359.412 $
$ 76,970,029 $ 74,998.866 ' 12,138,074 6,592,609 22,875,349 13,353,656
$ 111 ,983,452 $ 94,945,131 s
Note: As certain data required by GASB 44 was not readily available for years prior to 2002. years of data for this schedule
'Restated 2006 due to change of liability in both Special Revenue and Capital Project funds ©Restated 2007 due to change of major funds #Restated 2008 due to change of receivables in Capital Project funds
Source: City of Berkeley, Finance Department
Schedule Ill
Fiscal Year 2004 2005 2006 2007 2008 2009
17,906,247 s 13,609.216 ' 12,424,249 ' 15,735,422 © $ 16,153.120 $ 12,745,878 10,045,955 20.389,483 27,392.892 29,989,078 © 31,664,729 • 32.245,545
27,952,202 $ 33.998,699 $ 39,817,141 $ 45,724,500 $ 47,817,849 ' 44.991.423
54,280,209 ' 61,827,937 ' 53,855,131 $ 56,642,985 © $ 67,651,814 $ 66,847,870
10,062,899 9,760,166 17,836,391 12,038,775 © 16,158,919 26,001,665 11,960,837 7,907,369 14,485,765 • 13,143,822 © 15,319,622 • 17,442,566 76,303,945 $ 79,495,472 s 85,177,287 $ 81,825,582 ' 99,130,355 ' 110,292,101
the City of Berkeley has elected to show e1ght

Schedule IV City of Berkeley Changes 111 Fund Balances, Governmental Funds Last E1ght Fiscal Years (Modified Accrual Bas1s of Accounting)
F1scal Year 2002 2003 2004 2005 2006 2007 2008 2009
Revenues: Taxes $110,118,248 5 114,300,278 $ 119,013,284 $ 127,843,161 $127,099,195 (2) $ 130,825,668 $ 135.613,099 $ 135,649,038 Licenses and perm1ts 430,002 390,529 431,201 467,395 545,681 512,598 580,144 887,535 Intergovernmental 31,089,174 29,047,289 31,338,994 30,726,190 42,282,288 (2) 43,618,133 50,298,070 45,681,080 Charges for Service 6,757,499 6,900,404 8,533,424 7,714,470 9,064,617 9,691,836 10,474,180 11,616,513 Fmes and Penalties 6,738,312 7,190,768 8,395,994 9,290,404 10.100,720 12,943,542 10,921,168 10,885,461 Rents and royaltieS 434,372 457,416 334,649 358,415 396,199 362,540 332,279 411,413 Fra11ch1se 1,333,154 1,218,235 1,393,504 1,436.751 1,531,999 1,685,798 1,731,548 1,848,246 Pnvate contributiOns and donal1ons 152,277 257,017 531,888 1,054,073 327,806 382,044 565,457 194,860 lnd1rect cost reimbursements 4,312,707 4,088,862 4,154,512 4,187,375 4.534,874 4,492,525 5,109,485 5,387,536 Investment income 8,226,640 7,044,018 3,235,407 2,928,274 4,434,170 (2) 6,382.420 7,385,655 9,433,566 M•scettaneous 4.415 396 1,217,127 1,749,440 1,222.134 243,428 395,868 2,536,531 1,459,808
Total revenues 174,007 781 172,111,943 179,112297 187,228,641 200,560,977 211,292973 225,547,615 223,455,055
Expenditures
Current General government 21,886,376 22,042,296 23105,335 22,898,746 27,620,068 29,015.667 30,871,113 33,123,618 Public safety 52,309,922 56,973,099 57,784,174 63,924,810 70,163,212 72,587,976 77,487,988 78,891,374 Highway and streets 8,507,617 8,173,854 7,874,308 8,962,255 9,557,307 8,731,843 11,113,003 8,308,257 Health and welfare 27,859,201 21,939,792 21,041,549 24,120,036 24,595,493 27,343,370 28,520,889 29,616,973 Culture-recreation 15,061,710 25,108,060 26,688,284 25,988,543 27,554,682 28,828,440 30,713,797 30,347,460 Commun1ty development/housmg 15,315,282 15,113,511 16,026,430 13,213,362 11,471,892 11,988,001 13,963,017 18,338.303 Economic development 2,067,415 2,341,039 2,570,502 2,631,230 1,951,430 2,467,872 3,121,599 3,360,442 Cap1ta1 outlay 16,872,084 8,202,994 6,616.033 8,654,422 8.578,941 8,824,669 9,794,468 12,993,361
Debt service Pnnc1pal repayment 6,190,870 22,521,352 25,232,548 4,052.503 4.245,808 10,629,931 6,148,777 5,476,657 Interest and fiscal charges 6,962,202 6,977,819 6,102,845 4,956,438 5,368,380 6,081,191 4,380,468 4,302,026 Cost of issuance 286,103 794,226 41,601 74,702
Total expenditures 173,032 679 189,393,816 193.042,008 179,402,346 191,393,316 207,293,187 216.156,718 continued
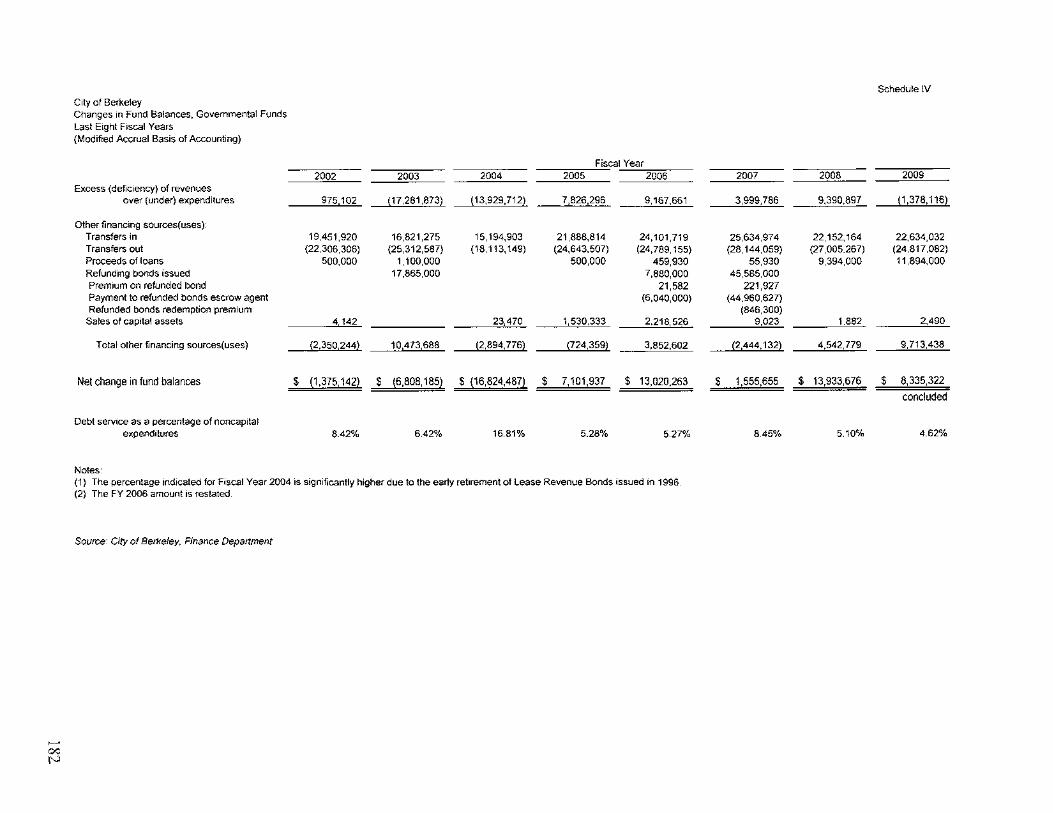
City of Berkeley Changes 1n Fund Balances, Governmental Funds Last Etght Ftscal Years {Modifted Accrual Basis of Accounting)
Fiscal Year 2002 2003 2004 2005 2006
Excess (defictency) of revenues over (under) expenditures 975 102 (17,281,873) (13,929,712) 7,826,296 9,167,661
Other financ•ng sources( uses). Transfers in 19,451,920 16,821,275 15,194,903 21,888,814 24,101,719 Transfers out {22,305,306) {25,312,587) (18, 113,149) (24,643,507) (24,789, 155} Proceeds of loans 500,000 1,100,000 500,000 459,930 Refundmg bonds issued 17,865,000 7,880,000 Premtum on refunded bond 21,582 Payment to refunded bonds escrow agent (6,040,000) Refunded bonds redemption prem1um
Sales of cap•tal assets 4142 23,470 1,530,333 2.218,526
Total other financing sources(uses} (2,350 244} 10 473 688 (2,894,776} (724,359) 3,852,602
Net change in fund balances ' (1,375142) ' (6,808,185) $ (16,824,487) $ 7,101,937 $ 13,020,263
Debt servtce as a percentage of noncap1!al expendt!ures 8.42% 6.42% 16.81% 5.28% 527%
Noles· (1) The percentage tndtcaled lor Foscal Year 2004 is significantly higher due to the early retorement of Lease Revenue Bonds issued tn 1996 (2) The FY 2006 amount ts restated
Source· City of Berkeley, Finance Department
Schedule IV
2007 2008 2009
3,999,786 9,390,897 {1 ,378, 116)
25,634,974 22,152,164 22,634,032 {28, 144,059} (27,005.267) (24,817,082)
55,930 9,394,000 11,894,000 45,585,000
221,927 {44,960,627}
(846,300) 9,023 1.882 2,490
(2,444,132) 4,542,779 9,713,438
' 1,555,655 $ 13,933,676 $ 8,335,322
concluded
845% 5.10% 4.62%

City of Berkeley Assessed Value and Estimated Actual Values of Taxable Property Last Nine Fiscal Years (In Thousands of Dollars)
Commercial Fiscal Residential Utility and Industrial Institutional Year Property Property Property Property
2001 1 $ 5,139,022 $ 2,640 $ 1,706,043 $ 120,792 2002 5,558,885 2,523 1,795,077 125,595 2003 5,981,691 2,463 1,911,660 126,737 2004 6,466,978 2,527 2,013,079 131,659 2005 7,005,223 3,075 1,966,680 149,092 2006 7,673,198 2,520 2,085,365 156,657 2007 8,415,411 2,335 2,235,743 212,847 2008 9,114,801 1,325 2,353,222 230,899 2009 9,762,011 474 2,498,734 228,115
Note:
Total Taxable Less: Assessed Total Direct
Exemptions Value Tax Rate
$ (351,510) $ 7,320,007 10.87 (368,619) 7,850,698 10.87 (373,130) 8,395,681 10.75 (360,677) 8,974,920 10.73 (433,086) 9,557,156 10.73 (415,243) 10,332,984 10.65 (486,955) 11,353,292 1053 (538,391) 11' 161,856 1045 (570,449) 11,918,885 10.55
1 Assessed Value and Estimated actual values of taxable property information is not available prior to fiscal year ending 2001.
2. In 1978, the voters of the State of California passed Proposition 13 which limited taxes to a maximum rate of 1% based upon the assessed value of the property being taxed. Each year the assessed value of property may be increased by an "inflation factor" (limited to a maximum increase of 2%). With few exceptions, property is only reassessed at the time that it is sold to a new owner. At that point, the new assessed value is reassessed at the purchase price of the property sold. Only six years of assessed value and estimated actual taxable value data in this format was available.
Source: Alameda County Auditor- Controller's Office
Schedule V
Estimated Actual Taxable
Value
$ 7,320,007 7,850,698 8,395,681 8,974,920 9,557,156
10,332,984 11,353,292 11,161,856 11,918,885

City of Berkeley Direct and Overlapping Property Tax Rates, Last Ten Fiscal Years (Rate Per $1,000 of Assessed Value)
City Direct Rates General
Fiscal Basic Obligation Year Rate(1) Debt Service
2000 10.00 0.94 2001 10.00 087 2002 10.00 087 2003 10.00 0 75 2004 10.00 0.73 2005 1000 0.73 2006 10.00 0.65 2007 10.00 0.53 2008 1000 0.45 2009 1000 0.55
Notes:
Total Direct Rate
10.94 10.87 10.87 10.75 10.73 10.73 10.65 10 53 10.45 10.55
Overlapping Rates Berkeley Peralta East Bay East Bay Bay Area Unified Community Municipal Regional Rapid School College Utility Dist 1 Park Dist. Transit
143 0.05 0.09 009 143 0.08 0.08 0.06 1.34 0.15 0.07 0.08 1.40 0.18 0.07 0.08 1.73 0.16 0.06 0.08 1.67 0.21 0.08 0.06 1.43 0.24 0.07 0.06 0.05 135 0.27 007 0.09 0.05 1.41 0.22 0.07 0.08 0.08 145 0.36 006 0.10 0.09
(1) In 1978, California voters passed Proposition 13 which sets the property tax rate at a 1.00% (or $10 per $1,000 of assessed value) fixed amount. This 1.00% is shared by all taxing agencies for which the subject property resides within. In addition to the 1.00% fixed amount, property owners are charged taxes as a percentage of assessed property values for the payment of City, school, and other districfs bonds.
Source. Alameda County Auditor ControJ!er's Office.
Schedule VI
Total Rate
12.59 12.52 12.52 12.48 12.75 12.73 12.49 12.35 12.30 12.62
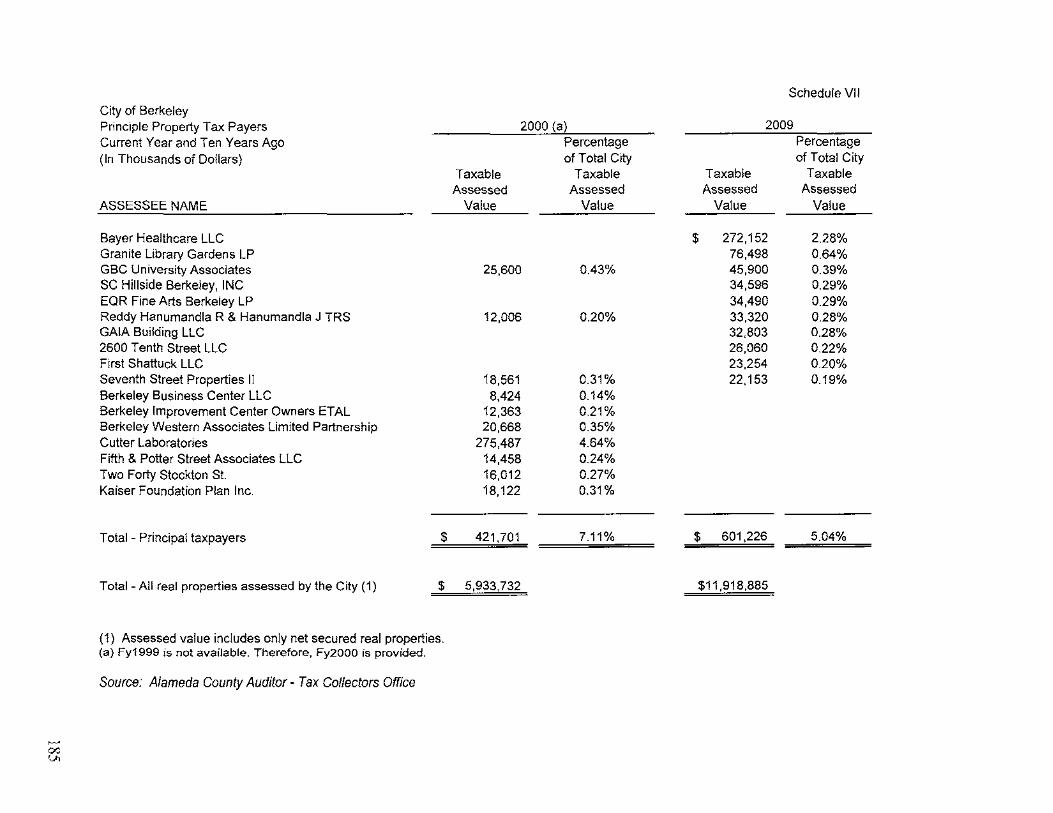
City of Berkeley Principle Property Tax Payers Current Year and Ten Years Ago (In Thousands of Dollars)
ASSESSEE NAME
Bayer Healthcare LLC Granite Library Gardens LP GBC University Associates SC Hillside Berkeley, INC EQR Fine Arts Berkeley LP Reddy Hanumandla R & Hanumandla J TRS GAlA Building LLC 2600 Tenth Street LLC First Shattuck LLC Seventh Street Properties II Berkeley Business Center LLC Berkeley Improvement Center Owners ETAL Berkeley Western Associates Limited Partnership Cutter laboratories Fifth & Potter Street Associates LLC Two Forty Stockton St. Kaiser Foundation Plan Inc.
Total- Principal taxpayers
Total- All real properties assessed by the City (1)
$
$
(1) Assessed value includes only net secured real properties. (a) Fy1999 is not available. Therefore, Fy2000 is provided.
Source: Alameda County Auditor- Tax Collectors Office
2000 (a)
Taxable Assessed
Value
25,600
12,006
18,561 8,424
12,363 20,668
275,487 14,458 16,012 18,122
421,701
5,933,732
Percentage ofT otal City
Taxable Assessed
Value
0.43%
0.20%
0.31% 0.14% 0.21% 0.35% 4.64% 0.24% 0.27% 0.31%
7.11%
Schedule VIJ
2009 Percentage of Total City
Taxable Taxable Assessed Assessed
Value Value
$ 272,152 2.28% 76,498 0.64% 45,900 0.39% 34,596 0.29% 34,490 0.29% 33,320 0.28% 32,803 0.28% 26,060 0.22% 23,254 0.20% 22,153 0.19%
$ 601,226 5.04%
$11,918,885
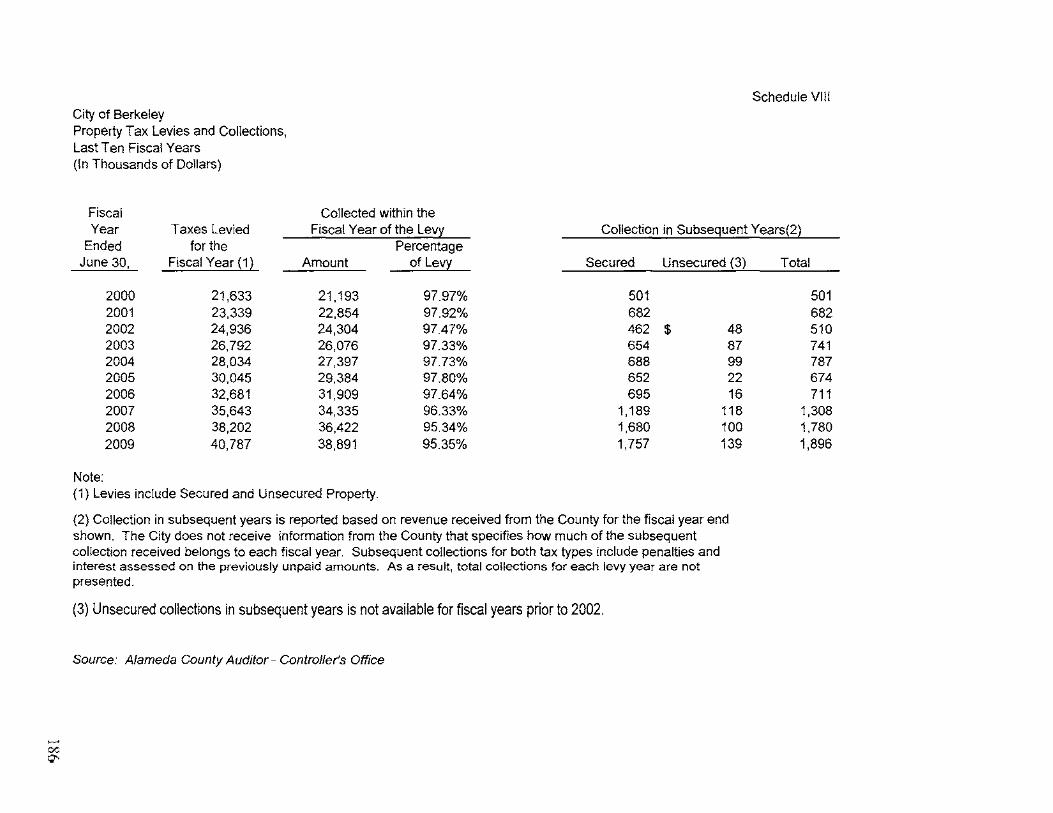
City of Berkeley Property Tax Levies and Collections, Last Ten Fiscal Years (In Thousands of Dollars)
Fiscal
Schedule VII!
Year Taxes Levied Collected within the
Fiscal Year of the Levy Collection in Subsequent Years{2) Ended for the Percentage
June 30, Fiscal Year ( 1) Amount of Levy Secured Unsecured (3)
2000 21,633 21,193 97.97% 501 2001 23,339 22,854 97.92% 682 2002 24,936 24,304 97.47% 462 $ 48 2003 26,792 26,076 97.33% 654 87 2004 28,034 27,397 97.73% 688 99 2005 30,045 29,384 97.80% 652 22 2006 32,681 31,909 97.64% 695 16 2007 35,643 34,335 96.33% 1,189 118 2008 38,202 36,422 95.34% 1,680 100 2009 40,787 38,891 95.35% 1,757 139
Note: {1) Levies include Secured and Unsecured Property.
{2) Collection in subsequent years is reported based on revenue received from the County for the fiscal year end shown. The City does not receive information from the County that specifies how much of the subsequent collection received belongs to each fiscal year. Subsequent collections for both tax types include penalties and interest assessed on the previously unpaid amounts. As a result, total collections for each levy year are not presented.
(3) Unsecured colleclions in subsequent years is not available for fiscal years prior to 2002.
Source. Alameda County Auditor- Controller's Office
Total
501 682 510 741 787 674 711
1,308 1,780 1,896

City of Berkeley Ratios of Outstanding Debt by Type Last Ten Fiscal Years (Dollars in Thousaflds, Except Per Capita)
Fiscal Year
2000 2001 2002 2003 2004 2005 2006 a 2007 b 2008 2009
Fiscal YMf
2000 2001 2002 2003 2004 2005 2006 2007 2008 2009
General Obligation
Bonds
78.120 76,755 75,245 73,915 71,885 69,940 67,915 60,000 64,255 71,430
Lease Revenue
Bonds
5,140 4,985 4,820 4,650 4,470 4,280 5,290 5,040 4,780 4,510
Certificates of Particieation
1,565 1,405
Certificates of
Participabon
27,950 27,950 27,950 27.950 27,685 27,410 26,755
Redevelopment Bonds
9,845 9,345 8,810 8,815 8,236 7,040 8,110 7,420 6,705 6,503
Business-
Notes Payable
2,257 2,858 2,691 2,541 3,738 3,428 3,319 1.954 4,431 4,710
Governmental Activities
Lease Revenue Capital
Bonds Lease
44,240 868 42,150 593 39,955 2,453 37,805 1,893 15,495 1,623 14,435 1,743 13,455 1.343 12.550 920 11.715 473 10,940 4,440
e Activities
Total Capital Business-Type Lease Activities
1,124 8.521 802 8,645 462 7,973 103 35,244 53 36,211
35,658 36.559
c 34,679 36,621 35,975
Notes: Details regarding the city's outstanding debt can be found in the notes to the financial statements
a The City issued $7 million in refunding tax allocation bonds for the Berkeley Redevelopment Agency_ b The City issued over $45.5 million into de lease General Obligation Bonds during the year
c Restated Amount
(1) See Schedule XIV fer personal mcome and population data
Source: City of Berkeley, Finance Deparlmen/
Schedule IX
Total Notes/Loans Governmental
Payable Activities
23 134,661 12 130,260
2,194 128.657 2,672 125.100 2,629 99,868 3,157 96.315 3,546 94,369 4,596 c 85,486 5,584 88.732 6,283 99.596
Total Percentage Primary of Personal "' Government Income (1) caeita l1)
143,182 4.29% 1,308 138,905 4.37% 1,332 136,630 4.36% 1,330 160,344 5.06% 1,542 136,079 4.28% 1.305 131,973 4.14% 1,262 130,928 4.08% 1,242 120,165 3.54% 1,080 125,353 3.85% 1,175 135,571 3.70% 1,264

City of Berkeley Ratios of General Bonded Debt Outstanding Last Ten Fiscal Years (Dollars in Thousands, Except Per Capita)
General Bonded Debt Outstanding
General Tax Fiscal Obligation Revenue Allocation Year Bonds Bonds Bonds
2000 't{ ' 78,120 .; v 44,240 9,845 2001 76,755 42,150 9,345
.:c~'002· 75,245 39,955 8,810 2003 73,915 37,805 8,815 2004'. . ,71,885 15,495 8,236 ". ',•
2005 69,940 14,435 7,040 2006'•_';, 67,915 13,455 '&,110 2007 60,000 12,550 7,420
):/J;/ 2008 6(~:1~-· .H 71'5 ,., ' ' •• ~.7@'5 ' . ' . 2009 71,430 10,940 5,970
Total
Percentage of Actual Taxable
Value of Property (a)
132,205 ,,, . ; 128,250 124,010'''-.C' . 120,535 95,61~::-:-., '
2:1~% 1.94% 1.¥4% 1.58% 1::16%
91,415 1.05%
Per Capita (b)
1,2~;, 1,248 1,19~Y 1,156
~-" 867
89"'IOA ., ' •0,94··~· •ill.· , ·.· .. ··'A!i!?'''·.841 .,,., __ •• ..• ' ·~
79,970 0.77% 752 r''ij7_,§75 o.68~v ' ... ~J75
88,340 0.74% 824
Notes: Details regarding the city's outstanding debt can be found in the notes to the financial statements.
(a) See Schedule V for property value data for FY2001 to 2009 (b) Population data can be found in schedule 14.
Source: Finance Department, City of Berkeley
Schedule X

City of Berkeley Direct and Overlapping Governmental Activities Debt As of June 30. 2009
(In Thousands of Dollars, except assessed valuation)
2008-09 Assessed Valuation: Redevelopment Incremental Valuation: Adjusted Assessed Valuation:
DIRECT AND OVERI APPING TAX AND ASSESSMENT DEBT Bay Area Rapid Transit District East Bay Municipal Utility District, Special District No. 1 Peralta Community College Ois.trict Berkeley Unified School District City of Berkeley Community Facilities D~strk:t No. East Bay Regional Park. District City of Berkeley Thousand Oaks Heights AFUU Assessment Dlstrtict
SUBTOTAL OVERLAPPING TAX AND ASSESSMENT DEBT
TOTAL NET OVERLAPPING TAX AND ASSESSMENT DEBT
DIRECT AND OVERLAPPING GENERAL fUND DEBT: Alameda County and Coliseum Obliga11ons Alameda County Pension Obligations Alameda·Contra Costa Wan sit District Certificates of Participation Peralta Community College District Pension Obligatir..ns
TOTAL OVERLAPPING GENERAL FUND DEBT
CITY DIRECT DEBT
TOTAL DIRECT AND OVERLAPPING DEBT
GROSS COMBINED TOTAL DEBT (2} NET COMBINED TOTAL DEBT
Notes
$12,590,866,544
159.411.320 $12,431,455,224
Debt Outstanding 6130/?_0Q~
$441,360
29,785 354,825
225,079
7.435 125,850
1.400
$445,402
203,021
42.765 155,369
Schedule XI
Estimated Estimated Share of Direct
Percentage and Overlapping A~!llicable
2,82% $ 2052%
22.30%
100 00%
100.00%
4.1611/Q
100.00%
7.11% $ 7.,1%
8.58%
22.30%
$
$
$
Debt 6130109
12,451
6,113
79,115
225,072
7,435
5,233
1.400
S36.819
336,819
31,664
14,433
3,668
34,643
84.407
99,596
184,003
520,822 520,822
Overlapping governments am those that coincide, at lear$t 1n part, with the geographic boundaries of the City. This schedule estimates the portion of the outstanding debt of those overlapping governments that IS borne by the residents and businesses of the City. This process recognizes that, when considering the City's ability to issue and repay long~term debt, the entire debt burden borne by the residents and businesses should be taken into account. However. this does not imply that evefy taxpayer is a resident. and tnercfore responsible for repaying the debt, of each overlapping government
(2) Exclwdes tax and revenue anticipation Mte$, enterprise revenue, mortgage revenue and tax allocation Conds and non· bonded capital lease
Source: California Munictpal Statistics, Inc,
189

City of Berkeley Legal Debt Margin Information. Last Ten Fiscal Years (In Thousands of Dollars)
Debt limit
Debt applicable to limit
Legal debt margin
Total net debt applicable to the lim1t as a percentage of debt imit
s
$
2000 2001
924,763 $ 992,548
78,120 76,755
846,643 $ 915,793
9.23% 8.38%
2002 2003 2004
$ 1,067,019 $ 1,147,413 $ 1,238,035
75.245 73,915 71,885
$ 991,774 $ 1,073.498 $ 1,166,150
7.59% 6.89% 6.16%
Note: The City of Berkeley is a charter city and, as such, does not have a debt limit However. the debt limit computation is calculated usmg the 15% limit that would be in effect if the city were a general law city.
Source: City of Berkeley, Fmance Department
2005
$1,303,648
69,940
s 1,233,708
5.67%
Schedule XII
Legal Debt Marg1n Calculation for Fiscal Year 2009
Assessed Value Debt limit
Debt applicable to limit:
legal Debt Margin
2006 2007
$1,455,167 $1,556,907
67,915 60,000
s 1,387,252 $1,496,907
4.90% 4.01%
$
2008
1,674,278
64,255
1,610,023
3.99%
$ 11,918,885 1,787,833
71.430
$ 1,716,403
2009
1,787,833
71,430
s 1,716,403
4.16%

City of Berkeley Pledged Revenue Coverage, Last Ten Fiscal Years (In Thousands of Dollars, except coverage ratio)
Off-Street Parking 1994 Lease Revenue Bonds Less: Net
Fiscal Operating Operating Available Debt Service Year Revenue Expenses (1) Revenue Principal Interest
2000,, 2,382. 1;080 A;302 '"3~3 . 305 2001 2,510 1,482 1,029 155 297
-~ .... 200~~, 3;234 1,8n 1,343 165 ""-- 289 2003 3,099 1,776 1,322 170 280
··20\)4'. -~.408 __ .,_~~-'2:248 "1·160 80 4 ""''2X't-'
2005 3,573 2,291 1,282 190 260 ;wos (2) _.,. > ~ ---,--
(1) Includes operating expenses less depreciation and amortization (2) Refunded in FY 2006 by 2005 A Lease Revenue Bonds shown below
Off-Street Parking 2005 A Refunding Lease Revenue Bonds Less: Net
Fiscal Operating Operating Available Debt Service Year Revenue Expenses (1) Revenue Principal
2006 (2) 3~ 2,251 1,005' 330 2007 3,039 2,093 946 250 2068 ---- -~.864" '2;'2-Sif _634 __ 260~
2009 2,723 2.472 251 270
(1) Includes operating expenses less depreciation and amortization (2) Refunded 1994 Lease Revenue Bonds, shown above
Interest
•.:122 -- ""''"' 201
192 184
Schedule XIII
Total Coverage
458 ,-,. 2.84 452 2.27
'"45'1 "~'-.--; 2.96 450 2.94 451. .. ~- "2.57 450 2.85
Total Coverage
'.- 45~Yl!fr""- 2.22 451 2.10 452 1_.40' 454 0.55
Note: Pledged revenue is generated from the operation of two parking garages and one surtace lot.
Source: City of Berkeley, Finance Deparlment

City of Berkeley Demographic and Economic Statistics, Last Ten Fiscal Years
Persona! Income Per Capita Public
Fiscal (thousands Personal Median School Year Population of dollars) Income Age Enrollment
Ended (1) (2 (3) (4)
2000 109,463 3,336,104 30,477 31.7 2001 104,271 3,177,867 30,477 32.5 2002 102,743 3,131,298 30,477 32.5 2003 104,000 3,169,608 30,477 32.5 2004 104,300 3,178,751 30,477 32.5 2005 104,534 3,185,883 30,477 32.5 2006 105,385 3,211,819 30,477 32.5
2007 106,347 3,391,193 30,477 32.5 2008 106,697 3,251,804 30,477 32.5 2009 107,268 (a) 3,668,029 34,195 (b) 32.5
Source: (1) California State Dept. of Finance- Population Research Unit (May 2007) (2) Association of Bay Area Governments, (in constant 88 dollars), U.S. Census (3) Association of Bay Area Governments, (in constant 88 dollars), U.S. Census (4) Association of Bay Area Governments, Bay Area Census (5) Berkeley Unified School District from California Department of Education {6) University of California (7) State of California, Employment development Dept., Labor Market Info. Div. As of June (a) City of Berkeley, Biennial Budget fiscal year 2010 & 2011 (b) From www.bayareacensus.ca.gov/cities/berkeley.htm
(c) From Employment Development Department. www.labormarketinfo.edd.ca.gov
(5)
9,569 9,622 9,154 9,060 8,843 8,904 9,076
9,088 8,954 8,856
Schedule XIV
University of City California Unemployment
Enrollment Rate (6) (7)
31,011 3.8% 32,128 4.5% 33,145 6.6% 33,076 7.1% 32,814 5.8% 33,483 5.0% 33,933 4.4%
34,953 4.6% 34,953 5.9% 34,183 10.8% ©

City of Berkeley Principal Employers Current Year and Ten Years Ago
Employer
University of California Berkeley Lawrence Berkeley National Laboratory Alta Bates Medical center City of Berkeley Bayer Corporation
Berkeley Unified School district Kaiser Permanente Medical group Pacific Steel Casting Company Andronico's Market Berkeley City College State of California Department of Health
Total
Employees
12,377 3,832 2,065 1,524 1,100 1,200
700 380 325
600
24,103
Source: City of Berkeley, Office of Economic Development
1999
Rank
1 2 3 4 6 5 7 9
10
8
Schedule XV
2009 Percentage Percentage Of Total City OfT otal City Employment Employees Rank Employment
17.59% 14,444 1 19.01% 5.45% 3,735 2 4.91% 2.93% 3,100 3 4.08% 2.17% 1,658 4 2.18% 1.56% 1,500 5 1.97% 1.71% 1,200 6 1.58% 0.99% 700 7 0.92% 0.54% 600 8 0.79% 0.46% 325 9 0.43%
300 10 0.39% 0.85%
34.26% 27,562 36.27%

City of Berkeley FuiHime-Equivalent City Governmental Employees by Function/Program Last Ten Fiscal Years
Notes:
Full-time equivalent employment is calculated as one or more employee positions totaling one full year of service or approximately 2,080 hours a year.
(1) In FY2002, some divisions of Health and Welfare moved to Culture and Recreation_ {2) In FY2006. Office of Transportation has been combined with Public Works. (3) In FY1999. Economic Development, used to be part of Community Developmen~ became new department.
Source C1ty Human Resources Department
Schedule XVI

City of Berkeley Operating Indicators Current and last two fiscal years
FUNCTION/PROGRAM
General government Building Permits Issued
Residential Permits Issued Residential Permits Value Commercial Permits Issued Commercial Permits Value
Residential Parking Permits Number of Oaily Permits Issued Number of 14 Day Permits Issued Number of Annual Permits Issued
City Clerk Number of Council Resolutions Passed Number of Ordinances Passed Number of Contracts Passed
General Serv1ces Number of Purchase Orders Issued
Police PhySical Arrests Parking Violations Traffic Violations DUI Arrests
Fire Structure Fires Vehicle Fire Other Fires Medical Calls Haz-mat Calls Other Calls Out of City
Health and Human Services Health Inspections and Permits Home Delivered Meal Health Education and linkages to services Mobile Crisis Visits Summer and year-round jobs provided for youth
Library Number of visits made to Library Branches Number of people that are registered library card holders Number of times materials from the library circulated (item
Fiscal Year 2007
1,987 $ 63,072,742
376 $ 30,454,892
13,700 2,006
39,712
390 57
425
4,817
4,243 313,595 24,000
245
137 33
176 7,641
71 3,300
216
6,323 70,015
114,195 2,800
389
1,339,327 94,053
1.609,726
Schedule XVII
Fiscal Year Fiscal Year 2008 2009
1,822 1.526 $ 76,889,732 $ 113,415,612
378 375 $ 75,644,224 $ 40,785,465
36,000 41,236 1.760 1,609
14,500 14.481
356 415 47 51
538 546
5,613 5,206
3,659 2,758 339,941 285,729
(a) 313,597 17,252 244 210
104 88 40 31
272 151 7,921 7,947
52 83 3,478 3.474
224 155
8,453 8,714 70,015 62,679 66,700 65.445 2,800 3,039
618 478
1,524,973 1,411,112 84,513 95,275
1,738,888 1,951,032
(Contrnued)
195

Schedule XVII City of Berkeley Operating lndrcators Current and last two frscal years
Fiscal Year Fiscal Year Fiscal Year 2007 2008 2009
FUNCTION/PROGRAM Berkeley Housing Authority
Percentage of Sectron 8 Voucher Units Leased 94% 92% 90% Percentage of Public Housrng Units Occupied 69% 87% 95% Average number of monthly Section 8 Units leased 1,725 1,673 1,651 Approved number of Section 8 Units 1,841 1,841 1,841 Total Housing Assistance Payments (HAP) $ 21.433,509 $ 19,202,642 $ 18,782,311 Average monthly HAP per unit $ 1,015 $ 958 $ 948
Solid Waste Management Diversion Rate (pending State Approval) 1 1 0% (C) Transfer Station Customers 125,259 130,436 110,829 Landfill Tonnage 92,443 90,877 68,321 Recyclable Tonnage 46,185 50,956 64,328
Total Tonage 132,649
Other Public Works Street Resurfacing/Overlay/Reconstruction (miles) 1 2 0 ADA Compliance: New Curb Ramps 33 213 0 Traffic Circles- Cumulative 49. 54 55 Street Poles with Lights - Cumulative 7,860 7,860 7,860
Marina Number of Berths 967 1 '101 1,101 Number of Occupred Berths 910 798 873 Number of new berthers 168 183 194 Number of paid launchers 4,702 4,515 6,234
Parking Number of Pay and Display Meters Operating 68 74 210 Number of Duncan Meters Operating 2,743 2,622 1.655
Planning and Development Department Customers Served 22,463 23,495 22,083 Burld1ng & Safety Inspections Performed 23,436 19,255 20,544 Taxies: CUPA Inspections 232 413 302 Redevelopment: Number of active projects 5 5 5
Sanitary Sewer Number of Customer Accounts Billed 31,230 30,192 31,214
(Concluded)
196

Note As certain data required by GASB 44 was not readily available prior to 2006the City of Berkeley has elected to show data since fiscal year 2006 (a) approximate number only, court stopped producing the report that allowed the City to track traffic citations (a) Diverston rate from California Waste Management Board
CY 2008 Est 65% CY 2009 available August 2010
(b)"Customers" are all paying customers regardless of the town they come from. Landfilled and recycled tons are all tons going through the transfer station It includes SWMD collection trucks, as wetl as payrng customers,
(c) The State Diversion rate applies to All tons landftlled from Berkeley sources, whether or not using the Berkeley transfer station. It does not include customers from other jurisdictions.
(d)Outside tons not included in transfer station tons 1) Tons collected by private haulers and taKen to other landfills 2) Tons delivered by members of the public to other landfills or transfer stations 3) BerKeley tons recycled by the private sector
(e) Corrective note on FY 2007 Traffic Ctrcles: cumulative total 49 vs. 5 which was the number coostructed FY2007
197

Schedulo XVIII City of Berkeley Capital Asset Statistics by Function/Program Current and last two fiscal years
Fiscal Year Fiscal Year Fiscal Year 2007 2008 2009
Function/Program
Police Number of Stations 1 1 1 Number of Patrol Units 97 97 81 Parking Enforcement Vehicles 31 31 45
Fire Number of Stations 7 7 7 Numbet of F1re Trucks 12 12 12
Library Central Library 1 1 1 Branch Libraries 4 4 4
Berkeley Housing Authority Number of Public Housing U11its BHA Run 61 61 61 Number of PubliC Housing Units State Run 14 14
total 75 75
Solid Waste Management Collection Vehicles 27 29 26 Support Vehicles 18 18 20 Transfer Tnactors 9 9 10 Transfer Trailers 7 9 9
Other Public Works Streets (miles) 216 216 216 Streetlights 7,660 7,860 7.860 Traffic Signals 134 134 134 Sidewalks (m11es) 300 300 300
Parks and Recreation Number of Parks 52 !;2 52 Public Swimming Pools 4 4 4 Over night Summar Camps 3 3 3 Number of Community Centers. 4 4 4 Number of Club Houses 2 2 2 Community Gardens 6 6 6 Nature Center/Adventure Playground 1 1
Sar~1tary Sewer Public Sanitary Sewer Ma1ns (miles) 270 270 270 Public Sewer Laterals (miles) 130 130 130
Parking Number of Parking Garages 2 2 3 Number of Parking Lois 2 2 2 Number of Off Street Parking Meter Spaces 130 130 139 Number of Off Street Parking Garage Spaces 850 850 937
Note: As certain data required by GASB 44 was not readily available prior to 2006 the City of Berkeley has elected to show data since fiscal year 2006,
Source: Operating indic;ator$ were provided by the various opotbting departments
198

C-1
APPENDIX C
FORM OF OPINION OF BOND COUNSEL
____ _, 2010
City CouncilCity of Berkeley2180 Milvia StreetBerkeley, California 94704
OPINION: $50,000,000 City of Berkeley, California 2010-11 Tax and RevenueAnticipation Notes
Members of the City Council:
We have acted as bond counsel in connection with the issuance by the City of Berkeley,California (the “City”), of $50,000,000 City of Berkeley, California 2010-11 Tax and RevenueAnticipation Notes, dated the date hereof (the “Notes”), pursuant to Article 7.6 (commencingwith Section 53850) of Chapter 4, Part 1, Division 2, Title 5 of the California Government Code(the “Act”), and a resolution of the City, adopted on June 1, 2010 (the “Resolution”). We haveexamined the law and such certified proceedings and other papers as we deem necessary torender this opinion.
As to questions of fact material to our opinion, we have relied upon representations ofthe City contained in the Resolution and in the certified proceedings of public officials andothers furnished to us, without undertaking to verify such facts by independent investigation.
Based upon our examination, we are of the opinion, under existing law, as follows:
1. The City is a duly created and validly existing municipal corporation with thepower to adopt the Resolution, to perform the agreements on its part contained therein and toissue the Notes.
2. The Resolution has been duly adopted by the City and constitutes a valid andbinding obligation of the City enforceable upon the City.
3. Pursuant to the Act, the Resolution creates a first lien on funds pledged by theResolution for the security of the Notes.
4. The Notes have been duly authorized, executed and delivered by the City andare valid and binding general obligations of the City.
5. The interest on the Notes is excluded from gross income for federal income taxpurposes and is not an item of tax preference for purposes of the federal alternative minimumtax imposed on individuals and corporations; it should be noted, however, that, for the purpose

C-2
of computing the alternative minimum tax imposed on such corporations (as defined for federalincome tax purposes), such interest is taken into account in determining certain income andearnings. The opinion set forth in the preceding sentence is subject to the condition that theCity comply with all requirements of the Internal Revenue Code of 1986 that must be satisfiedsubsequent to the issuance of the Notes in order that interest thereon be, or continue to be,excluded from gross income for federal income tax purposes. The City has covenanted tocomply with each such requirement. Failure to comply with certain of such requirements maycause the inclusion of interest on the Notes in gross income for federal income tax purposes tobe retroactive to the date of issuance of the Notes. We express no opinion regarding otherfederal tax consequences arising with respect to the Notes.
6. The interest on the Notes is exempt from personal income taxation imposed bythe State of California.
The rights of the owners of the Notes and the enforceability of the Notes and theResolution may be subject to bankruptcy, insolvency, reorganization, moratorium and othersimilar laws affecting creditors’ rights heretofore or hereafter enacted and may also be subjectto the exercise of judicial discretion in appropriate cases.
Respectfully submitted,
A Professional Law Corporation
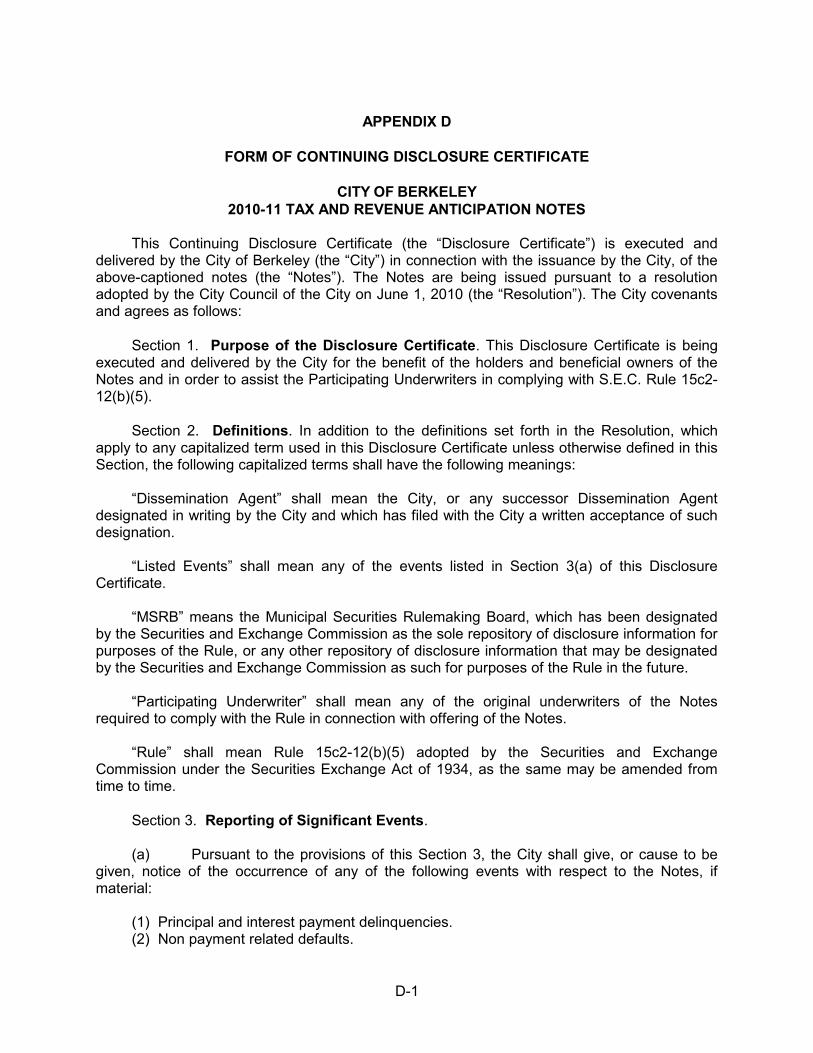
D-1
APPENDIX D
FORM OF CONTINUING DISCLOSURE CERTIFICATE
CITY OF BERKELEY2010-11 TAX AND REVENUE ANTICIPATION NOTES
This Continuing Disclosure Certificate (the “Disclosure Certificate”) is executed anddelivered by the City of Berkeley (the “City”) in connection with the issuance by the City, of theabove-captioned notes (the “Notes”). The Notes are being issued pursuant to a resolutionadopted by the City Council of the City on June 1, 2010 (the “Resolution”). The City covenantsand agrees as follows:
Section 1. Purpose of the Disclosure Certificate. This Disclosure Certificate is beingexecuted and delivered by the City for the benefit of the holders and beneficial owners of theNotes and in order to assist the Participating Underwriters in complying with S.E.C. Rule 15c2-12(b)(5).
Section 2. Definitions. In addition to the definitions set forth in the Resolution, whichapply to any capitalized term used in this Disclosure Certificate unless otherwise defined in thisSection, the following capitalized terms shall have the following meanings:
“Dissemination Agent” shall mean the City, or any successor Dissemination Agentdesignated in writing by the City and which has filed with the City a written acceptance of suchdesignation.
“Listed Events” shall mean any of the events listed in Section 3(a) of this DisclosureCertificate.
“MSRB” means the Municipal Securities Rulemaking Board, which has been designatedby the Securities and Exchange Commission as the sole repository of disclosure information forpurposes of the Rule, or any other repository of disclosure information that may be designatedby the Securities and Exchange Commission as such for purposes of the Rule in the future.
“Participating Underwriter” shall mean any of the original underwriters of the Notesrequired to comply with the Rule in connection with offering of the Notes.
“Rule” shall mean Rule 15c2-12(b)(5) adopted by the Securities and ExchangeCommission under the Securities Exchange Act of 1934, as the same may be amended fromtime to time.
Section 3. Reporting of Significant Events.
(a) Pursuant to the provisions of this Section 3, the City shall give, or cause to begiven, notice of the occurrence of any of the following events with respect to the Notes, ifmaterial:
(1) Principal and interest payment delinquencies.(2) Non payment related defaults.

D-2
(3) Unscheduled draws on debt service reserves reflecting financial difficulties.(4) Unscheduled draws on credit enhancements reflecting financial difficulties.(5) Substitution of credit or liquidity providers, or their failure to perform.(6) Adverse tax opinions or events affecting the tax exempt status of the security.(7) Modifications to rights of security holders.(8) Contingent or unscheduled bond calls.(9) Defeasances.(10) Release, substitution, or sale of property securing repayment of the securities.(11) Rating changes.
(b) Whenever the City obtains knowledge of the occurrence of a Listed Event, theCity shall as soon as possible determine if such event would be material under applicableFederal securities law.
(c) If the City determines that knowledge of the occurrence of a Listed Event wouldbe material under applicable Federal securities law, the City shall, or shall cause theDissemination Agent (if not the City) to, promptly file a notice of such occurrence with theMSRB, in an electronic format as prescribed by the MSRB. Notwithstanding the foregoing,notice of Listed Events described in subsections (a)(8) and (9) need not be given under thissubsection any earlier than the notice (if any) of the underlying event is given to holders ofaffected Bonds pursuant to the Resolution.
Section 4. Termination of Reporting Obligation. The City’s obligations under thisDisclosure Certificate shall terminate upon the legal defeasance, prior redemption or paymentin full of all of the Notes. If such termination occurs prior to the final maturity of the Notes, theCity shall give notice of such termination in the same manner as for a Listed Event underSection 3(c).
Section 5. Dissemination Agent. The City may, from time to time, appoint or engage aDissemination Agent to assist it in carrying out its obligations under this Disclosure Certificate,and may discharge any such Agent, with or without appointing a successor DisseminationAgent. The initial Dissemination Agent shall be the City.
Section 6. Amendment; Waiver. Notwithstanding any other provision of this DisclosureCertificate, the City may amend this Disclosure Certificate, and any provision of this DisclosureCertificate may be waived, provided that the following conditions are satisfied:
(a) if the amendment or waiver relates to the provisions of Section 3(a) it may onlybe made in connection with a change in circumstances that arises from a change in legalrequirements, change in law, or change in the identity, nature, or status of an obligated personwith respect to the Notes, or type of business conducted;
(b) the undertakings herein, as proposed to be amended or waived, would, in theopinion of nationally recognized bond counsel, have complied with the requirements of the Ruleat the time of the primary offering of the Notes, after taking into account any amendments orinterpretations of the Rule, as well as any change in circumstances; and

D-3
(c) the proposed amendment or waiver either (i) is approved by holders of the Notes, or (ii) does not, in the opinion of nationally recognized bond counsel, materially impair theinterests of the holders or beneficial owners of the Notes.
Section 7. Additional Information. Nothing in this Disclosure Certificate shall be deemedto prevent the City from disseminating any other information, using the means of disseminationset forth in this Disclosure Certificate or any other means of communication, or including anyother information in any notice of occurrence of a Listed Event, in addition to that which isrequired by this Disclosure Certificate. If the City chooses to include any information in anynotice of occurrence of a Listed Event in addition to that which is specifically required by thisDisclosure Certificate, the City shall have no obligation under this Disclosure Certificate toupdate such information or include it in any future notice of occurrence of a Listed Event.
Section 8. Default. In the event of a failure of the City to comply with any provision of thisDisclosure Certificate any holder or beneficial owner of the Notes may take such actions asmay be necessary and appropriate, including seeking mandate or specific performance by courtorder, to cause the City to comply with its obligations under this Disclosure Certificate. A defaultunder this Disclosure Certificate shall not be deemed an Event of Default under the Resolution,and the sole remedy under this Disclosure Certificate in the event of any failure of the City tocomply with this Disclosure Certificate shall be an action to compel performance.
Section 9. Duties, Immunities and Liabilities of Dissemination Agent. TheDissemination Agent shall have only such duties as are specifically set forth in this DisclosureCertificate, and the City agrees to indemnify and save the Dissemination Agent, its officers,directors, employees and agents, harmless against any loss, expense and liabilities which itmay incur arising out of or in the exercise or performance of its powers and duties hereunder,including the costs and expenses (including attorneys fees) of defending against any claim ofliability, but excluding liabilities due to the Dissemination Agent’s negligence or willfulmisconduct. The obligations of the City under this Section shall survive resignation or removalof the Dissemination Agent and payment of the Notes.
Section 10. Beneficiaries. This Disclosure Certificate shall inure solely to the benefit ofthe City, the Dissemination Agent, the Participating Underwriters and holders and beneficialowners from time to time of the Notes, and shall create no rights in any other person or entity.
CITY OF BERKELEY
ByCity Manager

(THIS PAGE INTENTIONALLY LEFT BLANK)

E-1
APPENDIX E
THE BOOK-ENTRY ONLY SYSTEM
The following description of the Depository Trust Company (“DTC”), the procedures andrecord keeping with respect to beneficial ownership interests in the Certificates, payment ofprincipal, interest and other payments on the Certificates to DTC Participants or BeneficialOwners, confirmation and transfer of beneficial ownership interest in the Certificates and otherrelated transactions by and between DTC, the DTC Participants and the Beneficial Owners isbased solely on information provided by DTC. Accordingly, no representations can be madeconcerning these matters and neither the DTC Participants nor the Beneficial Owners shouldrely on the foregoing information with respect to such matters, but should instead confirm thesame with DTC or the DTC Participants, as the case may be.
Neither the issuer of the Certificates (the “Issuer”) nor the trustee, fiscal agent or payingagent appointed with respect to the Certificates (the “Agent”) take any responsibility for theinformation contained in this Appendix.
No assurances can be given that DTC, DTC Participants or Indirect Participants willdistribute to the Beneficial Owners (a) payments of interest, principal or premium, if any, withrespect to the Certificates, (b) certificates representing ownership interest in or otherconfirmation or ownership interest in the Certificates, or (c) redemption or other notices sent toDTC or Cede & Co., its nominee, as the registered owner of the Certificates, or that they will sodo on a timely basis, or that DTC, DTC Participants or DTC Indirect Participants will act in themanner described in this Appendix. The current “Rules” applicable to DTC are on file with theSecurities and Exchange Commission and the current “Procedures” of DTC to be followed indealing with DTC Participants are on file with DTC.
1. The Depository Trust Company (“DTC”), New York, NY, will act as securitiesdepository for the securities (the “Certificates”). The Certificates will be issued as fully-registered securities registered in the name of Cede & Co. (DTC’s partnership nominee) orsuch other name as may be requested by an authorized representative of DTC. One fully-registered certificate will be issued for each maturity of the Certificates, in the aggregateprincipal amount of such issue, and will be deposited with DTC. If, however, the aggregateprincipal amount of any issue exceeds $500 million, one certificate will be issued with respect toeach $500 million of principal amount and an additional certificate will be issued with respect toany remaining principal amount of such issue.
2. DTC, the world’s largest securities depository, is a limited-purpose trust companyorganized under the New York Banking Law, a “banking organization” within the meaning of theNew York Banking Law, a member of the Federal Reserve System, a “clearing corporation”within the meaning of the New York Uniform Commercial Code, and a “clearing agency”registered pursuant to the provisions of Section 17A of the Securities Exchange Act of 1934.DTC holds and provides asset servicing for over 3.5 million issues of U.S. and non-U.S. equityissues, corporate and municipal debt issues, and money market instruments (from over 100countries) that DTC’s participants (“Direct Participants”) deposit with DTC. DTC also facilitatesthe post-trade settlement among Direct Participants of sales and other securities transactions indeposited securities, through electronic computerized book-entry transfers and pledgesbetween Direct Participants’ accounts. This eliminates the need for physical movement of

E-2
securities certificates. Direct Participants include both U.S. and non-U.S. securities brokers anddealers, banks, trust companies, clearing corporations, and certain other organizations. DTC isa wholly-owned subsidiary of The Depository Trust & Clearing Corporation (“DTCC”). DTCC isthe holding company for DTC, National Securities Clearing Corporation and Fixed IncomeClearing Corporation, all of which are registered clearing agencies. DTCC is owned by theusers of its regulated subsidiaries. Access to the DTC system is also available to others suchas both U.S. and non-U.S. securities brokers and dealers, banks, trust companies, and clearingcorporations that clear through or maintain a custodial relationship with a Direct Participant,either directly or indirectly (“Indirect Participants”). DTC has Standard & Poor’s highest rating:AAA. The DTC Rules applicable to its Participants are on file with the Securities and ExchangeCommission. More information about DTC can be found at www.dtcc.com and www.dtc.org.The information contained on this Internet site is not incorporated herein by reference.
3. Purchases of Certificates under the DTC system must be made by or throughDirect Participants, which will receive a credit for the Certificates on DTC’s records. Theownership interest of each actual purchaser of each Certificate (“Beneficial Owner”) is in turn tobe recorded on the Direct and Indirect Participants’ records. Beneficial Owners will not receivewritten confirmation from DTC of their purchase. Beneficial Owners are, however, expected toreceive written confirmations providing details of the transaction, as well as periodic statementsof their holdings, from the Direct or Indirect Participant through which the Beneficial Ownerentered into the transaction. Transfers of ownership interests in the Certificates are to beaccomplished by entries made on the books of Direct and Indirect Participants acting on behalfof Beneficial Owners. Beneficial Owners will not receive certificates representing theirownership interests in Certificates, except in the event that use of the book-entry system for theCertificates is discontinued.
4. To facilitate subsequent transfers, all Certificates deposited by DirectParticipants with DTC are registered in the name of DTC’s partnership nominee, Cede & Co. orsuch other name as may be requested by an authorized representative of DTC. The deposit ofCertificates with DTC and their registration in the name of Cede & Co. or such other nomineedo not effect any change in beneficial ownership. DTC has no knowledge of the actualBeneficial Owners of the Certificates; DTC’s records reflect only the identity of the DirectParticipants to whose accounts such Certificates are credited, which may or may not be theBeneficial Owners. The Direct and Indirect Participants will remain responsible for keepingaccount of their holdings on behalf of their customers.
5. Conveyance of notices and other communications by DTC to Direct Participants,by Direct Participants to Indirect Participants, and by Direct Participants and IndirectParticipants to Beneficial Owners will be governed by arrangements among them, subject toany statutory or regulatory requirements as may be in effect from time to time. BeneficialOwners of Certificates may wish to take certain steps to augment transmission to them ofnotices of significant events with respect to the Certificates, such as redemptions, tenders,defaults, and proposed amendments to the security documents. For example, BeneficialOwners of Certificates may wish to ascertain that the nominee holding the Certificates for theirbenefit has agreed to obtain and transmit notices to Beneficial Owners, in the alternative,Beneficial Owners may wish to provide their names and addresses to the registrar and requestthat copies of the notices be provided directly to them.

E-3
6. Redemption notices shall be sent to DTC. If less than all of the Certificates withinan issue are being redeemed, DTC’s practice is to determine by lot the amount of the interest ofeach Direct Participant in such issue to be redeemed.
7. Neither DTC nor Cede & Co. (nor such other DTC nominee) will consent or votewith respect to the Certificates unless authorized by a Direct Participant in accordance withDTC’s Procedures. Under its usual procedures, DTC mails an Omnibus Proxy to Issuer as soonas possible after the record date. The Omnibus Proxy assigns Cede & Co.’s consenting orvoting rights to those Direct Participants to whose accounts the Certificates are credited on therecord date (identified in a listing attached to the Omnibus Proxy).
8. Redemption proceeds, distributions, and interest payments on the Certificateswill be made to Cede & Co., or such other nominee as may be requested by an authorizedrepresentative of DTC. DTC’s practice is to credit Direct Participants’ accounts, upon DTC’sreceipt of funds and corresponding detail information from Issuer or Agent on payable date inaccordance with their respective holdings shown on DTC’s records. Payments by Participantsto Beneficial Owners will be governed by standing instructions and customary practices, as isthe case with securities held for the accounts of customers in bearer form or registered in“street name,” and will be the responsibility of such Participant and not of DTC nor its nominee,Agent, or Issuer, subject to any statutory or regulatory requirements as may be in effect fromtime to time. Payment of redemption proceeds, distributions, and dividend payments to Cede &Co. (or such other nominee as may be requested by an authorized representative of DTC) isthe responsibility of Issuer or Agent, disbursement of such payments to Direct Participants willbe the responsibility of DTC, and disbursement of such payments to the Beneficial Owners willbe the responsibility of Direct and Indirect Participants.
9. DTC may discontinue providing its services as securities depository with respectto the Certificates at any time by giving reasonable notice to Issuer or Agent. Under suchcircumstances, in the event that a successor securities depository is not obtained, securitycertificates are required to be printed and delivered.
10. Issuer may decide to discontinue use of the system of book-entry-only transfersthrough DTC (or a successor securities depository). In that event, security certificates will beprinted and delivered to DTC.
11. The information in this section concerning DTC and DTC’s book-entry systemhas been obtained from sources that Issuer believes to be reliable, but Issuer takes noresponsibility for the accuracy thereof.

(THIS PAGE INTENTIONALLY LEFT BLANK)


FOR ADDITIONAL BOOKS: ELABRA.COM OR (888) 935-2272