20060914.pdf - JCI Limited
194
1 THIS CIRCULAR IS IMPORTANT AND REQUIRES YOUR IMMEDIATE ATTENTION The interpretation and definitions on page 2 to 7 of this circular have been used on this front cover. Action required If you are in any doubt as to the action that you should take in relation to this circular, please consult your CSDP , broker, banker, attorney, accountant or other professional adviser immediately. If you have disposed of all your JCI ordinary shares please forward this circular to the purchaser of such JCI shares or the CSDP , broker, banker or other agent through whom the disposal was effected. Certificated shareholders or “own name” dematerialised shareholders who are unable to attend the general meeting of JCI shareholders to be held at 10:00 on Friday, 29 September 2006 in the Auditorium, Ground Floor, 28 Harrison Street, Johannesburg and wish to be represented at such meeting, must complete and return the attached form of proxy in accordance with the instructions contained therein to the South African transfer secretaries, Computershare Investor Services 2004 (Proprietary) Limited, Ground Floor, 70 Marshall Street, Johannesburg, 2001 (PO Box 61051, Marshalltown, 2107) or the United Kingdom Registrars, Capita Registrars,The Registry, 34 Beckenham Road, Beckenham, Kent, BR3 4TU, which form of proxy, in order to be valid, must be received by no later than 10:00 on,Wednesday, 27 September 2006. Dematerialised shareholders, other than “own name” dematerialised shareholders who wish to attend the general meeting of JCI shareholders to be held at 10:00 on Friday, 29 September 2006 in the Auditorium, Ground Floor, 28 Harrison Street, Johannesburg must instruct their CSDP or broker to issue them with the necessary authority to attend. Should dematerialised shareholders, other than “own name” dematerialised shareholders, wish to vote at the JCI general meeting by proxy, they must provide their CSDP or broker with their voting instructions in terms of the custody agreement entered into between them and their CSDP or broker. JCI LIMITED (Incorporated in the Republic of South Africa) (Registration number 1894/000854/06) Share code: JCD (Suspended) ISIN: ZAE000039681 CIRCULAR TO JCI SHAREHOLDERS relating to: – the disposal by Lets ˇeng Holdings of 2 280 ordinary shares held in Lets ˇeng constituting 76% of the issued ordinary share capital of Lets ˇeng; – the ratification by JCI shareholders of the loan agreement between JCI, JCIIF and Investec; and incorporating – a notice of a general meeting of JCI shareholders; and – a form of proxy – for use by certificated JCI ordinary shareholders and “own name” dematerialised JCI ordinary shareholders only. Date of issue: 14 September 2006 Investment bank and adviser to JCI Sponsor Independent reporting accountants and auditors Independent reporting accountants
-
Upload
khangminh22 -
Category
Documents
-
view
3 -
download
0
Transcript of 20060914.pdf - JCI Limited

1
THIS CIRCULAR IS IMPORTANT AND REQUIRES YOUR IMMEDIATE ATTENTION
The interpretation and definitions on page 2 to 7 of this circular have been used on this front cover.
Action required
If you are in any doubt as to the action that you should take in relation to this circular, please consult your CSDP, broker, banker, attorney, accountant orother professional adviser immediately.
If you have disposed of all your JCI ordinary shares please forward this circular to the purchaser of such JCI shares or the CSDP, broker, banker or otheragent through whom the disposal was effected.
Certificated shareholders or “own name” dematerialised shareholders who are unable to attend the general meeting of JCI shareholders to be held at10:00 on Friday, 29 September 2006 in the Auditorium, Ground Floor, 28 Harrison Street, Johannesburg and wish to be represented at such meeting, mustcomplete and return the attached form of proxy in accordance with the instructions contained therein to the South African transfer secretaries,Computershare Investor Services 2004 (Proprietary) Limited, Ground Floor, 70 Marshall Street, Johannesburg, 2001 (PO Box 61051, Marshalltown, 2107)or the United Kingdom Registrars, Capita Registrars,The Registry, 34 Beckenham Road, Beckenham, Kent, BR3 4TU, which form of proxy, in order to bevalid, must be received by no later than 10:00 on,Wednesday, 27 September 2006.
Dematerialised shareholders, other than “own name” dematerialised shareholders who wish to attend the general meeting of JCI shareholders to be heldat 10:00 on Friday, 29 September 2006 in the Auditorium, Ground Floor, 28 Harrison Street, Johannesburg must instruct their CSDP or broker to issuethem with the necessary authority to attend. Should dematerialised shareholders, other than “own name” dematerialised shareholders, wish to vote at theJCI general meeting by proxy, they must provide their CSDP or broker with their voting instructions in terms of the custody agreement entered intobetween them and their CSDP or broker.
JCI LIMITED(Incorporated in the Republic of South Africa)
(Registration number 1894/000854/06)Share code: JCD (Suspended) ISIN: ZAE000039681
CIRCULAR TO JCI SHAREHOLDERSrelating to:
– the disposal by Letseng Holdings of 2 280 ordinary shares held in Letsengconstituting 76% of the issued ordinary share capital of Letseng;
– the ratification by JCI shareholders of the loan agreement between JCI, JCIIF andInvestec;
and incorporating
– a notice of a general meeting of JCI shareholders; and
– a form of proxy – for use by certificated JCI ordinary shareholders and “own name”dematerialised JCI ordinary shareholders only.
Date of issue: 14 September 2006
Investment bank and adviser to JCI Sponsor
Independent reporting accountantsand auditors
Independent reporting accountants

2
CORPORATE INFORMATION
Legal adviser and secretary andregistered office
Ms B E Morton28 Harrison StreetJohannesburg, 2001(PO Box 11165, Johannesburg 2000)Telephone: +27 11 688 5100Facsimile: +27 11 492 1070
Investment bank and corporate adviser
Investec Bank Limited(Registration number 1969/004763/06)100 Grayston DriveSandownSandton, 2196(PO Box 785700, Sandton 2146)Telephone: +27 11 286 7534Facsimile: +27 11 291 1799
Sponsor
Sasfin Capitala division of Sasfin Bank Limited(Registration number 1951/002280/06)Sasfin PlaceNorth Block13–15 Scott StreetWaverley, 2090(PO Box 95104, Grant Park 2051)Telephone: +27 11 809 7500Facsimile: +27 11 809 7726
Reporting accountants to JCI
KPMG Inc.(Registration number 1999/021543/21)KPMG Crescent 85 Empire Road Parktown, 2193(Private Bag 9, Parkview, 2122)Telephone: +27 11 647 7111Facsimile: +27 11 647 8000
Communications
Brian Gibson Issue ManagementBrian Gibson23 Sutherland AvenueCraighall Park, 2196(PO Box 406, Parklands, 2121)Telephone: +27 11 880 1510Facsimile: +27 11 880 1392
Letseng Holdings
Letseng Investment Holdings South Africa (Proprietary) Limited(Registration number 1998/023466/07)28 Harrison StreetJohannesburg, 2001(PO Box 11165, Johannesburg 2000)
South African transfer secretaries
Computershare Investor Services 2004 (Proprietary) Limited (Registration number 2004/003647/07)Ground Floor70 Marshall StreetJohannesburg, 2001(PO Box 61051, Marshalltown 2107)Telephone: +27 861 100 634 or +27 11 370 5000
London secretaries
JCI (London) Limited6 St James’s PlaceLondon SW1A 1NPUnited KingdomTelephone: +44 20 7491 1889Facsimile: +44 20 7491 1989
United Kingdom registrars
Capita RegistrarsThe Registry34 Beckenham RoadBeckenhamKent BR3 4TUUnited KingdomTelephone (outside United Kingdom): +44 20 8639 2157Telephone (within United Kingdom): 0870 162 3100Facsimile: +44 20 8639 2342
Reporting accountants to Letseng
Moores Rowland27th Floor1 Thibault SquareCape Town, 8001 (PO Box 2817, Cape Town, 8000)

TABLE OF CONTENTS
The interpretation and definitions on pages 2 to 7 of this circular apply, mutatis mutandis, to the following table of contents:
Page
Corporate information Inside front cover
Interpretation and definitions 2
Important dates and times 8
Circular to JCI shareholders1. Introduction 9
2. The Letseng disposal 9
3. The Investec loan agreement 13
4. Opinion of the JCI board 17
5. Financial information 17
6. Major shareholders 18
7. Material changes 18
8. Directors 19
9. JCI and its directors’ interests and dealings 20
10. Future strategy of JCI 20
11. History of changes 20
12. Working capital statement 20
13. Litigation statement 21
14. Directors’ responsibility statement 21
15. Significant contracts 21
16. Borrowings 22
17. Expenses 22
18. Consents 22
19. Notice of general meeting of JCI shareholders 22
20. Documents available for inspection 23
Annexure I Historical financial information on Letseng 24
Annexure II Pro forma balance sheet and income statement of JCI 33
Annexure III Report of the independent reporting accountants on the historical financial information of Letseng 37
Annexure IV Report of the independent reporting accountants’ on the pro forma financial effects of the Letseng disposal and the pro forma balance sheet and income statement of JCI 39
Annexure V Competent Person’s Report 41
Notice of general meeting of JCI shareholders 189
Form of proxy for use by certificated JCI ordinary shareholders and “own name” dematerialised JCI ordinary shareholders only. Attached
This circular is only available in English and copies thereof may be obtained from the registered office of JCI, the office ofthe transfer secretaries and the office of the sponsor, the addresses of which as set out in the “Corporate information”section of this circular and the website.
1

INTERPRETATION AND DEFINITIONS
Throughout this circular, unless the context indicates otherwise, reference to the singular shall include the plural andvice versa, words denoting one gender shall include the other genders, words and expressions denoting natural personsinclude juristic persons and associations of persons, and the words in the first column have the meanings stated oppositethem in the second column, as follows:
“Aconcagua” Aconcagua 24 Investments (Proprietary) Limited (Registration number2000/010101/07), a private company incorporated in South Africa, which owns theproperty situated at 28 Harrison Street, Johannesburg;
“the Act” the Companies Act, 1973 (Act 61 of 1973), as amended;
“Barnard Jacob Mellet” Barnard Jacobs Mellet Holdings Limited (Registration number 1995/004798/06), apublic company incorporated in South Africa on 30 May 1995 whose ordinaryshares are listed on the JSE;
“Basotho Nation” a nation of Sotho speaking people which emerged from the unification of a numberof smaller southern Sotho clans by King Moshoeshoe at the beginning of thenineteenth century, now known as Lesotho;
“Boschendal” Boschendal Limited (Registration number 2002/023534/06), a public companyincorporated in South Africa;
“business day” any day other than a Saturday, Sunday or an official public holiday in South Africa;
“carat” unit of weight for diamonds, 0.2g = 1 carat;
“cents” South African cents;
“CEO” Chief Executive Officer ;
“certificated JCI ordinary JCI ordinary shareholders who have not dematerialised their JCI ordinary sharesshareholders” and thus hold physical share certificates or other physical documents of title;
“certificated shareholders” or certificated JCI ordinary shareholders, whose shares have not been dematerialised;“certificated JCI shareholders”
“certificated shares” shares which have not been dematerialised and which are evidenced by sharecertificates or other physical documents of title;
“this circular” this circular, including the annexures, the notice of general meeting and form ofproxy;
“Clifton” Clifton Dunes Investments 67 (Proprietary) Limited (Registration number2004/013628/07), a private company incorporated in South Africa;
“CMMS” Consolidated Mining Management Services Limited (Registration number1925/008135/06), a public company duly incorporated in South Africa, being asubsidiary of JCI;
“cpht” carats per hundred tons;
“Competent Person’s Report” a report by an independent person who is professionally qualified and who is aor “CPR” member in good standing of an appropriate professional association, institution or
body and has at least five years relevant professional experience in the estimation,assessment and evaluation of mineral resources and reserves to be exploited byLetseng;
2

“conditions precedent” the conditions precedent, as stated in paragraph 2.4.3 of this circular, to which theLetseng disposal is subject;
“CSDP” a Central Securities Depository Participant accepted as a participant in terms ofthe Custody and Administration of Securities Act, 1992;
“De Beers” De Beers Consolidated Mines Limited (Registration number 1888/000007/06),a public company incorporated in South Africa;
“dematerialised” the process whereby paper share certificates are replaced with electronic recordsof ownership of shares or securities under STRATE, with a duly appointed CSDPor broker;
“dematerialised JCI ordinary JCI ordinary shareholders who hold dematerialised shares;shareholders”
“dematerialised shareholders” or dematerialised JCI ordinary shareholders;“dematerialised JCI shareholders”
“dematerialised shares” shares which have been dematerialised and incorporated into STRATE and whichare no longer evidenced by share certificates or other physical documents of title;
“directors” or “the JCI board” the board of directors of JCI;
“disposal consideration” the total amount payable to Letseng Holdings by Gem in terms of the Sale ofShares Agreement, being the purchase price of R879.5 million in cash and interestaccruing at a rate of 6.75% per annum from the effective date to the date ofpayment. In addition, an amount equal to the distributable profit of Letseng for thethree month period ended 30 June 2006 will be distributed by Letseng to itsshareholders, being Letseng Holdings and the Lesotho Government, provided thatR30 million in cash, consumables and diamond stocks will remain in Letseng to fundits short-term working capital requirements;
“documents of title” share certificates, certified transfer deeds, balance receipts or any other documentsof title pertaining to the shares in question acceptable to the JCI board;
“effective date” the effective date of the Letseng disposal, being 1 July 2006;
“Equitant” Equitant Trading (Proprietary) Limited (Registration number 2003/008512/07), aprivate company incorporated in South Africa, which has a loan to Matodzi;
“form of proxy” the form of proxy for certificated JCI ordinary shareholders and “own name”dematerialised JCI ordinary shareholders which has been attached to and formspart of this circular ;
“GDP” gross domestic product;
“Gem” Gem Diamond Mining Company of Africa Limited (Registration number 66975), acompany incorporated in the British Virgin Islands;
“ha” hectares;
“HLPS” headline loss per share;
“IDC” The Industrial Development Corporation of South Africa Limited (Registrationnumber 1940/014201/06), a public company incorporated in South Africa;
“IFRS” International Financial Reporting Standards as determined by the InternationalAccounting Standards Board;
3

“IGS” International Geological Survey;
“Investec” Investec Bank Limited (Registration number 1969/004763/06), a public companyincorporated in South Africa;
“Investec loan agreement” an agreement between JCI and Investec, in terms of which Investec will arrange aloan facility of up to R460 million to JCIIF, as amended from time to time (the termsof which are summarised in paragraph 3). For avoidance of doubt, the latest agreement, incorporating all the respective amendments was signed on 16 January 2006;
“Jaganda” Jaganda (Proprietary) Limited (Registration number 2004/005559/07), a privatecompany incorporated in South Africa;
“JCI” or “the company” JCI Limited (Registration number 1894/000854/06), a public company incorporatedin South Africa, the shares of which are listed on the JSE;
“JCIIF” JCI Investment Finance (Proprietary) Limited (formerly Lexshell 658 Investments(Proprietary) Limited) (Registration number 2005/021440/07), a private companyincorporated in South Africa as a wholly-owned subsidiary of JCI;
“the JCI general meeting” the general meeting of JCI shareholders to be held at 10:00 on Friday,29 September 2006 in the Auditorium, Ground Floor, 28 Harrison Street,Johannesburg, in order to consider and vote on the ordinary resolutions requiredto give effect to the Letseng disposal;
“JCI Gold” JCI Gold Limited (Registration number 1998/005215/06), a public company dulyincorporated and registered in South Africa, being a wholly-owned subsidiary of JCI;
“JCI group” or “the group” JCI and its subsidiary companies;
“JCI ordinary share” an ordinary share with a par value of 1 cent, held in the share capital of JCI;
“JCI ordinary shareholders” registered holders of JCI ordinary shares;
“JCI shares” JCI ordinary shares;
“JCI shareholders” or “shareholders” registered shareholders of JCI shares;
“JSE” JSE Limited (Registration number : 2005/022939/06), a public companyincorporated in South Africa, the shares of which are listed on the JSE;
“Kimberlite” a rock of distinctive mineralogy that is the most common type that may hostdiamonds;
“last practicable date” 1 September 2006, being the last practicable date prior to the finalisation of thiscircular ;
“Lesotho” Kingdom of Lesotho;
“Lesotho Government” the Government of Lesotho;
“Lesotho Government disposal” the disposal of 6% of the issued share capital of Letseng to the LesothoGovernment post implementation of the Letseng disposal;
“Letseng” Letseng Diamonds (Proprietary) Limited (Registration number 95/259), a privatecompany incorporated in Lesotho;
“Letseng disposal” or “the Transaction” the disposal by Letseng Holdings of its entire interest in the Letseng ordinary sharesto Gem for the disposal consideration at the effective date, subject to the fulfilmentof the conditions precedent set out in paragraph 2.4.3 of this circular ;
4

“Letseng Guernsey” Letseng Diamonds Limited (Registration number 31750), a private companyincorporated in Guernsey;
“Letseng Holdings” Letseng Investment Holdings South Africa (Proprietary) Limited (Registrationnumber 1998/023466/07), a private company incorporated in South Africa;
“Letseng Holdings shareholders” JCI, Matodzi and Letseng Guernsey;
“Letseng Mine” the mining lease and operational assets of the Letseng Diamond Mine located inthe Letseng-la-Terae region of the mountains of Lesotho;
“Letseng ordinary shares” ordinary shares of M1.00 each in the issued share capital of Letseng;
“LPS” loss per share;
“Maloti” or “M” the unit currency of Lesotho which is pegged on a par value to the Rand;
“Matodzi” Matodzi Resources Limited (Registration number 1933/004523/06), companyincorporated in South Africa and a subsidiary of JCI, the shares of which are listedon the JSE;
“Matodzi general meeting” the general meeting of Matodzi shareholders to be held at 12:00 on Friday,29 September 2006 at 28 Harrison Street, Johannesburg for the purposes ofconsidering and, if deemed fit, approving the Letseng disposal;
“the mining lease” the lease entered into between the Basotho Nation and Letseng on 26 October1999 which entitles Letseng to the exclusive right to prospect, dig for, mine, win anddispose of diamonds, for its own account within the production area and grants toLetseng all of the specified rights in the mining lease agreement necessary forLetseng to conduct its operations under the mining lease, continuing for a periodof 25 years from the date of signature of the mining lease;
“the mining lease agreement” the agreement entered into between the Lesotho Government, Letseng Holdings,Letseng Guernsey, JCI Gold and Letseng, dated 28 May 1999, in accordance withwhich the mining lease was granted to Letseng, which sets out the terms andconditions on which the diamond deposits in the production area are required tobe mined;
“mtpa” million tons per annum;
“NAV” net asset value;
“own name dematerialised JCI dematerialised JCI ordinary shareholders that have instructed their CSDP to holdordinary shareholders” their JCI ordinary shares in their own name on the sub-register (being the list of
shareholders maintained by the CSDP and forming part of the company register);
“production area” an 11.7 km2 area of the Letseng-la-Terae region of Lesotho as defined on a sketchplan attached to the mining lease for which Letseng has been granted the mininglease;
“Rand” or “R” the South African Rand, the unit of currency in use in South Africa;
“Randgold” Randgold and Exploration Company Limited (Registration number 1992/005642/06),a public company incorporated in South Africa, the shares of which are listed onthe JSE;
“registered shareholder” a holder of JCI shares recorded in the respective registers of JCI (including withoutlimitation, for the avoidance of doubt, own name dematerialised shareholders);
“Reserve” the economical mineable material derived from a Measured and/or IndicatedMineral Resource. It is inclusive of diluting materials and allows for losses that mayoccur when the material is mined. Appropriate assessments, which may include
5

feasibility studies, have been carried out, including consideration of and modificationby, realistically assumed mining, metallurgical, economic, marketing, legal,environmental, social and governmental factors.These assessments demonstrate atthe time of reporting that extraction is reasonably justified. Mineral Reserves aresub-divided in order of increasing confidence into Probable Mineral Reserves andProven Mineral Reserve;
“Resource” a concentration [or occurrence] of material of economic interest in or on theearth’s crust in such form, quality and quantity that there are reasonable andrealistic prospects for eventual economic extraction. The location, quantity, grade,continuity and other geological characteristics of a Mineral Resource are known,estimated from specific geological evidence and knowledge, or interpreted from awell-constrained and portrayed geological model. Mineral Resources are sub-divided in order of increasing confidence, in respect of geoscientific evidence, intoInferred, Indicated and Measured categories;
“SAMREC Code” the March 2000 South African Code for reporting of Mineral Resource and MineralReserve published by the South African Mineral Resource Committee under theauspices of the South African Institute of Mining and Metallurgy;
“SFD” size frequency distribution;
“the Sale of Shares Agreement” the sale agreement entered into between Letseng Holdings and Gem, dated 23 June 2006;
“SENS” the Securities Exchange News Service of the JSE;
“SG” specific gravity, the ratio of weight or mass of a given volume of a substance to thatof another substance (usually water);
“Socgen” Société Générale (Registration number 1996/006193/10), an external companyduly registered as such in South Africa;
“South Africa” or “RSA” the Republic of South Africa;
“specified stones” gem stones in excess of 10.8 carats per stone;
“STRATE” STRATE Limited (Registration number 1998/022242/06), a registered centralsecurities depository in terms of the Custody and Administration of Securities Act(Act 85 or 1992);
“TNAV” tangible net asset value;
“transfer secretaries” Computershare Investor Services 2004 (Proprietary) Limited (Registration number2004/003647/07), a private company incorporated in accordance with the laws inSouth Africa;
“US” United States of America;
“$” US Dollars, the unit of currency in use in the US;
“Venmyn” Venmyn Rand (Proprietary) Limited (Registration number 1998/004918/07), aprivate company incorporated in South Africa;
“WAL” Western Areas Limited (Registration number 1959/003209/06), a public companyincorporated in South Africa, the shares of which are listed on the JSE;
“WANOS” weighted average number of ordinary shares;
6

“Witnigel” Witnigel Investments (Proprietary) Limited (Registration number1997/008062/07), a private company incorporated in South Africa, and a wholly-owned subsidiary of Matodzi; and
“WWW” WWW International Diamond Consultants Limited (Registration number03151205), a company incorporated in the United Kingdom.
7

IMPORTANT DATES AND TIMES
2006
Circular and notice of the JCI general meeting posted to JCI shareholders 14 September
Last day for lodging forms of proxy with the transfer secretaries for the JCI general meeting by no later than 10:00 27 September
JCI general meeting to be held at 10:00 29 September
Results of the JCI general meeting released on SENS 29 September
Results of the JCI general meeting published in the press 2 October
Notes:
1. The interpretation and definitions on pages 2 to 7 of this circular apply, mutatis mutandis, to these important dates and times.
2. The above dates and times are subject to change. Any such changes to the above dates and times will be released on SENS and published in thepress.
3. The time indicated above is given in South African time.
8

JCI LIMITED(Incorporated in the Republic of South Africa)
(Registration number 1894/000854/06)Share code: JCD (Suspended) ISIN: ZAE000039681
Directors of JCI
Executive Non-executive directors
Peter Henry Gray (CEO) David Morris Nurek (Chairman)Donn Edward Jowell Andrew Christoffel Nissen Peter Richard Suter Thomas
CIRCULAR TO JCI SHAREHOLDERS
1. INTRODUCTION
The Letseng disposal is classified as a Category 1 transaction in terms of the JSE Listings Requirements, and accordingly,JCI is required to obtain shareholder approval for the proposed transaction in a general meeting of JCI shareholders.
Shareholders are referred to the announcement released on SENS on 30 August 2005, wherein JCI shareholders wereinformed that JCI and Investec had reached agreement, in terms of which, Investec would arrange a loan facility of upto R460 million for JCIIF. In terms of the JSE Listings Requirements, the sale by JCI and certain of its subsidiaries of theassets to JCIIF on loan account and the cession and pledge of such assets, and related loan accounts to Investec assecurity for the facility and the subscription by JCI for WAL shares in terms of the WAL rights offer and theunderwriting by JCI of a portion of the WAL rights offer up to a maximum of R250 million have been categorised asCategory 1 transactions. In terms of a ruling by the JSE, such transactions need to be ratified at a general meeting ofJCI shareholders.
The purpose of this circular is to:
– provide JCI shareholders with information regarding the disposal of the 76% holding in Letseng by Letseng Holdings;
– provide JCI shareholders with information regarding the Investec loan agreement;
– advise JCI shareholders of the JCI board’s recommendations supporting the Letseng disposal and Investec loanagreement; and
– convene the JCI general meeting to consider and, if deemed fit, to pass the ordinary resolutions necessary toapprove the disposal of Letseng and the Investec loan agreement.
2. THE LETSENG DISPOSAL
2.1 Introduction and rationale
JCI shareholders are referred to the announcement released on SENS on Friday, 28 July 2006 in terms of whichit was announced that Letseng Holdings has entered into the Sale of Shares Agreement relating to the Letsengdisposal.
Letseng Holdings is an investment holding company incorporated in South Africa, of which 50% is owned byMatodzi, 40% by JCI and 10% by Letseng Guernsey. Letseng Holdings has as its sole operating asset a 76% equityinterest in Letseng with the remaining 24% of the shares being owned by the Lesotho Government.
9

The current organisational structure of Letseng is set out in the diagram below:
There has been no change in the shareholding of Letseng Holdings in the past three years.
In terms of clause 24 of the mining lease agreement, the parties to the mining lease agreement were entitled toreview the financial results of the operations of Letseng and to adjust the following accordingly:
• the percentage equity interest held by the Lesotho Government in Letseng, which is currently 24% in termsof clause 3(i) of the mining lease agreement; and
• the percentage diamond sales tax which is paid to the Lesotho Government, which tax is currently paid at arate of 7% of the true market value of all diamonds produced by the Letseng mine, in terms of clause 22 ofthe mining lease agreement.
In terms of this review, Letseng Holdings, Gem and the Lesotho Government have agreed that, postimplementation of the Letseng disposal, Gem will dispose of 6% of the issued share capital of Letseng to theLesotho Government, thereby increasing the equity interest of the Lesotho Government in Letseng from 24%to 30%.This disposal will be implemented as follows:
• Gem will transfer 3% of the issued share capital of Letseng to the Lesotho Government at zero purchaseconsideration; and
• Gem will dispose of a further 3% of the issued share capital of Letseng to the Lesotho Government for apurchase consideration of R37.5 million.This amount will be loaned to the Lesotho Government by Gem onan interest free basis, and will be repaid by the Lesotho Government to Gem out of dividends received bythe Lesotho Government from Letseng.
In addition, it has been agreed that the rate at which diamond sales tax is paid by Letseng to the LesothoGovernment will be increased from 7% to 8% of the true market value of all diamonds produced by Letseng.
Post-implementation of the Letseng disposal, the shareholding structure of Letseng will be as follows:
The JCI board of directors believes the proposed transaction presents JCI with an opportunity to realisesubstantial value for JCI’s direct and indirect interest in Letseng.
2.2 Nature of business of Letseng
Letseng is a Lesotho registered company and the holder of the mining lease and operational assets of theLetseng Diamond Mine located in the Letseng-la-Terae region of the mountains of Lesotho.The Letseng Mineconsists of two kimberlite pipes and a stockpile of previously mined lower grade diamondiferous ores.
The mining lease was entered into on 26 October 1999 between the Basotho Nation and Letseng which entitlesLetseng to the exclusive right to prospect, dig for, mine, win and dispose of diamonds, for its own account withinthe production area, continuing for a period of 25 years. Concurrently with the mining lease, the mining leaseagreement was entered into on 28 May 1999 between the Government, Letseng, Letseng Holdings, JCI Gold,Letseng Guernsey, which sets out the terms and conditions on which the diamond deposits in the productionarea are to be mined. The initial term of the mining lease agreement is a period of 10 years renewable for three consecutive terms of five years each.
10
Matodzi JCI Letseng Guernsey
9% 8%
50%
58%
40% 10%
Letseng Holdings Lesotho Government
76% 24%
Letseng
Gem Lesotho Government
70% 30%
Letseng

Prior to the signature of the mining lease and the mining lease agreement, the Letseng mine was operated byDe Beers up until 1982, when all mining operations ceased. Mining re-commenced under the mining lease andmining lease agreement in March 2004.
The Letseng mine has estimated economically open-pit mineable ore of 120 million tons of kimberlite containingmore than 2.4 million carats, resulting in an anticipated life of mine of 19 years.The mine is currently producingat a rate of approximately 200 000 tons per month, with established infrastructure capable of processing 2.4 million tons per annum. Since re-commissioning and up until the end of March 2006, the mine has produceda total of 78 944 carats from 4 088 087 tonnes of ore sourced predominantly from the Satellite Pipe and to alesser extent from the stockpile. A small amount of ore has been mined and treated from the Main Pipe.
A recent drilling programme carried out by an independent party has confirmed the existence of kimberlite atdepth and the results were utilised to model the estimated pit volumes of the Main and Satellite Pipes as set outbelow, further details of which are set out in the CPR, which is contained in Annexure V to this circular.
The Main Pipe covers a surface area of 15.9 hectares. The base of the estimated diamond resource lies at avertical depth of 490 m, resulting in total resources of approximately 40.3 million m3, of which 16.7 million m3
has been classified as indicated and 23.6 million m3 as inferred resources. In terms of geology, eight differentvarieties of kimberlite have been identified in the Main Pipe, named K1 to K8, in the order in which they wereencountered.
The Satellite Pipe is a kidney shaped intrusion with a surface expression of 4.7 hectares, and a pit depth of 475 m.The kidney shape of this pipe is attributable to a lenticular wedge or raft of lava extending from the centralarea of the pipe to the south-western end of the pipe.The estimated resources in the Satellite Pipe comprise17.9 million m3 of which 5.7 million m3 has been classified as indicated and 12.2 million m3 as inferred resources.In comparison to the Main Pipe, the Satellite Pipe comprises only one, possibly two kimberlite facies. Furthermapping will be required to confirm the presence of a second facies.
The stockpile has an estimated volume of 1.7 million m3.
The Letseng mine has a proven track record of producing large high quality diamonds, the most famous of whichis the Lesotho Brown, discovered in the mid 1960’s, measuring 601 carats. Historic records show that 15% ofdiamonds recovered weigh more than 10 carats and 1.5% of diamonds recovered weigh over 100 carats. Recentproduction has confirmed these records with the extraction of 96 stones of 20 carats each, of which 8 weighedmore than 100 carats and the largest was 186 carats. In addition to the size of the stone, a large percentage ofproduction from the Letseng mine is graded as D-flawless, and 90% of the diamonds produced are gem qualityand are sold on private auction to the jewellery market.
2.3 Background to Gem
Gem is registered in the British Virgin Islands and was incorporated in July 2005, with the objective of developinginto an international diamond mining company with producing assets and a focus on diamond production fromAfrica. Gem has a recognised and leading management and technical team with combined experience of over150 years in the diamond mining industry, led by Clifford Elphick, former Managing Director of E Oppenheimer& Sons.
Gem is currently involved in a number of other diamond projects in the Central African Republic and theDemocratic Republic of Congo, which are in the exploration and evaluation phase, with the first diamonds fromproduction expected in the first half of 2007.
2.4 The Letseng disposal
2.4.1 Details of the Letseng disposal
Letseng Holdings will, subject to the fulfilment of the condition precedent set out in paragraph 2.4.3below, dispose of 2 280 ordinary shares of M1.00 each held in Letseng constituting 76% of the issuedordinary share capital of Letseng.
In terms of the Letseng disposal, the agreement in respect of the provision of management services byCMMS to Letseng and all rental agreements between Letseng and JCI shall have been terminated witheffect from the effective date.
11

2.4.2 Disposal consideration
The purchase consideration payable by Gem for the Letseng Holding’s interest is R879.5 million, payablein cash, and will attract interest at a rate of 6.75% per annum with effect from the effective date to thedate of payment thereof, being the first business day after the fulfilment of the condition precedent, asset out in paragraph 2.4.3 below. In addition, an amount equal to the distributable profit of Letseng forthe three month period ended 30 June 2006 will be distributed by Letseng to its shareholders, beingLetseng Holdings and the Lesotho Government, provided that R30 million in cash, consumables anddiamond stocks will remain in Letseng to fund its short-term working capital requirements.The quantumof such distribution will be determined by the auditors of Letseng within a period of 90 days from theeffective date.
All tax liabilities arising in Letseng prior to the effective date, which are provided for in the accounts ofLetseng at 30 June 2006 are the responsibility of Letseng, and therefore indirectly of Letseng Holdingsand Lesotho Government, in proportion to their shareholdings in Letseng. Subsequent to the effectivedate, all tax liabilities arising in Letseng are the responsibility of Letseng, and therefore indirectly of Gemand Government, in proportion to their shareholdings in Letseng.
JCI intends to apply the proceeds from the Letseng disposal to reduce its current interest bearingliabilities.
2.4.3 Conditions precedent
The Letseng disposal is subject to the approval of the shareholders of Matodzi and JCI in respectivegeneral meetings.
2.4.4 Warranties
Warranties usual to transactions of the nature contemplated in the Letseng disposal have been providedby Letseng Holdings to Gem. Letseng Holdings has not guaranteed the book debts or other assets ofLetseng.
2.4.5 Restraint of trade
The sale of shares agreement does not preclude Letseng Holdings from carrying on business incompetition with Gem, or impose any other restrictions on Letseng Holdings. No cash or otherpayments were made regarding restraints of trade.
2.4.6 Commitments
JCI has received the following undertakings to vote in favour of all resolutions at a general meeting of JCIshareholders to give effect to the Letseng disposal:
Number of PercentageJCI ordinary holding of JCI
JCI ordinary shareholders shares ordinary share
Allan Gray Limited* 516 032 847 23.3Letseng Guernsey 177 455 684 8.0Hawkhurst Investments Limited 212 165 628 9.6
905 654 159 40.9
*Allan Gray Limited has irrevocably undertaken to recommend to their clients to vote in favour of the Letseng disposal.
Pursuant to the approval of the Letseng disposal by JCI shareholders, JCI intends to vote in favour of theLetseng disposal at the general meeting of Matodzi shareholders to be held on 29 September 2006.
2.4.7 Promoters
No cash or securities were paid nor any benefit given within the three years preceding the date of thiscircular, or are proposed to be paid or given, to any promoter, not being a director of JCI or LetsengHoldings.
12

3. THE INVESTEC LOAN AGREEMENT
3.1 Introduction
Investec granted a loan facility in August 2005 of up to R460 million to a newly formed special purpose vehicle,JCIIF, and Letseng Holdings. The facility enabled JCI to meet immediate cash flow requirements, restructureexisting facilities, follow JCI’s rights in terms of the WAL rights offer and to underwrite a portion of the WALrights offer.
Amongst other purposes, the facility was used, inter alia to:
• subscribe for 8 871 931 WAL shares in terms of the WAL rights offer ;
• underwrite 163 438 WAL shares in terms of the WAL rights offer ;
• refinance an equity-financing facility with SocGen, releasing 13 154 031 WAL shares, which had been pledgedas security;
• refinance an equity-financing facility with Barnard Jacob Mellet, releasing 2.9 million WAL shares, which hadbeen pledged as security;
• pay a judgement debt of R67 546 991 granted against JCI relating to a claim against Kabusha Mining andFinance (Proprietary) Limited, in respect of which JCI had bound itself as co-surety with Trinity Holdings(Proprietary) Limited;
• repay not more than R50 000 000 of JCI’s loan account claim against JCIIF to JCI in order to enable JCI torepay and fully settle all of JCI’s creditors and the creditors of JCI’s subsidiaries as at 31 August 2005 approvedby Investec in writing (including R15 000 000 owed by JCI to Investec in respect of tax liabilities); and;
• repay not more than R15 000 000 of JCI’s loan account claim against JCIIF to JCI in order to enable JCI tofund its own working costs and/or on-going operating costs approved by Investec in writing, but only if suchfunding is required by JCI and is approved by Investec in writing.
3.2 Assets transferred to JCIIF
The following assets, were transferred to JCIIF in terms of the facility:
• all JCI’s shares in and loan account claims of R35 485 837 against Letseng Holdings;
• 200 million unsecured, redeemable convertible participating “B” preference shares in Matodzi, which havesubsequently been “redeemed” into 200 million new Matodzi ordinary shares on 29 March 2006;
• 9 035 369 WAL shares received in terms of the WAL rights offer ;
• R246 462 256 received from WAL as a repayment of the WAL underwriting loan as a consequence of thesubscription of WAL shareholders of their entitlements in terms of the WAL rights offer ;
• 13 154 031 WAL shares previously pledged to SocGen;
• 12 000 debentures in Kovacs Investment 608 (Proprietary) Limited and all rights relating to those debenturesin respect of Boschendal;
• 357 374 000 redeemable 50% secured preference shares in Jaganda;
• 6 510 045 WAL shares, which had been pledged to the IDC for a loan granted to Letseng; and
• the property portfolio of JCI and its subsidiary companies valued at R243.5 million.
3.3 Letseng Holdings loan
An amount of approximately R180 000 000 was advanced by Investec to Letseng Holdings in terms of theLetseng loan agreement, which was subsequently paid by Letseng Holdings to JCIIF. JCIIF used the amount, toenable JCIIF to achieve the purposes disclosed in paragraph 3.1 above.
3.4 Security
The assets transferred to JCIIF, as well as JCI’s (and all entities selling assets to JCIIF) shares in and loan accountclaims against JCIIF, and the loan account claims of all entities selling the assets to JCIIF, were ceded and pledgedto Investec as security for the facility. JCI and such entities bound themselves to Investec as guarantors for JCIIFin respect of its obligations in terms of the facility. In terms of the cessions and pledges to Investec, JCIIF is entitledto exercise all voting rights attaching to any shares comprising part of the ceded assets.
Investec is entitled, at any time and on notice to JCIIF, to exercise all voting rights (including the right to call ameeting of shareholders) attaching to any shares comprising part of the ceded assets and for that purpose
13

Investec is entitled, in its discretion, to transfer such shares into its own name or the name of its nominee, asnominee of JCIIF. Notwithstanding the foregoing, as from the date on which JCIIF is deemed to be in breach ofthe Investec loan agreement, Investec shall automatically be entitled to exercise all of the voting rights attachingto such shares in its own name.
Unless and until JCIIF is deemed to be in breach of the Investec loan agreement, Investec shall, notwithstandingthe cession of the ceded rights in terms of the Investec loan agreement, not be entitled to exercise any of theceded rights, other than the voting rights attaching to any shares comprising part of the ceded assets.
Investec is entitled, without reference to JCIIF (and all entities selling assets to JCIIF), to cede, delegate or assignall or any of its rights and/or obligations under the Investec loan agreement either absolutely or as collateralsecurity to any third party.
Until such time as Investec notifies JCIIF (and all entities selling assets to JCIIF) in writing that all of JCIIF’sobligations, in terms of the loan agreement, have been fully and finally discharged, JCIIF (and all entities sellingassets to JCIIF) have irrevocably undertaking in favour of Investec that all claims against JCIIF have beensubordinated.
JCI has guaranteed any and all amounts which may be payable to Investec from time to time by JCIIF and LetsengHoldings.
3.5 Interest and capital repayments
Interest on the facility is charged at Investec’s prime rate and payable on the last business day of the secondcalendar month after the calendar month in which the first draw down date falls and quarterly in arrearsthereafter. Capital and interest is to be repaid from the proceeds of the sale of the JCIIF assets.
The facility is to be repaid by the later of 18 months after the final draw down-date, or such other date (notbeing later than 24 months after the final draw-down date) as the parties may agree. JCIIF is entitled to repaythe facility early, subject to the payment of break costs.
In the event JCIIF disposes of any of its assets, refinances any portion of the capital amount or receive any amountfrom or on behalf of any underlying company, whether by way of dividend, interest, return of capital, repaymentof loan or otherwise (including any payment from Letseng Holdings in respect of JCIIF’s loan claim against LetsengHoldings or otherwise), JCIIF must apply the full proceeds of such disposal, refinancing or amount received toeffect a partial repayment of the capital outstanding to Investec in a manner approved by Investec or for suchother purpose as may be approved by Investec in writing;
Penalty interest
Any amount falling due for payment by JCIIF to Investec in connection with the Investec loan agreement, shallbear penalty interest, which shall accrue daily from the due date for payment thereof to the actual date ofpayment thereof or, in the case of amounts due by way of an indemnity or damages (whether liquidated or not),from the date upon which the relevant indemnified loss or damage is sustained to the date of actual paymentthereof (both dates inclusive). Any damage and/or any indemnified loss arising from any breach of any warrantyor representation as to a stipulated state of affairs as at any date shall be deemed to have been sustained on thedate to which such stipulation relates. Such interest shall accrue at the Investec prime rate, plus 2%.
3.6 Investec fee
A raising fee is payable to Investec in respect of the Investec loan agreement, being the greater of:
• R50 million; or
• the aggregate of 30% of the increase in value of the JCIIF assets, whether realised or unrealised, and 10% ofthe increase in the price of approximately 2.2 billion JCI shares, up to, but not later than 18 months after thedate on which the facility is repaid.
For the purpose of determining the increase in the value of the JCIIF’s assets, as disclosed above:
• each asset of JCIIF shall be ring-fenced for the purposes of calculating Investec’s fee.To the extent that a lossis suffered on the disposal of one or more of JCIIF’s assets, such loss shall not affect the calculation of the 30%of the increase in the value in respect of JCIIF’s other assets; and
• the base cost of JCIIF’s assets shall be deemed to be:
• in respect of the interest in Letseng, the fair value thereof (being R225 000 000);
• in respect of all WAL shares, the value shall be RI8.00 per WAL share;
14

• in respect of the interest in Matodzi, the value shall be R0.575 per Matodzi share;
• in respect of the interest in Aconcagua, R50 000 000; and
• in respect of the property portfolio including Boschendal, the value shall be R240 million.
The increase of the value shall be the difference between the realised sale price (net of any and all brokers’commissions, stamp duties, marketable securities tax and/or any other similar tax and/or duty) of any of JCIIF’sassets concerned (which, in the case of shares, shall include the value per share of all distributions made to theshareholders during the increase period, and shall take account of the deemed number of shares adjusted forshare consolidations and/or share splits which shall have occurred during the increase period) and the base costof such asset, as set out above.To the extent that any of JCIIF’s assets remain unsold at the date on which theincrease in the value is to be determined:
• any share listed on the JSE shall be valued at the 30-day weighted average traded price in respect of thatshare, as determined at the close of the market on the value date, and shall include the value per share of alldistributions made to the shareholders during the increase period and shall take account of the deemednumber of shares adjusted for share consolidations and/or share splits which shall have occurred during theincrease period; and
• in respect of any other unrealised asset, such unrealised asset shall be valued at its fair market value as agreedbetween JCIIF and Investec in writing or determined by an expert.
For the purposes of determining the increase in the share price of the 2 218 476 730 JCI ordinary shares, thebase cost of such JCI ordinary shares shall be deemed to be R0.16 per share.The increase in the price of suchJCI ordinary shares shall be determined using the thirty day weighted average traded price in respect of thatshare, as determined at the close of the market on the value date, and shall include the value per share of alldistributions made to the shareholders during the increase period, and shall take account of the deemed numberof shares adjusted for share consolidations and/or share splits which shall have occurred during the increaseperiod.
To the extent that the Investec fee has been paid in full, Investec shall give Letseng Holdings a 20% rebate of thefee payable by Letseng Holdings to Investec in respect of the mandate granted by the Letseng Holdingsshareholders to Investec dated 13 May 2005. Similarly, to the extent that Letseng Holdings pays such fee toInvestec in full in accordance with the provisions of such mandate, Investec shall grant JCIIF a rebate against theInvestec fee in an amount equal to 20% of such other fee.
Investec may, in its sole discretion (but subject to any and all necessary contractual and/or regulatory consentsrequired) demand to receive the Investec fee or a portion thereof in any asset other than in cash.
3.7 Warranties
In addition to warranties usual to transactions of this nature, the warranties set out below have been providedby JCIIF to Investec:
• JCIIF shall, acquire (and, accordingly, become the legal and beneficial owner of) the property portfolio securityinterest by no later than 30 September 2005;
• no share in JCIIF or claim against JCIIF will at any time be held by any person or entity other than JCI, JCI Gold,CMMS, Clifton and/or Equitant;
• JCIIF shall cede on an out and out basis, to Investec all proceeds and right to proceeds of any sale of Letseng,Jaganda,Aconcagua and Boschendal, on the basis that Investec shall apply any amount received by it pursuantto such cessions in reduction of JCIIF’s obligations to Investec;
• JCIIF shall procure that the owners of the property portfolio shall cede on an out and out basis, to Investecall proceeds and all their rights to proceeds of any sale or other disposal of the property portfolio, on thebasis that Investec shall apply any amount received by it pursuant to such cessions in reduction of JCIIF’sobligations to Investec; and
• JCIIF shall procure that the current owners of all the shares and claims that form part of Letseng, Jaganda,Aconcagua and Boschendal that have not been (but are still to be) transferred to JCIIF, to the extent notalready done, guarantee, in favour of Investec, the obligations of JCIIF under the Investec loan agreement andshall cede, in securitatem debiti, to Investec all such shares and claims as security for their respective obligationsto Investec under such guarantee.
15

3.8 Costs
JCIIF shall pay Investec’s attorneys’ charges in respect of, and all other costs of and incidental to, the negotiation,drafting and execution of the Investec loan agreement and all transactions contemplated in terms of the Investecloan agreement and all other disbursements and expenses incurred by Investec.
Without prejudice to Investec’s other rights in terms of the Investec loan agreement or at law, JCIIF undertakesto pay the amount of any costs, charges and expenses of whatever nature incurred by Investec in its sole andabsolute discretion in securing or endeavouring to secure fulfilment of JCIIF’s obligations or in otherwiseexercising Investec’s rights in terms of the Investec loan agreement, including collection commission, tracingcharges and legal costs on the scale as between an attorney and his own client, insurance premiums, storagecharges, broking costs, stamp duties, taxes and other fiscal charges and all costs and expenses of valuation,maintenance, advertising, realisation (including agent’s and auctioneer’s commissions and other charges anddisbursements).
3.9 Redemption of JCI debentures
Following the conclusion of the WAL rights offer, and the subsequent repayment of the JCIIF underwriting loanof R246 462 256, JCI and Investec agreed on 16 January 2006 to an amendment to the terms of the Investecloan agreement, inter alia that:
• Investec advanced JCIIF a further R375 million to fund the redemption of the 307 300 024 JCI Debentures;
• the 5 500 000 WAL shares released by Sasfin as JCI Debenture Trustees be transferred to JCIIF (thecalculation of Investec’s fee in respect of this disposal was 40% of proceeds received in excess of R36.00 perWAL share);
• Investec be granted the authority to sell 5 500 000 WAL shares received from Sasfin to partially repay theadditional R375 million advanced in terms of the facility;
• JCIIF sell such of its assets to reduce the capital amount outstanding in terms of the facility to R280 millionby 28 February 2006 and R180 million by 31 March 2006.
3.10 Commitments
At the date of the conclusion of the Investec loan agreement, JCI had received the following undertakings tovote in favour of all resolutions at a general meeting of JCI shareholders to give effect to the Investec loanagreement:
Number of JCI Percentageordinary holding of JCI
JCI ordinary shareholders shares ordinary share
Tlotlisa Securities (Proprietary) Limited* 481 301 240 22.8 BNC Investments (Proprietary) Limited 215 110 073 10.2 Matodzi 126 922 380 6.0Masupatsela Investment Holdings (Proprietary) Limited 104 000 000 4.9 Witnigel Investments (Proprietary) Limited 83 333 333 4.0 JCI Gold Limited 79 000 000 3.8 First Wesgold Mining (Proprietary) Limited 37 560 613 1.8 R A R Kebble 16 000 000 0.8 H C Buitendag 15 614 033 0.7J Stratton 14 000 000 0.7 Morgate Investments Limited 8 495 617 0.4 J C Lamprecht 5 000 000 0.2
1 186 337 289 56.3
*Tlotlisa Securities (Proprietary) Limited has undertaken, subject to the continuing mandates of their clients, to vote in favour of the Investecloan agreement.
16

3.11 Default
JCIIF shall be deemed to be in default should it, inter alia:
• cease or dispose of or threaten to cease or dispose of its main business activities or any material part of itsbusiness activities;
• compromise or attempt to compromise with, or defer or attempt to defer payment of debts owing by it to,its creditors generally;
• pass, or propose, or have proposed in relation to it, a resolution for its liquidation or sequestration; or
• do anything which may reasonably prejudice the Investec’s rights in terms of the Investec loan agreement.
4. OPINION OF THE JCI BOARD
The JCI board has considered the CPR as well as the terms and conditions of the Letseng disposal and are of theunanimous opinion that the terms and conditions are for the benefit of JCI. Accordingly, the JCI board supports theLetseng disposal and recommends that JCI shareholders vote in favour of the Letseng disposal at the JCI generalmeeting and intends to vote JCI’s shares in Matodzi in favour of the Letseng disposal at the Matodzi general meetingto be held on 29 September 2006.
The JCI board (Messrs David Morris Nurek, Donn Edward Jowell and Peter Richard Suter Thomas have recusedthemselves as they are representatives of Investec) has considered the terms and conditions of the Investec loanagreement and are of the unanimous opinion that the terms and conditions are for the benefit of JCI. Accordingly, theJCI board supports the Investec loan agreement and recommends that JCI shareholders vote in favour of theratification and approval of the Investec loan agreement at the JCI general meeting.
5. FINANCIAL INFORMATION
5.1 Financial information on Letseng
The historical financial information on Letseng, comprising extracts from the audited financial statements for thethree financial years ended 31 March 2006 is set out in Annexure I to this circular.
5.2 Pro forma financial effects of the Letseng disposal
The table below sets out the unaudited pro forma financial effects on JCI based on the assumptions set out below.The unaudited pro forma financial effects have been prepared by the board of JCI for illustrative purposes only,in order to provide information about how the proposed transaction may have affected the results, changes inequity and financial position of JCI, had the transaction been implemented on 1 April 2005 for income statementpurposes and 30 September 2005 for balance sheet purposes. Due to their nature the unaudited pro formafinancial effects may not give a true reflection of the results, changes in equity and financial position of JCI afterthe proposed transaction.The directors of JCI are responsible for the unaudited pro forma financial effects.
The unaudited pro forma financial effects of JCI do not include any adjustments with regards to the followingsubsequent events:
• the acquisition by Matodzi of 200 million cumulative redeemable preference shares owned by JCI in Witnigel;and
• the redemption by Matodzi of 200 million unsecured redeemable convertible participating “B” preferenceshares owned by JCIIF, a wholly-owned subsidiary of JCI, on 29 March 2006.
As a consequence of the above, JCI through JCIIF, has become the majority shareholder in Matodzi andaccordingly, has increased its effective holding in Letseng from 30.4% to an effective 52.7%. JCI shareholders arereferred to the pro forma financial information contained in paragraph 4 of the Matodzi circular to be issued onor about 14 September 2006, as this will indirectly impact on JCI.
Before After Change(cents) (cents) (%)
Loss per share (7.74)1 (3.88)3 49.92Headline loss per share (5.90)1 6.644 212.47Net asset value per share (15.12)2 (11.92)5 21.16 Tangible net asset value per share (15.12)2 (11.92)5 21.16Number of ordinary shares in issue6 2 106 476 728 2 106 476 728 –WANOS in issue7 2 063 635 198 2 063 635 198 –
17

Notes:
1. The LPS and HLPS reflected in the “Before the proposed transaction” column have been extracted from the income statement includedin the JCI unaudited and unreviewed results for the six months ended 30 September 2005, as released on SENS on Friday, 7 April 2006and published in the press on Monday, 10 April 2006, adjusted for the 112 000 000 treasury shares held by the share incentive trust andsubsidiary companies, resulting in a difference between the LPS and HLPS disclosed above and in the unaudited and unreviewed resultsfor the six months ended 30 September 2005.
2. The NAV and TNAV reflected in the “Before the proposed transaction” column have been extracted from the balance sheet includedin the JCI unaudited and unreviewed results for the six months ended 30 September 2005, as released on SENS on Friday, 7 April 2006and published in the press on Monday, 10 April 2006. The NAV per share and TNAV per share have been calculated based on 2 106 476 728 ordinary shares in issue.
3. The LPS as set out in the “After the proposed transaction” column has been adjusted as follows:• to include JCI’s share of Letseng Holding’s profit on the disposal of Letseng of R298.2 million calculated at 30 September 2005;• to exclude the equity accounted income relating to Letseng Holdings for the six months ended 30 September 2006 of R13.7 million
as per the Letseng Holdings management accounts;• to include the impairment of JCI’s investment in Letseng Holdings of R171.4 million (the impairment calculated for income statement
purposes is based on the opening balance of the investment in associate at 1 April 2005);• to include the estimated transaction costs of R8.3 million;• to include Investec’s profit share of R38.0 million in terms of the loan agreement; and• to exclude R13 million of interest paid in respect of interest bearing liabilities as JCI will utilise the cash received net of transaction
costs to settle a portion of the interest bearing liabilities.
4. The HLPS as set out in the “After the proposed transaction” column has been adjusted as for the LPS, except that the following itemshave been excluded:• the impairment of JCI’s investment in Letseng Holdings of R171.4 million; and• the estimated transaction costs.
5. NAV per share and tangible NAV per share has been adjusted as follows:• to include the dividend to be received by JCI from Letseng Holdings of R294.1 million (40% of the net proceeds on the proposed
transaction distributed by Letseng Holdings to its shareholders after repayment of loans owing to CMMS and Matodzi and paymentof Secondary Taxation on Companies), less the estimated transaction costs of R8.3 million, which will be used to settle a portion ofthe interest bearing liabilities;
• to include the provision for payment of the Investec profit share of R38.0 million; and• to include JCI’s share of the profit on disposal of Letseng of R298.2 million calculated at 30 September 2005, the dividend received
from Letseng Holdings of R294.1 million and the impairment of JCI’s investment in Letseng Holdings of R184.4 million (the impairmentcalculated for balance sheet purposes is based on the closing balance of the investment in associate at 30 September 2005).
6. The number of ordinary shares in issue reflected in the “Before the proposed transaction” column has been extracted from the JCI unauditedand unreviewed results for the six months ended 30 September 2005, as released on SENS on Friday, 7 April 2006 and published in thepress on Monday, 10 April 2006, less 112 000 000 treasury shares held by the share incentive trust and subsidiary companies.
7. The weighted average number of ordinary shares in issue reflected in the “Before the proposed transaction” column has been extractedfrom the JCI unaudited and unreviewed results for the six months ended 30 September 2005, as released on SENS on Friday, 7 April2006 and published in the press on Monday, 10 April 2006, less 112 000 000 treasury shares held by the share incentive trust andsubsidiary companies.
The pro forma balance sheet and income statement of JCI are contained in Annexure II to this circular. Theindependent reporting accountants’ report on the pro forma financial information of JCI is contained in Annexure IV to this circular.
6. MAJOR SHAREHOLDERS
Insofar as is known to the directors of JCI, the following JCI shareholders beneficially held, directly or indirectly, aninterest of 5% or more of the JCI shares in issue at the last practicable date:
Number of PercentageJCI ordinary holding of JCI
JCI ordinary shareholders shares ordinary share
Allan Gray Limited 516 032 847 23.3Matodzi 210 255 713 9.4Letseng Guernsey 177 455 684 8.0Hawkhurst Investments Limited 212 165 628 9.6
1 115 909 872 50.3
7. MATERIAL CHANGES
The directors report that since the publication of the unaudited and unreviewed JCI interim financial statements forthe six months ended 30 September 2005 on 7 April 2006 until the last practicable date, there have been no materialchanges in the financial and trading position of JCI and its subsidiaries.
There have been no material changes in the financial or trading position of Letseng since the year ended 31 March 2006.
18

8. DIRECTORS
Subsequent to year-end and at the last practicable date of the following changes to the board took place:
Resignations Capacity Date
R B Kebble* CEO to Non-executive 24 August 2005
J C Lamprecht Financial director 16 May 2006
C H D Cornwall Non-executive 24 August 2005
R A R Kebble Non-executive chairman 24 August 2005
J Stratton Executive 24 August 2005
H C Buitendag Executive 24 August 2005
Appointments Capacity Date
P H Gray CEO 24 August 2005
J C Lamprecht Financial director 24 August 2005
D M Nurek Non-executive chairman 12 September 2005
D E Jowell Non-executive 12 September 2005
P R S Thomas Non-executive 12 September 2005
A C Nissen Non-executive 12 September 2005
* Mr R B Kebble passed away on 27 September 2005.
The board of directors of JCI at the last practicable date is as follows:
Name Age Business address Designation
Peter Henry Gray 58 28 Harrison Street, Johannesburg CEO
David Morris Nurek* 56 36 Hans Strydom AvenueForeshore, Cape Town, 8001 Non-executive chairman
Donn Edward Jowell** 65 72 Grayston DriveSandton, 2196 Non-executive director
Andrew Christoffel Nissen 48 12th Floor, Southern Life CentreRiebeek Street, Cape Town, 8001 Non-executive director
Peter Richard Suter Thomas*** 61 10 Orange Street, SunnysideAuckland Park, 2092 Non-executive director
* David Morris Nurek is an executive of Investec and a director of Investec Property Group Holdings Limited.
** Donn Edward Jowell is a non-executive director of Investec.
*** Peter Richard Suter Thomas is a non-executive director of Investec and a director of various other Investec companies.
There are no service contracts between JCI and the non-executive directors of JCI. The service contract with theexecutive director of JCI contains normal terms and conditions of employment and, other than disclosed in paragraph 8.1 below. has not been entered into or amended during the period beginning six months prior to the dateof this circular.
Peter Henry Gray is the only director of JCI or any of its subsidiaries who has a service contract (all disclosures relatingto Matodzi directors are contained in the circular posted to Matodzi shareholders relating to the Letseng disposal on 14 September 2006). In terms of the service contract entered into with Peter Henry Gray on 17 August 2005, eitherparty may terminate this contract by giving 90 days’ notice of such intention to the other party after the first 12 monthsof the contract.The service contract with Peter Henry Gray is available to shareholders for inspection.
At the date of this circular, no candidates have been nominated as proposed directors of the company.Accordingly, noservice contracts with any proposed directors have been entered into.
The total emoluments received by the directors of JCI will not be varied as a consequence of the Letseng disposal.
8.1 Directors’ emoluments
In terms of the service contract, Peter Henry Gray is entitled to receive an all-inclusive, package of R1.6 millionper annum. The cost of all additional benefits shall be part of the all-inclusive package. In addition to the all-inclusive package, JCI may award an annual bonus based on the performance of JCI and Peter Henry Gray,respectively.The remuneration package will be reviewed on an annual basis.
19

As a further entitlement for accepting the position as CEO, JCI acquired on behalf of Peter Henry Gray thefollowing shares, inclusive of the income tax thereon:
• 100 000 Randgold shares; and
• 10 000 WAL shares.
Subsequent to the signing of the service contract, Randgold was suspended and JCI paid Peter Henry Gray thecash equivalent of the suspended price of 100 000 Randgold shares being R890 000. In addition to the sharesabove, JCI paid Peter Henry Gray R1 million after tax.
JCI has resolved that non-executive directors would be entitled to receive R175 000 per annum and that thechairman would receive R350 000 per annum on the basis of at least 80% attendance of meetings.The necessaryresolutions will be passed on a quarterly basis, confirming the actual amounts due to the non-executive directors.
No share options are held by any executive directors and none were exercised for the period commencing 1 March 2005 and ending on the last practicable date.
9. JCI AND ITS DIRECTORS’ INTERESTS AND DEALINGS
9.1 Directors’ interests in JCI ordinary shares
At 30 September 2005, no directors of JCI held any beneficial or non-beneficial interest, whether directly orindirectly, in JCI ordinary shares.There has been no change in the directors’ interests in JCI ordinary shares since30 September 2005.
9.2 Directors’ interests in transactions
None of the directors of JCI have any material direct or indirect beneficial interests in any transactions whichwere effected by JCI during:
• the current or immediately preceding financial year ; or
• an earlier financial year and remain in any respect outstanding or unperformed.
9.3 Interest of JCI, Letseng and their directors in Gem and dealing in Gem shares
Neither JCI, Letseng nor their directors hold any Gem shares nor have they ever dealt in Gem shares. None ofthe directors of JCI or Letseng have any direct or indirect beneficial interest in the Letseng disposal.
10. FUTURE STRATEGY OF JCI
JCI is a mining investment company. JCI’s current strategy is to dispose of some of its investments in order to repay itsliabilities. As at the last practicable date, the significant assets, other than the Letseng asset, held by JCI are as follows:
• a 25% shareholding in WAL, a gold mining company listed on the JSE that holds 50% of South Deep mine, one ofthe largest unexploited gold reserves in the world;
• a property portfolio including an interest in Boschendal, a wine estate in the Western Cape;
• a 57.7% shareholding in Matodzi;
• preference shares in Jaganda (Proprietary) Limited (an indirect investment in Simmer & Jack Mines Limited);
• a selection of minor industrial and technology interests; and
• various mineral rights for which the necessary applications had been submitted to the Department of Minerals andEnergy in respect of the new mining legislation.
JCI is currently reviewing its strategic alternatives in relation to the above mentioned assets.
11. HISTORY OF CHANGES
JCI has not, in the past five years, had a controlling shareholder and currently does not have a controlling shareholder.
12. WORKING CAPITAL STATEMENT
Subject to the outcome of the matters referred to in paragraph 13 below, the JCI board are of the opinion that theworking capital resources of JCI and its subsidiaries are sufficient for JCI’s current requirements and will be adequatefor a period of 12 months from the date of this circular.
20

13. LITIGATION STATEMENT
Other than disclosed below, there are no legal or arbitration proceedings (including any such proceedings that arepending or threatened) of which JCI is aware which may have, or have had, a material effect on JCI Group’s financialposition during the past 12 months preceding the date of this circular.
On 7 April 2006, JCI and Randgold informed their respective shareholders that they had agreed to enter into amediation process with a view to resolving various potential disputes which had arisen between them.
Pursuant to that process, Randgold, after taking legal advice, formulated several claims against JCI, its subsidiary andassociated companies. Some of these claims are framed on alternative bases and, taking the highest bases, the claimscould, in the aggregate, substantially exceed the provision of R1.132 billion made therefore in the unreviewed andunaudited provisional consolidated financial statements of JCI published on 7 April 2006 and the consolidated NAV ofJCI and it subsidiaries, before making that provision.
JCI has taken legal advice in regard to the Randgold claims and, based on that advice, contends on several grounds thatthere is no basis for any liability on the part of JCI in respect of the Randgold claims, as submitted.
The mediation process is continuing and shareholders will in due course be advised of the mediator’srecommendations and will be asked to vote on the acceptability or otherwise of any proposed settlement that mayflow from them.
Should the mediator’s recommendation be rejected by either JCI or Randgold in terms of the process, the parties haveagreed to enter into arbitration in order to resolve the disputed issues.
The company has a potential liability to South African Revenue Services for penalties on unpaid pay as you earn relatingto payments made to directors, employees, contractors and sub-contractors.These amounts have not been quantifiedand are dependant on further forensic investigations.
DRDGold Limited and its associated companies have served summons on the Company as co-defendant with Messrs R A R Kebble, J Stratton and H C Buitendag, claiming payment jointly and severally from the company, and co-defendants of R77.8 million and AUS$6 million. This matter was settled during August 2005 and, inter alia, bothcompanies are committed to the payment of R2.5 million over the next five years. JCI has already paid R500 000.Theplaintiffs are alleging that the settlement agreement was not finally concluded.
The directors of Letseng have advised JCI that there are no legal or arbitration proceedings (including any suchproceedings that are pending or threatened) of which Letseng is aware which may have, or have had, a material effecton Letseng’s financial position during the past 12 months preceding the date of this circular.
14. DIRECTORS’ RESPONSIBILITY STATEMENT
The directors, whose names are given in paragraph 8 above, collectively and individually, accept full responsibility forthe accuracy of the information given relating to the JCI group and certify that to the best of their knowledge andbelief there are no facts that have been omitted which would make any statement false or misleading, and that allreasonable enquiries to ascertain such facts have been made and that this circular contains all information required bythe JSE Listing Requirements.
15. SIGNIFICANT CONTRACTS
Save as disclosed in parargraph 3 above, the JCI Group has not entered into, verbally or in writing, any material contractotherwise than in the ordinary course of business either :
• within the last two years; or
• at any time which contains an obligation that is material to the JCI group.
The directors of Letseng have advised JCI that Letseng has not entered into, verbally or in writing, any material contractout of the ordinary course of business either :
• within the last two years; or
• at any time which contains an obligation that is material to Letseng.
21

16. BORROWINGS
At the last practicable date, JCI had the following material borrowings:
R
Investec facility (refer paragraph 3) 397 667 546Randgold claim (refer paragraph 13) 1 132 000 000South African Revenue Services (refer paragraph 13) 255 000 000
1 784 667 546
Letseng had no material borrowings at 31 March 2006, other than as disclosed in the historical financial information ofLetseng as set out in Annexure I to this circular.
17. EXPENSES
The expenses of the Letseng disposal, excluding value-added tax, where applicable, are estimated at approximately R8.3 million, as follows:
Expenses R’000
Printing, publication and distribution 350JSE documentation and inspection fee 20Reporting accountants’ report – KPMG 60Corporate legal adviser – Tabacks 200Competent Person’s Report – Venmyn 200Working capital – Deloitte 100Sponsor – Sasfin 110Reporting accountants – Moores Rowland 50Transaction advisers – Investec 7 210
Estimated total 8 300
The expenses of the Letseng disposal will be payable by JCI out of the proceeds of the Letseng disposal.
18. CONSENTS
The investment bank, sponsor, independent reporting accountants and auditors, corporate law advisers andCompetent Person have consented in writing to act in the capacity stated and to their names being stated in thiscircular and, in the case of the independent reporting accountants, reference to their reports in the form context inwhich they appear, and have not withdrawn their consents prior to the publication of this circular.
19. NOTICE OF GENERAL MEETING OF JCI SHAREHOLDERS
A general meeting of JCI shareholders has been convened and will be held in the Auditorium, Ground Floor,28 Harrison Street, Johannesburg on Friday, 29 September at 10:00 for the purpose of considering and, if deemed fit,passing, with or without modification, the requisite ordinary resolutions which is contained in the notice of the JCIgeneral meeting, attached to this circular.
Any certificated shareholder or “own name” dematerialised shareholder who is unable to attend the JCI generalmeeting, but wishes to vote by proxy at the JCI general meeting, is required to complete and return the attached formof proxy in accordance with the instructions contained therein. Duly completed forms of proxy must be received bythe South African transfer secretaries, Computershare Investor Services 2004 (Proprietary) Limited, Ground Floor,70 Marshall Street, Johannesburg, 2001, PO Box 61051, Marshalltown, 2107 or the United Kingdom Registrars, CapitaRegistrars, The Registry, 34 Beckenham Road, Beckenham, Kent, BR3 4TU, no later than 10:00 on Wednesday,27 September 2006.
22

Dematerialised shareholders, other than “own name” dematerialised shareholders, must inform their CSDP or brokerof their intention to attend the JCI general meeting and obtain the necessary authorisation from their CSDP or brokerto permit them to attend the JCI general meeting. Alternatively, they may provide their CSDP or broker with theirvoting instructions should they not be able to attend the JCI general meeting, but wish to be represented thereat.
20. DOCUMENTS AVAILABLE FOR INSPECTION
The following documents, or copies thereof, will be available for inspection during normal business hours at theregistered office of JCI from Thursday, 14 September 2006 to and including Friday, 29 September 2006.
• the memorandum and articles of association of JCI;
• the Sale of Shares Agreement;
• copies of service agreements with directors and managers entered into during the last three years;
• the significant contracts entered into by JCI referred to in paragraph 15 above;
• the published audited financial statements of JCI for the financial years ended 31 March 2003 and 31 March 2004and the unaudited and unreviewed results for the six months ended 30 September 2005;
• the historical financial information of Letseng for the financial years ended 31 March 2004, 31 March 2005 and 31 March 2006 as reproduced in Annexure I to this circular ;
• the reporting accountants’ report of the historical financial information of Letseng Diamonds (Proprietary) Limited,as reproduced in Annexure III to this circular ;
• the independent reporting accountants’ report on the pro forma financial effects of the Letseng disposal and thepro forma balance sheet and income statement of JCI, as reproduced in Annexure IV to this circular ;
• commitments referred to in paragraph 2.4.6 and paragraph 3.10 above;
• the consent letters from the investment bank, sponsor, independent reporting accountants and corporate lawadvisers to the issue of this circular and references to their names, and in the case of the independent reportingaccountants, reference to their report, in the form and context in which they appear; and
• a copy of the most recent Letseng Competent Person’s Report.
By order of the board
D M NurekNon-executive chairman
11 September 2006
Registered office:28 Harrison StreetJohannesburg2001(PO Box 11165, Johannesburg, 2000)
23

ANNEXURE I
HISTORICAL FINANCIAL INFORMATION ON LETSENG
Letseng is a Lesotho registered company which holds the mining lease and operational assets of the Letseng mine locatedin the Letseng-la-Terai region of Lesotho. The Letseng mine is a diamond operation consisting of two kimberlite pipes,namely the Main Pipe and the Satellite Pipe, and a stockpile of previously mined lower grade diamondiferous ores.
Prior to March 2004, at which date large-scale mining operations commenced at Letseng, Letseng retained two alluvialgravel mining and processing companies to sample and mine on its behalf. Revenue and profits earned in the financial yearended 31 March 2004 are attributable to these alluvial mining operations. In April 2004, the kimberlite processing plant wascommissioned at the Letseng mine and large quality diamonds were regularly produced throughout the financial year ended31 March 2005. During the 2005 financial year, the kimberlite processing plant was modified, to bring the plant up to itsrated capacity of processing 2.4 million tons per annum. During the 2006 financial year, the plant operated at its full capacity,resulting in an increase in both revenue and profits earned.
The historical financial information contained in this report has been extracted from the audited annual financial statementsof Letseng for the three financial years ended 31 March 2006.
The directors of Letseng are solely responsible for the preparation of the historical financial information of Letseng and thefinancial statements and financial information from which this information has been compiled.
The directors of JCI are responsible that the historical financial information of Letseng have been accurately extracted andincluded in this annexure.
24

BALANCE SHEET AT 31 MARCH
2006 2005 2004Notes R’000 R’000 R’000
ASSETS
Non-current assets 205 865 212 839 194 121
Mining assets, property, plant and equipment 2 205 865 212 839 194 121
Current assets 81 044 93 589 18 240
Inventories 3 43 959 21 082 –Accounts receivable 14 291 14 119 10 795Taxation – 67 –Cash and cash equivalents 22 794 58 321 7 445
Total assets 286 909 306 428 212 361
EQUITY AND LIABILITIES
Shareholders’ equity 145 828 62 375 45 082
Share capital 4 3 3 3Share premium 4 39 997 39 997 39 997Retained income 105 828 22 375 5 082
Non-current liabilities 78 714 41 101 8 009
Provisions and accruals 7 16 647 14 637 –Deferred taxation 6 62 067 26 464 8 009
Current liabilities 62 367 202 952 159 270
Trade and other payables 26 356 36 903 15 885Provisions and accruals 7 4 674 600 –Loan 5 20 207 165 449 143 385Taxation 6 11 130 – –
Total equity and liabilities 286 909 306 428 212 361
NAV per share (cents) 4 860 923 2 079 151 1 502 733Tangible NAV per share (cents) 4 860 923 2 079 151 1 502 733Number of shares in issue 3 000 3 000 3 000
25

INCOME STATEMENT FOR THE YEAR ENDED 31 MARCH
2006 2005 2004Notes R’000 R’000 R’000
Revenue
Diamond sales 401 679 279 451 37 394Other income 2 195 2 090 386
Revenue 403 874 281 541 37 780Operating expenses 8 263 534 224 488 16 542
Operating profit 140 340 57 053 21 238Interest received 2 138 1 926 386Finance costs 11 887 23 232 8 589
Profit before taxation 130 591 35 747 13 035Taxation 9 47 138 18 455 7 990
Profit after taxation 83 453 17 292 5 045
Earnings per share (cents) 2 781 772 576 418 168 192Diluted earnings per share (cents) 2 781 772 576 418 168 192Headline earnings per share (cents) 2 781 772 576 418 168 192Dividends per share (cents) – – –Weighted average number of shares in issue 3 000 3 000 3 000
STATEMENT OF CHANGES IN EQUITY FOR THE YEAR ENDED 31 MARCH
Share Share Retainedcapital premium income TotalR’000 R’000 R’000 R’000
Balance at 31 March 2003 3 – 36 39Share premium issued – 39 997 – 39 997Profit for year – – 5 046 5 046
Balance at 31 March 2004 3 39 997 5 082 45 082Net income for year – – 17 293 17 293
Balance at 31 March 2005 3 39 997 22 375 62 375Net income for year – – 83 453 83 453
Balance at 31 March 2006 3 39 997 105 828 145 828
26

CASH FLOW STATEMENT FOR THE YEAR ENDED 31 MARCH
2006 2005 2004Notes R’000 R’000 R’000
Cash flow from operating activities 130 926 77 023 11 590
Cash generated by operations 10 164 861 80 477 13 035Changes in working capital 11 (33 596) (3 388) (1445)Taxation paid (339) (66) –
Cash flow from investing activities (21 211) (48 211) (154 839)
Additions to fixed assets (21 211) (48 211) (154 839)
Cash flows from financing activities (145 242) 22 064 147 653
Proceeds from share premium – – 39 997(Decrease)/Increase in loan (145 242) 22 064 107 656
Net cash flow from all activities (35 527) 50 876 4 404Cash and cash equivalents at beginning of year 58 321 7 445 3 041
Cash and cash flow equivalents at end of year 22 794 58 321 7 445
NOTES TO THE FINANCIAL STATEMENTS
1. ACCOUNTING POLICIES
1.1 Statement of compliance
The financial statements for the three financial years ended 31 March 2006 are consistent with IFRS as adoptedby the International Accounting Standards Board.
1.2 Basis of preparation
The financial statements are prepared using the historic cost convention, and on the going concern basis. Unlessotherwise stated, the accounting policies used are consistent with those applied in the previous year. Certainprior year figures, as set out in more detail in Note 15 below, have been restated to give effect to adjustments,including those required for IFRS compliance.
1.3 Mining assets, property, plant and equipment
All such assets are initially recognised at cost, and are depreciated on the straight-line basis at annual rates whichwill reduce their book values to estimated residual values over their anticipated useful lives or, in the case of non-tangible assets, over the remaining period of the mining lease, except for the preproduction costs, which aredepreciated over the same period as the life of the related asset (i.e. the kimberlite processing plant).The annualrates used are as follows:
Plant and equipment 10% – 33%
Leasehold improvements 20%
Preproduction costs 10%
Exploration costs 5.26%
Decommissioning costs 4.76%
Borrowing costs that are directly attributable to the construction of a qualifying asset are capitalised as part ofthe cost of that asset until such time as the asset is ready for its intended use.
1.4 Inventories
Diamond inventories are valued at the lower of production cost (calculated as average production cost per caratfor the relevant year) and net realisable value.
Consumable stores are valued at average cost, less obsolescence provisions, where appropriate.
27

1.5 Environmental rehabilitation
Long-term environmental obligations, comprising decommissioning and restoration costs, are based on thecompany’s interpretation of current environmental and regulatory requirements. Decommissioning costs arecapitalised at the present value of the anticipated expenditure to settle the obligation. The unwinding of thedecommissioning obligation is included in the income statement as a finance cost. Restoration costs are accruedat a fixed rate per production tonne of kimberlite.
1.6 Accounts receivable
Accounts receivable are recognised at fair value and, subsequently, at amortised cost.
1.7 Deferred taxation
Deferred taxation is provided in full, using the liability method, on temporary differences arising between taxbases of assets and liabilities and their carrying amounts in the financial statements. The current enactedcorporate tax rate is used in the determination of deferred income tax.
1.8 Leave pay and severance provision
The expected cost of accrued leave and severance awards is recognised as an expense as the employees renderservice that increase their entitlement or, in the case of non-accumulating leave, when the absence occurs.Accrued leave is measured as the amount that the company expects to pay as a result of unused entitlementthat has accumulated to the employee at the balance sheet date.
1.9 Operating lease
Operating lease payments are recognised as an expense on a straight-line basis over the lease term.
1.10 Revenue
Revenue comprises the invoiced value for the sale of diamonds, translated into Rand at the date of the salestransaction. Differences between these values and amounts subsequently received in Rand due to changes inrelevant exchange rates are treated as foreign exchange losses or gains, as appropriate.
28

2. MINING ASSETS, PROPERTY, PLANT AND EQUIPMENT
Preproduction,decommissioning
Plant and Leasehold and explorationequipment improvements costs Totals
R’000 R’000 R’000 R’000
Book value at 31 March 2003 9 613 8 684 20 985 39 282
Cost 9 613 8 684 20 985 39 282Accumulated depreciation – – – –
Additions 124 926 – 29 913 154 839Depreciation – – – –
Book value at 31 March 2004 134 539 8 684 50 898 194 121
Cost 134 539 8 684 50 898 194 121Accumulated depreciation – – – –
Additions 5 738 21 516 20 957 48 211Depreciation (15 211) (7 808) (6 474) (29 493)
Book value at 31 March 2005 125 066 22 392 65 381 212 839
Cost 140 277 30 200 71 855 242 332Accumulated depreciation (15 211) (7 808) (6 474) (29 493)
Additions 10 352 3 593 7 266 21 211Depreciation (16 083) (5 484) (6 618) (28 185)
Book value at 31 March 2006 119 335 20 501 66 029 205 865
Cost 150 629 33 793 79 121 263 543Accumulated depreciation (31 294) (13 292) (13 092) (57 678)
2006 2005 2004R’000 R’000 R’000
2.1 Capital commitments
Mining and plant costs committed, but not expended 13 636 3 169 197 226
3. INVENTORIES
Diamonds produced, but not yet sold 33 004 17 545 –Consumable stores 10 955 3 537 –
43 959 21 082 –
4. SHARE CAPITAL
Authorised and issued shares3 000 ordinary shares of M1 each 3 3 3
Share premium
Premium of R13 332.33 on each share 39 997 39 997 39 997
29

2006 2005 2004R’000 R’000 R’000
5. LOAN
Letseng Holdings
Balance at beginning of year 165 449 143 385 34 692Interest charges 10 842 23 070 8 589Additional advances – 20 214 140 101Transfer to share premium – – (39 997)Repayments (156 084) (21 220) –
20 207 165 449 143 385
The loan is secured by a notarial bond registered in favour of the IDC, bears interest at prime plus 1% and has no fixed terms of repayment.The loan arose as Letseng required finance to purchase mining and other plant and equipment,including the kimberlite processing plant and related site infrastructure for the Letseng mine.
6. TAXATION – BALANCE SHEET
Lesotho income tax:– current 11 130 (67) –– deferred 62 067 26 464 8 009
73 197 26 397 8 009
7. PROVISIONS AND ACCRUALS
Provision for environmental rehabilitation 16 647 14 637 –Provision for leave and severance pay 4 674 600 –
21 321 15 237 –
8. OPERATING EXPENSES
Operating expenses (2004: pre-production costs) include the following:
Auditors’ remuneration 372 256 225Depreciation 28 185 29 493 –Diamond sales tax 27 940 19 645 2 618Directors’ remuneration 2 144 1 889 1 556Finance costs 11 887 23 232 8 589Foreign exchange losses 6 979 2 137 –Operating lease rentals 9 638 16 714 3 556Salaries and wages 12 843 10 856 5 138
Directors’ Total Total Totalfees Salary 2006 2005 2004
R’000 R’000 R’000 R’000 R’000
T K Whitelock – 1 501 1 501 1 341 1 158P W Kolobe – 599 599 536 395B Sekonyela 24 – – 6 3M D Guni 20 – – 6 –
44 2 100 2 144 1 889 1 556
30

2006 2005 2004R’000 R’000 R’000
9. TAXATION – INCOME STATEMENT
Lesotho income tax– current 11 535 – (19)– deferred 35 603 18 455 8 009
47 138 18 455 7 990
Reconciliation of income tax rate: % % %
Statutory tax rate 35 35 35Effect of permanent differences:– disallowable expenses 1.1 16.6 26.3
Effective tax rate 36.1 51.6 61.3
10. CASH GENERATED BY OPERATIONS R’000 R’000 R’000
Net income before taxation 130 591 35 747 13 035Adjustments for :– depreciation 28 185 29 493 –– provisions 6 085 15 237 –
164 861 80 477 13 035
11. CHANGES IN WORKING CAPITAL
Increase in inventories (22 877) (21 082) –Increase in accounts receivable (172) (3 324) (10 563)(Decrease)/Increase in accounts payable (10 547) 21 018 9 118
(33 596) (3 388) (1 445)
12. RELATED PARTY TRANSACTIONS
Rent paid to JCI – 108 100Management fees paid to JCI 7 260 13 200 542
13. CONTINGENT LIABILITIES
Contingent liabilities – – –
14. EVENTS AFTER BALANCE SHEET DATE
The directors of Letseng are not aware of any matter or circumstance arising since 31 March 2006 that wouldsignificantly affect the operations of Letseng or the results of those operations.
31

2006 2005 2004R’000 R’000 R’000
15. RESTATEMENT OF COMPARATIVE INFORMATION
Income statementIncrease in operating expenses – 17 1451 –
Decrease in income before taxation – (17 145)1 –Consequent decrease in taxation charge – 6 001 –Re-allocation of taxation charge – 7 990 (7 990)
Decrease in net income for year – (3 154) (7 990)
Balance sheet
Increase in mining assets, property, plant and equipment – 3 793 –Decrease in accounts receivable – (6 301) –Decrease in retained income – 11 144 7 990Decrease/(Increase) in taxation liability – 6 001 (7 990)Increase in other liabilities and provisions – (14 637) –
Effect on net assets/liabilities – – –
Note 1:Additional depreciation as a result of first-time adoption of IFRS in 2006 (resulting from annual review of Letseng’s useful lives of assets, depreciation methods and residual values) – 5 545 –
Doubtful debt provision (increase in the doubtful debt provision for a VAT claim which is not considered to be recoverable) – 6 301 –
Correction of overstated preproduction costs (write-off of legal fees relating to the IDC loan, which were previously capitalised) – 3 617 –
Rehabilitation costs (rehabilitation policy was only put in place during the 2006 financial year and the provision required for the 2005 financial year was adjusted for retrospectively) – 1 682 –
– 17 145 –
16. FINANCIAL RISK MANAGEMENT
The company’s activities lead to exposure to various financial risks, which are summarised below:
Foreign exchange risk
Foreign exchange transactions are translated at the rate ruling at the date of the transaction.At the balance sheet date,monetary items are translated at rates then ruling. Exchange differences occurring on the settlement of monetaryitems, or on the reporting of outstanding monetary items, are accounted for as foreign exchange gains or losses.
Interest rate risk
Letseng has no significant interest bearing assets.The long-term borrowings are subject to variable interest rates.Thevariable rate of interest for the loan from Letseng Holdings is capped at prime plus 1%.
Credit risk
Letseng has no significant concentration of credit risks. Letseng has policies in place to ensure that sales of productsare through agents with an appropriate credit history.
Liquidity risk
Letseng has no significant liquidity risks from a trading point of view. Letseng has substantial borrowings from LetsengHoldings but, at the latest reported balance sheet date, was no longer dependent upon its continued support in thisregard.
32

ANNEXURE II
PRO FORMA BALANCE SHEET AND INCOME STATEMENT OF JCI
The unaudited pro forma consolidated income statement and balance sheet of JCI before and after the Letseng disposalare set out below. The unaudited pro forma income statement and balance sheet have been presented for illustrativepurposes only and because of their nature may not give a fair reflection of JCI’s results, financial position and changes inequity after the Letseng disposal. It has been assumed for purposes of the pro forma financial information that the Letsengdisposal took place with effect from 1 April 2005 for income statement purposes and 30 September 2005 for balance sheetpurposes.The directors of JCI are responsible for the preparation of the unaudited pro forma income statement and balancesheet.
The unaudited pro forma consolidated income statement and balance sheet of JCI do not include any adjustments withregards to the following subsequent events:
• the acquisition by Matodzi of 200 million cumulative redeemable preference shares owned by JCI in Witnigel; and
• the redemption by Matodzi of 200 million unsecured redeemable convertible participating B preference shares ownedby JCIIF, a wholly-owned subsidiary of JCI, on 29 March 2006.
As a consequence of the above, JCI through JCIIF, has become the majority shareholder in Matodzi and accordingly, hasincreased its effective holding in Letseng from 30.4% to an effective 52.7%. JCI shareholders are referred to the pro formafinancial information contained in paragraph 4 of the Matodzi circular to be issued on or about 14 September 2006, as thiswill indirectly impact on JCI.
33

UNAUDITED PRO FORMA INCOME STATEMENT
After theLetsêng
Before1 disposalPublished Adjustments Pro forma
R R R
Revenue 40 216 – 40 216Cost of sales (14 723) – (14 723)
Gross profit 25 493 – 25 493Other operating income 881 – 881Operating costs (129 280) (46 376)2 (175 656)
Operating loss (102 906) (46 376) (149 282)Investment income 9 290 – 9 290Finance expense (54 485) 13 0043 (41 481)Share of associate earnings (11 799) 284 5084 272 709Impairment of investment in associate – (171 381)5 (171 381)
Net loss before tax (159 900) 79 755 (80 145)Tax 132 – 132
Net loss after tax (159 768) 79 755 (80 013)Minority share – – –
Loss attributable to ordinary shareholders (159 768) 79 755 (80 013)
Loss per share (cents) (7.74) (3.88)Headline (loss)/earnings per share (cents) (5.90) 6.64Weighted average number of shares 2 063 635 198 2 063 635 198
Notes:
1. The “Before” financial information has been based on the income statement included in the JCI unaudited and unreviewed results for the six monthsended 30 September 2005, as released on SENS on Friday, 7 April 2006 and published in the press on Monday, 10 April 2006.
2. Operating costs has been adjusted to include the Investec profit share of R38.0 million and the estimated transaction costs of R8.3 million. Theseadjustments will not have a continuing effect on JCI.
3. Finance expense has been adjusted to exclude R13 million of interest paid in respect of interest bearing liabilities as JCI will utilise the cash receivednet of transaction costs to settle a portion of the interest bearing liabilities.
4. Share of associate income has been adjusted to include JCI’s share of Letseng Holding’s profit on the disposal of Letseng of R298.2 million, calculatedat 30 September 2005 (this adjustment will not have a continuing effect on JCI) and to exclude the equity accounted income relating to LetsengHoldings for the six months ended 30 September 2006 of R13.7 million.
5. Impairment of investment in associate has been adjusted to include the impairment of JCI’s investment in Letseng Holdings of R171.4 million (theimpairment calculated for income statement purposes is based on the opening balance of the investment in associate at 1 April 2005).This adjustmentwill not have a continuing effect on JCI.
34

UNAUDITED PRO FORMA BALANCE SHEET
After theBefore1 rights offer
Published Adjustments Pro formaR R R
ASSETS
Non-current assets 1 494 378 (180 313) 1 314 065
Property, plant and equipment 22 119 – 22 119Investments 881 103 (180 313)2 700 790Loans 590 985 – 590 985Deferred tax 171 – 171
Current assets 546 251 – 546 251
Inventories 68 322 – 68 322Investment properties 117 523 – 117 523Developed properties 67 188 – 67 188Trade and other receivables 65 017 – 65 017Short-term loans 112 021 – 112 021Tax advance 16 – 16Cash and cash equivalents 116 164 –3 116 164
Total assets 2 040 629 (180 313) 1 860 316
EQUITY AND LIABILITIES
Capital and reserves (318 523) 67 384 (251 139)
Share capital 22 185 – 22 185Share premium 1 746 650 – 1 746 650Non-distributable reserves 205 137 – 205 137Foreign translation reserve (58 839) – (58 839)Accumulated losses (2 179 169) 67 3844 (2 111 785)Treasury shares (54 487) – (54 487)
Minorities 681 – 681
Non-current liabilities 1 448 591 (247 697) 1 200 894
Interest bearing borrowings 559 418 (247 697)5 311 721Non-interest bearing borrowings 884 506 – 884 506Deferred tax 4 667 – 4 667
Current liabilities 909 880 – 909 880
Trade and other payables 291 685 – 291 685Taxation 35 499 – 35 499Short-term borrowings 582 683 – 582 683Bank overdraft 13 – 13
Total equity and liabilities 2 040 629 (180 313) 1 860 316
Net asset value per share (cents) (15.12) (11.92)Net tangible asset value per share (cents) (15.12) (11.92)Number of shares in issue 2 106 476 728 2 106 476 728
Notes:
1. The “Before” financial information has been based on the balance sheet included in the JCI unaudited and unreviewed results for the six months ended30 September 2005, as released on SENS on Friday, 7 April 2006 and published in the press on Monday, 10 April 2006.
2. Investments has been adjusted for JCI’s share of Letseng Holding’s profit on the disposal of Letseng of R298.2 million, the receipt of the dividend fromLetseng Holdings of R294.1 million and the impairment of JCI’s investment in Letseng Holdings of R184.4 million (the impairment calculated for balancesheet purposes is based on the closing balance of the investment in associate at 30 September 2005). Following these adjustments the carrying valueof JCI’s investment in Letseng Holdings following the disposal of Letseng is reduced to R3.3 million.
35

3. Cash and cash equivalents has been adjusted to reflect the receipt of the dividend from Letseng Holdings of R294.1 million less the payment of theestimated transaction costs of R8.3 million and the settlement of a portion of the interest bearing liabilities.
4. Accumulated losses has been adjusted for JCI’s share of Letseng Holding’s profit on the disposal of Letseng of R298.2 million calculated at 30 September 2005, the impairment of JCI’s investment in Letseng Holdings of R184.4 million, the payment of the estimated transaction costs of R8.3 million and the provision for the Investec profit share amounting to R38.0 million.
5. Interest bearing liabilities has been adjusted to reflect the settlement of a portion of the interest bearing liabilities out of the proceeds less theestimated transaction costs of R285.7 million and the provision for the Investec profit share of R38.0 million.
36

ANNEXURE III
REPORT OF THE INDEPENDENT REPORTING ACCOUNTANTS ON THEHISTORICAL FINANCIAL INFORMATION OF LETSENG
“The DirectorsJCI Limited28 Harrison StreetJohannesburg, 2001
6 September 2006
Dear Sirs
INDEPENDENT REPORTING ACCOUNTANTS’ REPORT ON THE HISTORICAL FINANCIALINFORMATION OF LETSENG DIAMONDS (PROPRIETARY) LIMITED (“LETSENG”)
1. INTRODUCTION
It is proposed that Gem Diamond Mining Company of Africa Limited will acquire Letseng Investment Holdings (SouthAfrica) (Proprietary) Limited’s (“Letseng Holdings) entire 76% equity interest in Letseng (incorporated in the Kingdomof Lesotho). Letseng Holdings is a 40%-owned associate of JCI Limited (“JCI”).
We have audited the historical financial information of Letseng relating to the year ended 31 March 2006 and reviewedthe historical financial information of Letseng relating to the years ended 31 March 2004 and 2005, as set out in thereport of historical financial information attached as Annexure I to the circular to JCI shareholders, dated on or about14 September 2006 (“the circular”). The financial statements of the company at 31 March 2004 and 31 March 2005 were audited by another auditor whose reports, dated 26 August 2004 and 25 July 2005, respectively,expressed unqualified opinions on those statements.
2. PURPOSE OF THIS REPORT
At your request, we present our report on the historical financial information of Letseng as set out in Annexure I tothe circular, for the purposes of complying with the JSE Limited Listings Requirements and for inclusion in the circular.Terms defined in the circular have, unless the context requires otherwise, the same meanings in this report as given tothem elsewhere in the circular.
3. RESPONSIBILITY
The directors of JCI are responsible for the compilation, content and preparation of the circular and for the accuracyof the information contained therein.The directors of JCI and the directors of Letseng are responsible for the financialinformation to which both this report and the report of historical financial information on Letseng relate and fromwhich such reports have been prepared.
Our responsibility is to express an opinion on the report of historical financial information of Letseng.
4. SCOPE OF THE AUDIT
We conducted our audit in accordance with International Standards on Auditing.These standards require that we planand perform our audit to obtain reasonable assurance that the historical financial information relating to the financialyear ended 31 March 2006 is free of material mis-statement.
An audit includes:
• examining, on a test basis, evidence supporting the amounts and disclosures of the historical financial information;
• assessing the accounting principles and significant estimates made by management;
• evaluating the overall historical financial information presentation.
We believe that our audit work provides a reasonable basis for our opinion.
37

5. SCOPE OF THE REVIEW
We conducted our review in accordance with International Standards on Review Engagements. These standardsrequire that we plan and perform our review to obtain moderate assurance that the historical financial informationrelating to the years ended 31 March 2004 and 2005 is free of material mis-statement. A review is limited primarily toenquiries of company personnel and analytical procedures applied to financial data, and hence provides less assurancethan an audit.We have not performed an audit and, accordingly, we do not express an audit opinion.
6. QUALIFICATION
The company has not retained sufficient documentation of additions to mining assets, property, plant and equipmentamounting to R8 102 479 and R6 207 192 in the 2003 and 2004 financial years, respectively. We were unable toperform alternative auditing procedures regarding these additions. Consequently, we did not obtain all the informationand explanations we considered necessary to satisfy ourselves as to the valuation and presentation of certain miningassets, property, plant and equipment.
7. QUALIFIED AUDIT AND REVIEW OPINIONS
In our opinion, except for the possible effects on the financial statements of the matter referred to in the precedingparagraph, the historical financial information of Letseng, for the purposes of the circular, fairly presents, in all materialrespects, the financial position of Letseng as at 31 March 2006, and the results of its operations and cash flows for theyear then ended in accordance with International Financial Reporting Standards and in the manner required by theCompanies Act.
Based on our review, except for the possible effects on the financial statements of the matter referred to in thepreceding paragraph, nothing has come to our attention that causes us to believe that the historical financialinformation of Letseng for the years ended 31 March 2004 and 2005 is not fairly presented, in all material respects, inaccordance with International Financial Reporting Standards and in the manner required by the Companies Act.
8. CONSENT
We hereby consent to the inclusion of this letter, and references thereto, in the circular in the form and context inwhich they appear. Furthermore, we confirm that we have not withdrawn that consent prior to the issue of the circular.
Yours faithfully
MOORES ROWLANDRegistered AuditorsChartered Accountants (SA)
Partner: Duncan S Dollman”
38

ANNEXURE IV
REPORT OF THE INDEPENDENT REPORTING ACCOUNTANTS ON THE PRO FORMA FINANCIAL EFFECTS OF THE LETSENG DISPOSAL AND THE PRO FORMA BALANCE SHEET AND INCOME STATEMENT OF JCI
“The DirectorsJCI Limited28 Harrison StreetJohannesburg2001
11 September 2006
Dear Sirs
INDEPENDENT REPORTING ACCOUNTANTS’ LIMITED ASSURANCE REPORT ON THEUNAUDITED PRO FORMA FINANCIAL EFFECTS, INCOME STATEMENT AND BALANCE SHEET
Introduction
We have performed our limited assurance engagement with regard to the unaudited pro forma financial effects, incomestatement and balance sheet (collectively, “the pro forma financial information”) of JCI Limited (“JCI”) set out inparagraph 5.2 and Annexure II to the circular, to be dated on or about 14 September 2006, issued in connection with theproposed disposal by Letseng Investment Holdings (South Africa) Limited (“Letseng Holdings”) of its 76% equity interestin Letseng Diamonds (Proprietary) Limited (“Letseng Diamonds”) (“circular”).
The pro forma financial information has been prepared for purposes of complying with the requirements of the JSE Limited(“JSE”), for illustrative purposes only, to provide information about how the proposed disposal by Letseng Holdings of its76% equity interest in Letseng Diamonds (“proposed transaction”) might have affected the reported financial informationhad the proposed transaction been undertaken on 1 April 2005 for income statement purposes and on 30 September2005 for balance sheet purposes.
Because of its nature, the pro forma financial information may not present a fair reflection of the financial position, changesin equity, results of operations or cash flows of JCI, after the proposed transaction.
Responsibilities
The directors of JCI are solely responsible for the compilation, contents and presentation of the pro forma financialinformation contained in the circular and for the financial information from which it has been prepared.
Their responsibility includes determining that the pro forma financial information contained in the circular has been properlycompiled on the basis stated, the basis is consistent with the accounting policies of JCI and the pro forma adjustments areappropriate for the purposes of the pro forma financial information as disclosed in terms of the JSE Listings Requirements.
Reporting accountants’ responsibility
Our responsibility is to express a limited assurance conclusion on the pro forma financial information included in the circular.We conducted our limited assurance engagement in accordance with the International Standard on AssuranceEngagements applicable to Assurance Engagements Other Than Audits or Reviews of Historical Financial information and theRevised Guide on Pro Forma Financial Information issued by The South African Institute of Chartered Accountants.
This standard requires us to obtain sufficient appropriate evidence on which to base our conclusion.
We do not accept any responsibility for any reports previously given by us on any financial information used in thecompilation of the pro forma financial information, beyond that owed to those to whom those reports were addressed byus at the dates of their issue.
39

Sources of information and work performed
Our procedures consisted primarily of comparing the unadjusted unaudited and unreviewed historical financial informationof JCI for the six months ended 30 September 2005 and the adjusted, audited historical financial information of LetsengHoldings and Letseng Diamonds for the year ended 31 March 2006 with the source documents, considering the pro formaadjustments in light of the accounting policies of JCI, considering the evidence supporting the pro forma adjustments,recalculating the amounts based on the information obtained and discussing the pro forma financial information with thedirectors of JCI.
In arriving at our conclusion, we have relied upon financial information prepared by the directors of JCI, Letseng Holdingsand Letseng Diamonds.
Whilst our work performed involved an analysis of the historical unaudited and unreviewed financial information and otherinformation provided to us, our limited assurance engagement does not constitute either an audit or review of any of theunderlying financial information undertaken in accordance with the International Standards on Auditing or the InternationalStandards on Review Engagements and accordingly, we do not express an audit or review opinion.
In a limited assurance engagement the evidence-gathering procedures are more limited than for a reasonable assuranceengagement and therefore less assurance is obtained than in a reasonable assurance engagement. We believe that ourevidence obtained is sufficient and appropriate to provide a basis for our conclusion.
Conclusion on the pro forma adjustments
Based on our examination of the evidence obtained, nothing has come to our attention that causes us to believe that, interms of Sections 8.17 and 8.30 of the JSE Listings Requirements, the pro forma adjustments:• have not been properly compiled on the basis stated;• such basis is inconsistent with the accounting policies of JCI;• are not appropriate for the purposes of the pro forma financial information as disclosed pursuant to Section 8.30 of the
JSE Listings Requirements.
Basis for disclaimer of conclusion on “After the Letseng disposal” column
The published provisional unaudited and unreviewed results of JCI for the six months ended 30 September 2005 statedthat the board of directors of JCI disclaimed any liability in respect of the accuracy, correctness and/or completeness of theinformation reflected in the provisional financial results. It was further stated that there may be material events andcircumstances of which the board of directors were not aware at the time of publication of the provisional financial results,which may have a material effect on JCI and which may affect the accuracy and completeness of the information reflectedin the provisional financial results and/or may have the effect that the provisional financial results do not reflect a true andcomplete account of the financial and other affairs of JCI.
Disclaimer of conclusion on“After the Letseng disposal” column
Because of the significance of the matter discussed in the preceding paragraph and its possible effect on the “After theLetseng disposal” column, we are unable to, and do not, express an opinion on the “After the Letseng disposal” columnincluded in the circular.
Yours faithfully
KPMG Inc.
Per Mickey BoveChartered Accountant (SA)Registered Auditor
Director
KPMG Crescent85 Empire RoadParktownJohannesburg”
40

41
ANNEXURE V
COMPETENT PERSON’S REPORT
COMPETENT PERSON’S REPORTON
LETSENG DIAMONDS (PTY) LIMITED
(“LETSENG DIAMONDS”)
FOR THEPROPOSED DISPOSAL
OF
76% OF AND ASSOCIATED SHAREHOLDER CLAIMS INLETSENG DIAMONDS
BY
LETSENG INVESTMENT HOLDINGS SOUTH AFRICA (PTY) LIMITED
(“LETSENG HOLDINGS”)

42
COMPETENT PERSON’S REPORTON
LETSENG DIAMONDS (PTY) LIMITED(“LETSENG DIAMONDS”)
FOR THEPROPOSED DISPOSAL
OF76 % OF AND ASSOCIATED SHAREHOLDER CLAIMS IN
LETSENG DIAMONDSBY
LETSENG INVESTMENT HOLDINGS SOUTH AFRICA (PTY) LIMITED(“LETSENG HOLDINGS”)
The DirectorsLetseng Investment Holdings South Africa (Pty) LimitedPO Box 11165Johannesburg2000
The DirectorsMatodzi Resources LimitedPO Box 6966Johannesburg2000
The DirectorsJCI LimitedPO Box 11165Johannesburg 2000
Dear Sirs
EXECUTIVE SUMMARY
Letseng Diamonds is a Lesotho registered company which holds the mining rights and operational assetsof the Letseng Diamond Mine (“Letseng”) located in the mountains of Lesotho. Letseng Diamonds isowned by Letseng Holdings (76%) and the government of the Kingdom of Lesotho (“LesothoGovernment”) (24%). Letseng Holdings’ shareholders are disposing of their 76% shareholding in LetsengDiamonds. Post the disposal Gem Diamond Mining Company of Africa Ltd (“GEM”) will hold 70% ofLetseng, while the government’s share will increase to 30%.
Letseng consists of two kimberlite pipes and a stockpile of previously mined lower grade Main Pipediamondiferous ores. The mine, previously operated by De Beers until 1982, re-commenced productionin March 2004 and is currently producing at a rate of approximately 200,000 tonnes per month (“tpm”).Since re-commissioning, and until the end of March 2006, the mine has produced a total of 78,944 carats(“cts”) from 4,088,087 tonnes (“t”) of ore sourced predominately from the Satellite Pipe and to a lesserextent from the stockpile. A small amount of ore has been mined and treated from the Main Pipe.Letseng treats ore through a 350 tonnes per hour (“tph”) Dense Medium Separation (“DMS”) processingplant. Letseng was historically renowned for the production of large stones, the most famous of whichwas the Lesotho Brown measuring 601cts discovered in the mid 1960’s. Recent production has confirmedthis propensity for large stones by extracting 96 stones larger than 20cts each. Of these stones, eightweighed more than 100cts each and the largest stone was 186cts. Recent production has also confirmedthe regular production of very high quality stones.

43
As a mine, Letseng has successfully outsourced the majority of the operational functions and an effectivemanagement structure ensures optimal control of the operation and the contractors. Management plansto expand the operation (“the Expansion”) by increasing the production from 200,000tpm to 400,000tpmand constructing another DMS plant to treat the additional ore.Venmyn was requested to independently assess the technical merits of Letseng, prepare a diamondresource and reserve statement and complete a techno-economic valuation of Letseng Diamonds. All this was undertaken and presented in the form of a Competent Persons Report (“CPR”), as required bythe JSE Limited (“JSE”). In the execution of the mandate, Venmyn also considered the strategic meritsof the operation and defined the valuation outcomes on an open and transparent basis. Venmyn has duediligenced the current mining operation and valued it based upon the existing mine plan to extract the Probable Diamond Reserves. Venmyn further considered the Expansion, which is currently in a pre-feasibility stage of development, and which is aimed at deepening the existing pits on the Main andSatellite Pipes to exploit the currently defined Indicated and Inferred Diamond Resources. Ourvaluation states, separately, the value of Letseng Diamonds based upon the mining of the IndicatedResources only and the mining of the Indicated and Inferred Resources, as required by the JSE ListingsRequirements.
The key aspects which are relevant to the mine and the Expansion include the following:
• Letseng is unique in that it comprises kimberlite deposits that exhibit characteristics that aresimilar to alluvial deposits, namely low diamond grade and very high diamond value;
• recent results have confirmed the previously held opinions that the majority of the value of theproduction comes from only a small fraction of the stones;
• the presence of large (+10.8ct) stones in the various kimberlite sources has been confirmed by recentproduction;
• the potential to produce diamonds with very high US$/ct values has been confirmed by the recentsales data in today’s market. These very high prices are achieved primarily as a result of the qualityof the stones and, to a lesser extent, as a function of size;
• a recent geostatistical analysis has enabled separate diamond prices to be predicted for the Satelliteand Main Pipes. The availability of data on the Main Pipe is limited and as a result the predictedprice may vary in the future. However, confidence in the estimated price pertaining to the SatellitePipe is high as it is based upon a significant amount of recent production and sales data;
• according to the Mining Lease Agreement between Letseng and the Lesotho government, the minemust expand the plant capacity to 500tph by September 2008;
• the required staffing ratio, of Lesotho nationals to expatriates, as defined in the Mining LeaseAgreement, must be met;
• the exploration drilling programme on both pipes has been completed. The results have confirmedthe existence of kimberlite at depth and the respective extent and geometry of the various kimberlitefacies within the Main Pipe and the basalt raft within the Satellite Pipe;
• the Expansion has been justified by the available diamond resources identified in the drillingprogramme. The design and detailed costing of the new plant has been prepared by BatemanMinerals & Metals (Pty) Ltd (“Bateman”). Further studies currently underway pertaining to theexpansion include:• identification and evaluation of future waste disposal sites;• completion of an amended Environmental Management Programme Report (“EMPR”) for
submission to the Lesotho government; and• detailed assessment of the Expansion’s influence on the current water balance.
• the environmental disturbance created as a result of the alluvial contractors’ activities must berehabilitated and prevention mechanisms implemented to ensure that no further damage to theenvironment occurs. According to the agreements with the alluvial contractors, Letseng Diamonds isresponsible for the rehabilitation of their mining operations and tailings disposal sites;
• a detailed assessment should be undertaken to further quantify the scheduled and non-scheduledmine closure environmental rehabilitation liabilities, including those associated with the plannedExpansion;
• a fund should be set up to manage the ongoing environmental liability contributions;• measurement of the critical input variables to the water balance will be necessary;• the diamond market outlook for Letseng is positive as there are no known potential mines scheduled
to come into production in the medium term which would produce similar stones in competition withLetseng, i.e. 5cts and larger and, in particular, stones of 10.8cts upwards of top colour and topquality;

44
• global jewellery demand is expected to rise in excess of 5% per annum for the next five years andglobal diamond production is predicted to remain constant over the same period leading to a deficitin supply; and
• prices for both rough and polished diamonds are expected to rise at an average annual rate in excessof 5% and superior quality jewellery with Letseng-type stones is expected to perform particularlywell.
In order to arrive at a techno-economic valuation of Letseng Diamonds’ mineral assets, althoughoperations on the Main Pipe have yet to be re-commissioned, Venmyn defined the operation as a MiningProperty from which future economic benefits are likely to accrue as a result of the established corporatestructures.
Recent operations have proved the Letseng resource to be economically viable under prevailing economicconditions. Venmyn has therefore applied a discounted cash flow (“DCF”) valuation methodologyapproach which, in our opinion, yields the most accurate results by capturing the pertinent aspects ofthe business’s investment case.
In order to demonstrate the value variance resulting from the inclusion of Inferred Diamond Resourcesinto the Letseng life-of-mine (“LOM”) plan, two valuation cases for the 5.16 million ton per annum(“Mtpa”) expansion operation were contemplated in this report. The first considered the depletion ofIndicated Diamond Resources only, and the second depleting both Indicated and Inferred Diamondresources to the base of the economic pit shells.
Both valuation cases were carried out for pre- and post transaction scenarios to further illustrate thevalue implications of the proposed changes to the Diamond Sales Tax (Royalty) and LesothoGovernment’s increased equity ownership in Letseng. The results of the valuations are summarisedbelow with respect to the scenarios described above:
BEFORE THE AFTER THETRANSACTION TRANSACTION
Indicated Indicated Indicated IndicatedResources and Inferred Resources and Inferred
Only Resources Only Resources
Discount Rate (Nominal) 15.6% 15.6% 15.6% 15.6%
Diamond Sales Tax (Royalty) 7.0% 8.0%
Letseng Holdings Attributable Ownership 76% 70%
Letseng Holdings Attributable Value (ZAR*) 606.2 994.0 536.9 882.9
Attributable Net Present Value (“NPV”) per reserve tonne (ZAR/t) 13.22 21.68 12.72 20.91
Attributable NPV per resource tonne (ZAR/t) 5.26 8.63 5.06 8.32
Attributable NPV per resource carat (ZAR/ct) 304.94 500.06 293.27 482.31
* ZAR = South African Rand
The values represent Venmyn’s valuations at a point in time having applied consistent valuationmethodologies across a range of scenarios. Venmyn is cognisant of the debate regarding the valuation ofinferred diamond resources using DCF methods and has therefore shown the full range of values thatwere calculated, but also ensured that this report fully describes each mineral asset. In accordance withthe SAMREC Guidelines, the substantial variance in the Letseng mineral asset value has been disclosedas it illustrates the effect of the inclusion of the Letseng Inferred Diamond Resources. This provides thepurchasers with a full and open disclosure of mineral asset information from which they can exercisetheir own judgement as to the merits of the Venmyn valuation.

45
COMPETENT PERSON’S REPORTON
LETSENG DIAMONDS (PTY) LIMITED(“LETSENG DIAMONDS”)
FOR THEPROPOSED DISPOSAL
OF76% OF AND ASSOCIATED SHAREHOLDER CLAIMS IN
LETSENG DIAMONDSBY
LETSENG INVESTMENT HOLDINGS SOUTH AFRICA(PTY) LIMITED
(“LETSENG HOLDINGS”)
EXECUTIVE SUMMARY
CONTENTS
Page
1. INTRODUCTION AND NATURE OF THE TRANSACTION 52
2. SCOPE OF THE OPINION 52
3. COMPETENT PERSONS’ DECLARATION 55
4. LESOTHO COUNTRY PROFILE 55
4.1 Political Climate 55
4.2 Economic Climate and Fiscal Regime 56
4.3 Mineral Policy 56
4.4 Diamond Industry 57
5. CORPORATE STRUCTURE 59
6. LEGAL TENURE AND AGREEMENTS 59
6.1 Mining Lease Agreement 59
6.2 Sale of Shares Agreement 62
6.3 Surface Rights 63
6.4 Environmental Impact Assessment License 63
6.5 Water License 64
6.6 Agreements with Contractors 646.6.1 Alluvial Ventures (Pty) Ltd 646.6.2 Matekane Mining Investment Company (Pty) Ltd 646.6.3 Quarry Cats Lesotho (Pty) Ltd 666.6.4 Minopex (Lesotho) (Pty) Ltd 666.6.5 Securicor Gray (Lesoth Ltd 666.6.6 Stallion Securities (Pty) Ltd 666.6.7 ESS Support Services Worldwide (Pty) Ltd 676.6.8 Naleli Clinic 67
6.7 Diamond Marketing Agreement 67

46
Page
7. GENERAL INFORMATION AND LOGISTICS 68
7.1 Location 68
7.2 Access 68
7.3 Topography and Drainage 68
7.4 Climate 68
7.5 Current Infrastructure and Requirements for the Expansion 69
7.5.1 Water 69
7.5.2 Water Balance 69
7.5.3 Power 72
7.5.4 Accommodation and Offices 72
7.5.5 Mining and Plant Equipment 72
7.5.6 Security 72
7.5.7 Roads 73
8. REGIONAL GEOLOGY 73
9. LOCAL GEOLOGY AND MINERALISATION 73
9.1 Main Pipe 74
9.2 Satellite Pipe 74
10. SAMPLING AND EVALUATION OF KIMBERLITE DEPOSITS 77
11. HISTORICAL EXPLORATION AND MINING 79
11.1 Historical Ownership and Activities 79
11.2 Historical Exploration, Bulk Sampling and Mining Results 80
11.2.1 RTZ Exploration 80
11.2.2 De Beers Exploration 81
11.2.3 De Beers Historical Mining and Further Exploration 81
12. CURRENT SAMPLING AND EXPLORATION 83
12.1 Diamond Drilling 83
12.2 Bulk Sampling of the Main Pipe 84
13. GEOLOGICAL MODELLING AND RESULTS 85
13.1 Modelling of the Stockpile 85
13.1.1 Calculated Volume 85
13.1.2 Estimated Grade 85
13.2 Modelling of the Main Pipe 87
13.2.1 Calculated Volume 89
13.2.2 Estimated Grade 89
13.3 Modelling of the Satellite Pipe 93
13.3.1 Calculated Volume 94
13.3.2 Estimated Grade 97

47
Page
14. DENSITY MEASUREMENTS 98
15. MINING 98
15.1 Current Mining Method and Equipment 98
15.2 Recent Production 99
15.3 Production Planning 99
15.4 Main Pipe 100
15.4.1 LOM Plan 100
15.5 Satellite Pipe 102
15.5.1 LOM Plan 104
15.6 Combined LOM Production Schedule 105
15.7 Pit Slope Stability 106
15.8 K1 Stockpile 106
16. PROCESSING 107
16.1 Description of Current Plant and Process 107
16.2 Description of New Plant for Expansion 111
16.2.1 Flowsheet Description 111
16.2.2 Testwork 111
16.3 Waste Disposal 113
17. DIAMOND PRODUCTION 115
17.1 Historical Diamond Production 115
17.2 Recent Diamond Production 116
18. CUMULATIVE SIZE FREQUENCY DISTRIBUTIONS BY PIPE 118
19. DIAMOND VALUATIONS 119
19.1 Historical Valuations 119
19.2 Recent Prices Received 120
19.3 Prices Used for Purposes of CPR Valuation 120
20. CLASSIFICATION OF MINERAL RESOURCES AND MINERAL RESERVES 123
20.1 Previous Diamond Resource and Reserve Statements 124
20.2 Diamond Resource Statement for 31st March 2006 124
20.2.1 Statement 124
20.2.2 Classification Reasoning 125
20.2.2.1 Main Pipe 125
20.2.2.2 Satellite Pipe 125
20.2.2.3 Stockpile 125
20.3 Diamond Resource Statement Variations Between 2005 and 2006 126
20.4 Diamond Reserve Statement for 31st March 2006 126
20.4.1 Statement 126

48
Page
21. ENVIRONMENTAL ISSUES AND IMPACT OF LETSENG ON THE ENVIRONMENT 127
21.1 Pre-Current Mining Environment 127
21.2 Conservation Area 127
21.3 Soil and Land Capability 127
21.4 Ecological Importance 12721.4.1 Fauna 12721.4.2 Flora 128
21.5 Water Pollution 12821.5.1 Surface Water 12821.5.2 Groundwater 129
21.6 Visual Impact 130
21.7 Noise Pollution 130
21.8 Air Pollution 130
21.9 Cultural and Archaeological Importance 130
21.10 Socio-Economic Impact 130
21.11 Key Environmental Issues 130
21.12 Environmental Liabilities 131
22. KEY PERSONNEL AND MANPOWER 131
22.1 Management Structure 131
22.2 Staff Organogram 134
23. CAPITAL COSTS 134
23.1 Expansion Capital Costs 134
24. OPERATING COSTS 134
24.1 Historical Operating Costs 134
24.2 Future Operating Costs 135
25. DIAMOND MARKET 136
25.1 Current and Forecast World Diamond Production 136
25.2 Current and Forecast Global Diamond Demand 137
25.3 Current and Forecast Diamond Prices 13825.3.1 Rough Prices Since January 2003 13825.3.2 Polished Prices Since January 2003 13925.3.3 Forecast Rough and Polished Prices to 2010 139
25.4 Diamond Market Outlook 139
26. VALUATION 140
26.1 Valuation Approach 141
26.2 DCF Valuation Rationale 141
26.3 Net Asset Value 143
26.4 Working Capital 144

49
Page
26.5 Economic Parameters 14426.5.1 Inflation 14426.5.2 Exchange Rate 14526.5.3 Revenue 14526.5.4 Taxation and Royalties 14526.5.5 Diamond Marketing Costs 146
26.6 Valuation Summary 146
26.7 Sensitivity Analyses 146
27. CONCLUSIONS 148

50
LIST OF FIGURES
Page
Figure 1: Locality Plan 53Figure 2: Corporate Structure Prior to Transaction 54Figure 3: Corporate Structure Post Transaction 60Figure 4: Regional Infrastructure and Topography 61Figure 5: Organogram of Contractors 65Figure 6: Mine Site Infrastructure and Aerial Photograph 70Figure 7: Water Balance for Current Operation 71Figure 8: Surface Plan of the Main Pipe Showing Geology in relation to Exploration 75Figure 9: Surface Plan of the Satellite Pipe Showing Geology in relation to Exploration 76Figure 10: Global Diamond Grades and Values 78Figure 11: Historical Mine Production by De Beers 82Figure 12: Modelling of Historical Sampling Results Using Surfer 88Figure 13: Cross Sections through the Geological Model of the Main Pipe 90Figure 14: Three Dimensional Models of Pipes 91Figure 15: Main Pipe Cross Section Showing Sampling, Mining Results and Resource Elevations 92Figure 16: Cross Sections through the Geological Model of the Satellite Pipe 95Figure 17: Satellite Pipe Cross Section Showing Sampling, Mining Results and Resource Elevations 96Figure 18: Recent Production Results by Source 99Figure 19: Main Pipe Pit Optimisation Shells 101Figure 20: Satellite Pipe Pit Optimisation Shells 103Figure 21: LOM Schedule Depleting Indicated Diamond Resources Only 105Figure 22: Expansion LOM Schedule Depleting Indicated & Inferred Diamond Resources 105Figure 23: Flowsheet and Mass Balance for Existing Plant 108Figure 24: Flowsheet for the Diamond Recovery Circuit 110Figure 25: Proposed Flowsheet for the New Plant 112Figure 26: Location of Waste Disposal Sites and Environmental Liabilities 114Figure 27: Historical De Beers Diamond Production 115Figure 28: Proportion of De Beers Diamond Production by Size (K6 and Satellite) 115Figure 29: Recent Diamond Production (Pre-Acid) 116Figure 30: Size Frequency Distributions by Carats for Recent Production 116Figure 31: Size Frequency Distributions by Revenue for Recent Production 117Figure 32: Proportion of Recent Diamond Production by Size 118Figure 33: Cumulative Size Frequency Distribution by Source 118Figure 34: Valuation of De Beers Parcels (K6 and Satellite) 119Figure 35: Valuation of Recent Parcels 120Figure 36: Price Structure Curve for Combined Satellite and Stockpile 122Figure 37: Management and Staff Organogram 133Figure 38: Letseng Operating Cost History 135Figure 39: World Diamond Production by Country for 2004 136Figure 40: Recent and Forecast Global Diamond Production 136Figure 41: Recent and Forecast Global Diamond Sales Value 138Figure 42: Recent and Forecast Diamond Price 138Figure 43: Mining Project Specific Risk Allocation 142Figure 44: Sensitivity to Average Stone Value and Base ZAR:US$ Exchange Rate 147Figure 45: Sensitivity to Average Stone Value and Average Recovered Grade 147Figure 46: Sensitivity to Nominal Discount Rate and Average Recovered Grade 147Figure 47: Sensitivity to Nominal Discount Rate and Average Stone Value 148

51
LIST OF TABLES
Page
Table 1: Types of Mineral Rights in Lesotho 58Table 2: Description of Facies Types within the Main Pipe 74Table 3: History of Letseng Diamond Mine 79Table 4: Historical Sampling and Mining Results 80Table 5: Borehole Results 83Table 6: Results of Bulk Sampling on Main Pipe (K1) 85Table 7: Estimation of Volume of the Stockpile 85Table 8: Estimation of Grade in the Stockpile 86Table 9: Estimation of Volume for the Main Pipe 89Table 10: Estimation of Grade for the Main Pipe 93Table 11: Estimation of Volume of the Satellite Pipe 97Table 12: Estimation of Grade in the Satellite Pipe 97Table 13: Density Measurements 98Table 14: Main Pipe Ultimate Pit Tonnage Contributions 100Table 15: Main Pipe Production Schedule Depleting Indicated Resources Only 100Table 16: Main Pipe Production Schedule Depleting Indicated and Inferred Resources 102Table 17: Satellite Pipe Economic Pit Tonnage Summary 102Table 18: Satellite Pipe Production Schedule Depleting Indicated Resource Only 104Table 19: Satellite Pipe Production Schedule depleting Indicated & Inferred Resource 104Table 20: Slope Stability Design Parameters 106Table 21: K1 Stockpile Depletion Schedule 106Table 22: Average Stone Prices Calculated Using Different Methods 123Table 23: Diamond Prices Used in Valuation 123Table 24: Actual versus Calculated Diamond Price Averages 123Table 25: Letseng Diamond Resource Statement at May 2002 124Table 26: Letseng Diamond Resource Statement at 30th September 2005 (Inclusive of Reserves) 124Table 27: Letseng Diamond Resource Statement at 31st March 2006 (Inclusive of Reserves) 125Table 28: Comparison of 2005 and 2006 Resource Statements 126Table 29: Letseng Diamond Reserve Statement at 31st March 2006 126Table 30: Letseng Nominal Capital Expenditure Schedule Estimates (Unescalated 2006 Terms) 134Table 31: Unit Operating Cost Assumptions 135Table 32: Valuation Approaches and Methodologies 140Table 33: ROM Tonnages Considered in the DCF Valuation 141Table 34: Discount Rate Calculation Summary 143Table 35: Rehabilitation Liability Estimate 143Table 36: NAV Calculation 144Table 37: Inflation Forecasts 144Table 38: South African Rand Forecasts 145Table 39: Valuation Results Summary (Attributable Value) 146
LIST OF APPENDICES
Page
Appendix 1: Competent Persons’ Certificates 150Appendix 2: Written Communication from the Ministry of Natural Resources 166Appendix 3: Stone Sizes (in Carats) in Relation to Grain and Sieve Sizes 168Appendix 4: Plant Modifications 169Appendix 5: Glossary and Abbreviations 171Appendix 6: Resource Classification Logic 178Appendix 7: DCF Valuation Output Summaries 179Appendix 8: References 187

52
INTRODUCTION
1. INTRODUCTION AND NATURE OF THE TRANSACTION
The Letseng Diamond Mine is an operation that exploits kimberlite pipes in the Kingdom of Lesothoin southern Africa (Figure 1). The rights to the mine are held in Letseng Diamonds which is acompany registered in Lesotho and controlled by Letseng Holdings. Currently Letseng Holdingsholds 76% of Letseng Diamonds with the balance (24%) held by the government of the Kingdom of Lesotho. Letseng Holdings is owned by South African registered Matodzi Resources Limited(“Matodzi”) (50%), JCI Limited (“JCI”) (40%) and Guernsey registered Letseng Diamonds Limited(“Letseng Guernsey”) (10%) (Figure 2). Letseng Holdings’ shareholders are disposing of their 76%shareholding in Letseng Diamonds. Post the disposal GEM will hold 70% of Letseng, while thegovernment’s share will increase to 30%.
Letseng consists of two kimberlite pipes and a stockpile of previously mined lower grade Main Pipediamondiferous ores. The mine, previously operated by De Beers until 1982, re-commencedoperations in March 2004 and is currently producing at a rate of approximately 200,000tpm. Sinceinception, and until the end of March 2006, the mine has produced a total of 78,944cts from4,088,087t of ore sourced predominantly from the Satellite Pipe and, to a lesser extent, from theStockpile. A small amount of ore has been mined and treated from the Main Pipe. Letseng treats orethrough a 350tph DMS plant. Historically Letseng was renowned for the production of large stones,the most famous of which was the Lesotho Brown measuring 601cts discovered in the mid-1960s.This tendency for large stones has been confirmed by the recent production of 96 stones larger than20cts each. Of these stones, eight weighed more than 100cts each and the largest stone was 186cts.Recent production has also confirmed the regular occurrence of very high quality stones.
Letseng mine has successfully outsourced the majority of the operational functions. A strictmanagement structure ensures maximum control of both the operation and the contractors.Management plans to expand the operation by increasing production from 200,000tpm to400,000tpm and constructing an additional DMS plant to treat the Expansion ore.
This CPR has been prepared by Venmyn as an independent technical assessment and valuation ofLetseng Diamonds. The CPR specifically meets the requirements of the JSE on which both JCI andMatodzi are listed. These companies are required to submit a CPR to shareholders as this sale willbe classified as a Category One transaction, i.e. one in which the value is greater than 30% of themarket capitalisation of the company.
In this CPR, Venmyn presents a techno-economic valuation of the mining operation including theplanned expansion programme. The valuation states both the value of Letseng Diamonds based uponthe mining of the Indicated Resources only and the mining of the Indicated and Inferred Resources,as required by the JSE Listings Requirements.
The effective date of this CPR and valuation is 31st March 2006.
2. SCOPE OF THE OPINION
Venmyn was requested by the directors of Letseng Holdings to independently assess the techno-economic merits of Letseng, prepare a diamond resource and reserve statement and complete avaluation of Letseng Diamonds. This mandate was undertaken and the findings incorporated intothis CPR, as required by the JSE. In the execution of the mandate, Venmyn also considered thestrategic merits of the operation and defined the valuation outcomes on an open and transparentbasis. The investigation is based upon commercial, mining, environmental and financialinformation, which has been supplied by Letseng Holdings and Letseng Diamonds andindependently subject to due diligence. Venmyn’s valuation model incorporates the cash flowassumptions defined in this report and is sensitised to critical assumptions such as the productionrates, discount rates and exchange rates.
Site visits to Letseng were undertaken by the authors of this report in July and August 2005.

53
This CPR has been prepared for Letseng Holdings in compliance with, and to the extent required by,the SAMREC Code issued by the South African Institute for Mining and Metallurgy (“SAIMM”),under whose geographical jurisdiction the mineral resources fall by virtue of shareholder listings inSouth Africa. The guidelines are considered by Venmyn to be a concise recognition of the bestpractice due diligence methods for this type of mineral asset transaction and accord with theprinciples of open and transparent disclosure that are embodied in internationally accepted Codesfor Corporate Governance.
Figure 1: Locality Plan

54
Figure 2: Corporate Structure Prior to Transaction

55
3. COMPETENT PERSON’S DECLARATION
Venmyn is an independent advisory company. Its consultants have extensive experience in preparingcompetent persons’, technical advisors’ and valuation reports for mining and exploration companies.Venmyn’s advisors have, collectively, more than 100 years of experience in the assessment andevaluation of mining projects and are members in good standing of appropriate professionalinstitutions. The signatories to this report are qualified to express their professional opinions on thevalues of the mineral assets described. To this end, Competent Persons Certificates are presented inAppendix 1. The Competent Person responsible for the compilation of and the information containedin this CPR is Mrs. C Telfer.
Neither Venmyn nor its staff have, or have had, any interest in this project capable of affecting theircapacity to give an unbiased opinion, and, have not and will not, receive any pecuniary or otherbenefits in connection with this assignment, other than normal consulting fees. Letseng Holdingsand Letseng Diamonds have warranted in writing that they have openly provided Venmyn with allmaterial information which may have an affect on the outcome of the valuation, and which, to thebest of their knowledge and understanding is complete, accurate and true. The Competent Personhas given written permission to use this CPR in the public domain.
4. LESOTHO COUNTRY PROFILE
The Republic of Lesotho is a small, 30,355km2, mountainous and landlocked country situated as anenclave within South Africa (Figure 1). Lesotho’s economy is based upon subsistence agriculturewhich engages 85% of the population. The remaining population is either employed in the SouthAfrican mining industry as contract workers or in small manufacturing enterprises involved intanning, milling, canning and jute. Lesotho’s primary natural resource is water, which it exports toSouth Africa, through the Lesotho Highlands Water Scheme. The only other significant naturalresource is diamonds. Other minor exports include manufactured clothing, footwear, vehicles andanimal products including wool, mohair and livestock.
Electricity is supplied to the Lesotho power grid by the Maseru and Muela power stations (locatedon the outfall of the Khatse Dam) as well as by South Africa via Hendriksdrift, just east ofFouriesburg (Figure 1). Rudimentary telecommunications are available, via both land lines andcellular networks. Cellular companies based in South Africa have expanded the existing receptionareas into Lesotho.
No railway infrastructure exists primarily as a result of the large differences in altitude and the lackof large scale industry. There are over 5,000km of roads, 20% of which are tarred. Lesotho has fourairports with paved runways and a number of unpaved airstrips. The climate is temperate, with coldwinters and snowfall occurring on the high lying areas. Summers are warm and wet. Naturalhazards include periodic drought.
The population size is 2.02 million (2006 estimate by Central Intelligence Agency (“CIA”) WorldFact Book). The growth is estimated at (0.46%) for 2006, with a life expectancy estimate of 34 years.The literacy rate is the second highest in Africa, with 85% of the population over 15 years able toread and write. The HIV/Aids situation in the country, according to the latest estimates (2003), isan adult prevalence of 29%, with 320,000 people living with AIDS and a resultant 29,000 estimateddeaths per year.
4.1 Political Climate
Lesotho gained independence from Britain in 1966 and was ruled by Chief Jonathon until 1986.Military rule followed until a constitutional government was elected in 1993. The governmentalsystem is a Parliamentary Constitutional Monarchy. The Monarch, King Letsie III, has noexecutive or legislative power but is considered to be a “living symbol of national unity”. TheHead of Government is, according to the Constitution, the leader of the majority party in theassembly. The results of the 1998 elections were claimed to be fraudulent by the oppositionparty. The opposition staged a coup which led to looting and arson in Maseru and thesurrounding towns. The South African Development Community forces were called in to restoreorder. The Interim Political Authority was formed to create a new electoral system and conductnew elections.

56
Since 1998 the political and social environment has been stable. In May 2002, ruling LesothoCongress for Democracy (“LCD”) won parliamentary elections, held under the new system,which in addition gave smaller parties voices in parliament. The polls were endorsed byinternational observers, but were rejected by the opposition as being fraudulent. PrimeMinister Mosisili was sworn-in for a second five-year term.
In April 2005, the first local elections since independence took place. Voters choserepresentatives for 129 local councils. Opposition parties boycotted the vote for an alleged lackof preparation.
4.2 Economic Climate and Fiscal Regime
The economy is relatively poor but stable. The inflation rate (consumer price) is estimated at4.7% (2005) and the GDP growth rate at 0.8% (2005). Almost half the population lives below thepoverty line, and the unemployment rate was estimated to be 45% in 2002 by the CIA World FactBook.
In recent years, the government has embarked upon a privatisation exercise and is in theprocess of implementing a Poverty Reduction and Growth Facility programme in conjunctionwith the International Monetary Fund (“IMF”). This is based upon free market principles andprivate ownership of properties. Institutional and regulatory constraints which have impededgrowth are being reviewed. However, the economy is still highly dependent on South Africa andtends to reflect South Africa’s economic climate.
The ending of the “quota” system in world textile trade at the end of 2004 by the World TradeOrganisation (“WTO”) created a major negative impact on the local textile industry. Thisindustry was the single largest employer in the kingdom, employing 40,000 workers in 2002. InJanuary 2005, an estimated 6,650 jobs were lost due to closure of the six large foreign-ownedtextile factories.
The monetary unit is the Loti or Maloti (plural) (“M”) which is on a par with the South AfricanRand, which is also legal tender in the country.
There are currently no incentives applicable to mining companies except for the exemption ofvalue added tax (“VAT”) on capital machinery and equipment which resulted from anapplication made by Letseng Diamonds and which was gazetted in March 2002. Miningcompanies are required to pay the following:
• 35% company tax;
• withholding tax on dividends of 15% to South Africa and 10% to the United Kingdom;
• a foreign company services income withholding tax of 10% for services provided by SouthAfrican companies; and
• a resident company services income withholding tax of 5% for services provided bycompanies resident in Lesotho and employing Lesotho staff.
The Lesotho Income Tax Act currently states that only 10% of capital expenditure can bewritten off. This is contrary to typical mining company legislation whereby all expenditure of a capital nature can be written off in the year in which it was incurred.
According to the Income Tax Order of 1993, a withholding tax of 10% for South African and 5% for Lesotho service providing companies must be applied. This is deducted by the Lesothoclient or consumer from their payments to the service provider and a Withholding TaxCertificate is issued to the service provider and the monies paid to the government. The serviceprovider is then able to recoup the monies in the following tax year.
4.3 Mineral Policy
The minerals industry in Lesotho is administered by the Commissioner of Mines and Geologyand is regulated by the Lesotho Mines and Minerals Act, 2005, which was promulgated byRoyal Assent in February last year.
The Act, which repealed the previous Mining Rights Act of 1967, regulates the prospecting for andmining of minerals, the orderly utilisation and rehabilitation of the surface of land and ensures

57
security of tenure. All rights to Lesotho’s minerals are vested in the Basotho Nation. However,rights to the minerals may be acquired by either a Lesotho individual or a Lesotho registeredcompany. The Act records that the holder of a mineral right must give preference to Lesotho goodsand services. The types of rights stipulated in the Act are summarised in Table 1.
The holders of mineral rights are required to compensate surface owners for the use and/ordamage to their properties as a result of the mining activities.
With respect to environmental issues, the Mines and Minerals Act stipulates that the holder of a mineral right shall:
• “preserve the natural environment;
• minimise and control waste or undue loss of or damage to natural and biological resources;and
• prevent and where avoidable, promptly treat pollution and contamination of theenvironment;”
• “restore the land substantially to the condition in which it was prior to the commencementof operations”; and
• “make ongoing financial provision for compliance with his (environmental) obligations”.
The Mining Department requires that an Environmental Impact Assessment (“EIA”) and an Environmental Management Programme Report (“EMPR”) be submitted prior tocommencement of mining operations. The department initially permitted the carrying out ofthese studies during the development stage of a mining project. However, new environmentallegislation (Act 15 of 2001) has subsequently been passed which requires that these studies beundertaken during feasibility stage. At present, a new Environmental Department is being setup which will, in future, control the environmental aspects of mining projects rather than theMining Department. Letseng has completed an EMPR which has been approved by the LesothoGovernment.
According to the Mines and Minerals Act, a royalty is payable to government of 10% for preciousstones and 3% for other minerals. The percentage is based upon the gross sale value receivableat the mine gate.
Letseng’s rights were issued prior to the implementation of the Mines and Minerals Act. The original agreement with the government is defined in the Mining Lease Agreement of May1999 (Section 6.1). This agreement was renegotiated as part of the sales process, according toSection 44 of the new Act and as part of the process of obtaining governmental approval for thesale. The new agreement is discussed in detail in Section 6.2.
4.4 Diamond Industry
The Lesotho Geological Survey has identified 33 kimberlite pipes and 140 kimberlite dykes in Lesotho, of which 24 are diamondiferous. To-date, most of the country’s diamond productionhas been derived from the Letseng deposit which was mined by De Beers between 1977 and1982, and was re-commissioned in the first quarter of 2004 under the new ownership. Apartfrom Letseng, the only other known potentially economic kimberlites are the Liqhobong pipeand the nearby low grade Kao pipe (Figure 1). Liqhobong is located 40km west of Letseng.European Diamonds PLC holds a mining lease to develop Liqhobong. Mining of the project hascommenced with a production of 290,000 carats per annum from the Satellite Pipe in early2006. Evaluation of the adjacent large Main Pipe is underway and a feasibility study is plannedto commence in 2006. As for Kao, it is reported that a Canadian company, Serious View Trading,is currently prospecting in the area.
Lesotho is a member of the “Kimberley Process” diamond certification scheme. This process,initiated by the World Diamond Council and the United Nations, and implemented by a UnitedNations vote in 2003, requires the certification of all diamonds mined and upon every transferof ownership of the diamonds.

58
Table 1: Types of Mineral Rights in Lesotho
TY
PE
OF
RE
NE
WA
LR
IGH
TV
AL
IDIT
YP
ER
IOD
Pro
spec
tin
g L
icen
ceM
axim
um
Max
imu
mof
2 y
ears
.of
1 y
ear.
Min
ing
Lea
seM
axim
um
M
axim
um
of
10
year
s.of
10
year
s.
Min
eral
Per
mit
Max
imu
m
Max
imu
m
of 1
yea
r.of
1 y
ear.
SIZ
E O
F A
RE
A
<25.
0km
2 . R
edu
ced
to b
etw
een
12.5
– 2
5.0k
m2
in r
enew
al.
Not
spe
cifi
ed, b
ut
may
be
enla
rged
co
nti
nu
ous
to
exis
tin
g ar
ea.
Max
imu
m
of 1
00m
2 .
RIG
HT
S
•to
pro
spec
t fo
r th
e sp
ecif
ied
min
eral
; •
dril
l,
exca
vate
an
d er
ect
tem
pora
ryst
ruct
ure
s; a
nd
•to
tra
nsf
er, w
ith
gov
ern
men
t ap
prov
al.
•to
min
e th
e sp
ecif
ied
min
eral
;•
erec
t th
e n
eces
sary
pla
nt
and
equ
ipm
ent;
•pr
ospe
ct w
ith
in t
he
leas
e ar
ea a
nd
dum
pw
aste
;•
disp
ose
of t
he
min
eral
pro
duct
; an
d•
to t
ran
sfer
, wit
h g
over
nm
ent
appr
oval
.
•to
co
ndu
ct
smal
l sc
ale
min
ing
for
asp
ecif
ied
min
eral
(ex
cept
dia
mon
ds);
•to
ere
ct t
empo
rary
str
uct
ure
s;
•to
dis
pose
of
the
min
eral
; an
d •
tran
sfer
, wit
h g
over
nm
ent
appr
oval
.
OB
LIG
AT
ION
S
•to
car
ry o
ut
pros
pect
ing
acco
rdin
g to
a w
orks
pro
gram
me;
•n
otif
y C
omm
issi
oner
of
the
disc
over
y of
all
min
eral
s;•
ann
ual
ly s
ubm
it a
n a
udi
ted
repo
rt o
n e
xpen
ditu
re;
•m
ain
tain
fu
ll a
nd
accu
rate
res
ult
s of
pro
spec
tin
g. T
hes
e m
ust
be s
ubm
itte
d to
th
e of
fici
als
on a
qu
arte
rly
basi
s; a
nd
•n
ot t
o re
mov
e m
iner
als
wit
hou
t pe
rmis
sion
.
•to
pro
vide
th
e go
vern
men
t w
ith
a s
har
e of
at
leas
t 20
% i
n t
he
min
e. I
n t
he
case
of d
iam
onds
, th
is s
har
ehol
din
g h
oldi
ng,
alo
ng
wit
h o
ther
fin
anci
al, t
ech
nic
al a
nd
com
mer
cial
asp
ects
, wil
l be
neg
otia
ted
wit
h t
he
appl
ican
t ac
cord
ing
to S
ecti
on 4
4;•
that
a g
over
nm
ent
repr
esen
tati
ve m
ust
be
on s
ite
at d
iam
ond
min
es a
t al
l ti
mes
;•
mu
st c
arry
ou
t m
inin
g ac
cord
ing
to t
he
prog
ram
me
of w
orks
and
in a
ccor
danc
e w
ith
good
min
ing
and
envi
ronm
enta
l pra
ctic
e;
•n
otif
y th
e C
omm
issi
oner
wh
en m
inin
g be
com
es p
rofi
tabl
e;
•ke
ep (
in L
esot
ho)
all
tec
hn
ical
an
d fi
nan
cial
rec
ords
; an
d •
furn
ish
au
dite
d fi
nan
cial
re
cord
s to
th
e go
vern
men
tbi
ann
ual
ly.
•to
car
ry o
ut
acti
viti
es u
sin
g go
od m
inin
g an
d en
viro
nm
enta
lpr
acti
ces;
•
subm
it p
rodu
ctio
n a
nd
fin
anci
al r
epor
ts a
nn
ual
ly;
•su
bmit
a
desc
ript
ion
of
pl
ant,
eq
uip
men
t an
d n
um
ber
ofem
ploy
ees
ann
ual
ly; a
nd
•n
ot
to
carr
y ou
t m
inin
g be
low
a
dept
h
of
2m
and
usi
ng
expl
osiv
es o
r po
wer
ed m
ach
iner
y (e
xcep
t fo
r m
ater
ial
load
ing
purp
oses
).

59
The process was implemented to combat the sale of the so-called “blood” or “conflict diamonds”which were used to fund armed conflict, rebel activities, overthrow of legitimate governments aswell as the trade in armaments, especially prevalent in Sierra Leone, Angola and the DemocraticRepublic of the Congo (“DRC”). The Kimberley Process Certification Scheme is voluntary andcomprises 43 participants, including the European Community. Kimberley Process participantsaccount for approximately 99.8% of the global production of rough diamonds.
5. CORPORATE STRUCTURE
Letseng Holdings is a South African registered company held by Matodzi (50%), JCI (40%) andGuernsey registered Letseng Guernsey (10%) as shown in Figure 2. Letseng Holdings’ sole asset is the Lesotho registered company Letseng Diamonds of which it owns 76%. The remaining 24% is held by the Lesotho Government.
The 76% share in Letseng Diamonds is being disposed of by the shareholders of Letseng Holdings.Post the disposal, GEM will hold 70% of Letseng Holdings and the Lesotho Government’s share willincrease to 30% (Figure 3). The disposal price and process is defined in the Sale of Shares Agreementsigned between Letseng Holdings and GEM, effective from 1st July 2006. The details of agreementare discussed in Section 6.2.
6. LEGAL TENURE AND AGREEMENTS
The legal agreements, to which Letseng is a party, are described below, commencing with thecompany’s entitlement to the minerals. Summaries of the various agreements with the contractingcompanies are also described in this section.
6.1 Mining Lease Agreement (“Lease Agreement”)
The Lease Agreement was entered into in May 1999 by the Basotho Nation (“State”) andLetseng Diamonds. It was signed by Letseng Diamonds, Letseng Holdings, JCI and LetsengGuernsey, and entitles Letseng Diamonds to the exclusive right to prospect, dig for, mine, winand dispose of diamonds, for its own account, within an area of 11.7km2, termed the ProductionArea (Figure 4). The Lease continues for an initial period of ten years and can be renewed forthree consecutive terms of five years each (25 years). The agreement stipulated theshareholding of the government being 24%, 12% by way of free carried interest and 12% to bepaid from dividends, interest free. This amounts to M4.8m or 12% of the original share capitalof Letseng Diamonds which was M40.0m.
According to the Lease Agreement, the mine is required to operate at a minimum productionrate of 66% of a plant design capacity of 300tph for at least three months or process 360,000tof ore and, on the first day of the following month, the mine will be classified as having met therequirements of Phase I commercial production. This was achieved on the 1st August 2004. The mine is required to maintain a production rate of not less than 120,000tpm in Phase I. This rate has been met by the mine.
Phase II commercial production will be achieved on the first day of the month following whichthe mine operates a plant with a design capacity of 500tph, at 66% of capacity for three months,or treats 240,000t of ore from the Main Pipe. The mine is required to have been operatingaccording to Phase II for at least six months prior to the application of the first Lease renewal,i.e. ten years after signature of the agreement. This occurs in May 2009. Therefore, the minemust be producing from an expanded plant (500tph) by September 2008.
Other important issues pertaining to the Lease Agreement include the following:
• the State is entitled to a minimum of two directors to sit on the Letseng Diamonds boardaccording to their shareholding in the company;
• the mining company cannot undertake any of the following without the Minister’s priorapproval:
• amend its Memorandum and Articles of Association;
• pass a special resolution;

60
Figure 3: Corporate Structure Post Transaction

61
Figure 4: Regional Infrastructure and Topography

62
• appoint independent auditors;• merge or consolidate with another company;• sell, lease or otherwise dispose of all or a substantial part of its assets; and• acquire or maintain any property or assets other than those related to the conduct of its
operations;• by May 2004 at least 90% of the employees of Letseng Diamonds must be Lesotho nationals.
Currently 85% of the staff are Lesotho nationals; • Letseng Diamonds is required to pay the government a Diamond Sales Tax (“DST”) (now
known as a royalty in the Mines and Minerals Act, 2005) of 7.0% of the market value of alldiamonds sold; and
• Government approval is required for the disposal of Letseng Diamonds.
As noted in Section 4.2 the Lesotho Government has a policy whereby only 10% of capitalexpenditures can be written off. However, according to the Lease, the Lesotho Governmentstated that it will make the necessary changes to the Income Tax Act of 1993 “so that, for thepurposes of determining the taxable income of the Mining Company, all expenditures properlyincurred including but not limited to:• expenditures prior to the Commencement of Commercial Production for Phase I, including
exploration expenditures in the Production Area; and• capital expenditures including expenditures for Plant and Equipment and Infrastructure,
shall be considered deductible expenditures in the Financial Year in which such expenditure isincurred by the Mining Company. Any recoupment by the Mining Company of capital costs shallbe added to the taxable income of the Mining Company for the Financial Year in which therecoupment occurs.”
As of June 2005, no amendment had been made by the Government to the Income Tax Act, andLetseng is only permitted to write off 10%. Letseng Diamonds queried the status of thisamendment with the Government in writing, to which the Ministry of Natural Resourcesresponded on 13th July 2005 to the effect that proposals to amend the current legislation wouldbe tabled before parliament in late August or early September 2005 (Appendix 2).
This amendment never materialised and as a result, Letseng incurred a deferred tax liabilityin terms of Section 23(b) of the Lesotho Tax Act.
For the purposes of the mineral asset valuation, it has been assumed that the amendment willhave been completed for the 2006 financial year.
6.2 Sale of Shares Agreement (“Sale Agreement”)
A Sale Agreement was signed between Letseng Holdings and GEM, effective 1st July 2006. Theagreement was prepared with input and consent from the Lesotho government, whose approvalwas required, according to the Lease Agreement, for a transaction of this nature. The SalesAgreement records the following changes to the relevant sections of the Lease Agreement:• increase in the royalty from 7.0% to 8.0%;• the agreement whereby the Government’s 12% shareholding that was to be paid out of
dividends has been scrapped;• the Government will receive 3% of GEM’s acquired share capital in Letseng Diamonds for no
consideration; and• the government will receive a further 3% of GEM’s acquired share capital in Letseng
Diamonds at a cost of ZAR37.5m. This amount will be financed via an interest free loan tobe repaid from the Government’s future attributable dividend.
The following conditions precedent to the sale must be met by 30th September 2006:• approval from Matodzi and JCI shareholders and the JSE and/or the Securities Regulation
Panel in South Africa;• approval of the Lesotho Government;

63
• an unconditional and irrevocable undertaking by Investec Bank Ltd (“Investec”) to cancel theoutstanding Industrial Development Corporation of South Africa Ltd (“IDC”) loan andrelease the securities. This loan was entered into between Letseng Holdings and the IDC inDecember 2003. The rights and obligations of the loan have subsequently been ceded anddelegated by the IDC to Investec;
• the termination of the agreement of provision of management services between the Companyand Consolidated Mining Management Services Ltd (“CMMS”), a 100% subsidiary of JCI;and
• termination of all rental agreements between Letseng Holdings and JCI.
The purchase price is ZAR879.5m, payable in cash, on the first day of business following thedate upon which the last of the conditions precedent is met.
6.3 Surface Rights
Letseng does not own the surface rights within the production area, but is required to pay tothe Government an annual rental of US$87,000 for the use of the area. This amount is payablein April and is increased by the Lesotho Consumer Price Index (“LCPI”) on an annual basis. Therental for 2005 was US$90,000 or (M559,000).
6.4 Environmental Impact Assessment (“EIA”) License
No modern environmental laws were in place when the Lease was signed in 1999. The Leasestated that the following had to be undertaken with respect to restoration provisions, inaccordance with good mining practise:• the production and infrastructure areas must be made safe by fencing, or filling in all
excavations with the exception of the two openpits of the Main and Satellite Pipes;• the surface must be levelled or, where this is not possible, contoured, graded and terraced;• the production and infrastructure areas must be left in a clean and orderly condition; and• any natural drainage courses obstructed or obliterated during mining operations must be re-
opened, where feasible.
Since then the Lesotho Environmental Act of 2001 has been enacted and this law requires thatan EIA be completed for any proposed mining activities in Lesotho. The process requires aninitial overview to be submitted to the National Environmental Secretariate (“NES”). Thisoverview typically includes a summary of the following:• the proposed project;• the existing environmental conditions; and• the potential environmental impacts of the proposed development.
Upon submission, NES will decide what environmental documentation is required, i.e. either afull Environmental Impact Statement (“EIS”), a preliminary EIS or no EIS. Upon considerationand acceptance of the EIS and consultation with the Interested and Affected Parties (“I&APs),the NES will then issue an EIA Licence. Since the development at Letseng commenced prior tothe enactment of the Environmental Act a special meeting was held in October 2003 with NES,Letseng Diamonds and their environmental consultants, Golder Associates Africa (Pty) Limited(“Golder”), in order to decide the way forward. The principal agreements reached were asfollows:• an EIS and Environmental Management Plan (“EMP”) would be prepared concurrently to
address the potential impacts of the mine on the environment;• a public meeting would be held to address any concerns from the I&APs; • no project brief would be required due to the advanced stage of development; and • a full EIS would be prepared post haste.
This process was duly undertaken and Letseng Diamonds submitted their EIS and EMP toNES in July 2004 and were awarded the EIA Licence in October of the same year.

64
6.5 Water License
A separate water license is not required, according to current Lesotho legislation, as it isincluded in the EIS and EMP.
6.6 Agreements with Contractors
Letseng Diamonds utilises the services of ten contracting companies which undertake variousfunctions from mining through to diamond sales. The contractors and their services aresummarised in Figure 5 and their legal agreements with Letseng Diamonds summarised in thesections below.
6.6.1 Alluvial Ventures (Pty) Ltd (“Alluvial Ventures”)
Alluvial Ventures is the mining contractor that entered into an agreement with LetsengDiamonds in March 2005 to mine and stockpile the alluvial gravels in certain definedareas. Alluvial Ventures operates at its own expense under a “profit sharing” schemespecified in this agreement and the diamonds recovered are marketed in conjunctionwith Letseng by WWW International Diamond Consultants Ltd (“WWW”). LetsengDiamonds retains the first option to process the ore mined. In the case when LetsengDiamonds elect not to process the ore through its own plant, it will allow AlluvialVentures to process the ore through Alluvial Ventures’ own pan plant. In this case,Letseng Diamonds is entitled to nominate the metallurgical processes to be utilised forthe mined material, which may vary for different areas. The agreement expires after fiveyears, however, Letseng Diamonds can terminate with 24 months’ notice.
No rehabilitation costs were included in the contract and Letseng Diamonds willultimately be responsible for the rehabilitation of Alluvial Ventures’ mining area andtailing disposal site.
6.6.2 Matekane Mining Investment Company (Pty) Ltd (“MMIC”)
MMIC signed a contract with Letseng Diamonds in May 2004 to undertake the loadingand hauling of ore and waste from within the open pit/s (the Satellite and/or Main Pipe)to the designated DMS plant, waste dumps or stockpiles, such that a minimum of 350tphof ore is supplied. The contract continues for a period of five years. MMIC is responsiblefor providing the fleet and the staff to operate the fleet. Barloworld (Pty) Ltd (“Barlows”)Equipment Division is contracted by MMIC to maintain and repair the fleet.
In order for MMIC to familiarise themselves with the nature and cost of the contract, thepayments are structured on an hourly cost plus and management fee basis for the firsttwo years, or for such period as Letseng Diamonds shall decide.
MMIC is required to carry out all services to the satisfaction of Letseng Diamonds andis required to adhere to the company’s instructions and directions on any matter,whether mentioned in the contract or not. The company is also able to suspend MMIC’sservices if necessary.
Letseng Diamonds also has the right to terminate the contract if the mining of thedeposit becomes financially or technically unviable or if MMIC has not, amongst otherthings, fulfilled the contract or has failed to provide the services with due diligence.MMIC is allowed to terminate the contract if Letseng Diamonds fails to pay the company.

65
Figure 5: Organogram of Contractors

66
Penalties will be applied to MMIC for any machinery not meeting the availability andfuel consumption requirements. Letseng Diamonds is responsible for providing dieseland a workshop for the fleet and accommodation and food for a total of 85 MMICemployees.
The budgeted value of the contract is M2.76m per month (“pm”) which included the fixedcosts and an hourly charge for the various earthmoving machines which includesutilisation, tyres/undercarriage and ground engaging tool fees.
6.6.3 Quarry Cats Lesotho (Pty) Ltd (“Quarry Cats”)
Quarry Cats own, constructed and have operated the crushing plant that supplies thefeed to the ore treatment plant since June 2005. This is a subsidiary of a South Africancontract crushing company. Quarry Cats are currently operating on the basis of a “letterof intent”.
The proposed toll charge structure consists of a charge per tonne of throughput. The charge amounts to approximately ZAR800,000pm. The toll charge escalation isyearly, in accordance with a formula based on South African CPI and Producer PriceIndex (“PPI”), and the escalation implemented in January each year.
6.6.4 Minopex (Lesotho) (Pty) Ltd (“Minopex”)
Minopex, a subsidiary of South African engineering and design company DowdingReynard & Associates (Pty) Ltd (“DRA”), provides the general metallurgical and qualitymanagement of the ore treatment plant and associated activities based on a contractsigned in September 2003. Construction of the plant commenced in November 2003 withtest commissioning in December 2003, reaching full production in March 2004, whereafter the contract continues for a further four years to March 2008.
The contract includes the provision of operational and maintenance personnel,procedures, consumables, spares and services and all other services required tobeneficiate the ore. Minopex is also responsible for the deposition and beaching of theslurry tailings and the DMS material deposition. The final concentrate discharge fromthe DMS cyclones into the recovery plant, together with the operation of all associatedscreening, drying, x-ray and sorting equipment falls outside of their contract area, exceptfor the maintenance thereof. Letseng Diamonds pays a fixed monthly cost of ZAR2.54mfor the services provided by Minopex.
It is envisaged that the Expansion plant will also be operated and maintained byMinopex in a similar manner.
6.6.5 Securicor Gray (Lesotho) (Pty) Ltd (“Securicor”)
Securicor, previously known as Gray Security Services (Lesotho) (Pty) Ltd, provides sitesecurity services to Letseng Diamonds based upon a contract signed in November 1999.The value of the contract is M42,000pm. Securicor’s sole function is to “minimise the riskof loss by fire, theft, burglary, vandalism, terrorism, riot or civil commotion”.
6.6.6 Stallion Security (Pty) Ltd (“Stallion”)
Stallion signed an agreement with Letseng Diamonds in August 2004 for the industrialsecurity related to the recovery plant and product transport whereby they areresponsible to “prevent or minimise loss or damage to the client’s property and persons byfire, theft, burglary and vandalism.” The contract endures until the end of August 2006.The Stallion fee was M199,000pm until August 2005, whereafter it escalated accordingto a formula based upon CPI. Negotiations are underway to increase staffing levels andit is anticipated that the fee will increase to M230,000pm accordingly.
Letseng Diamonds has agreed to supply to Stallion, free of charge, meals andaccommodation for the security personnel, electricity, water and office accommodation.

67
6.6.7 ESS Support Services Worldwide (Pty) Ltd (“ESS”)
ESS, a division of Compass Lesotho (Pty) Ltd, has been contracted by Letseng to providecatering and housekeeping services at the mine. The contract was proposed andimplemented in October 2003 and was due to be completed by September 2004.
A new contract was entered into in February 2006. ESS provides the following servicesunder the contract:• catering services – supply and provision of three sit down balanced, nutritional and
appetising meals a day, seven days a week, to Letseng staff, guests, contractors andworkers;
• laundry services – the washing and ironing of personal clothing and the issuing of bedlinen for Letseng staff, guests, contractors and workers; and
• janitorial services – cleaning of accommodation, communal and public areas.
ESS bills Letseng according to a daily rate per person according to their status at themine (M50.49 for senior staff or M31.42 for junior staff), plus a fixed monthlymanagement fee of M108,000 (up to 31st March 2007). These rates are reviewed on anannual basis in March and escalated by the lesser of 10% per annum or the South AfricanCPI (65% of the Food Index and 35% of the All Item Index). The latest fee structure iscurrently being negotiated.
6.6.8 Naleli Clinic (“Naleli”)
Dr Nyaphisi of Naleli, based in Mokhotlong, currently provides health care services to the mine’s staff and contractors. A proposal stipulating that Naleli will provide thefollowing services was submitted, and agreed upon:• emergency medical care including the administering of health care and arranging for
emergency evacuation if necessary;• primary medical care; and• occupational health, safety and industrial hygiene.
In undertaking the services above, Naleli will maintain and utilise the clinic, ambulanceand other required medical and office facilities provided by Letseng Diamonds. Nalelicharges a monthly fee of M82,000.
6.7 Diamond Marketing Agreement
Letseng Diamonds recently extended their diamond marketing contract with WWW for fiveyears from 22nd August 2005. The original contract came into effect when commercialproduction commenced at the mine in March 2004. The agreement states that WWW willundertake the following:• travel to Letseng with a Lesotho Government Official to sieve, weigh, size, sort and
provisionally value the diamonds for insurance purposes and calculate the export sales tax.The export tax is paid up front upon removal of the parcel from Lesotho, and then adjustedupon sale of the parcel;
• diamonds are sealed by both the mine and the government personnel and transported toAntwerp;
• upon breaking the seal in the presence of government and Letseng Diamondsrepresentatives, WWW will have the diamonds cleaned, sorted into suitable lots and priced;
• WWW invite a minimum of five selected tenderers to bid on selected parcels or on the wholeproduction;
• diamonds are sold to the highest bidder;
• in the case of exceptional stones (values >US$80,000), these are handled on an individualbasis to ensure that the maximum price is obtained; and
• upon receipt of the payment, WWW are paid 2.5% of the gross proceeds, with a minimumvalue of US$30,000.

68
The following WWW incurred costs must be paid by Letseng Diamonds:
• diamond transportation;
• diamond valuators travel to and from Letseng Diamonds;
• travel to any centres for diamond sales other than Antwerp;
• diamond insurance;
• diamond cleaning; and
• any other incidental costs.
7. GENERAL INFORMATION AND LOGISTICS
7.1 Location
Letseng is located in northeast Lesotho within the Mokhotlong District. The nearest towns areMokhotlong, 70km south of the mine and Butha Buthe, 104km to the west as shown in Figure1. The nearest village is Khaphamali located 1.5km away from the Satellite Pipe. The capital,Maseru, is situated approximately 246km west of Letseng.
7.2 Access
Access to the mine is via tarred road in fairly good condition from either Butha Buthe orMokhotlong. The nearest border crossing between South Africa and Lesotho is situated atCaledonspoort, approximately 10km west southwest of Butha Buthe (Figure 1). The trip fromthe Caledonspoort to Letseng takes approximately two hours by road.
Alternatively, Letseng can also be reached by light aircraft using the mine’s small gravelairstrip. The airstrip is in good condition. The mine is currently completing the construction ofa new longer airstrip along the top of the old De Beers waste rock dump (Figure 6).
7.3 Topography and Drainage
The mine is situated within the lava capped Maloti (Drakensberg) mountain range which formsthe border between Lesotho and South Africa (Figure 1). This area is renowned for its scenicbeauty. The mine is situated on a high plateau at an average elevation of 3,100m above meansea level (“amsl”) (Figure 3).
The mine site is situated on a north/south trending watershed and is drained by the Matsokuand Khubelu rivers (Figure 3). Most of the mine infrastructure, as well as the coarse and finetailings facilities, lie within the catchment of the De Beers Dam which is located within thecatchment of the Masenkeng stream (Figure 6). This stream drains into the Khubelu River. TheMain Pipe lies in the catchment of the Patiseng stream while the Satellite Pipe drains into anunnamed tributary of the Qaqa stream which finally drains into the Matsoku River.
7.4 Climate
The climatic conditions are generally temperate with very cold winter temperatures. Theannual temperatures range from a summer maximum of 22°C to a winter minimum of –22°C.Annual precipitation records for Letseng are sparse but suggest a variation between 556mmand 850mm, with an estimated average of 700mm. The precipitation is usually in the form ofsummer thunderstorms. Average annual snowfall is 750mm. The mine has recently installed aweather station to accurately measure the climatic variations.
The climatic conditions will not prevent continuous mining operations, except in the case ofheavy downpours, whereupon access to the pit may be inhibited for a few hours due to slipperyroadways or during unusually heavy snowfalls. Sufficient water pumping capacity is availableto prevent flooding of the pits.

69
7.5 Current Infrastructure and Requirements for the Expansion
7.5.1 Water
Water is currently stored on site within the De Beers Dam and the Main Pipe Pit, witha smaller amount in the Rio Tinto South Africa (Pty) Ltd (“RTZ”) Dam (Figure 6). Potablewater is sourced from the De Beers Dam and pumped to the Potable Water Dam adjacentto the plant (Figure 6). The clean water for pump gland service and the Flowsortmachines is also sourced from this dam. The Process Water Dam is situated next to thePotable Water Dam (Figure 6). This is filled with return water pumped from the SlimesDam which is the recycled water used in the plant. The current plant requires1,078,000m3 of water annually. With the construction of an additional plant for theExpansion, this water consumption rate will double.
7.5.2 Water Balance
Due to the fact that a lack of water may prove to be a fatal flaw in a project if it is notadequately addressed, a water balance has been constructed for the current operation(Figure 7). The water balance was investigated by Environmental, Civil and MiningProjects (Pty) Ltd (“ECMP”) as part of the design report for residue disposal and brieflydiscussed by Golder in the EMPR. Water flow measurements were also supplied by themine. ECMP estimates of runoff, precipitation, evaporation and seepage have beencoupled with the mine’s present pumping rates to construct the current water balance(Figure 7). The water balance indicates a net make-up water requirement ofapproximately 763,000m3 per annum. Based upon the existing reservoir volumes, themine will have adequate water reserves for the next five and a half years.
There are two critical variables in the water balance namely:• the runoff rates flowing into the De Beers and slimes dams; and• the evaporation and seepage rate from the slimes dam.
These variables control the water make-up requirement for the current operation.
The volume of runoff into both the De Beers and slimes dams is estimated by ECMP as25% of the rainfall volume. This is a typical value based upon the environment atLetseng. It has not, however, been measured on site. Due to the importance of this figureto the water balance, it requires verification through measurement. Indications fromobserving the levels of the De Beers dam indicate that the percentage of runoff may besignificantly higher than that estimated by ECMP. Assuming all other variables remainconstant, runoff of over 90% would be required to cause the mine to become waterneutral.
The other estimated value in the water balance is the volume lost from the slimes damvia seepage and evaporation. Once again, a typical value is utilised, this being basedupon ECMP’s experience in South Africa on similar slimes. Venmyn recommends thatthese figures be measured empirically by the mine, especially since the Expansion willfurther increase the make-up water requirements.
The designed water balance for the volume pumped from the DMS plant to the slimesdam is 0.9Mm3. The mine’s actual pumping rates are 3.2 Mm3. This increase in watervolume is a function of the lower density of the slurry being pumped from the plant. Theimpact of the lower density, and therefore the greater water pumping volumes, is higherwater losses from the Slimes Dam than originally designed. Bateman is investigating theinclusion of a paste thickener in the plant to increase the density and thereby reduce thepumping volumes. This investigation is part of the Class II feasibility study for theexpansion (Section 16.2). The investigation results will be available in January 2006.
The probability of the mine becoming water neutral is good provided that the runoffvolumes are higher than currently estimated and the water content of the slimes isreduced as planned. Should the mine require additional water the following potentialsources could be utilised:

70
Figure 6: Mine Site Infrastructure and Aerial Photograph

71
Figure 7: Water Balance for Current Operation

72
• pumping from the Khubelu River, over an estimated linear distance of 7km, and anelevation difference and resultant static head of approximately 1km;
• creating runoff collection facilities in the form of additional dams on the property. Thesite of the RTZ Dam would be particularly suitable for this as the steep valley sidewould result in increased levels of runoff and therefore improved water harvestingpotential;
• closing the adit to prevent overflows and collecting all the runoff into the Main PipePit; and
• pumping the runoff water into the Satellite Pipe Pit into a collection facility.Further investigation will be required to quantify the cost implications of the differentpotential sources of water for the mine.
7.5.3 Power
Power is currently sourced from South Africa via the Eskom grid from Muela. The oldpowerline to the mine was restored over a distance of 63km during 2002/3. The linesupplies 88 kilovolt (“kV”) power to Letseng’s substation (Figure 1 and Figure 6). The Letseng substation has a capacity of 7.0 mega Watts (“MW”) and is currently utilising2.5MW. This is expected to increase to approximately 4.0MW with the Expansion.
7.5.4 Accommodation and Offices
Letseng has renovated existing structures or constructed new buildings which includethe following (Figure 6):• administration offices;• survey offices;• plant and final recovery buildings and associated offices;• accommodation for 445 staff;• kitchen and mess facilities;• workshops and stores;• diesel storage facility;• explosives magazine for non-bulk explosives and a bulk explosives facility;• gymnasium and recreational facilities; and• police post situated south of the production area.
7.5.5 Mining and Plant Equipment
All the mining and earthmoving equipment is owned by MMIC. Letseng owns the hardrock drilling fleet, the 350tph DMS plant and Flowsort final recovery units. The crusheris owned by Quarry Cats.
7.5.6 Security
The mine site is fenced with 15km of 2m high razor wire (Figure 3), with two accesscontrolled entrances manned 24 hours a day by Securicor. Securicor also undertakes footand horseback patrols of the perimeter fence as well as the mine site on a regular basis.
Stallion is responsible for industrial security throughout the entire Letseng treatmentplant including recovery and sort house. The company is also responsible for industrialsecurity within the Alluvial Ventures’ treatment plant and sort house.
Furthermore Stallion utilises 72 surveillance cameras, which are monitored at a centralcontrol room on a 24-hour basis. Camera images are recorded and reviewed on a dailybasis and all images are stored for an extended period of time.
The new glovebox installation is presently being commissioned which will includeadditional cameras and security systems. Access to the recovery and sort house has beenimproved with access only permitted on authorisation of Stallion and the recoverymanager.

73
Extensive use is also made of both the Lesotho mounted police (based at the PoliceStation indicated on Figure 6) and the Lesotho Defence Force to perform patrol andprotection duties.
7.5.7 Roads
Letseng has, where possible, utilised all the existing roads. All roads are made from thecoarse tailings and are in good condition (Figure 6). Letseng undertakes minor repairsand maintenance on the tar road accessing the mine from Butha Buthe.
8. REGIONAL GEOLOGY
The regional geology of northern Lesotho comprises upper Karoo Supergroup sediments with flat-lying shales and sandstones of the Molteno Formation, overlain by basaltic lavas of theStormberg Group. The sediments and, to a lesser extent, the lavas are extensively intruded by dykesand sills of dolerite which decrease in frequency upwards in the succession. Minor normal faultingis present. The base of the lava sequence lies between 1,350m and 1,500m below the present erosionlevel at Letseng.
The sequence is intruded by kimberlite pipes and dykes, the largest of which is Kao followed in size by Letseng’s Main Pipe, with surface areas of 19.8ha and 15.9ha, respectively (Figure 1). The kimberlites are commonly found in groups consisting of one large intrusion and one, or more,smaller “satellite” intrusions. The kimberlite pipes usually manifest at surface as a depression filledwith marshy black cotton-soil known locally as “sponge”. A few of the pipes and their associatedsatellites (eg Kao, Lemphane, Liqhobong, Mothae) are diamondiferous, and have supported artisanaldiamond diggings.
The kimberlite dyke system present in Lesotho trends east-west, and comprises both “basaltic” andmicaceous kimberlite types. The dykes usually vary in thickness from a meter to a maximum thicknessof 8m. The dykes are typically discontinuous along strike. They show frequent enlargements, or blows,of up to 30m wide. None of the dykes are known to be diamondiferous.
9. LOCAL GEOLOGY AND MINERALISATION
Letseng is a primary vertical kimberlite pipe. Such kimberlite pipes are characteristically carrot shapedin section and comprise volatile-rich, potassic, ultra basic igneous rock. Kimberlite has aninequigranular texture which results from phenocrysts and xenoliths being set in a fine-grained matrix.
Letseng consists of two kimberlite pipes, namely the Main Pipe and the Satellite Pipe (Figure 6). The pipes are hosted in unweathered basaltic lavas. Prior to mining, both pipes consisted of thefollowing features, listed from surface to depth:
• a superficial upper organic layer of black cotton-soil or sponge with a thickness of less than 1.0m;
• a leached gravel which either consists of a brown basaltic over-wash (<5.0m thick on the Satelliteand poorly developed on the Main Pipe) or a widespread leached white gravel. The white gravelis dominantly quartz and, in the immediate vicinity of the pipes, carries kimberlitic heavyminerals;
• a soft, clayey, weathered and oxidised yellow-brown kimberlite known as “yellow ground”. It istypically 2.5m thick and contains many heavily weathered basalt xenoliths; and
• a soft blue-green, partially weathered kimberlite commonly known as “blue ground”. It is at least20m thick on the Main Pipe with the degree of weathering decreasing with depth. On theSatellite, the weathered kimberlite is 15m thick in the south, but very thin or absent in thenorth, with a relatively sharp lower contact with fresh (hard) kimberlite.
The distinction between the two pipes is evident in the geochemistry of the autoliths. This indicatesthat, although the two pipes are spatially related, they have differing origins.

74
9.1 Main Pipe
From surface mapping as well as surface and underground sampling, eight different varietiesof kimberlite are recognised in the Main Pipe, namely K1 to K8 in the order in which they wereencountered. Each facies type is described in Table 2.
Table 2: Description of Facies Types within the Main PipeFACIES AGE COLOUR
K1, K2, K3 Oldest Blue-greyto
grey-green to brown
K4 and K5 Injected Dark green-blackinto K1and K6
K6 Younger Greenish greythan K1, to brown
K2 and K3
K7 Younger Greenish greythan K6 to
brown
K8 Youngest Pale apple-greenmatrix
The contact between kimberlite and the lavas is sharp, with the kimberlite exhibiting a 1.3mwide zone of shearing, comprising mylonite zones, mud seams and calcite veining. The MainPipe is a cone shaped body tapering downward with depth from a surface projection measuring540m by 365m in extent (Figure 8). The long axis of the pipe trends northeast. The surfaceexpression covers an area of 15.9ha. The contact with the lavas, as determined by limitedhistorical drilling, dips inwards at 83°.
Assuming the pipe continues to taper with depth at a constant rate, the origin would be at 1,350m,close to the base of the lavas. It is possible that the diatreme exploded at this stratigraphic break.This inference is supported by the lack of sedimentary xenoliths in the Main Pipe.
The xenoliths present in the Main Pipe indicate that the pipe was derived from the mantle inthe wide temperature range 620° – 1,250°C, with a peak at around 930° – 1,000°C.
9.2 Satellite Pipe
The Satellite Pipe is a kidney-shaped intrusion measuring 425m along its NNE-SSW axis by130m (Figure 9). The surface expression covers an area of 4.7ha. Historical information showsthat the dip of the lava contact varies from 83° west on the eastern side to almost vertical in thenorth and south, to 62° west on the western side. Consequently the area of the pipe increaseswith depth to at least a depth of 150m. This increase in area with depth was identified fromhistorical drilling and confirmed by underground sampling. It was also demonstrated by agravity survey in 1968 carried out by the International Geological Survey (“IGS”).
A lenticular wedge or raft of lava is present in the Satellite Pipe which results in its kidneyshape (Figure 9). The wedge extends from the central area of the pipe to the southwestern endand is located immediately adjacent to the western sidewall.
The wedge tapers downward which results in the pipe expanding with depth. Below the base of thewedge, the pipe is elliptical in plan, and tapers at 83°, in conformity with the eastern sidewall.
The geometry suggests that the pipe area will continue to expand to a depth of approximately150m, below which it will taper like most kimberlite pipes.
DESCRIPTION
These types are variants of K1, distinguished bytheir relative proportions of kimberlitic heavyminerals. Referred to historically as Non-K6 or K1,they are referred to as K1 in this report.
These are distinctive micaceous types,distinguished from each other by their garnetcontent. They appear to be barren of diamonds.They have an irregular occurrence and distributionand occupy very little of the area of the pipe at thelevels mapped.
A discrete intrusion within the pipe, measuring245m by 185m at surface. It is differentiated fromall other phases (except K7) by the relatively highgarnet content and abundance of mantle-derivedultramafic xenoliths. Lava xenoliths constitute upto 15% of the rock and are up to 2m in diameter.
It has a higher garnet and chrome-diopside contentthan K6, implying an even higher ultramaficxenolith content, but with few crustal and countryrock xenoliths. Occupies very little of the area of thepipe at the levels mapped.
Seen only as a 2.5m wide zone in borehole core, itconsists of abundant small lava xenoliths and rareolivines.

75
Figure 8: Surface Plan of the Main Pipe Showing Geology in relation to Exploration

76
Figure 9: Surface Plan of the Satellite Pipe Showing Geology in relation to Exploration

77
The contact with the surrounding lavas is sharp. The lavas of the wedge are coarsely brecciatedand impregnated with calcite-chlorite veining. The outer contact of this brecciated zone is anarrow kimberlite dyke, with a sharp contact with undisturbed lavas to the west, whichindicates that the wedge is a very large xenolith. The Satellite Pipe’s ultramafic xenoliths showa distinctly bimodal distribution, with one peak at around 800°C, and the other between 1,260°and 1,280°C.
Early surface mapping of the Satellite Pipe led to the identification of nine varieties ofkimberlite, distinguished mainly on the basis of colour. Subsequent surface and undergroundmapping by De Beers demonstrated that the colour differences were due to differentialweathering effects, and that the Satellite Pipe is comprised of only one or possibly two discretekimberlite intrusions. The kimberlites are autolithic tuffisitic breccias, similar to the K1 of theMain Pipe. Further mapping will be required on the facies exposed during the mining processto confirm the presence of a second facies or intrusion.
10. SAMPLING AND EVALUATION OF KIMBERLITE DEPOSITS
The primary hosts for diamonds are kimberlites, lamproites and related rocks. The weathering anderosion thereof gives rise to secondary deposits which can be divided into a number of distinctclasses, dependent on the distance of transport from the primary host and the sedimentaryenvironment in which they are laid down.
A number of problems are inherent in diamond sampling and evaluation, and any explorationprogramme should be designed to mitigate these problems:• diamonds are present in an economically viable deposit in extremely small quantities, and their
distribution within the host tends to be erratic (e.g. 1cpht is equivalent to 0.002 parts per millionor 2 parts per billion);
• the size and value of stones is erratic and it is possible that the bulk of the parcel value isattributable to a single stone. The value of a stone is related to its colour, quality and size; and
• valuation of the better quality diamonds, which normally constitute most of the inherent value ofthe deposit, tends to be subjective and is dictated by an unpredictable, fashion-controlled marketdemand.
Multiple intrusions within a single kimberlite pipe can cause the diamond grade to vary from barrenin one facies to in excess of 100cpht in an adjacent one. To eliminate the evaluation problems causedby these factors, very large samples are required. The accurate evaluation of a deposit is generallynot possible without advancing to the stage of pilot mining.
In order to determine the typical revenues to be expected for a diamond deposit, the following isrequired:• the grade (cpht). This is the estimated number of carats contained in one hundred tonnes of ore.
The grade of diamond deposits typically varies from 60cpht to 1cpht for kimberlites and 2.0 to0.3cpht for alluvial deposits (Figure 10). At an average grade of 1.72cpht for both the pipes,Letseng is a low grade kimberlite;
• the diamond size frequency distribution is a cumulative plot of the percentage of stones found ineach size fraction of the sample. Confidence in the sampling results is obtained when multiplesamples of the same kimberlite display similar curves. This curve provides information regardingthe overall value of the stones. For example, a high percentage of large stones will provide a highvalue to the overall parcel. Hard rock tends to show a lower number of small stones due to thisreduction in liberation, i.e. soft or weathered kimberlite releases stones more readily than hardunweathered kimberlite. Letseng is unique in its ability to produce large stones on a regular basis;and
• the recovered diamond sample should be sold as a parcel in today’s market to provide a typical valuefor the diamonds of the deposit. This value is quoted as US$/ct for the whole parcel and typicallyvaries from US$1,400/ct for an alluvial deposit such as Saxendrift Mine (South Africa) to US$7/ct fora low value primary deposit such as Argyle Mine (Australia). Kimberlites are characterised by a lowdiamond value in comparison to alluvial deposits (Figure 10). Letseng has achieved an average priceof US$1,264/ct for its total production between May 2004 and March 2006.

78
Figure 10: Global Diamond Grades and Values

79
In order to assess a diamond deposit with respect to the resource available for mining, theSAMREC Code must be applied. There are three parameters that are investigated with respectto their continuity within the deposit. These parameters must be specified in the diamondresource and reserve statement and include the following:• tonnage, which is calculated on the volume of the ore deposit multiplied by its density or
specific gravity;• grade; and• diamond value.
The Letseng deposit is characterised by the presence of large (+10.8cts) and valuable stones.Approximately 80% of the revenue generated by the mine comes from these large stones.Letseng is the only kimberlite deposit, yet discovered, which has a grade and diamond valuesimilar to that of an alluvial deposit (Figure 10).
11. HISTORICAL EXPLORATION AND MINING
11.1 Historical Ownership and Activities
The historical ownership and associated activities with respect to Letseng are summarisedin Table 3.
Table 3: History of Letseng Diamond Mine
YEAR/S
1957
1958 – 1968
1967
1968 – 1972
1972/73
1974
1977
1978/79
1979
1977 – 1982
May 1982
1996
1998
1999
2002
Mar 2004
COMPANY
Leeds University
Artisanal Diggers
InternationalGeological Survey
RTZ
De Beers
De Beers
De Beers
De Beers
De Beers
De Beers
De Beers
Letseng Diamonds
Letseng Diamonds
Letseng Diamonds
Consolidated AfricanMines Ltd (“CAM”)
Letseng Diamonds
ACTIVITIES
The Main Pipe was discovered by P H Nixon of Institute of African Geology.
An estimated 6,000 artisanal diggers treated approximately 1.0 – 1.5Mt ofalluvial gravel, overburden and weathered kimberlite from the Main andSatellite Pipes, recording 62,070cts of production. Occasional large, highquality diamonds were discovered which included a 527ct stone in 1965 andthe famous 601ct “Lesotho Brown” in 1967.
Geophysical surveys conducted which outlined the pipes and suggestedthat the Satellite Pipe expanded in depth towards the west.
RTZ mapped and diamond-drilled 2,100m into both pipes. Tested the MainPipe underground, the K6 zone on surface, and the Satellite Pipe on surface.The presence of occasional large diamonds was proved in both pipes. RTZdecided that Letseng was not viable, and abandoned their option.
De Beers took out a one year option on the property and extended the RTZunderground development to sample the Satellite Pipe (30,000t), using theRTZ plant for treatment.
Commencement of De Beers’ investment in the mine, initially to exploit theK6 zone kimberlite.
First production by De Beers after a capital outlay of some US$36m.Mining commenced in the K6 open pit, stockpiling low-grade K1.
Two bulk samples (~150,000t) taken from the surface of the Satellite Pipe.
Mining of Satellite Pipe commenced.
Mining initially of the K6 zone to 120 m, followed by the Satellite Pipe to adepth of ~30 m. Total tonnage treated was 9.016m, for the recovery of272,840ct, valued at US$109m ($402/ct) (1982 monetary value) as a result oftheir diamond sales. Of this tonnage, 863,823t came from the Satellite Pipe.
De Beers ceased mining, as the operation was not viable.
Company formed to exploit the Letseng kimberlites.
Application for Mining Lease submitted. 50% holding by JCI Gold Limited.
Disposal of JCI Gold Limited of their 50% share to New Mining CorporationLimited (Now Matodzi).
Acquisition of 40% interest in Letseng Holdings from Letseng Guernsey.
Mine production commences.

80
11.2 Historical Exploration, Bulk Sampling and Mining Results
Historical exploration and bulk sampling was undertaken initially by RTZ between 1968 and1972. This was followed by De Beers in 1972 and 1973. The description of the sampling methodsand results follow.
11.2.1 RTZ Exploration
In mid-1968, RTZ acquired an option over Letseng. They surveyed and mapped the pipes,completed 2,100m of diamond drilling, and conducted surface and underground sampling.
Drilling was undertaken to delimit the outline of the Main Pipe below surface, and toestablish the dip of the kimberlite/lava contact, the dip of the contact of K6, K1 and thelavas, together with contact dips of the Satellite Pipe. Only mineralogical samples weretaken from the drill core. No logs of these boreholes are available.
The RTZ data was obtained by Letseng Diamonds from the Department of Mines inMaseru and was also included in the information obtained by Letseng from De Beers. Itis assumed that the sampling was accurately undertaken and that, as a consequence ofstrict security at all times, the results are reliable. Also, RTZ is an international miningcompany which was genuinely interested in exploiting the deposit for their own account.There has been no independent verification of the results.
A series of ground geophysical surveys (gravity, magnetic, electrical) were undertaken bythe IGS Geophysics Unit in 1967 to delineate the extent of the kimberlites. This surveyindicated that the Satellite Pipe expanded at depth towards the west.
To avoid the effects of surface enrichment and artisanal activities, RTZ initially sampledthe Main Pipe by means of underground development (Figure 8). This programmecomprised underground drives of 3.0m by 2.7m, developed on a 122m2 grid, at a nominaldepth of 55m. Development within the kimberlite totalled 2,110m. All developmentmaterial was processed in a pan plant as bulk samples. Each progression of thedevelopment, nominally 200t, was surveyed by suitably qualified personnel. The tonnageof each bulk sample was measured on a weightometer. The samples were taken on aregular basis resulting in good continuity of data. A 25tph pan plant was erected toprocess the sampling material. The sampling results are summarised in Table 4:
Table 4: Historical Sampling and Mining Results
DEPTH CUTFROM AVE OFF
SURFACE GRADE SIZESOURCE COMPANY YEAR/S TYPE (m) FACIES TONNAGE CARATS (cpht) (mm)
Main Pipe RTZ 1968 – 1972 Surface Sampling 0 K6 7,531 382 5.07 1.00K1 2,514 48 1.91 1.00
Underground (“u/g”) Sampling 55 K6 10,177 441 4.33 1.00
K1 48,162 1,059 2.20 1.00De Beers 1977 Mining K6 680,000 22,688 3.34 2.00
1978 Mining K6 1,367,000 47,187 3.45 2.001979 Mining K6 997,000 32,711 3.28 2.001980 Mining K6 1,415,310 40,314 2.85 2.001980 Pit wall sampling K1 52,838 1,217 2.30 2.001981 Mining K6 1,700,100 47,632 2.80 2.001982 Mining K6 448,900 12,659 2.82 2.00
Satellite RTZ 1968 – 1972 Surface Sampling 0 N/A 12,185 471 3.87 1.00Pipe De Beers 1978 – 1979 Surface Sampling 0 N/A 52,235 1,864 3.57 1.00
1978 – 1979 Surface Sampling 0 N/A 100,000 2,914 2.91 1.001973 U/g Sampling 85 N/A 29,845 827 2.77 1.001979 Mining N/A 600,000 16,800 2.80 2.001980 Mining N/A 437,690 12,255 2.80 2.001981 Mining N/A 188,900 5,289 2.80 2.001982 Mining N/A 886,600 25,000 2.82 2.00
Stockpile De Beers 1982 Sampling 0 N/A 94,500 1,455 1.54 2.00Letseng 2004 Sampling 0 N/A 60,364 1,163 1.93 2.00

81
Surface sampling (indicated in grey above) of the Main Pipe commenced in 1971, bymeans of trenches located above the underground drives (Figure 8). The samplingconcentrated on the K6, which the underground sampling had shown to have the highergrade. The geology of the underground and surface was shown to correlate well,demonstrating the vertical continuity of the mapped kimberlite facies.
The Satellite Pipe was also sampled by surface trenching (Figure 9). Gravel overburdenwas first stripped and dumped so that the treated sample was uncontaminated byweathered kimberlite. Stones greater than 1mm were recovered.
RTZ decided to halt further exploration and development of the project in 1972.
RTZ’s decision to abandon the property was subsequently found to be premature due toan incorrect value reported for the diamonds. Their decision to abandon the property wasbased upon it being uneconomic. RTZ used a single independent evaluator, who wasrequired to purchase the diamonds at his valuation price any time that RTZ required. Nosecond opinion was obtained. After RTZ relinquished their option, the LesothoGovernment required two further diamond valuations, for tax purposes. The RTZvaluation was to be accepted provided that the other two valuations were within 15% ofit. The additional two valuations, as well as other subsequent valuations, were morethan double that of the independent valuator. Upon consideration of the new valuations,RTZ tried to renew their option, but were unsuccessful.
11.2.2 De Beers Exploration
De Beers acquired a one-year option over the property in 1972. In 1973, they extendedthe RTZ underground development by 450m, to gain access to the Satellite Pipe, at adepth of 85m (Figure 9).
The De Beers information was purchased by CAM during November 2001. It is assumedthat the samples were accurately obtained, as De Beers is an international miningcompany that wished to exploit the deposit for their own account. Over and above this,high security was maintained on the operation at all times. There has been noindependent verification of the results. However, these results have been compared toother sampling and operational results to determine their accuracy. De Beers usedsimilar sampling techniques to RTZ on a 60m2 grid. All sample positions were surveyedby suitably qualified personnel.
De Beers processed the samples through the RTZ pan plant with a minimum screen sizecut-off of 1mm. The results of the De Beers Satellite Pipe underground sampling areshown in Table 4.
11.2.3 De Beers Historical Mining and Further Exploration
In 1974, De Beers began construction of a full scale mine and plant to exploit the K6kimberlite in the Main Pipe. The initial capital outlay was US$36m. Full productionfrom the K6 commenced in 1977 (Figure 11).

82
Figure 11: Historical Mine Production by De Beers
Non-K6 kimberlite from the Main Pipe was considered to be low grade and wasstockpiled. The resultant stockpile consisted predominately of K1 and, to a significantlylesser extent, the barren K4 facies.
The minimum diamond size recovered by the De Beers plant from the mining operationswas 2mm. Grades for the K6 zone decreased with depth from a quoted 3.34cpht in thefirst year of operations to 3.17cpht in 1982, at a depth of 120m, five years later.
The decrease in grade in the K6 with depth was attributed to poor liberation of smalldiamonds from the hard ore. The figures were further distorted by blending with theSatellite kimberlite in the plant. The slightly lower grade of the K6, when compared tothe RTZ figures for their underground development, reflects the differences in minimumstone size recovery of the two plants.
There is little data available as to the different diamond size distributions of the Mainand Satellite Pipes from the mining operation. Given that ores from the K6 and Satellitewere blended in the plant, it is probable that this data was never collected. Only thetonnage of Satellite kimberlite treated was recorded and a single Satellite sales batch.
K6 information was obtained from the 1977 and 1978 sales batches which consistedsolely of this kimberlite. Using the relative proportions of Satellite to K6 treated, and theknown grade of the K6 kimberlite treated before blending commenced, the drop in gradeof the blended material indicated a grade for the Satellite of the order of 2.80ct/ht. Thiscompares well with figures estimated from the underground sampling.
De Beers continued exploration activities while mining progressed. The results arerecorded in Table 4. De Beers ceased mining in May 1982. Mining of the K6 zone wasplanned to a depth of 140m, but ceased at 120m, due to the intersection of the barren K4within the K6 zone. This resulted in the stripping ratio below that depth becomingunpayable in the prevailing slump in the diamond market in 1981 – 1982. At the sametime mining of the Satellite Pipe ceased due to depletion of the soft, and more easilymined kimberlite ores. The reasons cited for the closure of the De Beers operation atLetseng included the following:
• a poor diamond market and low diamond prices;
• high operating costs;
• government diamond taxes which were becoming prohibitive in light of the weakdiamond prices; and
• the prevention by the Lesotho government of De Beers to either reduce production toa selected quota or place the entire operation on care and maintenance.

83
12. CURRENT SAMPLING AND EXPLORATION
12.1 Diamond Drilling
Letseng Diamonds contracted a South African drilling company, Geomechanics cc(“Geomechanics”), to undertake a diamond drilling programme on both pipes in order to:
• confirm the vertical continuity of kimberlite with depth;
• identify the different kimberlite facies present within the Main Pipe and their geometry;
• identify the vertical extent and geometry of the raft within the Satellite Pipe; and
• sample the cores for geotechnical studies and density measurements.
A total of 8,534m of core was drilled into both pipes between June 2005 and March 2006. The borehole positions are shown on Figure 8 and Figure 9 and the results are summarised in Table 5.
Table 5: Borehole Results
EOH* MAXVERT. DEPTH
DEPTH OFCO-ORDINATES AVE AVE (Below KIMBERLITE
DATE AZIMUTH DIP LENGTH datum (Below datumPIPE B/H NO. COMPLETE X Y Z (°) (°) (EOH m) 3,060m) 3,060m)
Main Pipe 1-2RP 21 – Feb – 06 -13,027 -3,209,470 3,009 23.98 -60.61 204.11 228.82 219.352-1RP 04 – Sep – 05 -13,002 -3,209,508 3,013 243.01 -53.81 494.22 446.31 435.662-2RP 17 – Oct – 05 -13,001 -3,209,507 3,012 62.62 -55.55 395.07 373.34 354.003-1RP 02 – Nov – 05 -12,984 -3,209,561 3,017 265.53 -54.43 491.47 442.31 432.923-3RP 14 – Nov – 05 -12,983 -3,209,561 3,018 89.49 -54.15 338.15 316.46 302.854-1RP 27 – Nov – 05 -12,936 -3,209,647 3,044 306.37 -55.38 346.97 301.35 301.354-2RP 16 – Jan – 06 -12,880 -3,209,844 3,056 316.03 -62.75 248.47 224.47 224.475-1RP 11 – Dec – 05 -13,072 -3,209,771 3,048 352.43 -51.13 317.07 259.16 259.166-1RP 17 – Oct – 05 -13,198 -3,209,784 3,048 26.43 -52.13 317.30 262.83 258.626-2RP 03 – Nov – 05 -13,256 -3,209,931 3,066 22.19 -48.64 230.40 166.50 166.508-1P 02 – Aug – 05 -13,325 -3,209,474 3,064 119.97 -57.60 444.11 370.65 370.65
9-1RP 22 – Feb – 06 -13,183 -3,209,285 3,074 161.10 -62.82 571.30 494.69 494.6910-1P 21 – Apr – 06 -12,967 -3,209,731 3,046 325.46 -58.54 389.90 346.47 346.47
TOTAL 4,788.54
EOH* MAXVERT. DEPTH
DEPTH OFCO-ORDINATES AVE AVE (Below KIMBERLITE
DATE AZIMUTH DIP LENGTH datum (Below datumPIPE B/H NO. COMPLETE X Y Z (°) (°) (EOH m) 3,100m) 3,100m)
Satellite Pipe S001 22 – Sep – 05 -13,841 -3,209,701 3,087 100.47 -50.02 336.09 270.87 259.19S002 24 – Oct – 05 -14,022 -3,209,664 3,100 105.12 -48.56 684.11 512.62 501.86S003 20 – Nov – 05 -13,992 -3,209,515 3,131 92.34 -49.75 666.17 477.97 468.25S006 27 – Nov – 05 -13,621 -3,209,262 3,109 190.49 -52.01 477.17 367.49 367.49S007 05 – Dec – 05 -13,776 -3,209,994 3,083 9.47 -57.45 144.08 138.10 Hole stoppedS008 12 – Mar – 06 -13,340 -3,209,790 3,069 285.98 -50.24 825.13 665.70 655.26S009 14 – Mar – 06 -13,343 -3,209,639 3,066 274.25 -56.92 612.22 547.39 547.39
TOTAL 3,744.97GRAND TOTAL 8,533.51
* EOH – End of hole
The holes were drilled using either a new Atlas Copco CS1500 or a new Boart Longyear LF90rotary core drill rig. Standard tubes were used. The holes were to be inclined at a dip of between50° and 75° with an initial core diameter of 63.5mm (“HQ”). This was followed by 47.6mm(“NQ”) to the bottom of each of the holes.
Mr Dave Rossiter, Managing Director and owner of Geomechanics, was responsible for thedrilling. The drill crew was managed by two full time supervisors with kimberlite drillingexperience. The supervisors reported to the Geomechanics’ Works Manager. The core wasextracted by tilting. The core was measured by suitably trained and experienced core writers,with measurements checked by the supervisors and the on-site geologist. The core recoveries,

84
on average were high (>90%) except in the boreholes where clay was intersected. At thesedepths the core recovery was low with concomitant water losses resulting in the cession ofdrilling. All cores were removed from the drill site on a daily basis and stored in core boxes eachholding 12m and placed in a freight container. The following adverse drilling conditionsresulted in slow penetration rates:• very cold weather during the winter months;• fractured ground within the basalt;• highly weathered kimberlite, in the form of clay, which resulted in the termination of two
holes on the Main Pipe; and• the losses of water in the basalt and on the basalt/kimberlite interface requiring multiple
grouting of a number of holes.
South African consulting mining engineers, MineNet (Pty) Ltd (“MineNet”), were contracted byLetseng to manage the drilling programme. MineNet’s consulting geologist, Dr Patrick Bartlett,was responsible for overseeing the logging and sampling the core. Dr Bartlett is a highlyqualified geologist with multiple degrees in geology and mining.
He has 40 years experience in the exploration, sampling and mining of diamond deposits insouthern Africa. Venmyn’s associate, Mr Anthony Bloomer, has independently viewed andverified the logging of a number of the boreholes.
All borehole positions were surveyed by Letseng’s resident mine surveyor, Mr Taelo Maleka. Mr Maleka has an international degree in surveying and mapping, and a local degree inscience. He is registered with various institutions and associations of surveyors. He has beenemployed at Letseng since the mine opened and has practised as a surveyor since 1983. Thetopographical controls are sufficient and the quality of all surveys was good.
The maximum depth of kimberlite in the Main and Satellite Pipes were confirmed to a verticaldepth of 495m and 655m, respectively. The boreholes provided sufficient information to beutilised in the classification of the resources.
12.2 Bulk Sampling of the Main Pipe
Letseng Diamonds commenced with a bulk sampling programme of the K1 facies on the easternrim of the Main Pipe (Figure 8) in November 2004 and completed it in October 2005. The mineutilised the services of alluvial mining contractors namely, Alluvial Ventures and TlaeengMining (Pty) Ltd, to undertake the mining and processing of the bulk samples. Thesecompanies received a share in the revenues from the diamonds extracted from these areas. Thisrevenue share is provided for in existing contracts and has ensured that accurate results wereobtained with respect to the diamond recovery. Tlaeeng is no longer conducting mining atLetseng as the company is in liquidation.
The area was divided into a series of ore blocks (Figure 8), for which the grades and associatedtonnages were measured. The surface of each block was cleared of all diggers’ spoils prior tosampling. The ore comprised rippable weathered kimberlite. Alluvial Ventures processed orefrom the southeastern area through one 16ft and one 14ft pan plant with a 3.0mm bottomscreen size cutoff while Tlaeeng mined the northeastern area and processed the ore through one16ft pan plant with a 1.3mm cutoff.
Accurate grade figures could not be calculated because of concerns about potentialcontamination with alluvial material, digger’s spoils, surface enrichment and volumemeasurement of individual blocks. Consequently, these blocks were excluded from gradecalculations.
Between August and October 2005 two trenches were excavated into the K1 exposed by theprevious bulk sampling (Figure 8). The mining of these trenches was closely monitored, and thekimberlite volumes and diamonds extracted accurately measured. The results obtained fromthe trenches are summarised in Table 6.

85
Table 6: Results of Bulk Sampling on Main Pipe (K1)
AVE RECOV.CONTRACTOR TYPE VOLUME GRADE CUTOFF
(m3) SG TONNAGE CARATS (cpht) (mm)
Alluvial Ventures Trench 1 13,217 2.50 33,043 502.91 1.52 3.00
Trench 2 21,678 2.50 54,195 809.88 1.49 3.00
Tlaeeng Trench 1 4,907 2.50 12,268 242.59 1.98 1.30
TOTAL/AVE 39,802 99,505 1,555.38 1.56
These grades are notably lower than the grades historically measured by RTZ and De Beers,which may be a function of the utilization of a pan plant as opposed to a DMS. In addition, thebottom cutoff screen size of 3mm used by Alluvial Ventures would have contributed towards the lower grades when compared to those obtained by Tlaeeng. An increase in grade due to thebetter liberation qualities of weathered kimberlite was not evident.
13. GEOLOGICAL MODELLING AND RESULTS
13.1 Modelling of the Stockpile
No computerised geological or grade models have been prepared for the Stockpile.
13.1.1Calculated Volume
A laser survey was flown in 2001 by Airborne Laser Solutions. This digital terrain modelwith surface contours at 1m intervals formed the basis for the JCI volume calculation of the Stockpile. This figure compared well with the De Beers recorded tonnages. The remaining volume, taking into account the recent mining, is calculated in Table 7.
Table 7: Estimation of Volume of the StockpileDESCRIPTION VOLUME (m3)
Calculated in 2002 2,222,222
Less production (March 2004 – March 2006) 559,285
GRAND TOTAL STOCKPILE 1,662,937
13.1.2Estimated Grade
There are no detailed plots of vertical and lateral grade variations for the Stockpilederived from bulk sampling as the samples were not taken at regular intervals across thedeposit. In addition, no information was available from De Beers as to the order in whichthe Stockpile was deposited. As a result, mapping of the facies within the Stockpile hasnot been possible. However, there is sufficient information to make an estimate of gradewith a reasonable level of confidence. Note that all grades are estimates of the recoveredgrade of the orebody using the current plant.
The stockpile consists predominately of K1 ore extracted from the Main Pipe by De Beersduring their mining of the K6. The K4 facies was also deposited on the stockpile by De Beers as well as other kimberlite facies encountered (K Other). Measurements of thestockpile grade only were sourced from a De Beers sample, a sample taken by Letseng inAugust 2004 and campaigning through the current plant (Table 8).

86
Table 8: Estimation of Grade in the StockpileAVE RECOV.
GRADE SOURCE TONNAGE CARATS (cpht)
De Beers Sampling 94,500 1,455 1.54
Letseng Sampling (August 2004) 60,364 1,163 1.93
* Letseng Stockpile Only Production (January 2005 – March 2006, Post-plant modification) 141,692 2,234 1.58
** Letseng Grade of Stockpile assumed from Combined (Satellite and Stockpile) Production 1,131,248 17,874 1.58
ESTIMATED GRADE USED IN RESOURCE STATEMENT 1.58
The Stockpile is comprised of Main Pipe (K1 and K Other) and its grade represents the ave grade of thesefacies.* Campaigning of Stockpile material only through plant during this period.** Grade assumed to be an average of 1.58cpht, based upon Stockpile campaign results.
The DMS plant underwent a modification to the feed preparation screen of the recrushcircuit in December 2004 whereby the aperture was increased from 19mm to 22mm. The modification is discussed in further detail in Section 16.1. The impact of thisadjustment was that diamonds less than 3 grain (“gr”) (or 0.66cts – 0.89cts) were notrecovered. The modification was undertaken to reduce the recirculating load to thetertiary crusher which had previously created a bottleneck in the ore flow.
The implications of the loss of these small diamonds were investigated by WWW in June 2005. Their investigations were based upon the size frequency distributions andassociated diamond prices of tenders before and after the modification. WWW identifiedthe following:• a reduction in the recovered grade of between 0.48cpht and 0.65cpht (average =
0.56cpht); and• a loss of associated revenue of US$88,661. This loss in revenue amounted to 0.3% of
the total revenue received for these parcels.
The result of the plant adjustment was to reduce the recovered grades but the effect onthe average diamond price was negligible. The mine management has made the decisionto maintain these aperture sizes in the current plant and any future plant that will beused to treat the ore.
Therefore, the grade figures measured after this modification are a more accuratereflection of the recovered grades to be expected from future production from the variousore sources. As a result, these recent measurements have had a greater influence on theestimates of grade than the pre-January 2005 results.
Note also that the mine currently processes a combination of Stockpile and Satellite orethrough the plant. Although the tonnes from each source are measured, only a combinedgrade is calculated (from the total number of carats produced by the plant). However, ifa grade is assumed for one of the sources, in this case the Stockpile, then the grade of theother source (Satellite) may be back-calculated.
The estimate of grade for the Stockpile is based upon the results of the campaigned oreprocessed using the current plant setup. A further indication of the grade of the K1 faciespresent in the Stockpile is the grade of 1.56cpht measured from trenching by the alluvialcontractors within the Main Pipe (Section 13.2.2 and Table 10).
All diamonds recovered from the plant are acid washed prior to sale. The wash dissolvesdirt sticking to the diamonds and any stones which are not diamonds. The pre and postwash carats are measured for every parcel and the average loss is calculated at 1.65%.All grades quoted have taken this loss into account (Table 8).

87
13.2 Modelling of the Main Pipe
The first computerised modelling on the Main Pipe was undertaken by Venmyn in 2002 as partof their due diligence exercise. Venmyn modelled the RTZ underground sampling results fromfirst principles using Surfer® in order to:• investigate the grade distribution variations of the K1; and• investigate the stone size distribution variation of the K1 and K6.
An inverse distance squared method of estimation was used with a search radius of 30.48m.The results are shown in Figure 12. The outlines of the various kimberlites were overlain ontothe Surfer plots. The following results were obtained:• the K6 has a higher grade and number of stones per tonne of kimberlite relative to the K1;• the barren K4 is clearly visible;• the average grade of the K1 is in the order of 1.5cpht to 2.5cpht; and• the average stone size for the K6 and K1 is similar, as shown by the plotted data at
0.30ct/stone for the K6 and 0.29ct/stone for the K1.
MineNet was contracted by Letseng Diamonds in January 2005 to compile a three dimensionalmodel of the pipe and the facies within it. MineNet utilised the MineSight Applications (Pty)Ltd (“MineSight”) software. All the available historical plans from the surface and undergroundwere digitised and used as the basis of the model. There was some confusion, however, withrespect to the different coordinate systems used by the previous companies which appeared tohave a rotational discrepancy. These were aligned, as accurately as possible, and thenconverted into the current coordinate system being used by the mine. MineNet created wireframes of the K6, K4 and K1 (and K other) facies and used the historically measured contactangles to project the Main Pipe downwards.
Using this model, MineNet carried out an initial pit optimisation in May 2005 and the resultanteconomic pit extended to a depth of 427m below surface. In June 2005, a further ultimate piteconomic shell analysis was conducted to assess the impact of doubling the production rate andmodifying the diamond value and exchange rate parameters to the levels current at that time.This exercise deepened the economic shell to a maximum depth of 560m.
In May 2006, a new geological model was prepared by MineNet using the Micromine computermodelling software. This model utilised the following information:
• the previous surface digital terrain model;• the previous geological model including the De Beers mapping of the facies contacts at the
base of the pit and at the depth of the underground development;• latest mapping of the K1 and basalt contact on surface exposed by the surface bulk sampling
operations; and• drilling results for 13 boreholes.
The geological model was created using wire frames of the K6, K4 and K1 & K Other. Theframes were projected down to an elevation of 2,500m amsl, or approximately 65m below thelowest borehole intersection. A series of cross sections, drawn from the latest model, areindicated on Figure 13 and a view in three dimensions is shown in Figure 14. The newgeological model has indicated the following:• the tongue of K4 present at surface does not persist at depth;• K6 is persistent, but narrows with depth;• the overall pipe footprint at surface is slightly increased as K1 occurs over a greater surface
area;• a breccia within the K1 at surface does not persist with depth;• the overall pipe footprint at depth is also increased indicating less of a taper in the pipe’s
shape; • the limit of the pipe has been defined in all directions; and• in areas of transition between the various kimberlite facies, the model assumes it to be the
facies with the lower grade. This is prudent for optimisation purposes.

88
Figure 12: Modelling of Historical Sampling Results Using Surfer

89
In June 2006 MineNet undertook a mine design and pit optimisation exercise based on theoutput of the new model. The exercise used the following input parameters:• production rate of 5.16mtpa;• exchange rate of US$1.00:ZAR6.50;• recovered grade for K1 & K Other = 1.58cpht; K6 = 2.51cpht and K4 = 0.00cpht; and• average diamond price of the Main Pipe of US$974/ct.
The results are detailed in Section 15.4.
13.2.1Calculated Volume
In order to quantify the volume and therefore the tonnage of the Main Pipe to be used inthis valuation, the requirements of the SAMREC Code were applied. The SAMREC Codeassesses the confidence which the Competent Person has in the continuity of the pipewith depth (volume) and the associated continuity of grade and diamond value. Thisassessment is based upon all information available on the pipe and includes thehistorical and recent exploration, sampling and production data.
The recent boreholes have confirmed the existence of kimberlite at a maximum verticaldepth from datum (3,060m amsl) of 495m. All volumes used in this report have beencalculated using the latest model generated in the Micromine modelling computersoftware package. The following information was taken into account when determiningthe base level of the resource as required by the SAMREC Code (Figure 15):• historical sampling at surface by RTZ;• historical sampling at a depth of 55m from surface by RTZ;• historical production and sales records from De Beers to a depth of 120m;• recent bulk sampling and sales records from near surface in K1; and
• recent borehole intersections of the kimberlite and facies identification therein to amaximum vertical depth of 495m.
The lower limit of the estimated diamond resource has been determined at the base of the ultimate pit, as designed and scheduled by MineNet. According to the SAMRECCode, a Resource must have “prospects for eventual economic extraction” and it is for thisreason that the base of the Main Pipe Inferred Resources lies at the base of the economicshell (490m), and not at the lowermost kimberlite intersection (495m). The associatedvolumes of kimberlite occurring within the ultimate planned pit are summarisedin Table 9.
Table 9: Estimation of Volume for the Main PipeDESCRIPTION DEPTH FROM DEPTH TO VOLUME
(m) (m) (m3)
Pit volume calculated from MineNet model (March 2006) 0 190 16,676,370
190 490 23,607,254
TOTAL 0 490 16,548,573
Less all bulk sampling of K1 to September 2005 0 5 127,797
GRAND TOTAL MAIN PIPE 0 490 16,420,776
13.2.2Estimated Grade
Grade measurements available for the Main Pipe include historical surface andunderground sampling, historical mining and recent contractor bulk sampling results.These measurements have been separated into K6 and K1 (and K Other) and aresummarised in Table 10.

90
Figure 13: Cross Sections through the Geological Model of the Main Pipe

91
Figure 14: Three Dimensional Models of Pipes

92
Figure 15: Main Pipe Cross Section Showing Sampling, Mining Results and ResourceElevations

93
Table 10: Estimation of Grade for the Main PipeSOURCE AVE RECOV.
GRADE K1 AND K OTHER FACIES TONNAGE CARATS (cpht)
RTZ Surface Sampling 2,514 48 1.91
RTZ Underground Sampling 48,162 1,059 2.20
De Beers Pit Wall Sampling 52,838 1,217 2.30
Trenching by Letseng’s Alluvial Contractors 99,505 1,555 1.56
* Letseng Stockpile Only Production (January 2005 – March 2006,Post-plant modification) 141,692 2,234 1.58
** Letseng Grade of Stockpile assumed from Combined Production 1,133,628 17,911 1.58
ESTIMATED GRADE USED IN RESOURCE STATEMENT 1.58
K6 FACIES
Surface Sampling 7,531 382 5.07
Underground Sampling 10,177 441 4.33
De Beers Mining Production 6,608,310 203,191 3.07
Letseng Mining Production None None None
ESTIMATED GRADE 3.07
Less grade associated with carats <3gr not recovered in current plant 0.56
ESTIMATED GRADE USED IN RESOURCE STATEMENT 2.51
***ESTIMATED GRADE OF MAIN PIPE USED IN RESOURCE
STATEMENT 1.64
Blocks shown in grey may be subject to surface enrichment.The Stockpile is comprised of Main Pipe (K1 and K Other) and its grade represents the ave grade of these facies.* Campaigning of Stockpile material only through plant.** Grade assumed to be an average grade of 1.58cpht, based upon Stockpile campaign results.*** Grade of Main Pipe based upon geological model and the planned extraction thereof.
The estimated grade for the K1 and K Other facies is based upon the campaigned postplant modification grade results from the Stockpile. Additional comfort is obtained fromthe trenching results for K1. It must be noted, however, that this ore was treated throughthe alluvial contractors’ pan plants. Pans typically have lower diamond recovery ratesthan DMS plants.
Venmyn has used the De Beers mining grades in its estimation of the grade of the K6,since there are no recent mining records for this facies. These results were determinedfrom a large tonnage (6.6Mt) extracted over the entire surface exposure of the K6 faciesto a maximum depth of 120m and therefore can be considered a representative sample.
The grade is then reduced by the predicted loss of stones to correct it to the recoveredgrade pertaining to the current plant.
The grades for the respective facies were included into the pit optimisation and mineplan. The average grade for the Main pipe to a depth of 490m is calculated at 1.64cpht(Table 10) based upon the MineNet modelling.
13.3 Modelling of the Satellite Pipe
Datamine South Africa (Pty) Ltd (“Datamine”) was contracted by JCI in 2001 to undertake a block model and pit optimisation exercise in order to identify the economic pit bottom, takinginto account the mining and processing costs at that time. Datamine utilised the historicalinformation to compile the model which determined an economic pit to a depth of 390m fromsurface with an average stripping ratio of 2.37.

94
During Venmyn’s due diligence exercise in 2002, the RTZ and De Beers surface and undergroundgrade data was modelled from first principles using Surfer® to compare the grade variations ofthe Satellite Pipe with increasing depth (Figure 12). From the modelling it was evident that:• a high grade area occurs just south of the central area of the pipe. These high grades continue
with depth; and• two low grade areas in the far north and far south of the pipe are present which are also
continuous with depth.
MineNet was contracted by Letseng Diamonds in 2004 to produce a mine plan for the SatellitePipe. The company utilised the geological model, digital terrain model around the pipe and theDatamine model and entered all the information into the MineSight computer modellingsoftware. MineNet undertook an initial pit optimisation exercise in December 2003 on theSatellite Pipe. The resultant economic pit reached a depth of 260m below surface with anoverall stripping ratio of 1.07.
In June 2005 a further economic shell analysis was undertaken in order to sensitise theeconomic pit shell to mining cost, ZAR:US$ exchange rate and diamond price. The resultantpotentially economic pit for the base case reached a depth of 418m below surface with an overallstripping ratio of 2.11, and a depth of 439m with a stripping ratio of 2.34 for the Expansion.
In May 2006 MineNet created a new geological model in Micromine. This model utilised thefollowing information:• the digital terrain model;• the previous geological model;• the latest mapping of the kimberlite/basalt contacts on surface and at various intervals as
the pit has been excavated; and• recent drilling results from seven boreholes.
MineNet created wire frames for both the raft and the satellite to a depth of 2,400m amsl,approximately 45m below the deepest borehole intersection at a vertical depth of 655m belowdatum (3,100m amsl). A number of cross sections drawn from the model are shown in Figure 16and a three dimensional view is highlighted in Figure 14. The new model indicated thefollowing with respect to the Satellite Pipe:• the surface footprint of the pipe has increased slightly;• the pipe does not taper as steeply as previously envisaged and dips to the west;• no new facies types were encountered in the boreholes;• the raft does not persist with depth;• the dips at various elevations have been accurately measured on the west of the raft;• the measurements of the dip on the east of the raft were highly variable;
• the extent of the raft has been projected to a point halfway between the lowest raftintersecting borehole and the following borehole with no raft intersection; and
• the limit of the Satellite Pipe to the south has not been accurately defined as borehole S007stopped short of a kimberlite intersection.
In June 2006 MineNet completed a pit optimisation and mine planning exercise using the newmodel. The following input parameters were used:• Expansion production rate of 5.16mtpa;• exchange rate of US$1.00:ZAR6.50;• recovered grade = 1.93cpht; and• diamond price of US$1,456/ct.
The results are detailed in Section 15.5.
13.3.1Calculated Volume
In order to identify the volume of the Satellite Pipe to be used in the valuation therequirements of the SAMREC Code were applied. The assessment of the CompetentPerson was based upon all information available on the pipe including the historical andrecent exploration, sampling and production data as shown on Figure 17. All volumesused in this report are based on the current model and were calculated using oreenvelopes generated in Micromine. The information included:• historical surface sampling by RTZ;• historical underground sampling by De Beers at an estimated depth of 83m below surface;

95
Figure 16: Cross Sections through the Geological Model of the Satellite Pipe

96
Figure 17: Satellite Pipe Cross Section Showing Sampling, Mining Results and ResourceElevations

97
• historical production by De Beers from surface to a depth of 20m; • recent drilling results reaching a maximum vertical depth of kimberlite intersected at
502m; and• recent production and sales to a depth of 82m from surface.
The base of the Indicated Diamond Resource, estimated in 2002 to a depth of 120m, hasbeen extended downwards equivalent to the depth of current mining. The depth of theexcavation has increased by 62m. Therefore, the base of the Indicated DiamondResource, compliant with SAMREC, occurs to a depth of 182m from surface.
The recent drilling results have enabled the classification of additional resources in theInferred category from 182m downwards. Although a borehole intersection of kimberlitewas obtained at a depth of 502m, the base of the Inferred Resources has been alignedwith the deepest economic pit shell as identified by the MineNet pit optimisation. Thebase of this shell occurs at a vertical depth of 475m. According to the SAMREC Code, aResource must have “prospects for eventual economic extraction” and it is for this reasonthat the base of the Satellite Pipe Inferred Resources lies at the base of the economicshell, and not at the lowermost kimberlite intersection. The calculated volumes of theresources are shown in Table 11.
Table 11: Estimation of Volume of the Satellite PipeDEPTH DEPTH VOLUME
DESCRIPTION FROM (m) TO (m) (m3)
Pit volume calculated from MineNet model (March 2006) 0 182 5,698,322
182 475 12,234,810
GRAND TOTAL SATELLITE PIPE 0 475 17,933,132
13.3.2Estimated Grade
There is sufficient grade information from the Satellite Pipe, sourced from historicalsurface and underground sampling as well as the De Beers and recent mining records,to estimate grade with a reasonable level of confidence. The recorded grades for theSatellite Pipe are listed in Table 12.
Table 12: Estimation of Grade in the Satellite PipeAVE RECOV.
GRADE SOURCE TONNAGE CARATS (cpht)
Surface Sampling 164,420 5,249 3.19
Underground Sampling 29,845 827 2.77
De Beers Mining Production 2,113,190 59,344 2.81
* Letseng Satellite Only Production (March 2004 – December 2005, Pre-plant modification) 440,326 10,019 2.28
** Letseng Grade of Satellite calculated from Combined Production(March 2004 – December 2005, Pre-plant modification) 993,850 23,040 2.32
* Letseng Satellite Only Production (January 2005 –March 2006, Post-plant modification) 284,787 5,986 2.10
Letseng Grade of Satellite calculated from Combined Production(January 2005 – March 2006, Post-plant modification) 1,960,610 37,993 1.94
ESTIMATED GRADE USED IN RESOURCE STATEMENT 1.94
Blocks shown in grey may be subject to surface enrichment.* Campaigning of Satellite material only through plant.** Grade calculated assuming an average grade of 1.58cpht for Stockpile.
The estimated recovered grade for the Satellite Pipe is based upon the recent productionresults, post the plant modifications, back-calculated from the combined production. Thisfigure is used, rather than the campaigned results, as it represents a significantly largertonnage.

98
14. DENSITY MEASUREMENTS
Densities of the ore were initially measured by Minopex, in the plant in July 2005. The densitieswere re-measured, in detail, using samples of the borehole cores extracted from the drillingprogramme. Densities were measured for all rock types and facies in both their weathered and freshform. The results for fresh rock are shown in Table 13.
Table 13: Density MeasurementsPIPE ROCK TYPE FACIES NO. MINIMUM MAXIMUM AVERAGE
SAMPLES (kg/m3) (kg/m3) (kg/m3)
Satellite Kimberlite N/A 179 2.43 2.86 2.58
Main Kimberlite K1 and K Other 402 2.22 2.80 2.62
K4 51 2.49 2.72 2.59
K6 68 2.32 2.75 2.55
*AVERAGE 521 2.61
N/A Basalt N/A 687 2.24 3.14 2.70
N/A Stockpile N/A 2 2.02 2.04 2.03
All fresh rock measurements.
* Average as calculated from geological model and LOM plan.
The Stockpile density was calculated from the density measured by Minopex for the Main Pipe anddivided by a bulking factor of 1.3. These density values are used in the calculation of the resourcetonnages.
15. MINING
This section describes the current operating philosophy and outlines the mining method applied,installed production infrastructure, contracting conditions and associated operating costs. The expansion operation is also described in terms of the respective pit configurations and kimberliteoutput profiles. Current mine planning is based upon conventional open pit mining and economicshell ranking within the confines of the infrastructure installed and the prescriptions of Phase I andPhase II of the Mining Lease Agreement. Phase I required Letseng to mine at a rate of not less than120,000tpm until the requirements of Phase II become due in May 2009, under which the mine mustoperate a plant with design capacity of 500tph at 66% capacity.
The requirements of the lease are described in Section 6.1, and the mine will be required to produceat this increased capacity from September 2008. As a result of this requirement, the long-termoperating plan at Letseng was modified such that the Expansion included two modular 400tphprocessing plants as a means of optimising feed from the Main and Satellite Pipes in addition to thestockpile.
15.1 Current Mining Method and Equipment
The Satellite Pipe is currently being mined using traditional drill, blast, load and haul open-pittechniques, stripping waste where necessary in terms of the mining programme. Letseng doesnot operate an owned mining fleet, but contracts in the mining fleet and operators from MMICwhich arrangement continues until April 2009. MMIC operate under the direct supervision ofLetseng management and staff in terms of the execution of their activities on site. MMICcurrently own their earthmoving fleet which is serviced by Barlows on a full maintenancecontract basis.
The estimated economic limit of the final Satellite pit is at a depth of 475m (at an assumedaverage stone value of US$1,456 and an exchange rate of US$1.00=ZAR6.50), which willproduce approximately 46.3Mt of kimberlite at a basalt:kimberlite stripping ratio of 2.6. This pit would be achieved in three 65m cutbacks, with the starter pit currently 82m deep andhaving produced 2.96Mt of kimberlite.
Mine planning and scheduling carried out by MineNet was reported upon in two reportscompleted in March 2004. A later report in June 2005 contemplated economic shells for therespective pits producing matrices of potential economic pit shells by applying various stone

99
value, exchange rate and operating cost scenarios. More recent pit optimisation and LOMscheduling was carried out by MineNet in June 2006 stating the ultimate Satellite pit to bepotentially economic to a depth of 475m, well within the 502m depth to which the geology of thepipe has been established from drilling.
The base-case LOM schedule used for economic valuation purposes incorporated the IndicatedDiamond Resource only. In addition, an uplift LOM case was scheduled which included InferredDiamond Resource as a means of identifying the full potential presented by the in situmineralisation.
15.2 Recent Production
Letseng commenced pre-production operations in the last quarter of 2003 with the dewateringof the pre-existing pit in the Satellite Pipe, enabling drilling and blasting of kimberlite to startin December 2003. Since production recommenced in March 2004, mining has blendedkimberlite material at an average ratio of 28% Stockpile to 72% Satellite kimberlite asillustrated in Figure 18.
Figure 18: Recent Production Results by Source
Figure 18 clearly illustrates the decrease in the average recovered grade after the plantmodifications were carried out in December 2004.
15.3 Production Planning
Long-term mine planning at Letseng has been based upon a blended kimberlite feed from theSatellite and Main Pipes as well as previously stockpiled material. Economic pit analyses andmine planning exercises were carried out by MineNet under prevailing techno-economicconditions and presented to Letseng in July 2006. Operating schedules were adopted basedupon the recommendations made in the proposals.
Both pipes were evaluated with the aim of maximising exploitation of the orebodies through theidentification of ‘ultimate pits’, the determination of the optimal mining stages within thosemaximum shells, and the development of shorter-term mining digging plans. Mine planninghas been based upon the ultimate pit configurations, with the LOM schedules for valuationpurposes being modified to take into consideration the required plant feed and each pit’ssustainable production capacity.

100
15.4 Main Pipe
A mining strategy for the deepening of the Main Pipe was conceptualised on a similar basis tothat of the Satellite Pipe, with a notional 5-stage approach being recommended for the LOMplan. Two pit optimisation cases were considered on the basis of pit slope angles, the base casebeing a deeper pit with steeper pit slopes, and Case 2 with relaxed pit slope angles to aneconomic depth of 490m. The respective tonnages are illustrated in Table 14 and in Figure 19:
Table 14: Main Pipe Ultimate Pit Tonnage ContributionsCASE INDICATED INFERRED
RESOURCE RESOURCE TOTAL GRADE WASTE STRIPPING DEPTH(t) (t) (t) (cpht) (t) RATIO (m)
Ultimate Base Case 43.5 75.1 118.6 1.64 73.0 0.62 525Ultimate Case 2 (Relaxed Pit Slopes) 43.5 61.6 105.1 1.64 68.0 0.65 490Case 2 Cutback 700m 43.2 38.7 81.9 1.65 42.4 0.52 425Case 2 Cutback 600m 38.9 18.9 57.8 1.67 22.7 0.39 360Case 2 Cutback 500m 31.1 7.2 38.3 1.68 8.1 0.21 315Case 2 Cutback 400m 19.0 2.1 21.1 1.73 2.9 0.14 260Case 2 Starter 300m 5.6 0.1 5.7 1.90 0.4 0.06 195
The tonnages in Table 14 represent the LOM of an ultimate pit to a depth of 490m below surface(3,060m amsl). The LOM plan has therefore been modelled to deplete the tonnage to this depth.
15.4.1LOM Plan
There is currently no mining being carried out on the Main Pipe. Production is scheduledto commence in 2008. The respective ROM profiles for inclusion and exclusion of InferredDiamond Resources are illustrated in Table 15:
Table 15: Main Pipe Production Schedule Depleting Indicated Resources OnlyYEAR ORE (Mt) WASTE (Mt) SR GRADE (cpht)
2006 – – – –
2007 – – – –
2008 – – – –
2009 – – – –
2010 3.2 0.7 0.2 1.80
2011 5.2 1.0 0.2 1.58
2012 5.2 1.8 0.3 1.55
2013 5.2 3.5 0.7 1.46
2014 5.2 2.4 0.5 1.54
2015 5.2 5.6 1.1 2.10
2016 5.2 6.0 1.2 1.73
2017 5.2 3.9 0.8 1.58
2018 4.2 5.4 1.3 1.80
TOTAL 43.5 30.3 0.6 1.64

101
Figure 19: Main Pipe Pit Optimisation Shells

102
Table 16: Main Pipe Production Schedule Depleting Indicated and InferredResources
YEAR ORE (Mt) WASTE (Mt) SR GRADE (cpht)
2006 – – – –
2007 – – – –
2008 – – – –
2009 – – – –
2010 1.03 0.10 0.10 2.09
2011 1.03 0.31 0.30 1.80
2012 1.03 0.31 0.30 1.68
2013 1.03 0.10 0.10 1.55
2014 1.03 0.05 0.05 1.49
2015 1.25 0.12 0.10 1.56
2016 1.66 0.75 0.45 2.10
2017 2.08 0.35 0.17 1.76
2018 2.58 0.10 0.04 1.58
2019 5.16 1.30 0.25 1.58
2020 5.16 3.50 0.68 1.57
2021 5.16 2.40 0.47 1.53
2022 5.16 5.60 1.09 1.59
2023 5.16 6.00 1.16 1.95
2024 5.16 3.90 0.76 1.58
2025 5.16 5.42 1.05 1.58
2026 5.16 4.13 0.80 1.60
2027 5.16 5.75 1.12 1.68
2028 5.16 4.00 0.78 1.70
2029 5.16 5.30 1.03 1.58
2030 5.16 5.70 1.10 1.59
2031 5.16 6.97 1.35 1.62
2032 5.16 5.33 1.03 1.68
2033 5.16 0.53 0.10 1.58
2034 5.16 – 0.00 1.58
2035 5.16 – 0.00 1.60
2036 3.95 – 0.00 1.61
TOTAL 105.10 68.02 0.65 1.64
15.5 Satellite Pipe
The vertical extent of the current Satellite Pipe is illustrated in the east-west section shown inFigure 20. Two pit optimisation cases were considered on the basis of pit slope angles. Therespective tonnages are illustrated in Table 17.
Table 17: Satellite Pipe Economic Pit Tonnage SummaryINDICATED INFERRED TOTALRESOURCE RESOURCE RESOURCE WASTE STRIPPING DEPTH
CASE (Mt) (Mt) (Mt) (t) RATIO (m)Ultimate Pit 14.70 31.57 46.27 119.85 2.59 475Cutback 3 (130m) 14.70 21.86 36.56 72.92 1.99 404Cutback 2 (100m) 14.70 15.48 30.19 51.08 1.69 355Cutback 1 (65m) 14.61 8.99 23.60 34.17 1.45 306Current Perimeter 9.49 0.22 9.72 4.89 0.50 195

103
Figure 20: Satellite Pipe Pit Optimisation Shells

104
15.5.1 LOM Plan
The rationale behind the pit planning exercise carried out by MineNet advocated athree-stage push-back strategy in arriving at the optimal business case for the SatellitePipe mine. The strategy outlined progressive cuts defined as follows:
• Current perimeter;
• Cutback 1 – 65m cutback;
• Cutback 2 – 100m cutback;
• Cutback 3 – 130m cutback; and
• Ultimate pit – relaxed pit slope angles.
From the results of a rigorous scheduling exercise, the component pits modelled asconstituting the three-stage design are illustrated in Figure 20.
For the purposes of the valuation, both the Indicated and Inferred Diamond Resourcesclassified in this report for the Satellite Pipe were included in separate LOM productionschedules, one exclusive and the other inclusive of Inferred Diamond Resources. Therespective ROM profiles for inclusion and exclusion of Inferred Diamond Resources areillustrated in Table 18 and Table 19:
Table 18: Satellite Pipe Production Schedule Depleting Indicated ResourceOnly
YEAR ORE (Mt) WASTE (Mt) SR GRADE (cpht)
2006 2.1 1.7 0.82 1.93
2007 2.4 5.5 2.28 1.93
2008 4.1 10.9 2.64 1.93
2009 4.1 10.9 2.64 1.93
2010 2.0 4.7 2.35 1.93
TOTAL 14.7 33.6 2.28 1.93
Table 19: Satellite Pipe Production Schedule depleting Indicated & InferredResource
YEAR ORE (Mt) WASTE (Mt) SR GRADE (cpht)
2006 2.06 1.70 0.82 1.93
2007 2.41 5.50 2.28 1.93
2008 4.13 10.90 2.64 1.93
2009 4.13 10.90 2.64 1.93
2010 4.13 9.70 2.35 1.93
2011 4.13 7.10 1.72 1.93
2012 4.13 9.90 2.40 1.93
2013 4.13 14.80 3.59 1.93
2014 4.13 17.50 4.24 1.93
2015 3.91 18.00 4.60 1.93
2016 3.50 13.00 3.72 1.93
2017 3.08 1.23 0.40 1.93
2018 2.58 0.05 0.02 1.93
TOTAL 46.3 119.9 2.59 1.93
It is important to note that the above schedule is not the product of a rigorousscheduling exercise but rather a spreadsheet calculated schedule taking into accountthe total material quantities identified in the economic shell analyses and theassociated stripping ratios.

105
15.6 Combined LOM Production Schedule
Two LOM scenarios have been applied for valuation purposes, exclusive and inclusive of the Inferred Diamond Resources classified for the Main and Satellite Pipe respectively. The following charts (Figure 21 and Figure 22) illustrate the LOM kimberlite production andprocessing schedules for the respective cases:
Figure 21: LOM Schedule Depleting Indicated Diamond Resources Only
Figure 22: Expansion LOM Schedule Depleting Indicated & Inferred DiamondResources
Although not illustrated in the preceding charts, the waste stripping profiles were matchedwith ore schedules on a bench-by-bench basis. The charts clearly delineate the two valuationcases, and more specifically the impact that the inclusion of inferred diamond resources has onthe life of the operation. An important assumption made for the inclusion cases is that theconversion of the current Mining Lease Agreement, which is due to expire at the end of 2024,will be successfully negotiated upon identical terms.
In conjunction with Letseng management, Venmyn reviewed all the mining and technicalparameters in light of the recent operating environment as well as within the context of the

106
southern African diamond mining industry. Venmyn is satisfied that all parameters described inthis report and applied in the mineral asset valuation were reasonable at the time of reporting.
15.7 Pit Slope Stability
The Satellite and Main Pipes were intruded within a hard rock environment. The designs ofstable slopes for the pits will ultimately be dictated by the discontinuity, or fracture, propertiesof the Basalt wall rock.
Results from preliminary rock fabric mapping carried out in the Satellite Pipe by MineNetconfirmed that it is permissible to cut steep slopes in both of the main rock types encountered,namely basalt and kimberlite. With the exception of some structures encountered within the‘wedge’ structure in the Satellite Pipe, no significant adverse structures are apparent that willpotentially have a negative impact upon the slope stability.
Geotechnical work carried out on both basalt and kimberlite demonstrated the wall rocks to bestrong and competent, with a generally favourable structural fabric. In the anticipated steepslope environment, however, the ability to manage the quality aspects required to maximiseslope angles as prescribed is critical to the success of the pit design philosophy. As such, thesequality aspects are monitored closely in collaboration with drill and blast operators.
The slope angles defined by MineNet for the respective pits are shown in Table 20:
Table 20: Slope Stability Design ParametersROCK TYPE SATELLITE PIT MAIN PIT
Inter-ramp Overall Inter-ramp Overall
Kimberlite 61° 50° 61° 50°
Country Rock (Basalt) 65° 54° 65° 54°
Basalt Raft 53° 48° – –
Bench Wall Angle 90 90°
Bench Height (Kimberlite) 14m
Bench Height (Basalt) 14m
Bench Width (Kimberlite) 7m
Bench Width (Basalt) 5m
Ramp System Single Double
Ramp Width 20m 20m – 12m
Ramp Inclination 10% 10%
15.8 K1 Stockpile
The planned plant feed schedule from the K1 Stockpile is illustrated in Table 21:
Table 21: K1 Stockpile Depletion ScheduleYEAR ROM ORE (Mt)
2006 0.52
2007 0.60
2008 1.03
2009 1.03
TOTAL 3.18

107
16. PROCESSING
16.1 Description of Current Plant and Process
Ores from the various sources are crushed to a top size of 250mm in the pre-crushing facility,operated by Quarry Cats, prior to entering the ore treatment plant (Figure 23). The facility hasa capacity of 800tph. The crushed ore (top size 250mm) is stockpiled and fed via the conveyorsystem to the ore treatment plant, owned by Letseng Diamonds and operated by Minopex. Ithas a throughput of 350tph and was designed and commissioned by DRA. Modifications in theprocess plant were made by Letseng management to overcome the original design shortcomingsin order to achieve the planned production, minimise diamond breakage and improve theenvironmental conditions (Appendix 4).
A conventional plant and associated processes are used for the treatment of the kimberlite oreand the recovery of diamonds, including:• primary crushing and conveying;• wet scrubbing and screening;
• secondary crushing;• DMS for primary diamond concentration; and• tertiary crushing for diamond liberation on the DMS discard.
The feed material to the DMS circuit consists of the size range of (45mm) +2mm. In the DMSprocess, the ore in the ferrosilicon medium is separated into a dense (or sink) component and a float component based on differences in density. To achieve this, ferrosilicon is mixed withwater to provide a medium with the correct operating density. Diamonds have a density of3.5g/cm3 and the separation process forces the diamonds to report to the sink component.Particle size distribution of the cyclone feed is one of the key parameters impacting on theseparating efficiency of the cyclones. Therefore the – 45mm +2 mm fractions are screened andseparated into coarse (–45mm +22mm) and fine (–22mm +2mm) fractions and fed into separatedense medium cyclones within the DMS module. Note that the DMS feed preparation screenwas originally fitted with 19mm x 58mm slotted panels. At the end of November 2004, and dueto restriction of the tertiary crusher capacity, 22mm x 58mm slotted panels were fitted insteadto address the bottleneck at the tertiary crusher.
Letseng management reported that in September 2005, the panels were changed once again to 27.5mm x 33 mm slots in order to maintain a consistent feed rate to the tertiary crusher andto reduce the length of the particles being sent to tailings. According to Letseng management,screen manufacture Multotec recommended this panel size as it served the intended purposewithout compromising the diamond recovery as the “nominal” panel size of the new panel wasactually smaller than the previous panel sized used since November 2004.
The coarse and fine DMS concentrate streams (the sink component) report to the drain andrinse screen where the ferrosilicon is removed and the concentrate rinsed and sent to the x-rayrecovery section.
The final recovery is carried out by x-ray separation followed by hand-sorting in glove boxes. To maximise x-ray recovery efficiency, the diamond concentrated streams (sink component)from the coarse and fine modules of the DMS are combined and re-screened into four differentsize fractions for separate recoveries by different x-ray recovery machines. The x-ray machinesrecover diamonds as well as other luminescent particles, typically mica and calcite at Letseng.
The x-ray section concentrate is then hand-sorted in single-handed glove boxes. The physicalappearances of mica and calcite are very different from that of diamond hence can be easilydistinguished by visual inspection. A special hand-held instrument is used for identifyingdiamonds when there is doubt. The recovered diamonds are checked, sorted and stored in asafe. The tailings from the X-ray machines are dried and conveyed to a secure area.Improvements of the final recovery section are in progress. The number of security cameras hasalready increased from 54 to 72. Towards the end of 2005, all existing glove boxes were replacedwith new ones and 12 additional security cameras installed. The access control to the finalrecovery area has recently been upgraded.

108
Figure 23: Flowsheet and Mass Balance for Existing Plant

109
Tailings (float) from the coarse and fine DMS modules are drained, sized and rinsed. The –45mm+ 19mm fraction is subjected to tertiary crushing (19mm aperture setting) for diamond liberationand conveyed, together with the secondary crusher discharge, to the crusher product sizing screenin preparation for DMS. The –19mm +2mm discard materials are conveyed to the coarse tailingdisposal site. A stand-by facility is available in the event that the overland conveyor system fail.
All the drained medium and washings from the DMS circuit are collected for medium recoveryand density regulation in the correct and dilute medium circuits.
All the fine material from the process is sent to the sump where it is pumped to the de-grittingand de-sliming circuits. The grit (–2mm) is sent to the tailings, and the water recycled. Theslimes are pumped to the slimes dam.
It should be noted that the final concentrate discharge from DMS into the x-ray recovery plant,together with the operation of all associated screening, drying, x-ray and sorting equipmentfalls outside the contract area of Minopex, save for maintenance.
This section of the diamond recovery is operated by Letseng Diamonds. The flowsheet of thediamond recovery circuit is shown in Figure 24.
In order to comment on the appropriateness of the process design for the style of mineralisation,the following information is required:• measurement of plant diamond value recovery factor (yield in terms of diamond value); and• formulation of the process design criteria.
Accurate measurements of the plant yield in terms of diamond recovery is costly andtechnically challenging, given that the concentration of diamonds is low. No plant yieldmeasurements have been carried out to-date.
Venmyn understands that the design criteria of the current plant were based upon “averagesouthern African kimberlite characteristics”. No additional process design criteria wereavailable, particularly with regard to:• the nature, quantity, result and representativeness of any metallurgical test work taken;• for example liberation studies, throughput optimisations versus recovery of smaller diamonds;
and• the nature, quantity, result and representativeness of the bulk sample/pilot plant test work
undertaken with reference to the envisaged mining plan and the full scale metallurgical process.
As a result, the following observations are considered informative:• modification of the original process design was made by Letseng management based upon
observations from the plant operation since March 2004 in order to achieve the requiredthroughput and minimise diamond damage;
• the process is intended to minimise the damage to large diamonds as well as to cater for therecovery of smaller diamonds. This is achieved by crushing “coarse” first (to top size 45mm)for initial DMS and then recycling the coarse discard (–45mm +19mm) for “finer” crushing(CSS 19mm), thereby liberating smaller diamonds for recovery. An initial 45mm DMS topsize would cater for the recovery of a 1,000ct octahedron shaped diamond. Batemanrecommended that test work be conducted to investigate the liberation of diamonds in the–19mm +2mm fraction of the DMS discard, which is currently sent straight to tailings;
• a summary of the DMS discard tailing re-crushing report was provided dated June 2005. The two samples taken on separate days appeared to contain relatively low diamond valuesof US$94/ct and US$99/ct, respectively;
• a mass balance and particle size distribution (belt-cut sampling) exercise conducted by Letseng management prior to the installation of a pre-crushing unit indicated that thecapacity of the tertiary crushing unit may be insufficient for the coarse DMS discard at times. Letseng management reports that when this situation is detected, plant feed isreduced to accommodate the situation. This situation is being monitored and managed bychanging DMS feed preparation screen panel size as mentioned previously;
• Letseng management reports that daily luminescent tracer tests are performed to monitorthe diamond recovery efficiency of the DMS and x-ray recovery section;
• six reports for separate DMS tracer tests were provided to Venmyn (reportedly conductedevery six weeks). These reports indicate good DMS separation efficiency with 100% recoveryof 3.5 density tracers and sharp Ep (<0.08) per test; and
• a Multotec DMS audit report dated July 2005 also indicated that the DMS is operated wellat Letseng.

110
Figure 24: Flowsheet for the Diamond Recovery Circuit

111
Letseng management reported that the capital cost of the ore treatment plant, recovery plantand some of the major infrastructure was ZAR103m as a lump sum project by DRA. This figureconsists of the following:• total ore treatment plant;• recovery and sorthouse;• water supply from De Beers dam;• potable and process water dams;• one slimes line; and• coarse tailings system.
During the plant visit in August 2005, visual observations indicated that the equipment is ingood condition. No pump gland leakage, ‘patch work’ or missing bolts were observed. House-keeping was in good order.
16.2 Description of New Plant for Expansion
The decision to proceed with the detailed design of a new plant has been taken by Letsengmanagement based upon the feasibility study prepared by Bateman. Letseng contractedBateman in May 2005 to provide an estimate for a class 2 feasibility study to cost a new 350tpmplant to increase the current treatment capacity to a nominal 700 tph. Class 2 specify that thelevel of accuracy of the estimates is between –10% and +15%. The new plant will be operatedtotally independent of the existing plant and this flexibility would allow for each plant to beadjusted according to its specific feed source. The two processing plants will be run in parallel,with ore being split after the pre-crushing circuit as shown in Figure 25.
The Class 2 level capital estimate for the engineering, procurement, construction andcommissioning of the new 350tph, stand alone diamond processing plant amounts to ZAR234mexcluding all taxes. Any changes to the design and specifications of the processing plant will beconsidered as separate cost.
16.2.1 Flowsheet Description
The envisaged flowsheet and mass balance for the new plant as proposed by Batemanunder direction of Letseng management is shown in Figure 25. After mining, the run-of-mine material is crushed to –250mm in the existing pre-crushing unit that has a nominal operating capacity of 800tph. After this the material will be split into two streams to feed both the existing and the new plant (both rated at 350tph). The –250mm crushed ore is conveyed to the processing plant where separated at 90mmusing a vibratory grizzly.
The +90mm is crushed to –90mm using a jaw crusher, fractionating the clay layers toimprove wettability during scrubbing. The –90mm material is scrubbed to wet andsoften the clay, remove surface clay and other material that would become clay furtheron in the process. The scrubber discharge is crushed to –45mm via the secondarycrushing/screening circuit where additional fine material is removed. The postsecondary crushed material is screened at –45mm and –2mm.
The –45 +15mm and –15+2mm are upgraded in DMS cyclone plants (Coarse and Fines)at a cut point of 3.15g/cm3. The +15mm DMS floats are re-crushed to –15mm, screened at2mm and treated in the Fines DMS plant. The DMS concentrates from the Coarse andFines DMS cyclone plants are combined and diamonds are recovered in a Recovery plant.
The –2mm streams are combined and thickened in a high-density thickener.
16.2.2 Testwork
Five bulks samples from Letseng were obtained from the Satellite Pipe and stockpilematerial. Mineral Technologies (“Mintek”) performed the testwork:

112
Figure 25: Proposed Flowsheet for the New Plant

113
• ~4t of Satellite Pipe, northwest side at 3,060m level;• ~4t of Satellite Pipe, south side at 3,039m level;• ~4t of stockpile, north side;• ~4t of stockpile, midway of north and south; and• ~4t of stockpile, south side.
Borehole core samples from the Main Pipe were also delivered to Mintek, testwork is inprogress and results will be reported as soon as available. The core samples that weresent to Mintek for test work were selected as being a general representation of the MainPipe material.
Size distributions studies were undertaken on the samples obtained. The resultsshowed that the ore is characterised by a smaller top size and a more pronouncedbimodal shape. The following points were considered when reviewing the results:• primary crushing and JK drop-weight test data can be used for calibration of a model
to simulate product size distribution after crushing given any feed size distributions;• scrubbing of the bulk samples will have less –2mm material generated;• scrubbing of the actual mined material may behave differently due to the higher clay
content in the scrubber and may be less effective in removal of the clay fraction thanwhat was demonstrated during the testwork; and
• densimetric data generated from the test samples may differ in concentrate massyield in the lower size fractions.
The Satellite Northwest and South samples were in the moderately soft to mediumrange of resistance to impact breakage. The Stockpile samples varied betweenmoderately soft to very soft range. The Satellite Pipe samples were in the mediumabrasion range, while the Stockpile samples were in the soft abrasion range.
The optimum laboratory batch scrubbing times were 3 minutes for the Satellite Pipeand 4 minutes for Stockpile samples. Retention time for continuous pilot scale testworkis taken as 80% of laboratory batch, relating to 2.4 minutes and 3.2 minutesrespectively. Visual inspection of the scrubber discharge indicated similar cleanproducts after 2, 3, 4 and 5 minutes for all five samples. Scrubbing retention time maytherefore be based on the Satellite Pipe data, namely 2.4 minutes.
The initial test work on the core samples from the Main Pipe indicated that these coresare softer than some of the other material that was tested for the Satellite Pipe andstockpile. The core samples results compared well to previous test work results from theother two sources. As result no process design alterations were required based on thesenew results. At this stage the test work results received from Mintek have been treatedas a fair representation of the Main Pipe resource.
16.3 Waste Disposal
A waste disposal design study was undertaken by ECMP in August 2003 as part of the DRAplant design. The waste disposal sites (Figure 26) are designed to hold the waste volumesassociated with the current operational tonnages.
The coarse tailings (>2mm) are transported via conveyor to the coarse tailing dump situatedbetween the slimes dam and the De Beers Dam (Figure 26). The coarse tailings facilitycomprises a wall across the valley, downstream of the slimes dam.
Slimes (<2mm) from the ore treatment plant are disposed separately in the slimes damoriginally constructed by De Beers (Figure 26). Slimes and grits are discharged from theimpoundment wall to form a beach that slopes downwards away from the wall to the southernpart of the facility, where the supernatant pond will be located.
Submersible pumps extract return supernatant water from the slimes dam to the plantreservoir from where the process water gravitates to the plant. Minopex is responsible for theoperation of the tailings disposal facility, and ECPM inspects the facility once a month.

114
Figure 26: Location of Waste Disposal Sites and Environmental Liabilities

115
A study on the waste disposal sites required for the Expansion will be undertaken by Batemanas part of their plant design study. Investigation must be conducted into the suitability of thesites in terms of fatal flaws analysis, volumes available and cost implications. Sites alreadyidentified include the following:• coarse tailings dump to be extended into the valley below the De Beers Dam;• a new fresh water dam constructed; and• slimes to be deposited within the De Beers Dam once the reservoir water has been
consumed by the operation.
17. DIAMOND PRODUCTION
17.1 Historical Diamond Production
De Beers produced a total of 203,786cts during their mining operation from 1977 to 1982.Production was sourced from the Main Pipe (K6) and, to a lesser extent, from the Satellite Pipe(Figure 27). A total of 23 parcels were sold during this time. The prices received for the variousparcels are discussed in Section 19.1.
Figure 27: Historical De Beers Diamond Production
Letseng was renowned for the production of large stones. Over 8% of this production was ofstones greater than 15cts in size as shown in Figure 28.
Figure 28: Proportion of De Beers Diamond Production by Size (K6 and Satellite)

116
17.2 Recent Diamond Production
A total of 78,944cts have been produced by Letseng from the Satellite Pipe and Stockpile sinceproduction recommenced in March 2004 until the end of March 2006. The monthly productionin carats is shown in Figure 29. The split of the carats coming from the two sources is notmeasured as there has been no separate campaigning through the plant.
Figure 29: Recent Diamond Production (Pre-Acid)
These diamonds have been sold via 21 tenders, since May 2004, at five week intervals. The prices received for these parcels are discussed in detail in Section 19.2. Cumulative sizefrequency distribution curves are plotted, on a tender by tender basis, for Letseng’s productionin Figure 30. Multiple lines on the graph, with minimal deviation from each other, show thatthe diamond parcels extracted to date are consistent and similar and therefore arerepresentative of the resource. Furthermore, this consistency provides confidence that theyaccurately portray future production. For operations which have diamond prices controlled bysize, rather than quality as is the case for Letseng, these graphs also provide a degree ofsecurity in the expected future diamond prices.
Figure 30: Size Frequency Distributions by Carats for Recent Production
*Diamond size units represent, from left to right, mm aperture size, grains and carats.

117
Figure 30 shows the size frequency distribution of carats for the combined Satellite Pipe andStockpile by parcel. Note that tenders 2 and 6 of 2005 were excluded from Figure 30.
These parcels represent the sales of one and three stones, which, due to their exceptional sizeand quality were sold as individual tenders to maximise the price. Since December 2005, WWWhas elected to sell the +10.8ct stones every five weeks but to only sell the –10.8ct stones everyten weeks. The company believes that better prices will be obtained for these smaller stoneswhen they are aggregated into larger sized parcels. It is for this reason that tenders 12 of 2005and 1 of 2006 are combined, and similarly tenders 2 and 3 of 2006.
The tenders all show very similar cumulative size frequency distribution characteristicsproviding assurance that this production is typical of the deposit and that future sizedistributions will continue to be within the range as recorded over the last 21 months. Thequestion arose in the previous assessment of Letseng in 2002, as to whether the mine would beable to continue to produce the large stones recorded by De Beers. It is evident from Figure 30that these large stones have continued to be produced. Between 10% and 20% of the totalproduction occurs in the +10ct size category. The successive curves also show very littlevariation with changing percentages of Stockpile source. Note that tenders 1 of 2004; 2 of 2004;3 of 2004 and 6 of 2004 consist of 100% Satellite Pipe.
Most kimberlite diamond producers exhibit a size frequency distribution curve which flattensout in the large size categories, unlike Letseng, as is shown in Figure 30, where the curvesteepens to the +10.8ct size fraction. The most important issue with respect to the large stonesis the revenue derived from them. The percentage of revenue attributed to the various sizefractions within the parcels are shown in Figure 31.
Figure 31: Size Frequency Distributions by Revenue for Recent Production
Figure 31 indicates that between 40% and 90% of the revenue is attributed to the +10ct stones.The large variation in the values within this size category is primarily a function of theirquality (i.e colour and clarity). Note the very high revenues attributed to the +10ct fraction forTender 8 of 2005 (shown in dark green). The combined tenders of 12 of 2005 and 1 of 2006 showan uncharacteristic revenue curve. This is due to very low prices being obtained for the 6gr –10ct stones in this parcel, resulting in a contribution to the total revenue of less than 1%. The low values obtained would be a result of poor qualities for these stones.
Figure 32 shows the proportion of mine production, by carats, reporting to five size classes. A comparison between this data and the historical De Beers data shows that the mine hascontinued to produce large sized stones even though the ratio of tonnages from the varioussources has changed. The percentage of stones with sizes greater than 15ct has increased from8.1% (De Beers’ production) to 10.1% (Letseng production to March 2006). The majority of the

118
recent production was sourced from the Satellite pipe, while that of De Beers came mainly fromthe Main Pipe K6. This increase in the percentage of +15ct stones adds further weight to theimpression that the biggest stones come from the Satellite Pipe.
Figure 32: Proportion of Recent Diamond Production by Size
18. CUMULATIVE SIZE FREQUENCY DISTRIBUTIONS BY PIPE
In order to characterise the diamond population to be expected from each of the various resourceslocated at Letseng, cumulative size frequency distributions have been plotted for each utilising allhistorical and recent results by source (Figure 33). Where only combined data is available, this hasalso been plotted. Note that in order to compare the data, the recent size categories were convertedto sieve sizes (used in the historical data) and, as a result, the graphs are different to the sizefrequency distributions plotted in Figure 30 and Figure 31. The information used to compile Figure33 includes a total of 32 old parcels and 21 recent parcels.
Figure 33: Cumulative Size Frequency Distribution by Source
* The critical stone sizes, in carats, which pass through the various sieve size indicated above are tabulated in Appendix 3.
The most stable curves are those which have been calculated from a large number of carats, i.e. theOld K6, Old K6 and Satellite and the New Stockpile and Satellite. Figure 33 indicates the following:

119
• the old data curves all show similar peaks and troughs which is a function of the sizeclassifications and not a result of the actual size distribution of the diamonds. Similarly with thepeaks and troughs pertaining to the new data curves;
• there is a maximum variation of 20% between the curves in the lower size fractions, with the olddata yielding a greater percentage of smaller stones. This is a function of the variations in plantcharacteristics;
• there is less than 10% variation between the curves in the large size fractions. This is furtherreduced to 5% if the small Old K1 parcel is disregarded. This provides confidence that the largestones will continue to be produced with time; and
• the K1 curves (although small in absolute carat size) indicate that this resource produces lesslarge stones.
Analysis of the exact sizes of the stones extracted from various resources both historically andrecently, reveals that the K1 only and stockpile only diamond parcels do not contain any stonesgreater than 55cts. All stones greater than 55cts were sourced predominately from Satellite only andSatellite and stockpile parcels. Only a small number were recorded from the K6 only parcels.
19. DIAMOND VALUATIONS
19.1 Historical Valuations
Historical valuations are available for the period 1977 – 1982 for the sale of the De Beersparcels, which indicated an average price, of US$402/ct (Figure 34). These valuations representfigures which were obtained during a period of volatility in the diamond market, and theyrepresent a combination of the Satellite and Main Pipes’ diamond production.
Figure 34: Valuation of De Beers Parcels (K6 and Satellite)
During the Venmyn valuation of Letseng Diamonds in 2002, WWW were contracted to preparean estimate of the US$/ct valuation for each of the mineral resources at prices applicable to the2002 market. Whilst WWW has a marketing contract with Letseng Diamonds and were clearlya related party, the SAMREC Code does not specify the need for an independent valuator.
WWW have assured Venmyn that their report was prepared without intentional bias. WWWreceived information on the history of the deposit, historical exploration and mining sizefrequency distribution data, the De Beers’ valuation data plus previous estimations of Letseng’sdiamond values. WWW had had previous experience with Letseng’s diamonds during the De Beers operations, and also viewed the parcel that had been mined by alluvial contractors in 2002.
WWW plotted logarithmic cumulative plots to compare each of the data sets. They concludedthat the curves for each of the various mineral resources were similar and, therefore, a singlediamond value could be applied to all resources. In the case of comparing the K1 curves to the rest, the data pertaining to the small and large diamond fractions were excluded. Their assumption was that, had they been included, the shape of the curve would not resemble

120
a straight line, as is typical of a kimberlite deposit. The remaining section of the curvecorresponded well with those curves for the other kimberlite resources.
In order to estimate the value of the Letseng Mine’s diamonds, WWW considered the following:
• historical and current diamond prices from the two highest average priced southern Africanmines;
• the present and future diamond market, as described in the previous section; and
• additional value that will be obtained from selling +23 carat stones to a market other thanthe Central Selling Organisation (“CSO”).
WWW estimated an average price of US$635/ct for Letseng and Venmyn utilised this figure intheir valuation of 2002.
19.2 Recent Prices Received
Since the 2002 estimations, a total of 21 parcels have been sold into today’s market. Theaverage values per carat received for each tender are shown graphically in Figure 35, by source.
Figure 35: Valuation of Recent Parcels
Tenders 2 of 2005 and 6 of 2005 represent tenders of exceptional stones sold separately.Tender 2 of 2006 represented stones greater than 10.8cts only. The values received for alltenders range from a minimum of US$488/ct for a K1 bulk sample mined by the alluvialcontractors, to a maximum of US$21,988/ct for a parcel of four special stones totalling 365ctsderived from a blend of the Satellite Pipe and Stockpile. The variation in price is a function ofquality, i.e. colour and clarity, as well as size. It must be noted that top quality stones do occurin all the stone size categories, and not only in the large categories. However, it is the top whitecolour of the large stones that has resulted in the exceptional diamond values received.
As noted in Section 17.2, since December 2005 the mine has adopted a strategy of pooling the<10.8ct stones for two tender periods (10 weeks) and selling the only +10.8ct stones in between.This has resulted in the oscillating average prices recorded for the last four tenders. This hasbeen undertaken at the recommendation of WWW, which believes that better prices will beobtained for the <10.8ct stones if they are sold in larger parcel volumes.
19.3 Prices Used for Purposes of CPR Valuation
The services of expert geostatistician, Dr Carina Lemmer, were contracted to estimate theaverage diamond price for the various kimberlites present at Letseng using statistical methods.This was initially undertaken in October 2005 and subsequently updated with the latest salesdata to March 2006. The latest results are reported in this Section.

121
The methodology used to establish price estimates was developed by H.S. Sichel, and is used inthe diamond industry on a regular basis. The approach consists of three steps, firstly toestablish a diamond stone size distribution curve, secondly to establish an average price curveand thirdly to multiply the two curves by one another so as to derive the average price for thediamonds from a specific kimberlite. This method takes cognisance of the high prices receivedby Letseng for their extra-ordinary diamonds, as well as the large stone sizes produced on aregular basis. This is the first time that this method has been applied to the Letseng deposit.
The first step establishes the stone size distribution for the relevant kimberlite type bydetermining the proportion of the total number of stones that occur within each carat sizefraction with a resultant histogram output.
Sichel determined that as data input increases, the histogram outline becomes smoother. This allows one to predict what the histogram outline would look like at the end of a mine’s life by fitting a curve to the irregular histogram. The advantage of fitting a smooth curve to the histogram is that it has predictive ability in the absence of large amounts of data. The frequency distributions of the various kimberlites were identified as being compoundlognormal due to their narrow peaks and long thin tails in the large stone sizes.
The second step was to establish the average price received within each carat size fraction bymeans of a “price structure curve”. This step establishes an average price trend for a kimberliteand shows, in a transparent manner, how the price trend compares against a background offluctuating prices due to variations in quality. The histograms of the price per carat received(during the past two years) are plotted according to the carat size fraction for each kimberlite.
Although a large amount of data exists for the combined Satellite and Stockpile feed, data forthe Satellite only is substantially less. No recent pricing data was available for the K6, and onlylimited data was available for the K1 and Stockpile only.
The price structure curve is constructed as follows:• prices received are averaged within the same carat size fraction used for constructing the
stone size distribution, and a histogram of average price received versus carat size fractionis constructed; and
• due to the fact that the values defined by the histogram bars deviate from the average pricestructure curve (either in a positive or negative sense), the deviations were squared. The “best” price structure curve is the one for which the sum of the deviations squared is theminimum. Such a curve becomes more stable with increased volume of data.
Figure 36 shows the price structure curve for the combined Satellite and Stockpile feed data.

122
Figure 36: Price Structure Curve for Combined Satellite and Stockpile
The price structure curves for the various kimberlites at Letseng show two characteristiccomponents:• an “initial component” in the form of an approximate straight line. Prices per carat for the
smaller stones (less than 9 carats in the case of Stockpile, and less than 10.8 carats in thecase of the others) increase in a regular manner with size; and
• a “secondary component” in the form of a convex curve followed by a horizontal straight line.Prices per carat for the larger stones increase substantially (steeply) from where the “initialcomponent” ends. Thereafter the prices level off to an average behaviour which takes intoaccount the influence on price of the variations in the quality of the diamonds.
The final step in estimating the average price per carat was to multiply the proportion of stonesin each carat size fraction by the associated value of the price structure curve for that fraction.The US$/ct values for each fraction were then accumulated over the entire range and anaverage was taken. For a stone of average shape, colour and quality, its price would bedependent on its size. However, Figure 34 shows how the attributes of quality can result indramatic deviations from such a simple dependence, which typifies Letseng.
Since no recent pricing information is available for the K6, its stone size distribution wasmultiplied by the price structure curve for the combined Satellite and Stockpile feed andaveraged as for the others.
The average price results for the various kimberlites are shown in Table 22, with the arithmeticmeans also reflected for comparison. The arithmetic mean was calculated from the total valueobtained divided by the total number of carats for each kimberlite.

123
Table 22: Average Stone Prices Calculated Using Different MethodsAVE. PRICE AVE. PRICE
NO. OF STONES OF STONES OVERALLCARATS <10ct (US$/ct) >10ct (US$/ct) AVERAGE ARITHMETICUSED IN (“INITIAL (“SECONDARY PRICE (US$/ct)
SOURCE ESTIMATION COMPONENT”) COMPONENT”) (US$/ct) MEAN
Satellite andStockpile 63,981 369.97 7,019.11 1,455.77 1,393.84
Satellite Only 13,646 441.49 5,172.38 1,041.59 1,166.87
Stockpile Only 1,543 434.60 4,324.56 1,080.01 1,076.25
K1 2,913 423.75 4,901.05 974.26 933.51
K6 45,297 239.16 6,429.37 973.96 No recent data
For the purposes of the resource statements and the valuation of Letseng, the following priceswere utilised (Table 23):
Table 23: Diamond Prices Used in ValuationSOURCE AVERAGE PRICE
(US$/ct) REASONING
Satellite Pipe 1,456 This is based upon the most stable curve (that is the combinedSatellite and Stockpile feed) which consisted of a large amountof data. Statistical evidence shows that the Stockpile has hadlittle influence on this curve.
Main Pipe 974 Similar values were calculated for both K1 and K6 and therefore(K1 and K6) a single price was used. Note that only a small amount of data
was used to estimate this price and the curve has not stabilised.As a result this value is likely to vary with additionalproduction.
Stockpile 974 According to De Beers’ records the Stockpile was comprisedpredominately of K1 and therefore this value was used. TheStockpile only value was calculated from a limited amount ofdata and has for this reason been excluded.
In order to provide further weight to the estimated diamond prices used, we have compared theactual average price received for the Satellite and Stockpile combination since the plantmodifications, to the calculated average combined price using the prices stated in Table 23. Thecombined price is calculated using the ratio of carats based upon the estimated gradesmultiplied by the actual tonnages from each source. The results are shown in Table 24.
Table 24: Actual versus Calculated Diamond Price AveragesSOURCE TOTAL AVE TOTAL % CALC. ACTUAL
TONNES GRADE CARATS CARATS AVE AVE(January 2005 (January 2005 (January 2005 (January 2005 PRICE PRICE– March 2006) – March 2006) – March 2006) – March 2006) (January 2005 (January 2005
– March 2006) – March 2006)Satellite 1,960,610 1.93 37,861 72.68% 1,456Stockpile 900,829 1.58 14,233 27.32% 974
TOTAL 2,861,439 52,094 100.00% 1,324 1,355Difference -2.33%
Table 24 indicates a difference of 2% between the calculated average prices (based upon Dr Lemmer’s prices) and the actual average price obtained over the same period. This providesVenmyn with a reasonable level of confidence with respect to the diamond price estimates.
20. CLASSIFICATION OF MINERAL RESOURCES AND MINERAL RESERVES
The mineral resources were calculated and classified by Venmyn in accordance with the SAMRECCode. The classification into the resource categories is based upon historical exploration andproduction information and the recent drill holes, sampling by the alluvial contractors and production records. The resource categories as defined by the SAMREC Code are described inthe Glossary in Appendix 5. Venmyn is confident that the logging, sampling, data density anddistribution are suitable for resource and reserve estimation as described in the following sections.

124
20.1 Previous Diamond Resource and Reserve Statements
The first official resource statement prepared for the mine was compiled by Venmyn in 2002and included in the CPR prepared for Consolidated African Mines Ltd on the proposedacquisition of a 40% interest in the mine, dated May 2002. This statement is illustrated in Table 25.
Table 25: Letseng Diamond Resource Statement at May 2002MIN
DEPTH DEPTH RECOV CUTFROM TO RESOURCE VOLUME SG GRADE VALUE OFF
SOURCE (m) (m) TYPE (m3) (kg/m3) TONNAGE (cpht) CTS (US$/ct) (mm)
Satellite Pipe 0 120 Indicated 4,285,714 2.80 12,000,000 2.80 336,000 635 1.00
Main Pipe 0 190 Indicated 9,285,714 2.80 26,000,000 2.04 530,400 635 1.00
Stockpile N/A N/A Indicated 2,222,222 2.25 5,000,000 2.04 102,000 635 1.00
TOTAL/AVERAGE 15,793,651 2.72 43,000,000 2.25 968,400 635 1.00
The volumes presented above represent the in-pit volumes to the defined depths. None of theresources were classified as reserves due to insufficient information available on the modifyingfactors as well as the lack of a representative parcel of stones having been mined and sold intotoday’s market.
In September 2005 Venmyn prepared a subsequent resource statement for Letseng which wasincluded in the initial CPR for the proposed disposal of Letseng Holdings’ 76% share, datedNovember 2005. This statement took into account the production results of the operating mine,sales prices in today’s market, a geostatisical estimation of the price curves, preliminaryborehole results, the geological model of July 2005 and the associated pit optimisation exerciseundertaken at that time. The resource statement is shown in Table 26. The grades were quotedas recovered using the plant without the modifications to the recrush circuit screen size. At thattime management believed that these adjustments may not be permanent and may not beincluded in future plants to be used to treat the ore. These decreases in grade were taken intoaccount as modifying factors and reported in the reserve statement. The decrease in carats dueto the acid boil process were also not taken into account in the resource statement, but werefactored into the cashflow.
Table 26: Letseng Diamond Resource Statement at 30th September 2005 (Inclusive ofReserves)
MINDEPTH DEPTH RECOV CUTFROM TO RESOURCE VOLUME SG GRADE VALUE OFF
SOURCE (m) (m) TYPE (m3) (kg/m3) TONNAGE (cpht) CTS (US$/ct) (mm)
Satellite Pipe 0 176 Indicated 3,639,892 2.49 9,063,000 2.28 206,000 1,174 2.00
176 439 Inferred 9,163,383 2.49 22,816,000 2.28 519,000 1,174 2.00
Main Pipe 0 190 Indicated 19,027,216 2.64 50,136,000 2.07 1,036,000 974 2.00
190 434 Inferred 14,883,075 2.64 39,216,000 2.07 810,000 974 2.00
Stockpile N/A N/A Indicated 1,872,157 2.03 3,794,000 1.91 72,000 974 2.00
TOTAL/AVERAGE 48,585,723 2.57 125,025,000 2.11 2,643,000 1,029 2.00
20.2 Diamond Resource Statement for 31st March 2006
20.2.1 Statement
The current resource statement for Letseng Diamonds is shown in Table 27, inclusiveof reserves. It takes into account all the drilling results and geotechnical results, newdensity measurements from the borehole cores, the new geological model, the new minescheduling and pit optimisation exercise undertaken in June 2006, the latest diamondsales prices, an updated geostatistical estimate of future expected prices and sixmonths of additional production data. Recovered grades are quoted taking into accountthe modified recrush screen size, which management has elected to retain in thecurrent plant and use in the Expansion plant. The consistent loss of carats in the acidwash, is also taken into account.

125
Table 27: Letseng Diamond Resource Statement at 31st March 2006 (Inclusive ofReserves)
MINDEPTH DEPTH RECOV CUTFROM TO RESOURCE VOLUME SG GRADE VALUE OFF
SOURCE (m) (m) TYPE (m3) (kg/m3) TONNAGE (cpht) CTS (US$/ct) (mm)*
Satellite Pipe 0 182 Indicated 5,698,322 2.58 14,701,000 1.93 283,000 1,456 2.00
182 475 Inferred 12,234,810 2.58 31,565,000 1.93 609,000 1,456 2.00
Main Pipe 0 190 Indicated 16,676,370 2.61 43,525,000 1.64 713,000 974 2.00
190 490 Inferred 23,607,254 2.61 61,614,000 1.64 1,010,000 974 2.00
Stockpile N/A N/A Indicated 1,664,111 2.03 3,373,000 1.58 53,000 974 2.00
TOTAL/AVERAGE 59,880,868 2.58 154,778,000 1.72 2,668,000 1,135 2.00
Inclusive of Reserves*2mm bottom screen size cutoff, 22mm re-crush screen aperture width.
20.2.2 Classification Reasoning
Classification of the resources by ore source is tabulated in Appendix 6. The resourcesare shown graphically in Figure 15 and Figure 17 for the Main and Satellite Pipes,respectively.
20.2.2.1 Main Pipe
No resources within the Main Pipe were classified as measured, as there wasinsufficient information on mapping, grade, stone size and diamond valuesassociated with each of the facies present and their variations with depth.
The diamond mineral resources from surface to a depth of 190m (orapproximately 60m below the base of the De Beers pit) were classified asindicated resources. There is extensive historical production and sales data onK6, and a small amount on K1. There is no recent production and sales datafrom any of the facies within the Main Pipe, except for a small trenchingexercise on K1 by the alluvial contractors. The exploration drilling hasconfirmed the size of the pipe and extent of the various facies within it.
The diamond resources below a depth of 190m have been included into thediamond resource statement as inferred resources to a depth of 490m. This isa function of the multiple drilling intersections which have proved thecontinuity of the kimberlite to a maximum depth of 495m.
Note that these inferred resources only include the volume within the ultimatepit on the Main Pipe, as the tonnage outside of this has little prospect foreventual economic extraction.
20.2.2.2 Satellite Pipe
No resources were classified as measured as there is insufficient detailedinformation on the grade, stone size and diamond value variations laterallyand vertically within the Satellite Pipe.
The Satellite Pipe is classified as indicated resources from surface to a depthof 182m. This represents a depth of approximately 60m below the base of thecurrent pit.
The diamond resources below a depth of 182m have been included in thediamond resource statement as inferred resources to a depth of 475m.Although kimberlite has been intersected at 502m, the base of the inferredresources has been defined as the base of the economic pit shell at 475m. Notethat these inferred resources only include the volume within the ultimate piton the Satellite Pipe, as the tonnage outside of this has little prospect foreventual economic extraction.
20.2.2.3 Stockpile
The Stockpile is not classified as a measured diamond resource due to the lackof grade measurements, stone size and diamond value variations within it,even though the volume has been accurately surveyed.

126
20.3 Diamond Resource Statement Variations Between 2005 and 2006
The major differences between the successive statements are summarised in Table 28.
Table 28: Comparison of 2005 and 2006 Resource StatementsSOURCE VARIABLE DIFFERENCES
Satellite Pipe Volume The latest drilling results, updated geological model, recentmined tonnages and lowering of the base of Indicated Resourceshave resulted in a 57% increase in this volume. The latestdrilling results and updated geological model to a depth of475m have resulted in a 34% increase in the InferredResources.
Density A 7% increase in density due to new measurements.
Grade A 15% decrease in grade due to plant modifications and acid boilresults being incorporated into the resource statement as well asadditional production results using the current plant setup.
Diamond value A 24% increase in diamond price due to additional sales parcels.
Main Pipe Volume The latest drilling results and updated geological model haveresulted in: a 12% decrease in the volume of the IndicatedResources; and a 59% increase in the volume of the InferredResources by increasing the depth of the pit to 490m.
Density A 1% decrease in density due to new measurements.
Grade A 21% decrease in grade due to plant modifications and acidboil results being incorporated into the resource statement.
Diamond value No change.
Stockpile Volume An 11% decrease due to mining production.
Density No change.
Grade A 17% decrease in grade due to plant modifications and acidboil results being incorporated into the resource statement.
Diamond value No change.
The net resultant differences between the 2005 and 2006 resource statements are a 24%increase in tonnage, a 1% increase in recovered carats, a 10% increase in average diamondvalue and an 11% increase in the deposit’s revenue generating potential (i.e. total caratsmultiplied by diamond price).
20.4 Diamond Reserve Statement for 31st March 2006
20.4.1 Statement
By definition, Mineral Reserves comprise that material, from either the measured orindicated resources, which is economically mineable.
All indicated resources have been converted to probable reserves through theapplication of the SAMREC defined modifying factors and LOM plan for each respectiveore source. These reserves have been valued on the basis of a cash flow model. TheLetseng reserve statement is summarised in Table 29.
Table 29: Letseng Diamond Reserve Statement at 31st March 2006MIN
DEPTH DEPTH RECOV. CUTFROM TO RESERVE VOLUME SG GRADE VALUE OFF
SOURCE (m) (m) TYPE (m3) (kg/m3) TONNAGE (cpht) CTS (US$/ct) (mm)*
Satellite Pipe 0 182 Probable 5,698,322 2.58 14,701,671 1.93 283,898 1,456 2.00
Main Pipe 0 190 Probable 16,676,370 2.61 43,525,327 1.64 713,815 974 2.00
Stockpile N/A N/A Probable 1,664,111 2.03 3,373,025 1.58 53,172 974 2.00
TOTAL/AVERAGE 24,038,804 2.56 61,600,023 1.71 1,050,885 1,104 2.00
*2mm bottom screen size cutoff, 22mm re-crush screen aperture width.

127
21. ENVIRONMENTAL ISSUES AND IMPACT OF LETSENG ON THE ENVIRONMENT
Golder was appointed by Letseng Diamonds in September 2003 as environmental consultants to themine. Golder completed an EIS and EMP in June 2004. This documentation was prepared for thecurrent Lease and for mining the Satellite Pipe to a depth of 140m only.
A new or amended EIS and EMP will need to be prepared upon renewal of the Lease in 2009, as wellas for the Expansion. The cost of this has been estimated by Golder at ZAR150,000.
21.1 Pre-Current Mining Environment
The pre-current mining environment was disturbed by previous exploration, mining andprocessing undertaken by RTZ and De Beers between the 1960s and the early 1980s, as well asartisanal workings on the alluvial tailings from both of the pipes. That environment comprisedthe following:• two open pits to a depth 120m and 20m, both filled with water;• unrehabilitated artisanal workings;• semi-demolished plant;• coarse tailings dump and fine tailings (slimes) dam;• lower grade stockpile of ore;• adit and underground development;• non-functional airstrip built on a waste rock dump;• fresh (return) water dam; and• various dilapidated buildings and gravel roads.
The current mining activity has endeavoured, where possible, to utilise only that land alreadydisturbed by past mining activities.
21.2 Conservation Area
A large area of the Maloti/Drakensberg escarpment has been declared as a conservation areacalled the Maloti-Drakensberg Transfrontier Park (“TFP”) (Figure 1). Letseng is situatedwithin this area. The Maloti-Drakensberg TFP is not an exclusion area, but an area which is tobe actively protected with respect to its natural resources. The project aims to undertake thisprotection whilst still ensuring that the local development needs are met.
21.3 Soil and Land Capability
The land capability of this area is limited to due the harsh climate and shallow soils. Grazingoccurs on the grasslands during the summer months.
The mine site has been significantly disturbed by the previous mining and is presentlyclassified as a mining area and not an agricultural one. Therefore, the impact within theproduction area by the current mine will be limited.
21.4 Ecological Importance
21.4.1 Fauna
Fauna records for Lesotho are limited to those areas within the Lesotho HighlandsWater Project, approximately 50km west of Letseng, and the Sehlabathebe NationalPark, in the southeast of the country. Detailed records for the Letseng production areaare not available. A number of Red Data species occur in Lesotho, these include:• eight mammal species;• ten bird species including the bearded vulture, Cape vulture and black stork;• one species of frog;• four rare species of butterfly; and• one species of fish, the Maloti minnow.

128
Although the Maloti minnow does not occur within the production area, it occurs in theMatsoku River (Figure 4). Water flowing from the alluvial diggings in the unnamedtributary of the Qaqa stream feeds the Matsoku River at a distance of approximately11km from the production area. A high total dissolved salts (“TDS”) and suspendedsolids content in the water may have a detrimental affect on the minnows.
21.4.2 Flora
The type of flora present in the area is determined by the altitude and the slope aspectand is classified as either Montane, Sub-Alpine or Alpine. The area is predominatelycovered by short grasses and sedges of various types. Occasional highland bogs or miresoccur which are unique and important ecosystems.
21.5 Water Pollution
21.5.1 Surface Water
There are two forms of surface water pollution that have the potential to occur as aresult of mining, namely:
• an increase in suspended solids; and
• an increase in TDS.
Surface water occurs in the production area in the De Beers and the RTZ Dams (Figure 4) and currently also within the Main Pipe pit.
The De Beers Dam was constructed in 1980 in order to intercept and contain any fine sediment runoff from the coarse tailings dump. The dam has a capacity of 4.0Mm3.The dam wall was independently assessed in 2004 and its stability was confirmedthrough the drilling of a series of holes into the wall. Piezometers have been installedto monitor the dam wall stability and the water levels. Letseng dewaters the wall on a continuous basis by siphoning from the well points. The upstream crest of the wall,which had been damaged by wave action over 20 years, was recently repaired. The damreceives water runoff from a small catchment of 450ha.
Water is also present in the Main Pipe up to the level of the RTZ undergrounddevelopment. Any increase in this volume of water drains through the development andout of the RTZ adit. The RTZ Dam is situated downstream of the adit (Figure 6) and currently serves as an intercept and settling facility for this water. The dam has a capacity of 0.3Mm3.
Alluvial contractors are working within the catchment areas of the Patiseng stream(Figure 4) adjacent to the Main Pipe.
Their workings and the historical workings in this area have resulted in an increase inthe sediment load within the stream. Mining will continue in this area in the future andit is recommended that a series of sediment catchment dams be constructed along thelength of the Patiseng stream to prevent any further damage.
Similarly, there are alluvial contractors working downstream of the Satellite Pipe in anunnamed tributary of the Qaqa stream. This area consists of the stream and anassociated sponge wetland. The mining has destroyed the wetland and the natural flowof the stream. Where the stream does flow there is a significant increase in thesediment load. It has been recommended that a containment dam be constructed alongthe stream at a position just before it flows out of the mining area. It is planned todeposit basaltic waste rock into this valley as an extension of the existing rock dump.
An aquatic ecological assessment of the area was undertaken on site by Ecosun cc(“Ecosun”) in December 2003 as part of the EIS in order to assess the current ecologicalstate of the ecosystem. This study serves as the baseline against which futureenvironmental performance can be measured.

129
Six study sites were selected by Ecosun (Figure 4) in three different river systems. Thesite situated in the Motete River (Site 1) represents natural non-impacted conditions inthe area, while the remaining sites represent conditions impacted by the historicalmining activities. The study investigated the following at each of the sites:• riparian habitats;• instream habitats at each site;• invertebrate habitats;• TDS;• pH; and• temperature.
The study concluded that the impact of the historical mining activities has significantlyaffected three of the sites, namely:• Site 6, downstream of the alluvial workings on the Main Pipe where the stream is
completely degraded and no longer flows;• Site 3, downstream of the alluvial workings on the Satellite Pipe due to mining of the
wetland; and• Site 2, to a lesser extent, downstream of the De Beers Dam due to modifications in
flow regime as a result of the dam.
Ecosun stated that the re-commissioning of the mine is expected to have little or noimpact on the current state of these sites. They recommend that the rehabilitation ofthese areas be undertaken as a matter of priority and that monitoring of qualities atthese sites is undertaken by the mine on a regular basis.
A further water quality assessment was undertaken by Golder on the water quality of21 localities (Figure 3), including some of the sites used in the Ecosun study. Four solidsamples, typical of the existing mine residues, were also collected and assessed. Thestudy concluded the following:• the influence of the mine on local water quality is significant;• streams in the vicinity of the mine are enriched with salts by up to four times the
norm. These increased levels could place environmental stress on certain aquaticorganisms. These levels decrease with distance from the mine due to dilution fromtributaries;
• a number of trace elements have been leached from residues and occur at levelsabove potential toxicity; and
• high turbidities occur in some areas.
Golder states that in order to prevent the items noted above, decanting into the variousstreams should be avoided in future, where possible. The mine is currently in theprocess of implementing the following remedial measures:• the alluvial contractor in the Patiseng stream has been instructed by Letseng
to construct retaining walls to ensure catchment of water. This water will then bepumped into the slimes dam. A similar procedure needs to be implemented in theunnamed tributary of the Qaqa as a matter of priority;
• water samples are collected on a monthly basis from the six Ecosun sample pointsand submitted to a laboratory in Maseru for analysis in order to identify anydecrease in the quality as compared to the baseline data. These results are alsosubmitted to NES; and
• an internal environmental audit was conducted in August 2005.
According to the water balance the mine will not discharge any further water.
21.5.2 Groundwater
Groundwater yields are low in the basalt as is evident in the minimal inflow of waterinto the open pits. The potential impact of the mine on the groundwater is expected to be minimal.

130
21.6 Visual Impact
The mine is situated in a remote but scenic area which is expected to receive increased interestfrom tourism with the development of the Maloti-Drakensberg TFP. Portions of the mine siteare visible from the tarred road as well as the alluvial workings in the unnamed tributary ofthe Qaqa stream. The visual impact is expected to increase as the volume of the coarse tailingsfacility increases, and especially with the additional volumes which will be associated with theExpansion.
21.7 Noise Pollution
Only limited noise pollution previously occurred in the area from occasional traffic, livestockand the small number of inhabitants in Khaphamali village. The mine has increased the noisepollution through blasting, mining machinery and plant noise. The mine and plant operates 24 hours a day. Due to the low level of the population in the area the impact is low. The mineensures that no blasting occurs at night.
21.8 Air Pollution
The air quality at Letseng is good with the only sources of pollution being domestic fuel andgrassland burning. The mine pollutes the air through mining machinery emissions of exhaustfumes and entrainment of dust from the gravel roads. The mine actively sprays the roadwayswith water. The impact of the mine on the air quality is low.
21.9 Cultural and Archaeological Importance
No sites of cultural or historical importance have been identified within the mine site whichcould be disturbed by the mining operation.
21.10 Socio-Economic Impact
The majority of the Lesotho population reside in rural areas and practise subsistence farming.There are few job opportunities in the country and especially in the remote area where the mineis situated. The socio-economic impact of the mine is large and of a positive nature, offeringwork opportunities. The local village of Khaphamali is a migrant labour habitat comprisedpredominately of men seeking employment at the mine.
The construction phase of the current mine provided employment for a large number of people.This level has decreased to a steady state of 85 employees, 73 of which are Lesotho nationals.
The Expansion should provide additional employment opportunities and the staff complimentis expected to increase by 310 during the construction phase, with a steady state of295 additional employees.
21.11 Key Environmental Issues
It must be noted that although the mine is located in a sensitive area, due to the high elevationand resulting climate, the mine’s surroundings are virtually barren. Only limited numbers offauna, flora and local populace are present. The area has also been significantly disturbed bythe historical mining activities. Over and above this, the process of diamond winning is straightforward and does not result in the emitting of dangerous chemical compounds. The processingmay, however, result in an increase in the salt and sediment content of water bodies which maycome into contact with the tailings and slimes. It is for these reasons that the risks associatedwith the environment are limited and simple to monitor and control.
The key environmental issues, as identified by Golder are summarised as follows:• alluvial diggings and the increase in the sediments in the associated streams (i.e. Patiseng
and an unnamed Qaqa tributary) pose the largest environmental risk. These diggings mustbe rehabilitated as soon as mining is completed;
• limited salination will result from the additional deposition of tailings, however the positionof the De Beers Dam will intercept any runoff and discharge from the disposal facilities;
• limited employment opportunities will be available to the local population because of theskills requirements. However, the utilisation by Letseng Diamond of local contracting

131
companies has ensured the maximum possible use of Lesotho nationals. The mine is alsoproviding training to these contractors to improve their skills base;
• due to the remote location of the mine, labour will need to be accommodated on site andoperate on a rotational shift basis. This may have a negative impact on the staff;
• the socio-economic benefit of the mine to Lesotho through the employment opportunities for25 years will significantly outweigh the two issues noted above; and
• due to the sensitive nature of the area, it is suggested that regular audits be conducted byindependent parties to monitor the implementation of the EMP.
With respect to the Expansion, the large volume of coarse tailings that will be generated needsto be carefully managed. A number of potential disposal sites have been identified but furtherstudies are required to determine their suitability and calculate their associated capacities.
There are no known environmental issues that are likely to cause a fatal flaw to the Expansion.
21.12 Environmental Liabilities
A preliminary independent environmental liability assessment was conducted by Golder in July 2005. Although time did not permit a comprehensive liability assessment in terms ofcurrent and future environmental legislation requirements in Lesotho, Golder were able toprovide judgement on an indicative rehabilitation liability in the event of non-scheduled mineclosure in 2005.
Recent developments in South African mining and environmental legislation require miningcompanies to provide a lump sum for rehabilitation in this event. Although legislation in Lesothohas no requirement for this, it has been assumed, for this report and valuation, that in the nearfuture Letseng will be required to make similar provisions as legislation may follow the samerationale as in neighbouring South Africa and prescribed by international best practise.
Golder have estimated that a total of ZAR27m will be sufficient to provide for the mine’s currentenvironmental closure liabilities (Figure 26). This quantum was compared to similar operationsin southern Africa and deemed to be in the correct order of magnitude.
It must be noted that this liability will increase as the proposed expansion is realised andfurther environmental disturbance is created in the form of a larger plant, larger open pits and significantly larger tailings and slimes dams amongst other issues.
In order to cater for this rehabilitation liability Letseng currently allocates ZAR0.41/ROMt for this process. To-date this amount has been notional and has not been accumulated in arehabilitation fund of any kind, and there is no balance sheet provision at present. The mine is,however, currently investigating establishing a fund.
22. KEY PERSONNEL AND MANPOWER
22.1 Management Structure
The management of Letseng is sourced from South Africa’s diamond industry as well as fromLesotho. The organogram of management is shown in Figure 37. The qualifications andexperience of each of the management team is described below. Note that Venmyn has not duediligenced the CV’s presented here but they were warranted to be true and correct by theindividual entities:
T Keith Whitelock (BSc. (Min. Eng); BSc. (Min. Geol); FSAIMM; FGSSA)Chief Executive Officer
Keith has a total of 45 years experience in the southern African mining industry, with 21 yearsof these being Mine Manager at De Beers’ operations in Lesotho, Botswana and Namibia. He has an extensive knowledge of the diamond mining business and of the Letseng Diamondmine. He has Mining Engineering and M.Sc (Geol) degrees from the University of theWitwatersrand.

132
Moruti Mphatsoe (BSc. (Min. Eng))General Manager
Moruti is a mining engineer with extensive cross industry experience including that of Inspector of Mines for the Lesotho Government when Letseng last operated as a mine. He joined Letseng Diamonds in 1999 from Loti Brick in Maseru where he was the ManagingDirector. He has a Mining Engineering degree from the University of Wisconsin.
Jon Tully (ACISA, MBA, ICS&A)Financial Manager
Jon has extensive financial experience across a wide range of industries. Since 1993 he hasbeen employed as Financial Manager for Netcare Medical Holdings Ltd, as well as for SAFT, a multinational logistics and maritime company. Jon joined Letseng Diamonds in 2004. He hasa CIS degree from the University of the Witwatersrand and an MBA from Oxford BrookesUniversity in the United Kingdom.
John Houghton (Nat Dip; Govt Cert. (Mech Eng); MDP)Production Manager
John has 25 years experience in the southern African mining industry. Of this he spent 21 yearsworking for De Beers in South Africa and Nambia. He has gained extensive experience invarious aspects of metallurgical and engineering processes related to the mining of diamonds.He also worked as a engineering manager at New Diamond Corporation (Pty) Ltd prior tojoining Letseng Diamonds in 2003.
Neil Kaner (BSc.(Hons) (Min Eng))Consulting Mining Engineer
Neil has 25 years operational, project and executive experience in the southern African miningindustry. He has worked with De Beers, Tati Nickel, and SA Mineral Resources gainingextensive experience in both openpit and diamond mining in Botswana and South Africa. Neiltook up his post as Letseng Diamonds’ consulting mining engineer in June 2004 where he isresponsible for all mining matters including the management of the various contractors.
Jan Venter (Nat Dip (Build. Constr.); Cert (QCP); SAAQS)Services Manager
Jan, born in Lesotho, has qualifications in building construction and quantity surveying. Hehas had over 15 years experience in the construction industry in Lesotho. Thereafter he tookup a position as Maintenance Manager with the Lesotho Highlands Water Project. Jan has beenemployed at Letseng since 2001.
Makhema Leboela (Dip (Loss Control); Safety Officer Cert.; LNACOS&H)Safety, Health & Environmental Manager
Makhema is a Lesotho national who commenced his work experience in 1979 in the SouthAfrican gold mines. There, and in the South African coal mines, he obtained on the job trainingin nursing, blasting, loss control, safety and health. In 1991 he took up a position with theLesotho Highlands Project as Health & Safety Manager and later as Health & Safety Officerfor the consulting engineers on the Lesotho Highlands Tunnel Project. He joined Letseng in2004 as their Safety, Health & Environmental Manager.
Baf Makhalane (BSc., PGD (Forensic Toxicology), Cert (Police Man. & Criminal Justice) Security Manager
Baf is a Lesotho national who completed a BSc. degree in 1984. He first entered the securityfield by joining the Lesotho Mounted Police in 1988. Baf moved up the ranks of the police forcegaining experience in various departments including the Criminal Investigation Division. In1990 he joined the police’s forensic laboratory where he worked for seven years. Baf then movedinto police administration where the highest rank he obtained was that of AssistantCommissioner of Police in 2001 for a period of 5 years. During his time as AssistantCommissioner he was involved in police management, crime prevention strategies,investigation of serious crimes. He also had the opportunity of studying forensic toxicology,analysis of drugs in seized materials and biological fluids in the United Kingdom, Austria andSingapore, respectively. Baf joined Letseng in March 2006 as Security Manager.

133
Figure 37: Management and Staff Organogram

134
22.2 Staff Organogram
Letseng has a total staff complement of 85 (Figure 37) comprised of 32 skilled, 15 semi-skilledand 38 unskilled personnel. The complement consists of 73 Lesotho nationals (85%) and12 expatriates (15%) sourced primarily from South Africa. The small staff compliment is afunction of the utilisation of contractors. This reduces the fixed costs of the business andminimises performance risk.
23. CAPITAL COSTS
23.1 Expansion Capital Costs
Capital expenditure profiles for Letseng’s expansion plans have been prepared internally byLetseng, taking cognizance of the technical requirements of the proposed expansion. The basedate of the estimates is March 2006. Capital expenditure has been estimated as illustrated inTable 30.
Table 30: Letseng Nominal Capital Expenditure Schedule Estimates (Unescalated2006 Terms)
2006 2007 2008 2009 2010 2011 2012
Earthmoving Equipment Workshop Upgrade 0 0 0 0 0 0 (10,000,000)
Plant double up implementation (122,848,408) (173,606,837) 0 0 0 0 0
Replacement capital (3.5% of new plant capex) (2,837,798) (6,848,116) (6,848,116) (6,848,116) (6,848,116) (6,848,116) (6,848,116)
Replacement capital (3.5% of existing plant capex) (3,003,000) (3,003,000) (3,003,000) (3,003,000) (3,003,000) (3,003,000) (3,003,000)
Ongoing Sustaining Capital (10,000,000) (10,000,000) (10,000,000) (10,000,000) (10,000,000) (10,000,000) (10,000,000)
Other Minor Capex (4,553,757) (6,751,926) (11,513,954) (12,142,821) (12,765,954) (12,534,464) (14,376,265)
Contingency Capex (2.0%) (2,773,784) (3,869,159) (397,022) (397,022) (397,022) (397,022) (597,022)
TOTAL CAPEX (ZAR) (146,016,748) (204,079,038) (31,762,092) (32,390,959) (33,014,092) (32,782,603) (44,824,403)
Note: Capex for the respective cash flow scenarios beyond 2012 is illustrated in Appendix 7.
All infrastructure, plant and equipment, except for earthmoving equipment, will belong toLetseng. The above schedules are the product of Letseng’s internal pre-feasibility study.Venmyn have consulted with industry experts regarding the order of magnitude of the aboveestimates and, in conjunction with records of capital already expensed on the existing plant andinfrastructure, are satisfied that the estimates are reasonable.
There is currently no unredeemed capital balance nor any assessed loss in the company.
24. OPERATING COSTS
24.1 Historical Operating Costs
The operating cost history at Letseng since production began in 2004 is illustrated in Figure 38:

135
Figure 38: Letseng Operating Cost History
24.2 Future Operating Costs
The question of base-case operating costs was premised on the moving average curve illustratedin Section 24.1, and a base-case total cost per tonne kimberlite mined and processed ofZAR100/t was applied as the 2006 opening unit cost. The economies of scale possible under theexpansion scenario have been applied from 2008 in respect of contract crushing, treatment, siteoverheads and fixed mining costs as illustrated in Table 31. Unit costs illustrated below are forthe ‘After the Transaction’ scenario with an 8% Diamond Royalty. Unit costs for the ‘Before theTransaction’ scenario illustrated in the respective cash flows in Appendix 7 reflect the 7%Diamond Royalty.
Table 31: Unit Operating Cost Assumptions2006 2007 2008 2009 2010
Nominal Operating Costs (ZAR/t)
Ore – Satellite (7.81) (9.17) (10.04) (10.98) (12.01)
Waste – Satellite (per tonne waste) (8.33) (9.79) (10.71) (11.71) (12.81)
Ore – Main pipe 0.00 0.00 0.00 0.00 (11.41)
Waste – Main pipe (per tonne waste) 0.00 0.00 0.00 0.00 (12.81)
Ore – Stockpile (5.33) (5.69) (5.94) (6.19) 0.00
Contract crushing cost per tonne (3.71) (3.96) (3.48) (3.63) (3.79)
Treatment cost per ore tonne (27.24) (29.09) (25.91) (27.02) (28.18)
Site overheads per ton including Maseru (16.08) (17.17) (12.92) (13.48) (14.06)
Fixed Mining cost per tonne Kimberlite (4.00) (4.27) (4.46) (4.65) (4.85)
Environmental Rehabilitation (0.13) (0.13) (0.13) (0.13) (0.13)
Off-mine cost per tonne* (21.68) (23.40) (23.46) (24.21) (27.26)
Contingency (2%) (1.77) (2.24) (2.23) (2.35) (2.47)
TOTAL (100.02) (114.41) (113.82) (120.04) (126.21)
* Includes diamond marketing costs, annual Mining Lease fee, Lesotho Diamond sales taxes and Johannesburg headoffice fees.
In addition to annual cost escalations at Venmyn’s estimate of South African CPIX, as the pitsare deepened, a nominal depth cost escalation of 4.9% per annum has been included in theabove costs.

136
25. DIAMOND MARKET
WWW were contracted by JCI to undertake a diamond market review on behalf of Letseng. Althoughthe company is not independent, WWW are international diamond valuators who currently valuediamonds for the Canadian government amongst many other international clients. It is for thisreason that Venmyn believes the wealth of their knowledge of the industry, as well as theirfamiliarity with the stones produced by Letseng, far outweigh any possibility of their assessment ofthe diamond market being biased. Excerpts from their report of August 2005 comprise the followingsections on the diamond market.
25.1 Current and Forecast World Diamond Production
Global diamond production is dominated by three countries, namely Botswana, DRC andRussia, who together produce over 50% of the world’s diamonds (Figure 39). The Africancountries together produce almost 60% of the world’s diamond production.
Figure 39: World Diamond Production by Country for 2004
Global production since 2003, as well as the forecast for world production by carats and byvalue, are shown in Figure 40. Compared with 2003, diamond production in 2004 fell by 2Mctsto just over 146Mcts. In value terms, however, production increased by US$2.3bn to US$11.8bnas a result of increased prices, fewer cheaper goods from Argyle (Australia) and increasedproduction from all other countries. This was the first time that annual production reached theUS$11bn level.
Figure 40: Recent and Forecast Global Diamond Production
During 2004 De Beers increased production from its mines in Botswana, Namibia, South Africaand Tanzania to approximately US$4.9bn. In addition, De Beers purchased around US$0.7bnof Russian production from Alrosa, under their long-standing contract. This estimated intakefor De Beers at US$5.6bn gives it a market share of approximately 47%.

137
In Canada, reduced production from Ekati Mine which decreased production value byUS$100m was more than compensated for by Diavik (up US$400m) moving into fullproduction. Overall Canadian production increased from US$1.2bn in 2003 to US$1.5bn in2004. In 2005 production is expected to fall from Ekati but increase from Diavik. Theintroduction of the Diavik production has been readily absorbed by the market.
A significant component of international supply has been at Rio Tinto’s Argyle Mine, whereproduction decreased by 10Mcts to 21Mcts in 2004. The first quarter of 2005 saw productionrise to 8.6Mcts. Argyle is fast running out of opencastable ore and the company undertook afeasibility study to identify the economics of going underground. It was completed in 2005 withpositive results. The underground operation will increase the mine’s life to 2018 but the rate ofproduction of stones will reduce by 50%.
Future global diamond production to 2010 is predicted to remain around the 160Mct level. Byvalue, it is expected to increase to $13.4bn this year due to significant price increases. By theend of this period, it is expected that world production will be US$14bn due to increases inoutput from Botswana, Canada, Russia and South Africa.
Based upon current estimates, WWW does not anticipate De Beers’ share of productionincreasing above 50% until 2008 at the earliest. This depends upon the Canadian Snap Lakeand Victor projects coming on stream and a drop in production at Canada’s Ekati and Diavikmines.
There are no major new kimberlite diamond mines anticipated to come into production over thenext seven or eight years. The only possible exception is Alrosa where an increase in productionis dependent upon the success of their Alrosa-Nyurba subsidiary, which started production in2002, and its progress in the Archangel diamond fields. It is clear that there are no knownadditional sources with the ability to produce similar diamonds to Letseng, namely 5cts andlarger and, in particular, stones of 10cts upwards of top colour and top quality.
25.2 Current and Forecast Global Diamond Demand
The demand for diamonds is generally measured in relation to the manufacturing capacity andthe continued demand for jewellery. At present, there is a manufacturing over-capacity. As newefficient factories are opened and older establishments become uneconomic, rather than tomove out of manufacturing, factory owners have elected to build even bigger, lower costestablishments to compete, thus exacerbating the problem. Pressure from producing countriesfor diamond manufacturing facilities to be built locally is also adding to the problem.
The fact is that for the foreseeable future, there will not be enough natural diamonds mined tokeep all the manufacturing facilities operating. This problem will become more severe after2007 when Argyle mine moves underground, and a further constriction in supply is created.There have been reports of late that some factories are now at least being moth-balled whilstthe current disparity between rough and polished prices remains.
Using the economics outlined in the International Monetary Fund’s World Economic Review(April 2005), the projected demand of diamond jewellery is based upon the real Gross DomesticProduct growth for the major diamond consuming countries. WWW’s econometric forecasts ofworld jewellery have the US diamond jewellery market growing broadly in line with consumerspending. Japan and Europe grow less quickly with Asia and the rest of the world growingquicker than general consumer spending. Overall this results in world diamond jewellerygrowing at an annual rate of approximately 5.3% per annum over the forecast period (Figure 41):

138
Figure 41: Recent and Forecast Global Diamond Sales Value
Polished stone prices are predicted to grow at 5.6% per annum.
25.3 Current and Forecast Diamond Prices
The recent diamond prices received and the forecast by WWW to 2010 are shown in Figure 42.The prices are based upon the overall Polished Prices index. The Polished Prices indices arecreated by weighting each of the individual prices of transactions reported by an estimate of thetotal world production of rough or polished diamonds over the ranges covered.
Figure 42: Recent and Forecast Diamond Price
25.3.1 Rough Prices Since January 2003
During 2003, changes in diamond prices were size dependent, with the prices of smallergoods falling by around 10% to 15%. In contrast, the larger goods strengthened during2003 by a similar amount. Based upon world production models, the net effect for 2003for the entire diamond market was an overall increase in prices of between 5% and 10%.
In 2004, diamond prices across all sizes were stronger than at the turn of the year dueto production problems encountered by many major producers. Due to the reduction inproduction at Argyle, a mainly small stone producer, the increase in the price of thesmaller diamonds was strongest.
Between January 2003 and August 2004, rough prices increased on average by aminimum of 10% in the small low-cost end to well over 30% in the larger better qualitygoods. Overall this translates to an average increase of around 25% to 30%.

139
This percentage will vary from producer to producer dependent upon the size, colourand quality of diamonds produced. Since August 2004, and for the rest of the year,prices of cheap rough fell back but remained above the levels of January 2004.
In January 2005, however, there was the usual seasonal increase in these categories,backed by a 3% to 5% price increase by De Beers. In addition the market has been givena 2% charge for marketing services provided by De Beers. Subsequently, there was afurther price increase of 3% on De Beers rough announced in June 2005.
Prices for larger better quality rough remain particularly strong.
25.3.2 Polished Prices Since January 2003
The overall Polished Prices index stands at 124.0 (Jan 2004=100), 18.6% above the104.5 from January 2003. One of the main features of the polished market over the past18 months has been the increase in the volatility of prices that accompanied theintroduction of De Beers’ Supplier of Choice initiative, and the decision of the companyto abdicate its custodian role over the rough markets.
The polished market turned towards the end of 2003, and prices rose by over 20% abovetheir levels at the start of the year, before slipping back slightly. The increases inpolished prices are, however, lagging behind those seen in rough. The average roughprice was 19% higher in 2004 than in 2003, whilst polished prices were 9% higher.During 2005, rough prices have increased by a further 10.9% whereas polished hascontinued to lag adding only 3.3%.
25.3.3 Forecast Rough and Polished Prices to 2010
Over the next five years the outlook for diamond prices remains positive, with prices for both rough and polished rising at an average annual rate in excess of 5%. Themarket is expecting a slight short-term correction in rough and the current moderategrowth of polished prices to continue. This will partly close the gap that has opened up between rough and polished over the past two years, but because of some supply side inefficiencies that have developed in recent times, some of the gap will remain. The market expects margins in the polished pipeline to continue to be squeezed.
Better quality top range goods, the type specific to Letseng Diamonds are expected toperform particularly well over the next two years. Letseng Diamonds is unique in termsof its production. None of the diamond discoveries in the past ten years combine the sizeand quality of diamonds to the same extent as Letseng Diamonds, so any new productionis unlikely to dampen demand for the Letseng Diamonds goods. If the Premier Mine’s “C”cut goes ahead there will be an increase in production of large stones. However theunique characteristics, in particular the top white colour of Letseng Diamonds’ mostexpensive stones, will give its production a serious competitive edge.
There is also an argument that the demand for Letseng Diamonds’ extraordinary stonesis not directly linked to the demand for, what might be termed, the more run of the milldiamonds. Its production, or that part of its production which produces all the value, isobviously in a unique segment of the diamond market. There is every indication thatthis unique segment of the market will be likely to be the one that enjoys the strongestperformance.
25.4 Diamond Market Outlook
Since January 2003 rough prices have seen a steady and strong upward movement. The longerterm prognosis for diamonds appears sound, as there is expected to be a clear shortage of roughsupply in the coming years, with production remaining constant over the next five years.Within the confines of increasing volatility, prices appear to be heading upwards. WWWforecasts that the prices of rough and polished stones will increase by over 5% per annum overthe next five years.
The surge in rough prices over the past couple of years has been exceptional and based onseveral extraneous factors including lower cost finance, a polishing over capacity, a weakUS dollar, active encouragement for consumer spending, definite supply shortages in manydiamond categories because of De Beers and Argyle production difficulties.

140
A key feature of the current market is the imbalance between rough and polished stones. At some point this has to be corrected. WWW’s view is that there will have to be some furthersoftening of rough prices at some point in most ranges, but that much of the gains over the pastyear and a half have become embedded in the system.
There are no outstanding stocks of rough, though there are of polished. Manufacturing over-capacity will continue to bolster rough for some time. In the meantime, more of thebenefits of the increase in advertising budget will help reduce and remove the polishedoverhang. Consumer demand is expected to remain reasonable.
Given the extraordinary niche that Letseng production holds, it is difficult to expect anythingbut a general movement upwards though there might be some sharp blips downward withinthis positive trend.
26. VALUATION
A mineral asset is defined, according to the International Financial Reporting Standards (“IFRS”),as “A resource controlled by the enterprise as a result of past events and from which future economicbenefits are expected to flow to the enterprise”.
This valuation has identified the Fair Market Value for the Letseng Diamonds mineral assets.According to the Valmin Code, this is “the estimated amount of money for which the project shouldchange hands at the valuation date, between a willing buyer and a willing seller in an arm’s lengthtransaction, wherein each party acted knowledgeably, prudently and without compulsion. It isusually comprised of the underlying value (technical value) and premium or discount, relating tomarket, strategic and other considerations”.
This report has valued the Letseng Diamonds mineral assets using industry-standard methods,selected according to the development stage of the mineral assets. An increase in value is associatedwith increasing confidence through increased knowledge, as well as the greater degree of probabilityof it being brought to account. The valuation method appropriate at each stage in the developmentprocess of mineral assets is illustrated in Table 32:
Table 32: Valuation Approaches and Methodologies
DORMANT PROPERTIES
VALUATION VALUATION EXPLORATION DEVELOPMENT MINING ECONOMICALLY DEFUNCTAPPROACH METHODOLOGY PROPERTIES PROPERTIES PROPERTIES VIABLE UNVIABLE PROPERTIES
Various DiscountedCash Flow Cash Flow (“DCF”)
Capitalisation Methods N/A P1 P1 P1 NA NA
Sales Comparable Comparative Transactions P1 P3 P2 P2 P1 P1
Historical Asset Recognition P2 NA NA NA P3 P2Cost and Impairment Test
P1 Most acceptable approach and widely used
P2 Acceptable approach and quite widely used
P3 Less acceptable approach, less widely used and poorly understood
NA Not acceptable
Definitions of the above mineral assets are contained in Appendix 5. The Letseng Diamonds’ mineralassets comprise two kimberlite pipe mineral resource areas in the Main and Satellite Pipes.
The valuation of these mineral assets has been conducted upon the basis that the Main Piperepresents a dormant property for which economic viability has been demonstrated and is in theprocess of re-development, and the Satellite Pipe a mining property. As such, the most acceptableand widely used cash flow capitalisation or discounted cash flow method of valuation has beenapplied to both properties as together they will form a single mining property.

141
26.1 Valuation Approach
In valuing the mineral assets of Letseng Diamonds, Venmyn scrutinised the development statusof the mineral assets, the amount and reliability of relevant information, the specific risksinvolved in the venture, and the prevailing and estimated future diamond market conditions.
A principal driver with regard to the Letseng Diamonds mineral asset valuation was the statusof advanced exploration and the associated classification of the diamond resources. Morespecifically, a limiting factor was the depth to which diamond resources could be classified interms of applying a mine of an appropriate nature to economically exploit the Letsengkimberlites. Several mine planning exercises were carried out on the Letseng kimberlites onthe basis of certain assumptions regarding the sub-surface geometry of the pipes. Explorationdrilling has since confirmed the approximate physical and volumetric characteristics of thepipes at depth, and as a result, sufficient confidence has been demonstrated to enable theclassification of resources to the depths advocated by the pit shell designs carried out byMineNet for Letseng.
This valuation, therefore, has enabled Venmyn to consider both Indicated and InferredDiamond Resources from both the Main and Satellite Pipes in the valuation of the Letsengmineral assets.
Recent operations have proved the Letseng resource to be economically viable under prevailingeconomic conditions. Venmyn has therefore applied a discounted cash flow (“DCF”) valuationmethodology approach which, in our opinion, yields the most accurate results by capturing thepertinent aspects of the business’s investment case.
In order to demonstrate the value variance resulting from the inclusion of Inferred DiamondResources into the Letseng life-of-mine (“LOM”) plan, two valuation cases for the 5.16Mtpaexpansion operation were contemplated in this report. The first considered the depletion ofIndicated Diamond Resources only; and the second depleting both Indicated and InferredDiamond resources to the base of the economic pit shells.
Two valuation outcomes are presented for each of the above cases, as prescribed by theSAMREC Code, in order to illustrate the value variance resulting from having includedinferred Diamond Resources into the LOM plan. The respective base-case valuations includedDiamond Reserves only.
Table 33 outlines the resource parameter changes from the base-case valuations to the upliftvaluation cases.
Table 33: ROM Tonnages Considered in the DCF ValuationBASE VALUATION UPLIFT VALUATION
(t) (t)
Main Pipe
Probable Reserve 43,525,327 43,525,327
Inferred Resource – 61,614,932
Total ROM 43,525,327 105,140,259
Satellite Pipe
Probable Reserve 14,701,671 14,701,671
Inferred Resource – 31,565,810
Total ROM 14,701,671 46,267,481
26.2 DCF Valuation Rationale
Venmyn used the DCF valuation methodology to value the Letseng Diamonds’ mineral assets.Our forecasts cover the estimated life of the project and our assumptions have beensummarised in the relevant sections.

142
Since Letseng Diamonds is an unlisted company, it is important to assess the merits of anappropriate discount rate. Venmyn used the Capital Asset Pricing Model (“CAPM”) to calculatethe applicable discount rate using the following formula:Re = Rf + ß (Rm), Where:Re = Expected investment return;Rf = Risk free rate (appropriate fixed interest investment);ß = Relative volatility measure (Beta); andRm = Equity market risk premium.
Venmyn have utilised the risk free rate applicable to South Africa based upon an RSAR153 bond, given that the company’s cash flows will be ZAR denominated. This is currentlytrading at 7.56%, significantly down from past risk free rates in South Africa.
The risk premium is generally considered to be the investors’ reward for investing in equityrather than a risk-free government bond and should ideally relate to the country in which theinvestor resides. A 5% premium is currently considered to be fair in the South African market.The beta of the stock should reflect the stock price’s volatility relative to other general equityinvestments in the country of operation. However, this calculation has several drawbacks. Poorliquidity and an asset base unrelated to the market in which it is listed, implies that thecalculated beta is unlikely to truly represent the risk of the stock. It is also reasonable to factora consideration of company specific issues into the beta, such as AIDS, with its resultant labourimplications.
Venmyn have, therefore, preferred to use a mining project risk component in the discount rate,which varies with level of knowledge and ranges between 3.0% – 16.0% and is weightedaccording to fourteen critical project development factors. Amongst other modifying factors,project specific risk includes, in order of relative influence, confidence in mineral resources,reserve grade, diamond price, political and country risk, environmental disturbance, operatingmargin, capital requirement, plant recoveries, and legal tenure. Although these factors can berealistically estimated through pre- and bankable feasibility exercises and actual mining, therisk associated with those factors cannot be removed.
Figure 43 and Table 34 indicates how the project risk component for Letseng was calculated.
Figure 43: Mining Project Specific Risk Allocation

143
Venmyn consider these risk measures to be more realistic than the beta of the Resources Indexof the JSE (1.64) in South Africa to the South African All Share Index, which in comparisonadds just 3.2% to the risk free rate and market premium.
Table 34: Discount Rate Calculation Summary
COST OF CAPITAL DESCRIPTION
Risk free rate (South African R153 bond) 7.6%
Risk premium (emerging market) 5.0%
Base beta 1.0
Cost of equity (CAPM) 12.6%
Cost of Debt 11.5%
After Tax Cost of Debt 7.5%
Weighted Average Cost of Capital (“WACC”) 10.6%
Project Specific Risk 5.0%
Nominal Discount Rate 15.6%
26.3 Net Asset Value (“NAV”)
The NAV of Letseng Diamonds was determined from the balance sheet dated 31st March 2006by identifying all assets and liabilities not accounted for in the DCF mineral asset valuation,such as cash, debt and other non-core assets not used in the generation of income.
For the purposes of the DCF valuation, the book value of the fixed property plant andequipment was written down to zero as all those assets were deemed to be employed in thegeneration of income through operations, and no residual value was attached to those assets at the end of the mine life. All remaining current assets and liabilities were thereforeconsidered in the calculation of the NAV.
An important consideration with respect to any contingent liabilities that may influenceLetseng at some point in the future was the inevitable environmental liability that wouldbecome due as a result of the environmental disturbance created by the mining operation. An indicative assessment of the current liability at Letseng was conducted by Golder in 2005,the recommendations of which are disclosed in Table 35.
Table 35: Rehabilitation Liability EstimateNON-SCHEDULED SCHEDULED ONGOING
CLOSURE CLOSURE CONTRIBUTION(2005) (ZAR) (2025) (ZAR)* REQUIRED (ZAR/T)
REHABILITATION LIABILITY 27,000,000 34,000,000 0.13
* Estimated for the Expansion in 2006 money terms.
The assumption for the above table is that the purchasing company will be required to providefor the future value of the current liability estimate of ZAR27m upon mine closure. As a result,Letseng have made a balance sheet provision of ZAR16.7m which, invested at the South Africanrisk free rate of 6.5%, will satisfy that requirement at mine closure.
The environmental liabilities incurred from March 2006 until mine closure were estimated byGolder to be ZAR7.0m. This shortfall will, therefore, need to be funded over the LOM in theform of an Environmental Rehabilitation Trust Fund, and was calculated at ZAR0.13/ROMt.
Table 36 summarises the key items from the NAV calculation from the 31st March 2006 balancesheet which includes the above estimate.

144
Table 36: NAV CalculationBALANCE SHEET NAV
31 MARCH 2006 (ZAR) 31 MARCH 2006 (ZAR)
TOTAL ASSETS 287,314,149
Non-Current Assets
Property, plant and equipment 205,865,204 –
Current assets 81,448,945 81,448,945
Accounts receivable 14,290,338 14,290,338
Cash and cash equivalents 22,794,297 22,794,297
Stock 43,959,229 43,959,229
Prepaid Taxation 405,081 405,081
TOTAL LIABILITIES 287,314,149
Shareholders’ Equity 145,827,697
Share capital 3,000 –
Share premium 39,997,000 –
Retained Income prior years 105,827,697 –
Retained income 105,827,697 –
Deferred Tax
Non-current liabilities 98,921,618 36,854,339
Long-term loan 20,206,904 20,206,904
Deferred Tax 62,067,279 –
Provision for environmental rehabilitation 16,647,435 16,647,435
Current liabilities 42,564,834 42,564,834
Accounts payable 26,355,934 26,355,934
Provisions 4,673,720 4,673,720
Taxation 11,535,180 11,535,180
LETSENG NAV 2,029,772
26.4 Working Capital
For the first instalment, the working capital balances have been reduced to zero at the disposaldate and then raised on the notional basis of debtors due over 60 days and creditors over 30 days. The net effect on current turnover is a free cash flow deduction of approximatelyZAR52m which is then balanced at project completion.
26.5 Economic Parameters
Venmyn has valued the project in South African Rands under prevailing Lesotho economicconditions and the following economic and commodity parameters have been used in the LOMfinancial forecasts.
26.5.1 Inflation
The US and South African inflation rates for the LOM cash flows were basedrespectively upon analysts’ forecasts and the most recent Reuters consensus view of theCPIX as determined by various contributing economists (Table 37).
Table 37: Inflation ForecastsLONG-
2006 2007 2008 TERM
South Africa Headline CPI (%) 3.90 4.30 4.15 4.15
South Africa CPIX (%) 4.22 4.58 4.30 4.30
United States Inflation (%) 2.20 2.20 2.20 2.20

145
26.5.2 Exchange Rate
An exchange rate of ZAR6.50/US$ was used as the base year (2006) input rate. Therehas been much debate in recent times about the practical applicability of the economictheory of Purchasing Power Parity (“PPP”) to devalue one currency against another inthe southern African region. Since 1995, the ZAR has deviated significantly from thevalue calculated using PPP. The volatility of the ZAR in recent years has further calledinto question the applicability of PPP. The ZAR devalued, on average, by over 18% tothe US$ in 2001, and a further depreciation of approximately 18% during 2002. By theend of 2003 it had regained some 29% over the previous year’s average, and a further23% during 2004. Notwithstanding these aberrations, the ZAR has devalued at a rateof almost twice that of the official South African inflation statistics for almost 10 years.
Albeit the US$/ZAR rate has been volatile as a result of market drivers, we have usedPPP as the basis of exchange rate calculations from 2009 (Table 38).
The upside potential to US$ revenue-generating resource projects is that labour andother South African based costs may reduce with time in real terms.
Table 38: South African Rand ForecastsLONG-
2006 2007 2008 TERM
ZAR/US$ Forecasts 6.56 6.92 7.08 7.23
ZAR/US$ PPP (Inflation) 6.50 6.75 6.91 7.08
26.5.3 Revenue
Several considerations exist as to how Letseng’s revenues can be expected to performannually. The basis of the current assumptions regarding stone value and the futureperformance of the diamond market has been discussed in the relevant section, but thisvaluation has considered the stone values as described in Section 19.3.
The performance of the ZAR against the US$ has an important bearing on long-termoperating margins. As discussed previously, PPP theory has been applied to the annualdepreciation of the ZAR against the US$, thus implying a straight line long-termgrowth in ZAR revenues.
The long-term view on the US$ prices of rough stones has been estimated by WWWuntil 2010, beyond which the expectation is positive but not quantified. For the purposeof this valuation, US$ prices have been estimated to increase at the average UnitedStates inflation of 2.2% per annum beyond 2010.
26.5.4 Taxation and Royalties
The corporate taxation rate, after full recovery of all capital expenditure deducted inthe year it is expended, of 35% for Lesotho mining companies has been applied. Inaddition, a withholding tax on dividends of 15% for South African Companies and 10%for UK based companies is applicable which dictates that the applicable percentage ofany dividends distributed from Lesotho companies is held by government until year-end and returned to the company in the following year.
Lesotho law further dictates an additional revenue tax on rough diamond sales,currently 7.0% in Letseng’s case. Recent negotiations between Letseng Holdings andthe Lesotho Government have concluded an increase in the diamond sales tax to 8.0%for the 2006 financial year.
It has been assumed that most mining capital is permitted to be written off in the yearin which it is incurred. If insufficient taxable profits are generated in any single year,the unredeemed capital balance is carried forward to the next tax year. The projectvalues calculated include all estimated capital expenditure, together with a provisionfor replacement and ongoing capital.

146
26.5.5 Diamond Marketing Costs
An agreement between the parties involved in the marketing of Letseng’s rough stonesspecifies that WWW will earn a fee of 2.5% of gross revenue for the diamond marketingfunction. The valuation of the Letseng therefore included this marketing fee as anexpense item.
26.6 Valuation Summary
The valuation methodology used in this report is based upon the preparation of a DCF. Theeffective date of the valuation is 31st March 2006. The project cash flows are in nominal moneyterms. The summary valuation results for the respective production scenarios are shown inTable 39 and Appendix 7.
Table 39: Valuation Results Summary (Attributable Value)BEFORE THE AFTER THE
TRANSACTION TRANSACTION
Indicated Indicated Indicated Indicatedresources and Inferred resources and Inferred
only resources only resources
Discount Rate (Nominal) 15.6% 15.6% 15.6% 15.6%
Diamond Sales Tax (Royalty) 7.0% 8.0%
Letseng Holdings Attributable Ownership 76% 70%
Letseng Holdings Attributable Value (ZAR) 606.2 994.0 536.9 882.9
Attributable NPV per reserve tonne (ZAR/t) 13.22 21.68 12.72 20.91
Attributable NPV per resource tonne (ZAR/t) 5.26 8.63 5.06 8.32
Attributable NPV per resource carat (ZAR/ct) 304.94 500.06 293.27 482.31
The results of the various scenarios highlight the value uplift achievable as a result of inclusionof Inferred Diamond Resources into the LOM plan. The scenario which includes the depletionof the Inferred Diamond Resources has been carried out to illustrate the value effect of doingso, as Inferred Resources are not at a level of confidence that warrant conversion to DiamondReserves.
Although transactions involving corporate entities in the diamond industry have taken placerecently, very few transactions involving kimberlite projects with a similar grade:stone valuerelationship have taken place. Letseng has been valued on an NPV per diamond resource tonand per diamond resource carat, but value comparisons with other transactions would,therefore, not be a good indicator of expected value.
26.7 Sensitivity Analyses
Although several valuations have been detailed in this section, for the purposes of illustratingthe influence that movements in the critical valuation variables have on the total enterprisevalue of Letseng Diamonds, only the full attributable value (including Inferred Resources) casehas been sensitised to a combination of the most influential variables, which are illustratedin Figure 44 to Figure 46.
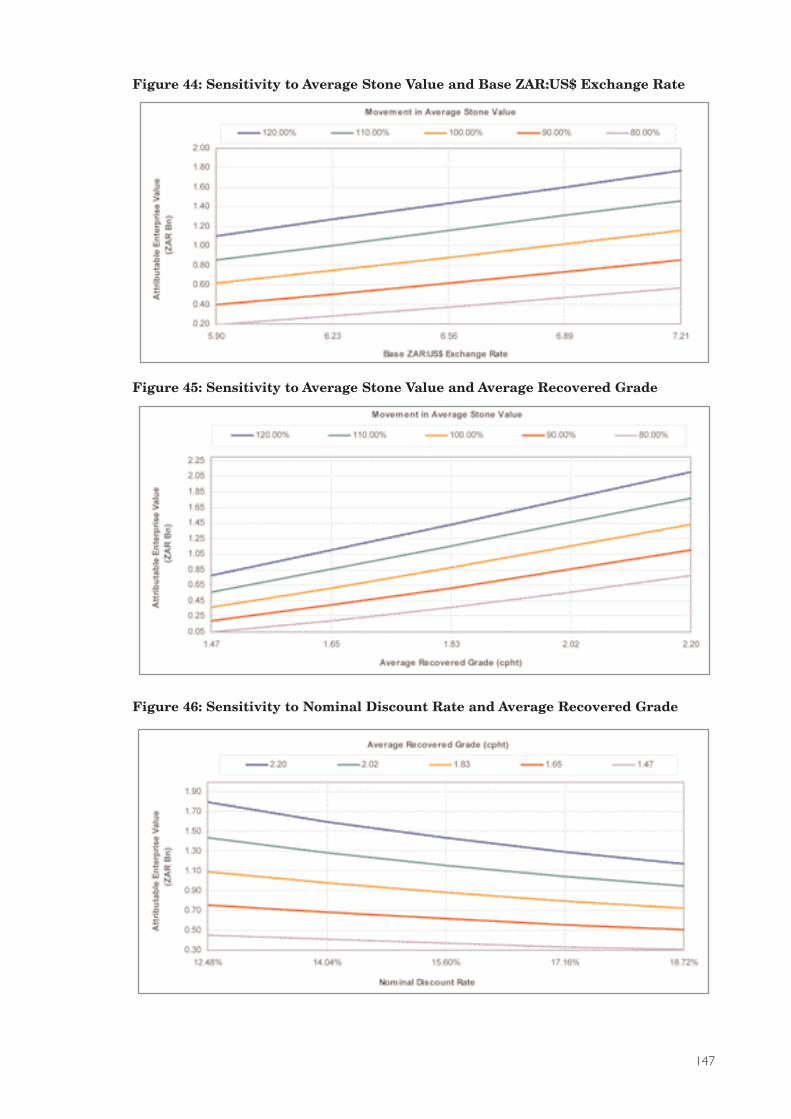
147
Figure 44: Sensitivity to Average Stone Value and Base ZAR:US$ Exchange Rate
Figure 45: Sensitivity to Average Stone Value and Average Recovered Grade
Figure 46: Sensitivity to Nominal Discount Rate and Average Recovered Grade

148
Figure 47: Sensitivity to Nominal Discount Rate and Average Stone Value
The project was valued at a base stone value of US$1,456/ct (Satellite), US$974/ct (Main) andan average recovered grade of 1.83cpht, as outlined in the relevant sections. The sensitivity ofthis valuation to stone value and grade is particularly significant. This valuation, therefore,sets a base value which is highly geared to changes in the abovementioned parameters.
27. CONCLUSIONS
Letseng is a unique kimberlite diamond mine which, with the re-development of the mine and therecent production results, has been proved a success. The critical aspects pertaining to the currentstatus of the mine and the Expansion include the following:• Letseng is unique in that it is a kimberlite type deposit that exhibits characteristics that are
similar to alluvial deposits, namely low diamond grade and very high diamond value;• recent results have confirmed the previously held opinion that the majority of the value of
production comes from only a small fraction of the stones;• the presence of large (+10.8ct) stones in the various kimberlite sources has been confirmed by
recent production;• the potential to produce diamonds with very high US$/ct values has been confirmed by the recent
sales data in today’s market. These high prices are achieved primarily as a result of the quality ofthe stones, and to a lesser extent as a function of size;
• a recent geostatistical analysis has enabled separate diamond prices to be predicted for theSatellite and Main Pipes. Although the availability of recent sales data on the Main Pipe is limitedand the resultant price may vary in the future, confidence in the estimates pertaining to theSatellite Pipe is high based on a substantial database as it relates to recent production and salesdata;
• according to the Mining Lease Agreement which Letseng has entered into with the Lesothogovernment, the mine must expand the plant capacity to 500tph by September 2008;
• the required staffing ratio, of Lesotho nationals to expatriates, as defined in the Mining LeaseAgreement, must be met;
• the exploration drilling programme on both pipes has been completed. The results have confirmedthe existence of kimberlite at depth and the respective extent and geometry of the variouskimberlite facies within the Main Pipe and the basalt raft within the Satellite Pipe;
• the Expansion project has been justified upon the basis of the defined diamond resourcesidentified in the drilling programme. The design and detailed costing of the new plant has beenprepared by Batemans. Further studies which are currently underway include:• identification and evaluation of future waste disposal sites;• completion of an amended EMPR for submission to the Lesotho government; and• detailed assessment of its impact on the water balance;

149
• the alluvial contractors’ effects on the local streams must be rehabilitated and preventionmechanisms implemented to ensure that no further damage to the environment occurs. Accordingto the agreements in place with the alluvial contractors, Letseng Diamonds is responsible for therehabilitation of their mining operations and tailings disposal sites;
• a detailed assessment should be undertaken to further quantify the scheduled and non-scheduledmine closure environmental rehabilitation liabilities as well as those associated with the plannedExpansion;
• a fund should be set up to manage the ongoing environmental liability contributions;• measurement of the critical input variables to the water balance will be necessary;• the diamond market outlook for Letseng is good as there are no known mines scheduled to come
into production in the medium term which would produce similar stones to Letseng, i.e. 5cts andlarger and in particular stones of 10.8cts upwards of top colour and top quality;
• global jewellery demand is expected to rise in excess of 5% per annum for the next five years andglobal diamond production is predicted to remain constant over the same period leading to asqueeze in supply; and
• prices for both rough and polished diamonds are expected to rise and better quality top rangejewellery with Letseng-type stones are expected to perform particularly well.
The valuation results have been presented in Section 26.6. The results represent Venmyn’svaluations at a point in time having applied consistent valuation methodologies across a range ofscenarios. Venmyn is cognisant of the debate regarding the valuation of Inferred Resources usingDCF methods and has not only shown the full range of values that were calculated, but also ensuredthat this report fully describes each mineral asset. This is done in order to provide investors with afull and open disclosure of mineral asset information such that they can exercise their own judgmenton the merits of the valuation results Venmyn have presented.
The substantial variance in the Letseng mineral asset value has been disclosed so as to illustrate theeffect of having included the Main and Satellite Pipes’ Inferred Diamond Resources into a DCFvaluation, as required by the SAMREC Code guidelines.
Yours faithfully
_______________________________________ ______________________________________G D STACEY C A TELFERBSc (Eng) Mining, MBA BSc Hons (Geol), DMS Dip Bus ManMSAIMM, MAusIMM, MSACMA Pr.Sci.Nat., MAusIMM, MGSSAADVISOR DIRECTOR
_______________________________________ ______________________________________M C EKLUND A G BLOOMERBSc (Eng) Ext. Met., MSc (Eng) Ext. Met BSc Hons (Geol)AMSAIMM Pr.Sci.Nat., MGSSA, MSAGA, MSEGADVISOR ASSOCIATE

150
Appendix 1: Competent Persons’ Certificates
Name of Staff: Catherine Anne TelferPosition: Independent Techno-economic advisor and DirectorName of Firm: Venmyn Rand (Pty) LtdAddress: 1st Floor
Block G173 Rivonia RoadSandton, 2146
Profession: GeologistDate of Birth: 23 August 1969Years with Firm/Entity: 14Nationality: South AfricanMembership in Professional Societies:
CLASS PROFESSIONAL SOCIETY YEAR OF REGISTRATION
Member(Reg. No. 400049/02) The South Africa Council for Natural Scientific Professions 2002
Member Australasian Institute of Mining and Metallurgy 1996
Member Geological Society of South Africa 1992
Fair and Reasonable Opinions: SECURITIES TRANS- IMPLIEDEXCHANGE ACTION VALUE
YEAR CLIENT JURISDICTION TYPE (US$m) DESCRIPTION
2005 LionOre TSX Acquisition 110.0 Tati Nickel International notification Review of
documentation. Mineral Resources.
2003 Amplats JSE Acquisition price Confidential Preparation of an calculation for Independent Unki Platinum. Techno-Economic
Valuation Report andFair and ReasonableOpinion. Document notused as the transactionbecame immaterial forreporting purposes.
2002 Consolidated JSE CAM acquired 40% 10.0 Preparation of anAfrican Mines of the Letseng Independent Limited. diamond mine for Techno-Economic
CAM shares. Valuation Report andFair and ReasonableOpinion. Document used in full.
1999 New Mining JSE Listing and 50.0 ComplicatedCorporation acquisition transaction and
documentation. full Independent
Techno-EconomicValuation prepared withFair and ReasonableOpinion included in ourreport. This satisfied the JSE and the SRP.
1996 West JSE Section 440K Offer 20.0 Independent Witwatersrand Competent Persons Gold Holdings Report on the OfferLimited by Durban Deep to
West Wits under Section440k. Documentincluded in circulars toboth shareholders. OurFair and ReasonableOpinion was specificallyrequested by the SRP.

151
Detailed Tasks Assigned:YEAR CLIENT COMMODITY PROJECT DESCRIPTION
2006 Pangea DiamondFields plc Diamonds Aim Listing document for 9 projects in 4 Africancountries.
2006 Trans Hex Group Diamonds Competent Persons Report on the Middle OrangeOperations.
2005 Eyesizwe Mining Coal Due diligence of reserves and resources of all KumbaResources’ coal mines required as part of a BEEtransaction.
2005 Eyesizwe Mining Coal Due diligence of reserves and resources of SasolMining’s Twistdraai Colliery required as part of a BEEtransaction.
2005 Letseng Diamonds Diamonds Competent Persons Report on Letseng Diamonds
2005 LionOre International Nickel Technical Report on the Tati Nickel Mine in NationalInstrument format for Canadian Stock Exchange
2005 Energem Diamonds Technical Report on the Koidu Project in NationalInstrument format for Canadian Stock Exchange
2005 Two private and one Diamonds Preparation of Report for AIM onlisted company 18 projects in five African countries
2004 LionOre International Ltd Nickel Due Diligence on the Nkomati Nickel Mine.
2004 Dwyka Diamonds Diamonds Prospectivity Report on Blaauwbosch Mine
2004 Dwyka Diamonds Diamonds Technical due diligence and valuation report on DancarlDiamonds for the sales bid to De Beers
2004 Rosy Blue NV Diamonds Field exploration and prospectivity report on property
2004 SouthernEra Resources Diamonds Independent valuation of 22 explorationPlatinum properties and mining operations located in five African
countries
2004 Sudor Coal (Pty) Ltd Coal Competent Persons Report and Valuation to be used inthe raising of finance for a new coal project in Bethal,South Africa
2004 Tangent Coal (Pty) Ltd Coal Technical and Valuation Report for a new project in theFree State, South Africa
2003 Transvaal Ferrochrome Ferrochrome CPR and Listing Document for ASX
2003 Anglo American Corporation Platinum Valuation of Zimbabwe platinum deposit
2003 Aquarius Platinum Platinum Due Diligence on Everest South Project
2003 Mineral rights owner Coal Evaluation of mineral rights potential
2003 Metallon Gold Valuation and due diligence on gold mine
2003 Hernic Ferrochrome Chromite Capital Gains Tax Valuation on Hernic
2003 Hernic Ferrochrome Chromite Capital Gains Tax Valuation on Ilitha Project
2002 Mining company Platinum Independent technical and financial competent personsreport and valuation on a platinum dump retreatmentproject
2002 Anglo Platinum Platinum Independent valuation report on selected platinumgroup metal properties located in the Pilanesberg area
2002 Mineral rights owner Coal Information memorandum on the Holfontein CoalProject
2002 Consolidated African Mines Diamonds Independent due diligence, valuation report and fairand reasonable opinion for the shareholders anddirectors of CAM on the proposed acquisition of a 40%interest in Letseng Investment Holdings from LetsengDiamonds Ltd
2002 Freddev Gold Valuation of Freddev’s mineral rights
2002 Barnex Gold Valuation of Barnex’s mineral rights
2002 Western Areas Gold Independent valuation report on JCI Gold’s interest inthe royalties and mineral rights pertaining to theWestern Areas No. 4 project area

152
YEAR CLIENT COMMODITY PROJECT DESCRIPTION
2001 Implats Platinum Valuation
2001 Mitsubishi Corporation Ferrochrome Due Diligence, Valuation and Acquisition Report
2001 Barplats Platinum Independent Valuation
2001 Eskom Various Research into Future Market Trends for SelectedCommodities
2001 Severin Group Platinum Independent Valuation
2001 DeBeers Diamonds Costing Research and Database Compilation
2000 BW Mining Coal Exploration drilling and reserve calculation
2000 Century Carbon Coal Exploration drilling and reserve calculation
2000 Eskom Various Database compilation
2000 African Minerals Varied Independent competent person’s report
2000 Durban Deep Gold Independent valuation report
2000 Iscor Limited Varied Independent valuation of exploration assets
1998 Barnex Ltd Wits Gold Due diligence
1998 Camco Diamonds Independent Competent Person’s Report and valuation
1998 Crown Mines and DRD Wits Gold Valuation
1998 Egyptian Government Phosphate Due diligence and valuation
1998 JCI Ltd Wits Gold Competent Person’s Report
1998 Randgold & Exploration Co Ltd Gold Competent Person’s Report
1998 Western Areas Wits Gold Competent Person’s Report
1997 Durban Roodepoort Deep Ltd Wits Gold Competent Person’s Report
1997 JCI Ltd Wits Gold Competent Person’s Report
1997 Penumbra Coal Due diligence
1996 Benoni Gold Holdings Ltd Wits Gold Competent Person’s Report
1996 Durban Roodepoort Deep Ltd Wits Gold Competent Person’s Report
1996 JCI Ltd Wits Gold Valuation
1996 Rand Leases Properties Ltd Wits Gold Competent Person’s Report and valuation
1996 Randgold & Exploration Co Ltd Wits Gold Due diligence
1995 Randgold & Exploration Co Ltd Wits Gold Competent Person’s Report and valuation
1995 Randgold Durban Deep Wits Gold Competent Person’s Report and valuation
1995 Randgold Harmony Wits Gold Competent Person’s Report and valuationUnisel Merger
1994 CRA (Australia) Iron Ore Due diligence
1994 Durban Roodepoort Deep Ltd Wits Gold Competent Person’s Report and valuation
1994 Ghana Gold Mines Greenstone Gold Due diligence and valuation
1994 Gold Fields of SA Ltd Wits Gold Competent Person’s Report and valuation
1994 Hernic Chrome Ferro-Chrome Valuation and Strategic Analysis
1994 Mitsubishi Ferrochrome Due diligence and valuation
1994 Namco Diamonds Competent Person’s Report and valuation
1994 Randgold & Exploration Co Ltd Wits Gold Due diligence
1993 Atomic Energy Commission Uranium Strategic Analysis
1993 Eskom Base metals Strategic Analysis
1992 Barbrook Gold Mines Greenstone Gold Ore resource modeling and mine valuation
1992 Rand Merchant Bank Copper Ore resource modeling and project valuation

153
Key Qualifications:
Mrs Telfer has had extensive experience in the valuation and technical due diligence of mining andmineral projects in South Africa, and in Africa as far north as Egypt. She has written and compiled alarge number of Competent Persons Reports for both local and international stock exchanges. She hasrepresented the Geological Society of South Africa’s disciplinary committee with respect to theimplementation of the SAMREC Code and the JSE Listing Rules. Mrs Telfer’s particular areas ofexpertise are in the coal and diamond industries where she has been involved in projects ranging fromexploration management through to the development and valuation of projects and mining operations.A detailed list of the project she has completed and their respective dates are tabled above.
Education:DEGREE/DIPLOMA FIELD INSTITUTION YEAR
B.Sc Geology University of the Witwatersrand 1991
B.Sc (Hons) Geology University of the Witwatersrand 1992
Dip.Bus.Man Diploma in Business Management Damelin College 1996
Employment Record:POSITION COMPANY JOB DESCRIPTION DURATION
Consultant Venmyn Rand (Pty) Ltd Part of the consulting team with the majority of 2000 – and Director assignments being Competent Persons’ Reports, Present(July 2001 – Due Diligences and valuations. Also undertakingJuly 2002) capital gains tax, mineral rights, projects and mine (July 2003 – valuations and geological exploration work Present) in the coal mining industry. Projects worked
on include:• Valuation of various platinum mineral
rights and projects;• Valuation of coal exploration assets;• Valuations on chromite and ferrochrome projects;• Market study on ferrochrome;• Independent Competent Persons Report
for Transvaal Ferrochrome Ltd;• Independent Competent Persons Report on Letseng
Diamond Mine for CAM;• Independent Competent Persons Report
for African Minerals Ltd;• Compilation of international mining cost database for
various types of mining methods for large South African mining company;
• Management of a number of coal exploration drilling programmes. Calculation of reserve tonnages and grade variations within coalfields;
• Research and compilation of small mining operations database to identify target market for a mobile transformer;
• Assessment of compliance of CPR’s for the Disciplinary Committee of the GSSA; and
• Co-presentation of valuation sectionof Venmyn’s Course on International Reporting Rules and Valuation Standards in the Minerals Industry.
Consultant Sole proprietor in own • Techno-economic evaluation of the Ferreira Opencast 1998 – 2000(Non- consulting business Coal Reserve, Ermelo, for Wholetrade 1 (Pty) Ltd;Executive • Advising on, managing and undertaking Director to geological work on various coal Venmyn exploration drilling programmes;Rand (Pty) • Modelling of coal reserves and resources April 1999)Ltd and coal quality variations;
• Development of mining plans; • Ore reserve auditing for DRD, Blyvooruitzicht,
Buffelsfontein, West Wits and Crown gold mining; • Digitising of assay plans for DRD;• Competent Persons Report on the non-gold assets of
JCI Gold and Consolidated African Mines for the JSE; and
• Mineral rights investigations.

154
POSITION COMPANY JOB DESCRIPTION DURATION
Director and Venmyn Rand (Pty) Ltd Techno-economic evaluations of mining and minerals 1997 – 1998Consultant project for the company and Technical Advisers Reports
for JSE listings. Specific projects included:• Merger between Western Areas Gold Mine (North
Section) and Randfontein Estates Gold Mine;• Disposal of Lindum Reefs Gold Mine to Randfontein
Estates Gold Mine; and• Technical Advisers Report and Valuation of the
Abu Tartur Phosphate Mining and Chemical Complex, Egypt.
Minerals Resources Division Techno-economic evaluations of mining and minerals 1996 – 1997Management project for the company and Technical Advisers ReportsConsultant for JSE listings. Also involved in the research, valuationRand and management of the technical aspects of RMB Merchant Resources’ mining investment project. Specific projectsBank included:
• Techno-economic valuation of various coal projects andmanagement of exploratory drilling programmes;
• Independent opinion on the input parameters and cashflow model for the agreement between Knights Gold Mining Company and Witwatersrand Gold Mining Company;
• Independent Competent Persons Report on the proposed disposal by Benoni Gold Holdings of Benoni Gold Mining Company to East Rand Proprietary Mine;
• Mineral rights investigations in South Africa and in Africa;
• Research and evaluation of various African exploration projects;
• Independent Valuation of the merger between DRD, Blyvooruitzicht, Buffelsfontein Gold Mines and South Wits Project;
• Independent Valuation of the merger between Harmony and Unisel Gold Mines; and
• Technical Advisers Report on the Randgold Resources listing.
Mineral Venmyn Rand (Pty) Ltd Involved in 90% of Venmyn Rand’s consulting projects 1992 – 1996Project over the last five years. Gained skills in data collation,Analyst data analysis, geostatistics, ore reserve modelling, ore
reserve calculation, mineral rights searches, graphical presentation of technical data, mine valuations and techno-economic cashflow modelling over a wide range of minerals and deposit types for clients ranging from miners to investors.
Languages:
English: ExcellentAfrikaans: Good
Certification:
I, the undersigned, certify that to the best of my knowledge and belief, these data correctly describe me,my qualifications, and my experience.
_________________________________________________________________________ Date: 30th June 2006
Full name of staff member: Catherine Anne Telfer
Full name of authorized representative: N/A

155
Proposed Position: Independent Techno-economic advisor
Name of Firm: Venmyn Rand (Pty) Ltd
Name of Staff: Graham David Stacey
Address: 1st FloorBlock G173 Rivonia RoadSandton2146
Profession: Mining Engineer
Date of Birth: 13 June 1973
Years with Firm/Entity: 2
Nationality: South African
Membership in Professional Societies:
CLASS PROFESSIONAL SOCIETY YEAR OF REGISTRATION
Member Australasian Institute of Mining and Metallurgy 2004
Member South African Institute of Mining and Metallurgy 1992
Member South African Colliery Managers Association 1998
Detailed Tasks Assigned:
YEAR CLIENT COMMODITY PROJECT DESCRIPTION
2005 Samadi/Diamond Core Diamonds Competent Persons Report and techno-economicResources valuation
2004–5 Gallery Gold Platinum Independent Due Diligence and valuation report on themineral assets of Platmin Limited
2004–5 Macphail/Umcebo Mining Coal Independent techno economic due diligence and valuation report on coal resources and processing assets
2004 Kumba Coal Coal Capital Gains Tax Valuation on Mineral Assets
2004 Bayer Chemicals Chromite Capital Gains Tax Valuation on Rustenburg chromemine
2004 Dwyka Diamonds Diamonds Independent valuation and technical due diligence onDancarl Mine
2004 Dwyka Diamonds Diamonds Independent Prospectivity Report and Desktop Reviewof the Newland Diamond Mine
2004 Dwyka Diamonds Diamonds Independent Prospectivity Report and Desktop Reviewof the New Elands Diamond Mine
2004 Dwyka Diamonds Diamonds Independent Prospectivity Report and Desktop Reviewof the Westend Diamond Mine
2004 Dwyka Diamonds Diamonds Independent Prospectivity Report and Desktop Reviewof the Rovic Diamond Mine
2004 Dwyka Diamonds Diamonds Independent Prospectivity Report and Desktop Reviewof the Blaauwbosch Diamond Mine
2004 Dwyka Diamonds Diamonds Independent Due Diligence and valuation report on theDancarl Diamond Mine
2004 Kumba Resources Coal, Heavy Minerals, Capital Gains Tax CertificatesIndustrial Minerals, Iron
2004 Mettle Limited Coal Independent valuation and technical due diligence onWelgedacht Colliery
2004 Zimbabwe Platinum Limited Platinum Independent techno-economic valuation of companyassets with regard to finalising an acquisition andproduction expansion
2004 Mintek Resource technology Evaluation of delivery of regional technical projects
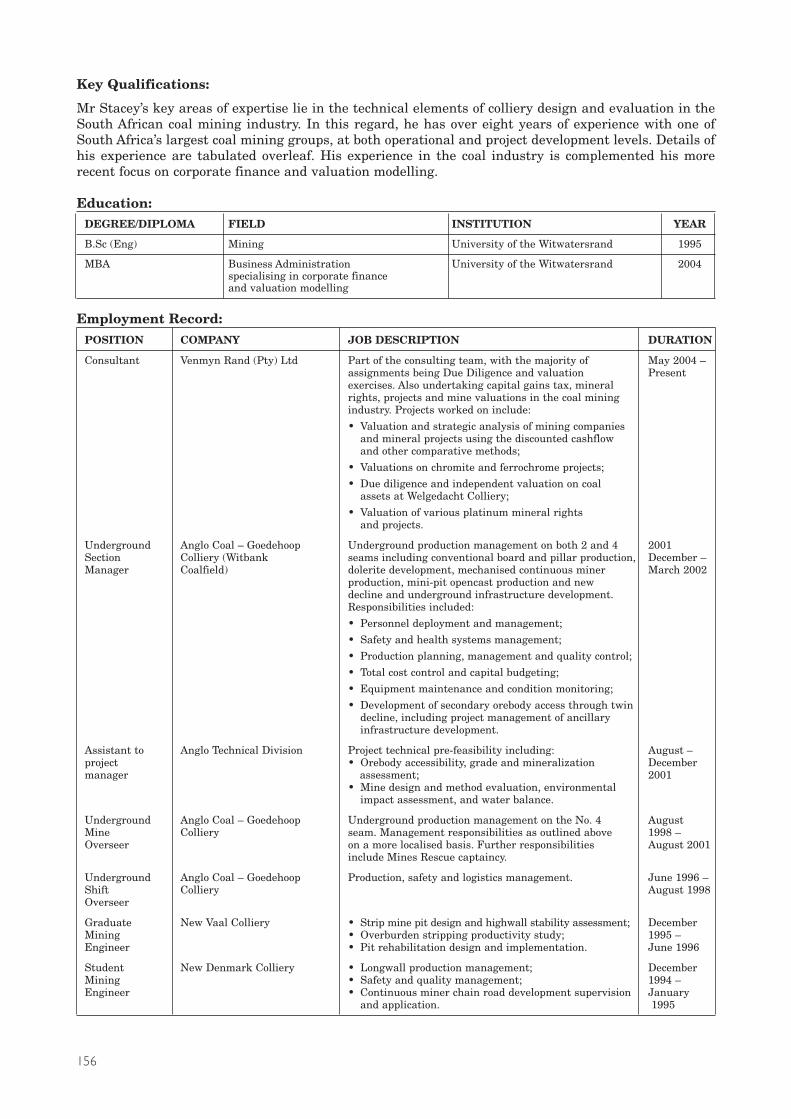
156
Key Qualifications:
Mr Stacey’s key areas of expertise lie in the technical elements of colliery design and evaluation in theSouth African coal mining industry. In this regard, he has over eight years of experience with one ofSouth Africa’s largest coal mining groups, at both operational and project development levels. Details ofhis experience are tabulated overleaf. His experience in the coal industry is complemented his morerecent focus on corporate finance and valuation modelling.
Education:DEGREE/DIPLOMA FIELD INSTITUTION YEAR
B.Sc (Eng) Mining University of the Witwatersrand 1995
MBA Business Administration University of the Witwatersrand 2004specialising in corporate finance and valuation modelling
Employment Record:POSITION COMPANY JOB DESCRIPTION DURATION
Consultant Venmyn Rand (Pty) Ltd Part of the consulting team, with the majority of May 2004 –assignments being Due Diligence and valuation Presentexercises. Also undertaking capital gains tax, mineral rights, projects and mine valuations in the coal mining industry. Projects worked on include:
• Valuation and strategic analysis of mining companies and mineral projects using the discounted cashflow and other comparative methods;
• Valuations on chromite and ferrochrome projects;
• Due diligence and independent valuation on coal assets at Welgedacht Colliery;
• Valuation of various platinum mineral rights and projects.
Underground Anglo Coal – Goedehoop Underground production management on both 2 and 4 2001Section Colliery (Witbank seams including conventional board and pillar production, December –Manager Coalfield) dolerite development, mechanised continuous miner March 2002
production, mini-pit opencast production and new decline and underground infrastructure development. Responsibilities included:
• Personnel deployment and management;
• Safety and health systems management;
• Production planning, management and quality control;
• Total cost control and capital budgeting;
• Equipment maintenance and condition monitoring;
• Development of secondary orebody access through twin decline, including project management of ancillary infrastructure development.
Assistant to Anglo Technical Division Project technical pre-feasibility including: August –project • Orebody accessibility, grade and mineralization Decembermanager assessment; 2001
• Mine design and method evaluation, environmental impact assessment, and water balance.
Underground Anglo Coal – Goedehoop Underground production management on the No. 4 August Mine Colliery seam. Management responsibilities as outlined above 1998 –Overseer on a more localised basis. Further responsibilities August 2001
include Mines Rescue captaincy.
Underground Anglo Coal – Goedehoop Production, safety and logistics management. June 1996 – Shift Colliery August 1998Overseer
Graduate New Vaal Colliery • Strip mine pit design and highwall stability assessment; DecemberMining • Overburden stripping productivity study; 1995 –Engineer • Pit rehabilitation design and implementation. June 1996
Student New Denmark Colliery • Longwall production management; DecemberMining • Safety and quality management; 1994 –Engineer • Continuous miner chain road development supervision January
and application. 1995

157
Languages:
English: ExcellentAfrikaans: Excellent
Certification:
I, the undersigned, certify that to the best of my knowledge and belief, these data correctly describe me,my qualifications, and my experience.
_________________________________________________________________________ Date: 30th June 2006
Full name of staff member: Graham David StaceyFull name of authorized representative: N/A

158
Name of Staff: Mei EklundPosition: Techno-economic advisorName of Firm: Venmyn Rand (Pty) LtdAddress: 1st Floor
Block G173 Rivonia RoadSandton, 2146
Profession: Process Engineer & Business Development AnalystDate of Birth: 13 August 1965Years with Firm/Entity: Starting from 18th July 2005Nationality: South African
Membership in Professional Societies: CLASS PROFESSIONAL SOCIETY YEAR OF REGISTRATION
Associate Member South Africa Institute of Mining and Metallurgy 1989
Engineer in Training Engineering Council of South Africa 1989
Key Tasks Assigned for the Past Five Years:
YEAR CLIENT COMMODITY PROJECT DESCRIPTIONWithin Sasol
2005 Sasol Technology, Coal, Liquid Fuels and Business track leader in identifying, New Business Electrical power evaluating and developing new coal to Development liquid opportunities in RSA
2005 Sasol Coal, Liquid Fuels and Independent identification and evaluationSynfuels Electrical power of coal to liquids opportunities in International Australia and recommending way forward
2004/5 Sasol Synfuels Coal, Liquid Fuels and Independent investigation in identifyingInternational Electrical Power and evaluating global business opportunities for Sasol’s
proprietary coal to liquid technology and mapping outway forward
2004/5 Sasol Synfuels Coal, Liquid Fuels and • Evaluating USA coal to liquid opportunities identifiedInternational Electrical Power and recommending way forward
• Ideal partner profiling and identification
• Business development and strategy formulation
2004 Sasol Technology, Natural Gas, Independent evaluation of feedstockNew Business synthesis supply alternatives for a parastatalDevelopment gas and coal energy company in RSA
2004 Sasol Technology, Natural Gas, Coal Advising the business unit concernedTechnology against investing in synthetic natural gasManagement: Gasification opportunities in USA
2003 On maternal Leave
2002 Sasol Solvents Glycol Ether and Independent competitive, price forecast, risk and derivatives techno-economic analysis for the new capital project
2002 Sasol Solvents Petrochemicals Independent valuation of two target US petrochemicalcompanies for merger and acquisition purposes
2002 Sasol Solvents Acetates Independent evaluation of Sasol Solvents’ globalcompetitive position in acetates products
2001 Sasol Ammonia Nitrogenous products Formulating Sasol’s nitrogenous products strategy inSouthern Africa
2001 Sasol Ammonia Nitrogenous products Evaluating four potential business opportunities inproducing ammonia and urea – Nigeria, Mozambiqueand two RSA sites
2000 Sasol Technology, Liquid fuels, natural Beira Petrochemical ComplexNew Business gas, nitrogenous • Independent competitive, risk, price Development products and methanol forecast, techno-economic and cash flow analyses
• Business Development

159
Career Summary and Key Qualifications:
Mei Eklund commenced her employment at Venmyn on 18th July 2005 as an advisor. (She subsequentlyleft the company in March 2006.)
She was trained as a mineral process engineer and holds BSc (Eng) and MSc (Eng) degrees in extractivemetallurgy from the University of the Witwatersrand. She worked as a process engineer for three yearsafter completing her MSc and spent two years as a process engineer for Sasol’s Twistdraai Coal ExportProject. She is also the patent owner of a technology that she developed from her MSc research work indewatering of fine and ultra fine coal. As a process engineer, she has exposures in coal, copper, gold andPGM metals.
After two years with the Twistdraai Project, she joined Sasol Coal Mining Marketing division as Headof Market Intelligence. Her main contributions were to analyse markets for the new coal export business,provided recommendations and acted as technical interface with clients in order to establish SasolMining as a new reliable supplier.
In Nov 1998 she was promoted and transferred to Sasol Technology New Business Development as aninvestment and business development analyst. Her roles were project-specific and she functioned eitheras an independent internal advisor or part of a project team. Her main areas of contributions were innew business opportunities identification and valuation, business strategy formulation and newbusiness development. Her internal client base covers the sectors of energy, petrochemical and coalmining.
Education:DEGREE/DIPLOMA FIELD INSTITUTION YEAR
B.Sc (Eng) Extractive Metallurgy University of the Witwatersrand 1989
M.Sc (Eng) Extractive Metallurgy University of the Witwatersrand 1996
Certificate in Management of Petroleum Policy University of the Witwatersrand 1999and Economic Programme
Employment Record:POSITION COMPANY JOB DESCRIPTION DURATION
Advisor Venmyn Rand (Pty) Ltd Part of the consulting team with 18 Julythe majority of assignments being 2005 –PresentCompetent Persons Reports, Due Diligences and valuations. First assignment:• Letseng Diamonds CPR:
Process section
Grade 1 Sasol Technology, New Provide independent, timeous analyses July, 2005 –Senior Business Development, to enable Sasol to: Nov, 1998Business Rosebank • Identify and evaluate new business/investmentDevelopment opportunities for company growthAnalyst • Formulate business strategies(July 2005 List of typical, non-exhaustive examples of to Feb 2002) contributions and competencies:Maternity Energy Sector Examples:Leave • USA coal to liquids Project – new venture (Oct 2003 to opportunity identification and evaluation,March 2004) business development strategy formulationSenior • USA Synthesis Natural Gas Project:Business Investment evaluation and recommendationsDevelopment • Beira Petrochemical Complex Project Analyst (Mozambique): Bankable business case (Jan 2002 to formulation and new business development Nov 1998) • Competencies Applied:and – Business landscape analysispromotion. – “Success driver” identification and interpretation
– Techno-economic analysis, project economic evaluation and cash flow analysis
– Industry analysis: coal, electricity, refining, nitrogenous and natural gas
– Market evaluation– Competitiveness analysis ito cost

160
POSITION COMPANY JOB DESCRIPTION DURATION
– Ideal partner profiling, identifications and engagement strategy formulation
– Stakeholder matrix analysis– Commodity price: analysis, forecast, risk
identification, evaluation and mitigation– Business case formulation
Petrochemical Sector Examples:• New Sasolburg Propylene Oxide and derivatives
project: techno-economic analysis, industry and competitive analysis, global price forecast and associated price risk identification and mitigation
• Global acetates (ethyl, propyl and butyl): Industry and competitive analysis as part of input toinvestment decision
Company Valuation for M&A Purposes Example:
• Two large USA petrochemical companies identified by Sasol senior Management
• Competencies applied:– Company research to identify and verify assets
and business models– Technological processing routes and plant flow sheet
identification and verifications on major production sites
– Mapping out economic and cash flow models from technical flow sheets and inter-plant connections, site by site
– Techno-economic analysis– Discounted cash flow analysis– Revenue, operating cost and profit forecast– Interpretation of result from the business context
• Multi-tasked as business development analyst and business developer
• US coal to liquid opportunities: acted as one point contact with external parties
• Beira Petrochemical Complex Project:Project promotion to internal and external stakeholders
Head: Market Sasol Mining, • Identifying business intelligence needs and Oct 1998 –Intelligence Marketing, Rosebank derive a system for the purpose April 1996
• Optimising marketing strategy for this new venture by providing business intelligence and technical expertise
• Technical promotion and liasing with clients, establishing confidence in Sasol Mining as a reliable new supplier
• Representing Sasol Mining at Richards Bay Shareholders Technical Sub-Committee.
Metallurgical Sasol Mining, Secunda • As project process engineer in a team that successfully March 1996Engineer implemented the capital project. This venture was the – April, 1994
first in Sasol Mining to earn major dollar revenues.
Management Johnson Matthey, • Achieving best production record for Dec 1993Trainee Germiston Rhodium dissolution (92%) at the time for the to Sep 1992
autocatalyst salt section
• Completing first operating manual for the autocatalyst salt plant
MSc (Eng) University of the Dissertation: Dewatering of Fine and Ultra Fine Coalresearch Witwatersrand by Using/Modifying the Conventional Processingstudent Equipment
• Successfully proving the concept from laboratory to pilot plant scale
• Design of pilot plant and project management of Aug 1992the construction to Jan 1990
• Owner of the resultant patent
• Providing an economically viable alternative to utilise coal discard
Assistant Messina Limited, Applied research to solve operational problems Dec 1989 to research Mining Division, • Botswana Copper Limited slag project Jan 1989metallurgist Maraisburg

161
Languages:
English, Taiwanese and Mandarin (speak, read and write).
Certification:
I, the undersigned, certify that to the best of my knowledge and belief, these data correctly describe me,my qualifications, and my experience.
______________________________________________________________________ Date: 22nd August, 2005
Full name of staff member: Mei Chen EklundFull name of authorized representative: N/A

162
Name: Anthony G Bloomer
Current Status Independent Consultant and Contractor
Name of Firm: AGB Geocon
Address: 22 Clemmow DriveFlorida Park1709
Profession: Geologist
Date of Birth: 23 August 1941
Nationality: South African
Membership in Professional Societies: CLASS PROFESSIONAL SOCIETY YEAR OF REGISTRATION
Member Geological Society of South Africa 1972
Member South African Geophysical Association 1977
Member Society of Exploration Geochemists 1979 – 1996
Member The South Africa Council for Natural Reg. No. 400068/02 Scientific Professions 2002
Record of Experience as an Independent Consultant:YEAR CLIENT COMMODITY PROJECT DESCRIPTION
2006 Pangea DiamondFields plc Diamonds Aim Listing document for 9 projects in 4 Africancountries.
2006 Trans Hex Group Diamonds Competent Persons Report on the Middle OrangeOperations.
2005 Letseng Diamonds Diamonds Competent Persons Report on Letseng Diamonds.
2005 Venmyn (Samadi) Diamonds Evaluation of kimberlite and alluvial diamondproperties in the Northern and North West provinces.
2004 Venmyn (NDC) Diamonds Re-evaluation of the Schmidtsdrift alluvial diamondproject.
2004 Venmyn (Rosy Blue NL) Diamonds Prospecting, mapping and evaluation of theSlangheuwel alluvial and kimberlite diamond property.
2004 Venmyn (Dwyka) Diamonds Evaluation of the Dancarl, Blaauwbosch, Newlands, NewElands, Roberts Victor and West End diamond mines.
2004 Venmyn Diamonds Mapping and prospectivity evaluation of an alluvialdiamond/kimberlite property in the Northern Cape.
2004 Venmyn (Letseng Diamonds) Diamonds Planning a resource drilling programme on the LetsengSatellite kimberlite.
2004 Platfields Limited Platinum Mapping and evaluation an exploration property on theeastern Bushveld Complex.
2003 Letseng Diamonds Diamonds Examination, sampling and evaluation of the alluvialdiamond deposits associated with the Letsengkimberlites, Lesotho.
2003 Venmyn Vermiculite Preliminary evaluation of the Zondwa vermiculitemining property.
2003 Venmyn Fluorspar Preliminary evaluation of the Witkop fluorspar miningproperty.
2003 Venmyn (DRD) Gold Evaluation of the Stilfontein Mine.
2003 Venmyn (Diamond Works) Diamonds Update and expansion of the evaluation of the SierraLeone Properties.
2003 Venmyn (Sallies) Gold Evaluation and verification of data of the SalliesProject.
2003 Venmyn (Kensington Resources) Diamonds Independent audit of De Beers GEMDL facility.
2002 Venmyn (African Diamonds) Diamonds Collation of data for certain marine diamondconcessions off the coast of Namibia.

163
YEAR CLIENT COMMODITY PROJECT DESCRIPTION
2002 Venmyn (AIG) Diamonds Evaluation and verification of data for alluvial andkimberlite diamond projects in the Northern Cape.
2002 Venmyn (Diamond Works) Diamonds Project evaluation and verification of kimberlites inSierra Leone.
2002 Venmyn (Consolidated Diamonds Data compilation, interpretation and evaluationAfrican Mines) of the Letseng Kimberlite pipes, Lesotho.
2001/2 Alcaston Mining Diamonds Kimberlite diamond project evaluation in the FreeState and Northwest Provinces of South Africa.
2001 Aquarius Platinum Platinum Drilling supervision and logging of the Marikana project.
2001 Craton Resources (OTR) Platinum Mapping, diamond drilling supervision and logging ofthe Palmietfontein project.
1998/ West Rand Consolidated Gold, Platinum Detailed mapping, drilling supervision and logging 2001 Exploration in the Kraaipan and Stella Greenstone belts of the
Northwest Province.
1998 Private Investor Diamonds Detailed evaluation of alluvial diamond projects in the(then) Western Transvaal.
1997 Venmyn Rand Andalusite Due diligence study on andalusite mines in the (then)Northern Transvaal.
1997 CAMCO Diamonds/Gold Data collection and evaluation of the alluvial diamondpotential of the Central African Republic. Selection oflease areas. Detailed evaluation of the selected leases.Data collection and evaluation of gold production andpotential in the CAR.
1996 Semafo (Ghana) Gold Grass roots exploration and detailed project evaluation,including mapping, sampling and drilling, forgreenstone gold in southwestern Ghana.

164
Key Qualifications:
Mr Bloomer has had extensive experience in the design, implementation and evaluation of mineralexploration and exploitation projects throughout Africa and elsewhere. He has contributed to thecompilation of many Competent Persons Reports, particularly with respect to diamond projects.
Education:DEGREE/DIPLOMA FIELD INSTITUTION YEAR
B. Sc(Hons) Geology University of Leeds 1963
Employment Record:POSITION COMPANY JOB DESCRIPTION DURATION
Geological Sole Proprietor of • Geological consulting and contracting 1996 – 2004Consultant Own Businessand Contractor
Senior Rio Tinto South • Geologist/Surveyor to the Letseng la Terai kimberlite 1971 – 1996Geologist Africa Exploration pipe evaluation programme, Lesotho.
• Prospect evaluation on vermiculite in Kenya.• Exploration Geologist on programmes on the Bushveld
Layered Suite.• Base metal exploration in the Richtersveld,
Bushmanland, Namibia and throughout South Africa.• Exploration and drilling programmes on uranium in
the Damara Belt.• Exploration and drilling programmes in the Karoo
Sequence of the Free State.• Extensive work on gold exploration, particularly in
granitic and metamorphic terrains.• Evaluation programme of offshore diamond projects
off the Namaqualand coast.• Exploration, project development and field
investigations for the Mafikeng Diamonds mining operation.
• Evaluation of numerous alluvial and kimberlite diamond properties offered for joint ventures throughout South Africa.
• Provision of technical and consulting services to RTZ diamond exploration programmes on an international scale, including planning and interpretation services for Namibia, Zimbabwe and Botswana.
• Technical assistance to diamond projects in Australia, Brazil, Venezuela.
• Prospect evaluation on diamonds and Sedex deposits in Zambia.
• Mapping and evaluation of tin projects in South Africa, including alluvial potential.
• Exploration project evaluation for diamonds in Zaire and Tanzania.
• Exploration target generation for gold, base metals and diamonds, with particular emphasis on the Limpopo Mobile Belt.
• Development of a diamond exploration database, with the emphasis on mineral geochemistry, as an aid to exploration.
• Development of interpretation techniques applicable to geochemical data as an aid to project evaluation.
• Compilation of an in-house diamond exploration and evaluation manual, considering concepts, target areas, methodology, sampling, evaluation, etc.
• Establishment, supervision and staff training for grass roots exploration in the Limpopo Belt of Zimbabwe, which led to the discovery of diamondiferous kimberlites.
• Establishment, supervision and staff training for grass roots exploration in Namibian Bushmanland.

165
POSITION COMPANY JOB DESCRIPTION DURATION
Senior African Selection • Kimberlite and diamond exploration in the Southern 1969 – 1971Geologist Trust Exploration Kalahari environment.
• Evaluation of alluvial diamond projects on the lower Orange River.
• Appointed to manage diamond exploration programme in Lesotho.
Senior Johannesburg • Section Geologist at Western Areas Gold Mining 1965 – 1969 Geologist Consolidated Investment Company. Development and stope mapping, drilling
Company control, grade control.• Subsequently acting head of department at Elsburg
Gold Mining Company.
Technician Radio Corporation • Contract to the United States Air Force, on computer 1964 – 1965of America maintenance and program checking.
Demonstrator University of Leeds • Field and Laboratory demonstrator for postgraduate 1963 – 1964Dept. of Mining, diploma courses. Technical assistance to PhD students.Geophysics Section
Languages:
English: ExcellentAfrikaans: Good spoken, otherwise fairFrench: Fair
Certification:
I, the undersigned, certify that to the best of my knowledge and belief, these data correctly describe me,my qualifications, and my experience.
Anthony Gerard Bloomer Date: 30th June, 2006

166
Appendix 2: Written Communication from the Ministry of Natural Resources

167

168
Appendix 3: Stone Sizes (in Carats) in Relation to Grain and Sieve Sizes
GRAIN SIZE RANGES
GRAIN SIZE FROM – CTS TO – CTS
+10.8 10.8
10c 9.8 10.79
9c 8.8 9.79
8c 7.8 8.79
7c 6.8 7.79
6c 5.8 6.79
5c 4.8 5.79
4c 3.8 4.79
3c 2.8 3.79
10grn 2.5 2.79
8grn 1.8 2.49
6grn 1.4 1.79
5grn 1.2 1.39
4grn 0.9 1.19
3grn 0.66 0.89
SIEVE SIZES
APPROX.SIEVE CRITICAL SIZE APPROX. AVE.
(CTS) (CTS/STONE)
23 9.2
21 3.9 5.0
19 1.9 2.7
17 1.5 1.7
15 1.2 1.3
13 0.7 0.9
12 0.5 0.6
11 0.32 0.4
9 0.17 0.23
7 0.12 0.14
6 0.08 0.10
5 0.05 0.07
3 0.03 0.04
2 0.02 0.02
1 0.01 0.01

169
Appendix 4: Plant Modifications
EQUIPMENT SHORTCOMING REMEDIAL ACTION
Front-End of Plant Design did not allow for a typical Initially mobile crushing units were deployed to pre-crush the opencast kimberlite ore envelope. ore prior to feeding it into the Front-End. In June 2005 aThe installed jaw crusher could permanent pre-crushing facility was commissioned that hasnot process the ROM material. the capability to pre-crush ore at a rate of 800tph.
Dust Suppression No dust suppression in Front-end Work has commenced for installations at both areas.area or at secondary or tertiarycrushers.
Scrubber (a) Feed chute continually (a) New chute was designed and installed.blocked and did not adequatelycater for belt scrapers.
(b) Discharge chute design resulted (b) New chute was designed and installed. Reduction in is high impact areas which diamond damage.potentially damaged diamonds.
Scrubber Discharge opening blocked and Discharge redesigned and installed.limited throughput.
Screen Discharge High wear areas and design Webber chutes have been installed in all high wear andChutes resulted in repetitive blockages. high breakage areas.
DMS Transfer High wear area and continual Chute redesigned.Chute blockages.
Secondary Crusher Numerous hydraulic pump failures. Entire hydraulic power pack replaced.
Secondary Crusher Insufficient throughput. Initial liner profile was 21 degrees – 190tph. Second linercut to 19 degrees – 240tph.Third liner was cut to 16.88 degrees – 290 tph.
Secondary Crusher Insufficient throughput. Speed reduced.
Tertiary Crusher Insufficient throughput. Crusher being cut to 17 degrees – delivery and installationend July 2005.
Tertiary Crusher Insufficient throughput. Speed reduced.
DMS Cyclone feed Diamond damage and blockages in Pumps replaced with Warman gravel pumps.pumps (Coarse and impellar.Fines) 10/8 Warman.
Sizing screen in Resonance caused by vibratory Motors with a different speed rating eliminated the problem.Recovery screen motors. Potential damage
to structure.
Conveyors Belt scrapers fitted during New and additional scrapers were fitted.construction were ineffective.
Weightometer/ The selection of belt scale for the Fitted a suitable belt scale.Belt scales main feed belt was incorrect
resulting in inaccurate recordings.
Weightometer/ Belt scale fitted on the DMS Fitted 3 scales after the DMS circuits to provide usableBelt scales feed belt was inaccurate and the information/data.
information provided was worthless.
Gland Service Pumps Mono-pumps were installed which Installed high-pressure centrifugal pumps. No further failures.continuously failed and resultedin numerous pump gland failures.
Instrumentation The heaters installed in the I/O Installed larger heaters and programmed warning signalPanels panels were underrated for the into SCADA system.
enclosure size, resulting in entire plant trips.
Flocculant Plant The installed flocculant plant is New flocculant and coagulant plant was installed inunderrated for the application. September 2005.
Tailings Dump The coarse tailings dump was Tailings conveyors were moved and an additional conveyorpositioned to far from the slimes installed to ensure correct positioning for the final starterdam wall resulting in a massive wall.void between the dump and thewall. The dump is to act as a starter wall for the final slimes dam.

170
EQUIPMENT SHORTCOMING REMEDIAL ACTION
Tailings Spreader The 10m longer spreader originally A flinger system was installed, operating successfully.Conveyor supplied, was impractical to utilize
and dump advancing was extremelydifficult and time consuming.
Electrical Supply The plant was fed with a single A cable fault resulted in 3 days lost production. An additionalto Plant 11kV cable. cable has been installed.
Pontoon walkways The walkway was poorly designed Modified walkways have been constructed and installed (De Beers dam) and could not stand up to the and are operating effectively.
force of the waves on the dam.
Flowsort Machine The extra-coarse Flowsort machine Machine was modified by adding addition spray bars and isblocked continuously resulting operating effectively.in diamond loss.
Driers Driers installed in the recovery An upgrade of the driers is in progress.plant are correctly sized andresult in wet concentrate reporting to the sort house.
Sort house The glove box design was New glove boxes are being manufactured.ergonomically poor.
DMS Feed Tertiary crusher capacity is a Panel size changed from 19mm*58mm slotted toPreparation Screen bottleneck. 22mm*58mm slotted in November 2004.
Panel size changed to 27.5mm*33mm slotted in September2005.

171
Appendix 5: Glossary and Abbreviations
Alluvial Diamond deposits which are located in sediments transported by river or marine systems.
Audit Checking mechanisms to verify the veracity of results.
Barren Kimberlite which does not contain diamonds.
Basalt A fine grained basic igneous rock which is erupted through volcanic activity.
Basic Of igneous rocks having a relatively low silica content.
Block model Technique of modelling which divides the resources into a number of mineable blocks.
Bottom cut-off Smallest screen opening which separates ore to be processed for diamonds from fines toscreen size be discarded.
Breccia A rock consisting of coarse, angular fragments.
Bulk sample Large sample which is processed through a small-scale plant, not a laboratory.
Calcite A carbonate mineral with the chemical formula, CaCO3.
Carat Unit of weight for diamonds, 0.2g = 1 carat.
Chrome-diopside One of the clinopyroxene groups of minerals, commonly found in igneous rocks. The chrome end-member of the group often found in kimberlites.
Cross section A diagram or drawing that shows features transected by a vertical plane drawn at right anglesto the longer axis of a geologic feature.
Cut-off grade The lowest grade of mineralised material considered economic to extract; used in the calculationof the ore reserves in a given deposit.
Defunct Property a Mineral Asset on which the Mineral Resources and Mineral Reserves have been exhausted andexploitation has ceased and which may or may not have residual assets and liabilities.
Densimetric Analysis Density distribution per size distribution of a sample.
Density Measure of the relative “heaviness” of objects with a constant volume, density = mass/volume.
Deposit Any sort of earth material that has accumulated through the action of wind, water, ice or otheragents.
Development Property A Mineral Property that is being prepared for mineral production and for which economicviability has been demonstrated.
Diamond drilling A drilling method, where the rock is cut with a diamond bit, to extract cores.
Diamond grade The content of diamonds, measured in carats, within a volume or mass of rock.
Diamond value The estimated average value of diamonds from the deposit, quoted in US$/carat.
Diamondiferous Containing diamonds.
Dilution Waste which is mixed with ore in the mining process.
Dip The angle that a structural surface, i.e. a bedding or fault plane, makes with the horizontalmeasured perpendicular to the strike of the structure.
Dolerite A medium grained igneous rock which is emplaced within the earth’s crust in the form of dykesand sills, and has the same mineralogy as basalt.
Dormant Property A Mineral Asset which is not currently being actively explored or exploited, where the MineralResources and Mineral Reserves have not been exhausted, and which may or may not beeconomically viable.
Dyke Intrusive igneous rock vertically or subvertically emplaced.
EP or EPM Escart Probable Moyen – a measurement of the deviation of the distribution curve from a perfectseparation, Ep=(d75-d25)/2, d25 = the density where 25% of the material is recovered.
Estimation The quantitative judgement of a variable.
Exploration Prospecting, sampling, mapping, diamond drilling and other work involved in the search formineralization.
Exploration Property A Mineral Asset which is being actively explored for Mineral deposits or petroleum fields, but forwhich economic viability has not been demonstrated.
Facies As assemblage or association of mineral, rock or fossil features reflecting the environment andthe conditions of the origin of the rock.
Fault A fracture in earth materials, along which the opposite sides have been displaced parallel to thenplane of the movement.

172
Feasibility study A definitive engineering estimate of all costs, revenues, equipment requirements and productionlevels likely to be achieved if a mine is developed. The study is used to define the economicviability of a project and to support the search for project financing.
Fresh rock Hard rock, at depth beneath the earth, which has not been subjected to the processes of weathering.
Garnet A silicate mineral. The magnesium-rich variety, pyrope, is commonly found in kimberlites.
Gondwana The southern supercontinent originating after the split of Pangea.
Grade The relative quantity or percentage of diamonds within the rock mass. Measured as carats perhundred tonnes in this report.
Gravel An unconsolidated accumulation of particles larger than sand (pebbles or cobbles).
Gravity survey A geophysical study undertaken from the surface or from the air which identifies variations inthe density of the earth from surface to depth.
Igneous Rocks resulting from the crystallization of a molten magma, either intrusive or volcanic.
In situ In its original place, most often used to refer to the location of the mineral resources.
Indicated Diamond That part of a diamond resource for which tonnage, densities, shape, physical characteristics,Resource grade and average diamond value can be estimated with a reasonable level of confidence. It is
based on exploration sampling and testing information gathered through appropriate techniquesfrom locations such as outcrops, trenches, pits, workings and drill holes. The locations are toowidely or inappropriately spaced to confirm geological and/or grade continuity but are spacedclosely enough for continuity to be assumed and sufficient diamonds have been recovered toallow a confident estimate of average diamond value.
Inferred Diamond That part of a diamond resource for which tonnage, grade and average diamond value can be Resource estimated with a low level of confidence. It is inferred from geological evidence and assumed but
not verified by geological and/or grade continuity and a sufficiently large diamond parcel is notavailable to ensure reasonable representation of the diamond assortment. It is based oninformation gathered through appropriate techniques from locations such as outcrops, trenches,pits, workings and drill holes that may be limited or of uncertain quality and reliability.
JSE JSE Limited.
Kimberlite An ultra basic rock defined as a porphyritic alkalic peridotite containing phenocrysts of olivineand phlogopite. Occurs as dykes or as characteristically carrot-shaped pipes.
Laser survey Airborne survey which accurately measures the height of the surface of the earth to produce adetailed digital topographic plan.
Lava Molten silicate material extruded by a volcano.
License, Permit, Lease Any form of license, permit, lease or other entitlement granted by the relevant Government or other similar department in accordance with its mining legislation that confers on the holder certain rightsentitlement to explore for and/or extract minerals that might be contained in the land, or ownership title that
may prove ownership of the minerals.
Life of Mine – LoM Expected duration of time that it will take to extract accessible material.
Liberation Release of diamonds from the host rock through processing.
Mafic Pertaining to iron and magnesium, equivalent to basic.
Matrix Fine grained rock which supports larger clasts or pebbles.
Micaceous Rock containing a large proportion of mica, a layer lattice group of minerals. Used to describekimberlites rich in phlogopite mica.
Mineable That portion of a resource for which extraction is technically and economically feasible.
Mineral Asset(s) Any right to explore and/or mine which has been granted (“property”), or entity holding suchproperty or the securities of such an entity, including but not limited to all corporeal andincorporeal property, mineral rights, mining titles, mining leases, intellectual property, personalproperty (including plant equipment and infrastructure), mining and exploration tenures andtitles or any other right held or acquired in connection with the finding and removing of mineralsand petroleum located in, on or near the earth’s crust. Mineral Assets can be classified asDormant Properties, Exploration Properties, Development Properties, Mining Properties orDefunct Properties.
Mineral Reserve Is the economically mineable material derived from a Measured and/or Indicated MineralResource, It is inclusive of diluting materials and allows for losses that Reserves to denoteprogressively increasing uncertainty in their recoverability. Proved Reserve can be categorisedas Developed or Undeveloped.
Mineral Resource A concentration of material of economic interest in or on Earth’s crust in such form, quality andquantity that there are reasonable and realistic prospects for eventual economic extraction. Thelocation, quantity, grade, continuity an other geological characteristics of a Mineral Resource areknown, estimated from specific geological evidence and knowledge, or interpreted from a wellconstrained and portrayed geological model. Mineral Resources are subdivided, in order ofincreasing confidence in respect of geoscientific evidence, into Inferred, Indicated and Measuredcategories.

173
Mineral Resource cont. A deposit is a concentration of material of possible economic interest in, on or near the Earth’scrust. Portions of a deposit that do not have reasonable and realistic prospects for eventualeconomic extraction must not be included in a Mineral resource.
Mineralisation The presence of a target mineral in a mass of host rock.
Mining Property A Mineral Asset which is in production.
Mylonite Hard, fine-grained, chertlike rock with banded or steaky structure, formed by the extremegranulation of rocks that have been pulverized during faulting or intense dynamicmetamorphism.
NAV Net asset value.
NPV Net present value.
Olivine A silicate mineral commonly found in igneous rocks.
Opencast/Open pit Surface mining in which the ore is extracted from a pit. The geometry of the pit may vary withthe characteristics of the ore body.
Orebody A continuous well defined mass of material of sufficient ore content to make extractioneconomically feasible.
Overburden The alluvium and rock that must be removed in order to expose an ore deposit.
Parcel A collection of diamonds of various sizes made available for sale as a single package.
Payability Economic viability of a mineral deposit.
Phenocrysts Large crystals found in a groundmass of fine grained rock.
Prefeasibility Study Referring to a study of a Mineral asset, in which appropriate assessments have been made ofrealistically estimated mining, metallurgical, economic, marketing legal, environmental, social,governmental, geological, engineering, operational and all other modifying factors are consideredin sufficient detail to demonstrate at the time of reporting that extraction is reasonably justifiedand the factors are considered in sufficient detail to serve as a reasonable basis for a decision toproceed or not to proceed to a Feasibility Study.
Primary deposit With reference to the deposition of diamonds, these deposits include kimberlite pipes, dykes,blows and fissures as well as lamproites. Contrasted with alluvial.
Primary Gravel Potentially diamondiferous alluvial gravels occurring on the Hospital and Uitdraai properties.
Probable reserves Is the economically mineable material derived from a Measured and/or Indicated DiamondResource. It is estimated with a lower level of confidence than a Proved Reserve. It is inclusiveof diluting materials and allows for losses that may occur when the material is mined.Appropriate assessments, which may include feasibility studies, have been carried out, includingconsideration of, and modification by, realistically assumed mining, metallurgical, economic,marketing, legal, environmental, social and governmental factors. These assessmentsdemonstrate at the time of reporting that extraction is reasonably justified.
Prospect A deposit with the potential for economic extraction.
Rehabilitation The process of restoring mined land to a condition approximating to a greater or lesser degreeits original state. Reclamation standards are determined by the South African Department ofMineral and Energy Affairs and address ground and surface water, topsoil, final slope gradients,waste handling and re-vegetation issues.
Sample The removal of a small amount of rock pertaining to the deposit which is used to estimate thegrade of the deposit and other geological parameters. Kimberlite samples for the recovery ofdiamonds are usually several hundred tonnes per sample.
Sampling Taking small pieces of rock at intervals along exposed mineralization for assay (to determine themineral content). Bulk samples in the case of kimberlites.
SAMREC Code The South African Code for Reporting of Mineral Resources and Mineral Reserves.
Sandstone A fine to very coarse grained arenaceous sedimentary rock consisting of silicate group minerals,e.g. Sand.
Sedimentary Formed by the deposition of solid fragmental or chemical material that originates fromweathering of rocks and is transported from a source to a site of deposition.
Shale A fine grained argillaceous sedimentary rock consisting of clays.
Silt A detrital particle, smaller than sand and coarser than clay, in the range 0.004 to 0.062mm.
Size frequency Graph which plots the number of carats in each of the sieve size fractions as a cumulativedistribution fraction of the total diamond production of that sample. The graph can also be plotted on log/log
axes to form a straight line.
Slimes The fine fraction of tailings discharged from a processing plant without being treated. In the caseof diamonds, usually that fraction which is less than 1mm in size.
Slimes dam A storage facility for all fine waste products from the processing plant.

174
Specific gravity Measure of quantity of mass per unit of volume, density.
Stockpile A store of unprocessed ore or marginal grade material.
Stone size Average size of the diamonds, expressed as carats/stone.
Stones Diamonds.
Strike The direction taken by a structural surface such as a fault plane as it intersects the horizontal.
Stripping Removal of waste overburden covering the mineral deposit.
Stripping ratio Ratio of ore rock to waste rock.
Tailings The waste products of the processing circuit. These may still contain very small quantities of theeconomic mineral.
Tailings dam Dams or dumps created from waste material from processed ore after the economicallyrecoverable metal or mineral has been extracted.
Tertiary period A period of time spanning between 2.0 Ma and 65 Ma.
Tonnage Quantities where the tonne is an appropriate unit of measure. Typically used to measurereserves of metal-bearing material in-situ or quantities of ore and waste material mined,transported or milled.
Tonne Metric Ton.
Trenching Making elongated open-air excavations for the purposed of mapping and sampling.
Tuffisitic In the form of a tuff or pyroclastic rock, formed as a result of explosive volcanic activity.
Ultramafic Containing >90% mafic minerals.
Volcanic Igneous rocks that have reached or nearly reached the earth’s surface before solidifying, forexample lavas.
Waste rock Rock with an insufficient diamond content to justify processing.
Weathered rock Rock which has been broken down by the influences of water and air and which becomes softenedand partially decomposed.
Xenoliths An inclusion of a pre-existing rock into an igneous rock.
Yield/Recovered grade The actual grade of ore realised after the mining and treatment process.
ABBREVIATION EXPLANATION
° Angle in degrees
°C Degrees centrigrade
3-D Three dimensional
ACISA Accounting Institute of South Africa
Alluvial Ventures Alluvial Ventures (Pty) Ltd
Ave Average
B.Sc Bachelor of Science degree
B.Sc (Hons) Bachelor of Science Honours degree
Build.Constr. Building & Construction
CAM Consolidated African Mines (Pty) Ltd
Capex Capital expenditure
CAPM Capital asset pricing model
CIA Central Intelligence Agency
CMMS Consolidated Mining Management (Pty) Ltd
cpht Carats per hundred tonne
CPI Consumer Price Index (South Africa)
CPIX Consumer Price Index excluding mortgage rates (South Africa)
CPR Competent Person’s Report
CSO Central Selling Organisation
cts Carats
Datamine Datamine South Africa (Pty) Ltd

175
DCF Discounted cash flow
Dip Diploma
DMS Dense Medium Separation
DMS Dip Bus Man Damelin Management Schoool Diploma in Business Management
DRA Dowding Reynard & Associates (Pty) Ltd
DRC Democratic Republic of the Congo
DST Diamond Sales Tax
ECMP Environmental, Civil and Mining Projects (Pty) Ltd
Ecosun Ecosun cc
EIA Environmental Impact Assessment
EIS Environmental Impact Study
EMP Environmental Management Programme
EMPR Environmental Management Programme Report
Eng. Engineer
EOH End of hole
ESS ESS Support Services Worldwide (Pty) Ltd
Ext. Met Extractive metallurgy
FGSSA Fellow of the Geological Society of South Africa
FSAIMM Fellow of the South African Institute for Mining & Metallurgy
GDP Gross domestic product
Geomechanics Geomechanics cc
Golder Golder Associates Africa (Pty) Ltd
Govt Cert Government Certificate
gr Grain
ha Hectare
HQ Drilling diameter of 63.5mm
I&AP Interested & Affected Party
ICS&A Institute of Chartered Secretaries and Administrators
IFRS International Financial Reporting Standards
IMF International Monetary Fund
Inf Inflated
IRR Internal rate of return
JCI JCI Ltd
JK JK Drop Weight Test
JSE JSE Limited
K Kimberlite facies
kg Kilogramme
km Kilometre
kV Kilovolt
LCD Lesotho Congress for Democracy
LCPI Lesotho Consumer Price Index
Lease Mining Lease Agreement
Letseng Guernsey Letseng Diamonds Ltd
Letseng Holdings Letseng Investment Holdings (South Africa) Pty Ltd
LNACOS&H Lesotho National Advisory Council on Occupational Safety and Health
LOM Life of mine

176
M Maloti
m Metre
m2 Square metres
m3 Cubic metre
Matodzi Matodzi Resources Ltd
MAusIMM Member of the Australasian Institute for Mining & Metallurgy
MBA Masters of Business Administration
MDP Management Development Programme
Mech.Eng Mechanical Engineer
MGSSA Member of the Geological Society of South Africa
Min.Eng Mining Engineer
MineNet MineNet (Pty) Ltd
Minopex Minopex (Lesotho) (Pty) Ltd
Mintek Mineral Technologies
Mm Million Maloti
mm Millimetre
Mm3 Million cubic metres
MMIC Matekane Mining Investment Company (Pty) Ltd
MSACMA Member of the South African Coal Miners Association
MSAGA Member of the South African Geophysicists Association
MSAIMM Member of the South African Institute for Mining & Metallurgy
MSc. Master degree in Science
Mt Million tonnes
Mtpa Million tonnes per annum
MW Megawatt
N/A Not applicable
Naleli Naleli Clinic
Nat Dip National Diploma
NAV Net asset value
NES National Environmental Secretariate
NNE North northeast
NPV Net present value
NQ Drilling diameter of 47.6mm
Opex Operating expenditure
PPI Producer Price Index (South Africa)
PPP Purchasing power parity
Pr.Sci.Nat Professional Natural Scientist
QCP Quantity surveyor
Quarry Cats Quarry Cats Lesotho (Pty) Ltd
ROM Run of mine
RTZ Rio Tinto South Africa (Pty) Ltd
SAAQP South African Association of Quantity Surveyors
SAIMM South African Institute for Mining & Metallurgy
SAMREC South African Code for Reporting of Mineral Resources and Mineral Reserves
Securicor Securicor Gray (Lesotho) (Pty) Ltd
SSW South southwest

177
Stallion Stallion Security (Pty) Ltd
t Tonnes
TDS Total dissolved salts
TFP Transfrontier Park
tph Tonnes per hour
tpm Tonnes per month
u/g Underground
UNISA University of South Africa
US$ United States Dollar
US$/ct United States Dollar per carat
VAT Value-Added Tax
WTO World Trade Organisation
WWW WWW International Diamonds Consultants Ltd
ZAR South African Rand
ZARm Million South African Rands

178
Appendix 6: Resource Classification Logic

179
Appendix 7: DCF Valuation Output Summaries
Before the Transaction Depleting Indicated Resources Only

180

181
Before the Transaction Depleting Indicated and Inferred Resources

182

183
After the Transaction Depleting Indicated Resources Only

184

185
After the Transaction Depleting Indicated and Inferred Resources

186

187
Appendix 8: References
DATE AUTHOR TITLE
May – 1999 Webber Newdigate Attorneys Mining Lease between The Basotho Nation and Letseng Diamonds (Pty) Ltd
May – 2002 Venmyn (Pty) Ltd Independent Due Diligence, Valuation Report and Fair & ReasonableOpinion for the Shareholders and Directors of Consolidated African MinesLtd on the Proposed Acquisition of a 40% Interest in Letseng InvestmentHoldings (South Africa) (Pty) Ltd from Letseng Diamonds Ltd inConsideration for Cash and an Issue of CAM Ordinary Shares
For references used in the previous Venmyn Report (above) the reader is referred to Section 10 – Bibliography ofthat report. These references are not repeated in this list.
DATE AUTHOR TITLE
December – 2003 US Geological Survey The Mineral industries of Lesotho and Swaziland, US Geological SurveyMinerals Yearbook, 2003
June – 2004 Golder Associates Africa Environmental Impact Statement for Reinitiation of Mining Operations at(Pty) Ltd Letseng Diamond Mine (Report No. 5870/6003/1/E)
June – 2004 Golder Associates Africa Environmental Management Plan for Reinitiation of Mining Operations at (Pty) Ltd Letseng Diamond Mine (Report No. 5870/6003/1/E)
December – 2004 BBC News Various news articles
March – 2005 The World Bank Group Country Brief Lesotho(www.web.worldbank.org/WEBITE/EXTERNAL/COUNTRIES/AFRICAEXT/LESOTHOEXTN/)
April – 2005 BBC News Timeline: Lesotho: a chronology of key events(www.bbc.co.uk/1/hi/world/africa/countryprofiles/2005964.stm)
May – 2005 Steffen, Robertson and Kirsten Draft Competent Persons Report on Letseng Investment Holdings (South(South Africa) (Pty) Ltd Africa) (Pty) Ltd prepared for JCI Limited (Report No.350405/2)
May – 2005 BBC News Country Profile: Lesotho(www.bbc.co.uk/1/hi/wprld/africa/countryprofile/1063292tm)
July – 2005 CIA The World Fact Book– Lesotho(www.cia.gov/cia/publications/factbook/geos/It.html)
July – 2005 Mbendi Lesotho Overview (www.mbendi.co.za/land/af/le/p0005.htm)
July – 2005 European Diamonds PLC www.europeandiamondsplc.com
July – 2005 Investec Corporate Finance Letseng Diamonds Information Memorandum
July – 2005 Letseng Staff Various communications by email and in person
August – 2003 Environmental, Civil and Design Report for Residue Disposal Facility prepared for DRAMining Projects (Pty) Ltd
September – 2003 Minopex (Lesotho) (Pty) Ltd Contract No. C1765 Vol 1 Conditions
July – 2005 Quarry Cats Lesotho (Pty) Ltd Draft agreement between Letseng Diamonds and Quarry Cats Lesotho
February – 2004 ESS Support Services Draft agreement between Letseng Diamonds and Compass Lesotho (Pty) Ltd,Worldwide (Pty) Ltd represented by its division ESS Support Services Worldwide (Pty) Ltd
May – 2004 Matekane Mining Investment Agreement between Letseng Diamonds and Matekane Mining InvestmentCompany Ltd Company Ltd
February – 2004 Stallion Security (Pty) Ltd Agreement between Letseng Diamonds and Stallion Security (Pty) Ltd
October – 1999 Securicor Gray (Lesotho) Agreement between Letseng Diamonds and Securicor Gray (Lesotho) (Pty) Ltd(Pty) Ltd
March – 2003 Alluvial Ventures (Pty) Ltd Amendment to the agreement between Letseng Diamonds and AlluvialVentures
March – 2004 Tlaeeng Mining (Pty) Ltd Agreement between Letseng Diamonds and Tlaeeng Mining
August – 2005 Naleli Clinic Proposal for the provision of medical services at Letseng
August – 2005 Geomechanics (Pty) Ltd Personal communications
August – 2005 Minesight Applications Personal communications(Pty) Ltd

188
DATE AUTHOR TITLE
August – 2005 WWW International Diamond Market Report and Diamond Price ForecastConsultants Ltd
August – 2005 WWW International Diamond Personal communicationsConsultants Ltd
August – 2005 Golder Associates Africa Letter concerning environmental liabilities(Pty) Ltd
March – 2004 MineNet (Pty) Ltd Letseng Satellite Pit mine plan, final report on mining strategy and short-term digging plans
March – 2004 MineNet (Pty) Ltd Letseng Main Pit mine plan, final report on mining strategy and short-term digging plans
June – 2005 MineNet (Pty) Ltd Satellite and Main Pits – updated ultimate pit economic shell analyses
July – 2005 Letseng Staff Flow sheet of pre-crushing facility and ore treatment plant, tracer testsreports, DRA (C1863) Section 2: Process Design Criteria
June – 2005 Minopex (Lesotho) (Pty) Ltd Mass Balance and Particle Size Distribution Final Summary KimberliteJune – 2005 Letseng Staff Tailings Crushing Project
July – 2005 Multotec Process Equipment Letseng Cyclones(Pty) Ltd
July – 2005 Letseng Staff Report for Venmyn on the Letseng Treatment Plant: Plant Modifications
August – 2005 Letseng Staff Cost of plants
February – 2005 Bateman Minerals Proposal to Letseng Diamond Mine for a Class II Feasibility Study for(Pty) Limited Increasing the Plant Capacity to 700 tph
June – 2005 Mr N Kaner Revision 11a – Letseng Diamonds (Pty) Ltd Unescalated Earnings Forecast
July – 2005 Mr N Kaner Option 1 – Letseng Diamonds (Pty) Ltd Expansion to 500tph Base Case
August – 2005 MineNet (Pty) Ltd Letseng Satellite Pit – Restricted Pit to 176m Depth
June – 2005 MineNet (Pty) Ltd Letseng Main Pit mine plan, final report: mining strategy and target firstdigging plans – Rev2
July – 2005 MineNet (Pty) Ltd Letseng Fracture Mapping & Rock Fabric Analysis in the Satellite OpenPit
February – 2005 MineNet (Pty) Ltd Letseng Satellite Pit – Short Term Mining Plan
June – 2005 Letseng Diamonds (Pty) Ltd Letseng Diamonds – Production Statistics March 2004 – June 2005
July – 2005 Lesotho Minister of Letter to Letseng Diamonds (Pty) Ltd – VAT Refunds and CapitalNatural Resources Expenditure Depreciation
August – 2005 Letseng Diamonds (Pty) Ltd Management accounts for period ending 31 July 2005
August – 2005 Letseng Diamonds (Pty) Ltd Diamond Marketing Contract
January – 2006 Bateman Minerals and Letseng Diamonds Class II Feasibility StudyMetals Ltd
May – 2006 Bateman Minerals and Letseng Value Engineering Study DocumentMetals Ltd
August – 2005 Dr I C Lemmer Valuation of Average Revenue Per Carat Per Kimberlite Facies Type forLetseng Diamonds (Pty) Ltd
June – 2006 Dr I C Lemmer Update of the Valuation of Average Revenue Per Carat Per KimberliteFacies Type of October 2005 for Letseng Diamonds (Pty) Ltd
June – 2006 MineNet (Pty) Ltd Memorandum on Density Values
February – 1973 Dr H S Sichel Statistical valuation of diamondiferous deposits

189
JCI LIMITED(Incorporated in the Republic of South Africa)
(Registration number 1894/000854/06)Share code: JCD (Suspended) ISIN: ZAE000039681
NOTICE OF GENERAL MEETING
All the interpretation and definitions in this circular, to which this notice of the JCI general meeting is attached, shall bearthe same meanings in this notice of the JCI general meeting.
Notice is hereby given that a general meeting of shareholders of JCI will be held at 10:00 on Friday, 29 September 2006 inthe Auditorium, Ground Floor, 28 Harrison Street, Johannesburg for the purpose of considering, and if deemed fit, passing,with or without modification, the following ordinary resolutions:
ORDINARY RESOLUTION NUMBER 1
“Resolved that the disposal by Letseng Investment Holdings South Africa (Proprietary) Limited (“Letseng Holdings”) toGem Diamond Mining Company of Africa Limited (“Gem”) of Letseng Holdings’ entire interest in the ordinary shares inLetseng Diamonds (Proprietary) Limited, on the terms and conditions contained in the sale of shares agreement dated 23 June 2006 entered into between Letseng Holdings and Gem ( a signed copy of which the Sale of Shares Agreementhas been initialled, for identification purposes, by the chairperson of the general meeting at which this ordinary resolutionnumber 1 is to be proposed), be and is hereby ratified.”
ORDINARY RESOLUTION NUMBER 2
“Resolved that any and all directors of the company be and are hereby authorised to take all such steps and sign all suchdocuments as are necessary to give effect to ordinary resolution number 1 above and that all such steps and signature ofdocuments by any director of the company as have already taken place pertaining to the matters contemplated in suchordinary resolutions are hereby ratified.”
ORDINARY RESOLUTION NUMBER 3
“Resolved that the loan agreement between JCI Limited (“JCI”), JCI Investment Finance (Proprietary) Limited (formerlyLexshell 658 Investments (Proprietary) Limited) (“JCIIF”) and Investec Bank Limited (“Investec”), on the terms andconditions contained in the loan agreement dated 31 August 2005 entered into between JCI, JCIIF and Investec (a signedcopy of which has been initialled, for identification purposes, by the chairperson of the general meeting at which thisordinary resolution number 3 is to be proposed), be and is hereby ratified.”
ORDINARY RESOLUTION NUMBER 4
“Resolved that any and all directors of the company be and are hereby authorised to take all such steps and sign all suchdocuments as are necessary to give effect to ordinary resolution number 3 above and that all such steps and signature ofdocuments by any director of the company as have already taken place pertaining to the matters contemplated in suchordinary resolutions are hereby ratified.”
VOTING AND PROXIES
On a show of hands, each shareholder of the company who, being a natural person, is present in person or by proxy or,being a company (or other juristic person), is represented by a duly authorised representative at the JCI general meeting,is entitled to one vote on a show of hands, irrespective of the number of JCI shares he holds or represents, provided thata proxy shall, irrespective of the number of JCI shareholders he represents, have only one vote. On a poll, a JCI shareholder

190 PRINTED BY INCE (PTY) LTD W2CF01438
who is present in person or represented by proxy (if a natural person) or represented (if a juristic person) at the JCI generalmeeting shall be entitled to that number of votes which is equal to that proportion of the total votes in the company whichthe aggregate amount of the nominal value of the JCI ordinary shares held by him bears to the aggregate amount of thenominal value of all the JCI ordinary shares issued by the company.
Each JCI ordinary shareholder of the company who is entitled to attend and vote at the JCI general meeting may appointone or more proxies as alternates (none of whom needs to be a shareholder of the company), to attend, speak and votein his stead.The completion and lodging of forms of proxy will not preclude a JCI shareholder from attending, speaking andvoting to the exclusion of the proxy so appointed.
A form of proxy is included with this notice for use by certificated shareholders and “own name” dematerialisedshareholders who are unable to attend the JCI general meeting but who wish to be represented thereat. Duly completedforms of proxy must be received by the South African transfer secretaries (Computershare Investor Services 2004(Proprietary) Limited, Ground Floor, 70 Marshall Street, Johannesburg, 2001, PO Box 61051, Marshalltown, 2107) or by theUnited Kingdom registrars, The Registry, 34 Beckenham Road, Beckenham, Kent, BR3 4TU by no later than 10:00 on 27 September 2006.
Dematerialised JCI shareholders, other than “own name” dematerialised shareholders, who wish to attend the JCI generalmeeting must instruct their CSDP or broker to issue them with the necessary authority to attend. Should dematerialisedJCI shareholders, other than “own name” dematerialised shareholders, be unable to attend the JCI general meeting inperson, but wish to vote by proxy, they must provide their CSDP or broker with their voting instructions in terms of thecustody agreement entered into between them and their CSDP or broker.
For and on behalf of the board
JCI LIMITED
Ms B E MortonLegal adviser and secretary
Johannesburg11 September 2006
Registered office: Transfer secretaries United Kingdom registrars
28 Harrison Street Computershare Investor Services Capita RegistrarsJohannesburg, 2001 2004 (Proprietary) Limited The Registry(PO Box 11165, Johannesburg, 2000) Ground Floor 34 Beckenham Road
70 Marshall Street BeckenhamJohannesburg, 2001 Kent BR3 4TU(PO Box 61051, Marshalltown, 2107) United Kingdom

JCI LIMITED(Incorporated in the Republic of South Africa)
(Registration number 1894/000854/06)Share code: JCD (Suspended) ISIN: ZAE000039681
(“JCI” or “the company”)
FORM OF PROXY
For use by certificated JCI ordinary shareholders and “own name” dematerialised JCI ordinary shareholders only, at the general meeting of JCI shareholders(“the JCI general meeting”) to be held at 10:00 on Friday, 29 September 2006 in the Auditorium, Ground Floor, 28 Harrison Street, Johannesburg.
JCI ordinary shareholders who have dematerialised their JCI ordinary shares, other than “own-name” dematerialised JCI ordinary shareholders, must informtheir Central Securities Depository Participant (“CSDP”) or broker of their intention to attend the JCI general meeting and request their CSDP or brokerto issue them with the necessary authorisation to attend or provide their CSDP or broker with their voting instructions should they not wish to attendthe JCI general meeting in person. Such JCI ordinary shareholders must not return this form of proxy to the transfer secretaries.
I/We (please print)
of address(please print)
being the holder of JCI ordinary shares, hereby appoint (see Note 2):
1. or failing him/her,
2. or failing him/her,
3. the chairperson of the JCI general meeting,
as my/our proxy to attend, speak and vote for me/us on my/our behalf at the JCI general meeting which is to be held for the purpose of considering and,if deemed fit, passing with or without modification, the ordinary resolutions to be proposed thereat and at each adjournment thereof and to vote for oragainst the ordinary resolutions or to abstain from voting in respect of their JCI ordinary shares in the issued share capital of JCI registered in my/ourname/s, in accordance with the following instructions (see Note 4).
For Against Abstain
Ordinary resolution number 1Approval of the Sale of Share Agreement between Gem Diamond Mining Company of Africa Limited and Letseng Investment Holdings South Africa (Proprietary) Limited
Ordinary resolution number 2To authorise directors to take all such steps and sign all such documents to give effect to ordinary resolution number 1
Ordinary resolution number 3Ratification of the loan agreement between JCI Limited, JCI Investment Finance (Proprietary) Limited (formerly Lexshell 658 Investments (Proprietary) Limited) and Investec Bank Limited
Ordinary resolution number 4To authorise directors to take all such steps and sign all such documents to give effect to ordinary resolution number 3
Insert an “X” in the relevant spaces above according to how you wish your votes to be cast. However, if you wish to cast your votes in respect of a lessernumber of JCI ordinary shares than you own in JCI, insert the number of JCI ordinary shares held in respect of which you desire to vote (see Note 4).
Signed at on 2006
Signature
Assisted by me (where applicable)
Each JCI ordinary shareholder is entitled to appoint one or more proxies (who need not be a JCI ordinary shareholder) to attend, speak and vote in placeof that member at the JCI general meeting.
Please read the notes on the reverse hereof.

I
Notes:
1. All JCI ordinary shareholders are entitled to attend, be represented and vote at the JCI general meeting. Each JCI ordinary shareholder present by proxy or in person (if a natural person) or presented (if a juristic person) at theJCI general meeting has, on a show of hands, one vote irrespective of the number JCI ordinary shares he holds orrepresents, provided that a proxy shall irrespective of the number of JCI ordinary shareholders he represents have onlyone vote. On a poll, at the JCI general meeting, a JCI ordinary shareholder who is present by proxy or in person (ifnatural person) or represented (if a juristic person) shall be entitled to that number of votes which is equal to thatproportion of the total votes in JCI which the aggregate amount of the nominal value of the JCI ordinary shares heldby him bears to the aggregate amount of the nominal value of all the JCI ordinary shares issued by JCI.
2. A JCI ordinary shareholder may insert the name of a proxy or the names of two alternate proxies of the JCI ordinaryshareholder’s choice in the space/s provided, with or without deleting “the chairperson of the JCI general meeting”. Ifa deletion is made, such deletion must be initialled by the JCI ordinary shareholder.The person whose name standsfirst on this form of proxy and who is present at the JCI general meeting will be entitled to act as proxy to the exclusionof those whose names follow.
3. A JCI ordinary shareholder’s instructions to the proxy must indicate by the insertion of the relevant number of JCI ordinary shares held by him (which will indicate the number of votes exercisable by the shareholder on a poll) inthe appropriate box provided. Failure to comply with the above will be deemed to authorise the proxy to vote orabstain from voting at the JCI general meeting as he deems fit in respect of all the JCI ordinary shareholder’s votesexercisable thereat. A JCI ordinary shareholder or the proxy is not obliged to use all the votes exercisable by the JCI ordinary shareholder or by the proxy, but the total of the votes cast in respect of which absention is recorded maynot exceed the total of the votes exercisable by the JCI ordinary shareholder or by the proxy.
4. A JCI ordinary shareholder’s instructions to the proxy as to whether to vote for, against or abstain from voting, and inrespect of the relevant number of JCI ordinary shares to vote in such a manner, shall, in respect of the ordinaryresolutions, be indicated as follows:
(a) by the insertion of an “X” in the appropriate box provided to indicate whether to vote for, against or abstain fromvoting. Such an insertion, without the insertion of the relevant number of JCI ordinary shares as contemplated inparagraph (b) below, shall require the proxy to vote or abstain from voting at the JCI general meeting as indicatedby the “X” in respect of all (and not some) of the JCI ordinary shareholder’s votes exercisable thereat;
(b) by the insertion, of the relevant number of JCI ordinary shares held by the JCI ordinary shareholder in thecompany to indicate the number of JCI ordinary shares to be voted for, against or abstain from voting (which willindicate the number of votes exercisable by the proxy on behalf of the shareholder on a poll), in the appropriatebox provided. Such an insertion, with or without the insertion of an “X”, shall require the proxy to vote or abstainfrom voting at the JCI general meeting as indicated by the number so inserted in respect of such inserted number(and not a portion) of all JCI ordinary shares; and/or
(c) by the failure to insert anything in the appropriate box. Such failure will be deemed to authorise the proxy to voteor abstain from voting at the JCI general meeting as he deems fit in respect of all (or a portion) of the JCI ordinary shareholder’s votes exercisable thereat.
5. A JCI ordinary shareholder is not obliged to use all the votes exercisable by the JCI ordinary shareholder, but the totalof the votes cast, and in respect of which abstention is recorded, whether by the JCI ordinary shareholder or the proxy,may not exceed the total of the votes exercisable by the JCI ordinary shareholder.
6. A form of proxy must be lodged with or posted to the South African transfer secretaries, Computershare InvestorServices 2004 (Proprietary) Limited, Ground Floor, 70 Marshall Street, Johannesburg, 2001, PO Box 61051,Marshalltown, 2107 or the United Kingdom Registrars, The Registry, 34 Beckenham Road, Beckenham,Kent, BR3 4TU so as to reach them by no later than 10:00 on Wednesday, 27 September 2006.
7. The completion and lodging of this form of proxy will not preclude the relevant JCI ordinary shareholder fromattending the JCI general meeting and speaking and voting in person thereat to the exclusion of any proxy appointedin terms hereof.
8. Documentary evidence establishing the authority of a person signing this form of proxy in a representative or otherlegal capacity must be attached to this form of proxy unless previously recorded by the transfer secretaries or waivedby the chairperson of the JCI general meeting, as the case may be.
9. Any alteration or correction made to this form of proxy must be initialled by the signatory/ies.
I