1997 MHCA Publications - USAID
177
1997 MHCA Publications Investigations supported by the Micronutrient for Health Cooperative Agreement (MHCA) between the Center for Human Nutrition, Department of International Health, Johns Hopkins School of Hygiene and Public Health and Office of Health and Nutrition US Agency for International Development, Washington, DC BEST AVAILABLE CO"., I
-
Upload
khangminh22 -
Category
Documents
-
view
3 -
download
0
Transcript of 1997 MHCA Publications - USAID

1997 MHCA Publications
Investigations supported by theMicronutrient for Health Cooperative Agreement
(MHCA)between the
Center for Human Nutrition, Department ofInternationalHealth, Johns Hopkins School ofHygiene and Public
Healthand
Office ofHealth and NutritionUS Agency for International Development,
Washington, DC
BESTAVAILABLE CO".,
I

Preface
Through its agenda of applied research, technical assistance and training theCenter for Human Nutrition (CHN), Department of International Health, Johns HopkinsUniversity seeks to significantly advance knowledge and the development andapplication of methods related to preventing key micronutrient deficiencies that canadvance global prevention programs. Much of the CHN's micronutrient research agendahas received support, in whole or in part, by the Office of Health and Nutrition, USAgency for International Development (USAID), through the "Vitamin A for Health"cooperative agreements at Johns Hopkins since the early 1980's, and more recentlythrough its current "Micronutrient for Health" Cooperative Agreement (MHCA).
CHN is committed to the dissemination of major research findings and theirrelevance to programs and policies through publications in peer-review scientificjournals, the lay press, conferences and consultations, and advocacy and constituencybuilding among legislators and other government bodies. This volume pulls together thepublications under the CHN's micronutrient agenda that appeared in peer-reviewjournals during calendar year 1997. These studies were supported, in whole or in part, bythe "Vitamin A for Health" or "Micronutrient for Health" cooperative agreements withUSAID.

1997 MHCA Publications
TABLE OF CONTENTS
Vitamin A
1. Gittelsohn J, Shankar AV, West KP Jr., Ram R, Dhungel C, Dahal, B. Infant feeding history reflectsantecedent risk of xerophthalmia in Nepali children. Eur J Clin Nutr 1997;51:484-490.
2. Greenberg BL, Semba RD, Schoenbaum E, Klein RS. Vitamin A deficiency among former andcurrent injecting drug users in Bronx, New York. Nutr Res 1997;17:785-796.
3. Katz J, Yoon SS, Brendel K, West KP, Jr. Sampling designs for xerophthalmia prevalence surveys.Int J EpidemioI1997;26:1041-1048.
4. Sanchez AM, Congdon NO, Sommer A, et al. Pupillary threshold as an index of population vitamin Astatus among children in India. Am J Clin Nutr 1997;65:61-66.
5. Semba RD, Akib A, Beeler J, Munasir Z, Permaesih D, Muherdiyantinigsih, Komala, Martuti S,Muhilal. Effect of vitamin A supplementation and measles vaccination in nine-month-old infants.Public Health 1997;111:245-247.
6. Sommer A. Vitamin A prophylaxis. Arch of Disease in Childhood 1997;77:191-194.
7. Sommer A, West KP Jr. The duration of the effect of vitamin A supplementation [letter; comment].Am J Pub H1th 1997;87:467-469.
8. Sommer A. Vitamin A deficiency, child health, and survival. Nutrition 1997;13:484-485.
9. West KP Jr., LeClerq SC, Shrestha SR, Wu LS, Pradhan EK, Khatry SK, Katz J, Adhikari R, SommerA. Effects of vitamin A on growth of vitamin A deficient children: field studies in Nepal. J Nutr1997;10:1957-1965.
Vitamin A and HIV
10. Semba RD, Miotti PG, Chiphangwi JD, Liomba G, Yang LP, Wu CO, Hoover DR. Maternal vitaminA deficiency and child growth failure during human immunodeficiency virus infection. J of AcquiredImmune Deficiency Syndromes and Human Retrovirology 1997;14:219-222.
11. Semba RD. Vitamin A and human immunodeficiency virus infection. Proceedings of the NutritionSociety 1997;56:459-469.
12. Semba RD. An overview of the potential role of vitamin A in mother-to-child transmission of HIV-1.Acta Paediatrica (Supp!) 1997;421:107-112.
13. Tang AM, Graham NMH, Semba RD, Saah AJ. Association between serum vitamin A and E levelsand HIV-1 disease progression. AIDS 1997;11 :613-620.
3

1997 MHCA Publications
Iron Deficiency and Anemia
14. Stoltzfus RI, Chwaya HM, Albonico M, Schulze K, Savioli L, Tielsch 1. Serum ferritin, erythrocyteprotoporphyrin and hemoglobin are valid indicators of iron status of school children in a malariaholoendemic population. J Nutr 1997;127:293-298.
15. Stoltzfus RI' Rethinking anaemia surveillance. Lancet 1997; 349:1764-1766.
16. Stoltzfus RJ, Dreyfuss ML, Jorgensen T, Chwaya HM, Albonico M. Hookworm control as a strategy toprevent iron deficiency. Nutr Rev 1997;55:223-232.
17. Stoltzfus RJ, Chwaya HM, Tielsch JM, Schulze KJ, Albonico M, Savioli L. Epidemiology of irondeficiency anemia in Zanzibari school children: the importance of hookworms. Am J Clin Nutr1997;65:153-159.
Iodine Deficiency
18. Cobra C, Muhilal, Kusnandi, Rustama D, Djatnika, Suwardi SS, Permaesih D, Muherdiyantiningsih,Martuti S, Semba RD. Infant survival is improved by oral iodine supplementation. J Nutr1997;127:574-578.
19. Albonico M, Chwaya HN, Montresor A, Stoltzfus RJ, Tielsch J, Alawi KS, Savioli L. Parasiticinfections in Pemba Island schoolchildren. E African Med J 1997;74:294-298.
20. Gittelsohn J, Shankar AV, West KP Jr, Ram RM, Gnywali T. Estimating reactivity and its effects indirect observation studies of health behaviors. Human Organization 1997;56:182-189.
21. Gittelsohn, J., Thapa, M. and Landman, L.T. Cultural factors, caloric intake and micronutrientsufficiency in rural Nepali households. Soc Sci Med 1997;44:1739-1749.
22. Habicht J-P, Stoltzfus RI. What do indicators indicate? Am J Clin Nutr 1997;66: 190-191.
23. Stoltzfus RJ, Albonico M, Tielsch JM, Chwaya JM, Savioli L. Linear growth retardation in Zanzibarischool children. J Nutr 1997;127:1099-1105.
24. Stoltzfus RI, Albonico M, Tielsch IT, Chwaya HM, Savioli L. School-based deworming program yieldssmall improvement in growth of Zanzibari school children after one year. J Nutr 1997;127:2187-2193.
25. Tay-Kearney ML, Enger C, Semba RD, Royal W, Dunn JP, Jabs DA. T-cell subsets and CMVretinitis in HIV-infected patients. J Infect Dis 1997;176:790-794.
26. Yoon SS, Katz J, Brendel K, West KP JT. Efficiency of EPI cluster sampling for assessing diarrheaand dysentery prevalence. WHO Bull 1997;75:417-426.

1997 PUBLICATIONS

VITAMIN A

European Joutnal of Clinical NutritiDn (1997) 51, 484-490o1997 Stocklo~ Press. All rights reserved 0954-3007197 $12.00
Infant feeding practices reflect antecedent risk of xerophthalmiain Nepali children
J Gittelsohn1, AV Shankar!, KP West Jrl
, R Ram2, C Dhunget2 and B Dahal2
'Center for Human Nutrition and Division ofHuman Nutrition, Department of International Health, School ofPublic Health, JohnsHopkins University, 615 North Wolfe Street. Baltimore. MD 21205, USA; and 2Nepal Nutrition Intervention Project-Sarlahi, Nepal EyeHospital, Kathmandu, Nepal
Objective: To detennine the relationship between infant feeding history and risk of xerophthalmia due tovitamin A deficiency (VAD) in early childhood.Design: A case-control study of previously xerophthalmic and non-xerophthalmic children.Setting: Rural lowland region of Nepal.SUbjects: One hundred and fifty-six children (aged 1-6 y old), half of whom previously had xerophthalmia dueto vitamin A-defiCiency, the other half matched by locale, age and the presence and age of a younger sibling(n= 102).Methods: Xerophthalmia was detennined by trained ophthalmic assistants on the basis of current Bitot's spots,corneal xerosis or report of night blindness. Infant feeding history was collected through a diet history methodobtained from the mother ofthe focus child. Exploratory factor analysis was conducted to determine the presenceof underlying patterns in infant feeding practices. Conditional logistic regression was used to estimate oddsratios.Results: Mothers of control children tended to have a higher level of education (P < 0.10) and to have fewerchildren who had died (P < 0.10) than mothers of case children. Feeding of meat (OR = 0.09, CI = 0.01-0.70) orfish (OR =0.41. CI=0.17-o.99) with liver, eggs (OR = 0.1 I, CI=0.0I-o.88) and mango (OR = 0.28,CI = 0.13--Q.60) were protective in association with xerophthalmia in early childhood. Factor analysis uncoveredseveral distinct patterns in infant feeding, which varied by age of the infant. Only the 'animal flesh' feedingpattern (factor), practiced in the second year of life, proved significantly protective from xerophthalmia(OR = 0.43, CI = 0.20-0.94). Feeding patterns of younger children closely paralleled those of their oldersiblings with and without VAD.Conclusions: The study supports the hypothesis that infant dietary practices can influence subsequent risk forVAD. Our findings emphasize the importance of introducing vitamin A-rich foods during weaning to reduce therisk of VAD-associated xerophthalmia in the later preschool years.Sponsorship: The project is funded through Cooperative Agreement No. DAN 0045-A-OO-5094-00 between theCenter for Human NutritionIDana Center for Preventive Ophthalmology, The Johns Hopkins University and TheOffice of Health and Nutrition, US Agency for International Development, with additional support from TaskForce Sight and Life (Roche, Basel), and NIH shared instrument grant No. SIO-RR 04060.Descriptors: infant feeding; diet history; xerophthalmia; vitamin A deficiency; Nepal
Introduction
There is a large literature linking a low, current intake ofvitamin A to xerophthalmia in preschool-aged children(Blankhart, 1967; Pepping et ai, 1989 Solon et ai, 1978;Sommer & West, 1996; Tarwotjo et ai, 1982). The evidence to date is believed to reflect a pattern of chronicallylow vitamin A intakes. Yet, beyond a propensity to weanearly (Khatry et ai, 1995; Tarwotjo et ai, 1982) little isknown about complementary feeding patterns during earlyinfancy of high-risk children prior to developing clinicallyevident vitamin A deficiency 0!AD). Secondly, given thatyounger siblings are at a greatly increased risk of developing xerophthalmia (Katz et ai, 1993) and that risk factorstend to cluster within families (Sommer & West, 1996), itis of interest to understand early dietary patterns of prexerophthalmic siblings in order to identify inadequacies of
Correspondence: Dr J Gittelsohn.Received 30 January 1997; revised 4 April 1997; accepted 11 April 1997
intake and develop more comprehensive dietary counselingstrategies for high-risk families and their children.
The most accurate means of addressing these questionswould include costly longitudinal studies spanning earlyinfancy through school-age. Therefore, much of the literature linking infant feeding patterns and childhood nutritional status has been indirect (Dettwyler & Fishman,1992), drawing inferences through the examination ofdifferent aged children within the same household.Murphy et al (1995) observes that nutrient adequacytends to be a household characteristic for toddlers andschool children. From a study of 94 toddler-schoolchildpairs, siblings at high risk of nutrient inadequacy could beidentified with high levels of sensitivity and specificityfrom an indicator child. A similar situation exists withvitamin A deficiency, as siblings .of cases are 7-13 timesmore likely to have, or develop, xerophthalmia once theyenter the high-risk age group than children living in households without a xerophthalmic sibling (Katz et ai, 1993). InNepal, dietary patterns of xerophthalmic children and theiryounger siblings were found to be comparable, both having
1

low intakes of vitamin A rich foods (Shankar et ai, 1996),suggesting that the chronic dietary risk of VAD beginsearly in life and concentrates in high risk households. AsSommer & West (1996) observe, 'For many children, aweaning diet deficient in vitamin A predicts a vitamin Adeficient diet through the rest of early childhood, andpossibly beyond.'
Although most studies examining dietary patterns ofchildren with night blindness have found significant differ~
ences in consumption of preformed vitamin A (Shankar etai, 1996; Tarwotjo et ai, 1982) and provitamin A foodsources (Pepping et aI, 1989; Solon et aI, 1978; Tarwotjo etaI, 1982), little evidence exists of the linkage betweeninfant dietary intake of vitamin A food sources and laterchildhood xerophthalmia. An exception is a study by Meleet al (1991), which looked at xerophthalmic Indonesianchildren from o-S y (96% > 2 years) and matched controls,which found significantly reduced risk of xerophthalmia inchildren whose mothers reported feeding them vitamin A~
rich foods regularly during the first year of weaning.Timing of introduction of key foods may also be
determinant of later childhood feeding and risk. Xeroph~
thalmic children in Malawi were reported to have begunthe weaning process, on average, one month earlier thannon-xerophthalmic controls (3 vs 4 months of age) (Westet ai, 1986). The infant feeding process can be divided intodifferent stages, each associated with patterns of feedingand interaction between care giver and child. In Nepal,Gittelsohn (1991) found that for children less than a year,72% of the infant-care giver feeding interactions involvedbreast-feeding. Zeitlin & Ahmed (199S) looked at infantfeeding in rural Bangladesh over three infant age periods 512, 13-18 and 19-23 months and fOood that 'growth stasis'occurs primarily during the second period, associated withdecreased breast- feeding time and less food intake.
Studies of infant feeding practices conducted withinNepal reveal a great deal of diversity in infant feedingpractices by etlmic and caste group (Gittelsohn, 1989;Graves, 1984; Krantz, 1979; Levine, 1987; Panter-Brick,1991; Reissland & Burghart, 1988). In general, commonpatterns identified include lack of feeding of colostrum tothe infant, generally long duration of breast-feeding (23 y), lack ofpreparation of specialized weaning foods (suchas cereal paps), and relatively late introduction of solidfoods (after six months of age).
This study describes feeding patterns during the first twoyears of life using infant feeding histories of lS6 childrenaged l--{)y, half of whom were diagnosed with xerophthal"mia, the other half selected as age-village-younger siblingmatched non-xerophthalmic controls in rural Nepal. Diet~
ary histories are also examined for the next younger sibling(if any) in case and control households to determinewhether inter-sibling feeding patterns are correlated.Using dietary histories in high-risk (for xerophthalmia)and low-risk households (non-xerophthalmic controls) weexplore the relationship between infant diet and the presence of clinical vitamin A deficiency in early childhood.
Methods
Study designA case-control study was conducted in three village development committees (VDCs) totaling approximately IS 000population in Sarlahi District, located in the central lowlandregion of Nepal. Children with clinical signs ofxerophthalmia or a current history of night blindness were identified
Infant feeding practices in Nepali childrenJ Gitlelsohn et al
during a community"based screening by senior ophthalmicassistants employing World Health Organization criteria(Sommer, 1982). Eighty-six households were identified ashaving at least one xerophthalmic ('focus') child betweenthe ages of l--{) y. All case children were treated with200 000 IV of vitamin A on two consecutive days andreferred to the local health post for follow-up. The pool ofcontrol households included those whose surveyed childrenexhibited no xerophthalmia and who reported no history ofnight blindness in any sibling or the child's mother. Controls were matched to case households based on geographicproximity, ages ofcase and potential controls (±3 months),and ages of the next yoooger siblings (±4 months), ifpresent in the case household. Five cases either declinedto participate or migrated from the region. The age dis~
tribution of the 81 case children were as follows: ages 12 Y (6 cases), ages 3--4 y (38 cases), ages 5-6 y (37 cases).An additional three case households were omitted due tomigration of their control coooterpart, resulting in a total of78 case-control pairs included in the analysis.
Verbal informed consent was obtained from familiesprior to their participation. This study was approved by theNepal Health Research CooocH, Kathmandu, Nepal and theCommittee on Human Research, Johns Hopkins School ofHygiene and Public Health, Baltimore, MD.
Etlmographic data were collected for a period of fourmonths on the following topics: identifying local foodsgiven to infants and young children aged less than twoyears; determining key stages in the life of the infant asidentified by the mother; and identifying appropriate fre~
quency of feeding units. These data were used to developan infant diet history instrument which asked the caregiverto describe feeding of 21 key foods for five different timeperiods: the first three days of life, the remainder of the firstmonth oflife, months 2 through 6, months 7 through 12 andthe second year of life. During each time period, thecaregiver was asked to report the frequency of feeding tothe infant as (a) never, (b) infrequently (3 times per monthor only to taste), (c) somewhat regularly (>3 times permonth to 2 times per week), or (d) regularly (every day orevery other day). Portion sizes were not obtained. Additional questions identified primary decision-makers andsources of advice for the caregiver in feeding the infantcolostrum and other non-breastmilk foods.
The infant diet history was obtained once for the studychild and once for the next youngest sibling, if any, in allcase and control households. This instrument was administered 12-18 months after the initial diagnosis of xerophthalmia from the February 1992 ocular survey. Theinfant diet history was performed by two trained Nepalifemale data collectors. In all households, the primaryrespondent was the mother of the child. During the interview, mothers were asked to sit together with the childwhose dietary history was being ascertained to helpimprove recall and avoid confusion with other children.
Data analysisFrequency of consumption of the 21 key foods examinedin the infant diet history was calculated over the twoyear period of the infant diet history. Exploratory factoranalysis was used to identify ooderlying patterns of infantfeeding responsible for covariation in the data. Thismethod has been applied to examine diets based on foodfrequency results in order to identify dietary patterns(Barker et aI, 1990; Randell et aI, 1990; Schwerin et aI,1982).
485

486
lnianl feedfng praetices in Nepali chrrdre~
J Gittelsohn et al
Factor analysis calculates squared multiple correlationsas prior communality estimates (Hatcher, 1994). The prin·cipal factor method was used to extract the factors, followed by an oblique (promax) rotation (An oblique rotationis preferred when factors to be extracted are considered tobe interrelated). Separate factor analyses were run for agesone month, 2~ months, 7-12 months, 13-24 months and1-24 months. A combination of scree test (a plot of theeigenvalues of the factors) and assessment of proportion ofvariance accounted by the factors were utilized to deter·mine the number of factors to be retained for rotation. Ininterpreting the rotated factor pattern, a selected food wasconsidered to load on a given factor if the factor loadingwas 0.30 or greater for that factor, and was less than 0.30for all other factors. No food item was pennitted to load atthe 0.30 level in more than one factor. Factor scores foreach dietary pattern identified were computed for eachinfant by multiplying the factor weight of each foodincluded in the pattern by the standardized values of thereported frequency of use, and swnming over all foods inthe factor. Factors were named based on our understandingof infant feeding in the setting and from the preliminaryethnographic data.
Many of the factors created include only two foods,representing a modification of the standard approach tofactor analysis. We feel an exception to the standardapproach is justified as mothers were presented with arelatively small number of distinct foods.
Matched-pair odds ratios (OR) and 95% confidenceintervals eel) were calculated by conditional logisticregression to estimate the risk of not feeding or feedingless of a particular food item or according to a particularfactor pattern of a case relative to a control. To improve themeaningfulness of the parameter estimates, all covariateswere reduced to binary fonn. Food frequencies weredichotomized either at the median of the frequency distribution or according to the presence or absence of thefood during the respective time interval. Factor covariateswere dichotomized at the median of the sample distribution. Odds ratios were adjusted for socia-economic status(SES) which was a scaled variable assessing the number of
different types of key material possessions owned. The finalscale included eight items (in currently usable condition):(a) flashlights (1+), (b) watch (1+), (c) cycle (1+), (d)annoire (1+), (e) beds (2+), (f) rooms in the house (2+), (g)a roof made with tile or cement, and (h) irrigation pumpset.The Cronbach's alpha (Cronbach, 1951) for this scale was0.78, indicating acceptable scale reliability, with a meanscore of 3. Those households having a scale score equal orgreater to the mean (3.0) were classified as having a higherSES (a value of I in regression equation), those below themean were classified as of lower status (value of 0).
Results
Background infonnationTable 1 presents a comparison of basic demographicindicators in study households. There were no significantdifferences between the mothers of case and control children in tenns of age, number of children born alive,paternal education and household size. There appears tobe a trend for more child death in case than controlhouseholds (P < 0.10). Control child mothers tended tohave greater amounts of education than case child mothers(P < 0.1 0), although the average number of years was muchless than one year for both groups. There were four households where the father of the focus child was not living, allof which are case households. More control households(27.0%) consisted of two or more families living togetherthan case households (9.8%). There were no significantdifferences between case and control households in termsof religion or caste.
Sources ofadvice and decision-making regarding infantfeedingMothers reported themselves and their mothers-in-law asthe decision·makers regarding infant feeding, but theresponses varied by case status. Mothers of cases reportedthemselves as the primary decision-maker (39% vs 26%,P < 0.10), while more control mothers relied on theirmothers-in-law (35% vs 26%, P> 0.10). This distribution
Table 1 Basic demographics of case and control households (11=78 case-control pairs)
Characteristics Case COlltrol P-yalue
x SE x SE
Maternal age (y) 28.9 0.58 28.8 0.62 0.960Paternal age (y) 33.7 0.75 33.8 0.78 0.920Nwnber of children born alive' 4.68 0.23 4.62 0.23 0.615Nwnber of children who diedb 1.01 0.13 0.86 0.16 0.078Maternal education (yy 0.05 0.05 0,33 0.l4 0.053Paternal education (y)d 1.71 0.31 3.04 0.44 0.188Household size" 6.80 0.28 7.55 0.31 0.336
% II % II P-yalue
ReligionHindu 97.4% 76 93.6% 73 0.440Muslim/Buddhist 2.6% 2 6.4% 5
Hindu castefhigh (Brahmin) 4.0% 3 5.6% 4middle (ChhetriNiasya) 78.4% 58 80.6% 58 0.810low (Sudra) 17.6% 13 13.9% 10
'r: 3 or less ys 4+ live children.bXZ: 0 ys I+ dead children.cX2
; 0 ys I+ years of mother's education.d.r: 1 or less ys 2+ years of father's education.·X2: 6 or less YS 7+ household members.fOf the 149 Hindu households, caste infonnation was unavailable for I case and 2 control households.

is consistent with the greater likelihood of control households being part of joint or extended households. Almost aquarter of the mothers reported that their husbands madethe infant feeding decisions.
When asked to identify their main advisors in infantfeeding, the most common responses were a neighbor(45%) or mother-in-law (32%). Mothers of cases weresignificantly more likely to report that they learned aboutinfant feeding from their mother (15% vs 5%, P < 0.05) orwere selfwtaught (8% vs 1%, P < 0.05), although thesenumbers are small.
Patterns of early feedingBreast-feeding was evident for almost all focus childrenand their younger siblings throughout the first two years oflife. Half of the study mothers reported giving their childcolostrum, with no significant differences between casesand controls. More than 40% of study mothers fed theirchildren colostrum because they claimed that they "did notknow not to feed it to the child," while less than 5% ofmothers gave colostrum for its health benefits. Of the 50%ofmothers who reported not feeding their infant colostrum,half said others had told them not to feed it to their infant(25%). Some believed that colostrum was dirty (13%) andothers thought that it caused the baby to have diarrhea(6%). Mothers of cases were significantly more likely thanthose of controls to report that they had avoided givingtheir child colostrum due to the fear it would causevomiting (10% vs 1%). Although many mothers reportednot feeding their infant colostrum, they also reported somebreast-feeding of the child during the first three days oflifewhich may indicate that many mothers feed their infantscolostrum when they think they do not.
A majority of mothers (>85%) reported introduction offoods after six months of age. Early supplemental foods
In!anI feeding practlces in Nepali ,hildrenJGittelsoon et aJ
include a variety of adult meal foods, such as rice, vegetables, or fruits, however, the frequency of consumptionwas low (3 times per month). Regular consumption of thesefoods were reported in the second year of life.
Frequency offeeding of individual foodsTable 2 compares differences in feeding 21 different foodsbetween case and control children in their first two years oflife. Preformed vitamin A sources consumed during infancywere strongly associated with reduction of risk for xerophthalmia in later preschool years. Consumption of anymeat (usually with some liver) in the first two years of lifewas associated with a 91% reduction in risk (OR=0.09,CI = 0.0 I-D.70) of xerophthalmia. Consumption of fish(usually in small amounts) was associated with a 59%reduction in risk (OR= 0.41, CI = O.17-D.99) for xerophthalmia. Of the various carotenoid sources considered,only mango intake was associated with significant protection against subsequent xerophthalmia (OR = 0.28,CI = 0.13-0.61), whereas dark green leafy vegetables(DGLV) intake was not (OR = 1.32, CI = 0.65-2.66). Consumption of animal milk was also greater in control housewholds (OR =0.56) although the confidence intervalsincluded unity. Foods low in vitamin A content were notassociated with significant differences in risk between caseand control children.
Analyses comparing the infant feeding pattern of focuschildren with that of their younger siblings (age 24+months at time of interview) shows remarkable conformityin the pattern of feeding (Table 3). As would be expected,the infant histories of younger siblings is highly correlatedwith that of their older counterparts in the same household.This finding is supported by correlations in sibling's frequency of consumption of specific, vitamin-A rich fooditems. Preformed vitamin A foods exhibited high correla-
487
(/
Table :% Case-control differences in frequency" offeeding of21 key foods over first 24 monthsb (n = 78 age-matched case-control pairs)
Food consumption Cases Controls AdjustedC Odds Ratios(%) (%) (95% Cl)
Vitamin A sourcesMother's milk (0-24) daily 100 97Meat (2-24) ever 85 97 0.09 (0.01-{1.70)dFish (7-24) ever 69 82 0.41 (0. I7-O.99)dMango (7-24) infrequently 37 64 0.28 (0. 13-0.6O)dAnimal milk (0-24) infrequently 40 51 0.55 (0.26-1.15)DGLVs (7-24) infrequently 40 35 1.29 (0.64-2.59)Papaya (7-24) infrequently 29 29 1.00 (0.49--2.05)Other breast milk (0-24) ever 26 23 1.22 (0.51-2,95)Eggs (7-24) infrequently 3 13 OJI (0,0I-O.88)dMalt drink (7-24) ever 3 4 0.67 (0.11-3.99)Powdered milk (0-24) ever 3 4 0.50 (0.05-5,51)
Non-vitamin A sourcesSweet potato-white (7-24) ever 91 95 0.57 (0.17~1.95)
Rice and dal (7-24) regularly 69 72 0.88 (0.43--1.79)Other vegetables (7-24) regularly 64 60 1.25 (0.59--2.67)Traditional tonic (2-24) ever 51 46 1.24 (0.65-2.34)Watery rice dat mix (7-24) infrequently 56 60 0.83 (0.42-1.65)Unleavened wheat bread (7-24) regularly 45 46 0.93 (0.44-1.98)Honey (0-24) infrequently 42 37 1.25 (0.65-2.41)Banana (7-24) infrequently 38 36 1.13 (0.57-2.21)Glucose water (7-24) ever 14 10 1.43 (0.54-3,75)Broth (7-24) ever 12 13 0.86 (0.29--2.55)
"Infrequent consumption over the specified time period refers to >once a month to 2 times/week; regularconsumption refers to 3 or more times per week.bThe period for which any specific food was eaten is designated as months in the 0 since many foods were notintroduced until the seventh month."Odds ratios are adjusted for SES.dp < 0.05.

Infant feelling practices in Nepali childrenJGilteJsohn et al
"Only younger siblings age >24 months at time of interview used.
Table 3 Correlations in siblings' feeding patterns and reportedfrequency of conswnption of selected food items (1/ = 67 focus child andyounger sibling pairs")
Month 1 feeding patternsOnly one factor was extracted for this time period. Most ofthe 21 foods were not included in the factor as they were
tions in reported two-year consumption frequenciesbetween siblings. Carotenoid sources were somewhat lessconsistently correlated, perhaps reflecting the influence ofseasonal variability in their availability.
Months 2-6 feeding patternsTwo factors were extracted for months 2-6. The first factor,labeled 'side dishes' includes vegetable dishes and meatdishes. In the 2-6 month age period. side dishes areoccasionally given to small children to taste. Of thosechildren who reportedly received these foods at this age,all were fed rarely or just to taste. The second factor,labeled 'snacks' includes sweet potatoes and honey. Abouta third of the infants reportedly received honey at leastoccasionally during this time period and a few received itonce a week or so. No differences were observed between
never given to such young infants. Breastmilk does notappear in the factor because all children received it severaltimes daily. The factor, labeled 'other milks,' consists ofother women's breastmilk, animal milk and honey. Nodifferences were observed between case and control chil·dren in the frequency of feeding for this scale.
"Odds ratios adjusted for SES (as determined by material possessionsscore).bp<0.05.
Table 5 Adjusted" matched-pair odds ratios for xerophthalmia based oninfant feeding patterns (factors) (n = 78 matched case-control pairs)
Age period Factors Adjusted 95%CIodds ratio
0-1 month Other milks 1.17 (0.75-1.83)2-6 months Side dishes 1.23 (0.72-2.09)
Snacks 1.46 (0.71-3.02)7-12 months Regular meal items 1.09 (0.6&-1.74)
Snacks 1.15 (0.7~1.75)
Powdered supplement 0.S7 (0,4~1.65)
Sick foods 0.78 (0.42-1.45)13-24 months Infant foods 0.58 (0.1~2.07)
Animal flesh 0.43 (0.2Q-O.94)bRegular meal items 0.75 (0.43-1.27)
0-24 months Regular meal items 0.94 (0.59-1.51)Breastmilk 2.77 (0.65-11.71)Animal flesh 0.57 (0.35-0.92lSick foods 0.95 (0.55-1.64)
0.00020.00040.04540.00010.10200.04640.0784
0.00010.00640.2687
0.00140.00120.00130.00010.00010.0001
0.540.330.14
0.440.420.250.450.200.240.22
0.380.390.380.660.500.53
Correlalioll between siblillgs
Speannan 's rallk corre/atioll P value
Specific food items
Prefonned vitamin A sourcesMeatFishTraditional tonicAnimal milkOther breast milkEggs
Carotenoid sourcesMangoDGLVsPapaya
Non-vitamin A foodsSweet potato (white)Rice and dalOther vegetablesWatery rice and dal mixUnleavened wheat breadHoneyBanana
Results offactor analysisThe infant feeding patterns identified in this study usingfactor analysis are presented in Table 4. Factors wereextracted separately for month 1, months 2-5, months 712, months 13-24 and a1124 months. Case-control comparisons of these feeding patterns are swnmarized in Table 5.
Table 4 Exploratory factor analysis results for infant feeding patterns (11 = 156 case and control focus children)
Age ofillfant Factor 1 Factor 2 Factor 3 Factor 4
I month Other milks:Other breastmilk,Animal milk,Honey
2--6 months Side dishes: Snacks:Vegetable dishes, Sweet potatoes,Meat dishes Honey
7-12 months Regular meal items: Snacks: Powdered supplements: Sick foods:Wheat bread, Broth, Glucose water, Malt drink,Vegetable dishes, Mango Powdered milk EggsDGLVs,Rice and dal,Sweet potatoes,Meat dishes
13-24 months Infant foods: Animal flesh: Regular meal items:Breastmilk Meat, Papaya,Vegetable dishes, Fish Wheat bread,Not powdered milk Animal milk,
DGLVs,Water rice dal mix
1-24 months Regular meal items: Breastmilk: Animal flesh: Sick foods:DGLVs, Breastmilk, Meat, Malt drink,Vegetable dishes, Not powdered milk Fish Traditional tonicsPapaya,Watery rice dal mix,Broth,Wheat bread

case and control children in the frequency of feeding foreither of these scales.
Months 7-12 feeding patternsFour factors were extracted for months 7-12. The firstfactor, labeled 'regular meal items' includes unleavenedwheat bread, vegetable dishes, dark green leafy vegetables,rice and dal (mixed together), sweet potatoes and meatdishes. Most of these foods were given rarely or to taste toinfants in this age group. The exception was rice and dal:over 70% of infants received the staple meal regularly.
The three other factors extracted include: 'snacks' (brothand mango), usually given only rarely or to taste; 'powdered supplements' (glucose water and powdered milk),and 'sick foods' (malt drink and eggs). No significantdifferences were observed between cases and control forany of these patterns.
Months 13-24 feeding patternsThree factors were extracted for months 13-24. The firstfactor, labeled 'infant foods', includes breastmilk, vegetable dishes and no powdered milk. In the second year, mostinfants (98.7%) are still being breast~fed regularly. Thesecond factor, 'animal flesh' includes meat and fish (including liver). Over 90% of study children reportedly receivedthese foods during the second year of life-tbe majority ofthem infrequently. The third factor, labeled 'regular mealitems' includes papaya, roti, animal milk, DGLVs andwatery rice-dal mix. Significant differences between casesand controls were observed for the 'animal flesh' intakewhich was associated with a 57% reduction in risk forxerophthalmia for this age group (OR =0.43, CI:= 0.200.94).
Overall feeding patterns in first two yearsWhen all infant feeding periods are combined (weighted forduration), four factors were extracted, including (I) 'regular meal items' (DGLVs, vegetable dishes, papaya, wateryrice dal mix, broth, unleavened wheat bread), (2) 'breastmilk' (breastmilk, no powdered milk), (3) 'animal flesh'(meat and fish), and (4) 'sick foods' (malt drink andtraditional tonics). As in the 13-24 month age group, theonly significant infant feeding pattern differentiatingbetween cases and controls is the 'animal flesh' pattern.More frequent feeding of these foods was associated withan odds ratio of 0.57 (CI =0.36-0.92).
Discussion and conclusions
Households where there is at least one xerophthalmic childhave been shown to live in relatively greater poverty, withless land and fewer material possessions (Cohen, 1985;Khatry et aI, 1995). Within these households, more thanone household member may be at risk, including themother (Katz et aI, 1995) and other siblings (Katz et aI,1993). Dietary behaviors (those low in vitamin A-rich foodsources) during infancy may be a contributing factor toclinical deficiency by early childhood. From these data itappears that feeding patterns during infancy, as early asseven months, are associated with children's risk of developing xerophthalmia later in the preschool years. Thisrelationship is primarily related to the feeding of preformedvitamin A sources, namely meat and fish, both usually withliver. While these foods are given to infants in very smallquantities, consumption of these foods may be indicative ofa diet that is of better nutrient quality, enough to swing the
Infant feeding practi~s in Nepali (hildrenJGittelsohn et at
balance away from clinical manifestations of VAD later inlife. These results are evident despite the problems inherentto conducting a recall of feeding behaviors of two to fiveyears in the past.
Distinct patterns in the feeding of infants can be identified in this population. These patterns may be generallydivided into five main clusters of foods: milks, regular mealitems, sick foods, animal flesh and snacks. The foods thatmake up these food groups vary by age of the infant. Veryfew of these patterns appear to differentiate betweenxerophthalmic children and their non-xerophthalmicpeers. Further work needs to be done to ascertain thevalue of these categories of infant diet in terms of theireffect On other health outcomes.
On the other hand, describing these food groupingsappear to be helpful in identifying the different stages ofthe infant feeding process in this setting. In the first sixmonths of life, most children are primarily breast-fed, andthere are very few other food clusters of importance. Thetwo major groups that exist are limited to infrequent tastingof certain food items and side dishes. Feeding of regularmeal items does not appear to be important until the 7-12month age period. Here, the early 'side dishes' factorbroadens to include staples, DGLVs and potatoes, and thecomposition of snacks evolves as well. Two other important food groups appear to come into play: powderedsupplements and foods given especially to sick children.Both of these food groups are noted by parents as remediesto children who experience greater morbidity due to theintroduction of weaning foods.
There is relatively little variation in feeding during thefirst year of life as nearly all children are breast-fed;mother's tend to report not feeding colostrum; 85% arereputed to have been exclusively breast-fed over months 2~
6 and 11.5% have only one additional food item. Thesefindings are in accordance with other ethnographic studiesconducted with women in this part of NepaL Reissland &Burghart (1988) found a universal discarding of colostrumby Maithili-speaking mothers living in Janakpur. Whilehalf of our mothers reportedly avoided giving their infantcolostrum, the other half did not, indicating a differencebetween belief and stated behavior in this population.
Significant variation in feeding patterns begins duringthe second year of life, when the child begins consumingsmall portions of the household meaL Based on a one-timeremote recall of early infant diet, our findings indicate thatconsumption of preformed vitamin A foods, particularlymeat (with liver), is important in differentiating later risk ofxerophthalmia. Although direct comparisons between pastinfant diet and present childhood diet (which were obtainedusing four 7 d food frequencies of the preschool aged child)(Shankar et aI, 1996) are not possible due to differences inthe data collection methods used, it appears that this dietarypattern continues to distinguish case from control childrenthroughout early childhood.
Many studies have shown that current or recent diet ofchildren with xerophthalmia is low in vitamin A-rich foodswhen compared to non-xerophthalmic, similar aged children. Our study indicates that, in this setting, dietary riskfactors for xerophthalmia in young children extend backinto the infant feeding period.
These findings suggest that efforts to improve the dietaryquality of young children should extend to infants in areasof high risk of VAD. In rural Nepal, early infant dietaryintake of vitamin A-rich foods cannot be said to be directlyresponsible for later childhood xerophthalmia, but do
489
I~

490
Infant feeding pra~ices in Nepali cltildrenJ Giltelsohn at al
appear to indicate greater risk for childhood diets that aredeficient in vitamin A. The evidence from our study andothers strongly suggest that in households with at least onexerophthalmic preschool aged child, nutrition interventionprograms should be inclusive of infants and other young(prexerophthalmic) children. Appropriate dietary strategiesshould target all infants and children in high-risk households.
References
Barker ME. McClean sr, Thompson KA & Reid NG (1990): Dietarybehaviors and sociocultural demographics in Northern Ireland. Br. J.Nutr. 64, 319-329.
Blankhart DM (1967): Individual intake of food in young children inrelation to malnutrition and night blindness. Trap. Geogr. Med. 19,144-153,
Cohen N, Rahman H, Sprague J, Julil MA, Leemhuis de Reg! E & Mitra M(t985): Prevalence and determinants of nutritional blindness in Bangladeshi children. World Health Stat. Q. 38,317-330.
Cronbach U (1951): Coefficient alpha and the internal structure of tests.Psychometrika 16, 297-334.
Dettwyler KA & Fishman C (1992): Infant feeding practices and growth.Ann. Rev. Anthr, 21, 171-204.
Gittelsohn J (1989): Intrahousehold Food Distribution in Rural Nepal.Doctoral Dissertation, University of Connecticut, Ann Arbor: University Microfilms.
Gittelsohn J (1991): Opening the box: lntrahousehold food distribution inrural Nepal. Soc. Sci. Med. 33, 1141-1154.
Graves PL (1984): Infantundemutrition in a Nepali village: Behaviors andbeliefs. J. Trap. Pediatr. 30, 176-184.
Hatcher L (1994): A Step-by-Step Approach to Using the SAS System/orFactor Analysis and Structural Equation Modeling, S5 Institute Inc,Cary, NC,
Katz J, Zeger SL, West JrKP, Tielsch 1M & Sommer A (1993): Clusteringor xerophthalmia within households and villages. Int. J. Epidemiol. 22,1709-17l5,
Katz J, Khatry SK, West KP. Jr., Humphrey m, LeClerq SC, Pradhan EK,Pohkrel RP & Sommer A (1995): Night blindness is prevalent duringpregnancy and lactation in ruml Nepal. J, Nutr. 125, 2122-2127.
Khatry SK, West Jr KP, Katz J, LeClerq SC, Pradhan EK, WU LS, ThapaMD & Pokhrel RP (1995): Epidemiology of xerophthalmia in Nepal: apattern of household poverty, childhood illness and mortality, Arch.Ophthalmol. 113, 425-429.
Krantz ME (1979): The relationship of children's circumstances to nutritional problems as observed in Lalitpur district, Nepal Community
Health Program, Lalitpur. Presented: NMA International Year of theChild Seminar on 'The child in Nepal,' Kathmandu, Nepal. In The Childin Nepal, ed. MR Baral, Nepal Medical Association, Kathmandu:Cbamundra Press.
Levine N (1987): Differential child care in three Tibetan communities.Pop. Dev. Rev. 13,281-304.
Mele L, West Jr KP, Kusdiono AP, Nendrawati H, Tilden RL, Tarwotjo r& the Aceh Study Group. (1991): Nutritional and household risk factorsfor xerophthalmia in Aceh, Indonesia: a case-control study. Am. 1. CUn.Nutr. 53, 1460-1465.
Murphy SP. Calloway DH & Beaton GH (1995): Schoolchildren havesimilar predicted prevalences of inadequate intakes as toddlers invillage populations in Egypt, Kenya and Mexico. Eur. J. Clin. Nutr.49, 647--657.
Panter-Brick C (1991): Lactation, birth spacing and maternal work loadsamong two castes in rural Nepal. 1. Biosoc, Sci. 23, 137-154.
Pepping F, Van der Giezen A, De Jong K & West C (1989): Foodconsumption of children with and without xerophthalmia in ruralTanzania. Trap. Geogr. Med. 41, 14--21.
Randall E. Marshall JR, Graham S & Brame J (1990): Patterns in food useand their association with nutrient intakes. Am. J. CUn. Nutr. 52, 739745.
Reissland N & Burghart R (1988): The quality nf mother's milk and thehealth of her child: Beliefs and practices of the women of Mithila. Soc.Sci. Med. 27,461-469.
Schwerin HS, Stanton JL, Smith JL, Riley, Jr AM & Brett BE (1982):Food, eating habits. and health: a further examination of the relationshipbetween food eating patterns and nutritional health, Am. J. CUn. Nutr.35, 1319-1325.
Shankar AV, West KP, Gittelsohn J, Katz J & Pradhan R (1996): Chroniclow intake of vitamin A·rich foods in households with xerophthalmicchildren: A case-control study in Nepal. Am. J. CUn. Nutr. 64,242-248.
Solon FS, Popkin 8M, Fernandez TL & Latham MC (1978): Vitamin Adeficiency in the Philippines: a study of xerophthalmia in Cebu. Am. J.Clin. Nutr. 31, 360-368.
Sommer A (1982) Nutritional Blindness: Xerophthalmia and Keratomalacia. New York. NY: Oxford University Press.
Sommer A & West Jr KP (1996): Vitamin A Deficiency: Health, Survivaland Vision. New York, NY: Oxford University Press.
Tarwotjo 1, Sommer A, Soegiharto T, Susanto D & Muhilal (1982):Dietary practices and xerophthalmia among Indonesian children. Am.J. CUn. Nutr. 35, 574--581.
West KP Jr, Chirambo MC. Katz J, Sommer A & Malawi Survey Group(1986): Breastfeeding, weaning patterns and the risk of xerophthalmiain southern Malawi. Am. J. Clin. Nutr. 44, 69(}-{)97.
Zeitlin MF & Ahmed NU (1995): Nutritional correlates of frequency andlength ofbreast-feeds in rural Bangladesh. Early Hum. Dev, 41, 97-110.
(elusively
1 pediatr
,..Ii
!lELSEVIER
Nutrition ReseatdI. \bl. 17. No.5. pp. 7SS-796. 1997Copyriahl C 1997 Elsevier Sci_Inc.Prinllld in the USA. All righrs rt5CI'Vtd
0271.5317197 S17.llO+.00
PH S0271.5317(97)00048.1
-
tildren of
the Gulf
lactation•Paediatr
utritional
'f
,d (1944-
';30:250-
12-130.
et Assoc
i9;2:436-
Edition,
velopingJ Nutr
on child
triODS of~efugees'
VlTAMIN A DEFICIENCY AMONG FORMER AND CURRENT INJECTINGDRUG USERS IN BRONX. NEW YORK
Barbara L.Greenberg, MSc PhD·,' Richard D. Semba, MPH MD2, Ellie E.Schoenbaum. M03• Robert S. Klein MO)
1AIDS Research Program,Department of Epidemiology and Social Medicine,Montefiore Medical Center!Albert Einstein College of Medicine. Bronx. New York.~pattment of Ophthalmology. Johns Hopkins School of Medicine, Baltimore,Maryland. ]AIDS Research Program,Department of Epidemiology and SocialMedicine, and Department of Medicine, Montefiore Medical center!Albert EinsteinCollege of Medicine, Bronx. New York.
ABSTRACT
The prevalence of vitamin A deficiency was studied cross-sectionally in 135HIV-infected and 45 HIV~uninfected high risk former and current injectingdrug users (lDUs) in the Bronx. New York. Vitamin A levels were similar byserostatus: 35% (47/135) of HIV-seropositive and 33% (15!45) of HIVseronegative subjects had serum vitamin A levels consistent with deficiency« 1.05 JimoVL); 17% HIV-seropositive and 11 % HIV~seronegative subjectshad severe vitamin A deficiency «0.70 I£moJlL). Among the HIVseropositive subjects women were significantly more likely to be vitamin Adeficient (29%. 27/92 of males versus 40%, 17/43 of females, p=O.05).Median serum vitamin A was associated with CD4+ levels previously found tobe prognostic of disease progression in this cohort; O.811£mo1fL versus 1.19I£mollL for < 150 and ~ 150 cells/mm) respectively, p= 0.02. Serum vitaminA levels were significantly associated with hemoglobin levels in HIV- infectedindividuals only (Mantel Haenszel trend. p=O.05). Further study of vitamin Adeficiency and infectious disease morbidity in HIV-infected and uninfectedhigh risk IDUs may be warranted given the high prevalence of yitamin Adeficiency among this cohort of IDUs and the association of vitamin A withinfectious disease morbidity.o lmElr_Sc:lcncoolno.
Key Words: Vitamin A deficiency, Injecting Drug Use, HIV infection
·Corresponding Author: Dr. Barbara L. Greenberg, Montefiore Medical Center, AIDSResearch Program, 111 East 210th Street, Bronx., New York 10467.
785
BESTAVAILABLE qqpy

786 B.L. GREENBERG et al.
lI
" jI(
i".I1
: .
: "'.
INTRODUCTION
Vitamin A is an essential micronutrient for immunity, growth, reproduction,maintenance of epithelial surfaces and vision (1). Among the micronutrients, vitamin A playsa central role in nonnaI immune function (2), and vitamin A deficiency has long beenassociated with infections and increased morbidity and mortality (3-7). Vitamin A deficiencyis characterized by a wide variety of immune alterations, including loss of CD4+ T-cellsfrom lymph nodes and periph.eral circulation, and impaired antibody responses (2,8,9).Characteristics of HIV infection are loss of circulating CD4+ T-cells and impaired antibodyresponses (8-9). These immune abnormalities have also been reported in IDUs without HIVinfection(10). Vitamin A deficiency may be of particular impcrtance i.~ H!V i.'1fectionbecause the occurrence of the two conditions may be additive or synergistic in causingimmunodeficiency with the potential for more severe clinical out.eome.
Vitamin A deficiency has been reported in various populations in the United Statesinfected with HIV, including homosexual men and injection drug users (lDUs)(ll-lS). Thereported prevalence of vitamin A deficiency varies, ranging from 11 %-29% with the higherrates in studies of patients with AIDS or AIDS related complex. Vitamin A deficiency basbeen reported to occur in approximately 15 % of HIV-infected injection drug users inBaltimore, Maryland (16). We conducted a cross-sectional study. to determine the extent ofvitamin A deficiency among HIV-infected and HIV- uninfected IDUs in the Bronx, NewYorlc. City.
MEUIODS
The study sample was selected from mus who are participating in an ongoinglongitudinal study of the natural history of HIV infection in current and former injecting drugusers attending a methadone maintenance program in the Bronx, New York. In January1994, a random sample of 135 mv seropositive and 4S mv seronegative subjects withresearch visits in the previous 18 months was selected for this cross-sectional study. Pregnantwomen were excluded from the present study based on self lq)C)rt data. .
Methods for the ongoing longitudinal study have been previously described (17). Inshort, bi-annual research visits are scheduled at which time standardized intcl'views areadministered (including drug use and medical histories). physical examinations andphlebotomy are performed. Laboratory analysis includes HIV-I antibody testing by enzymeimmunoassay (EIA) with confirmatory testing by Western Blot (Abbott Laboratories. NorthChicago, Illinois; DuPont, Wilmington Delaware, USA). Complete blood counts andlymphocyte subset analyses are perfonned at the New York Blood Center (New York City.New York, USA).
Data collected as part of the ongoing longitudinal study and used for the presentanalysis included CD4+ and CD8+ cell counts per mm', hemoglobin (hgb) levels, drug use(heroin. cocaine, alcohol) and injection history in the six months prior to the date of theblood specimen, methadone dose, age, zidovudine use, height and weight at the time of theblood specimen and clinical disease status. Symptomatic status is defined as dianhca or fever
for greaterthan five pc:definition ([kilograms]using stand
" visit storedwere me3S1
monitoredTechnolog;
Vit<0.70 I'mwas definedefined ascategorize:CD4+cellconditionsboth CD4"
DaUSA). Un(24). Muanemia anconfoundi
MIthe final t
the modelchi-squareOR of vapresentedtailed wit
ApresentsCharacteIsignifiC3ldifferenc
~
inc1udinlvitamindose. TIand no (highest
-----------_J,. ....Jr'

VITAMIN A AND DRUGS 787
-n,nin A playsbeendeficiencyT-cells
,8,9).l antibodytltout HI\'tionISing
:d States-IS). The •the high!rency has:inextent of:, New
lingiceting drug:tuary; with,. Pregnant
(17). In; aIC
renzyme=s, Northnd)rk City,
=sentlruguse)f thelC of the:a or fever
for greater than two weeks or unintentional weight loss (not attributed to drug use) of morethan five pounds. AIDS was defined according to the 1987 Centers for Disease Controldefinition (18). Body mass index (BMl) was calculated (Quete1et)(19) as weight(kilograms]/hcight1 [meters) and converted to BMI percentiles by age for males and femalesusing standard anthropometric charts (20). serum specimens from the subjects' most recentvisit stored at -7rrc were retrieved for vitamin A measurements. Serum vitamin A levelswere measured using high-performance liquid chrornatogt2phy (21), and quality control wasmonitored with vitamin A refcrenc:c standards from the National Institute of Standards andTechnology (Gaithersburg, Md, USA ).
Vitamin A levels were categorized similarly to other studies and were as follows:<0.70 pmoUL, 0.70-1.04 pmoUL, 1.05-1.39 pmoVL and ~ 1.40 p moUL (16). Deficiencywas defined at < 1.05 .umoVL and severe deficienc.y ~t <0.70 J,LmollL (22). Low 11gb 'A'aS
defined as < 13.51 dL for males and <12.5 g1dL for females. CD4+ cell count wascategorized as <200, 2()()..SOO and >500 cells/mm'. As previous work in our cohort foundCD4+ cell counts of <150 cellsImmJ to be prognostic of AIDS defining clinicalconditions(23), we examined the association of vitamin A levels and CD4+ cell count usingboth CD4+ cell count above and below 200 and above and below 150 cells/mm'.
Data analysis was performed using SAS (SAS Institute, Inc. Cary, North CarolinaUSA). Univariate tests of association were performed using chi square or Fisher's exact test(24). Multivariate logistic regression was used to evaluate the association of vitamin A andanemia and to examine vitamin A deficiency as the dependent variable. Interaction andconfounding effects were evaluated (24).
Modeling was accomplished by backwards stepwise regression. Variables selected forthe final model were based on the likelihood ratio statistic (LRS), i.e., twice the change inthe model likelihood. Criteria for inclusion in the fmal model was a LRS with a significantchi~square for the corresponding degrees of freedom Le., ~3.8 for 1 d f, or a change in theOR of variables in the model of more than 10%. The adjusted odds ratios (OR..t;) arepresented with the corresponding 95% confidence intervals (95% CI). All tests were twotailed with Qt =0.05.
RESULTS
A total of 135 mV-infected and 45 mv-uninfected IDUs were evaluated. Table 1presents the distribution by mv serostatus for demographic, drug history and clinicalcharacteristics. A significantly lower proportion of the seropositive subjects were females. Asignificantly greater proportion of the seropositive subjects used cocaine while there was nodifference in alcohol or injection use.
No SUbject reported a history of chronic fever during the six months prior to andincluding the time of blood drawing. To assess whether methadone was affecting serumvitamin A levels, we examined the relationship between serum vitamin A and methadonedose. There was no evidence of a relationship between vitamin A levels and methadone doseand no difference in vitamin A deficiency or median vitamin A levels between the lowest andhighest methadone dose categories (data not presented).
Serum vitamin A levels did not differ significantly by HIV serostatus. At least one
BEST AVAILABLE COpy

788 B.L GREENBERG at al.
~A~
third of both the mv seropositive and HIV seronegative subjects had vitamin A deficiency(< 1.05~moUL). Seventeen percent of the mv seropositive subjects and 11% of the HIVseronegative subjects had severe vitamin A deficiency «0.70 JlrnoVL). (See table 1)
Table 2 shows the percentage of viain A deficient individuals by HIV sc:rostatus.for demographic, drug history and clinical characteristics. Among HlV Seropositive subjects.females were significantly more likely to be vitamin A deficient (p=O.OS); median vitamin Alevels were 1.11 I&mollL for women and 1.29 pnollL for men, p=O.06. There was nodifference in vitamin A levels between those subjects with <200 and ~200 cells/mm3•
Median serum vitamin A was significantly lower for those with CD4+ < ISO celIsImm'compared to those with CD4+ ~ 150 ceUslmm3
, a level previously found to be prognostic inour cohort (0.81 JlmoIJL versus 1.19 I£moIIL for <150 iUid ~ ISO cclWmm ~vely,
p=O.02). Vitamin A deficiency was present among 37% of asjmptomatic patients, 28% ofsymptomatic patients, and 30% of AIDS patients. Mean hgb was significantly lower in thevitamin A deficient individuals(12.4 gldL versus 13.0 g1dLrespectively. p-O.04). Figure 1shows the relationship between vitamin A levels and low hgb among the mv seropositivesubjects. Among those with the lowest vitamin A levels, 68% were anemic compared to 41 %in the highest vitamin A category.
Among HIV-seronegative subjects, femaIes also tended to be more vitamin A deficient(p=O.08). Vitamin A levels were lower, albeit not significantly so. for HIV seronegativewomen compared to men (median vitamin A of 1.03 IlmollL for women compared to 1.27IlmollL for men, p=O.2S). Fifty -seven percent of the mv seronegative women had vitaminA deficiency compared to 29 % of the men. The lack of statistical significance is likely due tothe small sample size and inadequate power. Vitamin A deficiency was not associated withlow hgb among the mv seronegative individuals.
Multivariate
Among the HIV seropositive individuals female gender was independently associatedwith vitamin A deficiency after controlling for BMI, CD4+ cell count and age (OR...; 1.84;95% CI 1.16-2.93). Table 3 presents the OR...; and 95% CIs for the final model. Resultswere similar using CD4+ cell count categorized as <150 and ~ 150 cells/mm) or CD4+
categories « 200,20Q-499 and 2:500 cellslm3• Among the mv seronegative subjects. a
multivariate analysis that included BMI. drug history and age revealed no statisticallysignificant independent associations with vitamin A deficiency (data not shown). There weretoo few women to include gender in the analysis.
DISCUSSION
In the present study I 35 % of the mv seropositive subjects and 33% of the HIVseronegative subjects had vitamin A deficiency. The prevalence of vitamin A deficiency inour HIV-infected subjects is notably higher than the 15% reported by Semba et al in anothersample of HIV-infected IDUs in Baltimore, Maryland (16). Other studies in HJV-infectedindividuals with diverse risk behaviors have reported the prevalence of vitamin A deficiencyranging from 11-29% (11-15). The higher rates were reported in study samples consisting ofpatients with more advanced stages of mv disease, those with AIDS or AIDS relatedcomplex (13). One study that included mv seronegative homosexuals found 0% were
vitamin A (among thestudies in tIpresent in 1:reported b)
Distributio:Vitamin A
V
R
(
-------__.J.. ..,.11

VITAMIN A AND DRUGS 789
TABLE 1Distribution by Serostatus for Demographic, Drug History • Clinical ChaI3cteristics andVitamin A Levels Among IUV·Infected Injecting Drug Users
vitamin A deficient (11). Our study suggests that IOUs in the Bronx, New York City haveamong the highest prevalence of vitamin A deficiency reported in adult population basedstudies in the United States to date. Severe vitamin A deficiency « 0.70 I&moVL) waspresent in 17% of our HIV. seropositive subjects. a prevalence comparable to the 22%~ by Karter et a1 in hospitalized AIDS patients (2S). As only 30% of our subjects
RacelethnicityWhite 15(11) 9(20)Black 12( 9) 6(13)Hispanic 108(80) 30(67)
Age Group'<35 yrs 68(51) 25(56)~35 yrs 65(49) 20(44)
GenderFemale 43(32) 7(16)Male 92(68) 38(84)
Methadone Dose'<60 mg 57(42) 15(33)~ 60mg 76(57) 30(66)
Low hemoglobin" 69(51) 12(27)Serum Vitamin A
< 0.70 I&moUL 23(17) 5(11)O.7Q-1.04l&moVL 24(18) 10(22)1.05-1.39 ~moVL 39(29) 15(33)~ 1.40 I'moUL 49(36) 15(34)
Body Mass Index<25th percentile 67(50) 26(58)2S-5Oth percentile 26(19) 5(11)>50th percentile 42(31) 14(31)
Alcohol use (prior 6 mos.) 38(28) 11(24)Injection use (prior 6 mos) 43(32) 12(27)Cocaine usc (prior 6 mas) 66(49) 9(20)Cocaine or crack use (prior year) 76(56) 16(36)CD4" cell count
< 200 cells/mm' 47(35) 0200·500 cells/mm' 48(36) 0~500 cells/mm' 40(30) 45(100)
• Chi-square and Fisher's exact testII 2 subjectS are missing data··Low hemoglobin: < 13.5 g/dL males; <12.5 g/dL females
BEST AVAILABLE COpy
lciency:mv)
status•. subjects.ritamin A• nonJ•
1m'rsostic inive!y.:8% ofintheligun: 1,sitive:i to 41 %
f
deficientative01.27.vitaminly due to:iwith
ociated: 1.84;.wts)4+
ts. a
re were
[V
ICy inanotherreeted~ciency
lsting of:de
Variable N(percent)HTV+ HIV-
p value •
ns
ns
.04
ns.004
ns
nsnsns
.001
.02
<.001

·r.o • __ ~ ,_• ..:........;. '~...r'.~,.~~1lilIiij
790 B.L GREENBERG et al.
TABLE 2Proportion with Serum Vitamin A Deficiency « LOS ",moIlL) by Serostatus for
Demographic, Drug History and Clinical Characteristics Among Injecting Drug Users
Scru
Variable+ nlN (percent)lUV+ HIV-
ill
-Females were more likely to be vitunin A deficient; p=O.05 for HlV seropositive andp=O.08 for HlV negatives.
RacelethnicityWhite 4/15 (27) 3/9 (33)Black 6/12 (50) 2/6 (33)Hispa,rlic 37/108 (35) 10/30 (33)
Age Group<35 yrs 23/68 (34) 8/25 (32)0!:3S yrs 24/65 (37) 7120 (3S)
Gender-Female 20/43 (46) 4n (57)Male 27/65 (29) 11/38 (29)
Body Mass Index<25th percentile 25/67 (37) 6/26 (23)25-5Oth percentile 9/26 (35) 2/5 (40)>50th percentile 13/42 (31) 7/14 (SO)
Alcohol use(previous 6 mos.)Yes 13/38 (34) 3/11 (27)No 34/97 (3S) 12/34 (35)
Injection use(previous 6 mos.)Yes 13/43 (30) 4/12 (33)No 34/92 (37) 11/33 (33)
Cocaine use(prcvious 6 mos.)Yes 25/66 (38) 1/9 (11)No 22/69 (32) 14/36 (32)
Cocaine or crack use (previous year)Yes 29n6 (38) 4/16 (2S)No 18159 (31) 11/29 (38)
An acute phase response is unlikely to be responsible for the vitamin A deficiency inthis cohort as both mv infected and uninfected IDUs had high levels of vitamin A deficiencyand there were no reported infections at the time or in the six months prior to the vitamin Adetermination. 'Ibis study also found no evidence to suggest a relationship between specific
were symptomatic or had AIDS defining clinical conditions at the time of the serumdetermination, these data suggest that a high proportion of lUV-infected subjects in ourcohort may be vitamin A-deficient before the onset of clinical symptoms. Similar to previousstudies, women in this study population were more likely to be vitamin A deficient (1).
0-: •... ·...'.,,, '.... ..
J. . II
!." \
.; . <>.!, . ~.~. . ..~.
;ff~,;..;~ .. : I: .' 1
< /·:".:';}~~~:?'~~~~~;r~A?R~~-"~",,~,~~.. !l1i::~..~.~"""•••

VITAMIN A AND DRUGS
FIGURE 1Serum Vitamin A and Low Hemoglobin Among HIV Seropositive Injecting Drug Users
791
80
10
110
I50
<CO
30
20
10
~ 0<0.70 0.70-1.1)4 1.05-1.39
serumvitamin A (mlcromo/II.J
Corresponding number of subjects appears above each bar.Low hemoglobin: < 13.5 g/dL for males; < 12.5 g/dL for females.Mantel Haenszel trend test, p=O.OS.
TABLE 3Adjusted Odds Ratios (OR.;> and 95 % Confidence Intenrals (95% CI) of LogisticRegression for Vitamin A Deficiency Among lllV-Infectcd Injecting Drug Users
illicit drug use and vitamin deficiency. In this population, which is predominantly Hispanic,
iitive and
)Ul'
previous1).
.cy inleficiencytamin Apecific
Variable O~
GenderMen 1.00Women 1.84
Body Mass Index>50th percentile 1.00
.25th-50th percentile 1.57< 2Sth percentile 2.44
CD4+ cell count>500 ccl1s/mm3 1.002~SOO cellsImm3 0.67<200 cells/rnm3 0.81
Age Group<35 years 1.00c:3S years 1.46
(95% CI)
(1.16-2.93)
(0.52-4.75)(0.90-6.72)
(0.25-1.80)(0.32-2.04)
(0.66-3.22)
BEST AVAILABLE COpy

792 S.L GREENBERG at al.
;;j
j1I
I
:1
iI,i'IiI
'i:
inadequate dietary intake is the most likely explanation for the notably high proportion ofindividuals with vitamin A deficiency. Othet' biological mechanisms contributing to lowvitamin A levels may include high, abnormal urinary losses of vitamin A during mvinfection (26) and gener.U. hepatic depletion of vitamin A, which has been well described withinfections (27).
The importance of vitamin A lies in its role in immunity to infectious diseases which isexemplified by the well recognized relationship between vitamin A and infectious diseasemorbidity and mortality. Vitamin A is an immune enhancer and an essential co-fador in Tand lkell activation and growth (2,38-30). It also plays a major role in the maintenance ofmucosal epithelium (31) and is necessary for nonnal differentiation of hematopoietic stemcells (32). Deficiency of vitamin A is characterized by a loss of CD4+ cells (8,9) and isassociated with impaired hematopoiesis and anemia (33). Vit:uflin A supplementation trials inclinically and subclinically deficient childn:n have been associated with restored immunefunction, reduction in anemia, and reduced infectious disease morbidity and mortality (2,3436). The biological basis for the reduction in morbidity and mortality by vitamin A appearsto be immunopotentiation, which has been demonstrated in both animals and humans withnonnal and deficient vitamin A s1atUS (2,28-30,37).
In the present study, median vitamin A levels among seropositive subjects weresignificantly associated with CD4+ cell count levels previously found to be prognostic of HIVdisease progression in,our cohort « 150 versus Cl: 150 ~Uslmm). These findings corroborateprevious findings of vitamin A levels and CD4+ cell count in HIV infected IDUs (16). Ofparticular interest, is the fact that vitamin A deficiency, while marked in both HIVseropositive and seronegative subjects in our study, was associated with low hemoglobin onlyamong the HIV seropositiv:e subjects. While the association of vitamin A deficiency and lowhemoglobin is consistent with other'data (16,36,38), our finding of this association only inthe mv seropositive subjects may suggest an interaction between low vitamin A and HIVinfection. Vitamin A deficiency may contribute to nutritional anemia through impaired ironmobilization and the resulting decrease in iron available for red cell formation (38).
Injecting drug users represent an increasing proportion of the HIV·infected population.As drug use is generally associated with lower socio-economic status these individuals maybe at greater risk of micronutrient deficiency. A carefully designed study to lookprospectively at the relationship between vitamin A deficiency and infectious diseasemorbidity in lDV- infected and uninfected high risk IOUs may be warranted, particularlygiven the high prevalence of vitamin A deficiency observed in our cohort. It is possible thatthe marked degree of undernutrition and potential. metabolic alterations associated with druguse itself may promote vitamin A deficiency. Intake of fat, zinc and protein are necessary forvitamin A absorption and utiIiution (39). Co-existing deficiencies in these nutrients may alsoimpact on vitamin A levels in mv-infected individuals. Studies of specific micronutrientsand HIV disease progression suggest an association with vitamin A deficiency along withother micronutrlents(40-42). Among mv·infected IDUs serum retinol levels were associatedwith lower circulating CD4+ T-«1ls and higher mortality (16,42). Among mV-infectedhomosexuals a higher intake of vitamin A was associated with increased CD4+ T lymphocytecount (40) and moderate intakes were associated with slower progression to AIDS(41). Amore complete characterization of micronutrient deficiencies among IOUs is needed asmicronutrient supplementation might provide an inexpensive, low cost intervention to reducedisease morbidity and mortality among HIV-infected and uninfected high risk IOUs.
We~
SivapalasingarFunding Sotm(ROlDA0434'Foundation.
1. ~ommer
York. 0:
2. Semba II
3. MarkowRW. Viizaire. J
4. UsbaN.vitamin1991;1~
S. Bloem 1WHP.1and dia.1990;1:
6. Sommechildre:1095.
7. Sornmcmild v
8. SmithNutr 1
9. Semb,Somm1993;
10. Gro....dysfu'
It. BeaciSaublin as:
7.1

VITAMIN A AND DRUGS 793
'OpOrtion ofng to lowngHIVI described with
eases which isous disease~factor in Taintenance of;JOieticstem:,9) and is:ttltion trials ind immuneortality (2,34lin A appearsumans with
; were f
IgnOstiC of mv19S corroborateUs (16). OfHIV:moglobin onlyiency and lowLtion only inA and HI\'mpaired iron(38).
d population.ividuals may::>kiseascmticuIarlyi possible thatted with drug: necessary forients may alsoronutrientsl10ng withere associated'-infectedT lymphocyteIDS(41). A:eded aslion to reduceDUs.
ACKNOWLEPGEMNTS
We would like to thank Donna Buono for her programming assistance and MalathySivapalasingam for her assistance in the data collection.Funding SoUItC: National Institute of Health, National Institute of Drug Abuse(ROlDA04347); Centers For Disease Control (H64/CCH200714); Aaron DiamondFoundation.
REFERENCES
1. Sommer A, West KPIr. Vitamin A deficiency: Health, Survival, and Vision. NewYork. Oxford University Press; 1996.
2. Semba RD. Vitamin A, immunity. and infection. Clin Infect Dis 1994;19:489-499.
3. Markowitz LE, Nzilambi N, Driskell WI, Sension MG, Rovira EZ, Nieburg P, RyderRW. Vitamin A levels and mortality among hospitalized measles patients, Kinshasa,zaire. I Trap Pediatr 1989;35: 109-112.
4. Usha N, Sankaranarayanan A, Walia BNS, Ganguly NK. Assessment of preclinicalvitamin A deficiency in children with persistent diarrhea. I Pediatr Gastroent Nutr1991;13:168-175. .
S. Bloem MW, Wedel~, Egger RJ, Speck AJ, Schrijver I, Saowakontha S, SChreursWHP. Mild vitamin A deficiency and risk of respiratory tr.let diseases and diarrhea inand diarrltea in preschool and school children in northeastern Thailand. Am I Epidemiol1990;131:332-339.
6. Sommer A. Katz 1, Tarwo~o Y. Increased risk of respiratory disease and diarrhea inchildren with preexisting mild vitamin A deficiency. Am I Clin Nutr 1984;40:10901095.
7. Sommer A. Tarwatjo I, Hussaini G, Susanto D. Increased mortality in children withmild vitamin A deficiency. Lancet 1983;2:585~588.
8. Smith SM, Levy NS, Hayes CEo Impaired immunity in vitamin A-deficient mice. INutr 1987;117:857-865.
9. Semba RD, MuhiIal. Ward BI, Griffin DE, Scott AL, Natadisastra G, West KP Ir,Sommer A. Abnormal T-cell subset proportions in vitamin A-deficient children. Lancet1993;341:5-8.
10. Grown, SM, Stimmel B, Taub RN, Kochwa S, Rosenfield RE. Immunologicdysfunction in heroin addicts. Arch lot Med 1974; 134:1001.
11. Beach RS, Mant.ero-Atienza E, Shor~Posner G, Iavier 11, Szapocznik I, Morgan R,Sauberlich HE, Comwell PE, Eisdorfer C, Baum MK. Specific nutrient abnonnalitiesin asymptomatic HIV-I infection. AIDS 1992;6:701-708.
BEST AVAILA8LE copy

794 B.L. GREENBERG et at.
i
.j.t
j
I~. "
.,
12. Bogden rot Baker H, Frank 0, perez G, Kemp F, Bruening K, Louria D.Micronutrient status and human immunodeficiency virus (HIV) infection. Ann NY AcadSci 1990;587:189-195.
13. Malcolm JA, Tynan PF. Sutherland DC, Dobson p. Kelson K. Carlton I. Trace metl1and vitamin A deficiencies in AIDS. {abstract mB206}. In: Program and abstracts ofthe VI International Conference on AIDS, San Francisco, June 1990.
14. Coodley G, GiIud DE. Vitamins and minerals in HIV infection. J Gen Intern Med1991;6:412-479.
15. Baum MK, Shar-Posner G, Bonvebi P, Cassetti I, Lu Y, Mantero-Atienza E, Beach RS,Sauberlich HE. influence of HIV inf:ction on vitamin status and requirements. AnnNY Acad Sci 1992;669:165-174.
16. Semba RD, Graham NMH, caiaffa wr, Margolick lB, Clement L, VIahov D.Increased mortality associated with vitamin A deficiency during HIV-1 infection. ArchIntern Med 1993;153:2149-2154.
17. Selwyn PAt Alcabes P, Hartel, D Buono D, Schoenbaum BE, Klein RS. Friedland GH.Clinical manifestations and predictors of disease progression in drug users with humanimmunodeficiency virus infection. N Engl J Med 1992;327:1697-1703.
18. Centers for Disease Control. Supplement. Revision of the CDC SUIVcillance CaseDefinition for Acquired Immunodeficiency Syndrome. MoIbidity and Mortality WeeklyReport 1987;36(lS):4S~.
19. Bray GA. Definition, measurement, and classification of the syndromes of obesity. IntI Obesity 1978;2:99-112.
and
27. MOl:119-
28. NacDefi1981
29. GaJIE
30. Ro:Soc
3L W(J]
32. Dceel'
33. H(M<31
34. 01m(
35. S<13
36. S4Inpr
37. IiU1
38. I
'"3
40. ,
41.
39. 1I1
25. K.artef DL, Karet AI, Yanish Rt Patterson C. Hass PH, Nord I, Kislak JW. Vitamin Adeficiency in non-supplemented patients with AIDS: A cross sectional study. I AcquirImmune Defic Syndr 1995; 8:199-203.26. Jolly PE, Yang YL. Alvarez JO. Smoot TM. Vitamin A depletion in mv infection
20. Frisancho AR. Anthropometric Standards for the Assessment of Growth and NutritionalStatus. Ann Arbor: The University of Michigan Press, 1990.
21. Craft NE, Wtse SA, Soares JH Jr. Optimization of an isoc::ratic high performance liquidchromatographic sepantions of carotenoids. 1 Chromat 1992;589:171~176.
23. Alabes P, Schoenbaum BE. Klein RS. Correlates of the rate of decline of CD4+lymphocytes among injection drug users infected with the human immunodeficiencyvirus. Am J Epidemioll993; 137:989-1000.
22. Underwood BA. Methods for the assessment of vitamin A status. I Nutr 1990;120:1459-1463.
24. Kleinbaum DB, Kupper LL, Morgenstern H. Epidemiologic Research. California:Belmont Ufetime Learning Publications. 1983.
i
,II,,
.. i'. i;".j
t~lj·r·' .,...,'::i/:·'·:I
.',
. . :: ..' '. '::~:;::~~:~j;;~:':':::"
and AIDS. AIDS 1996;10: 114.
VITAMIN A AND DRUGS 795
. Acad
netallof
cd
:h RS,M
Uch
•GH.
tan
I"
=ekly
, Int
lional
iquid
):
UnAir
edon
27. Moore T. Shannan 1M. Vitamin A levels in health and disease. Brit I NutI' 1951;51:119-129.
28. Nauss KM. Influence of vitamin A status on the immune system. In: Vitamin ADeficiency And Its Control. Edited by Bauernfeind IC. Orlando: Academic Press,1986:207-243.
29. Garbe A, Buck J, Hammerting U. Retinoids are important cofactors in T cell activationI Exp Mod 1992;176:109-117.
30. Ross AC. Vitamin A status: relationship to immunity and the antibody response. ProcSoc Exp BioI Med 1992;200:303-320. .
31. Wolbach SB, Howe PRo Tissue changes following deprivation of fat-soluble A vitamin.J Exp Mod 1925;42:753-m.
32. Dauer D, Koeffler HP. Retinoic acid enhances growth of early erythroid progenitorcells in-mm. J Clin Inv 1982;69:1039-1041.
33. Hodges REt Sauberlich HE, Canham JEt Wallace DL, Rucker RB, Mejia LAtMohanram M. Hematopoietic studies in vitunin A deficiency. Am 1 Clin NutI' 1978;31:876-885.
34. Glamou PP, Mackerras DEM. Vitamin A supplementation in infectious diseases: ameta-analysis. Br ~ed 1 1993;306:366-370.
35. Sommer At West Ir KP. Vitamin A and childhood morbidity. Lancet 1992;339:13021303.
36. Semba RD, Muhilal, West KP Jr, Wmget M, Natadisastr'a G. Scott A, Sommer A., Impact of vitamin A supplementation on hematological indicators of iron metabolism and
protein status in children. Nutr Res 1992;12:469-478.
37. fJallg XL, Dillehay DL, Everson MP, T'l1den AD, Lamon EW. Potentiation of IL-2induced T cell proliferation by retinoids. Int I Imrnunopharm 1992;14:195-204.
38. Hodges REt Sauberlich HE. Canham JE, Wallace DL, Rucker RB, Mejia LA,Mohanram M. Hematopoietic studies in vitamin A deficiency. Am I Clin Nutr 1978;31:876-885.
39. Tseng Lui NS, ROOs Ok Vitamin A and Carotene. In: Modem Nutrition in Health andDisease: Part 1. The Foundations of Nuttition. Eds. Goodhart RS, Shits ME.
.Philadelphia: Leo & Febiger. 1980: 142-ltiO.
40. Abrams B, Duncan D. Hertz-Picciotto I. A prospective study of dietary intake andlaIuired immune deficiency syndrome in mv-seropositive homosexual men. 1 Acquit rImmune Defic Syndr 1993;6:949-958.
41. Tang A, Graham NMH, Kirby J, McCall LO, Willett we, Saah AJ. Dietary
BEST AVAILABLE COpy
~,...
i·····
f~?~. ..
t·-

796 S.L GREENBERG et al.
i.j
,~ .
::; ..
-~.. .' _. ~
!
II
·1;
}ir~~!1
- ..-jI
.' .... ~
micronutrient intake and risk of progression to AIDS in mv-1 infected homosexualmen. Am 1 Epidemio11993;138:931-9S1.
42. Semba RD, Caiaffa wr, Gl3Jwn NMH. Cohn S. VIahov D. Vitamin A deficiency andwasting as predictors of mortality in human immunodeficiency virus-infected drug users.J Infect Dis 1995;171:1196-1202.
Accepted for pUblication January 14, 1997.

International Journal of Epidemiology© International Epidemiological Association 1997
Vol. 26. NO.5Printed in Great Britain
Sampling Designs for XerophthalmiaPrevalence SurveysJOANNE KATZ,. STEVEN S YOON,* KARL BRENDEL" AND KEITH P WEST JR"
Katz J (Department of International Health, Johns Hopkins School of Hygiene and Public Health, Room 5515, 615N Wolfe Street, Baltimore, MD 21205-2103, USA), Yoon S S, Brendel K and West K P Jr. Sampling designs forxerophthalmia prevalence surveys. Internationat Journal of Epidemiology 1997; 26: 1041-1048.Background. The purpose of this study was to estimate the bias and design effects associated with the Expanded Program on Immunization's (EPI) sampling design when estimating xerophthalmia prevalence. and to estimate the savingsassociated with EPI in terms of distance travelled within selected clusters.Methods. Computer simulation of the EPI sampling strategy was done using maps from a xerophthalmia survey of40 wards in Sarlahi district, Nepal. Samples of fixed cluster sizes of 7, 10, 15, 20 and 25 were compared. The estimatedprevalence using the EPI design was compared with the true prevalence in the 40 wards to estimate the bias. The designeffect was estimated by taking the ratio of the variance under EPI sampling to that of stratified random sampling (SRS)with lixed cluster sizes. The EPI was also modified by increasing the distance between selected houses from nearestneighbour to skipping 1-4 houses between selected ones, The difference between the distance travelled within clustersusing SRS compared with EPI was weighed against the bias and increased variance.Results. The prevalence of xerophthalmia was 2.8%. The EPI design overestimated xerophthalmia prevalence by between 0.27% and 1.16%. The design effects of EPI cluster sampling within wards varied between 0.73 and 1.35. Neitherthe bias nor the design effect was related to distance between households or cluster size. Distance travelled within wardswas always less for EPI designs with Cluster sizes of 7 or 10. There was no saving in terms of distance travelled fordesigns with cluster sizes from 15 to 25 if there were two or more houses between selected ones. For fixed cluster sizesof 15 or fewer, the EPI sampling design using nearest or next nearest neighbours is a better choice than SRS in termsof minimizing the distance travelled and the mean square errOr.Conclusions. The choice of an optimum method would need to account for the density of clusters and difficulty of travelbetween Clusters, as well as the costs of travel within clusters. Based on certain assumptions. EPI with t5 children percluster would be favoured over examining all children in selected wards unless the travel time between wards was morethan 2 days.Keywords: sampling, survey, vitamin A deficiency, xerophthalmia, Nepal
Xerophthalmia is the leading cause of childhood blindness worldwide. I - J Children with xerophthalmia havebeen shown to be at increased risk of mortality,4 morbidity.5-1 and poor growth.R In areas where xerophthalmiais a public health problem. vitamin A supplementationwith capsules or through fortification can reduce mortality by an average of 23% and avert between one and
two million deaths annually among children aged 1-4years.9• IO A number of existing national vitamin A supplementation programmes have been given renewedurgency by these findings. while new national programmes are beginning in other countries. Althoughxerophthalmia is only the tip of the iceberg in termsof underlying subclinical vitamin A deficiency. it is arelatively easy and non-invasive way to assess whether
• Department of International Hea Ith. Johns Hopkins Sch"ol "fHygiene and Public Health. R"nm 5515. 615 N Wol fe Streel.Baltimore. MD 21205-2 W). USA.•• Independent consultant. Atlanta. GA. USA.
1041
vitamin A deficiency is a public health problem. Furthermore. a decline in xerophthalmia prevalence is oneway to measure the impact of programmes. A xerophthalmia prevalence survey can be done to assesswhether a problem exists. Such a survey can also act asa baseline from which to judge the progress of programmes through a comparison with follow-up surveys.For these purposes. ways in which to reduce the complexity. cost ami time taken to complete surveys wouldbe useful.
The Expanded Programme on Immunization (EPn of
the World Health Organization (WHO) advocatesa sampling procedure for surveys of immunizationcoverage that does not require mapping or a census ofselected clusters. I 1-19 The purpose of this procedure isto make it simple enough to be used by health workerswith minimal technical support in field settings. Theapproach has been adapted for surveys of many otherhealth outcomes such as nutritional status and formorbidity surveys.20.21 However. EPI has the potential
BEST AVAILABLE copy

1042 INTERNATIONAL JO URNAL OF EPlDEMIOLOGY
to lead to increased variance and bias of the coverage ordisease prevalence estimates. 22
-25 In this study, we use
maps drawn for a baseline xerophthalmia survey inNepal to simulate stratified random sampling (SRS) andEPI sampling of this population so as to obtain estimates of the bias and increased variance associatedwith EPI sampling for xerophthalmia surveys. Theseestimates are then used, in conjunction with the difference between the distance travelled within clustersusing EPI and SRS, to make recommendations aboutthe optimal sampling design for xerophthalmia surveys.
MATERIALS AND METHODSSource of DataThe data used in this study come from a baseline surveyof xerophthalmia uncJertaken prior to a randomizedcommunity trial of vitamin A supplementation inSarlahi district, Nepal. 26 Forty wards in 25 VillageDevelopment Committees were selected at randomfrom the larger sample of 261 wards in 29 Village Development Committees that were included in the trial.A ward is a well defined administrative unit, with ninewards comprising each Village Development Committee. The mean number of households per ward was72.7. The mean number of children per ward was 119.1,and the mean number of children per household was1.6. Within neighbourhoods. houses are relatively close(5-10 metres on average), but there are often severalneighbourhoods within wards that can be spaced up tohalf a kilometre apart. Sarlahi district is located in thelowland terai area bordering Bihar, and was selectedbecause it was identified as an area with high rates ofxerophthalmia in two previous nalional surveys. n2aThe selected wards were mapped, all houses were numbered. and children under 5 years old were censused byinterviewers who visited each household. Parents wereinvited to bring eligible children to a central site in theward for an eye examination. Parents were asked aboutnight blinuness using local terms. An ophthalmologistor senior ophthalmic assistant examined the eyes forsigns of xerophthalmia which were graded according tothe WHO definition. 2Y Prior inter-observer trials with100 I chiluren showed excellent agreement between thetwo graders, with a kappa statistic of 0.93.
Sail/pi illg DesigllsThe comparison of all sampling designs assumed thatthe primary sampling units (wards) had already beenselected proportionate to ward size, and that a fixednumber of chilurcn would then be selectcu in varyingways from each ward .. The first design selected a fixednumber of children at random from each of the 40
wards, thereby guaral1leeing equal probability of selection within each ward. Other simulations used the EPIcluster design or modifications of this design to selecta fixed number of children per ward. The EPI clustersampling method is described in detail in the WHOmanual." Briefly, the interviewer goes to the centre ofthe village and selects a direction at random (spinninga bottle has been suggested). The houses along thisdirection are numbered from the centre to the peripheryand one is chosen at random to be the starting house inthe sample. All children of eligible age are identified inthis house and immunization coverage information isobtained. The interviewer then goes to the next nearesthouse to the right of the front door of the starting house.If a house has no eligible children, the next nearesthouse is visited. This continues until the immunizationstatus of at least seven children has been determined.All children in selected houses are surveyed so that acluSler may contain more than seven children.
Simulation of EPI SampiingThe maps of the 40 wards were digitized and the x-ycoordinates of each house were stored in computerizedformat with the associated identifiers of the preschoolchildren in that house. The coordinates were selectedrelative to some arbitrary origin. The coordinates of allthe households were then averaged to identify an approximate centre of each ward. This location was thenset as the origin and the household coordinates wereadjusted to renect this origin. A direction was chosen atrandom from the origin. A pair of parallel straight linesof a fixed width was drawn from the centre to the periphery. This was done because houses in the computerized database were dimensionless locations, and unlessa path of a certain width was drawn, the likelihood ofa house falling exactly on the line would be very low.After the starting house was selected, the next nearestneighbour from +900 to -900 was selected. This wasdone in order to simulate the EPI rule of going to thenexl nearest house to the right when facing North. Oncethe edge of the village was reached, the direction ofsearch was rotated 900 to the right and selected the nextnearest house on lhis path. If the selected house hadalready been visited or if the house did not have anyeligible children, the next nearest house to its right wasvisited. Since xerophthalmia is a much rarer outcomethan positive immunization status. fixed cluster sizeswithin each ward were varied to include 7, 10, 15,20and 25 children selected per ward by either SRS or EPIcluster sampling. If the ward had fewer children thanthe.requisite nUlllber per ward. then all children in thatward were included. Only three wards had fewer than25 children. Modifications to the EPI approach increased

XEROPHTHALMIA SURVEY SAMPLING 1043
the distance of households from nearest neighbour tothe selection of every second. third. fourth and fifthhouse to the right of each selected house.
Estimation of P,'evalel1ce lIlId Desif?ll EffectsThe true prevalence was estimated by dividing the number of cases of xerophthalmia in the 40 wards by thetotal number of children examined. In an actual surveyin which the primary sampling units (wards) were selected proportionate to size. the sample would be selfweighting. However. in this simulated study. there hasbeen no selection proportionate to size. so the comparison of interest is between the 'true' prevalence inthe 40 wards and the estimated prevalence based onsampling a fixed number of children in each of the 40wards. Therefore the prevalence of xerophthalmia foreach simulation sample was calculated by taking theaverage of the ward prevalences weighted by the wardsize. One thousand simulated samples were drawn foreach sampling design and each sample size. The meanprevalence and the empiric variance of the 1000 samples were calculated for each sampling design (variance= I: (Pi - p)2/999 where Pi is the prevalence in the ithward and p is the average prevalence across the 1000simulations). The bias of the EPI design was estimatedby taking the difference between the 'true' prevalencein the 40 wards and the mean prevalence of the 1000samples selected according to EPI cluster sampling.
The design effect was calculated by taking the ratioof the variance from EPI sampling to that of stratifiedrandom selection of a fixed sample size per ward. Thisdesign effect is a measure of the extra variation generated by sampling a cluster or local neighbourhood ofhouses within a ward rather than sampling children atrandom within wards. where children would tend to bescattered across the ward. The mean square error associated with EPI sampling was calculated by taking thevariance of EPI sampling plus the square of the bias.The mean square error of SRS was estimated by takingthe variance under simple random sampling, since thereshould be no bias for this sampling design.
Estimatioll alld Comparisoll (If Distance TravelledFor EPI sampling. the simulated surveyor started at thecentre of the ward. travelled in a straight line to the firstselected house. and then travelled sequentially to eachnext nearest house to the right. The total distance travelled in the ward was calculated by adding the straightline distances along the path just described. This included visits to houses where no eligible childrenresided. For simple random sampling. the distance wascalculated by taking the shortest straight line path fromthe first randomly selected house to the next nearest
house and from there to the next nearest house untilall randomly selected houses had been visited. Thisexcluded visits to houses withoutchildren because theywere not included in the sampling frame. Because themaps of each ward were not drawn to the same scale,the ratio of the total distance travelled for the 1000simulated EPI samples to that of SRS was calculatedseparately for each ward. The median of the ward ratioswas used to compare the overall distances travelledusing EPI sampling to that using SRS. The median waschosen because the distribution of the distance ratioswas skewed to the right.
To compare sampling designs in terms of the tradeoff between distance travelled and mean square error.the EPI mean square error multiplied by the mediandistance travelled under EPI sampling was dividedby the SRS mean square error multiplied by the distance travelled under SRS. This assumeS the cost ofdoubling the mean square error is the same as doublingthe time. If this ratio was less than one then EPI wouldbe favoured over SRS in terms of less distance travelledfor comparable mean square error. In order to evaluatedesigns in terms of increased variance alone. the ratiosof the EPI variance multiplied by distance to that ofSRS variance multiplied by SRS distance was calculated. If this ratio was less than one. the EPI approachwould be favoured over SRS in terms of less distancetravelled for comparable variance. J()
An alternative to cluster sampling using EPI or SRSwould be to examine all children in selected villages,since the cost of travel to villages is greater than thecost of travel within villages. The cost of these differentsurvey designs can be calculated in days to completethe survey using the following formula: mn/x + mt l«n/y) - I] + mt, where m is the number of clusters. n isthe number of ~hildren examined per cluster. x is thenumber of children that can be examined per day, yis the number of children per household. t l is the average travel time between houses in days, and t2 is theaverage travel time between villages in days. The totalsample size. N = nm. varies according to the designeffect of cluster sampling. which is greater the largerthe cluster size. JU2
RESULTSA total of 4920 households were censused in the 40wards, and 57.4% of households were identified ashaving children under 5 years of age. The number ofchildren under 5 living in these households was 4765.Of these, 4297 (90.2%) Were interviewed about theirmorbidity in the past week and examined for xerophthalmia. These children formed the population from

1044 INTERNATIONAL JOURNAL OF EPIDEMIOLOGY
14 ,...-------------------------,
12
10
4
2
o0.0 1.0 2.0 3.0 4.0 5.0 6.0 7.0 8.0 9.0 10.0 11.0
Prevalence of Xerophthalmia
FIGURE 1 Frequency distribution of.<erophtl/(/Imia preVltlence by ward. Nepal, 1989
TABLE I Design effect ar the second stage of cluseer sampling TABLE 2 Bias (sample prel'alellCe minus true prevalence in per(VariwlceEP/1 VarillilceSRS)' Nepcrl, 1989 cent), Nepal, J989
Clus!er size No. of houses skipped Clusler size No. of houses skipped
0 2 3 4 0 2 3 4
7 I.IJ 0.90 1.12 1.20 1.16 7 0.49 0.27 0.77 0.86 0.9510 1.19 0.91 J.l1 1.35 1.15 10 0.63 0.30 1.00 0.92 1.16IS 1.13 LIS 1.00 1.10 1.15 15 0.74 0.55 1.10 0.64 0.9420 1.20 1.00 0.80 0.93 0.83 20 1.04 0.79 0.98 0.57 0.7025 0.90 0.80 0.73 0.83 0.83 25 LOU 0.75 0.79 0.54 0.92
which repeat samples were drawn. The number ofchildren in each ward ranged from 13 to 284 and thenumber of households ranged from 31 to 315. Theprevalence of xerophthalmia was 2.8% among the 4297children surveyed in the 40 wards. However, the wardprevalences ranged from 0% to I I% (Figure I). The design effect at the second stage of sampling (variance ofEPI divided by the variance of SRS of a fixed numberof children per ward) ranged from 0.73 to 1.35 (Table I).
The bias generated by EPI sampling ranged from0.27% l(J 1.16% (Table 2). The EPI design consistentlyled to overestimation of xerophthalmia prevalence.The true prevalence was 2.8% but the EPr prevalencesranged from 3. I% to 4.0% (Figure 2). The bias was notrelated to sample size per cluster, nor to number ofhouses between selected houses.
As expected, the .median distance ratios for EPIrelative to SRS increased with distance between houses
and with the increase in fixed cluster size (Table 3).The larger the cluster size, the greater the proportion·ate increase in the distance ratio. For next nearesthouses, the distance travelled was always less for EPIthan SRS, even when sampling 25 children per cluster.However, for houses with at least two houses betweenthem and for cluster sizes of 20 or more, the advantageof EPr in terms of distance travelled disappeared.For houses with four houses between them, EPI offered a clear advantage for cluster sizes of seven only.Based on minimizing the combination of mean squareerror and distance travelled. EPI was preferable forcluster sizes of I() or fewer and for houses spaced closetogether (Table 5). Based on minimizing the combination of variance and distance travelled, EPI waspreferred over SRS for all cluster sizes where nomore than two houses were between selected houses(Table 6).

XEROPHTHALMIA SURVEY SAMPLING
Prevalence of Xerophthalmia by Household Intervals and Sample Size
7 ......---------------------------,
6
5
2
1045
Sample size 7 10 15 20°W~NMVlt'J (J)"I""'"'(\JC")"!$"lt) <J)T'""c;\IM"II:f'lb W-NMvlt'J
O::o:-a:::o::o: 0::0::-0:0:0:: 0::0:-0:0:0:: 0:: a:-o: 0:0:wwftwLUw WWfuUHUW (JJwfuwww wwfuwww
Vertical lines indicate 95% confidence intervals.Short horizontal lines indicate estimated mean.Long horizontal line indicate population mean.
25
FIGURE 2 Prevalence and 95% confidence illten'als for xeroplrtllalm;a «S;IIII differelJl s"mplillgde.~igns. Nepal. J989
TABLE 3 Median ratios of dislllllce" traveiled within wards forExptmded Program OIl lmmrllli,arimi (EPI) vers«s StratifiedRandom Sampling (SRS). Nepal. 1989
TABLE 4 Ratio", of meall square amr f01' Expanded ProRramOil Immwri<.at;olJ (EPI) 10 meall .~tUlrdard error for StratifiedRalldam Sampling (SRS). Nepal. 1989
CI usler size No. of houses skipped
0 2 3 4
7 0.39 0.53 0.64 0.72 0.8210 0.42 0.58 0.68 0.80 0.9215 0.49 0.62 0.80 1.01 1.0720 0.55 0.77 0.92 1.28 1.3325 0.65 0.95 1.13 1.47 1.62
, Ratio of < I means EPI favoured over SRS.
Cluster size
710
152()25
No. of houses skipped
0 2 3 4
1.31 1.02 1.63 1.83 1.931.69 1.02 2.37 2.41 2.M
2.18 1.73 3.33 1.88 2.853.84 2.51 3.17 1.71 2.024.23 2.66 2.80 1.80 3.67
Given the above results. EPI appears to be a goodalternative to SRS at the second stage of sampling(at the ward level) since the cost in terms of distancetravelled within wards was much lower for EPI usingnearest neighbours. However. the estimates of prevalence generated by EPI for cluster sizes from seven to25 were overestimated by between II % and 36%. In
addition. other important costs come into play in thechoice of design. The lime it takes to travel from onecluster to another may muke it more efficient to surveyevery child in the cluster. One disadvantage of thislalter design is that the design effect increases with thesize of the cluster. Figure 3 gives the time taken in daysto complete a survey using EPI with fixed cluster sizes

1046 INTERNATIONAL JOURNAL OF EPIDEM IOLOG Y
TABtE 5 Efficiency" ofExpanded Program on Immunization (EPI)relative (0 Stratified Random Sampling (SRS) = (media" dis.tanC€IiPl x Mean Square Error [MSEluIJ/(median distanceslIs xMSEslIs) by cluster size and house proximity. Nepal, 1989
400,..---------------,
350
• Ralio of < I means EPI favoured over SRS.
Cluster size
710152025
No. of houses skipped
0 2 3 4
0.51 0.51 1.04 1.32 1.580.71 0.59 1.61 1.93 2.611.07 1.07 2.66 1.90 3.052.11 1.93 2.92 2.19 2.692.75 2.53 3.16 2.65 5.94
300
'iil~ 250
:EoGl
11 200
~~ 150:::l
CIl
100
50
204 8 12 16Time between villages (hrs)
o+---,.---.,.---r---,----,...--'
o
TABLE 6 Median distance ratios of Expanded Program onImmunization (EPI) 10 Sirarified Random Sampling (SRS) mulliplied by Ihe design effect" by cluster sil;e and house proximily.Nepal. 1989
FIGURE 3 Total rime 10 complere ij survey plotted lI8ilill,I tileavemge trm'e/lime betweell elf/'Iers jor Ille E.\p'mded Program"" ImmwliZll/i,," (EPl) with "hl.Her<ize 10 and J5. alld jf" adesigll 11101 ext/milles 01/ childre/l ill .<elecled "'Md,. Nepal, 1989
, Ralio of < I means EPI favoured over SRS.
of 10 or 15, compared with one in which all children inselected wards are examined. Sample size calculationsindicate that approximately 1000 children need to beexamined in order to estimate a prevalence of 2.8%(95% confidence interval: 1.8-3.8). This is the samplesize needed if a truly simple random sample wereselected from a list of all children in the populationof interest. However, the design effect using EPI withdusters of size lOis about lA, and about 1.5 forclusters of size 15. Hence, 1400 or 1500 children mustbe examined in 140 or 100 wards, respectively. If allchildren in selected wards are to be examined, thenapproximately 5500 children in 55 wards are neededbecause the design effect is 5.5 for clusters of size 100(the average number of children per ward).31 The calculation assumes that the travel time between houses is
CI usler size
7to152025
No. of houses skipped
0 2 3 4
0.43 0.48 0.72 0.86 0.950.50 0.53 0.75 1.08 1.060.55 0.71 0.80 1.11 1.230.66 0.77 0.74 1.19 1.100.59 0.76 0.82 1.22 1.34
5 min, that there are 1.8 children per household who areunder 5 years and that 8 h of work can be done in oneday. If 60 children can be examined in 8 h, then EPlwith 10 children per cluster takes less time than examining all children in selected wards, unless the traveltime between wards is more [han 8 hand 45 min. If 100clusters of 15 children are examined, then the breakpoint is about 2 days travel time between wards. Variations in the travel time between houses (tLl changesthe intercept but not the slope of the cost lines. An increase in the travel time between houses would reducethe travel time between wards where EPI.and 'all children examined' designs were comparable in terms oftime costs. A decrease in t l would have the oppositeeffect.
DISCUSSIONLess expensive and more rapid ways of estimating theprevalence of xerophthalmia would be very helpful forpopulation assessment and surveillance. Because of thelogistics and cost of constructing a sampling frame ofall children in a population, simple random samplingfrom the entire population is almost never an option. Asampling frame of communities such as villages, wards,or city blocks can often be constructed with estimatesof community size based on census information already

XEROPHTHALMIA SURVEY SAMPLING 1047
available. However. vanatlOns in how to sample individuals from communities that have been selectedproportionate to size can substantially alter the accuracy.speed and cost of surveys. The EPI sampling designreduces the cost of surveys by removing the need tomap and census selected communities, and by reducingthe time taken to travel within communities. This reduced cost needs to be balanced against the potentialbias and increased variance generated by such a sampling design. To date. no estimates of the bias and increased variance have been available for xerophthalmiasurveys where EPI sampling is used. The magnitudeof the estimate of xerophthalmia prevalence in thispopulation is comparable to other populations in whichxerophthalmia is of public health importance: 3.9% inMalawi. 1.3% in Zambia, 1.9% in Indonesia. 31
The magnitude of the bias and increased variancewill depend on the geographical distribution of xerophthalmia within communities. If cases of xerophthalmia are evenly spread across the community, then thereshould be no bias or increased variance from EPI sampling. Increased variance in the absence of bias can resultif clusters of cases are found in certain neighbourhoods.The selection of a cluster of households in a neighbourhood (as tends to be the case with EPI sampling)will produce prevalence estimates that are sometimestoo low. and sometimes too high, but on average theprevalence will be accurately estimated. Bias arises ifthere is a systematic pattern of distribution of cases inthe community, and if the starting household in the EPIdesign is not selected at random. A consistent overestimate of prevalence using EPI. as seen in these data,might arise if cases were concentrated in the centre ofthe ward and if EPI more often resulted in the selectionof a starting house near the centre. This was not a likelyexplanation because. when the ward was divided intoan inner and outer circle. one of which was selected atrandom to contain the starting house. the bias was notreduced. The bias was also not reduced by increasingthe distance between surveyed houses, thereby spreading the sample across a larger area of the ward. The biaswas smaller when cluster sizes were small and there werefewer houses between selected houses. These findingsare contrary to those of Bennett for other health out·comes. 22 However. we found similar results to Bennettfor different morbidity outcomes such as diarrhoea, sothe bias pattern appears to vary with the health outcomeof interest. In this population. the variance was increased by using EPI. but only for small cluster sizesand houses of close proximity, and the largest designeffect would have resulted in a 35% increase in variance of the prevalence estimate (a 16% increase in thelength of the confidence interval).
Obviously. a design in which fewer communities arevisited but more children within the communities areexamined is preferred because of the cost of travellingbetween communities. However. the more children examined per community. the larger the design effect andthe greater the total number of children who need to beexamined. For example. the design effect was 5.5 if allchildren in the 40 wards were examined.J1 This wouldresult in the need to examine 5500 children in 55 wards(100 children per ward) to obtain a 95% confidenceinterval around the prevalence estimate of 1.8-3.8.To achieve the same level of precision. a design thatsampled 15 children per ward would require only 1500children but necessitate visiting 100 wards. Hence. thedistance between communities is important in decidingwhich design is less costly. Other costs include reimbursement of trained examiners (the same per unit timefor both designs) and the cost of mapping and censustaking (for SRS and 'all children examined' designs). Inour study. the average ward took 3 days to map and census. The cost of trained examiners as a per cent of totalcosts is relatively small. but would vary by whethera local or expatriate ophthalmologist. or ophthalmicassistant was hired. In the context of our data. EPI with15 children per cluster would be favoured over examining all children in a ward if travel time between wardsdid not exceed 2 days on average. With clusters of size10. EPI would be favoured if time between wards didnot exceed 8 h. If fewer children can be examined perday, if the distance between houses within communitiesis greater. or if there are fewer eligible children perhousehold, then examining all children will become preferable with a shorter travel time between communities.While these calculations provide guidelines for thechoice of sampling design. the situations may vary fromone population to another. The design effect whensampling all children in selected villuges ranged from2.03 to 5.50 for two African and two Asian countrieswith a median number of children per cluster rangingfrom 25 to 99.·'1 Hence, it is possible that there is somevariation in disease clustering within neighbourhoodsfrom one population to another and this might lead to adifferent optimal design in a different setting. Based onour data from Nepal. we favour the traditional EPI design with a fixed cluster size of 15. except when villages are on average further than 2 days apart, but wecaution that the process of selecting an appropriatedesign should be done using as much local informationas is available. It should also be cautioned that the EPIapproach could overestimate the prevalence of xerophthalmia by up to 41 % of the true prevalence. and thatthis is one of the disadvantages that must be weighedagainst the reduced survey costs attained using EPI.

1048 INTERNATIONAL JOURNAL OF EPIDEMIOLOGY
ACKNOWLEDGEMENTSThis study was carried out under Cooperative AgreementNo. DAN 0045-A-5094 between the Office of Healthand Nutrition, United Slates Agency for InternationalDevelopment (USAID), Washington DC, and the DanaCenter for Preventive Ophthalmology (DCPO/Centerfor Human Nutrition, Johns Hopkins University, Baltimore, MD), with additional support from NIH grant no.RR04060. The authors wish to thank Dr Steve Bennettof the London School of Hygiene and Tropical Medicine for his helpful advice, and colleagues at the NepalNutrition Intervention Project-SarJahi (Dr S K Khatry,Steven LeClerq, Elizabeth Pradhan, and S R Shrestha)and the National Society for the Prevention of Blindness(Dr R P Pokhrel), Kathmandu, Nepal.
REFERENCESI Thylefors B, Negre! A D, Pararajasegaram R. Epidemiologic
aspects of global blindness prevention. C"I'r OpillOplJl/wlmol 1992; 3: 824-34.
2 Sommer A. Nr/lririOlrtll Blilldlless: Xeroplulrtllmia andKemromalada. New York: Oxford University Press, 1982.
3 Sommer A. WeSl K P Jr. Vjmmi" A Deficiellcy: Hea/rll, SIII'ViVlllalld Vi~·ioll. New York: Oxford University Press, 1995.
4 Sommer A, Tarwoljo [, Hussaini G et ll/. Increased mOtlality inchildren with mild vitamin A deficiency. Lallcet 1983; i:585-88.
5 Sommer A. Katz I. Tarwoljo I. Increased risk of rcspiratorydisease and diarrhea in children with preexisting mildvitamin A delkieney. Am j Clill ."II/II' 19~4: 40: 1090-95.
• Bloem M W, Wedel M. Egger R J et al. Mild vitamin Adeficicncy and risk of respiralOry diseases and diarrhea inpreschool children in northeast Thailand. Am j EI)jdemiol1990: 131: 332-39.
1 Milton R C, Reddy V, Naidu A N. Mild vitamin A deficiencyand childhood morbiJity-an Indian experience. Am j CUllNlltl' 1987; 446: 827-29.
S Tarwotjo L Katz I. West K P Jr el {II. Xerophthalmia and growlhin prcsehoollndllnesian children. Am J Clill N"t,- J992; 55:1142-46.
~ Humflhrey J H. Wesl K P Ir, Sommer A. Vilamin A delicieneyand allribulabk morlalily among under 5 year olds. BullWorld Hellllll Ol'g<lll 1992: 70: 225-32.
III Beaton G H. Manorell R. L'Abbc K A et <II. Effectiveness ofvilamin A supplementation in tbe control of young ehildmorbidity and mortalilY in developing countries. Finalreport 10 CIDA. Toronto: Univer:dly of Toronto, 1993.
11 The EPI Covemge Survey, Iraining for mid-level managers.Geneva: World He'llth Organization, 19'1 l.
"Henderson R H. Davis H. Eddins D L er <II. Assessmenl ofv"lcdniltion co\'crag<:, v:..ll:cin:i,lcion scar rat~s and ~maHpll-x
scarring in 5 areas Ill' West Africa. Billi World flellltilOl'gllll 1973; 48: 11I3-94.
1.1 Henderson R H, Sundaresan T. Clusta sampling to assess,mlllUniz~lion covcrage--;.a review ur C"xpcricncc with asimplified lIlethoJ. IJIlII lVorid Helll,lI (h:~lIIr 191:\2; 60:253-60.
14 Lemeshow S, Robinson D. Survey to measure programmecoverage and impact: a review of the methodology used bythe Expanded Programme on Immunization. World HeallhSllIt Q [985: 38: 65-75.
IS Cutts F. Soares A. Jecque A V el a/. The use of evalualion to improve the Expanded Programme on Immunization in Mozambique, Bull Wvrld Heallh Orgall 1990: 68: 199-208.
16 Nasseri K. Latil"i M. Azordegan F et ilt. Determinanls of partialparticipation in Ihe immunization programmes in Iran. SvcSci Med 1990; 30: 379-83.
17 Lemeshow S, Stroh G. Sampling Tedmiqlles for Eva/llatingHeoltlt PammeIers ill Developing COlllltries. Washington,DC: National Academy of Sciences. 1988.
18 Lemeshow S, Tserkovnyi A G. Tulloch J L er ll/. A computersimulation of the EP[ survey strategy. 1m J Epidemjol19115: 14: 473-81.
I~ Lwanga S K, Abiprojo N. Immunizalion coverage surveys: .methodological sludies in Indonesia. BIIII World HealrhOrgan 1987; 65: 847-53.
Oil Sierra Levlle Natiollal NWI'ilion Sliney. Washington DC: Officeof NUlrition Development and Support Bureau. Agency forInternational Deve[opment. 1978.
21 Rol:>enson A. Fronczak N. Jaganjac N et al. Nutrition andimmunization survey of Bosnian women and childrenduring 1993. 1m J Epidemiol 1995; 24: 1163-70.
22 Bennett S, Radalowicz A. Vella V et ill. A computer simulationof household sampling schemes for health surveys indeveloping countries. 1m J Epjdemjol 1994; 23: 1282-91.
2J Bennett S. Woods T, Liyanage WM. Smith D L. A simplifiedgeueral melhod for cluster sample surveys of heallh indeveloping countries. World Healtlt Stat Q 199 [; 44:98-106.
2~ Brogan D, Flagg E W. Deming M. Waldman R. Increasing theaccuracy of the Expanded Programme on Immunization'scluster survey design. Alllr I::.i)iclemiol 1994; 4: 302-[ I.
25 Turner A G, Magnani R J, Suaib M. A not quite as quick bUlmuch cleaner alternative to the Expanded Programme onImmunization (EPl) cluster survey design. Itu J Epidemiol1996: 25: 198-203.
26 Kalz J, West K P Jr, Khatry S K er III. Impaci of vitamin Asupplementation on prevalence and incidence of xerophthalmia in Nepal. IIIl'est Ol)lttlurlmol Vis Sci [995; 36:2577-83.
27 Bri II iant L B, Pokhrcl R P, Grassel N C el 01. Epidemiologyof blindness in Nepal. B"II World Heallh Ol'giUl 1985; 63:375-86.
'" Upadhyay M P, Gurung B J, Pillai K K er "I. Xerophthalmiaamong Nepalese children. Am J EpidemioJ 1985; 121:71-77.
2~ Sommer A. Viwmin A D"jicimc.\" "nd its COllseqllences: FieldGaiile /0 rheir Detection wuJ COIl/rot. Third Edilion.Geneva: WorlJ Health Organization, 1994.
Jll Kish L. Silr!"/.'\" SWJlpling. New York: John Wiley and Sons.1<J65.
H Kalz J. Zeger S L, West K Per <II. Clustering of xerophthalmiawithin households anJ villages. 111/ j I::.i}jdemiol 1993; 22:709-15.
.\, Katz I, Zeger S L. Estimation of design effects in clustersurveys. Alltl HI'idemi,,1 1')<)-'1; 4: 295-301.
(Rel'ised versiOI/ I'eceil'ed jalluary 1997)

e:
Pupillary threshold as an index of population vitamin Astatus among children in India1-3
Ana M Sanchez. Nathan G Congdon, Alfred Sommer, L Rahmathullah, PG Venkataswamy,PS Chandravathi. and Lily Clement
Vitamin A deficiency is both the leading cause of pediatricblindness in the world today (1, 2) and a significant source ofchildhood mortality in the developing world (3-5). Our abilityto combat vitamin A deficiency has been limited in part by thelack of a simple, practical field t,echnique for identifying communities in need of intervention.
We recently reported encouraging results from a field trial inIndonesia of a portable, inexpensive, hand-held device designed to measure the pupillary and visual light threshold as anindex of vitamin A status (6). The afferent pupillary reflex
ABSTRACT Two hundred seven \itanlin A-<feficient southernIndian children aged 1-7 y (mean age: 56.9 mo) underwent testing ofdark-adapted visual and pupillary thresholds in their village settingaccording to a previously reported protocol. One hundred thirty(62.8%) of the children also undcrwent serum retinol testing, and 178(86.0%) participatcd in a randomized. placcoo-controlled vitamin Adosing trial with pre- and postdose testing of dark-adaptation threshold. Most subjects (184 of 207, 88.9%) were able to complete pupillary testing, an objective sign re{juiring minimal cooperation. including a high proportion of the youngest children (72.2% of subjects aged2 y). The proportion of children completing visual threshold testing.which requires greater understanding and cOOpeIation, was significantly smaller than that able to complete pupillary testing (131 of 207,63.3%; P < 0.0001. chi square). At baseline (preclosing). the meanserum retinol concentration declined in linear fashion with a higherpupillary threshold (0.73 MmollL with a score :S 4; 0.47 MffiollL v.itha score 2: 8; P < 0.01). The mean pupillary threshold for these highly
.vitamin A-<feficient Indian children (-0.62: log cdlm2) was signif-
icantly higher than that for 136 more moderately deficient Indonesianchildren (-0.985 log cdlm2
; P < 0.001, two-sample t test) and 56normal American children (-1.335 log cdlm2
; P < o.oon. twosample t test). The improvement in pupillary dark-adaptation testingwas not significant for children receiving vitamin A or placebo.though there was a nonsignificant trend toward greater improvementin children receiving vitamin A (P = 0.2, two-sample t test), Pupillarythreshold testing represents a new, noninvasive, practical. and seemingly valid approach to assessing the vitamin A stams of a moderatelyto severely deficient preschool population. Am J CIin Nutr1997;65:61-6.
KEY WORDSpupil, children
INTRODUCTION
Vitamin A. night vision. dark adaptation.
(tendency of the pupil to constrict under illumination) has beenshown to correlate well with a subject's ability to detect a lightstimulus near the visual threshold (7). Dark vision is known tobe impaired in vitamin A deficiency, often before the appearance of other clinical signs such as Bitot's spots (8). We foundthat both visual and pupillary thresholds of a group of mildlyvitamin A-<feficient Indonesian preschool-aged children weresignificantly correlated with other measures of vitamin A status, including serum retinol. Most importantly, visual and pupillary thresholds rose s.ignificantly (their retinas became lesslight sensitive) the longer the time since a single high-dose(l05 ]Lmol) supplement of vitamin A. Thresholds subsequentlyfell significantly among children supplemented in randomized,double-blind fashion with vitamin A, but not among controlchildren receiving placebo (6).
The current report presents results of pupillary and visualthreshold testing on a group of children in southern India whowere clinically (therefore more severely) vitamin A-cleficientor the siblings of clinically deficient children. in whom deficiency is more common than in children at large (8), in contrastwith the more mildly deficient, nonxerophthalmic Indonesiansubjects. None of the Indian subjects had recently receivedvitamin A. Additionally, we tested the technique under lessfavorable field conditions. Although subjects in Indonesia hadbeen tested at a single, central site, in the current study childrenfrom 40 different villages were examined.
SUBJECTS AND METHODS
Subjects and study design
A total of213 southern Indian children aged 1-7 y (i :!: SD:56.9 :!: 15.2 mo, 55.4% male) were identified as eligible for the
I From the Johns Hopkins University Schools of Medicine and PublicHealth, Baltimore, and the Aravind Eye Hospital, Madurai, India.
1 Supported by USAID Cooperative Agreement DAN-0045-A-5094 between the Office of Nutrition of the US Agency for International Development, Washington. DC, and the Dana Center for Preventive Ophthalmology, Baltimore; and by the Task Force for Sight and Life, Basle,Switzerland and Thrasher Research Award 02807-3.
3 Address reprint requests to NG Congdon. Dana Center for PreventiveOphthalmology, 120 Wilmer Building, Johns Hopkins Hospital, 600 NorthWolfe Street, Baltimore, MD 21205.
Received September 6, 1995.Accepted for publication August 7, 1996.
I·!
Am J Clil'! Nutr 1997;65:61-6. Printed in USA. © 1997 American Society for Clinical Nutrition 61

SANCHEZ ET AL62
study on the basis of a history of nightblindness, the presenceof Bitot's spots on clinical examination, or being the sibling ofa child with nightblindness or Bitol's spots. Subjects were froma total of 40 villages in the vicinity of Madurai in the state ofTamil Nadu. We attempted Doth pupillary and visual testing in207 (97.2%) of the eligible children. after infonned writtenconsent had been obtained from their parents in the locallanguage. Blood for serum retinol analysis was obtained from130 (62.8%) of the participating SUbjects (mean age: 57.1 =13.6 moJo Among 184 subjects (88.90/<) completing pupillarytesting, 178 (96.7%) participated in a placebo-controlled dosing trial in which 89 children were selected at random toreceive 105 p..mol vitamin A and 89 to receive placebo indOUble-blind fashion. All 178 subjects (100%) presented forfollow-up pupillary and visual testing 2 wk after dosing(Figure 1). All children initially assigned to the placebo groupreceived 105 p..mol vitamin A at follow-up.
The protocols followed in testing subjects were approved bythe Johns Hopkins Joint Committee on Clinical Investigation.
Apparatus and testing procedure
The hand-held illuminators used to assess pupillary andvisual threshold were described previously (6). Briefly, thebattery-powered machines had a yellow-green, light-emittingdiode (LED) light source with 12 intensity settings at =0.4 logunit intervals, the range of the pupillary machine being =2 logunits higher than the device used for yi~ual testing. The devicefit entirely over one eye, with an obliquely mounted red LEDlight source providing illumination of the contralateral eye.Before testing, subjects underwent a binocular partial bleach
(ie, exposW"e to bright light to ~ounteract previous partial darkadaptation) followed by 10 min of dark adaptation in a standard1.5 X 2.0 X 2.0 m black-doth tent assembled on a portablemetal frame in the testing ¥Ca in each village, usually a centralsite such as a school or clinic. The tent was set up indoors andaway from windows, and its interior darkened to the degreethat a dark-adapted observer was unable to read black, handsized letters a finger's-breadth in width on a white background.The tent was cooled internally by a battery-powered air cooler.
The visual threshold was measured first, according to aforced-choice protocol, where the threshold stimulus was defined as that level at which a subject could correctly distinguishstimulus from nonstimulus on three successive trials. The redpupillary visualization light remained off during this phase oftesting to avoid confusing the subject. Next, the pupillarythreshold was measured with the machine over the subject'sright eye, the left eye being observed by means of a 2.5 Xloupe. With the subject's attention directed to a nonaccommodative target at a distance of 2 m (ie, a target at a sufficientdistance to prevent accommodation or close-up focusing of theeye, which causes the pupil to constrict), the stimulus intensitywas increased until a pupillary response in the contralateral eyewas clearly visible to the observer on two successive trials.
All examinations were carried out in the child's village ofresidence by one of two workers at the Aravind Eye Hospitalafter 1 wk of training by one of the authors (NGC). Note thatthe unit of measurement used throughout this paper to denotelight intensity is log cd/m2
, the metric unit for luminance,denoting the light reflected or emitted by a surface per unit areaand per unit solid angle.
13Gi13C1 (1«nl.) tit e!llldnnlOIItI -.viii NllnoI data
complMa pupillary 1MtI"9
131/207 (83.3%)oueeeufvlty COfIlfIIIQ
vlaua) watlll9
114120T (IlU%).--.fullycom~
pupillary INtln;
I207.=:"~ 1·-------....-113Of2aT:-:::::.undetVO
..--__~7_... r-'~----.
1781'11oC (IIU'I') of Chndren cornpIellng pup/lillyl.ellng PlnIcIpm In doelll9 tI1al:
R.....lnlng clllklr9n d.-d w!IlI \"l1.tmln A
1781118 (100%) of chlld_ peItlc/pe1jng In doalngtrtal prM.m tor follow-up -1llI In 2 _ka
1771171l (lIt.4%)com~pupillary '.ellng
12$/'118 (7O.2"JI.)~V1IIuallHtlnll
1771207 (85~) h....bolll p...Umlnary and
follow-up pupillary 1..,lng
1251207 (&(1.4%) ll.... boIhpNllmlnary ancllollowoup
vt....II••llng
FIGURE 1. Flow chart showing the progress of 213 preschool·aged children throughout the study.

PUPILLARY THRESHOLD AS INDEX OF VITAMIN A STATUS 65
were significantly correlated with retinol. The relation betweendark-adaptation threshold tests and serum retinol concentrations was mudi stronger than that observed in Indonesia (6),where vitamin A deficiency was less severe, the degree ofdepression in dark-adaptation threshold less marked, and therange of disturbance narrower (Table 1). Nonetheless, thisrelation persisted even at the upper end of both the pupillaryand visual curves among children who would not be expectedto be vitamin A-deficient. These observations support ourfindings among the less-deficient Indonesian children, furthersuggesting that this technique for assessing dark-adaptationstatus may be useful in identifying populations at risk ofrelatively mild (subclinical) vitamin A deficiency.
In the absence of a gold standard for the assessment ofvitamin A status, the randomized dosing trial provided anunequivocal means of improving vitamin A status in onegroup of deficient children compared with others (placeborecipients). Our previous trial in Indonesia had shown asignificant improvement in the pupillary and visual darkadaptation scores of children randomly assigned to receivevitamin A, but not of those receiving placebo. Althoughchildren randomly assigned to receive vitamin A in thecurrent study tended to improve their pupillary scores compared with children receiving placebo. the difference wasnot significant. Several explanations might account for thisdiscrepancy. We decided on a period of 2 wk for retestingpostdosing on the basis of animal (10) and human (II, 12)studies that suggested that this would be adequate for returnto baseline dark adaptation, a period that appeared to havebeen sufficient in Indonesia. In view of the more severedegree of vitamin A deficiency among the Indian subjects, alonger postdosing interval may have been needed. Whereassome sources indicate a shorter titl'\e for resolution of nightblindness after dosing in less-severe cases of deficiency (8),other studies have suggested that multiple doses of vitaminA may be needed to reverse the effects of xerophthalmia inhighly deficient subjects (13, 14). Finally, deficiencies ofother nutrients known to be involved in vitamin A releaseand utilization (eg, zinc) might have been present. In view ofthe potential effect of vitamin A supplementation on mortality in this age group, it was not felt ethical to withholddosing from children assigned to the placebo group for> 2wk. Longer follow-up of both groups might have beenrevealing, however.
The ability to identify populations in need of vitamin Aintervention requires a simple, inexpensive, and practical fieldtechnique for assessing vitamin A status in preschool children(the group most likely to be severely deficient). Pupillarydark-adaptation testing provides distinctly different results inpopulations with presumably normal (eg, United States), moderately deficient (Indonesia), and severely deficient (southernIndia) vitamin A nutriture. This mode of testing offers obviousadvantages over currently available techniques for the assessment of a population's vitamin A status, given that results areimmediate, it is noninvasive, and that blood samples do notrequire delicate transport, storage, and sophisticated analysis.Future testing might be made even more efficient by eliminating the flash, which calculations have shown to bleach < 10%of available rhodopsin, and by allowing children in groups of adozen or so to dark-adapt simultaneously and maximally (eg,for 30 min). In this way, the time for full evaluation of each
child would be reduced to the S 5 min required for the testingitself, without separate. sequential dark-adaptation periods foreach subject.
The smaller the sample size required to determine whethera stated level of vitamin A deficiency exists, the morepractical the test. Among the various factors that determinesample size, the prevalence of the condition being assessedand the validity of the test itself (the level of "backgroundnoise") are both important. Detection of impaired dark adaptation should, theoretically, have advantages in this regard. It represents a demonstrable physiologic consequenceof deficiency, and, because it occurs at relatively mild levelsof deficiency, is more prevalent than more severe clinicalmanifestations. For example, examination of the mean(= SD) dark-adaptation thresholds for Indian, Indonesian,and American children allowed us to calculate the minimumnumber of children required to show a difference betweenpopulations at, eg, the 0.01 level of significance. A sampleof 27 Indonesian children would have been adequate toshow a difference between the Indonesian and Americanpopulations, and only 7 Indian children would be needed toshow a difference between the American population and themuch more deficient Indian population. In comparison,identifying deficiency with the use of more severe clinicalindicators requires' the examination of hundreds to thousands of children (15). In interpreting these numbers, it isnecessary to remember that the populations tested in bothIndonesia and India are not representative of average preschool-aged children in those countries. but were ratherchosen to be deficient in vitamin A. Among more borderlinepopulations, larger numbers of subjects would presumablyneed to be tested to establish deficiency.
Obviously, testing a larger and more representative group isnecessary to determine the extent and severity of deficiencyand to provide an adequate baseline for assessing the impact ofinterventions. Only by testing additional populations of varyingvitamin A status will it be possible to determine appropriatemean dark-adaptation thresholds to serve as valid criteria fordiffering degrees of deficiency. and as the basis for detennining when an intervention program is warranted and whether ornot it is having its intended effect. n
REFERENCES
I. Sommer A, Tarwotjo J. Hussaini G. Jncidence, prcyatence and scale ofblinding malnutrition. Lancet 1981; I: 1407-8.
2. Sommer A. New imperatives for an old vitamin (A). VII E.V.McCollum intemational lectureship in nutrition. J Nutr1989;119:96-100.
3. Sommer A. Tarwotjo I, Djuanaedi E, et al. impact of vitamin Asupplementation on childhood mortality: a randomized. controlledcommunity trial. Lancet 1986;1: 1169-73.
4. Muhilal. Permeisih D. Idjradinata YR, ~uherdiyanciningsih. KaryadiD. Vitamin A-fortified monosodium glutamate and health. growth. andsurvival of children: a conU'Olled field mal. Am J Clin NutI'1988;48: 1271-6.
5. R<'lhmathullah L. Underwood B. Thulsir:lj RD. et a1. Reduced mortalityamong children in Southern India receh'ing a small weekly dose ofvitamin A. N Engl J Med 1990:232:929-35.
6. Congdon NG, Sommer A, Sevems M. et aJ. Pupillary and visualthresholds in young children as an index of population vitamin Astatus. Am J Clin Nutr 1995;61:1076-82.
66 SANCHEZ ET AL
7. Stewart BE. Young RSL. Pupillary re.~nse: an index of \isualthteshold. Appl Optics 1989;28:1122-7.
8. Sommer A. Nutritional blindoess: xerophthalmia and keratomalacia.New York: Oxford Univmity Press. 1982.
9. Tanumihardjo SA. Koellner PO. Olson lA. The modified relativedose-response assay as an indicator of vitamin A sta~ in a populationof well-nourished American children. Am ] Clin NUlr 1990;52:1064-7.
10. Kemp CM. Iacobson SG. BOlTUat FX. Chaitin MH. Knighton RW.Rhodopsin levels and rod sensitivity in cats recovering from vitamin Adeficiency. !nVe5t Ophthalmol Vis Sci 1987;28(suppl):347(abstr).
J1. Barber C. Brimlow G. Galloway NR, ToghiJI H. Walt RP. Darkadapration compared with electrooculography in primary biliary cir·rhosis. Doc Ophthalmol 1989;71;397-402.
12. Fulton AB. Hanson RM, Underwood BA. Schwachman H. Bacy OL.Scotopic threshold and plaSma retinol in cystic fibrosis. InvestOphthalmol Vis Sci 1982:23:364-70.
13. Humplu'ey JH. Natadisasti'a G. Muhilal. et al. A 210·~mole doseof vitamin A provides more prolonged impact on vitamin A statusthan lOS ~mole among preschool children. ] Nute 1994;124:1172-8.
14. Humphrey JH. West KP. MUhila1, See Le. Naradisastra G. Sommer A.A priming doSe of oral vitamin A given to preschool children mayextend protection conferred by a subsequent large dose of vitamin A.J Nutr 1993;123:1363-9.
IS. Sommer A. Vitamin A deficiency and its consequences: a field guideto detection and control. 3rd ed. Gencv:c World Health Organization.1995.

Public Health (1997) lll, 245-247@ The Society of Public Health, 1997
Effect of vitamin A supplementation on measles vaccination innine-month-old infantsRD Sembal
, A Akib2, J Beelex3, Z Munasir, D Pennaesih4, Muherdiyantiningsih4
, Komala4, S Martuti4 and Muhila14
IDepartment of Ophthalmology, The John Hopkins University School ofMedicine, Baltimore, MD, USA; 2Department ofChild Health, University ofIndonesia, Jakarta, Indonesia; 3Division of Viral Products, US Food and Drug Administration,Bethesda, MD, USA; and 4Nutrition Research and Development Centre, Ministry ofHealth, Bogor, Indonesia
Objective: Childhood immunization programs have been suggested as an infrastructure to deliver vitamin Asupplements to children in developing countries. The effects of giving vitamin A, a potent immune enhancer, withmeasles immunization to nine-month-old infants is unknown.Methods: A randomized, double-masked, placebo-controlled clinical trial of vitamin A, 100000 ill at the time ofstandard titer Schwarz measles immunization was conducted with nine-month-old infants in Bogor District, West Java,Indonesia. Antibody titers to measles were measured at baseline and one and six months following immunization.Results: 394 infants received measles immunization, and 37 infants (9.4%) had baseline antibody titers > 1: 120, whichis consistent with previous natural measles infection. Of the remaining infants, 98.8% seroconverted to measles, and99.3% had titers consistent with protection against measles six months postimmunization. Seroconversion rates weresimilar in vitamin A and placebo treatment groups.Conclusion: High dose vitamin A supplementation can be given without reducing seroconversion to standard titerSchwarz measles immunization in nine-month-old infants.
Keywords: vitamin A; retinol; measles; vaccination; Indonesia
\Introduction
Vitamin A deficiency is a major cause of childhoodmorbidity and mortality in many developing countriesworldwide. Periodic vitamin A supplementation has beenshown to reduce child mortality by 20--50%1 and is one ofthe most cost-effective interventions available to increasechild survivaP Child immunization programs involve morethan 500 million contacts per year, and it has beensuggested that the infrastructure of these programs couldbe used to deliver vitamin A supplements.3 Vitamin A is apotent immune enhancer.4 In a recent study, vitamin Asupplementation with measles vaccination was shown toreduce seroconversion to measles in six-month-old infantswho had high levels of passively acquired maternalantibody to measles.5 Many child immunization programsin developing countries routinely immunize againstmeasles at nine months of age, a time at which the levelsof maternal antibody are generally lower. The effect ofvitamin A supplementation on measles vaccination in ninemonth-old infants is not known. We conducted a randomised, double-blind, placebo-controlled clinical trial todetennine the effect of simultaneous vitamin A administration on antibody responses to measles vaccination innine-month-old infants.
Methods
The study population consisted of infants in 27 villages inthe Bogor District, West Java, Indonesia. This area has ahigh prevalence ofsubclinical vitamin A deficiency.5 Birthswere monitored in the area with the assistance of the rural
Correspondence: Dr RD Semba, Ocular Inununology Service, Suite700,550 North Broadway, Baltimore, MD 21205, USA.Accepted 13 February 1997
health centers. The overall design of the study was toevaluate the impact of integrating vitamin A supplementation with child immunization programs, starting with theearly immunization contacts. Infants were enrolled into theclinical trial between October, 1992, and February, 1993,and were randomly allocated by number table in blocks often to receive either 25 000 ill or 50000 ill, vitamin A, at 6,10, and 14 weeks immunization contacts of the ExpandedProgramme on Immunization and vitamin A, 100 000 IV atnine months of age, or placebo at 6, 10, and 14 weeks, andnine months of age. Standard-titer Schwarz measlesvaccine, 0.5 mL (Morbilivax, lot 68A09, 4.1310g10 mediantissue-culture infectious doses [TCID50) per dose, BiocineSclavo, Siena, Italy), was administered at nine months ofage by three pediatricians. Vitamin A, 100000 ill, orplacebo in identical capsules (Task Force Sight and Life,Basel, Switzerland) was given orally at the same time asmeasles immunization. Infants received identificationnumbers as they were enrolled into the study, and eachidentification number had an envelope with an identicalcapsule containing either vitamin A or placebo. At the timeof treatment allocation, both pediatrician and study nursewere required to verify the identification number of theinfant. Weight, height, and mid~upper-ann circumferencewere measured by an anthropometrist at 6 and 14 weeks,and 10 and 15 months of age. All infants received a boosterimmunization six months after the first measles immunization.
Blood was obtained by venipuncture at all three visits,and plasma was separated and frozen at -70°C. Antibodytiters to measles were measured by plaque reductionneutralisation assay at the Division of Viral ProductsJ USFood and Drug Administration, Bethesda, Maryland, andwere standardized against measles reference serum \'NorldHealth Organization, Geneva). Seroconversion to measleswas defined as four-fold or greater rise in antibody titer 3rt
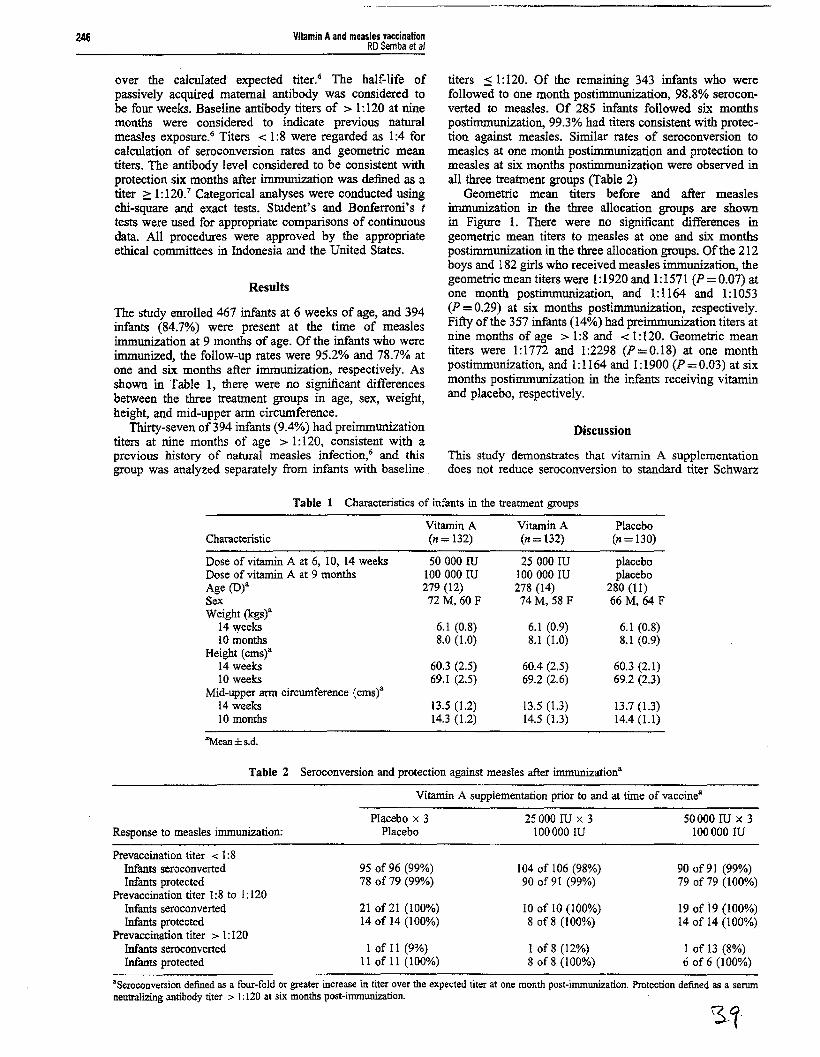
246 Vitamin Aand measles vaccinationRD Semba et al
over the calculated expected titer.6 The half-life ofpassively acquired maternal antibody was considered tobe four weeks. Baseline antibody titers of > 1: 120 at ninemonths were considered to indicate previous naturalmeasles exposure.6 Titers < 1:8 were regarded as 1:4 forcalculation of seroconversion rates and geometric meantiters. The antibody level considered to be consistent withprotection six months after immunization was defined as atiter 2: 1:120.7 Categorical analyses were conducted usingchi-square and exact tests. Student's and Bonferroni's ttests were used for appropriate comparisons of continuousdata. All procedures were approved by the appropriateethical committees in Indonesia and the United States.
Results
The study enrolled 467 infants at 6 weeks of age, and 394infants (84.7%) were present at the time of measlesimmunization at 9 months of age. Of the infants who wereimmunized, the follow-up rates were 95.2% and 78.7% atone and six months after immunization, respectively. Asshown in Table 1, there were no significant differencesbetween the three treatment groups in age, sex, weight,height, and mid-upper arm circumference.
Thirty-seven of394 infants (9.4%) had preimmunizationtiters at nine months of age > 1:120, consistent with aprevious history of natural measles infection,6 and thisgroup was analyzed separately from infants with baseline
titers :::: 1:120. Of the remaining 343 infants who werefollowed to one month postimmunization, 98.8% seroconverted to measles. Of 285 infants followed six monthspostimmunization, 99.3% had titers consistent with protection against measles. Similar rates of seroconversion tomeasles at one month postimmunization and protection tomeasles at six months postimmunization were observed inall three treatment groups (Table 2)
Geometric mean titers before and after measlesimmunization in the three allocation groups are shownin Figure 1. There were no significant differences ingeometric mean titers to measles at one and six monthspostimmunization in the three allocation groups. Of the 212boys and 182 girls who received measles immunization, thegeometric mean titers were 1:1920 and 1:1571 (P=0.07) atone month postimmunization, and 1:1164 and 1: 1053(P =0.29) at six months postimmunization, respectively.Fifty of the 357 infants (14%) had preimmunization titers atnine months of age> 1:8 and < 1:120. Geometric meantiters were 1:1772 and 1:2298 (P=0.18) at one monthpostimmunization, and 1:1164 and 1:1900 (P = 0.03) at sixmonths postimmunization in the infants receiving vitaminand placebo, respectively.
Discussion
This study demonstrates that vitamin A supplementationdoes not reduce seroconversion to standard titer Schwarz
Table 1 Characteristics of infants in the treatment groups
Vitamin A Vitamin A PlaceboCharacteristic (n= 132) (n= 132) (n= 130)
Dose of vitamin A at 6, 10, 14 weeks 50000 ill 25000 ill placeboDose of vitamin A at 9 months 100000 ill 100000 ill placeboAge (D)a 279 (12) 278 (14) 280 (11)Sex 72 M, 60 F 74 M, 58 F 66 M, 64 FWeight (kgs)a
14 weeks 6.1 (0.8) 6.1 (0.9) 6.1 (0.8)10 months 8.0 (1.0) 8.1 (1.0) 8.1 (0.9)
Height (emsY14 weeks 60.3 (2.5) 60.4 (2.5) 60.3 (2.1)10 weeks 69.1 (2.5) 69.2 (2.6) 69.2 (2.3)
Mid-upper arm eirewnferenee (emsY14 weeks 13.5 (1.2) 13.5 (1.3) 13.7 (1.3)10 months 14.3 (1.2) 14.5 (1.3) 14.4 (1.1)
zMean±s.d.
Table 2 Seroconversion and protection against measles after immunizationa
Vitamin A supplementation prior to and at time of vaccinea
Placebo x 3 25000 ill x 3 50000 ill x 3Response to measles inununization: Placebo 100000 ill 100000 ill
Prevaceination titer < 1:8Infants seroconverted 95 of 96 (99%) 104 of 106 (98%) 90 of 91 (99%)Infants protected 78 of 79 (99%) 90 of 91 (99%) 79 of79 (100%)
Prevaeeination titer 1:8 to 1: 120Infants seroconverted 21 of 21 (100%) 10 of 10 (100%) 19 of 19 (100%)Infants protected 14 of 14 (100%) 8 of 8 (100%) 14 of 14 (100%)
Prevaccination titer> 1:120Infants seroconverted I of 11 (9%) 1 of8 (12%) 1 of 13 (8%)Infants protected 11 of 11 (100%) 8 of 8 (100%) 6 of 6 (100%)
'Seroconversion defined as a four-fold or greater increase in titer over the expected titer at one month post-immunization. Protection defined as a serumneutralizing antibody titer > I: 120 at six months post-immunization.

3000
<41..--...l-_
Vitamin A50.000 lU/l00.000 IU
VilaminA25.000 lU/l00.ooo IU
Treatment Group
Placabo
Vitamin Aand measles vaccinationRD Semba et al
The levels of passively acquired maternal antibodies tomeasles in infants is likely to depend on complex patternsof natural measles infection and measles vaccination withincommunities. It is unclear whether these findings can beextrapolated to populations in areas such as sub-SaharanAfrica and Central and South America, and' further studiesare in progress to verify these findings in other populations.This study suggests that the Expanded Programme onImmunization could include vitamin A supplementationwith measles immunization at nine months of age withoutinterference with seroconversion. The benefits of vitamin Asupplementation in reducing child morbidity, mortality, andblindness in developing countries have been well described 8
247
Figure 1 Geometric means titers to measles at baseline and oneand six months post immunization by allocation group. Thevertical bars represent standard error of the mean. No significantdifferences, as assessed by Bonferroni's t-test, were notedbetween treatment groups at one and six months postimmunization.
measles immunization in nine-month-old infants in thisstudy population in Indonesia. Our previous study showedthat vitamin A supplementation was more likely to interferewith seroconversion if passively acquired maternal antibody to measles was present at the time of measlesimmunization. Only 14% of infants had maternal titers tomeasles at the time of immunization at nine months of age.Among the infants who had measles antibody prior toimmunization with titers in the > 1:8 to =:: 1: 120 range,there seemed to be a reduction in geometric mean titers tomeasles at one and six months postimmunization, whichcorroborates our previous findings. However, all infantswith titers in the > 1:8 to :;; 1:120 range seroconverted onemonth following immunization, regardless of whether theyreceived vitamin A or placebo. Infants who had preimmunization titers of > 1: 120 in general did not show a fourfold or greater increase in titer one month followingimmunization, and this antibody response is consistent withinfants who had a previous natural measles infection.
At nine months of age, 9.4% of the infants hadpreimmunization titers of > 1: 120 which suggested aprevious natural measles infection. In the same communityin Indonesia, only 1.5% of six-month-old infants hadpreimmunization titers consistent with previous measlesinfection.s Although about 99% of nine-month-old infantswithout previous natural measles infection seroconverted tomeasles immunization, these data suggest that the timing ofmeasles immunization may need further evaluation. If oneassumes that approximately 10% of infants will havenatural measles infection prior to measles immunization atnine months of age and a measles case fatality rate of 2030%, there could potentially be 20-30 deaths per 1000infants attributable to measles infection prior to immunization.
Acknowledgements
This study was supported by grants from the NationalInstitutes of Health (Al35143, HD30042), the ThrasherResearch Fund, the WHO Expanded Programme onImmunization, and the Office of Nutrition, Bureau forScience and Technology, US Agency for InternationalDevelopment (Cooperative Agreement DAN-0045-A5094-00). The authors wish to acknowledge the staff ofthe Nutrition Research and Development Center for thefield support, Biocine Sclavo, Siena, Italy, for donation ofmeasles vaccine, and Task Force Sight and Life, Basel,Switzerland, for donation of vitamin A and placebocapsules. Technical support was provided by Susette Audet.
References
Beaton GH et al. Effectiveness of Vitamin A Supplementationin the Control of Young Child Morbidity and Mortality inDeveloping Countries. University of Toronto: Toronto,Canada, 1992, pp 1-108.
2 World Bank. World Bank Reports 1993: Investing in Health.Oxford University Press, New York, 1993.
3 Expanded Programme on Immunisation Global AdvisoryGroup. World Health Organ Wldy Epidemiol Rec 1987; 62:5-12.
4 Semba RD.Vitamin A, immunity, and infection. CUn infectDis 1994; 19: 489-499.
5 Semba RD et al. Reduced seroconversion to measles in infantsgiven vitamin A with measles vaccination. Lancet 1995; 345:1330-1332.
6 Markowitz LE et al.Immunization of six-month-old infantswith different doses of Edmonston-Zagreb and Schwarzmeasles vaccines. N Engl J Med 1990; 322: 580-587.
7 Chen RT et al.Measles antibody: reevaluation of protectivetiters. J Infect Dis 1990; 162: 1036-1042.
8 Sommer A, West KP Jr. Vitamin A Deficiency: Health,Survival, and Vision Oxford University Press, New York,1996.

PUPILLARY THRESHOLD AS INDEX OF VITAMlN A STATUS 63
100
ll; 80.!lgo~ 60
tI~=Ia
u 40•'"J!lc
I 20
e-O
0.159 ::: 0.60 log cdlm2, whereas for children receiving pla
cebo, scores improved by only 0.016 ::: 0.50 log cd/m2• Neitherthe change in score for children receiving vitamin A (P = 0.15,paired t test), nor that for subjects receiving placebo (P == 0.7,paired t test), nor the difference in improvement between thetwo groups (P == 0.20, two sample t test) was significant. Therewas no significant difference in the change in visual scoresbetween vitamin A and placebo recipients (0.020 ::!.: 0.59 and-0.013 == 0.54 log cdlm2 respectively; P = 0.50, two-samplet test) (Figure 4). Resistance to multiple blood draws amongchildren and their parents made postdose serum testingimpractical.
12345 II 7(11=2) (11"'18) (17=32) (17=4S) (/f=76) (_32) (11=8)
Age (y)
nGURE 2. Compliance with pupillary and visual testing by age (n =number of subjects attempting testing). The difference between the twocurves was significant, (P < 0.0001. chi-square test).
Comparisons between different populations
The children tested in India were more vitamin A-deficientthan the children of similar age tested in Indonesia: the meanserum retinol concentration Was significantly lower (P <0.0001, two-sample t test), and the proportion of children witha serum retinol concentration < 0.70 ,u.mollL (P < 0.0001,chi-square test) and reported to be nightblind (P < 0.0001,chi-square test) were significantly higher for the Indian chil~
dren (Table 1).
0.8
:J" 0.7 [121
::.aE
.;!, 0.6"0oS! 0.5E:>
~ 0.4
0.3 n__
:!:5 5
JI<IPllIMY - 4 5 (I
7 J!87 J! 8
FIGURE 3. Mean (:= SE) serum retinol concentrations by pupillary andvisual dark-adaptation scores (number of subjects in brackets). The apparent decline in retinol with higher (less sensitive) scores was significant forpupillary score (P = 0.0 I. chi-square test of trend) but not for visual score(P = 0.21, chi-square test of trend).
Subject compliance
Most subjects (184 of 207, 88.9%) were able to completepupillary testing, including a high proportion of the youngestchildren (13 of 18, 72.2% of subjects aged 2 y). The proportionof children completing pupillary testing was higher than thatfor visual testing at all ages, with the overall difference incompliance between the two tests being highly significant (P <0.0001, chi-square; Figure 2). The difference in level of com·pliance between the two tests was most marked among theyoungest children, who generally complied poorly with visualtesting (Figure 2).
Statistical methods
SAS programs (SAS, Inc, Cary. NC) were used to measurethe association between pupillary and visual threshold andother indicators of vitamin A status, and between the change inpostdosing threshold and a subject's assignment in the placebocontrolled dosing trial. The two-tailed Student's t test was usedto compare means between two groups, whereas the chi-squaretest was used to compare proportions. The chi-square test oftrend was used to assess the significance of association between the two dark-adaptation tests and serum retinol. Analysisof variance (ANOVA) was calculated for a model comparingthe popUlation mean dark-adapted thresholds for American,Indonesian, and Indian children. The minimum number ofIndian and Indonesian subjects that would have to be tested toestablish a significant difference in mean threshold at the 0.05level between these groups and nonnal American children witha power of 99% was calculated with a standard sample-siz.eformula. A two-tailed probability < 0.05 was consideredsignificant.
RESULTS
Results of a randomized, placebo-controlled dosing trial
For 89 children receiving high-dose vitamin A supplements,pupillary dark-adaptation scores improved by an average of
Correlation between threshold testing and vitamin Astatus
Mean serum retinol declined linearly with increasing pupil.lary threshold scores (lower retinal sensitivity) (Figure 3: P <om, chi-square test of trend). A similar monotonic trend wasobserved for mean serum retinol and visual threshold, althoughthis relation was not significant (Figure 3; P < 0.3, chi-squaretest of trend). Age, sex, breast-feeding status, and a recent(previous 2 rna) episode of mumps, measles, cough. or diarrheawere not significantly correlated with serum retinol or darkadaptation score on linear modeling (data not shown).
Children reported by mothers to be nightblind did not havesignificantly lower serum retinol concentrations (0.57 ::: 0.27compared with 0.61 ::: 0.25 j.l.molJL; P = 0.4, Student's t test)or higher (less sensitive) pupillary threshold scores (-0.55compared with -0.67 log cdlm2
; P = 0.25. Student's t test),although the relations were in the expected direction. Allchildren either had evidence suggesting clinical vitamin Adeficiency (a history of nightblindness or current Bitot's spots)or were the siblings of deficient children, who are themselvesmore likely to be deficient (8).

2-I oLog tumlnlnce Oog edtm')
FIGURE 5. Pupillary scores for severely vitamin A-dcficient Indianchildren compared with scores for moder:nely deficient Indonesian andnormal American children. The mean score for Indian children (-0.622log cdlm2
) was significantly higher (poorer dark adaptation) than the scorefor Indonesian .hiJdren (-0.985 log cdlm2; P < 0.001. I test) and normalUS children (-1.335 log cdlm2; P < 0.0001. r test).
conducted in a portable testing site, constructed of locallyavailable materials and reassembled in each of the 40 villages,which were within a 3-h drive of our base at the Aravind EyeHospital. The inability of a dark-adapted observer to readstandard-sized tes! letters inside the lest site guaranteed areproducible, minimum level of darkness. Our results indicatethat this technique is sufficiently robust to allow valid testingunder these conditions.
As had been the case in Indonesia (6), a very high proportionof children completed pupillary dark-adaptation testing, significantly greater than the percent:lge able to comply with visualtesting. Pupillary testing, in which the response was Objectivelygraded by an observer. was more useful among young children,especially children 4 y of age and younger, the group atgreatest risk for vitamin A deficiency.
Our data suggest that pupillary testing is not only moreacceptable to young children. but may also provide a moreaccurate indication of impaired dark adaptation: pupillarythreshold was significantly correlated with serum retinolwhereas visual threshold was not. If pupillary testing doesindeed prove to be a more accurate indicator of vitamin Astatus in this age group. it may well be due to practicalissues of testing rather than to any fundamental differencebetween the two tests. Both pupillary and visual testingassess the function of the dark-adapted retina, known to beimpaired in vitamin A deficiency. It is possible that furtherexperience will show that the two tests prOVide complementary infonnation, but we are unaware of any data to suggestthat either offers a theoretical advantage in the assessment ofvitamin A status.
The degree of success in pupillary threshold testing is notable, given that children in this part of India are quite unused tositting in darkened conditions, and that testing was carried outduring the hottest part of the year. These problems were in partovercome by designing a portable testing area that was largeenough to accommodate the subjects' mothers. and that couldbe made comfortable by means of an electric air cooler weigh·ing < 10 kg and 70 cm in height.
As expected. mean serum retinol declined in linear fashionwith higher (less sensitive) scores on both pupillary and visualdark-adaptation testing, although only the pupillary scores
58.5 :!: 7.00.85 :!: 0.34J
47/122 (38.5)"
Bandung, Indonesia'
56.9 == 15.22
0.59 =0.26
92113000.8)
MaduraJ, IndiaIndicator
64 SANCHEZ ET AL
0.3 IlO
0.25
1==:=-1I~!SO
0.2
~-E 0.15 a-~~ <:,;go 0.1 ! 30.5.0=. g'¥ 0.05 ItC 20
0
10-0.05
As anticipated. the apparently poorer vitamin A status of theIndian children was associated with a higher mean pupillarythreshold (lower retinal sensitivity) compared with the Indonesian children (-0.622 compared with -0.985 log cd!m2
; p < 0.00 I, two sample t test), who in turn showedsignificantly poorer dark adaptation than a group of 56apparently well-nourished American children aged 54 =18mo with dark irides (two-sample ( test: -1.335 log cd/m2,
P < 0.0001 ~ comparison of the three populations byANaYA; F = 55.95. P < 0.0001) (Figure 5). Althoughserum retinol was not measured in the American subjects,the extremely low prevalence of vitamin A deficiencyamong well-nourished American children is well-documented (9). American children with dark irides were chosenbecause we found previously (unpublished data) that American children with light irides showed a slightly more sensitive response to pupillary threshold testing.
Although pupillary data differed significantly between theIndian and Indonesian populations, visual threshold data didnot (-4.00 compared with -4.09 log cdJm2
; P == 0.5, twosample t test). Comparable visual threshold data were notrecorded for the American subjects.
DISCUSSION
This study is a sequel to our previous clinic-based assessment of this new test of dark adaptation, with measurementsmade under actual village-based conditions. All testing was
Pupillary Pupillary Vloual Vl1lUaIVllamln A PlltC8bO VIl8mln A Plaeebo
FIGURE 4. Mean (= SE) decline in dark-adaptation thresholds aftersupplementation with vitamin A or placebQ. The difference in decline wasnot significant between individuals receiving placebQ or vitamin A foreither the pupillary (P = 0.2, r test) or visual (P ::: 0.5. r test) teslS.
TABLE 1Vitamin A status of 130 Indian children compared with 136 Indonesianchildren
I Six months after re.eiving a baseline vitamin A dose of (05 ~mol.
2; == SD..1." Significantly different from Madurai, India: J P < 0.0001 (Student's
( test), .. P < 0.000] (chi-~quare test).
Age (rno)Serum retinol (~mo1JL)
Proportion with retinol< 0.7 ~molJL (%)
Proportion reportedas nightblind (%) 93/207 (44.9) 01136 (O)~

Archives o/Disease in Clzildltoot/1997;77:191.194
Vitamin A prophylaxis
It has been little more than a decade since the initial obser~varion of the dose dependent relation between the severityof vitamin A deficiency and childhood mortality,' quicklyfollowed by the publication of a controlled trial in whichchildren of preschool age, randomised to receive largedoses ofvitamin A every six months, died at only two thirds(or less) the rate of control subjects." In the short intervalsince this trial, an initially sceptical scientific communityhas declared control of vitamin A deficiency a major international goa!.... and potentially one of the most cost effective of all health interventions.7
The Story did not begin in the 1980s. A host of animalstudies and anecdotal clinical reports during the first thirdof the century, soon after vitamin A was discovered,suggested a dose, potentially causal relation between vitamin A status and morbidity and mortality from infection.These are detailed elsewhere.8
Vitamin A prophylaxis and m.ortalityFor ethical and logistic reasons the observational study' hasnever been repeated, though a large number of interventiontrials have been carried out. Eight were initially consideredto be suitably rigorous for inclusion in an independently
commissioned meta-analysis (table 1).9 The results wereremarkably similar, particularly given the wide differencesin culture, dietary habits, disease pattems, and malnutrition of the populations studied, the differences in studydesign, and the variation in the potential effectiveness ofthe strategies used to improve vitamin A status.' '0-1.
On an intent to treat basis, six of the eight studiesrecorded a statistically significant reduction in mortalityamong children assigned to receive vitamin A supplements(19 to 54%), even though not all those assigned vitamin Acomplied with the treatment.2
8
Negative resultsTwo 'outlier studies', in which no reduction in mortalitywas observed, deserve mention. The Hyderabad trialU hada series of problems that only became apparent afterpublication from an e.",change of letters to the editor: children were routinely examined and treated for disease eachweek by specially trained health workers. This may explainwhy both the treatment and control arms experiencedmortality much lower than anticipated. This generalreduction in mortality drastically reduced the power of thestudy to detect an effect attributable to the vitamin A supplement (mean reduction 6%, 95% confidence interval

192
-50 to 50%)." In addition, the study had a large and differentialloss to follow up and low levels of compliance.
The Sudan trial" probably did not establish a meaningful difference in vitamin A starns between its two studygroups. It is likely that the study children were not particularly deficient to begin with: almost halflived in homes withsanitary facilities and piped-in water, hardly representativeof the economic status and living conditions of most children in the developing world.
Importantly, the senior authors of both these studieshave subsequently supported the value of improvingvitamin A status as a means of reducing childhoodmortality.' 11
Infectious morbidity and mortalityLongitudinal observational data have suggested thatvitamin A stams can affect the incidence of infectiousdiseases. IS 19 Intervention trials, however, have not confirmed a causal relation; instead, improving vitamin A status primarily reduces the severity ofinfectious episodes,14 20
particularly life threatening diarrhoea and measles (table2).
MeaslesIn the four community based prophylaxis trials in whichcause specific mortality was ascertained, mortality frommeasles was reduced by roughly 50% (table 2).11 .2" '5 Inthe one trial which did not arrive at this conclusion,l5 thedata presented in the published paper clearly prove otherwise (though given the sample size the large clinical difference was not statistically significant). Remarkably, thetreaonem with high doses of vitamin A of children admitted to hospital with moderate to severe measles reduces
Table 1 Major community mortality prevention rrials
Annoracions
mortality to a similar extent/'·" strongly suggesting thatthe beneficial impact is secondary to the correction of theunderlying vitamin A deficiency and not to a non-specificadjuvant response related to the large dose.· Treatmentwith large doses of vitamin A (200 000 ill on two successive days) also reduces the severity and persistence of complications related to measles.22
-25
DiarrhoeaChildren assigned to the vitamin A supplementation armsof the community based mortality trials had one thirdfewer deaths attributable to diarrhoea than the controlsubjects (table 2). CommunitY based studies on the effectof supplementation on morbidity support these results:although supplementation did not reduce the incidence ofdiarrhoea, it did reduce the severity of subsequentdiarrhoeal episodes" 20 The lack of apparent iml'act onincidence may be real; alternatively, it may reflect an inadequate sample size given the high frequency of trivial diar.:.rhoeal episodes among children in the developing world.8
Respiratory diseaseDespite evidence for an aSSOClaoon between vitamin Adeficiency and the prevalence and incidence ofrespiratorydisease: I. the prophylaxis trials did not show a consistentimpact on death from respiratory disease (table 2). Indeed,it has been suggested that vitamin A supplementation mayincrease the risk of respiratory infection, though a WorldHealth Organisation Consultative Group, after reviewingall available data, concluded that this was unlikely.26 Someworkers have suggested that the apparent contradictionmay reflect the reversal ofsquamous metaplasia of the epi-
Study
AcehBogorNNIP5]umIaTamil NaduHyderabadKhartoumVAST
Country
IndonesiaIndonesiaNepalNepalIndiaIndia5udanGhana
Vitamin A supplemmr
Large dose every six monthsVitamin A fortified monosodiwn glutamateLarge dose every four monthsOne large dose, follow up at five monthsWeekly moderate doseLarge dose every six monthsLarge dose every dix monthsLarge dose every four months
Reponed mortali')' rtducwn("/0)*
34t453029546 (not 55):::(+6; not 55)19
PMmary rejtrenJ:e
50mmererafMuhilal er al'0Wester al"Daulairc et al"Rahnl3lhullah er al"Viiayaraghavan er d"Herreraetal"Ghana VA5T 5tudyTeam"
" 6 months and older at baseline (1 year or older if younger children Dot reported separately).t Alternative analyses suggest at least 40 to > 50%.; As calculated from data in their publication, but not reported as such.'5S =Statistically significant (P < 0.01).Reprinted with permission from Sommer A, West KP. Vitamin A~: health. survival, and vision. New York and Oxford: Oxford UniversitY Press, 1996.
Table 2 Cause specific mortality. vitamin A supplementacion community prevention rrials
Sympro""ldiJeases
MeaslM DiaTTheoa Respiratory
StUdy Vitamin A Cancrol group Vitamin A C01lrrol group Vitamin A Conrrol group
Tamil Nadu"No of deaths 7 12 16 33 2 3RR" 0.58 0.48 0.67
NNIPS"No ofdeaths 3 12 39 62 36 27RR 0.24 0.61 1.29/J.OOt
]wnJa~"
No of deaths 3 4 94 129 18 17RR 0.67 0.65 0.95;
Ghacal4
No of deaths 61 72 69 III 47 45RR 0.82 0.66§ 1.00
+ RR (relative risk): cause 5pecific mortality of vitamin l't. group divided by mortality in conrrol group.t Original published results' ': RR= 1.29; reanalysis as an associared cause that recognises underlying causes; RR= 1.00 (KP West, unpublished data).; Pneumonia case management progranune may have confounded results.§ Defined as 'acme gasrroenteritis'.~ Except for ]umla, findings relale to children already" 6 months of age when supplemented.Reprinted with penni5sion from Sommer ..>,., We" KP. Vitamin A deficiency: h<allh, SUN-'it'al, and t';'ion. New York and Oxford: Oxford Univermy Press, ItJ.¥-

Annolatiom
theliallining of the respiratory tract, increasing its ability tomount a clinically detectable response to an infection. Adefinitive answer awaits further investigation.
Young infantsFew data suggest that vitamin A supplementation dramatically reduces childhood mortality in infants younger than 6months of age. The only carefully conducted communitybased prophylactic trial even suggests the potential for asmall increase in mortality among children supplementedwith vitamin A during the second and third months of life;clear cut protection is evident by the age of 5 months.' 27
Whether this is a real effecr or chance variation awaits theresults of follow up investigations.
In one trial Indonesian children randomised to receive50 000 IV vitamin A at birth had only half the first yearmortality of control subjects.z, Almost all the benefitoccurred during the second to fourth months of life.
Non-infectious morbidityApart from infectious disease, vitamin A status appears toplay an important part in gro\.Vth and haemoglobin synthesis. Human data on gro\.Vth, particularly from controlledintervention trials, are confusing: from no impact at all toan age dependent influence on ponderal and/or lineargro\.Vth.· Presumably vitamin A can be a limiting factor ofmany aspects of the gro\.Vth process, but the degree (if any)depends on the relative adequacy of other nutrients. Incontrast, numerous studies have shown that improvementin vitamin A status favourably affects iron metabolism,reducing the severitY of anaemia.' 102'
Mechanism of actionThe protective effects of vitamin A supplementation seemto be entirely related to restoring normal vitamin A status.This, in turn, increases resistance to (severe) infectionthrough at least two mechanisms: the restoration ofnormally differentiated epithelia, providing a more effective barrier to infection; and up-regulation of immunecompetence.•
For example, children admitted to hospital with severemeasles who were randomised co vitamin A supplementation developed a far greater immune response than controlsubjects." The speed of the protective response, graphically illustrated by the 50% reduction in mortality frommeasles among children supplemented with vitamin Aafter admission to hospital, seems at first glance surprising.We now know, however, that vitamin A regulates theexpression of at least 300 different genes and that thenasogastric administration of vitamin A to deficient ratsresults in detectable alterations in gene products within anhour. 9 Hence the dramatic clinical response observed inhospital and field studies has a readily demonstrablebiological basis, even if it is only currently partially understood.
RecoIIlIIlendations for prophylaxisThe ultimate goal of prophylaxis is to restore normal vitamin A status to deficient children. The most effectivemeans for accomplishing this urgent task will depend onthe vagaries of local culture, the available foods, and thelocal health system. Ideally, every child (and woman)should receive adequate vitamin A as part of their regular·diet. Small daily doses are more efficiently absorbed andstored than large periodic supplements. Unfortunately, thepopulation of those countries in which the problem is mostsevere and extensive subsist primarily on vegetable diets,containing little, if any, preformed vitamin A (aside frombreast milk, which is an excellent source for the young
193
Key messages• Vitamin A deficiency increases the severity of andmortalitY from measles and diarrhoea• Increased infectious morbidiry and mortalitY isapparent even before the appearance of xerophthalmia• Improving the vitamin A status of deficient childrenaged 6 months to 6 years can dramatically reduce theirmorbidity and mortaliry from infection• Prompt administration of large doses of vitamin A tochildren with moderate to severe measles, particularly ifthey may be vitamin A deficient, can reduce individualmortality by 50% and prevent or moderate the severityof complications
infant). Provitamin A carotenoids found in many fruits andvegetables are inefficiently converted to the active agentand one of the best, most widely available sources of provitamin A carotenoids, dark green leafy vegetables, is commonly eaten in only small amounts, if at all, by youngchildren.
Many wealthier countries rid themselves of the problemthrough the fortification of dietary staples, particularlymargarine and bread. Fortification of sugar has proved tobe an effective approach for dramatically reducing theprevalence and severity of vitamin A deficiency inGuatemala and is now being instituted in a number ofother Latin American countries.
Where the problem is most severe, however, particularlyin Africa and Asia (India, Bangladesh, Pakistan, Indonesia,and the Philippines), periodic supplementation of everychild once every three to six months (laO 000 IV at lessthan 1 year of age; 200 000 ill for older children) isrecommended. Children at special risk (for example severeprotein energy malnutrition, chronic diarrhoea, repeatedrespiratory infection) are provided with an additional doseif they have not received routine prophylaxis within the pastmonth. Measles is treated with a 200 000 ill supplementon two successive days as a medical emergency. To boostmaternal stores and the amount of vitamin A in breastmilk, women are advised to receive 200 000 ill within fourto six weeks of delivery.
Over 60 countries are now planning, or have instituted,programmes to control vitamin A deficiency. Periodic supplementation as a special endeavour generally achievessustainable coverage rates of 40-60%, though some countries (and most demonstration projects) attain far higherlevels. In Indonesia, where distribution has been integratedinto a burgeoning health service system and mass mediahas been used to educate the public and change dietarypatterns, a 90% reduction in the prevalence of overtdeficiency has been achieved.'
Unquestionably, the major challenge remains the designand implementation of effective population based intervention programmes.
ConclusionsAlthough there is a great deal more to be learnt about thevalue of vitamin A status and childhood morbiditY andmortality, there is no longer any credible doubt thatdeficiency is inimical to optimum health and survival.These effects becrin to occur even before the appearance ofocular disease ('~erophthalmia').9 19
ALFRED SOlvL\1ERJohns Hopkins School of Hygiene and Public Heallh,615 Norlh wz,ife Screel,Ballimore,,\1D 21205-Z179,US~

194
1 Sommet" A, Hussaini G, Tanvotlo I, SusantO O. Inaeased. mortality in children witb. mild vitamin A ddicieocy. Lanat 1983;ii:585·8.
2 Sommet" A, T3lWOtlo I, D;unaedi E, et aI. Impact ofvitamin A supplemenratiOIl 00 childhood mortality. A raI1domised. controlled community trialLance, 1985;i:1169-73.
3 Tarwotjo I, Sommer A, West KP, et aL Influence of participation 00mortality in a randomised trial of vitamin A prophylaocis. Am J CUn Nurr1987;45:1466-71.
4 United Nations/Activities Coordinating CommitteciSubcommittee onNutrition. Focus on micronutrients. SCN News 1993;9: 1-66.
5 W&rId lkc1aratitm a>td pwn ofaaion for nurrition. International Conference onNutrition. Rome: Food and Agriculture Organisation and the World HealthOrganisation, 1992.
6 National srrategies for /XJeTC')7ning micrmutrie7lr malnutrition. 45th WorldHealth Assembly (agenda item 21). Geneva: World Health Organisation,1992.
7 World Bank W&rId droeJopmen, reporr 1993: inwsting in health. WashingtonDC: World BanklNew York: Oxford University Press, 1993.
8 Sommer A, West I<P. Vitamin A d4i~: health, suroival, a>td vision. NewYork and Oxford: Oxford University Press, 1996.
9 Beaton GH, MarroreU R, L'Abbe IV\, et aI. EffectifJen= ofvitamin A supplementation in the wnrro! at yuung child rnorlJiJity and morralizy in detJdopingcmmtri4 Torooro: University ofThronto; 1992. Final Repon to CIDA.
10 Muhilal, P=eisih D, Icliradinata YR, Muherdiyanriningsih, Karyadi D.Vitamin A-fortified. monosodium glutamate and health, growth, andsurvival of children: a contrOlled field trial. Am J Clin Nua 1988;48:1271-~ .
11 West KP Jr, Pokhrel RP, Katz J, er al. Efficacy of vitamin A in reducing preschool child mortality in Nepal. Lanut 1991;338:67-71.
12 Daulaire NMP, Starbuck ES, Houston RM, Church MS, Stukel TA, PandeyMIt Childhood mortality after a high dose of vitamin A in a high riskpopulation. EMJ 1992;304:207-10.
13 Vijayaraghavan Ie, RadhaJah G, Prakasam BS, Sarma KVR, Reddy V. Effectof massive dose vitamin A on morbidity and mortality in Indian children.Lanal 1990;ii:1342-5.
14 Ghana VAST Study Team. Vitamin A supplementation in northern Ghana:effects on clinic attendances, hospital admissions, and child mortality. Lancet 1993;342:7-12.
15 RahmathulJah 1., Underwood BA, Thulasiraj RD, er ai. Reduced monaliryamong children in Southern lndia receiving a small weeJdy dose ofvitaminA. N Eng!J Med 1990;323:929-35.
16 Herrera MG, Nestel P, El Amin A, Fawzi WW, Mohamed IV\, Weld LVitamin A supplementation and child survival. Lanat 1992;340:267-71.
17 Fawzi WW, Ch:un= TC, Herrera MG, Mnsteller F. Vitamin Asupplementation and child mortaliry. JAMA 1993;269:898-903.
18 Sommer A, Hussaini G, MuhilaI, Tarwotjo I, SusantO D, Saroso JS. Historyof nightblindness: a simple tool for xerophthalmia screening. Am J elmNurr 1980;33:887-91.
19 Milton RC, Reddy V; Naidu AN. Mild vitamin A deficiency and childhoodmorbidity-an Indian experience. Am J Clin Nua 1987;46:827-9.
20 Barrero ML, Santos LMP, Assis AMO, et aI. Effect ofvitamin A supplementation on diarthoea and acute lower-respiratory-traer infections in yOut1gchild!en in Brazil. lAncet 1994;344:228-31.
21 ElIison]B. Intensive vitamin therapy in measles. BM] 1932;ii:708-11.22 Barclay AlG, Foster A, Sommer A. Vitamin A supplements and mortality
,;elated. to measles: a randomised. clinical trial. EM] 1987;294:294-6.23 Hussey GD, Klein M. A randomised, controlled. trial of vitamin A in
children with severe measles. N EngtJ Med 1990;323:160-4.24 Coutsoudis A, Broughton M, Coovadia HM. Vitamin A supplementation
reduces measles morbidity in young African cbiJdren: a randotnised,placebo-coottOlled, double-blind trial. AmJ Clin Nurr 1991;54:890-5.
25 CoutsDudis A, Kiepiela P, Coovadia HM, Broughton M. Vitamin A supplementation enhances specific IgG antibody levels and total lymphocytenumbers while improving morbidiry in measles. l'ediatr Injecr Dis J1992;11:203-9.
26 Sommer A, Rahmathullah 1., Underwood E, et al. Potenlial interventions forthe prevention of childhood pneumonia in developing countries: ameta-analysis ofdata from field trials to assess the impaer ofvitamin A supplementation on pneumonia morbidity and mortality. Bull WHO 1995;73:609-19.
27 West KP Jr, Katz J, Shrestha SR, er aL Mortality of infants <6 mo of agesupplemented with vitamin A: a randomised, double-masked. trial in Nepal.Am J C/in Nurr 1995;62:143-8.
28 Humphrey]H, Agoeslina T, Wu 1.., e' aI. Impact of neonatal vitamin A supplementation on infant morbidity and mortality. J Ptdiou 1996;128:48996.
29 Mejia LA, Chew F. Haematological effect of supplementing anaemicchildren with vitamin A alone and in combination with iron. AmJ Clin Nurr1988;48:595-600.

The Duration of theEffect of Vitamin ASupplementation
The recent article by Ross et al. I
funher analyzes data from the carefullyconducted vitamin A intervention trials togarner evidence for whether large dosesupplementation at 4-month intervals provides optimal protection against excessmorbidity and mortality associated withvitamin A deficiency. Finding no significant decrement in impact in relation toeither the duration between last dose orcumUlative number of doses and subsequent mortality, the authors, and anaccompanying editorial,2 suggest the4-month interval may be optimally effective.
On the face of it, the results areindeed reassuring. However, they raiseanother question. If a 4-month interval ismaximally effective, and if the impact ofsupplements occurs by improving vitaminA status that is initially suboptimal, whydoes repeated periodic dosing work at all?Either there really is room for furtherimprovement in vitamin A status andtherefore its impact on morbidity andmortality (which seems most likely, sincea host of biochemical studies clearlydemonstrate the transient impact of periodic supplements on biochemical indicesof improved status),3 or the large dose isexerting its impact through a bolus effectby "spiking" vitamin A status. The latterseems equally unlikely given the briefperiod of "normal starus" enjoyed bysupplemented children versus the prolonged benefit thm ensues.
Letters to the Editor
These considerations suggest thatjust as in prevention of xerophthalmia.-I aperiodic large dose is protective longerthan measures of "biochemical indices"would suggest.s Hence the 4-month interval provides a sustained rate of protection,but probably one that is not as great as itwould be if the child were truly vitamin Areplete.
The editoriaI2 misses this importantpoint and compounds the problem bysuggesting that the 4-month interval ishighly protective, while a 6-month interval probably is not. The evidence presented to support this conclusion rests onthe absence of observed protection in twotrials using a 6-month interval in comparison with one in which a 34% (to 70%)6.7protection was observed. A number ofalternative explanations have been offeredto explain the absence of an observableimpact (at any interva! following supplementation) in the two aforementionedstudies.3.8 The simplest reasoning, however, belies the editorialist's explanation:if 4 months is accepted as an effectiveinterval, then even if 6 months were lessoptimal, one would expect two-thirds thebenefit of the 4-month interval rather thanno benefit at all! Expressed differently, theexpected benefit dUring months 1 through4 would need to be cancetted by anegative impact, of greater magnitude,during months 5 and 6.
In conclusion, it is reassuring to learnthat in the Ghana studies no diminutionoccurred in protection from excess morbidity and mortality with increasing durationfrom dosing. Four-month (or shorter)intervals between doses (the optimalbeing daily, smaller doses) over 6 monthsseems self-evident. While this analysisdoes not demonstrate that. it does raise thequestion why the vitamin A recipientsexhibited any benefit from sequentialdosing if 4-month intervals were optima!. 0
Alfred Sommer, MD, MRSKeith P. West, Jr, DrPH
The authors are with the School of Hygiene andPublic Health. Johns Hopkins Univeislty, Baltimore. Md.
Correspondence should be sent to AlfredSommer. MD. MHS. The Johns Hopkins University School of Hygiene and Public Health. 615N Wolfe St., Ballimore. MD 21205-2179.
References1. Ross DA, Kirkwood SR. Sinka FN. el at
Child morbidity and mortality followingvitamin A supplementation in Ghana: timesince dosing. number of doses. and lime ofyear. Am J Public Health 1995:85:1246125 J.
2. Underwood BA. The timing of high-dosevitamin A supplementation to children. Am JPublic Health. 1995:85:l200-120l.
3. Sommer A. West KP Jr. Vitamin A Deficiencv: Health, Survival, and Vision. NewYork; NY: Oxford University Press 1996 (inpress).
4. Sommer A. Nutritional Blindness: Xerophthalmia and Keratomalacia. New York, NY:Oxford University Press; 1982.
5. West KP Jr, Sommer A. Delivery of oraldoses of vitamin A to prevent vitamin Adeficiency and nutritional blindness. A stateof-the-an review. Rome. Italy: ACClSCNSecretarial; 1987. United Nations ACCtSCN Nutrition Policy Discussion Paper No.Z.
6. Sommer A, Tarwotjo I, Djunaedi E, et alImpact of vitamin A supplementation onchildhood mortality. A modornised controlled community trial. Lancet. 1986;1:1169-1173.
7. Tarwotjo 1, Sommer A, West KP, et al.Influence of participation on mortality in amodornized trial of vitamin A prophylaxis.Am} Clin Nutr. 1987;45:1466-147l.
8. Beaton GH, Manorell R, L' Abbe KA, et at.Effectiveness of vitamin A supplementationin the control of young child morbidity andmortality in developing countries. FinalReport to CIDA. International NunitionProgram. Department of Nunitional Sciences. Faculty of Medicine. University ofToronto: 1992.
American Journal of Public Health 46iMarch 1997. Vol. 87. No.3 ~68
t.f1/

NUTRITION AND EPIDEMIOLOGY
GUEST EDITOR
SUSHMA PALMER, DSC
Nurririon Vol. 13. No.5. [997
Central European Center for Health and the Environment (CECHE), Washington, DC
Vitamin A Deficiency, Child Health,and Survival
While populations of wealthier countries seek the putative benefits of nearphannacologic levels of antioxidants(including vitamin A) as protectionfrom chronic diseases associated withaging, scientific evidence accumulatedover the past two decades has confirmedbeyond reasonable doubt that excesschildhood morbidity and mortality is attributable to classic vitamin A deficiency, a condition prevalent throughoutthe developing world. l From the relativedisbelief that accompanied the firstmodem description of the associationbetween deficiency and increased childhood mortality, Z to the ability of intervention programs to reverse it, 3 improvement in the vitamin A status ofdeficient populations has become amainstream international health goal. 4.5
Two decades ago, less than six countrieswere concerned about the problem.Now, over 60 countries worldwide haveestablished plans or programs to addressvitamin A deficiency, including theUnited States.6
Despite periodic reports earlier inthis century that vitamin A deficiencyaffected growth, measles mortality, andpotentially a host of other health outcomes, physicians largely focused onthe dramatic ocular changes ("xerophthalmia"). The earliest of these ocularchanges, nightblindness and Bito!' sspots, virtually defined "mild deficiency" and the biochemical criteria associated with it.' This conceptual framework has now been completely revised:ocular abnormalities reflect moderate tosevere deficiency. with clinically relevant implications arising earlier in'{heprocess and at milder degrees of impaired vitamin A statu5.!
Childhood mortality rates increase indirect proportion to the severity of defi-
Nulrition 13:484-485, 1997©Elsevier Science Inc. 1997Printed in the L'SA. All rights reserved.
ciency,2 beginning before ocular changesare clinically apparent. I Indeed, amongpopulations where xerophthalmia is rareor absent, 6 this is a fact consistent withthe high prevalence of milder manifestations of physiologic disturbance. 1.9 Metaanalyses of community-based prophylaxis trials indicate that improvement invitamin A status reduces preschool-age(6 mo to 6 y) mortality by 20 to 70%,depending upon the severity of underlying deficiency, the degree to which vitamin A status was improved, and the relative contribution of underlying diseasesto all-cause mortality.I.1O
Most childhood mortality associated with vitamin A deficiency appearsto be related to the severity and notthe incidence of infectious disease, 8
particularly chronic diarrhea and measles. 1 Indeed, treatment of moderate tosevere measles reduces the severity ofcomplications and cUts mortality inhalf, 11-13 the same degree of measlesmortality reduction associated withcommunity-based prophylaxis.! Sincetreatment of measles with high-dosevitamin A produces the same degreeof reduction in measles-associatedmortality as vitamin A administeredprophylactically in community settings, it is likely that the accompanying reduction in deaths, in both instances. is attributable to improvementin vitamin A status.
The mechanism( s) by which vitaminA status influences the severity of infectious diseases is undoubtedty complex,involving the barrier function of epithelial linings (altered early in deficiency)as well as humoral and cell-mediated immunity.14.15 •
Vitamin A also affects differentiationand development of a host of tissues andorgans, which probably accounts for its
ELSEVIER
role in immunity, growth, xerophthalmia, and iron metabolism (and associated anemia), 16 That this long-known vitamin, first discovered in 1913, shouldhave such profound and multifaceted effects is no longer surprising: vitamin Aregulates the expression of over 300genes, many of which respond within 1h to oral administration of vitamin A.
It is now estimated that vitamin A defiCiency accounts for 1 to 3 million childhood deaths, 5 to 10 million cases ofxerophthalmia, and half a million childrenbeing blinded each year.!7 The impact ofdeficiency on morbidity and mortalityamong older children and adults, particularly anemia and chronic infectious diseases, is as yet unquantified. Recent inter-·est has focused on the potential role ofvitamin A status in modulating the effectsof HIV infection, particularly verticaltransmission from mother to infant. 18
Many unresolved scientific questionsremain, particularly the role ·and clinicalimpact of varying levels of vitamin Astatus, especially "mild" deficiency(e.g., serum vitamin A of 20-30 J1.gldL), a condition that only a decade agowas considered to be within "normal"limits.
The most pressing health issue, however, is to act upon knowledge alreadyat hand: finding innovative ways to improve the vitamin A status of deficientpopulations. This will require local political commitment and a practical combination of intervention strategies appropriate to the local determinants of deficiency, including c,\lIturaI preferences,environment, and resources availablewithin the target population (s). Successful interventions usually include somecombination of education and socialmarketing (to increase intake of vitaminA-rich foods), fortification of a com-
0899-9007/97/S(7.00 \'?PI! S0899-9007(97)OOOI3-0 4' I}

VITAMIN A DEFICIENCY, CHILD HEALTH, AND SURVIVAL -485
, monly consumed item, and/or periodicsupplementation. Vitamin A deficiencyhas virtually disappeared from Singapore, Malaysia, and large areas of China,concomitant with dramatic improvements in economic stat;us. Indonesia radically reduced the prevalence of xerophthalmia, if not the eradication of milderdeficiency, through dedicated employment of a combination _of programs,moving initially from dependence oncostly vertically targeted approaches toones that were integrated into an expanding primary health infrastructure.19
With dedication and leadership, the samecan occur elsewhere.
ALFRED SOMMER, MD, MHSDean and Professor
Johns Hopkins School of Hygiene &Public Health
Baltimore, MD, USA
REFERENCESL Sommer A, West 'KP. Vitamin A defi
ciency: health, survival, and vision. NewYork: Oxford University Press, 1996
2. Sommer A, Hussaini G, Tarwotjo I, Susanto D. Increased monality in childrenwith mild vitamin A deficiency. Lancet1983;2:585
3. Sommer A, Tarwotjo I, Djunaedi E, et al.Impact of vitamin A supplementation on
childhood mortality. A randomised controlled community trial. Lancet 1986;1:1169
4. UN/ACC/SCN. Focus on micronutrients.SCN News 1993;9:1
5. World Declaration and Plan of Action forNutrition. International Conference onNutrition. Food and Agriculture Organization and the World Health Organization,Rome, Italy, 1992
6. Conunittee on Infectious Diseases. Vitamin A treatment of measles. Pediatrics1993;91:1014
7. Control of vitamin A deficiency and xe·rophthalmia. Report of a Joint WHO/UNICEF/USAID/Helen Keller International IVACG Meeting. WHO TechnicalReport Series 672. Geneva: World HealthOeganization, 1982:1
8. Ghana VAST Study Team. Vitamin Asupplementation in northern Ghana: effects on clinic attendances, hospital admissions. and child mortality. Lancet1993;342:7
9. Natadisastra G, Wittpenn m: Muhilal, etal. Impression cytology: a pmctical indexof vitamin A status. Am J Clin Nutr1988;48:695
10. Beaton GH, Manorell R, L'Abbe KA. etal. Effectiveness of vitamin A supplementation in the control of young child moebidity !!IJ,d mortality in developing countries. Final Report to CIDA, University ofToronto. Canada 1992
11. Barclay AJG, Foster A. Sommer A. Vitamin A supplements and mortality relatedto measles: a randomised clinical trial. BrMed J 1987;294:294
12. Coutsoudis A. Broughton M, CoovadiaHM. Vitamin A supplementation reducesmeasles morbidity in young African children: a randomized, placebo-controlled,double-blind trial. Am J Clin Nutr 1991;54:890
13. Hussey GO, Klein M. A randomized, con·trolled trial of vitamin A in children withsevere measles. N Eng! J Med 1990;323:160
14. Coutsoudis A, Kiepiela P, Coovadia HM.Broughton M. Vitamin A supp1ementationenhances specific IgG antibody levels andtotal lymphocyte numbers while improving morbidity inmeasles. Pediatr Infect .Dis J 1992;Il:203
15. Semba RD, Muhilal, Scon AL, et al. Depressed immune response 10 letanus inchildren with vitamin A deficiency. J Nutr1992; 122:101
16. Mejia LA, Chew F. Hematological effectofsupplementing anemic children with vitamin A alone and in combination withiron. Am J Clin Nutr 1988;48:595
17. Humphfey JR. West KP, Je, Sommer A.Vitamin A deficiency and attributable!'110rtality among under-5-year-olds. BullWHO 1992;70:225
18. Semba RD, Miotti PG, Chiphangwi m.et al. Maternal vitamin A deficiency andmother-lo-child transmission of HIV-1.
, Lancet 1994;343:159319. Muhilal. Tarwotjo I. Kodyat B, et al.
Changing prevalence of xerophthalmia inIndonesia. 1977-1992. Eur J ain Nutr1994;48:708
/

.'
Community and International Nutrition
Effects of Vitamin A on Growth of Vitamin A-Deficient Children: FieldStudies in Nepal1,2.3
Keith P. West, Jr.,4 Steven C. LeClerq, Sharada R. Shrestha,* Lee S.-F. Wu,Elizabeth K. Pradhan, Subarna K. Khatry,* Joanne Katz, Ramesh Adhikaritand Alfred Sommer
The Center for Human Nutrition (CHN), Department of International Health and the Dana Center forPreventive Ophthalmology (DCPO), the Johns Hopkins Schools of Public Health and Medicine, Baltimore,MD 21205; *The Nepal Nutrition Intervention Project~Sarlahi (NNlPS) and the National Society for thePrevention of Blindness, Kathmandu, Nepal; and the tDepartment of Pediatrics and Kanti Children's Hospital,Tribhuvan University, Kathmandu, Nepal.
ABSTRACT Inconsistencies have been observed in the impact of vitamin A 01A) supplementation on early childgrowth. To help clarify this issue, a cohort of 3377 rural Nepalese, nonxerophthalmic children 12-60 mo of agewere randomized by ward to receive vitamin A [60,000 ,ug retinol equivalents (RE)J or placebo-control (300 RE)supplementation once every 4 mo and followed for 16 mo. VA had no impact on annual weight gain or lineargrowth. However, arm circumference (AC) and muscle area (MA) growth improved in VA recipients, by 0.13 emand 25 mm2
, respectively, over controls. Growth of children with xerophthalmia, Who were treated with 2: 120,000RE at base line, was also compared to that of nonxerophthalmic children, stratified by initial wasting status, andadjusted for sex, baseline age and measurement status. Among initially nonwasted children (AC 2: 13.5 cm), VAtreated xerophthalmic children (n = 86) gained 0.7 cm more in linear growth than nonxerophthalmic children.Among initially wasted children (AC < 13.5 em), VA-treated children (n = 34) gained additional weight (672 g),height (~1 cm), muscle (76 mm2j and fat (79 mm2j areas, and subscapular skinfold (1.3 mm) compared to changesobserved in nonxerophthalmic children. Relative increments in soft tissue growth occurred within 4 mo of VAtreatment, while the effect on linear growth was gradual. Moderate-lo-severe VA deficiency, marked by xerophthalmia, is likely to impair normal physical growth, but milder stages of deficiency may not have this effect in ruralSouth Asia. J. Nutr. 127: 1957-1965, 1997.
KEY WORDS: • Vitamin A deficiency • xerophthalmia • growth • community trial • children
Vitamin A deficiency is an important child heaLth problemin many developing countries, with consequences ranging frompotentially blinding xerophthaLmia to increased risks of infection and mortality (Sommer and West 1996). Increased vitamin A intake, achieved by supplementation or fortification offood stuffs, confers a clear survival benefit to young children(Beaton et a1. 1993, Sommer and West 1996).
Vitamin A is an essential nutrient for mammalian growth(McCollum and Davis 1913) but it has been difficult to dem-
1 This study was carried out under Cooperative Agreement No. DAN 0045A-OO·5094-00 between the Office of Health and Nutrition, U.S. Agency for Intema-
• tional Development (USAID), Washington, DC and the CHN/DCPO, The JohnsHopkins University, Baltimore, MD, USA, with financial and technical assistancefrom Task Force Sight and Life (Roche, Basel), the United Nations Children'sFund (UNICEF), Nepal and NIH grant no. RR04060.
~ The costs of publication of this article were defrayed in part by the paymentof page charges. This article must therefore be hereby marked "advertisement"in accordance with 18 USC section 1734 solely to indicate this fact.
3 The Sarlahi Study Group (in addition to the authors) include Drs. R.P. Pokhrei, B.D. Chataut, D. Calder, J. Gmunder, J. Humphrey, J. nelsch, H. Taylor, M.R.Pandey; Mr. D. Piet, J. Canner, N.N. Achariya, D.N. Mandai, T.R. Sakya, B.B.Shrestha and R.K. Shrestha.
4 To Whom cOrTespondence and reprint requests should be addressed,e-mail;[email protected]
onstrate the effect of vitamin A deficiency on the growth ofchildren. The motivation to verify an effect of vitamin Adeficiency on growth and hence extend the assertion ofMcCollum and Davis to the human, is less to influence publicpolicy (since aims to prevent childhood blindness and mortality suffice in this regard) than to understand the sum of healtheffects that can be attributed to vitamin A deficiency and itsprevention in populations where other nutritional ds:hciencies,infection and mortality are common in children. It is theworking hypothesis of this paper that moderate-tO-severe vitamin A deficiency, marked by the presence of night blindnessor clinical eye signs, can and does impair physical growth inyoung children compared to the growth of generally wastedand stunted children who are also likely to be deficient invitamin A, but lack eye signs of xerophchalmia.
Clinical vitamin A deficiency has long been linked to poorchild growth on a cross-sectional basis; often the more severethe eye signs, the more severe the stunting and wasting (Sommer 1982). Children who develop mild xerophthalmia (nightblindness or Bitot's Spots) also show less weight gain and lineargrowth than their nonxerophthalmic peers. Conversely, improved weight gain can accompany spontaneous recovery fromxerophthalmia, although catch-up linear growth is less evident
0022·3166/97 $3.00 © 1997 American Society for Nutritional Sciences.Manuscript received 11 March 1996. [nitial review completed 30 May 1996. Revision accepted 12 June 1997.
1957

1958 WEST ET AL.
FIGURE 1 StUdy design and number of wards and children enrolled in the growth cohort. by supplement group and clinical status atbaseline.
130
t
1617
Normal
I ,I ,
Number of Children .•••• -----.--•••• -'
1760..~----------------_.
131
t Randomly
~~ Selected /~
Normal I IXerophthalmic I120
261 Wards
+Randomized
......v-it-a-min--A-l~ ..............1r--c-o-n-t-rO-I-
(Tarwotjo et aL 1992). These associations may represent adirect effect of vitamin A nutriture on growth or they may beindirect, mediated by other co-varying nutritional and morbidstates that can effect growth. Vitamin A supplementation trialshave produced mixed results, ranging from improved ponderal(West et al. 1988) or linear (Muhilal et a1. 1988) growth tolittle or no discemable effects (Brown et al. 1980, Fawzi et al.1997, Lie et al. 1993, Rahmathullah et aL 1991, Ramakrishnanet al. 1995) in nonxerophthalmic children, casting doubtabout the importance of vitamin A as a determinant of childgrowth in free-living populatiOns (Ramakrishnan et a1. 1995).
Here we report the impact of periodic vitamin A supplementation on pondera!, linear and body compositional growthof nonxerophthalmic children participating in a randomized,double-masked community trial. We also explore the hypothesis that vitamin A repletion of moderately-to-severely deficientchildren, marked by the presence of xerophthalmia, can improve growth under rural conditions where other forms ofchildhood malnutrition, infection and risk of mortality aremoderately severe and widespread.
METHODS
The impact on growth of high-potency vitamin A supplementation once every 4 mo was assessed over a 16-mo period in a randomlysampled cohort of preschool-aged children participating in a doublemasked, randomized, placebo-controlled community trial in the terai(plains) district of Sariahi, Nepal. Field work was conducted betweenSeptember, 1989 and December, 1991. The design (West et al. 1991),procedures (Pradhan et al. 1994) and findings of the trial related tothe impact of vitamin A on mortality (Pokhrel et al. 1994, West. etal. 1991 and 1995) and xerophthalmia (Katz et al. 1995) have beenreported. We have also attempted to assess the growth impact ofvitamin A on moderately-to-severely vitamin A-deficient childrenby comparing within each supplement group the growth responses ofchildren with xerophthalmia, who were treated with vitamin A atbase line irrespective of their random assignmenr, with the growthof nonxerophthalmic children, adjusting for multiple potential confounders.
Briefly, 261 wards in Sadahi District were randomly assigned tovitamin A (n = 131) or control (n = 130) supplement status. Twentywards were randomly sampled from each of these two groups to investigate the impact of vitamin A on growth. This analysis is restrictedto a cohort of children 12-60 mo of age at the outset (the agerange for xerophthalmia in this study). At base line, children wereenumerated and dosed with ward-assigned, coded capsules of identicalappearance containing either 60,000 f.Lg retinal equivalents (RE)5(200,000 IU "vitamin A") Ot 300 f.Lg RE (1000 IU) ("control") ofvitamin A as retinyl palmitate. plus 40 IU of vitamin E (a gift ofRoche, Basel, Switzerland). Seven-day morbidity histories were obtained. Parents or guardians brought their children to a central sitefor ocular examination and nutritional assessment. Xerophthalmiawas diagnosed by standard, clinical criteria (Sommer 1995) and byprobing for a history of nightblindness using a local term (rataundhi)(Khatry et al. 1995). Cases in both groups were treated with 120,000f.Lg RE of vitamin A (one capsule at presentation and a second takenthe next day) and referred to local health posts for clinical followup and further treatment, if indicated. Masking was preserved for thepurpose of the triaL Thus; children in the vitamin A group receiveda (coded) vitamin A supplement in their home just prior to examination, providing them with a total dose of 180,000 f.Lg RE. Childrenin the control group received their assigned placebo supplement athome. Children continued to be visited at home every 4 mo anddosed according to their ward allocation in the trial. This designproduced four supplemenr-clinical status groups: nonxerophthalmic
• Abbreviations used: AC. arm circumference; CL, 95% confidence limits; FA,fat area; HAZ. height-far-age Z-score; HT, height; MA. muscle area; RE, retinolequivalent; SS. subscapular skinfold; TS; tricipital skinfold; VA. vitamin A; WAZ.weight-far-age Z-score; WHZ, weight-for-height Z-score; 'NT, weight.
children receiving vitamin A or placebo-control supplements every4 mo and children with xerophthalmia at base line in each of thesetwo groups (Fig. 1). Having all received at least 120,000 /-lg RE atthe outset, cases of xerophthalmia in both supplement groups havebeen pooled for the growth analysis presented here, except wherenoted.
Baseline anthropometry included 1) weight (WT) measured whenchildren were naked or lightly clad, read to the nearest 0.1 kg on ahanging spring scale (Salter Ltd, UK) and calibrated daily' againstknown, standard weights; 2) standing height (;=,: 24 mo) or recumbentlength (12-23 mol (HT), read to the nearest o.t cm on a steel tapeattached to a wooden board with a foot-plate and sliding head block(Shorr Productions, Woonsocket, RI); 3) left mid-upper arm circumference (AC), read to the nearest 0.1 cm using a Zerfas insertiontape (Zerfas 1975); and 4) skinfold thickness, obtained to the nearesto.t mm after 2-4 seconds' application of a caliper to the left tricipital(TS) and subscapular (SS) sites (Holtain Ltd, Crosswell, Crymch,Wales, UK). The median of 3 or 5 independent readings was recordedfor each measurement, except for weight which was usually read onceafter the pointer on the scale was steady for;=,: 2 s. Measurements wereperformed by a team of four trained anthropometrists: one observerassistant pair assigned to measure WT and HT and a second pair tomeasure AC and skinfolds.
Household visits and anthropometry at the central site (WT, HTand AC) were repeated every 4 mo for 16 mo (5 visits) by the sameteam. Skinfolds (TS and S5) were remeasured only at the 16-movisit, the final visit during which children of this age were in thetrial (Pokhrel et a!. 1994).
Inttateam measurement error was monitored by independentlyrepeating all anthropometry 1-2 h later in a random 5% sample ofchildren at the central site during each visit (n = 411-414 replicatesfor WT, HT and AC and n = 75 for TS and SS). The mean technicalerror, expressed as a standard deviation (SD = JI.d2f2n, where d= the difference between paired measurements and n = the numberof children) was 76 g for WT, 0.35 cm for HT, 0.14 cm for AC, 0.34mm for TS and 0.27 mm for SS.
In addition to actual measurements, estimates of cross-sectionalupper arm muscle (plus humoral bone) (MA) and fat (FA) areas asindicators of apparent body muscle and subcutaneous fat mass (Gibson (990), respectively, were derived from AC and TS measurementsby standard formulas (Frisancho 1981). Weight-for-height, heightfor-age and weight-for-age values were expressed as standard normaldeviates (Z-scores, or WHZ, HAZ and WAZ, respectively) based onthe National Center for Health Statistics. median age-sex-specificvalues for American children- (Hamill et al. 1977).
Group differences at base line were evaluated by XZ for discreetvariables and unalysis of variance for continuous variables. Differences

GROWTH IN VITAMIN A-DEFICIENT CHILDREN 1959
in 4-, 8-, 12- and 16-mo growth increments were compared between1) randomized groups of nonxerophtha1mic children and 2) xerophthalmic and nonxerophthalmic children, by multivariable linear regression adjusted for age (in mo), the baseline value of the specificmeasurement or indicator being compared, and sex of the child(Kleinbaum and Kupper 1978). Beta-coefficients provided estimatesof the adjusted cumulative growth effects of vitamin A supplementation relative to placebo receipt in the randomized groups. For comparisons between xerophthalmic and nonxerophthalmic children, thebeta-coefficients represent the incremental growth of vitamin Atreated children with xerophthalmia over (or under) the growth rateof nonxerophthalmic children. It became apparent during analysisthat, in this population, ann circumference (AC) size was an imponant effect modifier for observed growth responses to vitamin A.Therefore, growth comparisons were stratified by initial AC size,< 13.5 and ;:= 13.5 em, representing children who were wasted andnot wasted, respectively, at the outset. Ninety-five percent confidencelimits (CL) for relative increments were derived from the standarderrors (SEM) of the regression coefficients.
Additional regression analyses were carried out to compare growthincrements between randomized groups and between xerophthalmicand nonxerophthalmic children, adjusting for other potential influences such as baseline morbidity (using diarrhea defined as ;:=1 dayof ;:=4 loose watery stools the previous· week as a proxy), breastfeedingstatus at the outset (visit l) and at the relevant visit ending aninterval (yes vs. no), and education of the head of household (anyvs. none) as a proxy for socioeconomic status. These adjustments hadno significant or discemable effects on growth outcomes, but decreased the effective sample size by about one-third for each comparison due to missing data obtained either by design (e.g., morbiditydata were only collected for children who were under parental observation the entire previous week) or due to non-responses on someof these variables. Thus, only findings adjusted by age, baseline statusand sex are presented to preserve sample size and power.
Participation of families and their children in the smdy was voluntary. Written and verbal disclosures were made about the study to
participating communities and households, respectively, and studyprocedures were approved by the Nepal Health Research Council,Kathmandu, Nepal and the Joint Committee on Clinical Investigation, the Johns Hopkins School of Medicine, Baltimore, MD, USA.
RESULTS
Baseline comparisons. A total 00811 children 12-60 moof age were recruited at base line (n = 1991 in the vitaminA group; n = 1820 in the control group). Of these, 3497 (92%of all eligible; 91 % in the vitamin A group and 93% of controls) obtained an eye exam and anthropometry at a centralsite (Table 1): 1760 nonxerophthalmic and 52 xerophthalmicchildren in the vitamin A group and 1617 nonxerophthalmicand 68 xerophthalmic children in the control group. Thesechildren constitute the present growth cohort. Of all clinicallynormal children in both supplement groups assessed at baseline, 87-91% were remeasured at 4, 8 and 12 mo; 84% inboth groups were remeasured at 16 mo. Comparable followup was achieved for xerophthalmic children with ~80% followed to completion. Follow-up was similar by gender (notshown) and initial wasting status (Table 1).
Nonxerophthalmic children in the twO randomized groupswere comparable except for a 0.21 cm larger AC (and largerconstituent MA) among controls (Table 2). Xerophthalmicchildren in the twO supplement groups were similar in allbaseline characteristics (not shown). However, xerophthalmicchildren were older (by ~7 mo), less likely to be breastfeeding(15 vs. ~4Z%), and came from more socioeconomically deprived homes than nonxerophthalmic children (Table 2)(Khatry et a1. 1995).
Baseline anthropometric profiles of nonxerophthalmic andxerophthalmic children were compared between and withineach AC stratum. Wasted children, with an AC < 13.5 em,
TABLE 1
Numbers of children receiving anthropometry by visit,supplement-clinical status and initial arm circumference1
Nonxerophthalmicchildren
XerophthalmicVisit Vitamin A Control children Total
n
Baseline 1760 1617 120 3497(100%) (100%) (100%) (100%)
<13.5 em 681 506 34 12212:13.5 em 1078 1109 86 2273
4 months 1592 1450 104 3150(90%) (90%) (87%) (90%)
<13.5 em 617 445 30 1092"2:13.5 em 975 1005 74 2054
8 months 1599 1434 98 3139(91%) (89%) (82%) (90%)
<13.5 em 620 438 27 10852:13.5 em 979 996 71 2046
12 months 1578 1405 100 3095(90%) (87%) (83%) (89%)
<13.5 em 604 429 26 10592:13.5 em 974 976 74 2024
16 months 1481 1361 96 2954(84%) (84%) (80%) (84%)
<13.5 cm 587 439 25 1051~13.5 em 894 922 71 1887
1 Maximum number measured at each follow-up visit. Maximumnumber of missing values for one or more measurements at 4, 8, 12and 16 mo for the nonxerophthalmie vitamin A group = 5, 4, 26 andcontrol group'" 5, 2, 19 and 5; and 0, 1, 0 and 0 for all xerophthalmicchildren.
had lower WHl, WAl and HAl scores (Fig. 2A), smallerSS and AC values (Fig. 28) and less MA and FA (Fig. 2C)than children who were not wasted (all P < 0.0001). For allindicators, nonwasted xerophthalmic and nonxerophthalmicchildren were comparable. However, wasted children with xerophthalmia were still more stunted and acutely malnourishedthan nonxerophthalmic children wirh an AC < 13.5 em,significantly so for HAZ, W Al, 55, AC and MA (all P <0.01) and FA (P < 0.03). Also, eye signs of xerophthalmiatended to be more severe in wasted than nonwasted children(66% vs. 55% with Bitet's spots, 2% vs. 0% wtth cornealxerosis, respectively).
Growth effects in nonxerophthalmic children. Findingsfrom the randomized trial show that four months after initialdosing (after the major rice harvest in November and December) vitamin A-dosed children gained 121 g less weight [and0.11 less in WHZ (95% CL: -0.16, -0.07)] than controls;the effect was comparable by baseline AC status (Table 3).This relative decrement was offset by relative weight gain overthe next 8 mo (encompassing the late dry and early monsoonseason) such that, after 12 mo, vitamin A recipients had gainedan average of 38 g more than controls (not significant). After16 mo (and a second peri-harvest interval) children receivingvitamin A had again gained less total weight than controls(-72 g, -0.06 WHl, 95% CL: -0.10, -0.02). Differencesbetween groups in weight gain were comparable by baselineAC (Table 3), sex and age (not shown).
There was no effect of vitamin A on linear growth (0.05cm and 0.01 HAl at 16 mo), except for a small increase of0.13 cm after 12 mo among nonwasted vitamin A recipients(Table 3). Arm circumferential growth of vitamin A recipients

1960 WEST IT AL.
TABLE 2
Baseline child and household characteristics (at visit 1) by randomized supplement group and xerophthafmia status
Nonxerophthalmic childrenXerophthalmic
Characteristic Vitamin A Control children
Childn 1760 1617 120Age,1 mo 35:!: 14 35:!: 14 42:!: 115Male, % 52.9 52.5 55.0Breastfed, % 42.2 43.1 15.05
Nutritional status1,2wr, kg 10.83 :!: 2.52 10.81 :!: 2.49 11 .50 :!: 2.434HT, em 84.3 :!: 9.9 84.4 :!: 9.9 88.0 :!: 9.105HAZ -2.46:!: 1.25 -2.44 :!: 1.25 -2.63:!: 1.50WAZ -2.23 :!: 0.95 -2.25 :!: 0.95 -2.36:!: 1.89WHZ -1.01 :!: 0.82 -1.05 :!: 0.82 -1.11 :!: 0.89AC,cm 13.71 :!: 1.133 13.92:!: 1.14 13.77 :!: 1.41
MA,2mm 1066 :!: 1823 1104:!: 181 1087 :!: 210FA,2 mm 440 :!: 111 449 :!: 108 437 ± 127SS,mm 5.8 ± 1.3 5.8 ± 1.3 5.7:!: 1.6
Morbidity past week, %Diarrhea 12.2 10.8 10.0Cough 16.1 15.1 20.8Fever 15.5 18.2 22.5
HouseholdMother
n 1295 1186 114Age,1 y 28 ± 7 28:!: 6 29:!: 6Any education, % 8.3 7.8 2.64
Headn 1234 1123 108Any education, % 33.1 31.6 17.65Laborer, % 22.1 19.5 39.85
1 Mean ± standard deviation.2 WT = weight; HT = height; HAZ, WAZ, WHZ = z-scores for HT-for-age, WT-for-age and WT-for-HT, respectively; AC .. (left) upper ann
circumference; MA, FA = (left) upper arm muscle and fat areas, respectively; SS = (left) subcapsular skinfold3 Difference between vitamin A and control children, P < 0.0014 Difference between xerophthalmic and all nonxerophthalmic children/households, P < 0.05.S Difference between xerophthalmic and all nonxerophthalmJc childrenlhouseholds, P .s 0.001.
increased 0.16 em over that of controls in the first 4 rna,more apparent in nonwasted children. This increment, whichpersisted, was associated with a 25 mmz (or 32%) increase inarm MA over the growth in MA of nonxerophthalmic children(Table 4) which had increased by a total of 77 mm2 (mean)over the 16-mo period (not shown). No differences between groups were observed in rates of change in FA and SS(Table 4).
Growth of xerophthalmic vs. nonxerophthalmic chilldren. The apparent ponderal growth response of xerophthalmic children to vitamin A, analyzed outside the randomizeddesign, differed markedly by initial wasting status, whereas thelinear growth response was more uniform across AC strata,compared to their nonxerophthalmic peers (Table 5).
Wasted xerophthalmic children gained 644 g more inweight during the first 4 mo than nonxerophthalmic, wastedchildren, representing an 84% increase over the mean 4month gain of 765 g in the latter group. The initial incrementwas accompanied by relative improvement in weight-forheight, by 0.57 WHZ (95% CL: 0.37, 0.77), reflecting early,preferential gain in soft tissue. This weight increment persistedfor the duration of the study. Relative change in AC growthparalleled that of weight gain: there was an initial increase of0.77 cm in arm circumferential growth of wasted xerophthalmic children compared to wasted nonxerophthalmic children.
The increment persisted through the 16-month follow-up(0.71 cm), by which time wasted xerophthalmics showed additional gains in MA of 76 mmzand FA of79 mm2 over arm areagains in other initially wasted children (Table 4). Subscapularskinfolds also preferentially increased in wasted-xerophthalmics, by 1.31 mm. Linear growth (6.HT in Table 5) of wastedxerophthalmics gradually accelerated over that of wasted nonxerophthalmic children, showing cumulative relative increments of 0.20, 0.49, 0.74 and 0.97 em by 16 mo, representinga 10% increase over the mean linear growth (of 9.8 em) inthe latter group over this time.
Vitamin A treatment was associated with modest, gradualweight gain (196 g by 16 mo) in initially nonwasted xerophthalmics (AC ~ 13.5 cm) compared to the weight gain oftheir nonwasted, nonxerophthalmic peers (Table 5). Lineargrowth of xerophthalmics also improved, by 0.69 em after 16mo, representing 8% of the mean gain in height (of 9.2 cm)of nonxerophthalmic children. However, nonwasted xerophthalmics showed no advantage in changed weight-far-height(with relative increments varying from -0.04 to -om WHZ,all not significant), AC (Table 5), MA, FA or SS (Table 4),indicating that the relative gain in weight was pondostatural.Supporting this interpretation, the 196 g weight gain advantage of VA-treated xerophthalmics was no longer evident once6.HT was introduced into the regression equation (b = 70 g)

GROWTH IN VITAMIN A-DEFICIENT CHILDREN 1961
2Ac::J Wasted XeromJ Wasted Non-xero_ Non-wasted Xero_ Non-wasted Non.xero
HAl
WHZ
ss
c::J Wasted Xerom Wasted N'on'xoro_ Non-wasted XefO_ Non-wallted Non-Itero
28
16
14
en 12en
E10E...
0
~ 8
E<,) 6
4
Z
0AC
A.:m Circumfe..nce lAC) an4 Subscapular 5klnfol4 (SS)
FIGURE 2 Baseline anthropometric status of children by arm circumference (AC < 13.5 em, wasted; AC 2= 13.5, nonwasted) and xerophthalmic status (Xero vs. Nonxero). A: Z-scores for height-far-age(HAZ), weight-far-age !YVAZ) and weight-far-height (WHZ); B: arm circumference (AC) and subscapular skinfold (SS) thickness; and C: leftmid-upper arm muscle (MA) and fat (FA) areas. All differences betweennonwasted and wasted children are statistically significant, P < 0.0001.No comparisons between nonwasted Xero and Nonxero children aresignificant, all 0.15 < P < 0.90. All differences between wasted Xeroand Nonxero children are significant (P :s 0.03), except for WHZ (P >0.1).
-5.0 -4.5 -4.0 -3.5 -3.0 -2.5 -2.0 -1.5 -1.0 -0.5 0.0
Z-seore Value2C
c:J Wasted Xero1400 ~ Wasted Non-xero
_ Non-wasted Xero_ NOR-wasted NOR·xero
1200
1000
1 800!«
600
400
200
0MA FA
Ann Muscle (MA) .n4 Fat (FA) Areas
containing age, sex, baseline WT and other covariates suggesting that the differential in weight gain was latgely due toa difference in height gain between groups.
Adding an interacrion term in each regression for xerophthalmia X AC showed highly significant interactions (P< 0.001 for all) for .6.WT, .6.WAZ, .6.WHZ and .6.AC andinsignificant interactions for .6.HT and .6.HAZ (P > 0.4 forall) during each cumulative interval, and strong interactions(P < o.ot for all) for 16-mo differences in MA, FA and SS,
as Tables 5 and 6, respectively, indicate. The size of interactionbetween effects in xerophrhalmic children with a low vs.higher AC can be estimated by subtracting the coefficientvalues for children with AC > 13.5 cm from values for children with AC < L3j cm (e.g., 621 g difference in weightgain between AC groups from 0-4 mo).
Also, adding a xerophrhalmia X supplemenr group interaction to each regression showed that continuously VA-supplemented xerophthalmics gained more fat by 16 mo than cases

1962 WEST IT AL.
TABLE 3
Cumulative differences in growth by inteIVal and baseline arm circumference (AG) between nonxerophthalmic children, 12-60 moof age at baseline, randomized to vitamin A or placebo control supplements eve/}' four months1
Follow-up interval
0-4 monthsAC < 13.5 cmAC:o: 13.5 em
0-8 monthsAC < 13.5 emAC:o: 13.5 em
0-12 monthsAC < 13.5 emAC;;,: 13.5 cm
0-16 monthsAC < 13.5 cmAC 2: 13.5 cm
b
-121-123-108-53-32-60
384824
-72-80-64
9
95% CL3
(-159, -93)(-190, -56)(-155, -61)(-73, -33)(-103, 39)(-109, -12)(-4, -70)(-28, 124)(-29, 77)(-125, -19)(-172,12)(-127, -1)
b
0.020.050.030.00
-0.060.060.070.000.130.050.000.11
ll. HT
95% CL3
cm
(-0.04.0.08)(-0.09.0.19)(-0.05.0.11)(-0.08,0.08)(-0.22,0.10)(-0.04,0.16)(-0.03,0.17)(-0.20, 0.20)(0.01, 0.25)(-0.07, 0.17)(-0.23,0.23)(-0.03,0.25)
b
0.160.090.200.100.070.120.230.220.230.130.070.16
D. AC
95% CL3
em
(0.12.0.20)(0.01, 0.17)(0.16,0.24)(0.06,0.14)(-0.01,0.15)(0.09,0.17)(0.19,0.27)(0.14, 0.30)(0.17, 0.29)(0.09, 0.17)(-0.03, 0.17)(0.10, 0.22)
1 Differences obtained from multiple linear regression coefficients (b) representing the cumulative effect of vitamin A (60,000 p,g RE) vs. placebocontrol (300 p,g RE) supplementation every 4 mo in nonxerophthalmic children adjusted for age and the specified measurement value at baselineand sex.
2 WT = weight, HT = height, AC = arm circumference.395% confidence limits of b derived from standard errors of regression coefficients.
treated with VA only at baseline: AC increased by an additional 0.30 cm (95% CL: 0.02, 0.58), FA increased by 38 mm2
(-2, 78) and 55 increased by 0.42 mm (-0.05, 0.89), whilethe relative increase in MA was less and not significant [29mm2 (95% CL: -11, 69)].
Differences in WAZ growth (Figure 3) show that treatmentof xerophthalmic children with vitamin A favored the growthof wasted xerophthalmic vs. wasted nonxerophthalmic chil·dren, irrespective of age. Within 4 mo. WAZ growth accelerated in wasted xerophthalmics by -0.4 Z-scores over that ofwasted nonxerophthalmic children; thus, idemifying a subgroup of initially more malnourished. vitamin A-deficientchildren whose growth responded to vitamin A. Among nonwasted children, vitamin A treatment conferred no WAZgrowth advantage to xerophthalmics over their similarly nourished, nonxerophthalmic peers, except for a 0.11 Z increasein WAZ in older xerophthalmics (36-60 mo of age at baseline) after 16 mo.
DISCUSSION
Nonxerophthalmic children. Findings from the randomized trial show that periodic, high-potency vitamin A receiptexerted no effect on linear growth or weight gain over thecourse of an entire year in rural Nepal. However, ponderalgrowth was negatively affected by vitamin A during two consecutive periharvest seasons, reflected by -120 g reductionsin weight gain per 4 mo compared to placebo-control children.It was accompanied each year by small relative decreases inweight-for-height suggesting that vitamin A redpients mayhave been accumulating less fat than children not receivingvitamin A. Mechanisms for this effeCt remain to be explained.However, this seasonal decline in weight gain velocity wascountered by improved weight gain over the remaining eightmomhs of [he year, when food availability and anthropometricstatus typically decline and morbidity increases (K. West etal., unpublished data), leaving no net effect of vitamin A on
TABLE 4
Differences in sixteen-month change in muscle and fat indicators by baseline arm circumference (AG)in children 12-60 mo of age at baseline1
Comparisons of nonxerophthalmic Xerophthalmic vs.children vitamin A vs. control nonxerophthalmic comparisons
Indicator b 95% CL b 95% CL
~ Muscle area, mm2 25 (17,33) 35 (15, 55)AC < 13.5 em 20 (8,32) 76 (35,117)AC;;,: 13.5 em 28 (19,37) 16 (-8,40)
ll. Fat area, mm2 a (-8,8) 7 (-13.27)AC < 13.5 em -5 (-17,17) 79 (40, 118)AC 2: 13.5 em 4 (-5,13) -22 (-46,2)
~ Subcapsular skinfold, mm 0 (-08, 0.08) 0.36 (0.13,0.60)AC < 13.5 em -0.05 (-0.19,0.09) 1.31 (0.86, 1.76)AC 2: 13.5 cm 0.05 (-0.05,0.15) -0.02 (-0.29, 0.25)
1 Differences obtained from multiple linear regression coefficients (b) representing the growth effects with 95% confidence limits (95% CL).

GROWTH IN VITAMIN A-DEFICIENT CHILDREN 1965
Fawzi, W. W., Herrera, M. G., Willett, W. C., Nester, P., EI Amin, A. & Mohamed,K. A, (1979) Vitamin A supplementation does not improve growth of preschool children in the Sudan. Am. J. PUb. Hlth. (in press).
Frisancho, A. R. (1981) The nonns of upper limb fat and muscle areas forassessment of nutritional status. Am. J. Clin. Nutr. 34: 2540-2545.
Gibson, R. S. (1990) Principles of Nutritional Assessment. pp. 200-204, OKford University Press, New York, NY.
Gopalan, C., Rama Sastri, B. V., Balasubramanian, S. C., Narasinga Rao, B. S.,Deosthale. Y. G. & Pant K. C. (1989) Nutritive Value of Indian Foods. pp.35-39, Indian National Institute of Nutrition, Hyderabad, India.
Hamill, P.V.V., Drizid, T.A., Johnson, C. L., Reed, R. B. & Roche, A. F. (1977)NCHS growth curves for children birth-18 years in United States. DHEWPublication No. (PHS) 78-1650, ser. 11, no. 165.
Hadi, H•. StOltzfus R. J., Dibley, M. J., Moulton, L H., West K. P., Kjolhede C. L &Sadjimin, T. (1997) Vitamin A supplementation improves linear growth ofIndonesian preschool children. XVIII IVACG Meeting, Cairo, Egypt. ILSI Human Nutrition Institute, Washington, DC.
Heymsfield, S. B., McManus, C., Stevens, V. & Smith, J. (1982) Muscle mass:reliable indicator of protein-energy malnutrition severity and outcome. Am. J.Clin. Nutr. 35; 1192-1199.
Hussain, A.. Undtjom, B. & Kvale. G. (1996) Protein energy malnutrition, vitamin A deficiency and night blindness in Bangladeshi children. Annals Trop.Paed. 16: 319-325.
Katz, J., West, K. P., Jr.• Khatry, S. K., Thapa, M. D.. LeClerq, S. C.• Pradhan,E. K.• Pokhrel, R, P. & Sommer, A. (1995) Impact of vitamin A supplementation on prevalence and incidence of xerophthalmia in Nepal. Invest. Ophthalmol. Vis. Sci. 36; 2577-2583.
Khatry, S. K., West, K. P., Jr.• Katz, J., LeClerq, S. C•• Pradhan, E. K., Wu. L. S.,Thapa, M, D. & Pokhrel, R. P. (1995) Epidemiology of Kerophthalmia in Nepal: a pattem of household poverty, Childhood illness and mortality. Arch.Ophthalmol. 113: 425-429.
Kleinbaum. D. G. & Kupper, L. L. (1978) Applied regression analysis and othermultivariable methods, pp, 131 -157, Doxbury Press, Boston, MA.
Lie, C.. Ying, C., En-Lin, W., Brun, T. & Geissler, C. (1993) Impact of largedose vitamin A supplementation on childhood diarrhoea, respiratory diseaseand growth. Eur. J. Clin. Nutr. 47: 88-96.
McCollum, E. V. & Davis, M. (1913) The necessity of certain lipids in the dietduring growth. J. Bioi. Chem. 15: 167-175.
Mele, L., West, K. P., Jr,. Kusdiono, Pandji. A., Nendrawati. H., Tilden, R. L.,Tarwotjo, I. & Aceh Study Group (1991) Nutritional and household riskfactors for xerophthalmia in Aceh, Indonesia: a case-control study. Am. J.Clin. Nutr, 53: 1460-1465.
Milton, R. C., Reddy, V. & Naidu, A. N. (1987) Mild vitamin A deficiency andchildhood morbidity-an Indian experience. Am. J. Clin. Nutr. 46; 827-829.
MUhilal. Permaesih, D., Idjradinata, Y. R., Muherdiyantiningsih & Karyadi, D.(1988) Vitamin A-fortified monosodium glutamate and health, growth, andsurvival of children: a controlled field trial. Am. J. Clin. Nutr. 48; 1271-1276.
Pokhrel, R. P.. Khatry, S. K., West, K. P., Jr., Shrestha, S. R., Katz, J., Pradhan,E. K., LeClerq. S. C. & Sommer, A. (1994) Sustained reduction in childmortality with vitamin A in Nepal. Lancet 343; 1368-1369.
Pradhan, E. K•• Katz. J., LeClerq, S. C. & West. K. P.• Jr. (1994) Data management for large community trials in Nepal. Control. Clin. Trials 15: 220-234.
Rahmathullah,L,UndelWood, B. A.,Thulasiraj.R. D. &Milton. R. C. (1991) Diarrhoea, respiratory infections, and growth are not affected by a weekly lowdose vitamin A supplement: a masked. controlled field trial in children insouthem India. Am. J. Clin. Nutr. 54: 568-577.
Ramakrishnan, U., Latham. M. C. & Abel, R. (1995) Vitamin A supplementationdoes not improve growth of preschool children: a double-blind field trial insouthem India. J. Nutr. 125: 202-211.
Santos,LM.P.,Oricot,J. M.•Asciutti,L. S.&Dricot-O'Ans,C. (1983) Xerophthalmia in the state of Paraiba, northeast of Brazil: clinical findings. Am. J. Clin.Nutr. 38: 139-144.
Sommer, A. (1982) Nutritional Blindness, Xerophthalmia and Keratomalacia.pp. 107-122, Oxford University Press, New York, NY.
Sommer, A. (1995) Vitamin A Deficiency and its Consequences; A field guideto Their Oetection and Control. 3rd ed. World Health Organization. Geneva.
Sommer, A., Hussaini, G., TalWotio, I. & Susanto, D. (1983) Increased mortalityin children with mild vitamin A deficiency. Lancet 2: 585-588.
Sommer, A., Katz, J. & Tarwotjo, I. (1984) Increased risk of respiratory diseaseand diarrhea in children with preexisting mild vitamin A deficiency. Am. J.Clin. Nutr. 40; 1090-1095.
Sommer, A. & West, K. P., Jr. (1996) Vitamin A Oeficiency; Health, Survivaland Vision. pp. 19-250, OXford University Press, New York, NY.
Tarwotio,l., Katz, J., West, K. P" Jr., Tielsch, J. M. & Sommer, A. (1992) Xerophthalmia and growth in preschool Indonesian children. Am. J. Clin. Nutr. 55;1142-1146.
Trowbridge, F. L.• Hiner, C. D. & RObertson, A. D. (1982) Arm muscle indicatorsand creatinine excretion in children. Am. J. Clin. Nutr. 36: 691-696.
UNICEF (1997) The State of the World's Children 1997. Oxtord UniversityPress, New York, NY.
West. K. P., Jr., Djunaedi, E.. Pandji, A., Kusdiono, Tarwotjo. I. & Sommer, A.(1988) Vitamin A supplementation and growth; a randomized communitytrial. Am. J. Clin. Nutr. 48: 1257-1264.
West, K. P., Jr., Katz, J., Shrestha. S. R., LeClerq, S. C.. Khatry, S. K., Pradhan,E. K., Adhikari. R., Wu, L. 5., Pokhrel, R. P. & Sommer, A. (1995) Mortalityof infants <6 mo of age supplemented with vitamin A: A randomized double·masked trial in Nepal. Am. J. Clin. Nutr. 62; 143-148.
West, K. P., Jr., Pokhrel. R. P., Katz, J., LeClerq, S. C., Khatry, S. K., Shrestha,S. R., Pradhan, E. K., Tielsch, J. M., Pandey, M. R. & Sommer, A. (1991)Efficacy of vitamin A in reducing preschool child mortality in Nepal. Lancet338: 67-71.
Wright, R. A. & Heymsfield, S. (1984) Nutritional Assessment. pp. 27-82,Blackwell Scientific Publications, Inc., Boston, MA.
Zerias. A. J. (1975) The insertion tape: a new circumference tape for use innutritional assessment. Am. J. Clin. Nutr. 28: 782-787.

GROWTH IN VITAMIN A-DEFICIENT CHILDREN 1963
TABLE 5
Cumulative differences in growth by interval and initial arm circumference (AC) between xerophthalmic and nonxerophthalmicchildren, 12-60 ma of age at baseline1
t:..wr
Follow-up interval b (95% CL)2
g
0-4 months 221 (115, 327)AC < 13.5 cm 644 (440,848)AC ~ 13.5 cm 23 (-100,146)
0-8 months 231 (117, 345)AC < 13.5 cm 686 (459, 913)AC ." 13.5 cm 37 (-92, 166)
0-12 months 276 (153,399)AC < 13.5 cm 725 (472,978)AC"", 13.5 cm 106 (-33,245)
0-16 months 343 (194,492)AC < 13.5 cm 672 (362,982)AC 2: 13.5 cm 196 (31, 361)
b
0.210.200.220.340.490.290.510.740.440.770.970.69
~ HT
(95% el)
cm
(0.03, 0.39)(-0.19,0.59)(0.02, 0.42)(0.11, 0.58)(-0.04,1.02)(0.04, 0.55)(0.24, 0.78)(0.13, 1.35)(0.15,0.73)(0.44, 1.10)(0.23, 1.72)(0.34, 1.04)
b
0.180.77
-0.090.230.79
-0.010.190.74
-0.030.200.71
-0.02
~AC
(95% Cl)
cm
(0.06, 0.30)(0.54, 1.01)(-0.23,0.05)(0.09, 0.37)(0.52, 1.06)(-0.15,0.13)(0.05, 0.33)(0.45, 1.03)(-0.17,0.11)(0.06, 0.34)(0.40, 1.02)(-0.16,0.12)
1 Differences obtained from multiple linear regression coefficients (b) representing the cumulative effect of vitamin A treatment (either 120,000~g RE or 180,000 ~g RE at baseline) of xerophthalmic children on growth compared to growth of nonxerophthalmic children (periodically receivingvitamin A or placebo), adjusted for age, measurement status at baseline and sex.
2 95% confidence limits of b derived from standard errors of regression coefficients.
-0.2 --i..o...,....----or-----r-----.....,-
annual weight gain. Seasonal increases in weight gain velocityassociated with vitamin A receipt have only recently beenappreciated. Indian children randomized to receive high-potency vitamin A between April and July (late hot/early rainy
seasons) also showed significantly greater weight gain (140 g)and less wasting malnutrition than placebo controls dosed inthe same season, but no effects were observed the rest of theyear (Bahl et al. 1997).
The lack of impact of vitamin f.. on annual ponderal orlinear growth is consistent with findings from twO other trialsamon~ nonxerophthalmic children in India where oral vitaminA, provided as a weekly low dose to children ~5 to 71 mo ofage (Rahmathullah et a1. 1991) or as a periodic, high-potencysupplement to children 6 to 36 rna of age (Ramakrishnan etal. 1995), failed to markedly influence 12-mo weight gain orlinear growth, but seasonality was not examined. Thus, it appears that in South Asia, where moderate stunting and wasting(ACC/SeN Report, 1992) typically coexist with multiple mi·cronutrient deficiencies (Gopalan 1989), vitamin A supplementation alone may have little effect on height or weightgain of most preschool children. This is in contrast to studiesin Southeast Asia where improved weight gain (West et a1.1988) and linear growth (Muhilal et aL 1988) were observedin vitamin A-supplemented children in populations that weregenerally in better health and bener nourished than the population in rural South Asia (UNICEF, 1997).
Vitamin A may have caused a change of body composition,reflected by a 32% relative increase in the growth of upperarm muscle area (~25 mm2) which contributed to a small butsignificant increase in arm circumference (0.13 cm) after 16mo in both wasted and nonwasted VA-supplemented children.Upper arm muscle area is an index of skeletal muscle mass(Gibson 1990), shares high correlations with other indices oflean body mass, such as the creatinine/height ratio (Heymsfieldet al. 1982; Trowbridge et al. 1982), and gradually respondsto protein-energy deprivation and recovery (Wright andHeymsfield 1984). In the absence of an effect on subcutaneousarm and trunk fat, the change in muscle (and humoral bone)area may have reflected a positive shift in lean body mass withimproved vitamin A nutriture_ The effect was similar to rhe36 mm! relative increase in arm muscle area observed after ayear of vitamin A supplementation in preschool boys in Indonesia (West et at. 1988). Improved lean body mass. assessed
16
..•. 0
12
~ Wasted, 12-35 rna-e- Westod, 3~0 rna.... Non-wastlld, 12-35 rna• -0. Non-wastsd, 36-60 rna
..•..
8
Follow-up IntelVal (months)
4
:: ::::: :: •.•• : ::: ~:: •.. _ _.. -e-'0.0
0.4
0.6
FIGURE 3 Growth by weight-for-age IYVAZl of children with xerophthalmia compared to children without xerophthalmia, supplementgroups combined, by wasting status and age at baseline and adjustedfor sex, age (in months) and baseline WAZ by linear regression. Alldifferences in ~ WAZ between wasted children and wasted nonxerophthalmic children are significant (P :s 0.005) except for 12-35 mo-oldsafter 12 rna (P ::s 0.02) and 16 mo (P = 0.12). Only the WAZ growthof nonwasted children after 16 months is significantly different fromnonwasted nonxerophthalmic children (P ::s 0.01).
.c
1Cl
~ 0.2.5
CDu
!~is

1964 WEST IT AL.
in this study by mid-arm anthropometry, may represent aninfrequently evaluated aspect of child growth that responds tovitamin A, even in the absence of improved height and weight.
Xerophthalmic children. This trial offered a unique opportunity to examine, outside the original randomized design, theeffects of vitamin A on the growth of clinically vitamin Adeficient children, representing -3% of this child population(Katz et a1. 1996; Khatry et al. 1995). Previous vitamin Agrowth trials have excluded, either a priori or in the analysis,children with xerophthalmia (Fawzie et al. 1997, Rahmathullah et al. 1991, Ramakrishnan et al. 1995, West et al. 1988)who, being moderately-co-severely vitamin A -deficient (Sommer and West 1996). may have been expected to show agrowth response co vitamin A. Mild xerophthalmia has beenassociated with decelerated linear and ponderal growth (Tarwotjo et al. 1992), low attained height, (Cohen et al. 1986,Khatry et at. 1995, Mele et al. 1991, Santos et al. 1983), mildwasting (Hussain et al. 1996, Khatry et at. 1995, Mele et al.1991) and increased risks of morbidity (Milron et at. 1987,Sommer et al. 1984) and mortality (Sommer et al. 1983).
Xerophthalmic children who were not wasted at the outsetgradually accelerated their linear growth over nonxerophthalmic, nonwasted children, by 0.7 em, or 10% after 16 mo. Theirrelative increase in weight gain of - 200 g by the end of thetrial was pondostacural; that is, it could be attributed to theirimproved linear growth since 1) there was no significant effectof treatment on changes in weight-for-height, arm fat area orsubscapular skinfold thickness, and 2) relative change inheight largely explained the increment in weight.
Wasted xerophthalmic children, on the other hand, showedmarked increases in weight gain (644 g) and arm circumferential growth (0.7 cm) within four months of being treated withvitamin A, representing 84 and 130% increases, respectively,over growth in these measures by other children who werewasted at the outser. No further improvements in weight gainor arm circumferential growth occurred, while height gainsteadily improved over that of other wasted children, reachinga -1 em increment after 16 mo (an 8% increase). Rapidweight gain in the first four months likely represented a gainin fat. While not assessed at the second visit, initially wastedchildren had clearly gained more fat by the end of the study,evident by differential increases in arm fat area and subscapularskinfold thickness. Yet, lean mass also likely improved, reflected by increased arm muscle area growth. By the finalround, change in weight-far-height (6.WHZ) was more highlycorrelated with age-adjusted change in upper arm muscle areain wasted xerophthalmics (r = 0.72) than in other wastedchildren (r = 0.43).
An initial growth response of soft tissue to vitamin A inmalnourished, moderately-to-severely vitamin A-deficientchildren has been reported elsewhere. Rapid ponderal gain wasseen in a randomly selected group of mildly wasted, hyporetinemic children with measles in South Africa after beingtreated with vitamin A (520 g gain in 6 mo), with 75% ofthe effect occurting in the first 6 wk (Coutsoudis et aL 1991).In Indonesia, children spontaneously recovering from mild xerophthalmia regained all of their calculated weight decrement(~120 g) in a 3-mo period, but no't height deficit even after6 mo (Tarwotjo et a1. 1992), suggesting the need for longerfollow-up to discern a potential effect of vitamin A on lineargrowth. However, a more recent randomized, double-maskedtrial in Indonesia has also shown high-potency vitamin A tostimulate both linear and ponderal growth in severely vitaminA-deficient children (serum retinol < -0.35 p;mol/L) (Hadiet at. 1997).
It is possible that improved growth observed in wasted xe-
BESTAVAILABLE COpy
rophthalmic children may have been due to factors other thanvitamin A receipt, such as effective follow-up at primary healthcare cencers or better child care and feeding at home oncechildren were diagnosed. These, however, were unlikely: 1)child feeding and dietary counseling programs were not beingoperated by health posts or other facilities in the area duringthe trial; 2) all children (12 months and above) with armcircumferences below 11.5 em, irrespective of xerophthalmiastatus, were, nonetheless, referred to health posts; 3) the cutofffor wasting in this study was mild, with 30% of all childrenhaving arm circumferences below 13.5 em, a level that wouldnot have provoked parents with few resources to immediatelybegin providing their children more food on a regular basis;4) high-potency vitamin A is -90% effective in treating xerophthalmia (West and Sommer 1987), leaving little motivation for parents EO sustainably improve the quality of a child'sdiet once eye signs have disappeared follOWing treatment; and,finally 5) a recently completed prospective, behavioral studyof children with and without a confirmed history of xerophthalmia in the study area has shown that previously xerophthalmic children, 1-2 years after being treated with vitaminA, were less likely to be served food at meals, be washed andgiven other forms of routine home health care and more likelyto be treated harshly than children living in nonxerophthalmichouseholds (Gittelsohn, J., Shankar, A. V., West, K. P., Jr.,Faruque, F., Gnawali, T. and Pradahan, E. K., unpublishedmanuscript). Thus, previously xerophthalmic children arelikely to be subjected to poor child caring practices long afterxerophthalmia has been successfully treated with vitamin A.These factors would argue against the observed growth effectsin xerophthalmic children being due to general improvementsin diet or health care at home.
These findings suggest a role for vitamin A in promotinggrowth in children with clinical signs of vitamin A deficiency,at least in this rural South Asian setting. The effect was especially evident among those who were initially wasted. Thelack of effect among children with milder (subclinical) vitaminA deficiency appears to emphasize the role of multiple deficiencies, as well as morbidity, in restricting growth (Allen1994). It is unlikely that vitamin A supplementation elicits atypical growth response across populations or within the samepopulation over different periods of time. Expectation ofgrowth impact (or lack thereon, in any event, should not drivepolicies to prevent vitamin A deficiency where reductions inthe severity of morbidity and mortality of children can berealized (Beaton et al. 1993, Sommer and West 1996).
LITERATURE CITEDAdministrative Committee on Coordination-Subcommittee on Nutrition (ACC/
SCN). (1992) Second Report on the World Nutrition Situation. Volume I.Global and Regional Results. World Health Organization (WHO), Geneva,Switzerland, pp. 1-50.
Allen. L. (1994) Nutritional influences on linear growth: a general review. Eur.J. Clin. Nutr. 48: 575-589.
,Bahl, R., Bhandari, N., Taneja, S. & Bhan. M. K. (1997) The impact of VitaminA supplementation on physical growth of children is dependent on season.Eur. J. Clin. Nutr. 51: 26-29.
Beaton. G. H., Martorell, R., Aronson, K. J., Edmonston, B., McCabe. G., Ross,A. C. & HaNey, B. (1993) Effectiveness of vitamin A supplementation inthe control of young child morbidity and mortality in developing countries.ACC/SCN State of the Art Series Nutrition Policy Discussion Paper, No. 13.World Health Organi<:ation, Geneva, Switzerland.
Brown. K. H., Rajan, M. M.• Chakraborth, J. & Ali<:. K.M.A. (1980) Failure of alarge dose of vitamin A to enhance the antibody response to tetanus toxoidin children. Am. J. Clin. Nutr. 54: 890-895.
Cohen, N., JaJil, M. A., Rahman, H.• Leemhuis de Regt, E., Sprague. J. & Mitra,M. (1986) Blinding malnutrition in rural Bangladesh. J. Trop. Pediatr. 32:73-78.
Coutsoudis,A., Broughton, M.&Coovadia. H. M. (1991) Vitamin A supplementation reduces measles morbidity in young African children: a randomizedplacebo-controlled. double-blind trial. Am. J; Clin. Nutr. 54: 890-895.

VITAMIN A AND HIV

Journal of Acquired Immune Deficiency Syndromes and Human Retrovirology14:219-222 © 1997 Lippincott-Raven Publishers. Philadelphia
Maternal Vitamin A Deficiency and Child Growth Failureduring Human Immunodeficiency Virus Infection
Richard D. Semba, *Paolo Miotti, tJohn D. Chiphangwi, :l:Robin Henderson,*Gina Dallabetta, *Li-Ping Yang, and *Donald Hoover
Departments of Ophthalmology, *Epidemiology, and :j:Pediatrics, The Johns Hopkins University School of Medicine andSchool of Hygiene and Public Health. Baltimore, Maryland, U.S.A.; and tCollege of Medicine, University of Malawi,
Blantyre, Malawi
Summary: Although vitamin A is thought to influence growth, the relationshipbetween maternal vitamin A deficiency during pregnancy and child growth isunknown. A longitudinal cohort study of 467 HIV-infected women and theirchildren was conducted in Blantyre, Malawi. The children's weight and heightwere measured every 3 months until they were 24 months old. Maternal vitaminA deficiency was independently related to both linear and ponderal growth afteradjustment for effects of body mass index, child gender, and child HIV status.By 12 months of age, infants born to mothers who were vitamin A-deficientduring pregnancy weighed -8% less (p < 0.001) and were -2% shorter (p <0.001) than infants born to mothers who were not deficient. This study suggestschildren born to HIV-infected women who are vitamin A-deficient during pregnancy are more likely to have growth failure. Key Words: Vitamin A-RetinolNutrition-Growth-Human immunodeficiency virus.
Growth failure is one of the most common manifestations of HIV infection in children (1,2). Major factorsthat may influence the growth of infants born to HIVinfected mothers include maternal nutritional statusand infant HIV status (3). There is evidence from largestudies that ponderal and linear growth are related tothe vitamin A status of preschool children (4). Thevitamin A status of the infant is largely dependent onmaternal vitamin A available to the fetus in utero andduring breastfeeding via the breastmilk. Vitamin Astatus may playa major role in growth because retinoicacid, the active metabolite of vitamin A, is the generegulator for growth hormone. (5).
Pregnant women are at a high risk of developingvitamin A deficiency, and in some cultures, nightblind-
Address correspondence and reprint requests to Dr. RichardD. Semba, Ocular Immunology Service, Suite 700, 550 NorthBroadway, Baltimore, MD 21205. U.S.A.
Manuscript received JUly 16. 1996; accepted December 2.1996.
219
ness-the earliest clinical manifestation of vitaminA deficiency-is common enough to be considereda symptom of pregnancy (6). We recently demonstrated that maternal vitamin A deficiency is associated with increased mother-to-child transmission ofHIV, low birthweight, and higher infant mortality(7,8). Although maternal vitamin A status is thoughtto influence child growth, no studies have addressedthis issue in humans. The purpose of this study is todetermine whether maternal vitamin A deficiencyduring pregnancy in HIV-infected women is associated with child growth failure.
METHODS
The study population consisted of567 HIV-infected mothers andtheir infants who were born at Queen Elizabeth Central Hospital(QECH) in Blantyre. Malawi. from November 1989 to August1991. The details of this study population have been describedelsewhere (7,8). Women presenting to the antenatal clinic ofQECH were confirmed to be HIV infected on the basis of a positiveresults from enzyme-linked irnrnunosorbent assay (ELISA) and

220 R. D. SEMBA ET AL.
Age (Months)
FIG. 1. Weight-far-age of boys and girls born to HIV-infectedmothers with and without vitamin A deficiency.
Age (Months)
FIG. 2. Height-for-age of boys and girls born to HlV-infectedmothers with and without vitamin A deficiency.
20
--'-Boy· ....·_.-.G;,t--v_...,...,..""....,---_~Gio1
20
_ VaminAtbmal. Boy...... Vrtanin ANorrMl. Girt--v_~Boy
_...V_ A.ee-, G;,t
15
15
10
10
5
5
14
12
Cil 10~.......1: 8.21Q)
:;: 6
4
2
0
90
eo..-In
70E..£.E 60Cl'a;I
50
40
0
The mean linear and ponderal growth curves forHIY-infected and uninfected children born to vitamin A-deficient and nondeficient mothers are shownin Figs. 3 and 4. As shown in Figs. 3 and 4, HIYinfected children had lower mean linear and ponderalgrowth than uninfected children. regardless of maternal vitamin A level. Among both HIV-infected anduninfected children, those born to vitamin Adeficient mothers had lower linear and ponderalgrowth than those born to mothers who were notvitamin A-deficient. For example, by 12 months ofage, infants born to vitamin A-deficient mothersweighed -0.7 kg less (-8% lighter) compared withinfants born to mothers who were not deficient invitamin A. Similarly. at 12 months of age. infantsborn to vitamin A-deficient mothers were -1 cmshorter (-1-2% shorter) than infants born to mothers who were not deficient in vitamin A.
Because repeated measures of ponderal and linear
RESULTS
western blot. Age. weight. and height of the mothers and gestational age based upon the last reported menstrual period wererecorded at the first prenatal visit, which occurred during thesecond or third trimester of pregnancy. Maternal body mass index(Quetelet) was calculated using weight (kg)lheight2 (m) (9). Serumvitamin A levels were measured during the first antenatal visit byhigh performance liquid chromatography (7). Serum vitamin Alevels <1.05 j.tmollL were considered consistent with deficiencyin adults in this population (8).
At delivery. gestational age was estimated by Ballard score.and the infant's weight was recorded. Mothers and infants wereexamined every 3 months after delivery. and at each visit theheight and weight of the infants were recorded. All infants wereweighed on the same calibrated digital scale to the nearest gram.Child length was measured using a child length board. Almost allinfants (>99%) in this study population were still at [east partiallybreastfeeding at 12 months of age. At 12 months of age. ELISAand confirmatory western blot were used to determine HIV·linfection in the infants. All studies were approved by the MalawiHealth Sciences Committee (Blantyre) and the Committee onHuman Research at Johns Hopkins University (Baltimore).
Generalized nonparametric additive models were used to analyze longitudinal growth data and construct mean growth curves forinfants (10.11). Comparisons were made between growth curves of(a) infants born to vitamin A-deficient and nondeficient mothers.(b) infants who were HIV infected and noninfected. and (c) boysand girls. Population means and 95% confidence intervals aboutthe mean were calculated for the two groups from birth to 24months of age. Generalized estimating equations were used to testfor statistical effects of covariates within these correlated longitudinal data.
Of 567 HIV-infected mothers. 421 had infants whosurvived to 12 months of age, and 146 had infantswho died before 12 months of age. Serum vitamin Alevels were measured in 474 HIV-infected mothers(in 136 of the 146 mothers whose infants died before12 months of age and in 338 of the 421 mothers whoseinfants survived to 12 months of age). Ninety-fourwomen were not included in the vitamin A analysisfor the following reasons: 40 mothers had no availableserum sample, 40 infants were lost to follow-up between delivery and 12 months, and 14 infants hadindeterminate HIV serostatus at age 12 months.
Growth data were available for 328 of the 338infants of known HIV status who survived to 12months of age. Among the 328 infants (148 boys and180 girls) with available growth data, 33 infants diedand 40 infants were lost to follow-up between 12 and24 months of age. The mean linear and ponderalgrowth curves for boys and girls born to vitamin Adeficient and nondeficient mothers shown in Figs. 1and 2. For both boys and girls, linear growth andponderal growth were lower in those born to vitaminA-deficient mothers.
Journal of Acquired Immune Deficiency Syndromes and Human Recrovirology, Vol. 14. No.3. 1997

VITAMIN A DEFICIENCY IN PREGNANCY WITH HIV INFECTION 221
DISCUSSION
Age (Months)
FIG. 3. Measurements of weight-for·age of HIV·infected anduninfected children bom to HIV-infected mothers with and withoutvitamin A deficiency.
Our study suggests that maternal vitamin A deficiency in HIV-infected mothers is an independentpredictor of child growth failure. Children born toHIV-positive women who were vitamin A-deficient
106.87 <0.000194.47 <0.0001
-4.44 <0.00012.87 <0.0043.98 <0.0001
-4.63 <0.0001
Z-score p value
55.48 0.521.15 0.01
-1.31 0.290.83 0.291.16 0.29
-1.74 0.38
Estimate Standard(cm) error
TABLE 1. Multivariate generalized equation model forlinear growth
InterceptAge of childSex of childMaternal vitamin AMaternal BMlInfant HlV status
TABLE 2. Multivariate generalized equation model forponderal growth
Estimate Standard(kg) error Z-score p value
Intercept 4.90 0.16 3134 <0.0001Age of child 0.28 0.004 76.94 <0.0001Sex of child -0.47 0.093 -4.99 <0.0001Maternal vitamin A 0.30 0.092 3.30 <0.001Maternal BMI \.47 0.092 5.09 <0.0001Infant HIV status -0.63 0.106 -5.94 <0.0001
For gender. boy = 0, girl = 1; for maternal vitamin A leveLdeficiency defined as serum vitamin A <LOS ,umoUL; for bodymass index (BMI), low and high divided at the median of 23.15kglm2; for infant HIV status, HIV negative = O. HIV positive = 1.
during pregnancy consistently had lower weight-forage and height-for-age compared with children bornto women who were not vitamin A deficient. To ourknowledge, this is the first study in humans to demonstrate that maternal vitamin A deficiency during pregnancy is associated with child growth failure.
The vitamin A status of infants depends on liverstores of vitamin A established through placentaltransfer while in utero and through the vitamin Ain breast milk after delivery (12). Animal studiesdemonstrate that vitamin A deficiency during pregnancy has a profound effect on growth and mortalityof offspring (13). In the human life span, infancy isthe most vulnerable period for vitamin A deficiency,and vitamin A deficiency may be overlooked becausenight blindness is difficult to assess in infants andbecause Bitor's spots. which are considered pathognomonic for vitamin A deficiency. do not usuallyoccur during infancy.
The impact of maternal vitamin A deficiency onthe newborn infant is complex because vitamin Ais involved in many different biological functions.including the development of the immune system,
20
--tilV-._A_.·_tilV·._""O-W- HiIY ~AHoftMI
"U'. HfV~ A-OtlIciInI
20
_ _ HIV_.Vbmi1 A~
_._HIV·.~~
_ 'HrJ+.VIWnIn'"~...... lUV•.V/WninA-~
15
15
10
10
5
5
14
(i)12
g 10
!!Cl 8Q;
3: 6
4
2
0
growth were obtained from each infant, we used generalized estimation equations that were robust to intraindividual colinearity to estimate simultaneouslythe effect of maternal vitamin A levels, body massindex, infant gender, infant age, and infant HIV statuson growth. In stepwise, bivariate generalized equation models where linear and ponderal growth werethe outcome variables, all five variables were significantly related to linear and ponderal growth, respectively, and were fit into final multivariate generalizedequation models for growth (Tables 1 and 2).
90
80(i)E 70..g.:c:
60Cl'SJ:
50
40
aAge (Months)
FIG. 4. Measurements of height-for-age of HIV·infected and un·infected children born to HIV-infected mothers With and withoutvitamin A deficiency.
For gender. boy = O. girl = [: for maternal vitamin A level,deficiency defined as serum vitamin A <\.05 /LmoI/L; for bodvmass index (BMI). low and high divided at the median of 23.15kglm2; for infant HIV status. HIV negative = O. HIV positive = I.
Journal of Acquired Immune DefiCiency Syndromes and Human Rermvirology. Vol. 14. No.3. 1997
222 R. D. SEMBA ET AL.
maintenance of mucosal surfaces, and mucosal immunity and growth. The development of the thymus andthe normal maturation of T and B cells is dependenton vitamin A (14). Thus, an infant born to a vitaminA-deficient mother may have a greater degree ofimmune dysfunction than an infant with healthy vitamin A stores. Vitamin A-related immune dysfunction could predispose to more severe infections andassociated morbidity, which would be reflected ingrowth failure. Maternal vitamin A deficiency couldalso be more directly related to growth failurethrough regulation of growth hormone (4,5).
This study is limited in that other micronutrientabnormalities in pregnant women that may contribute to child growth failure were not evaluated. Maternal iron deficiency is associated with low birth weightand prematurity (15). Iodine deficiency disorders increase the risk of prematurity, stillbirths, spontaneousabortions, and retarded growth and mental development (16). Zinc deficiency can affect the growth ofyoung children (17). Certain micronutrients may interact; for example, zinc deficiency may affect theavailability of circulating vitamin A (18), and vitaminA status can influence the mobilization of hepaticliver stores of iron (19). Further studies are neededto address the effect of multiple micronutrient deficiencies on child growth.
It is unknown whether improving maternal vitaminA status during pregnancy will improve child growth,and the use of vitamin A supplements during pregnancy should be approached with caution becauseteratogenicity may be a concern with supplementaldoses greater than 10,000 IV/day. Periodic vitaminA supplementation of children may increase bothlinear and ponderal growth, but the observationshave not been consistent in all populations (20). Studies are currently in progress in sub-Saharan Africaand in the Indian subcontinent to determine whethermaternal vitamin A supplementation will improvechild growth and infant mortality.
Acknowledgment: The authors acknowledge the dedication of the staff of the Johns Hopkins/Ministry of HealthResearch project, and the Malawi Health Sciences Committee and Ministry of the Health, for this continuing productive collaboration. This study was supported by grants fromthe National Institutes of Health (NIH AI26499, AI33874,
HD30042, HD32247) and the Fogarty InternationalCenter.
REFERENCES
1. McKinney RE. Robertson JWR, Duke Pediatric AIDS Clinical Trials Unit. Effect of human immunodeficiency virus infection on the growth of young children. J Pediatr 1993:123:579-82.
2. Halsey NA, Boulos R, Holt E, et al. Perinatal transmissionof HIV-I infections from mothers to infants in Haiti. JAMA1990;264:2088-92.
3. Saavedra JM. Henderson RA. Perman JA. Hutton N, Livingston RA, Yolken RH. Longitudinal assessment of growth inchildren born to mothers with human immunodeficiency virusinfection. Arch Pediatr Adolesc Med 1995;149:497-502.
4. West KP Jr. Dietary vitamin-A deficiency: effects on growth.infection, and mortality. Food Nutr Bull 1991;13:119-31.
5. Bedo G, Santisteban P. Aranda A. Retinoic acid regulatesgrowth hormone gene expression. Nature 1989:339:231-4.
6. Dixit DT. Night-blindness in the third trimester of pregnancy.Indian J Med Res 1996:54:791-5.
7. Semba RD. Miotti PG, Chiphangwi 10. et al. Maternal vitaminA deficiency and mother-to-child transmission ofHIV-1. Lancet 1994;343:1593-7.
8. Semba RD, Miotti PG. Chiphangwi JD. et al. Infant mortalityand maternal vitamin A deficiency during human immunodeficiency virus infection. Clin Infect Dis 1995;21:966-72.
9. Bray GA. Definition. measurement, and classification of thesyndromes of obesity. Int J Obesity 1978;2:99-112.
10. Chambers. JM. Hastie TJ. AT&T Laboratories. Statisticalmodels in S. Pacific Grove. CA: Wadsworth, S, Brooks, C..1992.
II. Diggle Pl. Liang KY. Zeger SL. Analysis of longitudinal dara.Oxford: Oxford University Press, 1994.
12. Newman V. Vitamin A and f:>reastfeeding: a comparison ofdata from developed and developing countries. San Diego:Wellstart. 1993.
13. Mason KE. Foetal death. prolonged gestation. and difficultparturition in the rat as a result of vitamin A-deficiency. AmJ Anal 1935:57:303-49.
14. Semba RD. Vitamin A. immunity. and infection. Clin InfecIDis 1994:19:489-99.
15. Scholl TO. Hediger ML. Anemia and ir.on-deficiency anemia:compilation of data on pregnancy outcome. Am J Clin NUlr1994:59(suppl):492s-501s.
16. Chauoki ML. Benmiloud M. Prevention of iodine deficiencvdisorders by oral administration of Iipiodol during pregnancy.EllrJ Endocrinol 1994:130:547-51.
17. Ninh NX. Thissen JP. Collette L. Gerard G. Khoi HH, Ketelslegers 1M. Zinc supplementation increases growth and circulating insulin-like growth factor I (IGF-I) in growth-retardedVietnamese children. Am J Clin Nwr 1996;63:514-9.
18. Smith Jc. McDaniel EG. Fan FF. Halstead lA. Zinc: a traceelement essential in vitamin A metabolism. Science 1973:191:954-5.
19. Bloem MW. Interdependence of vitamin A and iron: an important association for programmes of anaemia control. ProcNwr Soc 1995:54:501-8.
20. Kirkwood BR. Ross DA. Arthur P. et al. Effect of vitamin Asupplementation on the growth of young children in northernGhana. Am J Clin Nwr 1996:63:773-81.
Journal of Acquired Immune Deficiency Syndromes and Human Retrovirology. Vol. 14. .Vo. 3. 1997

Proceedings of the Nutrition Society (t997), 56, 459-469
'.Vitamin A and human immunodeficiency virus infection
BY RICHARD D. SEMBA
Ocular Immunology Service, Johns Hopkins University School of Medicine, Suite 700,550 North Broadway, Baltimore, MD 21205, USA
459
By the year 2000 there will be an estimated twenty-six million individuals infected withhuman immunodeficiency virus (HIV) (Quinn, 1996). About four to five million cumulative cases are expected among children by the year 2000. The areas hardest-hit by theacquired immune deficiency syndrome (AIDS) epidemic are sub-Saharan Africa, southAsia, and south-east Asia, where the prevalence of micronutrient deficiencies is generallyhigher. More than 90 % of new HIV infections are now occurring in developing countries.Although HIV infection is characterized by a variety of micronutrient deficiencies andwasting (Beach et ai. 1992; Kotler & Grunfeld, 1995), the relationship between nutritionalstatus and clinical outcome in HIV infection is not well understood. Vitamin A plays amajor role in normal immune function (Semba, 1994), and as early as the 1960s it wasacknowledged that 'no micronutrient deficiency is more synergistic with infection than thatof vitamin A' (Scrimshaw er ai. 1968). The present review focuses on the relationshipbetween vitamin A, immunity, and HIV infection.
VITAMIN A AND IMMUNITY
Vitamin A deficiency is a nutritionally-acquired immunodeficiency disorder characterizedby widespread pathological alterations of mucosal epithelia of the respiratory,gastrointestinal, and genito-urinary tracts, impaired antibody responses to protein antigens,altered cell-mediated immunity, and alterations in T-cell subsets (Semba et al. 1992,t993b; Wiedermann et al. 1993; Zhao & Ross, 1995; Cantoma et ai. 1996; Ross, 1996).Vitamin A, through its active metabolite, all-trans retinoic acid, regulates genes throughnuclear receptors in the steroid and thyroid hormone superfamily (Ross & Temus, 1993).The genes relevant to immunity which are regulated by vitamin A have not beencompletely characterized, but probably include those for interleukin-4, interferon-y(Cantoma et ai. 1996), interleukin-2 receptor (Sidell et ai. 1993), and others. Growth andactivation of T and B cells are dependent on vitamin A (Buck et al. 1990; Garbe et al.1992), and vitamin A supplementation is associated with increases in circulatinglymphocytes, including CD4 T-cells and natural killer cells, suggesting that lymphopoiesisis enhanced by vitamin A (Semba et ai 1993b; Ross, 1996).
The potential consequences of the immunodeficiency associated with vitamin Adeficiency have been shown in longitudinal studies of preschool children which wereconducted in Indonesia in the late 1970s. These studies demonstrated that children withmild vitamin A deficiency were at higher risk of respiratory and diarrhoeal disease andhigher mortality (Sommer et al. 1983, 1984). A series of community-based clinical trials ofvitamin A supplementation for preschool children soon followed in Indonesia, India,Nepal, Sudan, and Ghana, which showed overall that vitamin A supplementation orfortification reduced child mortality by about 20-30 % (Beaton et al. 1993). Furtheranalysis showed that vitamin A reduces the severity of diarrhoeal disease but seems to havelittle effect on respiratory disease (The Vitamin A and Pneumonia Working Group, 1995).High-dose vitamin A supplementation was also shown to reduce morbidity and mortality in

460 R. D. SEMBA
children with acute, complicated measles (Hussey & Klein, 1990; Coutsoudis et at. 1991).These clinical trials demonstrate that vitamin A is an immune enhancer and suggest thatvitamin A may have other therapeutic applications as a therapy for mv infection.
PATHOGENESIS OF VITAMIN A DEFICIENCY
Factors which may contribute to the development of vitamin A deficiency include: lowintake of vitamin A-containing foods, anorexia of chronic disease, diarrhoea andmalabsorption, concomitant protein-energy malnutrition, liver disease, abnormal urinarylosses of vitamin A during infections, the acute-phase response, and accelerated utilizationof vitamin A. In many developing countries where HIV infection is common, the intake ofvitamin A-containing foods may be marginal. Oesophageal candidiasis, cryptococcalmeningitis, and progressive multifocal leukoencephalopathy during mv infection areassociated with anorexia and wasting (Nablen et al. 1993). Diarrhoea and malabsorptionsyndromes are common during HIV infection and can be caused by a wide variety ofpathogens, including cryptosporidiosis and isosporiasis. Fat malabsorption has beenreported in mY-infected individuals and may interfere with vitamin A absorption andmetabolism.
Protein-energy malnutrition increases the risk of developing vitamin A deficiency(Smith et at. 1973), probably because vitamin A transport relies on a carrier-proteincomplex of retinol-binding protein and transthyretin. Hepatitis appears to interfere with themetabolism of vitamin A (Smith & Goodman, 1971), and hepatitis Band C are common inmany HIV-infected populations. During the acute-phase response, retinol-binding proteinmay break off from the carrier complex of transthyretin and retinol, allowing abnormalglomerular losses of vitamin A which may reach several times the required daily allowancefor vitamin A (Stephensen et al. 1994; Alvarez et al. 1995). Individuals with mv infectionand AIDS have been shown to have higher abnormal urinary losses of vitamin A comparedwith controls (Silveira et al. 1996). Whether infections accelerate the utilization of vitaminA is not clear; however, the depletion of hepatic vitamin A was shown to be increased inchildren who incidentally contracted chickenpox during a vitamin A dosing study (Camposet al. 1987). It is unknown whether the virulence of HlV itself may influence vitamin Astatus.
PREVALENCE OF VITAMIN A DEFICIENCY DURING HUMAN IMMUNODEFICIENCYVIRUS INFECTION
The prevalence of vitamin A deficiency may vary widely, depending upon the population.Serum or plasma vitamin A levels have been used as the main indicator of vitamin A statusin most of these investigations. In a hospital-based, cross-sectional study of fifty-nineadults with AIDS in New York City who were not taking vitamin :supplements, 20 % hadserum vitamin A levels < O·70 J.lmolll (Karter et at. 1995). A study of 100 asymptomatic,HIV-infected homosexual men in Miami showed that 18 % had serum vitamin A levels< 1·23j.lmolll, which were considered to be in the marginal range (Beach et al. 1992). Inforty-seven HIV-infected adults with wasting syndrome in Portland, Oregon, 14 % hadserum vitamin A levels < 1·75 J.lmolll (Coodley et al. 1993). A study of seventy-four HlVinfected pregnant women in Thailand showed mean vitamin A levels of 1·23 j.lmolll. Directcomparispns of the vitamin A status in these various studies is problematic because of thedifferent cut-offs of serum or plasma vitamin A used to define vitamin A deficiency inadults.

NUTRITIONAL STATUS IN DISEASE AND OTHER TRAUMA 461
We investigated the vitamin A status of different HIV-infected populations whichincluded injection drug users, homosexual men, adults in Uganda, pregnant women inMalawi, pregnant women in the USA, and lactating women in Haiti. Comparison ofvitamin A levels in these different populations is useful because it may provide clues to theepidemiology and pathogenesis of vitamin A deficiency during HIV infection. Plasmavitamin A levels were measured in 284 HIV-infected injection drug users from a cohortstudy in Baltimore, Maryland (AIDS Linked to Intravenous Experiences, ALIVE study;Vlahov et ai. 1991). The frequency distribution of vitamin A levels is shown in Fig. ]. Inour studies in adults we have defined vitamin A deficiency as consistent with serum orplasma vitamin A levels < 1·05 !!molll, a level at which some individuals may haveimpairment of biological function (Pilch, 1987). Using this criterion, about 29 % of HIVinfected injection drug users had plasma vitamin A levels consistent with deficiency inadults. Data from the first National Health and Nutrition Examination Survey show that inthe normal adult population in the USA, 1-3 % of adults have serum vitamin A levels< 1·05 j.lmolll (Pilch, 1987). In a study of 311 HIV-infected homosexual men (Study toHelp the AIDS Research Effort, SHARE) in Baltimore and Washington, DC, the frequencydistribution of plasma vitamin A leveis suggested that this population was replete invitamin A (Fig. 2). The frequency distribution is flatter and shifted to the right in thispopulation of homosexual men. Serum vitamin A levels were measured in 522 HIVinfected adults followed in a large cohort study in an outpatient clinic at Old MulagoHospital, Kampala, Uganda (Fig. 3). The adults in Uganda were HIV 'seropositive andpurified-protein-derivative positive or negative with no radiological evidence oftuberculosis.
Pregnant and lactating women are generally at higher risk of vitamin A deficiency. Thefrequency distribution of serum vitamin A levels in 474 HIV-infected pregnant womenfollowed in the antenatal clinic at Queen Elizabeth Central Hospital, Blantyre, Malawi isshown in Fig. 4. Of these women 63.3 % had serum vitamin A levels consistent withvitamin A deficiency. In comparison, serum vitamin A levels from 513 HIV-infectedpregnant women from the Womens and Infants Transmission Study (WITS), a multicentrestudy in the USA are shown in Fig. 5 (S. Landesman, D. Burns, D. Cotton, G. Fitzgerald,M. G. Fowler, R. Hershow, 1. Pitt, R. D. Semba and C. Zorilla, unpublished results). Of thewomen in WITS, 22 % had serum vitamin A levels consistent with vitamin A deficiency.
40III
";;j:)
"'C'S 30'6.S;...0Q) 20OlOl...c:Q)
eQ) 10II.
0"'-__
<1)035 0-3&0'70 0·70+05 HI5-HO 1-4~1-75 1-75-2·10 2·1ll-2·45 2045-2·80 >2·80Plasma vitamin A (I-'mol/l)
Fig. 1. Frequency distribution of vitamin A levels in 284 HIV-seropositive injection drug users in Baltimore. Maryland.(_), Proportion of individuals with vitamin A levels < 1·05l!molll.

462 R. D. SEMBA
40
~30(II
J
"'S'0.:::- 20Q
G)Cl
:l.::: 10G)
eIf.
0'------1--<0·35 0-35- 0·70· 1·05· 1-40· 1075- 2·10- 2'45- 2·80· 3·15· 3·50- 3·85· 4·20- >4·55
0·70 1·05 1·40 1·75 2·10 2·45 2·80 3·15 3·50 3·85 4·20 4·55
Plasma vitamin A (j.lffiOI/ll
Fig. 2. Frequency distribution of vilamin A levels in 311 HIV-seropositive homosexual men in a cohort from Baltimore,Maryland and the Washington, DC area. C-), Proportion of individuals with vitamin A levels < 1·0511mo1l1.
40
~o:J 30J
"'S:'0.S
20'0Q)
CD
'"E 10G)
eQ)a.
0 ......----<0·35 0·35-0·70 1).70·1·05 1·05-1,40 1040-1-75 1.75-2·10 2·10-2·45 2·45-2·80 >2·80
Serum vitamin A (f.lmollil
Fig. 3. Frequency distribution of vitamin A levels in 522 HIV-seropositive adults from an outpatient clinic of the OldMulago Hospital, Kampala, Uganda. C-), Proportion of individuals with vitamin A levels < 1·05I1moVl.
Overall, the vitamin A status of HIV-infected pregnant women in the USA was better thanthat in Africa. Vitamin A levels were measured in 126 HIY-infected lactating women at 6months post-partum who were being followed in an outpatient clinic in Cite Soleil, Port AuPrince, Haiti (J. S. Coberly, R. D. Semba, N. Halsey, J. Desonneaux, D. Jules-Joseph, P. A.Carrenard, M. McBrien, R. Boulos and A. J. Ruff, unpublished results; Fig. 6). Over 75 %of these lactating women had vitamin A levels consistent with vitamin A deficiency.
Comparison of the frequency distributions of vitamin A levels in these six differentpopulations allows some possible generalizations. First, HIY-infected adults fromdeveloping countries had lower vitamin A levels than HIY-infected adults in the USA.Such an observation might be expected because the intake of vitamin A-rich or vitamin Afortified' foods is lower in developing countries. Second, HIY-infected injection drug usersfrom inner city Baltimore had lower vitamin A levels than HIY-infected homosexual men

40
!!!
'":;)~ 30:a.S'0<1> 20Cl
~<1>
~ 10tf
o
NUTRITIONAL STATUS IN DISEASE AND OTHER TRAUMA
<0·35 0·35-1).70 ()'70-1·05 1·05+40 1040-1-75 1075·2·10 2·1Q.2·45 2045-2·80 >2·80
Serum vitamin A (~molm
463
Fig. 4. Frequency distribution of vitamin A levels in 474 HIV-seropositive women seen in the antenatal clinic of theQueen Elizabeth Central Hospital, Blantyre. Malawi. (_). Proportion of individuals with vitamin A levels < 1·05 ~moll
I.
40
Ul0;:;)
30"C'S:a.S""'0 20
<1>0>
'"E<1>
'" 10~a..
0 ......--<0·35 O·35·(HO (1.70-1·05 \·05·1-40 1040-1-75 1075·2·10 2·10-2·45 2045-2·80 >2-110
Serum vitamin A (~mol/l)
Fig. 5. Frequency distribution of vitamin A levels in 513 HIV-seropositive women in a multicentre cohort study in theUSA (Women and Infants Transmission Study). (.), Proportion of individuals with vitamin A levels < 1·05Ilmol/l.
from the same region. Dietary and socio-economic factors probably account for thesedifferences. Third, many of the homosexual men were taking vitamin supplements (Tang etai. 1993), which suggests that supplementation reduces the risk of having a low vitamin Alevel, in spite of opportunistic infections associated with HIV infection. Finally, it is wellknown that pregnancy and lactation are high-risk periods for vitamin A deficiency inwomen. and these findings show an alarmingly high prevalence of vitamin A deficiencyamong HIV-infected pregnant and lactating women.
VITAMIN A DEFICIENCY AND MORTALITY
Vitamin A deficiency and HIV infection constitute a combined immunodeficiencysyndrome which might be expected to have adverse clinical consequences. Vitamin A

464
40
IJ)
70:>"0.;;'B.S'0
20Q.)OlcoEQ)<>Q; 10ll.
o
R. D. SEMBA
<0·35 0·35'()·70 0-70-1·05 1·05+40 1-40-1'75 1-75-2·10 2·10-2·45 2-45-2·80 ,2'80
Serum vitamin A (flmolll)
Fig. 6. Frequency distribution of vitamin A levels in 126 HIV-seropositive lactating women from Cite Solei!, Port AuPrince, Haiti. (_). Proportion of individuals with vitamin A levels < 1·05 ilmolll.
deficiency was shown to be associated with increased mortality in a longitudinal study ofinjection drug users in Baltimore (Semba et a1. 1993a). Adults with vitamin A deficiencyhad decreased survival by about 1 year. This was corroborated by a larger nested casecontrol study within the ALIVE study which showed that vitamin A deficiency was anindependent risk factor for mortality and was associated with a four-fold increased risk ofdeath (Semba et a1. 1995a). Three other studies from Haiti (Rwangabwoba et at. 1996),Uganda, and Miami have recently continned the association between vitamin A deficiencyand increased mortality during HIV infection, with relative risks for mortality estimatedbetween 2 and 4 in these different studies. In addition, further follow-up in the cohort ofHIV-infected women in Malawi shows that women in the lowest quartiles of serum vitaminA levels had significantly higher mortality (Semba, 1997). Although data from fivedifferent study populations around the world now demonstrate a similar relationshipbetween vitamin A deficiency and increased mortality in adults, it is unknown whethervitamin A supplementation will reduce mortality in HIV-infected adults.
VITAMIN A DEFICIENCY AND VERTICAL TRANSMISSION OF HUMAN IMMUNO-DEFICIENCY VIRUS
The period of highest risk for vitamin A deficiency in women is during pregnancy, whenthere are increased demands for vitamin A because of the growing fetus. Epidemics ofnightblindness, the earliest clinical manifestation of vitamin A deficiency, were commonamong pregnant women in Europe in the nineteenth century and early part of this centurybefore dietary improvements (Birnbacher, 1928). NightbJindness was so common inpregnant women near Bombay, India, that it was considered to be a nonnal symptom ofpregnancy, along with morning sickness (Dixit, 1966). It has been shown recently in acase-control study in Nepal that pregnant women with nightblindness have significantlyhigher infectious disease morbidity than matched controls without nightblindness(Christian et al. 1996). As shown in Figs. 4 and 6, vitamin A deficiency has the highestprevalen,ce among pregnant and lactating women. The major factor contributing to the highprevalence of nightblindness during pregnancy is probably insufficient intake of vitamin Arich foods.

NUTRLTIONAL STATUS IN DISEASE AND OTHER TRAUMA 465
The rates of vertical transmission (mother-to-child transmission) of HIV generally areestimated to be 10-40 %, with rates being higher in developing countries. Prolongedduration of breast-feeding in developing countries was generally thought to account for thehigher rates in areas such as sub-Saharan Africa, because HIV may be present in breastmilk. Other known risk factors for vertical transmission include prolonged duration ofrupture membranes at delivery (Landesman et af. 1996), high maternal HIV viral load(Dickover et aJ. 1996), low maternal CD4 count, and chorioamnionitis (Temmerman et ai.1995).
Given the potential effects of vitamin A deficiency on immunity, and the highprevalence of vitamin A deficiency during pregnancy, we investigated the relationshipbetween vitamin A deficiency and vertical transmission. HIV-infected pregnant women inMalawi who were vitamin A-deficient were three to four times more likely to transmit HIVto their infants (Semba et at. 1994). There was a strong association between low maternalvitamin A levels and increased vertical transmission after controlling for CD4 count,maternal age, and maternal BMI. Infant mortality was higher among those born to vitaminA-deficient HIV-infected pregnant women, reaching 93 % mortality among infants born tothe most-severely-vitamin A-deficient women (Semba et ai. 1995b). Further studies inMalawi (Semba, unpublished results) have recently shown that HIV-seronegative pregnantwomen with serum vitamin A levels consistent with deficiency also have significantlyhigher infant mortality. Thus, the findings of maternal vitamin A deficiency and increasedinfant mortality are consistent among both HIV-seropositive and -seronegative women.
Whether low serum vitamin A levels are a 'marker' for increased vertical transmissionor are causally involved is unknown. In experimental animal models, vitamin A deficiencyduring pregnancy is associated with chorioamnionitis (Noback & Takahashi, 1978), aplacental infection which is a known risk factor for vertical transmission. In addition,animals made deficient in vitamin A during pregnancy have low birth weight and highmortality of offspring, which is consistent with the findings from human studies. Vitamin Adeficiency may have serious consequences for immune function in the mother as well asimmune development in the fetus, but these biological mechanisms have not beencharacterized. The association between maternal vitamin A deficiency and verticaltransmission has beelJ. confirmed in Rwanda (Semba, unpublished results), Haiti (J. S.Coberly, R. D. Semba, N. Halsey, J. Desormeaux, D. Jules-Joseph, P. P. Carrenard, M.McBrien, R. Boulos and A. J. Ruff, unpublished results), and in Baltimore and New YorkCity (Greenberg et at. 1996). A recent study from Kenya shows that HIV-infected womenwith vitamin A deficiency have a greatly increased risk of HIV load in breast milk, whichsuggests a possible wechanism for increased transmission through breast-feeding (Nduatiet al. 1995).
VITAMIN A DEFICIENCY AND VIRAL LOAD
High circulating HlV viral load has been shown to be a risk factor for HIV progression(Ferre et ai. 1995) and vertical transmission (Dickover et ai. 1996). The relationshipbetween serum vitamin A levels and viral load is of potential importance, because the HIVgenome contains a retinoic acid response element in the long terminal repeat (Orchard etai. 1993), and all-trans retinoic acid, the active metabolite of vitamin A, has been shown toinfluence HIV replication (Poli et ai. 1992; Turpin et ai. 1992). In a cross-sectional study of284 HIV-infected injection drug users from the ALIVE cohort, no relationship was foundbetween plasma vitamin A levels and viral load (Semba, unpublished results). In a study ofhomosexual men from the Multicentre AIDS Cohort Study, there was no relationship
466 R. D. SEMBA
between serum vitamin A levels and viral load (Semba, unpublished results). Arandomized, double-masked, placebo-controlled clinical trial of high-dose vitamin Asupplementation for 120 HIV-infected adults shows that vitamin A supplementation has noeffect on viral load (Semba, unpublished results). In a related study, a phase 11I1 trial of alltrans retinoic acid treatment for Kaposi's sarcoma showed no effect of retinoic acid onHIV p-24 antigenaemia, suggesting that retinoic acid had no effect on viral load (Bailey etat. 1995).
These studies suggest that vitamin A levels and viral load are independent risk factorsduring HIV infection, and that vitamin A deficiency is not a marker for viral load. Highdose vitamin A supplementation does not seem to have an effl<ct on viral load levels, andthis finding has implications for clinical trials of antenatal supplementation of vitamin A asa strategy to reduce mother-to-child transmission of HIV. These findings refute the ideathat vitamin A supplementation would work in the same manner as an anti-retroviralmedication, although some clinical trials are designed as if this were an expected biologicaleffect. Perhaps it is more important that these findings show that vitamin Asupplementation does not seem to up-regulate the expression of mv, a theoreticalconsideration raised by in vitro studies. Should clinical trials of vitamin A therapy toreduce mother-to-child transmission show a beneficial clinical effect, these studies suggestthat the biological mechanism(s) would probably be mediated through some other means,such as reduction in chorioamnionitis or improvement of immune development in motherand infant.
VITAMIN A AS THERAPY IN HUMAN IMMUNODEFICIENCY VIRUS INFECTION
The community- and hospital-based clinical trials of vitamin A for child survival andtreatment of acute measles provide compelling rationale for investigating the use ofvitamin A as therapy in HIV infection. Epidemiological studies demonstrate that vitamin Adeficiency is common in HIV-infected pregnant women, injection drug users in the innercity, and in adult populations in developing countries. In sub-Saharan Africa, where antiretroviral and prophylactic therapies may be prohibitively expensive, the optimization ofmicronutrient status may be among the affordable strategies available for potentiallyprolonging survival and reducing vertical transmission of HIV. Two recent clinical trials ofvitamin A therapy for HIV-infected children suggest that vitamin A supplementationreduces diarrhoeal morbidity (Coutsoudis et ai. 1995) and improves immunity (Hussey etal. 1996). Four clinical trials are currently in progress in Tanzania, South Africa, Malawi,and Zimbabwe to determine whether antenatal vitamin A supplementation can reducevertical transmission and infant mortality. A large clinical trial in Uganda is addressing thequestion of whether periodic vitamin A supplementation can improve survival for HIV~
infected children. A recent World Bank (1993) analysis has shown that vitamin Asupplementation has the second-highest cost-benefit effect of forty~seven major healthinterventions studied. It remains to be detennined whether vitamin A supplementation willhave therapeutic benefit in reducing vertical transmission of HIV, infant mortality, andmortality of young children.
REFERENCES
Alvarez, J. 0., Salazar-Lindo, E. Kohatsu, J., Miranda, P. & Stephensen, C. B. (1995). Urinary excretion ofretinol'in children with acute diarrhea. American Journal of Clinical Nutrition 61, 1273-1276.
Bailey, J., Pluda, J. M., Foli, A., Saville, M. W., Bauza, S., Adamson, P. C., Murphy, R. F., Cohen, R. G.,Broder, S. & Yarchoan, R. (1995). Phase vn study of intermittent a11-tran.l'-retinoic acid, alone and in
1 f

NUTRITIONAL STATUS IN DISEASE AND OTHER TRAUMA 467
combination with interferon alpha-2a, in patients with epidemic Kaposi's sarcoma. Journal of ClinicalOncology 13, 1966-1974.
Beach, R. S., Mantero-Atienza, E., Shor-Posner, G., Javier, J. J., Szapocznik, J., Morgan, R., Sauberlich, H. E.,Cornwell, P. E., Eisdorfer, C. & Baum, M. K. (1992). Specific nutrient abnormalities in asymptomatic mV·linfection. AIDS 6, 701-708.
Beaton, G. H., Martorell, R, Aronson, K. J., Edmonston, B., McCabe, G., Ross, A. C. & Harvey, B. (1993).Effectiveness of Vitamin A Supplementation in the Control of Young Child Morbidity and Mortality inDeveloping Countries. State-of-the-Art Nutrition Policy Discussion Paper no. 13. Geneva: ACCfSCN.
Birnbacher, T. (1928). Ueber den Friihlingsgipfel der epidemischen Mangelhemeralopie und die pathogenetischeBedeutung des Friihjahrs (On the springtime peak of epidemic hemeralopia and the pathogenic significance ofspring). Wiener Klinische Wochenschrift 20, 698-700.
Buck, J., Ritter. G., Dannecker, L., Katta, V., Cohen, S. L., Chait, B. T. & Hammerling, U. (1990). Retinol isessential for growth of activated human B cells. Journal of Experimental Medicine 171, 1613-1624.
Campos, F. A. C. S., Flores, H. & Underwood, B. A. (1987). Effect of an infection on vitamin A status ofchildren as measured by the relative dose response (RDR). American JoUrnal of Clinical Nutrition~, 91-94.
Cantorna, M. T., Nashold, F. E., Chun, T. Y. & Hayes, C. E. (1996). Vitamin A down-regulation oflFN-gammasynthesis in cloned mouse Thl lymphocytes depends on the CD28 costimulatory pathway. Journal ofImmunology 156, 2674-2679.
Christian, P., West, K. P. Jr, Khatry, S. K., Katz, J., Stoltzfus, R. J. & Pokhrel, R. P. (1996). Epidemiology ofnight blindness during pregnancy in rural Nepal. Abstracts of the XVllinternatiolUll Vitamin A ConsultativeGroup Meeting, Guatemala City, p.8. Washington, DC: International Life Sciences Institute.
Coodley, G. 0., Coodley, M. K., Nelson, H. D. & Loveless, M. O. (1993). Micronutrient concentrations in theHIV wasting syndrome. AIDS 7, 1595-1600.
Coutsoudis. A., Bobat, R. A., Coovadia, H. M., Kuhn, L., Tsai, W. Y. & Stein, A. Z. (1995). The effects ofvitamin A supplementation on the morbidity of children born to HIV-infected women. American Journal ofPublic Health 85, 1076-1081.
Coutsoudis. A., Broughton, M. & Coovadia, H. M. (1991). Vitamin A supplementation reduces measlesmorbidity in young African children: a randomized, placebo-controlled, double-blind trial. American Journalof Clinical Nutrition 54, 890-895.
Dickover, R. E., Garratty, E. M., Herman, S. A., Sim, M.-S., Plaeger, S., Boyer, P. J., Keller, M., Deveikis, A.,Stiehm, E. R. & Bryson, Y. J. (1996). Identification of levels of maternal HIV-l RNA associated with risk ofperinatal transmission. Effect of maternal zidovudine treatment on viral load. Journal of the AmericanMedical Association 275, 599-605.
Dixit, D. T. (1966). Night-blindness in the third trimester of pregnancy. Indian Journal ofMedical Research 54,791-795.
Ferre, F., Moss, R. B., Daigle, A., Richieri, S. P., Jensen, F. & Carlo, D. J. (1995). Viral load in peripheral bloodmononuclear cells as surrogate for clinical progression. Journal of the Acquired Immune DeficiencySyndromes and Human Retrovirology 10, Supp!. 2, 51-56.
Garbe, A., Buck, J. & Hiimmerling, U. (1992). Retinoids are important cofactors in T cell activation. Journal ofExperimental Medicine 176, 109-117.
Greenberg, B. L., Semba, R. D., Vink, P. E., Schoenbaum, E. E., Farley, 1. J. & Weedon, J. (1996). Serumvitamin A and perinatal transmission of HIV among a cohort of mV-infected women in the United States.Abstracts of the Xl International Conference on AIDS. Vancouver, vol. I, p. 367. Vancouver, Canada: XIInternational Conference on AIDS Society.
Hussey, G., Hughes, J., Potgieter, S., Kessow, G., Burgess, J., Beatty, D., Keraan, M. & Carelse, E. (1996).Vitamin A status and supplementation and its effects on immunity in children with AIDS. Abstracts of theXV][ InternatiolUli Vitamin A Consultative Group Meeting, Guatemala City, p. 6. Washington, DC:International Life Sciences Institute.
Hussey, G. D. & Klein. M. (1990). A randomized, controlled trial of vitamin A in children with severe measles.New England Journal of Medicine 323, 160-164.
Karter. D. L., Karter, A. J., Yarrish. R, Patterson, C., Kass, P. R., Nord, J. & Kislak, J. W. (1995). Vitamin Adeficiency in non-vitamin-supplemented patients with AIDS: a cross-sectional study. Journal of AcquiredImmune Deficiency Syndromes and Human Retrovirology 8, 199-203.
Kotier, D. P. & Grunfeld, C. (1995). Pathophysiology and treatment of the AIDS wasting syndrome. In AIDSClinical Review 1995/1996, pp. 229-275 [Po Volberding and M. A. Jacobson, editors}. New York: MarcelDekker. Inc.
Landesman, S. H., Kalish, L. A., Bums, D. N., Minkoff, H., Fox, H. E., ZorriUa, C., Garcia, P.• Fowler. M. G.,Mofenson, L., Tuomala, R. & Women and Infants Transmission Study (1996). Obstetrical factors and thetransmission of human immunodeficiency virus type I from mother to child. New England Journal ofMedicine 334, 1617-1623.
Nahlen, B. L., Chu, S. Y., Nwanyanwu, O. C., Berkelman, R L., Martinez, S. A. & RuHan, J. V. (1993). mvwasting syndrome in the United States. AIDS 7. 183-188.

468
-------------- -------------------
R. D. SEMBA
Nduati, R. W., John, G. C., Richardson, B. A., Overbaugh, J., Welch, M., Ndinya-Achola, J., Moses, S., Holmes,K., Onyango, F. & Kreiss, 1. K. (1995). Human immunodeficiency virus type I-infected cells in breastmilk:association with immunosuppression and vitamin A deficiency. Journal of Infectious Diseases 172, 14611468.
Noback, C. R. & Takahashi, Y. I. (1978). Micromorphology of the placenta in rats reared on marginal vitaminA-deficient diet. Acta Anatomica 102, 195-202.
Orchard, K.. Lang, G., Harris, 1., Collins, M. & Latchman, D. (1993). A palindromic element in the humanimmunodeficiency virus long terminal repeat binds retinoic acid receptors and can confer retinoic acidresponsiveness on a heterologous promotor. Journal ofAcquired Immune Deficiency Syndromes 6, 440-445.
Pilch, S. M. (1987). Analysis of vitamin A data from the Health and Nutrition Examination Surveys. JOU17UJ1 ofNutrition 117, 636-640.
Poli, G., Kinter, A. L., Justement, J. S., Bressler, P., Kehrl, I. H. & Fauci, A. S. (1992). Retinoic acid mimicstransforming growth factor J3 in the regulation of human immunodeficiency virus e)(pression in monocyticcells. Proceedings of the National Academy of Sciences USA 89, 2689-2693.
Quinn, T. C. (1996). Global burden of the HIV pandemic. Lancet 348, 99-106.Ross, A. C. (1996). The relationship between immunocompetence and vitamin A status. In Vitamin A
Deficiency: Health. Survival. and Vision, pp. 251-276 (A. Sommer and K. P. West Ir, editors]. New York:O)(ford University Press.
Ross, A. C. & Ternus, M. E. (1993). Vitamin A as a hormone: Recent advances in understanding the actions ofretinol. retinoic acid, and beta carotene. Journal of the American Dietetic Association 93, 1285-1290.
Rwangabwoba, J. M., Humphrey, J., Coberly, J., Moulton, L., Desormeaux, J. & Halsey, N. A. (1996). VitaminA status and development of tuberculosis and/or mortality. Abstracts of the Xl International Conference onAIDS, Vancouver vol. 2, p. 103. Vancouver, Canada: XI International Conference on AIDS Society.
Scrimshaw, N. S., Taylor, C. E. & Gordon, J. E. (1968). Interactions of Nutrition and Infection. Geneva: WHO.Semba, R. D. (1994). Vitamin A. immunity. and infection. Clinical Infectious Diseases 19,489-499.Semba, R. D. (1997). An overview of the potential role of vitamin A in mother-to-child transmission of HIV-l.
Ac/a Paediatrica (In the Press).Semba, R. D., Caiaffa. W. T., Graham, N. M. H., Cohn, S. & Vlahov, D. (1995a). Vitamin A deficiency and
wasting as predictors of mortality in HIV-infected injection drug users. Journal of Infectious Diseases 171,1196--1202.
Semba, R. D., Graham, N. M. H., Caiaffa, W. T., Clement, L. & Vlahov, D. (1993a). Increased mortalityassociated with vitamin A deficiency during mV-l infection. Archives of Inte17UJ1 Medicine 153,2149-2154.
Semba, R. D., Miotti, P. G., Chiphangwi, 1. D., Liomba, G., Yang, L. P., Saah, A., Dallabetta. G. & Hoover, D.R. (l995b). Infant mortality and maternal vitamin A deficiency during HIV infection. Clinical InfectiousDiseases 21, 966--972.
Semba, R. D., Miotti. P.• Chiphangwi, J., Saah, A., Canner, J., Dallabetta, G. & Hoover, D. R. (1994). Maternalvitamin A deficiency and mother-to-child transmission of HIV-l. Lancet 343, 1593-1597.
Semba, R. D., Muhilal, Scott, A. L., Natadisastra, G., Wirasasmita, S., Mele, L., West, K. P. Jr & Sommer, A.(1992). Depressed immune response to tetanus in children with vitamin A deficiency. JOU17UJl of Nutrition122, 101-107.
Semba, R. D., Muhilal, Ward, B. I., Griffin, D. E., Scott, A. L., Natadisastra. G., West, K. P. Ir & Sommer, A.(1993b). Abnormal T-cell subset proportions in vitamin A-deficient children. Lancet 341, 5-8.
Semba, R. D., Park, S. W., Royal, w. & Griffin, D. E. (1996). Vitamin A deficiency and T-cell subpopulations inHIV-infected adults. Nutrition Research 16,915-923.
Sidell, N., Chang, B. & Bhatti, L. (1993). Upregulation by retinoic acid of interleukin-2-receptor mRNA inhuman Tlymphocytes. Cellular Immunology 146,28-37.
Silveira, S., Vannucchi, H., Iordao, A. Jr & Figueiredo, J. F. C. (1996). Does urinary retinol excretion contributeto hypovitaminosis A in HIV-I-infected individuals and in patients with AIDS? Abstracts of the XlInternational Conference on AIDS, Vancouver, vol. 2, p. 292.
Smith, F. R. & Goodman, D. S. (1971). The effects of diseases of the liver, thyroid, and kidneys on the transportof vitamin A in human plasma. Journal of Clinical Investigation 50, 2426--2436.
Smith, F. R., Goodman, D. S., Arroyave. G. & Viteri, F. (1973). Serum vitamin A. retinol-binding protein, andprealbumin concentrations in protein-calorie malnutrition. n. Treatment including supplemental vitamin A.American Journal of Clinical Nutrition 26,982-987.
Sommer, A., Katz. J. & Tarwotjo, I. (1984). Increased risk of respiratory disease and diarrhea in children withpreexisting mild vitamin A deficiency. American Journal of Clinical Nutrition 40, 1090-1095.
Sommer, A., Tarwotjo. I., Hussaini. G. & Susanto, D. (1983). Increased mortality in children with mild vitaminA deficiency. Lancet ii, 585-588.
Stephensen, C. B., Alvarez, 1. 0., Kohatsu, I., Hardmeier, R., Kennedy, 1. I. Ir & Gammon, R. B. Ir (1994).Vitamin A is e)(creted in the urine during acute infection. American Journal ofClinical Nutrition 60, 388-392.
Tang, A. M., Graham, N. M. H., Kirby. A. J.• McCall. L. D., Willett, W. C. & Saah, A. J. (1993). Dietarymicronutrient intake and risk of progression to acquired immunodeficiency syndrome (AIDS) in human

NUTRITIONAL STATUS IN DISEASE AND OTHER TRAUMA 469
immunodeficiency virus type 1 (HlV-I)-infected homosexual men. American Journal of Epidemiology 138,937-951.
Temmennan, M., Nyong'o, A. 0., Bwayo, J., Fransen, K., Coppens, M. & Piot, P. (1995). Risk factors formother-to-child transmission of human immunodeficiency virus-I infection. American Journal of Obstetricsand Gynecology 172, 700-705.
The Vitamin A and Pneumonia Working Group (1995). Potential interventions for the prevention of childhoodpneumonia in developing countries: a meta-analysis of data from field trials to assess the impact of vitamin Asupplementation on pneumonia morbidity and mortality. Bulletin of the World Health Organization 73, 609619.
Turpin, J. A., Vargo, M. & Meltzer, M. S. (992). Enhanced HIV-l replication in retinoid-treated monocytes:retinoid effects mediated through mechanisms related to cell differentiation and to a direct transcriptionalaction on viral gene expression. Journal of Immunology 148, 2539-2546.
Vlahov, D., Anthony, J. C., Muiioz. A., Margolick, J. 8., Nelson, K. E. & Polk, B. F. (1991). The ALIVE study,a longitudinal study of mV·I infection in intravenous drug users: description of methods and characteristicsof participants. Journal of Drug Issues 21, 755-771.
Wiedennann, U., Hanson, L. A., Holmgren, J., Kahu, H. & Dahlgren, U. I. (1993). Impaired mucosal antibodyresponse to cholera toxin in vitamin A-deficient rats immunized with oral cholera vaccine. Infection andImmunity 61, 3952-3957.
World Bank (1993). World Bank Reports 1993: Investing in Health. New York: Oxford University Press.Zhao, Z. & Ross, A. C. (1995). Retinoic acid repletion restores the number of leukocytes and their subsets and
stimulates natural cytotoxicity in vitamin A-deficient rats. Journal ofNutrition 125, 2064--2073.
© Nutrition Society 1997

Acta Pa:tdlatr Supp1421: 107-12. 1997
Overview of the potential role of vitamin A in mother-to-childtransmission of HIV-1
RDSemba
DepartmoJl olOphthalmology, TM Jow HopkiM Untversity School ofMedicine, Baltimore, MD, USA
Semba. RD. Overview of the potential role of vitamin A in mother-to-ehild transmission of HlV-l. Actapziliatr 1997; Supp1421: 107-12. Stockholm.lSSN 0803-5326
Vitamin A is an essential micronutrient for normal immune function. Vitamin A deficiency is commonamong human immunodeficiency virus (HIV)-infected pregnant women and is. associated with highermother-to-child transmission of IHV-1 and increased infant mortality. The biological mechanisms by whichvitamin Adeficiency could influence mother-ta-child transmission ofHIV-1 include impairment ofimmuneresponses in both mother and infant, abnormal placental and vaginal pathology and increased mv viralburden in breastmilk: and blood. Clinical trials are currently in progress to determine whether dailymicronutrient supplementation, including vitamin A, during pregnancy can reduce mother-to-ehild transmission of HIV-l. OAcquired immruuxiejU:iency syndrome, HN-l, vitamin At vertical transmission
RD Semba, Ocular Immunology Service, Suite 700, 550 North Broadway, Baltimore, MD 21205. USA
Vitamin A, or all-tranNetinol, is an essential micronutrient for immunity, growth, reproduction, maintenance ofepithelial surfaces and vision (1). This fat~soluble vitaminis found either as preformed vitamin A in liver, cod~liver
oil, butter, egg yolks and other dairy products, or as provitamin A carotenoids, such as /3-carotene, in carrots, darkgreen leafy vegetables and various orange and yellow fruitsand vegetables. The liver contains approximately 90% ofthe body's stores of vitamin A, and the liver has thecapacity to store many months' worth of vitamin A, witha longer storage capacity for adults than children. VitaminA is released into the blood in a one~to·one molar complexwith transthyretin and retinol-binding protein, and it isutilized by all nucleated cells in the body. In the cytoplasm,all-trans-retinol is converted to all-trans-retinoic acid, themain active metabolite of vitamin A. The cell nucleuscontains receptors that belong to the superfamily of steroidand thyroid honnone receptors (2) and bind to both retinoicacid and to specific DNA sequences. Through these receptors. known as retinoic acid receptors (RAR) and retinoidX receptors (RXR), the active metabolites of vitamin Aeffect gene transcription (3). It is thought that vitamin Amay ultlmatel.y be involved in the regulation of more than300 genes. The recent discovery of these nuclear receptorsin the last decade has lent credence to the concept thatvitamin A acts as a potent gene regulator.
Vitamin A deficiency as an immunodeficiencydisorderVitamin A deficiency Can occur due to such factors asinadequate intake of vitamin A-containing foodstuffs,malabsorption of vitamin A, impaired storage due to liver
o ScandinavilUl University Press 1997. ISSN 0803·5326
disease and accelerated utilization and urinary loss ofvitamin A during acute and chronic infection. Vitamin Adeficiency bas been traditionally defined on the basis ofophthalmological signs and symptoms of deficiency, i.e.nightblindness and xerophthalmia, or other biochemicalindicators of low circulating vitamin A levels or stores.Children or adults with vitamin A deficiency are moresusceptible to infectious diseases, and longitudinal studieshave suggested that vitamin A-deficient children may havea fourfold increased risk of death in developing countries(4).
Vitamin A deficiency itself is a mild immunosuppressivedisorder that is perhaps the most common of what hasrecently been dubbed the "Nuttitionally Acquiredhnmunosuppressive Disorders," or NAIDS (5). The mainimmune abnormalities caused by a deficiency in vitamin Ainclude impaired antibody responses to T-cell-dependentprotein antigens, impaired cell-mediated immunity, atrophy of lymphoid tissues such as thymus, spleen, lymplrnodes and Peyer's patches, altered circulating T-cell subsets and metaplasia of ocular, respiratory, gastrointestinal.and genito-urinary mucosal surfaces. There is a wealth ofanill',lal and human studies that demonstrate these abnormalities (1). Vitamin A deficiency is known to increase therisk of subsequent infections, and infections increase thesubsequent risk of vitamin A deficiency, leading to avicious cycle of infection and deficiency I sometimesending in death. .
Vitamin A deficiency during HIV infectionGiven the close relationship between vitamin A deficiency,compromised immunity and infections, we began detailed

I,
I
IIIi
I)i
Ii!
i.
108 RDSemba
longitudinal observations to determine whether vitamin Adeficiency may influence the clinical course of humanimmunodeficiency virus (HIV) infection. At that timethere were cross-sectional studies suggesting that perhaps10-30% of HIV-infected adults might be deficient invitamin A (6-8). We commenced a longitudinal study ofvitamin A deficiency in mY-infected intravenous drugusers (!DUs) in Baltimore, Maryland (9). Plasma vitaminA levels were measured in a random sample of 179individuals from a cohort of over 2000 mus who wereparticipating in the AIDS Linked to Intravenous Experi~
ences, or ALIVE Study (10). This study suggested thatabout 15% ofIDDs had plasma vltamin A levels consistentwith deficiency, and those who were vitamin A deficienthad a fourfold increased risk of death and shortened sur-viva! compared to those \','ithcut v:tamin l\. deficiency4
Because of the limited size of this study, we wanted toconfirm these findings with a larger, more rigorous epidemiological study design. We conducted a nested casecontrol study comparing those who died with AIDS andinfections with those who survived in the similar timeperiod, matched by CD4 T-cell count on enrollment inthe ALNE cohort (11). We matched 50 cases with 235controls. The nested case--control study suggested thatvitamin A deficiency, wasting and low CD4 T-cell countwere all independently predictive of death during HIVinfection.
To summarize, a variety of cross-sectional studies indicate that vitamin A deficiency is a common micronutrientdeficiency during HIV infection (6-8, 12), and longitudinal studies suggest that serum vitamin A levels consistent with vitamin A deficiency are associated withincreased risk of death (9, 11). In the absence of clinicaltrial data, one cannot definitively conclude that vitamin Adeficiency leads to higher mortality during mv infection.However, among children, supplementation with vitaminA during HIV infection may potentially reduce mOrbidity(13), and there have been over a dozen clinical trialsshowing that vitamin A supplementation can reduce morbidity and mortality in general among non-mY~infected
individuals (1).
Vitamin A deficiency and mother-to-childtransmission of HIV-1The mother-to--child transmission rate of HIV-l is generally higher in developing countries than in developedcountries. For example, in Malawi the rate is about 34%,compared with 13% in Europe (14, 15). Although thedifference between these rates was usually attributed tolonger duration of breastfeeding in developing countries, itseemed reasonable that nutritional abnormalities mightalso contribute to the higher mother-to-child transmissionrates in developing countries.
Nightblindness, the mildest clinical manifestation ofvitamin A deficiency, is comJilon during pregnancy inmany developing countries, and in some places it may be
ACTA PAlDlATR SUPPL 421 (1997)
so common that it is considered to be a normal part ofpregnancy, along with morning sickness (16). Epidemics ofnightblindness among pregnant women were frequent inEurope until dietary improvements occurred after the1930s (17). Other common micronutrient deficienciesduring pregnancy include iron and folate deficiency.Given the high prevalence of vitamin A deficiency duringpregnancy and studies that suggested a relationshipbetween vitamin A deficiency and mortality during IllYinfection, it seemed reasonable to commence an investigation to detennine if maternal vitamin A status isrelated to vertical transmission rates, child morbidityand mortality and maternal mortality. We studied therelationship between vitamin A deficiency and clinicaloutcome within the context of a large natural historystudy of mv infection in pregnant women in Blantyre,Malawi, which was supported by the National Institutes ofHealth as one of the International Collaboration in AIDSResearch (lCAR) projects.
The study population consisted of 567 mv-infectedmothers and their infants who were born at QueenElizabeth Central Hospital in Blantyre, Malawi, fromNovember 1989 to August 1991. Serum vitamin A levelswere measured during the second or third trimester ofpregnancy. and mothers and infants were followed fromdelivery until the infants reached 1 year of age. Therelationship between maternal vitamin A levels and vertical transmission ofHIV-1 was studied in 338 mv-positivemothers whose infants survived to 12 months of age, atwhich time the HIV serostatus was determined by EUSA.Mean vitamin A levels in 74 mothers who transmitted IllYto their infants was 0.86::!: 0.03 JL1llo11-1 compared with1.07::t O,02pmoll- 1 in 264 mothers who did not transmitmv to their infants (p < 0.0001) (18). Both maternalserum vitamin A levels and maternal percentage CD4levels were independently related to mother-to--child transmission ofHIV. This study suggested that maternal vitaminA deficiency might contribute to increased mother-to--childtransmission of HIV-1.
Maternal vitamin A deficiency and mortality ofinfant and motherWe then studied the relationship between maternal vitaminA levels and infant mortality among women in the samecohort in Malawi (19). This included the 338 HIV-positivemothers whose infants survived to 12 months of age and136 mothers whose infants died before 12 months of age.Infant mortality rates were the highest among infants bornto the most vitamin A-deficient mothers, with 93.3%mortality among infants born to mothers with vitaminA levels < O.35/illloll-I, compared with 14.2% infantmortality among the most vitamin A-replete mothers(serum vitamin A > 1.75,amoll-l). In a multivariateanalysis, both maternal serum vitamin A levels andmaternal age were significantly related to infant mortality.Infant birthweight was also significantly lower among

6 842
%of Mothers withMissing Bands
~---------r.
o
1----------..,*
1-------...,**[
gp17
gag ~p24
p311----------,.
pSt '--__-----...Jp55
p66 t=::::=:::::J
env [0::: ._i----~**gp160
pol
A levels and antibody responses to mv antigens byexamining the presence or absence of bands to differentmv antigens on the Western blot of pregnant mothers inthe Malawi study. Mothers with a positive mv ELISA(Wellcozyme, Wellcome Diagnostics, Dartford. UK) hadtheir mv status confirmed by Western blot (Bio-RadLaboratories, Hemel Hempstead, UK). The Westernblot consisted of bands to env (gp4I, gpl20, gpl60).gag (gp17, gp24) and pol (p31, pSI, p55, p66) antigens.Among 470 mv-infected mothers whose Western blotbands were ~d. vitamin A deficiency (serum levels< l.05/Lmoll-1) was associated with a significantly higherproportion of individuals missing bands to gp41, gp120.gp17, p31 and p51 (Fig. 2). Although the method ofassessing antibodies to different mv antigens was semiquantitative. t'1ese data suggest that maternal vitamin Adeficiency is associated with decreased antibodyresponses to 5/9 mv antigens in the Western blotassay. Further studies using more precise quantitativetechniques are necessary to determine whether antibodytiter to HIV is altered in mv-infected mothers withvitamin A deficiency.
(ii) Hypothesis 2: Maternal vitamin A deficiency causeslowered antibody responses to a wide variety ofpathogens.thus conferring lower titers of passively acquired anti~
bodies to a variety ofpathogens to the infant, resulting inhigher infant morbidity and mortality. This is currently amajor gap in knowledge, as little is known for eithermv-infected or non-infective mothers and their infants.For example, it is unknown whether maternal vitamin A
Fig. 2. Percentage of HIV-infected mothers with missing bands onWestern blot for mV-I. as related to vitamin A deficiency: *p < 0.001and **p < 0.05.
Vitamin A and HN vertical tlYJllSrrW~io1Z 109
_A_._._1-_1--·
1.0 f'!.:'t,:t::::::=::=.1~i-.I" lI-';"-'--~II.....
,.... -!."
".'.t ,
~- ........ __ ... _-,1 - __ .......
..~ ....
~
tCL 0.9iii.~~:Ien
AcrAPAIDfATR SUl'PL421 (1997)
Potential biological mechanisms-somehypothesesBecause of the essential role that vitamin A plays in bothantigen-specific immunity and non-specific immunity, i.e.maintenance of mucosal barriers, it seems reasonable thatvitamin A deficiency could influence mother-to-childtransmission of HIV, infant mortality and maternalmortality. Although the specific biological mechanism(s)is unknown, there are several hypotheses that could beexamined:
(i) Hypothesis 1: Maternal vitamin A deficiency impairsantibody responses to HIV, thus conferring a lower titer ofpassively acquired antibodies to HlV to the infant, resulting in less passive protection and higher vertical transmission ofHlV. The hallmark ofvitamin A deficiency is theimpainnent of antibody responses to T-cell-dependentantigens (21). The exact role of "neutralizing" antibodiesto mv is undear and may depend upon stage of mvinfection and other factors. We attempted to gain someinsight into the relationship between maternal vitamin
Months after delivery
Fig. 1. Survival rates of HlV·infected mothers as ~lated to quartile ofvitamin levels. with quartile 1 as the lowest and quartile 4 as the highest.
0.801.---1....0---'2"'"0---:30"=---407'=---=50
those born to vitamin A-deficient mothers, although themagnitude of the difference was relatively small (19).Although animal models have long suggested a relationship between vitamin A deficiency during pregnancy andadverse outcomes such as low birthweight and highermortality of offspring (20). it was previously unknownwhether this relationship existed in humans. We alsoexamined the relationship between maternal vitamin Alevels and maternal mortality during further subsequentfollow-up in Malawi. In follow~up until the end of 1993. 38of 474 lllV-infected mothers died. We divided the serumvitamin A levels into quartiles, and those mothers in thelowest quartile of vitamin A levels during pregnancy hadsignificantly lower survival than the higher quartiles ofserum vitamin A (Fig. 1). This study confirms previous1:Ituwes showing that luw vilamin A levels are associatedwith increased risk of mortality (9, II).

iI·..:: .;j
110 RDSemba
deficiency would result in lower titers of passively transferred antibodies against measles to the infant.
(iii) Hypothesis 3: Maternal vitamin A deficiency causesabrwrmal placental pathology. i.e. chorioamnionitis. allowing highervertical transmission ofHIV. Animal studies suggest that deficiency ofvitamin A is associated with increasedplacental infections, low birthweight and prematurity (22,23). Currently studies are in progress to detemrine whetherm.aternaI vitamin A deficiency or other micronutrient deficiencies are associated with increased placental pathology intwo large HIV-infected cohorts in Uganda and Thailand.
(iv) Hypothesis 4: Maternal vitamin A deficiency isassociated with increased HN viral burden in breastmilk,allowing higher vertical transmission of HIV throughbreastfeeding. .A recent study in Kenya indicates thatmv-infected lactating women with vitan1in A deficiencyand CD4 T-cell count < 400 cells ",r1 have more than a2Q-fold higher risk ofhaving high levels of HIV-I DNA inbreastmilkcompared to women who are non-deficient (24).This relationship has recently been confirmed in a separatestudy in Haiti (Coberly et al., submitted for publication).Whether vitamin A supplementation, either during pregnancy or after delivery, will reduce HIV viral burden inbreastmilk and HIV transmission through breastfeeding isunknown and currently being addressed by clinical trials inMalawi, Tanzania and South Africa.
(v) Hypothesis 5: Maternal vitamin A deficiency isassociated with increased HN viral burden. Vitamin Aassociated immune impainnent may allow higher HIVviral burden, which itself may cause higher vertical transmission of HIV. We have examined HIV viral load andplasma vitamin A levels in IDUs and have not found arelationship between vitamin A levels and HIV viral load(Semba et al., submitted for publication).
(vi) Hypothesis 6: Maternal vitamin A deficiency causesabnormalities of the vaginal mucosa, resulting in morebleeding at the time ofdelivery and more exposure of thein/ant to HN-infected blood. There is a paucity of datafrom humans, but animal studies show that during vitaminA deficiency there is loss of mucus and squamous metaplasia in the vagina (25). Whether vitamin A deficiency andpathological changes in the vagina might increase susceptibility to bleeding, infection or increased .HIV in the birthcanal is unknown.
(vii) Hypothesis 7: Vitamin A deficiency during pregnancy in the mother also causes deficiency in the fetus,allowing vitamin A-related immune impainnent in theinfant and increased vertical transmission of HN andhigher infant mortality. Mothers who are deficient in vitamin A during pregnancy are more likely to have infantswho are also deficient (26), and this relationship appears tooccur during HIV infection (Coberly et al., submitted forpublication). A relationship between maternal vitamin Adeficiency and infant immune dysfunction has not yet beendemonstrated.
AcrA PAIDIATRSUPPL 421 (1997)
Further unanswered questionsThe major micronutrient deficiencies that are commonduring pregnancy are those of vitamin A, folate and iron.Other micronutrient deficiencies are less common or notknown to be associated with adverse birth outcome, thusvitamin A deficiency was a reasonable point at which tobegin investigations. Are other micronutrient deficienciesinvolved in increased vertical transmission -of mv andincreased infant mortality? One ofthe difficulties in studying this question retrospectively from cohorts of HI'(infected women is that the archived samples were oftennot originally handled in consideration of subsequentmicronutrient studies. For example, serum samples forzinc need to be drawn and stored in special trace elementvials. Further prospective studies are needed to inve~tigate
this issue.Axe low vitamin A levels only a "marker" for severity
of infection rather than true vitamin A deficiency? Thisquestion was also raised with other diseases, such as acutemeasles, until it was demonstrated that vitamin A supplementation could reduce measles mortality by greater than50% (27). During HIV infection, vitamin A levels consistent with deficiency are independently associated withadverse clinical outcome during HIV infection, controllingfor levels of CD4 T cells, protein energy status and otherfactors. Vitamin A levels are not correlated with circulatingHIV viral burden (Semba et al., submitted for publication).No studies to date have shown that vitamin A is merely a"marker" for a more important factor, and this reductionistargument may be settled by clinical trials. Is there a similarrelationship between maternal vitamin A deficiency andmother~to-ehild transmission of HIV-1 in developedcountries? A preliminary study suggests that such a relationship may exist among inner city women in New Yorkand Baltimore (Greenberg, Semba et al.• unpublished data).Could vitamin A supplementation actually increase mYviral burden and worsen the clinical course of HIVinfection? In vitro studies show that, depending on cellline and culture conditions, retinoids can either up- ordown-regulate .HIV replication (28, 29). The mv viralburden is currently being measured in a clinical trial ofvitamin A supplementation involving 110 mv-pasitivemus (Semba et al., unpublished data).
Clinical trials of vitamin A for reducing verticaltransmission of HIVAlthough the temporal relationship between vitamin Adeficiency during pregnancy and increased vertical transmission of HIV-1 and infant mortality suggest that vitaminA is playing an important role, the ultimate proof of acausal role will be detennined by clinical trials of vitaminA supplementation during pregnancy in HIV-infectedwomen. Four clinical trials are currently being conductedin sub-Saharan Africa in Malawi, Tanzania, South Africaand Zimbabwe. A comparison of thes;clinical trial designs

'1AC1'A P.£DlATRSUPPL 421 (1997).
Table 1. Clinical trials of vitamin A and vertical transmission of HIV-1.
Vitamin A and HN venica! rransmission 111
Silc
Btantyn:,Malawi
Duman,South Africa
Dar Es SalaamTanzania
Harare,Zimbabwe
n
700
7S0
960
600
TmItmel1t groups
(1) Vitamin A. iron, fo1alc(2) Iron. folate
(1) Vitamin A. ,60Qt0tene, iron, folate(2) Iron, folate
(1) Vitamin A. )3-<:arotene(2) Vitamin A. ,6-<:arotene, multivitamins(3) Multivitamins only(4) Placebo only
(1) Multivitamins, iron, folate(2) Placebo only
Outcomes
(1) Vertical transmission(2) Infant motbidity
llDd mortality(3) HIV in breast milk
(1) Vertical transmission(2) HIV in breast milk
(1) Vertical transmission,(2) Progression to AIDS
in mothers
(l) Vcrtical transmission
Collaborators
Johns Hopkins UniversityUniversity of Malawi
University of NatalColumbia University
Harvard University
Royal Veterinary andAgricultul'll1 University,CopenhagenUniversity of Zimbabwe,Blair Research Laboratory
is shown in Table 1. Two of the four studies include ironand folate for all women participants, while the studies inTanzania and Zimbabwe have a true placebo ann, Le.women receiving no nutritional supplementation. Onlythe Malawi study is a clinical mal examining vitamin Asupplementation, while the others are examining a combination of vitamin A and J3-carotene, or in the case ofZimbabwe, the use of multiple micronutrient supplements.The designs of these vitamin A clinical trials raise furtherquestions regarding the dose of vitamin A, whether toincorporate J3-earotene as well, the duration ofsupplementation, the addition of other micronutrients and combination with other therapies. These clinical trials shouldprovide information on the effects of vitamin A on bothearly transmission (during pregnancy and delivery) andlate transmission (through breastfeeding) ofHIV. Resultsof these clinical trials regarding the impact of vitamin A onvertical transmission of:mv are expected later this year.
Ideally, an intervention to stop transmission ofIllV frommother to child would have the following attributes: (i)inexpensive; (ii) easy to administer; (iii) not requiring mYtesting of pregnant women, Le. given to all pregnantwomen as routine antenatal care; (iv) safe with no sideeffects; and (v) not requiring monitoring. If the clinical
, trials mentioned above should demonstrate that vitamin Asupplementation has efficacy in reducing mother-to-childtransmission of IllY, it might meet the attributes for anideal intervention.
Summary and conclusionsIn many parts of the world, the AIDS pandemic is predictedto reverse much progress in the last 50 years with regard tomorbidity and mortality of infants, children and adults.Many factors, such as stage of disease in the mother,prolonged breastfeeding and birth order, have been
shown to increase the risk of vertical transmission offfiV. Until recently, the nutritional status of IllY-infectedpregnant women has been ignored. Vitamin A deficiency iscommon in mv-infected pregnant women and is associated with increased vertical transmission of HIV,higher infant mortality, low birthweight, impaired antibodyresponses to HIV and increased maternal mortality. Studiessuggest that possible biological mechanisms includeincreased HIV viral burden in breastmilk and impairedantibody responses to HIV in vitamin A-deficient mothers.Clinical trials are currently in progress in sub-SaharanAfrica to determine if simple supplementation with vitaminA or other micronutrients will reduce mother-to-childtransmission ofHIV.
Acknowledgments.-The studies in Malawi are a collaboration betweenthe Johns Hopkins Univetsity IIDd the College of Medicine of theUnivetsity of Malawi. The following individuals have made majorcontributions to these studies: Paolo Miotti, John Chiphangwi. GeorgeLiomba, Robin Broadhead, Laban Mtimavlliye, Aafke Justesen, TahaTaha, Gina Dallabetta, Len Van der Hoeven, Robert Biggar. Alfn:dSaah, Donald Hoover and the Maternal Child Health Project team. Thiswork was supportedby NIH AI 26499, AI33874. HD30042,HD32247 and.the Fogarty International Center.
References1. SembaRD. Vitamin A. immunity. and infection. Clin Infect Dis 1994;
19: 489-992. Evans RM. The steroid IllId thyroid hormone receptor superfamily.
Science 1988; 240: 889-953. Pfahl M. Apfel R. Bendik I. Fanjul A, Graupner G. Lee MO, et aI.
Nuclear retinoid receptors and their mechanism of action. VitamHorm 1994; 49: 327-82
4. Sommer A. Tarwoqo I. Hussaini G, Susanto D. Increased mortality inchildren with mild vitamin Adeficiency. Lancet 1983; 2: 585-9
5. Beisel WR. History of nulritional immmunology: introduction andoverview. J Nuti' 1992; 122 (SuppI3): 591-6
6. Beach RS, Mantero-Atienza E, Shor-Posner G. Javier JJ, SzapocznikJ. Morgan R, et al. Specific micronutrient abnormalities in asymptomatic HIV-l infection. AIDS 1992; 6: 701-8

112 RD&mba
7. Bogden JO. Baker H, Frank O. Perez G. Kemp F, Bruening Ie. et al.Micronutriettt status and human immunodeficieQCy virus (HIV)infectioo. Ann NY Acad SCi 1990; 587: 189-95
8. CoodIey GO, CoodIey MK, Nelson HO. Love!ells MO. MicronutrientCClIlUIItrations in the HIV wasting syndrome. AIDS 1993; 7: 1595600
9. Semba RD, Gt3ham NMH, Caiaffa wr. Margolick. m, Clement L,V1ahov D. IDcfeased mortality associated with viIamin A deficiencyduring human lmmunodcfu:iency virus type 1 infection. Arch InternMed 1993; 153: 2149-54
10. VlahovD.AnthonyIC,MuiIozA,MargolickI,NelsonKE,CelcntanoDD. etal. TheALlVEstudy. a longitudinal studyofHIV-l infectionin inlravenou drug WlClll: description ofmedlods and cbaracteristicsof participants. 1 Omg Issue 1991; 21: 755-71
11. SembaRD, Caiaffa WT. GrahamNMH, Cohn S. Vlahov D. VitaminA deficiency and wasting 88 predictors of mortality in humanimm1l.llOdeficiency viros--infected injection drug WlClll. 1 Infect Dill1995; 171:1196-202
12. Karter D1, Karter AI, Yanish R, Patterson C, Kasa PH, Nord J, et aI.Vitamin A deficiency in non-vitamin-supp1emented patients withAIDS: a cross-sectional study. 1 Acq Immune Def Syndr HumRetroviroll995; 8: 199-203
13. CoutsoudisA.BobatRA,CoovlldiaHM,KuhnL, Tsai WY,SteinZA.The effects of vitamin A supplementation on the morbidity ofchil~ born to HIV·infected women. Am 1 Publ Health 1995; 85:1076-81
14. Miotti PG. Canner JK, Liomba G. Chiphangwi I, Dallabetta G.Wangel AM, et aI. Rate of new HIV infection in a cohort of womenofchildbearing age iD Malawi. IX International Conf~nce on AIDS,Berlin, lune 6-11 1993
15. ElI1'llpl!al1 Collaborative Study. Ris.k factors for mothcr-to-childttansmission ofIllY-! Lancet 1992; 339: 1007-12
16. DixitDT. Night.blindness in the third trimcsterofprcgnancy. Indian IMed Res 1966; 54: 791-5
17. Birnbacher T. Ueber den Friihl.iDgsgipfel der epidemischen Mangelhemeralopic und die pathogenctische Bedeutung des Frllhjahrs.WiellCl' lOin Wochensc:hr 1928; 20: 698-700
18. Semba RD, Miotti PO, Chiphangwi JD, Saah AI. Canner 11(,
ActA PAlDIATR SUPPL 421 (1997)
Da11abetta GA. et al. Matema1 vitamin A deficiency and mother-tochild tnmsmisaionofHIV·l. Lancet 1994; 343: 1593-7
19. ScmbaRD.MiouiPG,CbiphangwiJD,LiombaG, YangLP.SaahAI.et al. Infant mortality and maternal vitamin A deficiency duringhuman immunodeficiency virus infection. C1iD Infect Dis 1995; 21:966-2
20. Mason KB. Foetaldeath, prolonged gestation, and difficull parturitionin the rat 88 a result of vitamiD A-deficicncy. Am 1 Ana11935; 57:303--46
21. RossAC. Vitamin AstalUs: relationship to immuaity and thc antibodyresponse. 1Soc Exp BioI Med 1992; 200: 303-20 \
22. Nobaclc CR, Tabhaahi YI. MicromOfPhology of the placenta in ratsreared on marginal vitamin-A-deficient diet Acta Anal 1978; 102:195-202 .
23. 'IbompIon IN, Howell I McC, Pitt GAl. Vitamin Aand reproductionin rats. Pnx: R Soc London, 8er B 1964; 159: 510-35
24. Nduati RW, 10hn GC, Richardson SA. Overbaugh I, Welch M,Ndinya·AchoIa I, et at. Human immunodeficiency virus type 1infected cells in breast milk: association with inlmunosuppressionand vitamin A deficiency. I Infect Dis 1995; 172: 1461-8
25. Mason KE, EIlUon ET. Changes in the vaginal epithelium of the ratafter vitamin A-deficicncy.l Nutr 1935; 9: 735-55
26. Gebrc-Medbin M, Vahlquist A. Vitamin A nutrition in the fetus. J:n:Gebre-Medhin M, editor. Maternal nulrition and its effect on theoffspring. Dietary, anthropometric, biochemical and haematologicalstudies in urban Ethiopia. Sweden: Institute of Nutrition. UniversityofUppsala, Uppsala, 1996: 1-15
27. Hussey GD, KlciD M. A randomized, controlled trial of vitamin A inchildren with severe measles. N Engl J Mcd 1990; 323: 160-4
28. Poli G. Kinter At., Iustement IS, Bressler P. ~brI1H, Fauci AS.Retinoic acid mimics 1rlmsforming growth factor {J in the regulationof human immunodeficiency virus expression in monocytic cells.Pnx: Nat! Acad Sci USA 1992; 89: 2689-93
29. Turpin lA, Vargo M, Meltzer MS. Enhanced mv·l replication inrctinoid-1Ieated monocytes: retinoid effects mediatto.d throughmechanisms related to cell differentiation and to a direct transcriptional action on viral gene expression. J Immunol 1992; 148:2539--46
(
gD
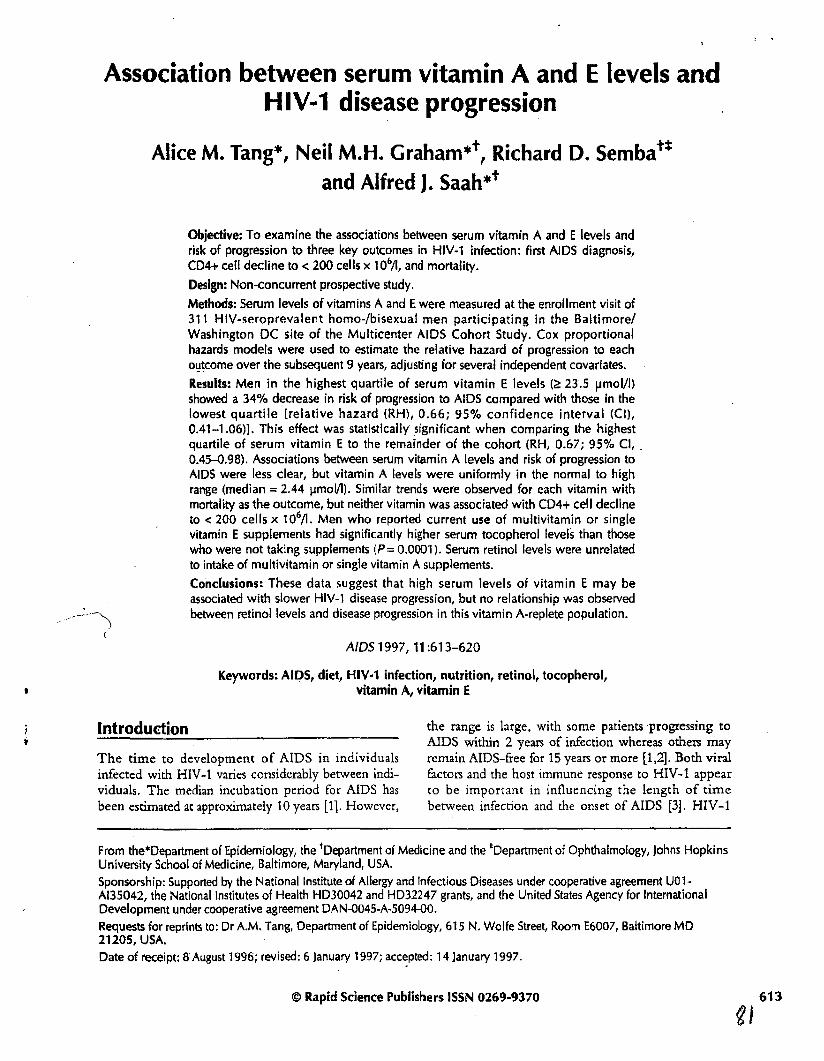
Association between serum vitamin A and E levels andHIV·1 disease progression
Alice M. Tang*, Neil M.H. Graham*t, Richard D. Sembat:l:and Alfred J. Saah*t
Objective: To examine the associations between serum vitamin A and Elevels andrisk of progression to three key outcomes in HIV·l infection: first AIDS diagnosis,C04+ cell decline to < 200 cells x 10b/l, and mortality.Design: Non~concurrent prospective study.
Methods: Serum levels of vitamins Aand Ewere measured at the enrollment visit of311 H1V~seroprevalent homo-/bisexual men participating in the Baltimore/Washington DC site of the Multicenter AIDS Cohort Study. Cox proportionalhazards models were used to estimate the relative hazard of progression to eachol;!tcome over the subsequent 9 years, adjusting for several independent covariates.Results: Men in the highest quartile of serum vitamin E levels (~23.5 IJmol/Oshowed a 34% decrease in risk of progression to AIDS compared with those in thelowest quartile [relative hazard (RH), 0.66; 95% confidence interval (CI),0.41-1.06)]. This effect was statistically.significant when comparing the highestquartile of serum vitamin E to the remainder of the cohort (RH, 0.67; 95% Cl, .0.45-0.98). Associations between serum vitamin A levels and risk of progression toAIDS were less clear, but vitamin A levels were uniformly in the normal to highrange (median =2.44 IJmol/l). Similar trends were observed for each vitamin withmortality as the outcome, but neither vitamin was associated with CD4+ cell declineto < 200 cells x 106/1. Men who reported current use of multivitamin or singlevitamin E supplements had significantly higher serum tocopherol levels than thosewho were not taking supplements (P= 0.0001). Serum retinol levels were unrelatedto intake of multivitamin or single vitamin A supplements.Conclusions: These data suggest that high serum levels of vitamin E may beassociated with slower HIV~ 1 disease progression, but no relationship was observedbetween retinol levels and disease progression in this vitamin A-replete population.
AIDS 1997,11 :613-620
Keywords: AII?S, diet, HIV~l infection, nutrition, retinol, tocopherol,vitamin A, vitamin E
Ii
Introduction
The time to development of AIDS in individualsinfected with HIV-1 varies considerably between individuals. The median incubation period for AIDS hasbeen estimated at approximately 10 years [1]. However,
the range is large. with some patients progressing toAlDS within 2 years of infection whereas others mayremain AIDS-free for 15 years or more [1,2]. Both viralfactors and the host immune response to HIV-1 appearto be important in influencing the length of timebetween infection and the onset of AIDS [3]. HIV-1
From the·Oepartment of Epidemiology, the +Department of Medicine and the tOepartment of Ophthalmology, Johns HopkinsUniversity School of Medicine, Baltimore, Maryland, USA.Sponsorship: Supported by the National Institute of Allergy and Infectious Diseases under cooperative agreement un14Al35042, the National Institutes of Health HD30042 and HD32247 grants, and the United States Agency for InternationalDevelopment under cooperative agreement DAN-0045·A·5094-DO.Requests for reprints to: Dr A.M. Tang, Department of Epidemiology, 615 N. Wolfe Street, Room E6007, Baltimore MD21205, USA.Date of receipt: 8" August 1996; revised: 6 January 1997; acc~pted; 141anuary 1997.
IS> Rapid Science Publishers ISSN 0269-9370 613
~I

614 AIDS 1997, Vol 11 No 5
infected individuals with non-progressive disease (thosewho remain healthy with stable CD4+ cell counts) arethought to be infected with less virulent HIV strains ormay have the ability to mount a highly effectiveimmune response [4].
Nutritional status has been hypothesized to be a potential cofactor which could modity the course of HIV-1disease progression through its effects on immune function [5,6]. Vitamins A and E are both important foroptimal functioning of the immune system Pl.Deficiencies of these vitamins have been found toimpair immune responses in a variety of studies [7,B}.There is ample evidence from both human and animalstudies that supplementation with vitamins A and/or Eenhances inununity and resistance to various infectiousdiseases [7-13]. Previous studies have found ~jgni6.c;mt
proportions ofHIV-1-seropositive individuals with lowserum levels of either or both vitamins [14-18]. Lowserum levels or' low intakes of vitamin A in HIV-1infection have been associated with lower CD4+ cellcounts [17], increased maternal-fetal transmission [18],increased mortality from AIDS or infections (19), andincreased risk of progression to AIDS [20]. Low serumvitamin E levels in HlV-1-infected individuals havebeen correlated with a higher degree of lipid peroxidation [21], increased p24 antigenemia [22], decreasedplasma levels of polyunsaturated fatty acids [22], andincreased plasma immunoglobulin (Ig) E levels [23].Supplementation with vitamins A and E has beenshown to improve immune parameters in severalmurine AIDS models [10,24-26]. There is also evidence that vitamin A supplementation in children withHIV-1 may decrease diarrhoeal symptoms [27].
In this study we examine the association betweenserum levels of vitamins A and E and subsequent disease progression in a cohort of HIV-1 infected homo/bisexual men.
Methods
Eligible subjects were 341 men who were HIV-lseropositive upon enrollment into the BaltimorelWashington, DC site of the Multicenter AIDS CohortStudy (MACS), a prospective study on the natural history of HIV-1 infection in homosexual and bisexualmen. The objectives, design and recruitment protocolof the MACS have been described elsewhere [2B}. Ofthose who were eligible, 312 (91%) had serum availablein the repository from their 1984 baseline study visit.The remaining HIV-1-seropositive individuals (n = 29)did not differ significantly with respect to age, race,education, cigarette smoking, CD4+ cell counts orweight (data not shown). Concentrations of vitamins Aand E were estimated for 311 of the 312 subjects.
Levels were determined using high. performance liquidchromatography procedures [29]. The stability of vitamins A and E in sera stored for long periods of time hasbeen examined in several studies and results have indicated that under optimal storage conditions, both vitamins can be quite stable for periods of several years andthrough several freeze-thaw cycles [30-33]. Serumalbumin and C-reactive protein (CRl') levels wereassessed in 308 of the subjects (by Dr Ranjit Chandra, StJohn's University, St John's, Newfoundland, Canada,1993). Serum albumin concentrations were determinedusing a colorimetric assay, with normal range designatedas 35-50 gil. The CRP levels were determined usingan enzyme-linked immunosorbent assay (ELISA). Levelsbelow 8.0 mg/l were considered to be nonnal whilelevels ~ 8.0 mgll were considered to be elevated.
The majority of variables used in these analyses werebased on data collected at each subject's baseline clinicvisit. Usual dietary intake was assessed at baseline usinga self-administered, semiquantitative food frequencyquestionnaire [34]. Subjects were asked to estimatetheir frequency of consumption ofeach of the 116 fooditems, in tenns ofa typical portion size, over the previous 12 months. Nine frequency categories were available to choose from, ranging from 'never or less thanonce per month' to 'more than six times per day'. Thequestionnaire also had sections for recording the brandname, frequency and amount of vitamin supplementstaken, a write-in section for foods not listed, and questions on the exact brands and types of fat used for frying, cooking and baking. Completed questionnaireswere reviewed and coded by ·a trained researcher andentered into computer data files. Estimates of foodintake and total intake (food and supplements combined) of vitamins A and E were detennined using thenutrient analysis program developed specifically for thequestionnaire [34].
HIV-1 serostatus was determined by enzymeimmunoassay (Genetic Systems, Seatde, Washington,USA) and a Western blot test (DuPont Co.,Wilmington, Delaware, USA and Bio-Rad, Hercules,California, USA) with interpretation using standard criteria. Subjects were divided into three categories basedon their CD4+ cell numbers at study entry: < 500,500-750 and> 750 cells X 10611. These categories wereformed to give approximately equal numbers of men ineach category. Those who were missing data on CD4+counts at their baseline visit (n = 32) were assigned toone of the three categories based on data from subsequent adjacent semi-annual visits. It was possible toestimate the appropriate CD4 category for these individuals since the mean CD4+ cell decline in the cohortwas 30 cells X 10611 per 6 months.
Body mass index was calculated as weight/height2•
HIV-related symptoms were defined as the presence of

one or more of the following most commonly reportedsymptoms lasting a period of 2 or more weeks: persistent/recurring fever> 37.SoC, persistent diarrhoea.oral thrush, persistent fatigue, and/or unintentionalweight loss of 4.5 kg. Frequency of alcohol consumption was based on the variable 'how often do you drinknow?' which was originally coded into eight categoriesranging from 'one to five times/year' to 'at leastonce/day'. For analyses, this variable was collapsed intotwo categories: less than or equal to two times perweek and more than twice per week. For 23 subjectswho were missing this data at their baseline visit, valuesfrom their next study visit (approximately 6 monthslater) were substituted. Subjects were placed into oneof two categories based on their smoking status: eithernon-smokers or regular/occasional smokers.
Treatment variables were obtained from data coUectedover the follow-up period of the study. For the analyses, two binary treatment variables were created indicating 'ever' or 'never' use of antiretroviral drugs(zidovudine, didanosine, zalcitabine) and Pneumocystiscarinij pneumonia (PCP) prophylaxis (aerosolized pentamidine, trimethoprirn-sulfamethoxazole. dapsone)before the onset of AIDS.
The cutoff date for analysis was 31 December, 1993,slighdy more than 9 years after the beginning of theBaltimore MACS. Three outcomes were examined inthis study including time from baseline study visit tofirst AIDS diagnosis, time from baseline to death, andtime from baseline to first CD4+ cell count < 200cells X 1OliII. AIDS diagnoses were based on the 1987revision of the Centers for Disease Control surveillancecase definition [35]. Mortality data were obtained fromphysicians' reports, hospital records, and death certificates. CD4+ cell counts were measured at every 6month follow-up visit.
Statistical methodsProportions of subjects with low serum vitamin A andvitamin E leyels were determined according to cutoffiderived from the laboratory standards. All of the independent covariates were examined for their associationswith serum vitamin A and E levels using Student'st tests for continuous variables and X2 tests for categorical covariates. Univariate associations between serummicronutrient levels and each of the three outcomeswere assessed using the non-parametric Kaplan-Meierproduct-limit method and the log-rank test. The logrank test was also used to examine associations betweenthe covariates and disease progression.
Cox proportional hazards models were used to adjust forcovariates found to be either associated with serummicronutrient levels (P < 0.15) or independent predictors of progression in the previous analyses. Variables thatdid not produce significant changes in the model esti-
Vitamins Aand Ein HIV disease progression Tang et al. 615
mates were eliminated using a step-down procedure.Semm nutrient levels were entered into the models asbinary variables ~ow versus adequate levels) and in quartiles. All independent covariates were entered into themodels as categorical variables. Separate Cox proportional hazards models were fit for each micronutrient.
Speannan rank-order correlations were used to examine the linear associations between serum nutrient levels and intake from food and vitamin supplements. TheWilcoxon rank-sum test was used to compare medianserum nutrient tevels between current and past/neverusers ofmulti- and sing1e~vitaminsupplements.
Results
Descriptive statisticsTable 1 shows the characteristics of the 312 eligiblemen in the study. The mean age of the study population at baseline was 34 years (range: 30-652. The meanCD4+ cell count was 643 ±314 cells X 10 /1 with only11 men ~4%) having CD4+ cell counts below 200cells X 10 /1. Although most of the men (81%) were inthe asymptomatic stage of their infection, 55% had elevated sernm CRP levels P- 8.0 mg/I) and 71 (23%) hadlow serum albumin levels « 35 gil).
Over the 9-year follow-up period, 163 men (52%) progressed to AIDS, 162 (52%) died, and 180 (58%)reached a CD4+ cell count of lower than 200cells X 106/1. First AIDS diagnoses were predominantlydue to PCP (35%) and Kaposi's sarcoma (25%), followed by Candida albicans (8%) and Mycobacteriumavium~intTacellulare complex (6%). Wasting syndromeand dementia were the first AIDS diagnoses for seven(4.3%) and five (3.1%) of the subjects, respectively.Eighty-one per cent (n = 132) of the deaths wereattributed to AIDS.
Table 2 summarizes the serum and dietary intake levelsof vitamins A and E for the 311 subjects. Mean andmedian serum levels were within the nonnal range forboth vitamins. Thirty-one subjects (10%) had serumretinolleve1s below 1,40 ~olll. and only seven (2%)had levels below 1,05 llffiollL Twenty-nine per cent ofsubjects had total intakes of vitamin A (including vitamin supplements) below the recommended dietaryallowance (RDA), and 27% had total vitamin E intakesbelow the RDA.
Univariate analysesSubjects with low vi.tamin E levels « 11.6j.1mol/l)were more likely to be non-whites r.x2 P-value =0.02),not have a college degree r.x2 P~va1ue = 0.007), and notto have used antiretroviral drugs before the onset ofAIDS r:x2 P-value = 0.07).

616 AIDS 1997, Vol 11 No 5
Table 1. Characteristics of 312 HIV·, seropositive homOo11lfsexualmen participating in the Baltlmore/Washington, DC site Qf theMull/centel' AIDS Cohort Study, 1984.
'Presence of fever> 37.8°C, diarrhoea, persistent fatigue, thrush,or unintentional weight loss ~ 4.5 kg. tBMl '= weight (kgljheight(m)2. tZidovudine, dldanosine or zalcitabine use at any time duroing follow-up period. sAerosolized pentamidine, trimethoprim-suJfamethoxazole, or dapsone used during follow-up period. pcp,Pneumocystis carini! pneumonia.
Demograpnics (at baselinelAge (years)
<30 67 2230-40 194 62>40 51 16
Race/ethnicityWhile, non·Hispanic 269 86Other 43 14
Education levelCollege degree t 88 60No college degree t 24 40
Alcohol consumption (frequency)S 2 time5lweek 171 55> 2 timeslweek 141 45
Cigarette smokingNon-smoker 194 62Regular/occasional smoker 1t 8 38
Health status (at baseline)HIV-related symptoms'
No symptoms 254 81Symptomatic 58 19
CD4+ T cells x t 06/1< 500 118 38500-50 97 31> 750 97 31
Body Mass Indext (quartiles)<21.5 80 2621.5-22.7 78 2S22.8-24.4 76 24~24.S 78 25
Serum albumin (gil)<3S 71 23~ 35 241 77
C-reactive protein (mg/llcU 1~ ~
~M 1~ ~
TreatmentAntiretroviral therapy'
Not used before AIDS 165 53Used before AIDS 147 47
pcp prophylaxisS
Not used before AIDS 236 76Used before AIDS 76 24
Frequency
Older age was strongly and independently associatedwith an increased risk of progression to AIDS, mortality and CD4+ cell decline. Higher CD4+ cell counts,
No significant difference was observed in risk of AIDSprogression between low versus adequate serum vitamin E levels in univariate analyses (Table 3). There wasalso no significant difference in risk of AIDS progression when comparing those in the lowest quartile ofserum vitamin A « 1.821Uriol/l) with those in each ofthe upper three quartiles. When vitamin E levels wereexamined by quartiles, however, a monotonic decreasein risk of progression to AIDS was observed withincreasing serum vitamin E levels. The risk ofprogression to AIDS in the highest quartile of vitamin E levelwas 35% lower than the risk in the lowest quartile [(relative hazard (RH), 0.65; 95% confidence interval (el),0.42-1.02)]. In Kaplan-Meier analyses, median AIDSfree time for subjects in the highest quartile of serumvitamin E level was approximately 1.5 years longerthan those in the iower three quartiles combined (1ogrank P-value = 0.07). There was also an approximate1 year difference in median survival time betweenthose in the highest quartile of vitamin E levd compared to the lower three quartiles combined aog-rankP-value = 0.10). No differences were observed in theproportions of subjects whose CD4+ cells declined to< 200 cells X 106/1 for either vitamin A or vitamin E(data not shown).
Multivariate analyses of serum nutrient levelsand HIV-1 disease progressionIn order to examine the independent effect of serumnutrient levels on HIV-1 disease progression, Cox proportional hazards models' were used to adjust forknown and putative confounders. Variables whichwere associated with AIDS diagnosis, mortality, CD4+cell decline andI or serum micronutrient levels (P <0.15) were entered as covariates into the Cox models.These included HIV-1 related symptoms, CD4+ cellcount, age at baseline, serum albumin, serum CRP useof antiretroviral therapy before AIDS, and frequency of3l.cohol consumption. Serum albumin and CRP levelswere subsequently dropped from the Cox models asthey did not produce significant changes in the modelestimates for any of the three outcomes.
%nCharacteristic
Table 2. Summary of serum micronutrient levels and total nutrient intake (from food and supplements) in 311 HIV·1 seropositive homo-/bisexual men participatiog in the BallimoreJWashington, DC site of the Multicenter AI DS Cohort Study, 1984.
Mean ::I: SD Median (lQRl Inadequate ("!o) Cutoff for inadequacy
2.45 (1.82-3,15)17.2 (12.3-23.5)
2.62 ± 1.0819.4::1: 11.7
Serum nutrient levelVitamin A(~mol/l)
Vitamin E(~moJII)
Total nutrient intaket
Vitamin A(IU/day) 7405 ± 8562 4739 (1700-3572) 29* 333011
Vitamin E(mg a-TI:/day) 133 ± 281 17.9 (8.8-72.9) 27t 10"
·Percentage below normal. tData available on 271 subjects. *Percentage below RDA. Slower limit of normal. IIRDA, recommended dietaryaUowance.1QR, Inter-quartUe range; a-TE, Cl-toeopherol equivalents.

Vitamins A and Ein HIV disease progression Tang et al. 617
Table 3. Cox proportional hazards models for serum micronutrien! levels'in 311 HIV-T seropositive homo-~isexulll'men In the theBaltlmor~ashington,DC site of the Multicenter AIDS Cohort Study, 1984-1994. Outcome is time to first AIDS diagnosis.
Crude relative hazard Adjusted· relative hazardSerum nutrient levels Number of events / total (95% Cil (95% CI)
Low versus adequate:Vitamin E
2 11.6 flmolll 128/242 1.00 1.00<: 11.6 flmol/l 35/69 1.22 (0.84-1.78) 1.11 (0.7&-1.63)
QuartilesVitamin A (lJmoVil
Ql: VitA <: 1.82 42/76 1.00 1.00Q2: '.82 :!> VitA <: 2.45 44/80 0.79 (0.52-1.21) 1.13 (0.73-1.75)Q3: 2.45 SVitA <: 3.15 37/78 0.69 (0.44-1.07) 0.94 (0.60-1.47)Q4: VitA ~ 3.15 40/77 0.75 (0.49-1.15) 0.73 (0.4&-1.16)
Vitamin E(lJmoll!)Q1: VitE< 12.3 40176 1.00 1.00Q2: 12.3 SVitE < 17.2 43/79 0.91 (0.59-1.40) 1.01 (O.65-1.56)Q3: 17.2 :!> VitE <: 23.5 43/78 {J.85 (0.56-1.32) 0.97 (0.63-1.50)Q4: VitE ~ 23.5 37/78 0.65 (0.42-1.02) 0.66 (0.41-1 .06)
;'a1l models adjusted for the iollowing covariates: HiY.reiated symptoms, CD4+ ceU counl, age at ba;eiine, u;e of alitiretrov;ral therapybefore AIDS, and frequency of alcohol consumption. Cl, Confidence interval; VitA, vitamin A.
Discussion
We examined the associations of serum levels of vitamins A and E with three key outcomes in the course of
Vitamin A (IJmollll 2.53 2.42 0.20Vitamin E(llmol/l\ 20.1 14.0 0.0001
'Current use of multivitamin and/or single vitamin supplements.
tionnaire with respect to the other independent variables, AIDS progression, mortality or CD4+ celldecline.
Vitamin supplements
WilcoxonCurrent use* PasVNever use P-valueSerum nutrient
Table 4. Median serum micronutrient levels by use of oral vitaminsupplements for 272 HIY·1 seropositive homo-Ibisexual men in thethe BaltimoreJWashington,OC site of the Multicenter AIDS CohortStudy, 1984.
Table 4 shows the median serum micronutrient levelsaccording to use or non-use of single andlor multi vitamin supplements. Subjects who reported current useof multivitamin or single vitamin A supplements(n =167) had only a slightly higher median serum vitamin A level than the 104 past/never users. However,current users of multivitamin or single vitamin E supplements (n = t70) had a significantly higher medianserum vitamin E level than past/never users (n = 101).
Speannan's correlations were weak and non-significantbetween serum vitamin A levels and vitamin A intakefrom food alone (r = -0.02, P = 0.72) and from foodand supplements combined (r =0.02, P = 0.74).Whereas the correlation between serum vitamin E leveland vitamin E intake from food alone was weak (r =-0.06, P = 0.29), the correlation between serum vitamin E level and total vitamin E intake was stronger andstatistically significant (r =0.30, P = O,QOOt).
more frequent alcohol consumption, and use of antiretroviral therapy before the onset of AIDS were allsignificantly and independently associated with adecreased risk of progression to AIDS, mortality, andCD4+ cell count decline. The presence of HIV·1related symptoms at baseline wa.<; significandy associatedwith an increased risk of progression to AIDS andCD4+ cell decline, but not with mortality.
The last column of Table 3 shows the adjusted hazardratios comparing low versus adequate serum Vitaminlevels, and quartiles of serum vitamin A and E levels.For quartiles of vitamin A, there was no apparent relationship between serum levels and progression toAIDS. For vitamin E levels, however, the risk of AIDSremained lower for the highest quartile compared withthe lowest quartile (RH, 0.66; 95% CI, 0.41-1.06).This eftect was again statistically significant when comparing the highest quartile ofserum vitamin E with theremainder of the cohort (RH,0.67; 95% CI,0.45--0.98). Similar trends, although not statistically significant, were observed for each vitamin when survivalwas used as the outcome. In these survival models, wealso adjusted for use of antiretroviral therapy after theonset 'of AIDS, but observed no significant changes inthe RH. Furthermore, no significant trends wereobserved when CD4+ cell decline to < 200cells X 106/1 was used as the outcome (data not shown).
Association between serum nutrient levels andself-reported nutrient intakeData concerning food and supplemental intake of vitamins A and E were available for 271 of the 311 subjects. Those who completed and returned theself-administered food frequenc~ questionnaire weremote likely to be non-smokers (x. P~value =0.001), tohave a college degree (X2 P-value = 0.002), and to beolder (Student's t test P-value = 0.02) than those whodid not return the questionnaire. There were no differences in those who did and did not return the ques-

618 AIDS 1997, Vain No 5
HIV-1 disease progression: development of first AIDSdiagnosis, CD4+ cell decline to < 200 cells x 106/1,and mortality. The results of this study showed thatsubjects in the highest quartile of serum vitamin E levels ~ 23.5 /!11101/1) had a 35% decrease in risk of progression to AIDS compared with those in the lowestquartile, after adjusting for several covariates. Adose-response relationship was evident in univariateanalyses. Similar trends were observed for both vitamins when mortality was used as the outcome, butserum levels of neither vitamin were .associated withCD4+ cell decline to < 200 cells X 106/1.
Previous studies have measured serum levels ofvitaminE in HIV-1-infected patients, but ours is the first studyto demonstrate a link between increased serum tocopherol levels and detttas,~d risk ofprogressiotl to AIDS.The prevalence of overtly or marginally low serum vitamin E levels has been documented to range between8% and 20% in studies of HIV-1-positive individuals[14-16,36-38J. None of these studies have examinedthe consequences of low serum vitamin E levels onHIV-1 disease progression nor have the mechanismsleading to vitamin E depletion during HIV-1 infectionbeen clearly elucidated. In this study we found that22% of our popu!:ltion had low concentrations ofserum vitamin E (< 11.6 J.LII10IIl), but we found noapparent relationship between low vitamin E levels andrisk of progression to AIDS. Instead, we found thatsubjects in the highest quartile of serum tocopherol levels ~ 23.5 lUUol/l) demonstrated a significant decreasein risk of progression to AIDS compared with those inthe lower three quartiles combined.
The effects of various states of vitamin E nutrition onimmune function and the potential benefits of vitaminE therapy in HIV-infected patients have been reviewedin several published articles [12,13,39]. The majority ofevidence put forth by these reviews suggests that vitamin E is not only necessary for proper functioning of theimmune system, but also has important immunostimulatory properties. Studies in both humans and animalmodels have shown that vitamin E supplementation, inapproximately two- to 10-fold excess of the recommendations, significantly increases humoral and cell-mediatedimmune responses to antigens and enhances phagocyticfunctions [12]. More specifically, high doses of vitaminE along with a nutritionally adequate diet has beenrepeatedly shown to enhance in vitro and in villO antibody production, phagocytosis, lymphoproliferativeresponses, and resistance to viral and infectious diseases[13]. Studies in the elderly have examined the effects ofvitamin E supplementation on immune dysfunctionsassociated with the ageing process [9,40J. Daily supplementation of healthy elderly individuals with 800. mgdl-a-tocopheryl acetate for 1 month significantlyimproved delayed-type hypersensitivity reactions andenhanced in vitro response to the mitogen, concanavalin
A [9]. Other epidemiological studies in the elderly havefound lower incidences of cancer and infectiousdiseases in those who maintain high plasma vitamin Elevels [40,41J.
In a recent study [25], the effects of dietary vitamin Esupplementation on immune dysfunctions were examined in mice with murine AIDS, a retrovirus-inducedinfection similar to human AIDS. In this study, infectedmice treated with vitamin E showed an increase in secretion of interleukin (IL)-2 and interferon (IFN)-y, and animprovement in mitogenesis of splenocytes and naturalkiller cell activity compared with retrovirus-infected, butnon-treated mice. At the same time, vitamin E supplementation was associated with a reduction in levels ofIL-4, IL-5, IL-6, and tumour necrosis factor (TNF)-a.,cytok.ines whil;h were devaler] in llI.m-treatt'd w.i!.:t'which had murine AIDS. This suggests that vitamin Esupplementation may serve to nonnalize the immuneabnormalities observed in murine retrovirus infection.Whether or not these results can be extrapolated tohuman HIV-1 infection, however, remains uncle:rr.
Another mechanism by which vitamin E enhancesimmun~ functions is through its antioxidant properties.Rapidly proliferating cells of the immune system arehighly susceptible to peroxidative daniage by free radicals, peroxides and superoxides [12]. Vitamin E aets as afree radical scavenger and prevents the lipid peroxidationof cell membranes. Vitamin E also modulates the pro-'duction of prostaglandin E2 (PGE 2) in the body.Elevated levels ofPGE:2 decrease the production ofIL-2,a cytokine critical for the growth and differentiation ofTand B lymphocytes, and increases the differentiation ofPGE2-receptor-bearing T-cells into T -suppressor cells.PGE:2 also inhibits actintion of natural killer cells, whichare a major source of IFN-y, another important eytokinein the host defence system. It is believed that downregulation of PGE2 by vitamin E serves to increase theproduction of lL-2 and IFN-'Y, thereby stimulating theimmune system. Other proposed actions ofvitamin E onthe immune system are through its direct interactionwith macrophages, causing upregulation of lL-1 and IL2. Vitamin E is also believed to decrease levels of TNFex through its antioxidant properties. Thus, in addition toits role as a free-r::tdical scavenger, the impact of vitaminE on the regulation of various eytokines in the immuneprocess is believed to playa major role in inhibitingHIV-1 replication.
The results of our study support the hypothesis thatthese immune-enhancing effects of vitamin E maydelay the onset of AIDS in HIV-1-infected individuals.The strong correlation between vitamin E supplementation and increased serum vitamin E levels in our subjects suggests that oral vitamin E therapy may bebeneficial in slowing progression to AIDS. even innutritionally-replete populations.

•
Vitamin A is essential for many aspects of immunefunction, including both B- and T-cell growth andfunction. In animal models, vitamin A deficiency hasbeen associated with diminished resistance to infections[42], reduced antibody responses to diphtheria andtetanus toxoids [7], and decreased lymphocyte responses to mitogens [7,43]. In humans, the morbidity andmortality of many infectious diseases (e.g. measles,pneumonia and diarrhoea) have been associated withlow vitamin A statw [8,44-46}. Studies of serum vitamin A levels in HIV~l-infected populations have foundthat levels below 1.05 ~olJl are commonly observed,with prevalence generally ranging from 10-20%.S~mba et aI. [18] showed that low serum vitamin A levels in HIV-l-infected mothers were significandy associated with a three- to fourfold increase in rates oftransmission of HIV-1 to their infants and that HIV-1infected mothers whose infants died before reaching1 year of age had the lowest serum vitamin A levels. Inanother study by Semba et aI. [19], low serum vitaminA levels « 1.05 f.l1l1ol/1) were significandy associatedwith a four- to fivefold increase in risk of mortalityfrom AIDS and infections in a population of adultinjection drug users. Since biological function isthought to be compromised when serum retinol levelsfall below 1.05 J.Lrnol/l [8], we did not have largeenough numbers to examine associations with HIV-1disease progressio;j in this lower range. The vast majority of our subjects had retinol levels in the high-normalrange (median = 2.44 JUIlolll) so it is not surprising thatwe found no relationship with disease progression.These data, taken with other studies of retinol status inHIV-1 and other infectious diseases suggest that the riskonly significandy increases in those with frank or marginal deficiency [17-19). Furthermore, given individuals with increased serum CRP levels, we still had avitamin A-replete population, which shows that bettervitamin A nutriture can protect against drops in serumretinol into the deficient ranges seen in the acute phaseresponse.
As might be expected since plasma vitamin A levels arehomeostatically controlled and do not tend to fluctuatewith dietary intake, we found litde association betweenserum vitamin A levels and vitamin A intake from foodand/or supplements in our subjects. In a previous studyof dietary intake in this population [ZO}, we found thathigh vitamin A intakes were not associated with adecreased risk of progression to AIDS, wheras moderate intakes were associated with an approximate 40%decrease in risk ofAIDS progression.
We compared serum nutrient levels from our population with those from studies of other HIV-l-infectedpopulations in order to detennine if concentrations fellwithin the range of those measured from fresh sera ofcomparable populations. The mean vitamin A level inour study population (2.62 ± 1.08 lllllolll) was, in fact,
Vitamins A and Ein HIV disease progression Tang et al. 619
higher than the mean vitamin A levels found in mostother published studies of HIV-1-seropositive populations [14-18,22,38,47,48]. The Q.tean vitamin A levelsin these studies ranged from O.91Ilmol/l to 4.54J.LITlolll, with only one smdy [16] reporting vitamin Alevels above the mean level found in our subjects. Themean vitamin E level in our study population was 19.4lUtlolll, which is in the range reported by most studies[14-16,21-23,38,49].
In conclusion, the results of this study suggest that elevated serum levels of vitamin E were associated with asubsequent decrease in risk of progression to AIDS andmortality. High serum vitamin E levels were stronglyassociated with current use of multi- or single-vitaminE supplements, indicating that vitamin E supplementation may be beneticiai in slowing the risk of progression to AIDS. Higher serum vitamin A levels were notassociated with intake of vitamin A supplements in thisstudy, however. These data suggest that vitamin E supplementation trials should be considered in HIV-1infected individuals given the non-toxic nature of thevitamin, its potential therapeutic effects, and the relative sensitivity of serum levels to supplementation.
References1. Mui\oz A, Kirby AI. He YD. et al.: long·term survivors with
HIV-1 infedion: incubation period and longitudinal patterns ofCD4+ lymphocytes. J Ac:quir Immune Defic Syndr 1995,8:491>..505.
2. Cao Y, Qin L, Zhang L, Safrit J, Ho DO: Virolopc and immunologic characterization of long-term survivors of human immu,,odeficiency virus type 1 infecHon. N Engl J Med 1995,332:201-208.
3. Pantaleo G, Fauci 1\5: New concepts in the immunopathogenesis of HIV infection. Allnu Rev Immuno/1995, 13:487-512.
4. Wolinsky 5M, Korber BTM, Neumann AU, et al.: Adaptiveevolution of human immunodeficiency virus-type 1 during thenatural course of infection. Science 1996, 272:537-542.
5. lain VK. Chandra RK; Does nutritional deficiency predispose toacquired immune defidency syndromel Nutr Res 1984,4:537-543.
6. Leonard-Green TK, Watson RR: The AIDS-immunocompetencenutrition·Infection cycle. In Cofactors in HIV-I Infection andAIDS. Edited by Watson RR. Boca Raton: eRe Press;1989:187-199.
7. Beisel WR: Single nutrients and immunity. Am JClin Nutr 1982,35:417-468.
8. Semba RD: Vitamin A. immunity, and infection. Clin Infect Dis1994,19:489-499.
9. Meydani SN. Barklund MP, Liu 5, et al.: Vitamin Esupplementation enhilOces cell·mediated immunity in healthy elderly subjects. Am 1eUn Nutr 1990, 52:557-563.
10. Wang V, Watson RR: Ethanol, immune responses, and murineAIDS: the role of vitamin Eas an immunostimulant and ...ntioxidant. Alcohol 1994, 11 :75-84.
11. Schmidt K; Antioxidant vitamins and ~-carotene: effects onimmunocompetence. Am J elin Nutr 1991, 53 [suppl 1):3835-3655.
12. Tengerdy RP: T1le role of vitamin Ein immune response and disease resistance. Ann NY Acad Sci 1990, 581:24-33.
13. Odeleye OE, Watson RR: The potential role of vitamin Ein thetreatment of Immunologic abnormalities during acquiredImmune deficiency syndrome. Prog Food Nutr Sci 1991,15:1-19.

620 AIDS 1997, Vol 11 No 5
T4. Bogden 10, Baker H, Frank 0, et a/.: Micronutrient aw, and long·term freezer .torage on concentrations of retinol,human Inununodeflclency vlru. (HIY) Infection. In be~-earotene, and alpha-tocopherol In serum or plasma sum-Micronutrients and Immune Functions, Vol 587. Edited by martzed. Clin Chem 1993, 39:1075-1078.Bendlch A, Chandra Rf<. New York: New York Academy of 31. Hsing AW, Comstock GW, Polk BF: Effect of repeated freezingSciences; 1990:181}..195: and thawing on vitamins and hormones in serum. Clin Chem
15. Beach RS, Mantero-Atienza E, Shor-Posner G, et al.: Specific T989, 35:2145.nutrient abnormalities in asymptomatic HIY-1 Infection;· ~/DS 32. Gunter EW, DriskeH WJ, Yeager PR: Stability of vitamin E in1992,6:701-706. long-term stored serum. Clin Chim Acta 1988, 175:329-336.
16. Coodley GO, Coodley MK, Nelson HO, loveless MO: 33. Driskell WJ, Bashor MM, Neese JW: Loss of vitamin A inMicronutrient concentrations in the HIV wasting syndrome. long-ttml stored, frozen sera. Clin Chim Ada 1985, 147:25-30.AIDS 1993,7:1595-1600. 34. Willett WC, Sampson L, 5tampfer MJ: The use of a self·adminis-
17. Semba RD, Graham NMH, Caiaffa WT, Margolick JB, Clement tered questionnaire to asseu diet four years In the past. Am JL, Vlahov D: Increased mortality wociateti with vitamin A Epldemlo/198a, 127:188-199.deficiency during HIY-1 infection. Arch Intern Med 1993, 35. Centers for Disease Control: RevisiclQ of the CDC surveillance153:2149-2154. case defintion for acquired immunodeficiency syndrome.
18. Semba RO, Miolti PC, Chiphangwi JD, et al.: Maternal vitamin MMWR 1987, 36:1~1 55.A defidency and mothe...to-dtild transmission of HIY·1. Lancet 36. Baum MK, Javier jJ, Mantere-Atienza E, et al.: Z1dowdlne-ano-1994,343:1593-1597. elated adverse reactions in a longitudinal study of asympto·
19. Semba RD, Caiaffa WT, Graham NMH, Cohn 5, Vlahov 0: matic HIY-1-infected homosexual males. J Acquir ImmuneYltamin A deficiency and warting as predictOR of mortality in DeficSyndr 1991, 4:1218-1226.HIV-infected adults. J Infect Dis 1995, 171 :1196-1202. 37. Baum MK, Shor·Posner G, Bonvehi P, et 3/.: Influence of HIV
20. Tang AM, Graham NMH, Kirby AI, McCall LO, Willett WC, infection on vitamin status and requirements. Ann NY Acad SciSaah Ai: Di1!i<lry micronutrient intake and risK oi progression to 1992, b69:i65-174.AIDS in HlY·l infected homosexual men. AmJEpidemio/1993, 38. Favier A, Sappey C, leclerc P, Faure P, Micoud M: Antioxidant138:937-951. statu. and lipid peroxidation in patients Infected with HIV.
21. Malvy DJM, Richard MI, Arnaud J, Favier A, Amedee-Manesme Chern BioI Interact 1994, 91 :165-180. .0: Relationlhlp of plasma malondialdehyde, vi~min E and. 39. Meydani SN, Hayek M, Coleman l: Influence of vitamins Eandantioxidant micronutrients to human Immunodeficiency virus-1 Bit on immune response. Ann NY Acad Sci 1992, 669:125-140.seropositivity. elin Chim Acta 1994, 224:89-94. 40. Chevance M, Brubacher G, Herbeth B, et al.: Immunological
22. Constans J, Peuchant E, Pellegrin Jl, et a/.: Fatty acids and plilS- and nutritional status among the elderly. In Nutrition, Immunity,ma antio"idants in HIV~lve patients: correlation with ncrtri- and Illness in the Elderly. Edited by Chandra RK. New York:tional and immunological status. Clin Biochem 1995, Pergamon Press; 1965:137-142.18:421426. 41. Menkes MS, Comstock GW, Vuilleumier JP, et a/.: Serum
23. Shor-Posner G, Miguez-Bumana Mj, lu Y, et al.: Elevated lIE beta-earott!l1e, vitamins A and E, selenium, and the riu of lunglevel in relationship to nutritional status and immune parame- cancer. N Engl JMed 1986, 315:1250-1254.ten in early human immunodeficiency vlrus-1 disease. J Allergy 42. Bang B, Bang F, Foard M: Lymphocyte depression induced inClin Immuno/1995, 95:686--892. chlck1ens on dieu deficient in vitamin A and other components.
24. Watson RR, Yahya MD, Darban HR, Prabhala RH: Enhanced Am j Patho/1972, 68:147-162.survival by vitamin A supplementation during a retrovirus 43. Gershwin M, Beach RS, Hurley L Nutrition and Immunity. Newinkc:tlon t:aUslngl1Klrlne AIDS. Life Sci 1988, 43:13-18. York: Academic Press; 1985:228-239.
25. Wang Y, Huang DS, Liang 8, Watson RR: Nutritional status and 44. Sommer A, Katz j, Tarwotio f: Increased risk of respiratory dis-immune responses in mice with murine AIDS are normalized by ease and diarrhea in children with pre-exlstfng mild vitamin A'IIltamin Esupplementation. j Nutr 1994, 124:2024-2032. deficiency. Am j Clin Nutr 1984, 40:1090-1095.
26. Wang Y, Watson RR: Potential therapeutla of vitamin E (taca- 45. Bloem MW, Wedel M, Egger RI, et al.: Mild vitamin A deflc:ien-phetol) in AIDS and HIV. Drugs 1994, 48:327-33B. cy and risk of respiratory tract diseases and diarrhea in
27. Coutsoudis A, Bj)bat RA, Coovadia HM, Kuhn l, Tsai WY, Stein preschool and ~chool children in northeastem thailand. Am JZA: The effet:U of vitamin A supplementation on the morbidity Epidemio/1990,131:332-339.of children born to HIV-infected women. Am j PubJ Health 46. Markowitz LE, Nzilambi N, Driskell WJ, et al.: Vitamin A levels1995, 85:1076-108T. and mortality among hospitalized measles patients, Kinshasa,
28. Kaslow RA, Ostrow DG,.DeteJs R, Phair JP, Polk BF, Rinaldo· Iaire.j Trop Pediatr 1989,35:109-112.CRj: The Multicenter AIDS Cohort Study: ratlonale, organiza- 47. Ward BJ, Humphrey JH, Clement L, Chaisson RE: Vitamin A sta·tion, and selected characteristics of the participants. Am J tus in HIV infection. Nutr Res 1993,13:157-166.Epidemio/1967,126:310-318. 48. Karter DL, Karter AI, Yarrish R, et a/.: Vitamin A deficiency in
29. Arroyave G, Chichester CO, Flores H, et al.: Biochemical non·vitamilHUpplemented patients with AIDS: it cross-section-Methodology for the ~ment of Vitamin A- Status: Report of ill study. J Acquir Immune Defic Syndr 1995, 8:199-203.the International Vitamin II Consultative Group (/VACG). 49. Baum MK, Cassetti L, Bonvehi. P, Shor·Posner G, lu Y,Washington, DC: The Nutrition Foundation; 1982. Sauberlich HE: Inadequate dietary intake and altered nutrition
30. Comstock GW, Alberg Aj, Helzlsouer Kj: Reported effects of statUI in early HIY·1 infection. Nutrition 1994, 10:16-20.
,;.:

IRON DEFICIENCY AND ANEMIA

Community and International Nutrition
Serum Ferritin, Erythrocyte Protoporphyrin and Hemoglobin Are ValidIndicators of Iron Status of School Children in a Malaria-HoloendemicPopulation1-4
Rebecca J. Stoltzfus,s Hababu M. Chwaya,* Marco Albonico,t Kerry J. Schulze,Lorenzo Saviolit and James M. Tielsch
Center for Human Nutrition, Department of International Health, The Johns Hopkins School of PublicHealth, Baltimore, MD 21205; "Ministry of Health, Zanzibar, United RepUblic of Tanzania; andtSchistosomiasis and Intestinal Parasites Unit, Division of Control of Tropical Diseases,World Health Organization, Geneva 27, Switzerland
ABSTRACT In many African populations, the prevalences of both iron deficiency and malarial infection exceed50%. The control of iron deficiency anemia is of urgent public health importance, but assessment of iron statusin these contexts has been controversial because of the effects of malarial disease on common iron statusindicators. We assessed iron status in 3605 school children in Zanzibar by measuring hemoglobin, erythrocyteprotoporphyrin (EP) and serum ferritin concentrations. Malaria parasitemia was quantified by counting againstleUkocytes. Iron deficiency was highly prevalent: 62.4% of hemoglobin concentrations were <110 giL, 59.7% of EPvalues were >80 ,umol/mol heme, and 41.5% of ferritin concentrations were < 12 ,ug/L. Prevalence of Plasmodiumfalciparum parasitemia was 60.6%, but <1% of children had densities above 5000 parasites/,uL blood. Neitherhemoglobin nor EP concentration was associated with malaria parasite density, but prevalence of abnormal valuesincreased by ,;;25% with parasite density. Erythrocyte protoporphyrin and hemoglobin were strongly inverselyrelated regardless of parasite density. The relationship of EP to hemoglobin was slightly attenuated when parasitedensity exceeded 1000 parasites/.uL blood. Ferritin rose by 1.5 .uglL per 1000 parasites/.uL for parasite densities> 1000 parasites!,uL, but the relationship of ferritin to hemoglobin or EP was strong even when parasite densitiesexceeded this cutoff. The population prevalences of iron deficiency were not significantly biased by malarialinfection. In this population of school children, iron status assessment using these indicators was not seriouslyinfluenced by malarial infection. We hypothesize that these indicators perform reliably in populations in whichmalaria! infection is infrequently associated with disease; namely older children and adults in holoendemic environments. J. Nutr. 127: 293-298, 1997.
KEY WORDS: • humans • iron deficiency • malaria • Plasmodium falciparum • hemoglobin• ferritin • protoporphyrin
Iron deficiency is probably the most common form of malnutrition in the world, affecting more than half of the womenand children in developing countries (DeMaeyer and Adie1sTegman 1985). In many regions where iron deficiency is ofgreat public health importance, malaria is endemic and themajority of the population harbors subclinical infections. InAfrica alone, an estimated 275 million people are infected
1 These data were presented at Experimental Biology 96, April 14-17, 1996,Washington, DC. [Schulze, K. J., Stoltzfus, R. J., Chwaya, H. M.. Albonico, M.,Savioli, L & Tielsch, J. M. (1996). Performance of iron deficiency indicators in amalaria-holoendemfc population. FASEB J. 10: A729 (abs.)].
• Funded through cooperative agreement no. DAN-5'1S-1-00-8051-00 between The Johns Hopkins University and the Office of Health and Nutrition, UnitedStates Agency for Intemational Development.
3 This article received institutional approval for publication by the World HealthOrganization.
4 The costs of publication of this article were defrayed in part by the paymentof page charges. This article must therefore be hereby marked "advertisement"in accordance with 18 USC section 1734 solely to indicate this fact.
S To whom correspondence should be addressed.
with this parasite (Najera et at. 1993). Malaria and otherinfections have complex effects on iron metabolism that mayaffect the interpretation of hemoglobin, erythrocyte protoporphyrin (EP) and serum ferritin (Baynes et a1. 1986, Brabin1992, Hastka et at. 1993), commonly used indicators of irondeficiency. Although these effects have been described in studies of individuals acutely ill with malaria (Adelekan andThumham 1990, Ayatse and Ekanem 1994, Phillips et a1.1986), there is a need for practical guidance regarding the useof indicators to assess iron deficiency in apparently healthypeople in malaria-endemic environments.
The spectrum of iron status covers several well-definedstages, ranging from adequate iron stOrage to depleted ironstores, iron-deficient erythropoiesis, and iron deficiency anemia (Bothwell et at. 1979). To characterize the iron status ofa population or to monitor changes in status, it is desirable touse a combination of indicators that provides informationabout this entire spectrum. Serum ferritin is a particularly useful indicator of iron status, because it is linearly related to iron
0022-3166/97 $3.00 © 199i American Society for Nutritional Sciences.
Manuscript received 1 April L996. Lnitial review completed 24 June 1996. Revision accepted LO Ocrober L995.
293

294 STOLTZFUS IT AL.
TABLE 1
Expected relationships among iron status indicators during iron deficiency and as a consequence of malaria pathology
Process
Iron deficiency
MalariaAcute phase response to infectionHemolysisDyserythropoiesisIron loss in urine or iron trapping
in malarial pigments
Effect
Loss of iron stores, accumulation of iron-poor heme, decrease inhemoglobin
Alterations in indicators unrelated to true iron statusRecycling of iron. increase in iron stores. stimulation of erythropoiesisSuppressed heme production despite anemia, increase in iron storesDecreased body iron stores
Expected change inindicators1
Hb EP SF
! t !
! t t! t t! ! t! t !
1 Hb ~ hemoglobin, EP = erythrocyte protoporphyrin, SF = serum ferritin.
stores when stores are present (Cook et al. 1974). Erythrocyteprotoporphytin is a precursor to heme in red cell production.Elevated EP is a sensitive indicator of iron-deficient erythropoiesis (Langer et al. 1972), because EP accumulates wheniron is limiting. Hemoglobin concentration is used to defineanemia, the end stage of iron deficiency (Anonymous 1989).
The effect of malaria on iron metabolism is not fully understood, but distinct changes in iron metabolism occur duringmalarial infection that may affect iron status indicators andtheir interrelationships (Table 1). Malarial disease causes destruction of red blood cells while suppressing erythropoiesis,resulting in a profound anemia (Phillips et al. 1986). Theseprocesses would shift iron out of heme toward storage fonns.As long as heme iron from destroyed erythrocytes is effectivelyrecycled, these processes would not alter total body stOres ofiron but would certainly alter the expected relationshipsamong iron status indicators. Malaria may also cause loss offunctional body iron, through immobilization in the fonn ofhemazoin (malarial pigments) and through urinary excretion(Brabin 1992). This would decrease iron stOres and potentiallyinduce iron deficiency. The effect of the acute phase responseto infection may overlap malaria-specific changes in iron metabolism (Baynes et al. 1986). During illness, serum iron concentrations fall as iron is apparently redistributed to storagesites (Elin et at. 1977). As a consequence, hemoglobin fallsand EP rises, mimicking the anemia caused by iron deficiency,but ferritin is elevated considerably. In general, on the basisof expected changes in iron status measures, hemoglobin measures would overestimate and ferritin measures would underestimate the prevalence of iron deficiency in a malaria-endemicpopulation.
To determine whether malarial infection influenced indicators of iron defiCiency in asymptomatic children, we examinedrelationships among hemoglobin, EP, ferritin and malaria parasitemia in 3605 children attending schools on Pemba Island,Zanzibar, Tanzania. Coastal East Africa, including the islandsof Zanzibar, has the highest malaria endemicity in the world.Plasmodium falciparum malaria is holoendemic, that is, parasitemia is highly prevalent but oflow density, and transmissionis relatively stable, with little seasonality of prevalence of infection (Marsh 1992). This article will speCifically address thefollOWing questions regarding the relationships of iron statusindicators and malaria parasite density in these children: I) Ishemoglobin, EP or ferritin or the prevalence of iron-deficiencyanemia associated with the level of malaria parasitemia? 2)Does malaria parasitemia obscure the expected relationshipsamong these indicators of iron status? 3) Does malarial infec-
tion bias estimates of the population prevalence of iron deficiency or iron deficiency anemia using these indicators?
MATERIALS AND METHODS
Study population. This survey was conducted in March throughMay 1994 on Pemba Island, the smaller of the two islands of Zanzibar,just off rhe east coast of mainland Tanzania. We randomly selected12 primary schools from the 72 schools on Pemba Island. The randomization· was stratified by the four districts of Pemba Island, so that the12 study schools represent all parts of the island. From these schools,76 morning classes of standards 1-4 were invited to participate inthe survey. A toral of 3605 children were enrolled in the survey,constituting 90% of children registered in those classes and approximately 11 % of the total school child population on Pernba Island.The research protocol was reviewed and approved by the internalreview boards of The Johns Hopkins University, the World HealthOrganization, and the Ministry of Health of Zanzibar.
Data. Data were collected in the school classrooms by speciallytrained local staff of the Ministry of Health. Blood samples werecollected by venipuncture from 100% of children surveyed. Hemoglobin concentration was determined in the classroom using the Hemocue portable hemoglobinometer (HemoCue, AB, Angelhom, Sweden). The accuracy of the Hemocues was checked daily with a controlcuvette provided with the machines. Precision was :t30 gIL. Erythrocyte protoporphyrin was also measured in the classroom using a hematofluorometer (Aviv Biomedical, Lakewood, NJ). This machine wasstandardized daily using comrol solutions provided by Aviv Biomedical. Coefficient of variation for the assay was typically 10=-14%. Thickand thin blood smears were made for determination of malaria parasitemia. These were fixed and stained with Giemsa, and malaria parasites were counted against leukocytes. Typically, 200 leukocytes werecounted; if < 10 parasites were seen, the microscopist continuedcouming up to 500 leukocytes. Parasite counts were converted toparasite densities on the basis of 8000 leukocytes!J.lL blood (Trape1985). Malaria species were identified from the thin smear. All infections were P. falciparom; in less than 5% of slides, P. malariae wasalso identified. A random 10% subsample of slides wete reread by theMalaria Team leader. Agreement between readers was excellent forthe presence of malaria patasitemia [(kappa = 0.93, 95% c.r. (0.89,0.98)], and parasite density measures were also highly reliable withan intracIass correlation of 0.85. The remaining blood was centrifugedand serum was collected. Sera were stored at - lOoC for up to lO wk,transported on liquid nitrogen to Baltimore, and stored at - 70°Cfor up to 6 mo. Ferritin was determined using a fluorescence-linkedimmunoassay {DELFIA System by Wallac. Inc., Gaithersburg, MD}on 3309 serum samples (91.8% of the total enrollment). A set ofWallac standards was assayed in each assay plate. Coefficient of variation for this assay was <5%.
Statistical analysis. To determine meaningful cutoffs for categorizing malarial infection in these analyses, we examined the scat-
.I
11

IRON STATUS INDICATORS AND MALARIA 295
TABLE 2
terplocs of hemoglobin, EP and ferritin against malaria parasitemia.No significant shifts in the mean or variance of these indicators wereapparent at infections of <1000 parasites!,uL. In subsequent analyses,malarial infection was categorized by thousands of parasites per microliter of blood.
The relationships of hemoglobin, EP and ferritin to malaria parasitemia level are expressed using indicator means and selected cutoffsto define deficiency. Distributions of EP and ferritin were skewed tohigh values; therefore geometric means are presented. Anemia wasdefined as hemoglobin < 110 giL. This anemia cutoff is lower thanthe WHO-recommended cutoff for this age group, but a race-speCificanemia criterion (10 g/L lower for blacks} optimizes the screeningperformance of this indicator to detect iron deficiency (JohnsonSpear and Yip 1994). Ferritin values <12 ,ug/L were considered toindicate exhausted iron stores, and an EP value of >80 ,umolfmolheme was used to indicate iron-defiCient erythropoiesis (WHOfUN1CEFfUNU 1995). Iron-defiCiency anemia was defined as abnormalvalues for hemoglobin, EP and serum ferritin. Linear trends in meanvalues were tested by linear regression, and trends in proportions weretested by chi-square test for trend (Snedecor and Cochran 1980).
To evaluate whether the relationships among ferritin, EP andhemoglobin levels differed by low and high parasitemia, we stratifiedthe sample using a cutoff for parasite density of 1000 parasites/,uL.Various cutoffs for level of parasitemia were considered, and thiscutoff was chosen because It maximized the fit of the model whenferritin or EP was regressed on hemoglobin, level of parasitemia, andtheir interaction term. Means, so, and proportions ofabnormal valueswere· examined for EP by level of hemoglobin, and ferritin by levelof hemoglobin or EP. To determine wherher linear crends in these
Characteristics of study sample
Sex. % maleAge,yHemoglobin, gILErythrocyte protoporphyrin, p.mollmol hemeSerum fettltin, J.l.gILMalaria parasites!J.l.L blood, % frequency
o1-9991000-19992000-29993000-39994000-4999:2:5000
1 Mean ::: SD, n = 3605.2 Geometric means =SD.
52.2%10.5 ::: 1.81104::: 1697 (56, 166}2
14.0 (7.2,27.3)
39.2%47.0%10.0%2.1%0.8%0.3%0.6%
indicators by category were statiscically Significant for both high andlow malaria groups, the indicator was regressed on hemoglobin or EP,malaria level, and their interaction term. The significance level ofthe interaction term was used to determine whether the relationshipbetween indicators differed by malaria level, with P < 0.15 indicatinga potentially important difference.
To evaluate the bi3!' caused by malarial infection in evaluatingiron status of this population, we compared mean values and thepercentage of abnormal values of each indicator in the total sampleto those of the children with lower malaria parasitemias. These weretested by Student's c test and chi-square test, respectively (Snedecorand Cochran 1980).
Data were entered using Epilnfo software (Centers for DiseaseControl and Prevention, Atlanta, GA) and managed and analyzedusing Systat statistical software (SYSTAT Inc., Evanston, IL).
RESULTS
Characteristics of the study sample. Several characteristics of the study sample are noteworthy (Table 2). First, thesefirst- through fourth-grade school children were relatively oldfor their school classes. This is typical in Zanzibar, where lateschool entrance is common. The average age was 10.5 y, withover 75% of children between 9 and 12 y (range 5-19 y).Second, their iron status was very poor; 63% of them wereanemic (hemoglobin < 110 gIL), 59% had EP values >80t-tmol/mol heme, and 41 % had ferritin values < 12 J.Lg/L. Third,the malaria parasitemia distribution indicated a populationwith a high prevalence of infection but a low parasite density.Less than 1% of children had > 5000 parasiteslJ.LL blood, alevel that begins to be predictive of clinical disease in highlyendemic areas in Africa (Trape et a1. 1985).
Association between malaria parasitemia and hemoglobinerythrocyte protoporphyrin and ferritin concentrations.Hemoglobin and EP concentrations were not associated withmalaria parasitemia (Table 3). The proportion of abnormalvalues for both hemoglobin and EP showed significant increasing trends with ascending level of malaria parasitemia. Bothtrends were similar in magnitude, with the prevalence of abnormal values in infected children reaching a maximum of125% of the prevalence of children with no parasitemia. Thehighest prevalence of abnormal values was, however, not foundin the highest malaria parasitemia group.
Ferritin concentration demonstrated no re1arionship withparasitemia at parasite densities < 1000 parasites!J.tL blood, butabove this cutoff ferritin increased slightly at a rate of 1.5 J.tg/L per 1000 parasites. This cutoff was used to defin~ high and
TABLE 3
Means and prevalence of abnormal values of iron status indicators by level of malaria parasitemia in children
Protoporphyrin lron-Hemoglobin Serum ferritin deficiency
% >80 anemia1
Malaria % <110 J.l.mol/mol J.l.mol/mol % <12parasiteslJ.l.L n giL giL n heme heme n J.l.g/L J1.g/L n %
0 1406 105 z 162 593 1406 93 (54, 159)4 563 1268 14.1 (7.2,27.7)4 403 1267 241-999 1678 103 ;!; 16 65 1678 100 (58, 173) 62 1564 13.3 (7.0, 25.3) 44 1542 301000-1999 351 104 == 16 61 351 99 (59, 165) 63 324 15.1 (7.6,30.1) 40 324 272000-2999 75 104 =16 69 75 91 (55,150) 64 70 17.5 (8.7, 35.4) 27 70 213000-3999 27 102 ± 16 74 27 101 (66, 154) 70 27 18.9 (9.1. 39.2) 26 27 222:4000 33 104;!; 16 58 33 93 (50.175) 55 30 26.9 (13.7,52.8) 13 30 3
1 Defined as hemoglobin <110 giL and erythrocyte protoporphyrin >80 J.l.moilmol heme and ferritin <12 ,ugL2 Means ± so.3 Significant linear trend by malaria parasite density category (P < 0.05).4 Geometric means Z SD.
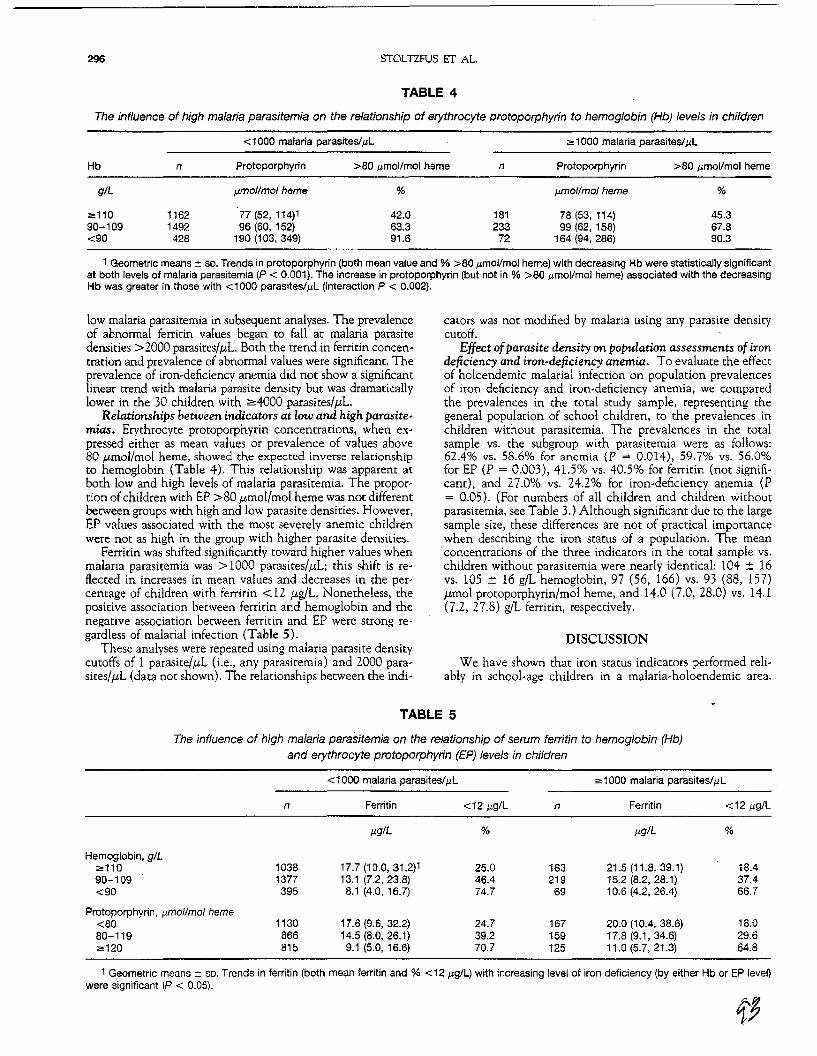
296 STOLTZFUS IT AL.
TABLE 4
The influence of high malaria parasitemia on the relationship of erythrocyte protoporphyrin to hemoglobin (Hb) levels in children
< 1000 malaria parasites/Ill ;;" 1000 malaria parasites!j.ll
Hb
giL
2:11090-109<90
n
11621492428
Protoporphyrin
fJ.trIollmol heme
77 (52, 114)196 (60,152)
190 (103, 349)
>80 Ilmol/mol heme
%
42.063.391.6
n
181233
72
Protoporphyrin
tffI'ol/mol heme
78 (53,114)99 (62,158)
164 (94, 286)
>80 j.lmol/mol heme
%
45.367.890.3
1 Geometric means:!: so. Trends in protoporphyrin (both mean value and % >80 /lmoVmoJ heme) with decreasing Hb were statistically significantat both levels of malaria parasitemia (P < 0.001). The increase in protoporphyrin (but not in % >80 Ilmol/mol heme) associated with the decreasingHb was greater in those with <1000 parasites/Ill (interaction P < 0.002).
low malaria parasitemia in subsequent analyses. The prevalenceof abnormal ferritin values began to fall at malaria parasitedensities> 2000 parasites/,uL Barh the trend in ferritin concentration and prevalence of abnormal values were significant. Theprevalence of iron-deficiency anemia did not show a significantlinear trend with malaria parasite density but was dramaticallylower in the 30 children with ~4000 parasites/,uL.
Relationships between indicators at low and high parasitemias. Erythrocyte protoporphyrin concentrations, when expressed either as mean values or prevalence of values above80 ,umol/mol heme, showed the expected inverse relationshipto hemoglobin (Table 4). This relationship was apparent atboth low and high levels of malaria parasitemia. The proportion ofchildren with EP >80 ,umol/mol heme was not differentbetween groups with high and low parasite densities. However,EP values associated with the most severely anemic childrenwere not as high in the group with higher parasite densities.
Ferritin was shifted significantly toward higher values whenmalaria parasitemia was> 1000 parasites/,uL; this shift is reflected in increases in mean values and decreases in the percentage of children with ferritin < 12 ,ug/L. Nonetheless, thepositive association between ferritin and hemoglobin and thenegative association between ferritin and EP were strong regardless of malarial infection (Table 5).
These analyses were repeated using malaria parasite denSitycutoffs of 1 parasite/,uL (i.e., any parasitemia) and 2000 parasites/,uL (data not shown). The relationships between the indi-
cators was not modified by malaria using any parasite denSitycutoff.
Effect ofpara.site density on population assessments of irondeficiency and iron-deficiency anemia. To evaluate the effectof holoendemic malarial infection on population prevalencesof iron deficiency and iron-deficiency anemia, we comparedthe prevalences in the total study sample, representing thegeneral population of school children, to the prevalences inchildren without parasitemia. The prevalences in the totalsample vs. the subgroup with parasitemia were as follows;62,4% vs. 58.6% for anemia (P = 0.014), 59.7% vs. 56.0%for EP (P = 0.003), 41.5% vs. 40.5% for ferritin (not significant), and 27.0% vs. 24.2% for iron-deficiency anemia (P= 0.05). (For numbers of all children and children withoutparasitemia, see Table 3.) Although significant due to the largesample size, these differences are not of practical importancewhen describing the iron status of a population. The meanconcentrations of the three indicators in the tOtal sample vs.children without parasitemia were nearly identical: 104 :!: 16vs. 105 :!: 16 gil hemoglobin, 97 (56, 166) vs. 93 (88, 157),umol protoporphyrin/mol heme, and 14.0 (7.0, 28.0) vs. 14.1(7.2, 27.8) gIL ferritin, respectively.
DISCUSSION
We have shown that iron status indicators performed reliably in school-age children in a malaria-holoendemic area.
TABLE 5
The influence of high malaria parasitemia on the relationship of serum ferritin to hemoglobin (Hb)and erythrocyte protoporphyrin (EP) levels in children
< 1000 malaria parasiteslill ;;" 1000 malaria parasites/Ill
n Ferritin <12 1l9/L n Ferritin <12 i-lg/L
IlglL % i-lgiL %
Hemoglobin, giL;;,,110 1038 17.7 (10.0, 31.2)1 25.0 163 21.5 (11.8, 39.1) 18.490-109 1377 13.1 (7.2,23.8) 46.4 219 15.2 (8.2, 28.1) 37.4<90 395 8.1 (4.0,16.7) 74.7 69 10.6 (4.2. 26.4) 66.7
Protoporphyrin, Ilmollmol heme<80 1130 17.6 (9.6,32.2) 24.7 167 20.0 (10.4, 38.6) 18.080-119 866 14.5 (8.0, 26.1) 39.2 159 17.8 (9.1,34.6) 29.6;;,;120 815 9.1 (5.0, 16.6) 70.7 125 11.0 (5.7, 21.3) 64.8
1 Geometric means:: so. Trends in ferritin (both mean ferritin and % <12 /lgll) with increasing level of iron deficiency (by either Hb or EP level)were significant (P < 0.05).
IRON STATUS INDICATORS AND MALARIA 297
Specifically, 1) hemoglobin and EP concentrations were notassociated with malaria parasitemia, although ferritin concentration did increase slightly with parasitemia when parasitedensity was > 1000 parasites/ILL; 2) expected relationshipsamong indicators were strong regardless of the level of malariaparasitemia; 3) malarial infection did not modify the relationship among the indicators, except that the elevation in EPwith low hemoglobin was slightly attenuated when parasitemiawas > 1000 parasites/,uL; and 4) malarial infection did not biaspopulation esrimates of iron deficiency to a meaningful degreeusing these indicators.
We cannot evaluate the influence of malarial infection onother indicators, such as transferrin saturation or serum transferrin receptor, because they were not assessed in this survey.A similar evaluation of these indicators in a malaria-endemicpopulation is needed. The three indicators used in this surveywere chosen because of their simplicity in the field (in thecase of hemoglobin and EP), Long-term stability at -20°C (inthe case of serum ferritin), relatively low cost to determine,and their complementarity across the spectrum of iron status.Because of these advantages, it is encouraging to find thatthese indicators are useful in this population.
The influence of malaria on iron sta~ indicators. Although hemoglobin typically falls precipitously (Fleming 1982,McGregor 1982, Phillips et a1. 1986) and severe anemia is acommon complication and cause of death from acute malaria(Brabin 1992), our data suggest that asymptomatic malarialinfection does not much influence hemoglobin concentration.Hemoglobin concentration was not associated with parasitemia, and the increase in prevalence of anemia associatedwith parasitemia was modest «25%). Hemoglobin maintained relationships with EP and ferritin that are typicallyobserved during iron deficiency.
Few data are available on the effect of malaria on EP, andwe found no published data on EP concentrations during acutemalarial disease. In theory, EP values could be elevated inresponse to infection, as observed in chronic tuberculosis(Langer et a1. 1972) and chronic inflammatory neoplastic diseases (Hastka et aL 1993), or decreased due to the dyserythropoiesis that occurs during malaria. In this study, the relationship of EP to hemoglobin Was somewhat attenuated in childrenwith higher parasite densities. In contrast to our findings,Schneider et a1. (1993) found that mean EP concentrationwas elevated in children in Togo aged 6 mo to 3 y withparasitemia>3000 parasites/t-tL. Prevalence of anemia was notassociated with parasitemia in those children. The authorsnoted that the hemolytic breakdown products of heme fluoresce similarly to EP, and speculate that the elevation in EPassociated with malaria is artifactual rather than caused bytrue changes in erythropoiesis. Although the discrepancy ofour findings with those ofSchneider et a1. (1993) is unresolved,the effect of parasite density on EP was not an importantconsideration when evaluating iron status at the populationlevel in these children.
The most important finding was that the relationship offerritin to hemoglobin and EP was not affected by malariaparasitemia, even thoughthe magnitude of ferritin values wasgreater when parasitemia was> 1000 parasites/,uL. Even inindividuals in our population with high parasite denSities, ferritin was directly related to hemoglobin and inversely relatedto EP. Had malaria been a major contributor to anemia, wewould have expected the normal relationship between ferritinand degree of anemia to be obscured (Phillips et a1. 1986)or reversed (Adelekan and Thumham 1990), because sickerindividuals typically have lower hemoglobin and higher ferritin. Although ferritin values increased slightly with parasite
densities> 1000 parasites/,uL, ferritin was still well below values reported for individuals with acute malaria. For example,the mean ferritin concentration at admission among 23 individuals hospitalized with acute, symptomatic, uncomplicatedP. falciparum malaria was 1773 ,ug/L (range 170-10,000 ,ug/L). Ninety days after initiation of treatment, all values hadreturned to 150 ,ug/L or below (Phillips et a1. 1986). Only fiveindividuals in our population had ferritin> 200 ,ug/L. At thepopulation level, endemic malarial infection did not affect theprevalence of abnormal ferritin values.
Comparison with other population studies. Others havedrawn similar conclusions regarding the reliability of iron status indicators in community surveys of P. fakiparum-endemicpopulations. Hercberg et a1. (1986) assessed iron status in arandomly selected sample of all community members in a ruraldistrict of South Benin, where the prevalence of malaria parasitemia was 96.5%. They reported that hemoglobin concentrations and iron deficiency indicators (ferritin, EP and transferrinsaturation) were not related to the density of malaria parasitemia; unfortunately, the evidence for this was not presentedin their article. Similarly, in pregnant and nonpregnantwomen in Papua New Guinea, malaria parasitemia was notassociated with significant differences in hemoglobin or EPconcentrations (Brabin 1992).
Our findings are in contrast to studies that examined therelationships of malaria infection and iron status indicators intwo types of populations: those acutely ill with malaria, inwhom iron status indicators are dramatically perturbed (seeabove), and in young children. Bradley-Moore et a1. (985),in a study of Nigerian children aged 3 mo to 2 y, found thatchildren with parasitemia had around 10 g/L lower hemoglobinand approximately doubled ferritin concentrations comparedwith their peers without parasitemia. The prevalence of parasitemia in this community was 41 %. An age-related effect isalso supported by studies in Papua New Guinea (Spencer 1966)and The Gambia (McGregor et aL 1966), in which the association of malaria parasitemia with hemoglobin concentrationdisappeared with increasing age. Among infants in both studies, children with parasitemia had hemoglobin concentrations10-20 gIL lower than did their peers without parasitemia.Among children aged 2-4 y, parasitemia was associated with12 giL lower hemoglobin concentration in Parua New Guineabut was not associated with lower hemoglobin concentrationin The Gambia. Among Papua New Guinean children aged5-9 y, the association of parasitemia with hemoglobin concentration was slight (a reduction of 3 gIL). Finally, Premji eta1. (1995) also found a strong association between anemia(measured by hematocrit) and parasitemia, which decreasedwith age in 6- to 40-mo-o1d children in coastal Tanzania, anarea expected to have transmission patterns of the parasitesimilar to those in Zanzibar. Further studies are needed todocument, however, whether the effect of parasitemia on otheriron status indicators shows a similar disappearance with agein holoendemic environments.
The importance of different patterns of malarial infectionand disease. The validity of indicators to assess iron defiCiencymay be influenced by several factors that dictate how malarialinfection will affect a population: parasite species, patterns oftransmission, and the susceptibility of population subgroups ofinterest. Decisions about the use of iron status indicators inPlasmodium-infected groups must consider these different situations and population subgroups. Of the four different Plasmodium species that cause malaria, each with distinct clinicalsequelae, P. fa1ciparum predominated in this population. Thisspecies causes the most profound changes in iron metabolism

298 STOLTZFUS IT AL
and thus presumably could have the most dramatic effect oniron· status assessment.
Different patterns of malaria transmission are broadly categorized as holoendemic, hyperendemic and epidemic, according to intensity and stability of transmission (Najera eta1. 1993). The immunity of the population, and thus the probability that infection is associated with disease, differs greatlydepending on these patterns. In holoendemic settings such asZanzibar, parasitemia is prevalent and of high density andsplenomegaly is common in infants and young children; however, in adults, malaria parasitemia is prevalent but of lowdensity. Because of the immunity to infection that is acquiredin holoendemic settings, the distribution of malarial infectionmay differ dramatically from that of malarial disease across agegroups and seasons (Marsh 1992).
Finally, within a given ecological context, population subgroups have different levels of immunity to the parasite. Immunity, as well as age, is dependent on factors such as generalnutritional status and physiologic state, notably pregnancy(Marsh 1992)..
We hypothesize that hemoglobin, EP and ferritin are validindicators of iron status in population groups with relativelyhigh immunity to malaria, but will be less reliable in groupswho are less immune. Put in another way, iron status indicatorswill measure iron status independently of malaria parasitemiain population groups where parasitemia is not strongly associated with disease, which is generally the case among olderchildren and nonpregnant adults in holoendemic environments. If true, this would be important and encouraging newsfor the assessment of iron deficiency in tropical Africa, whereiron deficiency is a prevalent problem among school-age children and adult women. In surveys of iron status in these population groups, it will still be desirable to exdude people whoare experiencing fever and those with parasite densities greaterthan some threshold; Trape et al. (1985) suggest a thresholdof 5000 parasites!,I..lL blood. Our data indicate that 5000 parasites!,I..lL would be an appropriate cutoff for hemoglobin andEP. For ferritin, 1000 parasites!,I..lL might be more appropriate,but ferritin would not bias population estimates if the proportion of individuals above such a threshold is relatively smal!.Further research is required to extend our findings to othervulnerable population groups.
LITERATURE CITED
Anonymous (1989) CDC criteria for anemia in children and childbearing-agedwomen. MMWR 38: 400-404.
Adelekan, D. A. & Thumham, D. I. (1990) Plasma ferritin concentrations in anemic children: relative importance of malaria, riboflavin deficiency, and otherinfections. Am. J. Ciln. Nutr. 51: 453-456.
Ayatse, J.O.!. & Ekanem, E. E. (1994) PlasmOdium falciparum malaria: its effects on some haematological parameters in nonnal and sickle cell Nigerianchildren. Trap. Med. Parasitol. 45: 219-222.
Baynes, R., Bezwoda. W., Bothwell, T.• Khan, Q. & Mansoor, N. (1986) The
nan-immune inflammatory response: serial changes in plasma iron, iron-binding capacity, lactoferrin, ferritin and C-reactive protein. Scand. J. Clin. Lab.Invest. 46: 695-704.
Bothwell, T. H., Charlton, R. W., Cook. J. D. & Finch, C. A. (1979) Iron Metabolism in Man. Blackwell Scientific Publications. Oxford. U.K.
Brabin, B. J. (1992) The role of malaria in nutritional anemias. In: NutritionalAnemias (Fomon, S. J. & Slatkin, S•• eds.). pp. 65-80. Raven Press, NewYork, NY.
Bradley-Moore. A. M., GreenWOOd, B. M., Bradley, A. K•• Akintunde. A.. Attai,E.D.E.• Fleming, A. F., Flynn. F. V., Kirkwood. B. R. & Gilles. H. M. (1985)Malaria chemoprophylaxis with chloroquine in young Nigerian children. IV. Itseffect on haematologicaJ measurements. Ann. Trap. Med. Parasitol. 79: 585595.
Cook, J. D., Upschitz, D. A., Miles, L.E.M. & Finch, C. A. (1974) Serum ferritinas a measure of iron stores in nonnal subjects. Am. J. Ciln. Nutr. 27: 681687.
DeMaeyer, E. M. & Adiels-Tegman, M. (1985) The prevalence of anaemia inthe world. Rapp. Trimest. Stat. Sanit. Mond. 38: 302-316.
E1in, R. J.• Wolff, S. M. & Finch, C. A. (1977) Effect of induced fever on serumiron and ferritin concentrations in man. Blood 49; 147-153.
Fleming, A. F. (1962) Iron deficiency in the tropics. Clin. Haemato!. 11: 365388.
Hastka, J., Lasserre. J.-J., Schwarzbeck, A.. Strauch. M. & Hehlmann, R. (1993)Zinc protoporphyrin in anemia of chronic disorders. Blood 81: 1200-1204.
Hercberg, 5., Chauliac. M.• Galan, P., Devanlay, M.• Zohaun, I., Agboton. Y.,Soustre. Y., Bories, C., Christicles, J.-P.• Potier de Courcy. G., Masse-Raimbault, A.-M. & Dupin. H. (1986) Relationship between anaemia, iron andfolacin deficiency, haemaglobinopathies and parasitic infection. Hum. Nutr.Ciln. Nutr. 40: 371-379.
Johnson-Spear, M. A. & Yip. R. (1994) Hemoglobin difference between blackand white women with comparable iron status: justification for race-specificanemia criteria. Am. J. Clin. Nutr. 60: 117-121.
Langer, E. E.• Haining. R. G., Labbe, R. F., Jacobs. P., Crosby. E. F. & Finch, C. A.(1972) Erythrocyte protoporphyrin. Blood 40: 112-128.
Marsh, K. (1992) Malaria-a neglected disease? Parasitology 104; $53-S69.McGregor. I. A. (1982) Malaria: nutritional implications. Rev. Infect. Dis. 4:
798-804.McGregor, I. A.• Williams, K., Billewicz, W. Z. & Thomson, A. M. (1966) Haemo
globin concentration and anaemia in young West African (Gambian) children.Trans. R. Soc. Trap. Med. Hyg. 60: 650-657.
Najera, J. A.. Liese. B. H. & Hammer, J. (1993) Malaria. In; Disease ControlPriorities in Developing Countries (Jamison, O. T., Mostey. W. H.• Measham.A. R. & Bobadilla, J. L.. eds.), pp. 281 -302. Oxford University Press. NewYorl<, NY.
Phillips, R. E., Looareesuwan, S., Warrell, D. A., Lee. S. H., Karbwang, J., Warrell,M.J.• White, N. J.• Swasdichai, C. & Weatherall. D. J. (1986) The importance of anaemia in cerebral and uncomplicated falciparum malaria: role ofcomplications, dyserylhropoiesis and iron sequestration. Q. J. Med. 58: 305323.
Premji, Z., Hamisi, Y., Shiff, C., Minias. J., Lubega. P. & Makwaya, C. (1995)Anaemia and Plasmodium falciparum infections among young children in anholoendemic area, Bagamoyo Tanzania. Acta Tropica 59; 55-64.
Schneider,D.•Aplogan,A., Dyck. J. L.. Berger, J. &Chippaux, J. P. (1993) Determination of erythrocyte protoporphyrin with a hematotJuorometer: interferencedue to malarial parasitaemia. Ann. BioI. Chem. 51: 141-142.
Snedecor, G. W. & Cochran, W. G. (1980) Statistical Methods, 7th ed. IowaState University Press. Ames. IA.
Spencer, T.E.T. (1966) Haemoglobin levels in the D'Entrecasteaux Islands inrelation to malaria and nutrition. Trans. R. Soc. Trop. Med. Hyg. 2: 10931097.
Trape, J. F. (1985) Rapid evaluation of malaria parasite density"and standard·ization of thick smear examination for epldemiological investigations. Trans.R. Soc. Trap. Med. Hyg. 79: 181-184.
Trape, J. F.. Peelman. P. & Morault-Peelman, B. (1985) Criteria for diagnosingclinical malaria among a semi-immune population exposed to intense andperennial transmission. Trans. R. Soc. Trop. Med. Hyg. 79: 435-442.
WHO/UNICEFIUNU (1995) Indicators and Strategies for Iron Deficiency andAnaemia Programmes. Report of a Consultation. 6-10 December 1993, Geneva. Switzerland (Unpublished).

High Moderate _Lo_w _
Any anaemia' >40 10-39 1-9severe anaemiat >10 1-9 <0·1...()·9
'Haemoglobrn concentration <110 giL in pregnant women or young children.<120 gil in schoolchildren or non-pregnant women, <130 giL in adult men.tHaemoglobin concentrations <70 giL.
Table 1: Epidemiological criteria for assessment of severity andmagnitude of lron-deflclency anaemia
2000 is "unlikely to be met without a significantacceleration of effort over the next 6 years".J
Is it true that efforts to control iron-deficiency anaemiaare failing, despite substantial health and economicimprovements in some pans of the world? Table 2 showshaemoglobin concentrations for different populations ofwomen. Although all the women are from less developedcountries, they were not selected purposively. These dataare from studies conducted since 1990 at the Center forHuman Nutrition, Johns Hopkins University, Baltimore,USA; none of the studies should be interpreted asnationally representative. The Nepal data were collectedin a continuing community-based studyll in the Terairegion, which is representative of the northern Gangeticflood plain of India and southern Nepal. Protein-energymalnutrition, vitamin A deficiency, and hookworminfection" are common in women from this region,but there is no programme to provide iron supplementsto these women. The Zanzibar data were collected froma rural community-based survey on Pemba Island(Chwaya HM, unpublished observations), where acutemalnutrition is common in children, and hookworms andSchistosoma haematobium and Plasmodium jaldparum areendemic. IS Iron supplements are provided to pregnantwomen by the Zanzibar Ministry of Health, but coverageis low because of limited tablet supply. The other threeareas represent populations where malnutrition isdeclining and public-health infrastructures are reasonablygood. In Peru and Indonesia, iron supplementation forpregnant women has been a long-standing health policy,and tablets are widely available. The Peru data werecollected from women who attended antenatal clinics inlow-altitude urban areas (Zavaleta N, Fukomoto M,unpublished observations), and the Indonesia data arefrom a rural community-based study in Central Java.'·The Shanghai population comprised women who receivedantenatal care at urban public hospitals.17 Although thispopulation is poor, acute malnutrition is'' rare andantenatal care is very good; iron supplements are availablebut are used by less than 10% of pregnant women. 17
From all we know about these populations-eg, theirdietary adequacy, burdens of infectious diseases, andavailability of health services-we would expect to findstriking differences in the prevalence and severity of irondeficiency anaemia. A good indicator should be able toseparate these populations according to different degrees
THE LANCET
Rethinking anaemia surveillance
Rebecca J Stoltzfus
Iron-deficiency anaemia affects about 1·3 billion people'and is the most common form of malnutrition in theworld. In the past few years, there have been renewedefforts to control iron-deficiency anaemia. At the 1990World Summit for Children, leaders from more than 159countries agreed to try to reduce the prevalence of irondeficiency anaemia by a third by the turn of the century.',J
In 1993, the World Bank' ranked anaemia as the eighthleading cause of disease in girls and women in developingcountries, and concluded that iron-deficiency anaemiacould be effectively controlled with existing cost-effectiveinterventions.
Surveillance systems for anaemia are fundamental topublic-health decision-making and for monitoring theprogress of national and worldwide goals to controlanaemia. S Effective anaemia surveillance is essential toidentify which populations are most in need ofintervention and to assess whether programmes areworking. As the World Declaration and Plan of Action forNutrition" states, the international community should"strengthen micronutrient surveillance capabilities andactivities by devising indicators to monitor ... strategiesfor achieving national goals". There is a need for simpleindicator cut-oft's that enable progress to be trackedand compared across regions, and for criteria onprevalence that identify the most severely affectedpopulations. Such surveillance activities differ frompopulation assessments of the underlying causes orinterventions and from the clinical assessments ofindividuals, for which other methods are recommended.7
-9
Haemoglobin concentration is the key indicator of irondeficiency anaemia for surveillance purposes, especiallysince the advent of the HemoCue system (HemoCue, AB,Angelholm, Sweden) which measures haemoglobinconcentration within seconds from a drop of whole bloodwithout need of electricity. '0 The current criteria for theassessment of the severity and magriitude of irondeficiency anaemia in populations are the prevalence ofany anaemia and severe anaemia (table 1).
Little progress seems to have been made againstiron-deficiency anaemia. Based on surveillance data from1975 to 1990, the United Nations reported that theprevalence of anaemia worldwide had not declined. lI
Similarly, in sub-Saharan Africa, a region challenged bywar and economic instability, and in Southeast Asia, aregion characterised by economic emergence anddeclining rates of other forms of malnutrition, theprevalence of iron-deficiency anaemia has not fallen.A midterm report of the objectives of the World Summitfor Children warns that the goal to reduce anaemia by
Lancet 1997; 349: 1764-66Center for Human NutritIon, School of HygIene and Public Health,Johns Hopkins University, Baltimore, MD 21205-2:1.03, USA(R J StOltzfus pnD)
Criterion Population pr8\'8lence ulegory (%)
1764 Vol 349· June 14, 1997
q~

THE lANCET
Nepal. 3 months post partum 613 81·4 28·4 13·6 6·3 2·4Central Java, 3 months post partum 146 71·9 15·1 2·7 2·1 2·1ZanZibar, not pregnant 583 71·7 26·2 13·0 8·9 5·3Nepal. pregnant 1052 69·8 40·5 20·8 9·5 4·9Shanghai. pregnant 829 66,2 25·3 5·5 0·8 0·2Peru. pregnant 670 44·3 14·5 4·3 ,,0·1 ,,0·1
'Anaemia define<! as haemoglObin concentrations <110 g/L in pregnant women or<120 g/L in non-pregnant women.
Table 2: Haemoglobin concentrations In different populatlons ofwomen
of risk of iron-deficiency anaemia. However, based on thecurrent criteria for any anaemia, all the populations wouldbe classified as areas with a high prevalence of iron~
deficiency anaemia. By contrast, based on the prevalenceof severe anaemia, none of the populations would havehigh rates of anaemia. But this opposition simply does notmake sense. Either iron-supplementation programmesand general health indicators have no bearing on theprevalence of iron-deficiency anaemia, or the currentcriteria do not provide the information needed for thepopulation burden of iron-deficiency anaemia to beassessed accurately. The answer lies in the lower end ofthe distribution of haemoglobin concentrations. Thecumulative distributions in table 2 show the expecteddifferences between the populations. There is only aI·S-fold difference in the prevalence of anaemia betweenthe populations; however, if haemoglobin concentrationsbelow 90 giL (moderate-to-severe anaemia) are used asthe indicator, there is a 7'7-fold difference betweenpopulations. Some comparisons are illuminating. Theprevalence of anaemia is similar among non-pregnantwomen in Central Java and Zanzibar. However, theprevalence of moderate-to-severe anaemia is five timeshigher in Zanzibar than in Java. The rate of anaemia inpregnant women is similar in rural Nepal and Shanghai,but the prevalence of moderate-to-severe anaemia is2·5 rimes higher among Nepalese women than amongwomen from Shanghai.
Severe anaemia (haemoglobin concentration <70 gIL)is closely linked to risk of mortality, but is difficult tomonitor because the prevalence rarely exceeds 5-7%,even in populations with a high prevalence of irondeficiency anaemia. Furthermore, this indicator does notalways distinguish between populations with very differenthaemoglobin distributions-eg, Nepalese and CentralJavanese women in the post-partum period (table 2).Changing the cut-off for haemoglobin concentration inanaemia surveillance is such a simple idea that it seemsunimportant, but it is not. Let us return to two keyobjectives of anaemia surveillance: to identify populationgroups in greatest need of intervention and to monitorprogress in anaemia control. The first objective enablesdonors and governments to use scarce health resourceswisely and the second enables them to set goals and see ifthey are met. How would public-health decision-makingbe influenced by surveillance of moderate-to-severeanaemia-ie, a haemoglobin cut-off of 90 giL?
First, public-health resources for anaemia controlwould be allocated differently. The prevalence of allanaemia or moderate-to-severe anaemia give differentindications of the severity of anaemia in the populationgroups (table 3). The current perception is that anaemia is
'tlaemoglobin concentrations <110 g/L in pregnant women. <120 giL in women whoare not pregnant.
Ta~le 3: IrolHfeflciency anaemia In different popUlations byprevalence of all anaemia and prevalence of moderate-tosevere anaemia
widespread in all countries. Fund donors, who need toaddress health issues that are well~defined and amenableto solution, find it difficult to focus their programmeefforts on anaemia. Governments of developing countriesare overwhelmed with health problems, and may not feelcompelled to tackle anaemia when their better-offneighbours report similar rates of anaemia. But, table 3shows that there are differences in the prevalence of irondeficiency anaemia between countries and regions, andhighlights the need for action in Nepal and Zanzibar.
Second, in developing countries, the prevalence ofmoderate-to-severe anaemia is more likely to indicateprogress in anaemia control if other health improvementsare being made. The prevalence of all anaemia inIndonesian women has remained above 50% during thepast 30 years, even though progress has been made inmost other health indicators, especially nutrition. It wouldbe interesting to know whether the prevalence ofmoderate-to-severe anaemia has declined or whether ithas always been low. I suspect it has declined greatly.Indeed, the lower end of the distribution of ahomoeostatically controlled indicator, such ashaemoglobin concentration, would be likely to changemore rapidly than the upper end. If a successfulprogramme for anaemia control were implemented inNepal or Zanzibar, the distribution of haemoglobinconcentrations might first shift to become likeIndonesia-ie, with high prevalence of all anaemia butlow prevalence of moderate-to-severe anaemia. Thisdistribution would represent substantial progress, butwould not be revealed with surveillance that relied on theprevalence of all anaemia.
If we begin to use the prevalence of moderate-to-severeanaemia for surveillance purposes, it is important not tolose sight of the prevalence of mild anaemia. A survey ofhaemoglobin concentrations provides data on both mildand moderate-to-severe anaemia. For countries where the"prevalence of mild or all anaemia has already fallen below50%, such as Latin America, the Middle East, and NorthAfrica, the prevalence of all anaemia will measure thelower end of the haemoglobin distribution and is the bestindicator for monitoring progress in the control of irondeficiency anaemia. A suggestion to monitor theprevalence of moderate-to-severe anaemia in regionswhere the prevalence of iron-deficiency anaemia is highdoes not imply that there are no health risks associatedwith mild anaemia. Mild iron-deficiency anaemia affectscognitive capacity in children,18 increases the risk ofpreterm delivery in pregnant women,17.J9 and reauces workoutput in all individuals.'· Public-health interventions to
132164
72706644
Pr8~alenc8 of lron-deflclency anaemia ("l
Define<! by Defined by prevalenceprevalence of of moderate-to-severeall anaemia' anaemia____ (haemoglobin <90 g/L)
81 1472 3
Population No
Nepal. 3 months post partum 613Cenual Java. 3 monthS 146post partumZanzibar. not ptegnant 583Nepal. pregnant 1052Shanghai. pregnant 829Peru. pregnant 670
" of populatlon wltlllIaemollIoblnconcentrations (&ILl
Below <100 <90 <80 <70anaemiacut-olf'
NoPopulation
Vol 349 • June 14, 1997 1765

THE lANCET
control iron-deficiency anaemia are needed in all thepopulations listed in table 2. But the addition of a lowerhaemoglobin cut-off for surveillance purposes isimportant because the health risks associated withmoderate-to-severe anaemia are substantially greater; it iswithin this range that anaemia contributes directly tomortality among women and children.
A helpful analogy is the use of the prevalence ofmoderate-to-severe stunting or wasting (more than 2 SDbelow the reference mean) to monitor protein-energymalnutrition worldwide, even though many children whoare 1 SD below the reference are malnourished andexperience adverse health risks.21 Similarly, use of lowbirthweight defined as below 2500 g to monitor rates oflow birthweight does not mean that the risk of mortalityfor a baby who weighs 2600 g is the same as that for a3300 g baby.22 Surveillance indicators are chosen becausethey serve the purposes of surveillance, not because theyindicate the point of minimum risk. Despite effectiveinterventions, control of iron-deficiency anaemia has notproved to be easy. We need to intensify our surveillance ofanaemia so that the progress we make can be assessed,especially in those countries with a high preve1ence ofanaemia. A simple change in the haemoglobin cut-offsused for anaemia surveillance would sharpen our focus.
I thank Keith West, :Wchele Dreyfuss, Li-Ming Zhou, Nelly Zavaleta, andHababu Mohammad Chwaya for making their data on anaemia prevalenceavailable for my analysis, and Jim Tielsch for discussions that spawnedthese ideas. This srudy was supported by cooperative agreements DAN0045 and DAV 5116 between the Center for Human Nutrition, JohnsHopkins University and the Office of Health and Nutrition, US Agency forInternational Development.
References
Gillespie S, Kevany J, Mason J. Controlling iron deficiency. Geneva:United Nations Administrative Committee on Coordination.Subcommittee of Nutrition (ACClSCN), 1991: 1-93.
2 FAO, WHO. Preventing specific micronutrient deficiencies: majorissues for nutrition strategies. Theme paper no 6. Geneva: WHO, 1992.
3 UNICEF. The Slate of the world's children, 1995. Oxford: OxfordUniversity Press, 1995: 1-89.
4 World Bank. World development report: investing in health. New York:Oxford University Press, 1993: 1-329.
1766
5 Mason]B, Habicht J-p,Tabarabai H, Valverde V. Nutritionalsurveillance. Geneva: WHO, 1984: 1-194.
6 FAO, WHO. World declaration and plan of action for nutrition.Geneva: FAO,WHO, 1992: 1-39.
7 Expert Scientific Working Group. Summary of a repOrt on assessmentof the iron nutritional statuS of the United States population. Am] ClinNurr 1985;42: 1318-30.
8 Yip R, Stolt>£us RJ, Simmons WI<. Assessment of the prevalence andthe nature of iron deficiency for populations: the utility of comparinghaemoglobin distributions. In: Hallberg 1., ed. Iron nutrition in healthand disease. London: John Libby and Co, 1996: 31-48.
9 'TYler RD, Cowell RL. Classification and diagnosis of anaemia. CompHaematolInt 1996;6: 1-16.
10 vOn Schenck H, Falkensson M, Lundberg B. Evaluation of"HemoCue", a new device for determining hemoglobin. Clin Chem1986; 32: 526-29.
II United Nations Administrative Committee on Coordination,Subcommittee on Nutrition (ACClSCN). Second repOrt on the worldnutrition situation, vol I: global and regional results. Geneva:ACCfSCN, 1992.
12 Dreyfuss ML, Shrestha J, !<hatry SK, et aI.The prevalence of anemiaamong pregnant and lactating women, and among their infants inSarlahi District.] Nepal MedAsso<: (in press).
13 Christian P, West KP, !<harry 5K, et al. Nightblindness duringpregnancy in Nepal: links to nutrition and health. FASEB J 1996; 10:A246 (abstr).
14 Dreyfuss ML, Shrestha ]B, !<hatry SK, et aI. Relationship between ironstatus and helminth infection among pregnant women in Nepal.FASEBJ 1996; 10: A730 (abstr).
15 Stolt>£us RJ, Chwaya HM,Tielsch JM, Schulze KJ, Albonico M,Savioli L. Epidemiology of iron deficiency anemia in Zanzibari schoolchildren. Am]Clin Nurr 1997;65: 153-59.
16 Stoltzfus RJ, Hakimi], Miller KW, et aI. High dose viraminAsupplementation ofbreasr-feeding Indonesian mothers: effects on thevitamin A status of mother and infant.J Nurr 1993; 123: 666-75.
17 Zhou L-M, YangW-W, Hua J-2, Deng C-Q,Tao X, Stoltzfus RJ.Hemoglobin concentration in early pregnancy and low birth weight.FASEB J 1997; 11: A654 (abstr).
18 Cook]D, Lynch SR. The liabilities of iron deficiency. Bwod 1986; 68:803--{)9.
19 SchollTO, Hediger ML, Fischer RL, Shearer JW. Anemia \TS irondeficiency: increased risk of preterm delivery in a prospective study.Am J Clin NIW 1992; 55: 985-88.
20 Haas]D, Fairchild MW. Summary and conclusions of the InternationalConference on Iron Deficiency and Behavioural Development,Oct 10-12, 1988.AmJClin Nurr 1989; 50: 703-{15.
21 WHO Expert Committee. Physical status: the use and interpretation ofanthropometry. WHOTechnical Report Series no 854. Geneva: WHO,1995: 1-452.
22 Shapiro S, McCormick MC, Starfleld BH, Krisher ]P, Bross D.Relevance of correlates of infant deaths for significant morbidity at1 year of age. Am J Obsm Gynecol 1980; 136: 363-73.
Vol 349 • June 14. ! 997

June 1997: 223-232Hook,vornl Control as a Strategy to PreventIron DeficiencyRebecca J. Stoltzfus, Ph.D., Michele L. Dreyfuss, ~LP.H., Hababuu M. Chwaya, M.D., and !\hrcoAlbonico, M.D.
The hookworms Necator americanvs and Ancylostoma duodenale infect approxima:ely 1 billion
.people worldwide. The prevalence of hookworminfection increases with age in children, typicallyreaching a plateau in late adolescence, whereasthe intensity of infection may continue to increasethroughout adulthood. Hookv/orms cause intestinal blood loss in amounts proportional :0 the number of adult worms in the gut. The relationshipbetween hookworm infection intensity and he[jloglobin concentration is evident in epidemiologicstudies, but may be apparent only abcI'e a threshold worm burden that is related to the iron storesof the population. Current hooh'rorm control efforts are focused on reducing infection load andtra(Jsmission potential through periodic anthel·minthic chemotherapy. Several controlfed trialshave demonstrated a positive impact of anthel·minthic treatment on hemoglobin levels, with bestresults obtained in settings where iron intakeswere also increased. Evidence suggests that anthelminthic programs will have modest impactson iron deficiency anemia in the short term, withgreater impacts on more severe anemia. Hookworms are an important cause of anemia inwomen, who are often overlooked by current helminth control programs. Current WHO recommendations for use of anthelminthics in schoolchildrenand women are reviewed. There is a need to clarifywhether hookworms are an important etiology ofiron deficiency anemia in preschool children.
Introduction
For ~ecades it has been beyond doubt that hod....wormsc~use blood loss, yet there are few modem examples of
Dr. Stoltzfus and Ms. Dreyfuss are with the Centerfor Human Nutrition and the WHO Collaborating Centerfor Research on Intestinal ParasHes and HumanNu'lrition, Johns Hopkins School of Hygiene and PublicHealth, Ballimore, Maryland 21205, USA. Dr. Chwayais with the Ministry of Heallh, Zanzibar, United Republicof.Tanzania. Dr. Albonico is with the de CarneriFo~'ndation, Milan, Italy 20129.
Nutrition Reviews, Vol. 55, NO.6
bookworm control programs that have been designed withthe measured objective of reducing iron deficiency. ~orare there outstanding examples ofanemia control prop-amsthat have integrated hookwonn control as a part of u'1econtrol strategy. In pzrt this is due to the difficulty oferadicating hoob\'orm infection in populations and the disenchantment with interventions that can reduce the problembut cannot get rid of it. We suspect it is also becausescientists are trained to focus within their own discipline,and effective integration of hool...worm control and programs to prevent iron deficiency requires collaborationbetween parasitologists and nutritionists. However, jfweare serious about meeting the current global objecth'e ofreducing anemia by one-third,' bool....wonn·related bloodloss cannot be ignored.
This paper focuses on boobvonns and their relationto iron status. However, let us remember that h00\"-wormsare not the only helminth-often Ascaris lumbricoides andTrichuris trichiura are more prevalent than hook"wormand that helminths have otber adverse effects in additionto causing iron loss. These effects may include grO\\1hretardation., vitamin A deficiency, and cognitive deficits.
We address the following objectives: to review theevidence that hook."v..orm infection is an important etiologyof iron deficiency in most populations where hook."wormsare endemic, to present recent data showing that currentanthelminthic therapies can improve iron status, 2nd tosummarize current public health recommendations for hookworm control and suggest some ways they could be ad· •vanced. Throughout the paper we will draw attention tothe importance ofbook'"\\'offilS as a cause of iron deficiencyin women., agroup who have been neglected until recentlyin most discussions of these issues.
Prevalence and Epidemiology of HookwormInfection
Hookv.'onns infect approximately I billion people world",ide? Prevalence TZtes range from 10% to 20% in relativelydry, unsani12ry areas such as Iran and parts of Pakistan togreater than 80% in rural, unsanitary conditions in tbe wet,humid tropics.3 Two species of hookwonD, Ancylostomaduodenale and .\'ecator americanus, are endemic in buman populations. Ancylostoma duodenale is usually found
223

in coolcr, dricr regions, such JS Eun'i'e. the ~1iddlc Ea!'t,the Mcdilcrr.mc:m, North Africa. Paki~l:m. Jnd northcr.1India. Neca/or amcriconus prcdC'minJles in thc AmcrieJs.Ccntrol Africa, easlcm and southern India. Indonesia. Jndthe South Pacific, However, mixed infections Jrc found inmany areas of the world, including parts (lfLatin America.'
Both species of hookworm require In infectivc stagein the human host to complete their life cycles. The transmission ofhookwonn infection in hum:!n populations depends on three factors: the eXlent of fcc:>] pollution of thesoil, the suitability of environrnent31 conditions for egghatching and lan'al development, and the extent ofcontactofcontaminated soil with human skin.! Contzmination ofsoil occurs when sanitary facilities are not a\'ailable andcommunity members defecate directly in the soil or whenhuman feces is used as fertilizer for agricultural activities.In wann, humid environments, hookwonn eggs in feceshatch and develop into infective Jar.ae, which can li\e fora period of several days to I month' ::'efore needing [0
enter a human host to continue their deyc)ojJment. Thelarvae enter the host through the skin, migrate L.)..Jougb thecirculatory system to the lungs, pass through L~e alwo[2.fsystem up the trachea, are swallowed, a.:J.d tina!!}' t.1ke upresidence in the intestines where they mature into adultwonns with a life span of2-3 years. Adult female WOi7!lS
lay eggs, which pass in the feces and cOLl/lnue the transmission cycle. The presence and number of eggs in thefeces also serve as the most practical indicatOrs of hookworm infection in population studies.
People ofalI ages are susceptible to bookv.·oruJ infection. However, the prevalence of infection increases withage in children, typically reaching maximum leyels at. I5-20years and leveling off in adulthood.s Infectioil intensityfollows a similar pattern of increasing with age, but doesnot necessarily level offduring adulthood, often continuing to increase in older adults. Hook:v..orrn infection is different in this regard than A. lumbricoides and T. tn'chiura
infections, which reach maximwn prevalence and intensityin the school-age years and then decline in adulthood.
Men often have higher levels ofhoobl,'onn infectionthan women, and this is most likely related to gender differences in exposure to contaminated soiLl For example, inwestern and northern Nigeria, women do not do :::gricullUral work in the field, so infection is heavier :::nd moreprevalent among men."a However, in eastern Africa andother areas wbere women participate in agncultunl work,tbere is no significant difference in prevalence r"les beMeen the sexes.7
Where hookworm infection is endemic, it is co:nmon, in pregnant and lactating women. Infection in pregnancy
is particularly disastrous to iron status bec2use iron demand is already very high in pregnancy. It is possible thatchanges in tbe immune response during pregnancy andlactation may modulate tbe susceptibility ofpregm.nt and
224
lactating women 10 hlwk\\'lmn infection, but ulis !lJS notbeen adequately investigated,
A characteristic ofhookwonn and othcr helminth infections is thJt J slnJlI proportion of individuals carT)' themajority ofthe hoC'l,:womls in the conUllunily. For example,a study in West Bengal found lhat greatcr th;m 60% of thebooJ..."Vt'orms were harbored by less than 10% ofthe population sampled.9 This clearly idenlificd distribution patternof infection in populations has led some to hypothesizethat certain "wormy people" arc predisposed 10 hea\')' infections because of undefined genetic, ecological, behavioral, and social factors, Numerous studies conducted totest this hypothesis have found that the infection inlensity prior to anthelminthic treatment is significantly correlated \\;th the infection intensity from reinfection after trCJtment9-l~ The causes of this predisposition to hookworminfection have yet to be fully elucidated and could be either behavioral or biological in nature. This epidemiolC'giccharacteristic of the disease has Jed some to suggest th:ltan efficient, economic, and effective hookworm controlprogram would target those individuals predisposed toheavy infection for chemotherapy treatmcnl.9 Howeyer,suco a strategy would not address the fact that light ormoderate hoo\,,-woi!ll infeclion is sufficient to cause anemiain people with low iron stores and intakes, FurJlennore, forsuch a strategy to work in practice, a simple method foraccurately ideotifying "wormy people" within treatmentprograms would need to be developed.
Effects of Hookworm Infection on Iron Status
Relationship of Hookworm lnfection to Iron LossThe mechanism by which hook"Vt'orm infection leads to irondeficiency anemia is chronic intestinal blood 10ss.13 Adultbookworms attach to mucosa in the upper small intestine,ingesting tissue and blood and cbanging their feeding siteevery 4--S bours.I":~ Blood is primarily lost when it passesthrough the hookwonn's intestinal tract and is subsequently expelled during feeding, but secondary loss alsooccurs from bleeding of the damaged mucosa.4
Numerous studies have shown that both the wormload and the fecal egg count are strongly correlated withthe amount ofblood 10S5.1•. :5-19 \Ve measured this relationship in Zanzibari schoolchildren~o from a sample of 200chosen to represent the range of hook\vonn infection intensity in the population (Figure 1). Hookworm infectionintensity was measured using fecal egg counts, and gastroiniestinal blood loss was measured by detennining theconcentration ofbeme in the feces, using the HemoqU2.otmetbod.:J This method determines the amount ofporphyrins contained in the feces before and after digestion thatdegrades heme to its porphyrin constituents. The concentration ofporphyrin after digestion is used to calculate tbetotal feC2l heme concentration, and the ratio ofthe porphy-
NVlrilion Reviews, Vel. 55, No.6

'~ormal requirements from reference 22. Losses from parasitesfrom reference 3.
Table 1. Iron Losses and Requirements for a TypicalWoman'
15 r--...,.-----y--.....--,---y---,--,
o
Source
Basal requirementMenstruationPregnancyLactationHookworm infection (moderate intensity)
N. americanliSA. duodenale
Other parasitic infectionsT. trichiura (moder:!te intensity)S. haemarobium (se\'ere infection)
Iron CostCroWds)")
0.720.442.140.23
1.102.30
0.162.10
'" § C> C> 8 .;!: C> 8 8i=i C> C>
d ~.... 0
0- J. I c::>to 0
" 0 0 0 00 0 0 00 N ... <.;)
Figure 1. Fecal heme content and hookv"oIT:1 infec~on inle:1si,)'in Zanzibari schoolchildren. Bars represenl SE~i. Inc:-:asing C"e:1din fecal hemoglobin is significant (p < 0.001). \'Ul':"Joers of chil·dren at each ascending level ofhook-v.'orrn eggs per gra.'!l offecesarc 45, 83. 19, 22, ]8, and 16. Reprinted with permission fromreference 20.
: rin concentration before and after digestion indicates wherethe blood loss occurred in the intestinal tracl A high proportion ofporph)un in the feces before the digestion pro"cess indicates blood loss higber in the intestinal tract. Inthe case ofthese samples, a high proportion of fecal hemewas already degraded to porphyrin, suggesting blood lossin the small intestine. This is what we would expect fromhookworms. A nonnal Hemoquant value is < 2mg hemellg feces. Like data from earlier experiments using differentmethods, Figure 1 demonstrates that there is no thresholdin the relationship betv.:een hookworm infection intensityand intestinal blood loss and that the relationship is approximately linear.
The magnitude of blood loss represented by heavyhookworm infection is substantial. A concentration of 10mgfg fecal heme represents a daily loss ofmore than 2 mgiron. more than double the median iron requirement of ahealthy scbool-age cbild. In children whose fecal hemeexceeded 10 mg/g feces, 100% had serum ferritin concen·trations < 18 flgldL, 93% had hemoglobin concentrations< 110 giL, and 29% had hemoglobin concentrations< 70 gIL.1.O In this sample ofchildren, the predominant hookworm species was N. americanus, although some A.duodenale was found in about 10% oftbe children. Fromstudies that have been made of pure infections of the tv.'ospecies, blood loss fromA. duodenale is 2-10 times higherthan that measured in infectio~s of 1'1. americanus. 13 Figure 1thus represents the less pathogenic oflbe hookv.·ormspecies.
Nutrition Reviews. '101.55. No.6
From this and other studies, the iron loss from a moderate hook."wOIm infection can be comjJared with other ironrequirements (T:lble 1). A moderate hookworm infectionapproximately doubles the iron requirement of a woman.Two other parasitic infections are also included in this 12blefor compmson with hookworms. Trichuris tn'chiura isbelieved to cause a loss of iron about one-tenth that ofhookworms, although much less evidence supports thisestimate than supports the hooJ..."\vorm figures. Schistosomahaematobium infections cause significant urinary iron losswhen the infection is severe. However, this parasite is limited to Afiica and the :>1iddle East.) ~alaria, especiallyPlasmodiumfalcipar.J.m malaria, is commonly associatedwith anemia, but there is no good evidence that malarialinfection brings about iron loss. Rather, body iron is dramaticaIty redistributed toward storage forms. Thus, malaria is not a cause of iron deficiency in the same sense asthese parasites.
Relationship of Hookworm Infection to IronDeficiency Anemia
From what we know about bookv.'orms, this parasitic infection should be strongly associated with iron deficiencyanemia. Have population studies found this to be the case?
Numerous studies dating back to 1920 have found asignificant correlation between hemoglobin levels andworm load and/or fecal egg counts. ll.:) A review of theevidence for the relationship between hookworm infectionand iron deficiency anemia also identified some studieswbere tbe relationship was not significant. Roche andLayrisse13 described four conditions necessary to identifjthis relationship in population studies: a large sample sizeto aCcount for individual v2.riation, quantitative measure·ment ofhemoglobin levels and worm load.s (or egg counts),a wide range of infection levels, and no more th2.n a minimal presence of other anemia-producing deficiencies. In
225

Table 2. Relation Bel\."een Hook'o\'orm Infection In:ensity and Hemoglobin Concentration in Nepal and
Zanzibar
Hooh."l\'onn Hrmoglobin Concentrations Cli!:-)Infecdon Intensity Srp3lr~e Zanzibari Zanzibari Zanzibari
(eggs/g feces) Pl"f'goant Women" SchoolchiJdren~ Adult :\trn :"onpregnaDt Women
0 105:: 12 11O::!:; 13 129± 19 115 ± 16(97)' (215) (24) (53)
1-1999 102± 14 IDS::!:; 13 121 ±22 109::!:; 18(256) (2562) (35 t) (375)
2000-3999 100= 18 100± 17 113:: 28 lOS ± 22(39) (456) (72) (9i)
4000-5999 56 ± 21 96:!: 19 104 =23 105:: 24(24) (128) (34) (42)
~6000 $9 ==:0 93 =23 96::38 98=20(IS) (6i) (14) (15)
"From reference 27.b From reference 28,<.\fean ± SD; sample size in p::.rentheses.
most studies finding no signific:?."1t correlation betwe:::lhook..wonn infection and iron deficie:Jcy ancUlia, at leastone of these conditions was not mel.:;
Layrisse and Roche's seminal po?:.:Jation·based studyofhooJ...·v..orm infection in Venezuela~ documented a highly
. significant relationship between hemoglobin levels a:ld! fecal egg counts. However, a threshold effect was also
observed, demonstrating the depende:lcy of this relatio:::ship on'a minimum level of infection. Hemoglobin levelswere significantly lower in women and children \\ith mon:than 2000 eggs per gram (epg) of feces and in men withmore than 5000 epg compared with those witb light infec-
: tions. Some other studies have found ilie same pbenomenon., although tbe threshold worm load varied from 1000to 5000epg.~~~6
The threshold worm load associated with anemia doesnot derive from the chazacteristics ofhook~",'orm infectionwe have seen that the relationship betv.'een bookworm infection mtensity and iron loss has no threshold-but ratherfrom the characteristics of anemia as an indicator of ironstatus. Hemoglobin concentration falls only wben ironstores are depleted. The development of iron deficiencyanemia from hookwonn infection thus depends on threefactors: iron intake, iron stores, and the intensity and duration ofinfection.7 Iron intake and stores differ significantlybetween communities and population subgroups. Thus, alight infection might be sufficient to cause negative ironbalance in someone with a low iron·bio2.vailable diet, butanother person with a more iron·rich diet would bave negative iron balance only ifmore beavily infected. Women andyoung children usually bave the lowest iron stores, mak·ing them particularly vulnerable to developing iron defi·ciency anemia from chronic blood Joss due to hookv.'onn.This is illUStrated in the work of Layrisse and Rocbe2l inVenezuela, wbere low hemoglobin le\'els occurred at a lower
226
threshold worm lOad in women and children than in men.At the opposite extreme, in a :\igerian population whereaverage iron in12.ke is 21-30 mg'day, iron deficiency ane·mia was not apparent unless subjects were infected withmore than 800 worms.1
We have studied the association betv..een hook,"'\l,'onninfection intensity and iron deficiency anemia in 1\\'0 regions that ~ave iron·poor diets: Pemba Island, Zanzibar, inEast Africa, and the Tend region of Nepal, just across theborder from northern India. In Zanzibar, tbe :\1inistry ofHealth has conducted a representative survey of schoolchildren on Pemba Island and a community-based surveyof adult men and nonpregnant women. In Nepal, we arecontinuing to evaluate the iron status and risk factors foriron deficiency in pregnant women in Sarlahi district. Ineach of these studies, hemoglobin and erythrocyte protoporphyrin concentrations have been determined fromvenous blood samples, and hook"Worm infection intensitywas assessed by the Kato·Katz method of counting eggsper gram feces.
In each of these population subgroups the relationship between hookworm infection intensity and hemoglobin concentration is vet)' strong (Table 2). In Zanzibariwomen and children and pregnant Nepalese women. the.hemoglobin concentration falls about 5 giL per 2000 hookworm epg. In Zanzibari men the decline is even steeper,about 8 gIL per 2000 bookworm epg. The iron status ofthese populations is vet)' poor. Even among tbe groupswith DO bookworm infection, mean hemoglobin levels arebelow normative definitions ofanemia. Therefore, the decline in hemoglobin is apparent even at the lowest levels ofhookworm. infection intensity. In populations like these,individuals have no iron stores to buffer the losses causedby bookworms, and thus the linear intensity..{lependeDtrelationship bel\\'een hooh'orm infection and iron status
Nutrition Reviews, Vol. 55, No.6
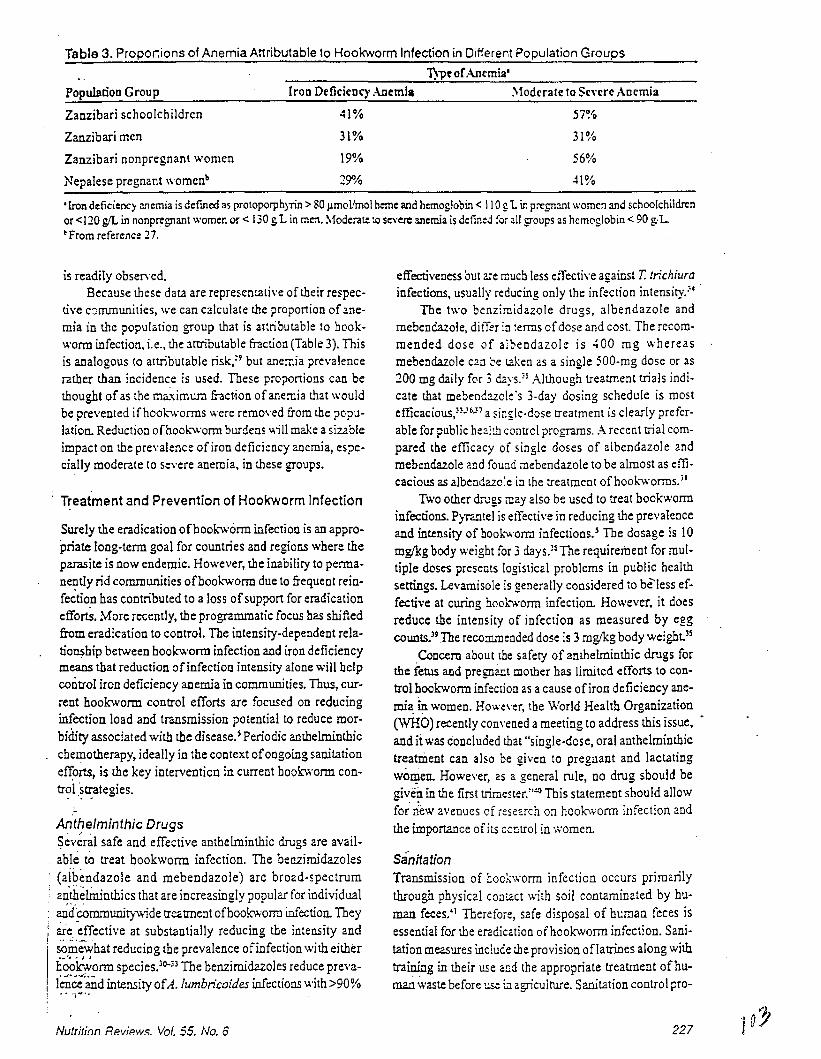
Tabla 3. PropOl1ions of Anemia Attributable 10 Hookworm Infection in Different Population Groups
l)'Pe o(AI1('mia'
Population Group
Zanzibari schoolchildren
Zanzibari men
(ron Defidcnc)' ..\Demla
41%
31%
:.todcrate to Senre Anemia
57%
31%
Zanzibari nonpregnant women 19% 56%
Nepalese pregnant womenb 29010 41 %
•Iron deficiency anemia is deflned as protoporphyrin> 80 Ilmol'mol heme and hemoglobin < \ 1091. in pre£n:ult women and schoolchildrenor <J 20 gil in nonpregnant women or < 130 g1. in men. Moderate to Severe anemia is defined for all groups as hemoglobin < 90 g:1..~From reference 27.
is readily observed.Because these data are representative of their respec
tive c8nununities, we can calculate the proponion ofanemia in the population group that is attributable 10 bookwonn infection, i.e., the arnibutable fraction (Table 3). Thisis analogous to attributable risk,=9 but anemia prevalencerather than incidence is used. These propol1ions can bethought ofas the ma.ximwn fraction ofanemia that wouldbe prevented ifhook.-v.'orms were removed from the population. Reduction ofboob';orm burdens ""ill make a sizableimpact on the prevalence of iron deficiency anemia, especially moderate to Severe anemia, in these groups.
Treatment and Prevention of Hookworm Infection
Surely the eradication ofbook-worm infection is an appropriate long-term goal for cOUDtries and regions where theparasite is now endemic. However. the inability to permanently rid communities ofbook.-worm due to frequent reinfection bas contributed to a loss ofsupport for eradicationeffortS. More recently. the programmatic focus has shiftedfrom eradication to control. The intensity-dependent relatio~hip between hook"Vo'orm infection and iron deficiencymeans that reduction ofinfection intensity alone will helpcontrol iron deficiency anemia in communities. Thus, current hookworm control efforts are focused on reducinginfection load and transmission potential to reduce morbidity associated with tbe disease.S Periodic anthelminthicchemotherapy, ideally in the context ofongoing sanitationen:0rts, is the key intervention in current book\l.orm contr?l.~u:ategies.
Anthelminthic Drugs~ev~ral safe and effective antbelminthic drugs are available to treat bookworm infection. The benzimidazoles(aibendazole and mebendazole) are broad-spectruman'tbelininthics that are increasingly popular for individual
: a,r{~(eOmmunitywide treatment ofhookworm infection. They; are. -effective at substantially reducing tbe intensity andI ...... .-
. somewhat reducing tbe prevalence ofinfection with eitherli~~onn species.oQ-;3 The benzirnidazoles reduce preval~ce'and intensity ofA. lumbn'coides infections with >90%~ ~ 'i"··
Nutritinn Rp.view.<;. Vol. 55, No.6
effectiveness but are much less effective against T. trichiurainfections. usually reducing only the infection intensity.~4
The two benzimidazole drugs, albendazole andmebendazole, differ in terms ofdose and cost. The recom·mended dose of al,:>endazole is 400 mg whereasmebendazole can be t?ken as a single SOO-mg dose or as200 mg daily for 3 d.:.ys. ,S Although treatment trials indicate that mebenc:uole's 3.day dosing schedule is mostefficacious/~-'b-'7 a single-dose treatment is clearly preferable for public health control programs. A recent trial compared tbe efficacy of single doses of albendazole andmebendazole and fou:Jd mebendazole to be almost as efficacious as albeodazole in lhe treatment ofhook.-v.'orms. JI
Two other drugs may also be used to treat hookworminfections. PiTantel is etTective in reducing the prevalenceand intensity of hook'V,'orm infections.S The dosage is 10mglkg body weight for 3 days.!S The requirement for multiple doses presents logistical problems in public healthsettings. Levamisole is generally considered to be-less effective at curing hooh'orm infection. However, it doesreduce the intensity of infection as measured by eggcounts.l9 .The recommended dose is 3 mglkg body weight)S
Concern about the safety of anthelminthic drugs forthe fetus and pregnant mother has limited efforts to control hookvo'Onn infection as a cause of iron deficiency anemia in women. However, tbe World Health Organization(WHO) recently convened a meeting to address this issue, •and it was concluded that "single-dose, oral anthelminthictreatment can also be given to pregnant and lactatingwOIl?en. However. as a general rule, no drug should begiven in the first tr1rnester:''G This statement should allowfor' new avenues cf iesezrch on hoo10\'orm infection andthe importance of its centrol in women.
SanitationTransmission of boekworm infection occurs primarilythrough physical contact with soil contaminated by buID2Jl feces:1 Therefoie, 52fe disposal of human feces isessential for the eradication ofhookwonn infection. Sanitation measures induce the provision oflatrines along withtraining in their use and the appropriate treatment ofhum.ari v,'aste before~ i1J. agriculture, Sanitation control pro-
227

Table 4. Results from Controlled Trials of Anthelminthic Treatment for Hookworm Infection: Impact on Hemo
globin LevelsHookworm Prevalence %'
Targcr PopulationCountry
KenyaC
Kenya4
Kenya"Papua New Guinea'rndia~
1-5 years6-14 years15-44 years, males15-44 years, females~ 45 years
ChildrcnChildrcnChildrenAdult malesAll
Prrtrcatmcnt Posttreatment
53SS443
Impact on HemogJobinb
+ 3 giL after 6 months+ 3 giL aftcr 8 months+ 4 giL after 4 months+ 6 giL after 5 months
+ 5 giL after 6 months+ 6 giL after 6 months+ 3 giL after 6 months+2 giL aftcr 6 months+ 5 giL after 6 months
'Prc\'alence rates of [he treatment group at baseline and posrtreatr::::ll~[mpact is defUled as the pre-post difference in the ::::atmenl gr0l:? minus the pre-post dilTerence in the placebo group.'From reference 43.'From reference 44.'From reference 45.'From reference 30.SAn individuals in the deworming cial had recdved iron-foMified sa!t for 6 months prior to dewor:r:ing and Llu"oughout the dewormingtrial. From reference 46.'Population prevalence from a previous study. Fro:n .-::ference 47.
grams aim to reduce or inteInlpt transmission, prevent reinfection, and gradually reduce worm loads.
FootwearUse offootwear to protect feet from contact with contaminated soil bas been recognized as an important preventivemeasme againsthookvtOnn infection since the ]920s whenSmillie documented the association betv:een hook.-worminfection and plantation work.<I In a subsequent study inAlabama, Smillie fouod that the highest prevalence ofhookworm in the community was among schoolchildren (99%)who co~only did not wear shoes, and he strongly advo-
, . cated. footwear use as protection from hook..worm infec. tion:2This highly sensible recommendation is well ac
cepted. although no real evaluations of its effectivenesshave b~~n done. Also, debate continues on whether promotion:of footwear use is a feasible and "effective hookworm ~""O~trol measure given the difficulties inherent in anybehavior change strategy. However, this would s:em to bea relatively simple behavior change compared v.;th manyother p~blic health interventions such as condom use anddietay modification.
Efficacy Trials of Hookworm Control to ImproveIron Status
Several controlled trials have demonstrated a positive impact ofanrheIminthic treatment on hemoglobin levels (Table4). Other" trials that have Dot fouod a positive impact onhemoglobin concentration following dewonning have notemployed a control group" or have had follow-up periodsof less than 8 weeks.~9.10 These controlled trials show tliat
228
deworming can have a ?ositi\"e impact on hemoglobin concentration. It is also appareot that hook.....,,·orm does notneed to be cured in all individuals to benefit iron status. Inthe Kenyan studies,'3-<1 a positive impact on hemoglobinwas observed even though rhe prevalence of bookl\'onninfection was decreased at most by around half. In each ofthese studies the intensiry of infection was significantlyreduced among those individuals who remained infected.The results of the trials in Papua New Guinea and India areparticularly impressive because the subjects were also provided with increased amouots of dietary iron. In PapuaNew Guinea3{t the men were newly incarcerated prisonersprovided with a nutritionally adequate prison diet, aDd allparticipants in the Indian trial were provided iron·fortifiedsalt for 6 months prior to deworming and throughout thedeworming trial.~
Effectiveness of Hookworm Control Programs toImprove Iron Status
Several regional hookworm control programs have beenevaluated for their impact on hoo!<",orm infections;>J·ll.~2
however, evaluations ofprogram effectiveness to improveiron status have been lacking. Until it has been demonstrated that large-scale 2nrhelroinrhic programs actuallydo improve the iron status ofcommunities, it will be difficult to gamer support for rheir integration into strategiesto control iron deficiency.
We recently completed an evaluation of the Zanzibars<:hool-based dewonning program, which is aimed at allprimary school children in grades 1-5. The prevalence ofhookv.:orm infection in this population and age group is
Nutrition Reviews, Vol. 55, NO.6

more than 90%.:~ So thaI the !\1inistry ofHC3.llh of lanzibar could obtain a valid estimate of pr0gr3m impact onchildrcn's nutritional status, the pro£r.lm was phased induring its first ycar. In this way, children in schools receiving the progmI1l could bc compared with child."'Cn in schoolsnot yct recciving thc program. By the second year of theprogram, all schools received the full program regimcn.
The program was implemented by the l.mzibar ministries ofHealth Jnd Education, and the evalu:ltion was implemented by the Pcmba Island Helminth Control Team, !\1alana Control Team, and the Nutrition Unit oft.ie ~1inistry
of Health. Out of 71 schools on Pcmba Isla.'ld, 12 wererandomly selected for the evaluation. From these schools,3605 children in grades 1-4 participated io tbe baselinesurvey, and 92% ofthese children were measured again attbe 12-month follow-up survey. Of the J2 evaluationschools,4 received deworming 3times per ye:lI, 4 receiveddeworming 2 times per year, and 4 received DO dewonningprogram. Deworming consistcd ofa single 500 rng dose ofgeneric mebendazole. The cost ofmis drug was CSSO.027per dose.
In its first year, neither twice-yearly nor thrice-yearlydewonniog had a significant impact 00 aVer2.ge hemoglobin concentrations.!) However, thrice"yearly de wormingreduced the incidence ofsevere anemia during the l-yearperiod by approximately one half. Dewormiog also improved children's iron status as measured by serum ferritinand erythroC)1e protoporphyrin. As expected from the linear relationship between hoo].,:wonn infection intensity andintestinal blood loss, children with heavier boob'onn infections at baseline benefited most from the intervention.'. As these results demonstrate, even in populations
where hoob:vv'onns are highly endemic, the short-term impact ofdeworming alone on iron deficiency anemia ",ill bemodest. Ifooe thinks ofa person's iron status as a bucket
, that needs filling, supplementation is like pouring iron intothe bucket, food fortification is like trickling iroo into thebucket, and dewornUng is like partially plugging a hole inthe bucket The impact from deworming alone might becompared to that ofa food fortification program, becausetheimpact is incremental and typically small in a i-yeartime frame. However, these early results from the Zanzibarprogram coupled with the pattern of attributable risks ofanemia in Table 3 suggest that dewonning will have thegrea~est impact on the left tail of the hemoglobin distribution.
Certainly dewonning alone will not solve the problem.The control ofiron deficiency anemia in settings like Zanzibar wilt require integration ofmultiple intet>'en:ions. However, dewonning is low cost, feasible, and bighly desiredby communities, and it does improve children's iron status. Dewonning will be ooe essential component ofan effective iron deficiency cootrol progra.m for Zarrzibar andfor either communities where hookv.onns are an importantetiology afiron deficiency,
Recommended Approaches to HookwormControlWe want to end by reviewing the two current policy recommendations made by WHO with regard to dewonningand suggesting ways that they can be further advanced.The first addresses anthelminthic treatment in schoolhealth programs,l9 and Slates: "Trcatment without priorindividual scrccning of the whole population is recom·mended where surveys ofschool-age childrcn indicate theprevalence of intestinal helminths or schistosome infection exceeds 50%:' The staled objective Oflhis policy recommendation is to prevent adverse effects ofhelmimh infections on health, gO\\1h, and school perfonnance ofchi 1dreD. To date, the pre\'ention ofanemia in schoolchildrenhas Dot often been an explicit objective of school-baseddeworming programs. for those of us concerned with thecontrol ofiron deficie:1cy, it would be helpful to refine thisgeoeral recommend::tion to address the prevalence ofhookwonn for which trea~eDt of the whole population is likelyto bring about some impact 00 the prevalence of iron deficiency in schoolchildren. It would also be helpful to havesome estimate oftbe benefit 10 children"s iron status thatcan be expected in a given time frame, One ofour currentcollaborative research objectives is to begin to addressthese policy questions with the data from Zanzibar.
More recently, a recommendation was made to address the problem of hook:v.onns in girls and women..lOThis recommendation reads: "Since hookwonn infectionscontribute to iron-deficiency anaemia, it is recommendedthat, in areas where these infections are endemic (prevalence > 2G-30%) and where anaemia is preval~t, hookworm control ... be included in strategies designed to improve the health, development and outritional status ofgirls and women." It goes on to state that several anthelminthic drugs may be safely given to pregnant womenbeyond their first trimester. This policy stalement, in contrast to the one for school-age children, was specificallymotivated by the role of book-wonns in causing anemia.The expectation is that anthelminthic treatment, especiallycombined with supplemental iron, will help prevent irondeficiency anemia and its consequences during pregnancy.
Sri Lanka has made dewonning, in addition to ironfolate supplementation, a routine part of its public healthantenatal care progrzm. In the program, pregnant womenreceive a single dose of mebendazole in the second trimester ofpregnancy. The mebendazole is produced locally inSri Lanka for less than U5S0.03 per dose. Asingle evaluation of this intervention has been carried out in 195 pregnant tea plantation workers.~~ The plantation commW1itywas cbosen for tbe study because these women are atbighest risk for hookwonn infection. Women received inten'enlious as they were delivered by the public healthservice; the study investigators did not control the interventions in any way. Thus, it happened that some womenreceived iron-folate tablets and some did not, but all ofthe
229/O(

women who Tt:cci\'cd mct>cndazolc also rt"ccivcd iron· folatetablets. Receiving the combination of mcbendazolc withiron-folate supplementation was more effective in improving women's iron status during prcgnanC'y than n:ceivingiron-folate supplemental ion alone.
This is a small study, but the results suggest that antenatal anthelminthic therapy could play an imporunt rolein prev~nting iron deficiency in women of reproductiveage. Unfortunately, hoo\....woml infections were not assessedin these women, so this impact cannot be related to thebaseline prevalence and intensity ofinfectioD in the population. Additional research is needed to refine the recom·mendation with regard to the endemicii)' ofhook.·wonn infection in populations ofwomen and whether a single treatment is the appropriate regimen in most circumsunces.
From a nutrition perspective, it is noteworthy wt thereare no recommendations for the use ofanthelminthic therapies for prescbool children, in whom the problem of irondeficiency is particularly prevalent and scvere. Ii anthelminthic therapy can improve the iron status ofa 7'~'ear-oldscboolchild, can it also benefit a 5-year-old or a 3-yearold? The potential adverse effects ofAscaris inf~tion ongrov.th and vitamin A status have been the foc~ of thediscussion ofdeworming in this age group. But wbe7e hookworm infection is endemic, it would be very lLc;eful to clarifywhether hookworms are an irnport.mt etiology ofiran deficiency in young children and an additional motivation forpreschool deworming programs.
Theoretical calculations suggest that bookworms couldcontribute to iron deficiency in prescboolers. A.Jthoughhookworm infection intensities are light in young childrencompared with school-age children and women, a smallblood loss in a small child is important. A light infection(1000 epg or 40 worms) of N. americanus causes a dailyblood loss of around 0.55 mg,3 equal to the median ironrequirement of0.56 mg for children 2--6 years old.=Ifchildren in many environments cannot meet this normal requirement, they certainly cannot offset a blood loss thatdoubles their requirement for absorbed iron. In many coun·tries where targeted fortification efforts are not yet feasible, no interventions exist to address the problem ofirondeficiency in young children. \\'here hookv,:onns are endemic, anthelminthic therapy may be a feasible intervention.
In conclusion, it is import2nt to reiterate that hockwonns are not the only helminth and that booh.orms mayinhibit children's grov,"th and other aspects of development as well as induce iron deficiency. Helminth controlprograms must be designed to address a broader framework of health concerns than only iron deficiency. Yet atthis moment, while there is a global commitment to tbecontrol of iron deficiency and a particular enthusiasm fordewonniog as a public health intervention, it is timely fornutritionists to clarify the importance ofhooJ<v,·orms as anetiology ofimn deficiency in different population contexts
230
and to evalua[c the r~'1c ofanthelminthic lhcrapy in Str:llc·gies to control ir~lD deficiency.
Ackno.....ledgment. Our Waml thanks to Lorenzo SavioH.Schistosomiasis and Intcstinal Parasiles Unit, Division ofControl ofTropical Diseases, WHO, whose scientilie excellence and dedication to the development of effectivehook~'orm contra! pwg3J1lS have pro\'ided inspiration forthis work, and whose collaboration enabled it.
1. Food and Ag~;cuiture Organization 01 the United Na·tions/World Hea:,!') Organiza:ion (FAO,vv'HO). Preventing speCIfic r.'IiC~O:1utr;ent deficiencies: major issuesfor nutrition stra:egies, Theme paper No 6. Geneva:WHO,1992
2. Warren KS. 3ur1cy DAp, Anderson RM. el af. Helminth infection. In: Jamison DT, Mosley WH, MeashamAR. Bo:ad.:~a JL, eCs. Disease control priorities indeveloping cO:.Jn:(es. New Yo~k: Oxford UniversityPress. 1993:131~O
3. Slephenson LS. l:7'pact of he:;';'1jnth in:ectior.s on human nutrition. Ne,v Yo~k Taylor & Francis, 1987
4. Banwell JG, Sc~ad GA. Hookwor;;'l. ClinicsGastroen:efol i 9,8:7: 129-55
5. Gilles HM. Se~ec::ve p~;;:-:a:y hea::h care: sira:eg:esfor control 01 c:sease in the developing world. XVII.Hookworm ir;~ec:;on and anemia. Rev Infect Dis1985;7:111-3
Ei. Bundy DAP. Is ,he hookworm just anothergeohelminlh? In: Schad GA, Warren KS, ecs. Hookworm disease: cur;e:il status a:id new directions. NewYork: Taylor & Francis. 1990;147-M
7. Fleming AF. Iron deficiency j" the :topics. CrinHaematol 1982;11 :365-88
a Gilles HM, \Va:so:i Williams EJ, Ball PAJ. Hookworminfection and ancemia: an epidemiological, clinical,and laborato~ sti.lcy. 0 J M 1954:33:1-24
9. Schad GA, Anderso" RM. Predis;>osilion 10 hookworminfection in hU:71ans. Science 19a5:228:1537~0
10. Upatham ES, Viyanant V, BrockeJman WY, et al. Pre·disposition 10 reinfection by intestinal helminths afterchemotherapy in south Thailand. I'nt J Parasito!1992;22:801--3
11. Bradley M, Chandr'....ana SK. Age·dependency in predisposition to hookY/or;;'l infection in the Burma Valley area of Zii7',babwe. Trans R Soc Trop Med Hyg1990;84:826-8
12. HasweU-Elkins t.:lR, Anderson RM. Evidence for predisposition in humans 10 infection with Ascaris, hookworm, Enterobius and Trichuris in a south Indian fish
. iog community. Parasitology 1987;95:323-3713. Roche M, Layrisse Iii. The natt;re and causes of 'hook
worm anemia: Am J Trop Med Hyg 1966;15:1031100
14. Kalkofen UP. Atlac!:;:-:enl and feeding behavior ofAncylostoma caninum. Z Parasi:enkunde 1970;33:339-54
15. Kalkofen UP.lntes:;nal ~rC.uma resulting from feedingactivities of Ancylostoma caninum. Am J Trop MedHyg lS74:23:10~&-53
16. Farid Z. Nicho!s JH, Bassily S, Schulert AR. Bloodloss in pure Ancylostoma duodena-Ie infection in Egyp
. tian farmers. Am J Trop Iloed Hyg 1965;14:375--817. Martinez-Torres C, ajeca A, P,oche 'A, Layrisse tA.
NUirition Revie"lls, Vel. 55, No.6
Hookworm inlection and intestinal b!ood loss. TransR Soc Trap Med Hyg 1967:61 :373-83
18. Miller TA. Hookworm infection in r.:ail. ACII Parasitol, 978:17:315-84
19. Areekul S, Devakul K, Viral/an C, Harir:asuta C. Stud·ies on blood loss, iron absorption and i~on reabsorption in hookworm patients in Thailand. SoutheastAsian J Trop Med Public Health 1970;1 :51S-23
20. Stoltzfus RJ, Albonico M, Chwaya HM, et al.HemoQuant determinaiion of hookworm·relatedblood loss and its role in iron deliciency in Africanchildren. Am J Trop Med Hyg 1996:55:399-404
21. Schwartz S, Dahl J, Ellefson M, Ahlquist D. The"HemoOuant" lest: a specilic 3:1d q~at';:itatil/e determination 01 heme (hemoglobin) in ~eces and othermaterials. Glin Chem 1983:29:2051-7
22. FAO.WHO. Requirements of v::a:T:::1 A. iron, folate,and 812. FAO Food and Nutrition Seres:--Jo 23. Rome:FAO.1958
23. layrisse M, Roche M. The re1at:or:s:-:.:) :-=:ween ane·mia and r,ookworm infection: res:..:l:s 01 s:..:r,'eys of rural VenezL:elan population. Am J Hyg 1~54:79:27S301
24, Carr HP. O:servations upon 1"ockwO~:-:l c:sease inMexico. A:n J Hyg 1926:6(Ju!y s:';OO:»~2-51
25. Hill AR. Andrews J. The relatio:1 01 :-,0:;:':',\'0,:':1 b~Hden
to physical staws in Georgia. A~ J j~ojJ t/.ed ~yg
1942:22:49S-S0626. Stoll NR, Tseng HW. The severily 01 ~oo~worm dis
ease in a Chinese group, as tes:ed 'Jy r.emoglobinreadings fer anemia and egg counts for :~e degree ofinfestation. Am J Hyg 1925;5:535-52
27. Dreyfuss Ml, Shrestha JB, Kha:ry SK, at al. Relationship between iron status and helminth jr,fec:ion amongpregnant women in Nepal [Abstract]. FASE8 J1996;10:A730
28. S10ltzfus RJ, Chwaya HM, Albonico 1,.\, at al. Epidemi'. ology of iron deficiency anemia in Zar.zibari school
children: the importance of hoolw;'or..r:s. Am J ClinNutr 1997;54:153-9
29. Kahn HA. An introduction to epicemio:ogic methods.New York: Oxford Universi:y Press, 1SS3
30. Shield JM. Vaterlaws AL. Kimber RJ, et al. The relationship of hookworm infection, anae:Tlia and iron status in a Papua New Guinea highland p0j)v!ation andthe response to treatment with iren and i7,abendazole.P N G Med J 1981 ;24:1 S-34
31. Xia 2, Yao SY, Su Yl, et al. Studies 0:1 the control ofhookworm and other soil·transmitted helminthiasesin farmers in Zhejiang Province, China. SoutheastAsian J Trop Med Public Health 1991 ;22:618-22
32. Hanjeet K, Mathias RG. The efficacy of treatment withalbendazc:e. Acta Trop 1991;50:111-4
33, Islam AF, Sadeque M, BisNas K, et a1. Incidence ofhelminthic infections and comparative sludy ofpyranteJ pamoate with levamiscie and mebendazolein hospital patients at Barisal, Bangladesh.Bangladesh Med Res Counc Bull 1S24;i O:2S-36
34. Smith IF, Taiwo 0, Golden MH. Plant p~otein rehabilitation diets and iron supplementation of theprotein-energy malnourished child. Eur J Clin Nutr1989 ;43:763-8
35. Pawlowski ZS, Schad GA. Ston GJ. Hookworm infec·tion and anaemia: approaches 10 ;xever,tion and control. Geneva: World Hea!th Organ:za:io:1, 1891
36. Kilpatrick ME, Trabolsi B, Farid Z. LeVaml$Ole com·pared to mebenda~ole in the treatment 01 Ancylos·toma duodena!e in Egypt. Trans A Soc Trap Med H~'g
1981 ;75:578-937. Keystone JS, r..1u~doch JK. Mebendazole. Ann Intern
Med 1979;91 :582-638. Albonico M, SmIth PG, Hall A, et al. A randomised
controlled trial comparing mebendazole andalbendazole acainst Ascaris. Trict1uris, and the hookworms. Trans RSec Trop Med Hyg 1994:88:585-9
39. WHO. Health of sc~ool children: lreatme;1t 01 intesti·nal helminths and schistosomiasis. WHO:COS,'IPIICTD/92.1. Ge~,eva: WHO, 1992
40. WHO. Repo~ of ;:-,e VlHO informal consultation onhookworm ir.'ec::on a;1d anaemia in girlS arod women.WHo.'CDS::PI 95.1, Geneva: WHO, 1995
41. Cairncrcss S. Sani:alion and the control 01 hookwOr:':1disease. In: Sc~ad GPo.. Warren KS, ecs. Hookworr:ldisease: curre:-,t s:a:vs and new direc:ior.s. New York:Taylor & Fra~c's, i ee0:304-17
42. Smillie WG. Co....,::ol of hook·.... o~,":'1 disease in southAlabama. So;;:~ 1.~ed J 1924;17:494-9
43. Stephenson LS. K;~o:i SN, la:~ar':"\ MC, et al. Singledose metrifo:-a:e or ;::r2ziQua~tel "ea:~ent i:'l Kenya.,children. l. E:':c:s 0:1 $c."listoso;,;a ,"laer.:atobium,hOOkworm, re:7'og'oojn levels, sp:enor.:egaiy. ar:dhepato:T:ega'y. A:-:l J ,rop r.~ed ~yg 1989;41 :43~4
44. Stephenson LS. la:ham MC, Kurz KM. et at Re~a·
tionships of $:;,";,'s:::;SOo71a her..-:atobium, hookwormand malarial i"~ec:ior.s and ;r;etrifona:e treatment :0hemoglobin level in Kenyan school children. Am JTrop Med Hyg 1965;34:51 S-28
45. Stephenson lS, La:har.1 MC, Adams EJ. et al. Physical fitness, growth and apjJeti:e of Kenyan schoolboys with hookworm, Tricburis irichiura and Ascaris/umbricoides infections are improved four months at·ter a single case of alber:cazole..~ Nuir1993;123:1036-46
46. Report of the Wor~ing Group on Fortifica:ion of Saltwith Iron. Use of common salt fortified with iron in thecontrol and prevention of aner.;ia-a collaborativestudy. Am J Crin Nutr 1982:35:1442-51
47. Chatterjea JB. Some aspects of nutritional anaemiasin India. Proc Nutr Soc lndia 1967;2:67-BO
48. Chwang lC, Soemar,tri AG, Polli~ E. Iron supplementation and physical growth of rural Indonesian chil·dren. Am J Clin Nutr 1988;47:495-501
49. l\wosu ABC. Hu;r;an ;,;eona!al infections with hookworms in an er,:::e",ic area of southern Nigeria: a possible transmammary route. Trop Geogr Med1981;33:105-11
50. Stephenson LS, La'har.i lAC, Kinoti SN, et al. Improvements in phys;cal ~;:r:ess of Keryan schooiboys infected with hoo;';wor:n, Trichuris :richiura and Ascarislumbricoides lollo'o'ling a sing:e ccse of albendazoJe.Trans R Soc Trop Med Hyg 19S0;84:277-B2
51. Bradley lA, Char,ciwa:-:3 SK, Bunc'y oAP. The epicemiology and coraol of hookworm infection in theBurma Valley a~ea cf Zimbabwe. Trans R Soc TropMed Hyg 1993;87:145-7
52. Arfaa F, Sahba GH, FarahmanCic.n I, Jalali H. Evaluation of the eliect of cilfererot methods of control ofsoil-transmil:ed heir'nir,ths in Khuzestan, southwestIran. Am J Tre;) Il.ed Hyg 1977;26:230-3
53. Stoltzfus RJ, A:~o,-::co lA, Chwaya HI.1, et al. Impact of
231

school-based deworming program on iron stal:.JS [Abstract]. FASEB J 1996;1O:A730
54. Atukorala TMS, de Silva LOR. Oechering WHJC. etar. Evaluation of effectiveness of iron·folate supple·
232
mentation and anthelminthic therapy against anemiain pregnancy-;-a study in the plantation sector of SriLanka. Am J Crin Nut! 1994;60:286-92
Nutrition Reviews, Vol. 55, No. il~

Epidemiology of iron deficiency anemia in Zanzibarischoolchildren: the importance of hookworms1-3
Rebecca J Stoltzfus, Hababu M Chwaya, James M Tielsch, Kerry J Schulze, Marco Albonico, andLorenzo Savioli
ABSTRACT Anemia is estimated to affect one-half ofschool-age children in developing countries. The school years arean opportune time to intervene, and interventions must be based onsound epidemiologic understanding of the problem in this agegroup, We report on the distribution of iron deficiency and anemiaacross age, sex, anthropometric indexes, and parasitic infections ina representative sample of 3595 schoolchildren from Pemba Island, Zanzibar. Iron status was assessed by hemoglobin, erythrocyte protoporphyrin (EP), and serum ferritin concentrations from avenous blood sample. Overall, 62.3% of children were anemic(hemoglobin < 110 gIL), and 82.7% of anemia was associatedwith iron deficiency. The overall prevalence of iron-deficienterythropoiesis (EP > 90 MmoUmol heme) was 48.5%, and theprevalence of exhausted iron stores (serum ferritin < 12 MgIL) was41.3%. [n bivariate analyses. iron status was slightly better in girlsthan in boys, and was better in children aged 7-11 y than in thoseolder or younger. Hemoglobin but not EP or serum ferritin concentrations were lower in stunted children. Infection with malaria,Trichuris trichiura, Ascaris lumbricoides, and hookworms were allassociated with worse iron status; the association with hookwormswas strongest by far. In multivariate analyses, hookworm infectionintensity was the strongest explanatory variable for hemoglobin,EP, and serum ferritin. Sex, malarial parasitemia, A. lumhricoidesinfection, and stunting were also retained in the multivariate modelfor hemoglobin. Twenty-five percent of all anemia, 35% of irondeficiency anemia, and 73% of severe anemia were attributable tohookworm infection; < 10% of anemia was attributable to A.lumbricoides, malaria infection. or stunting. We conclude tharanthelminthic therapy is an essential component of anemia controlin schoolchildren in whom hookworms are endemic, and should becomplemented with school-based iron supplementation. Am JClin Nutr 1997;65:153-9.
KEY WORDS Humans, iron deficiency, anemia, schoolchildren, geohelminths, hookwonns, malaria, schistosomiasis,ascariasis, trichuriasis
INTRODUCTION
Iron deficiency affects more people in the world than anyother fonn of malnutrition, and its control is a global priority inpublic health. Iron deficiency anemia results from a variety ofcauses, including inadequate iron intake, high physiologic demands in early childhood and pregnancy, and iron losses fromparasitic infections. The relative importance of these causes,
and thus the appropriate strategies for prevention of iron deficiency anemia, differs among populations and age groups.
Iron deficiency anemia is most prevalent and severe in youngchildren and women of reproductive age (1). As a result, thesegroups have been the focus of most epidemiologic investigations of the problem and its causes. However, iron deficiencyanemia is also common among school-age children. In developing regions of the world, the prevalence of anemia in 5-l2-yaids is estimated to be 46%, with the highest rates found inAfrica (49%) and South Asia (50%) (2). The school-age yearsare an opportune time to address this problem for severalreasons. Iron deficiency impairs children's cognitive abilities,and interventions to prevent and correct iron deficiency mayenhance children's learning potential in school (3). Improvingthe iron status of schoolchildren will also increase their fitnessand work capacity (4), and improvements in girls' iron statusduring the school-age years may help to prevent anemia duringtheir reproductive years. Finally, the school setting offers anideal distribution system for public health interventions ofmany types (5), including health education, iron supplementation, and treatment or prevention of parasitic infections.
To develop and target effective interventions to prevent irondeficiency anemia in schOOl-age children, a sound epidemiologic understanding of the problem is needed. As a first step toevaluate a school-based dewonning program in Zanzibar, weconducted a baseline survey of iron deficiency anemia and itsdetenninants in schoolchildren. Our objective in this paper-wasto describe the distribution of iron deficiency and anemia inZanzibari schoolchildren by age and sex, anthropometric indicators, and parasitic infections. We then used these findings to
I From the Center for Human Nutrition and WHO Collaborating Centerfor Research on Intestinal Parasites and Human Nutrition, Department ofInternational Health. The Johns Hopkins School of Public Health, Balti·more; the Ministry of Health, Zanzibar. United Republic of Tanzania; andthe Schistosomiasis and Intestinal Parasites Unit. Division of Control ofTropical Diseases. World Health Organization, Geneva.
2 Supported by cooperative agreement DAN-5116-1-00-8051-00 between The Johns Hopkins University and the Office of Health and Nutrition. United States Agency for International Development.
3 Address reprint requests to RJ Stoltzfus, Center for Human Nutrition.Department of International Health. The Johns Hopkins School of PublicHealth, 615 North Wolfe Street. Baltimore, MD 21205. E·mail:[email protected],EDU.
Received April 29. 1996.Accepted for publication September 6. 1996.
Am J Clin Nutr 1997;65:153-9. Printed in USA. © 1997 American Society for Clinical Nutrition
The American Society for Clinical Nutrition Inc. does not endorse any commercial enterprise.
153

154 STOLTZFUS ET AL
discuss the most promising strategies for control of iron deficiency anemia in schoolchildren of cOa$tal east Africa.
SUBJECTS AND METHODS
Study population
The study was conducted on Pemba Island, the smaller of thetwo islands of Zanzibar, just off the east coast of mainlandTanzania. The population is predominantly rural, with agricultural activities devoted to subsistance crops and cloves, anexported cash crop. Typical of coastal East Africa, PembaIsland is characterized by intense transmission of Plasmodiumfalciparum malaria, Schistosoma haematobium, and geohelminths. Both species of hookwonns (Necator americanus andAncylostoma duodenale) are endemic, with N. americanuspredominating (6). The iron bioavailability of the Pembian dietis low. The primary staple food is cassava, with rice being moredesired but less affordable. These foods are usually eaten withvegetable sauces and small fish. Meat is always a luxury item,and there are seasonal shortages of vegetables and fish.
The study population comprised first- through fourth-gradeschoolchildren of Pemba Island, Zanzibar. This survey wasconducted between March and May 1994, and was reviewedand approved by the institutional review boards of The JohnsHopkins University, the Ministry of Health of Zanzibar, andthe World Health Organization. To fonn the study sample, werandomly selected 12 primary schools from the 72 schools onPemba Island. From these schools, 76 morning classes ofstandards 1-4 were invited to participate in the survey. A totalof 3605 children were enrolled in the survey, constituting 90%ofchildren registered in those classes and =11 % of the totalschoolchild population on Pemba Island. Data were collectedin the school classrooms by specially trained local staff of theMinistry of Health. Age and sex data were obtained from 3595children (99.7% of the sample), and these children were used inthe present analyses.
Assessment of nutrition and health status
Children's weight was measured to the nearest 0.1 kg with abattery-powered digital scale (Seca, Inc, Columbia, MD).Height was measured to the nearest millimeter with a woodenstadiometer (Shorr Productions, Inc, Olney, MD). Age wascalculated from the birth date on school records, which arebased on birth certificates. When the school had no record ofage, the child's self-reported age was used.
Iron status and anemia were assessed by hemoglobin, erythrocyte protoporphyrin (EP), and serum ferritin (SF) concentrations. Assessing the iron status of malaria-endemic populationshas been a subject of controversy; however, we found thatthese indicators assessed iron status reliably in this population(7). Blood samples were collected by venipuncture from 100%of children surveyed. The hemoglobin concentration was determined by using the HemoCue hemoglobinometer(HemoCue, AB, Angelhom, Sweden), and the EP concentration was measured with a hematofluorometer (Aviv Biomedical Inc, Lakewood, NJ). An aliquot of blood was centrifuged at1000 X g for 20 min at room temperature and serum wascollected. Sera were stored at -10 °C for :$ 10 wk, transportedon liquid nitrogen to Baltimore, and stored at -70°C for:::; 6mo. SF was determined by using a fluorescence-linked immu-
noassay (DELFIA System by Wallac, Inc, Gaithersburg, MD)on 3309 serum samples, 91.8% of the total enrollment. Missingdata for SF were the result of losses of samples from mishandling or mislabeling in transport to Baltimore, or the result oflaboratory error.
Thick and thin blood smears were fixed and stained withGiemsa, and malaria parasites were counted against leukocytes.Typically, 200 leukocytes were counted; if < 10 parasites wereseen, the microscopist continued counting up to 500 leukocytes. Parasite counts were converted to parasite densities onthe basis of 8 X 10⁹ leukocyteslL blood (8). Malaria specieswere identified from the thin smear. All infections were P.falciparum; in < 5% of slides, P. malariae was also identified.A random 10% subsample of slides were reread by the MalariaTeam leader. Agreement between readers was excellent for thepresense of malaria parasitemia (kappa = 0.93, 95% CI: 0.89,0.98), and parasite density measures were also highly reliablewith an intraclass correlation of 0.85.
For the assessment of helminth infections, containers weredistributed to each class and the children were asked to bring asample of their feces to school the next day. More than 95% ofchildren surveyed returned a fecal sample. These samples werestained the same day and examined within I h of staining byusing the Kato-Katz method (9). Hookworm, Trichuris trichiura, and Ascaris lumbricoides eggs were counted. If> 10 000 eggs per gram feces (epg) were found for any helminth, the sample was diluted by using a modified Stoll technique (10) and was reexamined. A random 10% subsample offecal smears was reexamined by the most skilled technician forquality control. Intraclass correlations between staff and quality-control readings were 0.88 for A. lumbricoides epg, 0.79 forT. trichiura epg, and 0.89 for hookwonn epg.
As an indicator of S. haematobium infection, urine sampleswere collected on the day of the survey to test for microhematuria with Hemastix test strips (Ames Laboratories, Elkhart,IN). This procedure screens for urinary schistosomiasis with69% sensitivity and 89% specificity (11).
Data analysis
Stunting was defined as a height-far-age Z score < -2.These Z scores were calculated by using EpiInfo (Centers forDisease Control and Prevention, Atlanta). An appropriate indicator for wasting in primary school-aged children is not welldefined. For children aged> 10 y, the 5th centile of body massindex [BMf, weight (kg)/height squared (m2
)] is recommendedwhereas for children aged 5-10 y, there is no accepted recommendation (12). We used a BMI less than the 5th ceutileaccording to the sex- and race-specific tables of Must et al (13,14) to define wasting. The relation of iron deficiency andanemia to stunting and wasting was examined separately forchildren younger than and older than lay, to separate prepubertal and pubertal growth patterns.
Anemia was defined as a hemoglobin value < 110 gIL. Thisanemia cutoff value is lower than the WHO-recommendedcutoff for this age group, but a race-specific anemia criterion(10 gIL lower for blacks) optimizes the screening peIfonnanceof this indicator to detect iron deficiency (15). Distributions ofEP and SF were skewed to high values so geometric means arepresented. Iron deficiency anemia was defined as anemia witha SF concentration < 18 p.glL or an EP concentration> 90

IRON DEFICIENCY IN ZANZIBARI SCHOOLCHILDREN 155
/-LmoVmol heme. Severe anemia was defined as a hemoglobinvalue < 70 gIL.
The categorizations of age and parasitic infections in Tables1-3 were based on relations observed in exploratory analysesof those variables and iron-status indicators. For example,malaria parasitemia was considered as a dichotomous variablebecause there was no evidence of an empirical relation ofparasite density to the iron-status indicators. Because hookworm and T. trichiura egg counts were linearly related toiron-status indicators, increasing categories of 2000 epg wereused in subsequent analyses (Table 2).
Means of continuous variables were compared by usingStudent's t test, proportions were compared by using the chisquare test, and linear trends in mean values and proportionswere tested by linear regression. Multivariate-linear-regressionmodels of hemoglobin. EP, and SF were built in a forward,stepwise fashion. Variables were entered into the model in theorder of their strength of association in the bivariate tables, andthose that did not remain significant at a probability level of 5%were not retained. Interaction terms were considered for age,but none were retained using a probability level of 15% ascriterion for significance.
To assess which risk factors were associated with the greatest proportion of the anemia in this population, we estimatedthe attributable fraction of anemia for each risk factor. This isanalogous to attributable risk, except that, anemia prevalencewas used in place of incidence. The equation for attributablerisk and its variance were taken from Kahn (16).
Data were entered by using EpiInfo software and weremanaged and analyzed by using SYSTAT statistical software(SYSTAT Inc, Evanston, IL).
RESULTS
The sample comprised approximately equal numbers ofboysand girls, mostly between the ages of 7 and 13 y (Table 4).Parasitic infections were extremely prevalent. The prevalences
TABLE 1£ron-status indicators by sex and age
of hookworm, T. trichiura, andA.lumbricoides infections were94%, 96%, and 72%, respectively, and 99% of children wereinfected with at least one of these helminths. Of the 3361children with complete parasitologic data, only one child wasnegative for all three helminths, malaria, and hematuria.Growth retardation was also highly prevalent.
The iron status of the children was very poor (Table 1).Overall, 62.3% of children were anemic and 51.5% had irondeficiency anemia by our definition. The overall prevalence ofiron-deficient erythropoiesis (EP > 90 j.LmoVmol heme) was59.7%, and the prevalence of exhausted iron stores (SF < 12JLgIL) was 41.3%.
By all indicators, the iron status of boys was slightly worsethan that of girls (Table 1). The EP and SF values supported thefact that iron status was best in 7-10-y olds, slightly worse inchildren 11 y and older, and notably the worst in the smallgroup of children younger than 7 y. In contrast, hemoglobinconcentration and anemia prevalence improved with age. withno trend toward worsening values in children 11 y and older.
Hemoglobin concentration and anemia prevalence were significantly worse in stunted children, in both children youngerthan and older than to y. Overall. the hemoglobin concentration (x :t SD) was 102 :t 16 gIL in children with a height-forage Z score < -2, and 105 :t 16 gIL in children with Zscores =:: -2 (P < 0.001). The prevalences of anemia and irondeficiency anemia were also higher in stunted children than innonstunted children (66.3% compared with 58.6% for anemia,54.7% compared with 48.6% for iron deficiency anemia; P <0.001 for both comparisons). However, iron status as assessedby EP and SF was not worse in stunted children. Wasting wasnot associated with iron status by any indicator.
By far the most dramatic relation to iron status was that ofhookworm infection (Table 2). This intensity-dependent relation was strongly apparent in every indicator. For example,hemoglobin concentration decreased by =50 gIL for each 2000hookworm epg. Particularly noteworthy is the relation of hookworm infection to severe anemia. Among children with 2 6000
SexBoys (n = (864)Girls (Il = (731)
Age (y)< 7 (Il = 46)7.0-8.9 (n = 734)9.0-10.9 (Il = 1585)11.0-12.9 (Il = 935)2: 13 (n = 295)
All children (n = 3595)
Hemoglobin
giL
t03:!:: 16",,5
106:!: 15
92:!: Ie103:!: 16104:!: 16104:!: 16t05:!: 16
104'" 16
Protoporphyrin
JJ.1Tlol/mal heme
99 (56, 174)5.695 (55, (63)
128 (75, 217f94 (54, 161)94 (54, (64)
tOO (58. 174)7104 (61.178/97 (56, 166)
Serum ferritin
iJ-glL
13.4 (6.9, 25.W,614.8 (7,5, 29.0)
11.7 (6.1. 22.5f14,5 (7.4,28.4)14.4 (7.3, 28.3)13.7 (7.0, 26.9)712.7 (6.6, 24.6)714.0 (7.2, 27.3)
Anemia l Severe anemia'?Iron deficiency
anemia]
% % %-
65.65 4.15 55.75
58.8 2.8 47.2
73.9 19.67 67.463.0 4.4 50.862.8 2.6 50.6
61.7 3.5 53.357.6 2.7 50,2
62.3 3.5 51.5
I Hemoglobin < 110 gIL.2 Hemoglobin < 70 gIL.] Anemia with protoporphyrin> 90 JLmoUmol heme or ferritin < 18 JLg/L.4 X :': SO.
S Significantly different from girls. P < 0.05.6 Geometric mean (-1 SD, + 1 SD).7 Significantly different from children aged 7.0-10.9 y, P < 0.05 (chi-square test).
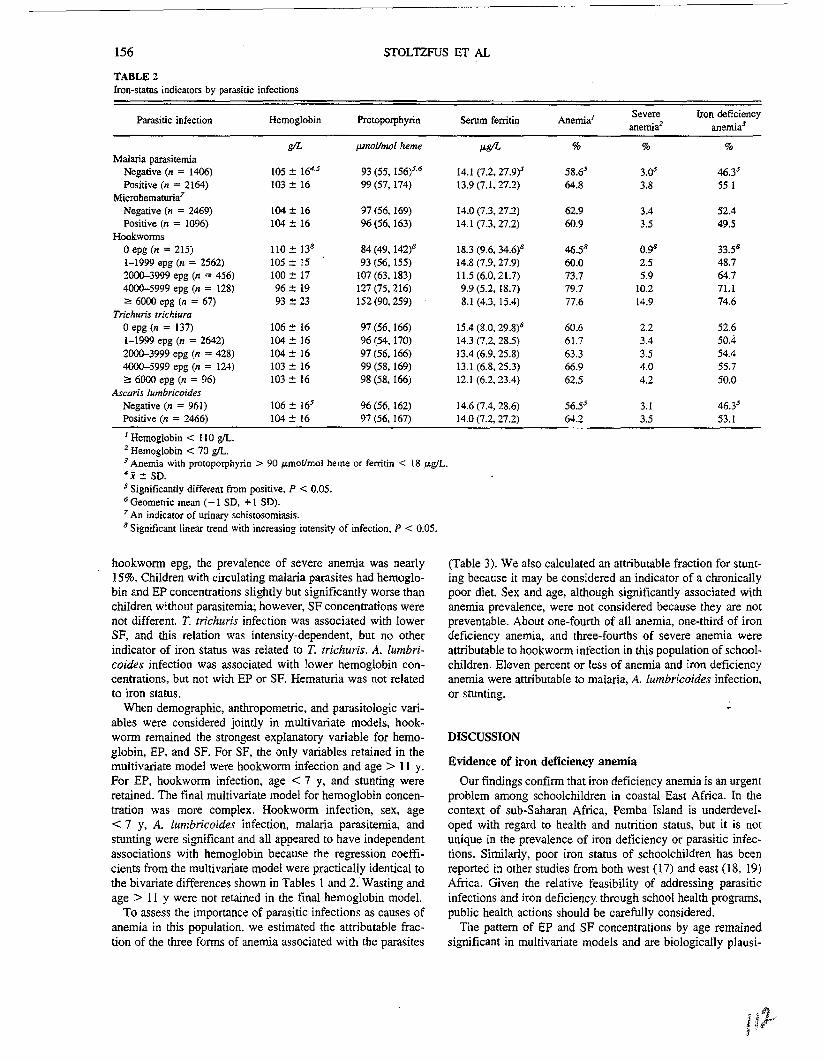
156
TABLE 2Iron-status indicators by parasitic infections
STOLTZFUS ET AL
Parasitic infection Hemog[obin Protoporphyrin Serum ferritin Anemia/ Severe Iron deficiencyanemia2 anemia!
gIL pmo/ll1Wl heme Jk8/L % % %Malaria parasitemia
Negative (n = 1406) lOS:!:: 164.5 93 (55, 156)5.6 14.1 (7.2,27.9)5 58.65 3.cr 46.)5Positive (n = 2164) 103:t 16 99 (57,174) B.9 (7.1.27.2) 64.8 3.8 55.1
Microhemaruria7
Negative (n = 2469) 104:!:: 16 97 (56,169) 14.0 (7.3, 27.2) 62.9 3.4 52.4Positive (n = 1096) 104 :!:: 16 96 (56,163) 14.1 (7.3.27.2) 60.9 3.5 49.5
Hookwormsoepg (n = 215) 110:!:: 138 84(49,142l 18.3 (9.6, 34.6)8 46.58 0.98 33.58
1-1999 epg (n = 2562) 105:t IS 93 (56,155) 14.8 (7.9, 27.9) 60.0 2.5 48.72000--3999 epg (n = 456) 100:t 17 107 (63. 183) U.5 (6.0.21.7) 73.7 5.9 64.74000--5999 epg (n = 128) 96:!: 19 127 (75.216) 9.9 (5.2, 18.7) 79.7 10.2 71.1;;., 6000 epg (n = 67) 93:!: 23 152 (90, 259) 8.1 (4.3, 15.4) 77.6 [4.9 74.6
Trichuris trichiuraoepg (n = 137) 106:!: 16 97 (56,166) 15.4 (8.0. 29.8)8 60.6 2.2 52.61-1999 epg (n = 2642) 104:!:: 16 96 (54,170) 14.3 (7.2, 28.5) 61.7 3.4 50.42000-3999 epg (n = 428) 104 :t 16 97 (56.166) 13.4 (6.9.25.8) 63.3 3.5 54.44000-5999 epg (n = 124) 103::!: 16 99 (58.169) 13.1 (6.8,25.3) 66.9 4.0 55.7;:: 6000 epg (n = 96) 103:!: 16 98 (58, 166) 12.1 (6.2,23.4) 62.5 4.2 50.0
Ascaris lumbricoide5Negative (n = 961) 106 :!:: 165 96 (56.162) 14.6 (7.4. 28.6) 56.55 3.1 46.]5Positive (n = 2466) 104:!:: 16 97 (56,167) 14.0 (7.2. 27.2) 64.2 3.5 53.1
/ Hemoglobin < 110 gil.2 Hemoglobin < 70 gil.J Anemia with protoporphyrin> 90 ~mollmol heme or ferritin < 18 IJ-glL.4j:!: SD.5 Significantly different from positive, P < 0.05.6 Geometric mean (- I SD, +1 SD).7 An indicator of urinary schistosomiasis.8 Significant linear trend with increasing intensity of infection. P < 0.05.
hookwooo epg, the prevalence of severe anemia was nearly15%. Children with circulating malaria parasites had hemoglobin and EP concentrations slightly but significantly worse thanchildren without parasitemia; however, SF concentrations werenot different. T. trichuris infection was associated with lowerSF, and this relation was intensity-dependent, but no otherindicator of iron status was related to T. trichuris. A. lumbricoides infection was associated with lower hemoglobin concentrations, but not with EP or SF. Hematuria was not relatedto iron status.
When demographic, anthropometric, and parasitologic variables were considered jointly in multivariate models, hookwooo remained the strongest explanatory variable for hemoglobin, EP. and SF. For SF, the only variables retained in themultivariate model were hookwooo infection and age> 11 y.For EP, hookwooo infection, age < 7 y, and stunting wereretained. The final multivariate model for hemoglobin concentration was more complex. Hookwooo infection, sex, age< 7 y. A. lumbricoides infection, malaria parasitemia, andstunting were significant and all appeared to have independentassociations with hemoglobin because the regression coefficients from the multivariate model were practically identical tothe bivariate differences shown in Tables 1 and 2: Wasting andage > II Y were not retained in the final hemoglobin model.
To assess the importance of parasitic infections as causes ofanemia in this population. we estimated the attributable fraction of the three fcoos of anemia associated with the parasites
(Table 3). We also calculated an attributable fraction for stunting because it may be consioered an indicator of a chronicallypoor diet. Sex and age, although significantly associated withanemia prevalence, were not considered because they are notpreventable. About one-fourth of all anemia, one-third of irondeficiency anemia, and three-fourths of severe anemia wereattributable to hookwooo infection in this population of schoolchildren. Eleven percent or less of anemia and iron deficiencyanemia were attributable to malaria, A. lumbricoides infection.or stunting.
DISCUSSION
Evidence of iron deficiency anemia
Our findings confioo that iron deficiency anemia is an urgentproblem among schoolchildren in coastal East Africa. In thecontext of sub-Saharan Africa, Pemba Island is underdeveloped with regard to health and nutrition status. but it is notunique in the prevalence of iron deficiency or parasitic infections. Similarly, poor iron status of schoolchildren has beenreported in other studies from both west (17) and east (18, 19)Africa. Given the relative feasibility of addressing parasiticinfections and iron deficiency through school health programs,public health actions should be carefully considered.
The pattern of EP and SF concentrations by age remainedsignificant in multivariate models and are biologically plausi-

IRON DEFICIENCY IN ZANZIBARI SCHOOLCHILDREN 157
1 epg, eggs per gram feces.2 An indicator of urinary schistosomiasis.J Height-for-age Z score < -2.4 Body mass index below the 5th centile of reference population.
TABLE 3Attributable fractions of anemia associated with preventable risk factors!
Fonn of anemia and Prevalence of Prevalence Attributable
risk factor risk factor ratio2 fraction2
% %All anemia
Hookwonn infection 94 1.36 (1.17, 1.57) 25 (15,35)
Ascaris infection 72 1.14 (1.07, 1.21) 9 (5, 13)
Malarial infection 61 1.11 (1.05, 1.17) 6 (3, 9)
Stunting 48 1.13 (1.08, 1.19) 6 (3, 8)
Iron deficiency anemiaHookwonn infection 94 1.56 (1.29, 1.89) 35 (23,47)
Ascaris infection 72 1.15 (1.06, 1.24) 10 (5,15)Malarial infection 61 1.19 (1.11, 1.27) 10(7,14)
Stunting 48 US (1.06, 1.20) 6 (3, 9)Severe anemia
Hookwonn infection 94 3.81 (0.95, 15.33) 73 (110. 35)
! All anemia defined as a hemoglobin c(lncentration < 110 gIL; irondeficiency anemia defined as arlemia with protoporphyrin > 90 p.mollmolheme or ferritin < 18 p.gIL; severe anemia defined as a hemoglobinconcentration < 70 gIL.
2 95% CIs associated with risk factor in parentheses.
ble. The youngest children « 7 y) would have most recentlyexperienced the high iron demands of early childhood, whereaschildren aged;=: 11 y may have been experiencing the pubertalgrowth spurt. Boys had EP and SF values indicative of greateriron deficiency compared with girls, but this sex difference didnot remain significant in multivariate analyses. Because boystended to have more intense hookworm infections than girls,the sex difference disappeared when we controlled for hookworm infection intensity. Other smdies of iron status of schoolchildren have also found no important sex differences in SFuntil the later teenage years (20-22).
TABLE 4Characteristics of the study sample!
Age (y)<77.0-8.99.0-10.911.0-12.9:=: 13
Sex (boys)Malaria parasitemiaHookwonn infection
Negative (0 epg)
Light (1-1999 epg)Moderate (2000--4999 epg)Heavy (:=: 5000 epg)
Trichuris trichiura infectionNegative (0 epg)Light (1-1999 epg)Moderate (2000-9999 epg)Heavy (:: 10 000 epg)
Ascaris lumbricoides infectionNegative (0 epg)Light (1-9999 epg)Moderate (10 00Q-49 999 epg)Heavy (:=: 50000 epg)
Microhematuria2
NegativePositive
Stunted]
Wasted4
Frequency
%
1.320.444.126.0
8.251.860.6
6.355.534.93.3
4.0
77.1'17.91.0
28.061.710.30.1
69.230.847.635.3
Evidence for non-iron deficiency anemia
Anemia can stem from a variety of causes, and it is apparentin this population that iron deficiency does not account for allthe anemia observed. Whereas EP rose and SF declined at ages> 11 y, hemoglobin did not change significantly. Also, stunting was associated with a lower hemoglobin concentration butwas not associated with EP or SF. Lastly, A. lumbricoidesinfection and malarial parasitemia remained significant in themultivariate model for hemoglobin, but were not retained in themodels of EP and SF after hookworms were controlled for.These findings suggest that factors other than poor iron statuscontribute to the low hemoglobin concentrations in this population. It is possible that one or more other nutrient deficiencieslink smnting, ascariasis, or malaria to erythropoiesis.
The negative association of hemoglobin to A. lumbricoides(23) and malaria (24-26) infections has been reported by othersas well. Hemoglobin may be lowered in a nonspecific wayduring infection-the so-called anemia of chronic disease (2729). However, it is unlikely that the acute-phase response toinfection with malaria or A. lumQricoides would influencehemoglobin more than EP or SF. As we described in greaterdetail elsewhere (7), there was no decreasing trend in hemoglobin concentration as malarial parasitemia increased in thispopulation. We hypothesize that this is because Zanzibari children are exposed to P. jalciparum repeatedly in their preschoolyears, and by school age they have developed significant
resistance to this infection (7). The difference in hemoglobinconcentration between children with and without these infections was significant but small (20 gil for both malaria andascariasis).
Risk factors for iron deficiency anemia
The most impressive finding in this study was the contribution of hookworms to the burden of iron deficiency and anemia. The strength of the association we observed is expl;pnedby the range of hookworm infection intensities in the population, and the lack of storage iron that would buffer the effect ofhookworm-related blood loss on iron status (30). Our dataconfirm the findings of Stephenson et al (18, 31) in coastalKenya, in which the hemoglobin deficit ~sociated with hookworm infection was greater than that of either schistosomiasisor malaria among schoolchildren.
Although we did not assess dietary iron intake, it is also clearfrom our data that dietary iron intakes were seriously inadequate. Even among children with no hookworm infection, theprevalence of anemia was 46.5%, and the average values forhemoglobin, EP, and SF only bordered on adequacy. Althoughanemia was prevalent in children without hookworm, severeanemia was rare « 1%). [f one imagines a normal hemoglobindistribution, it appears that dietary deficiency shifts the distribution significantly to the left, driving many children into a

158 STOLTZFUS ET AL
state of mild iron deficiency anemia. The addition of hookworms pulls the center of the distribution even farther left, anddramatically pulls down the left tail.
The intensity-dependent association between T. trichiurainfection and SF concentration is likely explained by theircommon association with hookworm, because T. trichiura infection did not remain significant in the multivariate model ofSF. The presence and intensity of T. trichiura infection wassignificantly associated with hookworm-infection intensity, despite the different routes of transmission of these two helminths. One clinical study found intestinal blood loss associated with T. trichiura infection (32), but another did not (33).We studied intestinal iron loss in this population and found noassociation between fecal hemoglobin concentration and T.trichiura infection after hookworm infection was controlled for(34). Thus, we conclude that the cross-sectional associationbetween iron-status indicators and T. trichiura infection observed by us and others (35) was probably not caused by T.trichiura-associated blood loss.
Other investigators have found a strong association betweenurinary schistosomiasis and iron status in sub-Saharan Africa(18,31, 36). The lack of association in our study may be dueto several reasons. Most probably, it is because a highly effective test-and-treat campaign for schistosomiasis was conductedon Pemba Island from 1988 to 1992 (37). Thus, children witha positive indication of schistosomiasis in our study may havehad the disease for only a short duration. Also, hookworminfection was significantly less common in children with schistosomiasis in this sample. Finally, hematuria is an excellentfield tool but an imperfect diagnostic indicator of schistosomiasis (11), and misclassification would attenuate a true association. Use of quantitative egg counts in urine would be a morepowerful way to examine this relation.
hnplications for control of iron deficiency anemia
The most impo'rtant application of these findings is to guidedevelopment of appropriate interventions to control iron deficiency anemia in African schoolchildren. Our results provide astrong basis for hookworm control as a strategy to control irondeficiency in this population group. If hookworms could beeradicated, anemia might be reduced by as much as 25%, irondeficiency anemia by 35%, and severe anemia by 73%. Because of the intensity-dependent relation of hObkwonn infection to intestinal iron loss and iron status, reducing hookwonnburdens (rather than eradicating infection) is the most rationalshort- to medium-term goal (38). Anthelminthic drugs are safeand inexpensive ("""USSO.025-0.20 per treatment), and periodicdelivery of them through the school system is a highly feasiblepublic health intervention (39). Our findings indicate thathookworm control will have the greatest effect on the lower tailof the hemoglobin distribution, ie, preventing relatively severeanemia.
Stopping the leakage of iron from children's bodies will notreplenish their stores however, and thus hookwonn controlalone will not solve the problem. Additional intake of iron willbe needed. In Zanzibar and many other parts of sub-SaharanAfrica, iron fortification of foods is not yet feasible. Schoolbased iron supplementation could be an opportunity to make upthe iron deficit that many children bring with them from thepreschool years, and to build stores to carry them into adult-
hood. Applied research is needed to find the most effectivedosing regimens to achieve these goals. n
We thank Kassim Shemel Alawi and the entire staff of the Pemba PublicHealth Team for their excellent work in collecting these data.
REFERENCES
1. Charlton RW, Bothwell TIL Definition, prevalence and prevention ofiron deficiency. Clin Haematol 1982;11:309-25.
2. DeMaeyer EM. Adiels-Tegman M. The prevalence of anaemia in theworld. Rapp Trimest Stat Sanit Mond 1985;38:302-16.
3. Haas JD, Fairchild MW. Summary and conclusions of the InternationalConference on Iron Deficiency and Behavioral Development. Am JClin Nurr 1989;50:703-5.
4. Stephenson LS, Latham MC. Adams EJ, Kinoti SN, Perret A. Physicalfimess, growth and appetite of Kenyan school boys with hookwonn.Trichuris trichiura and Ascaris lumbricoides infections are improvedfour months after a single dose of Albendazole. J Nutr1993;123:1036-46.
5. Savioli L. Bundy DAP, Tomkins A. Intestinal parasitic infections: asoluble public health problem. Trans R Soc Trop Med Hyg1992:86:353-4.
6. de Cameri f. Albonico M. Di Matteo L. Savioli L, Kisumku UM. SiaNecator sia Ancylostoma parassitano l'uomo a Pemba (Zanzibar).[Both Necator and Acylosroma infect humans in Pemba (Zanzibar)].Parassitologia 1992:34(suppl 1): 190(in Italian).
7. Stoltzfus RJ. Chwaya HM, Schulze KJ, Tielsch J. Albonico M. SavioliL. Hemoglobin. erythrocyte protoporphyrin and serum ferritin arevalid indicators of iron status in a malaria-endemic population ofschool children. J Nutr(in press).
&. Trape JF. Rapid evaluation of malaria parasite density and standardization of thick smear examination for epidemiological investigations.Trans R Soc Trop Med Hyg 1985:79:1&1-4.
9. World Health Organization. Bench aids for the diagnosis of intestinalparasites. Geneva: WHO, 1994.
lO. de Cameri I. Aggiomamento di un metodo per il conteggio di altocariehe di uova di elminti nelle feci. (Improvements of a method forthe quantitative assessment of high helminth egg counts in feces.) GMalattie fnfettive Parassitaire 1992:44:854-5(in Italian).
11. Savioli L. Hatz C, Dixon H. Kisumku UM, Molt KE. Control ofmorbidity due to Schistosoma haeffUIrobium on Pemba Island: eggexcretion and haematuria as indicators of infection. Am J Trop MedHyg 1990;43:289-95.
12. World Health Organization. Physical status. The use and interpretationof anthropometry. World Health Organ Tech Rep Ser 1995;854.
13. Must A, Dallal GE, Dietz WHo Reference data for obesity: 85th and95th percentiles of body mass index (wtlhtl ) and triceps.skinfoldthickness. Am J Clin Nurr 1991:53:839-46.
14. Must A, Dallal GE. Dietz WHo Reference data for obesity: 85th and95th percentiles of body mass index (wtlht2)-a correction. Am J ClinNutr 1991:54:773.
15. Johnson-Spear MA. Yip R. Hemoglobin difference between black andwhite women with comparable iron status: justification for race-specific anemia criteria. Am J Clin NUlr 1994;60: 117-21.
16. Kahn HA. An introduction to epidemiologic methods. New York:Oxford Press. 1983.
17. Prual A, Daouda H. Develoux M. Sellin B. Galan P. Hercberg S.Consequences of Schisrosoma haemarobium infection on the ironstatus of schoolchildren in Niger. Am J Trop Med Hyg 1992:47:291-7.
l8. Stephenson LS, Latham MC, Kurz KM, Kinoti SN, Oduori ML,Crompton DWT. Relationships of Schistosoma haematobium, hookwonn and malarial infections and Metri fonate treatment to hemoglobinlevel in Kenyan school children. Am J Trop Med Hyg1985:34:519-28.
19. Stephenson LS. Latham MC. Kurz [(,\1. Miller D. Kinoti SN, Oduori

IRON DEFICIENCY IN ZANZIBARI SCHOOLCHILDREN 159
ML. Urinary iron loss and physical fitness of Kenyan children withurinary schistosomiasis. Am J Trop Med Hyg 1985;34:322-30.
20. Bergstrom E, Hemell O. Lonnerdal B, Persson LA. Sex differences iniron stores of adolescents: What is normal? J Pediatr GastroenterolNutr 1995;20:215-24.
21. Ahmed F. Barna S. Mohiduzzaman M. et aI. Interactions betweengrowth and nutrient status in school-age children of urban Bangladesh.Am J Clin Nutr 1993;58:334-8.
22. Robertson U. Crompton DWT, Sanjur D, Nesheim MC. Haemoglobinconcentrations and concomitant infections of hookworm and Trichuristrichiura in Panamanian primary schoolchildren. Trans R Soc TropMed Hyg 1992;86:654-6.
23. Curtale R, Tilden R. Muhilal, Vaidya Y, Pokhrel RP, Guerra R.Intestinal helminths and risk of anaemia among Nepalese children.Panminerva Med 1993;35:159-66.
24. Bradley-Moore AM, Greenwood BM. Bradley AK. et aI. Malariachemoprophylaxis with chloroquine in young Nigerian children. [Y.
Its effect on haematological measurements. Ann Trop Med Parasitol1985;79:585-95.
25. Spencer TET. Haemoglobin levels in the D'Entrecasteaux Islands inrelation to malaria and nutrition. Trans R Soc Trop Med Hyg1966;2:1093-7.
26. McGregor lA, Williams K, Billewicz WZ. Thomson AM. Haemoglobin concentration and anaemia in young West African (Gambian)children. Trans R Soc Trop Med Hyg 1966;60:650-7.
27. Sears DA. Anemia of chronic disease. Med Clin Nonh Am1992;76:567-79.
28. Mohler ER Jr. Iron deficiency and anemia of chronic disease. Clues todifferentiating these conditions. Postgrad Med 1992;92: 123-8.
29. Christensen DJ. Differentiation of iron deficiency and the anemia ofchronic disease. J Fam Pract 1985;20:35-9.
30. Roche M. Layrisse M. The nature and causes of "hookworm anemia".Am J Trop Med Hyg 1966;15:1031-100.
31. Stephenson LS, Kinoti SN, Latham MC. Kurz Ki\1, Kyobe J. Singledose metrifonate or praziquantel treatment in Kenyan children. I.Effects on Schistosoma haemarobium, hookworm, hemoglobin levels,splenomegaly, and hepatomegaly. Am J Trop Med Hyg1989;41 :436-44.
32. Layrisse M, Aparcedo L, Martinez-Torres C. Roche M. Blood loss dueto infection with Trichuris trichiura. Am J Trop Med Hyg1967;16:613-9.
33. Lotero H, Tripailiy K, Bolanos O. Gastrointestinal blood loss inTrichuris infection. Am J Trop Med Hyg 1974;23:1203-4.
34. Stoltzfus RI. Albonico M. Chwaya HM, et al. Hemoquant detennination of hookworm-related blood loss and its role in iron deficiency inAfrican children. Am J Trop Med Hyg 1996;55:399-404.
35. Greenberg ER, Cline BL. Is trichuriasis associated with iron deficiencyanemia? Am J Trop Med Hyg 1979;28:770-2.
36. Greenham R. Anaemia and Schisrosoma haemarobium infection in theNonh·Eastem Province of Kenya. Trans R Soc Trop Med Hyg1978;72:72-5.
37. Renganathan E, Ercole E, Albonico M, et aI. Evolution of operationalresearch studies and development of a national control strategy againstintestinal helminths in Pemba Island experience. 1988-1992. BuHWorld Health Organ 1995;73:183~90.
38. Gilles HM. Selective primary health care: strategies for control ofdisease in the developing world. XVII. Hookworm infection· andanemia. Rev Infect Dis 1985;7: 111-8.
39. Warren KS. Bundy DAP, Anderson RM, et aI. Helminth infection. In:Jamison DT, Mosley WH, Measham AR, Bobadilla JL, eds. Diseasecontrol priorities in developing countries. New York: Oxford University Press, 1993:131--60.
III~

IODINE DEFICIENCY

Community and International Nutrition
Infant Survival Is Improved by Oral Iodine Supplementation1,2
Claudine Cobra, Muhilal,* Kusnandi Rusmil,t Diet Rustama,t Djatnika,t Susi S. Suwardi,*Dewi Permaesih,* Muherdiyantiningsih,* Sri Martuti* and Richard D. Semba**3
Deparlment of International Health, The Johns Hopkins University School of Hygiene and Public Health,Baltimore, MD 21205; *Nutrition Research and Development Centre, Ministry of Health, Government ofIndonesia, Bogor, Indonesia; tHasan Sadikin Hospital, University Pajajaran, Bandung, Indonesia; and**Deparlment of Ophthalmology, The Johns Hopkins School of Medicine, Baltimore, MD 21287
ABSTRACT Although reports suggest that infant mortality is increased during iodine deficiency, the effect ofiodine supplementation on infant mortality is unknown. A double-masked, randomized, placebo-controlled, clinicaltrial of oral iodized oil was conducted in Subang, West Java, Indonesia to evaluate the effect of iodine supplementation on infant mortality. Infants were allocated to receive placebo or oral iodized oil (100 mg) at about 6 wk ofage and were followed to 6 mo of age. Six hundred seventeen infants were enrolled in the study. Infant survivalwas apparently improved, as indicated by a 72% reduction in the risk of death during the first 2 mo of follow-up(P < 0.05) and a delay in the mean time to death among infants who died in the iodized oil group compared withinfants who died in the placebo group (48 days vs. 17.5 d, P = 0.06). Other infant characteristics associated withreduced riSk of death included weight-far-age at base line, consumption of solid foods, female gender and recenthistory of maternal iodine supplementation. Oral iodized oil supplementation had a stronger effect on the mortalityof males compared with females. This study suggests that oral iodized oil supplementation of infants may reduceinfant mortality in populations at risk for iodine deficiency. J. Nutr. 127: 574-578, 1997.
KEY WORDS: • infants • mortality • iodine deficiency • goiter • cretinism
Approximately 1.6 billion people worldwide may consumeinadequate daily amounts of iodine (UNICEF 1995) and are atris~ for iodine deficiency disorders (IDD)4 (Hetzel and Pandav1994), which include enlargement of the thyroid (goiter) anda wide spectrum of mental, psychomotor and growth abnormalities (Delange 1994). Currently, there are an estimated 655million cases of endemic goiter and 26 million cases of preventable mental deficiency, including 5.7 million cases of cretinismworldwide (Hetzel and Pandav 1994, WHO 1991b). Seventyfive percent of people with goiter live in developing countries(Gaitan et al. 1991). In areas with a high prevalence of IDD,maternal and fetal iodine deficiency has been associated withincreased rates of stillbirth. abortion, congenital anomaly, andinfant mortality (Pharoah et a1. 1976, Thilly et a1. 1980).Iodine supplementation of women before conception or duringpregnancy seems to reduce abortions, stillbirths and infantmortality (Chaouki and Benmiloud 1994, Fierro-Benitez et a1.1988, Olinoer et al. 1995, Hetzel 1983, Pharoah and Connolly1987, Pharoah et a1. 1971 and 1972, Potter et al. 1979). Although these studies suggest that iodized oil supplementation
, Supported by the Thrasher Research Fund and the World Health Organization.
• The costs of publication of this article were defrayed in part by the paymentof page charges. This article must therefore be hereby marked "advertisement"in accordance with 18 USC section 1734 solely to indicate this fact.
3 To whom correspondence should be addressed.• Abbreviations used: EPI, Expanded Programme on Immunization; IDD, io
dine deficiency disorders; WAZ. weight-far-age Z·score.
of infants might improve their survival, this has not beenshown definitively.
Oral iodized oil supplementation might influence infant survival through its effect on thyroid status and immunity. Thyroidhormones 'exert a powerful modulating effect on the immunesystem (Fabris 1973), including effects on B cell differentiation(Paavonen 1982), antibody responses (Keast and Ayre 1980),lymphoproliferation to mitogen (Keast and Taylor 1982) and Tcell subsets (Ohashi and Itoh 1994). Although the relationshipbetween thyroid disease and autoimmunity is well documented(Mooij and Drexhage 1992), less is known regarding rDD andimmune function in humans. Thyroid status and vitamin Astatus may also potentially interact to modulate immune responses. Both an active metabolite of vitamin A, 9-cis retinoicacid, and thyroid hormone can bind to retinoid~X receptor(Leng et al. 1994) and control gene transcription.
SUBJECTS AND METHODS
The study population consisted of mothers and their infants from28 villages in an area of mild-to-severe !DO in Subang. West Java,Indonesia. Eligible infants were 6-10 wk old, clinically euthyroid,and bom in the study villages. The time of supplementation of 610 wk of age was based upon the possible programmatiC integrationof oral iodized oil supplementation with the first visit of the ExpandedProgramme on Immunization (EPI) (Bruning et al. 1993, WHO 1987,1990 and 1991a) at which time infants received lJtal poliovirus anddiphtheria-percussis-tetanus vaccines. The study design was a randomized, double-masked, piacebo-conrroHed, clinical trial. Infants wereallocated by random number cable in blocks of 10 to receive vral
0022-3166/97 53.00 © 1997 American Society tor Nurritional Sciences.Manuscript received l August 199~. Initial review completed 29 September 1996. Revision accepted 11' December 1996.
574

INFANT SURVIVAL AND IODINE SUPPLEMENTATION 575
iodized oil or placebo, which was given at the first EPI visit. Uponenrollment, infams were assigned sequential identification numbers.An envelope labeled with the identification number contained identically appearing capsules of either oral iodized oil in poppyseed oil(loa mg) or poppyseed oil placebo (Lipiodol. Laboratoire Guerbee,Aulnay-sous-bois, France). The code was unknown to the investigators and study team until after the completion of the study. Thecapsules were administered immediately after the first dose of oralpolio vaccine. Infants in the clinical trial then completed the immunization schedule of the EPI with visits at 10 and 14 wk of age, anda final follow-up evaluation at 6 rna of age.
A 7-d morbidicy history was obtained at each visit. Height, weight,mid-upper arm circumference and head circumference were assessedat the first, third and final visits using standard procedures. At eachvisit, mothers were asked whether their infants were being breast-fedand/or given solid food or other liquids besides breastmilk, how manytimes a day they were breast-fed and/or fed other foods, and the listof other foods given. Community health workers visited the homesofparticipants on a monthly basis and monitored the study populationfor deaths, including those among infants who dropped out of thestudy but remained in their villages. Probable causes of death weredetermined by the pediatrician after interviewing relatives of thedeceased infant using verbal autopsy techniques adapted from otherpediatric studies (Dowell et al. 1993, Kalter et al. 1990).
Base-line and follow-up, comparisons between treatment groupswere made using Student's c test for comparison of two means andFisher's exact test for comparis·o!). between proportions, with statisticalsignificance at a two-tailed P value of 0.05 or tess. Absolute andgender-stratified relative risk, mortality rates and Kaplan-Meier survival curves were calculated and compared between allocation groups(Armitage and Berry 1987). Adjust"ed survival analyses were conducted using Cox regression models (Kleinbaum et al. 1982). Writteninformed consent was obtained from parents or guardians. The studywas approved by the institutional review board at the Johns HopkinsSchool of Medicine and by the ethical committees of the HasanSadikin Hospital, University Pajajaran and the Ministry of Health,Govemm~nt of Indonesia.
RESULTS
From June to October 1994,617 infants were recruited toparticipate in the study. Of the 617 participants, 307 (49.8%)infants received oral iodized oil and 310 (50.2%) receivedplacebo; 311 (50.4%) infants were males and 306 (49.6%)were females. The treatment groups were similar by maternalgoiter status, maternal age, infam gender, socioeconomic status, use of iodized salt and all other characteristics at base line,some of which are displayed on Table 1. Five hundred seveninfants completed follow-up to 6 mo, 255 of 307 in the iodizedoil group (83%), and 252 of 310 (81 %) in the placebo group.There was no differemialloss to follow-up by treatment groupor gender. Eighty-eight infants dropped out of the study before6 rna of age. Their base-tine characteristics were similar tothose who remained in the study (data not shown). A totalof 22 infants died, 15 (68.2%) in the placebo group and 7(31.8%) in the iodized oil group. Of those who died, 14(63.6%) were male and 8 were female (36.4%).
Infants who died before 6 mo of age were significantlylighter and had smaller head and arm circumferences at studyentry than the infants who survived to 6 mo of age. Theirmean weight-for-age was also significantly lower, indicatingthat they were malnourished a~ base line in comparison withthe surviving infants (Table Z). None of the mothers whoseinfants died had a history of iodized oil supplementation incomparison with 86 (17%) of the 507 mothers whose infantssurvived to 6 rna of age (P =: 0.034). Supplemented mothers'had received oral iodized oil on average 120 d before thebeginning of the study. No other base-line differences wereobserved between those who survived to 6 mo of age andthose who did not. The percentage of mothers who had been
supplemented in the past and the time elapsed between maternal and infant supplementation were similar in the iodizedand placebo groups.
Deaths in the iodized oil group occurred on average 48 d(~ 13.1) after the intervention, whereas in the placebo group,deaths occurred on average 17.5 d (~ 4.0) after the initial visit(P == 0.06). There were 13 deaths (65%) due to pneumonia orbronchopneumonia, 1 death (5%) due to meningoencephalitis, 1 death (5%) due to asphyxia, and 2 deaths with unspecified diagnoses (allergic reaction and shock of undeterminednature). Five deaths were not investigated through verbaL autopsies. The unadjusted relative risk of death in the iodizedoil group in comparison with the placebo group during thefirst 1, 2 and 4 mo offollow-up were 0.19 (95%CI 0.04-0.85,P =: 0.021); 0.28 (95%CI 0.09-0.82, P =: 0.018); and 0.48(95%CI 0,20-1.15, P =0.126), respectively. Figure 1 showsthe Kaplan-Meier survival curves according to treatmentgroup. At the end of 4 mo of follow-up, the overall mortalityexperience in the iodized oil group was still considerably lowerthan that of the placebo group, corresponding to a 52% reduction in mortality in the supplemented group. The tinal mortality difference at 6 rna of age, however, failed to reach statisticalsignificance, perhaps due to the small sample size studied. Thepower to detect a difference such as the one observed at 6 moof age was approximately 32%.
Multivariable Cox regression analysis was used to measure theeffect of other independent variables on survival, to control forpotential confounding and to test for interactions. Variables analyzed included gender, infant's diet at base line (breastfeedingand/or introduction of solid foods), diarrhea or acute respiratOlyinfection (cough, difficult breathing, or fast breathing) at baseline, history of maternal iodized oil supplementation, anthropometry at base line, and interaction among treatment, gender andother variables showing association with survivaL Iodine supplementation, consumption of solid foods or liquids at base line,female gender, weight, weight-far-age Z-score (WAZ), and headand arm circumference were independently associated with lmproved survivaL WAZ was selected for the final model on thebasis of the magnitude and statistical significance of the beneficialeffect on survival and multicolinearity between anthropometricparameters. Table 3 presents the results of the multivariable Coxsurvival analysis with the effect of iodine supplementation adjusted for gender, WAZ and consumption of solid foods at baseline. Treatment effect was not confounded and did not interactwith the effect of solid foods and anthropometry at base line.Sex-stratified analysis of treatment effect indicated.: that malesurvival at 6 mo of age in the iodized oil group was significantlybetter than that of male infants in the placebo group (22.9 per1000 vs. 84.6 per 1000, P == 0.03). The P-value tor the interactionberween treatment and sex in the Cox regression model was0.15. Because the difference in mortality occurred soon afterenrollment, there. were limited data regarding time-dependentvariables such as anthropometry and diet for the infants whodied; therefore, the Cox regression analysis was limited to baseline variables only.
Among 326 infants whose ba,se-line diets included foods orliquids, 164 (50.0%), 126 (38.4%),35 (l1.3%) and 1 (0.3%)were fed solid foods or liquids 1, 2, 3 and 4 times/d, respectively. Other liquids consisted of water, tea with sugar orhoney, or fruit juic~. Solid or mushy foods included premasticated rice (bubud, mashed bananas, biscuits, industrializedinfant food (e.g., Promina and Farley) and infant formulas(e.g., Lactogen, SNN and SGN). The proportion of infantsbreast-fed at base line was lower, but not significantly so,among infants who received supplements (95. i vs. 97.9%, P== 0.125). Infants who received solid foods or liquids supplements at base line were slightly, but signi!i.cantly older at study
rr&

576 COBRA ET AL.
TABLE 1
Selected base~/ine characteristics by allocation group
Placebo n .. 310 n (%) Iodized oil n .. 307 n (%) P-value
Maternal characteristicsGoiter grade1
001A180203
Previous maternal iodine supplementationUse of vitamin and mineral supplements during.pregnancyMean age,l.2 yPregnancies, nDeliveries, nUve births, nChildren alive, nMaternal education, yMaternal occupation: housewifeInfant gender, age at base line, and delivery historyGender
MaleFemale
Place of deliveryHomeMidwife's houseHospitalClinic
Delivery assisted byTraditional birth attendantMidwifeDoctor
Mean birth weight, kg1Mean age, mo
275 (89.6)20 (6.S)
7 (2.3)3 (1.0)2 (0.6)
52 (16.8)259 (84.6)
25.4 ::!: 0.322.3 :!: 0.092.2 ::!: 0.092.2 == 0.092.1 :!:0.087.1 :!: 0.15272 (94.1)
157 (50.6)153 (49.3)
269 (86.8)16 (5.1)17 (5.5)8 (2.6)
235 (76.1)65 (21.0)
9 (2.9)3.20 == 0.031.82 == 0.02
267 (87.6)26 (8.5)
8 (2.6)4 (1.3)0(0.0)
47 (15.3)261 (85.6)
25.7 :!: 0.322.3 :!: 0.082.2 == 0.082.2 ::!: 0.082.1 :!:0.077.4 == 0.16266 (90.5)
1S4 (50.2)153 (49.8)
272 (89.2)11 (3.6)17 (5.6)5 (1.6)
237 (77.5)65 (21.2)
4 (1.3)3.20 :!: 0.031.80 ::!: 0.02
0.54
0.660.820.610.690.760.690.980.320.32
0.90
0.66
0.38
0.740.54
1 Data from placebo group (n .. 3D?), iodized oil group (n .. 305).2 Mean::!: SEM.
TABLE 2
1 Mean:!: SEM.2 For birthweights, those who died (n .. 17), those alive (n .. 331).
Birth weight and base-line age and anthropometryby infant vital status
12030 60 90Days from Baseline
AllocatlonGroup
··.. ··t.......:......,•...·....····~l······ ..·..l ..... -;
•· ..·······..···..·······..·.....·..······1...
1.00
l.~:::sen....0 0.95S:sClI
.t:Iea.
0.900
DISCUSSION
This study suggests that iodine (loa mg) given at 6 wk .ofage may reduce the risk of death among infants in a geographi-
FIGURE 1 Survival of infants in the oral iodized oil and placebogroups from time of supplementation through 120 d of follow-up. Ageat base line was 6 wk.
years of parental schooling (data not shown). The effect ofsupplemental foods/liquids on survival did not change whencontrolled for age, socioeconomic status, iodine supplementation, WAX or gender.
0.100.320.030.120.Q10.020.010.090.11
3.2 ::!: 0.021.8 == 0.D14.8 == 0.03
55.8:': 0.1137.9 :!: 0.0612.5 :!: 0.050.03:': 0.04
-0.38 ::!: 0.040.40 == 0.03
Dead n = 22 Alive n .. 507 P-value
3.0 == 0.111.7 ::!: 0.074.5 == 0.14
55.0:': 0.4937.2 :':0.2411.9:': 0.21
-0.43 ::!: 0.17-0.70 ::!: 0.20
0.16 ::!: 0.17
Birthweight,1.2 kgAge at base line. maWeight, kgLength, emHead circumference, emArm circumference, emWeight-for-age Z-scoreHeight-for-age Z-scoreWeight-for-height Z-score
entry than infants who did not receive supplements (1.9 vs.1.8 rna, P < 0.0001). They were also heavier and taller (4.9vs. 4.7 kg, P = 0.0041; 56.2 vs. 55.5 em, P = 0.0003), hadslightly greater head and arm circumference (38.0 vs. 37.7 em,P = 0.002; and 12.5 vs. 12.4 em, P '= 0.05), but similar ageadjusted Z-scores (WAZ 0.03 vs. -0.03, P = 0.371; heightfor-age Z-score -0.34 vs. -0.45, P '= 0.109; weight-for-heightZ-score 0.37 vs. 0.39, P :; 0.622). Infants who did not receivesolid foods were more likely to have a better socioeconomicstatus as indicated, for instance, by the significantly higherpercentage living in houses with electricity and higher mean
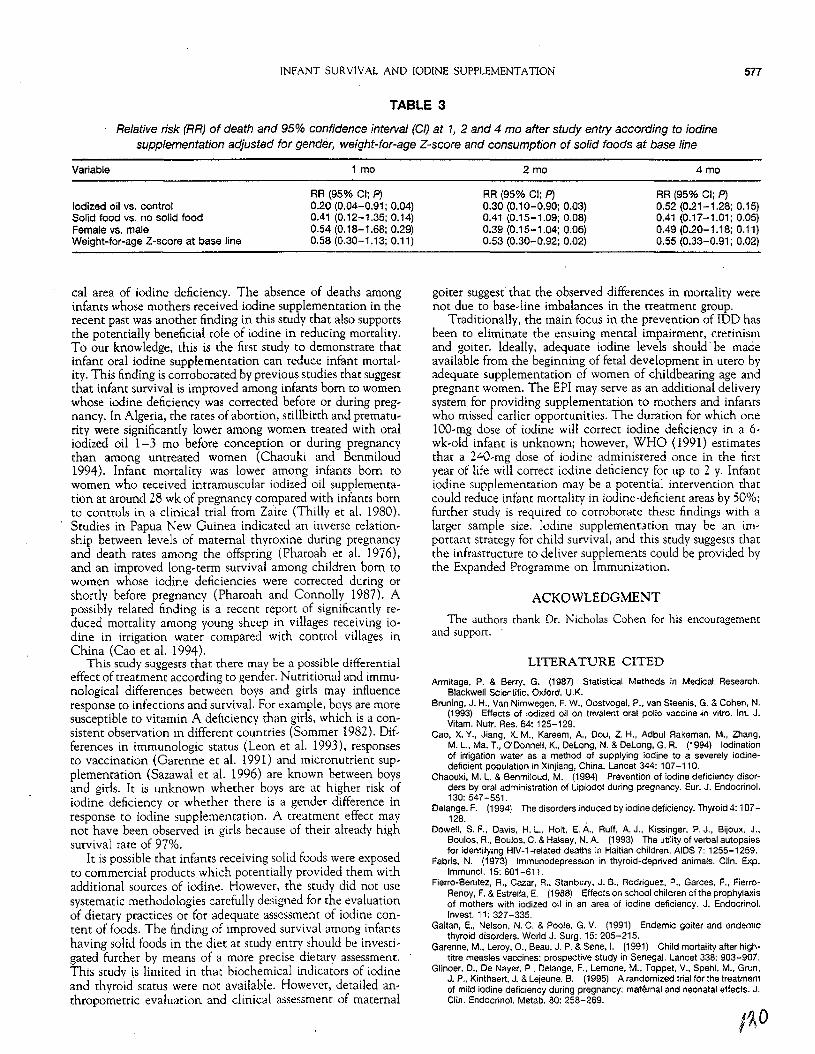
INFANT SURVIVAL AND IODINE SUPPLEMENTATION
TABLE 3
Relative risk (RR) of death and 95% confidence interval (el) at 1, 2 and 4 mo after study entry according to iodinesupplementation adjusted for gender, weight-for-age Z-score and consumption of solid foods at base line
577
Variable
Iodized oil vs. controlSolid food vs. no solid foodFemale vs. maleWeight-for-age Z-score at base line
1 mo
RR (95% Cl; p)0.20 (0.04-0.91; 0.04)0.41 (0.12-1.35; 0.14)0.54 (0.18-1.68; 0.29)0.58 (0.30-1.13; 0.11)
2 mo
RR (95% CI; p)0.30 (0.10-0.90; 0.03)0.41 (0.15-1.09; 0.08)0.39 (0.15-1.04; 0.06)0.53 (0.30-0.92; 0.02)
4 mo
RR (95% CI; P)0.52 (0.21-1.28; 0.15)0.41 (0.17-1.01; 0.05)0.49 (0.20-1.18; 0.11)0.55 (0.33-0.91; 0.02)
cal area of iodine deficiency. The absence of deaths amonginfants whose mothers received iodine supplementation in therecent past was another finding in this study that also supportsthe potentially beneficial role of iodine in reducing mortality.To our knowledge, this is the first study to demonstrate thatinfant oral iodine supplementation can reduce infant mortality. This finding is corroborated by previous studies that suggestthat infant survival is improved among infants born to womenwhose iodine deficiency was corrected before or during pregnancy. ln Algeria, the rates of abortion, stillbirth and prematurity were significantly lower among women treated with oraliodized oil 1-3 mo before conception or during pregnancythan among untreated women (Chaouki and Benmiloud1994). Infant mortality was lower among infants born towomen who received intramuscular iodized oil supplementation at around 28 wk of pregnancy compared with infants bornto controls in a clinical trial from Zaire (Thilly et al. 1980).Studies in Papua New Guinea indicated an inverse relationship between levels of maternal thyroxine during pregnancyand death rates among the offspring (Pharoah et a1. 1976),and an improved long-term survival among children born towomen whose iodine deficiencies were corrected during orshortly before pregnancy (Pharoah and Connolly 1987). Apossibly related finding is a recent report of significantly reduced mortality among young sheep in villages receiving iodine in irrigation water compared with control villages inChina (Cao et al. 1994).
This study suggests that there may be a possible differentialeffect of treatment according to gender. Nutritional and immunological differences between boys and girls may influenceresponse to infections and survival. For example, boys are moresusceptible to vitamin A deficiency than girls, which is a consistent observation in different countries (Sommer 1982). Differences in immunologic status (Leon et al. 1993), responsesto vaccination (Garenne et a1. 1991) and micronutrient supplementation (Sazawal et al. 1996) are known between boysand girls. It is unknown whether boys are at higher risk ofiodine deficiency or whether there is a gender difference inresponse to iodine supplementation. A treatment effect maynot have been observed in girls because of their already highsurvival rate of 97%.
It is possible that infants receiving solid foods were exposedto commercial products which potentially provided them withadditional sources of iodine. However, the study did not usesystematic methodologies carefully designed for the evaluationof dietary practices or for adequate assessment of iodine content of foods. The finding of improved survival among infantshaving solid foods in the diet at study entry should be investigated further by means of a more precise dietary assessment.This study is limited in that biochemical indicators of iodineand thvro'id status were not available. However, detailed anthropo~etric evaluation and clinical assessment of maternal
goiter suggest that the observed differences in mortality werenot due to base-line imbalances in the treatment group.
Traditionally, the main focus in the prevention of IDD hasbeen to eliminate the ensuing mental impairment, cretinismand goiter. Ideally, adequate iodine levels should be madeavailable from the beginning of fetal development in utero byadequate supplementation of women of childbearing age andpregnant women. The EPI may serve as an additional deliverysystem for providing supplementation to mothers and infantswho missed earlier opportunities. The duration for which one100-mg dose of iodine will correct iodine deficiency in a 6wk-old infant is unknown; however, WHO (1991) estimatesthat a 240-mg dose of iodine administered once in the tirstyear of hfe will correct iodine deticiency for up to 2 y. Infantiodine supplementation may be a potential intervention thatcould reduce infant mortality in iodine-deticient areas by 50%;further study is required to corroborate these findings with alarger sample size. Iodine supplementation may be an important strategy for child survival, and this study suggests thatthe infrastructure to deliver supplements could be provided bythe Expanded Programme on Immunization.
ACKOWLEDGMENT
The authors thank Dr. Nicholas Cohen for his encouragementand support. .
LITERATURE CITED
Armitage. P. & Beny. G. (1987) Statistical Methods in Medical Research.Blackwell Scientific, Oxford. U.K.
Bruning, J. H., Van Nimwegen. F. W., Oostvogel. P.• van Steenis, G. & Cohen. N.(1993) Effects of iodized oil on trivalent oral polio vaccine -in vitro. Int. J.Vitam. Nutr. Res. 64: 125-129.
Cao, X. Y.• Jiang, X. M.. Kareem, A.• Dou, Z. H.. Adbul Rakeman. M.• Zhang,M. L.. Ma. T.• O'Donnell, K.. Delong, N. & Delong, G. R. (1994) Iodinationof irrigation water as a method of supplying iodine to a severely iodinedeficient population in Xinjiang, China. Lancet 344: 107-110.
Chaouki, M. L. & Benmiloud, M. (1994) Prevention of iodine deficiency disorders by oral administration of Lipiodol during pregnancy. Eur. J. Endocrino!.130: 547-551.
Delange, F. (1994) The disorders induced by iOdine deficiency. Thyroid 4: 107128.
Dowell. S. F., Davis. H. L.. Holt. E. A.. Ruff. A. J.. Kissinger. P. J., Bijoux. J..Boulos, R.• Boulos, C. & Halsey, N. A. (1993) The utility of verbal autopsiesfor identifying HIV-1·related deaths in Haitian children. AIDS 7: 1255-1259.
Fabris, N. (1973) lmmunodepression in thyroid-deprived animals. Clin. Exp.Immuno!. 15: 601-611.
Fierro-Benitez, R.. Cazar. R.• Stanbury, J. B.. Rodriguez. P.. Garces. F., FierroRenoy, F. & Estrella. E. (1988) Effects on school children of the prophylaxisof mothers with iodized oil in an area of iodine deficiency. J. Endocrino!.Invest. 11: 327-335.
Gaitan, E.. Nelson. N. C. & Poole, G. V. (1991) Endemic goiter and endemicthyroid disorders. World J. Surg. 15: 205-215.
Garenne, M., Leroy. 0 .. Beau. J. P. & Sene, I. (1991) Child mortality after hightitre measles vaccines: prospective study in Senegal. Lancet 338: 903-907,
Glinoer. D.. De Nayer, P.. Delange. F.• lemone. M.• Toppet, V.. Spehl. M., Grun.J. p.. Kinthaert. J. & Lejeune. B. (1995) A randomized trial for the treatmentof mild iodine deficiency during pregnancy: maternal and neonatal effects. J.Clin. Endocrinol. Metab. 80: 258-269.

578 COBRA ET AL.
Hetzel, 8. S. (1983) Iodine deficiency disorders (100) and their eradication.Lancet 2: 1126-t129.
Hetzel, 8. S. &Pandav, C. S. (1994) S.O.S. fora Billion: The Conquest of IodineDeficiency Disorders. Oxford University Press, New Yorl<, NY.
Kalter, H. D., Gray, R. H. & Black, R. E. (1990) Validation of post-mortem interviews to ascertain selected causes of death in children. Int. J. Epidemiol. 19:380-386.
Keast. D. & Ayre. D. Y. (1980) Antibody regulation in birds by thyroid hormones. Dev. Compo Immunol. 4: 323-330.
Keast. D. & Taylor. K. (1982) The effect of tri-iodothyronine on the phytohaemagglutinin response of T lymphocytes. Clin. Exp. Immunol. 47: 217-220.
KJeinbaum, D. G.• Kupper, L I. & Chambless, L E. (1982) Logistic regressionanalysis of epidemiologic data: theory and practice. Commun. Statist. TheoryMethods 11: 465-547.
Leng, X., Blanco, J., Tsai, S. Y., Ozato. K.. O'Malley, D. W. & Tsai. M. J. (1994)Mechanism for synergistic activation of thyroid honnone receptor and retinoidX receptor on different response elements. J. 8iol. Chem. 269: 31436-31442.
Leon. M. E.• Ward, B., Kanashiro, R., Hernandez, H.. BerrY,S.• Vaisberg, A,Escamilla, J., Campos, M., Bellomo. 5., Azabache. V. & Halsey, N. A. (1993)Immunologic parameters 2 years after high-titer measles immunization in Peruvian children. J. Infect. Dis. 168: 1097-1104.
Mooij, P. & Drexhage, H. A. (1992) Interactions between the immune systemand the thyroid. Regulatol'f networks in heaith and disease. Thyroidology 4:45-48.
Ohashi, H. & Itoh, M. (1994) Effects of thyroid honnone on the lymphocytephenotypes in rats: changes in lymphocyte subsets related to thyroid function.Endocrine Regillation 28: 117-123.
Paavonen. T. (1982) Enhancement of human B iymphocyte differentiation invitro by thyroid honnone. Scand. J. Immunol. 15: 211-215.
Pharoah, P.O.D., Buttfield, I. H. & Hetzel, 8. S. (1971) Neurological damage tothe fetus resiliting from severe iodine deficiency during pregnancy. Lancet 1:308-310.
Pharoah, P.0.0., Buttfield, I. H. & Hetzel, B. S. (1972) The effect of iodine prophylaxis on the incidence of endemic cretinism. Adv. Exp. Med. Bioi. 30: 201221.
Pharoah, P.O.D. & Connolly, K. J. (1987) A controlled trial of iodinated oil forthe prevention of endemiC cretinism: a long-term follow-Ilp. Int. J. Epidemio!.16: 68-73.
Pharoah, P.O.D., Ellis, S. M., Ekins, R. P. & Williams, E. S. (1976) Matemalthyroid function. iodine deficiency and fetal development. elin. Endocrinol. 5:159-166.
Potter, J.D.• McMichael. A J. & Hetzel, B. S. (1979) lodization and thyroidstatus in relation to stillbirths and congenital anoma~eS. Int. J. Epidemio!. 8:137-144.
Sazawal, 5., Black, R. E., Bhan, M. K.. Jalla, S.. Bhandari. N., Sinha, A & Maiumdar, S. (1996) Zinc supplementation reduces the incidence of persistent diarrhea and dysentery among low socioeconomic children in India. J.Nutr. 126: 443-450.
Sommer, A. (1982) Nutritional Blindness. Oxford University Press, New York.NY.
Thilly. C., Lagasse, R., Roger, G., Bourdoux, P. & Ermans. A ~ (1980) Impaired fetal and postnatal development and high perinatal death-rate in asevere iodine deficiency area. In: Thyroid Research VIII. Proceedings of theEighth Intemational Thyroid Congress, Sydney, Australia, Stockigt, J. R., Nagataki, J. W., Meldrum. Eo. Barlow. J. W. & Harding, P. E. (ads.), pp. 20-23.Pergamon Press, New York. NY.
UNICEF (1995) The State of the World's Children. Oxford University Press,New Yorl<, NY.
WHO (1987) Potential contribution of the Expandad Program on Immunizationto the control of vitamin A deficiency and iodine deficiency disorders. EPI .Global Advisory Grollp Meeting, Washington, DC (00cumentfEPIIGAG/871WP17)
WHO (1990) Vitamin A and iodine supplementation. Weekly EpidemiologicalRecord 65: 66.
WHO (1991 a) Addressing micronutrient supplementation through the EPI.(DocumentfEPI/GAG/91IWPl7) Rev. 1. World Health Organization, Geneva,Switzerland.
WHO (1991 b) National strategies for overcoming micronutrient malnutrition.Executive Board, 89th session, provisional agenda item 10.2 (DocumentfWHO/EB89/27/91). World Health Organization, Geneva. Switzerland.

OTHER

294 EAST AFRICAN MEDICAL JOURNAL May 1997
East African Medical Journal Vol. 74 No.5 May t997PARASmC 1NFECI10NS IN PEMBA ISLAND SCHOOLCHILDRENM, Albonico. MD, Division ofCommunicable Diseases, World Health Organization, H.M.• Chwaya MD. Ministry or Health. Zanzibar, United RepUblic ofTanzania. A..Montresor. MD. Division ofContlO1 ofTropical Diseases. World Health Organization. RJ.. Stoltzfus. PlIO, 1M.. Tielsch, PhD. Department orIntemational Health, JohnsHopkins Sl:hool of Public Health. K. S.• Alawi PhD,MinistryorHealth.Zanzibar.UnitedRepublicofTanzaniaand L.. SavioH. MD. Schistosomi;osisandlntestinal Par;ositesUnit, Division of Control ofTlOpical Diseases, World Health Organization.
Requests for reprints to: A. Montresor. Division of Control of Tropical Diseases. World Health Organization, Avenue AWia 20. Ch 1211, Geneva 27, Switzerland.
PARASITIC INFECTIONS IN PEMBA ISLAND SCHOOLCHILDREN
M. ALBONICO. H. M. CHWAYA. A. MONTRESOR. R. 1. STOLFZFUS.J. MTIELSCH. K. S. ALAWI and L. SAVIOLI
SUMMARY
Intestinal helmintbs, schistosomiasis and malaria have been recognised for decades to bemajor public health problems in ZanZibar, Tanzania. During the evaluation oftbe impact ofthe Zanzibar Helminth Control Programme, baseline parasitological data on 3,605 schoolchildren were collected in Pemba Island. Prevalence of intestinal helminth infections was72%,94% and 96% for Ascarislumbricoides, Trichuris trichiura and hookworm, respectively.Thirty one percent ofcbildren tested positive for haematuria, a reliable indicator of urinaryschi."itosomiasis in the study area. Malaria parasites were found in 61 % of children.Hookworm infections and haematuria were more prevalent in boys. Sixty seven percent ofthe children were infected with all the three helminths, and 28% harboured double infection.No association was found between intestinal helminths and schistosomiasis or malaria.Cbildren living in rural areas were more heavily infected with hookworms, schistosomiasisand malaria compared to children in towns. Results from this study provided relevantinformation for designing a "plan ofaction" for the integrated control of filariasis, intestinalhelminths, malaria and schistosomiasis in Zanzibar.
INTRODUCTION
It is Widely recognised that school children carry theheaviest burden Dr nwrbidity due to intestinal helminthsmld schistosomiw;is infcction( I). Apart from the morbidityassociated WiUl acute infections, Ule burden of chronicparasitic infections may affect physicallimess(2). cognitiveperformancc(3), nutritional sUltus,U1dgrowth(4)mlo school~l.llendmlcc(5) of school age children. Acute and chronicmalaria infections may affect school performance ofchildren in endemic areas(6).
Parasitic infections have been recognised for decadesto be major public health problems in Z,mzibnr, UnitedRepublic of T,mzania(7-9). Malm;a is Ule major publichea.lUl problcm accounting for more than 30% of childmortality()O). TIlC present str'dtegy of malaria control isbased on early diagnosis and prompt case treaunent.Major constraints arc the lack of ,ill efliciem referralsystem, im;reasing resistance of Plasmodium jalciparulllto chloroquine and shortage of second line antimalarialdrugs. Schistosomiasis control was initiated in 1986tlU"ough a school-based approach and was integrated in1994 within a National Plan of Action for the control of aschistosomiasis and intestinal helminthic infections. Thestrategy adopted was based on a combination of regularchemotherapy of school children wiUl praziquantel andmebendazole administered as single doses and healtheducation. Children were selected for treaunent WiUl
praziquamel on the basis 0 f Ule presence ofhaematuria(7),while mebendazole was given as targeted mass treaunentdue to the high prevalence and intensity of helminthicinfectiolls(8). An inexpensive and effective drug andhealUl education delivery system was set up through theteachers with supervision from healtll staffof the helminthcontrol prognunme.
In 1994 tile Ministry of Health of Zanzibar, incollaboration with the World Health Organization (\VHO)and TheJohns Hopkins University, recognised tbe need toevaluate the impact of the Helminth Control Programme.A large scale longitudinal survey was planned to.collectnutritional and parasitological data on growth, irondeficiency. vitnmin A st..'ltus, malaria. haemau.uia andprevalence and intensity of soil transmitted nematodesinfection in school children. TIle baseline nutritional statusdalahas been published elsewhere( 11). The epidemiologyand geographical distribution of parasitic infections. theirassociation and tile implication for integrated control arepresented in tilis paper.
MATERIALS AND METHODS
The survey wasconducted on the island of Pemba, Tanzaniaby thestaffof the Pemba Helminth Control Programme. Importantfeatures of the island have been described in detail elsewhere(7).
The survey was carried uut during April and May 1994 in12 schools. randomly selected from the 72 schopls on PembaIsland. Three schouls were selected from each of the four

May /997 EAST APRICAN MEDICAL JOURNAL 295
Table 1
C:haracler;,,-/;,., ofstudy ,,,mple
RESULTS
U20A-t4.\26.0
&.2
5U\-18.2
80.b19A
P"rc.:nra~"
<77.n .. R,ll9.0-10.911.0-12.9>13
Se..~:Mal"sF"males
Reslden,.e:RuralUrban
define lhe lower boundaries of moderate and heavy infections.resJ.'tlctively. Differences between prevalence were tested by Chisquare statistic and means were compared using Student's tstatistic. Associations between parasitic infections wereinvestigated using 2x2 contingency tables for ea.;h combinationof pardsites. The association between parasitic infections wasmeasured using the ratio ot" prevalence and tested using the Chisquare statistic ".
TIle demographic characteristics of dIe study populationare shown in Table 1.
Late school enrolment ,md progressive drop-oul ofgirls characterise lhis school population. 11le childrenwere heavily infected with parasites (Table 2). TI)Cprevalence of intestinal helminth infections was 72%,94% and 96% for A. !lImbricoides. T. trr:chiura andhookwonn. respectively. TIlirty per cent of the childrenlesled positive for haemaluria. Malaria parasites werefound in 61 % of the children though parasilaemia was oflow density with 47 % of children having less tlUUl 1,000parasites per microhter ofbloou ,Uldonly one percclll wi thmore 11HUl 5,000 parasites per microhter. All infectionswere P,fah.:iparulll. P. lIIa!ariae ww, identified in less than5% of slides.
dislricts. From these schools, children enrolled in 76 morningclasses in standards one to four. were invited to participate in thestudy. Out of 3944 enrolled children, 3.605 participated in thesurvey.
In every school, demographic information. weight, heightand stool. urine and blol,d samples were collected from eachchild. The sample collection rates were 100%.99% and 97% forblood. urine and stool samples. respectively. Urine was testedwith a reagent strip for semiquantitative values of haematuria(Hemastix, Ames-Miles Laboratories. Hclkhart, IN). In thispopulation. microhaematuria is considered to be diagnostic ofurinary schistosomiasis (69% sensitivity and8a%specificity)( 12).Children testing positive for visual haematuria were treated withpraziquantel 40mglkg body weight. Haemoglobin, erythrocyteprotoporphyrin and serum ferritin were assessed as part ofnutritional evaluation( II). Those with severe anaemia(Hb below7 gldl) received mebendawle500mg as a single dose and ferroussulphate 25 mg tablets twice aday for one month. A thin and thickmalaria smearW<ls also made for l:<Ich child. Children with feverwere treated with astalldard dose of pyrimcthamine-sulphadoxineaccording to wl;light. All children wen~ treated with mebemlazole500 mg as a single dose at the end of the trial.
In the laboratory, stool samples wen: processed by theKato-Katz technique according 10 WHO reconunendalions( 13)
and examined for helminth eggs: samples containing more than10.000 eggs were re-examined using a modified Stoll dilutiontechnique(\4). Thick and thin blood smears were stained with3% Giemsa solution and malaria parasites were counted againstleucocytes to calculate parasitaemia per microliterof blood( 13 l.and identified by species. Qualitycontrol fol' malariaand intesthlalhelminths. was performed by two supervisors by re-ex;)mining10% of the slides chosen at random. Agreement belween readerswas excellent for the presence of malaria parnsitaemia (k:O.93)and parasite density were also highly reliable with an incerclasscorrelation of 0.85. Interclass c\>tTelation between staff andquality control readings were 0.88 for Ascaris lumbricoides eggper gram (epg), 0.79 tor Trichuris trielriura epg. and 0.89 forhookwonn epg. Data were entered into a microcomputer usingthe Epi-Info package.
Statistical analysis: Intensity of intestinal helminthinfections was measured by the eggs per gram of faeces (epg).The geometric mean was used to normalise the over- disperseddistribution of worm intensity. Infections were classified aslight, moderate and heavy according to WHO eliteri;) given inTable 2( 15). For bookworm. 2.000 and 5.000 epg were useJ to
Table 2
, -Prevalellce (lila illlellSit)' categories vf ilitestinalllelmilJ/l,s. lIIalwi" llIui Illu'!/I(uuria
A. /ltmbricoides T. triehiura
Prevaknce 72.0%
Intensity (epg)
Negalive 28.0%
Light 51.7%
Moderate 20.2%
,Heavy 0.1%
96.0%
-1.0%
54.9%
40.1%
1.0%
Hookworms Malaria Hacm.l[Urja
93.7% 60.6% 30.5%
(Parasi[e/~t1 of blood)
6.3% 0 39.-1% Seg:uiw 6\1.5%
74.7% 1m') 47.0% Microhaemaluria+ 16.0%
15.5% 1000-4999 12.6% Micmhaemamria+-+- 11.0%
3.5% 5000-+- 1.0% Visual hael11aluria 3.5%
A. Lumbrieoides
Ught=1-4999 epgMod=5QOO.49999 eps
Heavy:5()()()()+ epg
T. tridliura
Light=1-999 epgMod:lQOO.9999 epg
Heavy=l00<J0.+ epg
HookwormsUght=:I-1999 epg
Mod==Z0Q0-4999 epgHeavy:5000+ epg

296 EAST AFRICAN MEDICAL JOURNAL May 1997
TableJ
PmlQJetu:e ofparasitic infections by sex. age and residence
Boys Girls Age< 10 Age >=10 Rural Urban All0=-1851 n::01720 n=-1565 0=2905 n=IS72 0=700 n=3578
A.lumbricoidesany infection 73.4 70.4 74.4 70.0*· 72.0moderate+heavy infection· 21.9 IS.6 23.1 IS.O··· 203T.trichiumany infection 95.9 96.1 96.4 95.7 96.0m0der3te+beavy infection· 42.5 39.6 43.2 39.3t 41.1Hookwormany infection 94.7 92.7· 93.4 94.1 94.2 91.S· 93.7moderate+heavy infection· 21.1 16.8" 18.4 19.4 21.8 7.4··· 19.0Malariaany parasitaemia 60.6 60.7 45.7 54.3 62.4 91.8· 60.6>1.000 parasiie$1 13.8 13.4 15.8 11.7·" 13.8 7.4· 13.6Total haematuria 32.6 2S.1" 29.0 31.6 30.5Visual haematuria 4.8 2.2·" 3.5 .~.5 3.S 2.2· 3.5Microhaematuria# 28.4 26.3 26.8 28.5 31.3 16.0··· 27.0
···p<O.OOl ··p<O.OI ·p<O.OS• defined as in Table 2 #+ and ++ categories combined
Hookwonn infcction was more prevalent in boys<Table 3). Visuallmematuria was 4.8% in boys and 2.2%in girls giving a relative prevalence of 2.21 for boys (95%CI=I, 51-3. 22). TIlough less dramatic microhaematuriawas also more prevalent in boys.
Prevalence and intensity ofA. ltlmbricoide.t infectionand imensHy of T. trichillra was slightly lower in olderchildren (Table 3).Malariaparasitlemia(>I,OOOparasitcslmicmliter) wrL"also lighter in youngerchildren Cp<O.OO I).Prcvalenceand intensityof hookworm andS. haematobi1411linlections did not ditTer by age.
TIle prevalence of malaria purasil.1.cmia, hookworminfcction and haemaluria was smaller in urban than ruralschoolchildren (Table 3).TIlcse differences were smallerfor malaria than for hookworm infection and haematuria.
Multiple infections widl helminths were common.Only one child was negative forull dIe parasites. Infectionwith all three helmin tllS was observed in 67.2% ofchildrencompared to 28.l)% widl double infection. TIle associationbetwecn each pair of gcohelminths, hoth for prevalenceand intensity, was higher than expected by chance (Table4).
Children free frulll infection due to anyone of thegt-'ohclmintllS were more likely to be free from infection ofany of the other two helminths. 'Ille pairwise relativeprevalence of not being infected varies between 2.0 (CI=1.44·2.78) for A./umbricoides llnd T. Irichillra and 2.97(CI= 1.95-4.31) for T. Iricltillra and tItc hIXlkwonns. Incontrast there was a negative association betweenhookworm infection and haematuria (Table 5).
DISCUSSION
We have documented'lvery heavy burdenofparasi ticinfection in Zanzibari school children. A number ofother
Table 4Assod<ltion between geohelminlh infections categories
n Trichuris
<Loooepg ~1.oooepg
Hookwoml
<2.000epg 2783 65.9% 34.1%
<:2.000ep~ 653 28.9% 71.1%
n Ascaris
<5,oooepg <:5.oooepg
Trichuris
<l.OOOepg 2024 91.0% 9.0%
<:l,oooepg 1412 63.5% 36.5%
0 Hookworm
<2.000 epg 2:2.000epg
Ascaris
<5.000 2739 85.8% 14.2%
2:5.oooepg 697 62.0% 38.0%
p<O.OOOI
Table 5
Hookwonll infection by haematuria
n Haematuria
negative Positive
Hookworm
Negative 215 56.8% 43.2%
Positive 3214 70.2% 29.8%
p<O.OOI
May 1997 EAST AFRICAN MEDICAL JOURNAL 297
recent studies in East Africa have found high rates ofgeoheIminth infections, especially in coastal areas(l618). Although theprevalenceofinfection withany helminthvaries among these studies. they have all found. as we did.that most schoolchildren are infected with at least onehelminth. However, the intensityofgeohelmioth infectionsfrom our survey, partiCUlarly of hookworms. is striking.The tates are higher than in otherstudiesofAfrican schoolchildren and from other parts of the world such asJamaica(S), India(19) and Cbina(ZO).
We also found that 31% of school children in ourstudy hadhaematuria, areliable indicatorofschistosomiasisinfection in this populationOZ). This is the averageprevalence of haematuria maintained by the ongoingschistosomiasis control progrnmme, based on yearlyselective treatmentofchildren in schools where haematuriuis more than 20%. This survey was perfonned about tenmonths after the previous treatment with praziquantel.The 54% prevalence estimated in 1986, before theintervention. is similar to the prevalence found in otherstudies in sub·Saharan Africa. such as the 76.4% and 55%prevalence found respectively in Niger(21) and inEthiopia(18). The chronic loss of blood in urine wasrecognised by Proal et al(2l) to be an important cause ofiron-deficiency anaemin.
We found nodifference ineitherprevalenceorintensi tyofA.lumbricoides and T. tricllillra infection by sex thoughboys had slightly heavier bookworm infections. TIlescresults are in agreement with previous studies(l6,22).
We further found that visual haematuria in boys wasmore than twice as prevalent in girls. This is in agreementwith several other studies which have found higher ratesofschistosomiasis among boys, possibly retlecting higherexposure to infection due to closer contact willI waterbodies(18,23.24).
We found tllat AllllnlJricoides and T. triclliurainfections decreased after the age ten but there was nocbange in prevalence of hookworm infection with age.Others have found that intensity of infection withA.lumbricoides and T. tricllittra in school children remainconstant with age whereas that of hookworm infectionincreases steadily with age(25).
FiIk'lIly, we looked at the interaction betweendifferentparasites. We found a strong positive correlation mnongthe three helmintbs as previously demonstrated by Boothet al(26) with data from I1le s<une environment. Althoughwe expected A. lwnbricoides and T. triclliura to be moststrongly associated. our findings suggest that frequentcontactswilli soil contaminated with human faeces, equallyexpose lile children to alllhe three geohelminth infectionsregardless oforal orperculaneous transmission. AlthoughNecator americanlls is thepredominant hookwOffil speciesin Pemba, 27% of children are infected with Ancylostomaduodenale(27). and its possible faecal-oral transmissionmay account in part for the association with the otllergeohelminths. The negative correlationbetween hookworm
. infection and schistosomiasis is surprising. Childreninfectedwith hookwonnsare less likely to havehaematuria.
The expected positivecorrelation may have been reversedin Pembaas a consequence of the periodic treatment withpraziquantel that children have been receiving since 1986.
We also looked at the difference between childrenattending schools in urban and rural areas. Generally, wefound the prevalence to be the same but with an increasein intensity of the geohelminths in rural areas. Thesefindings contraSt with previous results(28) in the samepopulation, in a smaller sample size. It is interesting tonote that in rural areas where transmission is more intenseand prevalence very high. higher exposure is reflectedonly by higher intensity of infection. As expected we alsofound a lllrge difference in schistosomiasis, with theprevalenceofhaematunaalmost doubled in ruralchildren.TIle strong association between schistosomiasisand waterbodies and tlle availability of piped water in urban areasare likely to account for this difference. Malari~
parasitaemia was also higher in rural school children.Malaria inoculation rate might be lower in urban areasbecause of lower mosquito density and Ule more conunonuse of bednets(29). Urban children have also better accessto medication dIan children living in rural areas.
In conclusion, I1le parasite burden isdistributed broadlyand allllough I1lere is a difference between urban and ruralareas, parasitic infections are still high in boll}. TIle burdenof disea.,e associated with parasitic infections htlS beenshown to have a negative impact on iron status of schoolchildren in, tllis population( 11).TIle iron status of ourpopulation was very poor as illustrated by 62% of childrenhaving all~lemia and 78% of the anaemia being irondet1ciency lype. Iron-deficiency tUlaemia is an importantpublic health problem in Zanzibar schoolchildren( II}.Although schisIOSomia.,is<Ultl m'llariacmlConUibutc to its<letio logy, the most importmll cause in school children areintestinal blood loss due to hookworm infection and peK)rdie{( 11,30>-
Our findings have a number ofimplications for publichealth inlervention in Zmlzibar. First. the high prevalenceof intestinal helminthiasis lUld schistosomiasis mnongschool children justifies tlle implementation of schoolbased interventions such as periodic anthelminUlictreaunenl. Because of tlle enonnously high prevalenceand tlle availability of safe mld inexpensive single-dosedrugs. screening individuals for selective treaunent mig.htnot be cost-effective. Indicators for morbidity such asintensity ofinfection and visual haematuria on a sample ofthe populalion should be sufficient for monitoring andguiding control progranmles. Similarly. tlle relativelyevell distribution by age :mdby sex does notjustifya prioriselection of school children for {reatmenl. However, thelarge decreusl' ofsclwolattendance in girls with increasingage might cause a large proportion of older girls to bemissed out through school-based interventions inZanzibar.TIlis is an important and unresolved challenge becauseuncontrolled pamsitic infection will cause women toatlaintheir reproductive Iifes while at a high risk of anaemia.
These results advocate for an integrated controlprogramme which t.akes into account otller endemic

298 EAST AFRICAN MEDICAL JOURNAL May 1997
diseases like filariasis, that can be controlled using similarstrategies. The results of this study have led to tilepreparation of a Plan of Action for tile integrated controlof intestinal helminths, filariasis, malaria andschistosomiasis by tile Ministry of Health of Zanzibarwith .the technical support from the Division for ControlofTropical Diseases of the World Health Organization(31).Malaria control is an especially complex issue, but it canbe implemented i~. an Integrated Disease ControlProgramme where resourcesare shared and intervention iscarried out at both central and community levels with thesupervision and co-ordination from the District HealthMan.'lgement Team(3l).
ACKNOWLEDGEMENTS
To Pemba Public Health Team for excellent work in collecting
this data. The study was funded by a co-operative agreement
between the Office of Health and Nutrition. United Simes
Agency for International Development and the Johns Hopkins
University. Additional support was provided by the WHOProgl'llmme of Control of Intestinal Parasitic Infections andMinistry of Foreig.n Affairs of Italy.
REFERENCES
t. f1eahh of School Chiklren. Treatment of intestinal helminths andschistosomiasis. WHO/SCHISTO/95.112 WHO/CDSI95.1 WHO.Geneva. 1995: unpublishelJ document.
2. Stephenson. LS" Latham. M.e" Kinoli. S.N.. Kurz. K.M. andBrigh"m. H.Improvement ofphysical fjtll~ssofKen yan schoolboysinf~cted with hookworm. Tridlllris friclrillm and AscarisIlImhriC(,ides following a single do.se of alrendazole. TrlII/S. roy.Soc. Tmf'. Mct! 11Y8' 1990: lW:277-282.
~. Connolly. K.J. and Kvalsvig.J.IJ. lnf~ction.nutrition andcognitivererformanc~ in chiklren. Pilmsit. 1992: 104: SI87-S200.
4. Stephen""n. L.S.lldminth inlections. a nlo~ior factor in malnutrilion.lV/tI.l1Il/r. Fan/III. 19l)·k 15: 169-172.
5. Nokes. C. and Bundy. D.A.P. Compliance and absenteeism inSChlKll children: implications for h.::lminths control. TrailS. roy.Sue t1"(l{/. Mell. "Y8. 1993: 87: 141\-152.
f>. Kere. N.K.. Keni. 1.. Kcre. J.F.. Bobogare. A.. Webhcr. R.lI. andSouthgale. B.A. Th..: economic imlYo.lct of I'hl,mudillllJfillcipwulIJmal:.ria on education inve.stOlen!: a Pacific island study. SOIi/heal·tAsiC/II.!. Iml'. Mel!. Pub!. flIIII. 199~: 24:1\59-1\63.
7. Savioli. L Dixon. II.. Kisumku. P.M.. and MOll. K. E. Control ofOlorhidity Line to Sd,is".WlIIUI lu,clIJ(/tobillm on Pemba Island:programme organization anLi man:Lgemenl. Trop. Med. Pam.•if.1989: 40: IRl)-194.
X. Renl1anathan. E.. En;ole. Eo, Alhonico. M.. De Gregorio. G.. Alawi.K.S.~ KisuOlku. II.M. and Savioli. L. Evol111ion of op.:rationalresean:h anll developmenl of a nalional conlml strah:gy againstintestinal hdmil11hs in I'emha bland. 191\1\-92. Rull. IV/ii Hltlr.()r~l/Il. 1995: 73: 1ll3-tW.
'J. M;tola. Y.G.. Mwita. U.. Masoud. A.E. Malaria in the islands ofZanzibar and I'e'mha I I yeurs afler th~ susp.!nsion of a malariaeraLlication programme'. Cft"'. Afr. J. Me,L 19l14: 30:91-92. 95-96.
IO. National l'ro~raI1lm..: of Action for thl< Surv,va1. Protection andDt<velopment"ofChildren in Z~n:lio"r I<)'J2-2000. Mi nislry "fSlatePlanning, Zanzihar. 1992: unpuolisheLi Llocumenl.
II. Stoltzfus. R.J.. Chwaya. H.M.• Tidsch.J.. Schulze. K.1.. Albonico.M. and Savioli. L. Epidemiology of iron deficiency anaemia inZanzibari schoolchildren. Allier. J. elill. Nutr. 1997: 65:153-159.
12. Savioli. L., Hatz. C.. Dixon,.H., Kisumku, U.M. and Mott, K.E.Control of morbidity due to Schistosoma haematobium on PembaIsland: egg excretion and haematuria as indicators of infection.Amer. J. 'rop. Med. Hyg. 1990: 43:289-295.
13. Basic Laboratory Methods in Medical Parasitology. World HealthOrgani7.ation. Geneva. 1991.
14. de Cameri I. Aggiornamento di un metodo per il conteggio di ailecariche Lli uovadi elminti neHefeci. G Mal.//r[. Parassit. 1992; 44:854-855.
15. Prevention and concrol of inlestinal parasitic infections. Report ofa WHO Expert Committee. Technical Report series 749. WHO.Geneva. 1987; page 12-13.
16. Kightlinger. L.K.• Seed. RJ. and Kightlinger. M.B. Th~
~pidemiology of Ascaris ltlmbricoides. TricIJuris tricflium. andhookworm in children in the Ranomafana rainforesl. Madagascar.J. Parasit. 1995; 81:159-169.
17. Chunge. R.N.• KalUmoo. P.N.. Nagelkerke. N.. Kaleli.N.• Wamwea.M.. Mutiso. N.. Andala. E.O. and Kinoti. S.N. Intestinal parasilesin a rural community in Kenya: cwss-seetional surwys withemphasis on prevalence. incidence. duration of infection. amipolyparasitism. uw Afr. Med. 1.1991: 68:/12-123.•
18. Erko. B. and Tedla. S. A prt<li minary survey for inteslinal parasitesin the Ti.~ Abaytown. Northwest Ethiopia. with special reference toSt:!risrosoma l/ulIIsolli. 1993; East Afr. Med.1. 1993: 70:34-36.
19. Saxena. P.c. and Prasad. B.G. A review of surveys On intestinalhelminths in Inwa./tuiiall 1. Pub/.liItlt.l971:15:31-38.
20. Yu. Senhai. Control 'if parasitic dist<ases in China. Current statusand prospects Chill. Mt·d. .I. 1996: 109:259-265.
21. PmaJ. A.. DaouLia. H.. Develoux. M.• Se/lin. B.. Galan. P.• Hercberg.S. Consequences of Schistosoma haematobium infection on theiron stallLS of schoolchildren in Niger_ Amer. J. trop. Med. Hyg.1992: 47: 291-297.
22. Holland. C.V. anLi Asaolu. $.0. Ascariasis in Nigeria. PamsilolToda~ 1990:6: 143-147.
23. Akl.lf~ngwe. P.F.. Onwuliri. C.O.E.. Titanji. V.P.K. and Okwuosa.V.N. Prevalence of schistosomiasis and other intestinal helminthinfections among senior primaryschoolchildren in Makenene SubDivision. Cameroon. J. Helll/illl//Ol. 1995; 69: 103-105.
24. Mgeni A.F., Kisumku. V.M.• McCullogh. F.S.. Dixon. H.. Yoon.5.S. and Mott. K.E. Melrifonate in the control of urinaryschis[()sonuasis in Zanzibar. 8/11/ Wid Hlth. Orgall. 1990: 68:721730.
25. Bundy. D.A.P.. Hall. A.. Medley. G.F. and $avioli. L. Evaluatingmea<ure.' to control illlestinal parasitic infections. lV/d. Hlth. Sm.Quarr. 1')1)2; 45: 168-179.
26. Booth. M.. Bundy. D.A.P.. Albonico. M.. Chwaya. H.M., Kassim.S.A. anLi Savioli. L. Associations between multiple geohelminthspecies in schoolchildren from Pemba Island. Parasitology. 1997;(in press}.
27. Albonico. M.. Cancrini. G.. SlOltzfils. RJ., Tidsc;:h, J.• OJwaya.H.M.. Faki. B.F.. Ercok E. and SavioH L. Epidemiology ofAncylostolllll duodennle and Necator america/illS infectio~ in EastAfrican schoolchildren and correlation with iron-deficiencyanaemi". Parasitology (submilled).
28. Albonico, M.. de Carneri. I.. Di Matteo, L.. Ghiglietti. R.• Toscano.P.. Uledi. M.K. and Savioli. L. Intestinal parasitic infections ofurban anLi rural children On Pemba Island: implication for control.A/III. tmp MetL Parisir. 1993; 87: 579-583.
29. Najera. J.A. and Hempel. J. The burden of mnlaria. CTDIMAL96.10. Malaria Unit. Division of Conlrol of Tropical Diseases.WHO. Geneva. 1996: page 5 . UnpublisheLi document.
30. Stoltzfus. R.J.. Albonko. M.. Chwaya. H.M. SavioH. L.. Tielsch. LSdlUize. K.J. and Yip. R. Hemoquantdeterminalion ofhookwormrelaled blood loss and its role i 11 iron deficiency in African children.Amer. J. rrop Med. Hyg. 1996:55: 399-404.
31. Plan of Action for the [ntegrateLi Control of Filariasis. Intesti nalhelminth.'. Malaria and Schistosomiasis. Ministry of Health ofZanzibar. August 1996. Unpublished documenl.

Human Organ'%auon. Vol. 56. No.2. 1997Copyri~lll Cl 1997 l>y the SOClelY for Applied Anthropology0018·7259/97/020182·8S 1.301l
Estimating Reactivity in Direct ObservationStudies ofHealth Behaviors
JOEL GITTELSOHN, ANITA V. SHANKAR, KEITH P. WEST, JR.,RAVI M. RAl\I, A~D TARA GNYWALI
Direct observation teChniques arc increasingly being used to measure human behavior as part of health research and interventionstudies. One problem with this approa.;;h that has not been welJ-explored is the effect of the observer's presence on the behaviors beingobserved, the reactivity effect. This article examines reacthlty effects in a direct observation study of child care and feeding prncticcsin rural Nepal. Trained field workers conducted day·long stl1lctured observations in 160 households. seven times per household. Ourresults indicate that the first day ofobservation is more rea::tive than later days. A nUrIJbel" of individual behaviors changed in frequencyfrom observation day to observation day. including punishment of the child and method of serving food to the child. Observation dayswith higher levels of reactivity showed an increase in the number of positive health behaviors and a decrease in the number of sociallynegative behaviors. We conclude thal the validity of direct observation studies ofbehavior can be enhanced by examining and controllingfor reactivity effects.
Key words: direct observation. reacU\'ity, measurement, b-..aIth behaviors. Nepal
Direct observation is a method for assessing human beha,iorin natural settings. In recent years. observational methods
have begun to be incorporated into health interventions andhealth-related studies as a means of identifying behaviors whichplace individuals or households at increased risk for morbidityand mortality. and for evaluating the effectiveness of programsto promote positive health behaviors. For instance. structuredobservations have been used to estimate intra-household foodallocation patterns in Nepal (Gittelsohn 1991). dietarymanagement of diarrhea in Peru (Bentley 1991). and sanitarybehaviors in Bangladesh (Stanton and Clemens 1987) and inBurkina Faso (Curtis 1993). .
The primary advantage of direct observation over othermethods for acquiring infonnation on how humans behave isthat direct observation captures actual behavior. Most methods
Joel Gittelsolm is Assistant Professor in the Center for HumanNutrition Division ofHuman Nutrition,Department of/ntemaJiOfUlIHealth. School of Public Health, Johns Hopkins UniversiT)',Baltimore, MD 2/205-2179; Anila V. ShankLJr is a ResearchAssociate in the same Center and Division Ravi M. Ram is adoctoral student in the same department: Keith P. West, Jr. is anAssociate Professor in the same Center and Division. Tara Gnywaliis a graduate student in the Department of Sociology andAnthropology. Tribhuvan University, Kathmandu, Nepal. Theproject is fwuJed through Cooperative Agreement No. DAN 0045A-00-5094-00 berween the Center for Human NutritionID=Center for Preventilif Ophthalmology, The Johns HopkinsUniversiry and The Office of Health and Nutrition. U.S. Ageruyfor International Development, with additional suppor/from TaskForce Sight and [.jfe (Roche, Basel), and NIH shared instrumemgrant No. SlO·RR 04060.
for estimating human behavior rely on reports of previousbehavior by the human actor or a proxy (as in the motherreporting what her child ate). For many reasons. there isfrequently a big difference between what people say they do(or did) and what they actually do (Ricci et af. 1995). Peoplemay forget what they did. or prefer to answer with what isconsidered locally appropriate, or what they think theinterviewer would like to hear (Bentley et al. 1994). A secondadvantage of structured observations lies in their ability tocapture the context of human behavior. Much human behavioroccurs as a result of or precedes other behaviors. This kind ofinfonnation. sometimes termed the "behavioral stream." canbe captured best using direct observations.
Despite these advantages. a number of concerns have beenraised about the validity of direct observation data. Theseconcerns were laid out by Haynes (1978) and include: 1)excessive variance in observers (i.e.• inaccuracy) or observationsituations (e.g. sampling error): 2) inadequate or erroneoussampling procedures: 3) observer bias and drift; 4) inaccuraterecording or coding methods; 5) inadequate development ofcodes; and 6) reactivity. This article will focus on the lastconcern.
What is reactivity? Reactivity occurs when actors changetheir behavior due to the presence of an observer. Baum er al.(1979) noted that "the presence of an observer constitutes asignificant social stimulus which may cause subjects to altertheir behaviors and which may elicit socially desirableresponses. The investigator is then presented with an atypicalsample of behavior which deviates from that manifested by thesubject outside of the research setting." Of concern. then. isthat these changes in behavior will create systematic bias inthe data, particularly those behaviors of interest for the study.For instance. in a study of food allocation. family members
182 HUMAN ORGANIZATION

might change their dietary intake (e.g.. eating more expensivefoods) in response to the presence of the observer.
Reactivity can potentially effect the validity of a study. Inintervention studies. it can compromise internal validity bydirectly affecting measurement of the dependent variable sincereactive behavior changes may be wrongly attributed 10 anexperimental intervention (Kent and Foster 1977). It can effectthe generalizability (external validity) of studies by leading toerroneous study findings.
The importance of investigating the phenomenon ofreactivity has not escaped other investigators. Probably thesingle most comprehensive body of work comes from the fieldof psychology and behavioral sciences. Direct observation ofhuman behavior is a hallmark of many psychological studies.including studies of children at play. the interactions betweenadults and children. of couples. and so on.
Psychologists have studied the phenomenon of reactivityfor many years. Studies have varied considerably in terms ofthe paradigm used and according to the selling of theobservations. Baum et al. (1979) in a review of 17 studies ofadult-child interactions which had a reactivity componenL foundreactivity reponed in three fourths of the studies. Most of the17 studies were conducted in a laboratory (8/17) undercontrolled circumstances or in classrooms (5/17) - very fewof the studies were conducted in the home environment (4/17).Baum et al. conclude from their review that reactivity was anissue - with cenain behavioral biases more common thanothers. Adults reacted to the presence of observers with morepositi ve and neutral verba") interactions and physi calperformance. There was no change in tenns of negatjvecategories of behavior. Children show no clear trend inreactivity. and the authors conclude that there are not enoughstudies of reactivity in children yet to justify conclusions. Inthe 17 studies. three different paradigms for measuring reacti'.itywere used:
I) Habituation: where behavioral changes over timeindicate adjustment to the presence of the observer. 11 isassumed that such changes refl ect initial reacti vity andsubsequent adaptation to the observer's presence.
2) Conspicuousness: which involves a comparison ofprocedures which vary the obviousness ofthe observer'spresence to the person(s) being observed (Le. observerpresent in room. use of a video-tape recorder. observerbehind one-way mirror).
3) Awareness: which involves manipulation of subject'sconsciousness ofbeing observed (Le. telling the subje:::tthey will be observed and when, telling the subject theywill be observed but not at what times. not telling thesubject they will be observed).
The awareness paradigm was the most common means aftestingreactivity effects in these studies. All three of these paradigmshave disadvantages. Habituation relies heavily on assumptionsof patterns of reactivity. and how these patterns will changeover time. The conspicuousness paradigm is useful primarilyin highly controlled settings, such as the laboratory. In a studyof couples, Carpenter and Merkel (1988) found no differencein reactivity related 10 the use of a one-way mirror, comparedto audio-taping or video-taping. Manipulating awareness ofbeing observed has a number of obvious ethical concerns.
The habituation paradigm deserves further discussion. Thereis evidence to suppon me premise that initial observations arereactive. but later observations are not (or much less so). Severalinvestigators (Haynes and Follingstad 1977; Moos 1968; Purcelland Brady 1966) have found that reactivity decreases asobservation sessions continue. Haynes (1978) observes."Reactivity may also be inferred from a slope in the resultantdata, although slope may also be a function of otherdetenninants. A gradual increase or decrease in rate may suggestthat initial levels of the behavior were a function of the reactivityof the observation process and thaI. because ofhabimation.laterbehavior rates are a more accurate representation of the "true"rate."]n one study. while reactive positive behaviors decreasedas subjects became more accustomed to being observed, theyimmediately increased when a new observer was introduced(Zegiob er al. 1979).
Haynes (1978) concludes. "under some condirians theobservation process results in a significant change in thebehavior of target subjects. The task of the behavior analyst isto understand factors determining reactivity and'methodsavailable to reduce. control or predict its effects:' Despite thework that has been conducted. there are large gaps in ourknowledge of reactivity effects in observational studies ofhuman behavior. A gap that directly applies to the topic of thisanicle lies in the absence of information on reactivity effectsin regard to health behaviors. To our knowledge, no studieshave been conducted in this area. In addition. few studies ofreactivity have been conducted in naturalistic settings. This isa critical omission when doing health-behavior studies. Healthbehaviors are expressed within the household in the context ofdaily life. and would be difficult to examine in highly controlledsettings, especially in developing country settings.
The overall purpose of this paper. then. is to examinereactivity effects in the context of a household-level healthbehavior study in a community setting. The reactivity data hereuse the habituation paradigm, where trends in the frequency ofbehaviors are viewed as evidence of reactivity. We seek 10
answer the following questions:
I) What is the pattern ofreacti vity in direct obSet"Vationsofhealth behaviors? Are first observations more reactivethan later observations?
2) Over multiple days of observation. will there bestabilizing trends in the frequency of key health-relatedbehaviors (indicating habituation to the presence of theobserver)? When does this occur? •
3) Do more reactive days of observation show differentpatterns of health behaviors than less reactive days ofobservation?
4) Do more reactive days of observation show differentpatlerns of socially positive and negative behaviors thanless reactive days of observation?
5) What is the significance of our findings for otherinvestigators planning to use observational techniquesto explore and measure health behaviors?
Methods
The reactivity data presented in this anicle were collectedas part of a study looking at the behavioral detenninants ofvitamin A deficiency among children in rural Nepalesehouseholds. The study was conducted in Sarlahi district in the
VOL. 56. NO. 2SUMMER 1997 183

Code Definition
Table 1. Codes for Summary Estimates of Reactivityby Household Members
Very minImal contact with lhe observer. Household memt>ers may
exchange greetings 'Nuh the observer. but othel"'''''lse do nOInouceably change behavio~.
2 Interacts minimally with the observer (e.g. 1-2 times askingquestions). There may be a few minor changes in behavior (e.g.offering food to the observer. crowd galhers dunng observallon).
17665
oooI
Mean STD Minimum MaximumReactivity Code
Low-level reactive behavior 0.757 1.663
Moderate-level reactive behavior 0.321 0.774High-level reactive behavior 0.090 0.433
Overall observation day reactivity est. 1.6J2 0.828
Table 2. Frequency ofThree Behavior-level ReactivityCode Usage and the Reactivity SummaryEstimate (N=llOl Day-long Observations)
3 Interacts 3·5 times with the observer dunng the dtl)'. Women mayhide their face while doing acti\'1lies (may stay in the house). Foodusually offered to observer.
5 Change in household feeding or child care behaviors. Foods maybe prepared especially for the observer. ThiS is different from 114because the household members verbally "erified the change inbehavior is due 10 the presence of the observer. Foods may appear
to be not allocated to household members so Ihey can be gwen 10
the observer.
4 Interacts with the observer more than 5 limes. Women may hidebreasl-feeding or other eating from the obser\'er. Foods may beprepared especially for the observer.
rural Terai (lowland) region of lhe country. The population ofthe area is predominantly Hindu. living primaril~ at asubsistence agricultural level.
Seven day-long observations were conducted in each of l61study households during the period from April. 1993. to ~ay.
1994. Observations in a household were spaced roughly two
months apart. Ten male local high school graduates were trainedfor three months as observers in portion size estimation andwere standardized in the use of the behavior recordinginstrument (Giltelsohn er al. 1994). Observations were eventfocused; each time a behavior of interest occurred. it wasrecorded. A minimum of one record per fi ve minutes wasrequired when behaviors remained constant for prolongedintervals. e.g. playing. walking, sleeping. Priority was given toobserving the behavior of a focal child 2-5 years old and that ofcaregivers for that child. However. observations were recordedfor other household members. particularly other children.Observers recorded the following information regarding eachbehavioral event: time, location of behavior. actor doingbehavior. recipient of behavior (if any). actual behavior (oractivity) observed. food name (if any). food condition. and foodquantity. Observations were conducted from early morning (6am) until the focal child went to sleep for the night and theevening meal had been consumed (usually around 8 pm). Theobserver took a }·4 hour break in the middle of the day.
Observed behaviors were recorded as 5 letter mnemoniccodes. each representing a Nepali phrase (e.g. AFKLI stoodfor Aaphno khaana linchha, or "person takes their own food").In tota!. 1] 0 different behavioral codes were developed for thestudy. The codes covered seven topical areas: child care. foodpreparation and serving. general. observer-related. personalhygiene and health. conversation, and work.
In total. ] 101 days of observation were collected. Severalhouseholds were dropped from the study due to migration. andthree households refused to continue with the observations afterthe first visit. An average of 363 lines of observation werecollected from each study household for each day of observation.yielding a total of 399.730 total lines of obsen'ation.
LIMITING REACTIVITY
Observers were trained to behave in a manner which wouldreduce overall reactivity as much as possible. This includedvisiting the household for a short period prior to beginning actualobservations. training on how 10 be inconspicuous. not to engagein child care activities. and in particular, not to participate inhousehold food behaviors.
OPERATIONALIZING REACTIVITY
Measurement of reactivity was built into the study from theoutset. Two systems for estimating level of reactivity were used:1) A set of codes for reactive behaviors were created; and 2}An overall estimate of level of reactivity was made by theobserver at the end of the observation.
Three reactivity codes were created: Low. Moderate andHigh. Low-level reactivity behaviors. most commonly involvedwatching the observer. The Moderate-level reactivity code wasused when the observer's work was interrupted by others. oftenin the form of conversation. This included instances of beingasked for favors. medicine. etc. The High-level reactivity code
was used to indicate a behavior with an obvious high level ofreactivity to the presence of the observer. This code was usedwhen actors changed behaviors of interest to the study especially feeding. preparation of special foods and child care.The decision on whether or not to use this code was madeinitially by the observer, but later corroborated by p"erson(s)observed.
A summary estimate of reactivity was made by the observerat the end of the observation. Observers were asked to SCOrereactivity of the observation along a scale of J to 5, with Iindicating little to no reactivity and 5 indicating very highreactivity. where household members altered behaviors ofinterest to the study (i.e. feeding and child care) (Table I).
Table 2 presents the mean number of times each reactivitycode was used for all the days of observation combined. aswell as the mean summary estimate of reactivity made by theobserver. The Low-level reactivity code (LRC) was used anaverage of 0.757 times per observation visit. while theModerate-level reactivity code (MRC) was used at about halfthat frequency. The code indicating highly reactive behavior(liRC) was very rarely usedThe mean of the Overall ObservationDay Reactivity Estimate (OODREACT) was 1.605 (on a scaleof lto 5). indicating a very low level of reactivity, when
184 HUMAN ORGANIZATION

Score1.6
1.4
1.2
1
0.8
0.6
0.4
0.2
......._.._._...•.•_-_ .._---
o1 2 3 4
Day of Observation
5 6 7 ;
Figure 1. Change in Reactivity Score by Day of Observation
compared against an average of 363 recorded behaviors perobservation-day."' .
A principal components factor analysis was conducted onthe mean daily scores for Low. Moderate and High-levelreactivity and on the Overall Observation Day ReactivityEstimate to determine whether these items could be combinedinto a scale (Mahoney el al. 1995). Two factors had eigenvaluesgreater than 1: (a) a combination of the Low-level reactivitycode. Moderate-level reactivity code and the HouseholdReactivity Summary Estimate. and (b) the High-level reactivitycode alone. In total. these two factors account for 67.8% of thevariance. We decided to combine all four variables into a singlereactivity score, using the standardized scoring coefficientsproduced for the first factor as weightings. The final reactivityscore was calculated as follows:
Final Reactivitv Score =(# LRC • 0.45791)-+(# OODREAcT· 0.43537) -+ (# MRC· 0.41951)-+(# HRC • 0.29307) - 0.43~37
The lowest possible value of the final reactivity score (0.43537)was subtracted in order to create a scale with the base score ofO. The data were then divided into terciles for analysis. In thismanner, each observation day was described in terms of itsoverall level of reactivity.
It was necessary to eliminate several behaviors before furtheranalysis could be conducted. As the observations wereconducted over a year. there is a strong possibility thatfrequencies of certain behaviors would be effected by changesin season. Twenty-two such codes were dropped from theanalysis. Codes dropped due to possible seasonal effectsincluded gathering wild greens. work in agricultural fields.gathering firewood., and so on. AnotlJer set of codes droppedfrom the analysis were those with frequencies that might be
affected by maturation of the child over the course ofthe study.Fo~us child ages at the initiation of the study ranged from 2 to5 y~ars. Certain of these behaviors. such as the child defecatingor urinating in plain sight of the observer. are less likely tooccur as the child grows older.
Results
PATTERNS OF REACTIVITY
Household observations were characterized by relativelyhigh initial reactivity, followed by much less reactivity fromthe second observation day on. Figure 1 presents the mean FinalReactivity Score for each of the seven days of observation. ThePearson correlation coefficient for this relationship is -0. 175(p<O.OOO 1). Therefore. using our observer-generated codes forreactivity. it appears that the initial day of observation is morereactive than later days.
CHANGES IN THE FREQUENCY OF KEY BEHAVIORS
Reactivity can also be examined indirectly by examiningchanges in the frequency of behaviors from observation visitto observation visit; the key assumption of the habituationparadigm. Given the finding of higher initial reactivity basedon specific reactive behaviors recorded by observers, it isimportant to see how this mayor may not relate to other keybehaviors. .
Figures 2-5 indicate trends in the daily frequency of selectedbehaviors involving the focus child. Physical punishment ofthe child did vary significamly by day of observation, with theamount of mild (J:-.132, p<O.OOOl) and moderate beating (J:.I 24, p<O.OOO1) of the child decreasing with later observations
VOL. 56, NO.2 SUMMER 1997 185

Legend
~ Hits ughtly
..- .. Hits Moderately
~K Beats Severely
73 4 5 '6
DAY OF OBSERVATION
............. 1\
......"" .....
-._-~_.._.~.....-....._..~
1 2
1~]
, II
!
~ 0.81a:w
0.6 Ja.enw::::!:F'* O.4l
O.2li
0 1
Figure 2. Trends in physical punishment involving the focus child
~a:wa..enw:EF,.,
3.6
3.2
2.8
2.:],.6J
+'\,,,,,,
\ ;+---\ , ...... '\ , ~
, "\ '\ _ ..tf........ . .
Legend
~. Holding
Affectionate Gestu
,.: ~ Picking Uce
1.2
0.8
0.4"
0..:.--.,..--------,,...-----.....,.---.,..----,--1 2 345 6
DAY OF OBSERVATlON7
Figure 3. Trends in displays of affection involving the focus child
, ,
(Figure 2). No significant trend was observed in the frequencyof harsh beating. a fairly rare occurrence. Nor was anysignificant trend found in the frequency of individual behaviorsrelating to displays ofaffection (Figure 3). including affectionategestures to the child, holding the child, or picking lice from thechild's hair.
In tenns of food serving, changes were observed in themanner in which food was served to the child from one
observation to t.he next In all instances where the focus childreceived food (Figure 4), there is a tendency for the child toreduce the frequency ofself-serving (r=-.1 04. p<O.00b6), to be .served automatically less often (r=-.246, p<O.OOOl) and to beasked if they want food more often (r=.083, p<O.OOS6) in laterobservations..•No significant trend is observed in the frequencyof times the focus child asked for food and was served food.Nor were any significant trends observed from visit to visit in
186 HUMAN ORGANIZATION

5,
4.5-:
4~> 3.5 ~~
3~a:w IQ.
Jrnw 2.5 ,~
j
i= 2-'II:
1.5 ~II
1 JiI
0.5 ~
'",,'-.......'-
Leoend
01ild A!;lal fir andiSGwnFood
ser.e-Ssws Food,WIlNl\.CAsking
SeMI" AsIa;, thmSetws Food til CNld
,i
0':'"-----,------,.------,---.------,-----,-2 3 456
DAY OF OBSERVATION7
Figure 4. Trends in how food is served to the focus child
0.5 -:
0.4-
0.3 \r--IA\ ./V
..""....,," ......~, ' •....._..-.~~.~
••••••••••••••.t
Legend
~ Non-DiscriminateI')
-_. Ignores Request
: :~ Dlsaiminatory
1 2 3 4 5 6DAY OF OBSERVATION
7
Figure 5. Trends in types of food serving refusals to the focus child
terms of the frequency of food serving refusals. where the focuschild asked for food but was refused (Figure 5).
REACTIVITY EFFECTS ON HEALTH BEHAVIORS
How does reactivity effect the health behaviors ofhouseholdmembers being observed?This question is ofcentral imponanceto investigators and program planners who wish to use
observation to obtain estimates ofhealth-related practices withinthe household. In order to examine reactivity effects on healthbehaviors in this study. we developed two additive scales:positive health behaviors and negative health behaviors. Fromthe list of household behaviors. 15 positive and 7 negativehealth-related behaviors were identified. What was consideredpositive or negative was determined from a biomedicalperspective. Positive health behaviors included: encouraging
VOL. 56. NO, 2SUMMER 1997 187

Table 3. Scaled Positive and r-;egati\'e Health Beh:;vior Scores by Day of Observation Reactivity Effect
All Household BehavIors Beha,~ors Involving the Focus Child
Reacti"ny (TOTREACTI) ASOVA Re:lctlvllY (TOTREACT) A:"OVALOW MED HIGH LOW MED HIGH
Me:ln SId Error Mean SId ElTor ~le;l/\ StdE=, F MeJ1l SId Error Mean SId Error Mean SId Error FPOllla'~ H~a{lil B~ila~'lors
1.000 0.022 1.002 0.028 0.970 0.0:': 0.5.1 1.000 0053 1.059 0.058 1.187 0.056 3.11"N~gali"~ H~a{lh BeNn'iors
1000 0.~2 0.979 OQ.16 0937 O~~ 055 1.00.: 0.101 1.172 0.113 1053 0.10, 063
• p<O.05. Repon:d:lS ratios 10 10..... re:l~tivily t:r~ile summed over a:: ~:; of observauon
Table 4. Scaled Positive and !\egati\'e Social Bet:;vior Scores by Day of Observation Reactivity Effect
All Household Be haviors Behaviors Involving the Focus Child
Reaclimy (TOTRE.-\CT) ASOVA Reacti~'ity (TOTREAcr) ASO\·.:"LOW MED HIGH LOW MED HIGH
Me:ln SId Error Me;l/\ SId Error :-'lean SId E:7::: F Mean Std Error Mean Std Error Me;l/\ SId Error FPoma'e Soclaf B~hanors
1.000 0.022 0.969 0.02.1 1.006 0.0:': 068 1.000 0.033 0.993 0.033 1.003 0032 003N~gali,·t SocIal B~ha"fors
1.000 0048 IlJQ 0.052 0.9S8 ON: 2.S3 1.000 0.052 1.018 0.051 0.840 0.~2 ':.O~·
• p<O.05. Reponed as r:atios co low reactivity ter~iJe summed o\'er ~: ;!.;lys of observation
someone to eat more food. picking lice. brushing teeth. cleaningup feces in a sanitary manner. and using soap for cleaning!washing. Negative health behaviors included beating som~one
moderately or strongly. refusi ng requests for food (in adiscriminatory fashion). injuries. and cleaning up feces in anunsanitary fashion.
TOlal Observation-day scores for both scales are reported asa ratio to the score for Ihe least reactive days of observation.Final Reactivity Scores have been divided into terciles usingthe TOTREACf variable. Anumber greater than one indi.:atesa relatively higher frequency of health· related behaviors(compared to low reactivity days). while a number less thanone indicates the opposite. From Table 3. it appears that t..'Jereis a trend towards decreasing frequency of both positive andnegative health behaviors with more reactive observation daysat the household level, however these differences were notsignificanl using analysis of variance procedures. However.w~en heallh scores were calculated using behavioral events onlyinvolving the focus child. the analysis of variance proceduredid show a significant increase in positive health behaviors withgreater reactivity.
REACTIVITY EFFECTS ON POSITIVE/NEGATIVE SOCIALBEHAVIORS
As reported earlier. the literature indicates that sociallypositive behaviors are more likely to occur in initial, morereactive observation periods. Behaviors considered sociallynegative are presumed to be less frequent in those initial periods.Twenty-three socially positive and nine socially negativebehaviors were identified based on our working knowledge ofthe culture and setting. Socially positive behaviors included:affectionate gestures, holding the child, picking lice.encour:lging someone 10 eat. cleaning up feces, and teachingsomeone. Socially negative behaviors included beatingsomeone, refusing to gi ve someone food (discriminatory).
stealing food from anolher, fighting. and quarreling.Again. scores for both scales are reported as a ratio to the
score for the least reactive days ofobservation. Anumber greaterthan one indicates a relatively higher frequency of socialbeha\;ors (compared to low reactivity days). while a number lessthan one indicates the oppoSite. From Table 4. it appears that thereis no specific trend towards increasing or decreasing positive ornegative social behaviotS with more reactive observation days atthe household level. On the other hand. there is a significant trendtow:lt(is decreasing the socially negative behaviors with morereactive days when just the focus child is considered.
Discussion and Conclusion
We were able to operationalize a reactivity variable thatproved useful in evaluating the quality of our observationaldataset. Overall, our measures indicated that the level ofreactivity was low. Of the seven days ofobservation. the initialday was considerably more reactive than other successive days.
After eliminating a number of behaviors that are effectedby season and growth or aging of the child, trends in thefrequency of remaining specific key behaviors were observedover the course of the observation period. In tenns of physicalpunishment of children, it is important to observe that Ourfindings are in the opposite direction that one would expectfrom the literature. Children were punished much morefrequently in initial observations than in later observations. Thistrend mayor may not reflect reactivity to the presence of anobserver. It is possible that the focus child was punishedfrequently in the beginning of the observations due to theperception thaI he or she was disturbing the observer. On theother hand. this trend may reflect an aging effect. where youngerchildren make more frequent mistakes and need to be disciplinedmore often. Ch:mges in patterns of food serving to the focuschild were observed and may also be related to an unanticipated
188 HUMAN ORGASIZAilON

maturation effect. As children grow older. they may be lesslikely serve themselves or to be automatically served - andmore likely to be asked if they want food.
While no appreciable reactivity effects were observed interms of overall scores of positive and negative social behaviorsor negative and positive health behaviors when looking at theentire household. significant differences were observed whenjust behaviors involving the focus child were considered. Theincrease in the number of positive health behaviors related tomore reactive days is believable as many of the behaviorsinvolved cleaning. an activity that household members are likelyto perform in the presence of an outsider. The significantdecrease in the score for negative social behaviors in morereactive observation-days agrees with findings in thepsychological literature on reactivity. It is interesting that thenegative social behavior scale moves in the opposite directionof some of its component variables. namely physicalpunishment of the child. On closer inspection of the data.quarreling. scolding and fights involving the focus child occurmuch more frequently than do episodes of physical punishmentand account for this reversal. It appears thaI as levels ofpunishment go down. negative social behavior on the part ofthe focus child increases. We interpret these results to mean aswe moved on with our observations in a household. reactivitydecreased and behaviors became more normal.
This study in Nepal has several implications for studies usingdirect observations of health behavior. First. reactivity effectsmay very well playa role in patterns of health behaviorsobserved. especially positive health behaviors. Second.reactivity appears to effect the frequency of negative socialbehaviors. These. in tum. may be related to patterns of healthbehaviors in the household. Third. these effects appear strongeramong selected household members (in our case. among youngchildren). It is also possible that since we were focusing ourobservations on young children. we only had sufficient numbersof behaviors recorded to detect differences for that age group.Finally. most of the reactivity appears to occur during the firstday of observation.
This last finding is of key importance to investigators andprogram planners intending to conduct direct-observationstudies of health behavior. The social science public healthliterature provides numerous examples of the "single shot"observation study. where households or individuals aremonitored on one occasion only. This approach to doing directobservation studies should be reconsidered. When multipleepisodes are collected for the same individual(s). eliminationof the first observation day's behavioral data, or standardizingit according to successive days is an option to control forreactivity effects.
It should be understood that our most reactive observationdays were actually only relatively more reactive than others- there is no way to objectively stale one observation visitwas reactive while another was not. We conclude that directobservation provides a replicable and robust means forestimating behaviors of importance for health behavior studies.The validity of the method can be enhanced by measuring andcontrolling for reactivity effects.
REFERENCES CITED
Baum. Cynthia G.• Re:\: Forehand. and Leslie E. ZegiobJ979 A Review of Observer Reactivity in Adull-Child
Interactions. Journal of Behavioral Assessment 1(2): 167-178.Bentley. Margaret E.. Rebecca Y. Stallings. Mary Fukumoto Moo and
John A. Elder1991 Maternal Feeding Behavior :md Child Acceptance of Food
during Diarrhea. Convalescence. and Health in the CentralSierra of Peru. American Journal of Public Health 8I(l):43-47.
Bentley. Margaret E.. Marieke T. Boot. Joel Gittelsohn. and Rebecc:lY. Stallings
1994 The Use of Structured Observations in the StudY of HealthBehavior. Occasional Article No. 27. IRC lnternati'onal Waterand Sanitation Centre: The Hague. The Netherlands.
Carpenter. Linda J. And William T. Merkel1988 The Effects ofThn::e Methods of Observation on Couples
in Interactional Research. The American Journal of FamilyTherapy. 16(1):144-157.
Curtis. Valerie1993 Structured Observations of Hygiene Behaviors in Burkina
Faso. Bulletin of the World Health Organization 7In ):23·32.GitteIsohn. Joel
199 t Opening the Box: lntrahousehold Food Distribution in RuralNepaL Social Science and Medicine 33( 10): 1141·1154.
Gittelsohn. Joel. Anita V. Shankar. Keith P. West. Jr.. and Ram P.Pokhrel
1994 Accuracy ofDirect Observation for Food Intake Estimationin Rural Nepal. Journal of the American Dietetic Association.94 (11):1273-1217.
Haynes. Stephen H. and D. R. Follingstad1977 Behavioral Assessment of Marital Dysfunction."
Unpublished Manuscript, Southern lllinois Universitv.Haynes. Stephen H •
1978 Principles of Behavioral Assessment. New York. NY:Gardner Press. Inc.
Kent. Ronald N. and Sharon L. Foster1977 Direct observation procedures: Methodological issues in
naturalistic settings. In A. Ciminero. K. Calhoun. and H.E. Adams(cds). Handbook of Behavioral Assessment New York: Wiley.
Mahoney. Colleen A.• Dennis L. Thombs. and Christine Z. Howe1995 The Art and Science of Scale Devc:lopment in Health
Education Resc:arch. Health Education Research 10(1): I-I O.Moos. Rudolph H
1968 Behavioral Effects of Being Observed; Reactions to aWireless Radio Transmitter. Journal of Consulting and ClinicalPsychology 32:383-388.
Purcell. Kenneth and Kirk Brady1966 Adaptation to the Invasion ofPrivacy: Monitoring Behavior
with a Miniature Radio Transmitter. Merrill-Palmer Quarterlyof Behavior and Development 12:242-254.
Ricci. Judith A. Norge W. Jerome. Nadia Megally. Osman Gala!. GailG. Harrison. and Avanelle Kirksey
1995 Assessing the Validity of Informant Recall: Results of aTime Use Pilot Study in Peri -Urban Egypt. Human Organization54(3):304-308.
Stanton. Bonita and Jonathan Clemens1987 Twenty-Four Hour Recall. Know[edge.Attitude-Practice
Questionnaires. and Direct Observation of Sanitary Practices:A Comparative Study. Bulletin of the World HealthOrganization 2(63):217-222.
Zegiob. Leslie E.• Rex Forehand. and P.A. Resick1979 Parent-Child Interactions: Habituation and ResensitiZ3tion
Effects. Journal of Child Clinical Psychology 7:69-71.
VOL. 56. NO. 2SUMMER 1997 189

t1) Pergamon So,.. Sci. Mc·d. Vol. 44. No. II. pp. 17W· 1749. 1997I 1997 Elsevier Science Ltd
PH: 80277-9536(96)00375-9 All rights reserved. Printed in Great Britain0277-9536/97 $17.00 + 0.00
CULTURAL FACTORS, CALORIC INTAKE ANDMICRONUTRIENT SUFFICIENCY IN RURAL NEPALI
HOUSEHOLDS
JOEL GITTELSOHN.' MEERA THAPA' and LAURA T. LANDMAN'
'Division of Human Nutrition. Department of International Health. School of Hygiene and PuhlicHealth. The Johns Hopkins University. Baltimore. MD 21205. U.S.A. and 'Department of Huml,"
Ecology, Morgan State University. Hillen Road and Cold Spring Lane. Bl\ltimore. M D 21239. U.S.A.
Abstract-This study examined the allocation of food within 105 Nepuli households using a comhination of recall and observation methods. While a relationship exists hetween calork intake lind sulllciency of intake of several key micronutrients (i.e., bela carotene. vililmin C and iron) for the studypopulation as a whole. this relationship is weaker for cerlain subgroups. In particular. micronutrientintakes of adolescent girls and adult women lire much less likely to be tied to total ca loric consumptionwhen compared with the intakes of other household members. This gender difierential appears linkedin part to specific food heliefs and practices that tend to reduce women's consumption of micwnutrient·rich foods. such as dietary restrictions during menstruation. pregnanc>' and lactation. Overlappingwith these beliefs and practices. an overall pattern of di'sfavoritism of females in the inlrah\)usehold <.1location of food is evident in the study communities. While staple food items (i.e. ricc. lentil soup.bread. etc.) are distributed fairly equally. side dishes usu\\lIy contllining a higher proportion or micronutrients (i.e. vegetables. meat. yogurt. KII<'r. etc.) are often prefercntially allocated to valued householdmembers. including adult males and small children (of hoth sexes).i" 1997 Elsevier Science Ltd
Key 1i'nnl.~~micronu!rient sufficiency. caloric sufficiency. food heliefs and practices. intrahouseholdfood allocation. diet. Nepal. gender
INTRODUCTION
This paper explores the relationship between caloricsufficiency and micronutrient sufficiency in ruralNepali households. For many years. a prevailingbelief in the field of international nutrition was thatone need only provide adequate calories and ade·quate micronutrient intakes would naturally followO}. Today. it is more widely accepted that adequate,energy intake does not ensure adequate levels ofmicronutrients. Still, few studies have looked at thisrelationship within specific household and culturalcontexts. The data presented here, based on a studyof intrahousehold food distribution patterns andnutrient intake in Nepal conducted in 1986-87 [2],provide a case example examining the relationshipbetween caloric and micronutrient intakes. anddescribe sociocultural factors which influence thisrelationship.
The conceptual framework employed portrays in·dividual dietary intakes (and nutritional status) aspart of an integrated process of food selection, acquisition, distribution and consumption. These features are, in turn. affected by a complex interplayof environmental, economic, and sociocultural factors at national. community. household and individ·ual levels (Fig. I).
The focus of this paper is on dietary outcomes,specifically, gender and age-based differentials in
nutrient intake, and thc sociocultural and behavioral factors that determinc these patterns. Inexamining dietary patterns and their effects on thecaloric and micronutrient intakes of households. thefollowing questions were addressed:
(I) What cultural beliefs appear to inllucnce theallocation of foods to members of ruralNepalese households?
(2) What is the relationShip between energy andmicronutrient intakes in this setting? Arediets sufficient in energy also sufficient inmicronutrients?
(3) How does the sex and age of the individualaffect this relationship?
BACKGROUND
Differential inlta/rousdlOld allocation (If'food: eifeCISofgender and statlls
In most social settings an individual's statuswithin the household is largely determined by threemain variables: age, gender and kin relationship [2·6). In South Asia, gender-based dilTcrentillls in status are reported to reRect the mrrent economic contribution of adult males versus adult females andthe perceived fUlure economic potential of the malechild versus the female child Pl. Female children, in
1739

1740 Joel Gillelsohn et al.
National-level Food availabilityvariables 1-
-Food policy
1Community-level Household food Household-level
variables acquisition variables
behaviourComposition and-Sociocultural 1-
-Biophysical structure
environment -Sanitation-Economic status
1Intra-householdfood distribution
1Individual-Jevel
Individual nutrientvariables
intake--Gender, Age-Morbidity
1Nutritional status
Fig. I. "Food flow" model of intrahousehold food distribution.
these settings, are perceived to be an economicdrain on the household. All inputs (e.g. food, education, health care) to female children are unlikelyto be returned as they mature, except in laborextracted before they marry and leave the household. The lower value placed on women is socialand cultural, as well as economic. Some investigators have noted that in Hindu societies womenare viewed as polluting (particularly during menstruation) and as potentially threatening to thepatrifocal system (8]. Bennett observes, "women areproblematic-partly because of their associationwith sexuality and fertility and partly because theyare perceived as destructive to agnatic solidarity"[7J. In a study of female discrimination in Punjab,Das Gupta [9J points out that discriminatory behavior does not always occur on a conscious level:
Parents in a society may simply have internalized certainnorms that lead ~~em to give beller care to their sons thantheir daughters. and excess female mortality may be anunintended consequence.
Within the household, the allocation of food, likeother resources, varies according to culturally prescribed patterns. This is not a new concern. Pelto[IOJ observes, "It has long been recognized thatmalnourished children are often found in households where their siblings approach normal heightand weight". Van Esterik [II] notes,
There is sufficient evidence to say thai food is not equallydivided within households... the distribution of food reflectsthe order of precedence and social value of the food consumers.
Pinstrup-Anderson's [12] metaphor of intrahousehold food allocation as a "black box" is wellknown. In recent years, several researchers haveattempted to describe the inside of this "blackbox", including the form of behaviors by whichsome household members are shown preference andolhers disfavored, as well as the economic. environmental and sociocultural determinants of food allocation patterns (I, 13-17J.

Caloric and micronutrient sufficien<:y in Nepal 1741
Gender differences in household food allocationhave been observed in such diverse locales asBangladesh (18J, Brazil [19J, Great Britain [20], theivory Coast [21]. and the Sudan [22]. In SouthAsia. studies have identified several determinants ofpreferential food allocation. Preference in food al1ocation for adult males has been widely reported inIndia. Bangladesh and Nepal [2. 23. 24-26J. Muchof the available evidence is based on either nutritional status data and/or health outcome datawhich show higher rates of morbidity and mortalityin females [27-30J, or by inference from statedbeliefs and reported behavior [31-35J. In Punjab.Das Gupta [9J found consistent differentials in milkand fat allocation between boys and girls. althoughcaloric intake was roughly similar between the twogroups.
...milk and fats are highly valued (and high-cost) foods ofthis society. They also have high nutritional qlHllity.Among older children. boys are given a little more of eachfoodstuff. with the difference greatest in the case of fats.
Gender differentiation between children is lesscommon. although Chen et al. [l8J report favoringof male children over female children inBangladesh. Age differentials have been found tofavor children of both genders over adults in termsof caloric adequacy, especially in times of food scarcity [2. 36J.
Gitlelsohn [2J additionally found that householdwealth and caste influence food allocation in Nepal.As expected. wealthier households do better nutritionally than poorer households. However, whencontrolled for economic effects. higher castes eat adecreased variety of foods and run a greater risk ofcertain nutrient deficiencies.
METHODOLOGY
Researc/r selling
Research was conducted in Pahargaon* VillageDevelopment Committee (VDC)t in the Westernhills of Nepal. The VDC is comprised of 15 villages(total population: approximately 4320). A total of105 randomly selected households were studied.representing 767 individuals in six contiguous villages. Ethnically. the VDC is comprised of membersof all four main caste groups (Brahmin. Chhetri,Vaisya and Shudra) plus significant numbers ofMagar and Sunyasi households.
The mean household size for all castes inPahargaon was 6.7 persons. Nuclear households arequite common as interpersonal problems frequentlycomplicate relationships in extended or joint households.
A wide variety of income generating activities isemployed by villagers. including subsistence agricul-
•A pseudonym.tFormerly termed panchayal.
ture. cash cropping (of ginger). manual labor. government service. business. poljtics. jankri(traditional healers). priests and artisan work.Women are only marginally involved in incomegenerating activities. Their province is primarilydomestic. e.g. fetching water and firewood. maintaining the household. child rearing. and assistingtheir husbands with planting and harvesting thefamily fields. The elderly are usually accordedhighly respected st<ltus, and are given the lightesthousehold tasks. Small children arc not expected todo much work. although informants often specifiedthat little girls will often be required to "take careof their younger siblings. while boys study and playand eat". Children's household responsibilitiesincrease as they grow older.
Foods available in the study area vary greatlywith season. with the post-monsoon months(October-December) being the period of greatestabundance and the monsoon months (JulySeptember) heing the period of greatest scarcity.Most foods are produced by villagers on their ownland; however supplementary food is purchased andsold in the villages or in nearby markets as well.Overall there is a large variety of foods. althougheven at times of abundance no more than a third ofthese foods are available.
In most households two main meals are consumed during the day. although snacking betweenmeals by children is quite common. A "meal" isdefined here as a gathering of household membersfor the purpose of food consumption. in whichfood is served by one household member to another(or to a guest). The term "meal" encompasses foodselection. preparation. serving. timing, attendance,mood, ritual associations. interhousehold food-sharing and the treatment of guests.
Melltocl~
Data were collected in five overlapping phases andincluded both qualitative and quantitative methodologies [2]. P/rase aile involved key informant interviews and participant observations as initialexploratory exercises. In phase t1\'O a demographic/economic survey was conducted on 115 householdsto collect individual demographic and anthropometric data within each household. Phase tllreeinvolved unstructured pilot observations of meals in20 non-study households. In phase /OW'. dietarydata was collected in 105 households. from MayAugust 1987. Dietary information was gathered onall household members. based on combined directobservation (centered around one of the two dailymeals. but including snacking prior to the meal)and recall to obtain estimates of 24 hour intakes.The method used has been described in detail elsewhere [I3}. Die tary data were collected on three tofour occasions in each household on randomlyselected days; there was no advance notification tohouseholds that their meals were to be observed I

1742 Joel Gittelsohn el al.
recalled. Spot checks were also conducted on thehouseholds to determine time allocation patterns.In phase jive key informant interviewing was reintroduced to clarify findings from the previous fourphases. Focus-group interviews were conducted ona wide variety of topics and included groups of 2-6people, usually of the same sex and caste group.Finally, structured pile sorts were conducted onsubjects such as food classification.
Data analysis
Data analysis was performed using the SAS statistical analysis software package. Some of the outcome variables are presented in the form of MeanNutrient Adequacy Ratios (MNAR), the percent ofrequirement met for a particular nutrient by the individual. Recommended safe levels of protein intakefor individuals were calculated by multiplying theaverage safe protein allowance per kilogram ofbody weight (based on WHO/FAO recommendations for a particular age-sex group) by the average weight (kg) of a person in the correspondingage-sex group [37].
Individual energy requirements were calculatedaccording to the foHowing formula:
Energy Requirement (kcal~) = (BMR x BMRC)
+FPS
Basal Metabolic Rates (BMR) were calculatedbased on regression equations incorporating sex.age, and body weight [37J. Energy expenditure wasexpressed in terms of the BMR multiplied by ametabolic constant (BMRC), derived on an individual basis from observed daily activities, and including a factor for Female Physiological Status (FPS),when appropriate based on WHO/FAa recommendations [37].
Individual daily allowances for seven micronutrients (calcium, iron, beta-carotene, thiamin,riboflavin, niacin, vitamin C) were based on recommendations by the Indian Council of MedicalResearch [38J.
As breastmilk intake was not quantified in thisresearch, breastfeeding children « 2 years) wereeliminated from the analysis.
RESULTS AND DISCUSSION
Food belief systems
Khare [39] has described the "cultural economy"of the Hindu food system, which he sees as havingboth materialistic and ernie-cultural components.Food selection. preparation, serving and consumption in Pahargaon is regulated by an interwoven setof beliefs and rules, including ways that food (andindividuals) can become polluted, food classificationsystems, local explanatory models of illness (wherefood is perceived either as a causal agent or as atreatment), and normative patterns of favoring/dis-
favoring household members based on their ageand gender. Many of these food beliefs have directconsequences for the diets of women [40J.
Nichter [4IJ describes several food classificationsystems operating concurrently in a South Indianvillage. A version of the hot-eold food classificationsystem is common throughout Nepal. Almost allfoods can be assigned to one of three "valence" categories: hot, cold, or neutral. In Nepal, it is perceived that when an individual consumes a lot offood of a particular valence, illness can result,which can be corrected by consuming foods of theopposite valence [42]. The hot-cold valence offoods appears 10 be most important when personsare in a vulnerable state, such as pregnancy or thepostpartum period.
In the present study, a mean "hot-cold score"was derived by interviewing 30 different localrespondents. A mean valence ranking was calculated by assigning a score of -I if the food wasdescribed as cold (thundao), + I if hot (garmi) ando if neutral (Table I), and taking the average for allinformants. Water buffalo milk (mean: + 1.00),jll'allo [caraway] soup (mean: + 1.00), millet alcohol(mean: + 1.00), chicken (mean: + 1.00), corn(mean: + 1.00) and soybeans (mean: + 0.98) wereall listed as hot foods. Corn porridge(mean: - 1.00), cauliflower (mean: - t .00), eggplant(mean: - 1.00) and pumpkin (mean: - 1.00) areamong many foods considered cold. An analysisconducted on these data indicated a high level ofconsensus among the 30 respondents. Interestingly,there was more agreement by informants on whatfoods should be considered hot (+ 0.5 to + 1.0) orcold (-1.0 to -0.6), than on what foods should beconsidered neutral (-0.59 to + 0.49).
Many community members classify foods interms of digestibility. In general, poorly cookedfoods, fatty meats and many kinds of legumes,including soybeans, peanuts, peas and lentils areconsidered difficult to digest. These foods were saidto make one sick, especially with diarrhea, vomitingor a cold. Digestibility is particularly importantwhere the age of the consumer is concerned. Youngchildren and the elderly are felt to require easilydigestible foods (e.g. rice, nuts, sweets and yogurt)as do people in vulnerable phases of life or states(such as infancy or postpartum). Digestibility doesnot appear to be related to the hot-cold valence ofthe food, however.
Other less common systems of classificationinclude taste and perceptions of healthiness. In general, Nepali foods have strong flavors: sweet. salty,sour and spicy. Foods that are not sally or are bitter arc less popular. Bitler is perceived to be thetaste of medicine, like kaa/o jiraa (fenugreek).Particular care is take to ensure that small childrendo not consume spicy foods. VDC residents perceive certain foods as being beneficial to health.This notion of "healthiness" of a food is related in

Caloric and micronutrient sufficiency in Nepal
Tahle I. Me,m hot-cold valence ,core
1743
Food
Cold (-1.00-' - 0.60)
Score Food
Neutral (-0.59- + 0.49)
Score Food
Hot (+ 0.50- 7,1.00)
Score
'Corn (porridge/roli) -1.00 Yams -0.57 Breasrmilk +0.60'Cauliflower -1.00 Ghee (cow) -0.54 Goat (milk) +0.70'Eggplant. taro -1.00 Sweet palata -0.49 Wi Id berries +0.76'Pumpkin -1.00 Milk (cow) -0.38 Wheat +0.85'Gourds. cucumber -1.00 Lemon -0.30 Peanut +0.89'Peaches -1.00 Onions -0.23 G",,,lruk +0.89'Chang (corn/rice) -1.00 Broad beans -0.18 Garlic +0.91"Tomatoes -0.98 Bethe greens -0.16 'Mustard oil +0.96!>Yogurt (buffalo) -0.98 Eggs -0.13 'Tea (black/pepper) +0.96bPork -0.97 Coriander seed +0.07 bSoybeans +0.98Apple. pears -0.96 Dried beans +0.07 beorn (khaja) +0.98Green beans -0.96 Blackeyed peas +0.09 'Millet +0.98Banana ~O.93 Fern small +0.12 'Red gram +0.98Black gram -0.91 Sugarcane (black) +0.15 'Fish + 1.00Mustard leaf -0.91 Mango +0.34 'Chicken + 1.00Guava, plum -0.90 Orange +0.40 'Milk (bull) + 1.00Buff (meat) -0.89 Pomegranate +0.42 'Rak..i (millet + 1.00Okra. radish -0.87 Lentil balls +0.44 Jwmro soup + 1.00Yogurt (cow) -0.83 'Natal +1.00Rice -0.80Ghee (bull) -0.74
'Perfect agreement by respondents. 100% reported food as same valence.'High agreement by respondents. 80~99% reported food as same valence.
part to a notion of the nutrient content of foods.The notion of certain foods as being"strengthening" or "weakening" is also common inthe VDC, and relates to the concept of health-promoting foods.
Food consumption through the life span
The food belief systems described above areapplied to individuals differentially over their lifespans. The data presented in this section are primarily based on reported beliefs and behaviors,though much of the information was verifiedthrough direct observation [13].
Some dietary rules exist for breastfeeding women.In particular, if the breast feeding child is in a vulnerable state. dietary restrictions may be followedby the mother, as it is perceived that qualities associated with specific foods are passed on to thechild through breastmilk. The primary proscriptionappears to be avoidance of certain foods when theinfant is ill so that qualities of "coldness" and"indigestion" will not be passed along. An exception are fresh green leafy vegetables which areavoided continuously during lactation. as they areperceived as "cold" and are thought to cause arthritis, swelling and other illnesses in both the motherand infant. Instead. lactating women dry greenleafy vegetables before eating them (eliminating themajority of water-soluble vitamins).
Through infancy and childhood, children of bothgenders are often shown favored treatment in termsof food, receiving special foods when available. Onthe other hand, food avoidances during illnessappear to be most stringently observed for smallchildren. No differences were observed in the feeding of young boys compared with girls.
Sometime between the second and fourth year oflife. Pahargaon children begin to consume the regular adult diet, although they may receive less heavilyspiced food than their parents. As children moveinto puberty and adolescence, they begin to assumeadult roles and responsibilities. Boys start to workin the fields and/or attend school. Girls begin totake up domestic responsibilities. including childcare, water and wood fetching. and herding. Olderdaughters begin to be served last with their mothersin some households. While only 19% of mothersreported differential feeding by the gender of thechild at adolescence, our observations indicate thatthis practice is more pervasive. Reasons emphasizedthat boys needed to be strong (for work) and thatthey needed more food because they would beexpected to take care of the family in the future.
In adulthood, the distinctions made betweenPahargaon males and females emerge in full force.with pronounced favoring of males in food distribution. These patterns are expressed in the order inwhich persons are served. in amounts of food given.and in the preferential allocation of special. highstatus foods. resulting in a somewhat greater varietyof foods for males. Early adulthood appears to be atime of particular stress for rural Nepali women. Awoman marries and moves to her husband's household, where she has very low status. She is expectedto do a great deal of the hard physical work, produce children and not complain about her state. InPahargaon, while usually permitted to eat their fillof staple foods. junior adult females receive subtlediscouragement in the consumption of special foods(e.g. animal products, special fried foods). They arenot encouraged to eat second helpings of thesefoods. When new daughters-in-law begin to fulfill
J~O

1744 Joel Gittelsohn er al.
their reproductive role through the production ofoffspring, their overall status increases.
Generally, pregnancy is not seen as a time forspecial food restrictions or prescriptions. Motherswere asked what foods they consumed speciallyduring their previous pregnancy; 38.6% stated thatthey consumed no special foods during pregnancy,and merely ate the regular family diet. Five percentof mothers interviewed said they consumed certainfoods preferentially during pregnancy. Animal products, especially meat and dairy products were themost frequently mentioned food items to be eatenpreferentially. The most common reason womengave was due to "craving", not to any perceivedquality of the food.
During the postpartum period, when the motherand infant are considered to be especially vulnerableto cold, new mothers will avoid working in therain, doing laundry and planting rice, all activitiesassociated with "cold" water. There is agreementamong respondents that hot foods should be consumed during this period. Limited observations onpostpartum women indicate that certain hot foodslike jll'lIno soup, chicken. fish and millet roti areindeed preferentially consumed. Many of thesefoods are good sources of animal protein andwould seem to be advantageous to Pahargaonwomen. However, the most commonly mentionedavoided foods are also hot foods; for example soybeans, wheat bread, peanuts and corn porridge,which are believed to cause indigestion in mothersand infants, illustrating how food choices are theresult of multiple overlapping belief systems.
As Pahargaon men move into adulthood, theirstatus increases. They assume primary responsibilityfor decision-making about the household, thoughadult women may have an important advisory role.The higher status of adult males is recognized inmany ways, including household food behavior. Ingeneral, the adult male is considered the least vulnerable of any state; thus, there are few concernsabout avoiding foods that affect those in vulnerablestates, unless he becomes ill.
Elderly persons, both male and female, are seenas being in a vulnerable state, requiring morestrength-giving foods. If a household member isvery elderly, foods will be prepared that are easier
to consume. In general, "cold" foods are not givento the elderly for fear of causing illness.
Effects on dietary intake and adequacy
This section describes patterns of intrahouseholdvariation in dietary intake and nutrient adequacy inPahargaon VDC. As dietary intake data were collected from May-August 1987, we will not be ableto present seasonal differences. The dietary assessment period took place during the pre-monsoonand monsoon seasons. This period is characterizedby overall scarcity of most foods, except domesticand wild fruits, which are highly available.
Table 2 shows how differences in gender andtransitory states are played out in terms of the consumption of food types during household meals.Numbers in the table represent the percent of persons who ate a food from a particular group duringan observed meal. Chi-square tests were employedto detect whether the differences observed betweenadolescent males, adult males, adolescent females,non-pregnant and non-lactating females and lactating females were due to chance alone. The numberof meals observed with menstruating, pregnant andpostpartum women were too small to include in thetest, but averages are presented in the table forcomparative purposes.
For staple grains (rice. wheat roti), no significantdifferences were observed between any of the fivegroups; almost everyone received at least one kindof staple food during a meal. Nor were any significant differences observed in the number of personsconsuming of daa! (lentil soup), meat/eggs andpickles.
Adult males were significantly more likely to consume vegetables than adolescent males (/ = 7.068,p = 0.008), and lactating females (/ = 4.276,p = 0.039). They are more likely to receive milkand milk products than adolescent males(/ = 2.726, p = 0.099), adolescent females(/ = 3.309, p = 0.069) and lactating females(i = 10.095, p = 0.00 I). These findings reinforcetheir position as the preferred recipient of foodduring mealtimes.
On the other hand. adolescent males were significantly more likely to consume fruits during a mealthan either adult males (/ = 4.673, p = 0.031) or
Table 2. Gender/physiological stalus-based differences in % persons receiving at least one item rrom rood category (during a meal)
Adult females (18-·_·50 years)
Adolescenl males Adull males Adolescent remales Non-preg. Lactaling MenSlruating Pregnant POSlpartum(10-18 yr) (18-50 yr) (10-18 yrj Non·lac!. (II = 186) (11= 16) (II = 20) (n = 20)
Food group (n = 14l) (n = 207) (II = 163) (II = 143)
Staple grain 96.3 95.8 97.0 99.3 97.3 93.8 100 90.0Daal 28.7 31.1 30.7 25.9 29.6 31.3 15.0 .30.0Vegetable (TK) 46.3 60.9 53.6 53.2 50.5 62.5 80.0 30.0Saag (DGLVj 7.4 7.6 12.7 12.6 7.0 12.5 5.0 10.0Meat, eggs 12.5 12.7 9.0 14.7 9.7 0 10.0 30.0Milklghee 28.7 37.3 30.7 28.0 22.6 18.8 30.0 25.0AdJar/pickles ,. 14.7 17.5 16.3 15.4 15.1 12.5 15.0 5.0Fruit 22.1 13.2 19.3 8.4 16.7 25 40.0 10.0

Caloric and micronutrient sufficiency in Nepal 1745
adult females (/ = 10.182. l' = 0.00 I). Adolescentfemales were more likely to consume fruit thanadult females (l = 7.454. P = 0.06). These resultsrelate to the unique position of fruits as a food category. Fruits were relatively abundant during theobservation period (May-August). and many weregathered wild by adolescents and small children,consumed during the meal observation period. butnot as part of the prepared meal.
lactating women consume less DGlV (darkI green teafy vegetables) (/ = 3.222, P = 0.073) andmilk (i = 2.991, l' = 0.084) than adolescentfemales, and less DGlV (i = 2.969. p = 0.085)than adult females. The results concerning DGLVswould appear linked to food proscriptions for lactating women reported earlier. On the other hand,lactating women appear to be eating more fruitthan non-lactating adult females (/ = 4.873,p = 0.027).
While the sample size was too low to calculatechi-square statistics for women in different phasestates (menstruating. pregnant. postpartum). overalldifferences in consumption of food types were consistent with expressed beliefs about food proscriptions. These food consumption patterns haveconsequences for the adequacy of the local diet. Ingeneral. women are less likely than men to meettheir requirements for kilocalories. with significantdifferences observed between males and females 3-6years. 10-14 years, and 25-49 years (Fig. 2). Whileable to eat their fill of staple foods. it appears thatthese less energy-dense foods alone are insufficientto meet women's caloric needs in many cases. particularly those women with increased needs due topregnancy and lactation. Interestingly, children aremore likely to meet their energy requirements thanadults of both sexes.
The intake of beta carotene shows a similar pattern, with significant dilferences in mean intake relative to requirement between adult (> 2'5 years) menand women. Similar age-related variation, with children doing better than adults, was found for betacarotene as well (Fig. 3). Children are frequently"channeled" special foods in short supply. likemilk. sweets and fruits.
For vitamin C. significant differences wereobserved only between adult men and women(Fig. 4). Again, for this nutrient, children tend todo better than adults. Fruits were the main sourceof vitamin C in the diet during the dietary assessment period. As most fruits are eaten as snacks.their frequency tends to be underreported inTable 2.
Figures 2--4 indicate very low intakes (relative torequirements) of calories and micronutrients forreproductive-aged women. This appears linked largely to food restrictions for pregnant and lactatingwomen (included in the figures). and to increasednutrient requirements considered in calculating theirenergy and micronutrient requirements.
Determinallts of dietary adequacy
]n order to examine the effect of gender and ageof the individual in the context of other householdand individual-level variables. a series of multiplelinear regressions were calculated for all nutrients,incorporating a variety of other variables (Table 3).The other variables tested in the model included"respect" (a measure of relative household statusbased on a ranking of kin types assigned by keyinformants), "overall wealth" (based on land ownership. material possessions. housing quality. andanimal ownership). "meal size" (mean number ofpeople present during a household's meal),
_ Males 0 Females
120
~
110~~
0
~ 100>-0<ll~ 900-Q)
1;l<1l
C 80
.~:;
70cC<1lQ)
::2: 60
503 . 6 7 . 9 10 - 14 15 - 17 18 ·24 25 - 49 50 ...
Age group (Years)
Fig. 2. Intake or Keals in Nepal: varaition by sex.
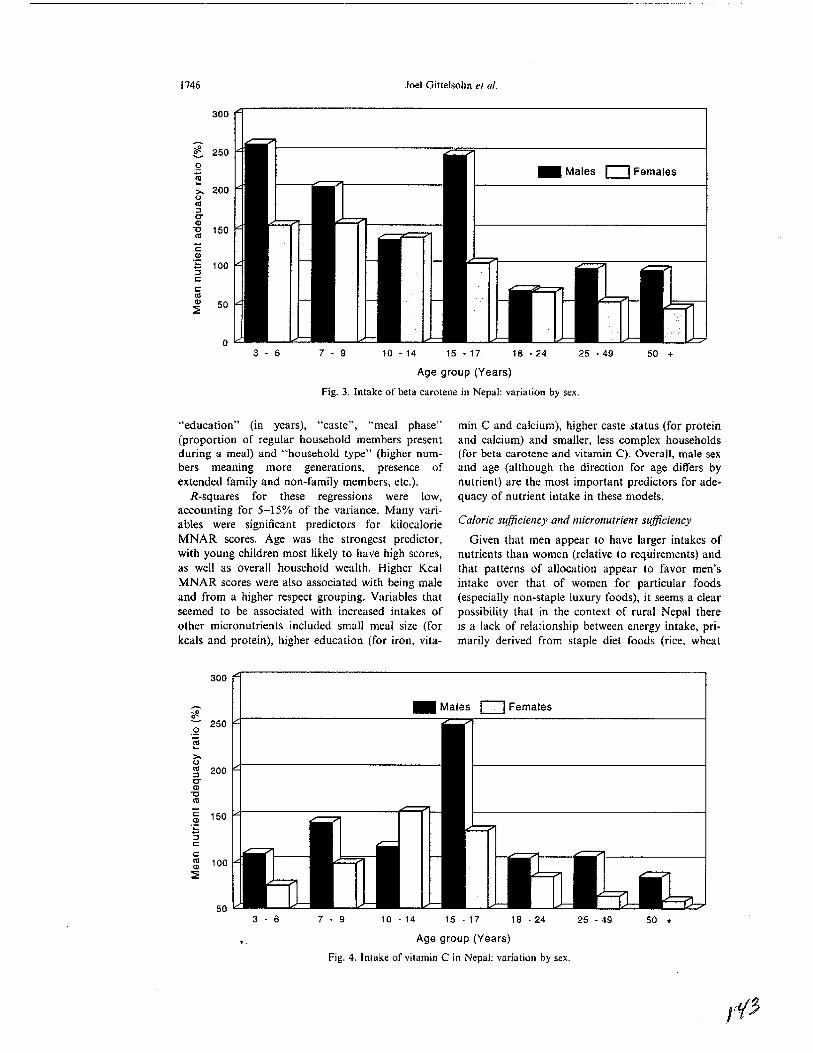
Joel Gittelsohn el al.
_ Males 0 Females
1746
300
~ 250~
.2~>- 2000«l:J0-Q)
'0 150«l
"E.~
100:;c:c:«lQ) 50:::E
03 - 6 7 - 9 10 - 14 15 ·17 18 ·24 25 ·49 50 +
Age group (Years)
Fig. 3. Intake of beta carotene in Nepal: variation by sex.
"education" (in years), "caste", "meal phase"(proportion of regular household members presentduring a meal) and "household type" (higher numbers meaning more generations, presence ofextended family and non-family members, etc.).
R-squares for these regressions were low,accounting for 5-15% of the variance. Many variables were significant predictors for kilocalorieMNAR scores. Age was the strongest predictor,with young children most likely to have high scores,as well as overall household wealth. Higher KcalMNAR scores were also associated with being maleand from a higher respect grouping. Variables thatseemed to be associated with increased intakes ofother micronutrients included small meal size (forkcals and protein), higher education (for iron, vita-
min C and calcium), higher caste status (for proteinand calcium) and smaller, less complex households(for beta carotene and vitamin C). Overall, male sexand age (although the direction for age differs bynutrient) are the most important predictors for adequacy of nutrient intake in these models.
Caloric su.fficiency and micronutrient sufficiency
Given that men appear to have larger intakes ofnutrients than women (relative to requirements) andthat patterns of allocation appear to favor men'sintake over that of women for particular foods(especially non-staple luxury foods), it seems a clearpossibility that in the context of rural Nepal thereis a lack of relationship between energy intake, primarily derived from staple diet foods (rice, wheat
300
100
_ Males 0 Females
50 +25 - 4918 ·2415 - 1710 - 147 • 93 - 650
.~ 150
:;c:c:«lQ)
::2
~ 250.2"§
Age group (Years)
Fig. 4. Intake of vitamin C in Nepal; variation by sex.

Caloric and micronutrient sufficiency in Nepal 1747
Table 3. Summary of multiple regression results: individual and hOl1sehold-level determinants of MNAR scores for key nUlrients
Nl1trient
Keals Protein Beta carolene Iron Vitamin C Calcium(R1 = 0.12) (R1 = 0.13) (R" = 0.09) (R" = 0.08) (R l = 0.05) (R" = 0.14)
Variable Beta ,,< T Beta I'<T Bela p<T Bela p<T Bela p<T Beta p<T
Age -0.245 •••* -0.198 .... 0.157 ...... 0.065 NS 0.136 ....Sex (- = male) -0.065 -0.080 -0.132 .... -0.17\ ..... -0.063 NSRespe;:t 0.128 ••• NS NS NS -0.079 •• 0.110 ..Overa11 wealth 0.183 ..*. NS 0.074 .. NS NS 0.211 ....Meal size -0.083 .. -0.085 .. NS NS NS NSEducalion NS -0.125 ••• * NS 0.139 *"'•• 0.127 .... 0.106 ....Caste (- = higher) NS -0.062 NS NS NS -0.107 t+••
Meal phase NS NS NS -0.063 • NS -0.056Household type NS NS -0.083 •• NS -0.133 •••• NS
'p < 0.05."p < 0.01."'p < 0.001.••••p < 0.0001.
and corn), and micronutrient intake, derived largelyfrom "luxury"' or non-staple foods (meat, 'vegetables. dairy products, beans and pickles).
Energy and protein intakes are correlated acrossall age and sex groups. However, energy intakes arenot correlated with beta-carotene, iron and vitaminC intakes for older individuals and, in particular,for adult females (Table 4). In general, women aremore likely than men to have micronutrient intakesthat are not correlated with energy intakes. Evenamong other age and sex groups, correlationsbetween energy and micronutrients are low. In thissetting, then, it appears that a diet high (or low) inenergy is not necessarily high (or low) in othermicronutrients.
What are the implications of these findings foroverall dietary adequacy? Table 5 shows the percentof male and female adults with MNAR scoresbelow 100% for different nutrients. The numberof adults with less than 100% ranges from nine(protein) to 159 (beta carotene). The data havebeen disaggregated so that the percent of men andof women who are calorically sufficient (KCalMNAR scores> 100%) can be compared to those
who are caloricafly insufficient (KCal MNARscores < 100%). In both men and women, highpercentages of individuals have both low intakes ofmicronutrients and low intakes of calories, rangingfrom 4% of adult males for iron to 52% of adultfemales for beta carotene. For all nutrients, womenare more likely than men to have both energyintakes and micronutrient intakes less than 100% ofthe MNAR.
Significant numbers of men and women arecalorically sufficient and micronutrient insufficient,ranging from a low of 2% of adult males for ironand calcium to 32% of adult males for beta·carotene. Larger percentages of adult women than menare calorically sufficient, but have insufficientintakes for micronutrients for iron, vitamin C andcalcium. Adult men are more likely to be caloricallysufficient, but have sufficient intakes of beta carotene.
CONCLUSIONS
Sufficient caloric intake does not assure sufficientmicronutrient intake in this setting. From our data,
Table 4. Correlations between mean daily energy intake and intake of other nutrients by age and se,
Age group
Children Adolescents Young adults Adults Older adulls(2-10 years) (10.1-18 years) (18.1-30 years) (30-50 years) (50+ years)
Male Female Male Female Male Female Male Female Male FemaleNutrient (n = 84) a(n = 75) (n ~ 48) (/1 = 53) (/1 ~ 32) (n = 65) (II = 5l) (n = 61) (II = 19) (It = 16)
Protein 0.761 0.571 0.612 0.573 0.767 0.673 0.658 0.612 0.847 0.752..... .... ".... ..... .**.. ..** .... .... .... •••Bela-carotene 0.306 0.383 0.338 0.100 0.420 0.192 0.147 0.3260 0.517 0.160.. ... NS NS NS • NSIron 0.503 0.636 0.469 0.220 0.338 0.306 0.320 0.390 0.670 0.323.... •••• ... NS NS •• •• NSVitamin C 0.391 0.230 0.286 0.160 0.242 0.137 0.115 0.223 0.441 0.302... NS NS NS NS NS NS NSCalcium 0.514 0.466 0.608 0.369 0.545 0.427 0.419 0.534 0.666 0.369..... ••• * •••• •• •• ... .. .... .. NS
'p < 0.05."p < 0.01."'p < 0.001.••••p < 0.0001.

1748 Joel Giuelsohn e/ al.
Table 5. Micronulrient sufficiency related lO energy sufficiency [adulls 18-50 years only: 11 ~ 85 males. 128 females)
Calorically insufficient MNAR Keats < 100%
Male FemaleNUlrienl (MNAR < 100% only)
PrOlein (II ~ 9)Beta-carolene (n ~ 159)Iron (II = 30)Vitamin C (II ~ 123)Calcium (I' = 55)
4% (3)38% (32)4% (3)
28% (24)14% (12)
5% (6)52% (67)16% (20)43% (55)26% (33)
Calorically sufficienl MNAR KCats > 100%
Male Female
0% (0) 0% (0)32% (27) 26% (33)
2% (2) 4% (5)16% (14) 23% (30)2% (2) 6% (8)
it appears that while there is a positive relationshipbetween caloric intake and the intake of somemicronutrients at the population level, this patterndoes not hold true for certain subgroups within thepopulation, in particular adult women and adolescent girls. In the rural Nepali setting, these subgroups appear to be at a particular risk for dietsdeficient in vitamin A and vitamin C.
In Pahargaon, food beliefs and practices appearto place individuals at risk for nutritional deficiencies and may account (at least partially) forthe low correlation between energy and micronutri·ent intakes. Our dietary information, comprised ofboth recalled intake and direct observation ofmeals, shows that while there is variation in individual application of these cultural rules, dietary proscriptions and prescriptions directly influence actualfood consumption behavior. Gender-based differences in access to certain foods appear linked, inpart, to specific food beliefs and practices thatreduce women's consumption of micronutrient-richfoods, such as dietary restrictions during menstruation, pregnancy and lactation [43J. Overlappingwith these beliefs and practices, an overall patternof discrimination against women in the intrahousehold allocation of food is evident in the study communities. While staple food items (i.e. rice, lentilsoup, bread, etc.) are distributed fairly equally, sidedishes usually containing more micronutrients (i.e.vegetables, meat, yogurt, ghee, etc.) are often preferentially allocated to valued household members,including adult males and small children (of bothsexes).
To what extent can women's poorer nutrientintakes be attributed to culture-based food proscriptions versus overt discrimination? Differencesobserved between lactating and non-lactatingwomen suggest that food proscriptions do affectdietary choices independent of discrimination basedon gender. Unfortunately, the small number ofwomen sampled who were menstruating, pregnantor postpartum do not permit statistical comparisonswith these groups. Such knowledge would be crucialfor planning nutrition education strategies toimprove the lot of Nepali women, but must awaitfuture studies.
Acklloll'ledgeme/JIs-This rese<trch was supported bygrants from tl"\c National Science Foundation. WennerGren Foundation for Anthropological Research and theUniversity of Connecticut Health Center and the Office of
Health and Nutrition, U.S. Agency For InternationalDevelopment (under Cooperative Agreement DAN 0045A-00-5094-00 with the Johns Hopkins University). Theauthors also gralefully acknowledge the individuals whoassisted in the design, and/or analysis of this project. especially Pemi J. Pelto, Gretel H. Pelto, Lindsay AJIen andJelfrey Backstrand.
REFERENCES
I. Gopalan, C. (1975) Protein vs calories in the treatmentof protein-calorie malnutrition: metabolic and population sludies in India. In Protein-Culorie Malnu/rition,ed. R. E. Olson, p. 334. Academic Press, New York.
2. Giuelsohn, J. (1989) Intrahousehold food allocation inrural Nepal. Ph.D. thesis. University of Connecticut.
3. Acharya, M. and Bennell, L. (J9lD) Women and thesubsistence sector. Economic participation and household decision-making in Nepal. World Bank StaffWorking Paper, No. 526, Washington, DC.
4. Carloni, A. S. (1981) Sex disparities in the distributionof food within rural households. Food NutritiO/l 7(1),3-12.
5. Karki. Y. (1981) Sex preference and the value of sonsand daughters in Nepal. Suulies in Family Planning19(3),169-178.
6. Nag, M., White, B. and Peel, R. C. (1978) An anthropological approach to the study of the economic valueof children in Java and Nepal. Current Amhropology19(2), 293-306.
7. Bennett. L (1976) Sex and motherhood among theBrahmins and Chhetris of east-central Nepal. Journal11( the IllStitute '!/ Nepal amI Asian Studies 3, SpecialIssue, Comributions to Nepalese Studies inAnthropology, Health, ani-! Development.
8. Thompson, C. ([985) The power 10 pollute and thepower to preserve: perceptions of females in a Hinduvillage. Social Sdence & Medicine 21(6), 701-711.
9. Das Gupta, M. (1987) Selective discrimination againstfemale children in rural Punjab, India. Population (/IldDel'elopmem Re\'ieu- 13( I), 77- roO.
10. Pelto, G. (1984) Intrahousehold food distribution patterns. In Malnutrilion: Delermil/ams and Consequences,ed. G. Davis, pp. 285-293. Liss, New York.
II. Van ESlerik. P. (1985) Intm-family food dislribution:its relevance for maternal and child nutrition. InDeterminalllS of YOllllg Chil<! Feeding (/nd TheirImplicl/tions for Nlitritiol/al Sun'ci!lcmce. CornellImernational Nutrition Monograph Series, No. 14.
12. Pinstrup-Anderson, P. (1983) Estimating the nutritional impact of food policies: a note on the analyticalapproach. Ecology <llld Food NutritiOI/ 5(4), 16-21.
13. Giltelsohn, 1. (1991) Opening the box: intnthouseholdfood allocalion in rural Nepal. Sodal Science &Medidne33(1O),1141-1153.
14. Messer, E. (1983) The household focus in nutritionalanthropology. Food u/UI Nlltritiol! Bulletin 5(4), 2-12.
15. Messer, E. (1991) Gelling through (three) meals a day:diet, domesticily, and cash income in a Mexican town.In Diet alld Domes/ic Li/e Iii Sodf!lY, ed. Sharman A.Temple University Press, Philadelphia, PA.

Caloric and micronutrient sufJ1ciency in Nepal 1749
16. Guyer. J. (1980) Household budgets and women'sincomes. Working Paper 28. African Studies Center.Boston University. Boston, MA.
17, Rogers. B. L. and Schlossman. N. P. (eds) (1990)hllra-ltou.<eltoM Re.Wllrce Al/onJlioll: Issues (/lidMetltods for Del'elopmel/t Polky a/1(1 Plal/lli1/g, UnitedNations University, Tokyo.
18. Chen. L. C .. Hug. E. and D·Souza. S. (1981) Sex biasin the family allocation of food and health care inrural Bangladesh. Populatioll (lml Del'elopmellt Rniell'7,55-70.
19. Gross. D. R. and Underwood. B. A. (1971)Technological change and caloric costs: sisal agriculture in northeastern Brazil. Americall AlllltrOp(Jloglsl73(3}.740-752.
20. Nelson. M. (1986) Distribution of nutrient intakewithin families. Britislr Joumal or Nutritloll 55, 267277.
21. Deaton, A. (l988) The allocation of goods within thehousehold: adults. children. and gender. World Bank,Living Standards Measurement Study Working Paper,No. 39.
22. Taha, S. A. (1978) Household food consumption infive villages in the Sudan. Ecology or Food (//ulNutrition 7, 137-142.
23. Levinson. F. (1974) Morillda: All Ecollomic AI/alrsis ofMalml/l'lliorl amollg Youllg Childrell III RW'al PUlljab.International Nutrition Policy Series. Cambridge. MA.
24. Batiwala, S. (1981) Rural energy scarcity and nutrition: a new perspective. £('ollolllic alld Polilical Weeklr17, 329-333.
25. Cain et al. (1979) Class. patriarchy, and women'swork in Bangladesh. Papillalion and De\·e/opmen/Rel'iell' 5.
26. Chaudary. R. H. (1983) Determinants of intrafamilialdistribution of food and nutrient intake in a rural areaof Bangladesh. Monograph (draft), BangladeshInstitute of Development Economics. Dacca.
27. Naharro. D. (191M) Social. economic. health. and environmental determinants of nutritional status. Food(/lid NwritlOlI Bulletill 6(1). 18~32.
28. Koenig, M. A. and D'Souza. S. (1986) Sex differencesand childhood mortality in rural Bangladesh. SocialScience & Medicine 22( I). 15-22.
29. Carloni. A. S. (1981) Sex disparities in the distributionof food within rural households. Food NCllri((J1I 7( I),3-12.
30. Den Harlog, A. P. (1972) Unequal distribution offood within the household. NUlI'ition Nell'sleller 10(4).8-17.
31. Pigott. J. (1983) Infant feeding practices and beliefs inone community in the Sierra of rural Ecuador: aprevalence study. ArdJiros Lalinod'mericallo.1 deNw,.ieioll 33( I). 126-138,
32. Ayres. B. C. (1967) Prefiltanc,l' Magic: A Siudy (J(Food TahOoJ and Sex I1I'Oi(/w/n's: A CompaJ'atil'eS/r/{~r of Hlllltalt PI·oduc/ion. Human Relations AreaFile Press, New Haven. CT.
33. Katona-Apte. J. (1977) Ti,e socia-cultural aspects offood avoidance in a low-income population inTamilnadu. S. India. EIII'ironmelllal and Child Health23(2). 83~90.
34. Richards, A. (1948) Hunger ami Work in a Sal'UgeT,.ihe; A FuncriOlwl Strl(~r OIl Nurri/ivlI among lireSouthem Bal1tll. Free Press. Glencoe. II.
35. Vemury. M. and Levine. H. (1978) Beliefs al/dPl'ac/ice.s tlrat A/recI Food Hahils in Del'elopingCoulltrieJ: A UI('ra/llI'(' Rel'/·eu·. CARE. New York.
36. Panter-Brick. C. Women's work and child nutrition:the food intake of ()-4 year old children in ruralNepal. Unpublished manuscript.
37. World Health Organization (1985) Energy WId ProteillRequirelllellIs. Technical Report Series No. 724,Geneva.
38. Indian Council of Medical Research (191\5) NlIIritil'eVailw 0( Illdiall FO{J(f.I". National Institute of Nutrition,New Delhi,
39. Khare. R. S. (1986) The Indian meal: aspects of cultural economy and food use. In Filod. Sode/}' andCU[I/rre. eds R. S. Khare and M. S. A. Rao. CarolinaAcademic Press, Durham, NC.
40. Brems, S. and Berg. A. (1983) "Eating down" duringpregnancy: nutrition. obstetric and cultural considerations in the Third World. Discussion Paper preparedfor the UN Advisory Group on Nutrition.
41. Nichter. M. (1986) Modes of food classification andthe diet-health contingency: a South Indian case study.In Food. Society and Cul/llre. eds R. S. Khare and M.S, A. Rao. Carolina Academic Press. Durham. NC.
42. Stone. L. (1976) Concepts of illness and curing in acentr,,1 Nepal village. Jilumal or 1n.~rirUle 0/ Nepal amiAsiall S/Ildies 3. Special Issue: Contributions toNepalese Studies: Anthropology, Health. andDevelopment.
43. Interestingly. the postpartum period involves preferential intake of "hot" (high protein) foods. althoughthere are some "hot" food proscriptions as weI!.

Editorial
See corresponding article on page 160.
What do indicators indicate?1,2
Jean-Pierre Habicht and Rebecca J Stolttfus
Selection of the best indicators is essential for scientificprogress and for implementation of programs. de Pee et al (1),in this issue, show that different investigators rank: indicatorsdifferently. One explanation is that different procedures revealdifferent aspects of an indicator. It is important that the aspectsrevealed are relevant to the indicator's uses. Certain principlesare at hand that pennit a more systematic approach to revealthese relevant aspects (2, 3).
An indicator is a measurable variable that is supposed toindicate some underlying reality that is more difficult or impossible to measure. One cannot evaluate an indicator withoutfirst specifying that underlying reality (4). Serum retinol is anindicator of vitamin A status-the underlying reality. However,in practice our definitions of vitamin A status may vary withthe particular question being addressed. Vitamin A status mightmean total body stores of vitamin A, vitamin A uptake by oneor more target tissues, or vitamin A balance. In public healthnutrition the underlying realities of interest are usually notnutrient status per se. When we llse indicators to make publichealth decisions, the correct decision concerns the underlyingreality. The decision of interest might concern the number ofchildren at risk of death from vitamin A deficiency and itsconsequences, or whether a group of women will benefit fromvitamin A supplementation, or whether a particular vitamin Aintervention had the intended effect. The performance of anindicator will depend on the underlying reality that it is supposed to indicate. This issue is inadequately addressed amongnutrition scientists and public health nutritionists.
Once the context of the evaluation is specified, to evaluate anindicator's performance the indicator is compared with a goldstandard, which is an approximation of the underlying reality.For an indicator to be useful it must either be summarized fora population by a mean or a rate, or it must be dichotomized bya cutoff value or trigger level, respectively, for classifyingindividuals or populations. Ranking the performance of indicators requires presentation of the indicators' sensitivity-specificity characteristics over their full range (5) and not only at asingle cutoff to be able to test the ranks statistically withadequate power (6). Considerations of these issues (7) andmethods to address them (8) can be found elsewhere.
The ideal gold standard for vitamin A indicators is often .stated to be liver vitamin A stores (1). In practical situations,this is almost never the case. The fundamental problem lieswith the definition of reality, not with its approximation (whichis also problematic). The reality must relate to the decision thatwill be made on the basis of the indicator's measurement. A
full review exceeds the space available in this editorial, but afew examples illustrate the approach.
One set of decisions relates to the consequences of vitaminA deficiency. First one needs to decide that vitamin A deficiency is truly an important determinant of the supposed consequences. Then one must decide whether to treat or preventthe consequences through vitamin A interventions, and finallyhow to monitor the effect of those interventions. An examplewould be to use the indicators described in the first section ofde Pee et al's article to screen mothers for a vitamin A intervention to prevent mortality in their infants. The appropriategold standard for this decision would be the prevented deaths,and the indicators would be ranked on how well they predictedthese prevented deaths. This type of analysis has been done foranthropometric indexes and risk of child death, but not yet fordeaths preventable by interventions (2).
A second use of the indicators in the first part of de Pee etal's article might be to screen mothers for maternal interventions to improve infant vitamin A intake from breast milk. Thebest indicator would best predict the rise in breast-milk vitamin'A from the intervention. Thus, the gold standard is the rise inbreast-milk vitamin A.
A third use of indicators is to evaluate interventions. This isthe subject of the second part of de Pee et ai's article. It isimportant to differentiate indicators of responsiveness to interventions from those indicators that predict benefit from anintervention. The best indicator for these tasks may be different. For example, in an anemic population low serum ferritinmay perform well to predict benefit (cure of anemia) from aniron intervention. But ferritin concentrations might not behighly responsive to the intervention because the absorbed ironwill be utilized for hemoglobin synthesis, not stored. ~
The performance of an indicator of response may be influenced by the sort of intervention given, the statistical treatmentof the variable, and the range of status of the population. Eachof these is illustrated by de Pee et aI's study. First. the goldstandard used by de Pee et al was the response to a low-dose.five-times-weekly intervention with carotenoids, whereas the
I From the Division of Nutritional Sciences. Cornell University. Ithaca.NY. and the Center for Human NUlrition, Department of InternationalHealth. School of Hygiene and Public Health, The Johns Hopkins University, Baltimore. MD.
~ Address reprinl requests to RJ Stoltzfus. Center for Human Nutrition.Department of International Health. School of Hygiene and Public Health,The Johns Hopkins University, 615 North Wolfe Str~et. Baltimore. MD21205. E-mail: [email protected].
190 Am J Clin Nurr 1997;66: 190-1. Prin[ed in USA. © 1997 American Society for Clinical Nutrition
The American Society for Clinical Nutrition Inc. does not endorse any commercial enterprise.

EDITORIAL 191
intervention to which the results were compared (5) was asingle high dose of vitamin A (9). This difference may explainthe low responsiveness of milk vitamin A in de Pee et ai'sstudy. Second, and more important, de Pee et al point out thatthey used the pre- to postintervention increments in indicatorvalues within individuals, whereas the other analysis usedpostintervention values. Homeostatically controlled indicators,such as serum retinol, are usually much less variable within anindividual than they are across individuals. Thus, they willrequire much smaller sample sizes to identify differences between groups of women if increments are used rather thanabsolute values. The opposite is true for nonhomeostaticallycontrolled indicators such as vitamin A in milk. For instancethe sample sizes needed to detect differences at 3 mo betweenpostintervention values of groups of women receiving a singlehigh dose of vitamin A or placebo was 148 for serum retinol,60 for breast-milk vitamin A, and 35 for breast-milk vitamin Aas a ratio to fat (5). The respective sample sizes needed for thesame comparisons but using the pre- to postintervention increments were 47%, 62%, and 143% as large (RJ Stoltzfus,unpublished observations, 1997).
TIrird. because of the homeostatic control. serum retinol isless responsive at higher rather than lower levels of vitamin Anutriture. Theoretically, breast-milk vitamin A concentrationswill be responsive to vitamin A nutriture at higher concentrations, and thus will tend to respond better to vitamin A interventions than will serum retinol in populations with bettervitamin A status. There is some evidence for this in cows (l0).
These examples of decisions related to consequences need tobe e~panded and complemented by examples related to otherkinds of decisions, such as those related to nutritional equity or
to the search for hypothesized benefits of vitamin A nutriturehigher than those necessary to prevent death. For some of theseuses liver vitamin A stores might be a useful gold standard, butthe case needs to be made that this is so, and if so, that it ispractically feasible. n
REFERENCES
1. de Pee S, Yuniar Y, West CE, Muhilal. Evaluation of biochemicalindicators of vitamin A status in breast-feeding and non-breast-feedingIndonesian women. Am J Clin Nutr 1997;66:160-7.
2. WHO Expert Committee. Physical status: the use and interpretation ofanthropometry. Geneva: World Health Organization. 1995.
3. National Academy of Sciences. WIC nutrition risk criteria: a scientificassessment. Washington, DC: National Academy Press, 1996.
4. Habicht J-P. Pelletier DL. The importance of context in choosingnutritional indicators. J Nutr 1990;120:1519-24.
5. Stoltzfus RJ, Habicht J.p, Rasmussen K.1\1. Hakimi M. Evaluation ofindicators for use in vitamin A intervention trials targeted at women.Int J Epidemiol 1993;22:1111-8.
6. Brownie C. Habicht J-P, Cogill B. Comparing indicators of health andnutritional status. Am J Epidemiol 1986:124:1031-44.
7. Habicht J.p, Meyers LD. Brownie C. Indicators for identifying andcounting the improperly nourished. Am J Clin Nutr 1982;35:1241-54.
8. Brownie C, Habicht J-P. Selecting a screening cut-off point or diagnostic criterion for comparing prevalences of disease. Biometrics1984;4Q:675-84.
9. Stoltzfus RJ. Hakimi M, Miller KW. et al. High dose vitamin Asupplementation of breast·feeding Indonesian mothers: effects on thevitamin A status of mother and infant. 1 Nutr 1993:123:666-75.
10. Schweigert Fl, Eisele W. Parenteral j3-carotene administralion tocows: effect on plasma levels, lipoprotein distribution and secretion inthe milk. Z Emahrungswiss 1990;29:184--91.

Community and International Nutrition
Linear Growth Retardation in Zanzibari School Children1,2,3
Rebecca J. Stoltzfus,4 Marco Albonico,t James M. Tielsch, Hababu M. Chwaya* andLorenzo Saviolit
Center for Human Nutrition, Department of International Health, The Johns Hopkins School of Public Health,Baltimore, MD 21205; *Ministry of Health, Zanzibar, United Republic of Tanzania; and tSchistosomiasis andIntestinal Parasites Unit, Division of Control of Tropical Diseases, World Health Organization, Geneva 27,Switzerland
ABSTRACT This paper describes the longitudinal changes in height and weight of children in school grades 13 on Pemba Island, ZanZibar, a poor rural population in which parasitic infections and anemia are highly prevalent.Heights and weights of children were measured at base line, and 6 and 12 mo later, and were compared withU.S. reference data. At base line, the prevalence of height-for-age Z-score < -2 rose from 14% in 7-y-old childrento 83% in 13-y-old children. Prevalence of weight-for-age Z-score < -2 in children < 10 y was -10% or less.Median 6-mo height increments for Pembian boys were around the 5th percentile at age 8 and around the 10thpercentile from age 9 to 13 y. Height increments for girls improved from below the 25th percentile to above themedian in this age range. Based on the longitudinal yearly gains observed, boys accumulate a height deficit of11.9 cm and girls 8.5 cm, relative to the reference popUlation. In multivariate analyses, a small part of the variabilityin growth increments was explained by ascariasis and anemia (for weight gain) and schistosomiasis (for heightgain). A review of other growth data from rural African Bantu populations provides supporting evidence thatstunting occurs in older as well as younger children. It has been controversial whether school-based health andnutrition interventions could induce catch-up growth in already stunted children. Our results suggest that appropriate interventions might actually prevent stunting in late childhood. J. Nutr. 127: 1099-1105,1997.
KEY WORDS: • Africa • school children • growth • stunting
Improving the health of school children is emerging as apolicy priority in international health. The recent World BankDevelopmenr Report, Investing in Health, recommendedschool-based health services as a top priority for public healthaction in developing countries after concluding that they areamong the most cost-effective activities for reducing the burden of disease in developing countries. Proposed models forschool-based health services typically include distribution ofanthelminthic medications and micronutrient supplements,along with health education (Savio!i et al. 1992, World Bank1993).
Although it is likely that school-based interventions mayprevent or cure micronutrient deficiencies in school children,it remains controversial whether these interventions could improve growth, particularly linear growth. Because linear growthretardation is believed to occur mainly in early childhood(Martorell et a1. 1994, WHO Expert Committee 1995), thequestion has focused on whether stunted children can exhibit
1 Funded through cooperative agreement #DAN-5116-1-00-B051-00 betweenThe Johns Hopkins University and the Office of Health and Nutrition, UnitedStates Agency for International Development.
2 This manuscript has received institutionai approval from the World HealthOrganization,
3 The costs of publication of this article were defrayed in part by the paymentof page charges. This artiCle must therefore be hereby marked "advertisement"in accordance with 18 USC section 1734 solely to indicate this fact.
• To whom correspondence and reprint requests should be addressed.
catch-up growth if their environment is improved in laterchildhood. Adopted children whose environment changesfrom one of poverty to one of adequacy can attain a normaladult height (Proos et a1. 1991), and some authors have coneluded that catch-up growth may occur even when childrenremain in their impoverished environment (Kulin et a1. 1982).However, others maintain that catch-up growth does not occur, except in unusual populations in which maturation ismarkedly delayed (Martorell et al. 1979 and 1994).
Schools are usually the most efficient channel for deliveringhealth interventions to this age group, and school-based surveys are most often used to assess need for different interventions. Although a survey of height and weight of.school children is relatively simple to implement, the data may easily bemisinterpreted. Shorrness-for-age (being stunted) is commonamong school children in developing countries. However, itis believed to reflect a process that almost always happened inearly childhood (Martorell et a1. 1994). If linear growth failure(stunting) is not happening during the school years, then itcannot be prevented by school-based interventions (althoughit might be overcome by catch-up growth). In addition, thereare many pitfalls when using cross-sectional data from schoolchildren in a search for age effects. Nine-year olds may be morestunted than 7-y aids because they were more malnourished asyoung children, not because they are growing poorly as schoolchildren. Also, school enrollment and drop-our patterns maydiffer in stunted and nonstunted children, creating a spuriouspicture of stunting by age among children who attend schaD I.
0022-3166/97 $3.00 © 1997 American Society for Nutritional Sciences.Manuscript received 14 October 1996. Initial review completed 3 December 1996, Revision accepted 4 February 1997.
1099

1100 STOLTZFUS ET AL.
As part of an evaluation of a school-based deworming program, we monitored the longitudinal changes in height andweight of Zanzibari school children over a 1-y period. Datafrom the nonprogram schools enabled us to examine both thecross-sectional and longitudinal patterns of growth in primaryschool children in the absence of intervention. As we expected, the cross-sectional and longitudinal pictures differ inimportant ways. Contrary to our expectation, we found thatthese children are experiencing stunting of an important magnitude during the school years. These results are relevant forthe planning and evaluation of school health programs in EastAfrica and perhaps other regions.
SUBJECTS AND METHODS
Study population. This program evaluation was conducted onPemba Island, the smaller of the two islands of Zanzibar, a part ofthe United Republic of Tamania. Pemba Island lies 40 km off theEast African coast, 50 south of the equator. The island is dividedfrom north to south inco four districts of approximately equal size.The population is predominantly rural but extremely dense, about330 people/kmz. The economy is devoted primarily to subsistenceagriculture and cloves, an exported cash crop, wirh practically notourism. There are two rainy periods of the year, the short rainsaround November and the long rains from mid-March to mid-May.There is little irrigation, making patterns of work and harvests mark·edly seasonal. The primary staple foods are cassava and rice, the latterbeing more desired but less affordable. These foods are eaten withsauces of vegetables and small fish. Larger fish and meat are luxuryitems, and there are pronounced seasonal shortages in vegetablesand fish. Like other parts of coastal East Africa, Pemba Island ischaracterized by intense transmission of Plasmodium falciparum malaria, Schistosoma haemarobium and geohelminths.
The present analyses were conducted using data collected in fourschools that were assigned as a comrol group for an evaluation of aschool-based deworming program. To form this control group, oneschool was randomly selected from the public primary schools in eachof the four districts of the island and morning classes of grades 1-4were selected. The base-line survey was conducted in March-May,1994, and anthropometric measurements were conducted at base line,and 6 and 12 mo later. [n the control schools, 1375 children wereenrolled in the selected classes according to the school records, and1261 (91.7%) of those children participated in the base-line survey.Children who were surveyed again 6 mo later (86.7% of those at baseline) and who had sex and age data at base line were used in thepresent analyses; this sample numbered 1090 children, 86.4% of thebase-line cohort. Of these children. IOn (98.3%) had anthropometric data at base line and 6 mo, and 978 (89.8%) had complete dataat base line, 6 and 12 mo.
The study protocol was reviewed and approved by the institutionalreview boards of The Johns Hopkins University, the Ministry ofHealth of Zanzibar and the World Health Organization.
Assessment of nutrition and health status . Two amhropometrists were trained and standardized at the stare of the study, but>95% of height measurements at all surveys were taken by one ofthe anthropometrists, who used the same equipment at each surveytime. Children were weighed and measured in light clothing withoutshoes. Weight was measured to the nearest 0.1 kg using a batterypowered digital scale (Seca, Colombia, MD), and height was measured to the nearest 0.1 em using a wooden stadiometer (Shorr Pro·ductions, Olney, MD). Age was calculated from the birth date onschool records, which are taken from birth certificates. a requirementfor school registration. Occasionally, however, the school had norecord of age, and the child's self-reported age was used.
Hemoglobin concentration was determined by use of the HemoCue (HemoCue AB, Angelhom, Sweden). Parasitologic methods aredescribed in derail elsewhere (Srole:tus et at. 1997). Briefly. thick andthin blood smears were fixed and stained with giemsa, and malariaparasites were counted against leukocytes, using standard methods.Malaria species was also identified. All infections were P. falciparum;in <5% of slides, P. malariaewas also identified. Prevalence and
TABLE 1
Zanzibari school children: stUdy cohort at base line
Boys Girls
n (%)
All 549 (50.4) 541 (49.6)Age (yj1
<6.75 2 (0.4) 2 (0.4)7 6 (1.1) 8 (1.5)7.5 13 (2.4) 6 (1.1)8 24 (4.4) 20 (3.7)8.5 29 (5.3) 21 (3.9)9 54 (9.9) 59 (10.9)9.5 44 (8.0) 60 (11.1)10 89 (16.2) 107 (19.8)10.5 45 (8.2) 28 (5.2)11 86 (15.7) 93 (17.2)11.5 28 (5.1) 34 (6.3)12 46 (8.4) 60 (11.1)12.5 22 (4.0) 14 (2.6)13 28 (5.1) 17 (3.1)>13.25 33 (6.0) 12 (2.2)
School grade1 225 (41.0) 201 (37.2)2 220 (40.1) 229 (42.3)3 104 (18.9) 111 (20.5)
Parasitic infections2Malaria 310 (57.0) 301 (56.3)Ascariasis 393 (75.0) 378 (72.1)Trichuriasis 492 (93.9) 503 (96.0)Hookworms 485 (92.6) 474 (90.5)Schistosomiasis3
Microhematuria 166 (30.5) 143 (26.7)Visual hematuria 17 (3.1) 13 (2.4)
Anemia4
Hb <110 giL 355 (64.7) 319 (59.0)Hb <70 giL 23 (4.2) 17 (3.1)
1 Except for oldest and youngest groups, age refers to midpoint ofage group, e.g., 7 includes children from 6.75 to 7.24 Y. 7.5 includeschildren from 7.25 to 7.74, and so on.
2 Numbers for parasitic infection and anemia do not match totalnumber of children because data were occasionally missing.
3 Hematuria was used as an indicator of urinary schistosomiasis asdescribed in Subjects and Methods. Hematuria categories are mutuallyexclusive.
4 Hb, hemoglobin.
intensity of helminth infections were determined using the KatoKatz method (World Health Organization 1994). S. haematobiuminfections were determined indirectly by testing for microhematuriawith Hemastix test strips (Ames Laboratories, Elkhart, IN); grade++, +++ or the presence of visible hematuria was considered apositive test. This procedure screens for S. haematobium infectionwith 69% sensitivity and 86% specificity (Savioli et aL 1990). Anychild with visual hematuria was treated with praziquantel.
Data analysis. Height·for·age and weight-for-height Z·scoreswere calculated using EpiInfo (Centers for Disease Control, Atlanta,GA). Stunting was defined as heighe-foc-age Z-score < -2. Wastingas weight-far·height Z·score <-2. We used this indicator only forchildren <10 y old because it is not recommended beyond this age(WHO Expert Committee 1995).
Six-month height and weight increments were calculated as thedifference in measurements between surveys, adjusted to 6-mo differences according to the actual number of days between surveys, whichwere approximately but not exactly 6 mo apart. These incrementswere compared with the incremental growth tables of Baumgartneret aL (1986), based on the growth of white children from Ohio (theFels Longitudinal Study). For this purpose. an age variable in 6-moincrements was created, in which children aged 6.75-7.24 y at baseline were categorized as age 7 y, children 7.25-7.74 y as 7.5 y, and
.".-/5, 0

STUNTING IN ZANZIBARI SCHOOL CHILDREN 1101
Proportion stunted or wasted (%)
100 r------------------,
FIGURE 1 Prevalence of stunting and wasting in Zanzibari schoolchildren by age and sex. Data are from base-line assessments. Fornumbers of children, see Table 1; children plotted at age 7 y includechildren 7.0 and 7.5 y, and so on.
..--'
.....
2
4
3
from around -1 at 7 y to - 2.7 at 13 y, whereas the standarddeviation of Z-scores remained between 0.85 and 1.2 at aUages. In contrast to stunting, the prevalence of wasting waslow (~1O% or lower) and showed no trend by age or sex.
Longitudinal patterns of growth. The cross-sectional patterns described above might have been created by seculartrends in malnutrition of early childhood, or by better-off children enrolling at earlier ages. To detennine whether ponderalor linear growth retardation was presently occurring in thesechildren, we compared weight and height increments to reference values. The median growth increments for height in boys(Fig. 2) were distinctly below the reference median, lyingaround the 5th percentile for 8-y aids, and around the 10thpercentile for 9- to 13-y aids. The pubertal growth Spurt wasnot apparent in these boys as a group up to age 13 y. Theprevalence of height increments below the 5th reference percentile was ~35% up to age 12, but fell to <10% by 13 y.This drop in low values relative to the reference likely reflectsthe increased variability in the reference population aroundtheir pubertal growth spurt, at a time when the Pembian boyshave not yet entered their spurr.
In girls, the height increments were around the 5th percentile in 8.y aids, around the 25th percentile in 9- to 12-y aIds,and above the 50th percentile in children 12.5-13.5 y. Thepubertal growth spurt appears to occur in these girls 1.5-2 ylater than in reference girls. The prevalence of height increments below the 5th reference percentile for girls was nearly40% at age 8, -20% at ages 9-10, and <5% after age 11 y.
For both girls and boys, the height increments for the twostudy intervals (roughly April to October and October toApril) were very similar. Apparently, these rather wide sea-
BOYS: Meell.n IMIgIIt In<;rement {cm/6 mol
5,.-----------------------,
Stunted, girls Wasted, girls• 0
Stunted, boys Wasted, boys
40
60
20 - e- •0 ~ Q
7 8 9 10 11 12 13Age (y)
80
50 on. In the rabIes and figures that follow, our age groupings representthe age at the start of each growth interval. This is in contrast tothe tables of Baumgartner et al. (1986), in which the tabulated ageis at the end of rhe growth interval.
To illustrate the magnitude of the height and weight deficits atdifferent ages in this population, we calculated the difference betweeneach child's height or weight and the median height or weight ofthe WHO growth reference population (World Health Organization1983). The difference in the height or weight deficit at base line andat 12 mo representS the height or weight deficit accrued by a childin a l-y period relative to the growth reference. The average annualheight or weight change relative to the reference was calculatedfor boys and girls, along with 95% confidence limits (5nedecor andCochran, 1980).
To test potential predictors of vuriadon in growth rate, we usedmultiple linear regression, with the base-line to 6-mo height or weightincrement as the dependent variable. In both models, we first adjustedfor the variation due to age, sex and school, then tested additionalpredictor variables and retained those with significance levels below0.10. lmeraccions between predictor variables were also tested andconsidered significant at P < 0.20. Data analyses were conductedusing Systat statistical software (SYSTAT, Evanston, IL).
RESULTS8 8.5 9 9.5 10 10.S 11 11.5 12 12.5 13 13.S
Age (yl :at atart of Interval
-1 '-'-_-'-_-'-_..l-_..I.-_.L---''----'-_-'-_-'-_-'-_-'-'
GIRLS: Median height Increment (cm/6 mol
4~-------------------.,
.. ,..•.
...... r •• > •••• '" ••••••••••• ,
..............•......•......... . .
2
a
3
8 8.5 9 9.5 10 10.5 11 11.5 12 12.5 13 13.5
Age (y) at stlIrt 01' Internl
FIGURE 2 Six-month height increments of Zanzibari boys andgirls by age. Heavy lines depict the incremental growth curves of Zanzibari children. Squares are median increments from base line to 6 moin 1072 children, and circles are median increments from 6 to 12 moin 978 children. Each point represents between 11 and 99 observations.Dotted lines depict the 50th and 5th percentiles from the Fels Longitudinal Study (Baumgartner et al. 1986).
The study sample was comprised of almost equal numbersof boys and girls (Table O. Although all children were ingrades 1-3, the age range of the children was wide, becauselate school entrance is common in Zanzibar. The prevalenceof anemia in these school children was very high; this is described in detail elsewhere (Stoltzfus et a1. 1997). Over halfof children had circulating malaria parasites, about one thirdhad some degree of hematuria, and >99% were infected withat least one geohdminth. Hookworms and Trichoris trichuriawere especially common.
Cross-sectional patterns of stunting and wasting. In thecross-sectional data at base line, the prevalence of stuntingrose dramatically with age, from an overall prevalence of 14%in 7-y aids to 83 % in 13-y aIds (Fig. 1). It is notewonhy thatthe increase in prevalence was steady both in the prepubertaland pubertal age ranges. In girls, the prevalence of stuntingpeaked at age 12 and then apparently began to decline,whereas in boys the prevalence of stunting rose steadily up toage 13. This striking trend in low Z-scores by age was notcaused by increasing variability of the Z-score distribution byage. The mean Z-score for the study sample steadily decreased

1102 STOLTZFUS ET AL.
-1 L...J.._........._~_'----I._-J.._-'-_.l----'_-..J._ ........._-'-'
BOYS: MedIan ~lIht Inc~ (kg/8 mol4
the reference. Based on the average annual losses from age 814 y, the cumulative height deficit was 11.9 cm for boys and8.5 em for girls. The cumu!ative weight deficit in the ~ame
period was 11.8 kg for boys and 9.8 kg for girls.Predictors of poor growth. In addition to the strong rda
tionships between age and sex and growth increments, severalbase-line morbidities were predictive of smaller growth increments in the succeeding 6-mo period (Table 2). Childreninfected with A. lumbricoides had 6-mo weight gains 140 g lessthan their uninfected peers. Among chHdren < age 11 y, lowerhemoglobin concentration was predictive oflower weight gain.This association was strongest using a hemoglobin cut-off of100 gIL; children below this cut-off had lower weight gains(170 g/6 mol than those with higher hemoglobin. For bothascariasis and low hemoglobin, the weight increments of norma! children were just above the 25th percentile, and thoseof affected children were just below the 25th percentile.
An association between hematuria and poor linear growthincrement was only marginally significant in boys. but it isnoteworthy because of its relationship to treatment. This association was found on!y with microhemaruria, which was nottreated. Visual hematuria, indicative of severe infection, wastreated with a curative dose of praziquanrel, and these treatedboys exhibited growth simHar to their uninfected peers. Thelinear growth of boys without hematuria was close to the 10thpercentile, whereas that of boys with microhematuria was closeto the 5th percentile.
.....
., •••• >
..........................~_....._-:;;:...-~!:::::::::::=::::=::::::-:....~
....o ••••••••••••••••••••••••••••••••••••••••••••••••
2
3
o
8 8.5 9 9.5 10 10.5 11 11.5 12 12.5 13 13.5
Age (yl at mrt of Interval
GIRlS: MedllUl weight Increment (kglll mol3 .................•..•.
...... .....2
0
.1
-28 8.5 9 9.5 10 1o.s 11 11.5 12 12.5 13 13.5
Age (yo) at start or Interval
FIGURE 3 Six-month weight increments of Zanzibari boys andgirls by age. Heavy lines depict the incremental growth curves of Zanzibari children. Squares are median increments from base line to 6 moin 1072 children, and circles are median increments from 6 to 12 mo in978 children. Each point represents between 14 and 106 observations.Dotted lines depict the 50th and 5th percentiles from Fels LongitudinalStUdy (Baumgartner et at 1986).
DISCUSSION
We found that Pembian school chi!dren experienced significant linear growth retardation during their primary school
0,-------------,
0,---------------,
12 months
Boys Basertne
Girls Baseline
~ 12 months
~~
~--
e 10 11 12 13 14
Age(y)
e 9 10 11 12 13 14
Age(y)
e -5
~
''5 -10,.QJ'tI;C -15 r.~ I:J: -20 L
e -5.2-1; -10l;:
-3.. -15.cCl.;,~ -20
FIGURE 4 Mean difference in height of Zanzibari boys and girlsfrom NCHSJWHO growth reference (World Health Organization 1983).Dotted lines show cross-sectional pattern of height deficit by age (n =1090), and solid lines show longitUdinal pattern (n '= 978) for each 6-moage cohort. Each point represents between 14 and 107 observations.
sonal intervals did not capture any seasonal patterns in lineargrowth.
The weight increments of boys and girls (Fig. 3) were towcompared with the reference, lying between the 10th and 25thpercentiles and closer to the 25th. There is no evidence of agrowth spurt in this group of boys up to age 13.5 y. The weightincrements of girls improved with age rdative to the reference.Bdowage 11, girls' weight increments were between the 10thand 25th percentiles, but after age 11 graduaUy approachedthe reference median.
The magnitude of growth retardation in the Pembian children can be examined in Figures 4 and 5. The base-lineand 12-mo foHow-up data have been converted into meandifferences from the National Center for Health Statistics(NCHS) reference so that the longitudinal and cross-sectionalpatterns of growth retardation can be compared in real terms.The cross-sectional picture in boys and girls confirms the patterns of prevalence of stunting by age seen in Figure 1.
In boys, the longitudinal picture of growth was similar tothe cross-sectional picture, both for weight and for height.Apart from the group of boys 9.25-9.75 y at base line, whosegrowth tended to be better, boys' weight and height declinedsteadily away from the reference. Boys lost on average 1.99cmly (95% confidence limits: - 2.16, -1.82) and 1.97 kg/y(95% confidence limits: -2.11, -1.83) relative to the reference population. In girls, the longitudinal fall away from thereference values was less steep than the cross-sectional trendsuggested. Girls began to stop losing height and weight relativeto the reference at ages 12-13 y. Still, girls lost on average1.42 cmly (95% confidence limits: -1.64, -1.19) and 1.63kg/y (95% confidence limits: -1.81, -1.45) compared with
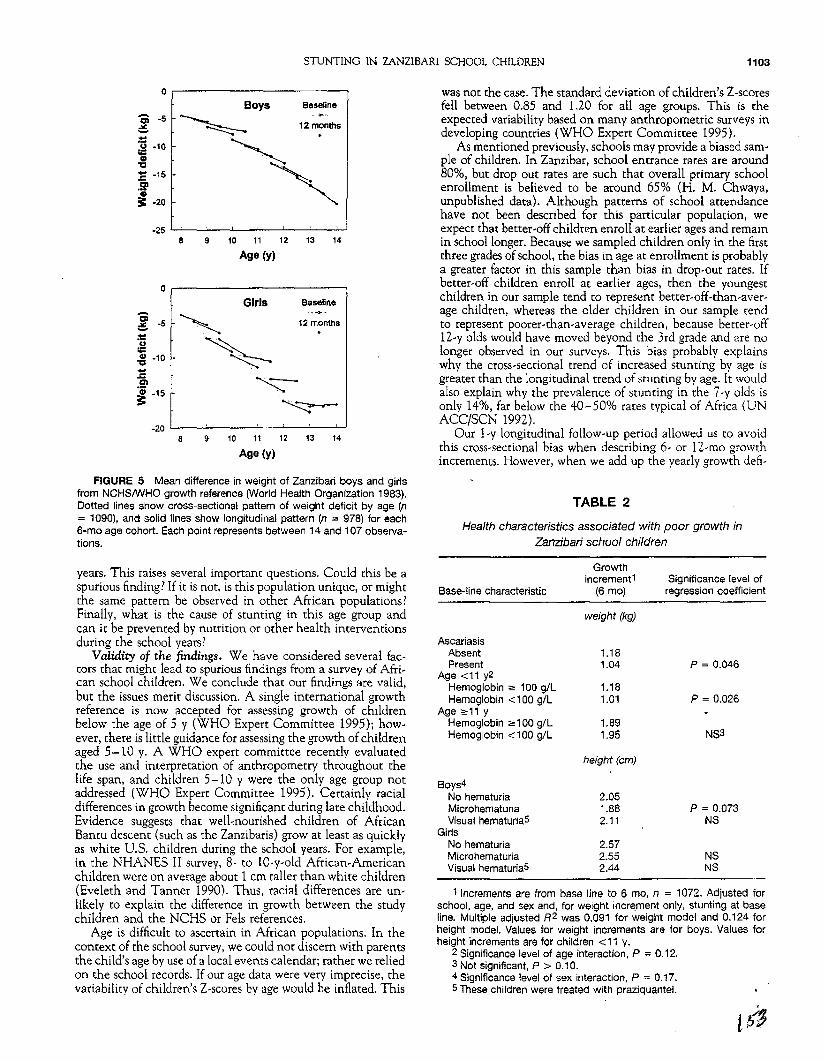
STUNTING IN ZANZIBARI SCHOOL CHILDREN 1103
0.-------------,
0.-------------, was not the case. The standard deViation of children's Z-scoresfell between 0.85 and 1.20 for all age groups. This is theexpected variability based on many anthropometric surveys indeveloping countries (WHO Expert Committee 1995).
As mentioned previously, schools may provide a biased sample of children. In Zanzibar, school entrance rates are around80%, but drop out rates are such that overall primary schoolenrollment is believed to be around 65% (H. M. Chwaya•unpublished data). Although patterns of school attendancehave not been described for this particular population, weexpect that better-off children enroll at earlier ages and remainin school longer. Because we sampled children only in the firstthree grades of school, the bias in age at enrollment is probablya greater factor in this sample than bias in drop-out rates. Ifbetter-off children enroll at earlier ages, then the youngestchildren in our sample tend co represent better-off-than-average children, whereas the older children in our sample tendto represent poorer-than-average children, because better-off12-y aids would have moved beyond the 3rd grade and are nolonger observed in our surveys. This bias probably explainswhy the cross-sectional trend of increased stunting by age isgreater than the longitudinal trend of stunting by age. It wouldalso explain why the prevalence of stunting in the 7-y aIds isonly 14%, far below the 40-50% rates typical of Africa (UNACC/SCN 1992).
Our 1-y longitudinal follow-up period allowed us co avoidthis cross-sectional bias when describing 6- or 12-mo growthincrements. However, when we add up the yearly growth deli-
Boys Baseline
~ 12m~nthS
~
~
Girls Baseline
, 12montlls
.~.
~
'z:::~
8 9 10 11 12 13 14
Age (y)
8 9 10 11 12 13 14
Age (y)
~ ~5
;!::~ -10
~~ -15.21CD
== -2.0
.-~ -5;!::u
~ ·10....z:Cl'I
~ ·15
FIGURE 5 Mean difference in weight of Zanzibari boys and girlsfrom NCHSIWHO growth reference (World Health Organization 1983).Dotted lines show cross-sectional pattern of weight deficit by age (n= 1090), and solid lines show longitudinal pattern (n = 978) for eachB-mo age cohort. Each point represents between 14 and 107 observations.
TABLE 2
Health characteristics associated with poor growth inZantibarlschoolchfldren
1 Increments are from base line to 6 mo, n = 1072. Adjusted forschool, age, and sex and, for weight increment only, stunting at baseline. Multiple adjusted R2 was 0.091 for weight model and 0.124 forheight model. Values for weight increments are for boys. Values forheight increments are for children <11 y.
2 Significance level of age interaction, P "" 0.12.3 Not significant, P > 0.10.4 Significance level of sex interaction, P ~ 0.17.5 These children were treated with praziquantel.
years. This raises several important questions. Could this be aspurious finding! If it is not. is this population unique, or mightthe same pattern be observed in other African populations!Finally, what is the cause of stunting in this age group andcan it be prevented by nutrition or other health interventionsduring the school years?
Validity of the findings. We have considered several faccors that might lead to spurious findings from a survey of African school children. We conclude that our findings are valid,but the issues merit discussion. A single international growthreference is now accepted for assessing growth of childrenbelow the age of 5 y (WHO Expert Committee 1995); however, there is little guidance for assessing the growth of childrenaged 5-10 y. A WHO expert committee recently evaluatedthe use and interpretation of anthropometry throughout thelife span, and children 5-10 y were the only age group notaddressed (WHO Expert Committee 1995). Certainly racialdifferences in growth become significant during late childhood.Evidence suggests that wel1~nourished children of AfricanBantu descent (such as the Zanzibaris) grow at least as quicklyas white U.S. children during the school years. For example,in the NHANES II survey, 8- to lO-y-old African-Americanchildren were on average about 1 em taller than white children(Eveleth and Tanner 1990). Thus, racial differences are unlikely to explain the difference in growth between the studychildren and the NCHS or Fels references.
Age is difficult to ascertain in African populations. In thecontext of the school survey, we could not discern with parentsthe child's age by use of a local events calendar; rather we reliedon the school records. If our age data were very imprecise, thevariability of children's Z-scores by age would be inflated. This
Base-line characteristic
AscariasisAbsentPresent
Age <11 y2Hemoglobin ;=: 100 giLHemoglobin <100 giL
Age ;=:11 yHemoglobin ",100 giLHemoglobin <100 giL
Boys4No hematuriaMicrohematuriaVisual hematuria5
GirlsNo hematuriaMicrohematuriaVisual hematuria5
Growthincrement1
(6 rna)
weight (kg)
1.181.04
1.181.01
1.891.95
height (em)
2.051.882.11
2.572.552.44
Significance [evel ofregression coefficient
P = 0.046
p = 0.026
NS3
P = 0.073NS
NSNS

1104 . STOLTZFUS ET AL.
dts observed in children of different ages, we are again subjectto this bias. In this case, this bias would tend to underestimatethe cumulative growth deficits experienced by typical Zanzibarichildren, because typical Zanzibari 8-y aids would tend to growmore poorly than the subgroup of 8-y olds who were privilegedenough to be in our school-based sample. Secular trends infeeding practices and infections during infancy may also contribute ro the cross-sectional pattern of stunting by age, butcould not create the longitudinal deficits we observed.
Differences in the maturation rate of poorly nourished children compared with reference populations make the interpretation of growth data in this age range problematic. Sexualmaturation was not assessed in this study. Modem-day studiesof African children have found the median age at menarcheto be 13.1-14.5 y, which represents a delay of around 1.5 ycompared with U.S. blacks (Eveleth and Tanner 1990). Adelay of 1-2 y in the start of the growth spurt of Zanzibarichildren is also suggested by the pattern of median growthincrements we observed in girls. If. the difference in growthincrements between the study sample and the reference population was caused by the difference in their maturation, thenthe growth increments would be normalized by shifting thecurve of growth increments by age of the Pembian children1-2 y to the left in Figures 2 and 3. This does not normalizethe growth increments. The median height increment for theboys in our sample was close to 2.0 cm from age 8 to 12 y.This does not resemble typical linear growth for referencechildren of any age from birth to 15 y. The lowest referencemedian height increment in this age range is 2.52 em, observedberween age 10.5 and 11.0 y (Baumgartner et a1. 1986).
Perhaps the greatest evidence for the validity of our findingsis their internal coherence. On the basis of the cross-sectionalpattern of stunting by age, the incremental growth pattems orthe longitudinal differences in height of age cohorts relativeto the NCHS reference, the phenomenon of stunting is clear.Although the cross-sectional analysis at base line overestimates the magnitude of stunting, the pattern of stunting byage and sex is consistent.
Comparability to other African studies. Several studies ofprimary school-age children in Bantu populations are availablefor comparison with our data. As part of the Nutrition Collaborative Research Support Program (NCRSP), longitudinalgrowth in a rural Kenyan population (Embu, Kenya) was measured (Neumann and Harrison 1993). In young infants, toddlers and school-age children, linear growth retardation wasfound. To obtain the school-age data. a community-based sample of 7-y aIds was followed prospectively for 18 mo. Thesechildren started off near the NCHS 3rd percentile for heightfor-age (7 em shorter than the reference), and ended 18 molater well below the 3rd percentile (11 cm shorter than thereference). This rate of height loss is steeper than the loss weobserved in Pembian 8-y aIds, perhaps because our schoolbased sample selected for better-off 8-y aIds. As we found inZanzibar, Kenyan boys grew more poorly than girls, with heightincrements around the 3rd and 25th percentile, respectively,for the sexes.
Lawless et a!. (1994) conducted an iron supplementationtrial in 87 primary school children, ages 6-11 y, from theKenyan coast (Kwale District), where endemic parasitic infections are very similar to Zanzibar. Although this study was toosmall to allow an examination of linear growth at differentages, the average height-for-age Z-scores of control childrenfell from -1.26 to -1.34 in the 14-wk study period, a smallbut significant decline. The average height gain of controlchildren over the period was i.1 cm. This would extrapolate
to 1.9 cm/6 mo, a value very similar to the increments weobserved. No comparison was made between boys and girls.
The growth of children from 2-18 y in rural MachakosDistrict, Kenya, was studied by means of a cross-sectional survey (Stephenson et a1. 1983 in Eveleth and Tanner 1990).The sample of preschool children was community-based, butthe older children were from two village schools. The meanlength of 2-y old children was already 7.3 em shorter than theNCHS reference. On average. children from the ages of 2-5y "lost" 1.0 cmly (total: 3.0 em), and those from the ages of6-11 y"lost" 1.5 cmly (total: 7.5 em). This pattern of heightby age in the school children may be exaggerated because ofschool enrollment biases, although the authors claimed thatbelow the age of 14 y, the school children were representativeof the community. By age 17, the height deficit was 18.2 cmin boys, compared with 12.7 em in girls. These older childrenwere not representative of the community, but rather tendedto come from more privileged families.
Thus it appears that the Pembian children are nor unique.These studies provide evidence that African children over theage of 3 y do not grow parallel to reference populations andthat boys are more vulnerable ro stunting than girls.
Possible etiologies and preventive measures. We hypothesized that stunting in African school-age children may becaused by energy deficiencies. micronutrient deficiencies, orchronic parasitic infection. However, because wasting did notaffect a large proportion of children in this population, energyinsufficiency is unlikely to be a major cause of stunting.
Irop status is very low in these children, but low hemoglobinwas the only base-line indicator of iron defiCiency that wasassociated with growth, and ponderal growth only. However.iron supplementation caused a significant increase in lineargrowth of children from coastal Kenya, based on the randomized controlled trial mentioned previously (Lawless et a1.1994). Iron-supplemented children gained on average an additional 0.3 cm/14 wk, equivalent to 0.6 cm/6 mo. This amountof additional height gain would bring the rate of height gainclose to reference values.
The NCRSP study of Embu, Kenyan children also suggeststhat dietary etiologies of stunting are operating in this agegroup. In multivariate models that included maternal heightand socioeconomic status, dietary energy intake was significantly associated with attained height at age 8 y, and animalprotein intake was significantly associated with height increment (Neumann and Harrison 1993). Animal protein intakemight indicate better overall protein intakes, b~ter dietaryiron availability or more bioavailable zinc. A higher phytate:zinc molar ratio was also associated with poor lineargrowth in these children. Inadequate dietary zinc has also beendocumented in Ghana and Malawi (Ferguson et a1. 1993).
Our data suggest that parasitic infections may also contribute to stunting. although the relationships we observed werenot statistically very strong, and they explained only a smallfraction of the variability in growth. Two trials of anthelminthic treatment with albendazole (effective against the geohelminths: hookworms, T. rrichuria, and Ascaris lumbricoides)(Stephenson et a1. 1989 and 1993) and one trial of treatmentwith merrifonate and praziquante1 (effective against the geohelminths and schistosomiasis) (Latham et a1. 1990) found positive effects on height gain in primary school children on theKenyan coast, whereas another publication from one of thesame albendazole trials reported no effect on height gain.
A remarkable aspect of helminth infection and malaria istheir chronicity. In Zanzibar and many parts of Africa, it israre to find a child who is not infected with at least one ofthese parasites throughout their entire childhood and adoles-

STUNTING IN ZANZIBARI SCHOOL CHILDREN 1105
cence. Even small decrements· in growth may become largewhen accumulated over 10-12 y.
Slow rates of linear growth in the primary school yearsmight have either of two implications for health. First, theprocess of stunting might be associated with concurrent risksto the health and development of school-age children, as isthe case with young children who experience stunting (WHOExpert Committee 1995). Second, school-age stunting mightresult in shorter adult height, which decreases work capacityand increases reproductive risks for women (WHO ExpertCommittee 1995). We cannot describe the effect of the growthretardation we observed on final adult heights, because we didnot measure growth during and after puberty. A porrion of theheight deficit we observed will be compensated by a longerduration of prepubertal growth. Between the ages of 8 and 14y, Pembian boys are gaining around 4 crnly, while "lOSing" 2cmly relative to the reference. A delay in puberty of2 y relativeto the reference population would allow them to recover 8 ofthe 12-cm deficit accrued in this period. A pubertal delay of3 y (i.e., mean age at menarche of 16-16.5 y) would be neededto compensate fully the deficit we observed. This seems unlikely, based on African values in the literature (Eveleth andTanner 1990).
It has been suggested from cross-sectional data that ruralKenyan stunted children catch up fully during late adolescence(Kuhn et a1. 1982). However, this evidence is based on observations of seven 18-y-old boys and eighteen 17-y-old girlscompared with reference data collected by other investigatorsin 1961. Compared with the NeHS reference data, these Kenyan boys had an average height-far-age Z-score of -1.55 at10 y and -2.74 at 17 y, whereas the girls improved from -2.57to -1.14.
Our findings raise several new questions: 1) How much of .the height deficit accrued during the primary school years ismade up through longer prepubertal growth or during the pubertal growth spurt? 2) What are the functional implicationsof slower linear growth during the primary school years; forexample, do these slower-growing children also have slowersocial or cognitive development? 3) Is school-age stunting pteventable through school-based or other public health interventions, and will these interventions correct the functional decrements that might be associated with stunting in this agegroup? Further research is required to describe the growth ofAfrican children based on community-based samples and toevaluate potential interventions to prevent stunting in Africanschool-age children.
ACKNOWLEDGMENTS
Our thanks to Laura Caulfield for her insightful comments on themanuscript. We also thank Kassim Shemel Alawi and all the staff ofthe Pemba Public Health Team who carefully collected these data.
LITERATURE CITED
Baumgartner. R. N., Roche. A. F. & Himes, J. H. (1986) Incremental growthtables: supplementary to previously published charts. Am. J. Clin. Nutr. 43:711-722.
Eveleth, P. B. & Tanner, J. M. (1990) Worldwide Variation in Human Growth.2nd ed. Cambridge Press. Cambridge. U.K.
Ferguson, E. L., Gibson, R. S., Opare-Obisaw, C., Ounpuu, S., Thompson. L. U. &Lehrfeld, J. (1993) The zinc nutriture of preschool children living in twoAfrican countries. J. Nutr. 123: 1487-1496.
Kulin, H. E.• Bwibo, N., Mutie. D. & Santner, S. J. (1982' The effect of chronicchildhood malnutrition on pubertal growth and development. Am. J. Clin.Nutr. 36: 527-536.
Latham, M. C., Stephenson, L. C.• Kurz. K. M. & Kinoti, S. N. (1990) Metrifonate or Praziquantel treatment improves physical fitness and appetite of Kenyan schoolboys with Schistosoma haematobium and hookworm infections.Am. J. Trop. Med. Hyg. 43: 170-179.
Lawless. J. W .• Latham, M. C., Stephenson. L. S., Kinoti, S. N. & Pertet, A. M.(1994) Iron supplementation improves appetite and growth in anemicKenyan primary school children. J. Nutr. t24: 645-654.
Martorell. R., Kettel, Khan L. & Schroeder. D. G. (1994) Reversibility of stunting:epidemiological findings in children from developing countries. Eur. J. Clin.Nutr. 46 (Suppl. 1': 545-S57.
Martorell, Roo Yarbrough, C.. Klein. R. E. & Lechtig, A. (1979) Malnutrition. bodysize, and skeletal maturation: interrelationships and implications for catch-upgrowth. Human BioI. 51: 371-369.
Neumann. C. G. & Harrison, G. G. (1993) Onset and evolution of stunting ininfants and children. Examples from the Human Nutrition Collaboartive Research Support Program. Kenya and Egypt studies. Eur. J. Clin, Nutr. 48(Suppl. 1): S90-S102.
Proos. L. A., Holvander, Y. & Tuvemo, T. (1991) Menarcheal age and growthpattem of Indian girls adopted in Sweden. II. Catch-up growth and final height.Ind. J. Pediatr. 58: 105-114.
Savioli, L. Bundy, DAP. & Tomkins, A. (1992) Intestinal parasitic infections:a soluble public health problem. Trans. R. Soc. Trop. Med. Hyg. 86: 353354.
Savioli, L., Hatz, C., Dixon. H" Kisumku. U. M. & Mott, K. E. (1990) Control ofmorbidity due to Schistosoma haematob/um on Pemba Island: egg excretionand haematuria as indicators of infection. Am. J. Trop. Med. Hyg. 43: 289295.
Snedecor, G. W. & Cochran. W. G. (1960) Statisticai Methods. 7th ed. IowaState University Press. Ames. IA.
Stephenson, L. S., Latham, M. C.• Adams, E. J., Kinoti, S. N. & Pertet. A. (1993)Physical fitness, growth and appetite of Kenyan school boys with hookworm.Trichuns trichiura and Ascaris {umbrico/des infections are improved fourmonths after a single dose of Albendazole. J. Nl.ltr. 123: 1036-1046.
Stephenson, L. S.. Latham, M. C.• Kurz. K. M., Kinot!. S. N. & Brigham. H. (1989)Treatment with a single dose of albendazole improves growth of Kenyanschoolchildren with hookworm, Trichuris trichiura, and Ascans lumbricoidesinfeotions. Am. J. Trap. Mad. Hyg. 41: 78-87.
Stoltzfus, R. J .. Chwaya, H. M.• Albonico, M., Schulze. K.. Tie\sch, J. & Savioli,L. (1997) Epidemiology of iron deficiency and anemia in Zanzibari schoolchildren. Am. J. Clin. Nutr. 65: 153-159-
United Nations Administrative Committee on Coordination-Subcommittee onNutrition (ACC/SCN) (1992) Second Report on the World Nutrition Situation. Vol. 1. Global and Regional Results. ACC/SCN, Geneva, Switzerland.
World Bank (1993) World Development Report, Investing in Health. OxfordUniverSity Press, New York, NY. •
World Health Organization (1983) Measuring Change in Nutritional Status.WHO, Geneva. Switzerland.
World Health Organization (1994) Sench Aids for the Diagnosis of IntestinalParasites. WHO, Geneva, Switzerland.
World Health Organization Expert Committee (1995) Physical Status: The Useand Interpretation of Anthropometry. WHO, Geneva, Switzerland.

Community and International Nutrition
School-Based Deworming Program Yields Small Improvement in Growth ofZanzibari School Children after One Year1
,2,3 '
Rebecca J. Stoltzfus,4 Marco Albonico,* James M. Tielsch, Hababu M. Chwayat andLorenzo Savioli*
Center for Human Nutrition, Department of International Health, The Johns Hopkins School of Public Heaith,Baltimore, MD 21205; t Ministry of Health, Zanzibar, United Republic of Tanzania; and *Schistosomiasis andIntestinal Parasites Unit, Division of Control of Tropical Diseases, World Health Organization, Geneva 27,Switzerland
ABSTRACT Efficacy trialS of antihelminthic therapies conducted in Africa have reported improvements in chil..,dren's growth, but nutritional evaluations of large-scale deworming programs are lacking. We evaluated the firstyear effect on growth of a school-based deworming program in Zanzibar, where growth retardation occurs inschool children. Children in four primary schools were given thrice-yearly mebendazole (500 mg) and comparedwith children in four schools that received twice-yearly mebendazole and children in four non-program schools.Evaluation schools were randomly selected and allocated to contrOl, twice-yearly or thrice-yearly deworming.Approximately 1000 children in each program group completed the 1-y follow-up. Children <10 Yold gained 0.27kg more weight (P < 0.05) and 0.13 cm more height (P = 0.20) in the tWice-yearly group, and 0.20 kg more weight(P = 0.07) and 0.30 cm more height (P < 0.01) in the thrice-yearly group, compared with the control group.Children <10 y old with higher heights-far-age at baseline had higher weight and height gains in response todeworming. In children 2:10 y old, overall program effects on height or weight gains were not significant. But inthis age range, younger boys had significant improvements in height gain with thrice-yearly deworming, andchildren With higher heights-for-age had greater improvements in weight gain with deworming. We conclude thatthe deworming program improved the growth of school children, especially children who were younger and lessstunted, but the improvements were small. More effective antihelminthic regimens or additional dietary or diseasecontrol interventions may be needed to substantially improve the growth of school children in areas such asZanzibar. J. Nutr. 127: 2187-2193,1997.
KEY WORDS: • humans • Africa • growth • geohelminths • hookworms
School-based deworming has been advocated as a highlycost-effective public health measure in less-developed countries (World Bank 1993). It is estimated that over 1 billionpeople are infected with Ascaris lumhricoides, 880 million withhookworms, and 770 million with Trichuris trichiura (Warrenet at. 1993), and school children are the group most heavilyinfected with these geohelminths (Savioli et a1. 1992). Theexpected benefits from deworming in this age group are improved school participation and performance, growth and ironstatus (Warren et al. 1993).
Improved growth of primary school children could result ingreater adult height, which is associated with greater workcapacity in men and women and with improved reproductive
1 Funded through cooperative agreement DAN-5116-1-00-8051-00 betweenThe Johns Hopkins University and the Office of Health and Nutrition, UnitedStates Agency for International Development.
2 This articlE! has received institutional approval from the World Health Organi·zation.
3 The costs of pUblication of this article were defrayed in part by the paymentof page charges. This article must therefore be hereby marked "advertisement"in accordance with 18 USC section 1734 solely to indicate this fact.
• To whom correspondence and reprint requests should be addressed.
outcomes in women (WHO Expert Committee 1995). Wepreviously published evidence that Zanzibari school childrenexperience significant linear growth retardation compared withinternational growth references (StOltzfus et at. 1997a). Because helminth infections are highly prevalent in Zanzibar,the growth of school children might be improved if helminthinfections were controlled.
Several efficacy trials of antihelminthic therapie~ in schoolchildren have produced promising results (Kruger et a1. 1996,Latham et al. 1990, Stephenson et al. 1989, 1993a and 1993b),especially in coastal East Africa, where helminth infections areprevalent and intense. In these controlled randomized trials,growth, appetite, fitness and iron status improved in childrentreated with antihelminthic drugs. However, evidence is lacking in the literature on the program effectiveness of large-scaleschool-based deworming efforts.
We report here the results of an evaluation of a schoolbased deworming program implemented by the Ministries ofHealth and Education of Zanzibar on Pemba Island. The evaluation measured the effect of the program on helminth infections, nutritional status and school attendance and comparedthe effects of two deworming schedules, twice-yearly and
0022·3166/97 $3.00 © [997 American Society for Nutritional Sciences.Manuscript recei\led 31 March 1997. Initial review completed 28 May 1997. Revision accepted 21 July 1997.
2187

2188 STOLTZFUS ET AL.
thrice-yearly. A single 500-mg dose of generic mebendazolewas chosen as the anrihelminrhic treatment because of itssimplicity and low cost (US$O.027 per dose, Albonico et a1.1994). We describe the effect of twice-yearly and thrice-yearlydeworming on the height and weight gains of primary schoolchildren in Zanzibar.
METHODS
The school-based dewonning program. The Zanzibar schoolbased deworming program began in 1994 on Pemba Island, the smallerof the two islands of Zanzibar, a parr of the United Republic ofTanzania. From 1988 to 1992, a school-I,ased "test-and-treat" program was conducted on Pemba Island for the control of urinary schistosomiasis (Renganathan et at. 1995). This program had been implemented by the Pemba Island Helminth Control Team, a unit of theMinistry of Health, in cooperation with the Ministry of Educationand local school teachers. Surveys conducted by the Helminth Control Team showed that geohelminth infections were also highly prevalent throughout Pemba (Renganathan et a1. 1995). Building on thesuccess of the test-and-treat campaign for schistosomiasis, a schoolbased dewotming progtam to control intestinal parasites was planned.
On the basis of a trial of amihelminthic drugs conducted in Pemba(Albonico et a1. 1994), a single 500-mg dose of generic mebendazolewas chosen as the regimen to be used in the program. Althoughmebendamle did not comrol hookworm infection as well as albendazole, its effect on A. [umbricoides and T. trichiura infections was similarto that of albendazole, and the cost of mebendazole was around 10%the cost of albendazole at that time. A thrice-yearly regimen waschosen because of the rapidity of reinfection with helminth infections
. (Albonico et al. 1995) and the limited efficacy of mebendazole againstT. trichiura and the hookworms.
Design of the program evaluation. Because the deworming pro·gram was planned to be extended to Zanzibar Island and susrainedfor the indefinite future, a controlled evaluation of its effect wasjustified, even though this meant delaying the start of the programin a small number of schools. Also, a twice-yearly deworming regimenwas evaluated along with the thrice-yearly regimen of choice, toprovide evidence to the Ministry of Health as to whether a twice·yearly regimen would be adequate to improve nutrition outcomes andschool attendance. The evaluation was planned before the start ofthe deworming program in any school so that an optimal researchdesign could be implemented.
Of the 72 public primary schools on Pemba Island, 12 schoolswere randomly selected for evaluation (Fig. 1). Pemba is divided intofour districts of roughly equal size, and the selection of schools wasstratified by district, so that three schools in each district were chosen.Within districts, the schools were randomly allocated to the control,twice-yearly or thrice-yearly group. All children within a school received the same program regimen. For logistical reasons, only morningclasses were selected for the survey. Although the deworming programwas administered to all classes of grades 1-5, only classes of grades1-4 were included in the evaluation of nutritional effect, becausemalnutrition was expected to be of greatest importance in youngerchildren. Grades 1 and 2 were deliberately overrepresented for thesame reaSon.
Baseline, 6-mo and 12-mo follow-up nutrition and parasitologysurveys were conducted in March-May 1994, October-November1994 and March-May 1995, respectively. The design was based onthe comparison of within-individual changes in childrens' nutritionalstatus from baseline to 12 mo in each treated group vs. the placebogroup, and these are the analyses presented in this article. The 6-mofollow-up survey was planned to provide an interim measure of program effect for evaluation of whether a nontreated group could bemaintained ethically. The fuH battery of assessments was not completed at 6 rna, and those data are not presented here. A sample sizeof 1000 children per group was estimated to be sufficient to comparethe twice-yearly and thrice-yearly program groups with the controlgroup, accounting for the design effect of randomizing at the schoollevel and planning for subgroup analyses.
Before the study began, meetings were held at each school to
inform parents of the deworming regimen that would be implemented
in theit school, the purpose of the evaluation, its risks and benefits,and alternatives to participation in the surveys. All children presentin school on survey days were inVited to participate in each survey.Children found to have hemoglobin <70 gIL (35% of children) weretreated with mebendazole and oral iron supplements. Inclusion orexclusion of these children did not affect the growth results, and theyare included in the analyses presented here. Overall, 91% of childrenlisted on teachers' class registers participated in the baseline survey,and 85% of those children were assessed again at the 12-mo followup, in the following school year (Fig. 1). Compared with childrenwho completed the study, those lost to follow-up were similar in allmeasured characteristics except that they were more likely to be boys(60.0% vs. 50.3%, P < 0.001) and less likely to be stunted (heightfor-age Z-score < -2, 42.1 vs. 48.6%, P < a.OOS). Both of thesecharacteristics were associated with greater growth effect from deworming (see Results); thus, any bias caused by loss to foHow-upwould act to diminish the effect that we measured. The study wasapproved by the institutional review boards of The Johns HopkinsUniversity, the World Health Organization and the Ministry ofHealth of Zanzibar.
Nutritional and parasitologic assessments. Nutritional assessment methods have been described in greater detail elsewhere (Stolt:fus et a1. 1997a and 1997b) but are briefly reported here. Children'sweights were measured to the nearest O. l kg using a battery-powereddigital scale (Seca Inc., Columbia, MD}, and heights were measuredto the nearest O.l em using a wooden stadiometer (Shorr ProductionsInc., Olney, MD). Children were lightly clothed and shoes wereremoved. Age was calculated from the birth date on school records.When this was missing, the child's self-reported age was used. Avenous blood sample was drawn co assess micronutrient status. Hemoglobin was determined using the HemoCue method (HemoCue AB,Angelhom, Sweden), and erythrocyte protoporphyrin was determinedusing an fluorometer (Aviv Biomedical, Lakewood, NJ). Serum ferritin was determined using an immunoassay (DELFIA System by Wallac Inc., Gaithersburg, MD).
Parasitological methods are described in greater detail elsewhere(Stoltzfus et at. 1997b), and are briefly recounted here. Stool containers were given to children on the day before the survey, and theywere instructed to bring a sample of their stool to school the nextday. About 95% of children returned stool samples in each survey.Quantitative counts of helminth eggs in feces were determined bythe Kate-Katz method (WHO 1994). Urine samples were collectedfrom 100% of children. Microhematuria was determined using Hemastix test strips (Ames Laboratories, Elkhart, IN) and was used as aproxy indicator of urinary schistOsomiasis (Savioli et at. 1990). Thickand thin blood films were stained with giemsa, and malaria parasiteswere counted against leukocytes using standard methods (WHO1991).
Data analysis. The study was designed to detect differences inthe twice-yearly or thrice-yearly treated group compared with theplacebo group; however, our sample size was not designed to detectdifferences in effect between twice-yearly and thrlce-yearly deworming. Thus we present statistical tests of these twO comparisons, ratherthan comparisons among the three groups.
First, baseline characteristics of the treatment groups and the placebo group were compared using simple linear regression. Characteristics that differed to a potentially biologically important degree werecontrolled for in subsequent tests of program effect.
The measures of program effect on growth were the 12-mo weightand height increments for each child. All analyses were performedat the individual level and were adjusted for within-school correlations using the generalized estimating equations approach (Diggle etat.). Some baseline characteristics of children in the three programgroups differed at baseline (Table 1). Thus, the overall l-y programeffects on weight and height increments of children in twice-yearlyand thrice-yearly dewonned schools were compared with those incontrol schools, using multiple linear regression to adjust for characteristics that differed at baseline.
Given the heterogeneity of schoo! children, we expected thatsome subgroups of children would benefit more from deworming thanothers. Multiple linear regression models with program group interaction terms were used to test whether program dfects were greater inchildren with certain baseline characteristics. Baseline characteristics

SCHOOL-BASED DEWORMINO AND GROWTH 2189
72 schools
I12 schools
II I I
control twice-yearly thrice-yearly
4 schools 4 schools 4 schools
I I I1375 children 1309 children 1275 children
I I I1260 children 1170 children 1175 children
91.6% of eligible 89.4% of eligible 92.2% of eligible
I I I1054 children 990 Children 1019 children
83.6% of baseline 84.7% of baseline 86.6% of baseline
Public schools on PembaIsland:
Completed 12 monthfollow-up:
Randomly allocated togroup,stratified by district:
Randomly selected intoevaluation,stratified by district:
Entered baselinesurvey:
Morning classesselected forsurvey:
FIGURE 1 Schema of research design, including numbers of children in each program group at each step of the evaluation.
associated with greater benefit from the program are termed predictorsof benefict. Interactions with program group were considered potentially important if they were significant at P levels <0. t5 and if rheywere consistent in borh program groups.
Analyses were conducted separately for children < 10 yand 210y of age, to separate the effects on pre-pubertal and pubertal growth.Sexual maturation was not assessed. Height-far-age Z-scores weredetermined using the anthropometric subroutines of Epilnfo, version6 (Centers for Disease Control and Prevention, Atlanta, GA).Weight-far-height Z-scores and body mass index [BMI, weight (kg)!height2 (m2)J percentiles were considered as indicators of thinness.Body mass index is presented here because it is recommended forassessing children > 10 y of age, whereas weight-far-height Z-scoreis not (WHO Expert Committee 1995), and there are no recommendations for assessing thinness in children 6- to y old. The BMI percentiles were defined by the sex and race-specific tables of Must etal. (l99la and 1991b). Analyses were performed using Systat (SPSS,Chicago, IL) and SAS (SAS Institute, Carey, NC) statistical software.
RESULTS
Baseline characteristics of the study sample. The studysample was composed about equally of boys and girls, whoseaverage age was 10 y (Table 1). Helminth infections werenearly universal. Around 95% of children were infected withhookworms and T. trichiura, and about two-thirds were infected with A. lumbricoides. Around 60% had circulating malaria parasites and about one-third had microhematuria, anindication of urinary schistosomiasis. Stunting and low BMIwere common and increased with age. The iron status of thepopulation was very poor. The prevalence of anemia (hemoglobin <110 gIL) was 62.3%, and 82.7% of anemia was associated with iron deficiency (protoporphyrin >90 .umol/molheme or serum ferritin <18 fJ.g/L) (Stoldus et a!. 1997b).
There were several significant differences among the threeprogram groups at baseline (Table 1). This is nor surprising,because only 12 schools were randomly allocated. Both program groups had more hookworm and T. trichiura infectionthan the control group, but the twice-yearly group had lessA. lumbricoides infection than the other groups. 1n terms ofanthropometry, the twice-yearly group was less stunted [hanthe other two groups at baseline.
Program effect on helminth infections. There was a cleardose response with frequency of deworming on all three helminths (Table 2). Ascariasis was effectively comrolled, buthookworms and T. r:richiura were controlled less well. Thesedeworming regimens reduced the intensity of T. r:rtchiura andhookworm infections but had little effect on the prevalenceof infection.
Overall tn'ogram effect on growth. Adjusted for baselinecharacteristics, the 12-mo weight gains were - 2 kg for children < 10 y old and 3 kg for children 2: 10 y old (Table 3).In children < 10 y old, the twice-yearly group had weight gains0.27 kg greater than those of the control group (P < 0.05).The thrice-yearly group had weight gains 0.20 kg greater thanthose of the control group, but this difference was not significant (P :; 0.07). There were no significant program effects onweight gains in children ::== 10 y of age. In children < lOy old.the 12-mo height gains in the thrice-yearly group were 0.30em greater than in the control group (P < 0.01). In children::== 10 y of age, there was no signincant program effect on height.
Predictors of benefit. As expected, children with certaincharacteristics had a greater growth response to deworming.Among children <10 y old, the degree of stunting was theonly predictor of benefit (Fig. 2). Children who had higherheight-for-age Z-scores at baseline benefited more from deworming. On the basis of the multiple regression model with

2190
Characteristic
Male sex, %Age,yHookworms
Infected, %Eggslg feces
T. trichiuriaJnfected, %Eggs/g feces
A. lumbricoidesInfected, %Eggsig feces
Malaria parasitemia, %$. haematobium, %
Age <10 Y
HAZHAZ < -2, %8MI8Ml < 5th centile, %
Age ;,,10 Y
HAZHAZ, < -2, %8MI8MI < 5th centile, %
STOLTZFUS ET AL.
TABLE 1
Baseline characteristics of study children by program group1
Program group
Control TWice-yearly deworming
(n = 1054) (n = 990)51.2 50.4
10.5 ± 1.8 10.7 ± 1.8"
91.2 94.5"332 (48, 2304) 505 (73, 3458)"
94.7 96.7"531 (95, 2949) 577 (104,3186)
73.0 66.5"239 (7, 8642) 149 (4, 5307)"
57.3 57.031.9 21.3"
(n "" 473) V7 = 442)
-1.44 ± 1.30 -1.21 := 1.30"30.7 26.0
14.4 :=1.2 14.3 := 1.222.6 22.1
(n = 581) (n = 548)
-2.33 == 1.25 -2.24:= 1.2464.0 59.6
14.8 :=1.4 15.1 := 1.4"48.9 48.4
Thrice-yearly deworming
V7 = 1019)49.4
10.5 :!: 1.8
95.8"601 (86, 4204)"
97.3"625 (115, 3398)
76.4335 (9,11,959)
65.6''39.5"
(n =476)
-1.44:::: 1.3136.1
14.4 ± 1.221.9
(n = 543)
-2.44 :::: 1.2466.3
15.0 ± 1.443.5
1 Values are means:!: so. For measures at eggs per gram offeces, values are geometric means (-1 so, + 1 so); :zero values were included, withtog-transtormed values defined as :zero.• Significantly different from corresponding value tor the control group (P < 0.05). HAZ = height-far-ageZ-score, 8MI "" body mass index (kgim2).
TABLE 2
Prevalence and intensity of helminth infections by programgroup at 12-mo follow-up survey
height-for-age Z-score as a continuous variable, children withheight-far-age Z :;;: 0 gained 0.44 kg and 0.39 cm more in thetwice-yearly group and 0.46 kg and 0.51 cm more in the thriceyearly group than children in the control group (all comparisons ro control group, P < 0.005). In children with heightfor-age Z :;;: -2, the only benefit was 0.23 cm greater height
Control
Program group1
Twice-yearlydeworming
Thrice-yearlydeworming
gain in the thrice-yearly group compared with the controlgroup (P < 0.05).
Among children ~ 10 y old, shortness-for-age again predicted weight gain from deworming (Fig. 3). Children whowere less stunted (higher height-far-age Z-score) at baselinegained more weight in response to deworming. Also, in thisage group, age and sex predicted height gain from deworming.Girls grew less than boys in response to deworming, and thegrowth response was greatest in younger boys. Ten-year-oldboys gained 0.31 cm more in the twice-yearfy group (P< 0.020) and 0.49 cm more in the thrice-yearly group (P< 0.025) compared with the control group.
The presence or intensity of the three geohelminth infections at baseline did not predict benefit from the dewormingprogram for either weight or height gain, nor did iron deficiency or anemia.
A. lumbricoidesPrevalence, % 84 58 38Eggsig feces 653 (25. 17,367) 54 (2, 1433) 10 (0,289)
T. trichiuraPrevalence, % 97 92 85Eggs/g feces 788 (96, 6449) 340 (41, 2633) 147 (19, 1256)
HookwormsPrevalence, % 96 89 88Eggs/g feces 778 (94, 6728) 329 (41,2826) 262 (30, 2044)
1 Samples sizes per group given in Figure 1. All values for twiceyearly and thrice-yearly groups differ significantly from correspondingvalues for the control group (P < 0.05). For measures at eggs per gramat feces, values are geometric means (+1 SD, -1 so); :zero values wereincluded. with log-transtormed values defined as :zero.
DISCUSSION
This evaluation provides strong evidence that the schoolbased deworming program improved the growth of school children. The pre-post design of the evaluation, the comparisonbetween randomly allocated program and control schools, andstatistical adjustment for the differences in baseline characteristics among groups enable us to conclude that periodic antihelminthic treatment caused greater height and weight gainsamong children participating in the deworming program.
The fact that control of helminth infections improved thelinear growth of children < 10 y old also provides support forour previous inference that Zanzibari children experience lin-

SCHOOL-BASED DEWORMING AND GROWTH 2191
TABLE 3
Overall adjusted 12-mo growth increments in children incontrol, twice-yearly or thrice-yearly deworming
program schools
Program group1
Twice-yearly Thrice-yearlyControl deworming deworming
Weight gain, kgAge <10 y2 2.11 :':: 0.08 2.38:':: 0.08' 2.31 :':: 0.08Age ..,10 y3 3.01 :':: 0.11 3.20 :':: 0.12 3.04:':: 0.12
Height gain, emAge <10 y4 4.29:':: 0.07 4.42:':: 0.07 4.59 :':: 0.07**Age..,10y3 4.74:':: 0.08 4.67:,:: 0.08 4.81 :':: 0.08
1 Samples sizes per group are given in Figure 1. Values are means± SEM•• Significantly different from corresponding value for the controlgroup (P < 0.05).•, Significantly different from corresponding value forthe control group (P < 0.01).
2 Adjusted for district, sex, age, and height-for-age Z-score.3 Adjusted for district, sex, age, height-far-age Z-score, and low
body mass index.4 Adjusted for district, sex, height-far-age Z-score and low body
mass index.
ear growth retardation during their early school years (Stoltzfuset a1. 1997a). If these children were achieving their geneticpotential for linear growth in the absence of intervention,then antihelminthic treatment would not have increased theirrate of linear growth.
However, the magnitude of the growth response to deworming was small. This can be illustrated in several ways. In children < 10 y of age, the growth responses in the thrice-yearlyprogram group were 0.2 kg/y and 0.3 cm/y. Compared withthe control group gains, these represent improvements of 10%
in weight and 7% in height. The largest height responses todeworming, seen in less stunted children receiving thriceyearly deworming, were around 0.5 cm/Y, or 12% of controlheight gains. These gains do not bring the growth of Zanzibarischool children in line with the international growth reference. An average 9-y-old child tracking at the median of theWHO reference for height would gain 3.7 kg/Y and 5.7 cmly(average of values for boys and girls, from WHO 1983).
Because Zanzibari children will benefit from the schoolbased deworming program throughout their primary schoolyears, the effect on growth has a long period of time to accumulate. If children gained an extra 0.3 cmly from the thrice-yearlydeworming program, over a 5-y period they might accumulate aheight benefit of 1.5 em. For an II-y-old boy, this representsan improvement in height-far-age of 0.22 Z-scores (WHO1983). Even the largest height benefit we observed in a subgroup, 0.5 cmlY, would mean an improvement of only 0.37 Zscores if sustained over a 5-y period.
A series of smaller randomized placebo-controlled efficacytrials conducted in Keny:l. where the epidemiology of geohelminths is very similar to ,hat in Zanzibar, found larger growthresponses to antihelminthic treatment than we did. A single400-mg dose of albendazole improved height gains by 0.6 emand weight gains by 1.3 kg in a 6-mo trial in 150 first andsecond graders (Stephenson et al. 1989). Treatment with metrifonate (which treats both hookworms and S. haematobium)or praziquantel (which treats only S. haemarobium) improvedheight gains by 0.2 em in a 5-wk trial in 48 pre-pubescentboys infected with both parasites (Latham et ·a!' 1990). Asingle 600-mg dose of albendazole improved height gains by0.6 em and weight gains by 1.0 kg in 53 boys after 4 mo(Stephenson et al. 1993b). However, those boys were part ofa larger trial comparing one dose of albendazole in a 8-moperiod to two 4-mo doses in 284 boys and girls (Stephensonet a1. 1993a). In the larger and longer trial, weight gains improved by 1.0 kg, but there was no effect on height gains.
*
**
HAZ=O
D twice~yearly
• thrice~yearly
Additional height gain (em)0.6
0.5
0.4
0.3
0.2
0.1
oHAZ =-2
**
HAZ=O
D twice-yearly• thrice-yearly
Additional weight gain (kg)0.6
0.5
0.4
0.3
0.2
0.1
o
FIGURE 2 Effects of twice-yearly or thrice-yearly deworming on 12-mo weight and height gains of children <10 y of age, according to height-for-ageZ-score (HAZ) at baseline. The y-axis represents the average additional height or weight gain associated with being in the twice-yearly or thrice-yearlydewormed groups compared with the control group, adjusted for sex, age and district. Asterisks indicate weight or height gains that are significantly different(P < 0.05) from control group gains at the indicated HAZ value. Interaction between HAZ and program group on weight was significant at P = 0.047 fortwice-yearly deworming and at P = 0.005 for thrice-yearly deworming. Interaction between HAZ and program group on height was significant at P = 0.008for twice-yearly deworming and at P = 0.041 for thrice-yearly deworming. sample sizes per group are given in Figure 1.

2192 STOLTZFUS IT AL.
-0.2 L-__..........J --'- ---"
posite to be true, which is consistent with the idea that somethingin addition to geohelminth infections is slowing the growth ofstunted children.
Under conditions found in areas such as Zanzibar, additionalzinc or iron may be needed for children to achieve normal growth.A potential role of vitamin A deficiency can be ruled out, becausethe serum retinol distribution of first-graders in this sample wasnearly identical to that of children in the United States (daranot shown). These children were significantly iron deficient(Stoltzfus et a1. 1997b), and iron supplementation improved thegrowth of Kenyan school children (Lawless et at. 1994). We havenot evaluated zinc status in this population, but zinc deficiencyhas been reported in other parts of sub-Saharan Africa (Fergusonet at. 1993). In addition to geohelminths, chronic malarial infection or strongyloidiasis might limit the growth of school children.An effective bednet program improved the growth of preschoolchildren in an area of mainland Tanzania with malaria epidemiology similar to that in Zanzibar (Shiff et at. 1996). The prevalenceof Srrogyloides stercoralis infection in a subsample of this studycohort at baseline was 41.2% (Albonico, M., and Cancrini, G.,unpublished dara), but the nutritional consequences of this infection are largely unknown (Stephenson 1987).
A second possible reason for the small growth effect is thatanthelminthic treatment might cause a temporary growth spurtthat is not sustained. These school children may have multiple"gates", growth inhibitors or missing growth factors, that limittheir rate of growth. Geohelminths may be one such growthinhibiror, but when this burden is alleviated the child can growat a normal rate only until bumping into the next gate. Thus,when evaluated over a 1-y period, the growth effect we observedseems relatively small compared with results from shorter trials.
This explanation is supported by twO trials in the literature.First is that of Stephenson et a1. (1993a), in which results after4 mo showed significant height and weight gains; however,when the 8-mo trial was completed, the weight gain had notincreased further and the height gain had disappeared (Stephenson et at. 1993b). However, it should be noted,that the4-mo results were reported on a subgroup of boys who mayhave responded differently from the total group of boys andgirls combined. A recent trial conducted north of Cape Town,South Africa (Kruger et al. 1996) also suggests that the effectof deworming on growth velOcity abates over time. Iron-deficient 6- to 8-y-old children who received twO 200-mg dosesof albendazole 4 rna apart had height gains about 0.6 cmgreater after 5 mo than children receiving placebo. After IImo, the relative height gain remained around O.~ em. Thisstudy must be interpreted with caution in this context, becausethe children were also given iron-fortified soup in a factorialdesign with deworming, and only 73 children composed theiron-deficient subsample.
To explore this possibility in our own data, we comparedthe observed growth effect using the 6-mo follow-up data tothe 12-mo effects. In children < 10 y of age, the weight effects(difference between weight increments in the treated vs. control group) after 6 mo were 0.32 kg (P < 0.01) in the twiceyearly group and 0.18 kg (P = 0.12) in the thrice-yearly group.These values are similar to the effects observed after 12 rna(see Table 2). The 6-mo height effects from deworming were-0.15 cm (P = 0.23) in the twice-yearly group and 0.19 em(P = 0.48) in the thrice-yearly group, values that rather support the assumption that the height effect observed in thethrice-yearly deworming group was gradual throughout theyear. These comparisons provide some supporting evidencethat deworming causes an immediate increase in weight gainthat is not sustained beyond 6 mo. The same does not seemto be true for height. In children ~ 10 y of age, the 6-mo
girls
o twice-yearly11 thrice-yearly
HAZ =·3
10 Y12 y
boys
HAZ =·1
10 Y
Additional weight gain (kg)0.4 r-----------;========::::::;I
01--'-----
FIGURE 3 Effect of twice-yearly or thrice-yearly deworming on12-mo weight and height gains of children 2:10 y of age, by baselinecharacteristics. The y-axis represents the average additional height orweight gain associated with being in the twice-yearly or thrice-yearlydewormed groups compared with the control group, adjusted for sex,age and district. Asterisks indicate weight or height gains that are significantly different (P < 0.05) from control group gains at the valuesindicated on the x-axis. HAl = height-for-age Z-score. Interaction between HAl and program group on weight was significant at P = 0.02 fortwice-yearly deworming and at P = 0.12 for thrice-yearly deworming.Interaction between age and program group on height was significantat P = 0.0001 for twice-yearlydeworming and at P = 0.002 for thriceyearly dewonrning. Interaction between sex and program group onheight was significant at P = 0.11 for twice-yearly deworming and wasnot significant (P = 0.30) for thrice-yearly deworming. Samples sizesper group are given in Figure 1.
0.2
There are several possible reasons why the growth effect weobserved was smalL First, there might be other factors limitingthe growth of these children in addition to helminth infections,i.e., helminth control is necessary but not sufficient to improvesubstantially the growth of Zanzibari school children. This explanation is supported by the consistent finding that less stuntedchildren had the greatest growth response to deworming. Thiseffect modification was apparent in both program groups forheight and weight gains of children < 10 y of age and for weightgains of children ~ lay of age. If helminth infection were theonly factor holding back the linear growth of children, then wewould expect to see the most stunted children having the greatestgrowth response to amihelminthic treatment. We found the op-

SCHOOL-BASED DEWORMING AND GRO'iVrH 2193
weight and height effects were trivial, and none was statistically significant.
A third possible explanation is that mebendazole controlledhookworms and T. r:richiura too poorly to induce a large growthresponse. Neither of the benzimidazole antihelminthic drugsis very effective against T. trichiura (Albonico et a1. 1994).However, the trials conducted by Latham and Stephenson andcolleagues in Kenya (Latham et a1. 1990, Stephenson et a1.1989, 1993a and 1993b) used antihelminthic treatments thatare more effective against hookworms, and larger reductionsin the prevalence and intensity of hookworm infection wereattained, This explanation is supported by the dose responsein the effect of twice-yearly and thrice-yearly deworming onheight gains. The height gains of children < 10 y of age increased with frequency of deworming, both in terms of theoverall group effects (Table 2) and the subgroup analyses (Fig.2 and 3). However, a similar dose response was not seen inweight gains.
If poor control of helminth burdens is the reason for thesmall growth effects, then hookworms or T. trichiura ratherthan A. lumbricoides must be mainly responsible, given thatascariasis was controlled quite effectively by mebendazole. Thelack of effect of A. lumbricoides on growth is also suggestedby the finding that the growth response to antihelminthictreatment did not differ between children with and withoutA. lumbricoides infection at baseline (i.e., ascariasis was not apredictor of benefit from deworming). Over 30% of childrendid not have ascariasis at baseline; thus we had reasonablestatistical power to observe. this effect if it existed. This is incontrast to the hookworms and T, trichiura, which infectedthe vast majority of children at baseline.
Finally, the small effect we observed might be due to chancein the particular sample that we used. It is possible that thegrowth response in this sample of children was at the lower endof effects that will usually result from school-based dewormingprograms or that the large growth response in the Kenyantrials represents the upper expectation and will probably notbe repeated. Additional evaluations of the growth effect ofdeworming programs are needed ro provide reliable expectations of effect for program planners.
In summary, controlling A. lumbricoides infection and reducing the intensity of T. trichiura and hookworm infectionsin Zanzibari school children brought about small improvements in weight and height gains, particularly in children < 10y of age and in children who were less stunted. The publichealth relevance of the growth effect we observed is questionable. It is possible that helminth control is necessary but notsufficient to substantially improve the growth of school children in areas such as Zanzibar, and additional interventionsor combinations of interventions should be tested. Antihelminthic regimens that are more effective against hookwormsshould be evaluated in programmatic settings and over timeframes of at least 1 y. Improved growth is only one potentialbenefit from school-based deworming programs, and a finalappraisal of the worth of such programs must also considerschool participation, educational performance and effect oniron status.
ACKNOWLEDGMENTS
We thank Kassim Sheme! Alawi and all the staff of the PembaHelminth Control Team for their excellent work in collecting thesedata.
LITERATURE CITED
Albonico, M., Smith, P. G., Ercole, E.. Hall, A.. Chwaya, H. M.. Alawi, K. S. &Savioli, L. (1995) Rate of reinfection with intestinal nematodes after treatment of children with mebendazOle or albendazole in a highly endemic area.Trans. R. Soc. Trop. Med. Hyg. 89: 538-541.
Albonico, M., Smith, P. G., Hall, A., Chwaya, H. M., Alawi, K. S. & Savioli, L.(1994) A randomised controlled trial comparing mebendazole and albendazole against Ascaris, Trichuris, and hookworm infections. Trans. R. Soc. Trap.Med. Hyg. 86: 565-569.
Diggle, P. J., Liang, K. Y. & Zeger, S. L. (1994) Analysis of Longitudinal Data.Oxford University Press, OXford, U.K.
Ferguson, E. L., Gibson, R. S., Opare-Obisaw, C., Ounpuu, S., Thompson, L. U. &Lehrfeld, J. (1993) The zinc nutriture of preschool children living in twoAfrican countries. J. Nutr. 123: 1487-1496.
Kruger, M., 8adenhorst, C. J., Mansvelt, E.P.G., Laubscher, J. A. & Benade, A.J.S.(1996) Effects of iron fortification in a school feeding scheme and anthelmintic therapy on the iron status and growth of six- to eight-year-old SChoolchildren. Food Nutr. BUll. 17: 11 -21.
Latham, M. C., Stephenson, l. C., Kurt, K. M. & Kinoti, S. N. (1990) Metrifonate or Praziquantel treatment improves physical fitness and appetite of Kenyan schoolboys with Schistosoma haematobium and hookworm infections.Am. J. Trop. Mad. Hyg. 43: 170-179.
Lawless, J. W., Latham. M. C., Stephenson. L. S., Kinoti, S. N. & Pertet, A. M.(1994) Iron supplementation improves appetite and growth in anemic Kenyan primary school children. J. Nutr. 124: 645-654.
Must, A., Dallal, G. E. & Dietz, W. H. (1991a) Reference data for obesity: 85thand 95th percentiles of body mass index (wtJhf) and triceps skinfold thickness. Am. J. Clin. Nutr. 53: 839-846.
Mus!, A" Dallal, G. E. & Dietz. W. H. (1991b) Reference data for obesity: 85thand 95th percentiles of body mass index (wtlhf)-a correction. Am. J. Clin.Nutr. 54: 773.
Renganathan, E., Ercole, E., Albonico. M., De Gregorio. G., Alawi. K. S.• Kisumku,U. M. & Saviol!, L. (1995) Evoiution of operational research studies anddevelopment of a national control slrategy against intestinal helminths inPemba Island experience, 1966-1992. Bull. WHO 73: 163-190.
SavioH, L.. Bundy, D.A.P. & Tomkins, A. (1992) Intestinal parasitic infections:a soluble public health problem. Trans. R. Soc. Trop. Med. Hyg. 86: 353354.
Savioli, l., Hatz, C., Dixon, H., Kisumku, U. M. & Mott, K. E. (1990) Control ofmorbidity due to Schistosoma haematobium on Pemba Island: egg excretionand haematuria as indicators of infection. Am. J. Trop. Med. Hyg. 43: 289295.
Shiff, C., Checkley, W., Winch, P.• Premji. Z.. Minjas, J. & Lubega, P. (1996)Changes in weight gain and anaemia attributable to malaria in Tanzanianchildren liVing under holoendemic conditions. Trans. R. Soc. Trap. Med. Hyg.90: 262-265.
Stephenson, L. S. (1967) Impact of Helminth Infections on Human Nutrition.Taylor & Francis, New York. NY.
Stephenson, L. S., Latham. M. C., Adams, E. J., Kinoti, S. N. & Pertet, A. (1993a)Weight gain of Kenyan school children infected with hookworm, TriChuristrichiura and Ascaris lumbricoides is improved following once- or twice-yearlytreatment with albendazole. J. Nutr. 123: 656-665.
Stephenson. L. S., Latham, M. C., Adams, E. J., Kinoti, S. N. & Pertet. A. (1993b)Physical fitness. growth and appetite of Kenyan school boys with hookworm,Trichuris trichiura and Ascaris lumbricoides infections are improved fourmonths after a single dose of aibendazole. J. Nutr. 123: 1036-1046.
Stephenson, L. S., Latham, M. C., KuJ'Z, K. M., Kinoti, S. N. & Brigham. H. (1989)Treatment with a sin91e dose of albendazole improves grOWth of Kenyanschoolchildren with hookworm, Trichuris trichiura, and AscariS lumbricoidesinfections. Am. J. Trop. Med. Hyg. 41: 78-87.
Stoltzfus, R. J.. Albonico. M.. Tielsch, J. M., Chwaya. H. M. & Savioli, L. (1997a)Linear growth retardation in Zanzibari school children. J. Nutr. 127: 10991105.
Stoltzfus, R. J., Chwaya, H. M., Tielsch. J. M., Schulze, K. J., Albonico, M. &Savioli. L. (1997b) Epidemiology of iron deficiency anemia in Zanzibarischool children. Am. J. Clin. Nutr. 65: 153-159.
Warren, K. S., Bundy, D.A.P., Anderson. R. M., Davis, A. R., Henderson. D. A.,Jamison, D. T.. Prescott, N. & Senft, A. (1993) Helminth infection. In: Disease Control Priorities in Developing Countries (Jamison, D. T., Mosley, W. H.•Measham, A. R. & Bobadilla, J. L., eds.), pp. 131-160. Oxford UniversityPress, New York, NY.
World Bank (1993) World Development Report. Investing in Health. OXford University Press, New York, NY.
World Health Organization (1983) Measuring Change in Nutritional Status. WorldHealth Organization. Geneva. Switzerland.
World Health Organization (1991) BasiC Laboratory Methods in Medical Parasitology. World Health Organization. Geneva, Switzerland.
World Health Organization (1994) Bench Aids for the Diagnosis of Intestinal Parasites. World Health Organization. Geneva, Switzerland.
World Health Organization Expert Committee (1995) Physical Status: The Useand Interpretation of Anthropometry. World Health Organization. Geneva,Switzerland.

790
T Cell Subsets and Cytomegalovirus Retinitis in Human ImmunodeficiencyVirus-Infected Patients
Mel-Ling Tay-}(earney," Cheryl Enger,Ric:lw'd D. Semba, Walter Royal m. James P. DUDDyaDd Douglas A. Jabs
Df!pGTtmf:1lff OfO;/IlIIa/mcVJg)', O'I/;/Jl0fIJ'. Newo1ofIJ'. and MlldiciM,JO/l1I1 Hopki'M Ulli~Uy ScAocl ofM,d/cw, BaJJlmore. Mary/and
Acase-contro1 study .....as done toInv~te the relationsllip betWeen T cell subsets and cytOmegalovirus (CM,V) retinitis in hUJDllll immunodeficiency virus (HIV)-inf~ted subjccc.s with or withoutCMV tetinitis and CD4'" edl counts of <0.050 x 10'lL. Cell:lW'face JniUketS on peripheral bloOdlymphocyteS .....ere cnraluated using flow eytometxy. Patients with CMV reQni.tJs had. significantlylower Icvds of COS'" eeUs (1'I1CiiJao: 0.152 x 10'IL) ClOmp_cd with levels for: controls (medbn: 0..296x 10'1L. P <: .001). Significant down-regulatioo ot COSIlmulatory molecule CD28'" and lympbocyWfunction-a:lSoQaced IlIltigen-l (LFA·1) expression was OJ)serve1! in paul;na 'VCml$ controls (CD2S·:0.048 x 10'IL vs. 0.143 x 1o'IL, P < .001; LPA-l: 0.238 x 1()91L \'S. Q.400 x 10'1L, P < .001), butDO significant differenceswere Doted for NX ceUs. We propose that progressive lo9lI at tho CD3"'CDS'"cell subset and down-regulation of CD2S and LFA-l ac:cessocy molc<:ul~ ate a.:lsociated with aDincrellllCd ris1( of CMV redoitls In HJV·1nfected patient3.
CytomegalovUus (CMV) disease is assuming a more signmcant role as people with AIDS live longer. The cumulativelifetime risk of CMV disease is 45% [11. with retinitis beingits most common manifestation. CM'! retillitis is the, mostcommon intraocular infection in AIDS patientS and is 11 caUSeof significant morbidity. It genc:tally occurs when CD4'" cellcoums are <0.050 x I09/L [21.
Despite the presence of antibodies to CMV. 30%-40% of .AIDS patientS d~lop CMV disease. suggesting that cell-me·diated inuIumity is necessaxy for tMintaining CMV 1aIeJ:1cy.This supposition is alSo supported in clinical and animal studiesin which recovery from CMV infection is dependenr on anin~ cellular immunity, in particular CDS'" T lymphocytesand NK cells [3}.
m addition to the progressive loss of CD4+ and CD8~ TlymphocyteS in human immunodeficiency viNS (HI\l) infee..tion. it was recendy reported that CD28 antigen e."tpre3Siondeclines 15 HIV infection advances [4]. Because loss of thismolecule might panly e:x.plain cytOtoxic T lymphocyte anergy(51, We postulare that progressive cytOtoxiC/suppressor T cell(CDg cell) loss or ane.t'l;Y (or both) eQuId predispose HJV·
Recel"ed 10 JIUy 1995;~ 11 Apnl1997.Wormed CQ"emt wu obtained from all pltienlS, and the rcsardl proroc:o\
'h8 approved by the Joint Conuniltl:c 013~1n\'e$ti~on of Jolw HopkiM Hospit\l and Sehoot of Medicinc.
Fitlanl:l~ !l\IPt'ott: Nationallllatimtcs of Health (ltR-007ZZ ~nd :EY·1026S{to D......1.1. HI).'0042 3JId Hl).J].241 (to R.D.S.l: Rtm-01lCh to Proven' Blindness (Foroisn "Fellow-ship Am.td :c M-L.T.oL).
Reprina rn: co=pondanc~: Pr. DouSlu A. J:lbB, Wilmer Bye ll\llQt\lte, 550N. Broadway. Suile 700, B~timorc. MD 21205.
• PIll!ont 1l11ili.!ion; Lions Eyo Institute, 2 Verdun S~. Ncd.lands, WA.6009, Australia.
TIle Joamu of huil:UoUJ Disealft 1997; 176:790-4o 1997 'Jy The U'nivenirt of ClUcugo. "ll nellIS ~lmel1.0022-1S99mn60J-003SS02.00
infected persons to CMV disease. Furtb.cnnore, since it is desirable to be able to identify patientS at higher risk of CMVretinitis (for primaI)' prophylaxis). we conducted a case-conttolcros~sectional study on the expression of lymphocyte subsetmarkers in peripheral blood lymphocytes from HIV-infeetedpexsons with. and without CMV retinitis. We hypothesized thatdecreased levels of CD8" cells, NK. cells, and coStimulat01'Ymolecules (CD28 and lymphOCyte function-associated antigen·! [LFA.I]) would predispose individuals with mv toeMV retinitis.
Materials aDd Methods
From september 1994 through May 1995, mv·infe~tcd pati!;ntswith c.\fV retinitis were recruited from the AIDS OphthalmologyClinic at Johns Hoplcins Hospital. A dillgnosis ot c.'-i1V r~tinitis
was ma.di on the; basis of typie;al ophthalmologic features. HlVinfected patients without CMV retinitis and with C04'" cell countS<0.050 x lO?fL were recruited as controls. Patie.nt3 with viscexalCMV disease~ excluded from. the control group.
Blood was colh;ctcd for flow ~metrY and a complete bloodcell count. Blood foe flow c:yccmetry was 1rat3Sported at roomtemperature and prepared within 4 h of collection. Clotted specim~ were discarded. Peripheral blood lymphocyteS were isolatl;d.stained. and analyzed in general compliance with CenterS for Dis-ease Control and Prevention guidelines for leukocyte immunophenot)'lling of HIV-infected persons [6].
Peripheral blood lymphocyres were stained with combinationsof monoclonal antibodies (MA'bs). fixed, and analyzed within 12h of sraining. Isotype..matched MAbs seIVcd as controls for tluo·rescence marker selIings and identification ofnonspecific staining.All MAbs were diIecdy conjugated to either fiu.orescein isothiocyanate (FITe), phycoc:tythrin (PE), or to II tandem dye, phycoerYthrin-cyanine: .5 (PE-Cy5). The follOWing MAbs wen:: used: CD3PE-CyS (Pan-T cells; ImmUllOteeh, Westbrook, ME); MsIgQ1·mC, MsIgG..·PE, MslgGl-Cy5 (isotypC: control; Irnmunotech);
____________________... ...''i'lHllllllllulllllllmWIl al·ww.lIIIUllllUmn Ulln
167

JID 1997;176 (September) 191
CD4s·mc (lymphOcyteS, monocyteS; BectOn Dickinson, SanJose. CAl; CDl4-PE (monocytcs; BectOn Pic.kinson); CD4-FITC(holper T cell; Beeton Diclcinson or Olympus, Lake Success, NY);CD8-PE (cytotoxic/suppressor T cell; BectOn Dickinson or Olympus); CD2S-FlTC, CD2S-Pll (costimulatoty molecull;; Inununotech); CD4SRA-mC (naive T "ll; BectOn Dickinson);CD16"CDS6+-PE (NK cell; Imnumoteeh); and LFA-I-FlTC (aeCC$Soty, adhesion molecule; I:mxnunotecll).
Two- and three-eolor 1iow eytometIy was done using BectonDic.\Qnson FACStar Plus and PACStar Plus Resesrch Software(LYSIS U). Plow cyromete:r optics were aligned and calibrateddaily with Biosurc chick red blood cells (Riese, S<m Jose, CA).For each sample, 15,000 ungated eventS were collected, and thelymphocyte population was selectedby bllclcgating. Quadrant analysis cuxsors were s~t from the isorype con[Iolsample so that >98%of the gan:d cells were double neptive. These same quadrantseaings were used for subseQuent antibody combiIlations. The rawsub!e't percentage value was concctl::d for nonlymphocyte eventSwithin the gate (6).
Raw data were analyzed with statistical software (SAS Institute,Cuy. NC). For many analyses, all patientS with c.\1Y retinitiswere considered a single group. Categorical charaeteristiC$ werecompared ~een group:! by use of Fisher's exact k:S\' Groupmeans wue compar@d usins: Smdent'~ t ttSt. Median and interquartile value:» were used to describe lymphocyte :."ubse,t ranges,which were not nonnaUy distributed. The percent counts and absolute counts of cell surface markers were compared using the wU·coxon rank sum teSt. Multivariate regn:ssion analysis was done toadjust for potentially confounding factors. UnadjUSted ? value:sare given.
Results
One hundred five HIV-infected persons with CD4"" cellcountS <0.050 X lQ911. w~e recruited prospectively, of whom49 had Cl\N retinitis (patients) and 56 had HlV·infection with·out CMV retinitis (controls).
Demographics for the patients and controls are compared intable 1. Of the 49 patients, 22 were receiving anti.cMV treat~
ment (ganciclovir, foscamct, or cidofovir); 27 had newly diag
nosed CMV retinitis and were not receiving tre:ument at therime of blood sampling. SUbgroup analyses showed no significant statistical differences in demographic faccOIS :md medicalhistoril;$, except for granulocyte colony-stimuJating factor (GCSF) use, for treated and untreated patients, so they were ana
lyzed as lL single group. PatientS were slightly older than con·troIs, but the 2 groups did nor differ significantly in their useof acyclovir, prednisone, or cytotoxic drogs; however, fevmpatients were receiving antiretroviIal dIugs than were controls(P =.049), and more patients than controls were treated withG·CSF (P < .001). In addition, more patients than contrOlshad a histoty of Kaposi's sarcoma (P '= .019) and other opportunistic infections (i.e., Pneumocystis carlnii pneumonia andcryptoco~31 and Mycobacterium avium-inrracellulare COtn
plc::x infections; P = .030).Lymphocyte subset results, comparing patients and conU'Ols,
are listed in table 2, The median absolute lymphocyte count
Table 1. Demographics~medical hisr.oriCll for HIV·infilcted sub--jtctS with (patien1:l) or without (cODtrOli) CMV retinitis.
FOllIUl'C :P1Ui~tll Control& p"
No. ofpWc:nlS 49 56Race .051
While 61 41
!~ 39 59Gender 1.000~ 116 88FCIllAlc; 14 12
l.idt f:IllUlr ,l90MSM 6S 46lDU 21 23MSMwiIDU 0 1HcleI'~ 1:2 10Blood I)lC(luOf use 2 4
.o\ge {yCV$}, me.m ::: SD . 40.3:= 3,+ 36.8::: 6.$ .016AnIi~Vim drug usc .049
Yca 31 SONo 69 50
G-CSF <.001Yes ~9 4No 11 96
1C.:lpoQ·s sartoma .019y~ 2Z 5No 78 95
Histoty of OtMr 01 .030Yes 71 SONo 29 SO
NOTB. D3f;\ 3te % unl~ ollu:twi3c in~ced. MSM = men ha~ ,",xwith men; rou = injllClion dNg USC; G-CSF = gr.mulocyn: colony-stimulatingtxror; 01 = oppot'CUnistie lnfeotioM (defined (IS PMloOnIOC'J"'lis carltlil pncumo.ni:l. :llld ayp~o,c:~ or MycobtU:reriwm a1Iirm.-lfllraC8JlwlUT complex infet:noDS).
• Iktemrined by US(: of fisher's =c:t~ 3lUl SDJdcnt's I tqT.
was significantly lower in the patient group than in the controlgroup (0.517 X l09/L \IS. 0.610 X 109ft, P '= ,01&). However,both groups had a similar CD4'" cell percent (0.81 X 10⁹/L vs.1.1 X 109fL. P = JSO) and similar median absolute CD4+ cellcounTS (both <0.010 X l09/l., P = .069).
Compared with CDS'" and CD4SRA· cell counts for con·troIs, those for patients were lower (CDS""; P <, 001;CD4$RA.+: P < .001). CDS"'CD45RA'" cell countS were alsosignificantly lower in patients than controls (P <. 001). Threecolor analysis dettmnined that most CD3""CD4SRA.,. cells (i.e.,CD45RA.'" cells) we:re ll1so CDS·CD45RA'" cells.
CD28 antigen exprBssion was significantly lower for CP3'"(P == < .001) and CDg'" (P == < ,001) cell subsets in patientsthan in controls. Three-color analysis detennined that moSt ofthe CDS"'CD2Sof' cells were also CD3+CDS'PCD2S"" cells. Tcells expressing U A·1 were significantly lower in patientsthan controls (P < .001). Although the percentage of CD3S6·CD16"" cells tNK cells) was higher in patients than controls, the absolute counts wore similar.
A subgroup analysis was done to determine the effect oftreatment with G-CSF. The absolUte number of lym.phoeytes
----------------------------------_-...wllll, 1111 _
lbf

'---------------------------- lMI&WllIll.
NOTE. Om .m! mcc1i3n, numbers in ~I/Il:tcs Mc: ZSlh, 75th pereenrilc: v&111CS.•Co~ wilh cOJIlfols; &:=ine>d 0:,' usc of Wileo.>ton Wlk sum teat.
792 Conci:lc Communications JID 1997; 176 (September)
Table 1. Percent and absclme lymphocyte counrs for HIV-infeCled subjectS with (patients) Qr wirhout (c:onacls) CMV retinitis.
p.ucm:l Conexo\$
CD4- ccU% AbeolllU: no. IYfIlIl~ CD4" ccU°,io Abwolult 0.0. lymphocytesSllffw: marlt:I,r (XIO'IL) p. (X1OtJ!.) p. (Xlo'fL) (x lo'lL)
C03·CDS'" 39.50 .006 0.152 <.001 49.62 0.296(19.13, 49.90) (0.075. 0.308) (34.76, 60.06) (0.163. 0.490)
COJ·CD45lV.- 19.43 .001 O.O~ <.001 34.23 0.211(9.16., 32.25) (0.036,0.191) (23.51, 43.63) (0.083. 0.367)
CDS"'CD4SM- 16.53 <.001 O.07S <.001 30.38 0.203(8.Sa, 34.21) (0.035, O.13S) (22.48, 39.12) (O.Q9S, 0.341)
C03·C028'" 13.38 <:.001 0.04& <.001 23.47 0.143(5.08, 24.22) (0.019, 0.144) (16.$4, 36.03) (0.093, 0.262)
CDS·CI>2S· 6.82 <.001 0.023 <:.001 lS.08 0.088(1.91,lSAQ) (0.010, 0.090) (9.18,26.14) (0.049, 0.18S)
CDS"'CD28· 25.65 .418 0.121] .Dl~ 29.29 0.200(17.02. 40.36) (0.063, 0.211) (19.86., 45.59) (0.113, 0.323)
C03·LPA-l'" SL46 .0Q.i 0.238 <:.001 5:1.92 0,400(30.88, 62.86) (0.120, 0.372) (S1.10, 73.11) (0.202, 0.594)
C03-COS6-CDW (NK ecl1s) 12.45 .011 0.063 .763 7.38 MS4(6.16, 22.35) (0.024, 0.108) (3.69. 16.00) (0.tu4, 0.099)
."""""""''''Wl;.&.~I!
and cona-ols. Subgroup analysis also showed no significantdifferences in the demographics or memcal histories of tteatea3Xl.d untreated patients, except for the greater use of G-CSf inthe treated group.
Cdl transie-r studies in CMV-infected murine models suggestthat ens· cytotoxic T lymp.hocyte~ are protective for CMVdisease (7). Our group of patients had significantly lower CDS'"cell counts compared with those for the: control group, and tbemajority of these cells were naive (CD4SRA"'). Fiala et at [81reponed lhat the risk for c.\1V disease increases when CDS'"cell counts decline to <0.500 X l09/L. This finding was corroborated by Lowder et al. [9] in a retrOspective study of Q.v1Vretinitis in paticn~ with AIDS. These findings underscore theimportance ofCDS'" cytotoxic T lymphocytes in the Pfeventionof CMV retinitis.
It has been suggc::sted that switching from CD45RA... (naive)to CD45RO'" (memaxy) cells is an important mechanism ofTcoil activation in response to CMV infection...In this study,patients with eM\! tetiniris had lower numbers of naive cellsthan did the control group, suggesting that the switching ofnaive cells to memory cells may be inadequate to prevent CMVdisease in HIV-infected patientS.
CD2S antigen provides the necessary second sign3.l for rcell activation, proliferation, and interleukin-2 production.Brinehmann et al. [5] demonstrated that in mv-infected patients, the abilitY to prolife:tate and secrete interleukin-2 inresponse to T cell reCeptor activation was restricted to theCD8+CD2S.... cell subset. In th~ cuaent StUdy, we found asignUicant decrease in T cell-expressed CD:2S antigen in theHIV-infected patientS with c..\N retinitis, compared with mV·
Discussion
was signHicandy higher in patientS receiving G-CSF comparedwith those not receiving G-CSF (median: 0.617 x l09/L V$.
0.384 X 10'>/L, P == .023). The absolute number of CDS· cellsin patient:! reeeiving G-CSF versus those not receiving G-CSFwas also significantly higher (0.308 X l09/L ¥s. 0.138 X 10⁹
/
1.. P =: .038), as was the absolute number of CD2S'" cells(0.136 X 10?ft. VS. 0.033 X 10⁹/L, P = .010) and CDS·CD28+cells (0.0& X 10?JL vs. 0.019 x lQ9/L, P == .027). T cells countSwere also significantly higher in G-CSF-tr~ted patientS. Nosignificant group differences were found for other mononuclearsubs~ analyzed.
Multivariate resression analysis showed that the·differencesin ceU surface markers between patients and controls remainedaft.:r adjusting for age, race, and anrirctroviral use. The onlyfactor that in:t1ueIWed the cell surface marker results WlU GCSF use, which actually reduced the diffcrcnc~s between patients and ~ntrols.
mv-infeCted patients wi1h CMV retinitis and contlols without C\1V retinitis were :matched for CD4"!' cells by ~electing
subjects with CD4. cells <0.050 X l09/L.Patients were more likely than controls to be white and older
and to have a ~tory of another opportunisti.c infection. andthey were less lilce1y to be usins antiretroViral drugs and moreIilcoly to be using G-CSF. However, regression analysis showedthat age, race, and anrlretroviral drug use did not alta the ceU5'Uface market results, 3nd G-CSf ~e reduced the diffarenc.esin some mononuclear subset measuremt:nts between patients
I\ ~ .'. '

JID 15197; 176 (September) 793
(.,j.";~I"Ii.,
..tj.~.
infected controls. This loss of COOS antigen was mainly o~
served in the CDS+ population of T cells, suggesting tI1lU lossof tilt costimulatory molecule may result in a less effectivecytotoXic/suppressor response to w\{v-infected cells. Thegreater loss of CD28 antigen e:lI.'pression might also explain thepoorer proliferative responses of T cells isolated from HIVinfected persons with CMV retinitis compared with ~onsesof T cells from HIV-infected persons without CMV retinitis[10J. FactOIS other than C028 antigen expression may alsocoatribure to the poorer lymphoprolifcrative responses obSCl'Ved in villO. For example, ganciclovir, acyclovir, and zido·vudine each have been reported to inhibit lymphocyte proliferation in vitro (11]. Furthermore, CMV infection itself bas be¢n
reported to have immunosuppressive effects, manifested by adecreased lymphoproliferative response after mitogen stimulation and by deae3sed cytolytic T cell and NK. cell activity.However, lymphocytes are usually nonpermissive for CMVinfection, so a direct immunosuppressive cffc:ct of the vitus atthe T cell level is unlikely.
lnteraetions between LFA-I and intercellular adhesion molecule 1 contribme to the activation of the T lymphocyte andcan augment cytOtoxicity ofvituS-Specific CDS" cells [121. Inthe current StUdy, HIV-infected patientS with CMV. retinitishad significantly lower levels of CD3 +LFA-I" cells comparedwith levels for the HrV-infected controls. Loss of LFA-l eouldfurther contribute to immunodeficiency and, thus, to an increased risk of CMV retinitis.
AniInlll and clinical stUdies have shown that NK cells playa role in c.\!V disease, though they generally delay but do notprevent severe disease and death [13 ]. In our study, there wereno significant differences in the absolute numbers of NK cellsin subjectS with or without c..'-1V retinitis, suggesting that thecells have a less important role in the p~c:ntion of CMVdisease in HIV-infeCted persons with progressive iIn.mw1osuppression.
A subgroup analysis ofT cell subsetS was done to study theeffectS of G-CSF in HlV-infected patients with CMV retinitis.It has been previously reponed that there is a disproportionateincrease in CD8+ cells during treatment with G-CSF [14J. Inour study, we found significant increases in the absolute lymphocyte and CDS"" cell counts but no e.ffect on the CD4'" cellcount. The CDS+CD28+ cell numbers also increased in patientstreated with Q.CSF. The G-CSF-initiated increase in cellsbearing cosrimulatory molecule CD28 is consistent with theccported increase in lymphoproliferative responses to phytohemagglutinin of T cells from HIV-infected patients treated withG~CSF compared wil'h those from untreated patients (14]. Thiseffect of G-CSF on. T cell subsets tended to miniznize thedifferences between subjects with and without C:MV retinitis.
Whether the observed changes in T cell subsets in HJVinfected patients with c.'v1V retinitis represent a cause or e:ff~ct
of C\1V disease cannot be determined from this study. However, in light of previously published obsenrarions and theobservatiODS from our study, one plausible hypothesis is that
a. Joss ofCDS'" cytotoxic Tcells with down-regulationofCD28and LPA-l antigens (a change that leads to an ineffective cytotoxic response to virus-infected cells) contributeS to an incn:ased risk for CMV retinitis. Screening ofHIV-infceted patients with Co-r cell cOuntS <0.050 x lO~IL, CD8+ ceU countS<0.500 x I09tL, a:nd low numbm of CD8T CD2S'" andCD8+LFA-I cells might better identify patientS at risk ofCMVretinitis. Such patients may benefit from primary prophylaxisfor CMV disease.
Fiaally, successful adoptive immunothel'aPy for human viralinfections requires an understanding of immune mechanismsessential for providing the host with a prorective response. TheobsClVed changes in the cytotoxic cell subset profile in AIDSand CMV retinitis may also help to develop more vinJ$.specificT cell subsets for adoptive therapy for CMV disease [15].
Acknowledgments
We thank /31)rdnn Weisand for ~"pert instructions given in theuse and running of me fiow cytometer and Diane Griffin for th¢use of her n~ovirology laboratory.
Rdl;:l'QlCC$
L Hoover DR, SlI<Ill AJ. :a..ceU3t Ii. e( 31. CliniQ! mani(CSl:UioM of AlOS
in The ua of I'ntlU1Mt:'jSrtt propllylaxiB. N EnSI SM~d 1993;329:19216.
Z. Pmd P, Hincllticl: R. l'lWt I. Cbmicl I, Pogsense= L., Murphy It. Ri:Ikof d.:vc;loping Cylc~lI1ovinls millilil in persons infect04 witll thehuman immun04oli~iency virus. I ACquit fmmunc: Dc:6c Syndr 1992:5:1069-74.
3. Rod@ba$o MI, Muau W, Mw1~h K, Bullring HI, ICoIzinoIVllld UH. CDSpositive T lympboey= :speci& fgr murine c)'IQll1CIga1ovirus "';1'\£$ iJn,.
~ tatly ;Wigens mediate prcrectivc immunity. J Vircll987.61:3102-8.
4. Chorani-P3padopouloll H. VigiU V, GilrgliIi=s P, Kordo.ss.is T, IrtiOIll1ciThoodoT3ki A, K.:lllJTlidi8 I. OO\VllIo&UJation of CD2S9~ aotieenon CD4~ tIIId CD8~ T lympllo~ during EIV.l infe<:tiOl1. J Al:quirImmune Odic Syndr 1994;7:24$-53.
S. Btinchnwm JE, OoblO\lS JH, He~ Bli, liallboim Lt. SouI4fS M, EgelandT. Exprcsaioll of cortiDlulalol)' molecule CD28 on T cells in lwrnaninununo~iencY virus type 1inft.ction: fiIIlctiolllll and cliDieal com\.1.tions. 1 Int1:et Dia 1994; 169:730-8.
6. Calvelli T, Denny T. !'1l.'«Cl1l H. Gelman R, iUgan I. Gui4clinca for ftowoytOlIlotric immllnopbalol)'pinS: a n:pon from the NatiOll41 IllSlilUte ofAllergy and Inic~riOllll Oieellsc:l. Divi:lWn of AIDS. Cylomeuy 1993:14:702-15.
7. Red4e~ MI, IQIljil: S, WcilwI f, Multer W, Kown0W3ki UH. Adoptiveimmunodtanpy of murine cytomegalovirus 3drcnaliris in the immWlDco~!lost: CD4-hclpcr-indq)c:nd<:lU wivillt.l1\mctioao!CDSpositive ~CllY T lymphocytes derived from lar=ly infeoted dollOtl.
J Virol 1.988;62:1061-5.8. Fiala M, K=i Y, Gombcin J. Role of CDS~ in l&le opponuniatic
infc:ctiQl\:l ofpatiellu with AIDS. ~Q ImmI1llG11992; 143:903-7.51. Lowder a, Riltler cP, Dodds EM, Secio M, R.eciJ1as..Gi3pul C. CDS· T
Iymphoeyt~ and c:ytOmepl.ovil'us retinitis In ll'Utl1lS with the: aatuirc'dLmm\ll1Odefici6llC:Y syndrome. Am 1 Opbthlmol 1995~ 120:283-90.
10. SCbrier RD, Freeman WR, Wiley CA, MtCutChan IA, HNRC group.Immune pted.ispositiollS for e:ytO'IlICsaJovilU:l ",linitis in AIDS. J CUtImvtst 1995;95:1741-6•
... .........J..nUWJUtlU'luU1111111IUIl .. , _
/~b

794 Conciae Communications JW 1997; 176 (September)
11. &agy W. Cnunpackcr C, Lopez PA. Finberg F.W. Inhibition orim·l1'l1llle ~at byautiviral dru8S, 1 Oin InyesJ 1991;87:191624.
t2. Ybaacndo D. O'IloG AM. Btian Ai\, Mescher MF. Comriwlion otlympboeylo i\anctiol1-wOci~r.td-IIiIlt=l:CllulM a4he!i0ll mokculo-l&illdiag 10 tile~:li~c~ o.t eytOIO:Ql: T 1>'mpbocytC'xavariOA. J Exp~ 1!l94; 179:359-63.
13. WdIh l'tM. BnIbabt JO. Vs~rtes M. O'Donnell CL.N~ killer(NIC) cell~ 10 viNs in£=iOll$ in mice with scv= ilnlllWlDde1i..
oiency. The stimulation ofN!< cells and NK4ependt1n ~nt'l'ol otvinlsiufcorion O«W' iDdqIcndaldy of T .ne :s 0f.I1I t'unetion. J Exp Mea1991:173:1053~,
14. MilM s..-., Mit3uytlSlJ It", Moreno J, oJ ll. Co.rtlbin"'d thc.r:spy withrocombi~lllgranulocyte colony-snmul_ting fac:wt and erylhnlpoi.~il1 dc~te&s4$ Mmawlo8ic: tOxicity from zidovudUtc. SloDd 1991;77:2I1'l9-77.
IS. Rid<kll SF.. GrMl'lbllfi 'PD. Prillciplc~ for adcptivc r edt thl:tllpy o1'humanviral diaeul:3- .~u Rev UmnlU10l 1995; 13:545-86,.
Combined MlllJary DJ~osdc Rerrol'trology SeMC~. Walrlll' Rtmd 9111)'[rutiMe 01RcstM'ch. Henry M. JacksOlt FollJtliat1on, and SRA
Tec/uloiDsics. R.ockuiiJ8: Naziol1aJ NiZVQ} Mct:bcQ} C4nr~. lJcth~da.
Maryland; Walrer Reed Army Memt:Q.J emllfl', Washinglon. DC
Materials and Methods
Study participants W'e'Ie tecruited from among voluntem enrolled in a DoD protocol for ic.vestigsting the natural history ofHIV-1 jnfection in members of the US military. Inclusion criu::ria
hemophilia and homoseJl:ual cohorts have shown that the levelofHlV-1 RNA circulating in the serum or plasma is a predictorof time to development of .AIDS and to de:ath [5, 6]. W1lethervirus load (circulating RNA level) diifers among racial andethnic groups is unknown, and virus load may affect the rateof disease progression.
The factors confounding moSt comparisons of racial andethnic groups in the United States ~ equalized within themilitarY system. Quality health care is accessible to all memobers. More spec:mcally, mv-1 screening and patient manageme:ot are carried out according to Standardized policies f7).
A long-rer.m srody of the naroral history of mY-I infectionestablished by the US Department of Defense (000) has en·rolled approximately equal numbers of white and black volunteers and a smaller number of Hispanic volunteers (8). As partof this study, HI\'-I RNA quantitation. in plasma was initiatedin 1995 through a single central laboratory. Herein we reporton an an31ysis that was based an resultS of the initial year oftesting. The analysis addresses the hypothesis that differencesin IDV·1 virUs load may be associated with race.
Volunteers in a natural history smdy aC human immunodeficiency ...ltus tYPe 1 (HlV-l) at twomilitary medical centers were stUdied to dererminc wbcthet plasma HlV·l RNA levels differ amongracial and ethnic groups of US aduRs infec~ed witb HIV·1. Cross-sectional analyses of pl380laHlV-l RNA and C04 celt cou:nts were done using demographic and cllnical data conected duringStUdy visits. Age, gender. CD4 c:ell count, scrocoRverslon staNS, and use of antiretroviral therapywere studied in 545 military members (46% whIte, 49% blaa, and 6% Hispanic). No associationwas found between HIV-1 RNA lC'lels aftd race or ethnicity among infected adults for whOal accessto care> and soaoceonomie $tatus were not confounding facto'Cll.
Human Immunodeficiency Virus RNA Levels in US Adults: A ComparisonBased upon Race and Ethnicity
Minority groups within the United States are affected dispro~
portionately by rh.e human immWlodeficiency virus type 1(ElY·1) epidemic. In the most recent national report ofleadingcauses of death, the ratio of age--adjusred death rates related toHIV-l infection is 4: 1fur black versus white persons [1]. Since1991, AIDS has been the leading cause of death for black andHispanic men and b.laclc womeII 25 -44 years old [2]. A numberof smdies have found that survival time fer persons with AIDSdiffers among racial groups (31, and a recent article suggeststhat CD4 cell count decline varies with race [4]. However,such comparisons are genc:rally confounded by socioeconomicfactors and unequal access 10 health care. Analyses of both
Arthur E. Brown, John D. Malone., Susan Y. J. Zhou,James R. Lane, and CliftAul A. Hawkes
Wrilttn informedco~t was obtaillod from all stUdy subjel:ts, and hUllWl8lCpetimentation guiclcJincs of !Ilc US Depumnent of Dofemo, Walter' R.ccdAmly Medical Ceruer. 3lId !he NatiOlUl N:iVoU Medical Center 11I= followedin the con~ of l!li:I rClioll[ob.Pin~ suppoct: US Azmy Medical Rcscarch lIJ\d Ma&cri..1 COll1mond;
.R..nty M. 1~" Fo~tioQ for Ibtl Adv:l.Dccmcnr of MiliCllty M<:dicine(cooperatillfl:l.greement no. D.~17-93-V·3004).
RqlriIlla or CO=spondCllC&: Dr. Anhur E. BroWll. Dept. of Reu'QvimlollY,1JlUMS. AlIO ~ 96546.
Cum:nt affiIWiOl1: Dr. Arthur E. BTo\llll, Dep{. of R.etrovi!ology, AmledFo~~ InlIril\lte of Medical Science"" 31S161t;ljvithi Ro~, a)nglcol:10400, !!uU1und.111. Journal of htKtJou.t!)tuUM 1997; 176:794-7" 1997 ~y l'l\4I UlIiVcni\y ;Jf Olil:aiO. All~r~cd.0022-1899/97n603-0039S02.00
!~."
.4,1I
,J. j,
.1-, I.
• I., ,
I~
,=I
, .; tl~
;;Hi::. ~)t~ 'I iIl'b••Iiii'....----.. 11&I:"1111111111111111111111111llilllllllllil,.

..-._._..- .
ION S
ion on epide·he frequencydescribes opevention. The:l the demand
Research/Recherche
Efficiency of EPI cluster sampling for assessingdiarrhoea and dysentery prevalence
8.S. Yoan,1 J. Katz,2 K. Brendel,3 & K.P. West Jr2
This study examines the efficiency of EPI cluster sampling in assessing the prevalence of diarrhoea anddysentery. A computer was used to simulate fieldwork carried out by a survey taker. The bias and varianceof prevalence estimates obtained using EPI cluster sampling were compared with those obtained usingsimple random sampling and cluster (stratified random) sampling. Efficiency ratios. calculated as the meansquare error divided by total distance travelled. were used to compare £Pf cluster sampling to simplerandom sampling and standard cluster sampling. EPI cluster sampling may be an appropriate low-cost toolfor monitoring trends in the prevalence of diarrhoea and dysentery over time. However, it should be usedwith caution when estimating the prevalence of diarrhoea at a single point in time because of the biasassociated with this cluster sampling method.
designed and conducted sample survey can provide an epidemiological snapshot of the disease. Adiarrhoeal disease survey may also be used to assessthe nutritional status of a community. since childrenaffected with diarrhoea and dysentery are often nutritionally deficient. A survey can also establish baseline information prior to an intervention. Repeatedover time. cross-sectional surveys are useful surveillance tools for monitoring changes in a population.
There are a number of sampling strategies thatcan be used to ascertain the prevalence of diarrhoeaand dysentery in a community. Theoretically thesimplest. but often the most difficulr to carry out. issimple random sampling (SRS). SRS requires eachmember of the population to have a known andequal probability of selection. The Jist from whifhthe sample is drawn is assumed to include everyeligible member. The compilation of this Jist, oftencalled the sampling frame, is difficult and sometimesimpossible, even in situations with large amounts ofresources. In developing countries. acquisition of thesampling frame can be especially difficult becauseof inaccuracies in rhe existing census, to which areadded high migration and birth rates and severelylimited resources.
An additional difficultv with SRS which makesit impractical in most situ;tions is that subjects selected in the sample can be geographically spreadout. Visiting these subjects can divert resources fromother areas of the surveyor even other health pro~
cal practice is1 reviews and, genetic comeluding cora·lIDa, diabetes,;e. A compre;lonunities forly studies andections cover·unselling andtetric care, forning and DNA
1 the organizaj and developcal, social and:nedicine, con-in the area of
1ility.
.ses
French and
22}791 4857
IntroductionDiarrhoea is one of the major causes of morbidityand mortaliry among children in developing countries. It has been estimated that over 12000 personsdie each day from diarrhoeal disease in developingcountries (J. 2). Diarrhoea has been ShO\\l1 to affectthe growth of children and is an important cause ofmalnutririon which can adverseIv affect child mortality (3,4). The infectious nature of diarrhoea suggeststhat faecal contamination of water and food contributes to its transmission (5). For example. a contaminated source of water, if serving several families, cancause a cluster of illness.
The prevalence of diarrhoea and dysentery in acommunity can be estimated through the use of asample survey. Depending on the method used. asample survey can give an accurate overview of thedisease process within a community. For infectiousdiseases such as diarrhoea and dysentery, a properly
1 Epidemic In1elligence Service Officer, NalionaJ Cemer tor Environmental Health, Cenlers for Disease ContrOl and Prevemion(CDC), Mail Stop F47, 4no Bufora Highway NE. Allanla. GA30341-3724, USA. Or Yeon was not affiliated with CDC when thiswork was carried oul. Reques1s lor reprints should be sem 10Dr Yeon.
• Associate Professor. School 01 Hygiene and Public Health.JOhns Hopkins University, Balltmore, MD. USA.
l Computer consultant, Allanta, GA, USA.
Reprin1 No. 5796
BUlletin of the WOOd Health OrgafllzatiOO. 1997. 7S (5): 417-426 co Wo~d Hearth OtganlzallOn 1997 417
;!
~'.
I'.

S.S. Yoon et al.
grammes. Inaccessible areas containing only one ortwo subjects may need to be visited. Consequently,SRS is infrequently used.
A method that eliminates many of the logisticalproblems of SRS is cluster sampling. The primarysampling units are clusters. often defined so as tobe convenient for the researcher (6). For example,clusters may be city blocks if the survey is conductedin an urban setting, or villages if the survey is can·ducted in rural areas. For cluster sampling, a complete list of clusters is necessary. which is usuallymuch easier to obtain than the sort of list requiredfor SRS. However, a complete list of individualelements is necessarv for selected clusters. SRS isoften used for sampiing within clusters. If clustersare "large", the amount of resources necessary to listtheir elements can still be substantial.
Thus. a simplified low-cost methodology (EPIcluster sampling) was developed by the WHO Expanded Programme on Immunization (EPI) and hasbeen used extensively (7). Typically. EPI cluster surveys have consisted of 30 clusters of 7 children each(for immunization coverage surveys) (8). However.the method has been modified and adapted forother purposes: 30 clusters of 14 children have beenused for surveys of immunization coverage, oralrehydration salt availability, and breast-feeding anddietar;' information (9); 30 clusters of 68 childrenwere :.ised in Guinea to monitor selective components of primary health care (10); 30 clusters of 70children were used for surveving neonatal tetanusmortality in Kenya (11); 30 c1u~teiS of2tS. for assessing morbidity and mortality due to diarrhoea in theCentral African Republic (12); 19 clusters of 10-13children each. in the Philippines (13); and 45 clustersof 8 children. for breast-feeding practices (14).
Standard cluster sampling uses SRS for sampling within clusters; however, EPr cluster samplinguses a convenient sampling procedure instead ofprobability-based SRS for second-stage sampling.Thus, although EPI cluster sampling is easier andless costly, the bias and variance of the estimatesobtained can increase.
The present study investigates the cost of conducting EPI cluster sample surveys (expressed asdistance travelled to visit the sample subjects) andthe bias and variance of the estimates derived withthis sampling design.
Materials and methodsData were derived from a survey of preschool-childmorbidity that was carried out prior to a randomizedvitamin A supplementation trial in the Terai districtof Sarlahi, Nepal (15. 16). Communities enrolled in
418
-... -~
the trial were mapped. and each house was numbered. We used data from a subset of 40 wards in 25villages where morbidity histories, anthropometricmeasurements. and ocular health indicators werecollected at the beginning of and at regular intervalsduring the trial. The 40 wards were selected withprobability proportional to size from among 261wards in the trial.
All children under 5 years of age were identifiedby a house·to-house census and enrolled in thestudy. At the outset. respondents were queried todetermine if enrolled children had either a 7-davhistory of diarrhoea (defined as four or more loos~.watery stools per day) or dysentery (defined as thepresence of blood in the stool regardless of whetherdiarrhoea was present). Other information on healthand nutritional status was also collected. Interviewswere conducted by persons with at least 10 years offormal education. but without medical training. Local terms for symptoms were used, which had beenpreviously identified through focus-group discussions within the communities. Children with symptoms on one or more davs were considered to be ill.Children not under direct observation by a parentfor the past week were considered to have missingmorbidity data.
Maps of each of the wards were established forthe census. Each house was identified on the mapswith the same identifier as used in the database. Although not drawn to scale. the maps were the meansof locating households for subsequent visits. Thequality of the data collected has been described (17).The study population consisted of 4297 children whoparticipated in the baseline survey and had a historyof morbidity.
Three 'different sampling schemes were simulated: SRS. stratified random sampling, and EPrcluster sampling. Modified versions of the EPr c1us-.ter sampling scheme were also simulated. The SRSmethod randomly selected a sample of fixed sizefrom the total population of eligible children, regardless of ward of residence. For stratified randomsampling, a fixed number of children in each of the40 wards was randomly selected. For EPI clustersampling a fixed number of children in each wardwas selected using an EPr-recommended samplingstrategy. All simulations were carried out using theestablished maps.
Like cluster sampling. EPI cluster samplingoften uses probability-proportional-to-size (PPS)sampling to select clusters. However. at the secondstage. EPI cluster sampling selects a starting household in each community by locating the ward'scentre. randomly selecting a direction. and randomlyselecting a house from a list of all houses fallingalong the line drawn from the ward centre to the
WHO Bulletin OMS. Vol 75 1997

Efficiency of EPI cluster sampling
ie was num) wards in 25hropometricicators wereliar intervalselected withamong 261
:re identifiedoiled in thee queried to~her a 7-day. more loose.~fined as thes of whetheron on health1. Interviewst 10 years oftraining. loch had beenroup discus·I with symp:red to be ill.by a parent
lave missing
tablished foron the mapslatabase. AIre the meanst visits. Thescribed (I 7).:hildren wholad a history
were simu19, and EPrhe EPI elus-.~d. The SRS)f fixed sizeiren, regard.ried randomI each of theEPI cluster
n each wardled sampling)tit using the
:er sampling)-size (P PS)\t the second1rting house·I the ward'smd randomlyouses falling:entre to the
OMS. Vol 75 1997
periphery in the chosen direction. All eligible children in the selected households are included. Ifadditional children are required, the closest houseto the right is visited. until the required number ofchildren are sampled. If a household has more chilodren than required for a given sample size. allchildren in the household are nevertheless sampled.A version of EPI duster sampling that has the effectof spreading out the sampled children across thecommunity by visiting the nth nearest house to theright was also simulated.
A total of 1000 simulations were performedfor each sample size investigated. For SRS. samplesizes of 280,400.600,800. and 1000 were simulated.For stratified random sampling, sample sizes of 7.10, 15,20, and 25 children per ward were simulatedfor all 40 wards. resulting in sample sizes of 280. ~OO.600,800. and 1000. For EPI cluster sampling.a minimUm of 7. 10. 15.20. and 25 children per ward weresampled in each of the .j.() wards, resulting in samplesizes of approximately 280. .wo. 600, 800. and 1000.Sample sizes were selected to provide a range ofestimates of bias and variance for each samplingmethod and to allow comparisons with previouscomputer simulations of EPl cluster sampling (18.19).
Simulations required computer maps representing the locations of households and allowing calculations to be made of the distance travelled in wards
.for each sampling method. A digitizing tablet andMapInfo (MapInfo Corporation. NY. USA) geographic-information-system software were used toenter household locations. which were referenced toan arbitrary point of origin. The centre of each wardwas calculated by taking the average of the coordinates of the households within a ward. For SRSand stratified random sampling. a Turbo Pascal(Borland Corporation. CA. USA) program determined, based on the list of selected children. thechild liYing closest to the ward centre. From thisinitial household. the nearest household containinga selected child was determined and visited. Thesoftware was used to keep track of disease status andthe total distance travelled. "Visiting" the nearesthousehold containing a selected child was repeateduntil all selected children were included. Since thesampling unit for SRS and stratified random sam·pIing was the eligible child. only households witheligible children were ·'visited".
For EPI cluster sampling, the sampling unit wasthe household. A household was selected at randomfrom a list of all households falling within a path ofa defined width from the ward centre in a randomlYchosen direction. The house was then examined todetermine if a child of eligible age was living there.Subsequently. the nearest (or nth nearest) house·
WHO Bulletin OMS. Vol 75 1997
hold to the right was "visited". and the steps reopeated until the desired number of children was obtained. The prevalence of diarrhoea and dysenteryand the total distance travelled. including the distance from the centre of the ward to the start·ing household. were determined. The total distancetravelled also included "visiting" households with noeligible children.
The "true" disease prevalence was consideredto be the number of children with diarrhoea (or dysentery) as determined by the census, divided by thetotal number of enrolled children. Disease prevalence estimates from stratified random samplingand EPI cluster sampling were weighted accordingto the number of eligible children in each ward. inorder to obtain estimates that could be comparedwith "true" prevalence. fn a survey in which theprimary sampling units (wards) would have beenPPS selected. an unweighted prevalence estimatefor the stratified random sample or the EPI clustersample would have been appropriate because of thefixed sample size in each cluster. A prevalence esti·mate was obtained for each of the 1000 simulationsrun for each method. The mean prevalence of the1000 simulations was then compared with trueprevalence to estimate the bias of each method.Variance was obtained from the distribution of the1000 prevalence estimates.
The effect of sampling design (design effect) onthe variance of estimates obtained with EPI clustersampling was calculated by dividing the estimatevariance for EPI cluster sampling by the estimatevariances for SRS and stratified random sampling.Thus. two different design effects were calculated.One answers the question "How much does estimatevariance increase if cluster sampling instead of SRSis used to assess the prevalence of diarrhoea anddysentery?": the second answers the question "Forthe wards selected using PPS sampling at the firststage, how much does estimate variance increaseusing EPI cluster sampling instead of SRS for 'thesecond sampling stage?" Mean square errors (MSE)were calculated from the bias and variance estimates derived from stratified random and EPl cluster sampling by adding the square of bias to variance.MSE represents the overall error of prevalence estimates under different sampling designs.
Estimates of distance travelled were comparedfor EPI cluster sampling and stratified random sampling for each simulation run. Distance was compared ward by ward becnuse ward maps were notdrawn to a common scnle and mapping distortionwas variable. Median distance was cnlculated foreach ward for each sampling method, A distanceratio was calculated for each ward by diViding themedian distance travelled for EPl cluster sampling
419

S.S. Yeen et al.
by medIan distance travelled for stratified randomsampling. A ratio greater than 1 indicates that EPIcluster sampling required a greater travel distance.
Maps of households visited for EPI clustersampling (Fig. 1) and stratified random sampling(Fig. 2) are shown for ward 1.2. In Fig. 1. of theeight houses visited during EPI cluster samplingsimulation. eligible children were found in onlythree. The distance travelled is greater for childrenselected at random (Fig. 2) than for those selectedusing the EPI sampling method (Fig. 1).
MSE measures the total error of sample estimates and distance can be used as an indicator ofcost. To compare two designs (a & b), one can usethe efficiency ratio (20):
Costa X MSEa
CoStb X MSEb
By these criteria, a ratio greater than 1 implies designb is preferred. i.e. it has eithera smaller cost per unitMSE or a smaller MSE per unit cost. The product ofthe cost and MSE of estimates obtained from EPIcluster sampling was compared to that of stratifiedrandom sampling for the same sample size.
Limitations
Distance travelled can provide only an approximateindication of the cost of conducting a survey. Other
costs may include personnel. training, and materials.However. for comparison across sample designs. distance travelled should prOVide reasonably accurateestimates. However. if the cost of obtaining an accurate sampling frame is considered. SRS may be farmore costly.
Distance was calculated as a straight line between two points. Roads. rivers. and other physicalobstacles were not taken into consideration. Again.however. all simulations were subject to the sameconstraints. so comparison of designs should not.have been seriously affected. .
Finally, a field worker cannot be perfectlymodelled using a computer. For example. the role ofindividual subjectivity in household selection cannotbe simulated. As the selection algorithm used in thesimulations is completely objective and consistent.the simulations represent an "ideal" that may bemore or less close to the real situation.
ResultsA total of 4297 (90.2%) of 4765 eligible childrenlived in 54.7% of the 4920 households in the 40 wardsunder study. The number of eligible children in eachward ranged from 13 to 284. whereas the number ofhouseholds ranged from 31 to 315. The "true" prevalence of diarrhoea was 13.8%. and the prevalence ofdysentery 4.4%. among the 4297 children surveyed.
Rg. 1. Map of ward 1.2 showing the households visited (starting with household27) for EPI cluster sampling (sample size 7, next nearest household to the rightvisited).
Gsi:(Eh(F(In
-,
420
41 ~~.... 47 ~40.... .... ....
D.'" D.46 6742 ................
.... 3943 4.4 45 ~37 ....
38 ~
D. Households with noeligible children
.... Households with eligiblechildren
o Visited house with noeligible children
• Visited house witheligible children
\o\oHO 91XJ9
WHO Bulletin OMS. Va 75 1997
anralsat
Tat(Sfi
Sam
710152025
• Figl
• SO

•.... )131'''''' >enmn .. " ... r :hys"Miti#nY',*SiSf»)' "s,,;)'y---~
t::. Households with noeligible children
... Households with eligiblechildren
• Visited households
WHO 97310
and -0.55% to 1.00% (dysentery) (Fig. ~ ~ 4). 1'.1'1_derived estimates for diarrhoea pn.:valcnt:c 'howcupositive bias (EPI cluster sampling (;On,i'lenllv liVer.estimated diarrhoea prevalence). Bia, fc,r ':I'!'h;.rived dysentery prevalence estimate, wa., eilherpositive or negative. depending on the numhel "fhouses to the right that were skippeu..[ hI,; I ypic;J!EPI procedure of selecting the m;xt neare'l IlIlU'e.hold consistently underestimated the prt:v:llelll;e ',fdysentery (negative bias) regardIL....s of ,ample \izl;.
Estimate varian~es for E.?I dU'ler \Mnplilll.:were compared to estlmate vanancr.:, !"r SI{S II, ,;,_
timate the design effect of EPI c!u,H;r \amplillV.·1 hi,estimates the overall increase or decn:a\c in c,l·ill1:.1e
10t::....
9 14..........11 13 15...
12
Efficiency of EPI cluster Sampling
Fig. 2. Map of ward 1.2 showing households visited (starting with household 26) forstratified random sampling (sample size 7).
Table 1: Prevalence estimates for diarrhoea obtained from EPI cluster sampling and simple random sampling(SRS)
Estimates based on simulations ranged from 13.75%(simple random sampling, sample size 10) to16.45% (EPI cluster sampling. sample size 7, 4thnearest house to the right selected) for diarrhoea(Table 1) and 3.85% (EPI cluster sampling. clustersize 25. nearest house to the right selected) to 5.4%(EPI cluster sampling, cluster size 7. 3rd nearesthouse to the right selected) for dysentery (Table 2).For diarrhoea. EPI cluster sampling always resultedin higher prevalence than "true" prevalence.
Bias. calculated as the difference between trueand sample prevalence. was very small for stratifiedrandom sampling. However. bias from EPI clustersampling ranged from 0.36% to 2.65% (diarrhoea)
t line ber physicalIn. Again.the samelould not
materials.signs. dis·accurate
~ an acculay be far
perfectly:he role ofon cannotsed in the:onsistent.,t may be
~ childrene40wardsen in eachJumber ofJe"preva.valence ofsurveyed.
EPI (1)' EPt (2) EPI (3) EPI (4) EP115/ "';R'~
True -_............Sample size prevalence Mean SO' Mean SO Mean SO Mean SO Mean SO '11~:;'" ".i.J
7 13.80 15.76 2.31 16.00 2.34 15.85 2.47 16.45 2.28 15.58 2.09 "; ~'.. L ::''':10 13.80 15.79 1.77 15.68 1.96 16.11 1.98 15.46 1.76 15.32 1.7a ";.7': L I,~
15 13.80 15.06 1.32 14.95 1.49 15.91 1.37 14.63 1.23 14,35 1.2<: I': 7:; ~ ' .. I ...
20 13.80 14.94 1.08 14.71 1.25 15.27 1.04 14.23 1.00 14.16 1.02 1"; ~~ , ,~
25 13.80 15.35 0.80 14.28 0.99 15.01 0.60 14.57 0.69 14.27 Ij.e-s 1'; ~~ ~ ;(:
• Figures in parentheses are the number 01 households to the nght lhat were skipped.• SO =standard deviation.
MS. Vol 75 1997 WHO Bulletin OMS. Vol 75 1997 4:t1

·~..; . ~~~.~
~~i.~· '::j:.;.:1';:"..............._ -_._-----
S.S. Yoen et a/.
Table 2: Prevalence estimates for dysentery obtained from EPI cluster sampling and simple random sampling(SRS)
EPI (1)' EPI (2) EPI (3) EPI (4) EPI (5) SASTrue
Sample size prevalence Mean. SO' Mean SO Mean SO Mean SO Mean SO Mean SO
7 4.40 4.02 126 5.07 1.58 5.40 1,49 4.82 1.39 4.99 1.46 4.44 1.4910 4.40 4.05 1.00 4.81 1.32 5.13 1.17 4.47 1.04 4.58 1.08 4.45 1.2315 4.40 4.09 0.76 4.78 0.88 4.71 0.75 4.02 0.73 4.17 0.73 4.41 0.9820 4.40 3.91 0.63 4.49 0.66 4.49 0.62 4.06 0.58 4.02 0.61 4.40 0.8225 4.40 3.85 0.50 4.13 0.55 4.30 0.49 3.90 0.44 3.97 0.55 4.42 0.72
, Figures in parentheses are the number af tile househOidS 10 the right that were skipped.• SO = standard deviation.
variance due to use of the EPI cluster sampling design compared with the random selection of childrenfrom the entire census list (Table 3). The designeffect for estimates of diarrhoea prevalence rangedfrom 0.47 to 1.52 for EPI cluster sampling versusSRS. The value 0.47 was obtained from EPI clustersampling with a sample size of 25 when the nearesthouse to the right was visited. The value 1.52 wasobtained from EPI cluster sampling with a samplesize of 7 when the 3rd nearest house to the riell! wasvisited. For estimates of dysentery prevalenCe. thedesign effect ranged from 0.46 (sample size 25. 4thnearest house to the right) to 1.76 (sample size 7. 2ndnearest house to the right) (Table 3). In general.larger sample sizes resulted in smaller design effects.The number of houses to the right that were skippeddid not influence the design effect.
The comparison of estimate variances from EPIcluster sampling with those from stratified randomsampling estimates the impact of using EPI clustersampling inst~ad of random sampling at the secondsampling stage. This gives an estimate of that portionof the overall increase or decrease in variance associated with EPI cluster sampling that is due solely tothe second sampling stage. The design effect for estimates of diarrhoea prevalence ranged from 0.42(sample size 25. nearest house or 3rd nearest houseto the right) to 0.95 (sample size 7, 3rd nearest houseto the right) (Table 3). For estimates of dysenteryprevalence, the design effect ranged from 0.37(sample size 25, 4th nearest house to the right) to1.15 (sample size 10. 2nd nearest house to the right)(Table 3). These design effects from EPI clustersampling versus stratified random sampling were
Tabl
Fig. 3. Prevalence estimates for diarrhoea, by number of households to the rightskipped and sample size. (SRS = simple random sampling, EPI(n) = n householdsto the right skipped).
22
20
18
~16
CD0 14<::CDc;;>
£ 12
10
8
- -tl~%-limIts
--
- I- - --- - --- -5anDle=7 ~$Il!la SanpjeSl/Z 15 SamPle~lZI:2I} 5anIllIe$ll!25~-- --
_trueprevalence
WII091311
EPI (EPI (EPI ("EPICEPI ('EPI (~
EPr (;EPI (~
EPr (~
EPI (2EPr (3EPI (3EPI (3EPI (3EPI (3.EPI (4,EPI (4,EPI (4.EPr (4,EPI (4,EPI (5.EPI (5.EPI (5,EPI (5,EPI (5.
, Compo• Comp,• Figureholds to
WHO 8uil81Jn OMS. Voj 75 1997 WHOBIlII,

Efficiency of EPI cluster sampling
pIIng
s
Fig. 4. Prevalence estimates for dysentery, by number of households to the rightskipped and sample size. (SRS :0 simple random sampling, EPI(n) "" n households to theright skipped).
Table 3: The design effects of EPI cluster sampling all less than one, except for those associated withestimates of dysentery prevalence with sample sizes
Design Diarrhoea- Oiant1oeao Dysentery" Dysentery" 7 or 10. (2nd nearest house to the right).
EPI (1.7)< 1.33 0.83 1.12 0.72The ratio of median distances (cost) increased
when either n increased (nth nearest house toEPl (1. 10) 1.01 0.73 0.98 0.65
the right) or sample size increased (Table 4). TheEPI (1, 15) 1.02 0.64 0.90 0.59EPI (1. 20) 0.98 0.58 0.95 0.60 ., median distance ratios were all less than one whenEPI (1, 25) 0.47 0.42 0.61 OA8 either nearest neighbours or next nearest neigh-EPI (2. 7) 1.36 0.85 1.76 1.13 bours were visited. regardless of sample size. ThisEPI (2. 10) 1.25 0.91 1.73 1.15
meant that for EPI cluster sampling visiting eitherEPt (2. 15) 1.30 0.81 1.22 0.80EPI (2, 20) 1.31 0.77 1.05 0.66 the nearest house or the second nearest house. theEPI (2. 25) 0.72 0.65 0.73 0.58 distance travelled was alwavs less than distanceEPI (3. 7) 1.52 0.95 1.56 1.00 travelled for stratified random sampling to obtainEPI (3. 10) 1.27 0.92 1.35 0.89
the same number of subjects. If either the 3rd, 4th, orEPI (3. 15) 1.10 0.69 0.89 0.58EPI (3. 20) 0.92 0.54 0.90 0.57 5th nearest household was visited. the distance ratioEPI (3.25) 0.47 0.42 0.59 0.46 was greater than one for large sample sizes. In otherEPl (4, 7) 1.30 0.81 1.35 0.87 words. by increasing n and cluster size. the distanceEPI (4.10) 1.00 0.73 1.07 0.71EPI (4.15) 0.8S 0.55 0.86 0.56 travelled using EPI cluster sampling increased moreEPI (4, 20) 0.84 0.50 0.81 0.51 than the distance travelled for similar sample sizesEPI (4, 25) 0.57 0.52 0.46 0.37 using stratified random sampling. The cost benefit ofEPI (5.7) 1.09 0.68 1.50 0.96 EPI cluster sampling (at least for small neighbour·EPI (5.10) 1.03 0.75 1.16 0.77EPI (5.15) 0.90 0.56 0.86 0.56 hoods within a village) is negated when householdsEPI (5. 20) 0.81 0.51 0.88 0.55 farther away than the 2nd nearest to the right areEPI (5.25) 0.54 0.49 0.73 0.58 visited.
• Compared with simple random sampling.Efficiency ratios based on comparisons of the
• Compared with stratified random sampling.MSE and cost of prevalence estimates for diarrhoea
< Figures in parentheses are. respectively. the number of house- obtained from EPI cluster sampling versus stratifiedholds to the right that were skipped and the sample size. random sampling increased with the sample size
WHO Bulle1ln OMS. Vol 75 1997 423
trueprevalence
091312
mean t195%confidence- hmlts
-I
- t- -- - - - -SftIem 1 SalIIlIe SiZe 1Q SlmoieSll! 1S S3noIe su:e 10 Sa!lDleSlle25 WH
10
8
*6
.......Q)
g4S!
«I:>~Q.
2
0
1.491.230.980.820.72
so
I EPIIdomuster:cond'rtionasso~Iy to: esti-
0.42louselOusentery0.37
1t) toright)lusterwere
1I751997

S.S. Yoon et al.
Table 4: Median distance ratios of EPI cluster sampling compared with stratified random sampling
nth nearest household to the right sampled:
Cluster size 2 3 4 5
7 0.39 0.53 0.64 0.72 0.8210 0.42 0.58 0.68 0.80 0.9215 0.49 0.62 0.80 1.01 1.0720 0.55 o.n 0.92 1.28 1.3325 0.65 0.95 1.13 1.47 1.62
when the nearest household to the right was visited(Table 5). The values ranged from 0.58 (sample size7, nearest household to the right) to 1.97 (sample sizeIS, 3rd nearest household to the right). Efficiencyratios compare EPr cluster sampling and stratifiedrandom sampling, and an efficiency ratio less thanone indicates that EP[ cluster sampling is more efficient than stratified random sampling, consideringboth distance travelIed and size of MSE. Similarresults were obtained for estimates of dysenteryprevalence: ratios ranged from 0.31 (sample size 7,nearest household to the right) to 1.51 (sample size25,5th nearest household to the right). The ranking.
Table 5: The ratios of the products of distance travelled and mean square error (efficiency ratios) for EPIcluster sampling versus stratified random sampling
Design Diarrhoea Dysentery
EPI (1. 7)' 0.58 0.31E?I (1.10) 0.74 0.31EPI (1,15) 0.64 0.34E?l (1. 20) 0.73 0.53EPI (1, 25) 1.44 0.69EPI (2, 7) 0.89 0.71EPI (2,10) 1.06 0.73EPI (2, 15) 0.85 0.59EPI (2. 20) 0.98 0.51EPI (2. 25) 0.82 0.68EPI (3,7) 1.07 0.93EPI (3.10) 1.56 0.85EPI (3,15) 1.97 0.55EPI (3. 20) 1.61 0.53EPI (3, 25) 1.75 0.54EPI (4,7) 1.44 0.68EPI (4.10) 1.16 0.57EPI (4,15) 0.87 0.72EPI (4. 20) 0.81 0.87EPI (4. 25) 1.48 1.24EPI (5, 7) 1.01 0.92EPI (5, 10) 1.25 0.73EPI (5.15) 0.76 0.66EPI (5,20) 0.82 1.02EPI (5. 25) 1.13 1.51
• Figures in parentheses are, respectively, the number at households to the right that were skipped and the sample size.
424
of efficiency ratios on the basis of the nearness ofhouseholds visited for a given cluster size was different for diarrhoea and dysentery, suggesting thatthe two diseases have different patterns of spatialdistribution.
DiscussionEPI cluster sampling is often used when resourcesare limited, as it is easier and quicker to carry outthan SRS or stratified random sampling. However.EPI cluster sampling can result in increased estimatebias and variance compared with SRS or stratifiedrandom sampling. In this study. EPI cluster samplingresulted in prevalence estimates for diarrhoea thatwere consistently larger than the prevalence as de·termined by census, regardless of sample size or thenumber of houses to the right that were skipped.Estimates for the prevalence of dysentery varied.Some showed positive bias and others negative. depending on sample size and the number of households skipped (Tables 1 & 2).
A possible explanation for the different biaspatterns is that diarrhoeal disease may tend to bemore concentrated in the centre of a village: as EPrcluster sampling tends to select starting householdsthat are central rather than peripheral. diarrhoeaprevalence may be overestimated. EPI cluster sampling may therefore introduce bias in prevalence estimates according to the actual pattern of diseasedistribution. Diarrhoea and dvsenterv were exam'j"ned in this study because they are infectious diseasesand may be transmitted by' a single source of infection. In addition, children from the same neigh·bourhood often play together, which may add toinfectious disease transmission and shape the resulting spatial distribution of disease.
On the basis of this study, we conclude thatdiarrhoea prevalence estimated with EPI clustersampling would be an overestimate of the prevalence of diarrhoea. If the accuracy of a single surveyis important, EPI cluster sampling may not be theright tool. However. if surveys are used to assesschanges in prevalence over a period of time, EPIcluster sampling may be appropriate. EP[ clustersampling would in any case be less expensive andquicker to carry out than SRS or stratified randomsampling.
For less common diseases such as dvsenterv.EPf cluster. sampling may be appropriate for assessing community disease prevalence when either accuracy or the measurement of trends is important. Nosystematic bias due to EPf cluster sampling wasfound when estimating dysentery prevalence, andthere was very little increase in variance associated
WHO 8UU911n OMS. Vol 75 1997
withrandoccu:dust,estim
large:inge'callygreat,theirmininfeet (ihouseobtaironlv (of reDsampJ!In thi~
similalties (2.affecte
Alence(diarrtbias fowhere.By incand, tcboth d:be exptotal p.(1000)dren inthe Ianselectee
Fu'whethe:tings.OIvalenceEPI c1u:timateshaps usi
Ackno,This WOn.
No. DANUnited S(USAID),and Dan;;DepO), Jadditionalgrant No.Bennett 01
Medicine'

~.-::.: ..~....-.:.~ ..-... _..;....
, nearness ofsize was difggesting that'ns of spatial
len resources. to carry outng. However.ased estimateS or stratifiedISter samplingJiarrhoea that'alence as depie size or thewere skipped.entery varied.; negative. deIber of house-
different biasay tend to bevillage; as EPIng households:ral. diarrhoea?I cluster samprevalence esem of diseasery were exam:ctious diseases) source of inte same neigh:h may add totape the result-
conclude thatth EPI cluster: of the preva, a single survey:nay not be theused to assess
ld of time. EPIlte. EPr cluster; expensive and:ratified random
:h as dysentery,priate for assess;.hen either JCCU
is important. Noer sampling was,prevalence. andriance associated
ulletin OMS. Vol7S 1991
......,:- ........:. .. ~ .....
with EPI cluster sampling compared with stratifiedrandom sampling. However. spatial clustering canoccur even with diseases of low prevalence. and EPIcluster sampling may in such a case produce biasedestimates.
The spreading of sampled households over alarger geographical area by increasing n when selecting every nth household to the right should theoreti·cally result in more heterogeneous samples andgreater precision of estimates. It may also reducetheir bias. since sampling from a larger area mayminimize the influence of the "neighbourhood" effect (Le., similarities in variables ofimerest betweenhouses located near each other). Another way toobtain more heterogeneous samples is to interviewonly one child per household. This has the benefitof removing within-household similarities from thesample (e.g. common morbidities among siblings).In this population. the effects of within-householdsimilarities were larger than within-village similarities (21). In our study, neither of these modificationsaffected the variance or the bias.
Although both diarrhoea and dysentery prevalence estimates showed substantial relative bias(diarrhoea, up to 17%; dysentery. up to 23%), thebias for estimates of diarrhoea was always positive.whereas the bias for estimates of dysentery varied.By increasing the sample size. variance decreased,and, to a lesser extent. so did bias for estimates ofboth diarrhoea and dysentery prevalence. This canbe explained by the increasing proportion of thetotal population sampled. The largest sample size(1000) included approximately lout of everyA children in the population. In some small wards. whenthe largest sample size was used. every child wasselected.
Further studies would be needed to determinewhether these results can be applied in other settings, or whether seasonal variations in disease prevalence would alter these findings. Modifications toEPI cluster sampling may provide more accurate estimates and should be examined more closely. perhaps using computer simulation techniques (22).
AcknowledgementsThis work was carried out under Cooperative AgreementNo. DAN 0045-A-5094 (Office of Health and Nutrition,United States Agency for International Development(USAIDl, Washington. DC & Center for Human Nutritionand Dana Center for Preventive Ophthalmology (CHNIDCPO), Johns Hopkins University, Baltimore. MO}, withadditional support from National Institute of Health (NIH)grant No. AR04060. The authors wish to thank Dr S.Bennett of the london School of Hygiene and TropicalMedicine for his helpful advice, and colleagues at the
WloiO Bulletin OMS. VOl 75 1997
Efficiencv of EPI cluster sampling
Nepal Nutrition Intervention Project. Sarlahi. Nepal (DrS.K. Khatry, S. LeClerq, E. Pradhan, S.R. Shrestha, N.N.Acharya. D.N. Mandai, T.R. Sakiya) and the National Society for the Prevention of Blindness (Or R.P. Pokhrel),Kathmandu. Nepal.
ResumeEfficience du sandage en grappes du PEVpour I'estimation de la prevalence de ladiarrhee et de la dysenterie
La diarrhee et la dysenterie sont des causesmajeures de morbidite et de merta/ite chez I'enfantdans de nombreux pays en developpement; fetraitement et la prevention ne sont toulefois possibles que s1 I'on dispose en temps voulu d'intormations exactes sur leur prevalence. Un systeme desurveillance utilisant des sondages en cours permetd'obten;r de telles donnees.
Plusieurs methodes d'enquete par sandagesontutilisables, mais les ressources disponibles etIe niveau d'exactitude requis sont des facteurscontraignants. La sandage ah~atoira simple. s'il estfait correctement, foumit des estimations preciseset exactes (c'est-a-dire des estimations nonbiaisees, ayant une variance faible). Les conditionsde realisation du sandage aleatoire simple sonttoutefois difficiles, voire impossibles, aremp/ir. " esten eftet particulierement malaise d'obten;r une basede sondage appropriee (c'est-a-dire une Iiste detous les membres de la population): de plus, si fapopulation est geographiquement dispersee. et quecertains membres habitent des secteurs eloignesou inaccessibles, les entretiens risquent de poserdes problemes logistiques supph§mentaires.
Une methode simplifiee de sondage engrappes mise au point par Ie Programme elargi deVaccination (PEV) de I'OMS permet de resoudreces difficultEis, en utiJisant a la lois una base desondage en grappes, at une strategie de sondagequi limite la dispersion geographique de& sujetsselectionnes. Ces avantages sont toutefois obtenusau prix de la perte d'une certaine exactitude etd'une certaina precision des estimations obtenues.Cette etude se propose de mesurer comment('economie de ressources compense I'augmentation du biais et de la variance des estimations.
On constate que la methode de sondage engrappes du PEV presente systematiquement unbiais relatif positif qui atteint 17% (par rapport afa moyenne pour la population) pour les estimations de prevalence de la diarrhee. Concernant ladysenterie, Ie biais est tantot positif, tantot negatif.Les estimations de prevalence de la diarrhee sontplus precises que celles obtenues avec Ie sandage
425
/1~

S.S. Yoon et al.
en grappes classique (sondage aleatoire stratifie);les estimations de prevalence de la dysenterie sonttant6t plus precises. tantot moins precises, quecelles obtenues par sondage en grappes cfassique.
Le sondage en grappes du PEV a exige engeneral des deplacements moins lointains (Ia distance sert d'indicateur de cout dans I'analyse) queIe sandage en grappes classique; toutefois. commeon s'y attendait. cet avantage a disparu au fur et amesure que des modifications destinees agarantirune plus grande dispersion geographique dessujets etaient apportees a ra methode du PEV.
Dans la mesure ou, avec Ie sondage engrappes du PEV, J'on observe une variation du biaisavec la maladie etudiee, if est possible que lesdifferences de repartition spatiale des variablesconsiderees (morbidite par exemple) modifient lesestimations de prevalence lorsqu'on utilise cettemethode. Les estimations obtenues grace a lamethope du PEV peuvent done avoir une exactitude acceptable dans certaines situations.Provisoirement. ces estimations seront toutefoisinterpnatees avec une certaine prudence. Resteque Ie biais etant constant, comme c'est Ie cas pourles estimations de prevalence de fa diarrhee, Jasurveillance des tendances dans fa population n'enest pas affectee. .
References1. Sachdev HPS et al. Risk factors for fatal diarrhea in
hospitalized children in India. Journal of pediatric gastroenterology and nutrition, 1991, 12: 76-81.
2. Savarino SJ, Bourgeois AL Diarrhoeal disease:current concepts and future challenges. Epidemiologyof diarrheal diseases in developed countries. "Transactions of the Royal Society of Tropical Medicine andHygiene, 1993.87 (suppl. 3): 7-11.
3. Black RE, Brown KH, Becker S. Malnutrition is adetermining. factor in diarrhea duration, but not incidence, among young children in a longitudinal study in/tIral Bangladesh. American journal of clinical nutrition, 1984,37:87-94.
4. Pelletier DL et al. The effects of malnutrition on childmortality in developing countries. Bul/etin of the WorldHealth Organization, 1995, 73: 443-448.
5. Black RE et al. Contamination of weaning foods andtransmission of enlerotoXigenic Escherichia coli diar·rhoea in children in rural Bangladesh. Transactions ofthe Royal Society of Tropical Medicine and Hygiene,1982, 76: 259-264.
6. Cochran WG. Sampling techniques. 3rd ed. NewYork, Wiley, 1978: 233.
426
7. (nformation system. Geneva. World Health Organization, 1992 (unpublished document WHO/EPI/CE1Sl92.1, available on request from the Expanded Programme on Immunization, World Health Organization,1211 Geneva 27, SWitzerland).
a. Lemeshow S, Robinson D. Surveys to measureprogramme coverage and impact: a review of themethodolOgy used by the Expanded Programme onImmunization. World health statistics quarterly, 1985,38: 65-75.
9. Frerichs RR, Tar Tar K. Computer-assisted rapidsurveys in developing countries. Publichealth.reports,1989, 104: 1, 14-23.
10. Dabis F et al. Monitoring selective components ofprimary health care: methodology and community assessment of vaccination, diarrhoea, and malaria practices in Conakry, Guinea. Sulfetin of the World HealthOrgan~ation, 1989, 67: 675-684.
11. Melgaard B, Mutie OM, Kimani G. A cluster surveyof mOl1ality due to neonatal tetanus in Kenya. Inter·national journal 01 epidemiology, 1988, 17: 1741n.
12. Georges Me et ai, Diarrheal morbidity and mortalityin children in the Central African Republic. Americanjoumal of tropical medicine and hygiene, 1987, 36:598-602.
13. Auer C, Tanner M. Childhood vaccination in a squatter area of Manila: coverage and providers. Socialscience and medicine. 1990,31: 1265-1270.
14. Zollner E, Carlier NO. 8reast-feeding and weaningpractices in Venda, 1990. South African medical journal. 1993, 83: 580-583.
15. West KP et al. Efficacy of vitamin A in reducing preschool child mortality in Nepal. Lancet, 1991, 338: 6~70.
16. West KP et at Tolerance of young infants to a single,large dose of vitamin A: a randomized community trialin Nepal. Bulfetin of the World Health Organization,1992,70: 733-739.
17. Pradhan EK et al. Data management for large community trials in Nepal, Controlled clinical trials, 1994,15: 220-234.
18. Bennett S et al. A computer simulation of householdsampling schemes for health surveys in developingcountries. Intemational journal of epidemiology, 1994,23: 1282-1291.
19. Lemeshow 5 et al. A computer simulation of the EPIsurvey strategy. International journal of epidemiology,1985,14: 473-481.
20. Klsh L Survey sampling, New York, Wiley, 1965:266.
21. Katz J et al. Estimation of design effects and diarrheaclustering within households and viIJages. Americanjoumal of epidemiology, 1993,138: 994-1006.
22. Bennett 5 et at A simplified general method forcluster-sample surveys of health in developing countoes. World health statistics quarterly, 1991, 44: 98106.
WHO 8ullelin OMS. Vol 751997
,,rJ;
I,1l'c'd
"1'ItupIe(~
CI
rcaelv,d'..zcDIe'K,re"de
I ~
Bel2 lr
lirE
Bullf