1971 White Paper on Crime - New OJP Resources
33
. " ..... ' GeVE·RN·MEN.:r-6f JA P AN--'" II OF THE WHITE PAPER ON CRIME . 1971 THE RESEARCH AND TRAINING INSTlTUTE OF THE MINISTRY OF JUSTICE ./ If you have issues viewing or accessing this file contact us at NCJRS.gov.
-
Upload
khangminh22 -
Category
Documents
-
view
2 -
download
0
Transcript of 1971 White Paper on Crime - New OJP Resources

. " ..... '
GeVE·RN·MEN.:r-6f JA P AN--'" II
-"1~SUMMARY OF
THE WHITE PAPER ON CRIME .
1971
THE RESEARCH AND TRAINING INSTlTUTE
OF THE MINISTRY OF JUSTICE
./
If you have issues viewing or accessing this file contact us at NCJRS.gov.

PREFACE
The Research anel Training Institute of the Ministry of Justic(, has compiled and
anulyzed Japanese crime trends each year since 1960 as well a" reviewing existing
measures for the prevention of crime and the treatment of offender'i. This information
is first reported by the Ministry of Justice to the Cabinet and later rdeased as a White
Paper on Crime to the general public.
The first English summary translation of the White Paper on Crime appeared in
1963 mClking available to scholars and persons concerned with the administration of
criminal justice in other parts of the world a summary of crime, prosecution, courts
and correctional trends in Japan. The Jap'anese edition of the 1971 White Paper on
Crime is subtitled "Trends in Crime and the Treatment of Offenders," and consists of
386 pages, while this summary has been reduced to 57 pages. The material
presented is divided under three headings: General View of Crime, Treatment of !
Offenders and Special Crimes and Criminals. Although every effort was made to
use 1970 statistics, in a few cases this was not Possi~le, In instance where the 1970 1 statistics were not available, the most recent ones were used. ~
This English summary was prepared by Messrs. Osamu Takada, Kiyoshi Hara, ~ Kazuo Takahashi, Masahiko Kikuchi and Mrs. Kyoko Tsunekawa, of the faculty of !'
the Research and Training Institute of the Ministry of Justice, and who 'are currently,'
assigned to the Asia a~d Far East Institute for-the Prevention of Crime and Treatment'
of Offenders. This Institute which is operated by the Japanese Government with the 1
co·operation of the nited Nations makes available personnel training program
and information services to individuals and countries in the Asian region. This yearj
the staff at the Institute w-ere able to give considerable time to the translatioJ). of the, ~
White Paper on Crime. Readers will note a rearrangement of materials which we} • hope will make tham more useful. I would also like to express my appreciation to~
~ Dr. Lloyd W. McCorkle, a Vis\iting Expert at this Institute, for his assistance in prei1
paring this Engli.shversion of the White Paper on Crime 1971. >;
Masayoshi Honda
Director, ~
The Research and Training Institute, J ~ t Ministry of Justice
February, 1972 II ,~;
~ JI "I
i! II I
~ .. --......... ,~--.....
<~~-.:.:::=::~~-------:-----.-~ ---.>

CONTENTS
PART ONE: GENERAL VIEW OF CRIME
1. Crime Trends .................................................... 1
II. Statistical Review of Crime in 1970 ................................ 2 I
A. Penal Code Offenses .......... " .................................... :.. 2
B. Special Offenses ...................................................... 8
PART TWO: TREATMENT OF OFFENDERS
1. Prosecution and Trial ............................................ 10
A. Prosecution .......................................................... 10
.E. Trial ................................................................ 12
II. Correctional Institutions .......................................... 15
A. Admissions and Releases .............................................. 15
B. Treatment of Convicted Prisoners ...................................... 17
~ 1. Classification ....................................................... 17 ~, r 2. Education .......................................................... 17
, ; I
" I.
,~ , ~
3. Prison Industry and Vocational Training .............................. 18
4. Security in Prison ................................................... 19
C. Treatment of Alleged Suspects and Defendants .......................... 19
D. Women's Guidance Home ............................................. 19
III. Probation, Parole and Aftercare .................................... 21
A. Parole ............................................................... 21
B. Trends in the Use of Probation and Parole .............................. 23
C. The Results of Probation and Parole .................................... 24
D. New Programming in Probation and Parole .............................. 25
E. Aftercare and Pardons ................................................. 27
PART THREE: SPECIAL CRIME AND CRIMINALS
1. Juvenile Delinquency ............................................ 29
A. Trends in Juvenile Delinquency ........................................ 30
1. Penal Code Offenses ............................ : .................... 31
2. Juvenile Special Law Offenses ....................................... 31
3. Law-breaking Children and Pre-offense Juveniles ...................... 32
-1-

To illustrate the trends in Special Law offenses, it may be helpful to relate the
number of suspected Special Law violators received by the public prosecu.tor to Penal
Code suspects received by him. The police must refer all cleared cases to the public
prosecutor since he is the only person with authority to institute prosecution.
Figure I in page 1 shows the number of suspects received by the public prosecutor
by type of offenses for selected past-World War II years,
When all Penal Code, Special Law, Traffic offenses are considered, the percent
of Special Law suspects received by the public prosecutor comprised 34.6 percent of
the total in 1946 and 57.5 percent in 1947, mosLo! whom were violators of the Food
Control Law and the Price Control Ordinance during the cbaotic situation in J'ost
World War II Japan. Traffic violators were only 0.5 percent in 1946 and 5.6 percent
in 1947 but-had increased to 61,192 in 1953. This figur~ reached 83.S percent in 1965
when it numbered 4,965,062. In July 1968, traffic suspects started to decrease and
dropped to 54.2 percent of the total in 1970. This is a reflection of the new system of
Traffic Infraction Notification Procedure, Thi.s system permits traffic offenders who
violate minor traffic laws and regulations to be exempt from prosecution if they pay
t'f' t' by the police a "penalty fine" designated in law. On the other upon no 1 lca Ion hand, the percentage of Penal Code offenders occupied only 40.5 percent of total
suspects in 1970 when that of Special Law suspects comprised only 5.3 percent.
II. Statistical Review of Crime in 19'70
1963 1965 1966
-l----
Table 2 shows the Penal Code offenses excluding "professional negligence causing
homicide and bodily injury" for the same selected years.')
Table 2. Penal Code Offenses, Number Cleared and Number of SUspects Investigated by the Police Excluding Professional Negligence Causing Homicide and Bodily Injury, selected years
I-N-u-m-b-e-r-~ Of- 1- Number of Offenses jl ~ate of---;-Number Of-S~lSP- l
Year fenses Known to Cleared by the Cflce : ects Investigated, ______ t~e ~~_~~e_ _ :o~ice _ __ ! __ e~~'~n(96) • by the Police
1946 1,384,222 800,431 58 430,178 1948 1,599,968 808,619 51 535,918 1953 1,317,141 927,012 70 492,214 1963 1,377,476 868,207 63 425,473 1965 1,343,625 812,996 61 '140,563 1966 1,292,091 754,462 58 431,324 1967 1,217,844 690,919 57 400,210 1968 1,231,886 695,101 56 391,091
t]:~~l_ ~~~~:;~! ____ J_ _ ~~~:~~~ ________ ~: ________ :~::~;~_ Comparison of the above two tables indicates that the recent increase trends
in Penal Code offenses can be traced to the sharp rise in offenses caused by prof("s
sional negligence causing homicide and bodily injury. majority of which resuliir,g
from traffic accidents.
It is generally believed that incidence of crime is related to the number of
persons in a popUlation and in Table 3 and 4 Penal Code offenses without the number
included in professional negligence are compared based on the criminally responsible
population.m These following trends are reflected in Table 3 and 4; the rate of suspects
of Penal Code offenses, excluding professional negligence causing homicide and bodily , injury, computed per 100,000 of the criminally responsible popUlation and also the
rate of those convicted in the COUl' of first instance show a trend downward. However,
it should be noted that the rate of the offenses known to the police moved slightly
upward starting in 1969.
~)The Penal Code provides for three types of Negligent Offenses: Simple Negligent Homicide 01' BodBy Injury; Gross Negligent Homicide or Bodily Injury; and Professional Negligence causing Homicide or Bodily Injul'Y. The punishments authorized for the latter two are mOTe severe. « Professional" 11egligence causing homicide or bodily injul'Y was originally adopted to cover negligent homicide or bodily injury ill one's business 01' profession as a medical doctor or ;:. p~'ofessional cm' drivel'. Courts have enlarged the interpretation vf "professional" to inc1ude reckless lllotol'ists whose occunations are other than that of car driver,
n)'l'he criminally responsible population is the general population excluding all person under the age of 14.
-3-

,.
P 1 Code Offense Suspects, PCl"sonslndictcd and. Convicted pe" Table 3. ena b P 1 f lected years
100,000 of the Criminally Responsi Ie opun IOn, s: '"
Year
1946
1956
1967 1968
1969 1970
.. __ .. ~. __ . ---~fe-Col:nputed per .100,000 of t~e I
!~\~~e ~~~~~~',\~:::':lO~;~~;~;Ti~~;~f.(;1e_, 49,572 62,840
77,638 78,677 79,740 80,676
. 874 322 \ 293 2,798 I 331 2,244 840 376 II 547
34 592 2,065 1,0 . , t
2,215 713 \ 2,318 755 I
764 I 2,395
673 717
Table ,1. Penal Code Offense Suspects, Persons Indicted and Convict:d Excluding Professional Negligence Causing Homicid: and nodtl~
i
! ;
Year I
\ \
19116 1956
1967
100,000 Criminally RCSI)OllSible Populilhon, selccted Injury per years
Criminally Responsible Population Unit: 1,000
49,572 62,840
'77,638
I 2,792 \ ~~! \ ~~: \ 265 2,155 I '185 1,569' 515 220 I
78,677 1968 1,566 \' 497 217 \ 181
204 I 167 1969 79,740 1,570 I 470 I 197 I .. , \ 1970) 80,676' 1,583 469 \ _~ ___ L--~--~.,
..... ~_I ___ ~_- .. '" - b b known to the police, In Table 5 the distribution of Penal Code offenses y num er d
b of suspects investigated in 1970 are pracente . cleared by them, and the num er h r theft accounts for 53.8 percent of
Of Penal Code offenses known to tepa Ice, , . h "d or II d b rofessional negligence caUSIng omlcl e
the total number of cases, fa owe Y P d b d'l injury resulting in death bodily injury (33.4 percent). fraud (3.0 pe~cent). ~; 5 :r~:nt, a 2.5 percent increase
(2.8 percent): The clear;nce :1a:::: ;~:~s:a:he ~le:rance rate was higher and in
over the pre~lOus year. or ·a Professional negligence causing homicide or such cases xl was over 90 percen!. f th sus ects followed by theft with 16.2
:bodily injury accounted fa: 64.S :erce~t a o;ens! kn~wn to the police, This fact percent the reverse of thelr relatIonship for ff Until
, he difference in the clearance rate between these two 0 enses. flows from t b d 11 others comprising 30 })ercent of 1964 persons suspected of theft outnum ere a, "homicide or bodily the total but starting in 1964. professional neghgence causmg
d d theft in number of suspects. injury has excee e • detailed examination of trends in Penal Code offenses.
For the purpose of a mo:efive
headings: Property offenses. Offense's of Violence. offenses were grouped unde. d M'scellaneous. Table 6 shows recent Sex Offenses. Offenses of Neghgence. an 1
-4-
(.
TaMe (). Pemll Code Offenses Known to the Police, Cleared by Them and Susl~ects Investigated by Type of Crime, 1970
~-~--~.--. I
1
Offenses
!-------'Theft Robbery Robbery involving' H
1 Injury or Rape
omicide,
Fl'aud
jExtortion Embezzlement
lHomicide including-Bodily Injury (
! those resulting in death) Assault
Cases Known --'--'-\Percent Number of
Total
1,039,118 53.81 1,451 0.1 1,238 O.lj
58,340 3.0j 18,775 1.0j
9,362 0.51 1,986 0.11
50,8361 2.61
32,0281 l,71
Number Rate of Susects of Clear- ,. .. \Pei.cent Cases anee Number of Cleared (%) Total
493,2401 47.5 173,616 16.2
1,130! 77.9 1,175 0.1 1,049
1
84.7 1,670 0.2
90.4\ 16,434 1.5 52,766
1 15,626 83.2 14J 979j 1.4 8,898
1
95.0J
5,973
::~ 1,927 97.0' 2,146,
46,17'1 90.8 61,6751 5.
29,501 92.1 37,8321 "5' u, j se result- 5,161 0.3 4,747 92.0 6,430' 0.61 Rape (including' tho I I ! I
ing' in death) ! I Arson 1,587' 0.\ 1,3551 85.4j 814, 0.1
'Professional Neg-ligence caus- 654,942 33.9, 654,922! 100.0, 695,4471' 64.81 I ing- homicide or bodily jn. 1 I j jury lMiseellaneous 57,577 3.0i 51,352 89.2 55,2791 5.1
1
trends in major Penal Code offenses in relation to the number of suspects investigated
by the police, In this table, the 1966 figures are used as an index of 100 percent.
and deviations annually up 10 and including 1970 are shown. It is apparent from a
quick inspection that negligent offenses have continued to escalate upward, while
other offense categories generally have been downward. The number of :suspects
alleged to have committed fraud, embezzlement, or receiving or buying of stolen
property, showed a continuous decrease between 1966 and 1970, while an increase
was observed for theft in 1970 in contrast to the previous four years.
In general • .offenses of violence have been downward and the number of suspects
of unlawful assembly with weapons has also decreased slightly. In this connection,
the. offense "interference with a government official in the performance .of his duties,"
frequently has a violent connotation. Although somewhat different from the more
typical "conventional" violent offenses, it has also decreased in both cases known to
the police and suspects investigated by them in 1970. The number of suspects in
vestigated by the police has decreased sharply from 7,626 in 1969 to 3.641 in 1970.
This decline was no doubt due to the decline of mass student movements in 1970.
Sex offenses have been downward for the last four years.
While offenses of negligence continues to increase in the case of death 01' injury
-5-

Table 6. Trends in Penal Code Offenders Investigated by the Police by Crime Categories, 1960 -1970 -- -,.-" -~ .. ....,-,.~~ ~- .... ------....... --.~-- - -.~~ ._-----;>,-_. --:~:~~~~-=-~J 1960 1966
1967 1968 1969 1970 Number Index Number Index Number Index Number Index Number Index Number Index' 1. Property Offeneses ---+---
180,899 98 184,432 100 169,699 92 165,901 90 160,356 87 173,616 94
1. Theft 28,743 130 22,075 100 18,785 85 17,'765 80 16,245 74 16,434 74
2. Fraud 12,345 154 8,012 100 6,287 78 6,107 76 5,536 69 5,973 75 i
3. Embezzlement 8,352 174 4,793 100 3,820 80 2,988 62 2,582 54 2,566 54 i
4. Stolen Property 241 81 296 -!QQ 196 66 ~~ 9.~ -~ 108 255 86 '
Bl'each of Trust -'--- -- _ .. _,._--
5. ----219,608 100 198,757 91 193,049 88 185,0~11 84 198,844 91 •
Total 230,580 105
II. Offenses of Violence
A. "Non-heinous" Crimes
38,445 85 45,352 100 44,415 98 42,002 93 38,657 85 37,832 83 . 6. Assault .
83,449 112 74,222 100 73,633 99 71,179 96 66,553 90 61,675 83 . 7. Bodily Injury (includmg' those
resulting in death) 4,388 102 4,320 100 3,762 87 3,381 78 3,055 71 3,026 70 .
8. Intimidation 25,268 133 18,968 100 15,310 81 14,157 75 13,511 71 14,979 79.
9. Extortion 568 72 787 100 724 92 1,051 134 1,871 238 1,250 159
10. Unlawful Assembly with Weap-on -. ....,..~.---.- -------152,118 106 143,649 100 137,844 96 131,770 92 123,627 86 118,762 83
Total
B. "Heinous" Crimes
Homicide (including patricide, 2,844 125 2,278 100 2,225 98 2,297 101 2,351 103 2,146 94
11. infanticide and attempt)
2,983 164 1,824 100 1,377 75 1,280 70 1,247 68 1,1'i'5 64
12. Robbery involving Homicide, 2,577 130 1,975 100 1,766 89 1,694 86 1,688 85 1,Ll'iD 85
13. Robbery Injury 01' Rape
---~.-- -. -,- -----~ --------..-~ 8,404 138 6,077 100 5,368 88 5,271 87 5,286 87 4,991 82
Total
III. Sex Offenses
Pape (including those resulting 8,080 98 8,210 100 8,039 98 7,725 94 6,843 83 6,430 78
14. in injury and death)
2,167 100 2,267 105 2,191 101 2,162 100 2,054 95
15. Indecent Assault (distributing, 5,502 100 5,120 93 5,173 94 4,586 83 5,165 94
16. Obscl:ne Matters selling', etc.)
~.-- -.--.---,._---12,118 76 15,879 100 15,426 97 15,089 95 13,592 86 13,649 86
Total
IV. Offenses of Negligence
Professional Negligence causing 118,937 39 308,731 100 402,368 130 532,400 172 624,849 202 695,477 225
17. Homicide or Bodily I.n~ury
2,087 179 1,166 100 1,070 92 1,117 96 1,013 87 689 59
18. Simple Negligent HCfluClde and: Injury . I
8,476 122 _, 6,940 100 . __ 7,g~ 103 "~.?~ 100 _~~J.54 89 5,g;rr 86
19. Fire Caused by N egbgence ! 129,500 41 316,837 100 410,614 130 540,455 171 632,016 199 702,073 222
Total
V. Miscellaneous
969 138 700 100 638 91 666 95 1,342 192 814 116·
20. Arson 6,050 39 15,541 100 13,221 85 13,729 88 12,707 82 U,258 92
21. Gambling 133 52 258 100 296 115 251 97 320 124 268 104
22. Kidnapping .. 1,949 92 2,112 " 100 1,733 82 1,599 76 1,578 75 1,878 89
23. Forgery & Cour,tel'imtmg' .---.... ----~-~~-.-- -.., --. --.-
- ---.-~~-.--~~~--.~-.-.---. .~---------.. --~~~---- - --.---;---... ~.-,~ No figures were identified f01' .15 and 16 for 1960.
-6--7-
due tel traffic accidents. This seems to be largely due to the increased number of
motor vehicles as will be considered later. ,
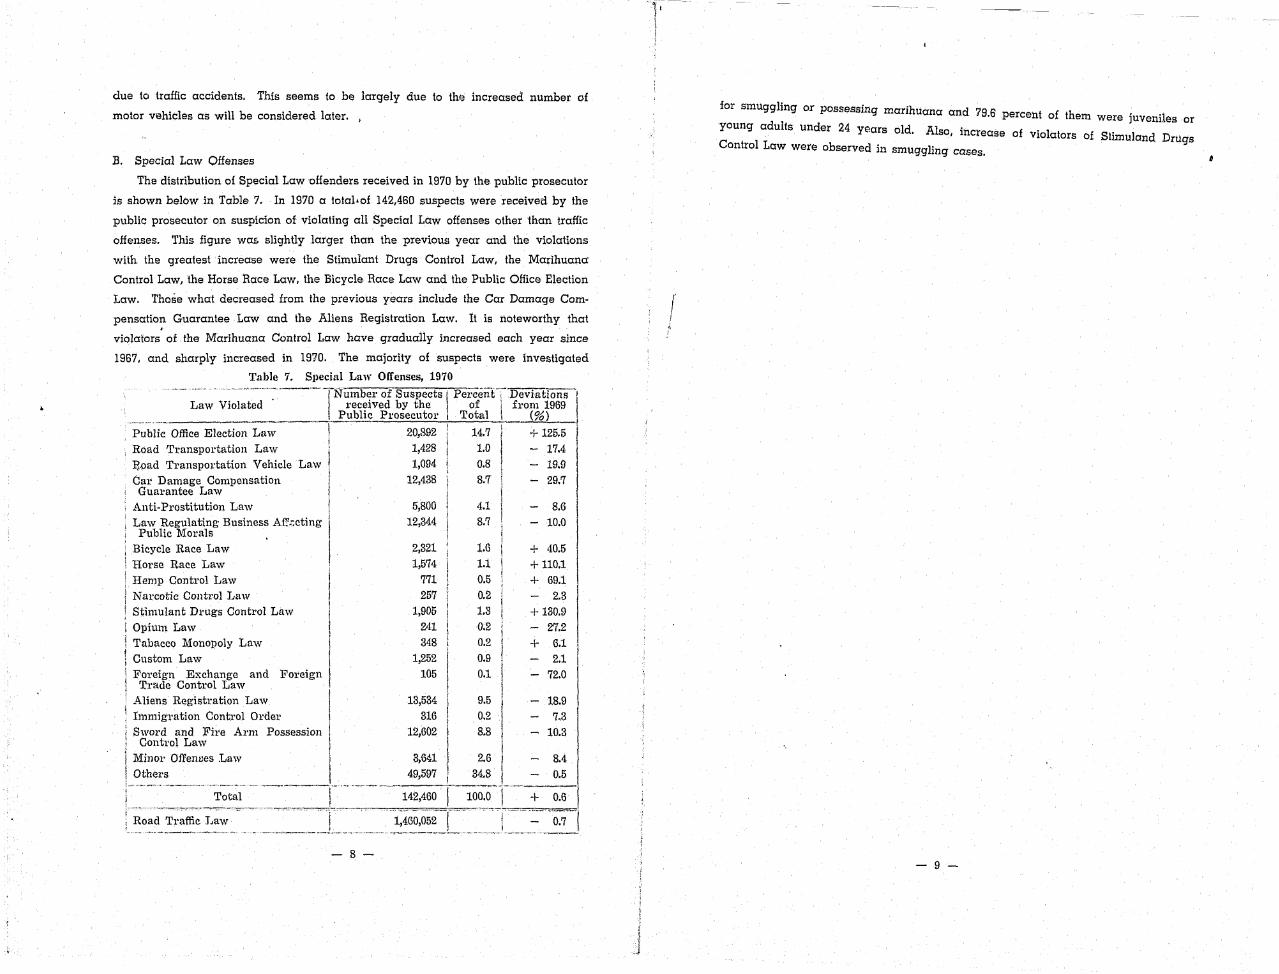
B. Special Law Offenses
The distribution of Special Law 'offenders received in 1970 by the public prosecutor
is shown below in Table 7. In 1970 a totaloof 142,460 suspects were received by the
public prosecutor on suspicion of violating all Special Law l::lffenses other than traffic
offenses. This figure was slightly larger than the previousl year and the violations
with the greatest increase were the Stimulant Drugs Conirol Law, the Marihuana
Control Law. the Horse Race Law, the Bicycle Race Law and the Public Office Election
Law. Those what decreased from the previous years include the Car Damage Com
pensation Guarantee Law and the Aliens Registration Law. It is noteworthy that . violators of the Marihuana Control Law have gradually increased each year since
1967, and, sharply increased in 1970. The majority of suspects were investigated
Table 7. S}leciul Law Offenses, 1970 -- ."". · .. ·--.. "····.-.. ·~·--·--l-Number of Suspects \ Percen.'Ci Deviations
Law Violated . received by the of Ii from 1969 Public Prosecutor Total (%)
Public Office Election Law . I 20,892 II 14.7 \ + 125.5
Road Transportation LaW! 1,428! 1.0 17.4 E.pad Transportation Vehicle Law 1,094 0.8 19.9
Cal' Damage Compensation I 12,438 8.'7 29.'7 Guarantee Law
Anti-Prostitution Law 5,800 4.1 8.6 Law Regulating Business Af.'.~cting 12,344 8.7 10.0
Public Morals Bicycle Race Law Horse Race Law Hemp Control Law Nu.·cotic Control Law Stimulant Drugs Control Law Opium Law Tabacco Monopoly Law Custom Law Foreign Exchange and Foreign Trade Control Law
Aliens Registration Law Immigration Control Order
) Sword and Fire Arm Possession ; Control Law
2,321 1,574
771
257 1,905
241 348
1,252 105
13,534 316
12,602
1.6 1.1 0.5 0.2 1.3 0.2 0.2 0.9 0.1
9.5 0.2 8.8
\
' Minor OffenlJes Law 3,641 2.6
+ 40.5 + 110.1 + 69.1
2.3 + 130.9
27.2
+ 6.1 2.1
72.0
18.9 7,3
10.3
8.4 0.5 i-?~~:·~ ___ .. ~~. __ .~ .. __ .. , __ ~_ 49,597 I 34.8
! Total 142,460 I 100.0 J- + 0.6
;~~~~-__ T~~:a~ffi_~.-:J-.~-~- _ ~.· ___ ._~_L ___ ~._._._1~460~~~r" _- ... J.~~~- '0.7
-8-
j
of them were juveniles or
of Violators of Slimuland, Drugs
for smuggling or possessing marihuana and 79.6 percent
young adults under 24 years old. Also, increase
Control Law were observed in smuggling cases.
-9-

PART TWO: TREATMENT OF OFFENDERS
I. Prosecution and Trial
A. ProsecuEon
1. In 1970, Public Prosecutors' Offices in Japan received') 2,692,414 suspects of
whom 1,089,900 were alleg~\d to have violated the Penal Code. 1,460,054 the Road
Traffic Law qnd 142.460 Special Laws. This total was 10,040 or 0.4 percent less than
the number referred to the Public Presecutors' Offices the previous year.
The number of persons suspe~ted of Penal Code Offenses decreased by 352 or
0.04 percent in 1970. This sligh I decrease is mainly due to a d,ecline in cases of pro
fessional negligence causing bodily injury cmd death in 1970. The number of suspects
of special law offenses increased slightlr by 878 in 1970. This seems T'lated to
an increase in violations of the Public Office Election Law, The numbt:-_ .J! persons
suspected of Road Traffic Law violations decreqsed by 10,566 or 0,7 percent, which is
related to the fact that certain juvenile traffic ofi.;lnses were recently (August 1970)
added to "the Traffic Infraction Nortification Procedure". This procedures permites
certain minor juvenile traffic effenses to' be dispesed ef without reference to the Public
Prosecutors' Office.">
Of all 1970 Penal Code suspects, thOse 'accused of professional negligence causing
bodily injury and death accounted for 62.6 percent of the total and the vast majority
of these involved automobile accidents. This offense was followed by persons accused
of theft (15.9 percent), injury and assault (8.7 percent), fraud (2.1 percent) and
extortion (1.5 percent).
It should also noted that in 1970, of 1,291,437 suspects examined by the Public
Prosecutor (excluding all Road Traffic Law Violators). only 12.6 percent were arrested,
the remainder appeared on a veluntary basis. Of suspects examined by the Public
Prosecutor, 91,320 or 7,1 percent were detained prior to prosecution, and the vast
majority 81.9 percent were detained less than 10 days.'\) In 1970, 62.628 suspects or
"The responsibility for criminal investigation is vested by law with the police, the Public Prosecutor and his assistants. However, after having conducted an investigation of a crime the police must send the case with all documents and evidence to the Public P~'osecutor (Article 246, Code of Criminal Procedure), and only the Public Prosecutor has the power to institute prosecution (Article 247, Code of Criminal P~'ocedure) .Iv. 1969, there were 1,049 Public Prosecutors and 800 Assistant Public Prosecutors in the Ministry of Justice assigned to 628 Public P~'osecutors' Offices distributed among 8 major administrative districts.
MIn detail, see Page 40. U)The period of detention authorized by the court is, in p~'inciple, 10 days. However,
an additoinal extention of detention not exceeding 10 days, and still another of 5 days for certain serious crimes, is available UpO~l separate application by the ptlblic prosecutor (Article 208, 208-2, Code of Criminal Pl·oaedure).
-10 -
68.5 percent of those del' d . aIne Were prosecuted. The rate of persons arrested and
detamed to the total number of suspects has been decreasing the last five years
2. The lotal number of suspecls disposed of by the Public Prosecutor ' ~Hices in 1970 (excluding transfer of cases from one pub}" s
IC prosecutor to another) VIas 2,828,991. These cases were disposed of in 1970 as follows:
Presecution .............•....................•. 1,738,452 Non-prosecution
......... " ••..•.................. 459,463 ( 61.5 percent)
( 16.2 percent)
( 21.3 percent) Referral to' Family Court .... , ..................... 602,003 Stay of diSPosition ............... , ..
. . •.••.•..•.. , .. . 29,073 ( 1.0 percent) Tetal .•......................
. ..•..... , ..•..... 2,828,991 ( 100.0 percent) Of the fatal number prosecuted 108317 (62 )
" . percent were prosecuted thrau h formal public trial, 1,622,454 (93.3 percent) through summary order,~) and 75:1
(0.4 percent) through summary trial proceedings in traffic cases '
3. The ,Public Prosecutor may at his discretion suspend pro;eculion but h t follow certa~n legal guidelines in making this determination. Ho may dec~d:Ut: sus:end prosecution even if the evidence is suf'· :ient to ronvirt, ;f after a careful revle~ of the character, age and situation of the offender, the gravity of the offen the CIrcumstances under which the offense was cemmitted and the condT s:, sequent to the commission of the effense (Article 248 Cod~ of C' , I pI Ions su -he b l' . b ' nmma rocedure)
~ leves It to e in the best interest of SOCiety and the offender to d Th ' exer~lse o.! discretionary power by the Public Prosecutor is based en cri;i:~~ , ~ conslderailons which aim at the rehabIlitation of the if db" . glca lion of him a " . 0' en er y avoldmg shgmatiza-
. s a cnmmal. Of all dicisions of non-prosecution made by Public Pro-secutors m 1970, 378,786 qr 82.4 percent were based on this discretion while 11 5 percent were based on lack of eVidence and 6 0 perceht 'or th ' , 8 h . ,0 er reasons. Table
s ows pe~cent of suspension of prosecution by five categories between 1966 to 1970. ______ 'lablc __ S'_ __ Pc:c~:~~~ __ ~_f Suspension of Prosecution, 1966 -1970
Year I All Offenses Porral cOde~I' -pe~c-~d~;li SP;ci~L~'v; Traffic _ L enses __ ~ffe~ Offenses I Offenses
10.9 30.21 .1 38.41·~------·-~-----~-
10.6 39,0 7.1 13.2 :~.2 38.6 41.8 6.1
1966 1967 1968
18.6 ,9 39.7 40,7 6.9
1970 29.3 40.9 I 40.6 I 7.8 '---_-!.-____ 17.H _____ . 29.7 41,3 39.1 6.1
* Ex.cluding Professional Negligence ca-u-s-I'n'-g'--B--d'l -I~---'- -.-~~ ~- .. -. -. o I y njury and Death.
1969
7JThis is an o~~, gi~;;;~lY tl S --- . .--~--"~~--'--initi~ted by the Public' Pros:cutg~l1~~itK &OUl't folhring informal criminal action conSIders and decides the case on d e ~ou~en of th.e acc1;lsed. The court by the Prosecutor without a public ~~m~~ntalY ,"'hUd !!lat<mal eVI.deuce submitted defendant. 'fhe ou t t h ~rlJ1gs 01 earmg any eVIdence trom th 50,000 yen (308 ~enris c:~i~~len~w~~er, Impose a £lentence heavier than a flne of the charge bj' the court \he defeuda~t'S'f $l)' ~tal' he learns the disposition of If a formal trial is not' requested by thle d:fe,::::r ets ~athY' request a formal trial. order becomes final. an ''VI In two weeksl the court
-11-

B. Trial
1. In
defendants.
1966-70.S)
were rendered on 1,665,308 1970, final and conclusive judgements
f 1 dispositions during the period Table 9 shows the trends in these ina
'fable 9. 'l';ends in Dispositions, 1~_1970. _____ ..
.'~'----" r·------\~1OOG-· "--1967--1 -1968 1969 \ 1970 \
Dispositions 1\ \ 14 \ 11 • 11 \ 14 , Death \ !lumber ClOg , (108) (85) \ (85) (108) \
, mdex \ 65,579 \ 718 I 57,70'iJ I 56(,+~.)5 \ Imprisonment j number \ 72,616 I (90) 62(86) 1\ (79)
• I' index \ (100) \ with PrIson Labour 8 9,252 8,771 9,0f)4 i
. t:. number \ 6,926 t (71,7142) (134) (127) (131) 1 Imprisonme~ (100) without PrIson II index. \ Labour i number 4149,588 \ 4,342,014
I index ' (100) I (105) , b' 253 \ 239
Temporary Penali ~um er (100) I (9 l1) Detention") ! ll1dex \
Minor FinetO) I number 4,230 \ 3(,§~0) ! tndex (100) i I 399 414 ' 492 ,
Not Guilty t number (100) I (104) I (123) \ ! index ill II number 14,036 I 10,906 1°(,67668) I,
Dismissal of (100) (78)
Fine 3,010,518
(73) 209
(83) 3,216 (76)
1,567,357 (38) 143
(57) 3,174 (75)
521 (131) .
7,309 (52)
J.,590,R26 (.:18)
72 (28)
2,709 (64) 623
(156) 5,236 (37)
Public \ index 1 . I ProsecutionJl) I I 27 i 19 19
\ b 28 I 71 I I (68) (68) Acquittal & I nl'nudnelxer \ (100) 1 (254) \ (96) I
Others1") \ \
I-----~'- \ . \ 4430945 \ 3097,111 \ 1,645,014 1,665,308
\
' number 4,248,089 " '(73) (39) (39) Total _~~~ ____ c:~:!!-. _(1_0_4)-,-_~_ ._, .___ -......-'--~
.---~.--.. ---- _.-~'.'-'------'-- ------"
_ .. ____ ... . .... - .. -~.--...... ----.... ----:-.-. ~;ent with prison lab~)Ur, ." ........ ~ . d b la 1Y are death, 1mp1:1S0n t t' nd m1110r s'Punishments prescrIbe . y' fine temporary penal de en lOn, a impl'iSOCnmfintati~l~hf~~ ~~:~re~:~~~f'~uni;h!11enfit (Artiflln9~ P;~~l ~~1:~tion house fine. on sCc t' shall conSIst of con nemen PIC d )
"'Temporary penal deten 10n th 30 days (Article 16, ena 0 e . b t
lQ)rrfil~!lesh~11 bO;' ~~t\~s~1\f~s:ll~~}1~' p~n~liC~d:,nl1~n~l~ ~~ la~~' ~foT~~;~ru~~y
less than 1,000 yen (A~ lC e dOth . )' "
11)~:1~~t;~}r~~~£~i~i~!~:r1 b;l'~~~~t~~~t~~~:!~~~~~:i~~~'~~!a~E:~s f:~i~~e t~~ serve a coPY of the l~for~na 10~ on . prosecution has been l!lstt~ut~~formation, even if true, do not constItute any
") Where all the counts 111 e I 11 specific offense; 'thd' by the public prosecutor; . t
iii) Wher~ prosecution has b~en w: l:.awn a 'udicial person, has ceas~d .to eXl~ ; iv) Where the accused ha~ dIed, ?l:, bel?;g ~Article 339, Code of Crlllunal PIO-
) Where the same case IS pendmg t" .ce. . v cedure) . h 11 be made by judgement in the followmg cases:
D!)!lliWh~l~f !~~~~~~~~ ~o ajurisdic.tior.t1ed ~~f~e~c~ff~Jrawal without newly dis-.~) Where prosecution ):las been lUS 1 U e c ... , ..................... : .. 11 covered material e!,ldenc~;h rosecution was instituted, another prosecutlon ... ) Where on a case 111 WhlC a P . III . b' ouened in the same court. .' void by reason of its havmg iv) ~~er:tIle procedure for .i~stitu~ir1.pro~h~~:t~~ I(Article 338, Code of Criminal
been contrary to the prOVIsIons Ie a 111g
Procedure) -12-
1
I J
In 1970, 623 or 0.03 percent of all defendants were found not guilty and convictions
were obtained in 99.6 percent of all individuals brought to trial. This rate of con
viction has been more or less stable in recent years. The decrease in the number
of imprisonments without prison labour in 1969 seems related to the many cases in
which imprisonment with prison labour was imposed in cases of professional negligence
causing bodily injury and death in trafic accidents following the amendment of
Article 211 of the Penal Code, 1968 which authorized this penalty. The number of
fines imposed in trafic violation cases, continued to decrease sharply in 1969 and
this is probably related to the implementation of the new "Trafic Infraction Notification
Procedure" system which has been functioning since July 1968. This procedure
authorizes the disposition of milJor trafic infractions without their being referred to
the Public Prosecutor.
2. A total of 49,119 defendants were tried and processed through formal pro
cedure in the District Courts in 1969,'") The average time between the referral of
a case to the court and its disposition by the court is as follows; 49.9 percent within
three months, 29.3 percent within six months, 12.3 percent within one year, 4.8 percent
more than one year but less than two years while 1.5 percent required more than two
years and 2.2 percent ·three years or more. The Summary Courts processed within six
months 88.9 percent of the 27,352 defendants who were tried on minor charge during
1970.
3. Table 10 shows the distribution of sentences tq imprisonment with and without
prison labour in 1970. Slightly more than half, 50.1 percent of persons incarcerated
with prison labour were for one year or less followed closely 40.4 percent by sentences
of more than one year but less than three years. The use of short sentences is even
more pronounced in imprisonment without prison labour where 93.4 percent of the
individuals who received this disposition had sentences of one year or less.
)2) A pronouncement of acquittal shall be made by a judgement in the following' cases: i) Where a final judgement has already been l'endexlFdj
ii) Where the punishment has been abolished by a law 01' ordinance enforced subsequent to the commission of the offense;
iii) Where a general amnesty has been proclaimed j IV) Where the period of limitations has been completed. (Article 337, Code of
Criminal Pl'ocedUl'e) l:"Summary'Courts and District Courts are first· instance trial courts and there are
49 District and 570 Summary Courts in Japan. The District Courts handle all cases in the first instance except those specifically coming unde~' the jurisdiction of other courts. The Summary Courts handle minor criminql cases. While in genel,'al, Summary Court do not incarcerate persons charged, they may impose imprisonment with prison labour not exceeding three years in certain specific cases enumerated by law.
A party who is not satisfied with a decision by trial courts of the first instance, may appeal to the High Court. Appeal may be made from decisions of the High Court, provided certain reasons Pl'escribed by law exist. This second appeal is to the Supreme Court of Japan which is the highest court and the court of last resort, with power to determine th.e constitutionality of any law, order, regu.1atioll 01' official act.
-13 -

Sentence, 1970
1-5 years 110 years'l' fo'years or less or ~ss over
Ttlble 10. Distribution of Prison
'rn1prisoiiilien t '-'\ Total I ;r~:~ \ 3o:i~~~ for limited term
with prison la our, cioo) * (50.1) (40.4)
without prison ! 2,440 2,280 160
1,590 (6.5) ,..~ b I 24471 12,257 \ 9,879
I (100) (93.4) (6.6) labour i , ___ ,~~ ___ . ,.' ---.-.. ------
663 82 (2.7) (0.3)
,;, Fi-g~~:;;-jn -;~r~:th~;es show percentages. _ d · J n 1905 and its use
4 The use of suspended sentence was introduce III apan 1
b· d d by amendments to the Penal Code increasing the number of
has een expan e d d 11) Thus the number of suspen e
defendants eligible to receive a suspended sentence. ,
s"'ntences has increased yearly. f . - . d t - r-soument by courts 0
I 1969 of the 66,257 persons who were sentence 0 Imp 1 n , . d d ntence The use of
iirst instance, 37,694 or 56.9 percent receIved a suspen e se .
suspended sentences by crime
victed is presented in Table 11.
category in relation to total number of persons con·
Ta~le 11. Percentages of Suspended Sentence wi~hin the Total Convicted Defendants by Categroy of Major Crmles, 1969, ' ~." _',
_.... C I
I Tota1 Number Number of ..B_ With Probation- -B' :
Offenses of Suspended A ary Supervision I
\
the Convicted sentences (0') (C) (96) I (A) (B) /0
579 504 87.0 I 31 \ 6.2 \ Interference in the .
I I Execution of Officml Duties
Bribery: offering & accepting
, Arson
! Pape
i Homicide
Bodily Injury
Bodily Injury Result-: ing in Death
! Professional , , N egIigence ., i ! causing HOlluClde &; I Injury
359
190 i I
1,207 : I
960 I 4,341 \
366 \
I 10,2771
\
:
338! 94.1 \ I
94 i 49.5
571 47.3
271 28.2
2,374 54.7
133 \ 36.3
6,825 66.4
22 008 I 12,067 54.8 , , ! Larceny , I 467 I 133 28.5
\
• Robbery I 4 n25 \ 2,113 44.7 Fraud ,I
3,728 2,166 58.1 i Extortion , t 1,409 934 I 66.3 ! Entbezzlemen ~, ___ ...l ___ -':'-.-J'------l.--"'!-'--
_I 0: I \
18 \ 19.1 \
228: 39.9 I 34 12.5
625 26.3
16 12.0
543\ 8.0
I
2,520 73
441 662
93
20.9 54.9 20.9 30.6
10.0
. ~ ... ---~ , hies a sentence of imprisonn1ent of three 1l)FfJr example, any first offenuer w °t_rece f his sentence by the court. A defendant
years or less !!lay be gl'anted sUSPbntIOnh~ has not been sentenced to il}lprisonment who was convIcted of an oH;ence u ''it ution of the former pumshment \yas within five years ;from the tIbme ,;h\n dt : ~;;;~nded sentence by the court (ArtIcle completed 01' remItted may e gran e 25, Penal Code).
-14-
The courts revoked 3,175 or 8.3 percent of the 38,204 suspended sentences given
by them in 1970, 3,082 committed. an additional offense within the period of the
suspended sentence. Of those committing an additional offense, 34.8 percent did so
within six months, and 60.1 within one year.
II. Correctional Institutions
Correctional institutions are not only places penalties imposed by courts are
carried out but places where offenders may learn the attitudes and skills needed for
a useful community adjustment after release. Since 1948, to reflect this dual purpose
prisons, reform and training schools as well as other penal in'stitutions have been
referred to as "correctional institutions." In Japan, there are 7 major Detention
Houses in the larger cities, 104 branch detention houses in smaller cities, 57 major
prisons, 9 branch prisons, and 9 juvenile prisons.,ol
A. Admissions and Releases
In 1970, 7l,Oas persons were admitted to all types of correctional institutions.
Of this number, 33,933 were initially admitted as suspects and 19,975 of them became
defendants while in the institution, and 27,584 were initially admitted as defendants.
21,307 of all defendants were eventually sentenced to imprisonment by the Court and
incarcerated in some institution. Consequently, only a relatively small number of
persons were initially admitted as conVicted prisoners.
The total number of admissions as convicted prisoners in 1970 was 25,890 the
smallest annual figure since World War II. Of this number, women accounted for
568 or 2,~ percent. The annual admission of convicted prisoners has been on a down
ward trend with some fluctuations since 1948, when there were 69,899 persons admilled
as convicted.
Of the 1970 total, 23,401 or 90.4 percent were sentenced to imprisonment with
prison labor and 2,418 or 9.3 percent were sentenced to imprisonment without priso~
labor. Of persons sentenced with prison labor, 48.7 percent had a sentence of 12
months or less; 30.6 percent 1-2 years; 10.5 percent 2-3 years; 9.9 percent over 3
years and 0.2 percent a life sentence.
Of the 25,890 new admIssions as convicted prisoners in 1970, 47.3 percent were
serving a prison sentence for the firsl time, 16.8 percent the second time; 10.3 percent
the third time; 7.3 percent the fourih time; 5.2 percent the fifth time; while 13.2 per
cent had a history of serving more than five sentences. The 47.3 percent or 12,249
ltlThe total of 16,499 personnel were assigned to these institutions in 1970. The number of positions Were divided as follows: Exectives 332; Captains 761; Assistant Captains 1,170, Senior Guards 2,573; Guards 9,547; Vocational Instructors 560; Medical and Psychological Specialists 452; Teachers 116; and other kinds of workers 1,020. (The figures for, Executives and other kinds of workers is for 1969.)
-15-

. . 1· d d 20 a percent who had C( previous history of corrective educative first termers mc u e . . t
. e probation or retention in a reform and training school, and 30.3 percen. measures, 1. •
had previously received a suspended prison sentence. . were newly convicted is
The breakdown of offenses for which these pnsoners
given in Table 12.
Table 12. Admissions by Type tlf Offense, 1970 -~------ -·-----N~~b~-;_of,.-Pe~~f Offense prisoners Total
Pen!.\l Code Offenses:
Theft Robbery Fraud Extortion Embezzelement
Rape Sexual Indecencies Bodily Injury and Assault Professional Neg-ligenc.e
Causing Death or InJury
Intimidation Homicide Arson Intrusion Upon Habitation
Violation of the L~w for Punishment o~ Violent Acts
Others
(Total)
Special Law Offenses: Violations of;
Narcotics Control Law; Stimulant Drugs Control Law;
Anti-Prostitution Law; Road Traffic Law; Other Laws.
(Total)
9,889
782
1,833
1,199
305
1,173
244 2,391
3,817
67
728
158
155
917
1,113
(24,771)
16
120
208
406
369
(1,119)
25,890
38.2
3.0
7.1
4.6
1.2
4.5
0.9
9.2
14.7
0.3
2.8
0.6
0.6
3.5
4.3
(95.7)
0.1
0.5
0.8
1.6
1.4
(4.3)
100.0
, i
Gross Total -----------------
i , i
\ \
\
The average daily population in prisons and detention houses in 1970 was 49,209,
1 d d · thO 49 209 are 1 105 females or down 3,528 from the previous year. Inc u e In IS, 'd'
I L'lmiting the average daily censuS to sentence pnsoners, 2.2 percent of the tota .
. . ddt 40917 3 521 lower than the daily average sentenced prison. the figure IS re uce 0 , "
The average daily population trends are shown in Table 13. population in 1969.
-16 -
.... jl
Table 13. Average Daily Resident Population, Prisons and Detention Houses, 1966 -1970
l-Year I J j
Prisoners Serving Sentences
Suspects W ~rk-House* Detainees
·-·---·-~-----I
> __ '~4 __
~
1966
1967
19G8
1969
1970 I >-',----
& Defendants
------~.-- -- .. ~-.-...-.-- '_"--_.-
53,736 9,910
51,928 8,444
48,094 7,787
44,438 7,9G8
40,917 8,010 "'"------~ --~----
Others Total 1
- -- --"~~-'~- '--~'~~---
445 108 64,199
356 109 GO,837
277 99 56,257
234 97 52,737
189 93 49,209 i
-~-.---
* This is a place of detention within a prison, where a convicted person who failed within the specified period to mal<e full payment of any fine imposed, serves a term in proportion to the amount of the fine which he was unable to pay. The legal maximum of such detention is 2 years.
In 1970, a total of 28,870 prisoners were released from prisons or detention houses
after serving all of their sentence or a portion of it. Of this number, 17,848 or 61.8
percent were released on parole, and 13,263 persons or 45.9 percent had served 12
months or less when released; 9,135 or 31.7 percent 1-2 years; 3,533 or 12.2 percent
2-3 years; and 2,939 or 10.2 percent over 3 years.
Both of the number of inmates released after completing their sentence and those
released on parole have been declining each year since 1968.
B. Treatment of Convicted Prisoners
1. Classification
All in."llates after admission receive a general orientation to institutional life as
well as further classification and investigation to determine both a suitable institution
and 'an appropriate treatment program. There are eleven major classification areas
and corresponding types of institutions or sections of institutions for each classifica
tion. These classifications are based on ·sex, age, type of sentence (i.e. whether or
not under'prison-labor), length of sentence, nationality, mental, physical and per
sonality traits, and the prospect for reformation. The degree of security required as
well as other factors are also considered as 'sub-divisions. The Major classification
categories and distribution of inmates among them at the end of 1970 are given in
Table 14.
2. Education
In prisons, opportunities are provided inmates to pursu~ correspondence courses
and in 1970 a total of 4,429 prisoners took courses in bookkeeping, automechanics,
mimeog!aphing, electronic engineering and other vocational subjects as well as
general academic courses for high 'school and college credits. Education in prisons
itself is concentrated on certain basic tool subjects with its primary purpose to eliminate
-17-

Table 14. Inmate Classifications, As of December 20, ::!_O _____ _ .------ --- --~- Number of Percent of
Classification prisoners Total I , I . - -~ose of generally normal personality , . who have good prospects of reforma-
6,693 17.2
tion B . Those of generally quasi-normal per-
· sonality who have pOOl' prospects of reformation
C . Those who have a long term sentence · (generally more than 8 years)
D . Juvenile prisoners (under 20 ye.ars of · age; the Juvenile Law applIes to
them) E :. Those generally under 23 .yea~·s of ~ge
who need to be treated lIke Juvemles G : Of A-class prisoners, those under 25
years of age H : Mentally disordered prisoners
J : Females K : Those \VIIO need medic!!l tl'e.atment
and care due to phYSIcal dIseases, defects or senility
1\1 : Foreigners
18,833
3,463
623
700
4,397
1,323
817 700
39 1,323
48.4
8.9
1.6
1.8
11.3
3.4 2.1 1.8
0.1 3.4
N : Those sentenced to imprisonment without prison labor __ -----.-... -.-.~----
Total 38,911 100.0. ~ -- --.. ~ --.-..--- --~-"---~-~~.-.---~------.- .. ---
. . h re compulsory education illiteracy. The only exception is in juvemle pnsons we.
courses are provided consistent with the requirements of the School EducatIo~ ~aw .. . d 'th' prisons with partIcIpatIon
Cultural and recreational activities are orgamze WI m . . .
the authorized public. In 1970, there were 1,0lD Voluntary Prison VIsItors w~o by . It I educational and socIal made a total of 9,887 visits to assist prisoners 111 cu ura,
welfare programs as well as with individual problems. The number of Voluntary
1,224 who conducted 9,699 individual and 6,725 groups prison Chaplains in 1970 was
interviews with inmates.
3. Prison Industry and Vocational Training d t' . onment
mb 31 1970 91 7 percent of the prisoners sentence 0 Impns On Dece er, "
. d t rk W 92.9 percent of inmates sentenced to with prison labor were a.ssIgne 0 wo . . . imprisonment without prison labor elected to work; 3.1 percent of the per~~ns awmtmg
trial and 83.8 percent of the workhouse detainees also elected t~ work ..
1 1 f the Products of prison industries includmg agncultural pro-
The tota va ue 0 .
------¥-----~~- ..... _ ... __ . ---..- ---.- - - ---:----- ntence;'to-i;~~;is~nment with prison lO)The Penal Code pl'ovides that the Pl'lson:rd se 0 Those not assigned to work were
labor has an obligation to work bnd mus f o'~k~ess disciplinary action, or transfer. temporarily exempted f~om l.abor ecaui:!eho ~l rison'labor, and those awaiting trial
1;)Prisoners sentenced to Impr.Isonrr~~nt l'I~o .ub~t are allowed to work upon request. are not obliged to engage 111 prIson a I,
-18-
duction in 1969 was 7,013 million yen (19.480,555 U.S. dollars).'S) The operational
cost of those industries was 2,317 million yen (6,436,111 U.S. dollars). In re}atipg
the value of production, cost of operation and man-days worked by type of industry,
in woodcraft, for example, 987 million yen was invested with the value of production
L 710 million yen, 24.4 percent of the total of prison industries. The woodcraft in
dustry during the same year had 8.1 percent of the total man-days worked as shown
in Table 15.
The total production value by type of industry in 1969 was 48.6 percent manufac
turing; 29.4 percent labor; 22.0 percent maintenance work.
Through the prison's vocational training programs in 1970, 1,514 prisoners passed
national or municipal examinations and were qualified or obtained licenses in such
fields as welding, driving, auto repairing, boiler operation, electric wiring, barbering,
etc. Also, 293 prisoners attained certification of vocational training authorized by
the Minister of Labor in such fields as woodcraft, printing, plastering, etc.
4. Security in Prison
In 1970, 246 prisoners were indicted for offenses committed while in the prison
and 196 of them involved a charge of bodily injury. The same figures for 1969 was
257 inmates indicted and 203 on charge of bodily injury.
During 1970, there were 29,104.instances of disciplinary action and the main
ch",ges included; assault against an officer or prisoner (19.4 percent), possession
or trafficking of contraband (13.0 percent), disobedience of officials (12.3 percent),
refusal to work (10.3 percent), and possession of Cigarettes (5.7 percent)!") Also,
there were 19 escapes in 1970.
C. Treatment of Alleged Suspects and Defendants·O)
The average daily population in 1970 of suspects and defendants was 8,OlD. There
were 53,517 defendants who were detained in institutions and whose trials were
. completed during 1969. Of this number, 40.6 percent had been in the institution less
than one month when the trial was completed; 30.7 percent 1-2 months; 14.2 percent
2-3 months: 11.1 percent 3-6 months; 2.8 percent 6-12 months; and 0.6 percent more
than 1 year.
D. Women's Guidance Home
15) At the old <Jj{change rate of 360 yen to one U.S. dollar. . 10)l\1ajor disciplinary punishment authorized are (1) reprimand, (2) prohibition of
reading books and seeing pictures for three months or less, (3) suspension of physical exercise for five days or less, and (4) solitary confinement for two months or less.
In Japan, smoking is legally prohibited for prisoners. "0) Alleged suspects and defendants are detained to insure their availability at the
time of their trial and in some cases to prevent their destroying evide:J.ce. The.y are detained in a section separate from convicted prisoners, and the principles and methods of treatment for them are substantiaHy different from those for convicted prisoners.
-19 -

l
'rable 15. Production Breakdown-Prison Industrie_~~~.~:6:_~ ___ ._
Type of Industry Cost Value* Total Worked Total
"--".-- \ AnnuaT-----Percent Total Percent \
\
Ann~al Produ(\tioh of Man-days of
(¥ 1,000) (¥ 1,000)
1 __ ·-.---------- I 987,807 \ 1,710,638 24.4 982,588 8.1 I Woodcraft 143 661,483 5.5 !, Printing 298,484 1,000,848 .
92,091 744,<106 10.6 1,316,396 10.8
i, Tailoring 32 2 094 340 i 330,488 1,628,1)40 2 . "
\ Metal Work 1 36 205,790
17.3
, . 1 92,429 254,90 . \ Farming & Amma
1.7
: Husbandry , 8,148 30,7,48 0.4 12,111 0.1
, Felling & Charcoal Making
Forestry Conservation , Chemical Industry Paper-making Paper-craft Knitting Hosiery Ceramics Leather Work Spinning & Weaving
Bamboo-craft Straw-craft Food Processing
Others Works Outside
Compound Vocational Trianing
2,105
39,906
133,715 3,297
392
67
50,146
82,184
14,337
7,495
1,139
4,892
2,978 I
986
134,162
37,85,2
108,167
202,502
276,834
33,962
15,505
104,884
338,693
97,532
22,007
3,323
8,133
179,680
100,023
113,982
0.5
1.5
2.9
3.9
0.5
0.2
1.5
4.8
1.4
0.3
0.0
0.1
2.6
1.4
1.6
o
9,761
122,113
84,931
1,393,672 87,491
111,521
72,769
412,124
225,012
34,660
13,692
7,728
633,208
135,719
502,434
3,017,456
0.1
1.0
0.7
11.5
0.7
0.9
0.6
3.4
1.9
0.3
0.1
0.1
5.2
1.1
4.1
24.8 Clerical & Maintenance i Wo~s I 0 0
Common to All works 30,713 t -\
\ 100.0 12,136,999 100.0 __
Total \2,317,957 7,013,569 ___ . __ _
-.~.--.---". th 1000 yen are not included. ,~ In this Table, fractional sums of less an , • l' h d' 1958 to
There are three Women's Guidance Homes in Japan,-') estab IS e ,111 , •
f nvicted under the Anh-proshtuhon rovide programs for women over 20 years 0 age co . d of
PLaw Persons convicted under this statute may be confined for maximu~d peno d . d' 1 daily gUl ance, an
6 months. Treatment in these institutions includes me lca care, . t be released on parole.
vocational training. All 1I1ma es may H h declined from the W n's Guidance orne as
The number of admissions to orne f d ' . 1970 One factor in the decline 0 a mlS-
h' h f 408 in 1960 to only 49 persons 111 • • I ~g 0 be the decrease in the number of investigations by the pohce. n
Slons appear,s to. d 1 4720 approximately one-third of the 17,729 investigated 1970, police 1I1veshgate on y ,
cases for 1959. _,-----, .,----,.-. , --d'--:-- Mar'ch 1971 because of the decline
--.' d d·t operatlOns urmg m , 2110ne of them l1as suspen. et d1 ~ Ie inmates.
in the numbers of conV1C e ema
- 20-
An average inmate in 1970 was between 30 and 44 years, serving her first term,
and whose I.Q. was below 70.
lII. Probation, Parole and Aftercare
A. Parole
Parole is granted by one of the eight District Offenders Relhabilitation Commis
sions."2) An inmate is eligible for parole when he meets the following stipulations: 23)
(1) Served at least one-third of his given sentence or ten years of a life
sentence;"")
(2) When he is considered penitent;
(3) When he is considerod not likely to commit another crime during the parole
period;
( 4) When it is believed that the community will emotionally accept him on
parole.
The chief executive officer of a correctional institution can file a request for parole
on behalf of inmates, or the commission itself may initiate a parole investigation.
After a commissioner investigated the parole application, the ca'se is presented to
the commission consisting of three commissioners. The case is discussed and a final
decision made by majority vote.
At any time after an inmate is admitted to a correctional institution, upon request
from either the institution or the District Offenders Rehabilitation Commission, a pro
bation officer at the ProbatiOiL-Parole Supervision Office visits the inmate's family,
or any other person named by him as having close ties to him. This process usually
starts soon after the inmate has been admitted to a correctional institution. The
probation officer investigates and starts to prepare the environment for the inmate's
return to the community.
There are 49 Probation-Parole Supervision Offices in Japan. These offices received
a total of 36,338 requests for investigations and adjustment from correctional institu-
~!!)District Offenders Rehabilitation Commissions are located in each of the eight administrative districts in Japan. Inmates are considered for parole by the D.O.R. Commission in the area where the institution where they are confined is located.
~")Parole from a Reform and Training School is authorized by the D.O.R. Commission. The general criteria utilized in making this determination is that an inmate has reached the highest degree of treatment and his rehalJilitation through parole supervision can be expected based on an evaluation of his personality, behavior, attitude and ability, achievement in the institution, and from his' surroundings in the community.
~i)Parole may be granted for a juvenile sentenced to imprisonment with or without prison labor when the following stipulations are met: (1) seven years in case of lifetime sentence; (2) three years in case of a penalty for a fixed term imposed under the prDvisions
of Art. 51 of the Juvenile Law; (3) one-third of minimum period in case of a penalty imposed under the provision
of paras, 1 and 2 of Art. 52 of the Juvenile Law.
-21-

lions during 1970. These offices provided 33,180 initial reports and 48,858 follow-up
reports as a part of the basic data used in parole examinations. The number of
reports was 'slightly less than the previous year.
An experimental program was developed in 1966 in several of the juvenile cor
rectional institutions 10 provide additional service to District Offenders Rehabilitation
Commissions. A probation officer attached to the D.O.R. Commission~G) visits the
correcti':>llal institution on a regular, systematic basis to collect information for the
parole hearing. He interviews inmates and discuS'ses their problems with correctional
officers. This investigation is started soon after inmates become legally eligible for
parole even if a parole application has not been filed. This program was expanded
in 1971 to include inmates in some adult correctional institutions.
During 1970, 17.861 inmates were released on parole, a slight decrease from the
previous year. During the year, 7.8 percent of all applications for parole were re
jected as compared with 8.2 percent the previous year. Inmates rejected for parole
are discharged upon exipiralion of their sentences. Of the 28,870 prisoners discharged
during 1970, 61.8 percent were released on parole and 38.2 at the expiration of their
sentences. The percent of persons released on parole has gradually increased each
of the past five years.
Figure 2 shows that prisoners who have served the major portion of their sentence
are more likely to be s'ranted parole than those who have served less of their 'sentence.
It also expresses the greater caution in. granting parole to recidivists. This pheno
menon may be explained by the perceived increased risk of recidivists committing
additional crimes and t~e greater liklihood that their backgrounds include deprived
familial and social environment.
The parole rejection rate from Reform and Training Schools shows a slight changes
in compa~ison with the previous 1.ear when it was 0.4 percent as compared with 0.2
percent for 1970.
Parolees from prisons tend to remain longer in the commUI'.ity and less likely to
be recommitment to a correctional institutions than inmates rele\tsed upon termination
of their sentences. For example, within the same year as their release, only 4.3 per
cent of the parolees committed additional crimes, compared to 11.6 percent of the
terminated cases. Only 29.4 percent of parolees committed another crime within five
years of release as compared with 48.4 percent of the terminated cases. Strictness in
granting parole to recidivists and the impro'l-ed use of parole supervision techniques
.0) A total of 80 probation officers were attached to District Offenders Rehabilitation Commissions at the end of 1970. They function to assist members of the D.O.E. Commissions in discharging their parole responsibilities. Their dities do not include either probation 01' parole supervision of either offenders or Volunteer Probation Officers, although they must possess the same qualification as probation officers attached to a Probation-Parole Supervision Office. '
-22 -
Figure 2.
j'crcent of Sentence Ser\'ed
Parole by Percent of Sentence Served, 1970
r==J NOIl·rcc:lcli\·i8t
["':):·'···"·"1 Hccidil"ist
70 - 79 1T1f::-::-----.J-] 2'3.5 ,,0.9
60~ 69 P'1.4 1).1
_ 59 0.4 0.1
o 10 20 30 40 50 60
----;:l>- Percent of l'ilrolcl!s iO
may be advanced as the main reasons for this wide difference.
B. Trends in the Use of Probation and Parole
I
80
Probationers from the Family alld C' . 1 C . the " " . !lmma ourts as well as parolees are under ff supervISlolL of the 49 Probation .. Parole Supervision Offices and their 19 branch
o I!:es. T~ere are 729 probation officers assigned to these offices who are res onsible for supervIsory services. Also involy.sd in pro bar d I' " p
th . Ion an paro e supervIsIon services are e unpaId volunteer probation officers c""'pointed by 'he M' - t f J . th 7 J:'. mls er 0 ushce In.
.e 6~ Prcb~tion areas throughout Japan, there are nearly 50,000 appointed volu~teer probahon offIcers whose main function is to" k f . , ma e up or what IS not sufficient in th.,.
work of the professional probation officer " •• ) P f - 1 -I . . ro esslona s and volunteers wo:rk in
c ose cooperation in supervising cases.
The following classes of persons are under the supervI's'lon P of the Probation~
arcle Supervision Office for a speCified period of time:
Category 1:
Category 2:
(Juvenile probationers)
Juveniles placed on probation by the F '1 C amI y ourt; until reaching age twenty or for at least two years;
(Juvenile parolees)
Parolees released from Reform and Trc;zining School; Until they
reach age twenty or for remainder of specified period qf confine-ment;
Category 3: (Adult parolees)
;~)~.\~:ti;le-2·o;;f' th~ . ·Off~nders RehabiUita ti~~" L~~~-- 23-

Parolees released frem prisens; fer the remainder .of their sentence;
Categery 4: (Adult prebatieners)
Persens granted prebaUen upen the suspension of execution .of
sentence; fer the peried .of suspension;
Categery 5: (Wemen's Guidancf~ Heme Parolees)
Parolees released frem Women's Guidance Hemes; fer the re
mainder of the term of gUidance.
Indicated in Table 16 are total number of persens in each .of the abeve categories
received at Probation-Parele Supervisien Offices threugheut Japan frem 1966 te 1970.
3.9 percent .of the cases added in 1970 were female and 48.1 percent .of them were
juvenile prebationers.
Table 16. Numerical Tl'i)nds in Probation and Parole, 1966 - 1970
Category L_~~~ __ 19_6_7_
1 (Juvenile \ 30,647 29,055 probationers) I
2 (Juvenile pal'olees) )' 3 (Adult Parolees) 4 (Adult probationers) 1 5 (Women's Guidance!
Home parolees) ,
Total
13,423 18,953
8,513 6
C. The Results of Probation and Parole
6,240
19,871
7,779 5
62,950
."0 .. _ ...... _._ ... ___ ., •..•.. __ .•
1968
. 28,549
5,016
19,534 7,542
2
60,643
19G9
25,999
3,895 19,171
7,161
2
56,228
1970
27,383
3,167
17,861
6,908 1
55,320
Probationers and parolees who maintain a good community adjustment, may be
exempt frem supervisien hy the decision .of the Prebatien-Parele Supervisien Office
or the District Offenders Rehabilitatien Cemmission. In 1970, 10,355 juvenile pre
bationers were discharged from prebatien .orders by the decisien of the chief .of the
Probatien-Parole Supervisien Office. This included 35.5 percent .of the juvenile pro
bationers who terminated their prebatien terms during the year.. For the Read
Traffic Law violaters ameng j~.venile prebationers, the percentage of discharge en
geod behavier is even higher, 57.9 percent of total terminatiens .of juvenile probatieners
in this categery during the same year.
The chief of the Prcbaticn-Parcle Supervision Office is also expected to lake action
against those perscns whc make a peor adjustment and appear to be serious risks
likely commit anether offense. The number of these determinations seems fairly
,small especially when compared with the number of probationers and parolees dis
posed of by the varieus ceurts because of crimes or delinquencies committed during
their supervision. Table 17 indicates the number of probatieners and parolees who
cemmitted additional .offenses during their period .of supervisien by type .of dispositien.
-24-
i
J
Of the numbers listed in Table 17, 28.7 percent of the juvenile probationers, 43.2
percent .of the juvenile parelees, 65,0 pe;cent ei the adult parolees, und 30.0 percent
of the adult prebationers cemmilled additional offenses within 6 months after being
placed on prebatien or parele. This reveals the crucial nature of the initial phase
of supervision when a persen may benefit from mote lntnesive supervisien. The rate
.of abscenders frem snpervision has been mere-or-less censtant fer the past five years as indicated in Table 18.
I! is significant that the percent .of transfer Cases among probatieners and parelees
has steadily increased the past five years, reflecting the incre~lsed mebility .of the
Japanese population. This mobility was particularly high ameng juveniles. In 1970,
23.4 percent .of the juvenile prcbationers, and 23.5 percent .of the juvenile parolees
were transferred frem one PrebatilJn.Parole Supervisien Office to anether. The cel'
responding figures fer adult parelees and probationers was 7.5 and 25.6 percent respectively.
D. New Programming in Probatien and Parole
As mentioned earlier, prebatien and parole supervision l.'l discharged by 729
professienal probation officers in ceeperatien with almest 50,000 velunteer probation
officers. The average caselead per professional probation .officer at present is ap
pleximately 200 cases. Since careful, intensive supervision and treatment .of indi
viduals assigned te the case load .of prefessienals weuld be impessible, volunteer
prebatien .officers' are utilized te assist the supervisien and treatment of prcbaticners
and parelees. Usually, twe probatieners .or parolees are assigned Ie a velunteer whe
under the guidance of a professional does a large part .of the cemmunity supervisien and treatment in probation and parole services.
Te improve services to prebalieners and parelees as well as meeting the challenges
to supervisien created by changing social cenditiens, several new community approaches have recently been attempted.
1. A new preject was started in 1965 in the Probatien-Parele Supervision Offices
in Tekye, Osaka and Nagoya. In this preject, fer the first twe menths .of supervisien
of selected juveniles and young adults, the prefessienal prebatien .officer assumed
fuII respensibility for diagnesis and treatment, without referring them to volunteer
probation officers. After the direct supervisien and treatment by the professienal pre
batien .officers, the individual is then assigned te a velunteer prebatien .officer. The
number of persons whe have participated in this pregramhas been relatively small 10 date.
2. The sl'1cond pre gram was star led in September 1967 and is refered te as a
"Differential Treatment Prcgram." In this experimental preject, the persons en the
caselead are differentiated intc three groups accerding to their need fer the time and
~ 25-

Total
Imprisonment with labor: 1,576
8
2,481 8
285 90
8 2,314
*A: "'B:
A*
C* D"
1,G31
8
656 7
869 104
G79
I i
\ 17 1 10 I I 145 I t ___ 83
18
1 ti
169 13
1,891 (24.7)
8
891
\ 46
1,014 I
1 492
1 7,637
I (12,8) -----------------
of those who
Parolees,
)-"1970--\ 5.1
. C~>t~;l;T--- 1966 I 1967 \ 1968 __ ~:~~: li~>(Juveni1e ---·~-~3-·\-·5.;-- 6.2 i 6.0 I'
I 1 Probationers) I 11.5 I PI) 9 9 10.5 11.7 1 \
12.4 \ 2 (Juvenile - arc ees .. I HJ.8 II 22.0'
4 (Adult probationers), 11.5, 11.6 11. \
23.3 10.1
\
. 3 (Adult Parolees) * I 21.2 \' 20.8 3 10.7 1\
. 5 (Women's Guidancel \ Home Parolees) . '------
1-~- Total . --8.3r~~~ __ > __ ~ _ 9.0 8.4 tl ' .... -... ----.-.. ----.. -- ~--=--ct--·-·. (3) 01' parolees from prisons, has par y .:. The percent of abscondel's m a egory, .' t suspend the
. . It of decisions mad.e by the commISsIons 0 been cumulatIVe as a resu sentence until tile absconders are located.
> Th th case load are matched to ths attention of a professional probation offIcer. us, e . d ltd
t This project has been apphe to se ec e differential types and degrees of treatmen .
-26 -
I \
j
juvenile and young adult offenders on a national basis. A total of 337 persons were
under intensive treatment by professional probation officers at the end of 1970.
3. The third is the introduction of group interaction programs into supervision
and treatment. Group techniques were first attempted with the rising number of
juvenile traffic violators, and has gradually been expanded to include non-traffic
juvenile probationers and parolees. In 1970, 289 group interaction meetings were
conducted in 39 Probation-Parole Supervision Offices. A total of 9,940 j'llvenile pro
bationers or parolees. 1,529 volunteer probation oHicers and 790 guatdians or employers
were involved in the various meetings.
4. The ;<.mrth experimental program requires the professional probation officer
-to make himself available at fixed regular intervals to specific places within his pro
bation area. This schedule is known to probationers, parolees and volunteer proba
tion officers in the area who can consult with him in their own communities. In 1970,
5,649 fixed, sceduled community consultative visits were conducted throughout Japan.
Each of the 49 Probation-Parole Supervision Offices scheduled an average 115 con
sultative meetings and an average meeting provided consultation to 4.1 probationers
or parolees, 3.2 volunteer probation officers and 1.5 guardians or other concerned
persons.
E. Aftercare and Pardons
In addition to servi<::es for probationers and parolees, the Probation-Parole Super
vision Offices provide within six months following discharge from confinement help
-to offenders who request aftercare service.2;)
In 1970, 9,805 persons requested aftercare services. Of this number, 83.9 percent
were discharged from prisons at the expiration of their sentence. The services pro
vided included:
1. Certificates for travel on trains at half-fare;
2. Providing money for meals and authorized travel expenses;
3. PrOViding clothing;
4. Arranging immediate medical care.
There were 119 Rahabilitation Aid Hostels operated by the same number of
Rahabilitalion Aid Societies with a total capacity of 3,388 beds at the end of 1970 .
These Societies are voluntary but are established with the approval of the Minister of
.r'Eligibility for aftercare services is open to llersons who have: (1) Completely sel'ved their sentences of imprisonment; (2) Been released from prisons upon l'emission of their sentences; (3) Been granted suspension of sentence without probationary supervision; t4) Been granted suspension of sentence, though not finalized as yet; (5) Received the disposition of "not instituting prosecution" because prosecution
was unnecessary; (6) Completely served the term of confinement in Women's Guidance Homes.
- 27-
discharged offenders, probationers or parolees were Justice. During 1970, 4,649 d d
d t d in these hostels. These aftercare services are provi e referred to and accommo a e . ood community
onsible to assist all offenders achIeve a g on the basis of the states resp
adju~tment. " f th Probation-Parole Supervision Office. f . also a mam funchon 0 e Crime preven Ion IS . . rtl d "Campaign to Enlighten
. I' the public educatIon dnve, en 1 e They have a major ro e l1'l. • f h M' . try of Justice every ye!;l:r sinr;e
" 'd d r the auspIces 0 t e lUIS the Society orgamze un e . d'a as well as
,. .. J ly of each year, vanous mass me 1 1951. Dunng thIS campaIgn lU u bT d on a national basis to direct
. d education resources are mo 1 lze other informatIon an . . . f 'ety The crime preven-
. . revention and the punhcahon 0 SOCI . public attentIon to cnme p " b t also voluntary organiza-
1 d' 1 d not only publIc agenCIes u lion activities invo ve mc u e 'th Volunteer Probation
' , nd the offenders. For mstance, e !ions concerned WIth cnme a . R h bTt fon Aid and Big Brothers
" Wen's Associahons for e a 11 aI, Officer's Assoclahons, om t' n activities in their areas
' arious crime preven 10 and Sisters Associations orgamze v
as a part of this program. , d' 'dual basis General llective and on an m IVI •
The Cabinet grants pardons on a co .•. d d'nance. In the case of nted by a speclahy Issue or 1
( collective) pardons are gra . f r officer of a prison or a P bI' Prosecutor the chle execu Ive
the individual, the U IC , " n behalf of an individual. ., Office can apply for remISSIons 0
Probation-Parole SuperVISIon . Off d Rehabilitation CommiSSion d th h the Nahonal en ers Applications are processe roug
before the Cabinet makes any decision.
- 28-
; ,
PART THREE: SPECIAL CRIME AND CRIMINALS
I. Juvenile Delinquency
In Japan, persons under age 20 are considered juvenile delinquents when they
commit offenses, and are subject to special procedures aimed at their protection,
education and trealment. Juvenile delinquents are referred by the police to the Family
Court eilher directly or through the Public Prosecutors' Office depending on the gravity
of offense. If it is a Serious offense it is likely to be referred to the Court through the Prosecutors' Offke.
Juvenile delinquents are classified by the Family Court into the following categories:
1. 111v:,eEile offender is one aged 14 to under 20 who has committed an offense
provided for in the Penal Code or Special Laws (frequently referred to a Penal Code
offenders and Special Law offenders respectively);
2. _~B!eakin['..Ehil~ is a child under age 14 who is exempt from criminal
resp"o~sibility but v:rho has committed an act in violation of a criminal statute. These
children are s~nt to the Family Court under the Child Welfare Law; and
3. Pre-Offense_J:!:~ is a person under age 20 who it is believed is likely to
Commit an offense or an act in violation of a criminal statute. The definition of
delinquent personality and surroundings based on specific factors is stipulated in the Juvenile Law.'R)
Tuvenile delinquents over 16 years may be referred by the Family Court to the
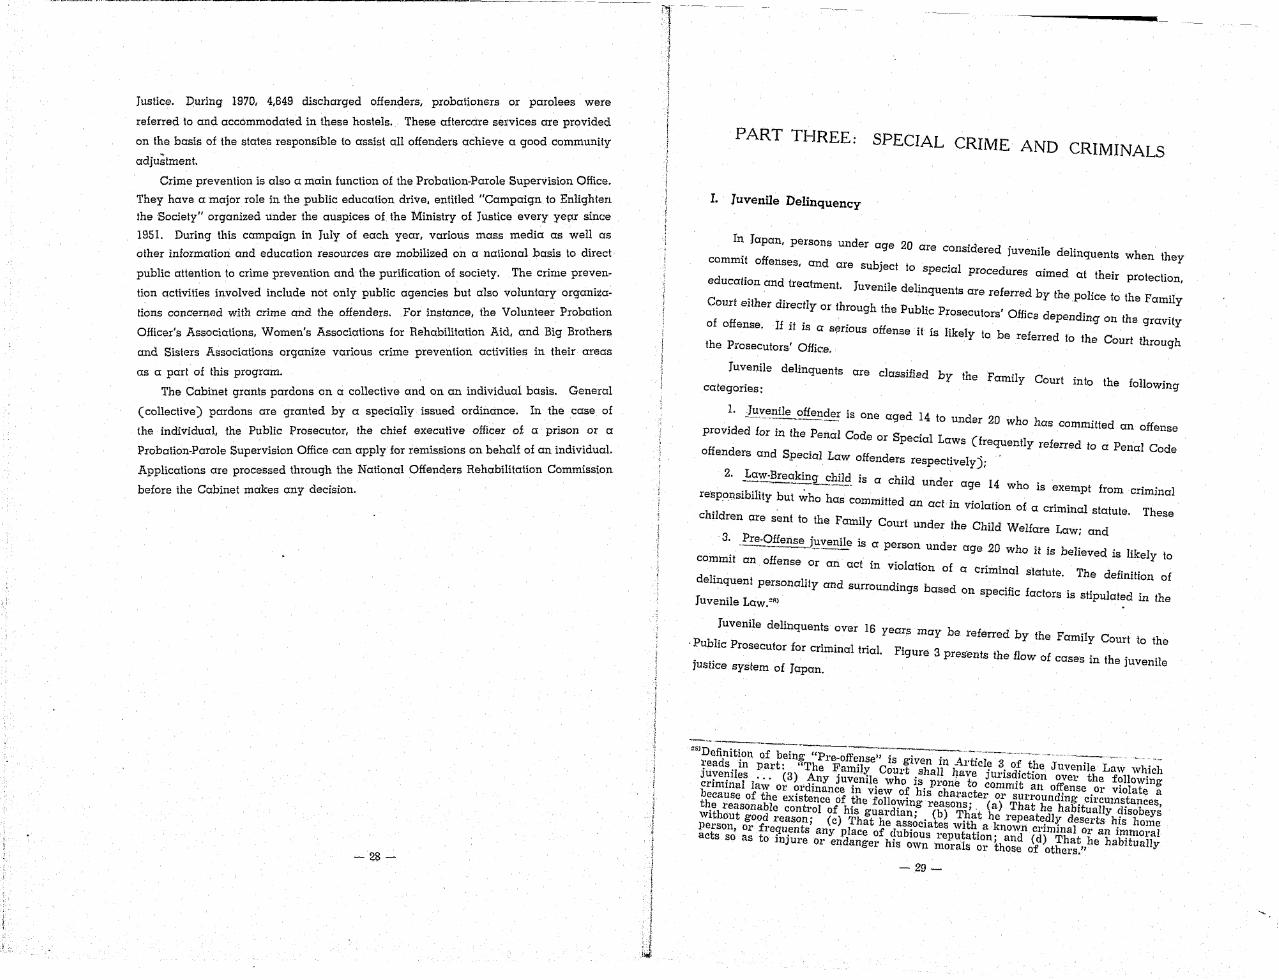
. Public Prosecutor for criminal trial. Figure 3 presents the flow of case"s in the juvenile justice system of Japan.
OSJDefinition of being "Pre-Offense" is given in Article 3 of the Juvenile Law which l'eads in part: "The Family Court shall have jUrisdiction over the following JUVeniles '" (3) Any juvenile who is prone to commit an offense Or violate a criminal law or ordinance in view of his character or surrounding Circumstances, because of the existence of the following reasons;. (a) That he habitually disobeys the l'easonablc control of his guardian; (b) That he l'epeatedly deserts his home without good reason; (c) That he associates with a known cl'iminal Or an immoral persOll, or frequents any place of dubious reputation; and (d) That he habitually acts so as to injure or endanger his Own morals or those of others."
-29-

Figure 3. Juvenile Jus,tice System of Japan
Pre.d,li"q","~ ~ Polk,
Juvenile Delinquents
I-__ ~ Pre·delinquents
.Mlnor Fine, . Fine, and Suspended Sentence \\' ithout IJrobation
f 'uveniIe delinquent to the Public PJ:osecutor. 1,] The police shall send the case 0 J • h bIe with a fine or lesser penalty,
h ncerns an offense pums a A t" 1 However, if t e case co. '1 C ,t (Article 41, the Juvenile Law; l' IC e he shall send the case to the Faml y om 246 the Code of Criminal Procedure), , under the Child Welfare
, d' deems that measures 'J31 If a police officer 01' -n, guar Ian , d' t 1 sending the information to the 18.1 d ' able than lmme Ia e y
Law will be more a VIS . th Ch'ld Guidance Centre of any case Family Court, he may direct:y nO,tlf
y de, lSI (Item 2, Article 6, the Juvenile
which involves a pre-offense Juvemle un er
Law), Also see @ below, ff has been committed by a juvenile, :cJ If the Public Prosecutor deems that, anCo en
tse
H shall ~lso send those cases to - h to the FamIly our, e 'f he shall send t e case d " the Court's jurisdiction even 1
the Family Court tbat he believes com~, un e(~rticle 42 the Juvenile Law), t ffi' t grounds for StlSpICIOn , 't
there is no su Clen 'th C1 'ld Guidance Centre deems 1 neces-'f)1 If the Prefectural Governor or ChIef of ,e I,ll to whom the Child Welfare Law .' 1 m asureS for a Juvem e , f
sary to take compu sory e d f h's conduct or depriving hlm 0
is applicable, such as l'es:l'icting th;:~~~ o~:rt :Item 3, AI'ticle 6, the Juvenile Iib61'ty, he shan be referred to t~e , d' t~11 over a law-breaking cbild 01' a preLaw) , The Family Court has, JurIs IC 1 1 h the Prefectural Governor or
'1 d 14 years of aO'e on Y w en A t' 1 offense juvem e un er '=' h' t th Family Court (Iten12, l' Ie e Chief of the Child Guidance Centre refers 1m 0 e
3, the Juvenile Law),
A, Trends in Juvenile Delinquency d I' Y in 1970 are divided al trends in J'uvenile e lllquenc
The description of gener
-30-
for purpose of this analysis into three categories: (1) Juvenile Penal Code Offenders,
(2) Juvenile, Special Law Offenders, and (3) Law-Breaking Children and Pre·Offense
Juveniles,
1. Penal Code Offenses
During 1970, a total of 191.002 juveniles were investigated by the police on
suspicion of violation of Penal Code offenses, an increase of a 3,164 over 1969. The.
number of juvenile suspects investigated by the police reached a peak of 134,000 in
1951 and then decreased for several years, but in 1955, it turned back up and reached
a high point of 193,000 in 1966, The number stabilized below 190,000 from 1967 to
1969 but in 1970, passed 190,000. These trends and the rate of suspects per 1.000
population 14-19 years of age are presented in Table 19,
Table 19 reflects the steady decline during the last several years in the percentage
of juvenile suspects to total suspects, However, the rate of juvenile offenders has
increased when related to the number of juveniles of 14-19 years of age in the popula
tion, The increase in the adult rates can be. explained by the increase in professional
negligence causing homicide or bodily injury in traffic accidents, and when profes.
sional negligence cases are excluded a different picture emerges, Table 20 shows
that although the number of juvenile suspects investigated decreased from 127,000 in
1951 to 85,000 in 1954, this trend was reversed starting in 1955 and peaked at ap·
proximately 151,000 in 1964. Since 1964 the number decreased each year and reach·
ing a low of 101,000 in 1969. In 1970 ·there was an increase in excess of 7,000 over
the 1969 low, The same table shows that the number of investigated adult suspects,
excluding negligent homicide and bodily injury, peaked at 380,000 in 1951. and
thereafter gradually decreased to 236,000 in Hi69 but in 1970, it exceeded the 1969
figure,
Table 20 also ~ndicates that the ral.e (lor suspects per 1,000 persons in the correspond
ing population shows in adult cases a yearly decrease from 1955 to 1964 when the rate
,increased to 4,3 from 4,1 the previous year, In the case of juvenile it was 12,0 in
1964 wilh a yearly decline from that year until 1970, In 1970, the adult rate remained
the same as Ihe previous year 3.4, b'ut the juvenile figure 10,1 represent'sd a 1.2 increase.
over the pl"evious year, T:his increase in juvenile major Penal Code suspects and
the increased tendency of juveniles under 14 years to become involved with law
emorcement agencies does not allow for overly optimistic projections of future
delinquency trends,
2, Juvenile Special Law Offenses
During the year 1970, the Public Prosecutors' Offices received 408,256 juveniles
suspected of violating special offense statutes, Of this number, 398,596 or' ~7,6 percent
were suspected of violating the. Road Traffic Law, The 9,660 non·traffic 'special law
- 31-

Table 19. Juvenile and Adult Penal ~d(l_S_~~Jlects, ----------Adult \
Year j-
1946 1947 1948 : 1949 1950 1951 1952 1953 1954. 1955 1956 1957 1958 1959 1960 1961 1962 1963 1064 1965
Juvenile
Number Investigated
99,389 92,551
113,763 113,531 128,809 133,656 114,381
98,604 94,342 96,956
100,758 114,302 124,379 139,618 147,899 158,884 162,941 174,351 190,442 190,864 193,121
-i Rate* I
10.0 \, 9.3
11.2 i
l 11.1 12.4 \
\ 12.8 I 10.9 \
9.6 I 9.0 9.2 9.3
10,4
11.1 12.4 13.7 14.1 13.9 14.2 15.1 14.8
Number Investigated
333,694 354,510 425,704 453,412 458,297 452,602 432,605 421,453 419,376 437,104 427,192 430,255 420,893 417,455 413,565 422,430 406,925 432,298 488,080 515,963
14.4 546,934 1966 1967! 186,000 14.4 616,578 1968; 189,787 15.6 733,704
\ 1969 187,838 ,I 16.5 812,143
\ __ :~2~ _~~~~~_j-~~-~-- 882,468
* . Rate pel' 1,000 population of 14-19 of age.
R:te:-\ 1
1 I
\
\ 1
8.4 8.4 9.8
10.2 10.1
9.8 9.1 8.7 8.4 8.6 8.2 8.1 7.8 7.6 7,4 7,4
6.9 7.2 8.0 8.3 8.7 9.5
11.0 11.9
12.6
19,16-1970 d __ ' ~ _.,. -
Juvenile Percentage
of Total Suspects -
\
22.9 20.7 21.1
\ 20.0 21.9 22.8 I 20.9
\ 19.0 18.4 18.2 19.1 21.0 22.8 25.1 26.3 27.3 28.6 28.7 28.1 27.0 26.1 23.2 20.6 18.8 17.8
*,~ Rate pel' 1 000 population over 20. . 1 ' . 970 decrease of approxImate Y
offenders received by the Public Prosecutors m 1 was a . ' . I 23 ercent of the non-traffIc specIal Ia:"
800 from the previous year. ApprOXImate y P offenders were suspected of violating the Guns and Swords Possession Control Law.
3 L -Breaking Children and Pre-Offense Juveniles . aw 'd nce to 34727 children under 14
In 1970 the police investgated and gave quI a ,
ears old w~o would have been referred to either the Family Court or Public Prosecutor
y 14 The rate per 1 000 of the population·8-13 years of ages had they been over Y'ears.·' .
. d by 3 298 and the rate by 0.4 from tp.e prevlOuS 's 3.7 and in 1970 cases Increase , . I h I been the chief offense of children in this category compn-year. Larceny as a ways
sing 88 percent of the total. I -ddition to children in the law-breaking category, the police in 1970 gave no. t I 800 000 to 900 000 pre.delinquent juveniles who
guidance or direction to approxlma e y, '
- 32-
Table 20. Juvenile and Adult Major Pellal Code Suspectl'l, Excluding Traffic Negligence Cases, 1951-1970
f Juvenile Adult Year i-Nu~b~-;-I
.~- .......... ,~-----I--~-----l--i
Rate" I Number Rate*" I
1951 126,505 12.1 380,142 8.2 1952 106,828 10.2 359,182 7.6 1953 . 90,583 8.8 343,764 7.1 1954 85,496 8.2 340,436 6.8 I 1955 87,286 8.2 353,835 7.0 1956 89,684 8.3 336,660 6.5 1957 100,646 9.2 327,638 6.2 1958 107,333 9.6 309,261 5.7 1959 117,938 10.5 296,664 5.4 1960 121,408 11.2 279,911 5.0 1961 131,044 11.7 278,810 4.9 1962 135,584 11.6 255,801 4.4 1963 141,800 11.5 246,910 4.1 1964 151,083 12.0 260,635 4.3
1 1965 145,335 11.3 258,262 4.1 i
1966 141,333 10.6,' ·254,541 4.0 1967 123,702 9.6 243,008 3.8 1968 111,819 9.2 243,716 3.7
I 1969 101,412 8.9 235,729 3,4 1970 108,696 I 10.1 238,806 3.4
"-.---......,..----~-- ~~--- --- -.-.-..--~- ~~-
,;, Rate PCI' 1,000 population of 14-19 of age. ,;,* Rate pel' 1,000 population over 20.
Percentage of-I
_Juveniles of the ~ota~,
25.0 I
22.9 20.9 20.1 19.8 21.0 23.5 25.8 28.4 30.3 32.0 34.6 36.5 36.7 36.0 35.7 33.7 31.5 30.1 31.3
were indulging in 'smoking, drinking, unwholesome pastimes, truancy, keeping bad
associates, loitering in entertainment areas, inhaling paint.thinner, e.tc. ~nl Of this
number, the police referred to the l?amily Court 10,200 lhe ones 14 to 19 years they
regarded as pre·offense juveniles. The number of pre·delinquent juveniles has been
deciining slightly since 1965. Twenty-eighf 'percent of the pre·offense juveniles were
p years, 24 percent were 16 years, 17 percent were 18 years and 14 percent were
15 years. Thirty-five percent were )J.nemployed, 34.6 perc~nt were employed, and 29.3
percent were students.
Recently considerable attention has been paid to the sniffing of paint-thinner or
glue of plastic models by juveniles which has become more frequent since 1267. In
1970, the police gave gUidance to 40,045 juveniles indulging in these activities. This
number reflected an increase of 29 percent over the previous year and almost doubled
""'In this cOl1text, all youths who receive guidance from the police because. of either their observed behavior or reported behavior are classified as "pl'e-delinquent juveniles." 1Vhen the police cOl"3ider this serious enough to be officially recorded they are classified as "pre-offe,~se" juveni.les., Of the 10,200 youths as l'eferred by the police to the Family Court, statistics are not available on their dispositions. In 1969, however, the police referred 10,282 "'pre-offense" juveniles to the Family Court and the. Court recorded :(ormal dispositions on 6,399 of them.
- 33-

the number in 1968 In 1970, 53 juveniles reportedly lost their lives as a result of
the abuse of paint-thinner or similar substances. the alice and given gUidance as Of th 40 045 j'uveniles who were suspected by p
e , I d 38 4 percent were 1 41 2 percent were emp aye, . b ers of Paint-thinner or 9 ue, . h' tI us A new trend observed in t 1S group students, and 20.4 percent were une;PIOyed. d to the previous year, ~nd the number
is the increase in the number ez;tploye compare th 140 percent fro~ the previous . . h hIt dents increased by more an
. of jumor h1g sc 00 S u t ated in the Kanto Area t of these juveniles are concen r
year. Although 55 perc en . d markedly in Shikoku and which includes Tokyo, thinner-sniffing cases mcrease
Kyushu Islands as well as western Honshu.
. . d Background of Juvenile Crime and Delinquency' B. SpeclQl Features an
Juvenile Offenses by Type of Crime .
1. d Offenders by type of offense 1S The breakdown of the total juvenile Penal Co e
shown in Table 21.
Table 21.
Type of Crime
Breakdown of Juvenile Penal Code ~.us~~~ts, 1970 ...... ~"~--'~-""- .... -- Percentage of .Juvenile Total Juvenile of Offenders Offenders Total
i Larceny 1 1 Fraud
---.... -... -~ .. -.-.-~ ... ----.-=.=--.. , --~.~. -44~O· -----, 4.3 ,
76,314 173,616 714 16,434
Embezzlement Robbery Extortion Intimidarion Assault Bodily Injury Rape Indecent Assault Homicide Arson Professional
Negligence " Causing HOnllC1de 01' Bodily Injury
I Others L--"--T-o-t-a-l-
764 1,097 6,632
443 8,721
10,101 2,213 i 1,049 ' .
198 152
77,008
5,608
191,002
5,973 2,845
14,979 3,026
37,832 61,675 6,430 7,219 2,146
814 695,447
45,034
1,073,470
12.8 38.G 44.3 14.3 23.1 16.4 34.4 14.5
9.2 18.7 11.1
12.5
17.8
I I
Professional Negligence causing homicide or bodily injury outunmbteredN~::'
. . 3 ercent of the total juvenile Penal Code suspec s. remainders, compnsmg 40. P ttl; 1970 followed by bodily
. . 40 percent of the 0 a.n , larceny increased to compnse 'd r d t t· n These three types of violent crimes plus intim1 a 10n l'nj'ury, ass aut an ex or 10 . f m
The crimes which showed increase ro . d 13.6 percent of the total. cases compnse
- 34-
1969 were larceny, extortion. assault. intimidation and embezzlement. The remainders
declined from the previous year. It should be noted. however. that juveniles comprised
higher percentages of such crimes as extortion, larceny and robbery.
When compared with figures for 1955, jUvenile professional or gross negligent
offenders causing casualties were eight times greater in 1970. followed by indecency
(250 percent). assault (236 percent) and extortion (170 p.ercent). On the other hand,
the numbers of fra.ud. embezzlement. robbery and homicide had declined. 2. Age Range of Juvenile Offenders
A demographic analysis of population of Japan may contribute to a clearer view
of juvenile delinquency. The number of juvenile and youth population and their
indexes are shown in Table 22. Juvenile population stood at a peak in 1966. when
Table 22. Transition iJf Juvenile and Youth Population, 1960 -1972, 1975
i I
i
(Unit: 1,000) .~~-.--'----- ,-.. _---,---J uveniJe PopUlation i
Year
1960
(14-19) I'
14-15 r 16~1'-7~i--1-8---1-9-1'--T-o-ta-I~~I-n-d-eX-'----20-_--24--~--I-n-d-ex---~~::~:. i
l
. '~~i
Youth PopUlation (20-24)
. ,"~~-~ . .~ .. ~"' .
3,114 I 3,846 I 1961 3,847 3,556 I 1962 4,795 3,107 1
1963 4,922 3,840 j 1964 4,696 4,791 !
i 1965 4,278 4,876
I 1966 3,980 6,474 1967 3,738 4,275 1968 3,503 3,980 1969 3,386 3,740
I 1970 3,299 3,507 1971 3,114 3,379 1972 3,065 3,292
I 1975 3,103 3,145
3,856 I
I 3,835 I
I
3,836 I 3,549 I 3,103 3,752 4,716 4,871 4,672 4,275 3,981 3,721 3,493
3,107
11,739 109 12,311 114 12,590 116 12,906 13,370 12,884 12,155 11,401 10,787 10,214 9,850
9,355
119 124 119 112 105 100 94 91
86
----- . ". '---~--'----.
8,318 8,484 8,721 8,967 9,397 9,069 8,634 9,016 9,588
10,148 10,813 11,390 11,013
100 102 105 108
! 113 109 104 108 115 112 130 137 132
9,117 110
those who were born in the postwar periods were about to reach their maturity_
From 1967 and on. the juvenile population has heen on a gradual decline as the youth
population has expanded. This trend will continue in the coming years.
Juvenile Penal Code offenders by age groups. together with the rates per 1,000
population of the corresponding ages. are 'shown in Table 23., The notable phenomena
for 1970 is that actual numbers of Penal Code offenders among 14-15 and 16-17 age
groups showed an increase. The offenders in 14-15 age group, in particular, were
21.8 percent greater than 1969. In parentheses in Table 23 are given non-traffic cases
of the total figures for 1970. When compared with corresponding figures since 1966.
- 35-

9 h d an increase in 1970 . 'h' h had declined steadily untill 196 , s owe
non-traffic cases, w lC
,except among' the older age groups. t' t d by Age Group, 1960 -1970 'r bI 23 Penal Code Offenders Inves 19a e, __ .~ ___ ,_-~-.-' -,.--' ,.-' '\
a e .,,--. -- '20 24
..-\ "~:~r'--r -~- 14-15 '\'-N~- :6-17Rate-\I-N~111::;~\-:Rat;·\N.lrnbe~ri~t;\ \ Number Rate*, urn e1'
16.1 140,455 16.9 I 1960 35,375 11.4
16.4 141,130 16.6
1961 44,909 11.7 15.4 134,515 15.4
16.5 142,617
17.8 163,470
16.4 167,739
60,615 12.6
65,957 13.4
65,883 14.0
1962
1963
1964
15.9
17.4 18.5 i
1965 16.4 170,974 19.8
1966 18.0 193,959 21.5
21.0 241,601
23.7 277,496 I 1967
1968
25.2
27.3
1969 23.9 305,716 28.3
1970
1970** ,- -'
Extortion
Age Rangc.--___ ---------------,
14 --15 L ___ .:..-------:=::;;~~~~~===
18 19 L-----:7'Z?" ~I_-----------r=
t for 79 1 percent of the toa1 cases in-
As shown l'n Figure 4, larceny accoun s· d . t 1 . also the amman
W'th 16-17 age group, arceny lS vestigated within 14-15 age group. I f 'onal negligence causing
. 46' ercent Next comes pro eSSl type of offense totalmg p. db It (6.2 percent), bodily
• .., T with 29.5 percent. followe Y assau . homiclde or baddy lU]ur] , ) I 18-19 age group, professional
) and extortion (5.1 percent. n injury (5.7 percent t f 625 percent of the total,
. . 'de or bodily injury accoun s or . negligence causmg homlcl . ., (55 perceent), and assault (3.5 followed by larceny (20.5 percent), bodlly m]ury .
- 36-
rr-i I
,I , r
U ! "1 , I
'i !
\ ~ I I ! ~
percent). For young adult offenders 6f 20-24 years old, professional negligence cases
account for 71.3 percent of all investigated cases. Aside from professional or gross
negligence cases, it is noted that larceny accounts for a majority of the cases in the
lower age groups. while in the older age groups crimes of violence comprise a higher
ratio in the total.
3. Family
Forty-five percent of non-traffic cases handled at the Family Court while in 1~55
had both parents. In 1969. the figure increased to 63.2 percent. The so·called broken
homes in which one or both parents were absent comprised less than 16 percent of
the total. The occupational status of parents r.>f 9,127 non-traffic delinquent children
surveyed in 1970 by the Research and Training Institute (hereafter referred to as
"special survey") was as follows: 35 percent of the working parents were engaged in
manual labor; 22 percent in agriculture or fishery and 15 percent were classified as
white-collar workers. The children of manual laborers were more likely to have
committed violent crimes such as robbery or murder. Statistics developed by the
Family Court revealed that in non-traffic cases 29.8 percent were middle class in 1965
but 73.2 percent in 1969. It seems reasonable to conclude from these figures that the
intra-familial relations and functions of the family appear more significant as cr.lusal
factors of delinquency than the socia-economic classification and financial aspects of
the family. Also, SOciological and cultural factors should not be overlooked in
analyzing juvenile delinquency.
4. School and Employment
Yearly, the Japanese people have attained a higher level of education. Approxi
mately 70 percent of the graduates from junior high school entered senior high school
each year while 23.3 percent of senior high school graduates entered colleges and
universities in 1970.
The percent of students among juvenile offenders has been increasing since 1968.
although it has always been smaller than the percent of students to the total popula
tion of the corresponding age group. In 1970, 56.2 percent of juvenile suspects in
vestigated were students of junior or senior high schools, colleges. or universities.
Compared with the 1966 figures. those who were in junior high schools decresed,
while senior high school. college and university students increased both in aclual
numbers and rate. By type of offense. the lower age group 01 students had higher
theft rates, and an increase in such violent crimes as extortion. intimidation and
assault among senior high school students was apparent in 1970.
In the meantime, the working p("--'lation has become smaller among 15 to 19
year old youth. as more p\~ople ha\--, • ome to enter either senior high schools or
universities. In 1970. a total of 35,254 working juveniles were investigated by the
police for non-traffic cases, 12.0 per 1,000 working population of the 'same age group.
- 37-

Of the total, more than 60 percent were manual laborers including drivers and as
sistant drivers. Clerical workers, farmers or fishermen did not loom too large in the
picture. The special survey of youthful offenders by the Ministry of Justice indicated
Ihat -S0.5 percent of juvenile offenders who presently work or who were once employed
had changed their place of work while this figure for the previous year was 59 percent.
S. Community
It has been generally believed that delinquency and crime occurs more frequently
in metropolitan areas. This assumption, however, needs some modification in recent
years. The movement of population from overcrowded urban areas to surrounding
areas has been observed as was the, tendency of juvenile crime and delinquency
to decentralize from urban areas to the middle·size or smaller cities and especially
those areas where new industries are growing. Little difference was obserced between
the type of offenses which were committed in urban and rural areas, although the
incidence of rape and indecency was somewhat higher in rural areas. Approximately
75 percent of the juvenile delinquents committed their offense in the same community
where they lived. Less than 10 percent of juvenile crime were committed in prefectures
other than the offendrs home prefecture. By type of offense, robbery was more
likely to be committed in communities other than offenders native towns or cities.
6. Others
Statistics gathered by the Police revealed that in 1970, 33.1 percent ofiuvenile
Penal Code offenders and 15.4 percent of adult Penal Code offenders, excluding
d h d d f d t Relati'ng to j'uvenile cases, the rate was negligent offen ers, a co· e en an s.
notably high for extortion" robbery and assault. The complicity rate for juveniles
outnumbered that of adults in such crimes as larceny and assault. A survey conducted
in 1970 by the police on 112,616 juvenile Penal Code offenders revealed that 34.9'
percent were affiliated with some kinds of delinquent groups. This was a 2.7 percent
increase from the previous year. Senior high school students had the highest role
of affiliation (42 percent), with junior high school students (40 percent) a close
second. and the third university or college students (35 percent). By type of
delinquent groups, 48 percent were affiliated with school groups, and the remainder
with groups organized either in their neighborhood, street corners or in where they
worked.
Eamily Court statistics indicate that among the non·traHic juvenile offenders
disposed of in 1969, 28.9 percent of Penal Code offenders, and 19.2 percent of special
law violators had previous records of dispositions either by the Public Prosecutor's
Office or the Family Court. Approximately 45 percent of juveniles charged with
robbery and 44 percent charged with intimidation had previous records of referral to
- 38-
.~
II ! I \ t
stIch agencies. In brief. those charged with Violent Iypes of crime tended 10 have
more extensive criminal records, whereas the rale of persons with previous offenses
were lower with arson, special law violations and indecency. At the same time, it
should be noted that 22 percent of juvenile delinquents between 14 and 15 years old bas previous delinquency record.
Finally, the special survey by the Ministry of JUstice revealed that 77 percent
of jUV~niles committed to training schoo1s had previous records of legal disposition.
These mc1uded: 40 percent were previously placed on probation, and 38 percent were
discharged at the Family Court either with or without court hearings. Seventy.one
percent .of the juveniles who were referred back 10 the Public Prosecutor's Office Py the Family Court for criminal trial had previous records. These facts seem to indicate
that the Family Court lakes into consideration previous delinquencies when the
commit juveniles to training schools. The survey also revealed that 82 percent ~ juvenile probationers were earlier referred at least once to the Family Court and
were discharged with or without court hearings. The survey also indicated that the
year immediately following a delinquent act is the most crucial for rehabilitative
efforts. A total of 66 percent of juvenile delinquents in the study committed another offense within one year fOllowing their dispositions.
The increase in the number of persons driving automobiles in Japan has contributed
not only to an upsurge in traffic offenders but also to an increase in other types of
crimes in one way or another associated with motor vehicles. According to the
special survey mentioned earlier, 22 percent of urban juvenile crimes and 26 percent
or rural juvenile crimes were in some way connected with automobiles. This rafe
both in urban and rural areas has been on a constant increase. The use of motor
vehicles in the offense of rape was observed in 43.6 percent of the cases in urban
areas and 36.8 percent in non-metropolitan areas. Also, 35.5 percent of robbery c . b ases m ur an areas and 38.S percent in rural areas were associated with the use of
motor vehicles. In larceny, 27.4 percent of urban cases and 33.2 percent of rural
cases involved automobiles. Motor vehicles tend to become the crime targets in such
property crimes as larceny, fraud and embezzlement, whereas they wete llsed as means of crime in robbery, rape or indecency.
Victimology has received more attention from researchers in recent years. Ac
cording to the special survey referred to above, 76.3 percent of 9,127 juvenile offenders
had no personal relations with the victims of their crimes: 12.1 percent "knew of"
the victims prior to the crimes; 4,7 percent had friends or aC'luaintances as victims;
families or relatives were made victims in 0.3 percent of the total crimes. There were
-- 39 ~

no previous relations between juvenile offenders and victims in more than 80 percent
of the cases of larceny and robbery. The offenders "knew of" the victims in more
than .,30 percent of the cases of intimidation, rape and violations of the Law for the
Punishment of Violent Acts. Friends or acquaintances were the victims in more than
10 percent of the case of intimidation, violation of the Law for the Punishment of Violent
Acts, injury, and fraud. The most conspicuous phenomenon of offender and victim
concerned homicide where family members were the victims in 9 out of 20 cases.
In 45 percent of property crimes, the monetary damage was between ¥l,OOO and
¥lO,OoO, although in some theft cases the damage was over a million yen. It remained
less than ¥l,ooo in 32 percent of the extortion cases.
C. Treatment of Juvenile Delinquents
This section is concerned with the treatment of juvenile delinquency at various
stages of the juvenile criminal justice system. Descriptions of treatment· activities will
be included in the following subsections: (1) Police; (2) Public Prosecutor; (3)
Family Court; (4) Criminal Trial; (5) Juvenile Detention and Classification Home;
(6) Juvenile Training School; (7) Juvenile Prison; (8) Juvenile Probation and Parole.
1. Police
There were 191,002 juveniles suspected of violating the Penal Code who were
investigated by the police in 1970, a figure slightly larger than the previous year.
ProfessIonal negligence causing homicide or bodily injury in traffic accidents accounted
for 76,921 of these cases in 1970 compared with 79,717 in 1969. The remaining
114,081 1970 cases represent a 5,960 increase over 1969. In 1970, 503,112 juveniles
came to the attention of 'the police for violations of special criminal statutes, the
majority as violators of the Road Traffic Law. The decrease of 57,801 cases in this
category when compared with the previous year results the marked decline in Road
Traffic vio1ati0:;:;' (:ases sinclS' the "Traffic Violation Report System" described earlier
was applied to juveniles in August 1970.
Juveniles who commit an offense punishable by a fine or lesser penalty Clnd
those who are alleged to be pre·offense juveniles ai:e directly referred by th;:: police
to the Family Court while those who commit an offense punishable by imprisonment
without prison labor or graver punishments are sent by them to the Public Prosecutor.
2. Public Prosecutor
The Public Prosecutors' Office received 606,150 juvenile suspects in 1970, a 46,260
decrease from the previous year. Of thm number, 197;::94 (32.6%) were suspected
Penal Code violators a 2,789 increase o.ver 1969, 398,596 (65.8%) were violators of
the Road Traffic Law, a 48,233 decrease from 1969, and 9,660 or 1.6 percent were
special criminal statutes .violators (other than R00d Traffic Law violators) 0 816
-40 -
decreas from the prevo 10US year. A conspicuous hen .
hanel, a 569 decline of those receiv d f P omenon 111 1970 was, on the one b d'l . . e or professional ne l'
o 1 y mJury when compared with th. g 1gence caUsing homicide or b e prevlOUS year al
ut on the other hand an . a revers of a long term trend , mcrease of 5 379 of th. '
w'th th . ' Ose receIved f th f 1 e preVIOUS year a ch f or e t When compared , ange rom the declining. past several years when this number was
The Public Prosecutor is not authorized to d t .
prosecution if the susp t.. e ermme whether or not to institu.te ec IS a Juvenile. He d h
the Family Court with a reco d' sen s t e case, after investigation to mmen atlOn for the t t '
total of 601,933 juveniles were ref d f rea ment of the jUvenile. Thus a in 1970 "I,) erre rom the Public Prosecutor to the F '1 C'
. amI y ourt
The Public Pro t secu or is, in prinCiple, re uired . .
case is sent back to his Off' b q to mshtute prosecution when a 6 . Ice y the Family Court f '.
6,363 Juvenile offenders th or cnmmal prosecution Of . us prosecuted in 1970 47545 .
TraffIC Law violators, and 18,737 2 "or 71.6 percent were Road or 8.2 percent were PIC
percent of whom were ch d' ena ode offenders 92 0 arge WIth negligent hom' 'd ' .
3, Femily Court lCl e or bodily injury.
The F '1 C amI y ourt is empowered to determine th
delinquents. The Family Co t • e treatment measures for juvenile . . ur Cal. apply one of three .
for m the Juvenile Law ref th protechve measures Provid"d , er e case to th P bl' -
Ii . e u lC Prosecutor f '. _on, or may discharge the offender b f or cnmmal prosecu·
e ore or after a h' . In 1970, 785,926 juveniles w f earmg WIthout any further action.
h ere re erred to the Fa '1 C t e previous year. Approximatel 70 ml y ourt, 79,671 less than
. y percent of these ware Ro d T' . Probahon officers are employed b th F . a rafflc Law vlOlators.
h . Y e amlly Court t· . is famIly or other persons involved 0 mvesllgate the jUvenile,
in his case. Th F juvenile on "tentative probation" . b . e amily Court may place a ff' D l,e., 0 servahon by th f il
o lcer. uring this period the fa '1 e am y court probation ., ml y court pr b r
conduct for the purpose of obt . . . 0 a Ion officer observes the delinquents ammg more mformat" t .
determination. In 1969 80 Ion 0 aSSIst an appropriate court . ' . percent of the total non.traffi
traffIC cases were placed on "te t r c cases, and 6.7 percent of "t . naIve probation" Of th' .
entahve probation" 45 2 . e Juvemles placed 0 , . percent were lequested to b n
workshops, hostels or homes during the eirioel" . e employed in appropriate were allowed to stay home und :. of tentallve probation"; the remained E' h er specifIC conditions t b b
Ig ty-five percent of non-traffi 0 e 0 served by the youth. f " c cases and 97 percent f t ff' rom tentative probation" 'th' . 0 ra lC cases were discharged
. WI m SIX months. The Family C t
our can also refer a juvenile to the Juvenile D t t. .. ~_________ e en Ion and C1assifi-
'O)The difference betwe . . -:::::::::;==;--:---;-:--________ _ l'eferred by them t ten Juve!ule cases referred to the P hI' -Prosecuutors' om 0 he FamIly Court is explained by th If, lC ti~ro~ecutor and those
ce.. e n.ves gatlOns of the Public
- 41-

, for mental and physical examination, During 1969, cation Home or other agenCleS ,derwent such examina-
t of the total non-trafflc cases un 32,296 juveniles or 17.0 percen
fons d 1910 is presented below 1 • of all non-traffic cases for 1969 an
Final dispositions
in Table 24.
4. Criminal Trial t 'uveniles referred back the Public Prosecutor must prosecu e J , •
While in principle 'de the following excephons. F '1 Court the law does provl
to his Office from the amI y , r n' (2) when additional " ffc'ent to support a prosecu 10 ,
(1) When the evidence IS msu 1 1, • (3) when new facts are dis-d h'ch extenuating circumstances,
facts are Ul1COvere WI, t that prosecution is improper. , the case which sugges d f
covered after referrmg • d' courts of first instance an 0 , , eniles were convlcte m
During 1970, 61.503 JUv 813 'ven suspended sentence; d . risonment· gi
. b 524 were sentence to Imp , thiS num er,
and 60,166 or 97.8 percent were fined. C 'FamilY Court for Non-Traffic ases,
Table 24, Final Dispositions of 1969-1970
.-_ .. -------r- Disposition
\
;- A. Dismissal without Hearing
I B. Dismissal after \ ReaTing I C Referral to Child
\ . C t Guidance en er
II D. Probation
E. Commitment ~o & Child EducatlO? Training Home
F. Commitment ~o.
I Juvenile Tl'ammg
. School
\ ~
-~-----~--------- ".------1 9 6 9
77,852 \ (39.6) \ 68,747 \ (35.0) I
391 \ (0.2) I
18,046 ! I
(9.2) i , 191
\ (0.1)
\ 4.395 (2.2)
2G,758
-- ------- -* --
19'( 0
79,302 (40.0) 70,976 (35.S)
341 (0.2)
17,985 (9.1)
210 (0.1)
3,942 (2.0)
25,276 (12.8)
\
G. Referrupl to ttho~ Public rosecu r
(13.6) \ ~-;
----1-9-8,-03-2 (100) \ , 196,380 (100) \ 1__ Total t --~~tt1~~t~ta1. for each yeur.
th s are percell ages Note: Figures in pal'en ese , d Classification Home . .'
5. Juvenile Detention an 1 t pre-hearing inveshga,lOn . . d Classification Homes comp e e a Juvenile DetentIon an Th average stay is 20 days.
. '1 eferred by the Court. e and classification on luvelll es r .' . H in Japan operated by the
. d Classlficahon omes There are 50 Juvenile DetentlOn an . f Ja an's 46 prefectures. The
, 's at least one III each 0 P . ' Ministry of JustIce. There 1 taff "'pecialists from medlCll1e•
classification o~ Ithgye j;:=n:~~~ca:;on~o~~:e:n;:gsS and = treatment tecommendation
psychology, SOClO 0 ,
are reported to the referring Family Court Judge.
- 42-
In 1970, a total of 19,633 juveniles, including 1,722 girls were committed to these
Classification Homes. There has been a gradual decline in referrals for the past
several years, and the 1970 were 3.480 smaller than the previous year.
The Juvenile Detention and Classification Homes also make available testing and
classification services on an outpatient basis. These youths are not referred by Family
Courts but by interested persons or agencies irom adjacent communities. Requests
for these services have steadily increased and in 1970 totaled 32,700 cases.
6. Juvenile Training School
Commilment to a Juvenile Training School is one of the three protective measures
provided for in Juvenile Law. The program at Juvenile Training Schools includes
disCipline of inmates in a friendly atmosphere, academic and vocational training,
medical treatment, caltural and recreational activities. The 60 Juvenile Training
Schools are administered by the Ministry of Justice. They are classified into four
types; primary, middle, advanced, and medical. Numbers of inmates resident in these
Schools at the end of 1969 and 1970 are given below by type of School.
Table 25. Number of Inmates in Training School, as of December 31, 1969-1970
"-~--- -~-------
Yea!' I Primary Middle
--~:~~ -r' '--i:-' 3,537 3,252
Advanced
931 757
Medical
458 397
. 'In 1970, 3,965 residents including 307 girls were admitted to Training Schools, a
440 decrease from the 1969 admissions. Nineteen-year,olds accounted for 29.5 percent
of the admissions and eighteen years 2704 percent. The main of lenses which resulted
in commitment in 1970 were: Larceny (51.1 percent), rape and indecent assault
(11.4 percent), pre-offensive activities (7.7 percent), extortion (7.5 percent), robbery
(6.5 percent), and bodily injury (5.6 percent). In 1970, 5,284. juveniles were released
from Training Schools of whom 3,163 were released on parole. The average length
of 'stay in 1970 in a Training School was, 452 days for those released on purole and
397 days for those released without parole !;upervision.
During 1970, certificates for completion of compulsory education were rewarded
to 87 percent of those in the Training Schools who had not completed compulsory
education in the sociey. In addition, 4,126 boys and girls obtained, as a result of vocational training and guidance, qualifications or certificates in such fields as abacus,
auto driving, welding, woodcraft, mechanics, printing, sheet medal work, architecture
and others. 0
7. Juvenile Prison
Juvenile offenders convicted in Courts other than the Family Courts are committed
to Juvenile Pri~ons. Juvenile Prisons are more treatment-oriented than adult prisons.
- 43-

An inmdte of a Juvenile Prison may be institutionalized until he reaches the
age of 26.
At the end of 1970, 891 juvenile prisoners were in Juvenile Prisons. a decrease of
343 from~the figj.1re for the previous year. In 1970, 338 juveniles were admlIled to
the nine Juvenile Prisons in Japan. This figure is a 145 decrease from the 1969 figure.
Most of inma.les of. Juvenile Prisons have an indeterminate 'Sentence. There is a higher
percentage of rape and robb9ry aril0ng juvenile prisoners than adult prisoners.
Ninety-eight percent of juvenile prisoners had no previous record of imprisonment,
however, 46.7 percent had previous contucts with the Family Courts and 37.4 percent
had previously been treated in Juvenile Training Schools.
8. Juvenile Probation and Parole
Probation pr placing juveniles on supervision in the community for a specified
period, as stated earlier, is one of the three protective measures that the Family
Court may select to avoid institutiunalization. In 1970, 27,383 new cases were placed
under probation supervision by the Family Courts. This is a 1,384 increase from
the 1969 figure and it is the first time in 'several years that the figure exceeded that
of the previous year. At the end of 1970, there were 53,417 juveniles on probation,
comprising 60.6 percent of total number of probationers and parolees in Japan.
Those juveniles released on parole from Juvenile Training School during 1970
numbered 3,167. At the end of the same year, 4,468 juveniles, or 5.1 percent of the
total probation and parole population, were under parole supervision throughout
Japan.
II. TraHie OHenses'11l
A. General Trends
The h~ghest number of caualties in traffic accidents was recorded in 1970, breaking
the same unhappy record set in the previous year. As shown in Table 26, there were
508 more fatalities than 1969 while the number of persons injured increased 14,096.
Thus 46 persons were killed and 2,688 injured in traffic accidents in Japan each day of
1970.
As Table 26 indicates there was a 434 percent increase in the number of auto
mobiles in 1970 from 1961. Also, the driving population has grown in proportion to
the increase of vehicles. The number of licensed drivers has reached 26,449,229,
approximately one-third of the population over 16 years."")
al)"Traffic Offense" is hereafter used to meall an offense in which vehicles including motorcycles are involved. The term is to cover two main categories of traffic offenses: (1) A Penal Code offense, in which a person kills or injures another through professional negligence; (2) the so-called "administrative offense," In which one violates the Road Traffic Law or other related laws and regulations.
~')Age for licensing is 16 for motorcycles and specified types of compact cars, 18 for ordinary cars, alld 21 (plus driving experience for three years or more) for such big vehicles as fleet trucks and dump-trucks.
-44-
r {
J j
! I 1 J 1
If
I I I
I I! U ! ; j! Ii )1 !
II If , I
Ii
if \ t
. i 1 j j Ii It 11 f j ; t
11 Il n d 11 I·'
If f, , , ! !
t t
·1 I I ! J
Table 26. Number of Vehicles and Casualties Resulting from Traffic , Accidents, 1945 -1970
A I Incidence Yea" utomobiIe Motorcycle Of Traffic Death* f
L , Accidents Injury I
1945 I 144,351 3: ** I 8 706: I : 1950 387,543 91 _** ' 21 3,365 26! 9,904 3:
I -, 33,212 7; 4,202 33· 25,450 I 1955 1,463,749 34 'I 8
J
504,875 171 93,981 19' I 6,379 50/· 76,501 25
1 1960 3,453,116 811
1,999,163 671 449,917 911 12,055 94: 289,156 94' 1961 4,282,542 100
J
' 2,968,311 100 493 "93 100! I I 1962 121 !,u 12,865 100: 308,697 100
5,198,697 3,938,529 133 479 8"5 971/ 11 445 I I . , - , 891 313,813 102'
5,722,037 134 4,900,463 165! 531,966 108i 1 I I 1964 i I 2,301 961 359,089 116 1965 6,775,971 158 5,853,630 197 557,183 113: 13,318 1041
/ 401,117 130j
7,897,499 184 6,721,763 2261
567,286 1151 12,484 97 425,666 1381
1963
1966 9,339,191 218 7,364,040 2481 425,944 . 861 13,904 1081 1"81. . 1967 11,275,859 263 7715516 260 I I 617,775 U I
" 269' 521,481 106: 13,618 106/
212 1968 13,594,859 317 7 988 I 655,377 , ,064 I 635,056 129' 14,256 111
1, 2"8'
1969 16,167,272 378 8,123,378 2741 720,880 146' 828,071 U I 1970 18,586,503 434 I I 16,257 126
J
: 967,000 313, 'I' '-.,;-- ". 8,159,17~5 718,080 145/ 16,765 130 981,096 318;
Death IS used to mean a pe' h d' " ** No reHabl t t· t. ~son w 0 Ies wlthm 24 hours following the accident. e s a IS ICS are avaIlable for the numbel' of motorcycles before 1954.
R.ecent trends of traffic accidents can be characterized as follows:
. Fust, the incidence of fatalities was greater in months in the latter part of the
~ear. The num~e~ of deaths per day was highest in November, followed by December, nd August. InJ~nes per day were highest in August, followed by July and September.
Secondly, pnvate cars (automobiles for the private use) were involved in 746 percent of the total accidents Th" , ' for th . ,: IS may Increase as more people purchase automobiles
l;lr own use. However, taxies were first when the ratio of accidents is calculated per ,000 motor v~hicles by type .0£ vehicles.
B t f . . y ype 0 aCCIdents, car-fo-car accident was th t f T hI 2 e mos requent as shown in
. all' ~ 7. ~lso, rea;r-end C9Ilision was the most' frequent when classifed by type o~ ~o. ISlon, bemg followed by head-on collision. In case of accidents iIivolvin d
~tl'lan~, the highest occurred with persons crossing streets or roads, followed b~ ~:os: m whIch persons were hit when they suddenly rushed into the street.
Table 27. Traffic Accidents by Type of Accidents, 1966 -1970
Yearlpedest~'ian-carl Car-to-car lOne Car I I ACCIdents Accidents I Accidents Others Total
i 1966 132,582(31.3) *1 252,010 (59.5) 1967 145,347(27.9)
37,027(8.7) 1,995(0.5) 423,614(100) 332,257(63.7) 42,016(8.1) 1,861(9.4) 521,481(100) 1968 161,563(25.4) 462,290(67.1)
1969 174,348(24.2) 45,3&8(7.1) 1,815(0.3) 635,056(100)
494,364(68.6) 50,300(7.0) 1,868(0.3) 720,880(100) I 1970 171,027(23.8) 492,921(68.6) 52,427 (7.3) ~
1,705(0.2) 717,080(100) In arenthe ~ p ses 1_ shown the percentage of the total.
- 45-

Finally, there was a 182 percent increase in hit-run cases in 1970 when compared
with 1966. The ratio of hit-run cases to toal casualties in traffic accidents has increased
slightly but 89.4 percent, or the highest percentage recorded to date, were arrested in
1970.
The Traffic Infraction Notification Procedure, or the traffic infraction ticket system,
was established in July 1968 to alleviate the heavy pressures on the agencies concerned
by the sharp increase in traffic cases. This system also aims at avoiding stigmatizating
millions of traffic violators as crimin~ls, since a minor traffic violator may be exempted
from prosecution if he pays a "penalty fine" within a specified time. In 1970, this
system was applied to 78.8 percent of the total adult violators of the Road Traffic Law
and only 4 percent notified by the police failed to pay the penalty fine within the
specified time. Cases that fail to pay the fine are referred to the Public Prosecutor's
Office. The system was expanded in August 1970 to cover juvenile violators of the
Road Traffic Law. From August 20, 1970 to the end of the year, the system was
applied to 145,974 juvenile violators of the Road Traffic Law and only l.B percent
failed to pay the fine. It seems safe to assert on the basis of this experience that
the Traffic Infraction Notification Procedure has heen operating succe'ssfully since its
establishment.
B. Dispositions of Traffic Offenders
In 1970, the number of suspects received by the Public Prosecutor's Office for
-46~
,I ! ,I
-I
'! I I 1 -1
I I ! 1
t I
I ! 1
! !,
il I
I 1 I I II !
r t !
, ·1
professional negligence causing homicide and bodily injury and grossly negligent
homicide and injury amounted to 680,336, or 62.4 percent, of the total Penal Code
offenders received during the year. Also, violators of the Road Traffic Law and other
traffic laws constituted 92 percent of the total !:luspects for violations of special laws.
The rate of prosecution against traffic offenders was 71.6 percent in cases con.
cerning with professional negligence causing homicide and bodily injury, 68.6 percent
in grossly negligent homicide and bodily injury cases, and 93 percent for the Road
Traffic Law violators. Summary orders, however, were requested for 96.5 percent,
78.7 percent, and 98.9 percent respectively of these cases. It is noted that more and
more traffic offenders who cause fatalities are being formally indicted. Thus a total
of 47.1 percent of all offenders prosecuted for causing fatalities in professional or;
gross negligence were formally indicted in 1970, twice the percent in 1960.
As Table 28 indicates, persons found guilty for professional negligence or gross
negligence in 1969 was apprOXimately 50,000 greater than the previous year.
I
*
Table 28. Dispositions by the Court of First Instance of Cases Resulting from Professional or Gross Negligence Causing Ilomicide and Bodily Injury, 1959, 1966 - 1969
Year ,Impl'isonment Imprisonment
'TotaI(A)! without Labor , with Labor i ,-" .'-_. -J--~'--.: -- ""--'I--~-I ! Total(B)i Unsuspended i TotaI(C) Unsuspendedl
Fine
1959 73,237 1,233 303 (24.6)* I 71,999 1.7
1965 202,197 6,489 1,884 (29.0) 195,708 . 3.2 1966 230,970 7,249 2,213 (30.5) 223,721 : 3.1 1967 281,455 2,418 (30.5) 273,525 ; 2.8 1968 I 387,019 2,894 (30.3) 310 177 (57.1) i 377,169 2.5 1969 438,685 2,537 (29.4) 1,939 1,043 (53.8) 428,109 ! 2.4
In parentheses are the percentages of the total (B) or (0).
Of 8,637 professional or gross negligent offenders causing fatalities sentenced to
imprisonment without prison labor, 2, 537, or 29.4 percent, were imprisoned and the
remainder had their sentence suspended. Imprisonment with prison labor was
expanded to include professional negligence when the revised Article 211 of the Penal
Code was enacted on June 10 .. 1968. Of. 1,939 offenders sentenced to imprisonment
with prison labor in 1969, 1.043, or 53.8 percent, were actually imprisoned and the
remainder had their sentence suspended. The length of sentence was relatively
short for both categories of imprisonment with approximately 70 percent of them
ranging from 6 to 12 months.
Regarding the fines, 93.9 percent of offenders fined for professional negligence
causing fatalities paid fines of between ¥30,000 and ¥5o,000, whereas 57 percen!' of
-47-

those who were fined for incurring injuries in professional neglkJellce paid between
¥lO,OOO and ¥30,OOO.
The Research and Training Institute completed a survey in 1970 on 1,452 traffic
~ffenders who were sentenced to imprisonment by 25 selected District Courts. This
survey reveal;d a disparity in the suspension of sentences among different types of
traffic crime. The terms of sentences tended to become longer as the damages to
victims in traffic accidents became more serious. Also, sentences tended to be more
severe in cases where victims or other persons did not make a contribution to the
accident. Of the 294 persons in the sample who were sentenced to imprisonment
with prison labor, 47 percent were involved in hit-run accidents. The rest committed
at least one or several of the foUowiw;l three types of violations: Drunken driving,
driving without llcen,se, and speeding.
C. Juvenile Traffic Offenders
Because of the age limit fo7.' licensing, and the fairly limited opportunities for
driving, the percent of juveniles among traffic offenders has been relatively law.
Table 29 indicates the number and percent of juveniles among traffic offenders
received at the Public Prosecutor's Office.
--
Table 29. Juvenile Traffic Cases Referred to the Pub1ic Prosecutor, 1969-1970
I Professional Negligent! Gross Negligent \ Violation of the Road I i !lo,micide and Bodily i Homicde and Bodily , Traffic Law Year ~ InJury Injury
I
1 Total I Juvenile (96) 1 Total I Juvenile (%) I Total I Juvenile (96) I
(12.0)*1
I 1,122 (38.5) \4,135,1091 581,979 (14.1) 19G9 I G71,G23I 80,GOG 2,912
1970 G78,031 80,224 (11.8) 2,305 935 (40.G) 5,309,4241
G75,849 (12.7) I
':' In parentheses are the percentages of Juvemles among the total.
Among the total juvenile Penal Code offenders, however, traffic offenders
comprised 40.3 percent of the total, and 97.4 percent of the juvenile Special Law
violators. 'rhe large proportion of juveniles among gross negligent offenders is
explained by the extremely high rate of non-lif.'~\:nsed drivers among juvenile traffic
violators. Figure 6 shows the juvenile violators of the Road Traffic Law by type of
violation. The adult traffic violators are also shown for the sake of comparison.
Among the juvenile traffic cases disposed of by the Family Court, 29.8 percent of
violators -w~re referred back to the Public Prosecutor's Office for possible criminal
the professional or gross negligent cases and 9.3 percent of the Road Traffic Law
prosecution in 1969. This is a considerable decrease in both - categories from the
previous year. Also, 4.6 percent of the professional or gross negligent c~ses and
89.2 percent of the Road Traffic Law violators were discharged by the FamIly Court
either with or without a court hearing.
-48 -
Figure 6. Juvenile and Adult Traffic Violators by Type of Violation, 1970
Juveniles Adults
A: Speeding G: Improper Passing B: Driving without License H: Disobeying Signals C: Improper Parking I: Failure to Carry License D: Failure to Stop J: Drunken Driving E: Disregarding Special Restrictions K: Others F: Over-loading
A survey conducted by the Research and Training Institute of the Ministry of
Justice indicated that more than 70 percent of the juvenile traffic offenders were
either 18 or 19 years old, More than 60 percent committed minor Road Traffic Law
violations without causing casualties. The majority were charged with being either
non-licensed drivers or speeding. Personality-wise, juvenile traffic offenders were
found to be non-inhibitive, hyper-active and outgoing. A test battery of intelligence,
personality, and driving aptitude tests were found to be effective in revealing their
special personal features.
Matsuyama Training School startec\ to operate in January 1969 as a short term
training school for traffic offenders and in March, 1970, the Uji Training School started
operating as a driving training center for juvenile traffic offenders.
D. Treatment of Traffic Offenders
1. Correction
During 1970, a total of 3,817 persons convicted for professional negligence causing
casualties, and 406 Road Traffic Law violators were admitted to correctional facilities.
Since 1968 when imprisonment with prison labor was introduced to include traffic
-49 -

~, i
offenders, the number of traffic offenders in institutions has increased constantly.
Table 30 below shows traffic offerlders imprisoned as of the end of 1970.
1'able 30. Traffic Prisoners by Type of Offense, as of Dcccmber 31, 1970
Typ~ of Offense
Professional Negligence Causing Casualties Gross Negligence Causing Casualuies Road Traffic Law Violators
Total
, Imprisonment I without Prison
Labor I I
!I 1,361 (97.3) *
32 (2.3)
6 (0.4)
1,399 (100)
Imprisonment with Prison Labor
Traffic Offense Only
797 (75.3)
26 (2.5)
235 (22.2)
1,058 (100)
Combi'ned with other Penal
Code Offeneses
288 (26.6)
21 (1.9)
772 (71.4)
1,081 (100)
I« In parentheses are the percentages of the total.
Fifty-six percent of traffic offenders imprisoned without labor and 42 percent of
those imprisoned with prisOl:. labor received sentences of between 6 and 12 months.
Prisoners sentenced to imprisonment for less than one year have increased from the
previous year both in actual numbers and rate. The age of traffic offenders confined
in prisons are predominantly in their twenties with 67 percent of traffic offenders
imprisoned without prison labor, and 59 percent of those imprisoned with prison labor
under 30 yeats. It was also revealed by the survey that very few traffic prisoners
had previous record of imprisonment. 92.5 percent of traffic offenders imprisoned
without prison labor and 83.4 percent of those impriso.ned with prison labor had
never previously been committed to a correctional institution.
The research and Training institute of the Ministry of Justice conducted two special
research studies of traffiC offenders. One covered 1,825 male prisoners who com
mitted traffic offenses and were confined in prisons as of November 10, 1970. The
other covered 368 traffic offenders confined in correctional institutions within the
jurisdiction of the Tokyo Correctional Headquarters. The two studies indicated that
apprOXimately 80 percent of the subjects were below LQ. 100. Over 30 percent of
these had I.Q. below 79, and 14.4 percent of the hit-run cases and 15.6 percent of
Ihose who failed to report to police after causing an accident were below LQ. 69.
The LQ. of traffic offenders, however, was found to be higher than the I.Q. of non
traffic offenders. The studies tried to determine the levels of social adjustment of
traffic offenders ill. ;:;risons as well as in the community by use of Sentence Completion
Test. The traffic offenders were found to be more adjusted than non-traffic prisollers in
their family life as well as in their employment. However, comparison of traffic
offenders imprisoned without prison labor to those imprisoned with prison labor
suggested that those imprisoned with labor had more social maladjustment problems.
- 50-
t 1
J j 1
I I J
i J
I
This tendency was more apparent in their adjustments within prisons. When asked
their view of the accidents, 44 percent of traffic offenders imprisoned without labor
responded that the victim was also to blame. The majority of traffic offenders without
labor answered that the accident were due to their being in a hurry while driving,
whereas those imprisoned with labor claimed they were absent-minded or irritated at
the time of the accident. ApprOXimately one-third of traffic offenders were dissatisfied
with their sentence. It was noteworthy that those imprisoned with prison labor ex
pressed more resentment at "Choeki" or imprisonment with prison labor. This term
implies that they committed heinous crimes and traffic offenders regard themselves
as negligent offenders and want to be treated differently. Their attitudes while driving
reflected more problems than average drivers and it was conspicuous among the
traffic offenders that they tended to ignore traffic rules and regulations. Moro personal
problems were found among those offenders who committed either non-licensed
driving, hit-run cases, drunken driving or speeding, whereas more visual and physiolo
gical problems were identified with those who failed to yield or to pass properly.
The life history of trqJfjc offenders indicated that before coming to prisons they
maintained more stable work and family life than non-traffic offenders. Also, they
had higher educational background than that of non-traffic offenders.
Open correctional treatment has been developed on traffic offenders without prison
labor, who are predominantly negligent offenders, with less personal problems and
who are not security problems. Since 1964, persons who satisfied the following con
ditions have been sent to one the six institutions in Japan for speCialized treatment of traffic offenders: nn)
I) No concurrent sentence to imprisonment with prison labor;
2) no previous record of imprisonment;
3) a sentence of more than three months;
4) no serious mental or physical handic(lp;
5) and no security problems.
On December 31 of 1970, 49 percent or 696 traffic offenders without labor were
assigned to the six prisons, with the remainder being confined either one of the four
other prisons with specified services for traffic offenders or in the other ordinary
prisons.
After ten days in solitary cells during the orientation period, traffic offenders in
six institutions live in dormitories, are allowed to move freely Within the buildings,
not searched, and in principle are unguarded within the facilities. Receiving visitors
'):I) The six prisons are: Ichihal'a Prison, Kakogawa Prison, Toyohashi Branch of Nagoya Prison, Saga Prison, Yamagata Pl'ison, and Saijo Branch of Matsuyama Prison.
- 51-

,,'
"
and correspondence are encouraged and counseling services are available to them.
For those who wait employment not requiring driving after leaving the institution,
information on the labor market, advice on the selection of employment, and basic
vocational guidance programs are available to them. For tho'se who wait to be
engaged in driving again and those who have aptitude for driviI1g, lectures and field
work to improve their driving techniques and increase their knowledge in traffic rules
and regulations as well as skill in automobile engineering are provided. Three
hundred hours of institution distributed over two months are allocated for this purpose.
Only 10 percent of traffic prisoners with labor and 6 percent of those without labor
received disciplinary punishment for violatinos of prison regulations during their stay
in prison. The behavior of traffic offenders both within prisons and after release
seem to be more acceptable than non-traffic prisoners. For instance, a follow-up study
of the Correctional Bureau indicated that among the 3,D47 separations from Ichihara
Prison for traffic offenders, only 28, or 0.9 percent, came back to prisons. This attempt
of more open treatment for traffic offenders is presently operated as a pilot study with
the hope that the same kind of treatment may expand to cover the other types of
offenders in the future.
2. Probation and Parole
Of 55,319 probationers or parolees received at Probation Offices in 1970, 32.7
percent were traffic offenders. Of the total traffic offenders received at Probation
Offices, juvenile probationers comprised 79.2 percent, training school parolees 0.3
percent, prison parolees 15.8 percent, and adult probationers 4.7 percent. It is note
worthy that more than half of the juvenile probationers admitted to the case load were
the traffic offenders and their number has been on an increase with slight modification.
Combined with ordinary probation or patole services, specified services for traffic
offenders have been attempted at Probation Offices. New trends in treating traffic
offenders within probation or parole services included the use of guided group inter
action or group work methods.
As compared with non-traffic probationers or parolees, traffic offenders terminated
their supervision periods more successfully in all categories of probation and parole.
III. Female Offenders
:r'he number of female suspects investigated by the Police as Penal Code offenders
has tended to increase with minor fluctuations the past several years. The number
of female Penal Code suspects in 1970 was 11,197, or 1.7 per 1,000 female population
14 years or older; Table 31 compares the number of males and females interrogated
by the Police and the percent of female to the total, cr stable percentage the past
several years.
- 52-
'rable 31. Number and Uate of Suspects of Penal Code Oli'endel;'s, Investigated by the Police by Sex, 1966 - 1V'it}
r-· ~-~''''.'-~~.--'--''~ ~ ~~.-.-"'-.------....... '---,""-- .---,,," __ ~ "".,,,~. __ ~->.-. I Female Male Female
Percent i Yeal'--N~~b~;~-r Rate* N~~~b~-;'·-I----Rat~;- i '-'---'~I--=-~-t------i----+--~----I 1966 53,542 1.4 686,513 18.5 7.2 I 1967 54,403 1.4 748,175 18.7 6.8
1968 60,810 1.5 862,681 22.6 6.6
~:~~_J __ ~~~:~_L ,_l~~ __ ~l'~~::~~~_, L.,,_~~~_ .. J ~,,_;:, ' .:' Rate pel' 1,000 population of 14 years or older.
The increase of female suspects is due to the increase in the cases of professional
negligence causing casualties, since arrests for other Penal Code offenses have been
negligence causing casualties, since arrests for other Penal Code offenses have been
1970 and professional negligence causing casualties 33.4 percent. Consequently,
other types of offenses do not loom very large in the female crime picture. Approxi
mately, one-half of the female Special Law offenses were violators of the Road Traffic Law.
Female offenders are not only small in number and as a percent of all offenders
but they also tend to be treated more leniently at each stage of the criminal procedures.
Of 48,804 females suspects disposed of by public prosecutors in 1970, only 46.3 percent
were prosecuted compared to 67.0 percent of the male suspects. This lower rate of
prosecution of female suspects has, however, steadily increased the past five years
due to the increase of cases of professional engligence causing homicide or bodily
injury in traffic accidents. About 71.5 percent of the 1,782 females sentenced to
imprisonment received cr suspended sentence, compared to 54.8 percent of males. A
total of 568 women wree committed to prisons, 2.2 percent of the total admission in
1970. The 20 to 25 yeal;s age group has the most male and female offenders. Table
32 compares suspected Penal Code offenders by age and sex in 1970. Females tend
to retain cr highe): crime rate in the older age groups as compared with males.
Table 32. Penal Code Suspects by Age and Sex, 1970 r"--" -.--'--,~- .,., Female ,'-_····i:r-u-le---·-- . , ''''P~:cent of : Age Range -,. ~ . Female to
I Number I Perce~et-i-N;~b~lP;~:~ent Male
. - :::~ - i ~i.~::-r :::! I ~~:: T :::: 25-29 11,948 I 13.4 /' 209.873 I 17.6 30-34 10,587 I 11.9 141,913 I 11.9 35-39 10,399. 11.7 , 112,241 I 9.4 40-49 13,963 15.7 I 121,972 I 10.2 50-59 5,885 6.6!' 48,337 I 4.0
i 60&Over t 3,112 f 3.5 , 20,965. 1.8
6.6 5.3 5.4 6.9 8.5
10.3 10.9 13.0
'_ _ ' t _ 1 _ I
C=~.~~t~l=']~-~~~~:.~~]· 100~-._]-'1~93,717·J 1~D.0.J .. __ .~,_.~.: - 53-

[1 i1
I
j
1
It is also noted that 89 percent of the female Penal Code suspects were considered
first offenders, and only 59 percent of the male suspects were considered as first
offenders.
IV. Crimes Committed by Government OHicials
In 1970, a total of 16,826 public officials were called to the attention of the Public
Prosecutors, excIudislg those who violated the Road Traffic Law, an increase of ap·
proximately 2,000 over 1969. This increase reflects an upsurge in persons charged
with professional negligence causing bodily injury and death in traffic accidents.
The highest prosecution rate concerned public officials charged with traffic offenses
where negligent homicide or bodily injury was involved, however, the majority of
these cases ':Iere disposed ,of by summary court orders.
Included are 648 persons referred to the Public Prosecutors for abuse of official
authority. and majority of these complaints involved members of various law enforce
ment agencies. Of 722 cases disposed of by Public Prosecutors during 1970, where
abuse of official authority was charged only one case was brought to trial. The
evidence of abuse was determined to be either non-existent or insufficient for prose
cution in the other cases. By way of contrast approximately 60 percent of the 574
bribery cases disposed of by Public Prosecutors during the year v.rere brought to trial.
The increase in the number of local governmental officials involved in these bribery
cases is noteworthy, 34.6 percent of the 1773 suspects investigated by the police
for bribery during 1967, 1968 and 1969, were local officials engaged in civil engineer
ing and construction or YJere members of local assemblies. In 1969, the courts of
first instance 'sentenced 34.1 percent of the cases where bribery was charged to a
term of more than one year imprisonment. Of 211 persons charged with bribery and
sentenced to imprisonment, 92.4 percent received a suspended sentence. This rale
of suspended sentence is high when compared with the average rate of suspended
sentences for all penal code offenses, approximately 50 percent. This can be explained
by the fact that these public officials have experienced serious social sanctions and
they can not repeat their offenses, since they have lost their positions as public
officials by being sentenced to imprisonments.
V. . Crime and Mental Disturbance
The Mental Health Law provides Prefectural Governors with the power to commit
mentally disturbed persons a mental hospital upon the certification of mentally illness
by two psychiatrists. The same law provides that officials of law enforcement agencies
have the right to inform the Prefectural Governor of any persons suspected of being
mentally disturbed. A total of 7,590 persons were thus reported in 1970 by the law
- 54-
I I
I
,f;-f
.\1\~~~1i{t:- '
enforcement agencies and 6,435 of them were found to be in need of care. Psychiatrists
are employed to undertake mental examinations of suspects in nine District Public
Prosecutor's Offices in metropolitan areas. A total of 2,730 suspects were referred for
examination by psychiatrists during the past three years. Of persons referred, 2,339
(2.159 males and 180 females) were subsequently classified as having some mental
disorder. The diagnosis of these 2,730 percents was as follows: 669 or 38.6 percent,
as alcoholics or addicts of some sort, 538 or 2.3 percent schizophrenic, 405 or 17.3
percent as mentally retarded and 328 or 14 percent psychopathic personality disorders.
Although approximately 36 percent had stable employment, only 32.1 percent lived
with their families and 40.3 pcerent had previous records of hospitalization in mental
hospitals. 71.1 percent had previous criminal records and 25.8 percent had previously
been committed to prisons. Theft was the most common offense, next was bodily
injury and ass=It followed by fraud and homicide. 67 percent were dropped without
prosecution. The public prosecutor notified the Prefectural Governor of 1.351 cases
of whom 945 were hospitalized. The public prosecutor dropped without prosecution
47 percent of the cases.
The percentage of the mentally disturbed amC''1g all offenders has not been
worked out yet. Among juvenile cases, psychiatric ~xamination determined that 10.3
percent of all cases examined had some form of mental disturbance. Of the juveniles
classified .as mentally disturbed 60 percent were classified as mental retarders, and
30 percent psychopathic personality, disorder. Both the actual number and the rate of
juveniles classified as mentally disturbed has been on a gradual decline. Table 33
shows, by type of offense, the juvenile mentally disturbed cases included in the Family
Court dispositions (excluding violators of the Road Traffic Law) in 1989.
The table includes only those juveniles who were referred for mental examination
and classification. The table indicates that about 40 percent of arson offenders are
mentally disturbed, followed by 20 percent in indecency and 20.6 percent in homicide.
Acts by insome persons are not punishable by statutory penalty and punishment
for a mentally deficient person is reduced (Article 39 of the Penal Code). Another
survey of 620 recidivists who once found not guilty or not prosecuted because of
mental disorders between the years of 1956 to 1970 reveals an example of the relation
between 'mental disorders and recidivism. The notable phenomenon was the fact that
359, or 57.9 percent of the total repeated the same type of crime again. The rate was
100 percent for prostitution, 75.8 percent for theft, 68.0 percent for fraud, 64.3 percent
for rape and indecent behavior, 51 for assault and bodily injury. Among the above
620 recidivists, 476 were hospitalized, of whom more than 50 percent were released in
- 55-
'J

six months, 80 percent were released in one year, that is relatively short period.
and juvenile training schools is listed in Table 34.
Finally, the rate of the mentally disturbed among the inmates both in prisons
and juvenile training schools is listed in Table 34 below.
Table 33. 'l'he Mentally Disturbed among Juvenile Non-Traffic Cases Disposed of by Type of Crime, 1969
Type of Crime
Penal Code Offenders Larceny Robbery Fraud Extortion Bodily Injury Assault Intimidation Homicide Rape Indecency Arson Others
The I Type of Mental Disturbance -I
Total ,M!:!ntally! B ------1 Psycho '-I ---I (A) DIsturb --A--(?6), Mental pathic- N Psy-
,ed , retarda-I Person- eu- I cho-(B) rosis
tion 11 ality I path Disorder
18,822
9,434
676 187
1,881
1,155 86 30 99
112 22 12
29
10.0
12.2 12.7 16.0 6.6 I
G.4 7.6
17.9 20.6 7.7
21.7 40.0
4.3 !
1,153
778 30 19
51
54
10
561 ! 282
42
7
43
50
8 4
19
40
21
7 1 1 1
2
2 '
127
74
7 3 4
7 4
3
7
7
1
i Special Law I Violators
1,508 1,743
289 67
141 1,600
272 80
2,825 940
123 59
32
122 92 9.8
8 5
75
33 20
70 52
17 8
40 29
3 2
3 10 I
8
I
Pre-delinquent Juveniles
Total
1,950 272 13.9
2,245 10.3
169 84 1 18
1,374 674 44 153
TabJe 34. The Mentally Disturbed among Inmates of CorrectiOJ1al Institutions, as of December 20, 1970
Type of Institution
--------~--- --------~ j j Mentally j j Breakdown of Mental DisOl:der : Inmate; Dis- ,B ---'--~-~--I' )' (A) d d ! -A- 'Feeble Psycho-, Neu-I I or (~e) : (96) I Mind- i path I rosis
I Psy- ; I chosis ': I '
\-I 1 _____ ,_ : I :d_~_es_s __
! 38,911 2,184 I (38.8)*1
I Prison 5,622 (100)
14.4
.T uvenile i . !
_ ~~~hl~:~~_~l __ ~,~I~_L (~5~~ __ .Jl~:~_",_ ,;, In parentheses are the percentages of (B).
VI. Crimes Committed by Student Groups
494 i
(59.8)*;
2,914 (51.8)
257 (31.1)
99 (1.8) :
I I
13 ' (1.6) I
425 (7.6)
62 (7.5)
One of the recent significant features of the crime phenomens in Japan is a
- 56-
~================== ~,..,;. ~
marked increase of violent group crimes committed mainly by student groups both
on and off the campus. While the number of persons received by the public pro
secutor for violent crimes of this kind was 6,200 in 1968, it jumped to 13,292 in 1969,
and in 1970 sharply decreased to 4,558 due to the normalization of school campus.
However, it must be noted that the means and instruments used by these students
in the commission of their crimes have became more and more radical and brutal.
Airplane hijacking, bank-robbery and attacks on police box illustrate a recent tendency
to adopt extreme forms and any means for political purposes. Of 4,558 suspects
referred to the public prosecutor in 1970, 793 or 24.6 percent were prosecuted, 2,427
were not prosecuted, and 1,133 were referred to the Family Court as juveniles. The
major types of crimes committed by these suspects were unlawful assembley with
weapons and interefeJ;ence with a governmental official in the performance of his duty.
Of defendants who were tried for violent group crimes committed in 1968, 1969
or 1970 and sentenced by the court of first instance as May 1971, 2,274 were conVicted,
18 were determined to be not guilty, 12 were dismissed, 2 were remitted. Table 35
shows the breakdown of dispositions against 2,242 convicted defendants.
Table 35. Breakdown of Dispositions of Radicals, 1970 -.-~-!
Rate(96) Punishment I Number _,~j_ I~l;;-is-o-n-m-e-n-t-_with Prison L~~~-'·---\ -- .---- 216 1 .,---------9-.6 ----~
Imprisonment with Prison Labor .. followed by Suspension of 1,844 82.3 Execution of Sentence I
j Imprisonment without Prison Labor followed by Suspension of I'
Execution of Sentence , Fine
l Minor Fine I Punitive Detention I
2
164 15
1
0.1
7.3
0.7 0.0
"~·--l-·---·2-'2-42-"-·'''--'' __ ''-_-_~~10~O~.0_--~-_-_''-_-_ Total 1,, _____ ----
Family Court disposion of 2,257 ju",eniles who were involved in violent group
crimes ill 1970, 883 or about 39.1 percent were dismissed without hearing and 1,154 or
nearly 51.1 percent were dismissed after hearing, 57 or 2.5 percent were sent to the
public prosecutor for prosecution and 143 or 6.3 percent were placed under probation.
-:)7 -

1
1 1 J • 1
I I j
LIST OF TABLES
PART ONE: GENERAL VIEW OF CRIME
Table 1. Penal Code Offenses, Number Cleared and Number of Suspects
Investigated by the Police, selected years ............................ :2
Table 2. Penal Code' Offenses, Number Cleared and Number of Suspects
Investigated by the Police Excluding Professional Negligence
Causing Homicide and Bodily Injury, selected years .................. 3
Table 3. Penal Code Offense Suspects, Persons Indicted and Convicted per
100,000 of the Cril!linally Responsible Population, selected years ...... 4
Table 4. Penal Code Offense Suspects, Persons Indicted and Convicted
Excluding Professional Negligence Causing Homicide and Bodily
Injury per 100,000 Criminally Responsible Population, selected years .... 4
Table 5. Penal Code Offenses Known to the Police, Cleared by Them and
Suspects Investigated by Type of Crime, 1970 ........................ 5
Table 6. Trends in Penal Code Offenses Investigated by the Police by Crime
Categories, 1960-1970 .............................................. G
Table 7. Special Law Offenses, 1970 .....................................•. '" 8
PART TWO: TREATMENT OF OFFENDERS
Table B. Percentage of Suspension of Prosecution, 1966-1970 .................. 11
Table 9. Trends in Dispositions, 1966-1970 ................................... 12
Table 10. Distribution of Prison Sentence, 1970 ................................ 14
Table 11. Percentages of Suspended Sentence within the Total Convicted
Defendants by Category of Major Crimes, 1969 ...................... 14
Table 12. Admissions by Type of Offense, 1970 ................................ 16
Table 13. Average Daily Resident Population, Prisons and Detention Houses,
1966-1970 ......... " ., ............................................ 17
Table 14. Inmate Classifications, as of December 20, 1970 .............•........ 18
Table 15. Production Breakdown - Prison Industries, 1969 •...................... 20
Table 16. Numeric,al Trends in Probation and Parole, 1966-1970 ................ 24
Table 17. Disposition of Probaiion and Parole Offenders, 1970 .................. 20
Table 18. Percent of Absco~ders to Total Probationers and Parolees, 1966-1970 '" . 26
- 58-
1
PART THREE: SPECIAL CRIME AND CRIMINALS
Table 19. Juvenile and Adult Penal Code Suspects, 1946-1970 .................. 32
Table 20. Juvenile and Adult Major Pellal Code Suspects, Exchlding Traffic
Negligence Cases, 1951-1970 ........................................ 33
Table 21. Breakdown of Juvenile Penal Code Suspects, 1970 .................... 34
Table 22. Transition of Juvenile and Youth Population, 1960-1972, 1975 .......... 35
Table 23. Penal Code Offenders Investigated by Age Group, 1960-1970 .......... 36
Table 24. Final Dispositions of Family Court for Non-Traffic Casss, 1969-1970 '" .42
Table 25. Number of Inmates in Training School. as of December 31, 1969-1970 .... 43
Table 26. Number of Vehicles and Casualties Resulting from Traffic Accidents,
1945-1970 ......................................................... 45
Table 27. Traffic Accidents by Type of Accidents, 1966-1970 .................... 45
Table 28. Dispositions by the Court of First Instance of Cases Resulting from
Professional or Gross Negligence Causing Homicide and Bodily
Injury, 1959, 1966-1969 .............................................. 47
Table 29. Juvenile Traffic Cases Referred to the Public Prosecutor, 1969-1970 ..... .48
Table 30. Traffic Prisoners by Type of Offense, as of December 31, 1970 .......... 50
Table 31. Number and Rate of Suspects of Penal Code Offenders Investigated
by the Police by Sex, 1966-1970 ..... " ....... , ., .... " ............... 53
Table 32. Penal Code Suspects by Age and Sex, 1970 .......................... 53
Table 33. The Mentally Disturbed among Juvenile Non-Traffic Cases Disposed
of by Type of Crime, 1969 .......................................•.. 56
Table 34. The Mentally Disturbed among Inmates of Correctional Institutions,
as of December 20, 1970 ........•...........•....................... 56
Table 35. Breakdown of Disopitions of Radicals, 1970 .....•.•.•................ 57
LIST OF FIGURES
Figure 1. Number of Suspects by Type of Offense Received by the Public
Prosecutor, selected years ..................... ,...................... 1
Figure 2. Parole by Percent of Sentence Served, 1970 .......................... 23
Figure 3. Juvenile Justice System of Japan ..................................... 30
Figure 4. Penal Code Offenders Investigated by the Police by Age and Type
of Offense, 1970 .......•......................................... , .. 36
Figure 5. Type of Violation of the Road Traffic Law, 1970 ........................ 46
Figure 6. Juvenile and Adult Traffic Violators by Type of Violation, 1970 ......... .49
- 59-

~'F~ .. ---