Macrophage MicroRNA-155 Promotes Cardiac Hypertrophy and Failure
Upload
independentCategory
view
2download
0
INTERNATIONAL JOURNAL OF PSYCHOPHYSIOUKjY
International Journal of Psychophysiology 19 (1995) 149-176
Developmental aspects of bereitschaftspotential during goal-directed behaviour
Giuseppe August0 Chiarenza * , Marica Villa, Gabriella
in children
Vasile
Istituto di Neuropsichiatria Infantile, Universit2 degli Studi di Milano, via Besta I, 20161 Milan, Italy
Received 9 August 1993; revised 25 October 1994; accepted 5 January 1995
Keywords: Bereitschaftspotential; Goal-directed behaviour; Skilled performance task; Maturation
1. Introduction
From the first moment of an infant’s life the parents’ attention is focused on their new-born’s motor behaviour, because they believe intuitively that therein lies all the information they need to judge the integrity and functioning of the nervous system of the new-horn. The infant’s motor be- haviour appears to be stimulus driven and when self-initiated, not goal-directed, it resembles the unintentional behaviour following ablation of the frontal cortex (Luria, 1966).
Study of self-initiated actions in animals has inherent difficulties, because the behaviour is rarely self-paced without the presentation of a stimulus (Fuster, 1984). Despite this, studies of the organisation of animals’ movements have gen- erated a hypothesis that a purposeful act has a neuronal basis: it involves diverse areas of the cortex that are part of a distributed re-entrant interconnected system in which motor functions do not reside in individual areas, but in several cortical and subcortical areas. Support for this hypothesis was derived from studies of trained
* Corresponding author. At: Servizio di Neuropsichiatria Infantile, Azienda USSL, Corso Europa 250, I-20017 Rho (Milano), Italy. Fax: ( + 39-2) 9356 1312.
animals performing behavioural tasks involving eye or arm movemerits (Cynader et al., 1988).
The study of the organisation of self-paced movement by electrophysiological techniques was initiated by Kornhuber and Deecke (19651, who reported that self-paced movements of the index finger are preceded by a slow, negative, cerebral electrical activity that lasts for about 800-500 msec, defined as the Bereitschaftspotential (BP). The movements employed were a simple, un- skilled, self-paced extension or flexion of the fin- gers. Subsequently, Papakostopoulos (1978a) in- troduced a paradigm demanding interaction be- tween the subject and his environment.
Since then more complex paradigms have been used to study this motor action. By the term “subject-environment interaction” Papakostopou- 10s (1989) means “a situation in which the indi- vidual’s plan and action towards a goal can be continuously updated on the basis of the results achieved after each attempt. In such a be- havioural sequence individual attempts are inter- linked because the preceding ones influence sub- sequent ones. After each attempt new informa- tion is available to be used, provided that the subject chooses to do so.” The method of study- ing goal directed behaviour employed a task called a “skilled performance task” (Papakostopoulos,
0167-8760/95/$09.50 0 1995 Elsevier Science B.V. All rights resewed SSDI 0167-8760(95)00002-X
150 G.A. Chiarenza et al. /International Journal of Psychophysiology 19 (1995) 149-I 76
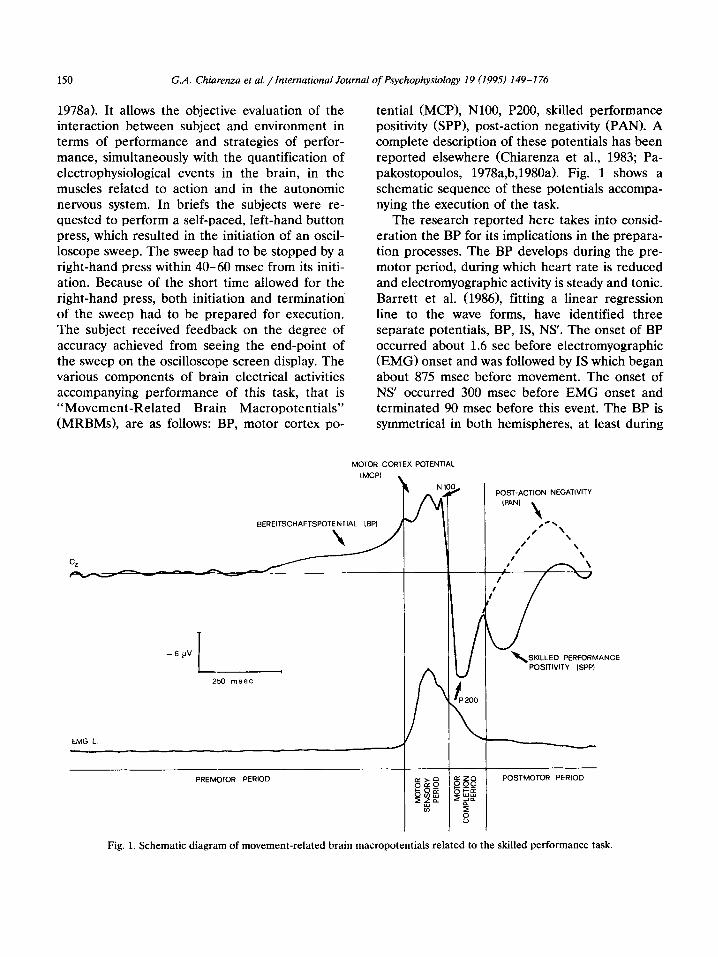
1978a). It allows the objective evaluation of the interaction between subject and environment in terms of performance and strategies of perfor- mance, simultaneously with the quantification of electrophysiological events in the brain, in the muscles related to action and in the autonomic nervous system. In briefs the subjects were re- quested to perform a self-paced, left-hand button press, which resulted in the initiation of an oscil- loscope sweep. The sweep had to be stopped by a right-hand press within 40-60 msec from its initi- ation. Because of the short time allowed for the right-hand press, both initiation and termination of the sweep had to be prepared for execution. The subject received feedback on the degree of accuracy achieved from seeing the end-point of the sweep on the oscilloscope screen display. The various components of brain electrical activities accompanying performance of this task, that is “Movement-Related Brain Macropotentials” (MRBMs), are as follows: BP, motor cortex po-
tential (MCP), NlOO, P200, skilled performance positivity (SPP), post-action negativity (PAN). A complete description of these potentials has been reported elsewhere (Chiarenza et al., 1983; Pa- pakostopoulos, 1978a,b,1980a). Fig. 1 shows a schematic sequence of these potentials accompa- nying the execution of the task.
The research reported here takes into consid- eration the BP for its implications in the prepara- tion processes. The BP develops during the pre- motor period, during which heart rate is reduced and electromyographic activity is steady and tonic. Barrett et al. (19861, fitting a linear regression line to the wave forms, have identified three separate potentials, BP, IS, NS’. The onset of BP occurred about 1.6 set before electromyographic (EMG) onset and was followed by IS which began about 875 msec before movement. The onset of NS’ occurred 300 msec before EMG onset and terminated 90 msec before this event. The BP is symmetrical in both hemispheres, at least during
MOTOR CORTEX POTENTIAL
IMCP) ,
SEREITSCHAFTSPOTENTIAL BP1
EMG L /
PREMOTOR PERIOD
f
N 101 ,OST-ACTION NEGATIVITY
IPAN)
1 /-\
, \ I \
1’ \
I \ , \
I
7-
\ SKILLED PERFORMANCE POSITIVITV ISPP)
POSTMOTOR PERIOD
Fig. 1. Schematic diagram of movement-related brain macropotentials related to the skilled performance task.

GA. Chiarenza et al. /International Journal of Psychophysiology 19 (1995) 149-176 151
the first second. During the 500 msec preceding phasic EMG onset, BP is greater in the contralat- era1 hemisphere during unimanual tasks both in right-handed and left-handed subjects. During bi- manual skilled tasks BP is symmetrical over pre- central areas in right-handed subjects and asym- metrical in left-handed subjects, greater over right precentral regions (Papakostopoulos, 1980b). The BP amplitude is proportional to the complexity of the task both in children and adults (Papakosto- poulos, 1978a; Chiarenza et al., 1980; Kitamura et al., 1993; Kristeva et al., 1990; Niemann et al., 1992). It is independent of electromyographic ac- tivity and the applied force and is also absent during passive movements. Its amplitude does not change when the subject receives a visual feed- back of the result of his action (Papakostopoulos et al., 1986).
The BP is recorded over frontal, central, pre- central and parietal regions. Cortical and scalp recordings have shown that the BP reflects the activity of the primary motor areas and scalp recordings have shown that the BP reflects the activity of the primary motor areas and the sup- plementary motor area (Boschert et al., 1983; Boschert and Deecke, 1986; Ikeda et al., 1992; Neshige et al., 1988; Sakamoto et al., 1991). In a previous paper, Chiarenza et al. (1983) described the developmental characteristics of BP in a group of children aged 8-13 years. A consistent BP appeared in children of 10 years; in younger children it was absent and it was positive at precentral and central locations. Its negativity decreases with age. This phenomenon begins af- ter the fourth decade of life and tends towards positivity after the age of sixty. These observa- tions were made with single-handed unskilled tasks (Deecke, 1978), whereas no differences in BP amplitude were detected between old and young during skilled tasks (Papakostopoulos and Banerji, 1980).
The BP is reduced in all situations where there are movement disorders such as in Parkinson’s disease (Deecke et al., 1977; Dick et al., 1989; Papakostopoulos et al., 1990) or where there is a disturbance of intentional behaviour as in schizophrenic (Chiarenza et al., 1985) and men- tally retarded patients as well as those with learn-
ing disabilities (Chiarenza, 1990,1993). The BP is believed to reflect the process of mental prepara- tion/intention to act (Libet et al., 1983). The BP has been proposed as an electrophysiological in- dex of cerebral efficiency during the premotor period (Papakostopoulos, 1978a).
The aim of this paper was to report further results obtained from a larger group of subjects aged between 8 and 13, together with new groups of 6-, 7-, 14- and 18-41-year-olds, and also to study the development of the BP in the frontal and parietal regions.
2. Materials and methods
Subjects The 119 male voluntary subjects selected for
the study were subdivided on the basis of age as follows: 17 aged 6, 17 aged 7, 21 aged 8, 17 aged 9,17 aged lo,13 aged ll-12,8 aged 13-14, and 9 adult subjects. All subjects met the following re- quirements: they were right-handed, natural Ital- ian speakers, without any sensory, visual or audi- tory defects, or any history of neurological symp- toms including seizures or behavioural disorders. All had good school records. To establish the above criteria all children were submitted to codi- fied clinical and psychological tests prior to the start of the research (Chiarenza et al., 1982).
Ability tests Previous history relating to birth and develop-
ment was obtained from the parents, a detailed school profile was constructed by the teachers, and a clinical neurological test based on the mi- nor neurological dysfunction protocol (Touwen, 1979) was administered. A series of tests of intel- ligence, motor-perception and linguistic abilities were given. These included: the Wechsler Intelli- gence Scale for Children-Revised (WISC-R; Wechsler, 1976) and the Culture-Fair Cattell Test 2 Form A (Cattell, 1951); the Italian adaptation of Oseretsky’s Motor Development Scale (Zucchi et al., 19591, laterality test (Harris, 1968); Bender Visual Motor Gestalt Test for Children (Koppitz, 19641, Rey’s Complex Figure copy and memory test (Rey, 19691, Goodenough’s Test (Gesell and

152 GA. Chiarenza et al. /International Journal of Psychophysiology 19 (1995) 149-176
Amatruda, 19741, Draw a Family Test, Stambak’s Test (Stambak, 1965), Reading and Writing Tests for subjects over 7 years old, including a Recogni- tion Test of meaningful/meaningless words and a Spelling Test (Italian version of the Metropolitan Achievement Test) (Faglioni et al., 1969,197O). 6-year-old subjects were given the Ll B.A.S.E. Reading Test (Primary School Set) (Vegetti, 1971). For 7-year-old subjects an objective read- ing test consisted of POL3/67-DIA-B decipher- ing, POL1/67-ER-1 accuracy and speed (Grasso-Magrin and Tornai-Vinciguerra, 1969).
The Skilled Performance Task (SPT) The subject sat in an armchair, 70 cm from an
oscilloscope, in a lighted and electrically shielded room, holding a push-button in each hand. The excursion of the button was 5 mm. The task consisted of starting a sweep of the oscilloscope trace with a left thumb press and stopping it within a predetermined area of the oscilloscope screen by a right-hand press; the sweep velocity was 1 mm/msec; the target area corresponded to a time interval between 40 and 60 msec from the onset of the sweep.
After a verbal explanation of the task, one of us demonstrated several trials, the subjects hav- ing to indicate the performance results. Subse- quently, subjects themselves were given a short period of practice. None of the subjects had previous experience of this task, or of any other type of motor test. Recording was begun only after subjects had demonstrated an ability to stop the oscilloscope sweep at least twice within a 40-60 msec interval. This practice also enabled subjects to learn to control eye-movements and blinking during the execution of the task, and to pace their trials at intervals between 7 and 20 sec. Subjects were asked to remain relaxed during the task and to avoid muscular preparatory move- ments before pressing.
EEG recording Ag/AgCl electrodes were fixed to the scalp
with collodion over prefrontal (Fpz), frontal (Fz), central (Cz), right precentral (RPC), left precen- tral (LPC), parietal (Pz), right parietal (P4) and left parietal (P3) regions. These last two locations
were not used for the adults. Each electrode was referred to linked mastoids. Bipolar EOG was also recorded. The surface electromyogram was recorded from the flexor muscles of the right and left forearms. Electrode impedance was < 3 k0. The EEG was amplified with Physio-Amp Marazza preamplifiers: time constant and low- pass filters (6 dB/octave) were respectively 8.0 set and 70 Hz for the EEG and 0.03 set and 700 Hz for the EMG. Data acquisition was controlled by a PDP-11/23 computer system interfaced with a MINC data collection system. The analysis started with sampling for each channel, a square wave of f 25 PV for calibration and equalisation procedures. A trigger pulse generated by the left-hand button press was used to initiate the data samples for each channel. Data were sam- pled at a rate of 250 Hz for 2.2 set preceding the trigger pulse and 1 set immediately following it. An average of the first 1 set of the sample was used to establish a baseline from which all ampli- tudes were measured. Amplitudes values were equalised across channels on the basis of a stored calibration pulse.
Data analysis Performance was measured as the time inter-
val between the two presses and defines as “per- formance time” (PT). Target performance (TP) was defined as the number of trials in which the sweep was terminated within the correct, 40-60 msec, target interval. Sweep termination < 40 or > 60 msec were designated as errors. Errors were further classified in terms of “performance shift” (PS), defined in terms of the distance of the end of the sweep from the target area. For every subject, four blocks of 25 sequential trials free of muscular artifacts, blinking, or eye-movements were averaged and measured. Amplitude and on- set of BP were measured as follows. The method of moving average was employed to determine the BP onset. We established that BP onset, if present, should appear in a time interval of 1200 msec before EMG onset. Two averages were cal- culated for each point in this interval, the first being the mean of the potentials at all points that precede the fixed one, excluding the last nine, and the second being the mean of the potentials

GA Chiarenza et al. /International Journal of Psychophysiology 19 (1995) 149-176 153
at the 20 points around the fixed point (the nine preceding the fixed point itself and the ten fol- lowing). Consequently, the point at which the second mean constantly remains greater as an absolute value than the first is chosen as that corresponding to the onset of BP. The twenty points value corresponding to an interval of 80 msec was chosen on the basis of the experimental data because the result was ideal for correctly identifying the onset of BP. The least squares method by means of simple linear regression was employed to isolate the left EMG onset. The mean amplitude of BP was computed for 200- msec periods immediately preceding the left- EMG onset.
and for each electrode location to BP onset and amplitude (the dependent variables) to test the effects of age, time in the experiment or blocks and IQ (the independent variables). In each case, analysis of variance was performed to test the significance of the multiple regression yielding F values as in Table 3 and to test the significance of the individual regression by means of Student’s t-test. The f signs of the regression coefficients revealed the direction of the regression.
3. Results
Statistical analysis The following statistical analyses were con-
ducted on performance and BP amplitude and onset: means, standard deviations (SD) and tests of normal distribution. Kurtosis and skewness values were assumed to be indices of normal distribution, with confidence limits at 95% and 99%. Wilcoxon tests were used to compare the performance values of each age group with the following one. Furthermore, the test for paired data was calculated to ascertain possible differ- ences of BP in each location. Because of the underlying hypothesis concerning the maturation effects of BP and performance, analysis of data was based on multiple linear regression. This technique was applied to performance measures
All the subjects adequately performed the task which appeared similar to that used for a video game. The task stimulated the desire to improve. This positive attitude emerged not only during the interview at the end of the experimental session, but also in the target performance trend, which increased with practice.
Only 7 children of 6 years of age were not able to complete one hundred trials without artifacts due to problem or difficulty in controlling their posture and blinking. Naturally, to complete 100 trials without artifacts, children of 6, 7 and 8 years had to perform more trials with respect to those of an older age. The comparison of the values of performance discarded for artifacts with those accepted, by means of Student’s t-test, did not show any statistical significant differences.
Table 1 Mean values (X) and standard deviations (SD) of performance averaged over subjects in each age group
Parameters Age (years)
6 7 8 9 10 11-12 13-14
PT msec X 99.6 102.7 89.9 86.6 66.3 65.9 62.4 SD 56.5 42.7 38.4 32.0 16.7 12.3 16.0
PS msec X 54.5 52.2 41.6 37.0 19.4 16.2 13.8 SD 49.7 39.6 32.4 26.4 10.8 9.26 13.0
%TP X 20.2 19.0 20.9 21.2 29.5 35.2 37.2 SD 13.0 13.6 13.2 13.0 12.8 13.2 13.9
% E < 40 msec X 22.8 14.7 18.8 16.6 19.9 15.4 18.3 SD 20.0 12.6 16.5 16.1 17.0 10.6 14.2
% E > 60 msec X 56.9 66.2 60.1 62.1 50.4 49.2 44.3 SD 25.7 21.1 24.5 25.1 19.6 17.1 20.6
18-41
57.4 17.3 14.0 9.81 32.0 13.2 28.1 22.3 39.8 25.2
PT = performance time; PS = performance shift; TP = number of target performance; E = errors.

154 GA Chiarenza et al. /International Journal of Psychophysiology 19 (1995) 149-176
Performance Table 1 shows for every age group the means
and SD of performance time (PT), performance shift (PS), target performance (TP) and the errors < 40 and < 60 msec.
Children of 6 and 7 years presented a greater mean value of PT 99.1 msec (SD = 56.6) and 102.7 msec (SD = 42.71, respectively. From the age of 7, PT regularly decreased by about 10 msec every age group until 9 years old. From the group of 9 year olds to the group of 10 year olds there was a greater difference (9 years = 86.6, 10 years = 66.3 msec). This last value in the next age groups (11-12 years = 65.9 msec and 13-14 years = 62.4 msec) remained constant. The adult group showed a further improvement (PT = 57 msec). Comparison of the values of performance time in every age group to the following one by means of Wilcoxon test showed significant differences only between the ages of 9 and 10 (Table 2).
years = 37.03 msec). From 9 to 10 years of age PS decreased by about 20 msec (19.4 msec). Further increases in accuracy during adolescence and in adult life are marginal. Comparison of the values of PS in every age group to the following one using the Wilcoxon test, has shown significant differences only between the ages of 9 and 10 (Table 2).
Evolution of accuracy has the same character- istics as those previously described for PT. Chil- dren of 6 and 7 years of age presented a greater value 54.6 msec (SD = 49.7) and 52.2 msec (SD = 39.6), respectively. After the age of 7 and up to 9 the PS decreased by about 10 msec per year (9
Children of 6 and 7 obtained the lowest num- ber of target performance, 20 (SD = 13.0) and 19 (SD = 13.6) respectively. Again, the most conspic- uous differences in TP were between 9 and 10 years (9 years = 21, 10 years = 29). This value continues to increase with age until a maximum number of 37 in adolescents of 13-14 years of age. Adults obtained a TP value of 32. Compari- son between number of target performance in every age group to the following one by means of Wilcoxon test, has shown significant differences between the ages of 9 and 10, and between the ages of 10 and 11 to 12 (Table 2). Meanwhile, for the performance errors < 40 msec there were no signs of a characteristic trend with regard to age; the > 60 msec errors decreased with age passing from a maximum of 65 in children of 7 years of age to that of 39 in adults.
Table 2 Performance time, performance shift and percentage of target performance of each age group compared with the following by means of Wilcoxon’s test.
Age (years) No. in group Performance time Performance shift % Target performance
Median (msec) Z score P Median (msec) Z score P Median (msec) Z score P
6 17 86.0 43.8 20.2 1.00
7 17 100.3 - 1.28
8 21 89.2 - 0.33
9 17 86.8 - 2.53
10 17 63.6 - 1.46
11-12 13 64.5 -0.94
13-14 8 60.9 - 1.29
18-41 9 60.3
n.s. 45.4
n.s. 37.8
ns. 37.0
18.5 ILS.
14.0 n.s.
10.8 n.s.
11.7
0.24 n.s. -0.17 n.s. 18.3
- 1.03 n.s. 0.27 n.s. 20.0
-0.68 n.s. 0.16 n.s. 20.0
-2.94 b 2.41 a 29.0
-1.36 n.s. 1.73 b
34.0 -0.72 n.s. 0.68 n.s.
36.0 -0.38 n.s. - 0.88 n.s.
35.0
n.s. = not significant. a p < 0.05. b p < 0.00s.

GA Chiarenza et al. /International Journal of Psychophysiology 19 (1995) 149-I 76 155
Both groups showed an improvement with practice. Fig. 2a shows the trend of PT with practice for all ages. Observation of the trend of the average performance time in the four blocks clearly shows the existence of two groups: one between the ages of 6 and 9 and the other be- tween 10 years and adults. In fact, at the end of the first block of 25 trials, the first group ob-
+lOyears
+ll-12 years
-l-13-14ysars A PERFORMANCE TIME
-adults
40
20
t
04 I
1 2 3 4
blocks
B PERFORMANCE SHIFT
80 -
70 --
60 _.
50 --
0 40s- E
30 -.
20 --
10 +
01. 4
1 2 3 4
blocks
Fig. 2. Mean values of 25 performance times (a) and perfor- mance shift (b) of each age group across the four sequential blocks.
-K-IO years
i+ll-12yean
--5-13e14 yeam TARGET PERFORMANCE
IO t
OJ I
1 2 3 4
blocks
Fig. 3. Mean values of number of target performance of each age group across the four sequential blocks.
tained a number of PT between 107 and 126 msec, whilst the second obtained a number of PT between 70 and 76 msec. With the exception of the 6-year-old children, the first group, with prac- tice, improved their PT progressively up until the fourth block of trials. In the second group, mas- tering the task took place in the first 25 trials, since improvement in PT during the following blocks was marginal. The best performance time, however, could be found in adults in the first block of trials and was maintained for the rest of the three blocks. Analogous observations can be made for performance shift (Fig. 2b).
Fig. 3 demonstrates the trend of TP with prac- tice for the various age groups. All of them, with the exception of adults, during the last 25 trials, obtained a greater number of TP than that ob- tained during the first 25. The lo-year-old chil- dren in the first block of 25 trials obtained more or less the same results as the 6-9-year-old group. In fact, a TP of 21 was obtained, similar to the lower group, which achieved between 15 and 18, and not to that of the older group, which scored between 31 and 33. However, after 25 trials, the

156 G.A. Chiarenza et al. /International Journal of Psychophysiology 19 (1995) 149-176
Table 3 Summary of multiple linear regression of performance of all subjects, in terms of performance time (PT), performance shift (PS),
percentage of target performance (TP) and errors (El < 40 msec and > 60 msec related to age and time in the experiment. For each independent variable, age and time, the computed t values of the partial regression coefficient and the regression coefficients
averaged (av. reg.) over all subjects are shown.
Parameters PT PS %TP E < 40 E > 60
Age t value - 7.44 b -8.90 b 8.44 b - 0.78 -4.51 b
av. reg. - 0.50 - 0.52 0.22 - 0.02 - 0.20
Time
t value - 5.34 b -5.18 b 3.82 b 3.21 b -4.56 b
av. reg. - 8.09 - 6.80 2.27 2.23 - 4.51
F-value 44.59 b 56.12 b 45.12 b 5.35 b 21.92 b
= p < 0.05. b p < 0.001.
lo-year-olds obtained a greater increase in TP, thereby reaching that obtained by the following age group and finished the task with a TP num- ber of 35, similar to those even older.
The simple linear regression showed that with age and practice PT, PS and > 60 msec errors decrease and the number of TP increases in a highly significant manner (Table 3).
MRBIt4S Tables 4 and 5 present the mean values and
SD of onset and BP amplitude in various cortical
areas recorded for each group. Normal distribu- tion anaIysis performed on all the data combined for all subjects showed that BP had a significant normal distribution over all locations except in Fpz (Table 5 and Fig. 4). Observation of mean BP values for each age group reveals that BP has different maturational peaks and plateaux in the various cerebral areas recorded. There exists a phase of rapid development between the ages of 6 and 7, which reaches its peak at about 7.5 years over the central and precentral areas and is fol- lowed by a plateau until about the age of 10.5
Table 4’ Mean values (X) in msec and standard deviations (SD) of BP onset over all locations recorded for each age group
Age (years) FPZ FZ cz PZ RPC LPC P4 P3
6 X 233 202 162 124 100 107 107 137
SD 311 288 240 190 199 209
7 x 400 368 380 294 292 343
SD 522 486 441 438 405 444
8 X 252 187 279 227 233 223
SD 365 314 326 331 313 341
9 X 237 190 300 329 223 21.5
SD 377 273 341 421 293 282
10 X 214 316 390 305 254 311
SD 283 364 388 331 339 349
11-12 X 350 486 577 408 453 425
SD 416 398 374 328 324 295
13-14 X 637 601 534 579 515 568
SD 412 342 374 459 389 408
18-41 X 441 434 496 447 526 513
SD 402 346 356 416 346 364
211 201 231 232
389 304 186 176
341 304 342 259 420 382
335 338 381 346 516 447 281 328
647 593 485 462
In this table and in the following ones: Fpz = mid-prefrontal; Fz = mid-frontal; Cz = vertex; Pz = mid-parietal; RPC = right
precentral; LPC = left precentral; P4 = right parietal; P3 = left parietal.

G.A. Chiarenza et al. /International Journal of Psychophysiology 19 (1995) 149-176 157
Table 5 Mean values (X) in PV and standard deviations (SD) and indices of skewness and kurtosis of BP amplitude over all locations recorded for each age group
Age (years) FPZ FZ cz PZ RPC LPC P4 P3
6
7
8
9
10
11-12
13-14
18-41
Skewness SE t value
P Kurtosis SE t value
P
X SD X SD X SD X SD X SD X SD X SD X SD
2.20 7.55 1.64 7.00 2.14 5.30 2.34 5.31 4.22 5.42 1.24 5.23 1.68 6.09 1.65 4.35 0.39 0.11 - 3.42 b
0.53 0.23 2.32 a
0.36 - 0.28 6.80 7.85 - 3.25 -5.68 5.76 5.21 - 1.69 - 2.27 4.92 6.20 - 2.09 -5.17 4.02 4.76 - 1.89 - 6.58 6.73 7.39 - 4.60 -7.15 4.63 7.87 - 1.87 -7.13 6.74 7.44 - 6.53 - 8.33 5.02 6.23 - 0.02 0.05 0.12 0.11 - 0.23 0.47
El ,“::3 0.25 0.23 0.84 1.87 n.s. n.s.
2.44 7.82 - 1.34 5.65 1.71 3.98 - 1.19 6.06 0.08 6.54 - 4.73 5.14 - 4.66 3.24 - 7.10 4.74 0.05 0.12 0.03 n.s. 0.06 0.25 0.25 n.s.
1.12 1.06 6.85 6.49 - 3.57 - 3.66 4.93 5.37 - 0.56 0.07 4.91 5.56 - 2.92 - 2.56 4.26 4.36 - 3.89 - 3.32 6.44 6.34 - 6.05 - 6.01 4.91 4.33 - 4.50 -5.02 5.65 5.05 8.96 - 8.37 4.74 4.89 0.03 - 0.05 0.11 0.11 0.26 -0.51 n.s. n.s. 1.16 0.55 0.23 0.23 5.04 2.39
b a
1.42 1.04 6.52 6.30 - 1.20 - 2.20 4.34 4.73 0.01 - 0.05 4.20 3.83 - 1.69 -2.10 5.20 5.20 - 1.44 - 1.71 6.07 6.30 - 4.98 - 6.37 4.84 5.66 - 6.66 - 6.32 3.71 3.65
0.16 0.13 1.21 n.s. 0.30 0.26 1.17 n.s.
0.10 0.13 0.82
;1:;9 0.26 0.35 n.s.
SE = standard error; n.s. = not significant, = p < 0.05. b p < 0.001.
years. After this, a new phase of development in Fig. 5 shows the BP grand average in children the frontal and parietal regions begins and termi- of 6 years old. BP is absent as a negative ramp in nates in adulthood. Between the 6-year-old chil- all recorded cerebral areas. The prefrontal and dren and adults there is a difference of about 400 parietal areas show a modest, positive deflection msec in BP duration; it increases with age. of about 2 p with a duration of about 230 msec
I.4 IN MAX i SD SE -36.0-t 13.13 -5.64 66’9 .33
N= 442 STEP 2.95
1 2 3 4 3 6 7 9 10 li 12 13 14 1s
Fig. 4. Example of normal distribution of BP amplitude in Cz on all the subjects combined.

158 G.A. Chiarenza et al. /International Journal of Psychophysiology 19 (1995) 149-l 76
and 120 msec, respectively. This was not, how- ever, usual for all children. In some, this positive phenomenon was found over all cerebral areas, sometimes dominating over frontal areas and sometimes over the central ones (Fig. 6). In other children positive BP was present in all areas in the first 25 trials, but in the following 25 was present with a negative polarity. In others, BP
had negative polarity limited over the frontal and central areas (Fig. 7).
Fig. 8 shows the BP grand average in children of 7 years old. In most of them, BP was present as a negative ramp over all the cerebral areas and predominant over the frontal and central regions with a greater amplitude than that of those of 6-, 8- and 9-year-olds. BP has a mean duration over
LPC -_J RPC =-___a__._
cz _,,
p3 - p4 -
_l____i ^_-_..__-_.A LEMG I REMG I
Fig. 5. Grand averages of BP and rectified EMGs of the left (L) and right (R) forearm flexor muscles. Each trace represents the average of 17 6-year-old subjects. In this figure and in the following ones the vertical bar indicates the instance of the computer
trigger and a calibration signal of -5 F. The time scale is 2200 ms.

G.A. Chiarenza et al. /International Journal of Psychophysiology I9 (I 995) 149-l 76
all recorded cerebral areas of 317 msec, 171 msec greater than the 6-year-old group, 97 msec greater than the 8 year olds and 56 msec greater than the 9 year olds.
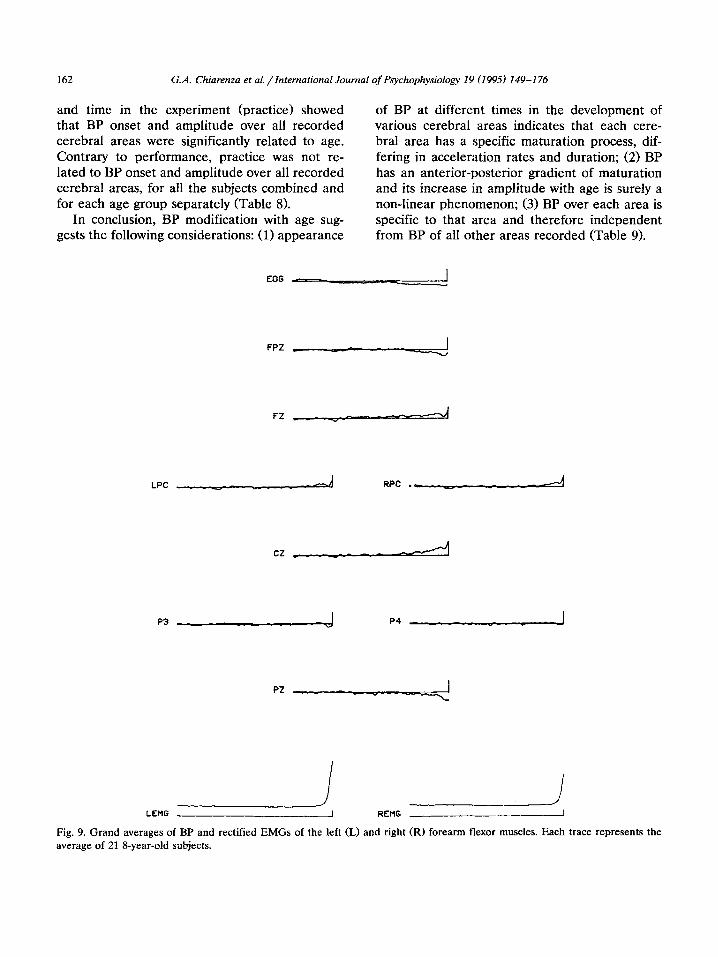
Fig. 9 shows the BP grand average in the g-year-old group. BP is consistently more present than in the preceding groups, over the frontal and central areas, but absent in parietal areas. In Cz, BP shows a greater amplitude (-5.1 /.L) in
159
comparison with the other locations. Over Fpz and Pz, BP is still positive.
Fig. 10 shows the BP grand average for 9 year olds. BP is present over anterior and central regions. Over the parietal regions it is slightly present over P4 and P3, but is absent over Pz. On Cz there is a greater amplitude of BP. In some exceptional cases BP was consistently present over all recorded cerebral areas (Fig. 11).
EOG_ -
LPC vv
P3
/ RmG
_--- LEMG - ____._ ~- __ __- -. .- - -3
Fig. 6. Average BP and rectified EMGs of 95 trials of a subject 6 years old. Note the presence of positive BP over anterior, central and posterior areas and the amplitude difference between the two precentral locations and between the hvo parietal locations.

160 G.A. Chiarenza et al. /International Journal of Psychophysiology 19 (1995) 149-I 76
Fig. 12 shows the BP grand average for chil- dren of 10 years old. BP was greater over the central and precentral regions than in children of 9 years old, but was of a similar amplitude over the frontal and parietal areas. Here, BP behaved as in the 9-year-old group. When present, it was over lateral parietal areas (P4, P3 regions and not on Pz).
It is after this age, in the 11-lZyear-old group, that BP is consistently recorded over all the cere-
bral areas and, in respect to 10 year olds, BP amplitude over precentral areas doubles, while it quadruples in frontal and parietal areas ( - 7.1 p) (Fig. 13).
The 13-14-year-old group is characterised by an increase in BP duration in respect to the preceding group by about 120 msec. The ampli- tude over the frontal and central areas is similar to that of 11-12 year olds, whereas over the parietal area it increases in amplitude (Fig. 14).
EOG --x *A. _._.____ _--A
RPC /,.,r\n.#
Fig. 7. Average BP and rectified EMGs of 100 trials of a 6-year-old subject. Note the absence of positive BP on Fpz, negative BP over anterior and central locations only, different amplitude of BP over precentral areas and absent BP over parietal areas.

GA Chiarenza et al. /International Journri rl of Psychophysiology I9 (I 995) 149-I 76
A further increase in BP amplitude over all recorded cerebral areas can be observed in the adult group, in which it doubles over the precen- tral and parietal areas in comparison to the ado- lescent group. These amplitude values are similar to those found on Cz. BP duration seems to be more even over the various cerebral areas and longer duration is recorded over the precentral areas rather than at the vertex (Fig. 15).
161
Table 6 shows Student’s t-test results for paired data, when onset and BP amplitude values of each cerebral area have been compared to those of the other areas. BP onset on Cz is significantly different from BP onset of all other cerebral areas. BP amplitude over each cerebral areas is highly significantly different from the BP ampli- tude of all other areas considered (Table 7).
Linear regression analysis of BP related to age
LPC _/ RPC .__wvv_/i
P3 /
LEMG
Fig. 8. Grand averages of BP and rectified EMGs of the left CL) and right (RI forearm flexor muscles. Each trace represents the average of 17 7-year-old subjects.
162 G.A. Chiarenza et al. /International Journal of Psychophysiology 19 (1995) 149-176
and time in the experiment (practice) showed that BP onset and amplitude over all recorded cerebral areas were significantly related to age. Contrary to performance, practice was not re- lated to BP onset and amplitude over all recorded cerebral areas, for all the subjects combined and for each age group separately (Table 8).
In conclusion, BP modification with age sug- gests the following considerations: (1) appearance
of BP at different times in the development of various cerebral areas indicates that each cere- bral area has a specific maturation process, dif- fering in acceleration rates and duration; (2) BP has an anterior-posterior gradient of maturation and its increase in amplitude with age is surely a non-linear phenomenon; (3) BP over each area is specific to that area and therefore independent from BP of all other areas recorded (Table 9).
LPC .d RPC .-_.ped
p3 _/ P4 _
J -J LEMG I REMG __.I
Fig. 9. Grand averages of BP and rectified EMGs of the left (L) and right (R) forearm flexor muscles. Each trace represents the average of 21 g-year-old subjects.

GA Chiarenza et al. /International Journal of Psychophysiology 19 (1995) 149-176 163
Analysis of multiple linear regression to test the correlation between performance and IQ of WISC-R and Culture-Fair Cattell tests has shown that performance is related to intelligence. In particular, children whose total IQ is higher give a better performance in PT, PS and TP. Verbal and performance IQ of WISC-R are correlated positively and significantly with the number of target performance only (Table 10). Even correla-
EOG _
tion between BP onset and BP amplitude and the intelligence test was statistically significant. BP onset, in particular, is significantly and positively correlated with the verbal IQ WISC-R over all cerebral areas considered except for Cz and RPC and with total IQ WISC-R only at P4 (Table 11). On the other hand, BP amplitude is significantly correlated to all three IQs of the WISC-R test on all recorded cerebral areas. Children with a higher
LPC _+-__-.1_/1 RPC .--.__-+__/i
P3 k P4 k
LEMG
2, ____ii REMG
Fig. 10. Grand averages of BP and rectified EMGs of the left (L) and right CR) forearm flexor muscles. Each trace represents the
average of 17 9-year-old subjects.

164 GA. Chiarenza et al. / International Journal of Psychophysiology 19 (1995) 149-176
RPC
PZ
I 1
.A ^ _ ._-rr-----* _.I_*__-.“.---wcy
LEMG ~c._- _^ .- ..J REtlG _____-_ ___---- I __-.- -
Fig. II. Average BP and rectified EMGs of 95 rrials of a Pyear-old subject. Note the absence of positive BP on Fpz, and the presence of negative BP homogeneously distributed over all locations recorded.
IQ had a greater BP (Table 11). The IQ of the Culture-Fair Cattell test is positively and signifi- cantIy correlated with BP onset only at P4 and with BP amplitude at LPC and P3 (Table 11).
4. Discussion
In this research, children showed great interest in the task, which they compared to video games
aiming for the highest number of successful hits. Advanced programming, bimanual co-ordination, learning the correct timing intervai and analysis of proprioceptive and visual feedback are needed for a correct execution of the skilled performance task. Characteristics of the task were adequately and consistentiy fulfilled by children of 8 years and more. With children of 6 and 7 years old, performance is characterised by increased vari-

GA Chiarerua et al. /Intermtionul Journal of Psychophysiology 19 (1995) 149-176 165
ability; In fact, they experienced great difficulty in following the correct bimanual sequence, often anticipating pressure of the right button (stop) in respect to that of the left (start), at other times pushing both buttons simultaneously. They un- derstood the short time interval between the two, but were incapable of correct timing. They expe- rienced great difficulty in self-pacing the trials, immediately performing a new one to correct the
previous score or to repeat their last good hit. Their action was more dependent on visual feed- back than on accurate programming. The verbal report at the end of the experiment was limited to an elementary explanation of procedure (“first I push the left button and then the right”). Asso- ciated arm movements were also present during thumb pressure in 6 and 7 year olds. By the age of 10, fine motor co-ordination is fully developed,
LPC ,_z”rl RPC <._
cz _1/1
P3 __ P4 -
1, / LEMG REIIG
Fig. 12. Grand averages of BP and rectified EMGs of the left CL) and right CR) forearm flexor muscles. Each trace represents the average of 17 lo-year-old subjects.

166 GA. Chiarenza et al. /International Jaur maI of Psychophysiology 19 (1995) 149-176
through the capacity to selectively inhibit muscles not involved in the action. Presumably, this is due to an aspect of cerebral cortex maturation when the cerebellum and proprioceptive system is fully developed (Touwen, 1979). In the function of bimanual coordination the corpus callosum is ac- tive in the cross-integration of sensory and motor information (Jeeves et al., 1988; Preilowski, 1972, Preilowski, 1975). This information reaches its
maturation at about 10 years of age (Seggie and Barry, 1972; Yakovlev and Lecours, 1967; for a review see Innocenti, 1986). Numerous reaction- time developmental studies have shown that or- ganisation of the temporal structure of an action improves with age, due to biological and environ- mental factors. Sensorimotor integration and tim- ing control are those with more importance. (Hay, 1984; Fuster, 1985; Halsband et al., 1993; Wise,
FPZ _,_..,J
LPC -., RPC d
LEMG 2 d
REMG
Fig. 13. Grand averages of BP and rectified EMGs of the left (L) and right (R) forearm flexor muscles. Each trace represents the
average of 17 11-12-year-old subjects.

GA Chiarenza et al. /International Journat of PsychophysioIogy 19 (1995) 149-l 16 167
1984). For planning a correct strategy and thereby a motor act, children must be able to integrate internal proprioceptive feedback coming from the button press together with external visual feed- back, which gives knowledge of the results. Both feedbacks must be integrated with the program- ming function of movement in the time domain. It seems that in younger children programming and perceptive capacity are not sufficiently inte-
grated to achieve an optimal level of perfor- mance. Therefore, this action can not be consid- ered as “skilled” (see de J Manoel and Connolly (1993, this issue, for definition of skill). Observa- tion of performance suggests that there are two groups. The first, between 6 and 9 year olds, who show continuous improvement in performance throughout the experiment, without apparently reaching saturation or stability beyond which im-
LPCr- _“- RPC we--..
p3 _,.^. p4 d
LEflG -----! RE”ii 4
Fig. 14. Grand averages of BP and rectified EMGs of the left CL) and right CR) forearm flexor muscles. Each trace represents the average of 8 13-14-year-old subjects.

168 GA. Chiarenza et al. /International Journal of Psychophysiology 19 (1995) 149-176
provement is impossible. Children in the second age group, however, developed the right strategy during the first 25 trials to fulfil the task and had only marginal improvement in successive trials. These differences in children cannot be at- tributed to misunderstanding of verbal instruc- tions, to a different training level or lack of commitment in performing the task as they all correctly completed it, respecting the bimanual
motor sequence. They had equal opportunity to practice and, at the end, the older children ex- pressed satisfaction with their successes as the result of their advanced programmed strategy, which took into account the speed of the sweep and conceived the two button press as one single press.
These data support the hypothesis that prepa- ration of movement entails setting a central-
LLHG umt I
Fig. 15. Grand averages of BP and rectified EMGs of the left (L) and right (R) forearm flexor muscles. Each trace represents the
average of 9 18-41-year-old subjects.

GA Chiarenza et al. /International Journal of Psychophysiology I9 (1995) 149-176 169
Table 6 Summary of t-test for paired data of BP onset of all subjects
FPZ FZ cz PZ RPC LPC P4 P3
FPZ FZ
0.062
cz PZ RPC LPC P4 P3
2.19 a - 0.08 - 0.82 - 0.33 - 0.42 - 0.95 3.09 b -0.16 - 1.26 - 0.65 - 0.59 - 1.18
-2.72 b -5.13 b -3.85 b -2.77 b - 3.54 b -0.93 - 0.42 - 0.53 - 1.40
0.95 0.94 0.34 0.35 - 0.32
- 0.84
= p < 0.05. b p < 0.001.
Table 7 Summary of r-test for paired data of BP amplitude of all subjects
FPZ
FPZ FZ
-18.61 * *
cz
- 20.73 l l
PZ
-8.83 * *
RPC
- 18.68 * *
LPC
-18.25 **
P4
-9.60 * l
P3
- 10.87 * l FZ cz PZ RPC LPC P4 P3
- 10.84 l * 4.54 l * -5.26 l * -3.33 l l 2.36 l * 0.90 * * 13.53 l ’ 9.52 * l 10.54 * * 11.21 * * 9.84 * *
-9.36 * * -8.50 * * -5.49 * = -8.13 * * 1.78 * * 6.58 * * 4.30 l *
4.89 * * 3.49 * * -2.79 ’ *
* p < 0.05. * ‘p < 0.001.
Table 8 Summary of multiple linear regression analysis of BP of all subjects related to age and time. For each independent variable, age and time, the computed I values of the partial regression coefficients and the regression coefficients averaged (av. reg.) over all subiects are shown.
FPZ FZ cz Pz RPC LPC P4 P3
BP onset Age 1 value av. reg. Time t value av. reg. F-value
BP amplitude Age t value av. reg. Time t value av. reg. F-value
2.77 b 0.90
3.48 b 1.06
4.42 b 1.33
4.32 b 1.31
6.56 b 1.79
6.15 b 1.25
6.27 b 5.58
5.19b 4.35
- 0.20 - 3.56 3.84 a
- 1.03 - 17.66 5.44 b
-0.31 - 40.90 9.79 b
- 0.06 - 1.12 9.34 b
- 0.84 - 12.11 21.73 b
- 0.64 - 9.66 19.00 b
- 0.39 - 6.91 19.61
- 0.35 - 6.05 13.51 b
-7.79 b 0.03
- 0.48 0.02
-4.42 b 0.02
-4.77 b 0.02
-7.35 b 0.03
- 7.64 b 0.03
-3.92 b 0.05
-3.37 b 0.04
-0.25 - 0.02 0.06 0.00 0.15 9.82 b
1.04 0.06 1.11 0.89 0.30 0.01 0.26 0.21 11.76 b 27.11 b 30.65 b 29.41 b
1.04 0.43 0.28 0.12 7.99 b 5.72 b
a p < 0.05. b p < 0.001.

170 GA Chiarenza et al. /International Journal of Psychophysiology 19 (1995) 149-176
clock-controlling time sequence that is linked to different afferent and efferent modalities (Hirsch and Sterrick, 1964; Rosenbaum and Patashnik, 1980). Improvement in performance of this clock depends on greater synaptic efficiency of the cen- tral nervous system, which develops with increas- ing age (Craik, 1947). This means more integra- tion of proprioceptive and visual feedback on the accuracy of performance. Further investigation would be necessary to establish if, with extended practice, there exists a better and stable perfor- mance in children of less than 10 years of age.
years. During this first developmental phase of the BP, performance is characterised by strong instability and continuous improvement. There then follows a plateau until the age of 10 years and during adolescence a further growth, which culminates in adulthood. Apart from general im- provement in accuracy of performance and re- duction in the variability during this second phase of BP growth there is a significant increase in target performance in 11-12-year-olds in compar- ison to those of 10 years.
Results regarding BP confirm those already shown in previous work (Chiarenza et al., 1983) concerning the same age group. The similar dou- ble-trend age-dependent results described in the performance can also be applied to the BP. There is a developmental phase of BP characterised by rapid growth that reaches its peak at about 7.5
The BP displays an anterior-posterior matura- tion gradient. First, it is recorded over the vertex and then the precentral areas probably corre- sponding to activity of the supplementary and primary motor areas. This BP maturational rate is uneven, because, while absent in most of recorded areas in 6 year olds, there is a growth peak in 7-year-old children followed by a plateau.
Table 9 Summary of linear regression analysis of BP onset and amplitude of all subjects related to performance in terms of performance
time (PT), performance shift(PS), percentage of target performance (TP)
FPZ FZ cz PZ RPC LPC P4 P3
BP onset PT t value av. reg. F-value
PS t value av. reg. F-value %TP t value av. reg. F-value
BP amplitude PT t value av. reg. F-value
PS t value av. rag. F-value %TP t value av. rag. F-value
- 1.86 - 0.96 3.46
-2.86 b - 1.42 8.20 b
-2.72 b - 1.54 -7.39 b
-3.04 b -2.43 b - 1.87 -2.40 b -2.87 b -2.89 a - 1.46 - 1.21 - 0.84 - 1.11 - 1.49 - 1.42 9.26 b 5.90 b 3.49 5.76 = 8.24 b 8.39 b
- 1.93 - 1.14 3.74
-3.52 b - 2.27 = -2.26 a -2.63 b -2.96 b -3.10 b - 1.92 - 1.29 - 1.15 - 1.39 - 1.7s - 1.71 12.42 b 5.15 a 5.12 a 6.91 b 8.80 b 9.59 b
2.46 = 3.13 b 2.69 a 2.73 b 3.53 b 3.72 b 3.61 b 3.85 b 3.21 4.19 3.28 3.67 3.97 4.34 5.17 5.17 6.05 b 9.82 b 7.24 b 7.44 b 12.49 b 13.87 b 13.05 b 14.85 b
- 1.20 1.36 3.50 b 4.09 b 2.77 b 3.78 b 1.73 2.82 b -0.00 0.01 0.03 0.03 0.02 0.02 0.01 - 0.02 1.44 1.86 12.2s b 16.72 b 7.71 b 14.34 b 3.00 a 8.39 b
- 1.63 1.41 3.75 b 4.03 b 3.11 b 3.87 b 2.15 a - 0.01 0.01 0.03 0.03 0.02 0.03 0.01 2.67 1.98 14.05 b 16.28 b 9.66 b 15.01 b 4.61
-0.18 - 1.94 -2.68 b - 5.08 b - 2.69 a -3.71 a -3.41 b -0.00 - 0.04 - 0.05 -0.11 - 0.04 - 0.05 - 0.07 0.03 3.77 7.19 b 25.81 b 7.24 b 13.78 b 11.63 b
3.10 b - 0.02 9.58 b
-3.87 b - 0.08 14.89 b
= p < 0.05. b p < 0.01.

GA. Chiarenza et al. /International Journal of Psychophysiology 19 (1995) 149-176 171
Structural indices of brain maturation as thick- nesses of cortical grey matter (Rabinowicz, 1979; Conel, 1967), cortical neuron packing density (Schade and Groeningen, 1961) and physiological indices such as quantitative EEG analysis show the similar non-linear phenomenon described for the BP.
appear separately (Hay, 1984). The developmen- tal BP peak in this age group could be a direct consequence of the EEG rhythm modifications and, behaviourally, could express a moment of instability privileging either motor programming or perception.
Our information on BP maturation is consis- tent with maturation trajectories obtained by EEG quantified analysis recorded in the parietal-oc- cipital, temporal, central and frontal areas (Hudspeth and Pribram, 1992). All these four regions exhibited discontinuous maturation rates and five stages were identified. In the second stage of maturation, which spans the period be- tween 6 and 6.5 years of age, rates were synchro- nized across the sensorimotor system with all reaching a peak at 7.5 years; the fifth stage, which spans the period between 17 and 21 years of age is related to maturation of the frontal executive system. During this period, the BP shows its mature form over all the brain regions recorded. Behavioural studies of bimanual simple and com- plex motor tasks, show that 7-year-old children display instability in performance, due to effort in integrating visual feedback to motor program- ming. These two functions increase when they
The developmental peak at about 11-12 years of age in the frontal and parietal regions suggests not only a contemporary maturation in associa- tive areas, but also the hypothesis that these areas are functionally connected. In fact, there are several direct connections between parietal and motor cortices (Zarzecki, 1986). Parietal cor- tex projects to the part of the prefrontal principal sulcus connected to the supplementary motor area (Goldman-Rakic, 1984) and the latter area also receives directly from the parietal cortex (Jones et al., 1978). The BP in these regions should also be distinguished from that recorded at the vertex; with respect to NS’, BP over frontal and parietal areas appears much earlier than electromyo- graphic activity. This could represent those inten- tional programmed processes attributed by Libet et al. (1983) to the BP, in other words a represen- tational function of the motor act necessary and essential for achievement of a goal-directed mo- tor task. Neuropsychological studies have at-
Table 10 Summary of multiple linear regression analysis of BP of all subjects related to age and time. For each independent variable, age and time, the computed t values of the partial regression coefficients and the regression coeffkients averaged (av. reg.) over all subjects are shown.
BP onset
Age t value av. reg. Time
t value av. reg. F-value BP amplitude
Age t value av. reg. Time t value av. reg. F-value
a p < 0.05. b p < 0.01.
FP~
2.77 b 0.90
- 0.20 - 3.56 3.84 =
- 0.48 0.02
- 0.25 0.06 0.15
FZ
3.48 b 1.06
- 1.03 - 17.66 5.44 b
-4.42 b 0.02
- 0.02 0.00 9.82 b
CZ
4.42 b 1.33
-0.31 -40.90 9.79 b
-4.77 b 0.02
1.04 0.30 11.76 b
Pz
4.32 b 1.31
- 0.06 - 1.12 9.34 b
-7.35 b 0.03
0.06 0.01 27.11 b
RPC
6.56 b 1.79
- 0.84 - 12.11 21.73 b
-7.79 b 0.03
1.11 0.26 30.65 b
LPC
6.15 b 1.25
-0.64 - 9.66 19.00 b
- 7.64 b 0.03
0.89 0.21 29.41 b
P4 P3
6.27 b 5.19b 5.58 4.35
- 0.39 - 0.35 - 6.91 - 6.05 19.61 13.51 b
-3.92 b -3.37 b 0.05 0.04
1.04 0.43 0.28 0.12 7.99 b 5.72 b

172 G.A. Chiarenza et al. /International Journal of Psychophysiology 19 (1995) 149-176
tributed ideo-motor prassic functions to these mary motor areas, ready to execute the motor lobes. task. During this phase no other modifications of
It can be proposed that the processes of motor motor strategy are possible (Papakostopoulos, preparation process is accompanied by at least 1988). Rizzolatti and Gentilucci (1988) suggested two phases. The first, a symmetrical phenomenon the existence of an area for “vocabulary of motor and diffused throughout the cerebral area, which act”, which is diffuse over the frontal and parietal should correspond to selection and integration of association areas and the use of these motor acts ideo-kinetic elements, necessary for movement, appears to be the basis of motor cortical organi- begins much earlier than phasic EMG activity. sation. The second, first appearing in children between In accordance with some cognitive and devel- the age of 6 and 8, immediately precedes the opmental psychologists (Bruner, 1970; Piaget and action, and could correspond to activity in pri- Inhelder, 19661, cognitive development in part
Table 11 Summary of linear regression analysis of BP onset and amplitude of all children related to psychometric tests
FIX Fz cz Pz RPC LPC P4 P3
BP onset Verbal IQ t value av. reg. F-value Performance IQ t value av. reg. F-value Total IQ t value av. reg. F-value
BP amplitude Verbal IQ 1 value av. reg. F-value Performance IQ t value av. reg. F-value Total IQ 1 value av. reg. F-value
BP onset Cattel IQ 1 value F-value
BP amplitude Cattel IQ I value F-value
2.10 a 2.53 a 1.73 2.73 b 0.69 2.46 a 3.94 b 3.43 b 4.22 4.61 3.46 5.04 1.40 4.94 7.17 6.32 4.40 a 6.40 a 3.01 7.47 b 0.47 6.05 a 15.53 b 11.80 b
- 0.78 - 0.89 0.21 - 1.13 - 1.41 0.30 0.60 0.80 0.04
-0.18 - 1.37 - 0.06 0.49 0.10 - 0.28 - 2.01 - 0.08 0.78 0.16 0.03 1.89 0.00 0.23 0.01
0.30 0.35 1.62 0.78 0.13 1.70 2.48 = 1.44 0.44 0.57 2.38 1.29 0.19 2.52 4.06 2.38 0.08 0.12 2.64 0.61 0.01 2.90 6.15 2.07
- 1.02 -0.01 1.05
-3.23 b -4.85 b -6.02 b -4.70 b - 0.06 - 0.08 -0.12 - 0.06 10.44 b 23.59 b 36.30 b 22.12 b
-3.99 b - 6.41 b -6.80 b - 0.05 -0.11 -0.12 15.94 b 41.07 b 46.29 b
- 0.47 0.01 0.22
- 0.28 -0.00 0.07
-2.23 a - 4.41 b - 3.41 b -2.56 a - 0.05 -0.10 - 0.08 - 0.05 4.98 a 19.43 b 16.61 b 6.55 a
-3.21 b - 6.43 b -4.85 b -5.41 b - 0.07 -0.15 -0.11 -0.10 10.34 a 41.33 b 23.56 b 29.27 b
-3.39 b -3.59 b - 3.74 b - 0.06 - 0.07 - 0.08 11.50 b 12.88 b 14.02 b
-5.78 b -5.22 b -5.51 b -0.11 -0.10 -0.11 33.44 b 27.26 b 30.37 b
0.97 0.83 1.96 1.28 0.76 1.82 2.77 b 1.49 0.94 0.69 3.86 1.65 0.57 3.33 7.69 b 2.22
1.24 0.19 -1.57 - 1.98 0.56 1.54 0.03 2.48 3.94 a 0.32
- 1.96 a - 0.55 - 2.45 a 3.86 0.31 6.04 a
a p < 0.05. b p < 0.01.
GA. Chiarenza et al. /International Journal of Psychophysiology 19 (1995) 149-l 76 173
consists of development of representational sys- tems as a means of processing information. In children, representation of the reality of the sur- roundings essentially begins through models learnt by movement. Bruner (1970) distinguishes three systems of representation: executive ac- quired through experience; iconic acquired through representation of images; symbolic through the use of language. Executive represen- tation is dominated in many aspects by the char- acteristics of the action itself its sequential and irreversible nature being similar to the procedure description of 6-year-old children. The presence of the BP after 10 years of age could suggest acquisition of flexibility in the motor system as opposed to the rigidity present in younger chil- dren. Observation of linguistic capacity and vo- cabulary through maturation in adolescence seems to sustain this interpretation.
The BP was absent in most of the recorded regions in nearly all the 6-year-old group. When present, it was over the anterior or central re- gions and appeared immediately before muscular activity, for the duration of 100-200 msec. This potential should be similar to that described by Barrett et al. (19861, defined as NS’. It seems to originate in primary and supplementary motor areas (Neshige et al., 1988; Sakamoto et al., 1991; Ikeda et al., 1992). In most 6-year-old children this potential presents a positive polarity, mainly over the frontal and central regions. The positive BP over frontal and central regions may suggest an origin in the eye, but the presence of the EOG and of a positive BP over parietal regions could not be compatible with an activity from an ante- rior-based eye-field. This positive BP over pre- frontal and frontal regions disappears after 10 years of age. It would not be appropriate to give an anatomic explanation on the basis of . . . . func- tional, exhaustive explanation or polarity reversal of BP with age with the present knowledge of cortical maturation. With regard to myelinisation and synaptogenesis of primary sensory areas, it is possible to maintain that they complete matura- tion during infancy, whilst associative modal and multimodal areas continue maturation until ado- lescence (Kostovic et al., 1995; this issue). In particular, during late childhood-early adoles-
cence the appearance of myelinisation of the frontal lobes and especially the appearance of the cholinergic innervation of layer III and, associa- tive pyramidal neurons (Kostovic et al., 1988).
As observed in previous work (Chiarenza et al., 1983,199O) and recently reported in adults with other skilled tasks (Morgan et al., 19921, target performances generate a greater negative BP amplitude than that which accompanies wrong performance. Researchers on alert monkeys have shown that frontal cortical neurons exist, only responding when the interested muscle in the proposed movement must fulfil a goal-orientated task (Rizzolatti and Gentilucci, 1988). When movement is skill and goal-orientated in man, BP increases its amplitude (Papakostopoulos, 1978a; Kristeva et al., 1990; Kitamura et al., 1993; Si- monetta et al., 1991). Therefore, in our group of children, the BP should be considered the maxi- mum resources available for each age group con- sidered.
Total IQ of the WISC-R and Culture-Fair Cattell test is positively correlated with perfor- mance time, performance shift and the number of target performance. The number of target perfor- mance is positively and significantly correlated with verbal and performance IQ, when consid- ered separately. The number of TP represents a direct measurement of the skill developed by the subjects during mastering of the task, that is the ability to transfer planned actions into mental operations. This capacity to restructure cognitive universe is synonymous with intelligence. The BP is significantly correlated with intelligence. Chil- dren with a high IQ have a more negative BP lasting longer. BP onset is significantly correlated only to verbal IQ WISC-R, while amplitude is also correlated to Performance IQ and total WISC IQ. This apparently different behaviour of the two BP parameters with IQ can be explained on the one hand by a lower number of BP onset detections in younger children and on the other, by the fact that BP appears when the subject has a well-developed capacity of formal and verbal thinking. Warren and Karrer (1979) found the same positive correlation of BP amplitude with IQ, using a unimanual, unskilled task. It is worth noting that this phenomenon, an index of the

174 G.A. Chiarenza et al. /International Journal of Psychophysiology 19 (1995) 149-l 76
cerebral efficiency of programming, is signifi- cantly related over all cerebral areas to the final outcome of an intelligence test. Further statistical analyses will clarify with which items of the WISC-R and perceptive and motor-perceptive tests BP is mainly correlated (Chiarenza, unpub- lished data). The Culture-Fair Cattell tests per- ceptive and visual-spatial intelligence, is not in- fluenced by verbal and sociocultural factors and activates mainly left cerebral areas. The BP is significantly and positively correlated to Cattell’s IQ only over left precentral and left parietal areas.
Psychophysiological investigation of human goal-directed behaviour by means of skilled ac- tions is a challenge for studying cortical, regional brain areas in a functional and developmental perspective.
References
Barrett, G., Shibasaki, H. and Neshige, R. (1986) Cortical potential preceding voluntary movement: evidence for
three periods of preparation in man. Electroenceph. Clin. Neurophysiol., 63: 327-339.
Boschert, J. and Deecke, L. (1986) Cerebral potentials pre-
ceding voluntary toe, knee and hip movements and their vectors in human precentral gyrus. Brain Res., 376, 175-
179.
Boschert, J., Hink, R.F. and Deecke, L. (1983) Finger move- ment versus toe movement-related potentials: further evi-
dence for supplementary motor area (SMA) participation
prior to voluntary action. Exp. Brain Res., 52, 73-80. Bruner, J.S. (1970) The growth and structure of skill. In:
Connolly, K.J. (Ed.), Mechanisms of Motor Skill Develop-
ment, Academic Press, London, 63-91. Cattell, R.B. (1951) Classical and standard score I.Q. stan-
dardization of the I.P.A.T. culture. Free intelligence scale
2. J. Cons. Psychol., 15; 154-159.
Chiarenza, G.A. (1990) Motor-perceptual function in children with developmental reading disorders: neuropsychophysio-
.logical analysis. J. Learning Disab., 23: 375-385. Chiarenza, G.A. (1993) Movement related brain macropoten-
tials of subjects with Downs syndrome during skilled per-
formance. J. Ment. Retard., 97/4: 449-467. Chiarenza, G.A., Papakostopoulos, D., Guareschi-Cazzullo,
A. and Giordana, F. (1980) Movement related brain macropotentials during skilled and unskilled actions in
children. Riv. It. EEG Neurofisiol. Clin., 1: 507-512. Chiarenza, G.A., Papakostopoulos, D., Guareschi-Cazzullo,
A., Giordana, F. and Giammari Alde, 0. (1982) Move-
ment related brain macropotentials during skilled perfor- mance task in children with learning disabilities. In: G.A.
Chiarenza and Papakostopoulos, D. (Eds.), Clinical Appli-
cation of Cerebral Evoked Potentials in Pediatric
Medicine, Excerpta Medica, Amsterdam, pp. 259-292.
Chiarenza, G.A., Papakostopoulos, D., Giordana, F. and Guareschi-Cazzullo, A. (1983) Movement related brain
macropotentials during skilled performances. A develop-
mental study. Electroenceph. Clin. Neurophysiol., 53: 373-383.
Chiarenza, G.A., Papakostopoulos, D., Dini, M. and Cazzullo,
C.L. (1985) Neurophysiological correlates of psychomotor
activity in chronic schizophrenics. Electroenceph. Clin. Neurophysiol., 61: 218-228
Chiarenza, C.A., Vasile, G. and Villa, M. (1990) Goal or near miss! Movement potential differences between adults and
children. Int. J. Psychophysiol., 10: 105-115.
Conel, IL. (1967) The Postnatal Development of the Human
Cerebral Cortex, Vol. VIII, The Cortex of the Six-Year Infant, Harvard University Press, Cambridge, MA.
Craik, K.J.W. (1947) Theory of the human operator in control systems. Br. J. Psychol., 38: 56-61.
Cynader, M.S., Andersen, R.A., Bruce, C.J., Humphrey, D.R.,
Mountcastle, V.B., Niki, H., Palm, G., Rizzolatti, G., Strick,
P., Suga, N., von Seelen, W. and Zeki, S. (1988) General
Principles of Cortical Operation. In: P. Rakic and W.
Singer (Eds.), Neurobiology of Neocortex, John Wiley and
Sons, Chichester, pp. 357-371. De J Manoel, E. and Connolly, K.J. (1995) Variability and the
development of skilled actions. Int. J. Psychophysiol., 19: 129-147.
Deecke, L. (1978) Functional significance of cerebral poten- tials preceding voluntary movement. In: Otto, D.A. (Ed.),
Multidisciplinary Perspectives in Event-Related Brain Po-
tential Research, U.S. Environmental Protection Agency, Washington, DC, pp, 87-91,
Deecke, L., Englitz, H.G., Kornhuber, H.H. and Schmitt, G.
(1977) Cerebral potentials preceding voluntary movement in patients with bilateral or unilateral Parkinson akinesia.
In: Desmedt, J.E. (Ed.), Attention, Voluntary Contraction
and Event Related Cerebral Potentials, Progress in Clini- cal Neurophysiol, vol. 1, Karger, Basel, pp. 151-163.
Dick, J.P., Rothwell, J.C., Day, B.L., Cantello, R., Buruma, O., Gioux, M., Benecke, R., Berardelli, A., Thompson,
P.D. and Marsden, C.D. (1989) The Bereitschaftspotential
is abnormal in Parkinson’s disease. Brain, 112; 233-244. Faglioni, P., Gatti, B., Paganoni, A.M. and Robutti, A. (1969)
A psychometric evaluation of developmental dyslexia in
Italian children. Cortex, 5:15-26. Faglioni, P., Gatti, B., Paganoni, A.M and Robutti, A. (1970)
Test di valutazione del linguaggio scritto. Manuale di istruzioni. Edizioni Organizzazioni Speciali, Florence.
Fuster, J.M. (1984) Behavioural electrophysiology of the pre-
frontal cortex. Trends Neurosci., 7: 408-414. Fuster, J.M. (1985) The prefrontal cortex and temporal inte-
gration. In E.G. Jones and A. Peters, (Eds.), Cerebral
Cortex, Vol. 4, Plenum Press, New York, pp. 151-178.

GA Chiarenza et al. /International Journal of Psychophysiology 19 (1995) 149-176 175
Gesell, A. and Amatruda, C. (1974) Developmental Diagno- Kristeva, R., Cheyne, D., Lang, W., Lindinger, G. and Deecke, sis, 2nd edn., Hoeber, New York. L. (1990) Movement related potentials accompanying uni-
Goldman-Rakic, P.S. (1984) The frontal lobes: uncharted lateral and bilateral finger movements with different iner- provinces of the brain. Trends Neurosci., 7: 425-429. tial loads. Electroenceph. Clin. Neurophysiol., 75: 410-418.
Grasso-Magrin, G. and Tomai-Vinciguerra, A. (1969) Prova Libet, B., Wright, E.W. and Gleason, C.A. (1983) Preparation oggettiva di lettura: deciframento POL 3/67-DIA/B, or intention to act in relation to prevent potentials esattezza e rapidita POL l/67-ER-I. Edizioni organiz- recorded at the vertex. Electroenceph. Clin. Neurophysiol., zazioni Speciali, Florence. 56: 367-372.
Halsband, U., Ito, N., Tanji, J. and Freund, H.J. (1993) The role of premotor cortex and the supplementary motor area in the temporal control of movement in man. Brain, 116: 243-266.
Luria, A.R. (1966) Human Brain and Psychological Processes, Harper and Row, New York.
Harris, A.J. (1968) Harris Test of Lateral Dominance, 3rd edn., Psychological Corporation, New York.
Hay, L. (1984) Discontinuity in the development of motor control in children. In W. Prince and A.F. Sanders (Eds.), Cognition and Motor Processes, Springer-Verlag, Berlin, pp. 351-359.
Morgan, J.M., Wenzl, M., Lang, W., Lindinger, G. and Deecke, L. (1992) Frontocentral DC-potential shifts pre- dicting behaviour with or without motor task. Electroen- ceph. Clin. Neurophysiol., 83: 378-388.
Neshige, R., Luders, H. and Shibasaki, H. (1988) Recording of movement-related potentials from scalp and cortex in man. Brain, 111: 719-736.
Hirsch, I.J. and Sterrick, C.E., Jr. (1964) Perceived order in different sense modalities. J. Exp. Psychol. 67: 103-112.
Hudspeth, W. and Pribram, K.H. (1992) Psychophysiological indices of cerebral maturation. Int. J. Psychophysiol., 12: 19-29.
Niemann, J., Winker, T. and Jung, R. (1992) Changes in cortical negative DC shifts due to different motor task conditions. Electroenceph. Chn. Neurophysiol., 83: 297- 305.
Ikeda, A., Luders, H.O., Burgess, R.C. and Shibasaki, H. (1992) Movement-related potentials recorded from supple- mentary motor area and primary motor area. Role of supplementary area in voluntary movements. Brain, 115: 1017-1043.
Papakostopoulos, D. (1978a) Electrical activity of the brain associated with skilled performance. In: Otto, D.A. (Ed.), Multi-disciplinary Perspectives in Event-related Brain Po- tential Research, U.S. Environmental Protection Agency, Office of Research and Development, Washington, DC, pp. 134-137.
Innocenti, G.M. (1986) General organization of callosal con- nections in cerebral cortex. In: E.G. Jones and A. Peters (Eds.), Cerebral Cortex, Vol. 5, Plenum Press, New York, pp. 291-353.
Papakostopoulos, D. (1978b) The serial order of self-paced movement in terms of brain macropotentials in man. J. Physiol., 280: 70-71.
Jeeves, M.A., Silver, P.H. and Jacobson, T. (1988) Bimanual co-ordination in callosal agenesis and partial commisuro- tomy. Neuropsychologia, 26: 833-850.
Jones, E.G., Coulter, J.D. and Hendry, S.H.C. (1978) Intra- cortical connectivity of architectonic fields in the somatic sensory-motor cortex of monkeys. J. Camp. Neurol., 175: 391-438.
Papakostopoulos, D. (1980a) A no stimulus no response event-related potential of the human cortex. Electroen- ceph. Clin. Neurophysiol., 48: 622-638.
Kitamura, J., Shibasaki, H. and Kondo, T. (1993) A cortical slow potential is larger before an isolated movement of a single finger than simultaneous movement of the two figures. Electroenceph. Clin. Neurophysiol., 86: 252-258.
Koppitz, E.M. (1964) The Bender Gestalt Test for Young Children, Grune and Stratton, New York.
Komhuber, H.H. and Deecke, L. (1965) Hirnpotential- Hnderungen bei Willkiirbewegungen und passiven Bewe- gungen des Menschen: Bereitschaftspotential und reaffer- ente Potentiale. Pfluegers Arch. Ges. Physiol., 284: 1-17.
Kostovic, I., Skavic, J. and Strinovic, D. (1988) Acetyl- cholinesterase in the human frontal associative cortex dur- ing the period of cognitive development: early laminar shifts and late innervation of pyramidal neurons. Neurosci. L&t., 90: 107-112.
Papakostopoulos, D. (198Ob) The Bereitschaftspotential in left- and right-handed subjects. In: Kornhuber, H.H. and Deecke, L. (Eds.), Motivation, Motor and sensory Pro- cesses of the Brain: Electrical Potentials, Behaviour and Clinical Use, Progress in Brain Research, vol. 54, Else- vier/North-Holland Biomedical Press, Amsterdam.
Papakostopoulos, D. (1988) The CNV potentials and adaptive preparatory behaviour. In: E. Basar (Ed.), Dynamics of Sensory and Cognitive Processing by the Brain, Springer- Verlag, Berlin, pp. 287-298.
Papakostopoulos, D. (1989) Brain macropotentials associated with goal directed performance in psychiatry. In: C.N. Stefanis, C.R. Soldatos and D. Rabavilas (Eds.), Psychiatry Today: Accomplishments and Promises, Excerpta Medica, International Congress Series 899, Amsterdam, pp. 565- 570.
Papakostopoulos, D. and Banerji, N. (1980) Movement re- lated brain macropotentials during skilled performance in Parkinson’s disease. Electroenceph. Clin. Neurophysiol., 49: 93.
Kostovic, I., Judas, M., Petaniek, Z. and Simic, G. (1995) The ontogenesis of goal-directed behaviour: anatomo-func- tional consideration. Int. J. Psychophysiol., 19: 85-102.
Papakostopoulos, D., Stamler, R. and Newton, P. (1986) Movement related brain macropotentials during self-paced skilled performance with and without knowledge of re- sults. In: McCallum, W.C., Zappoli, R. and Denoth, F

176 G.A. Chiarenza et al. /International Journal of Psychophysiology 19 (1995) 149-176
(Eds.), Cerebral Psycho-Physiology: Studies in Event-Re- lated Potentials (EEG Suppl. 38), Elsevier Science Pub- lishers, Amsterdam, pp. 261-262.
Papakostopoulos, D., Banerji, N.K. and Pocock, P.V. (1990) Performance, EMG, brain electrical potentials and heart rate change during a self-paced skilled motor task in Parkinson’s disease. J. Psychophysiol., 4: 163-183.
Piaget, J. and Inhelder, B. (1966) The Psychology of the Child, Basic Books, New York.
Preilowski, B.F.B. (1972) Possible contribution of anterior forebrain commissures to bilateral motor co-ordination. Neuropsychologia, 10: 267-272.
Preilowski, B.F.B. (1975) Bilateral motor interaction: percep- tual-motor performance of partial and complete “splitbrain” patients. Cereb. Local., 15: 116-131.
Rabinowicz, T. (1979) The differentiate maturation of the human cerebral cortex. In: F. Falkner and J. Tanner (Eds.), Human Growth: Neurobiology and Nutrition, Plenum Press, New York.
Rey, A. (1969) Copia e riproduzione a memoria di figure geometriche complesse. Edizione Italiana. Organizzazioni Speciali, Florence.
Rizzolatti, G. and Gentilucci, M. (1988) Motor and visual-mo- tor function of the motor cortex. In: P. Rakic and W. Singer (Eds.), NeurobioIogy of Neocortex, John Wiley and Sons, Chichester, pp. 269-284.
Rosenbaum, D.A. and Patashnik, 0. (1980) A mental clock setting process revealed by reaction times. In: G.E. Stel- mack and J. Requin (Eds.), Tutorials in Motor Behaviour, North-Holland Publishing Co., Amsterdam, pp. 1-14.
Sakamoto, A. Luders, H. and Burgess, R. (1991) Intracranial recordings of movement-related potentials to voluntary saccades. J. Clin. Neurophysiol., 8(2): 223-233.
Schade, J.P. and Groeningen, V.V. (1961) Structural develop- ment of the human cerebral cortex. Acta Anat., 47: 79-111.
Seggie, J. and Barry, M. (1972) Ontogeny of interhemispheric evoked potentials in the rat; significance of myelination of the corpus callosum. Exp. Neurol., 35: 215-232.
Simonetta, M., Clanet, M. and Rascal, 0. (1991) Bere- itschaftspotential in a simple movement or in a motor sequence starting with the same simple movement. Elec- troenceph. Clin. Neurophysiol., 81: 129-134.
Stambak, M. (1965) Epreuves de niveau et de style moteurs. Actual. Pedagog. Pycholog., 2: 5-65.
Touwen, B.C.L. (1979) Examination of the child with minor neurological dysfunction. Clinics in Developmental Medicine, 71, Spastics International Medical Publications, William Heineman Medical Books, London.
Vegetti, S. (1971) Test di lettura Ll B.A.S.E. Batteria per la scuola elementare. Edizioni Organizzazioni Speciali, Flo- rence.
Yakovlev, P.I. and Lecours, A.R. (1967) Myelogenetic cycles of regional maturation in the brain. In: A. Minkowski (Ed.), Regional Development of the Brain in Early Life, Blackwell, Oxford, pp. 3-70.
Warren, C. and Karrer, K. (1979) Developmental changes in ERP preceding movement: relation to variability and IQ. In: Lehmann and E. Callaway (Eds), Human Evoked Po- tentials, Applications and Problems, Plenum Press, New York, pp. 478.
Wechsler, D. (1976) Wechsler Intelligence Scale for Children-Revised (WISC-R), NFER Publishing Company Ltd., London.
Wise, S.P. (1984) The nonprimary motor cortex and its role in the cerebral control of movement. In: G.M. Edelman, W.E. Gall and W.M. Cowan (Eds.), Dynamic Aspects of Neocortical Function, John Wiley and Sons, New York, pp. 525-556.
Zarzecki, P. (1986) Functions of corticocortical neurons of somatosensory, motor, and parietal cortex. In: E.G. Jones and A. Peters (Eds.), Cerebral Cortex, Vol. 5, Plenum Press, New York, pp. 185-216.
Zucchi, M., Giuganino, B.M. and Stella, L. (1959) Adatta- mento italiano della Scala di sviluppo motorio di Oseret- zki. Bollettino di Psicologia e Sociologia applicate. Edi- zioni Organizzazioni Speciali, Florence, pp. 31-36.
Copyright © 2022 FDOKUMEN