12. CASE STUDIES
48
Chapter 12 – Case Studies Page 99 12. CASE STUDIES This chapter summarizes four “case studies” where the project team applied the connectivity tools and regression model to achieve the following outcomes: Verify the connectivity data collected from some of the jurisdictions Verify the output of the connectivity tools Calibrate and validate the regression model Evaluate 2035 conditions at the case study locations to provide guidance on how to apply the tools developed in this study and identify potential “blind spots” that must be considered when applying the tools for future studies. CASE STUDY LOCATIONS The project team selected the following four locations for the case study tool applications: Northgate Transit Center - Seattle Overlake Village - Redmond Mount Baker Transit Center/Link Station - Seattle Federal Way Transit Center – Federal Way The project team chose these locations because they all have active transportation and land use planning efforts being undertaken by local jurisdictions, represent a variety of urban forms, and have varying degrees of existing non-motorized connectivity. Three of the four areas are future Link light rail stations (all but Mount Baker). The addition of Link substantially alters the transit service characteristics of the areas. All case study locations are expecting increased land use development intensities in the future. Understanding how well the model responds to these changes was an important element of the case studies.
-
Upload
khangminh22 -
Category
Documents
-
view
6 -
download
0
Transcript of 12. CASE STUDIES

Chapter 12 – Case Studies Page 99
12. CASE STUDIES
This chapter summarizes four “case studies” where the project team applied the
connectivity tools and regression model to achieve the following outcomes:
Verify the connectivity data collected from some of the jurisdictions
Verify the output of the connectivity tools
Calibrate and validate the regression model
Evaluate 2035 conditions at the case study locations to provide guidance on how to
apply the tools developed in this study and identify potential “blind spots” that must
be considered when applying the tools for future studies.
CASE STUDY LOCATIONS
The project team selected the following four locations for the case study tool
applications:
Northgate Transit Center - Seattle
Overlake Village - Redmond
Mount Baker Transit Center/Link Station - Seattle
Federal Way Transit Center – Federal Way
The project team chose these locations because they all have active transportation and
land use planning efforts being undertaken by local jurisdictions, represent a variety of
urban forms, and have varying degrees of existing non-motorized connectivity. Three of
the four areas are future Link light rail stations (all but Mount Baker). The addition of Link
substantially alters the transit service characteristics of the areas. All case study locations
are expecting increased land use development intensities in the future. Understanding
how well the model responds to these changes was an important element of the case
studies.

Chapter 12 – Case Studies Page 100
EXISTING CONDITIONS DATA VERIFICATION
Given the large study area and number of jurisdictions from which the project team
collected existing conditions data, a detailed verification of the GIS data was not possible
across the entire region. These case studies provided the opportunity for the team to go
into the field and compare the jurisdiction’s GIS data against actual conditions. Below is a
summary of the findings by case study area. In general, the project team found that the
jurisdiction GIS data were a good match to actual field conditions.
Northgate Transit Center
Figures 34 through 37 show the connectivity surfaces calculated from the existing
conditions data in the Northgate Transit Center area:

!
N:\20
13Pr
ojects
\SE_P
rojec
ts\Kin
g_Co
unty_
NonM
otoriz
ed\Ju
ly201
4GIS\
ToPr
int\fig
34_N
orthg
ateP1
.mxd
Figure 34
!
Northgate Transit Center RDI Northgate Transit CenterSignalized Arterial Crossing Index
Northgate Transit Center RDI and Signalized Arterial Crossing Index
0 0.5 10.25 Miles! Study StationsRoute Directness
HighLow
Ease of CrossingHighLow

!
N:\20
13Pr
ojects
\SE_P
rojec
ts\Kin
g_Co
unty_
NonM
otoriz
ed\Ju
ly201
4GIS
\Bike
Stres
s\fig3
5_No
rthga
teP2.m
xd
Figure 35
!
Northgate Transit CenterBike Stress
Northgate Transit CenterBike Shed
Northgate Transit Center Bike Stress and Bike Shed
0 0.5 10.25 Miles! Study Stations
15-Minute Bike Shed
Bike StressLowMediumHigh
!
N:\20
13Pr
ojects
\SE_P
rojec
ts\Kin
g_Co
unty_
NonM
otoriz
ed\Ju
ly201
4GIS\
ToPr
int\fig
36_N
orthg
ateP3
.mxd
Figure 36
!
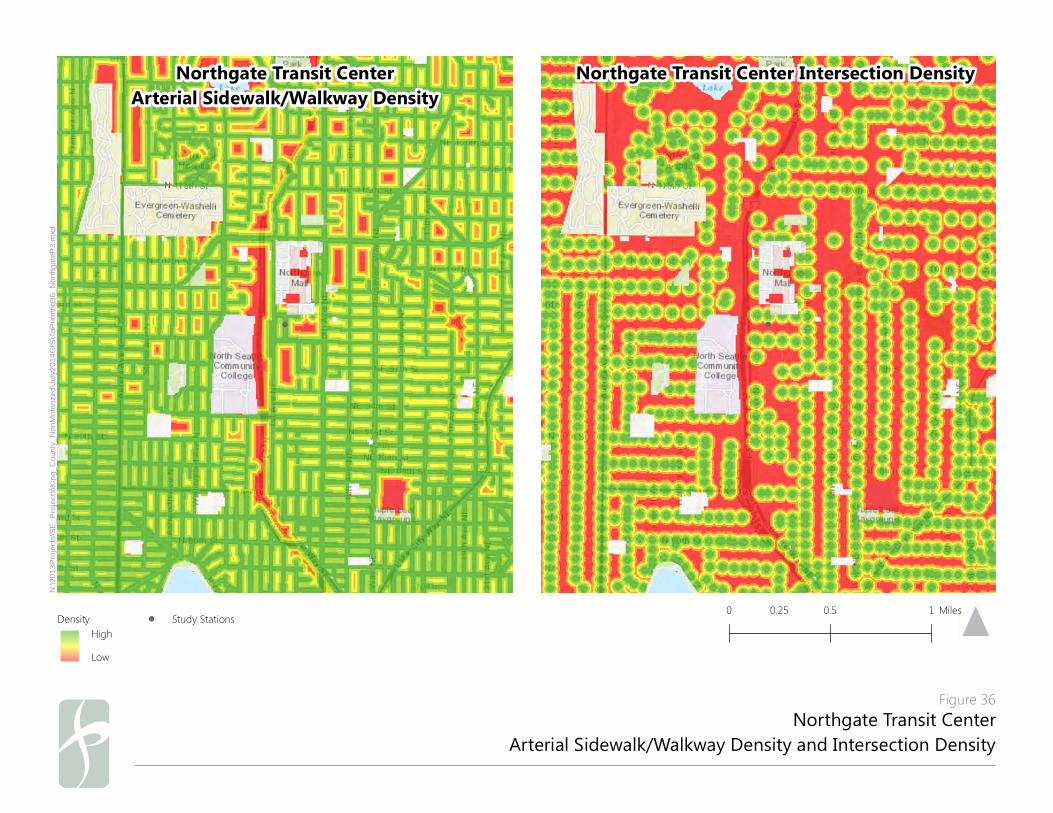
Northgate Transit CenterArterial Sidewalk/Walkway Density
Northgate Transit Center Intersection Density
Northgate Transit CenterArterial Sidewalk/Walkway Density and Intersection Density
0 0.5 10.25 MilesDensityHighLow
! Study Stations

N:\20
13Pr
ojects
\SE_P
rojec
ts\Kin
g_Co
unty_
NonM
otoriz
ed\Ju
ly201
4GIS\
ToPr
int\fig
37_N
orthg
ate C
ompo
site.m
xd
!
! Study Stations
Northgate Transit Center
ConnectivityHighLow
Figure 37Northgate Transit Center
Composite Connectivity Scores
0 0.25 0.50.125 Miles

Chapter 12 – Case Studies Page 105
Based on the field work, the data shown in the connectivity surfaces generally matched
our observations. Below are a few highlights for the Northgate area:
The poor scoring area on the RDI map reflects the lack of connections across I-5
from the transit center.
The field work verified the signalized arterial crossings; however, there were several
flashing crosswalk beacons along College Way that were not accounted for since
they are not traffic signals as defined by the City of Seattle. While unavailable in a
standard data format, they act as signalized arterial crossings.
Field data verified a lack of signalized crossings along Roosevelt Ave and 92nd
Street, as shown; however, these are relatively narrow and low volume arterials
compared to the “average” arterial in the county and crossing these streets is less
challenging than wider arterials like Northgate Way.
The bike stress results were confirmed. Traveling from the north and northwest
requires traversing the I-5/Northgate interchange, which has no bicycle facilities and
clearly meets the definition of a high stress route. When traveling from the south,
there are several routes to choose from, many of them being lower-stress local
streets. The bicycle travel shed does identify the terrain to the south and east, which
limits the practicality of bicycling for many cyclists.
Below are some pictures taken during the field visit:
Figure 38: Pedestrian Underpass of I-5 and Unsignalized Crossing of Roosevelt Ave

Chapter 12 – Case Studies Page 106
Figure 39: Bicyclist along Northgate Way and Urban Form near Transit Center
While the GIS data from the City of Seattle matched our observations, the field work
highlighted some additional considerations that were not captured in the GIS
information:
Sidewalk conditions are poor in some locations with broken panels that would be
difficult to traverse by those with mobility limitations. Overgrowth in certain areas
narrows the sidewalk as well.
Urban form around the station is mixed with good pedestrian-scaled uses along
portions of Northgate Way and 5th Avenue. 1st Avenue is not a great pedestrian
environment, being adjacent to parking lots and retaining walls near the transit
center.
Street light coverage is generally good in the area, although vegetation blocks
lighting in some of the neighborhoods to the east.
Overlake Village
Figures 40 through 43 show the connectivity surfaces calculated from the existing
conditions data in the Overlake Village area:

!
N:\20
13Pr
ojects
\SE_P
rojec
ts\Kin
g_Co
unty_
NonM
otoriz
ed\Ju
ly201
4GIS\
ToPr
int\fig
40_O
verla
keVil
lageP
1.mxd
Figure 40
!
Overlake Village RDI Overlake Village SignalizedArterial Crossing Index
Overlake Village RDI and Signalized Arterial Crossing Index
0 0.5 10.25 Miles! Study StationsRoute Directness
HighLow
Ease of CrossingHighLow

!
!
N:\20
13Pr
ojects
\SE_P
rojec
ts\Kin
g_Co
unty_
NonM
otoriz
ed\Ju
ly201
4GIS\
ToPr
int\fig
41_O
verla
keVil
lageP
2.mxd
Figure 41
Overlake Village Bike Stress Overlake Village Bike Shed
Overlake Village Bike Stress and Bike Shed
0 0.5 10.25 Miles! Study Stations
15-Minute Bike Shed
Bike StressLowMediumHigh

!
N:\20
13Pr
ojects
\SE_P
rojec
ts\Kin
g_Co
unty_
NonM
otoriz
ed\Ju
ly201
4GIS\
ToPr
int\fig
42_O
verla
keVil
lageP
3.mxd
Figure 42
!
Overlake Village ArterialSidewalk/Walkway Density
Overlake Village Intersection Density
Overlake VillageArterial Sidewalk/Walkway Density and Intersection Density
0 0.5 10.25 Miles! Study StationsDensity
HighLow

N:\20
13Pr
ojects
\SE_P
rojec
ts\Kin
g_Co
unty_
NonM
otoriz
ed\Ju
ly201
4GIS\
ToPr
int\fig
43_O
verla
keVil
lage_
Comp
osite
.mxd
!
! Study Stations
Overlake Village
ConnectivityHighLow
Figure 43Overlake Village
Composite Connectivity Scores
0 0.25 0.50.125 Miles

Chapter 12 – Case Studies Page 111
Similar to Northgate, the field observations were a close match to the GIS data in
Overlake Village. Below are some general observations:
There are additional pedestrian/bicycle connections coded in the dataset through
some private parking lots that may not be obvious to some transit patrons. This
could bias the existing conditions connectivity score higher than it would otherwise
be.
The high bike stress in the area was confirmed since there are few low stress routes
that provide direct access to the station area. City of Redmond staff observed that
bicycling through the Microsoft Campus could be higher stress than is indicated on
the map since some of the private roads internal to the campus have traffic volume
characteristics more similar to arterials elsewhere in the City.
Below are some pictures taken during the field visit:
Figure 44: Narrow Sidewalk along 148th Ave and Wide Sidewalks with Signalized Crossings along
156th Ave
Figure 45: Bicyclist along NE 24th St and New Bike Lanes along 152nd Ave

Chapter 12 – Case Studies Page 112
Below are some additional observations of factors not captured in the GIS data:
The Microsoft Campus generally has good pedestrian and bicycle facilities; however,
there is little pedestrian or bicycle activity in the area due to the homogeneity of
land use on the Campus.
The urban form of the station area south of SR-520 is very auto oriented with large
blocks and parking lots along most street frontages. High levels of pedestrian and
bicycle activity were observed; however, a reflection of the diversity of land uses in
the area.
Street illumination is good.
Sidewalks are narrow in some places, but coverage and maintenance is generally
good.
Mount Baker Transit Center and Link Station
Figures 46 through 49 show the connectivity surfaces calculated from the existing
conditions data in the Mount Baker Transit Center area:

!
N:\20
13Pr
ojects
\SE_P
rojec
ts\Kin
g_Co
unty_
NonM
otoriz
ed\Ju
ly201
4GIS\
ToPr
int\fig
46_M
tBake
rP1.m
xd
Figure 46
!
Mt. Baker LRT Station RDI Mt. Baker LRT StationSignalized Arterial Crossing Index
Mt. Baker LRT Station RDI and Signalized Arterial Crossing Index
0 0.5 10.25 Miles! Study StationsRoute Directness
HighLow
Ease of CrossingHighLow

!
N:\20
13Pr
ojects
\SE_P
rojec
ts\Kin
g_Co
unty_
NonM
otoriz
ed\Ju
ly201
4GIS
\Bike
Stres
s\fig4
7_Mt
Bake
rP2.m
xd
Figure 47
!
Mt. Baker LRT Station Bike Stress Mt. Baker LRT Station Bike Shed
Mt. Baker LRT Station Bike Stress and Bike Shed
0 0.5 10.25 Miles! Study Stations
15-Minute Bike Shed
Bike StressLowMediumHigh

!
N:\20
13Pr
ojects
\SE_P
rojec
ts\Kin
g_Co
unty_
NonM
otoriz
ed\Ju
ly201
4GIS\
ToPr
int\fig
48_M
tBake
rP3.m
xd
Figure 48
!
Mt. Baker LRT StationArterial Sidewalk/Walkway Density
Mt. Baker LRT StationIntersection Density
Mt. Baker LRT Station Arterial Sidewalk/Walkway Densityand Intersection Density
0 0.5 10.25 Miles! Study StationsDensity
HighLow

N:\20
13Pr
ojects
\SE_P
rojec
ts\Kin
g_Co
unty_
NonM
otoriz
ed\Ju
ly201
4GIS\
ToPr
int\fig
49_M
tBake
r_Com
posit
e.mxd !
! Study Stations
Mt. Baker LRT Station
ConnectivityHighLow
Figure 49Mt. Baker LRT Station
Composite Connectivity Scores
0 0.25 0.50.125 Miles

Chapter 12 – Case Studies Page 117
Consistent with the other case study areas, the field observations were a close match to
the GIS data in the Mount Baker area. Below are some general observations:
The RDI score matches the steep terrain to the west of the Link station.
Bike stress is generally high in the area since many bike trips would have to travel
along Rainier Avenue or MLK Jr. Way to reach the station.
The arterial crossing data is correct; however, as in other areas of Seattle, some of
the arterials, such as McClellan east of MLK Jr. Way or 23rd Avenue south of Rainier
Avenue are relatively narrow, low volume streets that do not present a major barrier
to crossing. Four-way stops are also not included in the signalized crossing dataset.
Below are some pictures taken during the field visit:
Figure 50: Pedestrians along MLK Jr. Way and Poor Sidewalk Quality
Figure 51: Bicyclist along Rainier Avenue and Steep Terrain West of the Station

Chapter 12 – Case Studies Page 118
Below are some additional observations of factors not captured in the GIS data:
The pedestrian/bicycle bridge across MLK Jr. Way and Rainier Avenue south of the
station is not heavily used. The steep spiral ramps and narrow bridge width may
discourage use.
Much of the area has sidewalk coverage, but the sidewalk quality is poor in spots
with broken or heaved sections. Some sidewalks near the Link station are very
narrow and have poles and other obstructions.
Perceptions about crime and safety issues may be a concern to some potential
transit riders.
There are good bicycle amenities at the Link station, but the terrain and high bike
stress may discourage use.
Federal Way Transit Center
Figures 52 through 55 show the connectivity surfaces calculated from the existing
conditions data in the Federal Way Transit Center area:

!
N:\20
13Pr
ojects
\SE_P
rojec
ts\Kin
g_Co
unty_
NonM
otoriz
ed\Ju
ly201
4GIS\
ToPr
int\fig
52_F
edera
lP1.m
xd
Figure 52
!
Federal Way Transit Center RDI Federal Way Transit CenterSignalized Arterial Crossing Index
Federal Way Transit Center RDI and Signalized Arterial Crossing Index
0 0.5 10.25 Miles! Study StationsRoute Directness
HighLow
Ease of CrossingHighLow

!
N:\20
13Pr
ojects
\SE_P
rojec
ts\Kin
g_Co
unty_
NonM
otoriz
ed\Ju
ly201
4GIS
\Bike
Stres
s\fig5
3_Fe
deral
P2.m
xd
Figure 53
Federal Way Transit Center Bike Stress Federal Way Transit Center Bike Shed
Federal Way Transit Center Bike Stress and Bike Shed
0 0.5 10.25 Miles! Study Stations
15-Minute Bike Shed
Bike StressLowMediumHigh

!
N:\20
13Pr
ojects
\SE_P
rojec
ts\Kin
g_Co
unty_
NonM
otoriz
ed\Ju
ly201
4GIS\
ToPr
int\fig
54_F
edera
lP3.m
xd
Figure 54
!
Federal Way Transit CenterArterial Sidewalk/Walkway Density
Federal Way Transit Center Intersection Density
Federal Way Transit Center ArterialSidewalk/Walkway Density and Intersection Density
0 0.5 10.25 Miles! Study StationsDensity
HighLow

N:\20
13Pr
ojects
\SE_P
rojec
ts\Kin
g_Co
unty_
NonM
otoriz
ed\Ju
ly201
4GIS\
ToPr
int\fig
55_F
edera
lWay
_Com
posit
e.mxd
!
! Study Stations
Federal Way Transit Center
ConnectivityHighLow
Figure 55Federal Way Transit Center
Composite Connectivity Scores
0 0.25 0.50.125 Miles

Chapter 12 – Case Studies Page 123
Below are observations of the Federal Way Transit Center data, which generally matched
the field observations:
The RDI score highlights the barriers created by I-5 and some of the large
parcels/blocks near the transit center.
There are some large gaps in signalized arterial crossings in the area, particularly on
Pacific Highway. The map shows a stretch of S 324th that lacks crossings, but field
visits indicated the presence of flashing pedestrian beacons in this segment.
Bike stress is high to the east due to the lack of connections across I-5, but the bike
shed is not extensive in that direction due to the terrain. There is moderately high
bike stress approaching from due west because of the need to cross Pacific Highway
at either S 312th or S 320th Streets, which are high stress routes.
The area generally has good arterial sidewalk coverage, but as shown on the map,
there are gaps along portions of S 312th Street, 28th Avenue, and S 320th Street
(across I-5).
Intersection density and street density is low due to the large block and parcel sizes.
Below are some pictures taken during the field visit:
Figure 56: Buffered Sidewalks with Strip Commercial and Flashing Pedestrian Crossing

Chapter 12 – Case Studies Page 124
Figure 57: Bike Lane on S 316th Street and Bike Parking at the Transit Center
Below are some additional observations of factors not captured in the GIS data:
While the area around the transit center generally has good sidewalk coverage, the
urban form is very auto-oriented with large streets and parking lots adjacent to the
sidewalks.
Some streets in the area lack street lights, although lights from adjacent parking lots
may provide some level of illumination. The streets lacking lighting include S 316th
Street between 21st Avenue and Pacific Highway, and S 317th Street between 23rd
Avenue and 25th Place.
The bike racks in the transit center are well utilized.
GIS DATA BLIND SPOTS
As described above, the jurisdiction GIS data matched field conditions well. However, the
project team identified several “blind spots” where the GIS data were either not available
across the entire region or where the GIS data were too general. Based on the research
and the team’s observations, these blind spots are important to consider when applying
the connectivity tools to evaluate non-motorized access to transit. The key blind spots
are listed below:
Low volume/speed arterial streets: Since general functional class information was
used to identify arterials, some cities like Seattle include low volume/speed arterial
streets that would be classified as collector streets in other jurisdictions. These

Chapter 12 – Case Studies Page 125
streets may be easier to cross, so the lack of signalized arterial crossings may be less
of an impediment to accessing transit.
Sidewalk width and quality: Only a handful of jurisdictions keep information on
sidewalk quality, and the data do not appear to be comprehensive. About half of the
jurisdictions had sidewalk width and presence of planter strip data.
Illumination: Most cities have GIS data on where city-owned street lights are, but in
many cities Puget Sound Energy owns most of the street lights and this information
was not generally available.
All-way stop signs and flashing crossing beacons: All-way stop signs and flashing
crosswalk beacons can make it easier to cross arterial streets. Only a handful of cities
have these types of signs/crossing treatments identified in their GIS data.
Urban form: There is no uniform method to measure and code the quality of the
urban form along a street or bikeway. Research shows that traveling along a street
that is fronted by parking lots or that is adjacent to the side of a warehouse is less
appealing than a street with smaller-scale street oriented businesses or homes16.
16
“Evaluating Transportation Land Use Impacts”. Litman, T,. June 11, 2014.

Chapter 12 – Case Studies Page 126
USING THE TOOLS TO EVALUATE 2035 CONDITIONS
This section presents how the project team used the connectivity tools and regression
model to evaluate 2035 conditions at each of the case study locations. In each case, the
following changes were considered in the evaluation:
2035 population and employment growth from either the PSRC regional travel
model or local travel model
Changes to the transportation system from city and regional plans, including the
following types:
o Roads
o Transit service
o Off-street trails or cycletracks
o Sidewalks
o Bike lanes
o Greenways
o Signalized arterial crossings
To obtain accurate information, the project team met with Seattle, Redmond, and
Federal Way planning staff. Based on these meetings, the team collected detailed
information such as Urban Design Frameworks, subarea plans, and the most up-to-date
bicycle and pedestrian plans. Using this information, the 2035 transportation system
information was coded into GIS and the connectivity tools were run17. The connectivity
tool results were combined with updated land use and transit service characteristics in
the regression model and new ridership estimates were generated.
Table 28 shows the change in population and employment expected under 2035
conditions and Figures 58 through 61 show the new transportation projects coded into
GIS for each of the case study areas.
17
It is important to keep in mind that many of the projects in the pedestrian/bicycle plans are not currently funded and
may or may not be implemented under 2035 conditions.

Chapter 12 – Case Studies Page 127
Table 28: 2035 Employment and Population in Case Study Locations
Case Study Employment Population
Existing Future % Diff Existing Future % Diff
Northgate TC 10,050 12,250 22% 9,140 11,320 24%
Overlake Village 23,420 36,470 56% 4,040 10,300 155%
Mt Baker 4,450 5,440 22% 6,760 8,450 25%
Federal Way TC 4,180 6,470 55% 4,740 6,690 41%

èéëìí
èéëìíèéëìí èéëìí
èéëìí
èéëìíèéëìí èéëìí
èéëìí
èéëìí
èéëìí
èéëìí èéëìí
èéëìí
èéëìí
èéëìí
èéëìí
èéëìí
èéëìí!
N:\20
13Pr
ojects
\SE_P
rojec
ts\Kin
g_Co
unty_
NonM
otoriz
ed\Ju
ly201
4GIS\
ToPr
int\fig
58_N
orthg
atePr
ojects
.mxd
! Study Stationsèéëìí New Signals
Off-street TrailBike Lane
Figure 58Northgate Transit Center
New Transportation Projects
Northgate Transit Center
0 0.25 0.50.125 Miles

""
""
""
""
""
""
""
""
""
""
""
""
""
""
""
"
!
N:\20
13Pr
ojects
\SE_P
rojec
ts\Kin
g_Co
unty_
NonM
otoriz
ed\Ju
ly201
4GIS\
ToPr
int\fig
59_O
verla
kePr
ojects
.mxd
! Study StationsOff-street TrailBike Lane
New Street" " " " New Sidewalk
Figure 59Overlake Village
New Transportation Projects
Overlake Village
0 0.25 0.50.125 Miles

èéëìí
èéëìí
èéëìí
èéëìí
èéëìí èéëìí
èéëìíèéëìí
èéëìí
èéëìí èéëìí
!
N:\20
13Pr
ojects
\SE_P
rojec
ts\Kin
g_Co
unty_
NonM
otoriz
ed\Ju
ly201
4GIS\
ToPr
int\fig
60_M
tBake
rProj
ects.
mxd
! Study StationsOff-street TrailBike Lane
èéëìí New SignalsNew Street
Figure 60Mt. Baker Transit Center
New Transportation Projects
Mt. Baker Transit Center
0 0.25 0.50.125 Miles

""
" " " " "
""
""
"
" " "" " " "
""
""
""
" " "
"
""
""" " " " " "
" "
" " "
"
" " "
" " "
""
"
" " " "" "
"
" " " " " " " " "
""
" " " " " "
" "
""
" " ""
""
"
" "
" " " "" " " " " " " " "
" " " " "
" "
""
"
" " " "
""
"
""
""
"
" " " " "
""
" " "
" " " "
""
""
""
" " " " " " "
"
" " " " "
" " " " "
" " " "" " "" "" "" "" " "
èéëìíèéëìí
èéëìíèéëìí
èéëìí èéëìí èéëìí
èéëìíèéëìí
!
N:\20
13Pr
ojects
\SE_P
rojec
ts\Kin
g_Co
unty_
NonM
otoriz
ed\Ju
ly201
4GIS\
ToPr
int\fig
61_F
edera
lWay
Proje
cts.m
xd
! Study StationsOff-street TrailBike Lane
èéëìí New SignalsNew Street
" " " " New Sidewalk
Figure 61Federal Way Transit Center
New Transportation Projects
Federal Way Transit Center
0 0.25 0.50.125 Miles

Chapter 12 – Case Studies Page 132
Below is a list of some of the more significant changes at each of the case study
locations:
Northgate Transit Center:
o Link light rail extension
o Pedestrian and bicycle bridge across I-5
o Cycletrack/major separated bicycle facility along 1st Avenue and Roosevelt
Way
o New bicycle lanes and signalized arterial crossings at proposed greenways
throughout the study area
Overlake Village
o Link light rail
o New pedestrian bridge across SR-520
o New street grid in Overlake Village redevelopment area
o Off-street trails/cycletracks on 148th Avenue and 156th Avenue
o Bicycle lanes on NE 24th Street and Bel-Red Road
Mount Baker TC and Link Station
o New cycletrack/major separated bicycle facility on Rainier Avenue north of
MLK Jr. Way and on MLK Jr. Way
o Bicycle lanes on McClellan Street, S Mt. Baker Boulevard, and Lake
Washington Boulevard
o New street through the Lowes site
Federal Way TC
o Link light rail
o New street grid in the Town Center area
o New signalized arterial crossings of Pacific Highway and S 320th Street
o New bicycle lanes and off-street trails throughout the study area
In addition to the new transportation infrastructure planned, each of the case study areas
is expecting substantial growth in population and employment between now and 2035.

Chapter 12 – Case Studies Page 133
Given relatively up-to-date urban design guidelines in each of the cities, as new
development progresses, the overall urban form of the case study areas is likely to
become more conducive to walking and biking. These urban form improvements will
complement the non-motorized improvements described above.
Results
The results of the regression model run on 2035 conditions are shown in Table 2918
below. The new composite connectivity index surfaces are shown in Figures 62 through
65.
Table 29: Daily Ridership Estimates
Case Study Existing
Future without
non-motorized
improvements
Future with non-
motorized
improvements*
Ridership
attributable to
non-motorized
improvements
Northgate TC 6,469 18,410 20,239 1,829
Overlake Village 392 946 998 52
Mt Baker 4,300 4,460 4,839 379
Federal Way TC 2,341 6,305 7,006 701
* Non-motorized improvements include new street grid projects, but not new Link light rail extensions. Ridership includes
all bus and light rail service
18
In 2013, Sound Transit performed an analysis of the potential new transit riders that would access the Northgate Transit
Center via the proposed pedestrian bridge over I-5. This analysis was performed using the best data available at the time,
as summarized in TCRP Report 153. There are several important differences between the 2013 study and this new analysis.
The key differences are:
it used fewer and less-detailed connectivity variables;
it had a 2030 analysis horizon (rather than 2035);
it used national data on travel and access to transit, along with local population and employment data to assess
station typologies; and
it evaluated bridge users based on light-rail boardings only (as opposed to rail and bus boardings).
Given these differences, it is not surprising that this new analysis indicates that the I-5 Bridge may attract additional
people accessing transit. To provide a more direct comparison to the prior study, the project team applied the new model
to only the light rail boardings and estimated a result that was within 8 percent of the 2013 study, which is comparable
given the difference in analysis horizons (2030 versus 2035). A similar analysis using the TCRP Report 153 analysis methods
was also performed for Sounder stations (Sounder Station Access Study). Similar differences should be expected the new
tool is used to analyze Sounder access/boardings as well.

Chapter 12 – Case Studies Page 134
As shown in the table above, much of the ridership gains expected between 2014 and
2035 stem from increased land use growth and major transit investments, like Link light
rail extensions. However, the non-motorized connectivity improvements do have a
meaningful impact on helping to achieve overall ridership. Note that the future ridership
forecasts shown in Table 29 are based on the model developed for this project. Given
the model’s limitations mentioned above, more sophisticated ridership models may be
appropriate to use for “base” future ridership forecasting, if the data are available. Using
these base ridership data, the percent change in ridership estimated by the connectivity
tools and model can be applied to calculate a refined estimate of ridership associated
with improved pedestrian and bicycle infrastructure.
With this in mind, the Sound Transit Incremental Travel Model’s 2035 forecasts were
evaluated at each of the study locations. In each case (except for Mt. Baker, as noted in
the footnote for Table 30 below), the Sound Transit’s model estimated daily boardings
for both rail and buses were extracted and the connectivity model results were applied to
the combined rail/bus boardings. The results are shown in Table 30.
Table 30: Daily Ridership Estimates Based on Sound Transit Model Forecasts
Case Study Existing
Future without
non-motorized
improvements
Future with non-
motorized
improvements
Ridership
attributable to
non-motorized
improvements
Northgate TC 6,469 27,000 29,700 2,700
Overlake Village 392 2,600 2,900 300
Mt Baker 4,300 4,500* 4,800 300
Federal Way TC 2,341 18,500 20,600 2,100
*Note the ST model did not assume the planned rezoning at the Mt. Baker station area and there was no increase in
ridership over 2014 existing conditions. Therefore, the results of the connectivity analysis model were used for this
location.
In general, Sound Transit’s model estimated higher bus/rail boardings than did the non-
motorized connectivity model. These higher future year ridership estimates translate into
higher estimates of boardings attributable to the planned non-motorized investments in

Chapter 12 – Case Studies Page 135
the areas. In general, it is the project team’s recommendation that the most accurate
base ridership information be used when applying the results of the connectivity tools
and model. In the Project Prioritization chapter, the connectivity model was applied to
observed boardings, which are clearly more accurate than the basic connectivity model’s
estimate of ridership. For future conditions, using Sound Transit’s Federal Transit
Administration approved model may be most appropriate19, except when this model is
not applicable or results are not available.
CASE STUDIES: FINAL CONNECTIVITY MAPS AND TRAVEL SHEDS
The following maps highlight the 2035 conditions for the four case study locations,
including the future connectivity index along with the 15-minute bike and walk travel
sheds.
19
Sound Transit’s ridership model covers all of urban Snohomish, King, and Pierce County; even areas outside of the
Sound Transit taxing district and is generally a good source for accurate transit ridership data.

""
" " " " "
""
""
"
" " "" " " "
""
""
""
" " "
"
""
""" " " " " "
" "
" " "
"
" " "
" " "
""
"
" " " "" "
"
" " " " " " " " "
""
" " " " " "
" "
""
" " ""
""
"
" "
" " " "" " " " " " " " "
" " " " "
" "
""
"
" " " "
""
"
""
""
"
" " " " "
""
" " "
" " " "
""
""
""
" " " " " " "
"
" " " " "
" " " " "
" " " "" " "" "" "" "" " "
èéëìíèéëìí
èéëìíèéëìí
èéëìí èéëìí èéëìí
èéëìíèéëìí
!
N:\20
13Pr
ojects
\SE_P
rojec
ts\Kin
g_Co
unty_
NonM
otoriz
ed\Ju
ly201
4GIS\
ToPr
int\fig
61_F
edera
lWay
Proje
cts.m
xd
! Study StationsOff-street TrailBike Lane
èéëìí New SignalsNew Street
" " " " New Sidewalk
Figure 61Federal Way Transit Center
New Transportation Projects
Federal Way Transit Center
0 0.25 0.50.125 Miles

N:\20
13Pr
ojects
\SE_P
rojec
ts\Kin
g_Co
unty_
NonM
otoriz
ed\Ju
ly201
4GIS\
ToPr
int\fig
62_N
orthg
ateFin
alCon
necti
vity.m
xd
!
! Study Stations
Northgate Transit Center
ConnectivityHighLow
Figure 62Northgate Transit Center Future
Connectivity Map and 15-Minute Travel Sheds
! !
0 0.5 10.25 Miles0 0.5 10.25 Miles
0 0.5 10.25 Miles
Existing 15-Minute Bike ShedFuture 15-Minute Bike Shed
Existing 15-Minute Walk ShedFuture 15-Minute Walk Shed
The primary improvement inconnectivity in the Northgatearea was due to the non-motorized bridge across I-5. Additionally, the greenway signals and cycle tracks proposed in the area helped improve the arterial crossingscore and the bicycling stress environment. The impact of the bridge can be seen in the large increase in both the 15-minute walk and bike sheds from the station.
Connectivity Improvements

N:\20
13Pr
ojects
\SE_P
rojec
ts\Kin
g_Co
unty_
NonM
otoriz
ed\Ju
ly201
4GIS\
ToPr
int\fig
64_M
tBake
rFina
lConn
ectiv
ity.mx
d
!
! Study Stations
Mt. Baker LRT Station
ConnectivityHighLow
Figure 64Mt. Baker LRT Station Future Connectivity Map
and 15-Minute Travel Sheds
! !
0 0.5 10.25 Miles
Existing 15-Minute Bike ShedFuture 15-Minute Bike Shed
Existing 15-Minute Walk ShedFuture 15-Minute Walk Shed
Connectivity around theMt. Baker LRT station areaimproved primarily due tocycletrack installations andnew greenway signals. Thisimproved both the bike stressand arterial crossing feasibilityin the area while there werelimited gains in the 15-minute travel sheds due to the present density of the street network.
Connectivity Improvements
0 0.5 10.25 Miles0 0.5 10.25 Miles

N:\20
13Pr
ojects
\SE_P
rojec
ts\Kin
g_Co
unty_
NonM
otoriz
ed\Ju
ly201
4GIS\
ToPr
int\fig
65_F
edera
lWay
FinalC
onne
ctivit
y.mxd
!
! Study Stations
Federal Way Transit Center
ConnectivityHighLow
Figure 65Federal Way Transit Center Future Connectivity Map
and 15-Minute Travel Sheds
!
!
0 0.5 10.25 Miles
Existing 15-Minute Bike ShedFuture 15-Minute Bike Shed
Existing 15-Minute Walk ShedFuture 15-Minute Walk Shed
Connectivity in the Federal WayTransit Center area improvedprimarily from the new FederalWay Commons street grid andenhanced pedestrian crossingsof arterials, particularly PacificHighway and S 320th Street. These improvements provided amoderate expansion to the walkand bike sheds and helpedenable a lower bicyclingstress environment.
Connectivity Improvements
0 0.5 10.25 Miles0 0.5 10.25 Miles

Chapter 12 – Case Studies Page 140
PRIORITIZING PROJECTS WITHIN THE CASE STUDY AREAS
An earlier chapter presented a methodology to prioritize projects within station areas
across the entire region. This generalized analysis of project types was performed for the
four case study locations and the results are shown in Appendix B. While the
generalized project ranking is valuable to consider, the case studies give us the
opportunity to evaluate some types of projects more specifically. Therefore, several
projects were broken out from the generalized categories and evaluated/prioritized
separately as part of the case study analysis. The projects were chosen utilizing the
following steps:
The existing surfaces were evaluated to identify poor scoring areas such as
portions of a station area with low RDI scores or poor bike stress
Within these poor scoring areas, the future projects were reviewed to determine
if any would provide a substantial improvement to the existing poor connectivity
These projects include:
Northgate Transit Center
o I-5 pedestrian and bicycle bridge
o 1st Avenue cycletrack
Overlake Village
o SR-520 pedestrian and bicycle bridge
o New street grid
Mount Baker Transit Center and Link Station
o Cycletracks Rainier Avenue north of MLK Jr. Way and on MLK Jr. Way
Federal Way Transit Center
o New street grid in the Town Center area
The results of the connectivity analysis, along with the total project costs are shown in
Table 31.

Chapte
Projec
I-5 Ped1st AvSR520OverlaGrid MLK aCycletFedera
As sh
Feder
to th
the h
street
Overl
When
the st
A rev
rating
demo
priori
cost p
meas
Other
In ad
conn
trans
er 12 – Case Stu
ct
destrian Bridgeenue Cycletrac
0 Pedestrian Briake Village Stre
nd Rainier Averack al Way Street G
hown above
ral Way are
e large incre
high future
t grid result
lake Village
n considerin
treet grid in
view of Tabl
g, shows tha
ographic an
itization. Giv
per rider, th
sure develop
r Projects to
ddition to ev
ectivity tool
it. This proje
udies
Table 31: Ca
Are
e Northck Northdge Over
eet Over
. Mt. B
Grid Federa
e, the I-5 Pe
expected to
ease in conn
ridership lev
ts in a large
are expected
ng cost per n
Federal Way
e 22, which
at only the Fe
d transit se
ven the Fed
is project wo
ped earlier.
Enhance No
valuating the
allows user
ect identifica
ase Study “Sel
ea 20Da
Boar
hgate 27hgate 27rlake 2
rlake 2
Baker 4
al Way 18
edestrian Br
o result in th
nectivity sco
vels expecte
connectivity
d to be lowe
new rider, th
y rates secon
summarized
ederal Way T
ervice metric
deral Way st
ould rate be
n-Motorized
e non-moto
rs to identify
tion method
lected Projects
035 aily rdings
ConnSc
Ch
7,000 7,000 2,600
2,600
4,500
8,500
ridge at No
e most new
ores generat
ed at these
y change as
est amongst
he Northgat
nd best.
d the demo
Transit Cent
c developed
treet grid’s
est when con
d Transit Acce
rized projec
y additional
d is typically
s” Evaluation
nectivity core
hange
C
B
Co0.27 0.05 0.21
0.30
0.07
0.42
orthgate and
daily transit
ted by these
station are
s well, but th
the case stu
te cycletrack
graphic and
ter was rated
d for the e
strong perfo
nsidering the
ess in the Ca
ts planned
projects tha
a two-step
Results Change in
Daily Boardings
from onnectivity
1,800 340 140
200
80
1,900
d the new s
t riders. This
e projects co
eas. The Ove
he ridership
udies.
k rates the h
d transit serv
d within the
entire study
ormance wit
e aggregate
se Study Loc
by local juri
at could ben
process:
Page 14
Total Project
Cost
$ 25 M $ 1.1 M $ 13 M
$ 10.9 M
$ 3.2 M
$ 12.4 M
street grid a
s result is du
ombined wit
erlake Villag
levels at th
highest, whi
vice proximit
top 25 of th
area projec
th respect t
performanc
cations
sdictions, th
nefit access t
41
Annual Cost per
Rider
$4 $1 $25 $15
$11
$2
at
ue
th
ge
he
le
ty
he
ct
to
ce
he
to

Chapter 12 – Case Studies Page 142
1. Identify areas within a station that exhibit poor connectivity scores.
2. Determine the reason for the poor scores (RDI, signalized crossing, bike
stress, sidewalk gaps, etc.)
3. Test various project type and project locations within the station-area to
improve the score (For example, if a clear barrier is causing a poor RDI score
for an area, test the result of adding a link across that barrier)
As part of the case study applications, the project team performed this analysis at two
levels. 1) Evaluating the future 2035 composite connectivity score and individual
connectivity surfaces to look for poor scoring areas that could be addressed through
additional projects, and 2) identifying smaller-scale projects and other projects that
cannot be readily evaluated with the connectivity tools. The findings of the team are
listed below and summarized in Table 32.
Northgate Transit Center
A review of the final composite connectivity score map shown in Figure 62 shows that
that many of the remaining low-scoring areas in the Northgate Transit Center area are
due to gaps in signalized arterial crossings (note the “corridors” of orange/red colors
along streets such as Roosevelt Avenue and 92nd Street). However, as discussed earlier,
these streets are relatively low volume/low speed streets and feature other crossing
amenities such as marked (but unsignalized) crosswalks and four-way stops. Considering
this limitation of the data, the project team identified the following improvements in the
area:
If the Northgate Mall parcel were ever to redevelop, additional street grid or
pedestrian/bicycle pathways through the redeveloped site could improve access
between the transit center and the dense uses along Northgate Way. This
improvement would have a moderate benefit on improving the connectivity score
and generating potential new transit riders.
Field observations revealed that the pedestrian environment on Northgate Way
under I-5 is poor. There are high-speed ramps on either side of the underpass, the
sidewalk is adjacent to the traffic lanes (no buffer), and despite the presence of
lights, it feels dark. Even with a new pedestrian/bike bridge to the south, the project

Chapter 12 – Case Studies Page 143
team expects Northgate Way to continue to be heavily traveled by pedestrians
wishing to access the transit center from the northwest. The pedestrian (and to a
lesser extent bicycle) environment could be substantially improved if these issues
were addressed. These sorts of detailed improvements cannot be evaluated by the
connectivity model, but they are complementary to the other improvements the
model was able to evaluate.
Given the large increase in non-motorized access forecasted under 2035 by this
analysis and Sound Transit’s Link light rail ridership forecasts, it will be important to
monitor and meet the demand for bicycle parking. There are provisions for high-
capacity bicycle parking in the Sound Transit station design. This analysis suggests
that high-capacity bicycle parking will be important, along with good wayfinding so
that potential users know where the parking is located.
Overlake Village
Based on plans obtained from the City of Redmond, the Overlake Village area is
expected to change dramatically over the next 20 years. With the arrival of East Link, the
City envisions the area transforming from the existing auto-oriented retail/office
development form to more traditional transit-oriented development. To support this
change, the City has developed a robust plan that includes new street connections,
standards for wide sidewalks, and low-stress bicycle links to the station. The final
composite connectivity score map shows relatively good scores throughout much of the
station, however gaps still exist within the southeast portion of the station-area that is
located in the City of Bellevue. With this in mind, the project team identified the
following types of improvements for non-motorized connectivity in the area:
Extend the off-street trails along 148th and 156th Avenues south into Bellevue to
extend the low-stress bicycle catchment area of the station. As shown in Table 32,
this improvement would provide a substantial boost to the connectivity score and a
credible increase in ridership.
If the City of Bellevue were to adopt similar pedestrian design standards as
Redmond, then there would be a consistent and high quality pedestrian

Chapter 12 – Case Studies Page 144
environment in both cities. This would improve the overall pedestrian access to the
station.
Mt. Baker
Amongst the case studies, Mt. Baker is expected to experience the least amount of
change over the next 20 years, in large part because it already has Link light rail. The City
of Seattle is pursuing a modest rezone of the area, but nothing on the scale of the other
three case study areas. A review of the final composite connectivity score map shows
that the planned improvements in the area results in good overall connectivity. Given
this background, the project team focused more on small-scale improvements that were
revealed through the field visits and our earlier work in the area:
Some gaps in signalized crossings of Rainier Avenue continue to exist, particularly
south of the transit center. Providing additional crossing opportunities will aid
pedestrians and cyclists accessing the Link station and transit center.
As mentioned earlier, while the Mt. Baker area generally has good sidewalk
coverage, the sidewalks are old and are not constructed to a standard one would
now expect in a Hub Urban Village. Additionally, sidewalk maintenance is an issue
with many sidewalks in a state of poor repair. The City of Seattle will likely require
new development to upgrade the sidewalks in the area and these types of
improvements will improve the walking environment in the area and address some
existing challenges for people with limited mobility.
A long-standing critique of the Mt. Baker Transit Center and Link station is the
difficult connections between buses and rail. For example, the busy southbound
Route 7 stop is located a couple of blocks north of the Link station. While this is not
a simple problem to address, the project team feels that additional ridership
benefits could be gained by more closely linking the connections between bus and
rail.
The field visits found that there are pedestrian connections up the hill to the west of
the Link station, which provides access to the neighborhoods to the west. However,
many of these paths are heavily vegetated and the street lighting is obscured by
trees. Given these conditions, some people may hesitate to use these paths. Better

Chapter 12 – Case Studies Page 145
landscaping or vegetation maintenance could help to address these issues and
make these areas more attractive to a greater pool of users.
Federal Way Transit Center
Similar to Overlake Village, a major transformation of urban form and transportation is
being planned for around the Federal Way Transit Center. The City of Federal Way has
developed a robust plan to increase densities add street grid connections, and improve
bicycle access to the Transit Center area. A look at the final composite connectivity score
map shows good non-motorized access immediately around the station area. There are
low-scoring areas east of I-5, but as noted earlier, low population/employment densities
and steep terrain limit the utility of providing additional infrastructure in that area. The
team’s suggestions for additional connectivity improvements are listed below:
The Commons at Federal Way Mall is a barrier to accessing the residential areas
south of the mall. If this mall were ever to redevelop, extending the City’s planned
street grid south of 320th Street would improve access to the station.
The field work indicated that several streets around the transit center lack street
lighting. While it is likely that this lighting will be added in conjunction with adjacent
redevelopment, the research indicated that adequate lighting is important in
encouraging non-motorized access to transit.
Similar to Northgate, the large increase in transit ridership forecast at the Federal
Way Transit Center may spur the need for high-capacity bicycle parking facilities
and wayfinding signage. The existing facilities were well utilized. This analysis
suggests that bicycle parking will be important to meeting the overall non-
motorized access needs at this station.
Table 32: Case Study Project Evaluation
Project Area
Additional
Connectivity Score
Change
Additional Daily
Ridership
Grid through Northgate Mall parcel Northgate 0.007 50
Southerly extension of proposed off-street
trails along 148th and 156th Avenue
Overlake
Village 0.120 80

Chapter 12 – Case Studies Page 146
Table32: Case Study Project Evaluation (cont’d)
Project Area
Additional
Connectivity Score
Change
Additional Daily
Ridership
Additional Signal Crossings along Rainier
Ave Mt. Baker 0.051 60
Grid through Federal Way Commons Federal Way 0.017 80
Improved lighting/sidewalks along
Northgate Way underneath I-5 Northgate * *
Additional bicycle parking; bicycle
wayfinding Northgate * *
Wider sidewalks in City of Bellevue Overlake
Village * *
Wider sidewalks, sidewalk repairs Mt. Baker * *
Direct connection between bus bays and
Link light rail station Mt. Baker * *
Vegetation control/new landscaping along
hillclimbs Mt. Baker * *
Fill gaps in street lighting Federal Way * *
Additional bicycle parking; bicycle
wayfinding Federal Way * *
*The connectivity model is not able to evaluate these types of projects
Sidewalk Gap Evaluation
While not an issue for the case study locations, the project team recommends that any
detailed analysis of stop/station areas begin with a search of sidewalk gaps within 200
feet of a stop location. This is important because these gaps could be missed in an area
with generally good sidewalk coverage but no sidewalks immediately near the transit
stop.