
No. Title Author Year Publisher 1 Cervical Spine Deformity Surgery ...
Upload
khangminh22Category
view
3download
0
1
Interactive comment on Atmos. Chem. Phys. Discuss., doi.org/10.5194/acp-2018-489, 2018
RESPONSE TO REVIEWER 1
C.R. Flechard (Referee) The authors thank Dr. Flechard for his constructive comments and for taking the time to look at all the details
described in the manuscript. We have carefully considered all comments. Please refer to the specific responses.
1) General observations The mean weakness in the quality of the dataset is likely the large uncertainty in HNO3 caused by interferences
by other NOy compounds on potassium carbonate coated denuders. This is mentioned in the methods but not
referred to later on in the discussion in relation to trends in measured HNO3 and reported NOx emissions. With
a flat and constant correction factor of 0.45 for HNO3 measured from K2CO3 coated denuders (meaning that
55% of the raw concentration is substracted to provide a corrected number), one can wonder whether the
apparent decrease in HNO3 since 2000 is significant, or if the slope of the apparent decrease has any meaning.
With large changes in NOx emissions and in the general pollution climate of the UK over the last 20 years, and
therefore with possibly large changes in the ratios of HNO3 to the interfering NOy gases (NO2, HONO, PAN,
etc), it is risky to assume a constant 0.45 correction factor for the whole period, and also across the whole country,
given the large differences in pollution profiles between the sites of the network
Author Response: Additional text has been added under new heading “Section 3.3: Uncertainties in HNO3 determination” to
address the reviewer’s comments.
See below:
“HNO3 data were corrected for sampling artefacts in the measurements with an empirical correction factor of
0.45 (see section 2.6). Interferences in HNO3 determination arise through the simultaneous collection of reactive
oxidized nitrogen species on the K2CO3 coating that forms nitrate ions in the aqueous extracts of exposed
denuders. Potential interfering species include HONO, NO2, N2O5 and PAN, as well as other inorganic and
organic nitrogen species. HONO is most likely to contribute to the interference, since it is collected effectively
on a carbonate coating and concentrations of HONO have been reported to be comparable to, and in some places
exceed HNO3 in the UK (e.g. Kitto & Harrison 1992, Connolly et al. 2016). Interference from NO2 should be
small, since the reactivity of a carbonate coating surface towards NO2 is low (Allegrini et al., 1987), with
capture of NO2 on carbonate ranging from 0.5 to 5 % (Allegrini et al., 1987, Benner et. al. 1991, Fitz 2002) and
their concentrations are also small at rural AGANet sites (< 10 µg NO2 m-3; Conolly et al., 2016). Tests by
Steinle et al. (2009) on the AGANet K2CO3/glycerol coated denuders also confirmed low capture (ca 3 %) of
NO2.
The correction factor was derived from two years of field intercomparison measurements at five sites across a
range of pollutant concentrations across the UK, from a clean rural background site in Southern Scotland
(Auchencorth) to a polluted urban site (London Cromwell road) in Southern England (Tang et al., 2015). It is
recognised that the correction factor to derive the “real HNO3” signal from the carbonate coated denuders will
be dependent on the relative concentrations of HNO3 to interfering species present in the atmosphere and likely
to be both site and season specific. The 2 years of data indeed show this variability between sites and between
seasons. Given the complexities of atmospheric chemistry of the large family of oxidised nitrogen species,
further work is clearly needed to understand what the carbonate denuders is measuring, before an improved
correction algorithm for the HNO3 data can be developed with any confidence.
The empirical 0.45 HNO3 is therefore at present a best estimate across a range of pollutant concentrations and
seasons encountered in the UK, based on available test data from 5 sites. At the cleanest rural sites (e.g.
Eskdalemuir), where a much smaller HONO and NO2 interference of the DELTA HNO3 signal is expected, the
HNO3 concentrations may be under-estimated after correction. This may partly explain the slope deviating from
unity in the comparison of corrected AGANet TIN with EMEP filter pack TIN data (slope = 0.835, R2 = 0.95) at
Eskdalemuir (see section 3.1.2). Conversely, at more polluted sites such as London that are affected by a larger

2
interference from HONO and NO2, the HNO3 determination may be over-estimated after correction. Apart from
two urban sites (London and Edinburgh), all other sites in the AGANet are rural, located away from traffic, and
the 0.45 correction factor should be more representative.
Since January 2016, the DELTA denuder sample train configuration in AGANet was changed to two NaCl
coated denuders (selective for HNO3, e.g. Allegrini et al., 1987), with a third K2CO3/glycerol coated denuder to
collect SO2. At three sites (Auchencorth, Bush OTC and Stoke Ferry), parallel measurements of the old
configuration (two K2CO3/glycerol coated denuders) and new configuration (two NaCl coated denuders +
K2CO3/glycerol coated denuder) were conducted over 12 months in 2016. In the new configuration, nitrate
measured on the NaCl denuders are reported as HNO3, whereas nitrate on the K2CO3 denuder are assumed to
come from other oxidised nitrogen species and are not reported. Comparing the sum of nitrate concentrations
from the new (2xNaCl + 1xK2CO3) with the old (2xK2CO3) configurations indicated matching capture of total
nitrate by the two parallel systems (new:old nitrate ratio = 0.95). A comparison of nitrate concentrations on the
2xNaCl denuders only (new configuration) with the 2xK2CO3 denuders (old configuration) yielded an average
ratio of 0.42, lending further support to the 0.45 empirical factor. Additionally, the new sample train
configuration is providing an extensive dataset which will allow the magnitude of HNO3 interference at each
site to be quantified, by comparing the amount of nitrate measured on the NaCl and K2CO3 coated denuders.
Initial analysis of 2016 data (unpublished data) showed that the mean ratio of nitrate on NaCl:K2CO3 of all sites
was 0.44, ranging from 0.31 (Bush OTC) to 0.59 (Moorhouse). Seasonally, the average monthly ratio (taken as
the mean across all sites for each month) was lowest in winter (0.25 in December and 0.27 in January) and
highest between May to June (0.59, 0.56 and 0.57). It may therefore be possible to derive an improved
correction algorithm that is both site and season specific, and work is ongoing to make this assessment. A
detailed assessment of sampling artefacts in the DELTA method and the effects of a method change in the
AGANet forms the subject for a next paper. “
Additional text also added to revised/expanded text in Section 3.6 Seasonal variation in acid gases and aerosols
(paragraph 2):
“HNO3 is a secondary product of NOx, but NOx emissions are dominated by vehicular sources which are not
expected to show large seasonal variations. Seasonal changes in chemistry and meteorology are therefore more
likely to be a source of the observed variations in HNO3 and NO3- (Figure 8). A weak seasonal cycle is observed
in HNO3, with slightly higher concentrations in late winter and early spring that may be due to photochemical
processes with elevated ozone in spring (AQEG 2009) leading to formation of HNO3 during this period (Pope et
al., 2016). As discussed in section section 3.3, a constant correction factor was applied to all HNO3 data,
which does not take into account seasonal dependency. The concentrations in HNO3 may therefore be
over-estimated in winter (less HNO3 formed from photochemical processes) and under-estimated in
summer (larger HNO3 concentrations due to increased .OH radicals for reaction with NO2 to form
HNO3), masking the true extent in the seasonal profile.”
2) Specific Comments p6, l4, ’...sampling rate of 0.2-0.4 l/min...’ Please mention at this stage, or just below in the paragraph describing the aerosol collection system, what the particle size cut-off is for the DELTA sampler (mentioned later on p10, l3). It is important to know what the size spectrum of collected aerosols is, and that some (coarse) particles are not sampled, eg dust, large marine aerosols.
Author Response:
The text below was inserted at the end of the paragraph 3 (section 2.2 Extended DELTA methodology for
sampling acid gases and aerosol in AGANet).
“A particle size cut-off of around 4.5 µm was estimated for the DELTA air inlet (Tang et al., 2015). The
DELTA will therefore also sample fine mode aerosols in the PM2.5 fraction, as well as some of the coarse mode
aerosols < PM4.5.”
3
3) p7, l6-7, change of analytical labs from Harwell to CEH Lancaster in 2009: was there a transitional period of overlapping parallel measurements by the two labs, to make sure no bias was introduced in the long term time series by the change of laboratory?
Author Response: There was no transitional period of overlapping measurements, but measurements of replicated samples were
compared between the two labs to ensure that there was no bias in chemical analysis prior to the lab. switch. CEH
Lancaster laboratory is UKAS accredited, with experience of DELTA measurements prior to taking over the
network measurements from Harwell lab.
4) p7, l26, ’...flagging up occurrences of poorly coated denuders and/or sampling issues...’ Another possibility is that concentrations are so large that the first denuder saturates and thus much is collected by the second denuder. This can happen for NH3 at agricultural sites after fertilisation; it is much less likely for acid gases due to lower concentrations, unless perhaps at some polluted urban stations?
Author Response: At high concentrations, saturation of the first denuder can indeed lead to lower gas capture efficiencies
(breakthrough and capture on second denuder). The monitoring network sites are however located away from
sources to monitor ambient concentrations. In 2015, the mean capture efficiencies for NH3, HNO3, SO2 and HCl
were 96%, 83%, 91% and 79 %, respectively.
5) p8, l15, the term ’bias’ is used in relation to the 0.45 correction factor for HNO3, in the title of 2.6 and also other parts of the text. This is perhaps misleading as a bias suggests an offset, while the multiplicative correction applied acts on the span. Further, in the Tang et al 2015 report, the authors write that ’... It is recommended that a correction factor of 0.45 be applied to the historic HNO3 measurements. The range of ratios was 0.44±0.15 (±2SD), i.e. 0.29-0.59, therefore it is reasonably likely that the value lies between 0.4 and 0.5. Therefore a correction factor of 0.45 should be applied...’ It is quite clear that the percentage of non-HNO3 NOy compounds that is measured after extracting K2CO3-coated denuders depends on the relative abundances of these gases compared with HNO3, as well as their collection efficiencies on K2CO3 and their oxidation/reaction rate following adsorption. I would expect large seasonal changes, and large spatial/geographical variations, in these concentrations and the associated chemical processes, as reflected in the observed 0.29-0.59 range. Applying the same correction factor at all sites of the network, that range from remote to coastal to rural to sub-urban and urban, does not seem to be adequate. This is hinted at in the Eskdalemuir example of Fig. 3, where applying the large 0.45 multiplier makes the DELTA TIN values diverge from the EMEP filter pack measurements, ie at this rural background site the need for such a large correction is not warranted. The correction factor should account for the differences in pollution climates between sites, and also for changes over the 20-year period. Could an empirical correction be derived from chemical transport modelling (eg EMEP4UK), whereby the ratios of modelled HNO3 to NO2, HONO, PAN, etc, are used to construct a geographically- and temporally-varying index to drive the correction function? The HNO3 data reported in Tang et al (2015) for NaCl vs K2CO3 coating, with measurements made in contrasted situations (rural, urban, remote, see Table 1 in that report), may be used for calibrating such a function.
Author Response: The tile of section 2.6 has been changed to “HNO3 measurement artefacts and correction”
Regarding the empirical correction of the HNO3 data, please see author response to general comments on pages
1 - 2.

4
6) p8-11, section 2.7 Performance of the DELTA method: strictly speaking, this section describes measurement results from intercomaprison experiments or even long term datasets (Bush, Eskdalemuir) does not belong in Methods, and should be moved to the beginning of Section 3- Results
Author Response: Section 2.7 Performance of the DELTA method was included in the method section to separate this component
from the main focus of presenting AGANet data in the results and discussion section.
But agree:
Moved to beginning of section 3 – Results and Discussion.
3.1 Performance of DELTA method
3.1.1 Comparison with daily annular denuder measurements
3.1.2 Comparisons with filter pack measurements: HNO3/NO3- and NH3/NH4
+
3.1.3 Comparisons with bubbler and filter pack measurements: SO2 and SO42-
7) p10, l12: Ca++ and Mg++ concentrations were near detection limits because they are mostly in the coarse fraction, with particle sizes near or above the DELTA cut-off. How much of the NaCl is similarly not collected by the DELTA system? Also, in relation to the DELTA v. ADS intercomparison, the loss of NO3, Na and Cl on the surface of the cyclone is put forward as an explanation for the lower ADS aerosols concentrations (compared with DELTA) (p10, l10), but why in that case is SO4= 23% larger in the ADS?
Author Response: NaCl is the main constituent of seasalt aerosol and size of seasalt aerosols ranges widely from ~0.05 to 10 µm in
diameter, with their particle sizes also varying with humidity. The DELTA cut-off is estimated to be around 4.5
µm, so the DELTA will sample NaCl aerosols in the PM4.5 particle size region. Na+ measured on the DELTA are
above detection limits, with concentrations ranging between 0.4 to 1.8 ug Na m-3 (annual mean in 2015). In the
DELTA v ADS intercomparison of base cation measurements, the slope for Na was 3.0 (R2 = 0.24) and for Mg,
the slope was 2.4 (R2 = 0.24), but a lot of scatter for Ca2+ as both ADS and DELTA Ca2+ data were at or below
LOD. The DELTA therefore captures Mg2+ and Na+ well, but not Ca2+, which is what we find in the AGANet
data.
The slope for SO42- in DELTA v ADS intercomparison is 0.69 (R2 = 0.89). The smaller SO4
2- signal on the DELTA
may be due to incomplete capture of fine mode sulphate on the DELTA base coated cellulose filters. In the DELTA
assessment report by Tang et al. (2015), up to 30 % of the total acid sulphate was measured on a 2µm porosity
PTFE membrane placed behind the K2CO3 coated filter to capture break-through. Since 2016, an additional PTFE
membrane is added in front of the carbonate and acid coated cellulose filters.
A detailed assessment of the DELTA system against filter pack with a focus on SO2 and SO42- in 1999 by Hayman
et al. (2006) had previosuly shown close agreement between the two methods, providing confidence in SO2 and
SO42- measurements by the DELTA. Sulphur measurements provided by the DELTA replaced filter pack
measurements in 1999.
Further work is ongoing to understand, assess and correct the bias in SO42- measurements in historic data. Since
the DELTA method was unchanged for the assessment period in this paper, the bias in SO42- should not influence
the interpretation of long-term trends in the data.
8) p13, l2: the highest HCl concentrations are in the SE and SW of England, but also in the Midlands
Author Response: Thank you. For an international audience, they may not know where the Midlands is. I propose to use “central
England” instead of “Midlands”,
Revised text below:
“HCl in the atmosphere are mostly emitted from coal combustion and the highest concentrations of HCl are in
the source areas in SE and SW of England, and also in central England (north of the Ratcliffe-on-Soar power
station)…,…”
5
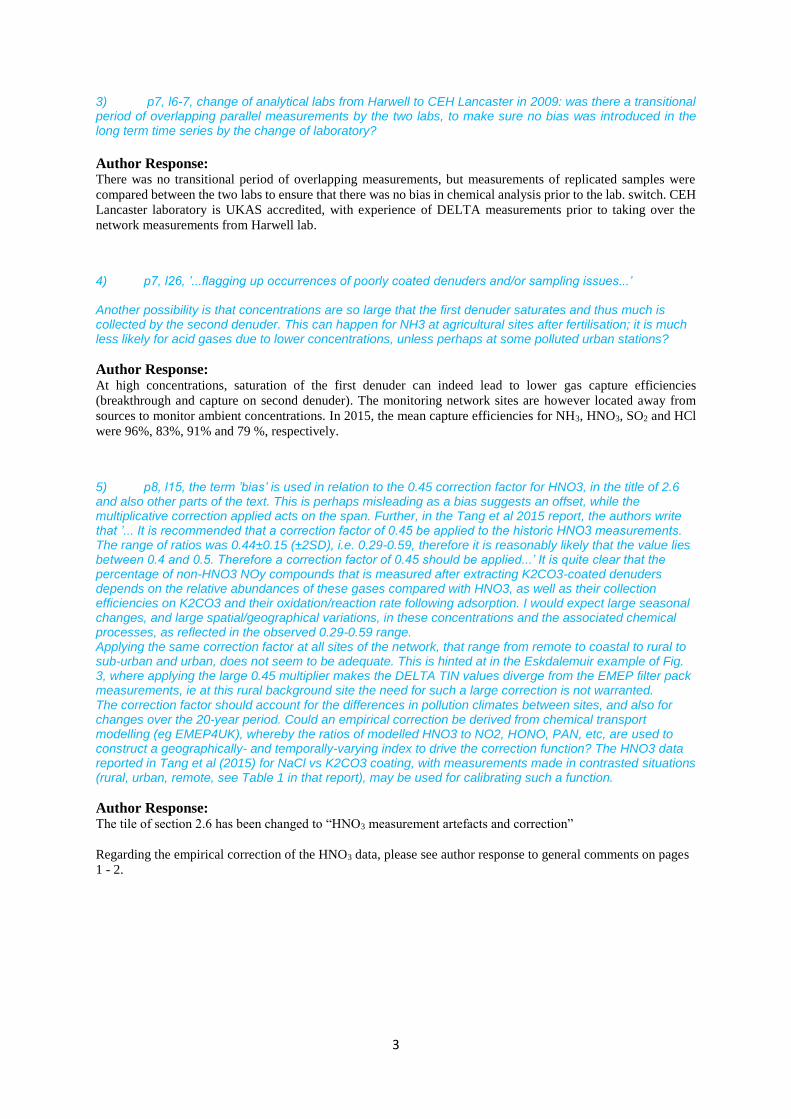
9) p13, l5: ’...Further away from the coast and influence of marine aerosol, the smallest concentrations of Cl and Na+ are measured in the west of the country (Lough Navar in Northern Ireland...’ Lough Navar is very near the coast (10km) and yet NaCl concentrations are very low (similar to concentrations in the Midlands), compared with all other western sites in the network (Fig. 5); what could be the reason?
Author Response: The Lough Navar site is actually approx. 40 km inland, close to the border between Northern Ireland and Republic
of Ireland, within a forested area. The UK maps in the manuscript are all shown without Republic of Ireland,
which may have given a false impression of Lough Navar being closer to the sea than it is in reality. Given its
location inland, and the prevailing wind direction coming from the SW, it is far from the influence of seasalts.
10) p13, l5: For Cl- and Na+, ’...largest concentrations at coastal sites in the south (Barcombe Mills) and west (Yarner Wood)...’; actually the highest concentrations are at Goonhilly at the SW tip of Cornwall.
Author Response: Thank you for spotting that.
Barcombe Mills and Yarner Woods are two of the original 12 sites that were established in 1999 in AGANet. As
coastal sites, Na+ and Cl- were always highest at these two sites up to the point when the new Goonhilly site in
Cornwall was added as part of the network expansion in 2006. Na+ and Cl- are indeed higher at Goonhilly than
Barcombe Mills and Yarner woods.
Text has been corrected accordingly.
“The spatial distributions of Cl- and Na+ were similar, with largest concentrations at the coastal sites Goonhilly
in SW England and Lerwick-Shetland in the Shetland Isles,….”
6
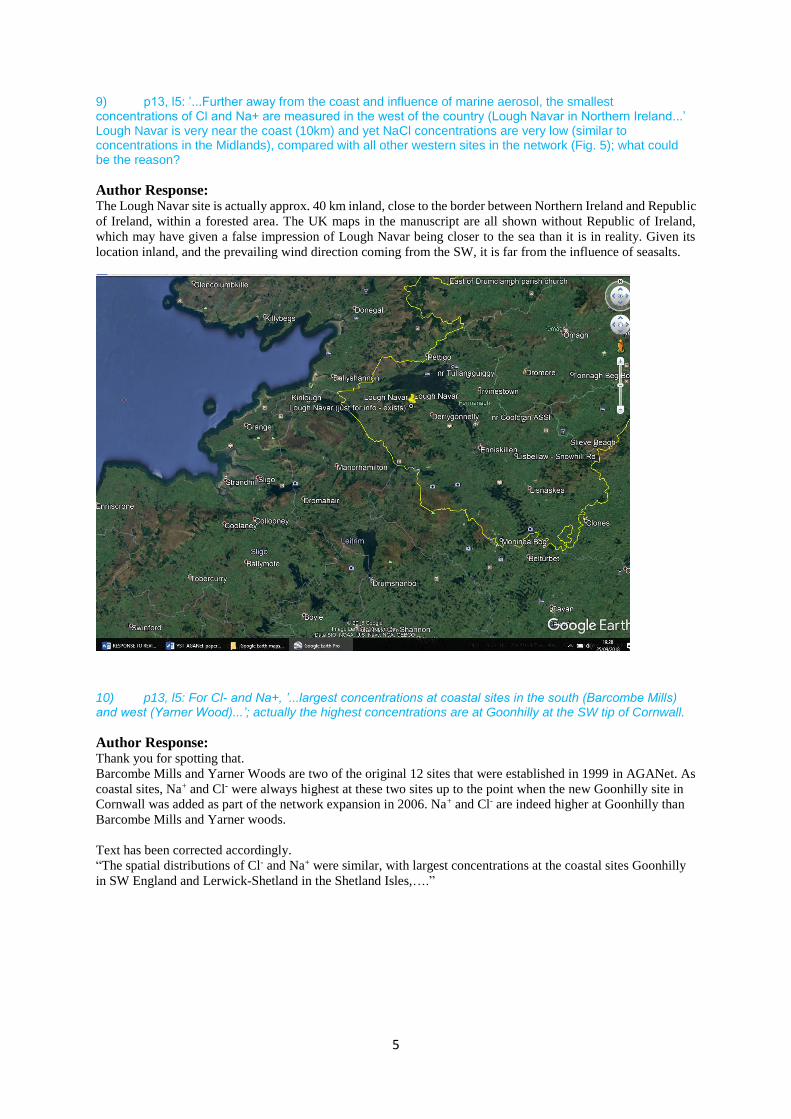
11) p13, l9-10, ’...There is however no clear spatial pattern for Ca2+, with concentrations that are mostly at or below LOD...’ For both Ca and Mg, which are mostly in the coarse fraction, it may be argued that the DELTA system does not allow a realistic assessment of the total concentration, because a large share of coarse particles are not collected. Please comment.
Author Response: Ca, Na and Mg are mainly in the 1 – 10 µm fraction in ambient aerosol. The size cut-off for the DELTA is around
4.5 µm, which means it will sample base cations in the PM4.5 fraction.
In the DELTA (PM4.5) v ADS (PM2.5) intercomparison of base cation measurements (see response to comment 7
earlier), the slope for Na was 3.0 (R2 = 0.24) and for Mg, the slope was 2.4 (R2 = 0.24), but no relationship was
established for Ca2+ as both ADS and DELTA Ca2+ data were at or below LOD.
This suggests that the DELTA captures Mg2+ and Na+ in the PM4.5 fraction reasonably well. At all AGANet sites,
Na and Mg measurements are above LOD, whereas Ca2+ are mostly at or below LOD. Aerosol filter blanks for
Ca2+ are also much more variable than Na or Mg. Ca2+ is particularly problematic in chemical analysis as
adsorption losses readily occur due to electrostatic interaction between Ca2+ and surfaces, especially plastic. To
this end, aerosol sample extracts are acidified to minimise adsorption of Ca2+ to surfaces.
Sampling of Ca2+ is also likewise problematic as Ca2+ can potentially stick to inlets and surfaces. Tests conducted
to assess adsorption losses of components to the connecting 6-mm diameter LDPE tube in the DELTA sampling
train showed that measured concentrations of Ca2+ were within the noise of the LDPE tube blanks (i.e. clean LDPE
tubes extracted with deionised water), adding to the uncertainty in Ca2+ measurements (see also response to next
reviewer comment 12).
Retention and transmission efficiency of the DELTA sampling train as used in the AGANET network
35
30
25
20
15
10
5
0
dm
/dlo
g(D
p)
[g
m-3
]
0.01 0.1 1 10
Dp [m]
1.0
0.8
0.6
0.4
0.2
0.0
Sam
plin
g e
ffic
iency
Water Cl-
NO3
- SO4
2-
NH4
+ Na
+ OOA HOA
EC Crustal (Ca2+
)
Combustionderived
Accumulationmode
(secondary)
Friction generated(Sea salt, resuspension, ...)
transmission efficiency filter retention efficiency fitted curve
7
12) Further, our own tests with DELTA systems at INRA indicated very substantial losses for Mg and Ca in all the non-filter parts of the sampling train (particularly the 6-mm diameter LDPE elbow connecting the 2nd acid denuder to the first NH3 denuder, Fig.S1), which are therefore not measured on the filter. We analysed the loss fraction LDPE / (LDPE + den + filter) for all compounds; for NH4+ and NO3- this was less than 5%; for Cl- and Na+ this was 5-10%; for SO4= and Mg2+ this was 10-15%; while for Ca2+ this was 30-40%. Beyond the question of coarse aerosols that were not sampled at all (did not enter the sampling train), there is the question of those coarse aerosols that ’did not make it’ to the filter pack. Did the authors carry out similar tests, and could the results be shown in the supplement? It may be that the new straight design for the DELTA sampling train allowed a reduction of these losses? Please comment.
Author Response: Potential loss of particulate components to the connecting tube 6-mm diameter LDPE in the DELTA sampling
train (Fig.S1) was investigated and reported in the DELTA assessment report by Tang et al. (2015).
Our test results (extracted from Tang et al., 2015) are similar to the INRA findings outlined above:
NO3-: loss to LDPE tube is negligible (2.4 ± 0.8 % (mean ± SD) across all sites for all available data).
NO2-, SO4
2- and Cl-: losses to LDPE are small (< 6%).
Base cations Na+ and Mg2+: losses to LDPE are slightly higher (<7%).
Base cations Ca2+: there is a large degree of uncertainty in the calcium assessment, due to 1) variability
of Ca2+ in the blank LDPE tube extracts and 2) very low Ca2+ on LDPE tubes from sites, that were similar
to blank values and close to the detection limit (LOD = 0.05 mg/L Ca2+).
Since January 2016, the new DELTA sample train configuration is linear, eliminating the use of the LDPE
connecting tube.
13) P15, l1: This section 3.4 is mostly about sub-annual (seasonal) variations, so could be re-named ’Seasonal variations in acid gases and aerosols’, as opposed to long term trends of Sections 3.5-3.6
Author Response: OK. Agree. Renamed
“3.6 Seasonal variation in acid gases and aerosols”
14) p15, l9-10: ’...In spring, the peak in HNO3 and NO3...’ Fig.7 does not actually show any spring peak for HNO3; the late winter (Feb-Mar) concentrations are only marginally higher (but not significantly different accoring to the error bars) than the rest of the year? The opening sentence of the paragraph should read ’...maximum in late winter and early spring...’
Author Response: Thank you. Text revised in “Section 3.6 Seasonal variation in acid gases and aerosols”
See below: “HNO3 is a secondary product of NOx, but NOx emissions are dominated by vehicular sources which are not
expected to show large seasonal variations. Seasonal changes in chemistry and meteorology are therefore more
likely to be a source of the observed variations in HNO3 and NO3- (Figure 8). HNO3 has a weak seasonal cycle
with slightly higher concentrations in late winter and early spring that may be due to photochemical processes
with elevated ozone in spring (AQEG 2009) leading to formation of HNO3 during this period (Pope et al.,
2016). As discussed in section 3.3, a constant correction factor was applied to all HNO3 data, which does not
take into account seasonal dependency. The concentrations in HNO3 may therefore be over-estimated in winter
(less HNO3 formed from photochemical processes) and under-estimated in summer (larger HNO3 concentrations
due to increased .OH radicals for reaction with NO2 to form HNO3), masking the true extent in the seasonal
profile.”

8
15) p15, l22, ’...this contributes to the winter minimum in NH4NO3...’ : the minimum NO3- actually occurs in July?
Author Response: Thank you. Text revised in “Section 3.6 Seasonal variation in acid gases and aerosols”
See below: “Warm, dry conditions in summer promotes dissociation, increasing gas-phase HNO3 relative to particulate-
phase NH4NO3, limiting peak NO3- aerosol concentrations (Figure 8). This process accounts for the minima in
NO3- concentrations (Figure 7) and the highest ratio of HNO3 to NO3
- seen in July (Figure 8). Cooler conditions
in the spring than early autumn sees a larger fraction of the volatile NH4NO3 remaining in the aerosol phase.
The peak in NO3- concentrations and the low HNO3:NO3
- ratio in spring-time (Figure 8) is thus a combination of
larger NO3- from reaction between higher concentrations of the precursor gases HNO3 and NH3, and partitioning
to the aerosol phase. Import from long-range transboundary transport of particulate NO3- e.g. from continental
Europe into the UK, as discussed in Vieno et al. (2014, 2016) adds to the elevated NO3- concentrations. In
winter, low temperature and high humidity also shifts the equilibrium to formation of NH4NO3 from the gas-
phase HNO3 and NH3. Since NH3 concentrations are lowest in winter however, with less NH3 available for
reaction, NH4NO3 concentrations are correspondingly smaller in winter than in spring or autumn.”
16) p16, l9-13: how far should seasonal cycles for Mg and especially Ca be discussed, given the low collection efficiency (and thus high uncertainty) of filter data (see my comment above on aerosol size cut-off and losses in sampling train for these large aerosols)?
Author Response: The discussion of the seasonal cycles on Mg2+ and Ca2+ are based on what the measurement shows. Mg2+
measurements were above LOD, with similar trends (spatial and seasonal) to Na+, so a discussion on seasonal
cycle for Mg is warranted. In the case of Ca2+, uncertainties in interpretation of the Ca2+ data is discussed.
17) p17 and beyond, general comment on sections 3.5-3.6: a linear regression is fitted to all datasets from 1999 through 2015, but looking closely at the 15-yr time series for the 12 sites (eg Fig. 12-13), for HNO3, NO3-, SO4=, NH4+, NH3, it appears that concentrations were rather stable (with some interannual variability but no trend) in the period 2000-2007, and then only started declining after 2007. The only exception is SO2 with a continuous decline all the way. Fitting a linear trend is helpful to quantify an multi-annual rate of decrease (which is what you do), but is not an accurate representation of the time course of concentrations. Can you think of any plausible explanation for a change of course around the year 2007: change or implementation of pollution control policies? Decadal change in weather patterns? It might be useful to show (in the supplement)a summary of weather patterns for all sites of the network, the 15-yr time course of temperature, rainfall, wind speed etc.
Author Response:
“Section 3.8 Assessment of trends in relation to UK emissions” has been revised and expanded to include a more
thorough discussion of trends under new sub-headings.
3.8.1 Trends in HNO3 and NO3- vs NOx emissions
3.8.2 Trends in SO2 and SO42- vs SO2 emissions
3.8.3 Trends in HCl and Cl- vs HCl emissions
3.8.4 Trends in NH3 and NH4- vs NH3 emissions
3.8.5 Changes in UK chemical climate
Revised/expanded text:
“The overall downward trends in HNO3 and NO3- are seen to be broadly consistent with the −49 % fall in
estimated NOx emissions (NAEI, 2018) over the 16 year period between 2000 and 2015 (Figure 14). Reductions
in combustion (power stations and industrial) and vehicular sources (fitting of catalytic converters), coupled to
tighter emission regulations are major contributory factors to the decrease in UK NOx emissions. The rate of
reduction however stagnated in the period 2009 and 2012 (improvement in emissions abatement offset by

9
proportionate increase from diesel combustion and increase in vehicle numbers), followed by a 16 % decrease
between 2012 and 2015 due to the closure of a number of coal-fired power stations.
It is notable that the first 6 years (2000-2006) of HNO3 and NO3- annual data show substantial inter-annual
variability and in particular are dominated by the large 2003 peak in concentrations (see sect. 0). Variability in
the annual data thus highlights the sensitivity of the trend assessment to the selection of a reference start for the
time series, since the annual mean concentrations of both HNO3 and NO3- in 2000 are in fact smaller than
concentrations in the following 6 years. Re-analysis of the same annual data normalised against 2001 instead of
2000 takes the relative trend line for HNO3 and NO3- much closer to the relative trend line in NOx emissions. In
the later period between 2006 and 2015, the relative trend lines in HNO3 and NO3- using mean data from 12 or
30 sites were not significantly different and emissions and concentrations trends followed each other closely.“
Regarding the reviewers comment on the possibility of change in weather patterns to explain the apparent biphasic
trend, the UK annual average temperature and rainfall (https://www.metoffice.gov.uk/climate/uk/summaries)
show no overall trend in the 16 years of climate data between 1998 and 2015. 2010 was however an unusual year,
with a lower than average mean annual temperature of 7.9 C due to an exceptional cold winter, with Dec 2010
recorded as the coldest for over 100 years (cf. 9.2 C average for 2000 to 2015) and lower than average rainfall
of 950 mm (cf. 1180 mm average for 2000 to 2015). Graph of UK annual mean temperature and rainfall has been
added to supplementary materials.
In terms of implementation of pollution control policies that could explain the change in course of the pollutant
trend concentrations:
In 2007, the designation of Nitrate Vulnerable Zones (NVZs) in the UK was introduced to strengthen the range
of measures in the Nitrates Action Programme under the Nitrates Directive (91/676/EEC). NVZs are areas
designated as being at risk from agricultural nitrate pollution and farms within NVZs must comply with the rules
laid down on use of nitrogen fertiliser and storage of organic manure. Adoption of NAP by farms will also likely
reduce emissions of NH3. NH3 data from the 12 sites in AGANet were stable from 2000-2010 and decreased
between 2010 and 2012 with concentrations again stabilising after 2012.
It could be surmised that there was more NH3 before 2007 to react with the acid gases and form / maintain
higher concentrations of aerosols. But it has also to be borne in mind that the period between 2000 and 2007 was
subject to a pollutant episode in 2003 and the data, as you also pointed out, is extremely variable. The apparent
change in course of pollutant concentrations in NO3- and SO4
2- is more likely due to influences of import from
long range transboundary pollutant transport and meteorology.

10
18) p18, l6: ’...The long-term time series in annually averaged concentrations of the gas and aerosol components are shown in Figure 12a and Figure 12b...’: would it be possible to show, alongside the measured DELTA time series, the modelled NO/NO2 time series (from a CTM, eg EMEP4UK) for the same sites? In a way this would account for both NOx emission changes as well as climatic variability over the period.
Author Response: Dr Massimo Vieno (CEH) is currently working on a paper comparing EMEP4UK with measurement data from
NAMN and AGANet.
NO2 concentrations is however measured at rural sites across the UK in the UKEAP NO2-net (NO2 diffusion
tube network), some of which are co-located with the AGANet. The network average in annual mean NO2
concentrations showed a downward trend, decreasing from ~8 µg NO2 m-3 in 2000 to ~ 4 µg NO2 m-3 in 2015
(Conolly et al. 2016).
In terms of climatic variability from the UK, there is no apparent trend in the UK rainfall and temperature data
(see earlier response to comment 17).
Additional text added in section 3.8.1 Trends in HNO3 and NO3- vs NOx emissions, end of last paragraph.
A comparison of the network averaged NO2 concentrations with NOx emissions by Conolly et al (2016) showed
matching decreasing trends between 2000 and 2015, with annual mean NO2 concentrations falling 2-fold to 4 µg
NO2 m-3 in 2015 (Conolly et al. 2016). Although there is uncertainty in the corrected HNO3 data (see
section3.3), the encouraging agreement between HNO3, NO2 concentrations and NOx emissions lends support to
a linear response in HNO3 concentrations to reductions in NOx emissions.
19) p18, l12 ’...The exceptions are Na+ and Cl- that have higher mean concentrations...’ : Na+ is not shown in Fig.12.
Author Response: Mean concentration of Na+ from 12 and 30 sites are compared in Table 4.
Table 4 inserted at the end of the sentence:
“The exceptions are Na+ and Cl- that have higher mean concentrations from the 30 sites than the original 12 sites
(Table 4).” 20) Figures 13, 14: use only one type of regression to simplify the figures (LR and MK give almost identical results)
Author Response: Figures 13 and 14 have been amalgamated into one single figure, with LR analyses taken out and moved to
supplementary materials.

11
21) p20, l24-25 ’...the reduction in SO2 emission and measured concentration is accompanied by a smaller negative trend in particulate SO4=...’, and l27, ’...The smaller decrease in particulate SO4= compared with its gaseous precursor, SO2, is similar to that observed at Eskdalemuir...’. Question: Is the smaller reduction rate in SO4= (compared with SO2) a reflection of the fact that increasingly in the UK, total sulphate includes a larger and larger fraction of marine sulphate, such that the decrease in anthropogenic SO4= (resulting from SO2 abatement) has a increasingly small effect on total sulphate? Is it possible to re-calculate the SO4= trend separately for coastal and inland (eg Midland/London) sites?
Author Response:
Additional text added in “section 3.8.2 Trends in SO2 and SO42- vs SO2 emissions” to discuss sea salt SO4
2-
(SS_SO4) – see below:
“Sea salt SO42- (SS_SO4) aerosol, as discussed in section 3.5, makes up a significant fraction of the total SO4
2-.
It is possible that the smaller reduction in particulate SO42-, compared with SO2, may be explained by an
underlying increase in the relative proportion of SS_SO4 to total SO42-. To assess the contribution of SS_SO4 to
the observed trends in total SO42-, SS_SO4 concentrations (estimated according to the empirical equation
described in Sect. 3.5) and NSS_SO4- (= total SO42- – SS_SO4) are compared with the long-term trends in total
SO42- in Figure 17. Overall, there is no trend in the long-term annual mean SS_SO4 data, with concentrations in
range of 0.16 to 0.21 µg SO42-. Since SS_SO4 is derived from an empirical relationship with Na+ (sect.3.5), the
long-term trend data for Na+ is also included in the analysis (Figure 17). Similar to SS_SO4, there is no overall
trend in the Na+ data either, with small inter-annual variability and annual mean concentrations in the range of
0.65 – 0.85 µg Na+ m-3. SS_SO4 made up just 10% of the total SO42- in 2000, but by 2015, this had increased to
just over 50% due to the decrease in NSS_SO4 over that time. MK analysis of the NSS_SO4 (Tables 4 and 5)
showed decrease in concentrations of –78 % (2000-2015) and –62% (2006-2015), similar to that observed in
SO2 (–81 %: 2000 –2015 and –60 %: 2006 – 2015), indicating a closer relationship between NSS_SO4 and SO2
than between total SO42- and SO2.”
NSS_SO4 Total SO4

12
22) p21, l5-22: The argument about the NH3/SO2 ratio impacting the dry deposition velocities of SO2 and NH3 was developed in the 1980s and early 1990s, when SO2 concentrations were still very large in W. Europe. It is no longer sufficient to consider the NH3/SO2 ratio alone, since SO2 no longer massively dominates the acid load in W. European atmospheres. Instead, the ratio NH3/(2*SO2 + HNO3 + HCl) should be computed to analyse long terme trends, as shown in Fowler et al. (Atmospheric Environment 43 (2009) 5193–5267, see Fig. 4.5). It is the combined effects of all acids and NH3 that determines the pH of cosystem/vegetation surfaces and hence their sink strength for water-soluble pollutants.
Author Response: Additional analysis of the change in molar ratios of NH3 to acid gases and molar ratios of NH4
+ to NO3- and
SO42- with time has been carried out – new figure added in manuscript: Figure 18: Long-term changes between
2000 and 2015 in (a) molar ratio of NH3 to acid gases (SO2, HNO3 and HCl) and (b) molar ratio of particulate
NH4+ to acid aerosols (SO4
2- and NO3-) from measurements made at 12 sites in AGANet.
1)
Long-term changes in the molar ratio of NH3 to acid gases (SO2, HNO3 and HCl) between 2000 and 2015 from measurements
made at 12 sites in AGANet.
Revised/expanded text added, replacing text on p21, l5-22
“3.8.5 Changes in UK chemical climate”
“Past studies have shown that the increasing ratio of NH3 to SO2 in the atmosphere leads to enhanced dry
deposition of SO2, accelerating the decrease in atmospheric SO2 concentrations than would be achieved by
emissions reduction alone (Fowler et al., 2001, 2009; ROTAP 2012). The dry deposition of SO2 and NH3, by
uptake of the gases in a liquid film on leave surfaces, is known to be enhanced when both gases are present in a
process termed “co-deposition” (Fowler et al., 2001). Where ambient NH3 concentrations exceed that of SO2,
there is enough NH3 to neutralize acidity in the liquid film and oxidise deposited SO2, and maintain large rates
of deposition of SO2. With changes in the relative concentrations of acid gases in the UK and across Europe
however, the deposition rates will increasingly be controlled by the NH3/combined acidity (sum of SO2, HNO3
and HCl) molar ratio (Fowler et al., 2009).
To look at the UK situation, an analysis of the molar ratios of NH3 to acid gases is presented in Figure 18a. The
molar ratio of NH3 to acid gases (sum of SO2, HNO3 and HCl) increased with time, from 1.9 in 2000 to 4.7 in
2015, confirming that NH3 is increasingly in molar excess over atmospheric acidity. The ratio of annual mean
molar concentrations of NH3 (80 nmol m-3) to SO2 (29 nmol m-3) was 2.7 in 2000, which increased in 2015 to 15
(annual mean concentrations of NH3 = 58 nmol m-3 cf. SO2 = 4 nmol m-3). Molar concentrations of HNO3 (4
nmol m-3) and HCl (6 nmol m-3) were comparable to SO2 in 2015, highlighting the increasing importance of
HNO3 and HCl in contributing to atmospheric acidity. A larger decrease in SO2 (−81 %) than particulate
sulphate (−69%) in the AGANet data (Table 4) would appear at first to suggest that the large NH3:SO2 ratio is
contributing to a more rapid decrease in SO2 concentrations. However, when the seasalt fraction of SO42- is
removed from the sulphate trend, the decrease in NSS_SO4 (−78%) is similar to SO2 (−81%) which would
suggest that maximum deposition rates for SO2 may have been reached with the smaller SO2 concentrations
since 2000.”
13
23) p21, l30: ’...The increase in ratio of HNO3:NO3- is similar to changes in upward trend in gas-aerosol partitioning between NH3 and NH4+ over time...’: what do you call similar? For HNO3/NO3-, the ratio increases by _20%, while for NH3/NH4+, the ratio increases by 100% (according to Fig. 18) ?
Author Response: Apologies for the ambiguity in the sentence. I simply meant that both sets of data (HNO3:NO3
- and NH3:NH4+)
show an upward trend.
Text revised/expanded in section 3.8.5. Changes in UK chemical climate, paragraph 5.
“A change to an NH4NO3 rich atmosphere and the potential for NH4NO3 to release NH3 and HNO3 in warm
weather, together with the surfeit of NH3 also means that a larger fraction of the reduced and oxidised N is
remaining in the gas phase as NH3 and HNO3. An increased partitioning to the gas phase may account for the
larger decrease in particulate NH4+ (MK −62% between 2000-2015, n = 12) and NO3
- (MK −52% between
2000-2015, n = 12) than NH3 (MK −30% between 2000-2015, n = 12) and HNO3 (MK −45 % between 2000-
2015, n = 12) (Table 5) and the increase in gas to aerosol ratios (NH3:NH4+ and HNO3:NO3
-) over the 16 year
period (Figure 17). A higher concentration of the gas-phase HNO3 and NH3 may therefore be maintained in the
atmosphere than expected on the basis of the emissions trends in NOx and NH3. Given the larger deposition
velocities of NH3 and HNO3 compared to aerosols, more of the NH3 and HNO3 emitted will have the potential to
deposit more locally with a smaller footprint within the UK. “
24) p22, l11-12, ’...a change in the particulate phase from (NH4)2SO4 to NH4NO3. This change is expected to increase residence times of NH3 and HNO3 in the atmosphere...’I am not convinced the shift from ammonium sulphate to ammonium nitrate should increase the residence time, since NH3 and HNO3 will deposit faster (higher deposition velocities) than either aerosol form?
Author Response:
See revised/expanded text in “section 3.6. Seasonal variation in acid gases and aerosols”
Specifically:
“In contrast, the seasonal cycle for particulate NO3- is more distinct with a large peak in concentrations that
occur every spring, together with a second smaller peak in autumn (Figure 8Error! Reference source not
found.). NH3, the main neutralising gas in the atmosphere that reacts with HNO3 to form NH4NO3, has a
correspondingly large peak in concentration in spring, a second smaller peak in autumn, but with elevated
concentrations in summer and lowest in winter (Figure 9). Although particulate NO3- formation is dependent
upon the availability of NH3 for reaction with HNO3, its’ concentration is also governed by the equilibrium that
exists between gaseous HNO3, NH3 and particulate NH4NO3, the latter of which is appreciably volatile at
ambient temperatures (Stelson and Seinfeld, 1982). Partitioning between the gas and aerosol phase is therefore
also a key driver for their atmospheric residence times and concentrations. HNO3 and NH3 that are not removed
by deposition may react together in the atmosphere to form NH4NO3, when the concentration product
[NH3].[HNO3] exceeds equilibrium values, with NH4NO3 serving as a potential reservoir for the gases. Since
NH4NO3 is semi-volatile, any that is not dry or wet deposited can potentially dissociate to release NH3 and
HNO3, effectively increasing their residence times in the atmosphere. The formation and dissociation in turn
are strongly influenced by ambient temperature and humidity.”
25) p22, l12 ’...expected to increase residence times of NH3 and HNO3 in the atmosphere...’ and p22, l15 ’...NH3 and NOx emitted will deposit more locally with a smaller footprint...’: these two statements appear to contradict each other?
Author Response: See response to comment 23 above and response to comment 26 after this.

14
26) p22, l12: perhaps another way to analyse this trend is to calculate the (changing) linear regression slopes of NO3- vs NH4+ and SO4= vs NH4+, for each year of the 2000-2015 period (as in Fig. 6b), and examine how the two slopes change over time, as an indicator of the fraction of the total NH4+ that neutralizes NO3- and SOA= and its trend over time.
Author Response: New Figure 18: Long-term changes between 2000 and 2015 in (a) molar ratio of NH3 to acid gases (SO2, HNO3
and HCl) and (b) molar ratio of particulate NH4+ to acid aerosols (SO4
2- and NO3-) from measurements made at
12 sites in AGANet.
Text revised/expanded in section 3.8.5. Changes in UK chemical climate (paragraph 3)
Specifically:
To look at the UK situation, an analysis of the molar ratios of NH3 to acid gases is presented in Figure 18a. The
molar ratio of NH3 to acid gases (sum of SO2, HNO3 and HCl) increased with time, from 1.9 in 2000 to 4.7 in
2015, confirming that NH3 is increasingly in molar excess over atmospheric acidity. The ratio of annual mean
concentrations of NH3 (80 nmol m-3) to SO2 (29 nmol m-3) was 2.7 in 2000. By 2015, this ratio had increased to
15 (annual mean concentrations of NH3 = 58 nmol m-3 cf SO2 = 4 nmol m-3). Molar concentrations of HNO3 (4
nmol m-3) and HCl (6 nmol m-3) were comparable to SO2 in 2015, highlighting the increasing importance of
HNO3 and HCl in contributing to atmospheric acidity. A larger decrease in SO2 (−81 %) than particulate
sulphate (−69 %) in the AGANet data (Table 4) would appear at first to suggest that the large NH3:SO2 ratio is
contributing to a more rapid decrease in SO2 concentrations. However, when the seasalt fraction of SO42- is
removed from the sulphate trend (Sect.3.8.2), the decrease in NSS_SO4 (−78%) is similar to SO2 (−81%) (Table
4). Since the decreasing trend in the ratio of SO2 to SO42- also appeared to stabilise after 2006 (Sect.3.8.2), this
would suggest that maximum deposition rates for SO2 may have been reached with the smaller SO2
concentrations since 2006.
27) p24, l14 ’...Higher concentrations of the NH3 and HNO3 in the atmosphere will deposit more locally...’ But then, NH3 and HNO3 concentrations are actually decreasing; they are not higher than before?
Author Response: Text revised/expanded in section 3.8.5. Changes in UK chemical climate (paragraph 5)
“A change to an NH4NO3 rich atmosphere and the potential for NH4NO3 to release NH3 and HNO3 in warm
weather, together with the surfeit of NH3 also means that a larger fraction of the reduced and oxidised N is
remaining in the gas phase as NH3 and HNO3. The increased partitioning to the gas phase may account for the
larger decrease in particulate NH4+ (MK −62% between 2000-2015, n=12) and NO3
- (MK −52% between 2000-
2015, n=12) than their gaseous precursors (NH3: MK −30% between 2000-2015, n=12 and HNO3: MK −45 %
between 2000-2015, n=12) (Table 5) and the increase in ratios of NH3:NH4+ and HNO3:NO3
- over the 16 year
period (Figure 15). A higher concentration of the gas-phase nitrogen species (HNO3 and NH3) may
therefore be maintained in the atmosphere than expected on the basis of the emissions trends in NOx and
NH3. Given the larger deposition velocity of NH3 and HNO3 compared to particulate NH4+ and NO3
-, more of
the NH3 and HNO3 emitted will have the potential to deposit more locally with a smaller footprint within the
UK.”

15
28) Technical Corrections Units: different units are used. They should either be harmonized, or else each figure should state explicitly what the unit is, especially for the difference between element (N,S) based or molecule (HNO3, SO2) based. For example, mean HNO3 at the Bush site is reported as 0.55 μg m-3 in Fig.2 (average of 0.54 and 0.56 for samplers A and B), while the color code on the concentration map (Fig. 5) indicates a concentration in the range 0.15-0.25, from which I infer that Fig.2 is μg HN03 m-3, while Fig.5 is μg N m-3 ? Similarly, p12, l16, is the Cromwell site HNO3 concentration 1.3 μg HNO3 m-3, or 1.3 μg HNO3-N m-3? From Figure 5 I expect it is the latter (N, not HNO3 as written in the text). Further below, are the SO2 concentrations at Sutton Bonington given as μg SO2 m-3, or in fact μg SO2-S m-3 ? Given that the map in Fig. 5 gives numbers in μg N or μS per m3, it would be good to use the same units. Thus I would recommend to check carefully throughout the text in this paragraph and in the whole paper and make the necessary text changes to eliminate the ambiguity in units.
Author Response: Thank you – checked and corrected. 29) p4, l26-27, delete ’...that is also deployed at some CASTnet sites (Rumsey and Walker, 2016).’ (already mentioned same page, l14)
Author Response: OK – deleted.
30) p4, l32, suggest change ’temporal’ to ’seasonal’
Author Response: OK. Changed ’temporal’ to ’seasonal’ 31) p5, l9-12: this mostly repeats what was said in the introduction p4, l20-25
Author Response: OK – sentence below deleted.
“Since 2009, the AGANet, together with the NAMN (monthly NH3 and NH4+), Precip-net (2-weekly wet
deposition measurements) and NO2-net (4-weekly NO2 concentrations) were unified under the UKEAP network
to provide long-term measurements of eutrophying and acidifying atmospheric pollutants (Conolly et al.,
2016).”
32) p7, l20, please provide the equation for the calculation of the denuder capture efficiency
Author Response:
Calculation of denuder capture efficiency is described in “section 4 Calculation of air concentrations”
“The denuder capture efficiency for each of the gas is calculated by comparing the concentrations of the
individual gases in the denuder pairs”
Equation is now also provided:
Denuder capture efficiency (% CE) = 100 x Denuder 1
(Denuder 1+ Denuder 2) (2)

16
33) p35: Figure 2 contains scatter plots and a statistical summary table for the Bush DELTA
intercomparison (parallel sampling). It would be good to adapt the same or similar style of display for the
other intercomparisons (scatter plots + stats table). Thus for the comparison with ADS (2.7.2), take Fig. S2
out of the supplement and stack it above the statistics given in Table 2. Similarly for the intercomparisons
of DELTA vs EMEP TIA/TIN (add statistical table), as is already also done for DELTA vs Bubble/FP
Eskdalemuir (Fig 4).
Author Response: Thank you for suggestions:
Fig S2 and Table 2 combined into Figure 2
Figure 3 (DELTA vs EMEP TIA/TIN), summary stats table added.
There are now however quite a large number of figures.
34) p11, sections 2.8 and 3.6: throughout the time series trend analysis, both linear regressions and non-parametric MK tests are used, but as far as I can see, there is essentially no difference between the slopes for any of the pollutant time series. To improve readability and reduce unnecessary redundant information, I would suggest to stick to just one of the methods; it would suffice to say in the methods that both regressions were used and no significant differences were found, and thus henceforth only one regression is displayed.
Author Response: Thank you for the suggestion.
Figures 13 and 14: graphs with both linear regression and MK analyses moved to supplementary materials.
Replaced by a single Figure 14 showing results of MK analysis only for both time series.
Tables 5 and 6: summary tables comparing LR and MK moved to supplementary section.
Replaced by a single Table 4 showing results of MK analysis only for both time series.
Additional text included at end of <section 2.8 Time series trend analyses
“…but since there was no difference between either tests, MK results only are presented and discussed in the
paper. A comparison of trend analyses from both approaches is however provided in supplementary materials
(Figures S7, S8 and Tables S4 - S6). “
35) p12, l22, ’...A peak MONTHLY concentration of...’
Author Response:
Thank you – corrected
36) p12,l28, ’...expected to be more SPATIALLY homogeneous...’
Author Response:
Thank you – corrected
37) p15, l19 ’...in summer promotes AEROSOL dissociation...’
Author Response:
Thank you – corrected
38) p17, l12 change to ’...are available SINCE 1989...’
Author Response:
Thank you – corrected

17
39) p18, l31, ’...To QUANTIFY changes...’
Author Response:
Thank you – corrected
(paragraph moved to section 2.7 Time series trend analyses)
40) p18, l32, the unit for the annual trend is μg HNO3-N m-3 y-1
Author Response: The unit is for annual trend is µg HNO3 m-3 y-1
Units used in trend analysis are on a molecule basis
41) p19, l3: ’...The LR % annual trends for each time series...’ Delete ’annual’, since the % reduction are not expressed per year, but over the whole period ? Note that if the concentration reduction were a constant percentage every year, say -10% per year, then the overall time course over 15 years would not look linear, but exponential: if yr1=100, then yr2=90, yr3=81, yr4=72.9, yr5=65.6, ...yr15=20.6
Author Response: Thank you - text corrected:
“The LR and MK % change in annual mean concentrations for the two time series are estimated from the slope
and intercept….”
42) p19, l6: same as above, delte ’annual’
Author Response:
Thank you - equation corrected:
% change = 100 .[𝑌𝑖−𝑌𝑜)
𝑌𝑜
43) p21, l17-18 ’...The dry deposition... IS known to be enhanced...’
Author Response: Thank you - corrected 44) p23, l9, delete ’from coal combustion’
Author Response: Thank you - deleted 45) p24, l1, ’... modest reductionS in HNO3...’ (plural)
Author Response: Thank you - corrected 46) p24, l12, ’...smaller THAN emission trends...’
Author Response: Thank you – corrected
18
47) All figures: when the units displayed on axes or legends are given in μg m-3, please specify whether this is on an element basis (NH3-N, HNO3-N, SO2-S) or molecule basis (NH3, HNO3, SO2)
Author Response: Figure 10a, Y-axis changed to Oxidised N (µg N m-3) Figure 10b, Y-axis changed to Reduced N (µg N m-3) Figure 11, Y-axes changed to SO2 (µg S m-3) and SO4
2- (µg S m-3) To show more clearly that the units are on an element basis (NH3-N, HNO3-N, SO2-S, etc.) All other figures are on a molecule basis (NH3, HNO3, SO2, etc)– axis and legends should be correct. 48) Figure 8: "...Average annual cycles in the ratios of gas:aerosol component concentrations (μg m-3)...’ The unit for the ratio is not μg m-3, it must be dimensionless, or mol mol-1?
Author Response:
The Y axis label on the graphs are dimensionless.
In the figure caption, (µg m-3) is the unit of gas and aerosol concentrations that are compared. As this
is causing confusion, the caption in Figure 8 (now Figure 9, because Suppl. Figure S2 added as Figure
2) has been revised to:
“Figure 9: Average annual cycles in the ratios of gas:aerosol component concentrations. HNO3, SO2,
HCl and aerosol NO3-, SO4
2-, Cl- data (annual mean, µg m-3) are from the UK Acid Gases and Aerosol
Monitoring Network (AGANet). NH3 and NH4+ data (annual mean, µg m-3) are from the UK National
Ammonia Monitoring Network (NAMN, Tang et al., 2018) measured at the same time. Each data point
in the graphs represents the mean ± SD of monthly measurements of 12 sites operational in the network
over the period 2000 to 2015.
49) Figures 13-14: keep only one of the two trend lines (LR or MK); and delete Fig.14 but add the n=30 datapoints to Fig. 13 as a different symbol shape or color
Author Response: Figures 13 – 14 replaced with a single figure as suggested by reviewer above.
50) Figure 18: the left-hand side panels show the same data as Figs. 13-14 and should therefore not be repeated here.
Author Response:
The left hand panels provides a direct comparison of the concentrations and trends of each of the gas
and aerosol pairs (HNO3/ NO3-, SO2/SO4
2- etc.).
The author agrees with the reviewer that the left hand panels shows the same data as Figures 13 and
14 and they have been removed.
1
Interactive comment on Atmos. Chem. Phys. Discuss., doi.org/10.5194/acp-2018-489, 2018
RESPONSE TO REVIEWER 2
Anonymous (Referee)
The authors thank reviewer 2 for his constructive comments and for taking the time to look at all the details
described in the manuscript. We have carefully considered all comments. Please refer to the specific responses.
General comments
1. Currently the manuscript is primarily focused on documenting trends and events and with a smaller focus on
the changes in atmospheric composition and pollutant fate due to changes in emissions. This manuscript would
benefit from a bit more focus. I suggest focusing more on the trends and how they relate to emission changes
and less on specific events captured in the data.
Author Response:
Section 3.8 Assessment of trends in relation to UK emissions” has been revised and expanded to include
a more thorough discussion of trends under new sub-headings. 3.8.1 Trends in HNO3 and NO3
- vs NOx emissions
3.8.2 Trends in SO2 and SO42- vs SO2 emissions
3.8.3 Trends in HCl and Cl- vs HCl emissions
3.8.4 Trends in NH3 and NH4- vs NH3 emissions
3.8.5 Changes in UK chemical climate
Discussion on specific events captured in the data have not been revised/truncated as they are important for
interpreting anomalies in the trends.
2. The discussion of the trends of NH3 and HNO3 are sometimes a bit difficult to follow as the change in
aerosol composition and loading over the time frame of the measurements impacts the gas phase
concentrations. Consider discussing these trends as total nitrate (gaseous HNO3 + aerosol NO3) and NHx
(gaseous NH3 + aerosol NH4).
Author Response:
Interactions and partitioning between the gas phase (SO2, HNO3, NH3) and aerosol phase (SO42-, NO3
-, NH4+) are
important drivers for concentrations and trends in the respective components. Discussion of the gas phase and
particulate phase atmospheric components for oxidised and reduced nitrogen, rather than total inorganic nitrate
(TIN, sum of gaseous HNO3 + aerosol NO3-) and total inorganic NHx (TIA, sum of gaseous NH3 + aerosol NH4
+)
allows a clearer understanding of the processes occurring in the atmosphere, which drive trends and environmental
effects. TIN and TIA is only considered in the manuscript for comparing DELTA with EMEP filter pack
measurements at Eskdalemuir.
The expanded “Section 3.8 Assessment of trends in relation to UK emissions” (see response to your comment 1
above) should hopefully provide a clearer discussion on the change in gas and aerosol composition and their
interactions in a changing chemical climate.
3. There are lots of small sections in this manuscript, some consisting of single sentences. Consider combining
them into more general sections. Specifically, 2.3.1-2 and 2.5-6.
Author Response:
Following your suggestion:
“2.3.1 Base coated denuders and filters” and “2.3.1 Acid coated denuders and filters” combined into a single
section “2.3.1 Chemically coated denuders and filters”
“2.5 Data Quality Control” and “2.6 Bias correction applied to HNO3 data” have not been combined as they
cover different aspects.

2
4. Many sentences leading paragraphs are structured as “For {atmospheric constituent},. . .”. This is a bit
formulaic and the authors may want to revise these sentences.
Author Response:
Thank you. We have gone through and revised where appropriate.
Specific comments
1. Abstract: I find the final two sentences of the abstract to be the most compelling. There is a lot of detail,
primarily on page 1, that would be better suited for the results section. Consider summarizing the text on the
spatial and temporal trends and better connecting them to the changes in atmospheric HNO3 and NH3.
Author Response:
Text revised in abstract.
2. Abstract Page 2 lines 5-6: “. . . indications that the atmospheric lifetime of HNO3 and NH3 has increased . .
.”. This does not seem correct to me. The lifetime of these gases has not increased but rather the
phase/composition of these species have. There are now more gaseous and less aerosol bound NO3 and NH3
due to changes in SO2. This likely decreases the atmospheric lifetime of total nitrate and reduced nitrogen
compounds as NH3 and HNO3 typically dry deposit faster than aerosol NO3 and NH4.
Author Response:
See also response to Reviewer 1 (comment 32).
Text revised in abstract:
“Since 1999, AGANet has shown substantial decrease in SO2 concentrations relative to HNO3 and NH3,
accompanied by large reductions also in the aerosol components, with evidence of a shift in the particulate phase
from (NH4)2SO4 to NH4NO3. The potential for NH4NO3 to act as a reservoir for NH3 and HNO3, together with the
surfeit of NH3 means that a larger fraction of the nitrogen is remaining in the gas phase, maintaining higher
concentrations of NH3 and HNO3 in the UK. …”
3. Page 4 lines 17-29: This paragraph contains similar information as the previous paragraph. Consider
combining it with the previous paragraph
Author Response:
See below (replicated information deleted):
Page 4 lines 17-29: “testing, but the high costs and resources required for these measurements make them
unsuitable for the assessment of long-term trends at many sites, particularly where spatial patterns are required.
To achieve this, a larger number of sites operated at lower time-resolution is needed. In the UK, the Eutrophying
and Acidifying Atmospheric Pollutants (UKEAP) network provides long-term measurements for the UK rural
atmospheric concentrations and deposition of air pollutants that contribute to acidification and eutrophication
processes (Conolly et al., 2016). UKEAP comprises of two EMEP supersites and four component networks:
precipitation network (Precip-net), NO2 diffusion tube network (NO2-net), National Ammonia Monitoring
Network (NAMN) and the Acid Gases and Aerosol Network (AGANet). At the two EMEP supersites
(Auchencorth and Harwell – relocated to Chilbolton in 2016), semi-continuous hourly speciated measurements
of reactive gases and aerosols are made with the MARGA system (Twigg et al., 2016) that is also deployed at
some CASTnet sites (Rumsey and Walker, 2016). These measurements are contributing to the validation and
improvement of atmospheric models, such as FRAME (Dore et al., 2015) and EMEP4UK (Vieno et al., 2014,
2016) that are used to develop and provide the evidence base for air quality policies, both nationally and
internationally. “
Page 5, lines 9 – 12 deleted (repeat of what has already been written on Page 4 lines 17-29)
“Since 2009, the AGANet, together with the NAMN (monthly NH3 and NH4+), Precip-net (2-weekly wet
deposition measurements) and NO2-net (4-weekly NO2 concentrations) were unified under the UKEAP network
to provide long-term measurements of eutrophying and acidifying atmospheric pollutants (Conolly et al.,
2016).”

3
4. Page 6 lines 21-22: This is an awkward introductory sentence for this paragraph. Consider revising or adding
an introductory paragraph that introduces the importance of the denuder base coating.
Author Response:
Revised text
Page 6 lines 21-22: “For the base coating, K2CO3 is used instead of Na2CO3 (Ferm et al., 1986) to sample acid
gases so that the system can also measure aerosol Na+ concentrations. Glycerol increases adhesion, stabilizes the
base coating (Ferm, 1986; Finn et al., 2001)……”
Revised to:
“Sodium carbonate (Na2CO3) is an effective sorbent for acid gases, allowing simultaneous collection of HNO3,
SO2 and HCl on denuders (e.g. Ferm 1986). Since the measurement of aerosol Na+ is also of key interest in
AGANet however, a potassium carbonate (K2CO3) coating is used instead to eliminate the possibilities of Na+
contamination from Na2CO3. Glycerol is added to the K2CO3 coating, as it increases adhesion…….,”
5. Sections 2.5: Are data that failed the quality checks removed from the analysis?
Author Response:
Sections 2.5 Data Quality Control
“i) Air flow rate (0.2 – 0.4 L min-1): where this is below the expected range for a sampling period, the data is
flagged as valid but failing the QC standard.
ii) Denuder capture efficiency: where this is less than 75% for a sample, the data is flagged as valid but less
certain.
iii) Ion balance checks: close agreement expected between NH4+ and the sum of NO3
- and 2SO42-, as NH3 is
neutralised by HNO3 and H2SO4 to form NH4NO3 and (NH4)2SO4, respectively (Conolly et al., 2016), and for
Na+ and Cl-, as these are marine (sea salt) in origin.”
Data failing the above quality check are not automatically removed from analysis.
Air flow rates:
The air pumps used are relatively stable, at 0.2 – 0.4 l min-1. If a low air flow rate is due to temporary loss of
power and/or air pump issue, the data is accepted provided that the flow rate does not drop below 25% of the
normal range. The data is flagged as valid (EMEP data flag), but has higher uncertainty. If low air flow rate is due
to a leak or obstruction (e.g. kinking of tubing), the data is rejected.
Denuder capture efficiency:
Two denuders in series are used for every sample to check capture efficiency for reactive gas: two carbonate
denuders for capture of HNO3, SO2 and HCl and two acid coated denuders for capture of NH3. Samples with <
75% of the total gas captured in the first of the two denuders are accepted but are flagged as valid (EMEP data
flag) but has higher uncertainty.
Ion balance checks:
Ratio of NH4+ (µeq): (2*SO4
2- + NO3-) (µeq)
Expect 1:1 as NH3 neutralised by HNO3 and SO2 (H2SO4) to form NH4NO3 and (NH4)2SO4
Acceptable range = 0.2 to 3.
Ion balance checks are carried out at site level and in collated file (with regression plots for outliers)
Data are rejected if the ratio is outside the range.
Ratio of Na (µeq):Cl (µeq).
Expect 1:1 as Na and Cl aerosols derived mainly from sea salt.
Acceptable range 0.2 to 3.
Ion balance checks are carried out at site level and in collated file (with regression plots for outliers)
Data are rejected if the ratio is outside the range.

4
6. Section 2.5 iv) What is the criteria to determine anomalies and outlies?
Author Response:
Sections 2.5 Data Quality Control
“i) Screening the whole dataset for sampling anomalies and outliers, e.g. due to contamination or other issues.”
This is a screening process carried out for a small number of runs where there was clearly a sampling
malfunction. This exclusion includes events such as vandalized or damaged samples, water ingress or
equipment/analytical problems (e.g. mix-up between carbonate and acid coated filters).
7. Section 2.6 Line 22: Does the empirical factor used for HNO3 bias correction exhibit any dependence on
season, temperature or solar radiation? If the bias is due to oxidants, then I would expect a dependence in the
bias on seasonal and environmental parameters.
Author Response:
See response to reviewer 1 (comment 1, pages 1 – 2).
8. Page 9 lines 28-29: The mean difference between the measurements are given here but what is the scatter
between the measurements and the median difference. A correlation coefficient would provide some
information about the scatter and a median difference would indicate how normal the distribution is and if the
bias is being driven by high values in one of the measurement techniques.
Author Response:
Page 9 lines 28-29: “Agreement between the DELTA and ADS was within 19 % for SO2 (mean DELTA = 1.75
µg m-3 cf mean ADS = 2.18 µg m-3) and 4 % for HCl (mean DELTA = 0.40 µg m-3 cf mean ADS = 0.41 µg m-
3).”
Linear regression (R2) is provided in table 2.
Regression plots (DELTA v ADS) were provided in Supplementary materials (Figure S2) – since there were
already a lot of figures and tables in the paper.
Supplement Figure S2 and Table 2 has been combined into a single Figure 2 – see response to review 1
(comment 32, page 16).
9. Page 9 line 32: Difference in the instrumentation flow rates and/or inlets could result in the instruments
measuring different sized aerosols and my influence the differences in SO4.
Author Response:
Page 10 line 3: “A particle size cut-off of around 4.5 µm was estimated for the DELTA air inlet) (Tang et al.,
2015)”.
Page 10 lines 6 to 7: “In comparison, the ADS has a 2.5 µm cyclone in front of the aerosol filters to collect
aerosols < 2.5 µm on the aerosol filters”
ADS size cut-off (cyclone) = 2.5 um @ flow rate of 10 LPM. Note that the cyclone is in front of the aerosol
filters, and not at the inlet, as in the case for the URG ADS
(http://www.urgcorp.com/index.php/systems/manual-sampling-systems/annular-denuder-system)
5
10. Page 16 lines 1-2: The peaks in NHx and SO4 in the spring may just be coincidental. The spring time could
also be a time in which the aqueous formation pathway of SO4 is at its maximum or the SO2 emissions from
heating or transportation may be larger. In the US, the SO4 concentrations typically peak in the summer while
the NH3 concentrations peak in the spring.
Author Response:
In the UK, SO2 concentrations are highest in winter (January and February) and lowest in summer (June –
August). The peak in SO42- concentrations however occur in March every year, where peaks in concentrations of
NH3 and NH4+ from measurements made at the same time from the same sites are also observed (please note
that the seasonal cycle of ammonia vary, depending on the emission source types in the vicinity of the
measurement site, see Tang et al. 2018).
Formation of SO42- is largely governed by the availability of SO2 and NH3 to form the stable (NH4)2SO4, and the
spring peak may be attributed to enhanced formation of (NH4)2SO4, since peaks in concentrations of NH3 and
NH4+ also occur in spring. Import of particulate (NH4)2SO4 from long-range transboundary transport also
enhances the springtime concentration. In summer, sunny, warmer conditions increases photochemical oxidation
of SO2 to H2SO4 and subsequent formation of sulphate aerosols leading to higher aerosol SO42- concentrations in
summer than in winter.
Revised/expanded text in “section 3.6 Seasonal variation in acid gases and aerosols (paragraph 5)
“SO2, by contrast, are highest in the winter, with concentrations exceeding summer values on average by a factor
of 2 (Figure 8). Increased emissions of SO2 from combustion processes (heating) during the winter months,
coupled to stable atmospheric conditions resulting in build-up of concentrations at ground level contributes to
the winter maximum. Since the reaction of SO2 with NH3 to form (NH4)2SO4 is effectively irreversible (Bower
et al., 1997), the ratio of the concentrations of SO2 and SO42- (Figure 9) is largely governed by the availability of
SO2 and NH3 to form (NH4)2SO4. The temporal profile of SO42-- has a peak in concentrations in spring, although
not as pronounced as the NO3- peak (Figure 8). The spring peak may be attributed to enhanced formation of
(NH4)2SO4, since peaks in concentrations of NH3 and NH4+ also occur in spring (Figure 8) and from the import
of particulates from long-range transboundary transport. Unlike SO2, aerosol SO42- concentrations are higher in
summer than in winter, due to increased photochemical oxidation of SO2 to H2SO4 and subsequent formation of
sulphate aerosols in sunnier and warmer conditions (Mihalopoulos et al., 2007). In winter, lower SO2 oxidation
rates limits H2SO4 formation and therefore also the formation of (NH4)2SO4.”
11. Page 16 Line 5: “Na+ and Cl-“ have highest concentrations during winter . . .’ Is salt used for the treatment
of road surfaces in the Winter in the UK?
Author Response:
Yes, indeed rocksalt (NaCl) is used to treat road surfaces in the winter in the UK. About 2 million tonnes are used
every year, with most of it going on motorways, trunk roads and main roads.
Aerial salt spray has been shown to increase the concentrations of particulate NaCl in the immediate vicinity of
treated road surfaces. For example, a study by Palmer et al. (2004) found that the concentrations of particulate
NaCl at the road edge (2m) was 25 - 70% higher than at 10 m away from the road edge, with concentrations at 10
m approaching background NaCl concentrations (ca. 35 nmoles m-3 from UK AGANet).
Aerial salt spray from treatment of road surfaces in winter is however unlikely to contribute to an increase at
regional / national level in the UK. Sources of seasalt aerosol (NaCl) in UK has been shown by high time-
resolution measurements (MARGA) in the UK to originate from air masses coming into the UK with the
predominant south-westerly winds (seasalt aerosol generated off the atlantic) (pers. comm.).
AGANet sites are all located away from roads, and should not be affected by local seasalt from gritting.
Reference:
Palmer S.C.F, Cape J.N, Truscott A-M, Black H.I.J, Tang Y.S, Swaine, Van Dijk N, Smart S.M, Sutton M.A,
Fowler D, Biodiversity in roadside verges: CEH Final Report to SEERAD. 108 pages. 2004.

6
12. Page 20 line 18: Significant has a specific statistical meaning. I think “larger” would be a more appropriate.
Author Response:
Thank you. “significant” replaced with “substantial”
13. Page 21 line 5: “. . . SO2 towards it being dominated by NH3, . . .” This appears to be a bit binary. There are
lots of constituents in the air, many of which were note measured here. More context is needed.
Author Response:
OK, thanks.
Sentence has been deleted.
Changes in NH3 relative to other acid gases are discussed in section 3.8.5 Changes in UK chemical climate.
14. Page 22 line 12: “expected to increase residence times of NH3 and HNO3 in the atmosphere” If we are in an
NH3 limited environment, I can see how this would increase HN4NO3 and how that could increase the
atmospheric lifetime of HNO3 as it is partitioned to NO3 aerosols. However, I do not see how this increases the
NH3 lifetime. NH3 will preferentially partition with SO4, which is more thermodynamically stable than
NH4NO3, this should decrease the lifetime of NH3 if anything as the NH4NO3 will
evaporate where the (NH4)2SO4 aerosol would not.
Author Response:
See revised/expanded text in “3.8.5 Changes in UK chemical climate (paragraph 5 and 6)”
“At the same time, reduction in emissions of the precursor gases have also led to a lower formation of
particulate phase NH4+, NO3
- and SO42- in the atmosphere and changes in atmospheric composition. Since the
affinity of H2SO4 (oxidation product of SO2) for NH3 is much larger than that of HNO3 and HCl, available NH3
is first taken up by H2SO4 to form ammonium sulphate compounds (NH4HSO4 and (NH4)2SO4), with any excess
NH3 then available to react with HNO3 and HCl to form NH4NO3 and NH4Cl that are volatile. Analysis of the
different particulate components in sect. 3.5Error! Reference source not found. showed that the ammonium
aerosols are mainly made up of (NH4)2SO4 and NH4NO3. With the large reduction in SO2, more NH3 is
available to react with HNO3 to form NH4NO3 and concentrations of NH4+ and NO3
- are now observed to be in
molar excess over SO42-, providing evidence of a change in the particulate phase from (NH4)2SO4 to NH4NO3
(Figure 18b).
A change to an NH4NO3 rich atmosphere and the potential for NH4NO3 to release NH3 and HNO3 in warm
weather, together with the surfeit of NH3 also means that a larger fraction of the reduced and oxidised N is
remaining in the gas phase as NH3 and HNO3. An increased partitioning to the gas phase may account for the
larger decrease in particulate NH4+ (MK −62% between 2000-2015, n = 12) and NO3
- (MK −52% between
2000-2015, n = 12) than NH3 (MK −30% between 2000-2015, n = 12) and HNO3 (MK −45 % between 2000-
2015, n = 12) (Table 5) and the increase in gas to aerosol ratios (NH3:NH4+ and HNO3:NO3
-) over the 16 year
period (Figure 17). A higher concentration of the gas-phase HNO3 and NH3 may therefore be maintained in the
atmosphere than expected on the basis of the emissions trends in NOx and NH3. Given the larger deposition
velocities of NH3 and HNO3 compared to aerosols, more of the NH3 and HNO3 emitted will have the potential to
deposit more locally with a smaller footprint within the UK. “
15. Figure 8: I am happy to see a measure of scatter on these plots as the SD. However, a 5% and 95% CI would
be more informative as it would give the reader an idea about the distribution of the data.
Author Response:
The 4 graphs in Figure 8 have been replotted showing the 95% CI (T test).
1
Acid gases and aerosol measurements in the UK (1999-2015): regional
distributions and trends
Y. Sim Tang1, Christine F. Braban1, Ulrike Dragosits1, Ivan Simmons1, David Leaver1, Netty van Dijk1,
Janet Poskitt2, Sarah Thacker2, Manisha Patel2, Heather Carter2, M. Glória Pereira2, Patrick O. Keenan2,
Alan Lawlor2, Christopher Conolly3, Keith Vincent3, Mathew R. Heal4 & Mark A. Sutton1 5
1CEH, Bush Estate, Penicuik, Midlothian EH26 0QB 2CEH, Lancaster Environment Centre, Bailrigg, Lancaster LA1 4AP 3Ricardo Energy & Environment, Gemini Building, Fermi Avenue, Harwell, Oxon, OX11 0QR 4School of Chemistry, University of Edinburgh, David Brewster Road, Edinburgh EH9 3FJ 10
Correspondence to: Y. Sim Tang ([email protected])
Abstract. The UK Acid Gases and Aerosol Monitoring Network (AGANet) was established in 1999 (12 sites, increased to 30
sites from 2006), to provide long-term national monitoring of acid gases (HNO3, SO2, HCl) and aerosol components (NO3-,
SO42-, Cl-, Na+, Ca2+, Mg2+). An extension of a low-cost denuder-filter pack system (DELTA) that is used to measure NH3 and
NH4+ in the UK National Ammonia Monitoring Network (NAMN) provides additional monthly speciated measurements for 15
the AGANet. A comparison of the monthly DELTA measurement with averaged daily results from an annular denuder system
showed close agreement, while the sum of HNO3 and NO3- and the sum of NH3 and NH4
+ from the DELTA are also consistent
with previous filter pack determination of total inorganic nitrogen and total inorganic ammonium, respectively. With the
exception of SO2 and SO42-, the AGANet provides for the first time the UK concentration fields and seasonal cycles for each
of the other measured species. The ranges in site-annual mean concentrations (nmol m-3) in 2015 for the gases were: HNO3: 20
0.7-17; HCl: 2.4-21; SO2: 0.9-10, while those for aerosol were: NO3-: 6.3-53; Cl-: 22-89; SO4
2-: 2.2-11; Na+: 20-74; Ca2+: <lod-
2.6; Mg2+: 1.3-6.8. The largest concentrations of HNO3, SO2, and aerosol NO3- and SO4
2- are found in south and east England
and smallest in western Scotland and Northern Ireland, whereas. For HCl are, highest concentrations are in the southeast, and
southwest and central England, that may be attributed to dual contribution from anthropogenic (coal combustion) and marine
sources (reaction of sea salt with acid gases to form HCl). The spatial distributions of Na+ and Cl- are spatially correlatedwere 25
similar, with largest concentrations at coastal sites in the south and west and at Shetland, reflecting a contribution from sea salt
(NaCl) since a near 1:1 relationship was also observed in their concentrations. Temporally, peak concentrations in HNO3 and
NO3- occurred in late winter and early spring and early summer, dueattributed to photochemical processes and transboundary
pollutant transport. The spring peak in NO3- and SO4
2- have a spring maxima thatconcentrations coincides with the peak in
concentrations of NH3 and NH4+, and are therefore likely attributable to formation of NH4NO3 and (NH4)2SO4 from reaction 30
with higher concentrations of NH3 in spring. By contrast, peak concentrations of SO2, Na+ and Cl- during winter are consistent
with combustion sources for SO2 and marine sources in winter for sea salt aerosol. Key pollutant events were captured by the
AGANet. In 2003, a spring episode with elevated concentrations of HNO3 and NO3- was driven by meteorology and
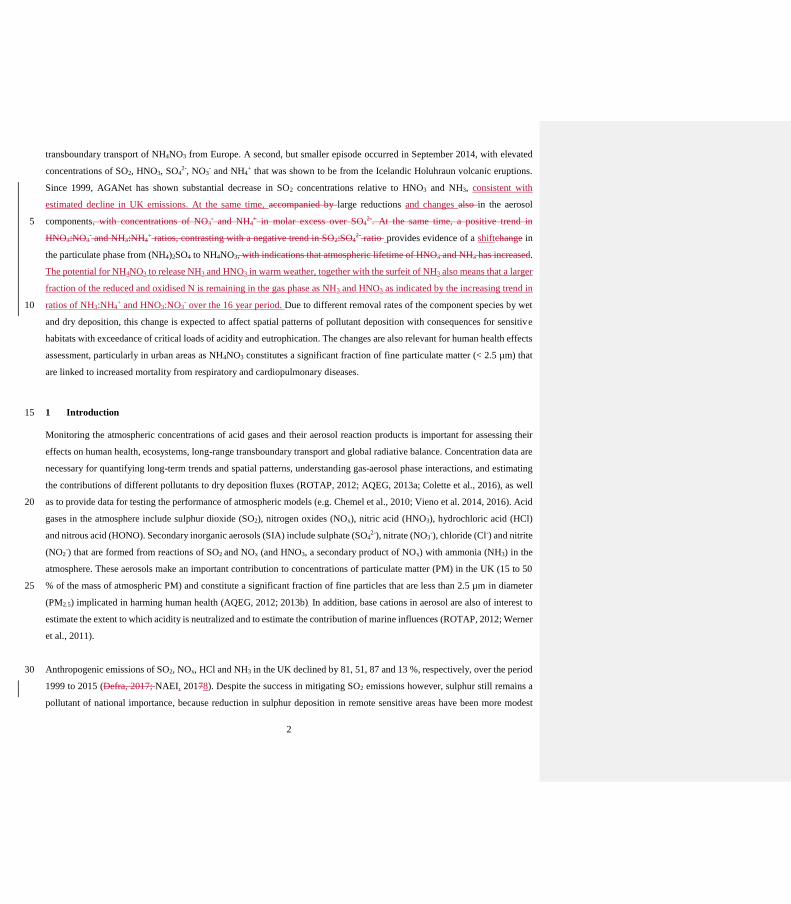
2
transboundary transport of NH4NO3 from Europe. A second, but smaller episode occurred in September 2014, with elevated
concentrations of SO2, HNO3, SO42-, NO3
- and NH4+ that was shown to be from the Icelandic Holuhraun volcanic eruptions.
Since 1999, AGANet has shown substantial decrease in SO2 concentrations relative to HNO3 and NH3, consistent with
estimated decline in UK emissions. At the same time, accompanied by large reductions and changes also in the aerosol
components, with concentrations of NO3- and NH4
+ in molar excess over SO42-. At the same time, a positive trend in 5
HNO3:NO3- and NH3:NH4
+ ratios, contrasting with a negative trend in SO2:SO42- ratio provides evidence of a shiftchange in
the particulate phase from (NH4)2SO4 to NH4NO3, with indications that atmospheric lifetime of HNO3 and NH3 has increased.
The potential for NH4NO3 to release NH3 and HNO3 in warm weather, together with the surfeit of NH3 also means that a larger
fraction of the reduced and oxidised N is remaining in the gas phase as NH3 and HNO3 as indicated by the increasing trend in
ratios of NH3:NH4+ and HNO3:NO3
- over the 16 year period. Due to different removal rates of the component species by wet 10
and dry deposition, this change is expected to affect spatial patterns of pollutant deposition with consequences for sensitive
habitats with exceedance of critical loads of acidity and eutrophication. The changes are also relevant for human health effects
assessment, particularly in urban areas as NH4NO3 constitutes a significant fraction of fine particulate matter (< 2.5 µm) that
are linked to increased mortality from respiratory and cardiopulmonary diseases.
1 Introduction 15
Monitoring the atmospheric concentrations of acid gases and their aerosol reaction products is important for assessing their
effects on human health, ecosystems, long-range transboundary transport and global radiative balance. Concentration data are
necessary for quantifying long-term trends and spatial patterns, understanding gas-aerosol phase interactions, and estimating
the contributions of different pollutants to dry deposition fluxes (ROTAP, 2012; AQEG, 2013a; Colette et al., 2016), as well
as to provide data for testing the performance of atmospheric models (e.g. Chemel et al., 2010; Vieno et al. 2014, 2016). Acid 20
gases in the atmosphere include sulphur dioxide (SO2), nitrogen oxides (NOx), nitric acid (HNO3), hydrochloric acid (HCl)
and nitrous acid (HONO). Secondary inorganic aerosols (SIA) include sulphate (SO42-), nitrate (NO3
-), chloride (Cl-) and nitrite
(NO2-) that are formed from reactions of SO2 and NOx (and HNO3, a secondary product of NOx) with ammonia (NH3) in the
atmosphere. These aerosols make an important contribution to concentrations of particulate matter (PM) in the UK (15 to 50
% of the mass of atmospheric PM) and constitute a significant fraction of fine particles that are less than 2.5 µm in diameter 25
(PM2.5) implicated in harming human health (AQEG, 2012; 2013b). In addition, base cations in aerosol are also of interest to
estimate the extent to which acidity is neutralized and to estimate the contribution of marine influences (ROTAP, 2012; Werner
et al., 2011).
Anthropogenic emissions of SO2, NOx, HCl and NH3 in the UK declined by 81, 51, 87 and 13 %, respectively, over the period 30
1999 to 2015 (Defra, 2017; NAEI, 20178). Despite the success in mitigating SO2 emissions however, sulphur still remains a
pollutant of national importance, because reduction in sulphur deposition in remote sensitive areas have been more modest

3
than close to major sources (ROTAP, 2012). HCl was also recently identified as another important acidifying pollutant for
sensitive habitats (Evans et al., 2014). Emissions of HCl (from coal burning in power stations) have however declined to very
low levels (from 74 kt in 1999 to 9 kt in 2015), although it could still pose a threat to habitats close to sources. For NOx, the
more modest decrease in emissions reflects difficulties in their abatement, while for NH3, the decrease to date is largely a result
of changes in animal numbers (Defra 2017NAEI, 2018). 5
With the decline in SO2 emissions and deposition, the large number of reactive nitrogen compounds in the atmosphere are
assuming greater importance owing to the complexities of the global N cycle and associated challenges in their abatement.
These include the gas phase components NH3, with over 80% estimated from agricultural emissions (EEA, 2017) and nitrogen
oxides (NO, NO2) from combustion, the secondary gas phase reaction products HNO3, HONO and PAN (peroxyacetyl nitrate) 10
and particulate phase components ((NH4)2SO4, NH4HSO4, and NH4NO3) formed by the reaction between NH3 and acid gases.
(AQEG, 2012). Ammonia and the N-containing aerosols are known to cause nitrogen enrichment and eutrophication, as well
as contributing to acidification processes (Sutton et al., 2011). Oxidised nitrogen species (NOx) are precursors to ground-level
O3 formation, while the production of acids (HNO3, HONO) and PAN in the atmosphere affects air quality and is damaging
both to human health and to vegetation (Cowling et al., 1998, Bobbink et al., 2010). 15
In Europe, air pollution policies regarding acidification and nitrogen eutrophication apply the “critical loads approach” (Bull,
1995; Gregor et al., 2001), which requires that atmospheric deposition inputs be mapped at an appropriate scale for the
assessment of effects. In parallel, the “critical levels” of concentrations addresses the direct impacts of concentrations of
nitrogen components in the atmosphere (Bull, 1991; Gregor et al., 2001; Cape et al., 2009). Quantifying the dry deposition of 20
reactive nitrogen compounds is a major challenge and a key source of uncertainty for effects assessment (Dentener et al., 2006;
Flechard et al., 2011; Schrader et al., 2018; Sutton et al., 2007). While deposition may be estimated using atmospheric transport
and chemistry models (e.g. Dore et al., 2015; Flechard et al., 2011; Smith et al., 2000), air concentration data at sufficient
spatial resolution are needed, both to assess the atmospheric models and provide input data for estimating deposition using
inferential models. 25
In light of policies to reduce atmospheric emissions, e.g. the amended 2012 Gothenburg Protocol (UNECE, 2018) and the
revised National Emissions Ceilings Directive (NECD, EU Directive 2016/2284) (EU, 2016), it is important to assess long-
term trends in the measured pollutants, since this provides the only independent means to assess the effectiveness of any
abatement policies. Both these international agreements set emissions reduction commitments for SO2, NOx and NH3, of 59, 30
42, and 6 %, respectively, by 2020 (with 2005 as base year) and includes PM2.5 for the very first time. Under the 2016 NECD,
further reduction commitments of 79 % (SO2), 63 % (NOx) and 19 % (NH3) are also set for the EU 28 countries from 2030.
Since emissions of these gases comes from different sources, emissions controls require very different strategies, making it
important to monitor and assess the the relative concentrations and deposition of nitrogen and sulphur components.

4
The spatial and temporal patterns of gases and particulate phases of these pollutants differ substantially. Although it is widely
acknowledged that speciation between reactive gas and aerosol measurement is critical, there are few national long-term
monitoring programmes dedicated to measuring separately their concentrations and dry depositions at high spatial resolution
(Torseth et al., 2012). Across Europe, the European Monitoring and Evaluation Programme (EMEP, 2014) continues to 5
recommend using a daily filter pack sampling method to measure oxidised nitrogen (total inorganic nitrate, TIN) and reduced
nitrogen (total inorganic ammonia, TIA) (Torseth et al., 2012; Colette et al., 2016). The filter pack method is generally
considered as robust for measuring SO2 and SO42- concentrations (EMEP, 2014; Hayman et al., 2006; Sickles et al., 1999).
However, many papers have shown that there are potential artefacts in filter-pack sampling for HNO3 and HCl, due to
interactions with NH3 and the volatility of NH4NO3 and NH4Cl aerosol (Pio, 1992; Sickles et al., 1999; Cheng et al., 2012). 10
Results from EMEP filter pack measurements are therefore reported as TIN and TIA, due to phase uncertainties in the method
(Torseth et al., 2012). This has been complemented by daily measurements of HNO3 and NO3- using annular denuders
(Allegrini et al., 1987; EMEP, 2014) that are made at a restricted number of sites because of the resources required. In North
America, filter pack sampling is also used in weekly measurements of sulphur and nitrogen species in the CASTnet (Clean Air
Status Trends Network) national monitoring network of 95 sites across USA, Canada and Alaska 15
(https://www.epa.gov/castnet). At a small number of CASTnet sites, hourly measurements of water-soluble gases and aerosols
are made with the Monitor for AeRosols and GAses in ambient air (MARGA) system (Rumsey and Walker, 2016). In the UK,
the MARGA approach is deployed for continuous hourly measurements at just two sites (Twigg et al., 2016).
High time-resolution measurements of gases and aerosols are useful at selected locations for detailed analysis and model 20
testing, but the high costs and resources required for these measurements make them unsuitable for the assessment of long-
term trends at many sites, particularly where spatial patterns are required. To achieve this, a larger number of sites operated at
lower time-resolution is needed. In the UK, the Eutrophying and Acidifying Atmospheric Pollutants (UKEAP) network
provides long-term measurements for the UK rural atmospheric concentrations and deposition of air pollutants that contribute
to acidification and eutrophication processes (Conolly et al., 2016). UKEAP comprises of two EMEP supersites and four 25
component networks: precipitation network (Precip-net), NO2 diffusion tube network (NO2-net), National Ammonia
Monitoring Network (NAMN) and the Acid Gases and Aerosol Network (AGANet). At the two EMEP supersites
(Auchencorth and Harwell – relocated to Chilbolton in 2016), semi-continuous hourly speciated measurements of reactive
gases and aerosols are made with the MARGA system (Twigg et al., 2016) that is also deployed at some CASTnet sites
(Rumsey and Walker, 2016). These measurements are contributing to the validation and improvement of atmospheric models, 30
such as FRAME (Dore et al., 2015) and EMEP4UK (Vieno et al., 2014, 2016) that are used to develop and provide the evidence
base for air quality policies, both nationally and internationally.

5
The long-term dataset of monthly speciated measurements from the AGANet (1999 – 2015) are analysed in this paper to
provide a comprehensive assessment of the spatial, temporal and long-term trends in atmospheric concentrations of the acid
gases HNO3, SO2, HCl and related aerosol components NO3-, SO4
2- and Cl- (and also base cations Na+, Ca2+ and Mg2+) across
the UK, together with an assessment of the DELTA denuder-filter pack sampling method (Sutton et al., 2001b; Tang et al.,
2009) as compared with other sampling techniques. To aid interpretation of the relative changes and trends in the acid gases 5
and aerosols, NH3 and particulate NH4+ data from the NAMN (Tang et al., 2018) are included, since atmospheric NH3 is a
major interacting precursor gas in neutralisation reactions with the acid gases.
2 Methods
2.1 Acid Gases and Aerosol monitoring Network (AGANet)
The UK Acid Gases and Aerosol Network (AGANet), known previously as the nitric acid monitoring network, was started in 10
September 1999 under the Acid Deposition Monitoring Network (ADMN, Hayman et al., 2007) to deliver for the very first
time, long-term monthly speciated measurement data on gaseous HNO3 and particulate NO3- across the UK. Other acid gases
(SO2, HCl) and aerosols (SO42-, Cl-, plus base cations Na+, Ca2+, Mg2+) are also measured and reported. Since 2009, the
AGANet, together with the NAMN (monthly NH3 and NH4+), Precip-net (2-weekly wet deposition measurements) and NO2-
net (4-weekly NO2 concentrations) were unified under the UKEAP network to provide long-term measurements of eutrophying 15
and acidifying atmospheric pollutants (Conolly et al., 2016).
AGANet and NAMN are closely integrated, with AGANet established at a subset of NAMN sites to provide additional
speciated measurements of the acid gases and aerosol components. To improve on national coverage, the number of sites in
AGANet was increased in 2006 from 12 to 30 (Figure 1Figure 1, Table 1Table 1). At the same time, the Rural Sulphur Dioxide 20
Monitoring Program ceased, replaced by SO2 and SO42-
measurements made under the expanded AGANet (Hayman et al.,
2007). A broad spatial coverage of the UK is provided by the AGANet sites, with a focus on sites providing parallel information
on other air pollutants (e.g., co-location with the Automatic Urban and Rural Network that provides compliance monitoring
against the Ambient Air Quality Directives (https://uk-air.defra.gov.uk/networks/) and ecosystem assessments (e.g.
Environmental Change Network, http://www.ecn.ac.uk/) (Monteith et al., 2016). 25
<INSERT Figure 1 HERE>
<INSERT Table 1 1HERE>
2.2 Extended DELTA methodology for sampling acid gases and aerosol in AGANet
A low-cost manual denuder-filter pack method, DELTA (DEnuder for Long-Term Air sampling) implemented in the NAMN 30
for measurement of NH3 gas and aerosol NH4+ (Sutton et al., 2001a,b; Tang et al., 2018) is extended to provide additional

6
simultaneous monthly time-integrated average concentrations of acid gases (HNO3, SO2, HCl) and particulate phase NO3-,
SO42-, Cl-, Na+, Ca2+ and Mg2+ for the AGANet (Conolly et al., 2016; Tang et al., 2015).
The DELTA method used in AGANet has also been applied in an extensive European-scale network of 58 sites to deliver 4
years of atmospheric concentrations and deposition data for reactive trace gas and aerosols from 2006 to 2009 (Tang et al., 5
2009; Flechard et al., 2011). Detailed descriptions of the DELTA method are provided by Sutton et al. (2001b) and by Tang
et al. (2009, 2015). In brief, a small air pump is used to provide low sampling rates of 0.2–0.4 L min-1, and air volumes are
measured by a high-sensitivity diaphragm gas meter. By sampling air slowly, the method is optimised for monthly
measurements, with sufficient sensitivity to resolve low concentrations at clean background sites (e.g. LOD = 0.05 g m-3 for
HNO3 for monthly sampling; see Supplement Tables S1, S2). In addition, the power requirement is very small, and low voltage 10
versions (using 6 V and 12 V micro-air pumps) of the system powered by wind-solar energy operate at some remote sites.
An extended denuder-filter pack sampling train is used to provide speciated sampling of reactive gases and aerosols
(Supplement Figure S1) (Tang et al., 2009, 2015). A Teflon inlet (2.8 cm long) at the front end ensures development of a
laminar air stream (Table S3), followed by a first pair of K2CO3 and glycerol coated denuders to collect HNO3, SO2 and HCl 15
, a second pair of citric acid coated denuders to collect NH3 and a 2-stage filter pack at the end to collect aerosol components.
Stage 1 of the filter pack is a cellulose filter impregnated with K2CO3 and glycerol to collect NO3-, SO4
2-, Cl-, Na+, Ca2+, Mg2+,
with evolved aerosol NH4+ from this filter collected on the stage 2 citric acid impregnated filter. The separation of gases and
aerosol is achieved by higher diffusivities of reactive gases to the denuder walls where they react with the chemical coating
and are retained, whereas aerosol components pass through and are retained by post-denuder filters (Ferm, 1979). In this 20
approach, potential artefacts caused by phase interactions associated with filter packs and bubblers are avoided (e.g. Sickles et
al., 1999). A particle size cut-off of around 4.5 µm was estimated for the DELTA air inlet (Tang et al., 2015). The DELTA
will therefore also sample fine mode aerosols in the PM2.5 fraction, as well as some of the coarse mode aerosols < PM4.5.
For the base coating, K2CO3 is used instead of Na2CO3 (Ferm et al., 1986) to sample acid gases so that the system can also 25
measure aerosol Na+ concentrations. Na2CO3 is reported to be an effective sorbent for acid gases, allowing simultaneous
collection of HNO3, SO2 and HCl on denuders (e.g. Ferm 1986), but since the measurement of aerosol Na+ is also of key
interest in AGANet, a K2CO3 coating is used instead to eliminate possible Na+ contamination from Na2CO3. Glycerol is added
to increases adhesion, stabilizes the base coating (Ferm, 1986; Finn et al., 2001), and is reported to minimise potential oxidation
of nitrite that is also collected on the denuder to nitrate in the presence of atmospheric oxidants such as ozone (Allegrini et al., 30
1987; Perrino et al., 1990). The lengths of denuders (borosilicate glass tubes 10 cm and 15 cm long to capture > 95 % of NH3
and acid gases, respectively) in the sampling train was calculated according to the procedures described by Sutton et al.
(2001b), based on the calculations derived by Gormley and Kennedy (1948) and Ferm (1979) (see Supp. Table S3). All sites
were set up as “outdoor” systems sampling directly from the atmosphere, avoiding potential adsorption losses (in particular
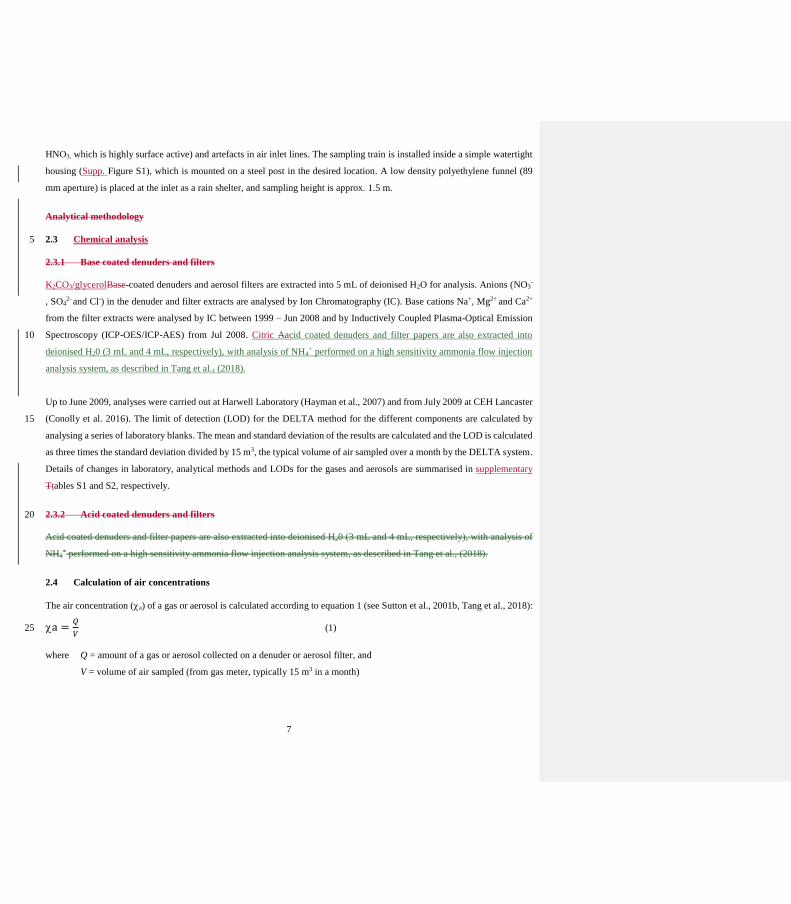
7
HNO3, which is highly surface active) and artefacts in air inlet lines. The sampling train is installed inside a simple watertight
housing (Supp. Figure S1), which is mounted on a steel post in the desired location. A low density polyethylene funnel (89
mm aperture) is placed at the inlet as a rain shelter, and sampling height is approx. 1.5 m.
Analytical methodology
2.3 Chemical analysis 5
2.3.1 Base coated denuders and filters
K2CO3/glycerolBase-coated denuders and aerosol filters are extracted into 5 mL of deionised H2O for analysis. Anions (NO3-
, SO42- and Cl-) in the denuder and filter extracts are analysed by Ion Chromatography (IC). Base cations Na+, Mg2+ and Ca2+
from the filter extracts were analysed by IC between 1999 – Jun 2008 and by Inductively Coupled Plasma-Optical Emission
Spectroscopy (ICP-OES/ICP-AES) from Jul 2008. Citric Aacid coated denuders and filter papers are also extracted into 10
deionised H20 (3 mL and 4 mL, respectively), with analysis of NH4+ performed on a high sensitivity ammonia flow injection
analysis system, as described in Tang et al., (2018).
Up to June 2009, analyses were carried out at Harwell Laboratory (Hayman et al., 2007) and from July 2009 at CEH Lancaster
(Conolly et al. 2016). The limit of detection (LOD) for the DELTA method for the different components are calculated by 15
analysing a series of laboratory blanks. The mean and standard deviation of the results are calculated and the LOD is calculated
as three times the standard deviation divided by 15 m3, the typical volume of air sampled over a month by the DELTA system.
Details of changes in laboratory, analytical methods and LODs for the gases and aerosols are summarised in supplementary
Ttables S1 and S2, respectively.
2.3.2 Acid coated denuders and filters 20
Acid coated denuders and filter papers are also extracted into deionised H20 (3 mL and 4 mL, respectively), with analysis of
NH4+ performed on a high sensitivity ammonia flow injection analysis system, as described in Tang et al., (2018).
2.4 Calculation of air concentrations
The air concentration (a) of a gas or aerosol is calculated according to equation 1 (see Sutton et al., 2001b, Tang et al., 2018):
a =𝑄
𝑉 (1) 25
where Q = amount of a gas or aerosol collected on a denuder or aerosol filter, and
V = volume of air sampled (from gas meter, typically 15 m3 in a month)
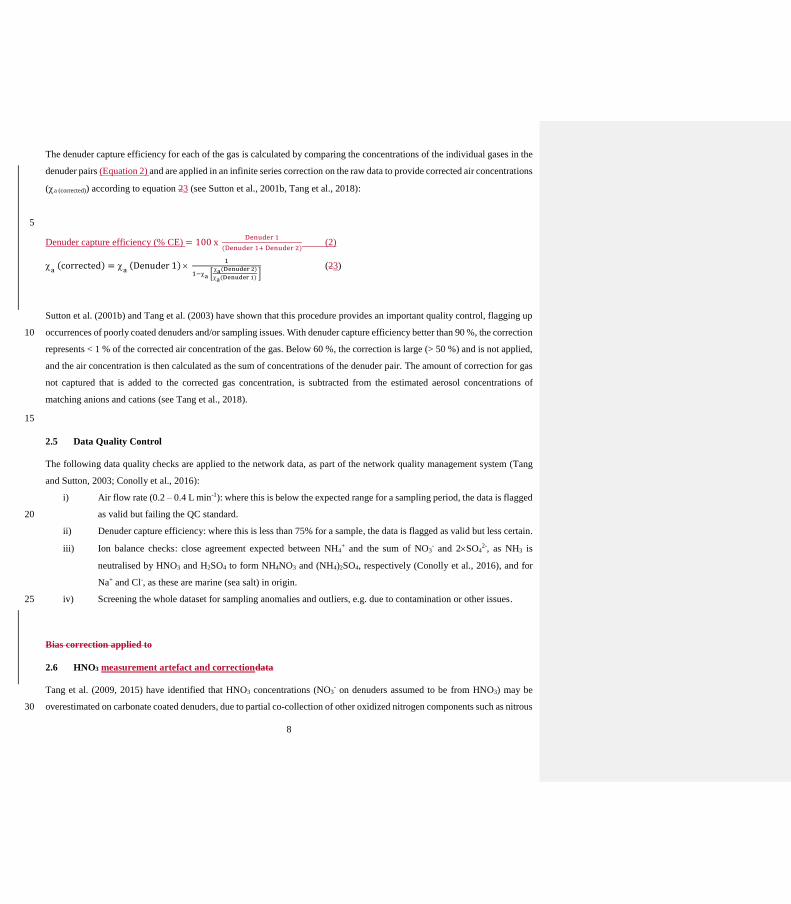
8
The denuder capture efficiency for each of the gas is calculated by comparing the concentrations of the individual gases in the
denuder pairs (Equation 2) and are applied in an infinite series correction on the raw data to provide corrected air concentrations
(a (corrected)) according to equation 23 (see Sutton et al., 2001b, Tang et al., 2018):
5
Denuder capture efficiency (% CE) = 100 x Denuder 1
(Denuder 1+ Denuder 2) (2)
a (corrected) =
a (Denuder 1)
1
1−a [ a(Denuder 2)
a(Denuder 1) ] (23)
Sutton et al. (2001b) and Tang et al. (2003) have shown that this procedure provides an important quality control, flagging up
occurrences of poorly coated denuders and/or sampling issues. With denuder capture efficiency better than 90 %, the correction 10
represents < 1 % of the corrected air concentration of the gas. Below 60 %, the correction is large (> 50 %) and is not applied,
and the air concentration is then calculated as the sum of concentrations of the denuder pair. The amount of correction for gas
not captured that is added to the corrected gas concentration, is subtracted from the estimated aerosol concentrations of
matching anions and cations (see Tang et al., 2018).
15
2.5 Data Quality Control
The following data quality checks are applied to the network data, as part of the network quality management system (Tang
and Sutton, 2003; Conolly et al., 2016):
i) Air flow rate (0.2 – 0.4 L min-1): where this is below the expected range for a sampling period, the data is flagged
as valid but failing the QC standard. 20
ii) Denuder capture efficiency: where this is less than 75% for a sample, the data is flagged as valid but less certain.
iii) Ion balance checks: close agreement expected between NH4+ and the sum of NO3
- and 2SO42-, as NH3 is
neutralised by HNO3 and H2SO4 to form NH4NO3 and (NH4)2SO4, respectively (Conolly et al., 2016), and for
Na+ and Cl-, as these are marine (sea salt) in origin.
iv) Screening the whole dataset for sampling anomalies and outliers, e.g. due to contamination or other issues. 25
Bias correction applied to
2.6 HNO3 measurement artefact and correctiondata
Tang et al. (2009, 2015) have identified that HNO3 concentrations (NO3- on denuders assumed to be from HNO3) may be
overestimated on carbonate coated denuders, due to partial co-collection of other oxidized nitrogen components such as nitrous 30

9
acid (HONO). In the case of HONO, this collects on the denuder carbonate coating as nitrite (NO2-), but oxidizes to nitrate
(NO3-) in the presence of oxidants such as ozone (Bytnerowicz et al., 2005) which can result in a positive interferencebias in
HNO3 determination (Tang et al., 2009, 2015). Other oxidised nitrogen species present in the atmosphere such as peroxyacetyl
nitrate (PAN) and nitrogen oxides (NOx) can also potentially contribute to a further small interference (Allegrini et al., 1987;
Bai et al., 2003). Based on the tests of Tang et al. (2015), raw HNO3 data are corrected with an empirical factor of 0.45 which 5
is estimated to be uncertain by ±30 %. Apart from where stated, all HNO3 data reported in this study have the 0.45 correction
factor applied.
2.71.1 Performance of the DELTA method
2.7.11.1.1 Measurement reproducibility 10
Replicated DELTA measurements are made at the Bush OTC site in Scotland (UKA00128). A comparison of the parallel
measurements (Figure 2) showed good reproducibility in the method, with close agreement for all components (e.g. mean
difference of < 3 % for all components and 6 % for HCl).
<INSERT Figure 2 HERE> 15
2.7.21.1.1 Comparison with daily annular denuder measurements
An assessment of the DELTA method for NH3 has previously been reported by Sutton et al. (2001b). Following the extension
to additionally sample acid gases and aerosols, the modified system was compared with independent daily measurements from
an annular denuder system (ADS). The ADS (ChemspecTM model 2500 air sampling system, R&P Co. Inc.) was operated at
Barcombe Mills in southern England (UKA00069) alongside the AGANet DELTA monthly measurements for a period of 18 20
months. Due to significant instrument and local site issues resulting in low data capture with the ADS, only 11 months of data
were available for intercomparison. The sampling train used in the ADS consisted of 2 K2CO3 + glycerol-coated annular
denuders (same coating as AGANet DELTA), 2 citric acid-coated annular denuders; a cyclone with 2.5 µm cut-off, followed
by a 2-stage filter pack containing a 2 µm PALL Zefluor teflon membrane (collection NO3-, SO4
2-, Cl-, Na+, Mg2+, Ca2+) and
a 1 µm PALL Nylasorb nylon membrane (collection of evolved NO3-), with a sampling rate of 10 L min-1. For comparison 25
against the monthly DELTA measurements, daily ADS values were averaged to the corresponding monthly periods, with
results summarised in Table 2 and Figure S2.
<INSERT Table 2 HERE>
30
For HNO3, the DELTA (mean = 1.56 µg m-3, n = 11) was on average 23 % higher than the ADS (mean = 1.31 µg m-3, n = 11).
Since both methods used the same carbonate coating on the denuders to sample acid gases, the HNO3 data here have not been
Field Code Changed
Field Code Changed
Field Code Changed

10
corrected with the bias adjustment factor described in Sect. 2.6. Nitrous acid (HONO) was found to be close to or below limit
of detections for most of the DELTA measurements (mean = of 0.03 µg m-3), compared with a significantly higher
concentration (mean = 0.41 µg m-3) from the ADS. Since the sampling period of the ADS is daily, any HONO collected as
nitrite on the ADS is likely to remain as nitrite and not oxidised to nitrate. The very low HONO (nitrite on the denuders
assumed to be from HONO) concentrations from the DELTA supports the hypothesis of the retention of HONO that is 5
subsequently oxidised to nitrate, resulting in an artefact in HNO3 determination (Possanzini et al., 1983; Allegrini et al., 1987;
Tang et al., 2015). Further corroboration is provided by the improved agreement between both methods (line of fit closer to
the 1:1 line) when comparing the sum of HNO3 and HONO (see graph in supp. Figure S2). Agreement between the DELTA
and ADS was within 19 % for SO2 (mean DELTA = 1.75 µg m-3 cf mean ADS = 2.18 µg m-3) and 4 % for HCl (mean DELTA
= 0.40 µg m-3 cf mean ADS = 0.41 µg m-3). Given the limited data available, it is not clear why SO2 measured on the ADS is 10
higher than the DELTA, since there was good agreement for HCl.
For the particle-phase components, NO3- measured by the DELTA method (mean = 2.59 µg NO3
- m-3) was on average 2-fold
higher than the ADS method (mean = 1.32 µg NO3- m-3), whereas SO4
2- by the DELTA method was on average 23 % lower
(DELTA = 2.10 vs ADS = 2.74 µg SO42- m-3) (Table 2). NO3
- and SO42- are both present as fine mode (< 1 µm) NH4NO3 and 15
(NH4)2SO4 (Putaud et al., 2010). Some NO3- can also be present in the coarse mode (> 2.5 µm), likely as calcium nitrate
(Ca(NO3)2) from a reaction between gas-phase HNO3 (or its precursors) and soil dust particles (Putaud et al., 2010). For SO42-
, some will be coarse mode sea salt SO42- (see section 3.3). A particle size cut-off of 4–5 µm was estimated for the DELTA air
inlet) (Tang et al., 2015), which would suggest that the DELTA will also sample a small amount of coarse mode aerosols. An
ion balance check of the ratio of µeq NH4+ to sum µeq (NO3
- + SO42-) yielded a near unity value, which confirms that NO3
- and 20
SO42- collected by the DELTA aerosol filter are mainly fine mode NH4NO3 and (NH4)2SO4. In comparison, the ADS has a 2.5
µm cyclone in front of the aerosol filters to collect aerosols < 2.5 µm on the aerosol filters. NH4+ was unfortunately not analysed
in these tests, which would have allowed a similar ion balance check. Na+ and Cl- concentrations on the DELTA were also on
average 331% and 444 % higher than on the ADS and the ion balance check of the ratio of Na+:Cl- was unity for both methods.
In the absence of analytical errors, loss of NO3-, Na+ and Cl- on the surface of the cyclone, coupled to a small fraction of the 25
aerosols > 2.5 µm that is collected (but not analysed) in the cyclone, could partly account for the observed lower concentrations
of the aerosol components. Since Ca2+ and Mg2+ concentrations by both methods were at or below detection limits, comparisons
of these are not meaningful and have not been made.
2.7.31.1.1 Comparisons with filter pack measurements: HNO3/NO3- and NH3/NH4
+ 30
The EMEP network (www.emep.int) measures atmospheric concentrations and depositions of a wide range of pollutants at
rural background sites across Europe (Aas, 2014; Tørseth et al., 2012). For assessment of oxidised and reduced nitrogen
species, the daily EMEP filter pack method are implemented at 39 sites across Europe (Colette et al., 2016; Tørseth et al.,
Field Code Changed
Field Code Changed
Field Code Changed

11
2012), with results reported as Total Inorganic Nitrate (TIN: HNO3 + NO3-) and Total Inorganic Ammonia (TIA: NH3 + NH4
+)
(Torseth et al., 2012), as these are considered more reliable than reporting for the gas and aerosol components separately.
<INSERT Figure 3 HERE>
5
At the UK Eskdalemuir site (EMEP station code GB0002R; UKAIR ID UKA00130), a Scottish rural background site on the
border between Scotland and England, daily filter pack measurements of TIN and TIA were made as part of the EMEP network
from 1989 to 2000 (EMEP, 2017a). Following installation of the DELTA system in September 1999, both methods were
operated in parallel for 14 months at Eskdalemuir, allowing a comparison to be made of TIN and TIA from both systems.
Comparison results are shown in Figure 3 of parallel data from the AGANet (sum of HNO3 and NO3-) and NAMN (sum of 10
NH3 and NH4+), demonstrating close agreement between the two independent measurements. The EMEP values shown are
daily measurements of TIN and TIA averaged to corresponding monthly means for comparison with the DELTA data. For
TIN, the regression between EMEP TIN and AGANet (sum of uncorrected HNO3 + NO3-) is close to unity (slope = 0.984, R2
= 0.94), which provided independent verification and support of the DELTA HNO3 measurements at the start of the network.
After applying a bias adjustment factor of 0.45 to the HNO3 data (see Sect. 2.6), the AGANet values (sum of corrected HNO3 15
+ NO3-) are smaller than the EMEP TIN (slope = 0.835, R2 = 0.95). It is possible that the filter pack method may also be subject
to similar artefacts in HNO3 determination due to co-collection of other oxidised nitrogen species (Tang et al., 2015).
2.7.41.1.1 Comparisons with bubbler and filter pack measurements: SO2 and SO42-
Independent measurements of SO2 and SO42- with a daily bubbler and filter pack method, respectively, are also available for
comparison with the DELTA method at the Eskdalemuir site. Daily SO2 data with a bubbler method (Hayman, 2005) from 20
Dec-77 to Dec-01 and daily SO42- data with an EMEP filter pack method from Dec-77 to Apr-09 (Hayman, 2006) were
downloaded from the EMEP website (EMEP, 2017b). A close agreement is found between the bubbler and DELTA method
for SO2 (slope = 0.86, R2 = 0.82), while there is more scatter between the filter pack and DELTA method for SO42- (slope =
0.67, R2 = 0.66) (Figure 4). Concentrations of SO2 for the 26 month overlap period were comparable (mean of bubbler method
= 0.40 µg S m-3 cf mean of DELTA method = 0.44 µg S m-3), whereas the filter pack SO42- concentration (mean = 0.44 µg S 25
m-3, n = 87) is larger than the corresponding monthly DELTA measurement (mean = 0.28 µg S m-3, n = 87) (Figure 4). An
earlier detailed assessment of the DELTA system against filter pack with a focus on SO2 and SO42- in 1999 by Hayman et al.
(2006) had shown close agreement between the methods. It is therefore unclear why the DELTA gives a reading lower than
the filter pack SO42- at Eskdalemuir in this assessment, since the dataset was a continuation of the original inter-comparison.
Possible explanations include uncertainties associated with limit of detection of the daily filter pack method at the very low 30
concentrations encountered at this site, or the sampling of coarser particles by this method (due to high flow rate and open-
Field Code Changed
Field Code Changed
Field Code Changed
Field Code Changed
Field Code Changed
12
face sampling) with higher concentrations of sea salt sulphate. The DELTA methodology was unchanged for the duration of
the AGANet dataset (1999 - 2015) in this manuscript, which allows a consistent assessment of overall trends in the SO42- data.
<INSERT Figure 4 HERE>
5
2.82.7 Time series trend analyses
Statistical trend analyses using both parametric linear regression (LR) and non-parametric Mann-Kendall (MK) (Gilbert, 1987;
Chatfield, 2016) tests were performed on annually averaged data from AGANet, and on a subset of annually averaged data
from NAMN made at the same AGANet sites. The datasets are considered sufficiently long-term (>10 years) and produced by
a consistent method for effective statistical trend analyses. Both the LR and MK approaches are widely adopted for trend 10
analyses in long-term atmospheric data (e.g. Meals et al., 2011; Colette, 2016; Jones and Harrison, 2011; Marchetto et al.,
2013; Hayman et al., 2007; Conolly et al., 2016), and were used in a recent trend assessment of atmospheric NH3 and NH4+
data (1998 – 2014) from the NAMN (Tang et al., 2018). As described in Tang et al. (2018), LR tests were performed using R,
and MK tests used the R ‘Kendall’ package (McLeod, 2015), with estimation of the MK Sen’s slope (fitted median slope of a
linear regression joining all pairs of observations) and confidence interval of the fitted trend using the R ‘Trend’ package 15
(Pohlert, 2016). Results from both tests provides an indication of uncertainty associated with the choice of approach. .Since
there was no difference between either tests, MK results only are presented and discussed in the paper. A comparison of trend
analyses from both approaches is however provided in supplementary materials (Supp. Figures S6 and S7 and Tables S4 - S6).
3 Results and Discussion 20
3.1 Performance of the DELTA method
Measurement reproducibility
This section presents the performance of the DELTA measurements, including a comparison with other air sampling methods
and networks. Replicated sampling with the DELTA methodasurements wereare also made to assess measurement 25
reproducibility and this is shown for example for at the Bush OTC site in Scotland (UKA00128). A comparison of the parallel
measurements (Figure 2Figure 2) showed good reproducibility in the method, with close agreement for all components (e.g.
mean difference of < 3 % for all components and 6 % for HCl).

13
<INSERT Figure 2 Figure 2 HERE>
3.1.1 Comparison with daily annular denuder measurements
An assessment of the DELTA method for NH3 has previously been reported by Sutton et al. (2001b). Following the extension
to additionally sample acid gases and aerosols, the modified system was compared with independent daily measurements from
an annular denuder system (ADS). The ADS (ChemspecTM model 2500 air sampling system, R&P Co. Inc.) was operated at 5
Barcombe Mills in southern England (UKA00069) alongside the AGANet DELTA monthly measurements for a period of 18
months. Due to significant instrument and local site issues resulting in low data capture with the ADS, only 11 months of data
were available for intercomparison. The sampling train used in the ADS consisted of 2 K2CO3 /+ glycerol-coated annular
denuders (same coating as AGANet DELTA), 2 citric acid-coated annular denuders; a cyclone with 2.5 µm cut-off, followed
by a 2-stage filter pack containing a 2 µm PALL Zefluor teflon membrane (collection NO3-, SO4
2-, Cl-, Na+, Mg2+, Ca2+) and 10
a 1 µm PALL Nylasorb nylon membrane (collection of evolved NO3-), with a sampling rate of 10 L min-1. ToFor comparisone
against the monthly DELTA measurements, daily ADS values were averaged to the corresponding monthly periods, with
results summarised in Table 2 and Figure S2 Figure 3.
<INSERT Table 2 Figure 3 HERE> 15
In the measurement of gases, For HNO3, determination on the DELTA (mean = 1.56 HNO3 µg m-3, n = 11) was on average 23
% higher than the ADS (mean = 1.31 HNO3 µg m-3, n = 11). Since both methods used the same carbonate coating on the
denuders to sample acid gases, the HNO3 data here have not been corrected with the empirical bias adjustment factor described
in Ssect.ion 2.62.6. Nitrous acid (HONO) was found to be close to or below limit of detections for most of the DELTA 20
measurements (mean = of 0.03 µg HONO m-3), compared with a significantly higher concentration (mean = 0.41 HONO µg
m-3) from the ADS. Since the sampling period of the ADS is daily, any HONO collected as nitrite on the ADS is likely to
remain as nitrite and not oxidised to nitrate. The very low HONO (nitrite on the denuders assumed to be from HONO)
concentrations from the DELTA supports the hypothesis of the retention of HONO that is subsequently oxidised to nitrate,
resulting in an artefact in HNO3 determination (Possanzini et al., 1983; Allegrini et al., 1987; Tang et al., 2015). Further 25
corroboration is provided by the improved agreement between both methods (line of fit closer to the 1:1 line) when comparing
the sum of HNO3 and HONO (see graph in supp. Figure S2Figure 3). Agreement between the DELTA and ADS was within
19 % for SO2 (mean DELTA = 1.75 µg m-3 cf mean ADS = 2.18 µg m-3) and 4 % for HCl (mean DELTA = 0.40 µg m-3 cf
mean ADS = 0.41 µg m-3). Given the limited data available, it is not clear why SO2 measured on the ADS is higher than the
DELTA, since there was good agreement for HCl. 30
For the particle-phase components, NO3- measured by the DELTA method (mean = 2.59 µg NO3
- m-3) was on average 2-fold
higher than the ADS method (mean = 1.32 µg NO3- m-3), whereas SO4
2- by the DELTA method was on average 23 % lower
Field Code Changed
Field Code Changed
Formatted: Font: Bold
Field Code Changed
Field Code Changed
Formatted: Font: Bold
14
(DELTA = 2.10 vs ADS = 2.74 µg SO42- m-3) (Table 2Figure 3). NO3
- and SO42- are both present as fine mode (< 1 µm)
NH4NO3 and (NH4)2SO4 (Putaud et al., 2010). Some NO3- can also be present in the coarse mode (> 2.5 µm), likely as calcium
nitrate (Ca(NO3)2) from a reaction between gas-phase HNO3 (or its precursors) and soil dust particles (Putaud et al., 2010),
while . For some of the SO42- , some will be coarse mode sea salt SO4
2- (see section 3.3 3.5). A particle size cut-off of 4–.5 µm
was estimated for the DELTA air inlet) (Tang et al., 2015), sowhich would suggest that the DELTA will also sample a small 5
amount of coarse mode aerosols. An ion balance check of the ratio of µeq NH4+ to sum µeq (NO3
- + SO42-) yielded a near unity
value, which confirmsing that NO3- and SO4
2- collected by the DELTA aerosol filter are mainly fine mode NH4NO3 and
(NH4)2SO4. In comparison, the ADS has a 2.5 µm cyclone in front of the aerosol filters to collect aerosols < 2.5 µm on the
aerosol filters. NH4+ was unfortunately not analysed in these tests, which would have allowed a similar ion balance check. Na+
and Cl- concentrations on the DELTA were also on average 331% and 444 % higher than on the ADS and the ion balance 10
check of the ratio of Na+:Cl- was unity for both methods. In the absence of analytical errors, loss of NO3-, Na+ and Cl- on the
surface of the cyclone, coupled to a small fraction of the aerosols > 2.5 µm that is collected (but not analysed) in the cyclone,
could partly account for the observed lower concentrations of the aerosol components. Since Ca2+ and Mg2+ concentrations by
both methods were at or below detection limits, comparisons of these are not meaningful and have not been made.
15
3.1.2 Comparisons with filter pack measurements: HNO3/NO3- and NH3/NH4
+
The EMEP network (www.emep.int) measures atmospheric concentrations and depositions of a wide range of pollutants at
rural background sites across Europe (Aas, 2014; Tørseth et al., 2012). A For daily filter pack method continues to be
implemented at 39 sites across Europe for assessment of oxidised and reduced nitrogen species, the daily EMEP filter pack
method are implemented at 39 sites across Europe (Colette et al., 2016; Tørseth et al., 2012), with results reported as Total 20
Inorganic Nitrate (TIN: HNO3 + NO3-) and Total Inorganic Ammonia (TIA: NH3 + NH4
+) (Colette et al., 2016; Torseth et al.,
2012), as these are considered more reliable than reporting for the gas and aerosol components separately.
<INSERT Figure 4Figure 3 HERE>
25
At the UK Eskdalemuir site (EMEP station code GB0002R; UKAIR ID UKA00130), a Scottish rural background site on the
border between Scotland and England, daily filter pack measurements of TIN and TIA were made as part of the EMEP network
from 1989 to 2000 (EMEP, 2017a). Following installation of the DELTA system in September 1999, both methods were
operated in parallel for 14 months at Eskdalemuir, allowing a comparison to be made of TIN and TIA from both systems.
Comparison results are shown in Figure 4Figure 3 of parallel data from the AGANet (sum of HNO3 and NO3-) and NAMN 30
(sum of NH3 and NH4+), demonstrating close agreement between the two independent measurements. The EMEP values shown
are daily measurements of TIN and TIA averaged to corresponding monthly means for comparison with the DELTA data. For
TIN, the regression between EMEP TIN and AGANet (sum of uncorrected HNO3 + NO3-) is close to unity (slope = 0.984, R2
Formatted: Font: Italic
Field Code Changed
Formatted: Font: Bold
15
= 0.94), which provided independent verification and support of the DELTA HNO3 measurements at the start of the network.
After applying a bias adjustment factor of 0.45 to the HNO3 data (see Sect. 2.62.6), the AGANet values (sum of corrected
HNO3 + NO3-) are smaller than the EMEP TIN (slope = 0.835, R2 = 0.95). It is possible however, that the filter pack method
may also be subject to similar artefacts in HNO3 determination due to co-collection of other oxidised nitrogen species (Tang
et al., 2015). 5
3.1.3 Comparisons with bubbler and filter pack measurements: SO2 and SO42-
Independent measurements of SO2 and SO42- with a daily bubbler and filter pack method, respectively, are also available for
comparison with the DELTA method at the Eskdalemuir site. Daily SO2 data with a bubbler method (Hayman, 2005) from
Dec-77 to Dec-01 and daily SO42- data with an EMEP filter pack method from Dec-77 to Apr-09 (Hayman, 2006) were 10
downloaded from the EMEP website (EMEP, 2017b). A close agreement is found between the bubbler and DELTA method
for SO2 (slope = 0.86, R2 = 0.82), while there is more scatter between the filter pack and DELTA method for SO42- (slope =
0.67, R2 = 0.66) (Figure 5Figure 4). Concentrations of SO2 for the 26 month overlap period were comparable (mean of bubbler
method = 0.40 µg S m-3 cf mean of DELTA method = 0.44 µg S m-3), whereas the filter pack SO42- concentration (mean = 0.44
µg S m-3, n = 87) is larger than the corresponding monthly DELTA measurement (mean = 0.28 µg S m-3, n = 87) (Figure 15
5Figure 4). An earlier detailed assessment of the DELTA system against filter pack with a focus on SO2 and SO42- in 1999 by
Hayman et al. (2006) had shown close agreement between the methods. It is therefore unclear why the DELTA gives a reading
lower than the filter pack SO42- at Eskdalemuir in this assessment, since the dataset was a continuation of the original inter-
comparison. Possible explanations include uncertainties associated with limit of detection of the daily filter pack method at
the very low concentrations encountered at this site, or the sampling of coarser particles by this method (due to high flow rate 20
and open-face sampling) with higher concentrations of sea salt sulphate. The DELTA methodology was unchanged for the
duration of the AGANet dataset (1999 - 2015) in this manuscript, which allows a consistent assessment of overall trends in
the SO42- data.
<INSERT Figure 5 HERE> 25
3
3.13.2 AGANet data
Annual data from the AGANet (and also from the NAMN) are submitted to the Department for Environment, Food & Rural
Affairs (Defra) UK-AIR database (https://uk-air.defra.gov.uk/), in a format consistent with other UK Authority air quality
networks and relevant reporting requirements. Every concentration value is labelled with a validity flag and an EMEP flag 30
(see http://www.nilu.no/projects/ccc/flags/index.html). Ratified calendar year data are published from around June the year
following collection. Currently, work is also in progress for the data to be made available from the EMEP database
Formatted: Normal
Field Code Changed
Formatted: Font: Bold
Formatted: Normal
16
(http://ebas.nilu.no/). All data used in this paper (up to 2015), except where specified, are accessed from the UK-AIR website
(Tang et al. 2017a, b).
3.3 Uncertainties in HNO3 determination
HNO3 data were corrected for sampling artefacts in the DELTA method with an empirical correction factor of 0.45 (see Sect. 5
2.6). Interferences in HNO3 determination arise through the simultaneous collection of reactive oxidized nitrogen species on
the K2CO3 coating that forms nitrate ions in the aqueous extracts of exposed denuders. Potential interfering species include
HONO, NO2, N2O5 and PAN, as well as other inorganic and organic nitrogen species. HONO is most likely to contribute to
the interference, since it is collected effectively on a carbonate coating and concentrations of HONO have been reported to be
comparable to, and in some places exceed HNO3 in the UK (e.g. Kitto & Harrison 1992; Connolly et al., 2016). Interference 10
from NO2 on the other hand should be small, since the reactivity of a carbonate coating surface towards NO2 is low (Allegrini
et al., 1987), with capture of NO2 on carbonate ranging from 0.5 to 5 % (Allegrini et al., 1987; Fitz 2002) and their
concentrations are also small at rural AGANet sites (< 10 µg NO2 m-3; Conolly et al., 2016). Tests by Steinle (2009) on the
DELTA K2CO3/glycerol coated denuders also confirmed low capture (ca 3 %) of NO2.
15
The correction factor was derived from two years of field intercomparison measurements at five sites across a range of pollutant
concentrations across the UK, from a clean rural background site in Southern Scotland (Auchencorth) to a polluted urban site
(London Cromwell road) in Southern England (Tang et al., 2015). It is recognised that the correction factor to derive the “real
HNO3” signal from the carbonate coated denuders will also be dependent on the relative concentrations of HNO3 to interfering
species present in the atmosphere and likely to be both site and season specific. The 2 years of data indeed show this variability 20
between sites and between seasons. Given the complexities of atmospheric chemistry of the large family of oxidised nitrogen
species, further work is clearly needed to understand what the carbonate denuders is measuring, before an improved correction
algorithm for the HNO3 data can be developed with any confidence.
The empirical 0.45 HNO3 is therefore at present a best estimate across a range of pollutant concentrations and seasons 25
encountered in the UK, based on available test data from 5 sites. At the cleanest rural sites (e.g. Eskdalemuir), where a much
smaller HONO and NO2 interference of the DELTA HNO3 signal is expected, the HNO3 concentrations may be under-
estimated after correction. This may partly explain the slope deviating from unity in the comparison of corrected DELTA TIN
with EMEP filter pack TIN data (slope = 0.835, R2 = 0.95) at Eskdalemuir (see Sect. 3.1.2). Conversely, at more polluted sites
such as London that are affected by a larger interference from HONO and NO2, the HNO3 determination may be over-estimated 30
after correction. Apart from two urban sites (London and Edinburgh), all other sites in the AGANet are rural, located away
from traffic, and the 0.45 correction factor should be more representative.

17
Since January 2016, the DELTA denuder sample train configuration in AGANet was changed to two NaCl coated denuders
(selective for HNO3, e.g. Allegrini et al., 1987), with a third K2CO3/glycerol coated denuder to collect SO2. At three sites
(Auchencorth, Bush OTC and Stoke Ferry), parallel measurements of the old configuration (two K2CO3/glycerol coated
denuders) and new configuration (two NaCl coated denuders + K2CO3/glycerol coated denuder) were conducted over 12
months in 2016. In the new configuration, nitrate measured on the NaCl denuders are reported as HNO3, whereas nitrate on 5
the K2CO3 denuder are assumed to come from other oxidised nitrogen species and are not reported. Comparing the sum of
nitrate concentrations from the new (2xNaCl + 1xK2CO3) with the old (2xK2CO3) configurations indicated matching capture
of total nitrate by the two parallel systems (new/old nitrate ratio = 0.95). A comparison of nitrate concentrations on the 2xNaCl
denuders only (new configuration) with the 2xK2CO3 denuders (old configuration) yielded an average ratio of 0.42, lending
further support to the 0.45 empirical factor. Additionally, the new sample train configuration is providing an extensive dataset 10
which will allow the magnitude of HNO3 interference at each site to be quantified, by comparing the amount of nitrate
measured on the 2xNaCl and K2CO3 coated denuders. Initial analysis of 2016 data (unpublished data) showed that the mean
ratio of nitrate on NaCl:K2CO3 of all sites was 0.44, ranging from 0.31 (Bush OTC) to 0.59 (Moorhouse). Seasonally, the
average monthly ratio (taken as the mean across all sites for each month) was lowest in winter (0.25 in December and 0.27 in
January) and highest between May to June (0.59, 0.56 and 0.57). It may therefore be possible to derive an improved correction 15
algorithm that is both site and season specific, and work is ongoing to make this assessment. A detailed assessment of sampling
artefacts and uncertainties in the DELTA method and the effects of a method change in the AGANet forms the subject of a
next paper that is currently in preparation.
3.23.4 Spatial patterns in relation to pollutant sources and transport 20
In Figure 6, Tthe spatial patterns for each of the gas and aerosol components measured are shown in the annual maps for the
example year 2013 (Figure 5). A gradient in the concentrations of acid gases HNO3 and SO2, and related aerosols NO3- and
SO42- can be seen across the UK, highest in the south and east (combustion/vehicular sources and long-range transboundary
pollutant transport from Europe) and lowest in the north and west of the UK (fewer sources, furthest from influence of Europe).
The ranges in site-annual mean concentrations (µg molecule m-3) in 2013 for the gases were: HNO3: 0.12 – 1.2; HCl: 0.15 - 25
0.52; SO2: 0.10 – 1.08, while those for aerosol were: NO3-: 0.33 – 3.1; Cl-: 0.54 – 3.3; SO4
2-: 0.35 – 1.2; Na+: 0.35 – 1.8; Ca2+:
<lod - 0.11; Mg2+: 0.03 – 0.19.
The largest HNO3 concentrations were measured at the London Cromwell site (2013 site annual mean = 1.3 µg HNO3 m-3 cf
2013 mean of 30 sites = 0.40 µg HNO3 m-3). London and Edinburgh are the only two urban sites in the AGANet, with the 30
other 28 sites all in rural environments. HNO3 concentrations in Edinburgh, the capital of Scotland with a population that is
18 times smaller than London (0.5 million vs 8.8 million), is about 2 times lower than London, but largerhigher than the
national average (2013 annual mean = 0.58 µg HNO3 m-3). For SO2, the highest concentrations were recorded at Sutton
Formatted: Not Superscript/ Subscript

18
Bonington due to close proximity to the 2000 MW capacity coal-fired Ratcliffe-on-Soar power station (2 km North). A peak
monthly concentration of 10.9 µg SO2 m-3 was recorded in May 2000 at this site, with an annual mean concentrations of 5.9
µg SO2 m-3 for that year that was also 3 times higher than the national average (mean of 12 sites = 1.9 SO2 m
-3 cf. mean of 11
sites (excl. Sutton Bonington) = 1.5 SO2 m-3). At remote sites further away from sources, concentrations of HNO3 and SO2 are
smaller, e.g. Lough Navar in Northern Ireland (2013 annual mean: 0.15 µg HNO3 m-3 and 0.21 µg SO2 m
-3) and Strathvaich 5
Dam in northwest Scotland (2013 annual mean = 0.17 µg HNO3 m-3 and 0.18 µg SO2 m
-3). NO3- and SO4
2- as secondary
aerosols have longer residence times in the atmosphere and are expected to be more spatially homogeneous than their precursor
gases. The spatial distribution in concentrations of particulate NO3- (0.33 – 3.1 g m-3) and SO4
2- (0.35 – 1.2 g m-3) are
however similar to that of HNO3 (0.12 – 1.3 µg m-3) and SO2 (0.10 – 1.1 µg m-3), with no clear differences in the main regional
patterns from only 30 sites. 10
<INSERT Figure 6Figure 5 HERE>
For HCl are mostly emitted from coal combustion and , the highest concentrations are in the source areas in the southeast and
southwest of England, and also in central England (north of Ratcliffe-on-Soar power station). There is also a that may be 15
attributed to dual contribution from anthropogenic (coal combustion) and marine sources for HCl formed by the (reaction of
sea salt with HNO3 and H2SO4 to form HCl) (Roth and Okada 1998; Ianniello et al., 2011) that may contribute to additional
enhancement of local to regional HCl concentrations. The spatial distributions of Cl- and Na+ were similar, with largest
concentrations at the coastal sites in the south (Barcombe Mills) and west (Yarner Wood) Goonhilly in southwest England and
at Lerwick Shetland in the Shetland Isles, highlighting the importance of marine sources to the sea salt (NaCl) aerosol. Further 20
away from the coast and influence of marine aerosol, the smallest concentrations of Cl- and Na+ are measured in the west of
the country (Lough Navar in Northern Ireland and Cwmystwyth in mid-Wales) and most of Scotland (with the exception of
Shetland). For Mg2+, is also seen to show a similar spatial distribution to Na+ and Cl-, which suggests that it may be in the form
of MgCl2, although the range of concentrations at sites are small (0.03 – 0.19 µg m-3), but the spatial distribution is similar to
Na+ and Cl- and suggests that it may be in the form of MgCl2. There is however no clear spatial pattern for Ca2+, but since with 25
concentrations that are mostly at or below LOD, any assessment of this component is highly uncertain.
In the case of NH3, the extensive spatial heterogeneity seen is related to large variation in emission sources at ground level
across the UK (Tang et al., 2018). Aerosol NH4+, as expected for a secondary component, show a less variable concentration
field. The spatial distribution of NH4+ is similar to SO4
2- and NO3- over the UK (Figure 6Figure 5), due to the close coupling 30
between species from the formation of particle phase (NH4)2SO4 and NH4NO3 (see next section).
Formatted: Not Superscript/ Subscript
Formatted: Superscript
Formatted: Not Superscript/ Subscript
Formatted: Superscript
Field Code Changed
Formatted: Font: Bold

19
3.33.5 Correlations between gas and aerosol species
Correlations plots between the gas and aerosol phases of the different components are shownummarised in Figure 7, with
Figure 6a summary of the regression results provided in Table 2. The comparison of gas phase concentrations show that
gaseous NH3 is poorly correlated with either SO2 or HNO3, as might be expected since the emission sources of these pollutants
are different. In the case of the acid gases however, For HNO3 and SO2, there significant is a stronger correlations between 5
HNO3:SO2 (R2 = 0.35), HNO3:HCl (R2 = 0.25) and SO2:HCl (R2 = 0.21) which may be related due to similarity in the regional
distribution of their emissions. These comparisons show that there is on average 5 times more NH3 than SO2 and 13 times
more NH3 than HNO3 at the AGANet sites (on a molar basis), and that SO2 concentration is nearly 3 times larger than HNO3
(on a molar basis).
10
<INSERT Figure 6 Figure 7 HERE>
<INSERT Table 2 HERE>
15
InFor the aerosol components, there is very high correlation between NO3-, SO4
2- and NH4+, and between Na+ and Cl-, but no
discernible relationship between NH4+ and Cl- (Figure 6Figure 7). The near 1:1 relationship in the scatter plot of the sum of
NO3- and SO4
2- (µeq m-3) versus NH4
+ (µeq m-3) (slope = 0.91, R2 = 0.93), in the absence of any correlation between NH4+ and
Cl-, suggests that H2SO4 and HNO3 in the atmosphere are fully neutralised by NH3 to form (NH4)2SO4, NH4HSO4 and NH4NO3
(Aneja et al. 2001). For Cl-, the high correlation with Na+ (slope = 1.04, R2 = 0.8) lends support that the Cl- measured in the 20
DELTA are derived mainly from sea salt (NaCl). Similar to the relative concentrations of gases, NH4+ concentrations (on a
molar basis) are larger than SO42- and NO3
-, but NO3- is in molar excess over SO4
2-. The correlations between NH4+ and sum
(NO3- + 2SO4
2-) and for Na+ and Cl- forms the basis of ion balance checks in data quality assessment, as discussed in section
2.5 and shows that robust data are obtained .
25
Sea salt aerosol, derived from sea spray has essentially the same composition as seawater (Keene et al., 1986). The marine
aerosol comprises two distinct aerosol types: (1) primary sea salt aerosol produced by the mechanical disruption of the ocean
surface and (2) secondary aerosol, primarily in the form of non-sea salt (nss) sulphate and organic species, formed by gas-to-
particle conversion processes such as binary homogeneous nucleation, heterogeneous nucleation and condensation (O’Dowd
and Leeuw, 2007). It has been shown that the ratio of the mass concentrations of SO42- and Cl- to the reference Na+ species in 30
seawater may be used to estimate mass concentrations of non-sea salt SO42- (nss_SO4) and non-sea salt Cl- (nss_Cl) in aerosol,
according to equations 34 and 45, respectively (Keene et al., 1986; O’Dowd and de Leeuw, 2007).
Formatted: Subscript
Formatted: Subscript
Formatted: Subscript
Formatted: Font: Italic
Formatted: Superscript
Formatted: Subscript
Formatted: Font: Italic
Formatted: Superscript
Formatted: Line spacing: 1.5 lines, Adjust space betweenLatin and Asian text, Adjust space between Asian text andnumbers
Field Code Changed
Field Code Changed
Formatted: Font: Bold
Field Code Changed
Formatted: Font: Bold
Formatted: Superscript
20
[nss_SO4] = [SO42-] - (0.25 x [Na+]) (34)
[nss_Cl] = [Cl-] - (1.80 x [Na+]) (45)
Applying Equation 34 to the SO42- data in Figure 6Figure 7, nss_SO4 is estimated to comprise on average 25 % (range = 3 –
83 %, n = 187) of the measured total SO42- aerosol. Regression of nss_SO4 vs NH4
+ (slope = 0.18, intercept = 0.47, R2 = 0.71) 5
(Supp. Figure S3) was not significantly different from the regression of total SO42- vs NH4
+ (slope = 0.18, intercept = 2.4, R2
= 0.73) (Figure 7)Figure 6). Sources of nss_SO4 are (i) biological oxidation of dimethylsulphide and (ii) oxidation of SO2
(O’Dowd and de Leeuw, 2007). This analysis demonstrates that sea salt SO42- aerosol makes up a significant and variable
fraction of the total SO42- measured, consistent with observations of the contribution by sea salt SO4
2- to the total SO42- in
precipitation in the UK (ROTAP 2012). The improved intercept from the nss_SO4 regression (Supp. Figure S3) suggests that 10
nss_SO4 are mainly associated with NH4+.
For Cl- (mean = 1.3 µg m-3, n = 188), eEstimated nss_Cl concentrations according to Equation 4 was howeverere negligible
(mean = –0.09 µg m-3, n = 188),. compared to the total Cl- (mean = 1.3 µg m-3, n = 188). Studies have shown that part of the
chloride of sea salt can be substituted by SO42- and NO3
- through a reaction with H2SO4 and HNO3, known as the Cl- deficit 15
(Ayers et al., 1999). The close coupling between Cl- and Na+ (near 1:1 relationship) presented here suggests that the measured
Cl- in the aerosol are mostly sea salt in origin, with no evidence of depletion of Cl− from sea salt aerosols.
3.43.6 Seasonal variation Temporal trends in acid gases and aerosols
The average seasonal cycles for all gas and aerosol components derived from the mean of monthly data of all sites for the 20
period 2000 to 2015 are compared in Figure 8Figure 7. Clear differences are observed in these seasonal cycles, influenced by
local to regional emissions, climate, meteorology and photochemical processes.
<INSERT Figure 8Figure 7 HERE>
The seasonal cycle for HNO3 and NO3- has a maximum in spring (Figure 7). HNO3 is a secondary product of NOx, but NOx 25
emissions are dominated by vehicular sources which are not expected to show large seasonal variations. Seasonal changes in
chemistry and meteorology are therefore more likely to be a source of the observed variations in HNO3 and NO3- (Figure 8).
In spring, the peak in HNO3 and NO3- concentrations A weak seasonal cycle is observed in HNO3, with slightly higher
concentrations in late winter and early spring that may be attributed are due to i) photochemical processes with elevated ozone
in spring (AQEG 2009) leading to formation of HNO3 during this period (Pope et al., 2016)., and ii) long-range transboundary 30
pollution from Europe, leading to regional enhancement across the UK (Vieno et al., 2014, 2016). As discussed in section 3.3,
a constant correction factor was applied to all HNO3 data, which does not take into account seasonal dependency. The
Field Code Changed
Formatted: Font: Not Bold
Field Code Changed
Formatted: Font: Bold
Field Code Changed
Field Code Changed
Formatted: Font: Not Bold
21
concentrations in HNO3 may therefore be over-estimated in winter (less HNO3 formed from photochemical processes) and
under-estimated in summer (larger HNO3 concentrations due to increased .OH radicals for reaction with NO2 to form HNO3),
masking the true extent in the seasonal profile.
The ratio of the concentrations of HNO3 and NO3- can also be seen to fluctuate throughout the year; largest in July and smallest 5
in spring (Figure 8) which may be explained as follows. In contrast, the seasonal cycle for particulate NO3- is more distinct
with a large peak in concentrations that occur every spring, together with a second smaller peak in autumn (Figure 8). NH3,
the main neutralising gas in the atmosphere that reacts with HNO3 to form NH4NO3, has a correspondingly large peak in
concentration in spring, a second smaller peak in autumn, but with elevated concentrations in summer and lowest in winter
(Figure 8). Although particulate NO3- formation is dependent upon the availability of NH3 for reaction with HNO3, its’ 10
concentration is also governed by the An equilibrium that exists between gaseous HNO3, NH3 and particulate NH4NO3, the
latter of which is appreciably volatile at ambient temperatures (Stelson and Seinfeld, 1982). The atmospheric residence times
and therefore concentrations of HNO3 and NH3 are strongly dependent on their partitioning between the gas and aerosol phase.
Partitioning between the gas and aerosol phase is therefore also a key driver for their atmospheric residence times and
concentrations. HNO3 and NH3 that are not removed by deposition may react together in the atmosphere to form NH4NO3 15
aerosol, when the concentration product [NH3].[HNO3] exceeds equilibrium values. Since NH4NO3 is semi-volatile, any that
is not dry or wet deposited can potentially dissociate to release NH3 and HNO3, effectively increasing their residence times in
the atmosphere. The formation and dissociation in turn are strongly influenced by ambient temperature and humidity.
Warm, dry conditions in summer promotes dissociation, increasing gas-phase HNO3 relative to particulate-phase NH4NO3 20
(Figure 8). This process accounts for the minima in NO3- concentrations (Figure 8) and the highest ratio of HNO3 to NO3
- seen
in July (Figure 9). Cooler conditions in the spring and autumn sees a larger fraction of the volatile NH4NO3 remaining in the
aerosol phase. The largest peak in NO3- concentrations (Figure 8) and the lowest HNO3:NO3
- ratio in spring-time (Figure 9) is
thus a combination of increased NO3- formation from reaction between higher concentrations of the precursor gases HNO3 and
NH3, and increased partitioning to the aerosol phase in cooler, more humid climate. Import from long-range transboundary 25
transport of particulate NO3-, e.g. from continental Europe into the UK, as discussed in Vieno et al. (2014, 2016) adds to the
elevated NO3- concentrations. In winter, low temperature and high humidity also shifts the equilibrium to formation of NH4NO3
from the gas-phase HNO3 and NH3. Since NH3 concentrations are also lowest in winter, with less NH3 available for reaction,
NH4NO3 concentrations are correspondingly smaller in winter than in spring or autumn.this contributes to the winter minimum
in NH4NO3. The low HNO3:NO3- ratio in spring-time on the other hand is a result of higher NO3
-, from higher concentrations 30
of the precursor gases HNO3 and NH3, and from long-range transboundary transport of particulate NO3- e.g. from continental
Europe into the UK, as discussed in Vieno et al. (2014, 2016).
<INSERT Figure 8 Figure 9 HERE>
Formatted: Space Before: 0 pt
Field Code Changed
Formatted: Font: Not Bold
Field Code Changed
Formatted: Font: Not Bold
Field Code Changed
Field Code Changed
Formatted: Font: Not Bold
Field Code Changed
Field Code Changed
Formatted: Font: Not Bold
Field Code Changed
Field Code Changed
Field Code Changed
Formatted: Font: Bold
22
For SO2, by contrast, are the temporal profile shows highest concentrations in the winter, with concentrations exceeding
summer values on average by a factor of 2 (Figure 7Figure 8). Higher emissions of SO2 from combustion processes (heating)
during the winter months, coupled to stable atmospheric conditions resulting in build-up of concentrations at ground level
contributes to the winter maximum. Since the reaction of SO2 with NH3 to form (NH4)2SO4 is effectively irreversible (Bower 5
et al., 1997), the ratio of the concentrations of SO2 and SO42- (Figure 8Figure 9) is largely governed by the availability of SO2
and NH3 to form (NH4)2SO4. The temporal profile of SO42-- has a peak in concentrations in spring, although not as pronounced
as the NO3- peak (Figure 7Figure 8). This may be attributed to enhanced formation of (NH4)2SO4, since peaks in concentrations
of NH3 and NH4+ also occur in spring (Figure 8Figure 7) and from the import of particulates from long-range transboundary
transport. Unlike SO2, aerosol SO42- concentrations are higher in summer than in winter, due to increased photochemical 10
oxidation of SO2 to H2SO4 and subsequent formation of sulphate aerosols in sunnier and warmer conditions (Mihalopoulos et
al., 2007). In winter, lower SO2 oxidation rates limits H2SO4 formation and therefore also the formation of (NH4)2SO4.
Na+ and Cl- also have highest concentrations during winter, highlighting the importance of marine sources (more stormy 15
weather) in winter for sea salt aerosol. The seasonal trends in Mg2+ is similar to Na+, with maxima during winter and minima
in summer (Figure 7Figure 8). While sea salt aerosols comprise mainly of NaCl, other chemical ions are also common in
seawater, such as K+, Mg2+, Ca2+ and SO42− (Keene et al., 1986). Some of the sea salt aerosol may therefore be in the form of
MgCl2. Magnesium is however also a crustal element, and so it is not as good as sodium as a tracer for sea salt. Similarly,
calcium is also a rock-derived element and its presence in the atmosphere is thought to come from chemical weathering of 20
carbonate minerals (Schmitt & Stille, 2005). The seasonal cycle of Ca2+ is similar to, but less pronounced than Na+ and Mg2+.
Measured concentrations of Ca2+ were mostly at or below the method LOD which makes interpretation uncertain, but the
higher concentrations of Ca2+ in the winter months is likely to be both crustal dust and sea salt in origin.
<INSERT Figure 9 Figure 10 HERE> 25
Large inter- and intra-annual variability are also observed in the long-term mean monthly concentrations of gas and aerosol
components, as illustrated in Figure 9Figure 10. In 2003, elevated concentrations of HNO3 and NO3- (and also NH4
+) were
observed between February to April that were more pronounced than the normal peak in concentrations that occur in Spring.
The large spike in concentrations was of a sufficient magnitude to elevate the annual mean concentrations for 2003 of HNO3 30
(0.54 µg m-3 cf 0.39 and 0.36 µg m-3 for 2002 and 2004, respectively), particulate NO3- (2.98 µg m-3 cf 1.99 and 1.93 µg m-3
for 2002 and 2004, respectively) and NH4+ (1.45 µg m-3 cf 1.06 and 0.97 µg m-3 for 2002 and 2004, respectively). In
comparison, a much smaller spike in elevated SO42-
concentrations resulted in a slight increase in annual average SO42-
(1.79
µg m-3 cf 1.41 and 1.31 µg m-3 for 2002 and 2004, respectively) (Figure 9Figure 10). Meteorological back trajectory analysis
Field Code Changed
Field Code Changed
Formatted: Font: Not Bold
Field Code Changed
Field Code Changed
Field Code Changed
Field Code Changed
Formatted: Font: Not Bold
Field Code Changed
Formatted: Font: Not Bold
Field Code Changed
Field Code Changed
Field Code Changed
Formatted: Font: Bold
Field Code Changed
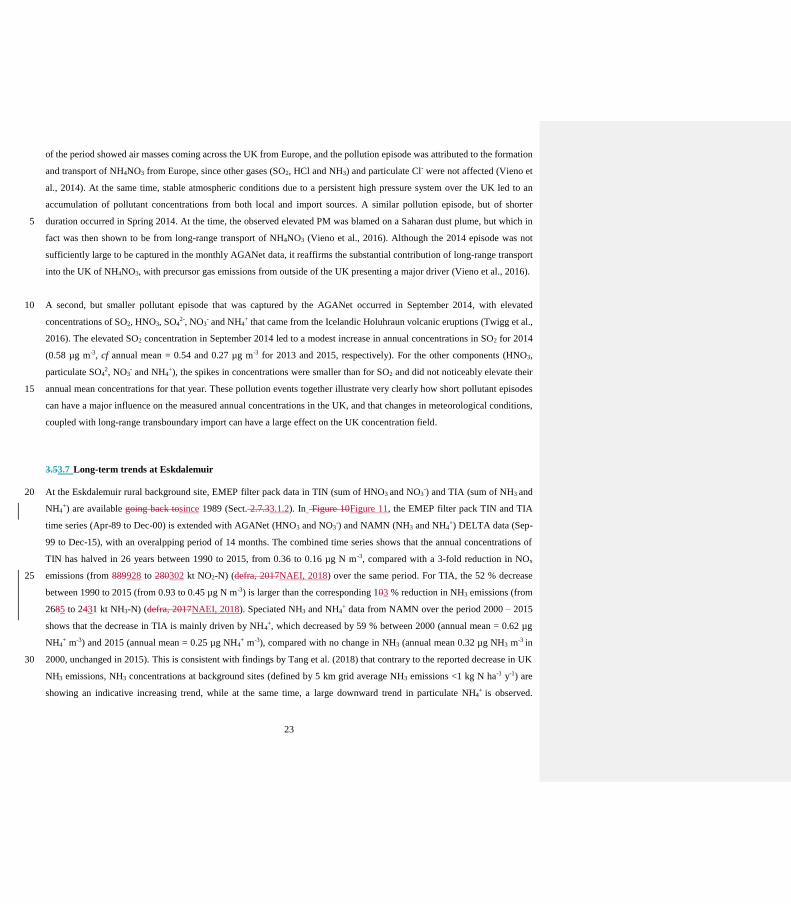
23
of the period showed air masses coming across the UK from Europe, and the pollution episode was attributed to the formation
and transport of NH4NO3 from Europe, since other gases (SO2, HCl and NH3) and particulate Cl- were not affected (Vieno et
al., 2014). At the same time, stable atmospheric conditions due to a persistent high pressure system over the UK led to an
accumulation of pollutant concentrations from both local and import sources. A similar pollution episode, but of shorter
duration occurred in Spring 2014. At the time, the observed elevated PM was blamed on a Saharan dust plume, but which in 5
fact was then shown to be from long-range transport of NH4NO3 (Vieno et al., 2016). Although the 2014 episode was not
sufficiently large to be captured in the monthly AGANet data, it reaffirms the substantial contribution of long-range transport
into the UK of NH4NO3, with precursor gas emissions from outside of the UK presenting a major driver (Vieno et al., 2016).
A second, but smaller pollutant episode that was captured by the AGANet occurred in September 2014, with elevated 10
concentrations of SO2, HNO3, SO42-, NO3
- and NH4+ that came from the Icelandic Holuhraun volcanic eruptions (Twigg et al.,
2016). The elevated SO2 concentration in September 2014 led to a modest increase in annual concentrations in SO2 for 2014
(0.58 µg m-3, cf annual mean = 0.54 and 0.27 µg m-3 for 2013 and 2015, respectively). For the other components (HNO3,
particulate SO42, NO3
- and NH4+), the spikes in concentrations were smaller than for SO2 and did not noticeably elevate their
annual mean concentrations for that year. These pollution events together illustrate very clearly how short pollutant episodes 15
can have a major influence on the measured annual concentrations in the UK, and that changes in meteorological conditions,
coupled with long-range transboundary import can have a large effect on the UK concentration field.
3.53.7 Long-term trends at Eskdalemuir
At the Eskdalemuir rural background site, EMEP filter pack data in TIN (sum of HNO3 and NO3-) and TIA (sum of NH3 and 20
NH4+) are available going back tosince 1989 (Sect. 2.7.33.1.2). In Figure 10Figure 11, the EMEP filter pack TIN and TIA
time series (Apr-89 to Dec-00) is extended with AGANet (HNO3 and NO3-) and NAMN (NH3 and NH4
+) DELTA data (Sep-
99 to Dec-15), with an overalpping period of 14 months. The combined time series shows that the annual concentrations of
TIN has halved in 26 years between 1990 to 2015, from 0.36 to 0.16 µg N m -3, compared with a 3-fold reduction in NOx
emissions (from 889928 to 280302 kt NO2-N) (defra, 2017NAEI, 2018) over the same period. For TIA, the 52 % decrease 25
between 1990 to 2015 (from 0.93 to 0.45 µg N m-3) is larger than the corresponding 103 % reduction in NH3 emissions (from
2685 to 2431 kt NH3-N) (defra, 2017NAEI, 2018). Speciated NH3 and NH4+ data from NAMN over the period 2000 – 2015
shows that the decrease in TIA is mainly driven by NH4+, which decreased by 59 % between 2000 (annual mean = 0.62 µg
NH4+ m-3) and 2015 (annual mean = 0.25 µg NH4
+ m-3), compared with no change in NH3 (annual mean 0.32 µg NH3 m-3 in
2000, unchanged in 2015). This is consistent with findings by Tang et al. (2018) that contrary to the reported decrease in UK 30
NH3 emissions, NH3 concentrations at background sites (defined by 5 km grid average NH3 emissions <1 kg N ha-1 y-1) are
showing an indicative increasing trend, while at the same time, a large downward trend in particulate NH4+ is observed.

24
Together, the AGAnet and NAMN are thus providing an important long-term dataset that distinguishes between the gas and
aerosol phase, allowing gas:aerosol phase interactions to be explored.
<INSERT Figure 11Figure 10 HERE>
5
An extended time series illustrating the continued decline in SO2 and SO42- has also been constructed by combining historic
SO2 and SO42- measurement data at the Eskdalemuir site going back to December 1977 (see Sect. 2.7.43.1.3) with AGANet
SO2 and SO42- data (Sep-99 to Dec-15) (Figure 11Figure 12). A substantial decline in SO2 is observed, falling by 98 % from
4.5 µg S m-3 in 1978 to 0.07 µg S m-3 in 2015, in good agreement with similarly large reduction in UK SO2 emissions over the
same period of 95 % (from 25370 to 1206 kt SO2-S) (NAEI, 2018). The decrease in SO42- is of a smaller magnitude, declining 10
by 88 % from an annual mean concentration of 0.89 µg S m-3 in 1978 to 0.11 µg S m-3 in 2015, highlighting the non-linearity
in relationship between the atmospheric gas and aerosol phase of sulphur at this background site.
<INSERT Figure 12Figure 11 HERE>
3.63.8 Assessment of trends in relation to UK emissions 15
The long-term time series in annually averaged concentrations of the gas and aerosol components are comparedshown in
Figure 13Figure 12a and Figure 13Figure 12b, respectively. Since there was a change in the number of sites during the
operation of the AGANet, Aannually averaged data from the original 12 sites for the period 2000 – 2015 (1999 data excluded
since AGANet started in September 1999) and from the full network (30 sites) for the period 2006 – 2015 are plotted alongside
each other for comparison. From 2006 – 2015, the decreasing trends for all gas and aerosol components from the expanded 30 20
sites are seen to be similar to those from the original 12 sites. The annual mean concentrations in gas and aerosol components
derived from the expanded 30 sites (2006 – 2015) or from the original 12 sites over the same period are also in general
comparable (Table 3Table 4). The exceptions are Na+ and Cl- that have higher mean concentrations from the 30 sites than the
original 12 sites (Table 3), due to the addition of two coastal sites (Shetland and Rum), with larger contribution from sea salt.
Larger HNO3 concentrations are due to two urban sites, London and Edinburgh (higher NOx emissions from vehicular traffic). 25
The addition of three sites in high NH3 emission (agricultural) areas (Rosemaund in England, Narberth in Wales and
Hillsborough in Northern Ireland) also elevated measured annual mean NH3 concentrations. The comparisons here thus
illustrates very clearly the need to consider the effect of site changes in a national network and the importance of maintaining
consistency and site continuity for assessing long-term trends.
30
<INSERT Figure 13Figure 12 HERE>
<INSERT Table 3Table 4 HERE>
Field Code Changed
Formatted: Font: Bold
Field Code Changed
Formatted: Font: Bold
Field Code Changed
Formatted: Font: Bold
Field Code Changed
Formatted: Font: Bold
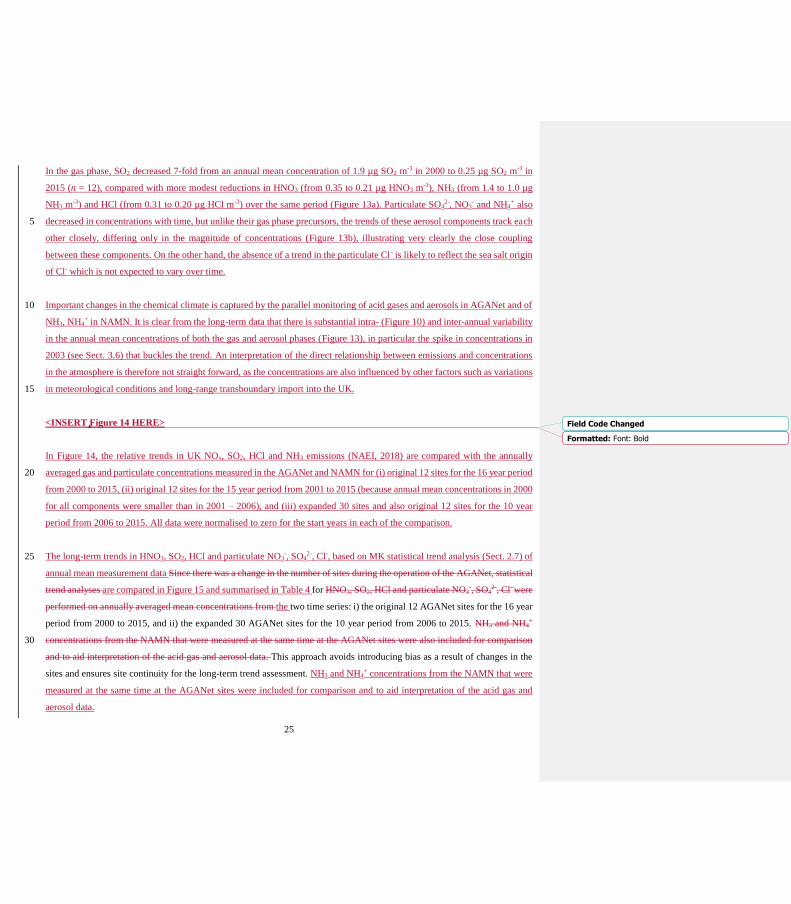
25
In the gas phase, SO2 decreased 7-fold from an annual mean concentration of 1.9 µg SO2 m-3 in 2000 to 0.25 µg SO2 m
-3 in
2015 (n = 12), compared with more modest reductions in HNO3 (from 0.35 to 0.21 µg HNO3 m-3), NH3 (from 1.4 to 1.0 µg
NH3 m-3) and HCl (from 0.31 to 0.20 µg HCl m-3) over the same period (Figure 13a). Particulate SO4
2-, NO3- and NH4
+ also
decreased in concentrations with time, but unlike their gas phase precursors, the trends of these aerosol components track each 5
other closely, differing only in the magnitude of concentrations (Figure 13b), illustrating very clearly the close coupling
between these components. On the other hand, the absence of a trend in the particulate Cl - is likely to reflect the sea salt origin
of Cl- which is not expected to vary over time.
Important changes in the chemical climate is captured by the parallel monitoring of acid gases and aerosols in AGANet and of 10
NH3, NH4+ in NAMN. It is clear from the long-term data that there is substantial intra- (Figure 10) and inter-annual variability
in the annual mean concentrations of both the gas and aerosol phases (Figure 13), in particular the spike in concentrations in
2003 (see Sect. 3.6) that buckles the trend. An interpretation of the direct relationship between emissions and concentrations
in the atmosphere is therefore not straight forward, as the concentrations are also influenced by other factors such as variations
in meteorological conditions and long-range transboundary import into the UK. 15
<INSERT Figure 14 HERE>
In Figure 14, the relative trends in UK NOx, SO2, HCl and NH3 emissions (NAEI, 2018) are compared with the annually
averaged gas and particulate concentrations measured in the AGANet and NAMN for (i) original 12 sites for the 16 year period 20
from 2000 to 2015, (ii) original 12 sites for the 15 year period from 2001 to 2015 (because annual mean concentrations in 2000
for all components were smaller than in 2001 – 2006), and (iii) expanded 30 sites and also original 12 sites for the 10 year
period from 2006 to 2015. All data were normalised to zero for the start years in each of the comparison.
The long-term trends in HNO3, SO2, HCl and particulate NO3-, SO4
2-, Cl-, based on MK statistical trend analysis (Sect. 2.7) of 25
annual mean measurement data Since there was a change in the number of sites during the operation of the AGANet, statistical
trend analyses are compared in Figure 15 and summarised in Table 4 for HNO3, SO2, HCl and particulate NO3-, SO4
2-, Cl- were
performed on annually averaged mean concentrations from the two time series: i) the original 12 AGANet sites for the 16 year
period from 2000 to 2015, and ii) the expanded 30 AGANet sites for the 10 year period from 2006 to 2015. NH3 and NH4+
concentrations from the NAMN that were measured at the same time at the AGANet sites were also included for comparison 30
and to aid interpretation of the acid gas and aerosol data. This approach avoids introducing bias as a result of changes in the
sites and ensures site continuity for the long-term trend assessment. NH3 and NH4+ concentrations from the NAMN that were
measured at the same time at the AGANet sites were included for comparison and to aid interpretation of the acid gas and
aerosol data.
Field Code Changed
Formatted: Font: Bold

26
Results of the Linear Regression (LR) and Mann-Kendall (MK) tests (Section 2.8) are summarised in Figure 13 and Table 5
for the original 12 sites (2000 – 2015), and in Figure 14 and Table 6 for the expanded 30 sites (2006 – 2015). To quantifyassess
changes in measured concentrations over time, annual trends (e.g. µg HNO3 m-3 -1 y-1) arewere estimated from the regression
results of the LR and MK tests. This is considered to provide a more reliable estimate of trend than comparing measured annual 5
concentrations at the beginning and end of the time series, which is subject to bias due to substantial variability in annual
concentrations between years (Tang et al., 2018). Changes in measured concentrations over time (MK The LR % annual trends
for each time series are estimated from the LR’s slope and intercept, while the MK % median median change)annual trends in
the time series are estimated from the MK Sen’s slope and intercept (eEquation 56). MK annual trends and % median change
are summarised in Figure 15 and Table 4. 10
% medianannual change = 100 .[𝑌𝑖−𝑌𝑜)
𝑌𝑜 [(56])
where (y0) and (yi) = estimated annual mean concentrations at the start and end of the selected time period, estimated from
the slope and intercept of the LR or MK tests. 15
Statistical trend analysis of monthly mean measurement data The long-term trends in the gas and aerosol components, based
on statistical analysis of monthly mean measurement data, are also shown for comparison in Supp. Figure S43 (mean monthly
data of 12 sites for period 2000-2015) and Figure S54 (mean monthly data of 12 sites for period 2006-2015). MK annual trends
and % median change, based on Results of the trend analysis onthe monthly data (Supp. Tables S47, S58) were similar to the 20
were similar to trend analysis results of the annual test resultsdata (Table 5; Table 6Table 4). While not discussed further here,
since assessment of long-term trends in this paper focusses on trends in annual mean concentrations for comparison with trends
in estimated annual emissions, the monthly plots serves to illustrate the large intra-annual variability of concentrations in gases
and aerosols.
25
<INSERT Figure 15 Figure 13 HERE>
<INSERT Table 4Table 5 HERE>
<INSERT Figure 14 HERE>
<INSERT Table 6 HERE>
Formatted: Not Superscript/ Subscript
Formatted: Superscript
Formatted: Not Superscript/ Subscript
Field Code Changed
Formatted: Font: Bold
Field Code Changed
Formatted: Font: Bold
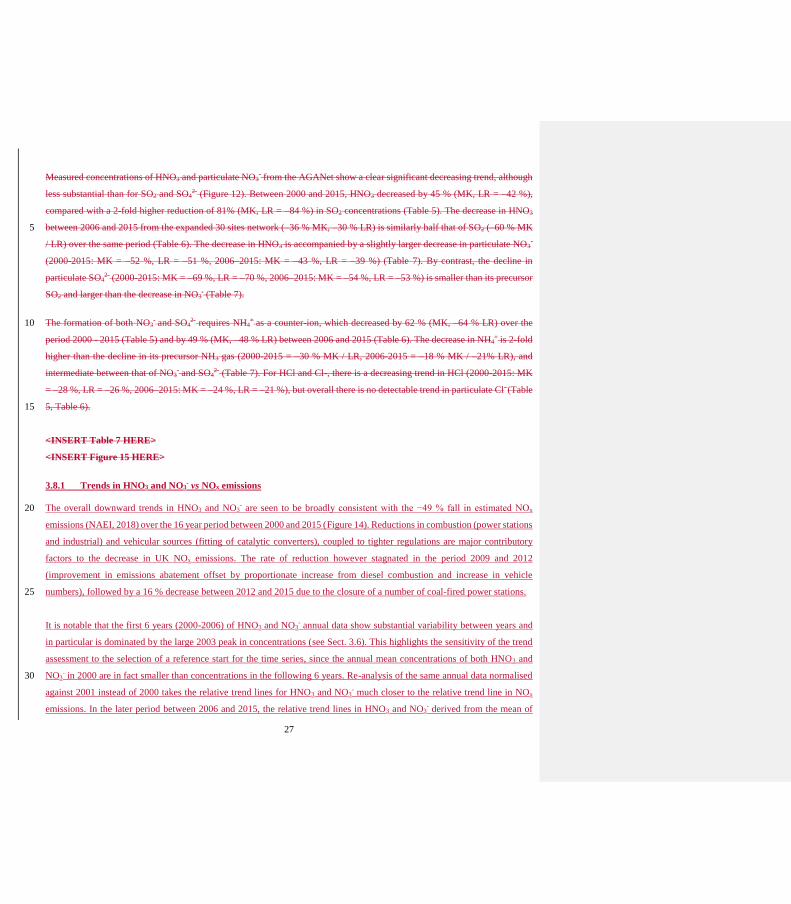
27
Measured concentrations of HNO3 and particulate NO3- from the AGANet show a clear significant decreasing trend, although
less substantial than for SO2 and SO42- (Figure 12). Between 2000 and 2015, HNO3 decreased by 45 % (MK, LR = –42 %),
compared with a 2-fold higher reduction of 81% (MK, LR = –84 %) in SO2 concentrations (Table 5). The decrease in HNO3
between 2006 and 2015 from the expanded 30 sites network (–36 % MK, –30 % LR) is similarly half that of SO2 (–60 % MK 5
/ LR) over the same period (Table 6). The decrease in HNO3 is accompanied by a slightly larger decrease in particulate NO3-
(2000-2015: MK = –52 %, LR = –51 %, 2006–2015: MK = –43 %, LR = –39 %) (Table 7). By contrast, the decline in
particulate SO42- (2000-2015: MK = –69 %, LR = –70 %, 2006–2015: MK = –54 %, LR = –53 %) is smaller than its precursor
SO2 and larger than the decrease in NO3- (Table 7).
The formation of both NO3- and SO4
2- requires NH4+ as a counter-ion, which decreased by 62 % (MK, –64 % LR) over the 10
period 2000 - 2015 (Table 5) and by 49 % (MK, –48 % LR) between 2006 and 2015 (Table 6). The decrease in NH4+ is 2-fold
higher than the decline in its precursor NH3 gas (2000-2015 = –30 % MK / LR, 2006-2015 = –18 % MK / –21% LR), and
intermediate between that of NO3- and SO4
2- (Table 7). For HCl and Cl-, there is a decreasing trend in HCl (2000-2015: MK
= –28 %, LR = –26 %, 2006–2015: MK = –24 %, LR = –21 %), but overall there is no detectable trend in particulate Cl- (Table
5, Table 6). 15
<INSERT Table 7 HERE>
<INSERT Figure 15 HERE>
3.8.1 Trends in HNO3 and NO3- vs NOx emissions
The overall downward trends in HNO3 and NO3- are seen to be broadly consistent with the −49 % fall in estimated NOx 20
emissions (NAEI, 2018) over the 16 year period between 2000 and 2015 (Figure 14). Reductions in combustion (power stations
and industrial) and vehicular sources (fitting of catalytic converters), coupled to tighter regulations are major contributory
factors to the decrease in UK NOx emissions. The rate of reduction however stagnated in the period 2009 and 2012
(improvement in emissions abatement offset by proportionate increase from diesel combustion and increase in vehicle
numbers), followed by a 16 % decrease between 2012 and 2015 due to the closure of a number of coal-fired power stations. 25
It is notable that the first 6 years (2000-2006) of HNO3 and NO3- annual data show substantial variability between years and
in particular is dominated by the large 2003 peak in concentrations (see Sect. 3.6). This highlights the sensitivity of the trend
assessment to the selection of a reference start for the time series, since the annual mean concentrations of both HNO3 and
NO3- in 2000 are in fact smaller than concentrations in the following 6 years. Re-analysis of the same annual data normalised 30
against 2001 instead of 2000 takes the relative trend lines for HNO3 and NO3- much closer to the relative trend line in NOx
emissions. In the later period between 2006 and 2015, the relative trend lines in HNO3 and NO3- derived from the mean of
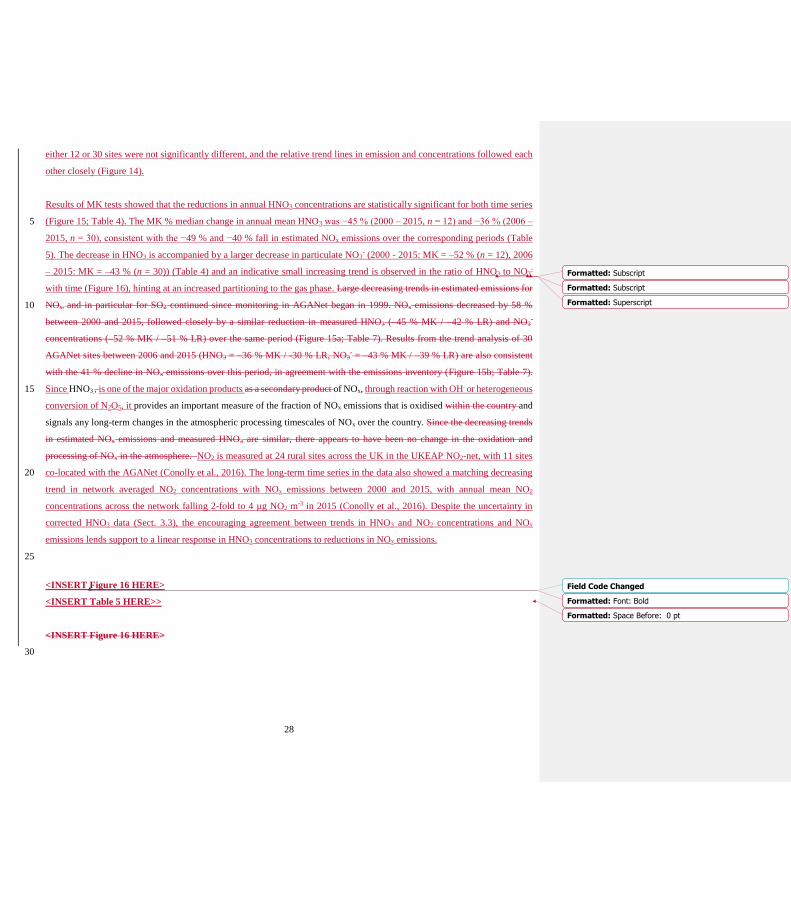
28
either 12 or 30 sites were not significantly different, and the relative trend lines in emission and concentrations followed each
other closely (Figure 14).
Results of MK tests showed that the reductions in annual HNO3 concentrations are statistically significant for both time series
(Figure 15; Table 4). The MK % median change in annual mean HNO3 was −45 % (2000 – 2015, n = 12) and −36 % (2006 – 5
2015, n = 30), consistent with the −49 % and −40 % fall in estimated NOx emissions over the corresponding periods (Table
5). The decrease in HNO3 is accompanied by a larger decrease in particulate NO3- (2000 - 2015: MK = –52 % (n = 12), 2006
– 2015: MK = –43 % (n = 30)) (Table 4) and an indicative small increasing trend is observed in the ratio of HNO3 to NO3-
with time (Figure 16), hinting at an increased partitioning to the gas phase. Large decreasing trends in estimated emissions for
NOx, and in particular for SO2 continued since monitoring in AGANet began in 1999. NOx emissions decreased by 58 % 10
between 2000 and 2015, followed closely by a similar reduction in measured HNO3 (–45 % MK / –42 % LR) and NO3-
concentrations (–52 % MK / –51 % LR) over the same period (Figure 15a; Table 7). Results from the trend analysis of 30
AGANet sites between 2006 and 2015 (HNO3 = –36 % MK / -30 % LR, NO3- = –43 % MK / –39 % LR) are also consistent
with the 41 % decline in NOx emissions over this period, in agreement with the emissions inventory (Figure 15b; Table 7).
Since HNO3 , is one of the major oxidation products as a secondary product of NOx, through reaction with OH. or heterogeneous 15
conversion of N2O5, it provides an important measure of the fraction of NOx emissions that is oxidised within the country and
signals any long-term changes in the atmospheric processing timescales of NOx over the country. Since the decreasing trends
in estimated NOx emissions and measured HNO3 are similar, there appears to have been no change in the oxidation and
processing of NOx in the atmosphere. NO2 is measured at 24 rural sites across the UK in the UKEAP NO2-net, with 11 sites
co-located with the AGANet (Conolly et al., 2016). The long-term time series in the data also showed a matching decreasing 20
trend in network averaged NO2 concentrations with NOx emissions between 2000 and 2015, with annual mean NO2
concentrations across the network falling 2-fold to 4 µg NO2 m-3 in 2015 (Conolly et al., 2016). Despite the uncertainty in
corrected HNO3 data (Sect. 3.3), the encouraging agreement between trends in HNO3 and NO2 concentrations and NOx
emissions lends support to a linear response in HNO3 concentrations to reductions in NOx emissions.
25
<INSERT Figure 16 HERE>
<INSERT Table 5 HERE>>
<INSERT Figure 16 HERE>
30
Formatted: Subscript
Formatted: Subscript
Formatted: Superscript
Field Code Changed
Formatted: Font: Bold
Formatted: Space Before: 0 pt
29
3.8.2 Trends in SO2 and SO42- vs SO2 emissions
Unlike NOx, For SO2, there has been a more significant decline in SO2, both in emissions and measured concentrations during
this period (Figure 14Figure 16). Between 2000 and 2009, SO2 emissions fell substantially by 66 % from 1286 to 432 kt SO2.
The reduction reflects mitigation measures introduced since the 1980s (fitting of flue gas desulphurisation to coal fired power
stations) to control S pollution, reductions in energy production and manufacturing and the switch from coal to gas at the same 5
time. Similar to trends in NOx emission, the decreasing trend in SO2 emissions plateaued between 2009 and 2012 and then
decreased again by a further 45% between 2012 and 2015 following the closure of a number of coal-fired power stations, as
well as conversion of some coal-fired stations to burn biomass.
Over the same period, Tthe network annual mean concentration decreased from 1.9 µg SO2 m-3 in 2000 to 0.25 µg SO2 m
-3 in 10
2015 (mean of 12 sites), continuing the long-term decline in SO2 concentrations observed at the background Eskdalemuir site
(Sect. 3.1.33.5) and across the UK (ROTAP 2012). The relative trends in SO2 emissions and concentrations tracked each other
closely for all the time periods considered and it is clear that these decreases are highly correlated (Figure 14). In the case of
particulate SO42- however, there is an apparent “gap” between emissions and concentrations in the trend normalised against
the year 2000. Like NO3-, re-analysis of the same annual data normalised against 2001 instead of 2000 takes the relative trend 15
line for SO42- closer to the trend lines in both SO2 emissions and concentrations (Figure 14), thus again highlighting the
potential bias in the use of a measured value at a specific time point in trend assessments when there is substantial inter-annual
variability in the data.
From the MK trend analysis, the decrease in annual mean SO2 concentrations of –81 % (MK, LR = –84 %) between (2000–20
2015, n = 12) (Table 5), and –60 % (MK and LR) between (2006 – 2015, n = 30) (Figure 15, Table 4Table 6) are consistent
with the substantial reduction of –80 % and –64 % in SO2 emissions over the two overlapping periods, respectively (Figure
16; Table 7Table 5). The decrease in both emissions and concentrations SO2 is also almost twice as large as HNO3 (Table 5),
illustrating the greater success in mitigating sulphur than nitrogen and the increasing dominance of N components in the
atmosphere compared with S, with larger decline in SO2 than NOx. 25
At the same time, the reduction in SO2 emission and measured concentration is accompanied by a smaller negative trend in
particulate SO42- (2000-2015: –69 % MK/ -70 % LR; 2006-2015: –54 % MK / –53 % LR) (Table 5; Table 7Table 5), with
concentrations falling 3-fold from an annual mean of 1.2 µg SO42- m-3 in 2000 to 0.42 µg SO4
2- m-3 in 2015. The smaller
decrease in particulate SO42-compared with its gaseous precursor, SO2, is similar to that observed at Eskdalemuir (Sect. 30
3.53.1.3). A similar picture is also seen in Europe, where atmospheric concentrations of gas phase SO2 decreased by about 92
% compared with a smaller reduction of 65 % in particulate SO42- in response to sulphur emissions abatement over the 1990-
2012 period in the EMEP region (EMEP 2016). The ratio of SO2:SO42- is also seen to show a decreasing trend over time

30
(Figure 16), with the largest change occurring between 2000 and 2006 that matches the period of largest decline in SO2
emissions.
Sea salt SO42- (ss_SO4) aerosol, as discussed in section 3.5, makes up a significant fraction of the total SO4
2-. It is possible that
the smaller reduction in particulate SO42-, compared with SO2, may be explained by an underlying increase in the relative 5
proportion of ss_SO4 to total SO42-. To assess the contribution of ss_SO4 to the observed trends in total SO4
2-, ss_SO4
concentrations (estimated according Equation 4 described in Sect. 3.5) and nss_SO4- (= total SO42- – ss_SO4) are compared
with the long-term trends in total SO42- in Figure 17. Overall, there is no apparent trend in the long-term annual mean ss_SO4
data, with concentrations in range of 0.16 to 0.21 µg SO42-. Since ss_SO4 is derived from an empirical relationship with Na+
(Sect. 3.5), the long-term trend data for Na+ is also included in the analysis (Figure 17). Similar to ss_SO4, there is no overall 10
trend in the Na+ data, with small inter-annual variability and annual mean concentrations in the range of 0.65 – 0.85 µg Na+
m-3. ss_SO4 made up just 10% of the total SO42- in 2000, but by 2015, this had increased to just over 50% due to the decrease
in nss_SO4 over that time. MK analysis of the nss_SO4 (Table 4) showed decrease in concentrations of –78 % (2000-2015)
and –62% (2006-2015), similar to that observed in SO2 (–81 %: 2000 –2015 and –60 %: 2006 – 2015), indicating a closer
relationship between nss_SO4 and SO2 than between total SO42- and SO2. 15
<INSERT Figure 17Figure 17 HERE>
3.8.3 Trends in HCl and Cl- vs HCl emissions 20
HCl emissions in the UK also decreased substantially by 89 % between 2000 and 2015, from 82 kt to 9 kt in 2015 (NAEI
2018), contrasting with a smaller, but non-significant decreasing trend in HCl concentrations (Figure 14, Figure 15, Table 5).
The annual mean monitored concentrations in HCl over this period decreased from 0.30 µg HCl m-3 in 2000 to 0.19 µg HCl
m-3 in 2015. Most of the reduction in HCl emissions occurred before 2006 (−79%, from 82kt in 2000 to 17kt in 2006), with
emissions plateauing since 2006 (NAEI, 2018) (Figure 14). A corresponding decrease is not seen in the HCl measurement 25
data, where concentrations remained fairly stable at between 0.31 µg m-3 HCl in 2000 to 0.33 µg m-3 HCl in 2006. Since 2006
however, the relative change in HCl emissions is closely tracked by changes in concentrations of both the annual mean data
from the original 12 sites and from the expanded 30 sites in the AGANet, with the small peak in HCl emissions in 2013 also
captured in the annual mean data. This part of the time series therefore clearly shows a direct relationship between emissions
and concentrations. 30
So why is the most significant fall in HCl emissions between 2000 and 2006 not captured by the network? HCl are mainly
released as point sources. Coal burning, particularly from coal-fired power stations, is responsible for the majority of UK
Formatted: Font: Bold

31
emissions: 92 % in 1990 and 76 % in 2015 and reductions in HCl emissions in the UK inventory is largely as a result of
declining coal use and the installation of emissions abatement measures at coal-fired power stations (implemented since 1993)
aimed at reducing S that also coincidentally reduced HCl emissions. It may be that a network of only 12 sites in the early
periods failed to capture peak emissions and changes in source areas. While there is an indicative, but non-significant
decreasing trend in HCl (2000-2015: MK = –28 %, 2006–2015: MK = –24 %), no detectable trend in particulate Cl- can be 5
seen (Table 4). Since Cl- is mainly associated with Na+ (seasalt) in the AGANet measurements (Sect. 3.5), the absence of a
trend in Cl- (Figure 15) and Na+ (Sect. 3.8.2, Figure 17) provides evidence of a constant background in seasalt in the UK
atmosphere.
3.8.4 Trends in NH3 and NH4+- vs NH3 emissions 10
By contrast, In comparison to the acid gases, there is a more modest decrease of −9 % in NH3 emissions, from 254 kt NH3 in
2000 to 231 kt NH3 in 2015 (NAEI, 2018). This is a smaller than the 30 % decrease is seen in the annually averaged NH3
concentrations at the 12 AGANet sites (2000-2015: –30 % MK/LR) (Figure 13; Table 5). This decrease is larger than the
decrease in NH3 emissions of 10 % over the same period (Figure 14, Figure 15, Table 5Table 7). A recent assessment by Tang
et al. (2018) showed that NH3 trends are highly dependent on site selection and categorisation of sites in the analysis. Aa more 15
comprehensive analysis of a larger number of sites shows smaller reductions over time, whereas. By contrast, a significant
decreasing trend in NH3 concentrations was observed in the grouped analysis of sites in areas classed as dominated by pig and
poultry emissions, contrasting againstwith an upward (non-significant) trend for sites in cattle-dominated areas. Therefore
there is a large degree of uncertainty in interpreting the trends in NH3 concentrations from a subset of just 12 sites., since NH3
emissions are dominated by agricultural emissions (> 80%) that vary hugely on a local to regional scale across the UK. 20
What the NH3 data from the 12 sites does show, however, is that there is a shift from air being dominated by SO2 towards it
being dominated by NH3,
At the same time, there is a larger decrease in particulate NH4+ concentrations (–62 % MK), contrasting with the smaller
decrease in NH3 concentrations over the period 2010–2015 (–30 % MK) (Table 4), with the NH3:NH4+ ratio also increasing
with time (Figure 16). This provides evidence for a shift in partitioning from the particulate phase NH4+ to the gaseous phase 25
NH3 in the UK data, discussed in Tang et al. (2018). The change in partitioning from particulate NH4+ to gaseous NH3 is also
occurring in other parts of Europe, where decreases in NH3 concentrations have been smaller than emission trends would
suggest, due to large decreases in SO2 emissions (Bleeker et al., 2009; Horvath et al., 2009).
3.8.5 Changes in UK chemical climate 30
Atmospheric SO2 concentrations in the UK has declined to very low levels over the 16 years of measurements in AGANet,
with annual mean concentrations in 2015 (0.25 µg SO2 m-3, n = 12) approaching that of the other acid gases HNO3 (0.21 µg
Formatted: Heading 3
Formatted: Space Before: 0 pt
32
HNO3 m-3, n = 12) and HCl (0.20 µg HCl m-3, n = 12). NH3 measured at the same time at the AGANet sites also decreased,
but to a smaller extent, to a mean concentration of 1.0 µg NH3 m-3 (n = 12) in 2015. The changes in measured concentrations
of SO2, HNO3, HCl and NH3 are consistent with the estimated decrease in emissions of SO2, NOx, HCl and NH3 since 2000.
SO2 is therefore no longer the dominant acid gas, with HNO3 and HCl together contributing a larger fraction of the total acidity
in the UK atmosphere. 5
with a rapidly changing chemical climate in terms of relative concentrations of NH3 and SO2. The ratio of annual mean
concentrations of NH3 (80 nmol m-3) to SO2 (29 nmol m-3) was 2.7 in 2000 (Figure 18). By 2015, this ratio had increased to
15 (annual mean concentrations of NH3 = 58 nmol m-3 and SO2 = 4 nmol m-3) (Figure 18). At the same time, there is a larger
decrease in NH4+ concentrations (–62 % MK / –64 % LR), contrasting with a smaller decrease in NH3 concentrations over the 10
period 2010–2015 (–30 % MK / LR) (Table 7), with the NH3:NH4+ ratio increasing with time (Figure 18). This provides
evidence for a shift in partitioning from the particulate phase NH4+ to the gaseous phase NH3 in the UK data, discussed in Tang
et al. (2018). The change in partitioning from particulate NH4+ to gaseous NH3 is also occurring in other parts of Europe, where
decreases in NH3 concentrations have been smaller than emission trends would suggest, due to large decreases in SO2 emissions
(Bleeker et al., 2009; Horvath et al., 2009). 15
Past Sstudies have shown that the increasing ratio of NH3 to SO2 in the atmosphere leads to increased dry deposition of SO2,
accelerating the decrease in atmospheric SO2 concentrations than would be achieved by emissions reduction alone (Fowler et
al., 2001,; 2009; ROTAP 2012). The dry deposition of SO2 and NH3, by uptake of the gases in a liquid film on leave surfaces,
are known to be enhanced when both gases are present in a process termed “co-deposition” (Fowler et al., 2001). Where
ambient NH3 concentrations exceed that of SO2, there is enough NH3 to neutralize acidity in the liquid film and oxidise 20
deposited SO2, and maintain large rates of deposition of SO2. Supporting evidence for enhanced deposition of SO2 in a NH3-
rich atmosphere is provided by the AGANet data that shows a more rapid decline in SO2 concentrations than SO42-, and the
negative trend in the ratio of SO2:SO42-. With changes in the relative concentrations of acid gases in the UK and across Europe
however, the deposition rates will increasingly be controlled by the NH3/combined acidity (sum of SO2, HNO3 and HCl) molar
ratio, rather than based on SO2 alone (Fowler et al., 2009). 25
<INSERT Figure 18Figure 18 HERE>
30
with a rapidly changing chemical climate in terms of relative concentrations of NH3 and SO2. To look at the UK situation, an
analysis of the molar ratios of NH3 to acid gases is presented in Figure 18a. The molar ratio of NH3 to acid gases (sum of SO2,
HNO3 and HCl) increased with time, from 1.9 in 2000 to 4.7 in 2015, confirming that NH3 is increasingly in molar excess over
Field Code Changed
Field Code Changed
Field Code Changed
Field Code Changed
Formatted: Space Before: 0 pt
Field Code Changed
Formatted: Font: Bold
Field Code Changed
33
atmospheric acidity. The ratio of annual mean concentrations of NH3 (80 nmol m-3) to SO2 (29 nmol m-3) was 2.7 in 2000
(Figure 18). By 2015, this ratio had increased to 15 (annual mean concentrations of NH3 = 58 nmol m-3 cfand SO2 = 4 nmol
m-3) (Figure 18). . Molar concentrations of HNO3 (4 nmol m-3) and HCl (6 nmol m-3) were comparable to SO2 in 2015,
highlighting the increasing importance of HNO3 and HCl in contributing to atmospheric acidity. A larger decrease in SO2 (−81
%) than particulate sulphate (−69 %) in the AGANet data (Table 4) would appear at first to suggest that the large NH3:SO2 5
ratio is contributing to a more rapid decrease in SO2 concentrations. However, when the seasalt fraction of SO42- is removed
from the sulphate trend (Sect. 3.8.2), the decrease in NSS_SO4 (−78%) is similar to SO2 (−81%) (Table 4). Since the decreasing
trend in the ratio of SO2 to SO42- also appeared to stabilise after 2006 (Sect. 3.8.2), this would suggest that maximum deposition
rates for SO2 may have been reached with the smaller SO2 concentrations since 2006.
10
At the same time, there is a larger decrease in NH4+ concentrations (–62 % MK / –64 % LR), contrasting with a smaller
decrease in NH3 concentrations over the period 2010–2015 (–30 % MK / LR) (Table 7), with the NH3:NH4+ ratio increasing
with time (Figure 18). This provides evidence for a shift in partitioning from the particulate phase NH4+ to the gaseous phase
NH3 in the UK data, discussed in Tang et al. (2018). The change in partitioning from particulate NH4+ to gaseous NH3 is also
occurring in other parts of Europe, where decreases in NH3 concentrations have been smaller than emission trends would 15
suggest, due to large decreases in SO2 emissions (Bleeker et al., 2009; Horvath et al., 2009).
The substantial decrease in UK SO2 emissions and concentrations, while UK NOx emissions and concentrations remain
relatively high in comparison, set against a much smaller decrease in NH3 emissions and concentrations since 2000 is leading
to changes in the respective particulate SO42-, NO3
- and NH4+ concentrations. Since the affinity of H2SO4 (oxidation product
of SO2) for NH3 is much larger than that of HNO3 and HCl, available NH3 is first taken up by H2SO4 to form ammonium 20
sulphate compounds (NH4HSO4 and (NH4)2SO4), with any excess NH3 then available to react with HNO3 and HCl to form
NH4NO3 and NH4Cl. Analysis of the different particulate components in section 3.5 showed that the ammonium aerosols are
mainly made up of (NH4)2SO4 and NH4NO3. With the large reduction in SO2, more NH3 is available to react with HNO3 to
form NH4NO3 and concentrations of NH4+ and NO3
- are now observed to be in molar excess over SO42-, providing evidence
of a change in the particulate phase from (NH4)2SO4 to NH4NO3 (Figure 18b). 25
The increase in ratio of HNO3:NO3- is similar to changes in upward trend in gas-aerosol partitioning between NH3 and NH4
+
over time (Figure 18). The negative trend in ratio of SO2:SO42-, contrasting with the positive trend in ratio of HNO3:NO3
-
(Figure 18) lends further support that reduction in SO2 emissions is contributing to a more rapid decrease in particulate
(NH4)2SO4 concentrations, as more NH3 becomes available to react with HNO3 to form the NH4NO3, A change to an NH4NO3
rich atmosphere may account for the smaller negative trend in particulate NO3- observed here. 30
A change to an NH4NO3 rich atmosphere and the potential for NH4NO3 to release NH3 and HNO3 in warm weather, together
with the surfeit of NH3 also means that a larger fraction of the reduced and oxidised N is remaining in the gas phase as NH3
and HNO3. An increased partitioning to the gas phase may account for the larger decrease in particulate NH4+ (MK −62%
Formatted: Normal
Formatted: Space Before: 0 pt

34
between 2000-2015, n = 12) and NO3- (MK −52% between 2000-2015, n = 12) than NH3 (MK −30% between 2000-2015, n =
12) and HNO3 (MK −45 % between 2000-2015, n = 12) (Table 4) and the increase in gas to aerosol ratios (NH3:NH4+ and
HNO3:NO3-) over the 16 year period (Figure 16). A higher concentration of the gas-phase NH3 and HNO3 may therefore be
maintained in the atmosphere than expected on the basis of the emissions trends in NH3 and NOx. Given the larger deposition
velocities of NH3 and HNO3 compared to aerosols, more of the NH3 and HNO3 emitted will have the potential to deposit more 5
locally with a smaller footprint within the UK.
Currently, the critical loads of acidity (sulphur and nitrogen) are exceeded by 44 % of the area of sensitive habitats in the UK 10
(based on mean deposition data for 2012-2014), whereas the figure for exceedance of eutrophication (nutrient nitrogen) is even
larger, at 62 % (based on deposition data for 2012 – 2014) (Hall & Smith, 2016). Air quality policies have been very successful
in abating SO2 emissions (–80 %: between 2000 – 2015) and moderately successful with NOx emissions (–58 %: between
2000 – 2015), with both on course to meet the emission reduction targets set out under the 2012 Gothenburg protocol and 2016
NECD. Difficulties in abating There remains however little political will to reduce emissions of NH3. is reflected in the smaller 15
reduction in NH3 emissions (–9 %: 2000 – 2015), with emissions increasing, rather than decreasing since 2013 and Since
estimated emissions of NH3 decreased by only 10 % over the same period, it is likely that abatement measures may be required
to meet emission reduction targets. In recognising the need to tackle the ammonia problem, the Code of Good Agricultural
Practice (COGAP) was published under the UK government’s Clean Air Strategy (launched in July 2018) as a step towards
reducing NH3 emissions from agriculture. 20
At the same time, results from the AGANet show a change in the particulate phase from (NH4)2SO4 to NH4NO3. This change
is expected to increase residence times of NH3 and HNO3 in the atmosphere, as the semi-volatile NH4NO3 will volatilise in
warm weather to release HNO3 and NH3. A higher concentration of the gas-phase nitrogen species (HNO3 and NH3) may
therefore be maintained in the atmosphere than expected on the basis of the emissions trends in NOx and NH3. More of the
NH3 and NOx emitted will deposit more locally with a smaller footprint within the UK. 25
Based on the current emission trends and evidence from AGANet and NAMN long-term measurements, atmospheric N
deposition from oxidised N (NOx, HNO3 and NO3-) and from reduced N (NH3, NH4
+) are likely to continue to exceed critical
loads of N deposition over large areas of sensitive habitats, with implications for UK’s commitment to maintain or restore
natural habitats (e.g. Natura 2000 sites; Hallsworth et al., 2010) to a favourable conservation status under the EU Habitats
Directive (Council Directive 92/43/EEC) and ecosystem monitoring under Article 9 and Annex V of Directive 2016/2284 30
(NECD). The changes are also relevant for human health effects assessments, since NH4NO3 and (NH4)2SO4 are mainly in the
fine mode and constitute a significant fraction of PM2.5 that are associated with acute and chronic human health problems. The
change in partitioning from (NH4)2SO4 to NH4NO3, coupled to import of NH4NO3 from long-range transport (driven by
Formatted: Not Superscript/ Subscript
Formatted: Subscript

35
emissions of NH3 and NOx from outside the UK) poses policy challenges in protection of human health from effects of air
pollution, particularly in urban areas where concentrations of the PM2.5 precursor gases NOx, SO2 and NH3 are higher.
4 Conclusions
The UK Acid Gases and Aerosol network (AGANet) is delivering, uniquely, a comprehensive UK long-term dataset of 5
speciated acid gases (HNO3, SO2, HCl) and aerosol components (NO3-, SO4
2-, Cl-, Na+, Ca2+, Mg2+) and also of NH3 and NH4+
measured within the National Ammonia Monitoring Network (NAMN). Speciated measurements are made with an established
low-cost DELTA denuder-filter pack methodology, allowing assessment of atmospheric chemical composition and gas-aerosol
phase interactions. Other manual denuder-filter implementations designed for high time-resolution measurements are useful
at selected locations for detailed analysis and model testing, but they are resource intensive and expensive. The DELTA 10
monthly measurements on the other hand are cost-efficient for estimating annual mean concentrations, providing sufficient
resolution for analysis of temporal trends and which can be operated at a large number of sites in the network to provide long-
term trends and temporal/spatial patterns.
Large regional patterns in concentrations are observed, with the largest concentrations of HNO3, SO2, and aerosol NO3- and 15
SO42- in south and east England, attributed to anthropogenic (combustion, vehicular) and long-range transboundary sources
from Europe, and smallest in western Scotland and Northern Ireland. HCl concentrations are also largest in the southeast, and
southwest and central of England, attributed to dual contribution from anthropogenic (coal combustion) and marine sources
(reaction of sea salt with HNO3 and H2SO4 to form HCl) from coal combustion. For Cl-, this has a similar spatial distribution
as Na+, with highest concentrations of at coastal sites, reflecting their origin from marine sources (sea salt). 20
Distinctive temporal trends are established for the different components, with the seasonal variability influenced by local to
regional emissions, climate, meteorology and photochemistry. A weak seasonal cycle is observed in HNO3, with slightly higher
concentrations in late winter and early spring, due to formation from photochemical production processes. Particulate NO3-
and SO42- have highest concentrations in spring, coinciding with the peak in concentrations of NH3 and NH4
+, and are therefore 25
likely to be attributed to formation of NH4NO3 and (NH4)2SO4 from reaction with a surplus of higher concentrations of NH3
at that time of yearHNO3 and NO3- have a maximum during late spring and early summer, due to photochemical production
processes and from long-range transboundary pollutant transport. SO42- concentrations also have a peak in spring-time,
coinciding with the peak in concentrations of NH3 and NH4+, and is therefore likely to be attributed to formation of (NH4)2SO4
from reaction with a surplus of higher concentrations of NH3 at that time of year. Conversely, peak concentrations of SO2, Na+ 30
and Cl- occur during winter, likely from combustion processes (heating) for SO2 and marine sources in winter (more stormy
weather) for sea salt generation. Magnesium and calcium are bothis a crustal elements, but which isare also present in sea salt
36
aerosols. The seasonal trend in Mg2+ is similar to Na+, with maxima during winter and minima in summer; therefore some of
the sea salt aerosol may be in the form of MgCl2. For Ca2+, the winter maxima is much less pronounced and its seasonal
variability is likely to be influenced by both crustal dust and sea salt.
Enhancement of local to regional concentrations of reactive gases and aerosols in the UK from long-range transboundary 5
transport of pollutants into the UK is highlighted by two pollution events, captured in the long-term AGANet monthly
measurements. In 2003, a spring episode with elevated concentrations of HNO3 and NO3- was driven by meteorology, with
easterly winds transporting NH4NO3 formed in Europe into the UK and a high pressure system over the UK (Feb-April) that
led to a build-up of NH4NO3 and HNO3 concentrations from both local and transboundary sources. A second, but smaller
episode of elevated concentrations of SO2 and HNO3, as well as of particulate SO42, NO3
- and NH4+, in September 2014 was 10
shown to be from transport of pollutant plume from the Icelandic Holuhraun volcanic eruptions at that time.
After more than 16 years of operation, the AGANet is also capturing important long-term changes in the concentrations and
partitioning between gas and aerosol of the N and S components in the atmosphere. For SO2, aA significant decreaseing trend
in annual mean SO2 concentrations of –81 % (MK, LR = –84 %) in annual mean concentrations of SO2 betweenfrom 2000 15
and– 2015 was in agreement with the estimated –80 % reduction in SO2 emissions reductions, but larger than the accompanying
decline in particulate SO42- (–69 % MK/ -70 % LR). A more modest reduction in HNO3 (–45 % MK / –42 % LR) and particulate
NO3- (–52 % MK / –51 % LR) are consistent with the estimated 58 % decline in NOx emissions over this same period. At the
same time, NH3 measurements made under NAMN shows a shift from air being dominated by SO2 towards it being dominated
by NH3. ForThe decrease in particulate NH4+, the decrease in concentrations (–62 % MK / –64 % LR) is larger than the 20
precursor gas NH3 (2000 – 2015 = –30 % MK / LR), and larger than the estimated decline in estimated NH3 emissions of 109
%. However, it should be noted that NH3 trends are highly dependent on site selection and aaccording to an earlier assessment
made on a more comprehensive dataset from the UK NAMN. more comprehensive analysis of a larger number of sites shows
smaller reductions over time.
25
The substantial decrease in UK SO2 emissions and concentrations, while UK NOx emissions and concentrations (HNO3) remain
relatively high in comparison, set against a much smaller decrease in NH3 emissions and concentrations since 2000 is leaving
more NH3 available to react with HNO3 to form the semi-volatile particulate NH4NO3. Particulate NH4+ and NO3
- are now in
molar excess over SO42-, providing evidence of a shift in the particulate phase from (NH4)2SO4 to NH4NO3. A change to an
NH4NO3 rich atmosphere and the potential for NH4NO3 to release NH3 and HNO3 in warm weather, together with the surfeit 30
of NH3 also means that a larger fraction of the reduced and oxidised N is remaining in the gas phase as NH3 and HNO3. The
change in partitioning from particulate NH4+ to gaseous NH3 is also occurring in other parts of Europe, where decreases in
NH3 concentrations have been smaller then emission trends would suggest, due to successful mitigation in SO2 emissions. At
the same time, a change in the particulate phase from (NH4)2SO4 to NH4NO3 would contribute to slowing down the negative
Formatted: Subscript
37
trend in particulate NO3- observed here. Higher concentrations of the NH3 and HNO3 in the atmosphere will deposit more
locally, exacerbating the effects of local N deposition loads over large areas of sensitive habitats, with implications for UK’s
commitment to maintain or restore natural habitats (e.g. Natura 2000 sites) to a favourable conservation status under the EU
Habitats Directive (Council Directive 92/43/EEC). The changes are also important in terms of human effects assessment since
NH4NO3 constitute a significant fraction of PM2.5 that are implicated in acute and chronic human health effects and linked to 5
increased mortality from respiratory and cardiopulmonary diseases.
Acknowledgements
The UK AGANet and NAMN are funded by the Department for Environment, Food and Rural Affairs (Defra) and the devolved
administrations, under the UK Acid Deposition Monitoring Network (ADMN: 1999 - 2008), UK Eutrophying and Acidifying 10
Atmospheric Pollutants network (UKEAP: 2009 - present) and from supporting NERC CEH programmes. The authors
gratefully acknowledge assistance and contributions from the following: the large numbers of dedicated local site operators
without whom the monitoring work would not be possible, site owners for provision of facilities, Harwell Scientifics
Laboratory (now Environmental Scientifics Group (ESG) Ltd) for provision of chemical analysis for the AGANet between
1999 to 2009, the Centralised Analytical Chemistry facility in Lancaster (in particular Heather Carter, Darren Sleep and Philip 15
Rowland) for sample preparation and chemical analysis since 2009, and colleagues at both CEH Edinburgh (Robert Storeton-
West, Linda Love, Sarah Leeson, Matt Jones, Chris Andrews, Amy Stephens, Margaret Anderson, Ian D. Leith) and Ricardo
Energy & Environment field team (Martin Davies, Tim Bevington, Ben Davies, Chris Colbeck) for assisting in site / equipment
maintenance and data collection.
20

38
References
Aas, W., Carou, S., Alebic-Juretic, A., Aneja, V,P., Balasubramanian, R., Berge, H., Cape, J. N., Delon, C., Denmead, O.T.,
Dennis, R,L., Dentener, F., Dore, A.J., Du, E., Forti, M.C., Galy-Lacaux, C., Geupel, M., Haeuber, R., Iacoban, C., Komarov,
A,S., Kubin, E., Kulshrestha, U,C., Lamb, B., Liu, X., Patra, D.D., Pienaar, J,J., Pinho, P., Rao, P.S.P., Shen, J., Sutton, M.A.,
Theobald, M,R., Vadrevu, K,P., Vet, R.: Progress in nitrogen deposition monitoring and modelling. In: Sutton, Mark A.; 5
Mason, Kate E.; Sheppard, Lucy J.; Sverdrup, Harald; Haeuber, Richard; Hicks, W. Kevin, (eds.) Nitrogen deposition, critical
loads and biodiversity. Dordrecht, Springer, 455-463, 2014.
Allegrini, I., De Santis, F., Di Palo, V., Febo, A., Perrino, C., Possanzini, M. and Liberti, A.: Annular denuder method for
sampling reactive gases and aerosols in the atmosphere, Science of The Total Environment, 67, 1-16,
https://doi.org/10.1016/0048-9697(87)90062-3, 1987. 10
Aneja VP, Roelle PA, Murray GC, Southerland J, Erisman JW, Fowler D, Asman WAH, Patni N (2001) Atmospheric nitrogen
compounds II: emissions, transport, transformation, deposition and assessment. Atmos Environ 35:1903–1911
Ayers, G.P., Gillett, R.W., Cainey, J.M. and Dick, A.L.: Chloride and Bromide Loss from Sea salt Particles in Southern Ocean
Air, Journal of Atmospheric Chemistry, 33(3), 299-319, https://doi.org/10.1023/A:1006120205159, 1999.
AQEG, Ozone in the United Kingdom, AIR QUALITY EXPERT GROUP report prepared for: Department for Environment, 15
Food and Rural Affairs; Scottish Executive; Welsh Government; and Department of the Environment in Northern Ireland.
http://uk-air.defra.gov.uk, 2009.
AQEG, Fine Particulate Matter (PM2.5) in the United Kingdom, AIR QUALITY EXPERT GROUP report prepared for:
Department for Environment, Food and Rural Affairs; Scottish Executive; Welsh Government; and Department of the
Environment in Northern Ireland. http://uk-air.defra.gov.uk, 2012. 20
AQEG, Linking Emission Inventories and Ambient Measurements, AIR QUALITY EXPERT GROUP report prepared for:
Department for Environment, Food and Rural Affairs; Scottish Executive; Welsh Government; and Department of the
Environment in Northern Ireland. http://uk-air.defra.gov.uk, 2013a.
AQEG: Mitigation of United Kingdom PM2.5 Concentrations, AIR QUALITY EXPERT GROUP report prepared for:
Department for Environment, Food and Rural Affairs; Scottish Executive; Welsh Government; and Department of the 25
Environment in Northern Ireland. http://uk-air.defra.gov.uk, 2013b.
Bai, H., Chungsying, L., Chang, K-F. and Fang, G-C.: Sources of sampling error for field measurement of nitric acid gas by a
denuder system. Atmospheric Environment 37: 941-947, https://doi.org/10.1016/S1352-2310(02)00972-x, 2003
Bleeker, A., Sutton, M. A., Acherman, B., Alebic-Juretic, A., Aneja, V. P., Ellermann, T., Erisman, J. W., Fowler, D., Fagerli,
H., Gauger, T., Harlen, K. S., Hole, L. R., Horvath, L., Mitosinkova, M., Smith, R. I., Tang, Y. S., and van Pul, A.: Linking 30

39
Ammonia Emission Trends to Measured Concentrations and Deposition of Reduced Nitrogen at Different Scales, Atmospheric
Ammonia: Detecting Emission Changes and Environmental Impacts, edited by: Sutton, M. A., Reis, S., and Baker, S. M. H.,
123-180 pp., 2009.
Bobbink, R., Hicks, K., Galloway, J., Spranger, T., Alkemade, R., Ashmore, M., Bustamante, M., Cinderby, S., Davidson, E.,
Dentener, F., Emmett, B., Erisman, J.-W., Fenn, M., Gilliam, F., Nordin, A., Pardo, L. and De Vries, W.: Global assessment 5
of nitrogen deposition effects on terrestrial plant diversity: a synthesis. Ecological Applications, 20, 30–59. https://doi.org/
10.1890/08-1140.1, 2010.
Bower K.N., Choularton T.W., Gallagher M.W., Colvile R.N., Wells M., Beswick K.M., Wiedensohler A., Hansson H.-C.,
Svenningsson B., Swietlicki E., Wendisch M., Berner A., Kruisz C., Laj P., Facchini M.C., Fuzzi S., Bizjak M., Dollard G.,
Jones B., Acker K., Wieprecht W., Preiss M., Sutton M.A., Hargreaves K.J., Storeton-West R.L., Cape J.N. and Arends B.G. 10
: Observations and modelling of the processing of aerosol by a hill cap cloud. Atmospheric Environment, 31, 2527-2544, 1997.
Bull, K. R.: The critical loads/levels approach to gaseous pollutant emission control, Environmental Pollution, 69, 105-123,
https://doi.org/10.1016/0269-7491(91)90137-L, 1991.
Bull, K. R.: Critical loads — Possibilities and constraints, Water, Air, and Soil Pollution, 85, 201-212, https://doi.org/
10.1007/bf00483701, 1995. 15
Bytnerowicz, A., Sanz, M. J., Arbaugh, M. J., Padgett, P. E., Jones, D. P. and Davila, A.: Passive sampler for monitoring
ambient nitric acid (HNO3) and nitrous acid (HNO2) concentrations, Atmospheric Environment, 39, 2655-2660, https://doi.org/
10.1016/j.atmosenv.2005.01.018, 2005.
Cape, J N., van der Eerden, L. J., Sheppard, L. J., Leith, I. D. and Sutton, M. A.: Evidence for changing the Critical Level for
ammonia. Environmental Pollution, 157 (3), 1033-1037, https://doi.org/10.1016/j.envpol.2008.09.049, 2009. 20
Chatfield, C.: The analysis of time series: an introduction. CRC press, 2016.
Chemel, C., Sokhi, R.S., Yu, Y., Hayman, G.D., Vincent, K.J., Fore, A.J., Tang, Y.S., Prain, H.D.and Fisher, B.E.A.:
Evaluation of a CMAQ simulation at high resolution over the UK for the calendar year 2003, Atmospheric Environment, 44,
2927-2939, 229-233, https://doi.org//10.1016,/j.atmosenv.3020.03.029, 2010.
Cheng, Y., Duan, F-K., He, K-B., Du, Z-Y., Zheng, M. and Ma, Y-L.: Sampling artifacts of organic and inorganic aerosol: 25
Implications for the speciation measurement of particulate matter, Atmospheric Environment, 55, 229-233,
https://doi.org//10.1016 j.atmosenv.2012.03.032, 2012.
Colette, A., Aas, W., Banin, L., Braban, C.F., Ferm, M., González Ortiz, A., Ilyin, I., Mar, K., Pandolfi, M., Putaud, J.-P.,
Shatalov, V., Solberg, S., Spindler, G., Tarasova, O., Vana, M., Adani, M., Almodovar, P., Berton, E., Bessagnet, B., Bohlin-
Nizzetto, P., Boruvkova, J., Breivik, K., Briganti, G., Cappelletti, A., Cuvelier, K., Derwent, R., D'Isidoro, M., Fagerli, H., 30
40
Funk, C., Garcia Vivanco, M., González Ortiz, A., Haeuber, R., Hueglin, C., Jenkins, S., Kerr, J., de Leeuw, F., Lynch, J.,
Manders, A., Mircea, M., Pay, M.T., Pritula, D., Putaud, J.-P., Querol, X., Raffort,V., Reiss, I., Roustan, Y., Sauvage, S.,
Scavo, K., Simpson, D., Smith, R.I., Tang, Y.S., Theobald, M., Tørseth, K., Tsyro, S., van Pul, A., Vidic, S., Wallasch, M.,
and Wind, P.: Air pollution trends in the EMEP region between 1990 and 2012, EMEP/CCC-Report 1/2016, Joint Report of
the EMEP Task Force on Measurements and Modelling (TFMM), Chemical Co-ordinating Centre (CCC), Meteorological 5
Synthesizing Centre-East (MSC-E), Meteorological Synthesizing Centre-West (MSC-W), ISBN 978-82-425-2834-6.
http://hdl.handle.net/11250/2393346, 2016.
Conolly, C., Davies, M., Knight, D., Vincent, K., Sanocka, A., Lingard, J., Richie, S., Donovan, B., Collings, A., Braban, C.,
Tang, Y. S., Stephens, A., Twigg, M., Jones, M., Simmons, I., Coyle, C., Kentisbeer, J., Leeson, S., van Dijk, N., Nemitz, E.,
Langford, B., Bealey, W., Leaver, D., Poskitt, J., Carter, H., Thacker, S., Patel, M., Keenan, P., Pereira, G., Lawlor, A., 10
Warwick, A., Farrand, P. and Sutton, M. A.: UK Eutrophying and Acidifying Atmospheric Pollutants (UKEAP) Annual Report
2015, 2016.
Cowling, E. B., Erisman, J. W., Smeulders, S. M., Holman, S. C. and Nicholson, B. M.: Optimizing air quality management
in Europe and North America: Justification for integrated management of both oxidized and reduced forms of nitrogen,
Environmental Pollution, 102, 599-608, https://doi.org/10.1016/S0269-7491(98)80088-2, 1998. 15
Defra, Trends in UK sulphur dioxide, nitrogen oxides, non-methane volatile organic compounds, ammonia and particulate
matter (PM10, PM2.5) emissions, National Statistics, Release data: 21-Dec-2016, Environment Statistics Service, Department
for Environment, Food and Rural Affairs, Area 2C Nobel House, 17 Smith Square, London SW1P 3JR, 08459 33 55 77,
http://www.defra.gov.uk/statistics/environment/air-quality/, last accessed 22/03/17, 2017
Dentener, F., Drevet, J., Lamarque, J. F., Bey, I., Eickhout, B., Fiore, A. M., Hauglustaine, D., Horowitz, L. W., Krol, M., 20
Kulshrestha, U. C., Lawrence, M., Galy-Lacaux, C., Rast, S., Shindell, D., Stevenson, D., Van Noije, T., Atherton, C., Bell,
N., Bergman, D., Butler, T., Cofala, J., Collins, B., Doherty, R., Ellingsen, K., Galloway, J., Gauss, M., Montanaro, V., Müller,
J. F., Pitari, G., Rodriguez, J., Sanderson, M., Solmon, F., Strahan, S., Schultz, M., Sudo, K., Szopa, S., Wild, O.: Nitrogen
and sulfur deposition on regional and global scales: A multimodel evaluation, Global Biogeochem. Cycles, 20, GB4003,
https://doi.org/10.1029/2005GB002672, 2006. 25
Dore, A. J., Carslaw, D. C., Braban, C., Cain, M., Chemel, C., Conolly, C., Derwent, R. G., Griffiths, S. J., Hall, J., Hayman,
G., Lawrence, S., Metcalfe, S. E., Redington, A., Simpson, D., Sutton, M. A., Sutton, P., Tang, Y. S., Vieno, M., Werner, M.,
and Whyatt, J. D.: Evaluation of the performance of different atmospheric chemical transport models and inter-comparison of
nitrogen and sulphur deposition estimates for the UK, Atmospheric Environment, 119, 131-143,
https://doi.org/10.1016/j.atmosenv2015.08.008, 2015. 30
EEA, Air quality in Europe 2017, Report No 13/2017, published 11 Oct 2017. https://www.eea.europa.eu/publications/air-
quality-in-europe-2017, last accessed 22/03/17, 2017.

41
EMEP, EMEP Manual for Sampling and Analysis. Revised February 2014, www.nilu.no/projects/ccc/manual/, 2014.
EMEP, Daily filter pack data of ammonia and ammonium (TIA) and nitric acid and nitrate (TIN) for the Eskdalemuir EMEP
site, downloaded from website: http://ebas.nilu.no/. Last accessed 17/03/17, 2017a.
EMEP, SO2 and SO42- data by daily bubbler and filter pack method for the Eskdalemuir EMEP site, downloaded from website:
http://ebas.nilu.no/. Last accessed 17/03/17, 2017b. 5
EU: Directive (EU) 2016/2284 of the European Parliament and of the Council of 14 December 2016 on the reduction of
national emissions of certain atmospheric pollutants, amending Directive 2003/35/EC and repealing Directive 2001/81/EC,
2016.
Evans, C.D., Monteith, D.T., Fowler, F., Cape, J.N and Brayshaw, S.: Hydrochloric Acid: An overlooked driver of
environmental change, Environmental Science & Technology 2011 45 (5), 1887-1894, https://doi.org/10.1021/es103574u, 10
2011.
Ferm, M.: Method for determination of atmospheric ammonia, Atmospheric Environment, 13, 1385-1393,
https://doi.org/10.1016/0004-6981(79)90107-0, 1979.
Ferm, M.: A Na2CO3-coated denuder and filter for determination of gaseous HNO3 and particulate NO3- in the atmosphere,
Atmospheric Environment (1967), 20 (6), 1193-1201, https://doi.org/ 10.1016/0004-6981(86)90153-8, 1986. 15
Finn, D., Rumburg, B., Claiborn, C., Bamesberger, L., and Siems, W.F.: Sampling artifacts from the use of denuder tubes with
glycerol based coatings in the measurement of atmospheric particulate matter, Environmental Science & Technology, 35, 40-
44, https://doi.org/10.1021/es001325i, 2001.
Fitz, D. R.: Evaluation of Diffusion Denuder Coatings for Removing Acid Gases from Ambient Air. Final Report, U.S.
Environmental Protection Agency. Riverside, 2002. 20
Flechard, C. R., Nemitz, E., Smith, R. I., Fowler, D., Vermeulen, A. T., Bleeker, A., Erisman, J. W., Simpson, D., Zhang, L.,
Tang, Y. S., and Sutton, M. A.: Dry deposition of reactive nitrogen to European ecosystems: a comparison of inferential models
across the NitroEurope network, Atmospheric Chemistry and Physics, 11, 2703-2728, https://doi.org/10.5194/acp-11-2703-
2011, 2011.
Fowler, D., Sutton, M.A., Flechard, C., Cape, J.N., Storeton-West, R., Coyle, M., and Smith, R.I.: The control of SO2 dry 25
deposition on to natural surfaces by NH3 and its effects on regional deposition. Water, Air, & Soil Pollution: Focus. 1(5), 39-
48, https://doi.org/10.1023/A:1013161912231, 2001.
Fowler, D., Pilegaard, K., Sutton, M.A., Ambus, P., Raivonen, M., Duyzer, J., Simpson, D., Fagerli, H., Fuzzi, S., Schjoerring,
J.M., Granier, C., Neftel, A., Isaksen, I.S.A., Laj, P., Maione, M., Monks, P.S., Burkhardt, J., Daemmgen, U., Neirynck, J.,
Personne, E., Wichink-Kruit, R., Butterbach-Bahl, K., Flechard, C., Tuovinen, J.P., Coyle, M., Gerosa, G., Loubet, B., Altimir, 30

42
N., Gruenhage, L., Ammann, C., Cieslik, S., Paoletti, E., Mikkelsen, T.N., Ro-Poulsen, H., Cellier, P., Cape, J.N., Horváth,
L., Loreto, F., Niinemets, Ü., Palmer, P.I., Rinne, J., Misztal, P., Nemitz, E., Nilsson, D., Pryor, S., Gallagher, M.W., Vesala,
T., Skiba, U., Brüggemann, N., Zechmeister-Boltenstern, S., Williams, J., O'Dowd, C., Facchini, M.C., de Leeuw, G.,
Flossman, A., Chaumerliac, N. and Erisman, J.W.: Atmospheric composition change: Ecosystems–Atmosphere interactions,
Atmospheric Environment, 43(33), 5193-5267, https://doi.org/10.1016/j.atmosenv.2009.07.068, 2009. 5
Gilbert, R. O.: Statistical methods for environmental pollution monitoring. New York, John Wiley & Sons. 1987.
Gormley, P., and Kennedy, M.: Diffusion from a stream flowing through a cylindrical tube, Proceedings of the Royal Irish
Academy. Section A: Mathematical and Physical Sciences, 163-169, 1948.
Gregor, H.-D., Nagel, H.-D., and Posch, M.: The UN/ECE International Programme on Mapping Critical Loads and Levels,
Water, Air and Soil Pollution: Focus, 1, 5-19, https://doi.org/10.1023/a:1011503115918, 2001. 10
Hall, J. and Smith, R.: Trends in critical load exceedances in the UK – Updated June 2016, CEH Report to Defra, prepared
under contract AQ0826, version 02/06/16, 35pp, http://www.cldm.ceh.ac.uk/sites/cldm.ceh.ac.uk/files/
TrendsReport_June2015_WEB.pdf, 2016.
Hallsworth S., Dore A.J., Bealey W.J., Dragosits U., Vieno M., Hellsten S.. Tang Y.S. and M.A. Sutton M.A.: The role of
indicator choice in quantifying the threat of atmospheric ammonia to the ‘Natura 2000’ network. Environmental Science and 15
Policy, 13, 671-687, https://doi.org/10.1016/j.envsci.2010.09.010, 2010.
Hayman, G., Vincent, K.J., Lawrence, H., Smith, M., Davies, M., Sutton, M., Tang, Y.S., Dragosits, U., Love, L., Fowler, D.,
Kendall, M., and Page, H.: Management and Operation of the UK Acid Deposition Monitoring Network: Data Summary for
2004, Report produced for the Department for Environment, Food and Rural Affairs, the Scottish Executive, the Welsh
Assembly Government, and the Department of the Environment Northern Ireland. AEAT/ENV/R/2093 Issue 1. AEA 20
Technology plc, The Gemini Building, Fermi Avenue, Harwell, OX11 0QR, 2005.
Hayman, G., Lawrence, H., Vincent, K., Smith, M., Davies, M., Colbeck, C., Hasler, S., Baker, S., Stedman, J., Sansom, L.,
Page, H., and Kendall, M.: Rural Sulphur Dioxide Monitoring in the UK: Data Summary 2001-2005, Report ref: ED48204,
AEAT/ENV/R/2292 Issue 1, December 2016, 2006.
Hayman, G. D., Vincent, K., Lawrence, H., Smith, M., Colbeck, C., Davies, M., Sutton, M. A., Tang, Y. S., Dragosits, U., 25
Love, L., Fowler, D., Kendall, M., and Page, H.: Management and Operation of the UK Acid Deposition Monitoring Network:
Data Summary for 2005, AEA Energy & Environment Report AEAT/ENV/R/2342 Issue 1, AEA Technology plc, The Gemini
Building, Fermi Avenue, Harwell, OX11 0QR., 2007.
Horvath, L., and Sutton, M. A.: Long-term record of ammonia and ammonium concentrations at K-Puszta, Hungary,
Atmospheric Environment, 32, 339-344, 10.1016/s1352-2310(97)00046-0, 1998. 30
43
Ianniello, A., Spataro, F., Esposito, G., Allegrini, I., Hu, M., and Zhu, T.: Chemical characteristics of inorganic ammonium
salts in PM 2.5 in the atmosphere of Beijing (China), Atmospheric Chemistry and Physics, 11, 10803-10822,
https://doi.org/10.5194/acp-11-10803-2011, 2011.
Jones, A.M. and Harrison, R.M.: Temporal trends in sulphate concentrations at European sites and relationships to sulphur
dioxide, Atmospheric Environment, 45, 873-882, https://doi.org/10.1016/j.atmosenv.2010.11.020, 2011. 5
Keene, W. C., Pszenny, A. A. P., Galloway, J. N. and Hawley, M. E.: Sea salt corrections and interpretation of constitutent
ratios in marine precipitation. J. Geophys. Res. 91(D6), 6647-6658, https://doi.org/10.1029/JD091iD06p06647, 1986.
Kitto, N, A-M. and Harrison, R.M.: Nitrous and nitric acid measurements at sites in South-East England, Atmospheric
Environment. Part A. General Topics, 26(2), 235-241, https://doi.org/10.1016/0960-1686(92)90305-5, 1992.
Marcehtto, A., Rogora, M. and Arisci, S.: Trend analysis of atmospheric deposition data: A comparison of statistical 10
approaches, Atmospheric Environment, 64, 95-102, https://doi.org/10.1016/j.atmosenv.2012.08.020, 2013.
Meals, D.W., Spooner, J., Dressing, S.A., and Harcum, J.B., Statistical analysis for monotonic trends, Tech Notes 6, November
2011. Developed for U.S. Environmental Protection Agency by Tetra Tech, Inc., Fairfax, VA, 23 pp. Available online at
https://www.epa.gov/sites/production/files/2016-05/documents/tech_notes_6_dec2013_trend.pdf, 2011.
McLeod, A. I.: Package “Kendall”, version 2.2, Kendall rank correlation and Mann-Kendall trend test, https://cran.r-15
project.org/web/packages/Kendall/Kendall.pdf (last access: 17 February 2017), 2015.
Mihalopoulos, N., Kerminen, V.M., Kanakidou, M., Berresheim, H., and Sciare, J.: Formation of particulate sulfur species
(sulfate and methanesulfonate) during summer over the Eastern Mediterranean: A modelling approach, Atmospheric
Environment, 41(32), 6860-6871, https://doi.org/10.1016/j.atmosenv.2007.04.039, 2007.
Monteith, D., Henrys, P., Banin, L., Smith, R., Morecroft, M., Scott, T., Andrews, C., Beaumont, D., Benham, S., Bowmaker, 20
V., Corbett, S., Dick, J., Dodd, B., Dodd, N., McKenna, C., McMillan, S., Pallett, D., Pereira, M. G., Poskitt, J., Rennie, S.,
Rose, R., Schäfer, S., Sherrin, L., Tang, S., Turner, A., and Watson, H.: Trends and variability in weather and atmospheric
deposition at UK Environmental Change Network sites (1993–2012), Ecological Indicators, 68, 21-35, https://doi.org/
10.1016/j.ecolind.2016.01.061, 2016.
NAEI, http://naei.beis.gov.uk/data/data-selector-results?q=101505)?, last access: 2319 SeptemberMarch 20178, 20178. 25
O'Dowd, C.D. and de Leeuw, G.: Marine aerosol production: a review of the current knowledge, Phil. Trans. R. Soc. A, 365,
1753-1774; https://doi.org/ 10.1098/rsta.2007.2043, 2007.
Perrino, C., De Santis, F., and Febo, A.: Criteria for the choice of a denuder sampling technique devoted to the measurement
of atmospheric nirous and nitric acids, Atmospheric Environment. Part A. General Topics, 24, 617-626,
https://doi.org/10.1016/0960-1686(90)90017-H, 1990. 30
Formatted: Font color: Text 1
44
Pio, C.: Measurement of ammonia an ammonium in the atmosphere by denuder and filter pack methods. Evaluation of the
Rome Field Intercomparison Exercise, Development of Analytical Techniques for Atmospheric Pollutants. Air Pollution
Research Report, 41, 239-252, 1992.
Pohlert, T. Package “Trend”, version 0.2.0: Non-Parametric Trend Tests and Change-Point Detection, https://cran.r-
project.org/web/packages/trend/trend.pdf, 2016. 5
Pope, R.J., Butt, E.W., Chipperfield, M.P., Doherty, R.M., Fenech, S., Schmidt, A., Arnold, S.R and Savage, N.H. The impact
of synoptic weather on UK surface ozone and implications for premature mortality. Environmental Research Letters. 11,
https://doi.org/10.1088/1748-9326/11/12/124004, 2016.
Possanzini, M., Febo, A., and Liberti, A.: New design of a high-performance denuder for the sampling of atmospheric
pollutants, Atmospheric Environment (1967), 17, 2605-2610, https://doi.org/10.1016/0004-6981(83)90089-6, 1983. 10
Putaud, J.P., Van Dingenen, R., Alastuey, A., Bauer, H., Birmili, W., Cyrys, J., Flentje, H., Fuzzi, S., Gehrig, R., Hansson,
H.C. and Harrison, R.M. A European aerosol phenomenology–3: Physical and chemical characteristics of particulate matter
from 60 rural, urban, and kerbside sites across Europe. Atmospheric Environment, 44(10), 1308-1320,
https://doi.org/10.1016/j.atmosenv.2009.12.011, 2010.
ROTAP: Review of Transboundary Air Pollution: Acidification, Eutrophication, Ground Level Ozone and Heavy Metals in 15
the UK. Contract Report to the Department for Environment, Food and Rural Affairs. Centre for Ecology & Hydrology,
http://www.rotap.ceh.ac.uk/, 2012.
Roth, B., and Okada, K.: On the modification of sea-salt particles in the coastal atmosphere. Atmospheric Environment, 32,
1555–1569, 1998
Rumsey, I. C., and Walker, J. T.: Application of an online ion-chromatography-based instrument for gradient flux 20
measurements of speciated nitrogen and sulfur, Atmospheric Measurement Techniques, 9, 2581-2592,
https://doi.org/10.5194/amt-9-2581-2016, 2016.
Schmitt, A.-D. and P. Stille.: The source of calcium in wet atmospheric deposits: Ca-Sr isotope evidence, Geochimica et
Cosmochimica Acta, 69(14), 3463-3468, https://doi.org/10.1016/j.gca.2004.11.010, 2005.
Schrader, F., Schaap, M., Zöll, U., Kranenburg, R. and Brümmer, C.: The hidden cost of using low resolution concentration 25
data in the estimation of NH3 dry deposition fluxes, Nature Scientific Reports, 8:969, https://doi.org/10.1038/s41598-017-
18021-6, 2018.
Sickles, I. J. E., Hodson, L. L., and Vorburger, L. M.: Evaluation of the filter pack for long-duration sampling of ambient air,
Atmospheric Environment, 33, 2187-2202, https://doi.org/ 10.1016/S1352-2310(98)00425-7, 1999.
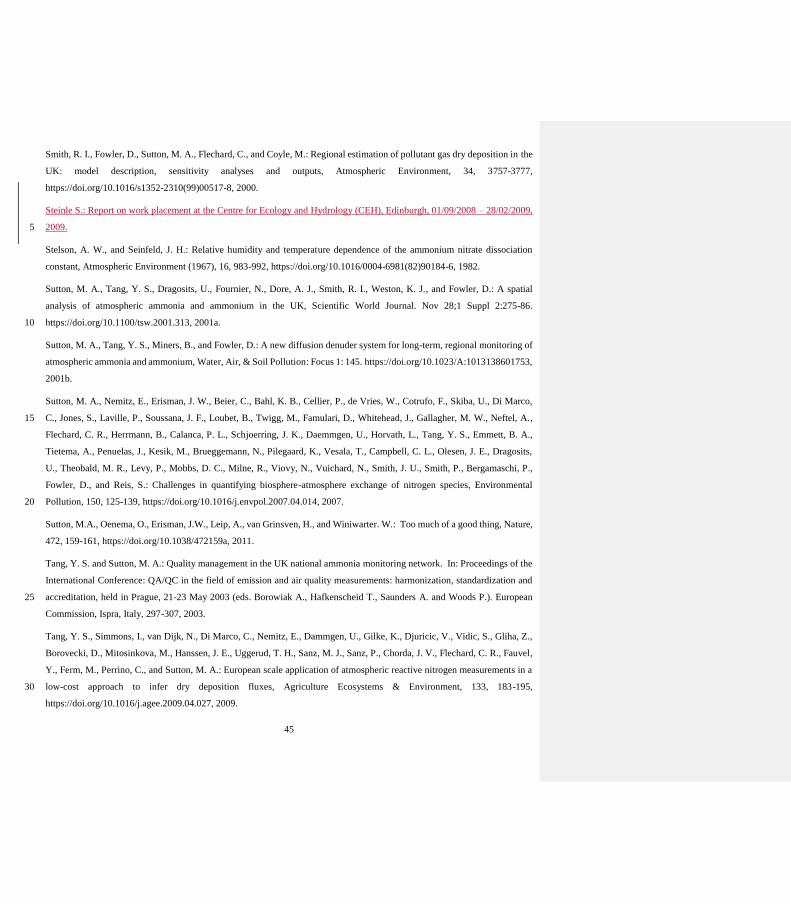
45
Smith, R. I., Fowler, D., Sutton, M. A., Flechard, C., and Coyle, M.: Regional estimation of pollutant gas dry deposition in the
UK: model description, sensitivity analyses and outputs, Atmospheric Environment, 34, 3757-3777,
https://doi.org/10.1016/s1352-2310(99)00517-8, 2000.
Steinle S.: Report on work placement at the Centre for Ecology and Hydrology (CEH), Edinburgh, 01/09/2008 – 28/02/2009,
2009. 5
Stelson, A. W., and Seinfeld, J. H.: Relative humidity and temperature dependence of the ammonium nitrate dissociation
constant, Atmospheric Environment (1967), 16, 983-992, https://doi.org/10.1016/0004-6981(82)90184-6, 1982.
Sutton, M. A., Tang, Y. S., Dragosits, U., Fournier, N., Dore, A. J., Smith, R. I., Weston, K. J., and Fowler, D.: A spatial
analysis of atmospheric ammonia and ammonium in the UK, Scientific World Journal. Nov 28;1 Suppl 2:275-86.
https://doi.org/10.1100/tsw.2001.313, 2001a. 10
Sutton, M. A., Tang, Y. S., Miners, B., and Fowler, D.: A new diffusion denuder system for long-term, regional monitoring of
atmospheric ammonia and ammonium, Water, Air, & Soil Pollution: Focus 1: 145. https://doi.org/10.1023/A:1013138601753,
2001b.
Sutton, M. A., Nemitz, E., Erisman, J. W., Beier, C., Bahl, K. B., Cellier, P., de Vries, W., Cotrufo, F., Skiba, U., Di Marco,
C., Jones, S., Laville, P., Soussana, J. F., Loubet, B., Twigg, M., Famulari, D., Whitehead, J., Gallagher, M. W., Neftel, A., 15
Flechard, C. R., Herrmann, B., Calanca, P. L., Schjoerring, J. K., Daemmgen, U., Horvath, L., Tang, Y. S., Emmett, B. A.,
Tietema, A., Penuelas, J., Kesik, M., Brueggemann, N., Pilegaard, K., Vesala, T., Campbell, C. L., Olesen, J. E., Dragosits,
U., Theobald, M. R., Levy, P., Mobbs, D. C., Milne, R., Viovy, N., Vuichard, N., Smith, J. U., Smith, P., Bergamaschi, P.,
Fowler, D., and Reis, S.: Challenges in quantifying biosphere-atmosphere exchange of nitrogen species, Environmental
Pollution, 150, 125-139, https://doi.org/10.1016/j.envpol.2007.04.014, 2007. 20
Sutton, M.A., Oenema, O., Erisman, J.W., Leip, A., van Grinsven, H., and Winiwarter. W.: Too much of a good thing, Nature,
472, 159-161, https://doi.org/10.1038/472159a, 2011.
Tang, Y. S. and Sutton, M. A.: Quality management in the UK national ammonia monitoring network. In: Proceedings of the
International Conference: QA/QC in the field of emission and air quality measurements: harmonization, standardization and
accreditation, held in Prague, 21-23 May 2003 (eds. Borowiak A., Hafkenscheid T., Saunders A. and Woods P.). European 25
Commission, Ispra, Italy, 297-307, 2003.
Tang, Y. S., Simmons, I., van Dijk, N., Di Marco, C., Nemitz, E., Dammgen, U., Gilke, K., Djuricic, V., Vidic, S., Gliha, Z.,
Borovecki, D., Mitosinkova, M., Hanssen, J. E., Uggerud, T. H., Sanz, M. J., Sanz, P., Chorda, J. V., Flechard, C. R., Fauvel,
Y., Ferm, M., Perrino, C., and Sutton, M. A.: European scale application of atmospheric reactive nitrogen measurements in a
low-cost approach to infer dry deposition fluxes, Agriculture Ecosystems & Environment, 133, 183-195, 30
https://doi.org/10.1016/j.agee.2009.04.027, 2009.

46
Tang, Y. S., Cape, J. N., Braban, C. F., Twigg, M. M., Poskitt, J., Jones, M. R., Rowland, P., Bentley, P., Hockenhull, K.,
Woods, C., Leaver, D., Simmons, I., van Dijk, N., Nemitz, E. and Sutton, M. A.: Development of a new model DELTA sampler
and assessment of potential sampling artefacts in the UKEAP AGANet DELTA system: summary and technical report.
London, Defra. (CEH Project no. C04544, C04845), https://uk-air.defra.gov.uk/library/reports?report_id=861, 2015.
Tang, Y. S., Braban, C. F., Dragosits, U., Dore, A. J., Simmons, I., van Dijk, N., Poskitt, J., Pereira, M. G., Keenan, P. O., 5
Conolly, C., Vincent, K., Smith, R. I., Heal, M. R. and Sutton, M. A.: Drivers for spatial, temporal and long-term trends in
atmospheric ammonia and ammonium in the UK, Atmospheric Chemistry and Physics, 18, 705-733,
https://doi.org/10.5194/acp-18-705-2018, 2018.
Tang, Y. S., Poskitt, J., Cape, J. N., Nemitz, E., Bealey,W. J., Leaver, D., Beith, S., Thacker, S., Simmons, I., Letho, K., Wood,
C., Pereira, G., Sutton, M. A., Davies, M., Conolly, C., Donovan, B. and Braban, C. F.: UK Eutrophying and Acidifying 10
Atmospheric Pollutant project’s Acid Gas and Aerosol Network (Data funded by Defra and the Devolved Administrations and
published under the Open Government Licence v1.0, AGANet, http://uk-air.defra.gov.uk/networks/network-
info?view=ukeap), last access: 23 March 2017, 2017a.
Tang, Y. S., Poskitt, J., Cape, J. N., Nemitz, E., Bealey,W. J., Leaver, D., Simmons, I., Wood, C., Pereira, G., Sutton, M. A.,
Davies, M., Conolly, C., Donovan, B., and Braban, C. F.: UK Eutrophying and Acidifying Atmospheric Pollutant project’s 15
National Ammonia Monitoring Network (Data funded by Defra and the Devolved Administrations and published under the
Open Government Licence v1.0, NAMN, https://uk-air.defra.gov.uk/networks/network-info?view=nh3), last access: 23 March
2017, 2017b.
Tørseth, K., Aas, W., Breivik, K., Fjæraa, A. M., Fiebig, M., Hjellbrekke, A. G., Lund Myhre, C., Solberg, S., and Yttri, K.
E.: Introduction to the European Monitoring and Evaluation Programme (EMEP) and observed atmospheric composition 20
change during 1972-2009, Atmospheric Chemistry and Physics, 12, 5447-5481, https://doi.org/10.5194/acp-12-5447-2012,
2012.
Twigg, M. M., Ilyinskaya, E., Beccaceci, S., Green, D. C., Jones, M. R., Langford, B., Leeson, S. R., Lingard, J. J. N., Pereira,
G. M., Carter, H., Poskitt, J., Richter, A., Ritchie, S., Simmons, I., Smith, R. I., Tang, Y. S., Van Dijk, N., Vincent, K., Nemitz,
E., Vieno, M., and Braban, C. F.: Impacts of the 2014–2015 Holuhraun eruption on the UK atmosphere, Atmos. Chem. Phys., 25
16, 11415-11431, https://doi.org/10.5194/acp-16-11415-2016, 2016.
UNECE, Protocol to Abate Acidification, Eutrophication and Ground-level Ozone, the 1999 Gothenburg Protocol to Abate
Acidification, Eutrophication and Ground-level Ozone, http://www.unece.org/env/lrtap/multi_h1.html, last accessed March
2018.
Vieno, M., Heal, M. R., Hallsworth, S., Famulari, D., Doherty, R. M., Dore, A. J., Tang, Y. S., Braban, C. F., Leaver, D., 30
Sutton, M. A., and Reis, S.: The role of long-range transport and domestic emissions in determining atmospheric secondary

47
inorganic particle concentrations across the UK, Atmospheric Chemistry and Physics, 14, 8435-8447,
https://doi.org//10.5194/acp-14-8435-2014, 2014.
Vieno M., Heal M.R., Twigg M.M., MacKenzie I.A., Braban C.F., Lingard J.N.N., Ritchie S., Beck R.C., Móring A., Ots R.,
Di Marco C.F., Nemitz E., Sutton M.A. and Reis S.: The UK particulate matter air pollution episode of March–April 2014:
more than Saharan dust. Environmental Research Letters 11, 044004, https://doi.org/10.1088/1748-9326/11/4/044004, 2016. 5
Werner, M., Kryza, M., Dore, A., Blas, M., Hallsworth, S., Vieno, M., Tang, Y., and Smith, R.: Modelling of marine base
cation emissions, concentrations and deposition in the UK, Atmospheric Chemistry and Physics, 11, 1023-1037,
https://doi.org/10.5194/acp-11-1023-2011, 2011.

48
Figure 1: Site map of the UK Acid Gases and Aerosol Network (AGANet). The AGANet was established in September 1999 with 12 sites
and expanded to 30 sites from January 2006 to improve national coverage. These sites also provide measurements of NH3 and NH4+ for the
UK National Ammonia Monitoring Network (NAMN, Tang et al., 2018). 5
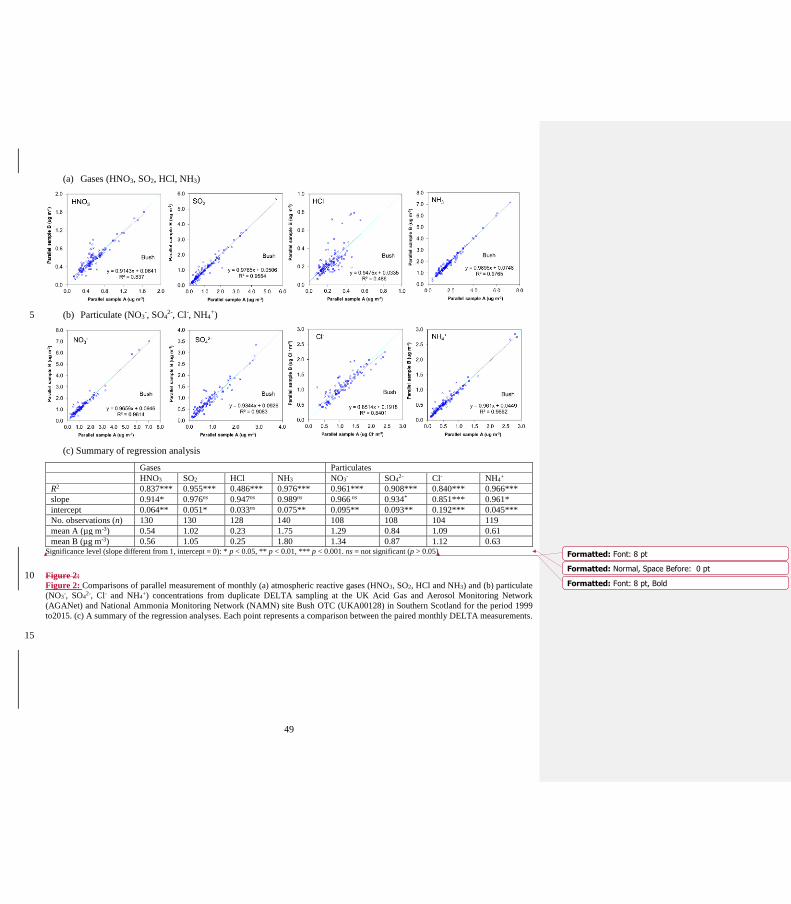
49
(a) Gases (HNO3, SO2, HCl, NH3)
(b) Particulate (NO3-, SO4
2-, Cl-, NH4+) 5
(c) Summary of regression analysis
Gases Particulates
HNO3 SO2 HCl NH3 NO3- SO4
2- Cl- NH4+
R2 0.837*** 0.955*** 0.486*** 0.976*** 0.961*** 0.908*** 0.840*** 0.966***
slope 0.914* 0.976ns 0.947ns 0.989ns 0.966 ns 0.934* 0.851*** 0.961*
intercept 0.064** 0.051* 0.033ns 0.075** 0.095** 0.093** 0.192*** 0.045***
No. observations (n) 130 130 128 140 108 108 104 119
mean A (µg m-3) 0.54 1.02 0.23 1.75 1.29 0.84 1.09 0.61
mean B (µg m-3) 0.56 1.05 0.25 1.80 1.34 0.87 1.12 0.63 Significance level (slope different from 1, intercept = 0): * p < 0.05, ** p < 0.01, *** p < 0.001. ns = not significant (p > 0.05)
Figure 2: 10 Figure 2: Comparisons of parallel measurement of monthly (a) atmospheric reactive gases (HNO3, SO2, HCl and NH3) and (b) particulate
(NO3-, SO4
2-, Cl- and NH4+) concentrations from duplicate DELTA sampling at the UK Acid Gas and Aerosol Monitoring Network
(AGANet) and National Ammonia Monitoring Network (NAMN) site Bush OTC (UKA00128) in Southern Scotland for the period 1999
to2015. (c) A summary of the regression analyses. Each point represents a comparison between the paired monthly DELTA measurements.
15
Formatted: Font: 8 pt
Formatted: Normal, Space Before: 0 pt
Formatted: Font: 8 pt, Bold
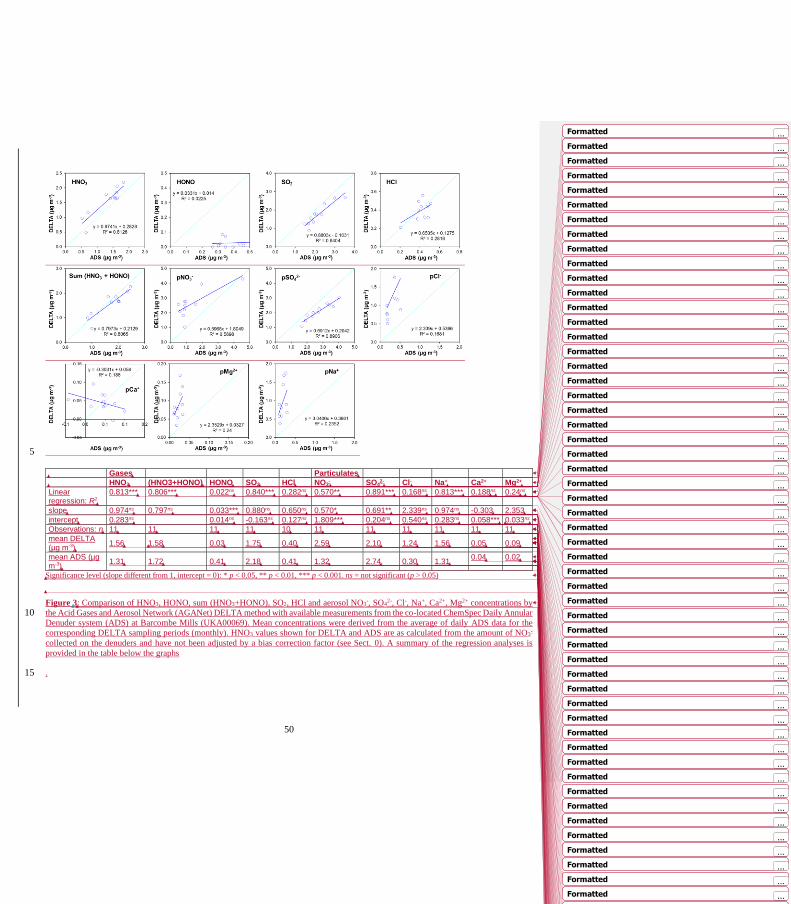
50
5
Gases Particulates
HNO3 (HNO3+HONO) HONO SO2 HCl NO3- SO4
2- Cl- Na+ Ca2+ Mg2+
Linear regression: R2
0.813*** 0.806*** 0.022ns 0.840*** 0.282ns 0.570** 0.891*** 0.168ns 0.813*** 0.188ns 0.24ns
slope 0.974ns 0.797ns 0.033*** 0.880ns 0.650ns 0.570* 0.691** 2.339ns 0.974ns -0.303 2.353
intercept 0.283ns 0.014ns -0.163ns 0.127ns 1.809*** 0.204ns 0.540ns 0.283ns 0.058*** 0.033ns
Observations: n 11 11 11 11 10 11 11 11 11 11 11
mean DELTA (µg m-3)
1.56 1.58 0.03 1.75 0.40 2.59 2.10 1.24 1.56 0.05 0.09
mean ADS (µg m-3)
1.31 1.72 0.41 2.18 0.41 1.32 2.74 0.30 1.31 0.04 0.02
Significance level (slope different from 1, intercept = 0): * p < 0.05, ** p < 0.01, *** p < 0.001. ns = not significant (p > 0.05)
Figure 3: Comparison of HNO3, HONO, sum (HNO3+HONO), SO2, HCl and aerosol NO3-, SO4
2-, Cl-, Na+, Ca2+, Mg2+ concentrations by
the Acid Gases and Aerosol Network (AGANet) DELTA method with available measurements from the co-located ChemSpec Daily Annular 10 Denuder system (ADS) at Barcombe Mills (UKA00069). Mean concentrations were derived from the average of daily ADS data for the
corresponding DELTA sampling periods (monthly). HNO3 values shown for DELTA and ADS are as calculated from the amount of NO3-
collected on the denuders and have not been adjusted by a bias correction factor (see Sect. 0). A summary of the regression analyses is
provided in the table below the graphs
. 15
Formatted ...
Formatted ...
Formatted ...
Formatted ...
Formatted ...
Formatted ...
Formatted ...
Formatted ...
Formatted ...
Formatted ...
Formatted ...
Formatted ...
Formatted ...
Formatted ...
Formatted ...
Formatted ...
Formatted ...
Formatted ...
Formatted ...
Formatted ...
Formatted ...
Formatted ...
Formatted ...
Formatted ...
Formatted ...
Formatted ...
Formatted ...
Formatted ...
Formatted ...
Formatted ...
Formatted ...
Formatted ...
Formatted ...
Formatted ...
Formatted ...
Formatted ...
Formatted ...
Formatted ...
Formatted ...
Formatted ...
Formatted ...
Formatted ...
Formatted ...
Formatted ...
Formatted ...
Formatted ...
Formatted ...
Formatted ...
Formatted ...
Formatted ...
Formatted ...
Formatted ...
Formatted ...
Formatted ...
Formatted ...
Formatted ...
Formatted ...
Formatted ...
Formatted ...
Formatted ...
Formatted ...
Formatted ...
Formatted ...
Formatted ...
Formatted ...
Formatted ...
Formatted ...
Formatted ...
Formatted ...
Formatted ...
Formatted ...
Formatted ...
Formatted Table ...
Formatted ...
Formatted ...
Formatted ...
Formatted ...
Formatted ...
Formatted ...
Formatted ...
Formatted ...
Formatted ...
Formatted ...
Formatted ...
Formatted ...
Formatted ...
Formatted ...
Formatted ...
Formatted ...
Formatted ...
Formatted ...
Formatted ...
Formatted ...
Formatted ...
Formatted ...
Formatted ...
Formatted ...
Formatted ...
Formatted ...
Formatted ...
Formatted ...
Formatted ...
Formatted ...
Formatted ...
Formatted ...
Formatted ...
Formatted ...
Formatted ...
Formatted ...
Formatted ...
Field Code Changed ...
Formatted ...

51
DELTA
TIN EMEP
TIN DELTA TIN
(corrected HNO3) EMEP
TIN DELTA
TIA EMEP
TIA
Linear regression: R2 0.942*** 0.953*** 0.895***
slope 0.984ns 0.835* 0.879ns
intercept 0.015ns 0.004ns 0.088ns
mean (µg N m-3) 0.23 0.22 0.19 0.22 0.58 0.54
No. of observations (n) 13 13 13 13 13 13
Significance level (slope different from 1, intercept = 0): * p < 0.05, ** p < 0.01, *** p < 0.001. ns = not significant (p > 0.05) 5
Figure 3:
Figure 4: Comparison of (a) total inorganic nitrate, TIN (sum of HNO3 + NO3-) and (b) total inorganic ammonium, TIA (sum of NH3 +
NH4+) concentrations at the Eskdalemuir monitoring station (EMEP station code = GB0002R; UK-AIR ID = UKA00130) measured under
the EMEP program with concentrations of the corresponding gas and aerosol from the UK Acid Gases and Aerosol (AGANet, HNO3 and
NO3-) and UK National Ammonia Monitoring Network (NAMN, NH3 and NH4
+). EMEP values (data downloaded from http://ebas.nilu.no/) 10 are means of daily measurements for TIN and TIA by the EMEP filter pack method, matched to the AGANet and NAMN sampling periods
(monthly). Filter pack measurements at Eskdalemuir terminated in December 2000. A summary of the regression analyses is provided in the
table below the graphs.
15
Formatted: Font: 8 pt
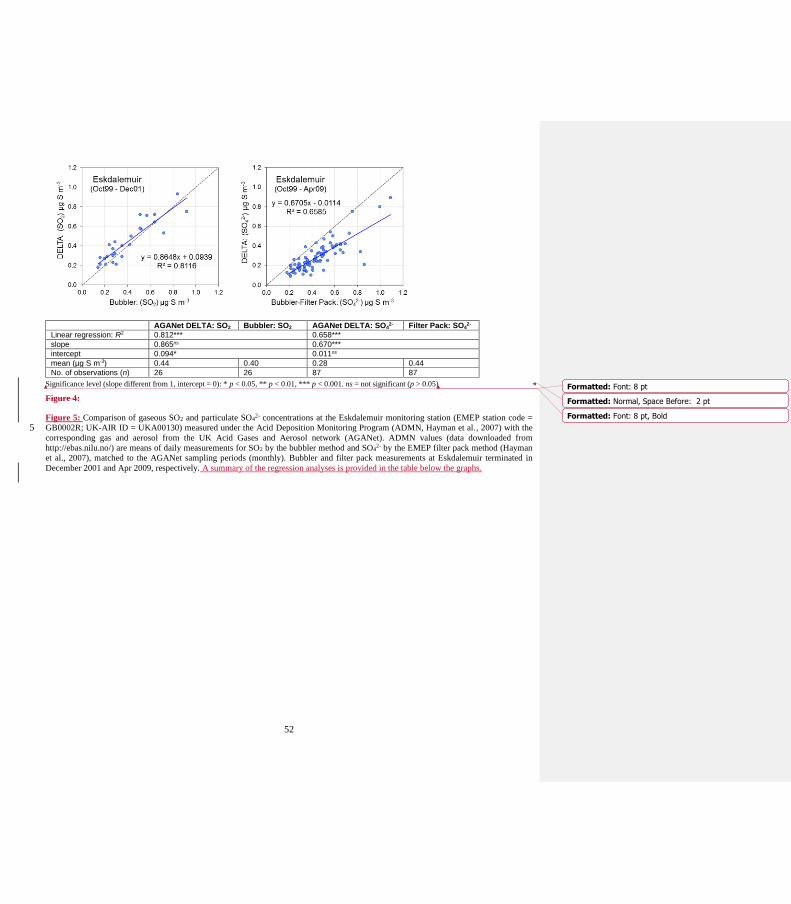
52
AGANet DELTA: SO2 Bubbler: SO2 AGANet DELTA: SO42- Filter Pack: SO4
2-
Linear regression: R2 0.812*** 0.658***
slope 0.865ns 0.670***
intercept 0.094* 0.011ns
mean (µg S m-3) 0.44 0.40 0.28 0.44
No. of observations (n) 26 26 87 87
Significance level (slope different from 1, intercept = 0): * p < 0.05, ** p < 0.01, *** p < 0.001. ns = not significant (p > 0.05)
Figure 4:
Figure 5: Comparison of gaseous SO2 and particulate SO42- concentrations at the Eskdalemuir monitoring station (EMEP station code =
GB0002R; UK-AIR ID = UKA00130) measured under the Acid Deposition Monitoring Program (ADMN, Hayman et al., 2007) with the 5 corresponding gas and aerosol from the UK Acid Gases and Aerosol network (AGANet). ADMN values (data downloaded from
http://ebas.nilu.no/) are means of daily measurements for SO2 by the bubbler method and SO42- by the EMEP filter pack method (Hayman
et al., 2007), matched to the AGANet sampling periods (monthly). Bubbler and filter pack measurements at Eskdalemuir terminated in
December 2001 and Apr 2009, respectively. A summary of the regression analyses is provided in the table below the graphs.
Formatted: Font: 8 pt
Formatted: Normal, Space Before: 2 pt
Formatted: Font: 8 pt, Bold
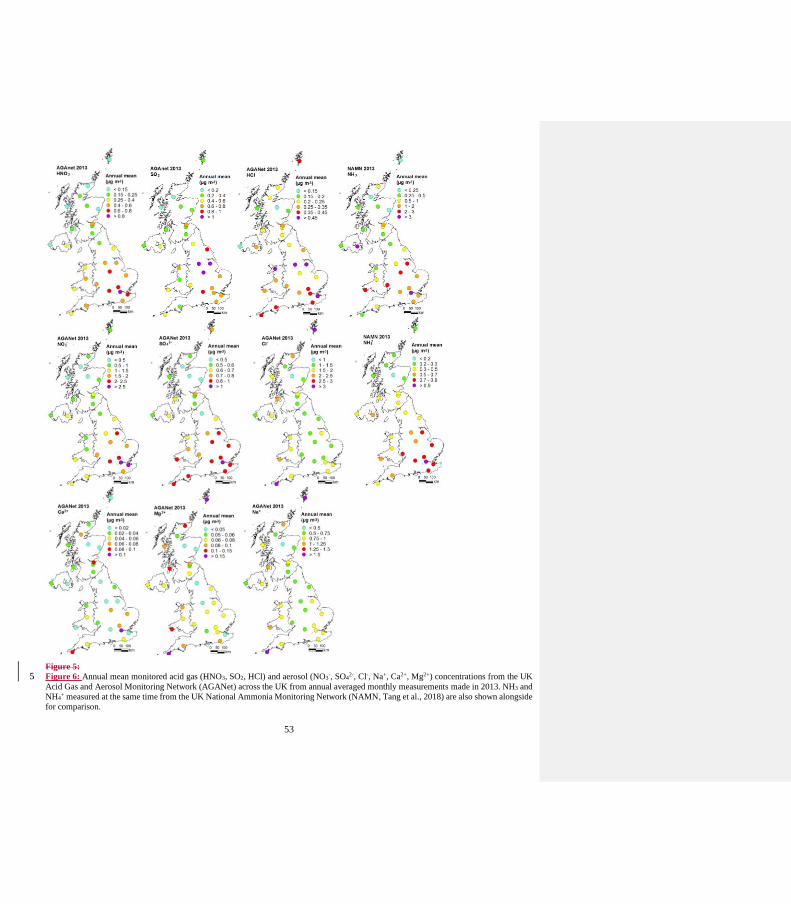
53
Figure 5:
Figure 6: Annual mean monitored acid gas (HNO3, SO2, HCl) and aerosol (NO3-, SO4
2-, Cl-, Na+, Ca2+, Mg2+) concentrations from the UK 5 Acid Gas and Aerosol Monitoring Network (AGANet) across the UK from annual averaged monthly measurements made in 2013. NH3 and
NH4+ measured at the same time from the UK National Ammonia Monitoring Network (NAMN, Tang et al., 2018) are also shown alongside
for comparison.

54
(a) Gaseous components
(b) Particulate components
5
Figure 6:
Figure 7: Scatter plots between concentrations of (a) gaseous species HNO3, SO2 and NH3, and (b) particulate species NO3-, SO4
2-, NH4+,
Cl- and Na+ from mean monthly measurements (1999-2015) from the 12 sites in the UK Acid Gas and Aerosol Monitoring Network
(AGANet) that were operational over the whole period. NH3 and NH4+ data are from the UK National Ammonia Monitoring Network 10
(NAMN, Tang et al., 2018) made at the same time. Each data point represents a single monthly DELTA measurement.

55
Figure 7: Figure 8: Average annual cycles for HNO3, SO2, HCl and aerosol NO3-, SO4
2-, Cl-, Na+, Ca2+ and Mg2+ from the UK Acid 5 Gases and Aerosol Monitoring Network (AGANet). The NH3 and NH4
+ concentrations measured at the same time in the UK National
Ammonia Monitoring Network (NAMN, Tang et al., 2018) are also shown for comparison. Each data point in the graphs represents
the mean ± SD of monthly measurements of all sites in the network.
Formatted: Check spelling and grammar
Field Code Changed
Formatted: Font: Not Bold
Formatted: Caption,Legend

56
Figure 8: 5
Figure 9: Average annual cycles in the ratios of gas:aerosol component concentrations (µg m-3). HNO3, SO2, HCl and aerosol NO3-, SO4
2-
, Cl- data (annual mean, µg m-3) are from the UK Acid Gases and Aerosol Monitoring Network (AGANet). NH3 and NH4+ dataconcentrations
(annual mean, µg m-3) that are measured at the same time for the UK National Ammonia Monitoring Network (NAMN, Tang et al., 2018)
are also shown for comparison. Each data point in the graphs represents the mean ± 95% confidence interval (CI)SD of monthly
measurements of 12 sites operational in the network over the period 2000 to 2015. 10
Formatted: Font: Not Bold
Formatted: Normal
Formatted: Font: Not Bold
Formatted: Caption Char,Legend Char
Formatted: Caption Char,Legend Char, Subscript
Formatted: Caption Char,Legend Char
Formatted: Caption Char,Legend Char, Subscript
Formatted: Caption Char,Legend Char
Formatted: Caption Char,Legend Char, Subscript
Formatted: Caption Char,Legend Char, Superscript
Formatted: Caption Char,Legend Char
Formatted: Caption Char,Legend Char, Subscript
Formatted: Caption Char,Legend Char, Superscript
Formatted: Caption Char,Legend Char
Formatted: Caption Char,Legend Char, Superscript
Formatted: Caption Char,Legend Char
Formatted: Caption Char,Legend Char, Subscript
Formatted: Caption Char,Legend Char
Formatted: Caption Char,Legend Char, Subscript
Formatted: Caption Char,Legend Char, Superscript
Formatted: Caption Char,Legend Char

57
Formatted: Font: Not Bold

58
5
Figure 9:
Figure 10: Monthly mean concentrations in gaseous HNO3, SO2, HCl and aerosol NO3-, SO4
2-, Cl- from the UK Acid Gases and Aerosol
Monitoring Network (AGANet). Monthly mean concentrations of NH3 and NH4+ that were measured at the same time in the UK National
Ammonia Monitoring Network (NAMN, Tang et al., 2018) are also shown for comparison. Each data point in the graphs represents the
mean of monthly measurements of 12 sites operational in the network over the period Sep 1999 to December 2015. The same plots for the 10 full 30 site network from 2006 - 2015 are shown in Supp. Figure S6.
Formatted: Normal

59
Figure 10:
Figure 11: Long-term time series of (a) oxidised nitrogen (HNO3 and NO3-) and (b) reduced nitrogen (NH3 and NH4
+) concentrations at 5 Eskdalemuir (EMEP station code = GB0002R; UK-AIR ID = UKA00130). EMEP values (data downloaded from http://ebas.nilu.no/) are
monthly means of daily measurements for total inorganic nitrogen, TIN (sum of HNO3 and NO3-) and total inorganic nitrogen, TIA (sum of
NH3 and NH4+) by the EMEP filter pack method (Apr-89 – Nov-00), matched to the AGANet and NAMN sampling periods (monthly) where
the measurements overlap. The AGANet and NAMN data are for gaseous HNO3 and NH3 and for the sum of (HNO3 + NO3-) and sum of
(NH3 + NH4+), respectively, by the DELTA method. The AGANet HNO3 values shown here includes the bias correction (Section 02.6). 10
Formatted: Normal

60
Figure 11:
Figure 12: Long-term time series of SO2 (Dec-77 – Jul-93) and SO42- (Dec-77 – Dec-01) concentrations measured in the UK Acid Deposition 5
Monitoring Network (ADMN) (Hayman et al., 2007) and the AGANet DELTA measurements (Oct-99 – Dec-15) at the Eskdalemuir
monitoring station (EMEP station code = GB0002R; UK-AIR ID = UKA00130). ADMN values (data downloaded from http://ebas.nilu.no/)
are monthly means of daily measurements for SO2 and SO42- by a daily bubbler and filter pack method, respectively, matched to the AGANet
sampling periods (monthly) where the measurements overlap.
10
Formatted: Normal
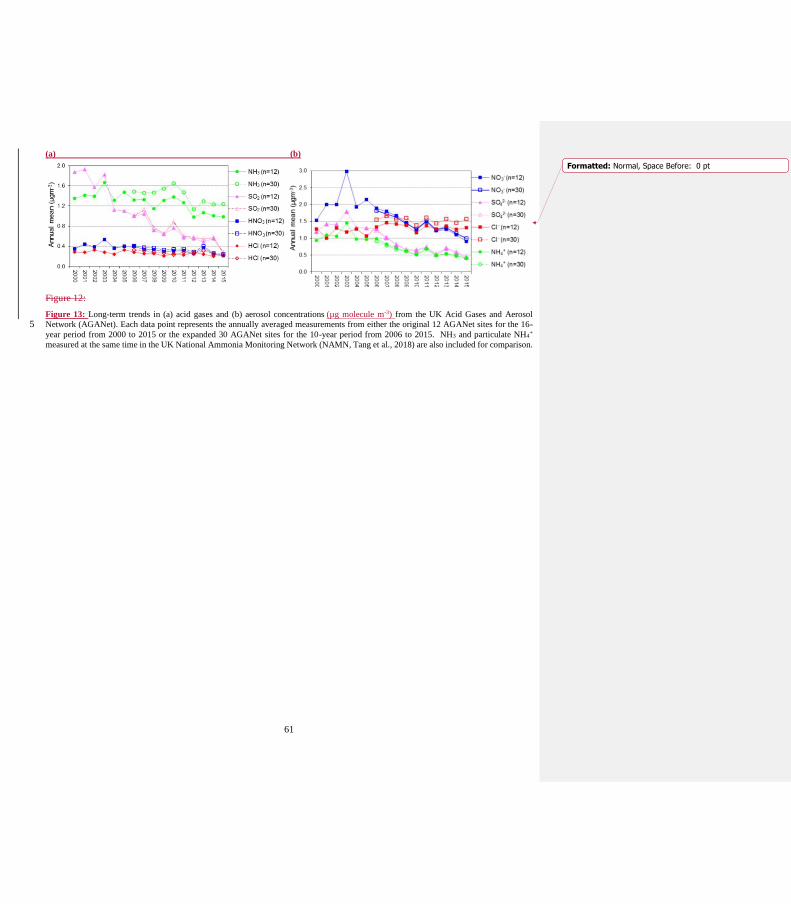
61
(a) (b)
Figure 12:
Figure 13: Long-term trends in (a) acid gases and (b) aerosol concentrations (µg molecule m-3) from the UK Acid Gases and Aerosol
Network (AGANet). Each data point represents the annually averaged measurements from either the original 12 AGANet sites for the 16-5 year period from 2000 to 2015 or the expanded 30 AGANet sites for the 10-year period from 2006 to 2015. NH3 and particulate NH4
+
measured at the same time in the UK National Ammonia Monitoring Network (NAMN, Tang et al., 2018) are also included for comparison.
Formatted: Normal, Space Before: 0 pt
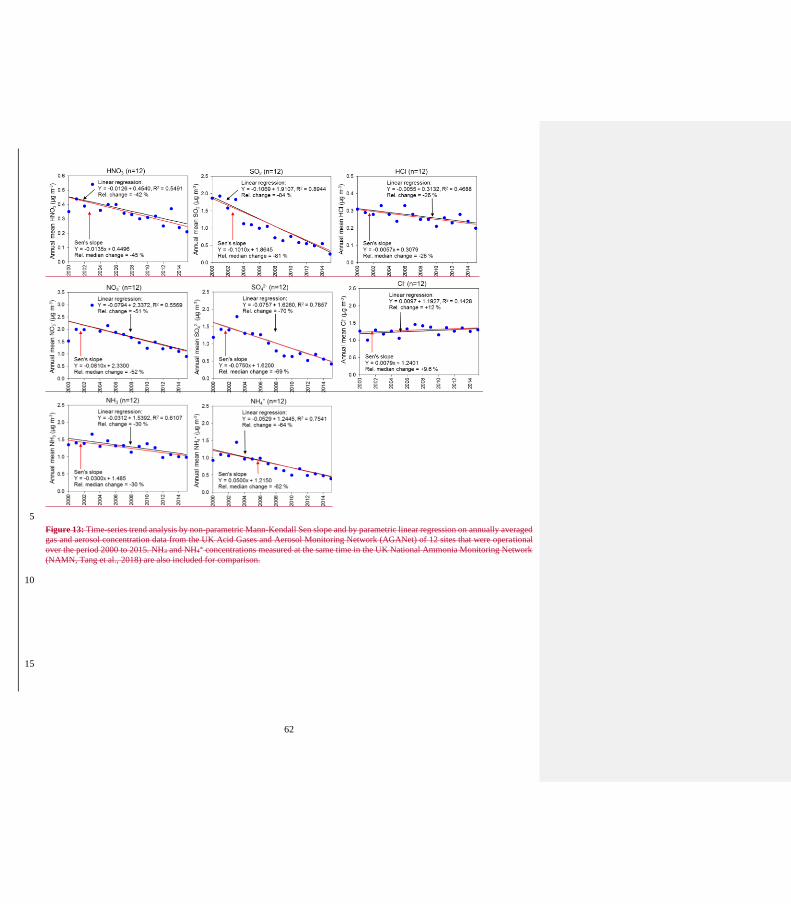
62
5
Figure 13: Time-series trend analysis by non-parametric Mann-Kendall Sen slope and by parametric linear regression on annually averaged
gas and aerosol concentration data from the UK Acid Gases and Aerosol Monitoring Network (AGANet) of 12 sites that were operational
over the period 2000 to 2015. NH3 and NH4+ concentrations measured at the same time in the UK National Ammonia Monitoring Network
(NAMN, Tang et al., 2018) are also included for comparison.
10
15

63
Figure 14: Time series trend analysis by non-parametric Mann-Kendall Sen slope and by parametric linear regression on annually averaged 5 gas and aerosol concentration data from the UK Acid Gases and Aerosol Monitoring Network (AGANet) of 30 sites that were operational
over the period 2006 to 2015. NH3 and NH4+ concentrations data measured at the same time in the UK National Ammonia Monitoring
Network (NAMN, Tang et al., 2018) are also included for comparison.
10
15

64
(a) (b)
Figure 15: Relative trends in UK NOx emissions (Defra 2017) and in annually averaged HNO3 and particulate NO3- concentrations for (a)
the original 12 AGANet sites for the 16 year period from 2000 to 2015, and (b) the expanded 30 AGANet sites for the 10 year period from
2006 to 2015. 5
(a) (b)
Figure 16: Relative trends in UK SO2 emissions (Defra 2017) and in annually averaged SO2 and particulate SO42- concentrations for (a) the
original 12 AGANet sites for the 16 year period from 2000 to 2015 and (b) the expanded 30 AGANet sites for the 10 year period from 2006 10 to 2015.
(a) (b)
Figure 17: Relative trends in UK NH3 emissions (Defra 2017) and in annually averaged NH3 and particulate NH4+ concentrations from the 15
UK National Ammonia Monitoring Network (NAMN, Tang et al., 2018) for (a) the original 12 AGANet sites for the 16 year period from
2000 to 2015 and (b) the expanded 30 AGANet sites for the 10 year period from 2006 to 2015.
20

65
5
Figure 14: Relative trends in UK emissions (NAEI 2018) and in annually averaged gas and particulate concentrations from the UK AGANet
and UK National Ammonia Monitoring Network (NAMN, Tang et al., 2018) for (left) original 12 sites for the 16 year period from 2000 to
2015, and (right) expanded 30 sites compared with the original 12 sites for the 10 year period from 2006 to 2015.
10
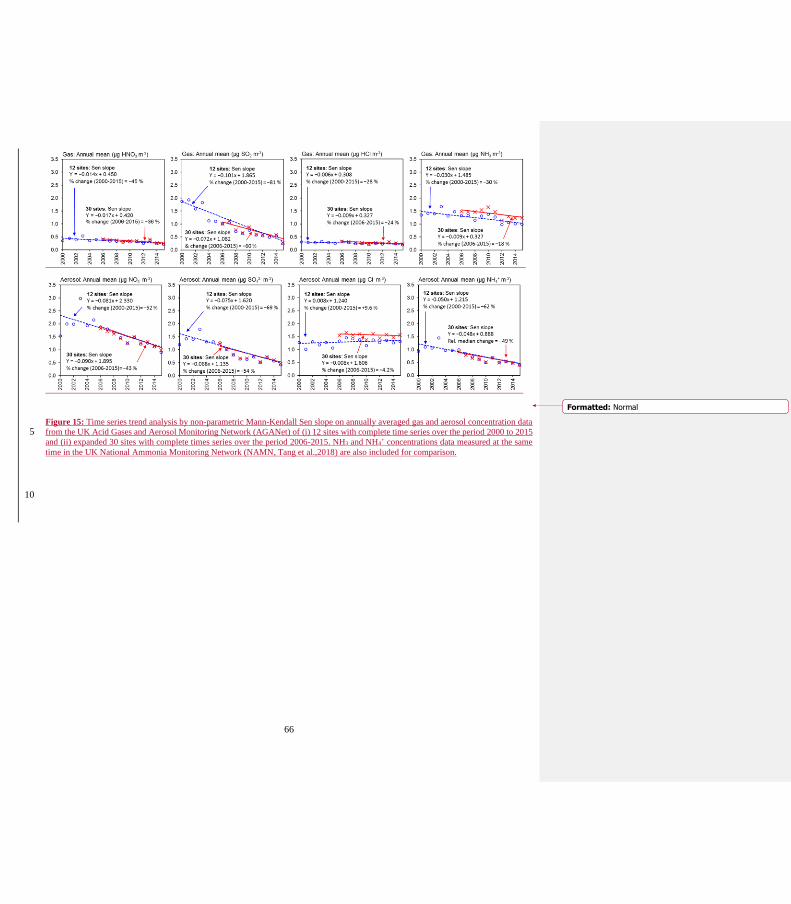
66
Figure 15: Time series trend analysis by non-parametric Mann-Kendall Sen slope on annually averaged gas and aerosol concentration data
from the UK Acid Gases and Aerosol Monitoring Network (AGANet) of (i) 12 sites with complete time series over the period 2000 to 2015 5 and (ii) expanded 30 sites with complete times series over the period 2006-2015. NH3 and NH4
+ concentrations data measured at the same
time in the UK National Ammonia Monitoring Network (NAMN, Tang et al.,2018) are also included for comparison.
10
Formatted: Normal
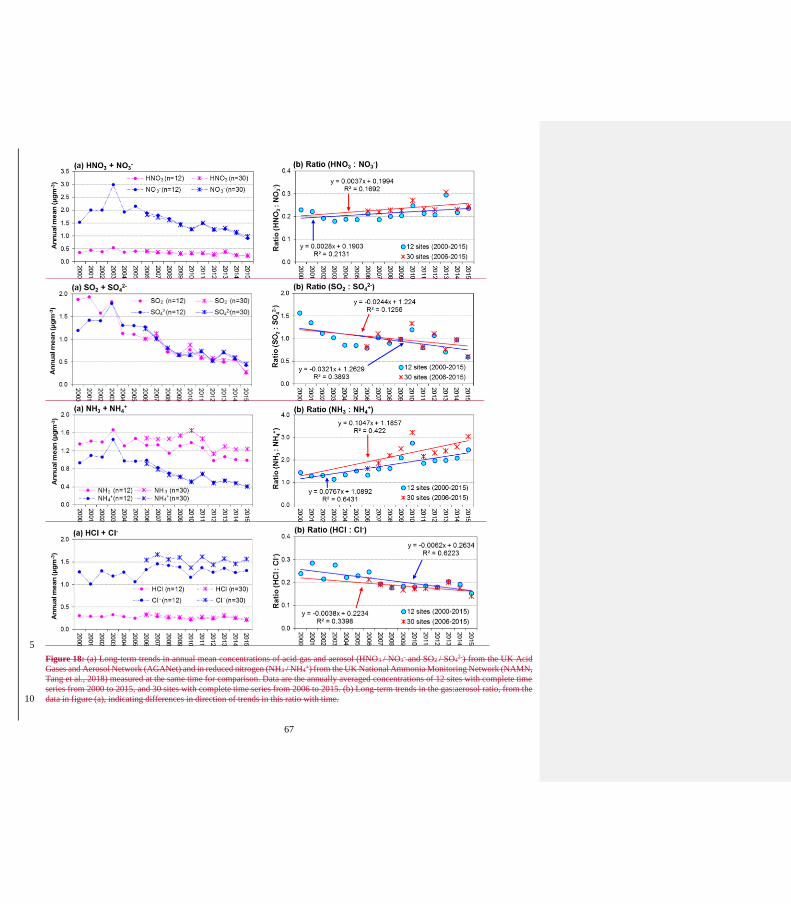
67
5
Figure 18: (a) Long-term trends in annual mean concentrations of acid gas and aerosol (HNO3 / NO3- and SO2 / SO4
2-) from the UK Acid
Gases and Aerosol Network (AGANet) and in reduced nitrogen (NH3 / NH4+) from the UK National Ammonia Monitoring Network (NAMN,
Tang et al., 2018) measured at the same time for comparison. Data are the annually averaged concentrations of 12 sites with complete time
series from 2000 to 2015, and 30 sites with complete time series from 2006 to 2015. (b) Long-term trends in the gas:aerosol ratio, from the
data in figure (a), indicating differences in direction of trends in this ratio with time. 10

68
Figure 16: Long-term trends in the gas:aerosol ratio, from a comparison of the annual mean concentrations of 12 sites with complete time
series from 2000 to 2015, and 30 sites with complete time series from 2006 to 2015, showing indicative differences in direction of trends in 5 this ratio with time.

69
Figure 17: Comparison of long-term trends in annual mean concentrations of total sulphate (as determined from the amount of sulphate 5 collected on the AGANet aerosol filter), NSS_sulphate (estimated from the empirical relationship: [NSS_SO4] = [SO4
2-] - (0.25 x [Na+]),
SS_sulphate (Total – NSS) and sodium. Each data point represents the annually averaged mean concentration of 12 sites for the 16 year
period from 2000 to 2015.
10
Formatted: Normal, Space Before: 0 pt

70
Figure 18: Long-term changes between 2000 and 2015 in (a) molar ratio of NH3 to acid gases (SO2, HNO3 and HCl) and (b) molar ratio of
particulate NH4+ to acid aerosols (SO4
2- and NO3-) from measurements made at 12 sites in AGANet. 5
Formatted: Normal

71
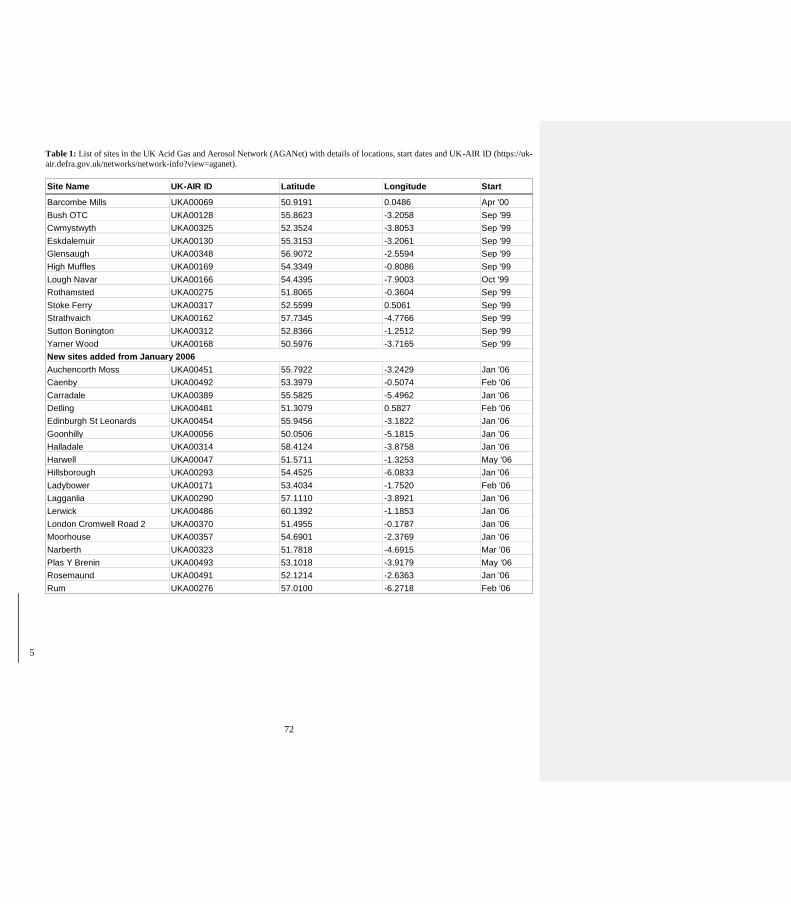
72
Table 1: List of sites in the UK Acid Gas and Aerosol Network (AGANet) with details of locations, start dates and UK-AIR ID (https://uk-
air.defra.gov.uk/networks/network-info?view=aganet).
Site Name UK-AIR ID Latitude Longitude Start
Barcombe Mills UKA00069 50.9191 0.0486 Apr '00
Bush OTC UKA00128 55.8623 -3.2058 Sep '99
Cwmystwyth UKA00325 52.3524 -3.8053 Sep '99
Eskdalemuir UKA00130 55.3153 -3.2061 Sep '99
Glensaugh UKA00348 56.9072 -2.5594 Sep '99
High Muffles UKA00169 54.3349 -0.8086 Sep '99
Lough Navar UKA00166 54.4395 -7.9003 Oct '99
Rothamsted UKA00275 51.8065 -0.3604 Sep '99
Stoke Ferry UKA00317 52.5599 0.5061 Sep '99
Strathvaich UKA00162 57.7345 -4.7766 Sep '99
Sutton Bonington UKA00312 52.8366 -1.2512 Sep '99
Yarner Wood UKA00168 50.5976 -3.7165 Sep '99
New sites added from January 2006
Auchencorth Moss UKA00451 55.7922 -3.2429 Jan '06
Caenby UKA00492 53.3979 -0.5074 Feb '06
Carradale UKA00389 55.5825 -5.4962 Jan '06
Detling UKA00481 51.3079 0.5827 Feb '06
Edinburgh St Leonards UKA00454 55.9456 -3.1822 Jan '06
Goonhilly UKA00056 50.0506 -5.1815 Jan '06
Halladale UKA00314 58.4124 -3.8758 Jan '06
Harwell UKA00047 51.5711 -1.3253 May '06
Hillsborough UKA00293 54.4525 -6.0833 Jan '06
Ladybower UKA00171 53.4034 -1.7520 Feb '06
Lagganlia UKA00290 57.1110 -3.8921 Jan '06
Lerwick UKA00486 60.1392 -1.1853 Jan '06
London Cromwell Road 2 UKA00370 51.4955 -0.1787 Jan '06
Moorhouse UKA00357 54.6901 -2.3769 Jan '06
Narberth UKA00323 51.7818 -4.6915 Mar '06
Plas Y Brenin UKA00493 53.1018 -3.9179 May '06
Rosemaund UKA00491 52.1214 -2.6363 Jan '06
Rum UKA00276 57.0100 -6.2718 Feb '06
5

73
Table 2:
5 Table 3:
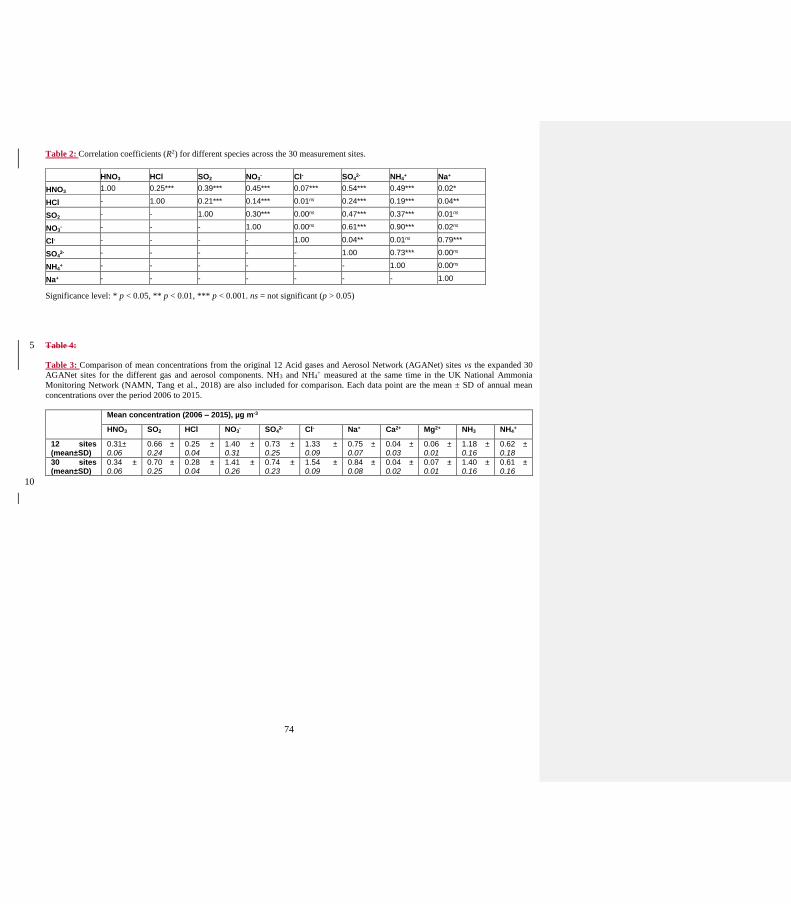
74
Table 2: Correlation coefficients (R2) for different species across the 30 measurement sites.
HNO3 HCl SO2 NO3- Cl- SO4
2- NH4+ Na+
HNO3 1.00 0.25*** 0.39*** 0.45*** 0.07*** 0.54*** 0.49*** 0.02*
HCl - 1.00 0.21*** 0.14*** 0.01ns 0.24*** 0.19*** 0.04**
SO2 - - 1.00 0.30*** 0.00ns 0.47*** 0.37*** 0.01ns
NO3- - - - 1.00 0.00ns 0.61*** 0.90*** 0.02ns
Cl- - - - - 1.00 0.04** 0.01ns 0.79***
SO42- - - - - - 1.00 0.73*** 0.00ns
NH4+ - - - - - - 1.00 0.00ns
Na+ - - - - - - - 1.00
Significance level: * p < 0.05, ** p < 0.01, *** p < 0.001. ns = not significant (p > 0.05)
Table 4: 5
Table 3: Comparison of mean concentrations from the original 12 Acid gases and Aerosol Network (AGANet) sites vs the expanded 30
AGANet sites for the different gas and aerosol components. NH3 and NH4+ measured at the same time in the UK National Ammonia
Monitoring Network (NAMN, Tang et al., 2018) are also included for comparison. Each data point are the mean ± SD of annual mean
concentrations over the period 2006 to 2015.
Mean concentration (2006 – 2015), µg m-3
HNO3 SO2 HCl NO3- SO4
2- Cl- Na+ Ca2+ Mg2+ NH3 NH4+
12 sites (mean±SD)
0.31± 0.06
0.66 ± 0.24
0.25 ± 0.04
1.40 ± 0.31
0.73 ± 0.25
1.33 ± 0.09
0.75 ± 0.07
0.04 ± 0.03
0.06 ± 0.01
1.18 ± 0.16
0.62 ± 0.18
30 sites (mean±SD)
0.34 ± 0.06
0.70 ± 0.25
0.28 ± 0.04
1.41 ± 0.26
0.74 ± 0.23
1.54 ± 0.09
0.84 ± 0.08
0.04 ± 0.02
0.07 ± 0.01
1.40 ± 0.16
0.61 ± 0.16
10
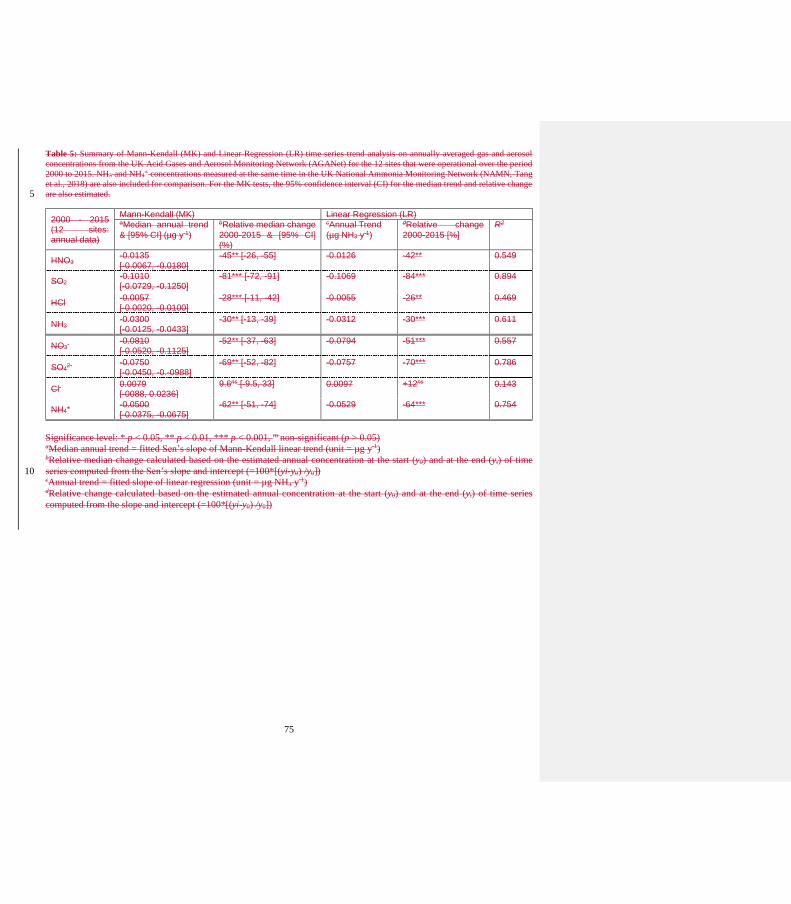
75
Table 5: Summary of Mann-Kendall (MK) and Linear Regression (LR) time series trend analysis on annually averaged gas and aerosol
concentrations from the UK Acid Gases and Aerosol Monitoring Network (AGANet) for the 12 sites that were operational over the period
2000 to 2015. NH3 and NH4+ concentrations measured at the same time in the UK National Ammonia Monitoring Network (NAMN, Tang
et al., 2018) are also included for comparison. For the MK tests, the 95% confidence interval (CI) for the median trend and relative change
are also estimated. 5
2000 - 2015 (12 sites: annual data)
Mann-Kendall (MK) Linear Regression (LR) aMedian annual trend
& [95% CI] (µg y-1)
bRelative median change
2000-2015 & [95% CI] (%)
cAnnual Trend
(µg NH3 y-1)
dRelative change
2000-2015 [%]
R2
HNO3 -0.0135 [-0.0067, -0.0180]
-45** [-26, -55] -0.0126 -42** 0.549
SO2 -0.1010 [-0.0729, -0.1250]
-81*** [-72, -91] -0.1069 -84*** 0.894
HCl -0.0057 [-0.0020, -0.0100]
-28*** [-11, -42] -0.0055 -26** 0.469
NH3 -0.0300 [-0.0125, -0.0433]
-30** [-13, -39] -0.0312 -30*** 0.611
NO3-
-0.0810 [-0.0520, -0.1125]
-52** [-37, -63] -0.0794 -51*** 0.557
SO42-
-0.0750 [-0.0450, -0.-0988]
-69** [-52, -82] -0.0757 -70*** 0.786
Cl- 0.0079 [-0088, 0.0236]
9.6ns [-9.5, 33] 0.0097 +12ns 0.143
NH4+
-0.0500 [-0.0375, -0.0675]
-62** [-51, -74] -0.0529 -64*** 0.754
Significance level: * p < 0.05, ** p < 0.01, *** p < 0.001, ns non-significant (p > 0.05) aMedian annual trend = fitted Sen’s slope of Mann-Kendall linear trend (unit = µg y-1) bRelative median change calculated based on the estimated annual concentration at the start (y0) and at the end (yi) of time
series computed from the Sen’s slope and intercept (=100*[(yi-y0) /y0]) 10 cAnnual trend = fitted slope of linear regression (unit = µg NH3 y
-1) dRelative change calculated based on the estimated annual concentration at the start (y0) and at the end (yi) of time series
computed from the slope and intercept (=100*[(yi-y0) /y0])
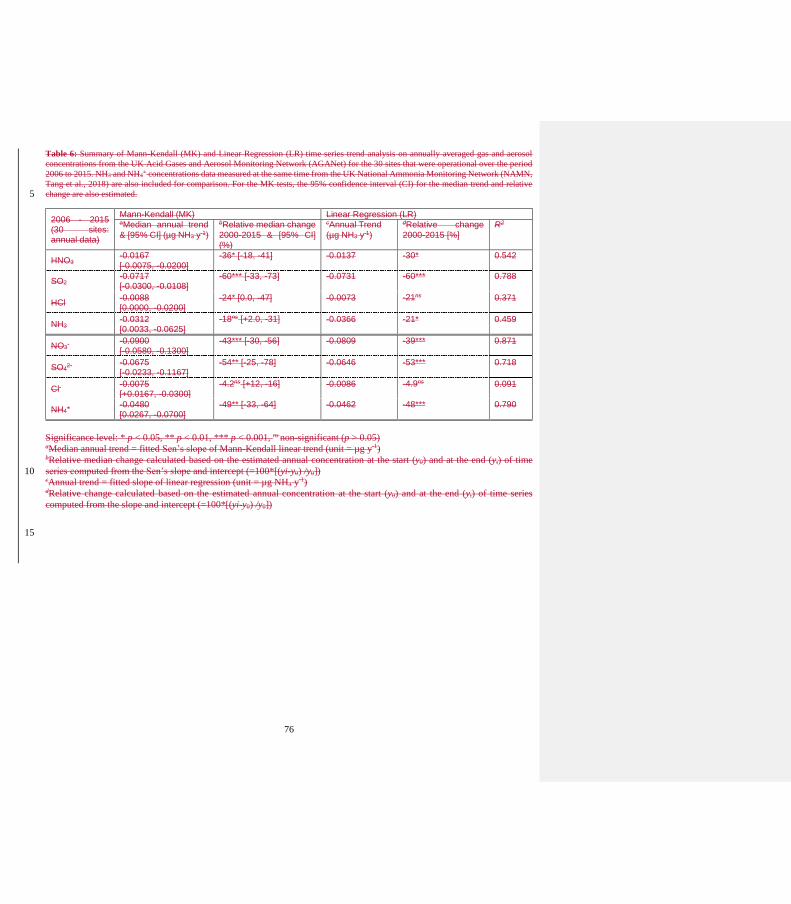
76
Table 6: Summary of Mann-Kendall (MK) and Linear Regression (LR) time series trend analysis on annually averaged gas and aerosol
concentrations from the UK Acid Gases and Aerosol Monitoring Network (AGANet) for the 30 sites that were operational over the period
2006 to 2015. NH3 and NH4+ concentrations data measured at the same time from the UK National Ammonia Monitoring Network (NAMN,
Tang et al., 2018) are also included for comparison. For the MK tests, the 95% confidence interval (CI) for the median trend and relative
change are also estimated. 5
2006 - 2015 (30 sites: annual data)
Mann-Kendall (MK) Linear Regression (LR) aMedian annual trend
& [95% CI] (µg NH3 y-1)
bRelative median change
2000-2015 & [95% CI] (%)
cAnnual Trend
(µg NH3 y-1)
dRelative change
2000-2015 [%]
R2
HNO3 -0.0167 [-0.0075, -0.0200]
-36* [-18, -41] -0.0137 -30* 0.542
SO2 -0.0717 [-0.0300, -0.0108]
-60*** [-33, -73] -0.0731 -60*** 0.788
HCl -0.0088 [0.0000, -0.0200]
-24* [0.0, -47] -0.0073 -21ns 0.371
NH3 -0.0312 [0.0033, -0.0625]
-18ns [+2.0, -31] -0.0366 -21* 0.459
NO3-
-0.0900 [-0.0580, -0.1300]
-43*** [-30, -56] -0.0809 -39*** 0.871
SO42-
-0.0675 [-0.0233, -0.1167]
-54** [-25, -78] -0.0646 -53*** 0.718
Cl- -0.0075 [+0.0167, -0.0300]
-4.2ns [+12, -16] -0.0086 -4.9ns 0.091
NH4+
-0.0480 [0.0267, -0.0700]
-49** [-33, -64] -0.0462 -48*** 0.790
Significance level: * p < 0.05, ** p < 0.01, *** p < 0.001, ns non-significant (p > 0.05) aMedian annual trend = fitted Sen’s slope of Mann-Kendall linear trend (unit = µg y-1) bRelative median change calculated based on the estimated annual concentration at the start (y0) and at the end (yi) of time
series computed from the Sen’s slope and intercept (=100*[(yi-y0) /y0]) 10 cAnnual trend = fitted slope of linear regression (unit = µg NH3 y
-1) dRelative change calculated based on the estimated annual concentration at the start (y0) and at the end (yi) of time series
computed from the slope and intercept (=100*[(yi-y0) /y0])
15
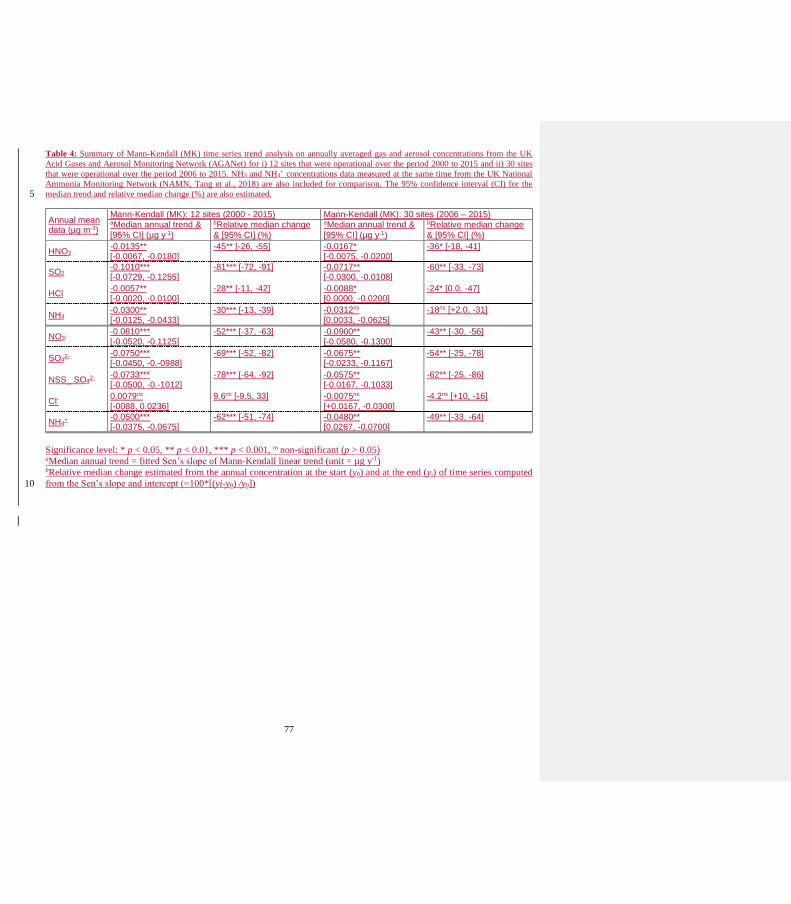
77
Table 4: Summary of Mann-Kendall (MK) time series trend analysis on annually averaged gas and aerosol concentrations from the UK
Acid Gases and Aerosol Monitoring Network (AGANet) for i) 12 sites that were operational over the period 2000 to 2015 and ii) 30 sites
that were operational over the period 2006 to 2015. NH3 and NH4+ concentrations data measured at the same time from the UK National
Ammonia Monitoring Network (NAMN, Tang et al., 2018) are also included for comparison. The 95% confidence interval (CI) for the
median trend and relative median change (%) are also estimated. 5
Annual mean data (µg m-3)
Mann-Kendall (MK): 12 sites (2000 - 2015) Mann-Kendall (MK): 30 sites (2006 – 2015) aMedian annual trend &
[95% CI] (µg y-1)
bRelative median change
& [95% CI] (%)
aMedian annual trend &
[95% CI] (µg y-1)
bRelative median change
& [95% CI] (%)
HNO3 -0.0135** [-0.0067, -0.0180]
-45** [-26, -55] -0.0167* [-0.0075, -0.0200]
-36* [-18, -41]
SO2 -0.1010*** [-0.0729, -0.1255]
-81*** [-72, -91] -0.0717** [-0.0300, -0.0108]
-60** [-33, -73]
HCl -0.0057** [-0.0020, -0.0100]
-28** [-11, -42] -0.0088* [0.0000, -0.0200]
-24* [0.0, -47]
NH3 -0.0300** [-0.0125, -0.0433]
-30*** [-13, -39] -0.0312ns
[0.0033, -0.0625]
-18ns [+2.0, -31]
NO3-
-0.0810*** [-0.0520, -0.1125]
-52*** [-37, -63] -0.0900** [-0.0580, -0.1300]
-43** [-30, -56]
SO42-
-0.0750*** [-0.0450, -0.-0988]
-69*** [-52, -82] -0.0675** [-0.0233, -0.1167]
-54** [-25, -78]
NSS_ SO42-
-0.0733*** [-0.0500, -0.-1012]
-78*** [-64, -92] -0.0575** [-0.0167, -0.1033]
-62** [-25, -86]
Cl- 0.0079ns
[-0088, 0.0236]
9.6ns [-9.5, 33] -0.0075ns
[+0.0167, -0.0300]
-4.2ns [+10, -16]
NH4+
-0.0500*** [-0.0375, -0.0675]
-62*** [-51, -74] -0.0480** [0.0267, -0.0700]
-49** [-33, -64]
Significance level: * p < 0.05, ** p < 0.01, *** p < 0.001, ns non-significant (p > 0.05) aMedian annual trend = fitted Sen’s slope of Mann-Kendall linear trend (unit = µg y-1) bRelative median change estimated from the annual concentration at the start (y0) and at the end (yi) of time series computed
from the Sen’s slope and intercept (=100*[(yi-y0) /y0]) 10

78
Table 7: Table 5: Comparison of % change in estimated UK NOx, SO2 and NH3 emissions reported by the National Atmospheric Emission
Inventory (NAEI) (data from http://naei.defra.gov.uk/) with % change between 2000-2015 (12 sites with complete time series) and between
2006-2015 (30 sites with complete time series) in annually averaged HNO3 / NO3- and SO2 / SO4
2- concentrations from the UK Acid Gas
and Aerosol Monitoring Network (AGANet), and annually averaged NH3 / NH4+ concentrations from the UK National Ammonia Monitoring
Network (NAMN, Tang et al., 2018). 5
Components
2000 – 2015 (12 sites) 2006 – 2015 (30 sites)
UK emissionsb
% change
MK Sen Slope
% relative median changea
UK emissionsc
% change
MK Sen slope
% relative median changea
Gas HNO3 -49 (NOx) -45** -40 (NOx) -36*
Particulate NO3- -52*** -43**
Gas SO2 -80 (SO2) -81*** -65 (SO2) -60***
Particulate SO42- -69*** -54**
NSS_ SO42- -78*** -62**
Gas HCl -87 (HCl) -28ns -45 (HCl) -24ns
Particulate Cl- +10ns -4ns
Gas NH3 -9 (NH3) -30*** -0.7 (NH3) -18ns
Particulate NH4+ -62*** -49**
Significance level: * p < 0.05, ** p < 0.01, *** p < 0.001, ns non-significant (p > 0.05) aRelative median change calculated based on the estimated annual concentration at the start (y0) and at the end (yi) of time 10
series computed from the Sen’s slope and intercept (=100*[(yi-y0) /y0]) bRelative change calculated based on the estimated annual concentration at the start (y0) and at the end (yi) of time series
computed from the slope and intercept (=100*[(yi-y0) /y0]) bUK emissions data from NAEI (http://naei.beis.gov.uk/data/, accessed 17/09/18)
15
Copyright © 2022 FDOKUMEN