Apoptosis-Inducing Factor Regulates Skeletal Muscle Progenitor Cell Number and Muscle Phenotype
Upload
khangminh22Category
view
1download
0
1
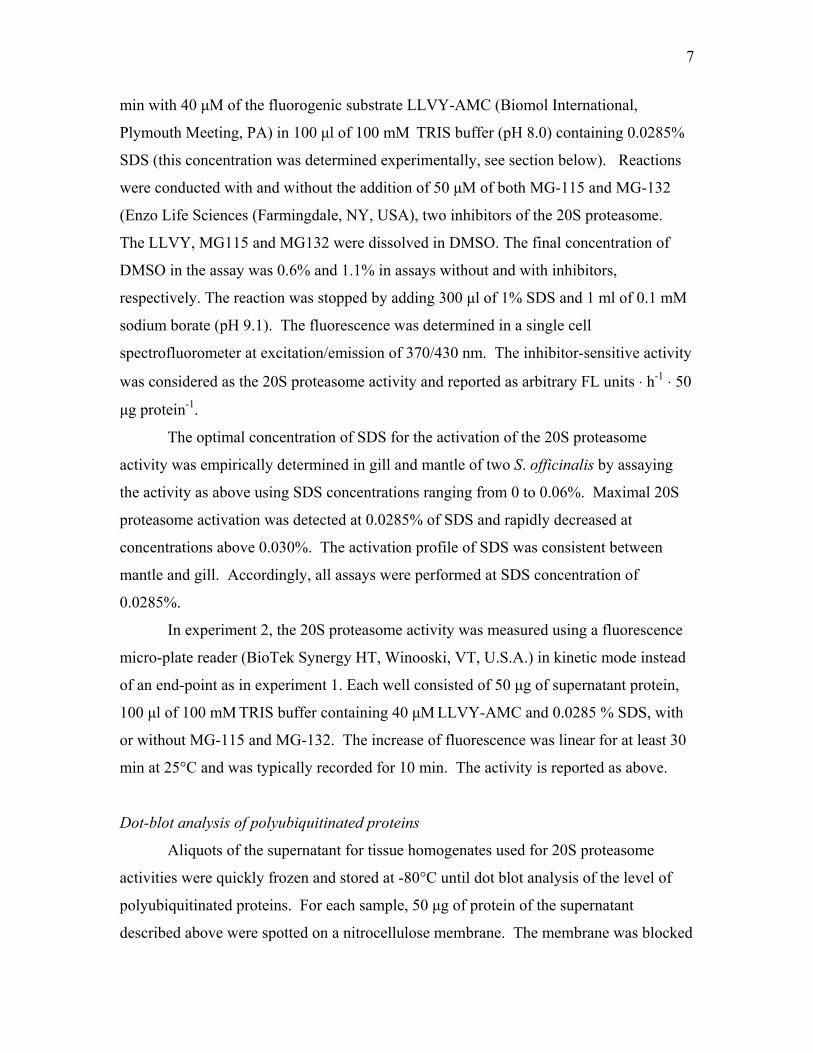
Mechanisms of protein degradation in mantle muscle and proposed gill
remodeling in starved Sepia officinalis
Simon G. Lamarre1,2, Delphine Ditlecadet2,3, David J. McKenzie2,4, Laure Bonnaud5
William R. Driedzic2,3
1 Department of Biochemistry, Memorial University of Newfoundland, St. John’s, NL,
CANADA, A1C 5S7, 2 Station Méditerranéenne de l’Environnement Littoral, 2 Rue Des Chantiers Navals,
34200 Sète, France, 3 Ocean Sciences Centre, Memorial University of Newfoundland, St. John’s, NL,
CANADA, A1C 5S7, 4 UMR 5119 Ecologie des Systèmes Marins Côtiers, Université Montpellier II, Place
Eugène Bataillon Case 093, F – 34095 Montpellier cedex 5, FRANCE 5 Museum National d'Histoire Naturelle (MNHN). Département Milieux et Peuplements
Aquatiques (DMPA) UMR Biologie des Organismes et Ecosystemes Aquatiques
(BOREA). MNHN, CNRS 7208, IRD 207, UPMC. 55 rue Buffon, CP51 , 75005 Paris.
and Université Paris Diderot, Sorbonne Paris Cité, Paris, FRANCE.
Address for correspondence : William R. Driedzic, Ocean Sciences Centre, Memorial
University of Newfoundland, St. John’s, NL, CANADA, A1C 5S7 (e-mail:
Articles in PresS. Am J Physiol Regul Integr Comp Physiol (May 30, 2012). doi:10.1152/ajpregu.00077.2012
Copyright © 2012 by the American Physiological Society.

2
SUMMARY
Cephalopods have relatively high rates of protein synthesis compared to rates of protein
degradation, along with minimal carbohydrate and lipid reserves. During food
deprivation on board protein is catabolised as a metabolic fuel. The aim of the current
study was to assess if biochemical indices of protein synthesis and proteolytic
mechanisms were altered in cuttlefish, Sepia officinalis, starved for 7 days. In mantle
muscle, food deprivation is associated with a decrease in protein synthesis as indicated by
a decrease in the total RNA level and dephosphorylation of key signalling molecules 4E-
BP1 (regulator of translation) and Akt. The ubiquitination-proteasome system (UPS) is
activated as shown by an increase in the levels of proteasome ß-subunit mRNA,
polyubiquitinated protein, and polyubiquitin mRNA. As well, cathepsin activity levels
are increased suggesting increased proteolysis through the lysosomal pathway. Together
these mechanisms could supply amino acids as metabolic fuels. In gill the situation is
quite different. It appears that during the first stages of starvation both protein synthesis
and protein degradation are enhanced in gill. This is based upon increased
phosphorylation of 4E-BP1 and enhanced levels of UPS indicators, especially 20S
proteasome activity and polyubiquitin mRNA. It is proposed that an increased protein
turnover is related to gill remodeling perhaps to retain essential haemolymph borne
compounds.
Key words: cathepsin, cephalopod, metabolic enzymes, proteasome, polyubiquitin, RNA,
starvation, triglyceride
3
INTRODUCTION
Cephalopods typically feed upon protein rich diets and are generally high in protein
content with low reserves of lipid and carbohydrates. Most of the lipid is present in
digestive gland with very little lipid reserves in other tissues (33). Studies tracking the
incorporation of radiolabelled phenylalanine into the protein pool show that in feeding
cephalopods protein accretion is favoured by relatively low rates of protein degradation
compared to rates of protein synthesis (6, 18, 27). In Southern dumpling squid
(Euprymna tasmanica), whole body protein degradation increases in minimally fed
animals (18). Furthermore in octopus, Octopus vulgaris the oxygen consumption /
nitrogen excretion ratio increased over the first 5 days of starvation to values that imply a
mixed lipid and protein oxidation and by day 8 the ratio decreased to a predominantly
protein based metabolism (5). In cuttlefish, Sepia officinalis, oxygen consumption is
maintained for the first six days of starvation and thus rates of metabolic fuel delivery
must remain constant (15). Collectively, the above implies that during periods of food
deprivation the limited lipid reserves are called upon first in parallel with, then
subsequently followed by, an obligate dependence on the use of protein as a metabolic
fuel. The objective of the current study was to assess if biochemical indices of protein
breakdown and to some extent protein synthesis in various tissues are altered during food
deprivation in S. officinalis.
Mechanisms of protein degradation have been well studied in vertebrate animals.
One pathway is the ubiquitin-proteasome system (UPS) that involves the ubiquitination
of protein followed by degradation via proteasomes. In mammalian cell lines and
especially in mammalian muscle during starvation the ubiquitin-proteasome pathway is
the dominant route of protein degradation (24, 40). Here we assess, for the first time in
any cephalopod, the activity of 20S proteasome, levels of polyubiquitinated protein,
transcript levels of proteasome ß-subunit (a component of the catalytic subunit), and
transcript levels of polyubiquitin. In addition, we determined the degree of
phosphorylation of the signalling molecules Akt (also known as protein kinase B) and the
eukaryote binding protein, 4E-BP1. Akt is considered to play a role in numerous
signalling pathways including the UPS, whereas, 4E-BP1 is a regulator of the translation

4
step of protein synthesis. Phosphorylation of Akt can result in phosphorylation of 4E-BP1
leading to the activation of protein synthesis. The dephosphorylated state of Akt and 4E-
BP1 should lead to a curtailment of protein synthesis (1,14).
Protein degradation may also occur via the transport of protein into lysosomes
with subsequent proteolysis by low pH active cathepsins and by non-lysosomal
intracellular calcium dependent calpains. Activation of the lysosomal pathway has been
noted in white muscle of starved rainbow trout (Oncorhynchus mykiss) and Atlantic cod
(Gadus morhua) (7, 16). Cathepsin like activity has also been reported in viscera of S.
officinalis (4). Here we determine in numerous tissues cathepsin A,B,H,L like activity at
pH 5.5, cathepsin D,E like activity at pH 2.5, and calpain like protease activity in medium
containing calcium at neutral pH. Following proteolysis the released amino acids must be
metabolised via aerobic metabolism and the citric acid cycle in order to release energy to
sustain ATP production. As such, the activity of enzymes involved in the final trafficking
of amino acids aspartate aminotransferase (AspAT), alanine aminotransferase (AlAT),
and glutamate dehydrogenase (GDH), as well as, the mitochondrial enzyme citrate
synthase (CS) were also determined.
In order to provide a context for protein degradation, levels of RNA in various
tissues and triglyceride content in digestive gland were assessed as these are hallmarks of
nutritional status in cephalopods. This contention is based on the following observations.
Within individual tissues of O. vulgaris rates of protein accretion increased linearly with
RNA/protein ratio (19). As well, whole body RNA per g, fractional rates of protein
synthesis, and fractional rates of protein accretion all followed similar regressions when
plotted against total body weight in E. tasmanica (25). However, during starvation the
RNA/protein ratio decreased in mantle of the octopus Eledone cirrhosa (18), and the
RNA/DNA ratio decreased in paralarvae of the squid Loligo opalescens (39), as well as,
whole (approximately 67 mg) juvenile S. officinalis (8). Most compelling in relation to
the current experiment is the finding that in mantle muscle from S. officinalis there was a
decrease in RNA/DNA ratio and RNA/ gm dry weight after 4 to 6 days of starvation (25).
Taken together these data imply that the level of RNA is an important determinant of
rates of protein synthesis and when food deprived the RNA pool is decreased presumably
as a means to decrease protein synthesis. Digestive gland mass decreased with starvation
5
in E. cirrhosa (18) and in S. officinalis four days of food deprivation resulted in about a
35-50% decrease in its mass (7, 25). In S. officinalis, digestive gland triglycerides
constitute about ½ of the lipids in fed animals and decrease during starvation, whereas,
phospholipids that make up the bulk of the remainder of the lipid pool are mobilized to
only a limited extent. As such, digestive gland triglyceride serves as an energy source
during the first 10 days of food deprivation and is a clear indicator of the level of
starvation (7).
This study presents novel information about the mechanisms of protein
degradation in cephalopods under physiological conditions and provides an intellectual
connect between the UPS and signalling processes. Our major findings are that during
food deprivation the UPS and cathepsin activity are increased in mantle muscle but in gill
there appears to be at least a transient increase in protein turnover (both synthesis and
degradation).
MATERIALS AND METHODS
Animals
Cuttlefish (Sepia officinalis) were captured by net by a local fisherman. Animals
were transferred to the Station Méditerranéenne de l’Environnement Littoral (Sète,
France) and maintained in free running sea water. Studies were conducted in May 2010
(experiment 1) and May 2011 (experiment 2). For experimental purposes animals were
held in individual shallow tanks (200 x 45 x 25 cm) with fine gravel on the bottom. Water
temperatures varied between 16°C to18°C in 2010 and 20°C to 22°C in 2011. S.
officinalis were either fed daily or food deprived for a period of seven days. In
experiment 1, the final body masses were 296 ± 63 g and 282 ± 31 g for fed and starved
animals, respectively. In experiment 2, the final body masses were 261 ± 40 g and 364 ±
127 g for fed and starved animals, respectively. There was no statistically significant
differences in body mass amongst the four experimental groups. The larger average mass
in starved than in fed animals is presumably due to variability in initial body masses and
not weight loss during 7 days of food deprivation. In experiment 1, fed animals were
offered 2 sea bream (Sparus aurata) per day with a body mass of about 4 g, resulting in a

6
daily ration of about 3% body weight per day. In experiment 2, ration was increased in
an attempt to generate a greater range in nutritional status. In this case, fed animals were
offered 4-5 sea bream per day, resulting in a daily ration of about 7% body weight per
day. Following seven days the animals were anesthetised in 3% ethanol in sea water and
the ventral nerve cord was severed behind the head. Sections of mantle muscle, retractor
muscle, systemic heart, gill, digestive gland and in some cases haemolymph were
harvested, frozen on dry ice, and stored at -80°C for future analysis. Animal protocols
were approved by the Animal Care Committee at Memorial University of Newfoundland.
Lipid analysis
Total triglyceride level in the digestive gland was determined as described by
Collison et al. (10). Tissue was homogenized in ground glass [60 mg per ml
chloroform:methanol (2:1)]. The homogenate was transferred to a centrifuge tube and
allowed to stand for 2 h with frequent shaking. Thereafter, 0.2 vols of water were added,
the sample was vortexed, centrifuged for 5 min at 2,000 g, the bottom layer was
transferred to a glass vessel and allowed to dry. The lipid was resuspended in ethanol
(250 mg tissue ml-1) and triglycerides levels were determined via Sigma kit TR0100
(Sigma Aldrich, St Louis, MO, USA).
20S proteasome activity
In experiment 1, tissues were homogenized in 5 vols of ice cold lysis buffer using
a polytron (2 x 10s) and centrifuged at 13,000 g at 4°C for 60 min. The lysis buffer was
50 mM TRIS, 0.1 mM EDTA, 0.007 % β-mercaptoethanol, pH 8.0. In experiment 2, the
lysis buffer included a phosphatase inhibitor cocktail (containing cantharidin, p-
bromolevamisole oxalate, and calyculin A; (Kit # P0044; Sigma Aldrich, St-Louis, MO).
Immediately after centrifugation, the protein concentration of the supernatant was
determined using the Bradford protein assay kit (Bio-Rad, Hercules, CA) with bovine
serum albumin (BSA) as the standard. The fresh supernatant was used for the assay of
20S proteasome activity.
For experiment 1, the 20S proteasome activity was measured according to
Shibatani and Ward (36). Fifty μg of protein from the supernatant was incubated for 60
7
min with 40 μM of the fluorogenic substrate LLVY-AMC (Biomol International,
Plymouth Meeting, PA) in 100 μl of 100 mM TRIS buffer (pH 8.0) containing 0.0285%
SDS (this concentration was determined experimentally, see section below). Reactions
were conducted with and without the addition of 50 μM of both MG-115 and MG-132
(Enzo Life Sciences (Farmingdale, NY, USA), two inhibitors of the 20S proteasome.
The LLVY, MG115 and MG132 were dissolved in DMSO. The final concentration of
DMSO in the assay was 0.6% and 1.1% in assays without and with inhibitors,
respectively. The reaction was stopped by adding 300 μl of 1% SDS and 1 ml of 0.1 mM
sodium borate (pH 9.1). The fluorescence was determined in a single cell
spectrofluorometer at excitation/emission of 370/430 nm. The inhibitor-sensitive activity
was considered as the 20S proteasome activity and reported as arbitrary FL units ⋅ h-1 ⋅ 50
μg protein-1.
The optimal concentration of SDS for the activation of the 20S proteasome
activity was empirically determined in gill and mantle of two S. officinalis by assaying
the activity as above using SDS concentrations ranging from 0 to 0.06%. Maximal 20S
proteasome activation was detected at 0.0285% of SDS and rapidly decreased at
concentrations above 0.030%. The activation profile of SDS was consistent between
mantle and gill. Accordingly, all assays were performed at SDS concentration of
0.0285%.
In experiment 2, the 20S proteasome activity was measured using a fluorescence
micro-plate reader (BioTek Synergy HT, Winooski, VT, U.S.A.) in kinetic mode instead
of an end-point as in experiment 1. Each well consisted of 50 μg of supernatant protein,
100 μl of 100 mM TRIS buffer containing 40 μM LLVY-AMC and 0.0285 % SDS, with
or without MG-115 and MG-132. The increase of fluorescence was linear for at least 30
min at 25°C and was typically recorded for 10 min. The activity is reported as above.
Dot-blot analysis of polyubiquitinated proteins
Aliquots of the supernatant for tissue homogenates used for 20S proteasome
activities were quickly frozen and stored at -80°C until dot blot analysis of the level of
polyubiquitinated proteins. For each sample, 50 μg of protein of the supernatant
described above were spotted on a nitrocellulose membrane. The membrane was blocked
8
with 5% BSA. The polyubiquitinated proteins were detected using a specific antibody
(clone FK1; Enzo Life Sciences). Dots were revealed by enhanced chemiluminescence
(ECL) after secondary detection using a horseradish peroxidase (HRP) conjugated goat
anti-mouse IgM (Abcam, Cambridge, MA). Dot intensity was quantified by
densitometry using ImageJ (NIH, Bethesda, NY).
Western blot analysis
Aliquots of the supernatant of tissue homogenates used for 20S proteasome
activities in experiment 2 were quickly frozen and stored at -80°C until analysis of levels
of Akt, phospho-Akt (serine 473), 4E-BP1 and phospho-4E-BP1 (threonine 37/46).
Tissue homogenates (50 μg of protein) were subjected to SDS polyacrylamide gel
electrophoresis (SDS-PAGE), blotted on PVDF membranes and the blots were blocked
using 5 % BSA. The membranes were probed with protein specific antibodies obtained
from Cell Signaling Technologies (Beverley, MA). The phosphorylated form of the
proteins was quantified first, then the membranes were stripped and probed with the
antibody recognizing the total protein. Secondary detection was performed using a goat
anti-rabbit HRP conjugated antibody and bands were revealed using ECL. Band intensity
was quantified using ImageJ and the ratio of phospho-Akt/Akt and phospho-4E-BP1/4E-
BP1 were calculated.
Metabolic enzymes
The fresh supernatant obtained from preparations for 20S proteasome activity in
experiment 1 was diluted 1:1 with homogenization buffer and used directly for assay of
metabolic enzymes. All assays for metabolic enzymes were previously utilized with
cephalopod tissues (12, 17). Specific conditions were as follows:
Aspartate aminotransferase (AspAT: EC 2.6.1.1): 50 mM imidazole, 40 mM L-
aspartate, 0.025 mM pyridoxal phosphate, 0.15 mM NADH, excess malate
dehydrogenase, initiated with 10 mM 2-oxoglutarate; pH 7.0.
Alanine aminotransferase (AlAT: EC 2.6.1.2): 50 mM imidazole, 200 mM L-
alanine, 0.025 mM pyridoxal phosphate, 0.15 mM NADH, excess lactate dehydrogenase,
initiated with 10 mM 2-oxoglutarate; pH 7.0.

9
Glutamate dehydrogenase (GDH: EC 1.4.1.3); 100 mM TRIS, 200 mM NH4Cl, 2
mM ADP, 0.2 mM NADH, initiated with 5 mM 2-oxoglutarate; pH 8.0.
Citrate synthase (CS: EC 2.3.3.1); 100 mM TRIS, 0.25 mM DTNB [5,5’
dithiobis-(2-nitrobenzic acid)], 0.4 mM acetyl CoA, initiated with 4 mM oxaloacetate; pH
= 8.0.
All enzymes were assayed at 15°C in a spectrophotometer with 1 ml cuvettes.
Activity was expressed as µmol min-1 mg protein-1 based on mmolar extinction
coefficients of 6.22 for NADH linked reactions at 340 nm and 13.6 for CS at 412 nm.
Protease assays
In experiment 1, tissues were homogenized in 10 vols of medium containing 20
mM TRIS, 1 mM EDTA, 100 mM KCl, and 0.1% mercaptoethanol at pH 7.5 and
centrifuged for 5 min at 10,000 g. In experiment 2, the fresh supernatant obtained from
preparations for 20S proteasome activity was utilized. In all cases the supernatant was
diluted to 1% (tissue mass / volume) for enzyme analysis. Cathepsin like activity was
determined in medium at pH 5.5 (97 mM citric acid, 5.8 mM Na2HPO4, 40 mM cysteine)
and in medium at pH 2.5 (43.5 mM citric acid, 112 mM Na2HPO4, 40 mM cysteine),
modified from Mycek (26). Calpain like activity was determined in medium containing
20 mM TRIS, 1 mM EDTA, 10 mM CaCl2, 100 mM KCl, and 0.1% mercaptoethanol at
pH 7.5. Assays were based on the degradation of fluorescently labelled casein
(BIODIPY-FL conjugated casein) that releases fluorescent cleavage products (21, 38).
Assays followed the manufacturer’s instructions in an EnzChek Protease Assay Kit
E6638 (Molecular Probes, Eugene, OR, USA). Briefly, 100 µl of diluted homogenate
was added to a microplate well followed by 100 µl of the enzyme assay buffer containing
10 µg ml-1 BODIPY-casein. The fluorescence (excitation/emission = 485/535 nm) was
recorded immediately and after an incubation period of 60 min at room temperature. The
final fluorescence was subtracted from the initial value to determine the relative enzyme
activity. The assay was linear with respect to substrate concentration. Fluorescence was
determined with a Beckman Coulter DTX microplate reader in experiment 1 and with a
BioTek Synergy HT microplate reader in experiment 2.

10
Proteasome β-subunit and polyubiquitin expression
Frozen samples were weighed and thereafter total RNA was extracted by
homogenization in Trizol reagent (Invitrogen, Burlington, ON, Canada). Extracted RNA
was quantitated by UV absorption at 260 nm. Integrity and purity were verified prior to
cDNA synthesis by agarose gel electrophoresis and by calculating the OD260/280 ratio,
respectively. Ten µg of RNA were treated with DNAse using the TURBO DNA-free kit
(Ambion, Austin, TX). One µg of DNase-treated RNA was reverse transcribed using
random hexamers and Moloney murine leukemia virus reverse transcriptase (Invitrogen).
cDNA so generated was used for real-time quantitative PCR (qPCR). DNase treatment
and reverse transcription were performed following manufacturers instructions.
Expression of proteasome β-subunit and of polyubiquitin was quantified as levels
of their respective mRNA. qPCR was done using prepared cDNA with normalization to
16S rRNA (AB240155.1) using SYBR Green I dye chemistry and the 7300 real-time
PCR system (Applied Biosystems, Foster City, CA) or the Stratagene Mx3000P system
(Stratagene, La Jolla, CA) in experiments 1 and 2, respectively. Primers used are listed in
Table 1 and were designed from sequences specific to S. officinalis for the genes
considered. Sequences of the two genes were obtained from an ESTs library
(Genoscope CEA project) obtained from S. officinalis embryos cDNA and identified
following automatic annotations (3). Relevancy of annotations was confirmed by blasting
relevant known sequences against EST, tc and singlets databases through SAMS blast
interface. One tc was automatically annotated as ubiquitin (30 ESTs), five tcs as
proteasome subunit (5, 4, 7, 3, 44 ESTs). For proteasome, tc was chosen for its closest
homology to proteasome β subunit. [proteasome (prosome, macropain) subunit, β type, 4
(PSMB4)]. For all transcripts, efficiency and specificity of the reactions were confirmed
before running the samples. Efficiencies of the reactions (%) were estimated for both
qPCR systems and in all tissues using a five-point serial dilution and all ranged between
90-110%. Specificity of each reaction was verified by running a melt curve analysis and
by running the reaction products on a 2% agarose gel. Both methods showed a single
specific product of the expected size for all genes. Samples were then run in duplicate in
separate reactions. qPCR reactions were performed in a total volume of 25 μl containing
12.5 μl power SYBR Green PCR Master Mix (Applied Biosystems); 50 nM of each
11
forward and reverse primers and 2.5 ng of cDNA for proteasome β-subunit and
polyubiquitin or 0.2 ng cDNA for 16S rRNA. The qPCR program consisted of 1 cycle at
50°C for 2 min, 1 cycle at 95°C for 10 min, and 40 cycles of (95°C for 15 s and 60°C for
1 min). The cycle threshold was determined using the 7300 PCR Detection System SDS
software version 1.2.3 from Applied Biosystems (experiment 1) or the MxPro QPCR
v4.00 software from Stratagene (experiment 2). The relative quantity of proteasome β-
subunit and of polyubiquitin mRNA was determined following the Pfaffl method (32).
This mathematical model takes into account the respective efficiencies of the gene
considered.
Statistical analyses
Values are expressed as mean ± SE. Significant differences involving two
conditions were assessed with a two-tailed Student’s t-test and in the case of multiple
conditions a one-way ANOVA with Tukey’s post hoc test. Data that are presented as
ratios were log transformed prior to statistical analysis. In all cases P < 0.05 was
considered to be significant.
RESULTS
Nutritional status
There was no difference in haemolymph glucose content between fed (1.6 ± 0.1
mM; N = 4) and starved (1.7 ± 0.1 mM; N=5) S. officinalis.
Starvation was associated with a decrease in digestive gland triglyceride content
in both experiments 1 and 2 (Fig. 1A and 1B). The starved S. officinalis in experiment 1
showed the lowest level of digestive gland triglyceride (2.1 ± 2.1 mg / g tissue) and is
considered to be the group that should have placed the highest demands upon protein as a
metabolic fuel. The fed S. officinalis in experiment 2 had the highest level of triglyceride
in the digestive gland (64.7 ± 10.7 mg / g tissue) and is considered to be the best
nourished of the four groups. There was no significant correlation between
hepatopancreas triglyceride content and body mass within each of the four groups nor
when all of the fed or all of the starved animals were considered together.

12
In experiment 1, food deprivation was associated with a significant decrease in
RNA in heart (Fig. 1 C). In experiment 2, there was a significant decrease in RNA in
mantle and a tendency for a decrease in retractor muscle (P = 0.075) between fed and
starved animals (Fig. 1D). Fig. 2 presents the relationship between triglyceride level in
digestive gland, as an index of the nutritional state, and tissue RNA content, taking into
consideration data from both experiments. Triglyceride level in digestive gland was
linearly related to RNA in mantle (y = 0.15x – 22; R2 = 0.38; P = 0.02) and retractor
muscle (y = 0.08x - 7; R2 = 0.36; P = 0.03). As such, low levels of triglyceride were
associated with lower levels of RNA. There was no obvious correlation between
triglyceride level in digestive gland and RNA content in heart. Although the data are
limited it appears that the situation in gill is more complex. When data from fed and
starved animals were analyzed separately, the starved group showed a linear correlation
between the two variables (y = 0.01x – 15; R2 = 0.99; P = 0.003). Triglyceride level in
digestive gland and gill RNA level in the fed group also showed a tendency to correlate
but with a much steeper slope (y = 0.028x -12; R2 = 0.77; P = 0.11)
Overall, the changes in RNA content induced by starvation were small on an
absolute level compared to tissue differences in RNA. For instance, in experiment 2, the
significantly different level of RNA in mantle muscle between fed and starved S.
officinalis was 126 µg g-1; whereas, the difference between gill and mantle RNA level
was ~2500 µg g-1. A comparison, including values from both fed and starved individuals
provides a generalized picture of the tissue distribution of RNA (Fig. 3). RNA level in
gill is significantly higher than in all other tissues, while RNA level in heart is higher
than in mantle and retractor muscle.
Components of the ubiquitin-proteasome system
In experiment 1, components of the UPS were elevated in mantle of starved in
comparison to fed S. officinalis (Fig. 4 – left panels). More specifically, there were
significant increases of the transcript levels of the proteasome β-subunit and
polyubiquitin. Also, the amount of polyubiquitinated protein was higher in starved
animals. The increase in mantle polyubiquitinated protein was most substantial as
amounts were below detectable levels in two of three samples in the fed animals. Mean

13
values of polyubiquitinated protein were also about 2-fold higher in gill and heart
although these were not statistically significant, perhaps due to the semi-quantitative
nature of the assay. All other measures were similar between fed and starved S.
officinalis.
In experiment 2, changes of components of the UPS were evident in gill (Fig. 4 –
right panels). There were significant increases in starved versus fed animals in
proteasome activity and polyubiquitin transcript level. The amount of polyubiquitinated
protein also tended to be higher (P = 0.063) and the mean level of proteasome β-subunit
transcript was higher. All other comparisons in heart, mantle, and retractor were similar
between fed and starved S. officinalis.
Given that total RNA is considered to be one determinant of protein synthesis and
20S proteasome activity represents one aspect of protein degradation, the relationship
between these two parameters was assessed. In both experiments 1 and 2, when data for
all tissues from both fed and starved animals were taken into consideration, there was a
linear correlation between 20S proteasome activity and RNA level (experiment 1: y =
0.004x + 10; R2 = 0.41; P = 0.0002 ) (experiment 2: y = 0.58x + 1290; R2 = 0.77; P <
0.0001) (Fig. 5).
Phosphorylation state of signalling molecules
The phosphorylation state of the signalling molecules 4E-BP1 and Akt were
determined in experiment 2 (Fig. 6). The ratio of phosphorylated 4E-BP1 / 4EBP1 total
protein significantly decreased in mantle but significantly increased in gill following food
deprivation. Following starvation there was a significant decrease in the ratio of
phosphorylated Akt / Akt total protein in mantle and retractor muscle. There was no
change in the phosphorylated Akt / Akt total protein in gill.
Protease activities
Overall, there were only minimal changes in the maximal activity of the three
commonly studied proteases (Fig. 7). In experiment 1, starvation resulted in a significant
increase in cathepsin like activity at pH 5.5 in mantle. There was also a tendency for
cathepsin like activity at pH 2.5 to increase in mantle (P = 0.085). In experiment 2, there

14
was a significant increase in calpain activity in retractor. There were no significant
differences in any other of the comparisons.
Metabolic enzymes
There were no significant differences in activities of AspAT, AlAT, GDH, or CS
between fed and starved animals in any tissue (Fig. 8). Heart displayed the most
vigorous activity of all of the enzymes measured. Further analysis revealed a linear
correlation between 20S proteasome activity and CS activity in heart (y = 0.02x + 10; R2
= 0.64; P = 0.002) (Fig. 9).
DISCUSSION
Biochemical and physiological processes are often compared between
cephalopods and fishes, two distantly related groups that are competitors in the same
ecosystems (11, 26, 30, 31). Such comparisons provide fundamental insights into
conserved features that favour species performance. In the following discussion on the
impact of starvation in S. officinalis, reference is made to studies with fishes where
possible.
Digestive gland triglycerides and tissue RNA levels are related
In keeping with previous work, food deprivation was associated with a decrease
in triglyceride content in digestive gland of S. officinalis (7). This finding is important in
setting the context of the current study. The experimental design of different feeding
levels, possibly coupled with the difference in water temperature, nutritional status at the
time of capture, and/or holding times/feeding regimes prior to food deprivation, resulted
in a range of triglyceride contents that provides a platform for comparisons. It is unlikely
that scaling effects have a major impact on the variables in this study given that there was
no statistically significant difference in body mass amongst the experimental groups, and
triglyceride content in the hepatopancreas was not correlated with body mass. Moreover,
based on the scaling relationships presented in Grigoriou and Richardson (15) the
metabolic rate of the group with the lowest mass would be within 28% of the group with

15
the highest mass. The strength of the information is that there were two extreme groups
of fed versus starved animals, regardless of how that end point was achieved. The
experiment 1 data best illustrates what occurs once triglyceride resources are essentially
depleted. Digestive gland triglyceride level also decreased in experiment 2; however,
there were still reserves at the time of sampling. As such, experiment 2 is considered to
represent an earlier stage of the starvation response. The data collectively reveals variable
digestive gland triglyceride levels that reflect a range of nutritional states and which are
useful in relating to other variables.
Total RNA content was highest in S. officinalis gill, intermediate in heart, and
substantially lower in mantle and retractor muscle when data from all groups were
considered together. The content pattern is similar to that observed in O. vulgaris and
fishes (e.g. Atlantic cod and cunner Tautogolabrus adspersus). Further to this point,
RNA content correlates with rates of protein synthesis on a tissue specific basis in these
species (13, 20, 22). It is probable that under routine feeding conditions total RNA
content is a determinant of protein synthesis in S. officinalis, as well, and that rates of
protein synthesis rank order in the same manner in S. officinalis tissues as that of other
species.
The impact of food deprivation on tissue RNA content noted here was consistent
with earlier studies in S. officinalis. (25) and other cephalopods (18, 39). Levels
decreased in mantle muscle during the first stages of starvation and in heart during more
severe food deprivation. More revealing and unique to this study is the relationship
between digestive gland triglyceride level and tissue RNA content. These variables were
significantly correlated in mantle and retractor muscles with the slope being much steeper
in mantle. There was no correlation between digestive gland triglyceride level and heart
RNA content. These findings indicate that the RNA content in mantle is more sensitive to
decreases in overall nutritional status than either retractor muscle or heart, as indicated by
digestive gland triglyceride. Response at the level of total RNA content could contribute
to a decrease in protein synthesis in the absence of food.
The situation in gill is much more complex. The average level of total RNA was
higher in starved than in fed animals. Although the data are limited, total RNA content
very clearly decreased in association with decreases in digestive gland triglyceride level
16
in starved S. officinalis. In fed animals there is a suggestion for such a relationship with a
tentatively greater slope than in starved animals. This implies that in a comparison of any
two animals with the same level of triglyceride in the digestive gland a starved specimen
will have higher levels of RNA in the gill than a S. officinalis that is feeding. It appears
that totally food deprived animals better defend gill protein synthesis as nutritional status
falls. The implications of this are discussed below.
Ubiquitin-proteasome system is activated
This paper provides the first measurements of elements of the UPS in any
cephalopod. All tissues displayed 20S proteasome activity, polyubiquinated protein, and
transcripts for proteasome ß-subunit (i.e. the catalytic subunit), and polyubiquitin. In
rainbow trout, 20S proteasome activity and total ubiquitin protein is higher in gill than in
numerous other tissues (23) which is qualitatively similar to the current information with
S. officinalis. These findings suggest that gill tissue has the highest tissue specific rate of
protein degradation via the UPS in both cephalopods and fish. When all groups and
tissues were considered together there was a correlation between 20S proteasome activity
and RNA content in both experiments, suggesting that the two variables are both linked
to protein turnover. This is consistent with total RNA being an index of protein synthesis
and the UPS being mostly responsible for the degradation of damaged proteins.
In experiment 1, where the nutritional status of the S. officinalis is considered to
be the lowest, there were significant increases in mantle polyubiquinated protein, and
levels of proteasome ß-subunit and polyubiquitin mRNA. There was no change in 20S
proteasome activity but, given the increase in proteasome ß-subunit transcript, a longer
period of starvation may have led to such. This might also indicate that regulation of the
UPS degradation pathway is not primarily at the level of 20S proteasome content/activity.
Regardless, significant changes in three components of the UPS in mantle strongly
suggest activation of this process, which would result in proteolysis leading to the
production of amino acids to fuel metabolism. Three studies with rainbow trout also
report no change in 20S proteasome activity in muscle following 14 days of starvation,
similar to the current finding with S. officinalis (9, 23, 35). Moreover, increases were
reported in the expression of ubiquitin-protein ligases (9, 35) and in polyubiquinated
17
protein (35) consistent with activation of the UPS. Although Martin et al. (23) present the
argument, based primarily on a decrease in total ubiquitin protein, that 14 days of
starvation in rainbow trout leads to a decrease in proteolysis by the UPS in muscle, more
recent findings do not support this viewpoint. The bulk of the evidence suggests that a
period of starvation resulting in almost total depletion of digestive gland triglyceride
reserves in S. officinalis or a significant weight loss in rainbow trout results in activation
of the UPS in muscle involving increases in protein ubiquitination.
The situation in experiment 2, which is considered better to reflect the first
responses to starvation, is quite different. In this case there were no changes in any of the
UPS variables in heart, mantle, and retractor muscle. In gill of starved as opposed to fed
S. officinalis, however, 20S proteasome activity and polyubiquitin mRNA both
significantly increased, as did the average levels of proteasome ß-subunit transcript and
polyubiquinated protein. It appears there is activation of the UPS in gill as an early
response to starvation that could be part of gill remodeling discussed below.
Signalling molecules lead to tissue specific responses
The phosphorylation state of 4E-BP1 is considered to be an important controlling
factor of protein synthesis. Dephosphorylated 4E-BP1 binds to the eukaryote initiation
factor, eIF4E and holds it in an inactive state. Upon phosphorylation, 4E-BP1p
dissociates from eIF4E allowing the latter to bind to eIF4G and subsequently facilitate
the onset of mRNA translation. The phosphorylation state of 4E-BP1 is itself under
control by Akt. Phosphorylation of Akt results in the phosphorylation of 4E-BP1 either
directly or via a multistep process involving mTOR. Both pathways lead to the activation
of protein synthesis (1,14). The decreased 4E-BP1p/4E-BP1 and Aktp/Akt that occurred
in mantle in experiment 2 should work counter to the above scenario and result in
reduced rates of protein synthesis via regulation of translation. We propose that in
mantle this is an early response to a decrease in nutritional status and works in parallel
with the decrease in total RNA. The Akt response in S. officinalis mantle is similar to that
previously described in muscle of rainbow trout starved for 14 days (35) again illustrating
a common principle between a cephalopod and a teleost. In starved rainbow trout,
dephosphorylation of Akt is also associated with increased expression of ubiquitin-
18
protein ligases and polyubiquinated protein in muscle (35). In mammalian tissues,
downregulation of Akt signalling permits the transcription of ubiquitin-protein ligases
(34). A similar signalling mechanism is likely occurring in S. officinalis mantle as well.
Once more the situation in gill, where there was an increase in 4E-BP1p/4E-BP1
ratio during the first stages of food deprivation, is strikingly different from the other
tissues. The elevated phosphorylation of 4E-BP1 suggests an increase in mRNA
translation and subsequent rates of protein synthesis. In concert with an activation of the
UPS, this would result in at least a transient increase in protein turnover.
Proteases and metabolic enzymes
The most commonly measured proteases cathepsin A-, B- ,H- and L-like at pH
5.5, cathepsin D- and E-like at pH 2.5, and calpain-like at neutral pH were all detectable
in S. officinalis tissues. This was not surprising since cathepsins have been well described
in the viscera of S. officinalis (4). Activities of these enzymes were generally higher in
mantle and retractor muscles than gill. This is in contrast to 20S proteasome activity that
is higher in gill than muscle tissues. Furthermore, there is no obvious linkage between
activity of these proteases and protein synthesis as there is for 20S proteasome. The
activity of these proteases were not influenced by starvation with the one exception of
cathepsin A-, B-, H- and L-like at pH 5.5 in mantle muscle. In this case, activity
increased in starved S. officinalis in experiment 1 when triglyceride content in the
digestive gland was lowest. This finding suggests that the lysosomal pathway of protein
degradation is also activated to provide amino acids for energy metabolism. Starvation in
rainbow trout resulted in increased expression of cathepsin L transcript in muscle
(enzyme activity was not reported) (9) and activity of cathepsin D in muscle of Atlantic
cod (9, 16). Although there may be minor variations on this theme it appears that the
lysosomal protein degradation pathway is activated at some point during starvation in
muscle of both S. officinalis and fishes.
Enzymes involved in amino acid trafficking (AspAT, AlAT, GDH) and CS were
detected in all tissues. Enzyme activities were always highest in heart reflecting the high
energetic demands of the tissue. This finding is consistent with enzyme activity patterns
in other cephalopods (2, 28). There were no differences in activity levels of any of the
19
metabolic enzymes between fed and starved S. officinalis. These data though are only
from experiment 1, which compared S. officinalis. with intermediate to very low levels of
triglyceride in the digestive gland. As such, although we think it unlikely, we cannot rule
out the possibility that well-nourished specimens would exhibit different activity levels of
these enzymes.
As an aside to the main aspects of this study, we also report a correlation between
20S proteasome and CS activities in heart. This relationship has also been noted for
spotted wolffish (Anarhichas minor) and sea bass (Dicentrarchus labrax) (Lamarre et al.,
in preparation). The significance of this correlation is under investigation.
Perspectives and Significance
An initial response to food deprivation in mantle muscle of S. officinalis, while
triglyceride reserves are still available in the digestive gland, appears to be a decrease in
protein synthesis. This contention is based upon the dephosphorylation of 4E-BP1, a
signalling molecule intimately involved in the regulation of translation, and
phosphorylation of Akt that either directly or indirectly controls the phosphorylation state
of 4E-BP1. In addition, decreases in the level of total RNA would contribute to a
decrease in protein synthesis. As starvation progresses to the point of almost total
depletion of digestive gland triglyceride, protein degradation is activated. The protein
breakdown through the UPS is enhanced via an increase in polyubiquitinated protein
available to the proteasome. This in part would be due to an increase in ubiquitin, as the
level of polyubiquitin mRNA is markedly elevated. In addition, increases in cathepsin
activities imply that the lysosomal pathway for protein breakdown is also called upon.
Together, these processes would provide amino acids for energy metabolism, although
increases in activity of specific transaminases are not a requirement for catabolism. This
scenario is consistent with models presented for starvation in muscle of rainbow trout and
other fishes.
The response to starvation in gill of S. officinalis is much more provocative and
unlike that of mantle. In gill there appears to be an increase in protein synthesis during
the early stages of food deprivation as suggested by increased phosphorylation of 4E-
BP1. As well, levels of total RNA are higher in starved than in fed S. officinalis at similar

20
levels of digestive gland triglyceride. At the same time, apparent rates of protein
degradation are enhanced through the UPS, as implied by a significant increase in 20S
proteasome activity and polyubiquitin mRNA, and a similar directional change in mean
values of proteasome mRNA and polyubiquitinated protein. Taken together, these
changes imply enhanced protein turnover with modification of the protein pool (i.e. gill
remodeling). Change in gill structure occurs in fishes under various conditions. For
instance, in carp (Carassius carassius) and goldfish (C. auratus) exposed to low
temperature, with a subsequent decrease in oxygen consumption, there is increased
mitotic activity and a cell mass fills the space between lamellae to limit ion loss (37). In
food deprived juvenile S. officinalis oxygen consumption was maintained for six days but
thereafter decreased to 35% of initial level by day 27. Following resumption of feeding
oxygen consumption immediately returned to control levels (15) revealing a maintenance
of functional integrity of the oxygen delivery system. During the period of food
deprivation associated with reduced oxygen consumption, we propose that there is a
reduction in requirement for exposed lamellae. This is in turn could lead to gill
remodeling, involving elevated protein turnover, perhaps to reduce the loss of a
haemolymph borne component normally obtained in the diet. Once feeding commences
the oxygen consumption may be elevated in part due to the selective protection of gill
structure and function. Maintenance of gill function would also allow the animal to meet
the challenges of ionic and acid-base balance with resumption of feeding and associated
activity and cardiac output.
ACKOWLEDGEMENTS
We thank Connie Short and Kathy Clow for their technical assistance.
GRANTS
This work was supported in part by a Natural Sciences and Engineering Research
Council (NSERC) of Canada Discovery Grant (WRD), by the Centre National de la
21
Recherche Scientifique and the Université Montpellier 2. WRD holds the Canada
Research Chair in Marine Bioscience. SL was supported by a post-doctoral fellowship
from the Canadian Institutes for Health Research. DD was supported by a post-graduate
scholarship from NSERC.
DISCLOSURES
No conflicts of interest, financial or otherwise, are declared by the author(s).
REFERENCES
1. Balakuntalam SK, Mariappan MM, Sataranatarajan K, Lee MJ, Feliers D.
mRNA translation: unexplored territory in renal science. J. Am Soc Nephrol 17:
3281–3292. 2006.
2. Ballantyne JS, Hochachka PW, Mommsen TP. Studies on the metabolism of the
migratory squid, Loligo opalescens: enzymes of tissues and heart mitochondria.
Mar Biol Lett 2: 75-85. 1981.
3. Bassaglia Y, Bekel T, Da Silva C, Poulain J, Andouche A, Navet S, Bonnaud L.
ESTs library from embryonic stages reveals tubulin and reflectin diversity in
Sepia officinalis (Mollusca — Cephalopoda). Gene 498: 203-211. 2012.
4. Bihan EL, Zatylny C, Perrin A, Koueta N. Post-mortem changes in viscera of
cuttlefish Sepia officinalis L. during storage at two different temperatures. Food
Chem 98: 39-51, 2006.
5. Boucher-Rodoni R, Mangold K. Ammonia excretion during feeding and starvation in
Octopus vulgaris. Mar Biol 86, 193-197, 1985.
6. Carter CG, Lynch KA, Moltschaniwskyj NA. Protein synthesis in a solitary benthic
cephalopod, the Southern dumpling squid (Euprymna tasmanica). Comp Biochem
Physiol 153A: 185–190, 2009.
7. Castro BG, Garrido JL, Sotelo, C.G. Changes in composition of digestive gland and
mantle muscle of the cuttlefish Sepia officinalis during starvation. Mar Biol. 114:
11- 20, 1992.
22
8. Clarke A, Rodhouse RG, Holmes LJ, Pascoe PL. Growth rates and nucleic acid ratio
in cultured cuttlefish Sepia officinalis (Mollusca: Cephalopods). J Exp Mar Biol
Ecol 133: 229-240, 1989.
9. Cleveland BM, Weber GM, Blemings KP, Silverstein JT. Insulin-like growth
factor-I and genetic effects on indexes of protein degradation in response to
feed deprivation in rainbow trout (Oncorhynchus mykiss). Am. J. Physiol Regul
Integr Comp Physiol 297: R1332–R1342, 2009.
10. Collison KS, Maqbool Z, Saleh SM, Inglis A, Makhoul NJ, Bakheet R,
Al-Johi M, Al-Rabiah R, Zaidi,M.Z, Futwan A, Al-Mohanna FA. Effect of
dietary monosodium glutamate on trans fat-induced nonalcoholic fatty liver
disease. J Lipid Res 50: 1521-1537, 2009.
11. Driedzic W.R. Matching of cardiac oxygen delivery and fuel supply to energy
demand in teleosts and cephalopods. Can J Zool 66: 1078-1083, 1988.
12. Driedzic WR, Sidell BD, Stewart JM, Johnston IA. Maximal activities of enzymes
of energy metabolism in cephalopod systemic and branchial hearts. Physiol Zool
63: 615-629, 1990.
13. Foster AR, Houlihan DF, Hall SJ, Burren LJ. The effects of temperature
acclimation on protein synthesis and nucleic acid content on juvenile cod (Gadus
morhua L). Can J Zool 70, 2095-2102. 1992.
14. Goodman CA, Mayhew DL, Hornberger TA. Recent progress toward
understanding the molecular mechanisms that regulate skeletal muscle mass.
Cellular Signalling 23: 1896–1906, 2011.
15. Grigoriou P, Richardson C.A. Effect of body mass, temperature and food
deprivation on oxygen consumption rate of common cuttlefish, Sepia officinalis.
Mar Biol 156: 2437-2481, (2009).
16. Guderly H, Lapointe D, Bédard M, Dutil J-D. Metabolic priorities during
starvation: enzymes sparing in liver and white muscle of Atlantic cod, Gadus
morhua L. Comp Biochem Physiol A 135: 347-356, 2003.
17. Hochachka PW, Fields JHA. Arginine, glutamate, and proline as substrates for
oxidation and for glycogenesis in cephalopod tissues. Pacific Sci 36: 325-335,
1982.

23
18. Houlihan DF, Kelly K, Boyle PR. Correlates of growth and feeding in laboratory-
maintained Eledone cirrhosa (Cepalopoda:Octopoda). J Mar Bio. Ass U.K. 78:
919-932, 1998.
19. Houlihan DF, McMillan DN, Agnisola C, Genoino IT, Foi, L. Protein synthesis
and growth in Octopus vulgaris. Mar Biol 106: 251-259, 1990.
20. Houlihan DF, McMillan DN, Laurent P. Growth rates, protein synthesis, and
protein degradation rates in rainbow trout: effects of body size. Physiol Zool 59:
482-493, 1986.
21. Jones LJ, Upson RH, Haugland RP, Panchuk-Voloshina N, Zhou M, Haugland
R.P. Quenched BODIPY dye-labeled casein substrates for the assay of protease
activity by direct fluorescence measurement. Anal Biochem 251: 144-152, 1997.
22. Lewis JM, Driedzic WR. Tissue-specific changes in protein synthesis associated
with seasonal metabolic depression and recovery in the north temperate labrid,
Tautogolabrus adspersus. Am J Physiol Regul Integr Comp Physiol 293: R474-
R481, 2007. 23. Martin SAM, Blaney S, Bowman AS, Houlihan DF. Ubiquitin-proteasome-
dependent proteolysis in rainbow trout (Oncorhynchus mykiss): effect of food
deprivation. Pflug Arch Eur J Physiol 445: 257–266, 2002.
24. Medina R, Wing SS, Goldberg AL. Increase in levels of polyubiquitin and
proteasome mRNA in skeletal muscle during starvation and denervation atrophy.
Biochem J 307: 631–637, 1995.
25. Melzner F, Forsythe J.W, Lee PG. Wood JB, Piatkowski U, Clemmesen C.
Estimating recent growth in the cuttlefish Sepia officinalis: are nucleic acid-based
indicators for growth and condition the method of choice? J Exp Mar Biol Ecol
317: 35-51, 2005.
26. Moltschaniwskyj NA. Understanding the process of growth in cephalopods. Mar
Freshwater Res 55: 379-386, 2004.
27. Moltschaniwskyj NA, Carter CG. Protein synthesis, degradation, and retention:
mechanisms of indeterminate growth in cepalopods. Physiol Biochem Zool 83:
997-1008, 2010.

24
28. Mommsen TP, Hochachka PW, French CJ. Metabolism of arginine, proline, and
ornithine in tissues of the squid, Illex illecebrosus. Can J Zool 61: 1835-1846,
1983.
29. Mycek JM. Cathepsins. Methods Enzymol. 19: 285-315, 1970.
30. O’Dor R, Webber, D. The constraints on cephalopods:why squid aren't fish. Can J
Zool 64: 1591 – 1605, 1986.
31. Packard A. Cephalopods and fish: limits of convergence. Biol. Rev. Cambridge
Philos Soc 47: 241 – 307, 1972.
32. Pfaffl MW. A new mathematical model for relative quantification in real-time
RT-PCR. Nucleic Acids Res 29: 2003–2007, 2001.
33. Rosa R, Pereira J., Nunes ML. Biochemical composition of cephalopods with
different life strategies, with special reference to a giant squid,
Architeuthis sp. Mar Biol 146: 739–751, 2005.
34. Sandri M, Sandri C, Gilbert A, Skurk C, Calabria E, Picard A, Walsh K,
Schiaffino S, Lecker SH, Goldberg, A.L. Foxo transcription factors induce the
atrophy-related ubiquitin ligase atrogin-1 and cause skeletal muscle atrophy. Cell
117: 399–412, 2004.
35. Seiliez I, Panserat S, Skiba-Cassy S, Fricot A, Vachot C, Kaushik S, Tesseraud
S. Feeding status regulates the polyubiquitination step of the ubiquitin-
proteasome-dependent proteolysis in rainbow trout (Oncorhynchus mykiss)
muscle. J Nutri 138: 487-491, 2008.
36. Shibatani T, Ward W.F. Sodium dodecyl-sulfate (Sds) activation of the 20s
proteasome in rat-liver. Arch Biochem Biophys 321: 160-166, 1995.
37. Sollid J, Nilsson GE. Plasticity of respiratory structures—Adaptive remodeling of
fish gills induced by ambient oxygen and temperature. Resp Physiol Neurobiol
154: 241–251, 2006.
38. Thompson VF, Saldaña S, Cong J, Goll DE. A BODIPY fluorescent microplate
assay for measuring activity of calpains and other proteases. Anal. Biochem 279:
170-178, 2000.

25
39. Vidal ÉAG, DiMarco P, Lee P. Effects of starvation and recovery on the survival,
growth and RNA/DNA ratio in loliginid squid paralarvae. Aquaculture 260: 94–
105, 2006.
40. Wing SS, Haas, AL, Goldberg AL. Increase in ubiquitin-protein conjugates
concomitant with the increase in proteolysis in rat skeletal muscle during
starvation and atrophy denervation. Biochem J 307: 639-645, 1995.

26
Table 1. Amplicon sizes and sequences of primers used for proteasome β-subunit,
polyubiquitin and 16S rRNA real-time quantitative PCR analysis
Transcript Direction_Sequence (5’- / -3’) Amplicon size (bp)
proteasome
(β-subunit)
F_ATAATGCTGGCTGCCGACACT
R_TGCGGCAATCACAGTAGCATC
102
polyubiquitin F_ CAACTCTCCTACTGGACGAAAGC
R_ TGTCCAGAGCGCTAAACAACT
70
16S rRNA F_ AATTTCTCCGGTCCTTTCGT
R_ TGCAGTAGCTTTAGGTGGTGAA
125

27
Legends to Figures.
Fig. 1. Triglyceride content of digestive gland and tissue RNA levels in fed and starved S.
officinalis. Left panels – experiment 1. Right panels experiment 2. (A) and (B)
triglyceride levels. (C) and (D) RNA levels. Closed bars represent fed animals; open bars
represent starved animals. Asteric indicates a significant difference between fed and
starved animals. Values are means ± s.e.m. N sizes are as follows. Experiment 1:
triglyceride – 3; RNA, gill fed - 2, gill starved - 3, all other groups - 6 to 8.
Experiment 2: triglyceride fed – 5, starved - 4; RNA, gill fed - 3, gill starved - 4, all other
fed groups - 3, all other starved groups – 4.
Fig. 2. Triglyceride content of digestive gland versus tissue RNA levels in fed and
starved S. officinalis. (A) mantle. (B) retractor. (C) heart. (D) gill. Solid symbols
represent fed animals; open symbols represent starved animals. Squares are from
experiment 1. Circles are from experiment 2.
Fig. 3. RNA level in various tissues of S. officinalis. Both fed and starved animals for
experiments 1 and 2 are included in the analysis. Values are means ± s.e.m. Values with
different letters indicate a statistically significant difference. N size for gill is 12 and for
all others 21.
Fig. 4. Components of the ubiquitin-proteasome system in various tissues of fed and
starved S. officinalis. Left panels - experiment 1. Right panels - experiment 2. (A) and (B)
20S proteasome activity (fluorescent units min-1 50 µg protein-1). (C) and (D) proteosome
β-subunit mRNA levels (relative amount). (E) and (F) polyubiquitinated protein (relative
amount). (G) and (H) polyubiquitin mRNA levels (relative amount). Closed bars
represent fed animals; open bars represent starved animals. Asteric indicates a significant
difference between fed and starved animals. Values are means ± s.e.m.
N sizes are as follows: 20S proteasome activity: Experiment 1, gill fed - 2, starved – 3;
heart fed – 5, starved – 7; all other conditions – 4. Experiment 2, all conditions – 4.

28
Proteasome β-subunit mRNA: Experiment 1: gill fed - 2, starved – 3; all other conditions
– 5. Experiment 2, gill fed – 3, starved – 4; heart fed – 3, starved – 4; mantle fed – 4,
starved – 4; retractor fed - 3, starved - 4. Polyubiquitinated protein: Experiment 1, gill
fed – 2, starved - 3; heart, fed – 2, starved – 6; mantle, fed – 3, starved – 4; retractor, fed
– 6, starved – 6. Experiment 2, mantle starved – 3; all other conditions – 4.
Poylubiquitinated mRNA: Experiment 1, mantle fed – 5, starved - 5. Experiment 2, gill
fed – 3, starved – 4; heart fed – 3, starved – 4; mantle fed – 4, starved – 4; retractor fed –
3, starved – 4.
Note: it is not possible to directly compare measurements between experiments due to the
use of different instrumentations and slightly different techniques.
Fig. 5. 20S proteasome activity versus RNA level. (A) Experiment 1. (B) Experiment 2.
Values for both fed and starved animals for all tissues (gill, heart, mantle, retractor)
sampled were considered in the analysis. Both regressions are significantly different from
zero. Note: it is not possible to directly compare measurements between experiments due
to the use of different instrumentation and slightly different techniques.
Fig. 6. Levels of signalling molecules in various tissues of fed and starved S. officinalis.
(A) Ratio of phosphorylated 4E-BP1 / 4E-BP1 total protein. (B) Ratio of
phosphorylated Akt / Akt total protein. Solid symbols represent fed animals; open
symbols represent starved animals. Asteric indicates a significant difference between fed
and starved animals. Values are means ± s.e.m. N sizes for gill and mantle - 4. N sizes
for retractor - 3.
Fig. 7. Maximal activity levels of proteases in various tissues of fed and starved S.
officinalis. Left panels – experiment 1. Right panels – experiment 2. (A) and (B)
cathepsin like activity at pH 5.5. (C) and (D) cathepsin like activity at pH 2.5. (E) and
(F) calpain like activity. Data are expressed as flourescent units min-1 mg protein-1.
Solid symbols represent fed animals; open symbols represent starved animals. Asterisk
indicates a significant difference between fed and starved animals. Values are means ±
s.e.m. N sizes are as follows:

29
Experiment 1: gill fed – 2, gill starved – 3; mantle and retractor fed – 5; mantle and
retractor starved – 7. Experiment 2: all conditions - 4 except cathepsin at pH 2.5, starved
mantle – 3.
Note: it is not possible to directly compare measurements between experiments due to
the use of different instrumentation and slightly different techniques.
Fig. 8. Maximal in vitro activity levels of metabolic enzymes molecules in various tissues
of fed and starved S. officinalis in experiment 1. Data are expressed as µmol min-1 mg
protein-1. Solid symbols represent fed animals; open symbols represent starved animals.
Values are means ± s.e.m. N sizes are as follows: gill – 3 (in all cases); heart – AspAT
and AlAT - 3; heart – GDH and CS - 5 (fed) and - 8 (starved); mantle and retractor – 4 in
all cases, except CS where mantle - 2 and retractor - 3.
Fig. 9. 20S proteasome activity versus CS activity in heart in experiment 1. Solid
symbols represent fed animals; open symbols represent starved animals. The regression is
significantly different from zero.

Fed Starved0
10
20
30
40
*
Experiment 1
A
Trig
lyce
ride
(mg
/ g)
Figure 1.
Gill Heart Mantle Retractor0
1000
2000
3000
4000
5000
*
D
RN
A ( �
g / g
)
Gill Heart Mantle Retractor0
1000
2000
3000
4000
*
C
RN
A ( �
g / g
)
Fed Starved0
20
40
60
80
*B
Experiment 2
Trig
lyce
ride
(mg
/ g)

0 200 400 600
0
20
40
60
A mantle
RNA (�g / gm)
Trig
lyce
ride
(mg
/ g)
0 200 400 600
0
20
40
60
B retractor
RNA (�g / gm)
Trig
lyce
ride
(mg
/ g)
0 500 1000 1500 2000
0
20
40
60
C heart
RNA (�g / gm)
Trig
lyce
ride
(mg
/ g)
0 2000 4000 6000 8000
0
20
40
60
D gill
RNA (�g / gm)
Trig
lyce
ride
(mg
/ g)
Figure 2.

Gill Heart Mantle Retractor0
1000
2000
3000
4000
b
c c
a
RN
A ( �
g / g
)
Figure 3.

Gill Heart Mantle Retractor0
10
20
30
Experiment 1
APr
otea
som
e(f.
u. m
in-1
50�g
pro
tein
-1)
Gill Heart Mantle Retractor0
1000
2000
3000
4000
5000
*
Experiment 2
B
Prot
easo
me
(f.u.
min
-1 5
0�g
pro
tein
-1)
Gill Heart Mantle Retractor0.0
0.5
1.0
1.5
2.0
2.5
*
C
Prot
easo
me
mR
NA
(RQ
)
Gill Heart Mantle Retractor0.0
0.5
1.0
1.5
2.0
2.5 D
Prot
easo
me
mR
NA
(RQ
)
Gill Heart Mantle Retractor0
10000
20000
30000
*
E
Poly
ubiq
uina
ted
prot
ein
(rel
ativ
e am
ount
)
Gill Mantle Retractor0
20000
40000
60000 F
Poly
ubiq
uina
ted
prot
ein
(rel
ativ
e am
ount
)
Fed Starved0
2
4
6
8 *G
Mantle
Poly
ubiq
uitin
mR
NA
(RQ
)
Gill Heart Mantle Retractor0.0
0.5
1.0
1.5
*
H
Poly
ubiq
uitin
mR
NA
(RQ
)
Figure 4.

0 1000 2000 3000 4000 50000
10
20
30 A
RNA (�g / gm)
Prot
easo
me
(f.u.
min
-1 5
0�g
pro
tein
-1)
0 2000 4000 6000 80000
2000
4000
6000 B
RNA (�g / gm)
Prot
easo
me
(f.u.
min
-1 5
0�g
pro
tein
-1)
Figure 5.

Gill Mantle Retractor0.0
0.5
1.0
1.5
2.0
* *
A
AKTp
/AK
T
Gill Mantle Retractor0.0
0.5
1.0 * *
B
4EB
P1p/
4EB
P1
Figure 6.

Gill Mantle Retractor0
200000
400000
600000
*
A
Experiment 1
Cat
heps
in a
t pH
5.5
(f.u
. h-1
mg
prot
ein
-1)
Gill Mantle Retractor0
5000
10000
15000 BExperiment 2
Cat
heps
in a
t pH
5.5
(f.u
. h-1
mg
prot
ein-1
)
Gill Mantle Retractor0
50000
100000
150000
200000C
Cat
heps
in a
t pH
2.5
(f.u
. h-1
mg
prot
ein
-1)
Gill Mantle Retractor0
500000
1000000
1.5�100 6
2.0�100 6 E
Cal
pain
(f.u
. h-1
mg
prot
ein
-1)
Gill Mantle Retractor0
10000
20000
30000
*
F
Cal
pain
(f.u
. h-1
mg
prot
ein-1
)
Figure 7.
Gill Mantle Retractor0
500
1000
1500
2000
2500 D
Cat
heps
in a
t pH
2.5
(f.u
. h-1
mg
prot
ein
-1)

Gill Heart Mantle Retractor0
200
400
600
800
1000 AAs
pAT
( �m
ol m
in-1
mg
prot
ein-1
)
Gill Heart Mantle Retractor0
100
200
300
400
500 B
AlAT
( �m
ol m
in-1
mg
prot
ein-1
)
Gill Heart Mantle Retractor0
100
200
300
400
500 C
GD
H( �
mol
min
-1 m
g pr
otei
n-1)
Heart Mantle Retractor0
100
200
300D
CS
( �m
ol m
in-1
mg
prot
ein-1
)
Figure 8.

0 100 200 300 400 50010
15
20
25
CS(�mol min-1 mg protein-1)
Prot
easo
me
activ
ity(f.
u. m
in-1
50�g
pro
tein
-1)
Figure 9.
Copyright © 2022 FDOKUMEN