1 COVER - ISSIMM 2019
144
1 COVER
-
Upload
khangminh22 -
Category
Documents
-
view
0 -
download
0
Transcript of 1 COVER - ISSIMM 2019

1
COVER

The 4th International Seminar on Sensors, Instrumentation, Measurement and Metrology
1
CONFERENCE PROGRAM
The 4th International Seminar on Sensors, Instrumentation, Measurement and Metrology (ISSIMM) 2019
Padang, November 14th, 2019

The 4th International Seminar on Sensors, Instrumentation, Measurement and Metrology
2
Table Of Contents
Table Of Contents ............................................................................................................................ 2
Committee ........................................................................................................................................ 7
Meeting Venue ................................................................................................................................. 8
Chair’s Report ................................................................................................................................. 9
Welcome Message: Dean of Faculty of Mathematics and Natural Science .............................. 10
Opening Remark from the Rector of Universitas Negeri Padang ............................................... 11
Rundown Of ISSIMM 2019 .......................................................................................................... 12
Parallel Session Schedule Of ISSIMM 2019 ................................................................................ 13
Planary Session
Quartz Crystal Microbalance for Physical Sensor, Chemical Sensor and Biosensor: Sensing
Devices, Acquisition and Challange
Setyawan P. Sakti ............................................................................................................................ 24
Smart Sensing For A Better Tomorrow
Koo Voon Chet ................................................................................................................................ 25
Parallel Session
01-ISSIMM2019 Low Cost Dual Frequency Impedance Analysis For Measuring Internal And
External Cellular Fluid .............................................................................................. 27
02-ISSIMM2019 A High Voltage Electrostatic Filter For Fine Particles Capture Applied in
Motorcycle Exhaust System .................................................................................... 28
03-ISSIMM2019 Design and Implementation of Water Pump Control System for Rice Field
Irrigation .................................................................................................................. 30
04-ISSIMM2019 Beat Frequency M easurement of the Stabilized He-Ne Laser 633 nm Calibration in
BSN ........................................................................................................................... 32
05-ISSIMM2019 Changes Of Mangrove Area In Pangpang Bay, Banyuwangi 2014-2018 Using
Landsat-8 Imagery ................................................................................................... 34
06-ISSIMM2019 Oil Spill Monitoring using Radar Image ................................................................... 36
07-ISSIMM2019 Algorithm of Time and Frequency Remote Calibration System of SNSU- BSN .... 37
08-ISSIMM2019 Analysis and Characterization of Magneto-Optical Kerr Effect Measurement
System: Case Study on CoFeB ................................................................................. 39
09-ISSIMM2019 The Design of Litopenaeus Vannamei Automatic Feeder ......................................... 40
010-ISSIMM2019 Implementation of Single Shot Detector for Object Finding in Drone Platform ..... 42
011-ISSIMM2019 Stroke Severity Classification of EEG Signals by Recurrent Neural Network ......... 44
012-ISSIMM2019 Influence of The Nitrogen exposure Time to The Plasma Treatment on the
Hydrophobicity of polystyrene surfaces ................................................................ 45
013-ISSIMM2019 Plasma Intensification in 2 MHz RF Glow Discharge in Carbon Film Plasma
Sputtering Deposition by means of a Hollow Cathode ......................................... 47

The 4th International Seminar on Sensors, Instrumentation, Measurement and Metrology
3
014-ISSIMM2019 Implementation of Convolutional Neural Networks to Determine Lightning
Location .................................................................................................................... 48
015-ISSIMM2019 Rain Detection in Image Using Convolutional Neural Network .............................. 50
016-ISSIMM2019 Cloud Detection Method for Pleiades Images Using Spectral Indices ..................... 52
017-ISSIMM2019 Characterization of Circular Patch Antenna at 1 GHz for Crack Sensing ................ 53
018-ISSIMM2019 Quality Assessment and Validation of Digital Surface Model Derived from LiDAR
Using TerraSAR-X in Land Cover
Gamma Knife Application ........................................................................................ 56
021-ISSIMM2019 Dose Evaluation of Organ at Risk during Treatment Using Gamma Knife
Stereotactic Radiosurgery (GKSRS): Phantom Study .............................................. 57
022-ISSIMM2019 Analysis Of Energy-Peaks Characteristic In NaI(Tl) Spectrometer For Radionuclide
Identification In Environmental Radiation Monitoring device ................................. 59
023-ISSIMM2019 A Systematic Literature Reviews of Multichannel Analyzer Based on FPGA for
Gamma Spectroscopy ................................................................................................ 61
024-ISSIMM2019 Object Detection for Autonomous Search and Rescue Quadrotor Application ....... 62
025-ISSIMM2019 Unmanned Aerial Vehicle Object Tracking and Following ...................................... 64
026-ISSIMM2019 Infant Cry Classification Using CNN-RNN ............................................................. 65
027-ISSIMM2019 A Study of Micro-Bubble Generator for Litopenaeus Vannamei Pond .................... 67
028-ISSIMM2019 Comparison between two-stage and three-stage Peltier Thermoelectrics driven by
Pulse Width Modulation............................................................................................ 68
029-ISSIMM2019 Fog Prediction Using Deep Learning: A Case Study in Wamena Airport................ 69
030-ISSIMM2019 Effect of skull contours using manual measurement and CT Image on doses
distribution in Gamma Knife Stereotactic Radiosurgery: Phantom Study ................ 70
031-ISSIMM2019 Design Of Water Height Detectors In Runway Based On Internet Of Things ......... 72
032-ISSIMM2019 Design of Neural Network and PLC based Water Flow Controller .......................... 74
033-ISSIMM2019 Monitoring Distribution System of Carbon Monoxide and Surface Ozone Based On
GPS and Microcontroller ......................................................................................... 75
034-ISSIMM2019 Diurnal Variation of Radar Reflectivity Factor In Intense Convective Clouds Over
Indonesia ................................................................................................................... 77
035-ISSIMM2019 Design Measuring Instrument of Volume and The Number of Drops Infusion on
Automatic Infusion Monitoring System Arduino Based........................................... 78
036-ISSIMM2019 Center Silver nanoparticle preparation by colorimetric method and its application as
a metal ion detector ................................................................................................... 80
037-ISSIMM2019 Integration of LAPAN’s Remote Sensing Ground Station Control and Monitoring
System Application .................................................................................................. 81
038-ISSIMM2019 A Measurement Low Magnetic Field at Copper Plate Electromagnet...................... 82
............................................................................ 55
020-ISSIMM2019 Analysis of Magnetic Resonance Image Quality Using an In-House Phantom:

The 4th International Seminar on Sensors, Instrumentation, Measurement and Metrology
4
039-ISSIMM2019 Verification of Dose Distribution on The Gamma Knife Perfexion Radiosurgery
Using Gafchromic Ebt3 Film: Rando Fantom Study ............................................... 83
040-ISSIMM2019 Feature Selection with LASSO for Classification of Ischemic Strokes Based on EEG
Signals ....................................................................................................................... 84
041-ISSIMM2019 Predictive Maintenance Magnetic Sensor using Random Forest Method ................ 85
042-ISSIMM2019 Calibration of Dynamic Thorax Phantom In-house for Radiotherapy Dosimetry .. 86
043-ISSIMM2019 Synthesis and Characterization of Graphene Oxide from Biomass Waste ............... 88
044-ISSIMM2019 Design of High Efficiency Active Class E Rectifier using PMOS Switch for Hybrid
Wireless Power Transfer ........................................................................................... 89
045-ISSIMM2019 EEG-EMG based Bio-Robotics Elbow Orthotics Control Development.................. 91
046-ISSIMM2019 Atmospheric Correction Models for Monitoring Rice Plants with Landsat-8 OLI and
Sentinel-2 .................................................................................................................. 94
047-ISSIMM2019 Comparative Study of Hyperspectral Acquisition Technique for Measuring Total
Soluble Content and pH in Honey ............................................................................ 95
048-ISSIMM2019 Real Time Monitoring State-of-Charge Battery using Internal Resistance
Measurements for Remote Applications ................................................................... 96
049-ISSIMM2019 Prediction System for Flavonoid Content on Bisbul Leave (Diospyros discolor
Willd.) Using Deep Neural Networks Regression .................................................... 97
050-ISSIMM2019 Design Analysis of Consolidation of Cellular Operators in Indonesia ..................... 98
051-ISSIMM2019 Prediction of PM2.5 and PM10 Parameters Using Artificial Neural
Network: Case Study in Kemayoran, Jakarta ............................................ 99
052-ISSIMM2019 Identification System for Beeswax on Malang Apple Using VNIR Imaging ......... 100
053-ISSIMM2019 Magneto-Optic Faraday Effect of Vegetable Oils ................................................... 101
054-ISSIMM2019 A Comparison of Joint Reversible Data Hiding Methods in Encrypted Remote
Sensing Satellite Images.......................................................................................... 103
056-ISSIMM2019 Implementation of Artificial Neural Networks for Very Short Range
WeatherPrediction .................................................................................................. 104
057-ISSIMM2019 Simple I-V Acquisition Module with High Side Current Sensing Principle for Real
Time Photovoltaic Measurement ............................................................................. 105
058-ISSIMM2019 Developtment Of LVDT (Linear Variable Differential Transformer) Sensor as Land
Displacement Sensor ............................................................................................... 106
059-ISSIMM2019 An Implementation of Haar-Cascaded Detection for Indoor Hexacopter Application
................................................................................................................................. 108
060-ISSIMM2019 The Influence of Particle Size to Diffusivity of Nanogold Particles Based on
Brownian Motion .................................................................................................... 110
061-ISSIMM2019 Development of ECG Sensor using Arduino Uno and E-Health Sensor ................ 111
062-ISSIMM2019 Blown Fiber Technology for Out Site Plan Network Deployment in Apartments
Project ..................................................................................................................... 113

The 4th International Seminar on Sensors, Instrumentation, Measurement and Metrology
5
063-ISSIMM2019 Examination System of Chicken Meat Quality Based on Hyperspectral Imaging . 114
064-ISSIMM2019 Measurement And Analysis Of The Impact Of Air Quality Because Co And No2 By
Pollutants From Motor Vehicles On The Road Of Margonda Raya Around The
Balaikota Depok ...................................................................................................... 115
065-ISSIMM2019 Automatic Take-off Landing Quadcopter Control on Dynamics Platform ............. 116
066-ISSIMM2019 Detecting the Burned Area in Southern Kalimantan by Using the Sentinel-1
Polarimetric SAR and Landsat-8 OLI Optic .......................................................... 118
067-ISSIMM2019 Parasitic Resistance Calculation of PV Module at Various Irradiance Based on
Three Condition Lambert-W
Network Modeling .................................................................................................. 122
070-ISSIMM2019 Non galvanis measurement of partial discharge using antenna boutique. .............. 123
071-ISSIMM2019 Microstrip Slot Antenna Design for Radar Remote Sensing Application .............. 124
072-ISSIMM2019 Surface Temperature Changes of the Crater of Agung Volcano from Landsat-8 TIRS
Integrated With Weather Parameters (A Case Study on Margonda Raya Street
Depok) ..................................................................................................................... 127
075-ISSIMM2019 Development of Landsat/LDCM Data Acquisition System Integration for Parepare
and Rumpin base on Virtual Ground Station In order to Provide National
Intermediate Resolution Remote Sensing Data ....................................................... 128
076-ISSIMM2019 FPGA based Switching Circuits and Acquisition Module for Electrical Impedance
Tomography ............................................................................................................ 129
077-ISSIMM2019 Development of Mechanical Platform for Picosatellite Ground Simulator and
Communication Protocol ...................................................................................... 130
078-ISSIMM2019 Developing A system to determine impact force in tennis ..................................... 131
079-ISSIMM2019 Detection of Hg2+
ions using silver nanoparticles as colorimetric indicator ........... 132
080-ISSIMM2019 A Simple Paper-Based Color Change Label Using Plant Extracts for Ammonia Gas
Detection ................................................................................................................. 133
082-ISSIMM2019 New Insight Of The Implication Blood Pressure Detection Differences Using
Aneroid Sphygmomanometer And Digital Blood Pressure On Medical Examination
................................................................................................................................. 134
083-ISSIMM2019 Long-Term Change in Characteristics of Cloud Vertical Structures Over Indonesian
from Radiosonde Observations ............................................................................... 135
084-ISSIMM2019 Simple Gold Nano Particles Production Method by Ablated Laser: Diameter
Modification ............................................................................................................ 136
................................................................................. 120
069-ISSIMM2019 The pH Measurement Based on Color Image Sensors Using Convolutional Neural
during 2017-2018 Eruption ..................................................................................... 125
074-ISSIMM2019 Design and Analysis Of Air Quality Monitoring System PM 10 And PM 2,5

The 4th International Seminar on Sensors, Instrumentation, Measurement and Metrology
6
085-ISSIMM2019 ECG CALIBRATION SIGNAL DATABASE CONSTRUCTION BASED ON IEC
60601-2-25 USING MATLAB ............................................................................... 137
086-ISSIMM2019 Influence of the liquid injection hole to ripple frequency of the QCM sensor ....... 138
087-ISSIMM2019 Design of Negative Pressure Wound Therapy (NPWT) to Accelerate Diabetic Ulcer
Healing .................................................................................................................... 139
089-ISSIMM2019 Cholesterol Electrochemical Sensor Based on Molecularly Imprinted Polymers
(MIPs) Modified Screen Printed Electrode (SPE) .................................................. 140
092-ISSIMM2019 A high voltage electrostatic filter for particulate matter PM2.5 capture applied in
motor vehicle exhaust system ................................................................................. 141
093-ISSIMM2019 Design of Water Height Detector Model in Runway Based on Internet of Things 142
099-ISSIMM2019 A Radiochromic Paper Label Using Red Cabbage Acid Extract ............................ 143

The 4th International Seminar on Sensors, Instrumentation, Measurement and Metrology
7
Committee
Steering Committees
Prof.Dr.Ganefri. Ph.D Dr. Yulkifli, M.Si General Chair
Yohandri,M.Si, Ph.D Co-Chairs Dr. Ramli, M.Si Secretary Mairizwan, M.Si Technical Program Fadhila Ulfa Jhora, MSi Treasurer Wahyuni Satria Dewi, M.Pd Dola Novianda Sari, SE Publication Rio Anshari, M.Si Toni Supriadi, S.Pd Secretariat Putri Dwi Sundari, M.Pd Rahmat Hidayat, M.Si Even Triaga, S.Si Accommodation Nofri Hardisal, S.Si Documentation Edi Kurnia, S.Si

The 4th International Seminar on Sensors, Instrumentation, Measurement and Metrology
8
Meeting Venue
UNP Hotel and Convention
The participants may use one of the few options written below to reach the venue:
Intercity bus from any cities in Sumatera and Java to Padang
Air plane: There is flligth directly from Kuala Lumpur International Air Port and any cities in Indonesia
(Jakarta, Medan, Batam, Pekanbaru etc.). Arrive at Minangkabau International Airport (BIM). Take a
taxi and tell the driver to go to UNP Hotel and Convention, Universitas Negeri Padang (UNP).

The 4th International Seminar on Sensors, Instrumentation, Measurement and Metrology
9
Chair’s Report
On behalf of the Steering Committee, it is my great pleasure to welcome you to attend
The 4th International Seminar on Sensors, Instrumentation, Measurement and
Metrology (ISSIMM 2019) will take place in Padang, West Sumatera, Indonesia at
November 14th, 2019.
This 4th ISSIMM is hosted by the Physics Department, Faculty of Mathematic and
Natural Science, Universitas Negeri Padang. It is jointly organized by Universitas
Indonesia (UI), Universitas Brawijaya (UB), Universitas Gadjah Mada (UGM), Institut
Teknologi Bandung (ITB), Institut Teknologi Sepuluh Nopember (ITS), Universitas
Airlangga (UNAIR) and Universitas Negeri Padang (UNP). Moreover, Physical Society of
Indonesia (PSI), Instrumentation and Metrology (Puslit KIM-LIPI).
The main objective of this seminar is to provide an international platform for
researchers, Academicians as well as industrial professionals to present their research
on sensors, instrumentation, measurement and metrology and other related fields. The
seminar will include 2 (two) plenary speeches (Prof Koo form Multimedia University,
Malaysia and Prof Setiawan form Universitas Brawijaya, Indonesia) and 90 (ninety
contributed presentations) from various affiliation.
I would like to express my sincere appreciation to all the participants, supporting
organizations and all the committee members who will make ISSIMM 2019 successful.
With these strong support, we are sure ISSIMM 2019 will be beneficial to all the
participants, and you will enjoy Padang.
Thank You
Yohandri, Ph.D General Chair of ISSIMM2019

The 4th International Seminar on Sensors, Instrumentation, Measurement and Metrology
10
Welcome Message: Dean of Faculty of Mathematics and Natural Science
Assalamualaikum wr. wb.
Rector of Universitas Negeri Padang
Vice-Dean of Faculty, Mathematics and Natural Science
Head of Department and Graduate Program in Faculty of Mathematics and Natural
Science
Distinguished Invited Speakers
Organizers of this conference
Dear participants
Ladies and gentlemen
I am delighted to have this opportunity to welcome you in the 4th International
Seminar on Sensors, Instrumentation, Measurement and Metrology (ISSIMM
2019) which is hosted by Physics Department, Faculty of Mathematics and Natural
Sciences, Universitas Negeri Padang. We are especially honored by the presence of
the eminent keynote speakers, who have graciously accepted our invitation to be
plenary Speaker.
Prof. Dr. Koo Voon Chet, Multimedia University, Malaysia
Prof. Dr. Setyawan Purnomo Sakti, Universitas Brawijaya, Indonesia
To all speakers and participants, I am greatly honored and pleased to welcome you to
Padang.
This conference is a special occasion for those who work in sensors, instrumentation,
measurement and metrology and other related fields. it will be an occasion to meet,
to share information, to exchange new ideas and application experiences. In addition,
direct contacts among the researchers and scientists will therefore promote
international research networking as well as collaboration in the future.
In closing, I wish the participants a very fruitful and productive meeting, but I do
hope you will also take time to enjoy fascinating Padang, with its tropical setting,
friendly people and multi-cultural cuisine. I also wish to express my gratitude to
the Organizing and Scientific Committee for their diligence.
Finally, we respectfully request the Rector of Universitas Negeri Padang to open the
ISSIMM 2019 officially.
Thankyou,
Dr. Yulkifli, S. Pd., M. Si.
Dean

The 4th International Seminar on Sensors, Instrumentation, Measurement and Metrology
11
Opening Remark from the Rector of Universitas Negeri Padang
Assalamualaikum wr. wb.
Vice Rector of Universitas Negeri Padang
Dean and Vice-Dean in Universitas Negeri Padang
Distinguished Invited Speakers
Organizers of this conference
Dear participants
Ladies and gentlemen
It gives me great happiness to extend my sincere and warm welcome to the
participants of the 4th International Seminar on Sensors, Instrumentation,
Measurement and Metrology (ISSIMM 2019). On behalf of Universitas Negeri
Padang, let me welcome all of you to the conference in Padang, West Sumatra,
Indonesia.
We believe that from this scientific meeting, all participants will have time to discuss
and exchange ideas, findings, creating networking as well as strengthen the
existing collaboration in the respective fields of expertise. On the other hand, through
this conference we can improve the quality of our researches as well as innovation
and trend in Sensors, Instrumentation, Measurement and Metrology and other
related fields.
I would like to express my sincere appreciation to Physics Department, Faculty of
Mathematic and Natural Science and organizing committee who have organized this
event. This is a great opportunity for us to be involved in an international community.
I would also like to extend my appreciation and gratitude to keynote speakers and
participants of this conference for their contribution to this event.
Finally, I wish all participants get a lot of benefits at the conference. I also wish all
participants can enjoy the atmosphere of the city of Padang, West Sumatra.
Thank you
Prof. Ganefri, Ph.D
Rector
The 4th International Seminar on Sensors, Instrumentation, Measurement and Metrology
12
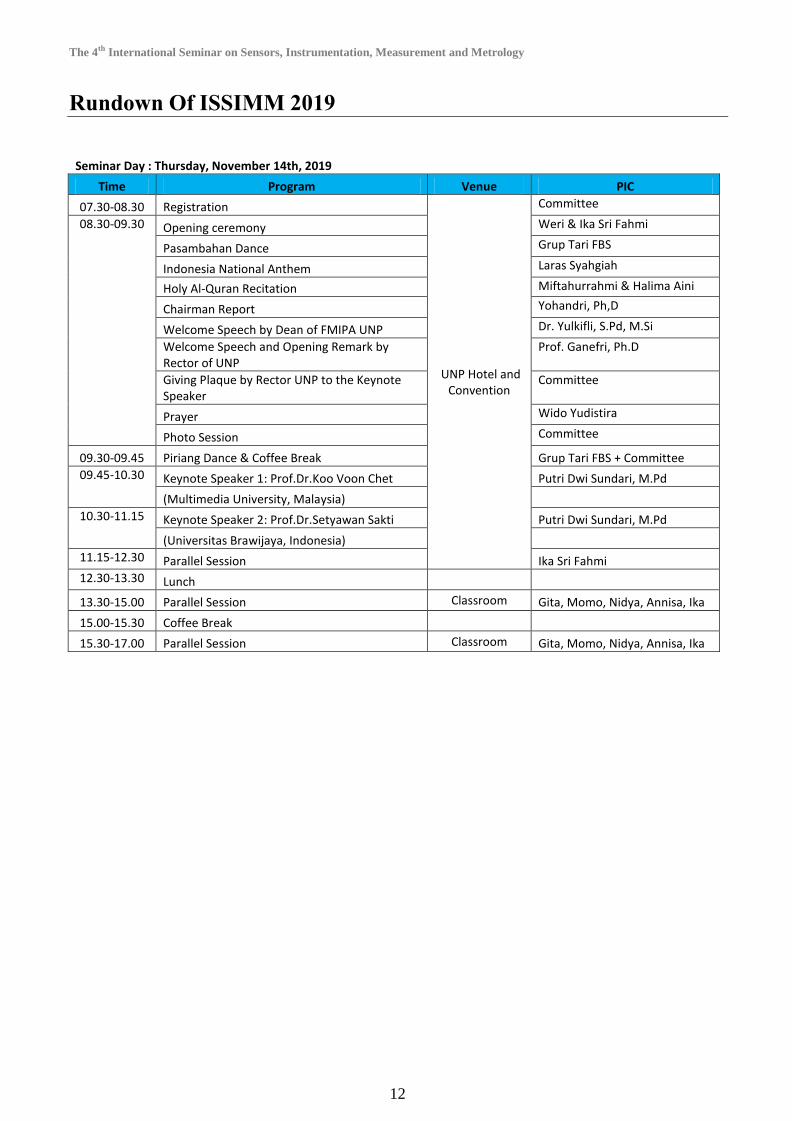
Rundown Of ISSIMM 2019
Seminar Day : Thursday, November 14th, 2019 Time Program Venue PIC
07.30-08.30 Registration
UNP Hotel and Convention
Committee
08.30-09.30 Opening ceremony Weri & Ika Sri Fahmi
Pasambahan Dance Grup Tari FBS
Indonesia National Anthem Laras Syahgiah
Holy Al-Quran Recitation Miftahurrahmi & Halima Aini
Chairman Report Yohandri, Ph,D
Welcome Speech by Dean of FMIPA UNP Dr. Yulkifli, S.Pd, M.Si
Welcome Speech and Opening Remark by Rector of UNP
Prof. Ganefri, Ph.D
Giving Plaque by Rector UNP to the Keynote Speaker
Committee
Prayer Wido Yudistira
Photo Session Committee
09.30-09.45 Piriang Dance & Coffee Break Grup Tari FBS + Committee
09.45-10.30 Keynote Speaker 1: Prof.Dr.Koo Voon Chet Putri Dwi Sundari, M.Pd
(Multimedia University, Malaysia)
10.30-11.15 Keynote Speaker 2: Prof.Dr.Setyawan Sakti Putri Dwi Sundari, M.Pd
(Universitas Brawijaya, Indonesia)
11.15-12.30 Parallel Session Ika Sri Fahmi
12.30-13.30 Lunch
13.30-15.00 Parallel Session Classroom Gita, Momo, Nidya, Annisa, Ika
15.00-15.30 Coffee Break
15.30-17.00 Parallel Session Classroom Gita, Momo, Nidya, Annisa, Ika

The 4th International Seminar on Sensors, Instrumentation, Measurement and Metrology
13
Parallel Session Schedule Of ISSIMM 2019
ROOM 1. Measurement and control systems and software development for instrumentation, theory and applications
Moderator: Gita
No Time ID Presenter Title Affiliation
1 11.15 - 11.30 001-ISSIMM-2019 Khusnul Ain Low Cost Dual Frequency Impedance Analysis For Measuring
Internal And External Cellular Fluid
2 11.30 - 11.45 003-ISSIMM-2019 Rizal Arifin Design and Implementation of Water Pump Control System for
Rice Field Irrigation
3 11.45 - 12.00 004-ISSIMM-2019 Asep Hapiddin Beat Frequency Measurement of the Stabilized He-Ne Laser
633 nm Calibration in BSN
4 12.00 - 12.15 007-ISSIMM-2019 A. Mohamad Boynawan Algorithm of Time and Frequency Remote Calibration System
of SNSU-BSN
5 12.15 - 12.30 019-ISSIMM-2019 Burhan Izzudin Quadcopter Control System Based on Body Gesture Using
Kinect for Search and Rescue Operation
12.30 - 13.30 Lunch
6 13.30 - 13.45 024-ISSIMM-2019 Ahsanu Taqwim Safrudin Object Detection for Autonomous Search and Rescue
Quadrotor Application
7 13.45 - 14.00 028-ISSIMM-2019 Daniel Kamasi Comparison Between Two-stage and Three-stage Peltier
Thermoelectrics Driven by Pulse Width Modulation
8 14.00 - 14.15 032-ISSIMM-2019 Burhanuddin Ahmad Design of Neural Network and PLC based Water Flow
Controller

The 4th International Seminar on Sensors, Instrumentation, Measurement and Metrology
14
9 14.15 - 14.30 038-ISSIMM-2019 Sony Wardoyo A Measurement Low Magnetic Field at Copper Plate
Electromagnet
10 14.30 - 14.45 048-ISSIMM-2019 Taufiq Alif Kurniawan Real Time Monitoring State-of-Charge Battery using Internal
Resistance Measurements for Remote Applications
11 14.45 -15.00 057-ISSIMM-2019 Eri Wiyadi Simple I-V Acquisition Module with High Side Current Sensing
Principle for Real Time Photovoltaic Measurement
15.00 - 15.30 Coffee Break
12 15.30 - 15.45 064-ISSIMM-2019 Hendina Aprilia
MEASUREMENT AND ANALYSIS OF THE IMPACT OF AIR QUALITY BECAUSE CO AND NO2 BY POLLUTANTS FROM MOTOR VEHICLES ON THE ROAD OF MARGONDA RAYA
AROUND THE BALAIKOTA DEPOK
13 15.45 - 16.00 067-ISSIMM-2019 Lazuardi Umar Parasitic Resistance Calculation of PV Module at Various
Irradiance Based on Three Condition Lambert-W
14 16.00 - 16.15 070-ISSIMM-2019 Eka Waldi Non galvanis measurement of partial discharge using antenna
boutique.
15 16.15 - 16.30 074-ISSIMM-2019 Rumondang Simanullang Measurement and Analysis of Air Quality Impact Assued by
PM10 and PM2,5 on Jalan Margonda Raya Depok
16 16.30 - 16.45 079-ISSIMM-2019 Windri Handayani Detection of Hg2+ ions using silver nanoparticles as
colorimetric indicator
17 16.45 - 17.00 080-ISSIMM-2019 Arie Listyarini A Simple Paper-Based Color Change Label Using Plant Extracts
for Ammonia Gas Detection

The 4th International Seminar on Sensors, Instrumentation, Measurement and Metrology
15
ROOM 2. Instrumentation systems and Technology
Moderator: Momo
No Time ID Presenter Title Affiliation
1 11.15 - 11.30 002-ISSIMM-2019 Arinto Yudi Ponco Wardoyo A High Voltage Electrostatic Filter For Fine Particles Capture
Applied in Motorcycle Exhaust System
2 11.30 - 11.45 009-ISSIMM-2019 Irwan The Design of Litopenaeus Vannamei Automatic Feeder
3 11.45 - 12.00 092-ISSIMM-2019 Arinto Yudi Ponco Wardoyo, Hari Arief Dharmawan, Muhammad
Nurhuda and Arif Budianto A High voltage electrostatic filter for particulate matter PM2.5
capture applied in motor vehicle exhaust system
4 12.00 - 12.15 010-ISSIMM-2019 Alfarih Faza Implementation of Single Shot Detector for Object Finding in
Drone Platform
5 12.15 - 12.30 023-ISSIMM-2019 Andeka Tris Susanto A Systematic Literature Reviews of Multichannel Analyzer
Based on FPGA for Gamma Spectroscopy
12.30 - 13.30 Lunch
6 13.30 - 13.45 026-ISSIMM-2019 Tusty Maghfira Infant Cry Classification Using CNN-RNN
7 13.45 - 14.00 027-ISSIMM-2019 Irwan A Study of Micro-Bubble Generator for Litopenaeus Vannamei
Pond
8 14.00 - 14.15 035-ISSIMM-2019 Auliya Sifa Fauziyyah Design Measuring Instrument of Volume and The Number of
Drops Infusion on Automatic Infusion Monitoring System Arduino Based
9 14.15 - 14.30 044-ISSIMM-2019 Taufiq Alif Kurniawan Design of High Efficiency Active Class E Rectifier using PMOS
The 4th International Seminar on Sensors, Instrumentation, Measurement and Metrology
16
Switch for Hybrid Wireless Power Transfer
10 14.30 - 14.45 047-ISSIMM-2019 Advendio Desandros Comparative Study of Hyperspectral Acquisition Technique for
Measuring Total Soluble Content and pH in Honey
11 14.45 -15.00 059-ISSIMM-2019 Febri Faresi An Implementation of Haar-Cascaded Detection for Indoor
Hexacopter Application
15.00 - 15.30 Coffee Break
12 15.30 - 15.45 061-ISSIMM-2019 Lantana Dioren Rumpa Development of ECG Sensor using Arduino Uno and E-Health
Sensor Platform: Mood Detection from Heartbeat
13 15.45 - 16.00 065-ISSIMM-2019 Akmal Dutasatria Automatic Take-off Landing Quadcopter Control on Dynamics
Platform
14 16.00 - 16.15 078-ISSIMM-2019 Syahrial Baktiar DEVELOPING A SYSTEM TO DETERMINE IMPACT FORCE IN
TENNIS
15 16.15 - 16.30 082-ISSIMM-2019 Novitasari Novitasari New Insight Of The Implication Blood Pressure Detection
Differences Using Aneroid Sphygmomanometer And Digital Blood Pressure On Medical Examination
16 16.30 - 16.45 089-ISSIMM-2019 Elhana Julita Cholesterol Electrochemical Sensor Based on Molecularly
Imprinted Polymers (MIPs) Modified Screen Printed Electrode (SPE)
17 16.45 - 17.00 045-ISSIMM-2019 Faizal Adila Ferdiansyah EEG-EMG based Bio-Robotics Elbow Orthotics Control
18 17.00 - 17.15 069-ISSIMM-2019 Dian Wulan Hastuti The pH Measurement Based on Color Image Sensors Using
Convolutional Neural Network Modeling
19 17.15 - 17.30 099-ISSIMM-2019 Cuk Imawan A Radiochromic Paper Label Using Red Cabbage Acid Extract

The 4th International Seminar on Sensors, Instrumentation, Measurement and Metrology
17
ROOM 3. Sensors and transducers, Internet of things and network of sensors
Moderator: Annisa
No Time ID Presenter Title Affiliation
1 11.15 - 11.30 008-ISSIMM-2019 Nauval Franata Analysis and Characterization of Magneto-Optical Kerr Effect
Measurement System: Case Study on CoFeB
2 11.30 - 11.45 012-ISSIMM-2019 Masruroh Influence of The Nitrogen exposure Time to The Plasma
Treatment on the Hydrophobicity of polystyrene surfaces
3 11.45 - 12.00 013-ISSIMM-2019 Dionysius Santjojo Plasma Intensification in 2 MHz RF Glow Discharge in Carbon
Film Plasma Sputtering Deposition by means of a Hollow Cathode
4 12.00 - 12.15 017-ISSIMM-2019 Hanalde Andre Characterization of Circular Patch Antenna at 1 GHz for Crack
Sensing
5 12.15 - 12.30 031-ISSIMM-2019 Puti Aulia Mardiah Design Of Water Height Detectors In Runway Based On
Internet Of Things
12.30 - 13.30 Lunch
6 13.30 - 13.45 036-ISSIMM-2019 Yulkifli Center Silver nanoparticle preparation by colorimetric method
and its application as a metal ion detector
7 13.45 - 14.00 050-ISSIMM-2019 Gunawan Wibisono Design Analysis of Consolidation of Cellular Operators in
Indonesia
8 14.00 - 14.15 043-ISSIMM-2019 Muhammad Ikhsan Synthesis and Characterization of Activated Carbon from
Biomass Waste for Radar Absorbing Material

The 4th International Seminar on Sensors, Instrumentation, Measurement and Metrology
18
9 14.15 - 14.30 053-ISSIMM-2019 Arnold Fedriko Magneto-Optic Faraday Effect of Vegetable Oils
10 14.30 - 14.45 058-ISSIMM-2019 Wilson Jefriyanto Developtment Of LVDT (Linear Variable Differential Transformer) Sensor as Land Displacement sensor
11 14.45 -15.00 060-ISSIMM-2019 Zulfahmi The Influence of Particle Size to Diffusivity of Nanogold
Particles Based on Brownian Motion
15.00 - 15.30 Coffee Break
12 15.30 - 15.45 062-ISSIMM-2019 Sri Priyo Hutomo Blown Fiber Technology for Out Site Plan Network Deployment
in Apartments Project
13 15.45 - 16.00 076-ISSIMM-2019 Rizard Renanda Adi Pramono FPGA based Switching Circuits and Acquisition Module for
Electrical Impedance Tomography
14 16.00 - 16.15 077-ISSIMM-2019 Brian Reynald Mechanical Platform for Picosatellite Ground Simulator and
Communication Protocol
15 16.15 - 16.30 084-ISSIMM-2019 Syukur Pambudi Simple Gold Nano Particles Production Method by Ablated
Laser: Diameter Modification
16 16.30 - 16.45 086-ISSIMM-2019 Retno A Pratiwi Influence of the Liquid Injection Hole to Ripple Frequency of
the QCM Sensor
17 16.45 - 17.00 041-ISSIMM-2019 Aziz Setia Aji Predictive Maintenance Magnetic Sensor using Random Forest
Method
ROOM 4: Big Data and metrology, and Remote Sensing Technology.
Moderator: Ika

The 4th International Seminar on Sensors, Instrumentation, Measurement and Metrology
19
No Time ID Presenter Title Affiliation
1 11.15 - 11.30 006-ISSIMM-2019 Ogi Gumelar Oil Spill Monitoring Using Radar Image Satellite
2 11.30 - 11.45 005-ISSIMM-2019 Khansa Cintya Pradipta Hapsari Changes of Mangrove Area in Pangpang Bay, Banyuwangi
2014-2018 Using Landsat-8 Imagery
3 11.45 - 12.00 016-ISSIMM-2019 Yudhi Prabowo Cloud Detection Method for Pleiades Images Using Spectral
Indices
4 12.00 - 12.15 018-ISSIMM-2019 Marendra Budiono Quality Assessment and Validation of Digital Surface Model
Derived from LiDAR Using TerraSAR-X in Land Cover
5 12.15 - 12.30 025-ISSIMM-2019 Ahmad Haris Indra Fadhilllah Unmanned Aerial Vehicle Object Tracking and Following
12.30 - 13.30 Lunch
6 13.30 - 13.45 033-ISSIMM-2019 Abibagus Indrawan Monitoring Distribution System of Carbon Monoxide and
Surface Ozone Based On GPS and Microcontroller
7 13.45 - 14.00 034-ISSIMM-2019 Helmi Yusnaini Diurnal Variation of Radar Reflectivity Factor In Intense
Convective Clouds Over Indonesia
8 14.00 - 14.15 037-ISSIMM-2019 Ali Syahputra Nasution Integration of LAPAN’s Remote Sensing Ground Station
Control and Monitoring System Application
9 14.15 - 14.30 046-ISSIMM-2019 Fadila Muchsin Atmospheric Correction Models For Monitoring Rice Plants
With Landsat 8 Oli and Sentinel-2
10 14.30 - 14.45 051-ISSIMM-2019 Andi Mario Prediction of PM2.5 and PM10 Parameters Using Artificial
Neural Network: Case Study in Kemayoran, Jakarta
11 14.45 -15.00 054-ISSIMM-2019 Ali Syahputra Nasution A Comparison of Joint Reversible Data Hiding Methods in
The 4th International Seminar on Sensors, Instrumentation, Measurement and Metrology
20
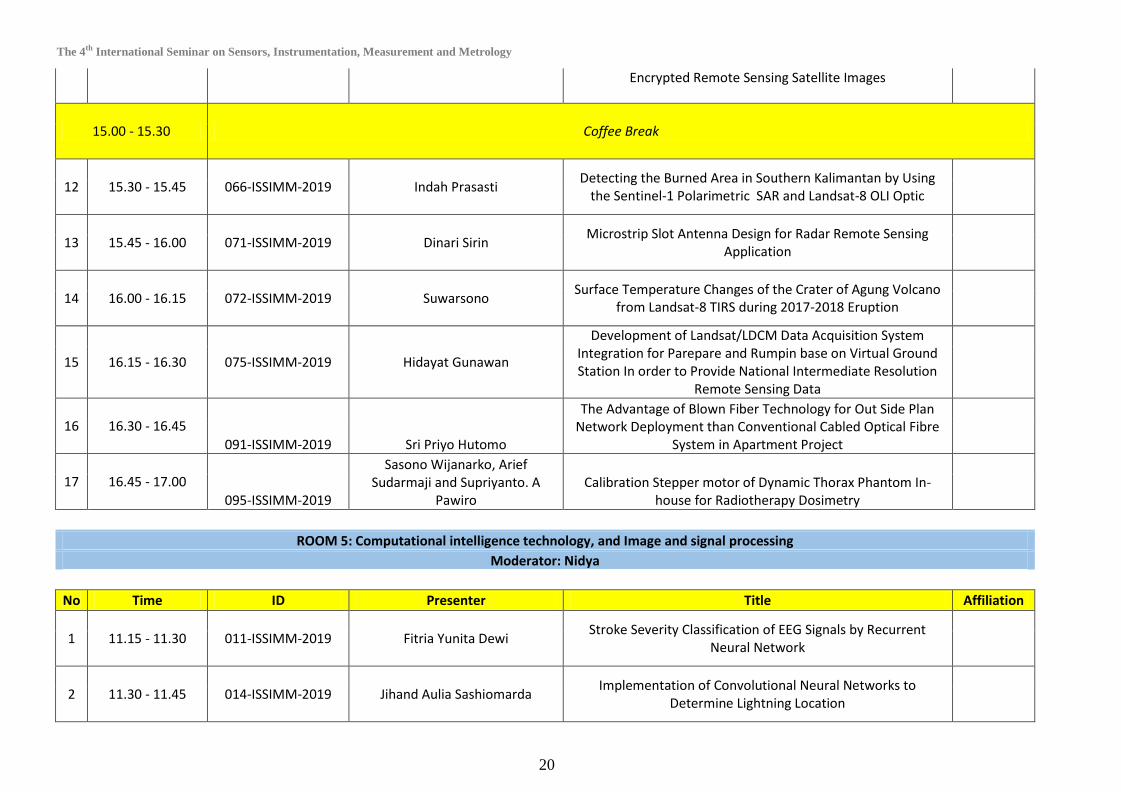
Encrypted Remote Sensing Satellite Images
15.00 - 15.30 Coffee Break
12 15.30 - 15.45 066-ISSIMM-2019 Indah Prasasti Detecting the Burned Area in Southern Kalimantan by Using
the Sentinel-1 Polarimetric SAR and Landsat-8 OLI Optic
13 15.45 - 16.00 071-ISSIMM-2019 Dinari Sirin Microstrip Slot Antenna Design for Radar Remote Sensing
Application
14 16.00 - 16.15 072-ISSIMM-2019 Suwarsono Surface Temperature Changes of the Crater of Agung Volcano
from Landsat-8 TIRS during 2017-2018 Eruption
15 16.15 - 16.30 075-ISSIMM-2019 Hidayat Gunawan
Development of Landsat/LDCM Data Acquisition System Integration for Parepare and Rumpin base on Virtual Ground Station In order to Provide National Intermediate Resolution
Remote Sensing Data
16 16.30 - 16.45
091-ISSIMM-2019 Sri Priyo Hutomo
The Advantage of Blown Fiber Technology for Out Side Plan Network Deployment than Conventional Cabled Optical Fibre
System in Apartment Project
17 16.45 - 17.00
095-ISSIMM-2019
Sasono Wijanarko, Arief Sudarmaji and Supriyanto. A
Pawiro Calibration Stepper motor of Dynamic Thorax Phantom In-
house for Radiotherapy Dosimetry
ROOM 5: Computational intelligence technology, and Image and signal processing
Moderator: Nidya
No Time ID Presenter Title Affiliation
1 11.15 - 11.30 011-ISSIMM-2019 Fitria Yunita Dewi Stroke Severity Classification of EEG Signals by Recurrent
Neural Network
2 11.30 - 11.45 014-ISSIMM-2019 Jihand Aulia Sashiomarda Implementation of Convolutional Neural Networks to
Determine Lightning Location

The 4th International Seminar on Sensors, Instrumentation, Measurement and Metrology
21
3 11.45 - 12.00 015-ISSIMM-2019 Arif Luqman Hakim Rain Detection in Image Using Convolutional Neural Network
4 12.00 - 12.15 020-ISSIMM-2019 Annisa Rahma Fauzia Analysis of Magnetic Resonance Image Quality Using an In-
House Phantom: Gamma Knife Application
5 12.15 - 12.30 021-ISSIMM-2019 Putri Amalia Pontoh Dose Evaluation of Organ at Risk during Treatment Using Gamma
Knife Stereotactic Radiosurgery (GKSRS): Phantom Study
12.30 - 13.30 Lunch
6 13.30 - 13.45 022-ISSIMM-2019 Gina Kusuma Analysis Of Energy-Peaks Characteristic In NaI(Tl)
Spectrometer For Radionuclide Identification In Environmental Radiation Monitoring device
7 13.45 - 14.00 029-ISSIMM-2019 Ristiana Dewi Fog Prediction Using Deep Learning: A Case Study in Wamena
Airport
8 14.00 - 14.15 030-ISSIMM-2019 Bayu Bagaskara Effect of skull contours using manual measurement and CT Image on doses distribution in Gamma Knife Stereotactic
Radiosurgery: Phantom Study
9 14.15 - 14.30 039-ISSIMM-2019 I Nyoman Pranditayana Verification of Dose Distribution on The Gamma Knife
Perfexion Radiosurgery Using Gafchromic Ebt3 Film: Rando Fantom Study
10 14.30 - 14.45 040-ISSIMM-2019 Hendra Angga Yuwono Feature Selection with LASSO for Classification of Ischemic
Strokes Based on EEG Signals
11 14.45 -15.00 042-ISSIMM-2019 Sasono Wijanarko Calibration of Dynamic Thorax Phantom In-house for
Radiotherapy Dosimetry
15.00 - 15.30 Coffee Break
12 15.30 - 15.45 049-ISSIMM-2019 Eufrat Tsaqib Qasthari Prediction System for Flavonoid Content on Bisbul Leave

The 4th International Seminar on Sensors, Instrumentation, Measurement and Metrology
22
(Diospyros discolor Willd.) Using Deep Neural Networks Regression
13 15.45 - 16.00 052-ISSIMM-2019 Naufal Praditya Identification System for Beeswax on Malang Apple Using VNIR
Imaging
14 16.00 - 16.15 056-ISSIMM-2019 Gandung Bayu Wanugroho Implementation of Artificial Neural Networks for Very Short
Range Weather Prediction
15 16.15 - 16.30 063-ISSIMM-2019 Engrid Latifa Nofentari Kaswati Examination System of Chicken Meat Quality Based on
Hyperspectral Imaging
16 16.30 - 16.45 083-ISSIMM-2019 Lismalini Long-Term Change in Characteristics of Cloud Vertical
Structures Over Indonesian from Radiosonde Observations
17 16.45 - 17.00 085-ISSIMM-2019 Siddiq Wahyu Hidayat ECG CALIBRATION SIGNAL DATABASE CONSTRUCTION BASED
ON IEC 60601-2-25 USING MATLAB

The 4th International Seminar on Sensors, Instrumentation, Measurement and Metrology
23
Planary Session The 4th International Seminar on Sensors, Instrumentation, Measurement
and Metrology

The 4th International Seminar on Sensors, Instrumentation, Measurement and Metrology
24
Quartz Crystal Microbalance for Physical Sensor, Chemical Sensor
and Biosensor: Sensing Devices, Acquisition and Challange
Setyawan P. Sakti Sensor Technology Laboratory &
Collaborative Research Center for Advanced System and Material Technology
Department of Physics, Brawijaya University
The sensitivity of the Quartz Crystal Microbalance (QCM) sensor to a mass change, viscosity change
and film propperty change hase been known and continued to be explored for various application. The
availability of the quartz crystal resoato, the sensor preparation and its system instrumentation attract
the development of the QCM sensor around the world. The wide range of sensor application together
with the possibility to develop the instrumentation system which requires simple and low cost to a
high sopisticated research tools makes it attractive. The development of the system covering the
instrumentation system, sensor surface modification, sensitive layer development and sensing device
is an interesting aspects for the academic and commercial interest. The advance of the
microcelectronic tehnology resulted in a compact form of the instrumentation for the QCM sensor.
The detection limits of the sensor was reported as low as nanograms of mass. Which hase been used
for material deposition detection, chemical sensor and biosensor. Based on current state of the
electronic technology, detection limits down to an order of picogram could be possible. In other
aspect, the surface modication of the sensor both for the sensitive layer or matrix layer has been
reported from monolayer to a thick layer. This allows the utilization of the QCM sensor not only
based on the ttraditional mass change detection, but also by using other physcal change property of the
coating film. Swelling and phase transition of the film which affects the resonance frequency as well
as the impedance of the sensor could be an interesting aspect to be explored further for high sensitive
chemical sensor application. However, it leaves many chalange to better undertsanding the coatinng
material property change in contact with the target molecules.

The 4th International Seminar on Sensors, Instrumentation, Measurement and Metrology
25
Smart Sensing For A Better Tomorrow
Koo Voon Chet
ABSTRACT:
A country is said to have a better quality of life if the country can provide better opportunities for a
healthy, safe and prosperous life in the years ahead. Quality of life concerns about the general well-
being of individuals and societies. It observes life satisfaction in various aspects, including physical
health, safety, wealth, the environment, and more. In this talk, we will review some of the state-of-the-
art technologies used for the purpose of improving tomorrow’s quality of life. Particularly, we will
discuss on how smart sensing can help in protecting our environment, safeguarding our properties,
increasing productivity for farmers, and connecting people to the love one.
Prof. Ir. Dr. Koo Voon Chet
Director, Research Institute for Digital Lifestyle, MMU
Voon-Chet KOO is currently a full Professor of Multimedia University. His research interests
include remote sensing technologies, signal processing, and embedded system design. With more
than 20 years of experience under his belt, he has become a renowned international speaker for
various international conferences, seminars and lectures for universities, and public and private
agencies in various countries around the world.
In terms of publication, he has successfully published more than 100 papers in refereed journals, international conferences,
4 books, and 11 patents. With his extensive and rich knowledge and experience, it is no wonder that be became the
recipient of the inaugural Young Engineer Award by the Institution of Engineers, Malaysia in 2004.
As for other professional involvement, Prof. was the Chairperson for the Centre for Remote Sensing and Surveillance
Technologies, MMU, Chair of the IEEE Geoscience and Remote Sensing Society Chapter, Malaysia Section, a registered
Professional Engineer with Practicing Certificate, a Fellow of the ASEAN Academy of Engineering and Technology
(AAET), and a senior member of IEEE. Prof. Koo is also the founder and the current CEO of a spin-off company of the
university research centre. The company, iRadar, was incorporated in 2011 with primary focus to provide smart sensing
solutions for precision farming, construction, mining, and more.

The 4th International Seminar on Sensors, Instrumentation, Measurement and Metrology
26
ABSTRACT COLLECTIONS
Parallel Session The 4th International Seminar on Sensors, Instrumentation, Measurement
and Metrology

The 4th International Seminar on Sensors, Instrumentation, Measurement and Metrology
27
001-ISSIMM2019
Low Cost Dual Frequency Impedance Analysis For Measuring
Internal And External Cellular Fluid
Khusnul Ain1,a
, Riries Rulaningtyas1,b
R. Arif Wibowo2,c
, Soegianto
Soelistiono1,d
, Lailatul Muniroh3,e
Tri Anggono2,f
, M. Rizky Yusdy1,g
1Biomedical Engineering, Airlangga University, Indonesia
2Physics, Airlangga University, Indonesia
3Public Health, Airlangga University, Indonesia
[email protected] (corresponding author),
Keywords: low cost, intracellular, extracellular, dual frequency, bio-impedance ABSTRACT. The regulation of body fluid balance is a major concern in body health. Disruption of body fluid balance is a major factor responsible for changes in cell volume. It can affect cell function and survival. Intracellular fluid (ICF), extracellular fluid (ECF) and total body fluid (TBW) have been used as information on body fat levels, dengue indications and some chronic diseases. The design and development of dual frequency bioelectrical impedance analysis prototype as a candidate of intracellular and extracellular fluid measuring instrument. The device is built using sine wave generator from ICL8038 which can produce 20 kHz and 75 kHz, voltage controlled current source (VCCS) from LF412 which can generate 0.5 mA from Howland dual op-amp method, potential was measured by instrument amplifier from AD620 and used AD536 as AC to DC converter. The device performance was tested on 10 volunteers. The performance indicator
is relationship between ICF and ECF calculations against H2
/Z. The analysis of intracellular fluid (ICF) was obtained from measurement of total body impedance at high frequency 75 kHz. It has excellent linearity with R² = 0,9636. While analysis of extracellular fluid (ECF) was obtained from measurement of total body impedance at low frequency 20 kHz. It has a very good linearity with R² = 0.9579.
References [1] Deen J et al. 2006. The WHO Dengue Classification and Case Definitions : Time for a Reassessment.
Lancet., 368 : 170 – 173. [2] Ginanjar, Genis. 2008. Demam Berdarah, a Survival Guide. Yogyakarta : B –First. [3] Hoffer et al. 1969. Correlation of Whole – Body Impedance with Total Body Water Volume. J.
Appl. Physiol, 27, 531 – 534. [4] Ibrahim et al. 2005. A Novel Approach to Classify Risk in Dengue Hemorrhagic Fever (DHF) Using
Bioelectrical Impedance Analysis (BIA). IEEE Transactions On Instrumentation And Measurement, Vol. 54, No. 1.
[5] Ibrahim et al. 2007. A New Approach to Classify Risk in Dengue Infection Using Bioelectrical Impedance Analysis. Dengue Bulletin – Volume 31.
[6] Jaffrin et al. 2008. Body Fluid Volumes Measurements by Impedance : A Review of Bioimpedance Spectroscopy (BIS) and Bioimpedance Analysis (BIA) Methods. Med. Eng. Phys., 30, 1257 – 1269. [7] Moissl et al. 2006. Body Fluid Volume Determination via Body Composition Spectroscopy in Health and Disease. Physiol. Meas., 27, 921 – 933.
[8] World Health Organization. 2009. Dengue : Guidelines for Diagnosis, Treatment, Prevention and Control. Switzerland : WHO Press.

The 4th International Seminar on Sensors, Instrumentation, Measurement and Metrology
28
002-ISSIMM2019
A High Voltage Electrostatic Filter For Fine Particles Capture
Applied in Motorcycle Exhaust System Arinto Yudi Ponco Wardoyo
1, a, Hari Arief Dharmawan
1,b, Muhammad
Nurhuda1, c
and Arif Budianto1,d
1
Physics Department, Brawijaya University, Jl. Veteran Malang 65145, East Java, Indonesia a
[email protected] (corresponding author), b
[email protected] Keywords: Efficiency; electrostatic principle; filtration system; fine particle; motor
vehicle emission. ABSTRACT. Increasingly strict air pollution regulations along with a global warming issue have
peeked an interest in cleaner emission emitted by motor vehicles. In line with this, this study was
aimed to develop a low-cost particulate filtering system based on an electrostatic principle
for particulate matter with the diameter less than 2.5 μm, as known as a fine particle, and to test
the performance of the filter. The filter consisted of aluminum anodes and cathodes as the
electrostatic electrodes. These electrodes were placed into the filter frame and installed on a
motor vehicle muffler. The test was conducted to obtain the filter performance by
measuring particle concentrations before and after using the filters. The filter was tested
under four different electrostatic voltages: V1 100 Volt, V2 200 Volt, V3 300 Volt, and V4 400 Volt.
The results show that the filter can reduce fine particle concentrations with the best efficiency of
50%, 60%, 62%, and 68%, respectively for V1, V2, V3, and V4. Filter performance was directly
influenced by the applied voltage and the time of the test.
Figure 1. Correlation between voltage and filter efficiency at 10th minute (blue line)
and 40th minute (green line)
References
[1] T. Boger, S. He, T. Collins, A. Heibel, D. Beall, and C. Remy, “A next generation
cordierite diesel particle filter with significantly reduced pressure drop,” Int. J. Engines, vol. 4, pp. 902–912, 2011.
[2] G. Buonanno, G. Giovinco, L. Morawska, and L. Stabile, “Lung cancer risk of airborne particles for
Italian population,” Environmental Research, vol. 142, pp. 443–451, 2015. [3] U. Hajar, A.Y.P. Wardoyo, and Masruroh, “Developing and characterization of an ultrafine filter made of banana leaf and water hyacinth to reduce motorcycle emission,” Applied Ecology and Environmental Research, vol. 17, pp. 1959–1965, 2019. [4] X. Han, H. Li, Q. Liu, F. Liu, and A. Arif, “Analysis of influential factors on air quality from
global and local perspectives in China,” Environmental Pollution, vol. 248, pp. 965–979, 2019.

The 4th International Seminar on Sensors, Instrumentation, Measurement and Metrology
29

The 4th International Seminar on Sensors, Instrumentation, Measurement and Metrology
30
003-ISSIMM2019
Design and Implementation of Water Pump Control System for
Rice Field Irrigation
Rizal Arifin1, a
, Zulkham Umar Rosyidin2
, Muhammad Malyadi1
, Edy Kurniawan3
,
Khoirul Anam3
, Rical Cahya Ardhitamara3
, Doni Rhomadon3
, Muhammad Ega Pahlawi3
1Department of Mechanical Engineering, Universitas Muhammadiyah Ponorogo, Jl. Budi Utomo No. 10 Ponorogo, 63471 Indonesia 2Universitas Muhammadiyah Ponorogo, Jl. Budi Utomo No. 10 Ponorogo, 63471 Indonesia 3Department of Electrical Engineering, Universitas Muhammadiyah Ponorogo, Jl. Budi Utomo No. 10 Ponorogo, 63471 Indonesia [email protected] (corresponding author) Keywords: Electronic instrument, control system, water pump, irrigation, rice field, short
message service.
ABSTRACT. We have built an electronic instrument of water pump control system for rice field
irrigation, as shown in figure 1. This instrument is developed from the previous prototype [1]
with some additional features. This instrument is equipped with the keypad, GSM modem,
water flow sensor, and relay as the input sources. An Arduino Mega 2560 is used as the main
controller of the system. The working time of the water pump can be set using the keypad or
short message service, which is received by GSM modem in the instrument. If there is no water
flowing through the water pump as detected by the water flow sensor, the instrument will
automatically shut down the water pump, and send the notification message to the user’s
handphone. When the abnormal condition is detected on the water pump, the relay will
disconnect the electricity to avoid the severe damage of the water pump. This instrument has
been installed and used by the farmer in Desa Ngunut, Babadan District, Ponorogo Regency, with
support from DRPM Kemenristekdikti through Program Kemitraan Masyarakat [2].
Figure 1. Picture of water pump control instrument
References
[1] Z.U. Rosyidin, “Perancangan alat kendali irigasi sawah menggunakan short message
service (SMS) berbasis mikrokontroler ATMEGA 16.” Undergradute Thesis, Universitas
Muhammadiyah Ponorogo, 2017 [2] R. Arifin, M. Malyadi, E. Kurniawan, and Z.U. Rosyidin “Upaya peningkatan efektifitas pengairan sawah dengan sistem kontrol pompa air listrik,” Dinamisia: Jurnal Pengabdian kepada Masyarakat, In review.

The 4th International Seminar on Sensors, Instrumentation, Measurement and Metrology
31

The 4th International Seminar on Sensors, Instrumentation, Measurement and Metrology
32
004-ISSIMM2019
Beat Frequency M easurement of the Stabilized He-Ne Laser 633 nm
Calibration in BSN
Asep Hapiddin1, 2
, Yulita Ika P. 1, 2
, A.M. Boynawan1, 2
, Ratnaningsih1, 2
, Swivano
Agmal 3
, Okasatria Novyanto1, 2
1Center for Research and Human Resources Development, National Standardization Agency of Indonesia, Kompleks Puspiptek Gedung 435, Setu Tangerang Selatan, Banten, Indonesia 2National Measurement Standards Laboratory, National Standardization Agency of Indonesia, Kompleks Puspiptek Gedung 420, Setu Tangerang Selatan, Banten, Indonesia 3Research Center for Physics, Indonesian Institutes of Sciences , Kompleks Puspiptek Gedung 440, Setu Tangerang Selatan, Banten, Indonesia [email protected] Keywords : optical wavelength, calibration, beat frequency measurement, stabilized He-Ne laser
AB STRACT. In the metrology area, typically stabilized lasers are used as length primary
standard. Iodine stabilized He-Ne laser in National Standardization Agency of Indonesia-BSN (KIM-
1) has been traceable to SI unit through CCL-K11 inter-laboratory comparison in 2014, the result
was suitable for KIM-1 to be used as the length primary standard in BSN. The optical wavelength
calibration system has been established as a dissemination system of the reference value of KIM-
1. Beat frequency measurement was applied in the calibration system for stabilized He-Ne laser
633 nm. In the calibration replica, a dual-frequency mode (Agilent 5519B) took a role as UUT
laser, which emits a pair of beams with a central wavelength of λ=632.991354 nm in vacuum
with frequency difference 3.4 to 4.0 MHz and +- 0.02 ppm stability for a typical lifetime. As a
calibration result, the optical wavelength of Agilent 5519B is (632.991 371 06 ± 0.000 000 13) nm
and (632.991 374 73 ± 0.000 000 14) nm, respectively for vertical and horizontal polarization
beams. It shows that Agilent 5519B produces a wavelength in the acceptable range and can be
traced back to SI unit of length through KIM-1.
Figure 1. Scheme of the configuration setup for beat frequency measurement in SNSU-BSN

The 4th International Seminar on Sensors, Instrumentation, Measurement and Metrology
33
Re fe re nces
[1] B. B. Laud, “Lasers and non-linear optics.” New Age International Publishers, New Delhi, 2011.
[2] T. J. Quinn, “Practical realization of the definition of the metre, including recommended radiations of other optical frequency standards (2003),” Metrologia, vol. 40, no. 4, pp. 103–133, 2003.
[3] Iodine Stabilized He Ne Laser, Model NEO-92SI. Nihonkagaku Engineering Co., Ltd, 2000. [4] Matus Michael, “Report on on-going CCL Key Comparison for the year 2014 Comparison of
optical frequency and wavelength standards Final,” Metrol. Tech. Suppl., vol. 54, no. July, 2017.
[5] T. H. Yoon, J. Ye, J. L. Hall, and J. M. Chartier, “Absolute frequency measurement of the iodine-stabilized He-Ne laser at 633 nm,” Appl. Phys. B, vol. 72, pp. 221–226, 2001.
[6] A. Widya, A. Hapiddin, M. Syahadi, and E. Juliastuti, “Optical wavelength meter calibration using Iodine stabilized He-Ne laser by direct measurement method,” Procedia Eng., vol. 170, pp. 363–368, 2017.
[7] “Laser Heads Agilent 5519B, User’s Manual.” Agilent Technologies, 2002. [8] JCGM, “Evaluation of measurement data — Guide to the expression of uncertainty in
measurement,” vol. 50, no. September, p. 134, 2008.
The 4th International Seminar on Sensors, Instrumentation, Measurement and Metrology
34
005-ISSIMM2019
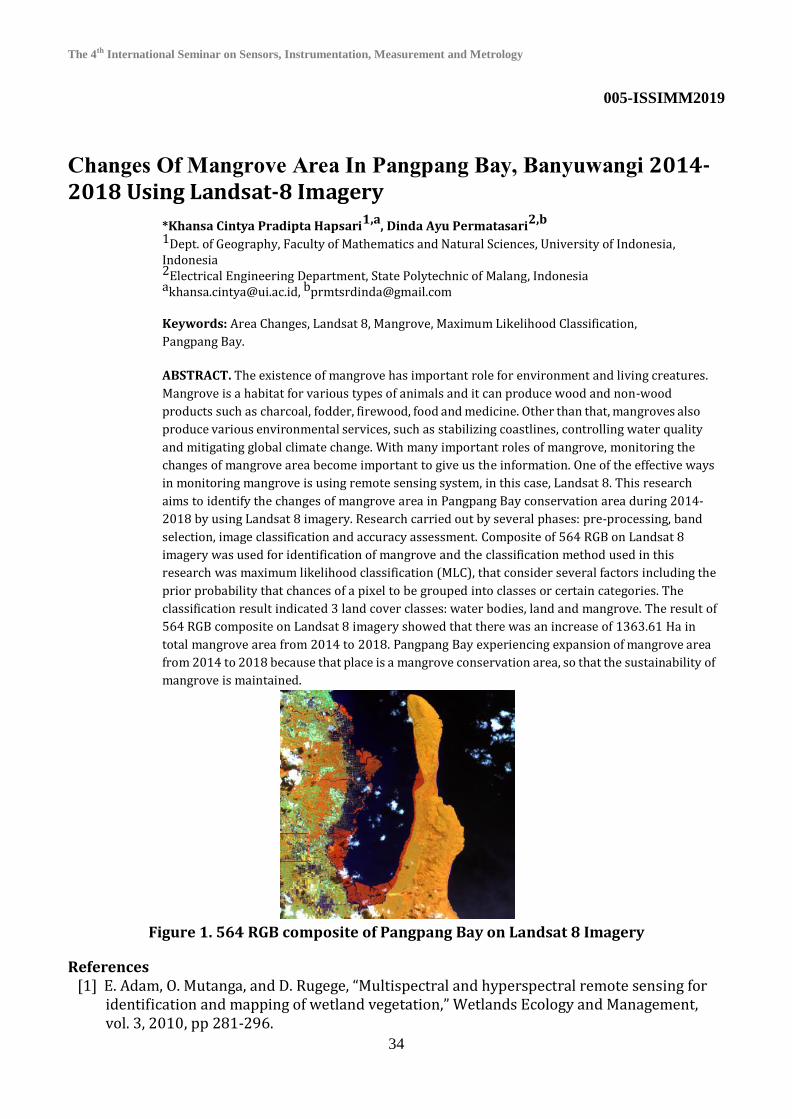
Changes Of Mangrove Area In Pangpang Bay, Banyuwangi 2014-2018 Using Landsat-8 Imagery
*Khansa Cintya Pradipta Hapsari1,a
, Dinda Ayu Permatasari2,b
1Dept. of Geography, Faculty of Mathematics and Natural Sciences, University of Indonesia, Indonesia 2Electrical Engineering Department, State Polytechnic of Malang, Indonesia [email protected], [email protected] Keywords: Area Changes, Landsat 8, Mangrove, Maximum Likelihood Classification,
Pangpang Bay.
ABSTRACT. The existence of mangrove has important role for environment and living creatures.
Mangrove is a habitat for various types of animals and it can produce wood and non-wood
products such as charcoal, fodder, firewood, food and medicine. Other than that, mangroves also
produce various environmental services, such as stabilizing coastlines, controlling water quality
and mitigating global climate change. With many important roles of mangrove, monitoring the
changes of mangrove area become important to give us the information. One of the effective ways
in monitoring mangrove is using remote sensing system, in this case, Landsat 8. This research
aims to identify the changes of mangrove area in Pangpang Bay conservation area during 2014-
2018 by using Landsat 8 imagery. Research carried out by several phases: pre-processing, band
selection, image classification and accuracy assessment. Composite of 564 RGB on Landsat 8
imagery was used for identification of mangrove and the classification method used in this
research was maximum likelihood classification (MLC), that consider several factors including the
prior probability that chances of a pixel to be grouped into classes or certain categories. The
classification result indicated 3 land cover classes: water bodies, land and mangrove. The result of
564 RGB composite on Landsat 8 imagery showed that there was an increase of 1363.61 Ha in
total mangrove area from 2014 to 2018. Pangpang Bay experiencing expansion of mangrove area
from 2014 to 2018 because that place is a mangrove conservation area, so that the sustainability of
mangrove is maintained.
Figure 1. 564 RGB composite of Pangpang Bay on Landsat 8 Imagery
References [1] E. Adam, O. Mutanga, and D. Rugege, “Multispectral and hyperspectral remote sensing for
identification and mapping of wetland vegetation,” Wetlands Ecology and Management, vol. 3, 2010, pp 281-296.

The 4th International Seminar on Sensors, Instrumentation, Measurement and Metrology
35
[2] J. Aschbacher, “An integrated comparative approach to mangrove vegetation mapping using advanced remote sensing and GIS technologies,” Hydrobiologia, vol. 1, 1995, pp. 285-294.
[3] K. Kathiresan and B.L. Bingham, “Biology of mangroves and mangroves ecosystem,” Adv. Mar. Biol, vol. 40, 2001, pp. 81-251.
[4] T.L. Coleman, A. Manu, and Y.A. Twumasi, “Application of landsat data to the study of mangrove ecologies along the coast of Ghana,” Center for Hydrology, Soil Climatology, and Remote Sensing Alabama A&M University. Alabama, 200
The 4th International Seminar on Sensors, Instrumentation, Measurement and Metrology
36
006-ISSIMM2019
Oil Spill Monitoring using Radar Image
Ogi Gumelar1, a, Rachmat Arief1,b Shadiq Ali1,c
1LAPAN Jl. Pekayon no.70 Pekayon Pasar Rebo Jakarta Timur 137110, Indonesia [email protected], [email protected], [email protected] Keywords: oil spill, radar image, sentinel, dark spot, image processing
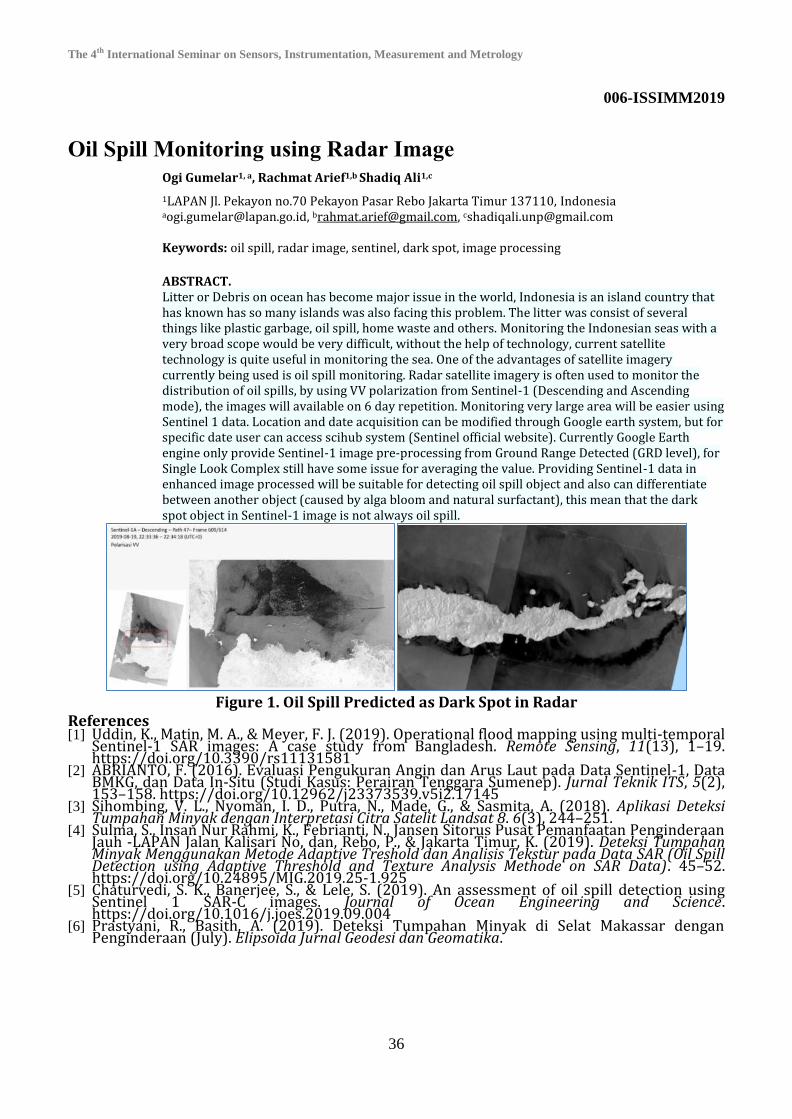
ABSTRACT. Litter or Debris on ocean has become major issue in the world, Indonesia is an island country that has known has so many islands was also facing this problem. The litter was consist of several things like plastic garbage, oil spill, home waste and others. Monitoring the Indonesian seas with a very broad scope would be very difficult, without the help of technology, current satellite technology is quite useful in monitoring the sea. One of the advantages of satellite imagery currently being used is oil spill monitoring. Radar satellite imagery is often used to monitor the distribution of oil spills, by using VV polarization from Sentinel-1 (Descending and Ascending mode), the images will available on 6 day repetition. Monitoring very large area will be easier using Sentinel 1 data. Location and date acquisition can be modified through Google earth system, but for specific date user can access scihub system (Sentinel official website). Currently Google Earth engine only provide Sentinel-1 image pre-processing from Ground Range Detected (GRD level), for Single Look Complex still have some issue for averaging the value. Providing Sentinel-1 data in enhanced image processed will be suitable for detecting oil spill object and also can differentiate between another object (caused by alga bloom and natural surfactant), this mean that the dark spot object in Sentinel-1 image is not always oil spill.
Figure 1. Oil Spill Predicted as Dark Spot in Radar
References [1] Uddin, K., Matin, M. A., & Meyer, F. J. (2019). Operational flood mapping using multi-temporal
Sentinel-1 SAR images: A case study from Bangladesh. Remote Sensing, 11(13), 1–19. https://doi.org/10.3390/rs11131581
[2] ABRIANTO, F. (2016). Evaluasi Pengukuran Angin dan Arus Laut pada Data Sentinel-1, Data BMKG, dan Data In-Situ (Studi Kasus: Perairan Tenggara Sumenep). Jurnal Teknik ITS, 5(2), 153–158. https://doi.org/10.12962/j23373539.v5i2.17145
[3] Sihombing, V. L., Nyoman, I. D., Putra, N., Made, G., & Sasmita, A. (2018). Aplikasi Deteksi Tumpahan Minyak dengan Interpretasi Citra Satelit Landsat 8. 6(3), 244–251.
[4] Sulma, S., Insan Nur Rahmi, K., Febrianti, N., Jansen Sitorus Pusat Pemanfaatan Penginderaan Jauh -LAPAN Jalan Kalisari No, dan, Rebo, P., & Jakarta Timur, K. (2019). Deteksi Tumpahan Minyak Menggunakan Metode Adaptive Treshold dan Analisis Tekstur pada Data SAR (Oil Spill Detection using Adaptive Threshold and Texture Analysis Methode on SAR Data). 45–52. https://doi.org/10.24895/MIG.2019.25-1.925
[5] Chaturvedi, S. K., Banerjee, S., & Lele, S. (2019). An assessment of oil spill detection using Sentinel 1 SAR-C images. Journal of Ocean Engineering and Science. https://doi.org/10.1016/j.joes.2019.09.004
[6] Prastyani, R., Basith, A. (2019). Deteksi Tumpahan Minyak di Selat Makassar dengan Penginderaan (July). Elipsoida Jurnal Geodesi dan Geomatika.
The 4th International Seminar on Sensors, Instrumentation, Measurement and Metrology
37
007-ISSIMM2019
Algorithm of Time and Frequency Remote Calibration System of
SNSU- BSN
A. Mohamad Boynawan, Ratnaningsih, Windi Kurnia Perangin-Angin, Yulita Ika Pawestri, Asep Hapiddin, Muhammad Azummar Center for Research and Human Resources Development, National Standardization Agency of Indonesia, Kompleks Puspiptek Gedung 430, Setu Tangerang Selatan, Banten, Indonesia [email protected] Keywords: Atomic clock cesium, GPS receiver, remote calibration, time and frequency,
UTC(IDN).
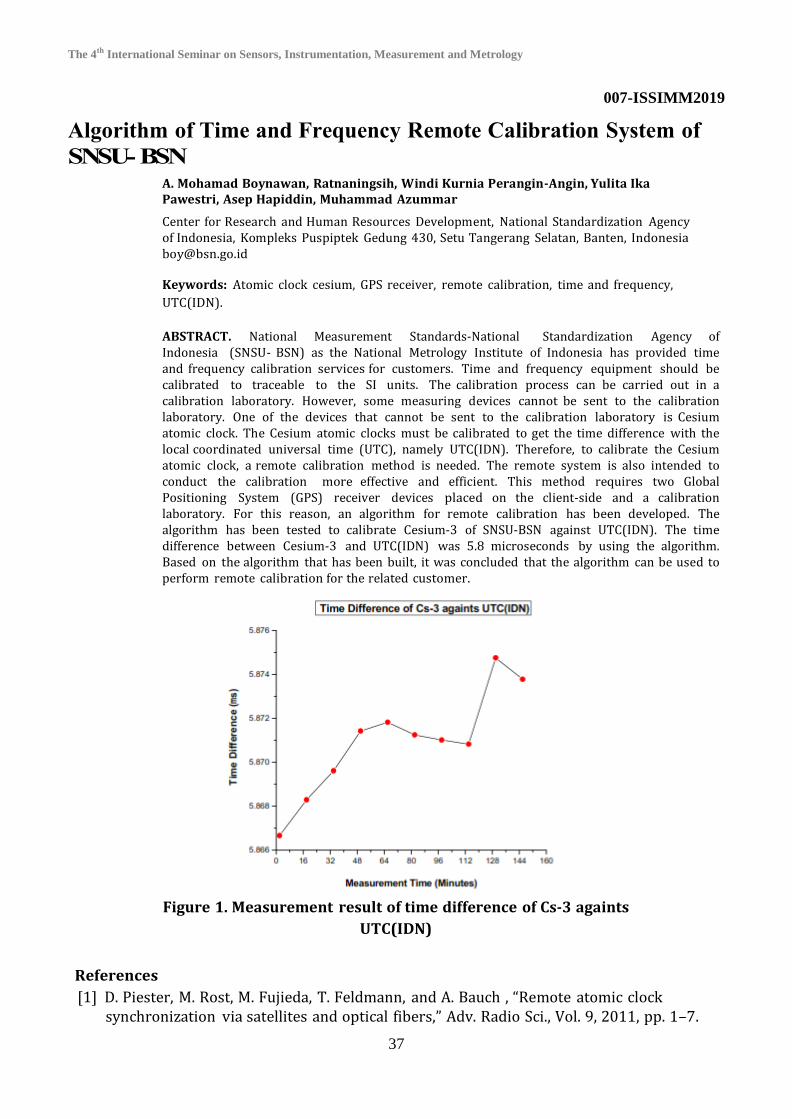
ABSTRACT. National Measurement Standards-National Standardization Agency of Indonesia (SNSU- BSN) as the National Metrology Institute of Indonesia has provided time and frequency calibration services for customers. Time and frequency equipment should be calibrated to traceable to the SI units. The calibration process can be carried out in a calibration laboratory. However, some measuring devices cannot be sent to the calibration laboratory. One of the devices that cannot be sent to the calibration laboratory is Cesium atomic clock. The Cesium atomic clocks must be calibrated to get the time difference with the local coordinated universal time (UTC), namely UTC(IDN). Therefore, to calibrate the Cesium atomic clock, a remote calibration method is needed. The remote system is also intended to conduct the calibration more effective and efficient. This method requires two Global Positioning System (GPS) receiver devices placed on the client-side and a calibration laboratory. For this reason, an algorithm for remote calibration has been developed. The algorithm has been tested to calibrate Cesium-3 of SNSU-BSN against UTC(IDN). The time difference between Cesium-3 and UTC(IDN) was 5.8 microseconds by using the algorithm. Based on the algorithm that has been built, it was concluded that the algorithm can be used to perform remote calibration for the related customer.
Figure 1. Measurement result of time difference of Cs-3 againts
UTC(IDN) References
[1] D. Piester, M. Rost, M. Fujieda, T. Feldmann, and A. Bauch , “Remote atomic clock synchronization via satellites and optical fibers,” Adv. Radio Sci., Vol. 9, 2011, pp. 1–7.

The 4th International Seminar on Sensors, Instrumentation, Measurement and Metrology
38
[2] M. A. lombardi, “The Reach and Impact of the Remote Frequency and Time Calibration
Services at NIST,” NCSLI Measure J. Meas. Sci., 2019.
[3] X. Hong, G. Liu, Z.i Wu, D. Xipeng, “Remote calibration system for frequency based
on in-place benchmark,” Front. Mech. Eng. China,Vol. 5, no. 3, 2010. pp. 316–321.
[4] J. L. Wang, S. Y. Huang, C. S. Liao, “Time and Frequency Transfer System using GNSS
Receiver,” Asia-Pacific Radio Science Conference, 2013.
[5] M. A. Lombardi, “A NIST Disciplined Oscillator: Delivering UTC(NIST) to the
Calibration Laboratory,” The Journal of Measurement Science, Vol. 5, No. 4, 2010, pp.
46–54.

The 4th International Seminar on Sensors, Instrumentation, Measurement and Metrology
39
008-ISSIMM2019
Analysis and Characterization of Magneto-Optical Kerr Effect
Measurement System: Case Study on CoFeB
N. Franata1,a
, F. Permata2,b
, L. H. Suganda3,c
, A. Sudarmaji4,d
, and D. Handoko5,e
1,2,3,4,5Department of Physics, Faculty of Mathematics and Science, Universitas Indonesia, Depok 16424, Indonesia [email protected], [email protected], [email protected], [email protected], [email protected] (corresponding author) Keywords: BH1750, CoFeB, Kerr, Effect
Polarization
ABSTRACT. In this research, a magneto-optical Kerr effect (MOKE) measurement system is made
to analyze the magnetic properties of CoFeB film. The Kerr signal is obtained by measuring the
polarized light that passed through the polarizing beam splitter (PBS) that was reflected by CoFeB
thin film, as shown in Figure 1. In this work, a RGB laser is used as the light source with three
different wavelengths and the light intensity that is reflected by the thin film is measured by
BH1750. To complete the observation, the applied magnetic field is observed by using Gauss
meter with current source which given by constant current power supply. Hysterisis loop of
CoFeB from the measurement were observed to analyze and determine the characteristic of the
system to get the optimal measurements. All the measurements system worked automatically, the
data of linght intensity is being acquired by using a microncontroller and the data acquisition is
processed by using LabVIEW.
Figure 1. Measurement system schematic based on Magneto-Optical Kerr Effect
(MOKE)
References
[1] C. Shearwood, A. D. Matiingley, and M. R. J. Gibbs, J. Magn. Mater. 162, 147
(1996) [2] D. Handoko, D. T. Quach, S. H. Kee, K. M. Lee, J. R. Jeong, D. S. Yang, and D. H. Kim,
IEEE Transactions on Magnetics 52, 6100105(2016) [3] D. Handoko, S. H. Lee, K. M. Lee, J. R. Jeong, D. H. Kim. J. Magn. Mater. 351, 82-
86(2014)

The 4th International Seminar on Sensors, Instrumentation, Measurement and Metrology
40
009-ISSIMM2019
The Design of Litopenaeus Vannamei Automatic Feeder
Irwan1, a
, M. Iqbal Nugraha2,b
, M. Anzullah3,c
, Rahmah Suci Saputri 4.d
1, 2, 3, 4Politeknik Manufaktur Negeri Bangka Belitung, Bangka, Indonesia airwan@polman-
babel.ac.id, [email protected], [email protected], [email protected] Keywords: vannamei, shrimp, auto-feeder, android-
based-system.
ABSTRACT. The province of Bangka Belitung in Indonesia has a potential production of ocean
fishery production about 1,200,000 tons per year. On the other side, there is another oppurtunity
for the government to take advantage of mainland usage for ocean fishery. Vannamei shrimp is
one fishery product that can be farmed on mainland. Based on the statistical information
published by BPS in 2017, Bangka Belitung province has only used 419.14 hectare of land for
fishery from the the total of 1,602 hectare. The Vannamei shrimp has been farmed on small
portion of that land, while Vannamei shrimp sits on the highest export commodity of the ocean
fish product that is about 40% compared with others. Nowadays there are numbers of Vannamei
shrimp’s company in Bangka Belitung. Feeding process of Vannamei shrimp is one problem in this
business. The foods and its vitamins consume about 50-80% of the total cost. Another big problem
is the food residual can cause about 60% of organic waste. This problem is due to the feeding
process done manually. The shrimps do not consume all the foods. The rest of the food is then be
an organic waste. This then gives another problem that makes the reduction of dissolved oxygen
in the shrimp pond. To anticipate this problem, an automatic feeder has been produced, but
they are not optimized yet. The existing auto- feeder that is used by one of shrimp farmer in
Bangka Belitung has several problems such as: (1) the food spreading does not cover all area, (2)
the mechanical system or food transporter could not be used for long time (it needs to be
replaced frequently). The propose of this study was to design a new method of automatic feeder
which can spread the pellets from 0 to required distance in meters and of a food transporter that
can flow pellets properly. The machine has been designed to be operated using android-
based system. This brings the ease of use to control and monitor the feeding process. The system
was divided into two parts, mechanical and electronics. The mechanical parts are a container for
shrimp food, a transporter for delivering the food from container to thrower part, and a throwing
part to spread the food. The electronics part are an input which is sensors and other input
components are attached, a processing unit to update the output status based on the program
stored in it, and output parts to actuate the mechanical parts. Several steps has been conducted in
the research process. Literature study, interview with business owner and technical staffs, and
comparing with their available system was firstly conducted. Secondly is designing the
mechanics, electronics, and software parts. The third stage was making and building each
designed parts. The testing of each part was conducted when it finishes and ready for testing.
The last stage was the test for the whole system in the lab and continued in the real
Vannamei shrimp pond. The result shows that the automatic feeder can achieve 15 meter in
maximum distance of food throwing. Spreading the food can be from 0 up to
15 meter based on the speed controlling of throwing (0 to 700 rpm). The auto-feeder can also be
monitored using android system such as the volume of the food, and on/off the system manually.
References [1] E. A. Hendajat, "Budi Daya Udang Vaname (Litopenaeus vaname) Pola Tradisional Plus Di
Kabupaten Sulawesi Selatan," Media Akuakultur, vol. 2, no. 11, p. 1, 2019.

The 4th International Seminar on Sensors, Instrumentation, Measurement and Metrology
41
[2] efishery, "The Smartest Shrimp Autofeeder," PT. Multidaya Teknologi Nusantara, September 2017:www.efishery.com. [Accessed Monday July 2019]
[3] Ullman, C., Rhodes, M.A., and Allen Davis, D.: ‘Feed management and the use of automatic feeders in the pond production of Pacific white shrimp Litopenaeus vannamei’, Aquaculture, 2019, 498, pp. 44-49.

The 4th International Seminar on Sensors, Instrumentation, Measurement and Metrology
42
010-ISSIMM2019
Implementation of Single Shot Detector for Object Finding in
Drone Platform
Alfarih Faza1, a
and Surya Darma2,b
1Jl. Sumatra, Ds. Jombang Rawa Lele, Tangerang Selatan, Indonesia 2Department of Physics, F Building Kampus UI Depok, 16424, Jawa Barat, Indonesia [email protected] [email protected] (corresponding author) Keywords: Object Detection, PID Control, Quadcopter, Single Shot Multibox Detector, Time
Responses.
ABSTRACT. The developing of object detection for many purposes has come to various
techniques. Some of those works also implement to solve our daily life problem. Those
developments which are state-of-the-art are mostly applicable to many pros than others. In this
paper, we use one of the state-of-the-art object detection to control a quadcopter, i.e., Single Shot
MultiBox Detector (SSD). SSD is used to detect an object as a quadcopter target for approach
missions. SSD also use to keep an eye on the target. The shape of the ROI location represents
the target. Figure 1 shows the result of using SSD in a 6 meters object detected. The control
system of a quadcopter uses this ROI or bounding box location as its feedback, which will guide
the quadcopter to approach for it. In this paper, a lab-scale quadcopter was built, uses simple
Proportional- Integral-Differential (PID) to control it. A method for fine-tuning the PID also given
in the discussion. Times and responses of the whole process provided in the graphics display. The
mission considered as a success if the quadcopter can stop at a minimum range of 1 meter toward
the target.
Figure 1. Example of object detection using SSD model to detect person.
References
[1] Uijlings, J.R., van de Sande, K.E., Gevers, T., Smeulders, A.W.: Selective search for object
recognition. IJCV (2013)

The 4th International Seminar on Sensors, Instrumentation, Measurement and Metrology
43
[2] Ren, S., He, K., Girshick, R., Sun, J.: Faster R-CNN: Towards real-time object detection with
region proposal networks. In: NIPS. (2015) [3] He, K., Zhang, X., Ren, S., Sun, J.: Deep residual learning for image recognition. In:
CVPR. (2016)
[4] Liu, W., Anguelov, D., Erhan, D., Szegedy, C., Reed, S., Fu, C. Y., & Berg, A. C. (2016). SSD:
Single shot multibox detector. Lecture Notes in Computer Science (Including
Subseries Lecture Notes in Artificial Intelligence and Lecture Notes in Bioinformatics),
9905 LNCS, 21–37

The 4th International Seminar on Sensors, Instrumentation, Measurement and Metrology
44
011-ISSIMM2019
Stroke Severity Classification of EEG Signals by Recurrent Neural
Network
Fitria Yunita Dewi1, a, Alfarih Faza2,b and Sastra Kusuma Wijaya3,c
1Universitas Indonesia, Depok, Indonesia 2 Universitas Indonesia, Depok, Indonesia 3 Universitas Indonesia, Depok, Indonesia
[email protected], [email protected], [email protected] (corresponding author) Keywords: Acute Ischemic Stroke, Electroencephalogram, Long Short-Term Memory, Principal Component Analysis. ABSTRACT. Acute Ischemic Stroke (AIS) is one kind of stroke that occurs the most. Stroke itself is the number one cause of death that can reduce blood flow and deprive the oxygen into the brain. Early diagnosis can help patients getting faster medical treatment thus avoid unwanted damage to the brain. Electroencephalogram (EEG) is an alternative tool for diagnosing AIS to the standard tools as in MRI or CT-scan. In this research, we try to classify stroke severity with one of the Recurrent Neural Network (RNN) architecture i.e. Long Short-Term Memory (LSTM). The proposed method took the input from 18 EEG channels with 10-20 electrode placement system. The signals would be preprocessed first through Principal Component Analysis (PCA) to reduce dimensionality and find the new smaller set where most of the information is not lost. The output would be classified into 4 classes: normal, mild, moderate and severe stroke.
References [1] Alhagry, Salma, Aly Aly Fahmy, and Reda A. El-Khoribi. "Emotion recognition based on EEG
using LSTM recurrent neural network." Emotion 8.10 (2017): 355-358. [2] J. Clerk Maxwell, A Treatise on Electricity and Magnetism, 3rd ed., vol. 2. Oxford: Clarendon,
1892, pp.68-73. [3] N. Fitriah, S. K. Wijaya, M. I. Fanany, C. Badri, and M. Rezal, “EEG channels reduction using
PCA to increase XGBoost’s accuracy for stroke detection,” AIP Conf. Proc., vol. 1862, no. July, 2017.
[4] Tan, Chuanqi, et al. "Multimodal classification with deep convolutional-recurrent neural networks for electroencephalography." International Conference on Neural Information Processing. Springer, Cham, 2017.

The 4th International Seminar on Sensors, Instrumentation, Measurement and Metrology
45
012-ISSIMM2019
Influence of The Nitrogen exposure Time to The Plasma Treatment
on the Hydrophobicity of polystyrene surfaces
Masruroh1, a
, Gigih Satriyo Wibowo2,b
and Dionysius J. D. H. Santjojo3,c
1Department of Physics, Brawijaya University, Malang, 65145, Indonesia 2 Collaborative Research Group for Advanced System and Material Technology (ASMAT), Brawijaya University, Malang, Indonesia [email protected] (corresponding author) b [email protected]
Keywords: Nitrogen plasma, polystyrene surface, exposure time, hydrophilic, NH2 and N-H functional groups. ABSTRACT. The wettability of material can change from hydrophobic to hydrophilic when
treated using plasma nitrogen. The present work investigated the influence of the plasma
treatment duration on the modification of polystyrene s surface coating on a glass surface. The
polystyrene layer was produced by means of spin coating method with the rotational speed of
3000 RPM for 1 minute. The plasma was established by a 2 MHz RF generator at the power of
40 watts, pressure of 0.3 torr, flow rate 40 mL/min. The samples were treated at various
exposure time which were 2 minutes, 5 minutes, 10 minutes, and 15 minutes. The hydrophobicity
of the polystyrene was measured using a contact angle measurement before and after the
nitrogen plasma treatment. Polar functional groups related to the wettability were observed by a
Fourier Transform Infrared (FTIR). The longer the treatment duration, the smaller the contact
angle was observed. A very low contact angle of 6.42 was achieved at a power of 40 watt at 0.3
torr for the exposure time of 15 minutes. The means that the surface of the polystyrene changed
to superhydrophilic or superwetting. The FTIR results show the spectra of NH2 and C-H
functional group at the wavenumber of 3485.76 cm-1 and 2962.61 cm-1, respectively. These
functional groups indicate the existence of the polar groups, which contribute to the change of
surface hydrophobicity into hydrophilicity.
References
[1] J. Kong, K. L. Yung, Y. Xu, W. Tian, Wettability transition of plasma-treated polystyrene
micro/nano pillars-aligned patterns eXPRESS Polymer Letters Vol.4, No.12 753–762, 2010 [2] Masruroh, D.J. Djoko, H.S, Lalu A. Didik, Eka Rahmawati, Masdiana Padaga, Abdurrouf, S. P.
Sakti., “Solvent Effect on Morphology of Polystyrene Coating and their Role to Improvement for Biomolecule Immobilization in Application of QCM Based Biosensor,” Appl. Mech. Mater., vol. 530–531, pp. 54–57, 2014.
[3] Masruroh, T. N Zahirah, Aulanni'Am, S P Sakti and D J D H Santjojo, The Effect of Molecular Weight on the Surface Wettability of Polystyrene Treated by Nitrogen Plasma", IOP Conference series: Materials science and Engineering 2018.
[4] S. P. Sakti, L. Amaliya, N. F. Khusnah, and Masruroh, “Effect of UV radiation duration and molecular weight to hydrophobicity and surface roughness of polystyrene coating on QCM sensor,” J. Teknol., vol. 79, no. 3, pp. 61–67, 2017.
[5] S. Ebnesajjad and C. F. Ebnesajjad, Surface Treatment of Materials for Adhesive Bonding, Second edi., no. October. Waltham, USA, Elsevier Inc, 2014.
[6] M.D. Ionita, B. G. Daşan, M. Teodorescu, M. Mutlu, B. Mitu, G., Surface modification of polystyrene beads using RF atmospheric pressure plasma jet, https://www.researchgate.net/publication/261842037

The 4th International Seminar on Sensors, Instrumentation, Measurement and Metrology
46
[7] Masruroh, Dionysius J. D. H. Santjojo, Heraniawati, Muhamad A. Abdillah, Tyas N Zafirah and Eka Maulana, Setyawan P. Sakti, Optical emission spectroscopy studies
during nitrogen plasma of polystyrene surfaces Modification", 4th Int. Conf. on Science, Engineering & Environment SEE), Nagoya, Japan, Nov.12-14, 2018
[8] I. G. Wenten, Superhydrophobic membrane : progress in preparation and its separation properties, pp. 1–28, 2018.
[9] S. Anand, S. Rs, C. Ramachandraraja, S. Ramalingam, and R. Durga, “Physico-Chemical Characterization , Opto Electronic Investigation and Vibrational Analysis on Coordinate Covalent Complex ; Bis ( Thiourea ) Nickel Bromide ( BTNB ) Using Experimental and Computational Tools Theoretical & Computational Science,” vol. 3, no. 1, pp. 1–15, 2016.
[10] A. F. Alkaim, R. Dillert, and D. W. Bahnemann, Effect of polar and movable (OH or NH2 groups) on the photocatalytic H2 production of alkyl-alkanolamine: a comparative study, Environ. Technol., vol. 36, no. 17, pp. 2190–2197, Sep. 2015.

The 4th International Seminar on Sensors, Instrumentation, Measurement and Metrology
47
013-ISSIMM2019
Plasma Intensification in 2 MHz RF Glow Discharge in Carbon
Film Plasma Sputtering Deposition by means of a Hollow Cathode
Dionysius J.D.H. Santjojo1,2,a
, Dwi R.S. Pambudi1
and Masruroh1,2
1Department of Physics, FMIPA, Brawijaya University Malang, Indonesia 2 CRC for Advanced System and Material Technology, Brawijaya University Malang, Indonesia [email protected] (corresponding author) Keywords: carbon film, emission spectroscopy, hollow cathode, rf plasma,
sputtering.
ABSTRACT. A hollow cathode has been one of the methods to intensify the plasma in etching or
ashing process. This work examined a number of technique in intensification of a 2 MHz RF glow
discharge plasma to deposit carbon film by means of the hollow cathode. Three types of the
cathode configurations, which were cylindrical, rectangular and a cylindrical-rectangular
combination, were tested to get an optimum condition for the carbon deposition. Both carbon
target and substrate were fixed inside the hollow cathode. The plasma was characterized by
means of an optical emission spectroscopy (OES) at the range of 200 nm –
1000 nm. The results showed that the combination where the rectangular hollow was placed
inside the cylindrical one, produced the most intense glow. Ion density and electron temperature
in the plasma were determined by a calculation based on the atomic data related to the specific
electronic transitions of the ions.
The density of ions was very high in the center area of the rectangular hollow producing a
complex reactions. On the other hand, the high density of the ions decreases the electron
temperature. The energy of the ions was difficult to be predicted since the spectrum showed the
existence of large number of ion states. Observations on the resulted deposit on the surface of
quartz substrate suggest that the intensification needs to be further investigated related to the
effectiveness of sputtering and deposition process.
Figure 1. Argon Plasma in a combined rectangular-cylindrical hollow cathode (left)
and its optical emission spectra (right).

The 4th International Seminar on Sensors, Instrumentation, Measurement and Metrology
48
014-ISSIMM2019
Implementation of Convolutional Neural Networks to Determine Lightning Location
Jihand Aulia Sashiomarda1, a
, Aziz Setia Aji1,b
and Djati Handoko1,c
1Department of Physics, Faculty of Mathematic and Sciences, Universitas Indonesia a [email protected], [email protected], [email protected] Keywords: Detection, lightning,
learning, machine.
ABSTRACT. Lightning produce not only electromagnetic signals but also thunder sound signal. A
new method was proposed to determine lightning location by measure Time of Arrival (TOA) of
lightning electromagnetic signals and thunder sound signal to get lightning distance using
Convolutional Neural Network (CNN). These signals were caught by using a set of cell phones.
These cell phones collect three main data i.e. the TOA of lightning electromagnetic signals, the
TOA thunder sound signal, and the coordinates obtained from Global Positioning System (GPS). In
this study, CNN determines thunder sound signal pattern which is recorded by certain cell phone.
More than one hundred samples of thunder sound signals were used as data set. Whole data set
divide into three categories i.e. training data, validation data, and testing data. The model runs
few hours to train the network and then produce a confusion matrix. The Matrix consists of
several column represents a set of samples that previously predicted by their labels and several
rows represents actual labels. The labels are thunder sound and the other sound. After the model
created, it is exported to the cell phone so that every time cell phone record a sound signal, the
model will predict whether the thunder sound or not. When the model predicts the sound as
thunder sound, the cell phones save the exact occurrence time. This determination is very
important when the cell phone is going to measure lightning distance between lightning location
and cell phone location.
(a)
(b)
Figure 1. Observation on thunder sound signal (a) thunder sound signal in time
domain (b) Spectrogram of thunder sound signal

The 4th International Seminar on Sensors, Instrumentation, Measurement and Metrology
49
References
[1] N.S. Tara and P. Carolina, “Convolutional Neural Networks for Small-footprint Keyword
Spotting,” Interspeech, 2015, pp.1478-1482. [2] Z. Han, G. Shanqiang, et.al, “Single-Station-Based Lightning Mapping System With
Electromagnetic and Thunder Signals,” IEEE on Transaction on Plasma Science, Vol. 47, No.2, February 2019, pp.1421-1428.
[3] S. Yu, Z. Ke, et.al., “Environment Sound Classification Using a Two-Stream CNN Based on
Decision- Level Fusion,” Sensor, 2019, pp.1-15.

The 4th International Seminar on Sensors, Instrumentation, Measurement and Metrology
50
015-ISSIMM2019
Rain Detection in Image Using Convolutional Neural Network
Arif Luqman Hakim*1, a and Prawito Prajitno1,b
1Department of Physics, Universitas Indonesia, Depok, Indonesia [email protected], [email protected] (corresponding author) Keywords: Convolutional neural network, image processing, rain detection, weather. ABSTRACT. Weather is a phenomenon occurs in the earth's atmosphere. Weather affects human daily activities, especially outdoor activities. Weather observations including rainfall observation in Indonesia conducted by Meteorological Climatological and Geophysical Agency (BMKG). BMKG facing a major problem in terms of rainfall data spatial density. The insufficient amount and unevenly distributed rainfall measurement instrument, are two main factors contributing to rainfall data special density problems. One of the very prominent methods to gain a larger amount of rainfall measurement location is using the image obtained from existing Closed Circuit Television (CCTV) spread over vast areas, especially in the Jakarta region. The approach to recognize and classify the rainfall in a certain area from the CCTV image used in this research is the Convolutional Neural Network (CNN) method. The image data was taken from CCTV located in Kamal, Kalideres, West Jakarta. The total of 2480 images taken is split into two categories, the one that shows a rainy day and the one that shows a clear day. These two categories of images will be used as sample data to train CNN, an effort to obtain a suitable model. By using the CNN method, it’s possible to recognize and classify the rainfall condition within an image based on the model. Python is an open-source programming language that widely used nowadays to run CNN. The image classification using this CNN, scored approximately 97% of accuracy, which means that the model is optimal to recognize and classify rainfall conditions in a certain area based on the CCTV images.
Figure 1. Training Performance Graph
References [1] J. Alecci, “Transfer Learning for Rain Detection in Images,” Delft University of Technology,
July 2017. [2] K. Garg and S.K. Nayar, “When does a camera see rain?,” Tenth IEEE International Conference
on Computer Vision (ICCV 2005). [3] T. Nurhikmat, “Implementasi Deep Learning untuk Image Classification Menggunakan
Algoritma Convolutional Neural Network (CNN) pada Citra Wayang Golek,” Universitas Islam Indonesia, Yogyakarta, 2018.
[4] Siswanti, Ngasifudin, and Sudiono, “Rancang Bangun Alat Ukur Curah Hujan,” Seminar Nasional II SDN Teknologi Nuklir Yogyakarta, Desember 2006.
[5] S. Bhandarkar, R. Prasad, V. Agarwal, R Hebbar, D. Uma, Y.B.V. Reddy, Y. Raghuramulu, and K.G. Raj, “Deep Learning and Statistical Models for Detection of White Stem Borer Disease in

The 4th International Seminar on Sensors, Instrumentation, Measurement and Metrology
51
Arabica Coffee,” Photogrammetry, Remote Sensing and Spatial Information Sciences, Volume XLII-3/W6, pp 443-451, Februari 2019.

The 4th International Seminar on Sensors, Instrumentation, Measurement and Metrology
52
016-ISSIMM2019
Cloud Detection Method for Pleiades Images Using Spectral Indices
Yudhi Prabowo1,a, Danang Surya Candra2,b and Shadiq Ali3,c
1,2,3Remote Sensing Technology and Data Center, National Institute of Aeronautics and Space of Indonesia (LAPAN), Lapan Street, No. 70, Pekayon, Pasar Rebo, 13710 Jakarta, [email protected] (corresponding author) [email protected] [email protected] Keywords: Cloud detection, NDCI, Pleiades. ABSTRACT. Very high spatial resolution satellite images such as Pleiades have been widely used for many remote sensing applications. But there is a main issue regarding cloud cover which interfere the information of the images. Another issue is that there are very few studies discussing cloud detection for Pleiades images. In this study, we developed a cloud detection approach for Pleiades images to address these issues. In the first step, normalized difference cloud index was used to detect thick cloud. We used the mean of the index in each 25x25 sliding windows. To improve the accuracy, we used soil-adjusted vegetation index. We also used band two to decrease commission error. In the second step, haze optimized transformation was used to identify haze and thin cloud. As a result, we found that by using first step, cloud can be detected, but the results still have commission error in some areas. Therefore, we used blue band of Pleiades to minimize this error. Haze and thin cloud can be identified by using blue band and red band as a haze optimized transformation algorithm. We used visual and statistical assessments. The results showed that the proposed approach in this study has a high accuracy.

The 4th International Seminar on Sensors, Instrumentation, Measurement and Metrology
53
017-ISSIMM2019
Characterization of Circular Patch Antenna at 1 GHz for Crack
Sensing Hanalde Andre1,a, Muhammad Riski Albert1 , Rudy Fernandez1, Baharuddin1, Eka Putra Waldi1, Rizki Wahyu Pratama1, Andrew Kurniawan Vadreas2, Agus Rahmad Timor3 1Andalas University, Indonesia 2STMIK Indonesia Padang, Indonesia 3Politeknik Kesehatan Siteba Padang, Indonesia [email protected] Keywords: Sensor, Stucture Health Monitoring, Crack, Antenna ABSTRACT. Microstrip antenna has been attarctive in many research to development as a sensor to detect crack in metal material. This subject is very usefull to Structure Health Monitoring (SHM). The concept of this method replaced the ground of microstrip antenna to tested metal. This paper presents circular patch microstrip antenna at 1 GHz frequency resonant with insert feed as a sensor to crack detection. Length and position of the crack on tested metal effected electrical property of microstrip antenna.
Figure 1. Purposed Circular Patch Antenna
References [1] Z. Liu, K. Chen, Z. Li, and X. Jiang, “Crack Monitoring Method for an FRP-Strengthened Steel
Structure Based on an Antenna Sensor,” Sensors, vol. 17, no. 10, p. 2394, Oct. 2017. [2] M. Liu, B. Li, and H. Li, “A crack monitoring method based on microstrip patch antenna,”
2015 Annual Reliability and Maintainability Symposium (RAMS), Jan. 2015. [3] P. Kalansuriya, R. Bhattacharyya, and S. Sarma, “RFID Tag Antenna-Based Sensing for
Pervasive Surface Crack Detection,” IEEE Sensors Journal, vol. 13, no. 5, pp. 1564–1570, May 2013.
[4] H. Andre, R. Fernandez, Firdaus, P. Emeraldi, M. Muharam, and E. P. Waldi, “Triple Band Circular Microstrip Antenna for Metallic Material Crack Sensing,” 2018 International Conference on Applied Science and Technology (iCAST), Oct. 2018.
[5] X. Yi, C. Cho, Y. Wang, and M. M. Tentzeris, “Battery-free slotted patch antenna sensor for wireless strain and crack monitoring,” Smart Structures and Systems, vol. 18, no. 6, pp. 1217–1231, Dec. 2016.

The 4th International Seminar on Sensors, Instrumentation, Measurement and Metrology
54
[6] C. Wang, C. Wang, G. C. Wan, M. S. Tong, S. Guan, and L. Y. Xie, “RFID Antenna Sensor for Quantitatively Monitoring Surface Crack Growth,” 2019 IEEE International Conference on Computational Electromagnetics (ICCEM), Mar. 2019.
[7] S. Xue, Z. Yi, L. Xie, G. Wan, and T. Ding, “A Passive Wireless Crack Sensor Based on Patch Antenna with Overlapping Sub-Patch,” Sensors, vol. 19, no. 19, p. 4327, Oct. 2019.
[8] C. Cho, X. Yi, D. Li, Y. Wang, and M. M. Tentzeris, “Passive Wireless Frequency Doubling Antenna Sensor for Strain and Crack Sensing,” IEEE Sensors Journal, vol. 16, no. 14, pp. 5725–5733, Jul. 2016.
[9] S. Xue, K. Xu, L. Xie, and G. Wan, “Crack sensor based on patch antenna fed by capacitive microstrip lines,” Smart Materials and Structures, vol. 28, no. 8, p. 085012, Jul. 2019.
[10] Zhang, A. I. Sunny, G. Zhang, and G. Tian, “Feature Extraction for Robust Crack Monitoring Using Passive Wireless RFID Antenna Sensors,” IEEE Sensors Journal, vol. 18, no. 15, pp. 6273–6280, Aug. 2018.

The 4th International Seminar on Sensors, Instrumentation, Measurement and Metrology
55
018-ISSIMM2019
Quality Assessment and Validation of Digital Surface Model
Derived from LiDAR Using TerraSAR-X in Land Cover
Rahmat Arief1,a, Shadiq Ali2,b, Marendra Eko B3,c, Rachmat Maulana4,d and Andie Setiyoko5,e
1,2,3,4Remote Sensing Technology and Data Center (LAPAN), Indonesia 5Faculty of Computer Science, Universitas Indonesia, Indonesia [email protected], [email protected], (corresponding author) [email protected] (corresponding author), [email protected], [email protected] Keywords: Radar, DSM, Validation methods, Quality Assessment, TerraSAR-X, Image Processing. Abstract. Digital Surface Models (DSMs) are highly important product obtained from either conversional measurements or from remote sensing imagery. The height estimation of the earth's surface can be measured using interferometry synthetic aperture radar (InSAR). The InSAR method uses phase information to produce the height of the earth's surface. The accuracy of the DSMs produced by InSAR depends on the shadow, the layover area, and the coherence of two SAR data. This paper proposes a quality of DSMs derived from the InSAR method, which is from ascending and descending paths using high resolution TerraSAR-X / TanDEM-X. In this research we generate DSMs in Urban area in Jakarta. Generating DSMs was done by the InSAR method which covers the same test area and came from one pair of ascending TanDEM-X images and one descending pair of TerraSAR-X. The quality level of elevation to be validated compared to validation datasets and application requirements. The comparison of the two DSMs from the ascending and descending path has been done by validating with LiDAR. The images pairs with 33 angles for descending path and 37 degrees for ascending path. The results show error distribution within different terrain characteristics, which are presented using various ways including statistics, error maps and profiles. There is significant reduction in missing pixel counts due to layover, shadow and low coherences after co-registered. These include terrain characteristics, vegetation and land cover. For different slope we found accuracy to decrease with slope increase with an average standard deviation between a very low slope class and very steep slope class.

The 4th International Seminar on Sensors, Instrumentation, Measurement and Metrology
56
020-ISSIMM2019
Analysis of Magnetic Resonance Image Quality Using an In-House
Phantom: Gamma Knife Application
A R Fauzia1*,a, A R Setiadi 2,b, S A Pawiro1,c
1Departement of Physics, Faculty of Mathematics and Natural Sciences, Universitas Indonesia, West Java, Indonesia. 2Gamma Knife Referral Center, Dr. Cipto Mangunkusumo General Hospital, Jakarta, Indonesia. a [email protected], b [email protected], c [email protected] Keywords: Gamma Knife, Image Quality, MRI, Phantom ABSTRACT. Magnetic Resonance Imaging (MRI) is increasingly being used for purposes of radiosurgery and radiotherapy planning. This imaging modality can explore the physical properties of tissue with great details and is probably the best imaging technique in the current practice of radiology, chiefly for imaging of the brain. However, the geometric distortion is reasonably occurred and can make significant differences in certain MR application such as, for example, stereotactic localization in Gamma Knife. Therefore, the geometric distortion measurement and correction should be applied. Previously, some of 2D or 3D distortion phantom designs have been proposed. In this study, an MRI in-house phantom was developed to measure not only 3D geometric distortion, but also uniformity and high contrast spatial resolution of MR image. The design of the phantom follows AAPM Report No. 28: Quality Assurance Methods and Phantoms for MRI. The materials of the phantom are resin and acrylic, copper sulfate pentahydrate solution is used as phantom filler. The phantom is characterized by 1 cm3 MRI visible 3D cartesian grid and 3D grid that is MR-signal negative. The phantom attached with Leksell stereotactic frame was scanned using 1.5 T MRI GE Healthcare. Both Bravo and Fiesta (Fast Imaging Employing Steady-state Acquisition) scan protocol were applied. The image of the in-house phantom then would be compared to the standard MRI phantom, Magphan 100. The result showed that geometric distortion could not be found, either in in-house phantom or Magphan 100 images. When Bravo scan protocol was applied, the measurement using Magphan 100 showed that the high contrast spatial resolution of MR image is 5 lp (line pairs)/cm, yet using in-house phantom, it showed 4 lp/cm. In addition, the high contrast spatial resolution of MR image generated by Fiesta scan protocol is 6 lp/cm and 5 lp/cm for Magphan 100 and in-house phantom respectively. The percent uniformity (PIU) of MR image, when Bravo scan protocol was applied, is around of 90.06 % and 79.570 % for Magphan 100 and in-house phantom respectively. Furthermore, PIU of MR image, when Fiesta scan protocol was applied, is around of 86.75 % and 56.39 % for Magphan 100 and in-house phantom respectively. For this study, it was concluded that the in-house phantom could be used to analyze image quality of MR image, yet still needs some improvements, especially in uniformity test part.

The 4th International Seminar on Sensors, Instrumentation, Measurement and Metrology
57
Figure 1. The High Contrast Spatial Resolution of MR Image when Bravo and Fiesta Scan Protocol were Applied
021-ISSIMM2019
Dose Evaluation of Organ at Risk during Treatment Using Gamma
Knife Stereotactic Radiosurgery (GKSRS): Phantom Study
P A Pontoh1*,a, A R Setiadi2, O A Firmansyah3, D Tandian4, and S A Pawiro1,b
1Department of Physics, Faculty of Mathematic and Natural Science, Universitas Indonesia, Depok, Indonesia 2Gamma Knife Referral Center, RSUPN Dr. Cipto Mangukusumo, Jakarta Indonesia 3PTKMR BATAN, Indonesia 4Department of Neurosurgery, Cipto Mangunkusumo Hospital, Faculty of Medicine, Universitas Indonesia [email protected], [email protected] Keywords: Gamma Knife, Organ at Risk, Radiosurgery, Rando, Stereotactic Radiosurgery, TLDs. ABSTRACT. Gamma Knife Stereotactic Radiosurgery (GKSRS) treatment requires the high accuracy of delivering single high dose without negative impact on the surrounding tissue. During radiosurgery treatments using GKSRS, the surrounding tissue will receive high scatter radiation because the single dose treatment will employed long irradiation time. Therefore, radiation doses in critical organs in patients during GKSRS treatment is needed to be evaluate. In this study, we investigated the radiation dose to the right lens, left lens, thyroid, right breast, left breast, uterine fundus, right ovaries, left ovaries and testes during treatment using Leksel Gamma Knife Perfexion (LGK; Elekta AB, Stockholm, Sweden). The dose was simulated using the variation of tumor target of 5 to 20 cc The measurement were performed using variation of collimator size of 4 mm, 8 mm, 16 mm and employed thermoluminescent dosimeters (TLDs) to be inserted to Female Rando anthropomorphic phantom. TLDs reader Harshaw model 3500 were employed to evaluate the measurement result. The result of study explains that the dose of organ at risk decrease linearly depend on the distance of the target and the size of collimator.

The 4th International Seminar on Sensors, Instrumentation, Measurement and Metrology
58
Figure 1. Organ Dose with Variation of Tumor Volume

The 4th International Seminar on Sensors, Instrumentation, Measurement and Metrology
59
022-ISSIMM2019
Analysis Of Energy-Peaks Characteristic In NaI(Tl) Spectrometer
For Radionuclide Identification In Environmental Radiation
Monitoring device
Gina Kusuma1, a, Lely Yuniarsari2,b, Budi Santoso2,c, Prawito Prajitno1,d, Sastra Kusuma Wijaya1,e, Santoso Soekirno1,f and I Putu Susila2,g
1Universitas Indonesia, Depok, Jawa Barat, Indonesia 2PRFN BATAN, Tangerang Selatan, Banten, Indonesia [email protected], [email protected], [email protected], [email protected], [email protected], [email protected], [email protected] (corresponding author) Keywords: Identification Radioisotope, High Summing Ratio, NaI(Tl) Detector, Radiation Monitoring. ABSTRACT. The risk of radiation exposure can be obtained from radiation facilities or national border lines. For this reason, an environmental radiation monitoring device is needed to determine abnormalities. Currently, environmental radiation monitoring equipment used in various regions only monitors gross gamma radiation. So that the device used cannot distinguish whether the increase in dose rate is due to abnormal events, or due to natural radiation. Therefore, we need a device that can have the ability of spectroscopy so that it can distinguish the elements that cause an increase in the dose rate like NaI(Tl) gamma spectrometer. The device has been built using a NaI (Tl) detector with a peak characteristic observation method with various conditions of acquisition time and distance. This has test in laboratories using Cs-137 as sample source. Tests have been done by varying the value of time and distance between the source and detector in the measurement process. Time used varies, 1 minute, 5 minutes, 10 minutes, 30 minutes, 60 minutes, 90 minutes and 120 minutes with varying distance of 50 cm, 70 cm, 100 cm, 200 cm and 300 cm. Data has been analyzed using the high summing ratio method to be able to distinguish measurement values using source and only background measurements. The result show that detector has stable when measuring for 30 minutes with FWHM value 60, and distance is not less than 200 cm, and it was able to distinguish background and source value from 1 minutes acquisition using high summing ratio method.
Figure 1. High Summing Ratio From The Measured Spectrum in Accordance With A Cs-
137 Source References

The 4th International Seminar on Sensors, Instrumentation, Measurement and Metrology
60
[1] Kim, Jongyul, Lim, Kisuh, Jeon, Byoungil, lee, Joohyun and Moon, Myungkook, “Radionuclide identification method using high sum ratio of a PVT detector spectrum,” Gyeongju, Korea, October 26-27, 2017.
[2] Kim, Jinhwan, Park, Kyeongjin and Cho, Gyuseong, “Multi-Radioisotope Identification Algorithm using an Artificial Neural Network for Plastic Gamma Spectra”, Applied Radiation and Isotopes, January 2019.
[3] Bobin, C., Bichler, O., Lourenco, V., Thiam, C., Thevenin, M., “Real-time radionuclide identification in γ-emitter mixtures basedon spiking neural network”, Applied Radiation and Isotopes 109(2016) 405–409.
[4] Burr, Tom and Hamada, Michael, “Radio-Isotope Identification Algorithms for NaI γ Spectra”, Journal Algorithms 2009, 2, 339-360.

The 4th International Seminar on Sensors, Instrumentation, Measurement and Metrology
61
023-ISSIMM2019
A Systematic Literature Reviews of Multichannel Analyzer Based
on FPGA for Gamma Spectroscopy
Andeka Tris Susanto1,a, Prawito Prajitno1,b, Sastra Kusuma Wijaya1,c,
Santoso Soekirno1,d and I Putu Susila2,e 1Departemen Fisika, FMIPA, Universitas Indonesia, Depok, Jawa Barat, Indonesia 2PRFN, Badan Tenaga Nuklir Nasional, Tangerang Selatan, Banten, Indonesia [email protected], [email protected], [email protected], [email protected] [email protected] (corresponding author) Keywords: FPGA; Gamma spectroscopy; Multichannel analyzer; Systematic literatur review ABSTRACT. Radiation measuring devices based gamma spectroscopy require a multichannel analyzer (MCA) which functions to record and analyze nuclear radiation spectrum data. MCA is one of the main components in radiation measurement and nuclear spectroscopy. There are currently many studies related to MCA based on field programmable gate array (FPGA). The main reasons for using FPGA as MCA are parallel processing capabilities and ability to be programmed for pulse signal processing to produce spectra which resolution adjustable to ADC. An FPGA consisting of a single chip also simplifies the PCB layout design and thus effectively reduces power consumption and relatively lower costs than non FPGA based comercial MCA. The main objective of this paper is to present the systematic literature review (SLR) of MCA based on FPGA for gamma spectroscopy that was developed during past 10 years. This review was conducted by selecting papers from leading journals in three scientific databases namely ScienceDirect, IEEE Xplore and Scopus. For the SLR execution, specific keyword strings used for each database and paper selecting using inclusion and exclusion criterion. This review highlights the design of MCAs, pulse signal processing methods, their main results and system performance. Figure 1.a reveals the amount of searched documents in the databases using the selected keyword string. The total of searched papers was 337, then using extraction criteria selected 38 papers. Figure 1.b shows the distribution of publications for 10 years from 38 selected papers. This search confirms that research of MCA based FPGA for gamma spectroscopy is relatively constant but still limited. This fact is related to nuclear technology research which is still limited. So the challenges and opportunities for future research are quite high. The implications of this study can be used as a reference for MCA research and development.
1.a The number of papers in three scientific databases using extraction criteria
1.b Distribution of papers per year
Figure 1. The number of papers in three scientific databases using extraction criteria and distribution of publications for 10 years
References [1] Kitchenham, Barbara, et al. "Systematic literature reviews in software engineering–a
systematic literature review." Information and software technology 51.1 (2009): 7-15. [2] Okoli, Chitu, and Kira Schabram. "A guide to conducting a systematic literature review of
information systems research." (2010).
132
11095
186
14
0
20
40
60
80
100
120
140
ScienceDirect IEEE Xplore Scopus
Nu
mb
er o
f p
ap
ers
Number of papers found Number of selected papers
0
2
4
6
8
10
Nu
mb
er o
f p
ub
lica
tion
s
Year
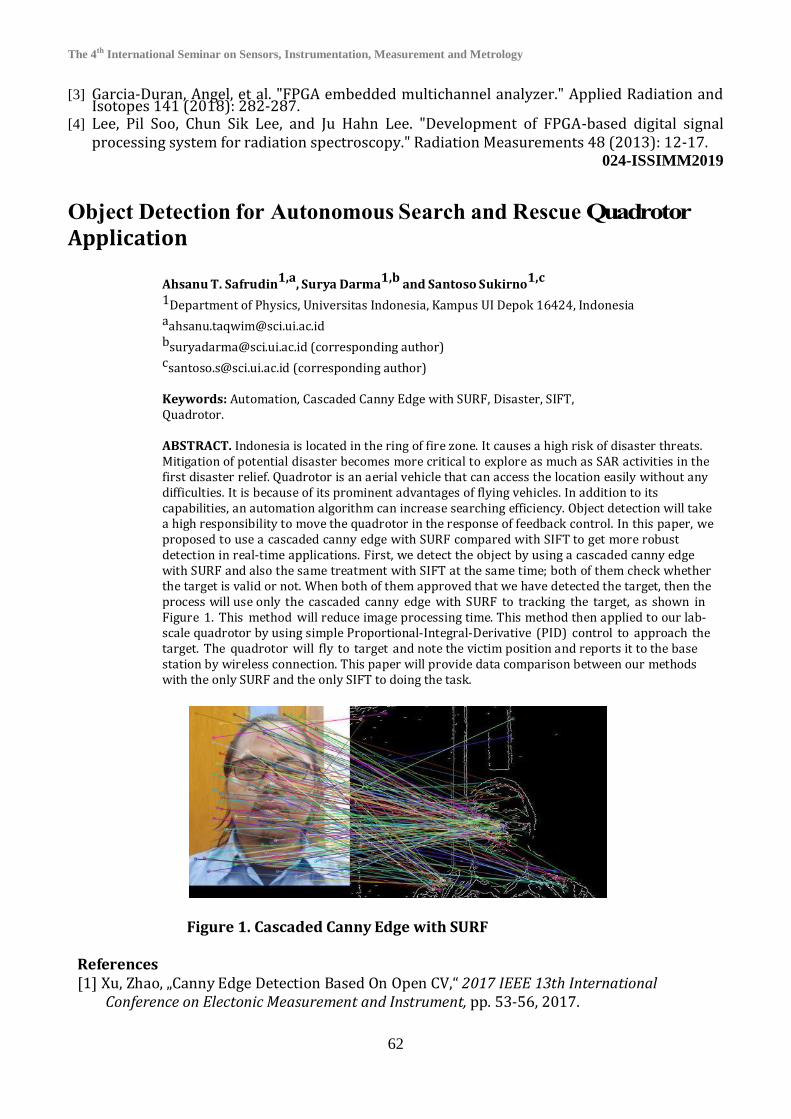
The 4th International Seminar on Sensors, Instrumentation, Measurement and Metrology
62
[3] Garcia-Duran, Angel, et al. "FPGA embedded multichannel analyzer." Applied Radiation and Isotopes 141 (2018): 282-287.
[4] Lee, Pil Soo, Chun Sik Lee, and Ju Hahn Lee. "Development of FPGA-based digital signal processing system for radiation spectroscopy." Radiation Measurements 48 (2013): 12-17.
024-ISSIMM2019
Object Detection for Autonomous Search and Rescue Quadrotor
Application
Ahsanu T. Safrudin1,a
, Surya Darma1,b
and Santoso Sukirno1,c
1Department of Physics, Universitas Indonesia, Kampus UI Depok 16424, Indonesia [email protected] [email protected] (corresponding author) [email protected] (corresponding author) Keywords: Automation, Cascaded Canny Edge with SURF, Disaster, SIFT, Quadrotor. ABSTRACT. Indonesia is located in the ring of fire zone. It causes a high risk of disaster threats. Mitigation of potential disaster becomes more critical to explore as much as SAR activities in the first disaster relief. Quadrotor is an aerial vehicle that can access the location easily without any difficulties. It is because of its prominent advantages of flying vehicles. In addition to its capabilities, an automation algorithm can increase searching efficiency. Object detection will take a high responsibility to move the quadrotor in the response of feedback control. In this paper, we proposed to use a cascaded canny edge with SURF compared with SIFT to get more robust detection in real-time applications. First, we detect the object by using a cascaded canny edge with SURF and also the same treatment with SIFT at the same time; both of them check whether the target is valid or not. When both of them approved that we have detected the target, then the process will use only the cascaded canny edge with SURF to tracking the target, as shown in Figure 1. This method will reduce image processing time. This method then applied to our lab-scale quadrotor by using simple Proportional-Integral-Derivative (PID) control to approach the target. The quadrotor will fly to target and note the victim position and reports it to the base station by wireless connection. This paper will provide data comparison between our methods with the only SURF and the only SIFT to doing the task.
Figure 1. Cascaded Canny Edge with SURF
References [1] Xu, Zhao, „Canny Edge Detection Based On Open CV,“ 2017 IEEE 13th International
Conference on Electonic Measurement and Instrument, pp. 53-56, 2017.

The 4th International Seminar on Sensors, Instrumentation, Measurement and Metrology
63
[2] An, Shan, „Face Detection and Recognition with SURF for Human-Robot Interaction,“ Internal Journal of Advances in Science Engineering and Technology, pp. 1946-1951, 2009.
[3] H. Bay, A. Ess, T. Tuytelaars und L. V. Gool, „Speeded-Up Robust Features (SURF),“ Science Direct, pp. 346-359, 2007.
[4] K. Boudjit und C. Larbes, „Detection and Implementation Autonomous Target Tracking with a Quadrotor AR.Dron,“ IEEE Xplore, 2015.
[5] E. Oyallon und J. Rabin, „An Analysis of the SURF Method,“ Image Processing On Line, pp. 176-218, 2015.

The 4th International Seminar on Sensors, Instrumentation, Measurement and Metrology
64
025-ISSIMM2019
Unmanned Aerial Vehicle Object Tracking and Following A. H. I. Fadhillah
1,a Ahsanu T. Safrudin
1,b and Surya Darma
1,c 1 Department of Physics, Universitas Indonesia, Kampus UI Depok 16424, Indonesia a [email protected] b [email protected] c [email protected] (corresponding author) Keywords: Camshift, HSV-RGB, Kanade-Lucas-Tomasi, Quadcopter, Robot Operating System (ROS), Tracking. ABSTRACT. The use of quadcopter on SAR activity is increasingly dominant, especially in the field of search and rescue. One of the most challenging cases from search and rescue is tracking any object that we choose directly (real-time). Then the object is immediately recognized; further, we can track and follow it with a high degree of precision. This research reports the results of the design and program to control quadcopter, which can track and follow 3D objects, which were initially determined. The algorithm for tracking system used several methods from image processing to extract the information from the image (feature extraction base on color), then the information will be used as a reference movement quadcopter in following the target. The object tracking system used various methods of image processing in the domain of HSV-RGB, Camshift, and Kanade-Lucas-Tomasi Tracker to optimizing the 2D tracking system and increase the success rate of the program, as shown in Figure 1. While the method of distance estimation using the camera calibration towards the distance. The output from the tracking system is the object coordinates (x, y, z). This information is fed back to the quadcopter Robot Operating System (ROS) as the error between the position of the camera with the position of objects and is known as Visual Servoing. Quadcopter control system using PID constants in the leading to the movement of the pitch, throttle, and roll, to maintain the position of quadcopter towards the target and follow an object moving forward or backward.
Figure 1. Object Tracking System
References
[1] Chakrabarty, A., Morris, R., Bouyssounouse, X., & Hunt, R., “Autonomous Indoor Object Tracking with the Parrot AR. Drone.” in International Conference on Unmanned Aircraft Systems (ICUAS), Arlington, June 2016.
[2] Ouchatti, Z., Bensaid, A., Moutaouakkil, & Medromi, H., "Deterministic Method of Visual Servoing: Robust Object Tracking by Drone" in International Conference Computer Servoing: Robust Object Tracking by Drone" in International Conference Computer
Graphic, Imaging and Visualization 13th, 2016.

The 4th International Seminar on Sensors, Instrumentation, Measurement and Metrology
65
[3] Bartak, R. & Vyskovsky, A., "Any Object Tracking and Following by a Flying Drone" in 14th
MexicanInternational Conference on Artificial Inteligence, 2015 [4] Silva, A. S., Severgnini, F. M. Q., Oliveira, M. L., Mendes, V. M. S., & Peixoto, Z. M. A.,
"Object Tracking by Color and Active Contour Model Segmentation" in IEEE Latin American Transaction, March 2016, vol. 14, no. 3, pp. 1488-1493.
026-ISSIMM2019
Infant Cry Classification Using CNN-RNN
Tusty Nadia Maghfira1, a, T. Basaruddin1,b, Adila Krisnadhi1,c
1Faculty of Computer Science, Universitas Indonesia, Indonesia [email protected], [email protected], [email protected] Keywords: convolutional neural networks, infant crying, recurrent neural networks ABSTRACT. Study of infant cry recognition aims to identify what an infant needs through her cry. Different crying sound can give a clue to caregivers about how to response to the infant's needs. Appropriate responses on infant cry may influence emotional, behavioral, and relational development of infant while growing up. From a pattern recognition perspective, recognizing particular needs or emotions from an infant cry is much more difficult than recognizing emotions from an adult's speech because infant cry usually does not contain verbal information. In this paper, we study the problem of classifying five different types emotion or needs expressed by infant cry, namely hunger, sleepiness, discomfort, stomachache, and indications that the infant wants to burp. We propose a novel approach using a combination of Convolutional Neural Networks (CNN) and Recurrent Neural Networks (RNN) that acts as feature extraction and classifier method at once. Particularly, CNN learns salient features from raw spectrogram information and RNN learns temporal information of CNN obtained features. We also apply 5-folds cross-validation on 200 training data set and 50 validation data set. The model with the best weight is tested on 65 test set. Evaluation in Dunstan Baby Language dataset shows that our CNN-RNN model outperforms the previous method by average classification accuracy up to 94.97%. The encouraging result demonstrates that the application of CNN-RNN and 5-folds cross-validation offers accurate and robust result.
Figure 1. Average Accuracy Result
References [1] S. Jeyaraman, H. Muthusamy, W. Khairunizam, S. Jeyaraman, T. Nadarajaw, S. Yaacob, and S.
Nisha, “A review: survey on automatic infant cry analysis and classification,” Health Technol. (Berl)., vol. 8, no. 5, pp. 391–404, 2018.
[2] E. Franti, I. Ispas, and M. Dascalu, “Testing the Universal Baby Language Hypothesis - Automatic Infant Speech Recognition with CNNs,” 2018 41st Int. Conf. Telecommun. Signal Process. TSP 2018, pp. 1–4, 2018.
[3] Y. Mu, L. A. Hernández Gómez, A. C. Montes, C. A. Martínez, X. Wang, and H. Gao, “Speech Emotion Recognition Using Convolutional- Recurrent Neural Networks with Attention Model,” DEStech Trans. Comput. Sci. Eng., no. cii, pp. 341–350, 2017.
7880828486889092949698
1st
…
2n
d …
3rd
…
4th
…
5th
…
6th
…
7th
…
8th
…
9th
…
10
t…
11
t…
12
t…
CNN-RNN
CNN from [3] with cross-validation
CNN from [3] without cross-validation

The 4th International Seminar on Sensors, Instrumentation, Measurement and Metrology
66
[4] W. Lim, D. Jang, and T. Lee, “Speech emotion recognition using convolutional and Recurrent Neural Networks,” 2016 Asia-Pacific Signal Inf. Process. Assoc. Annu. Summit Conf. APSIPA 2016, 2017.

The 4th International Seminar on Sensors, Instrumentation, Measurement and Metrology
67
027-ISSIMM2019
A Study of Micro-Bubble Generator for Litopenaeus Vannamei
Pond
Irwan1,a
, Husman2,b
, Edfintria Atiasafani3,c
, Novia Riski Ananda4.d
1, 2, 3, 4Politeknik Manufaktur Negeri Bangka Belitung, Bangka, Indonesia airwan@polman-
babel.ac.id, [email protected], [email protected], [email protected] Keywords: litopenaeus-vannamei, micro-bubble, dissolved-oxygen, android-
based-system.
ABSTRACT. The numbers of Litopenaeus Vannamei pond have grown in the Province of Bangka
Belitung in Indonesia. Majority of the ponds use paddle wheel as the aerator. The use of
paddle wheels consumes much energy beside its function to add oxygen into the water and to
make the water flowing. Most of Litopenaeus Vannamei ponds’ owners are facing to this
problem. They spend much cost of electricity on their aerator system. This paper presents the
study of micro-bubbles to generate oxygen for Litopenaeus Vannamei pond. This study was
supposed to carryout the possibility of replacing paddle wheel as the aerator. A study literature,
interview and discussions with technical staffs of Litopenaeus Vannamei pond was firstly
conducted. This was accomplished to gain the information regarding the requirement of
oxygen in the Litopenaeus Vannamei ponds. The second stage was observing the possibility of
equipments and devices that can be used in the experiment. It was then continued with designing
and assemblying the equipment, and evaluating their functionality. An analog gravity DO
(Dissolved Oxygen) sensor was used to measure DO within the pond. To make it easy to read the
measurement value of the sensor, an Arduino Uno controller was programmed to display the
sensor’s value on LCD. The sensor was firstly callibrated by comparing its measurement value
with the existing measurement device. A combination of 750 Watt water pump and JSW
8 aerator nozzle was then used to generate oxygen with the pond. The android-based system was developed to make users easy tor control and monitor the aerator system in this study. The next stage
was examining the whole aerator system within the laboratory scale. A container with 0.5m in
length and width, and 1m in height was used to accommodate the water pond-like. The micro-
bubble aerator system was then installed within the container. The experiment shows that for one
hour testing the DO value increased about 0.8 mg/L from its base value. The experiment was
continued in the real Litopenaeus Vannamei pond with has 35m x
35 m x 1.5 m of width, length, and height respectively. Two ponds was used in the comparison.
The first pond used existing aerator system with four paddle wheels, while the second pond used
the proposed micro- bubble system with two paddle wheels and the proposed system. The result
shows that the second pond has DO about 0.3 mg/L higher that the first pond. This indicates that
with micro-bubble generator, the DO in Litopenaeus Vannamei pond can increase. Even though it
did not show significant result of the proposed system in terms of DO value, it is still efficient in
terms of the cost. The proposed system used two paddle wheels and one micro-bubble generator
which consume 2,25 kW electricity, compared with the existing system with four paddle wheels
which consume 3 kW electricity. The proposed system also can display the oxygen through
android based system. This makes the technical staffs do not need to measure the DO
directly to the pond.
References

The 4th International Seminar on Sensors, Instrumentation, Measurement and Metrology
68
[1] Agung, F. R. Peningkatan Efektifitas Aerasi menggunakan micro-bubble generator. Jawa Timur: http://eprints.upnjatim.ac.id.
[2] Chrisdiyanto,Y.D.MICRODESIDA (Microbubble and Desalination) sebagai Teknologi Pengolahan Air dan Aerasi Tambak Udang diPantai Trisi. (123-128).
[3] Mardhiya, I. R. (2017). Sistem Akuasi Data Pengukuran Kadar Oksigen Terlarut Pada Air Tambak Udang Menggunakan Sensor Dissloved Oxygen (DO). Bandar Lampung.
028-ISSIMM2019
Comparison between two-stage and three-stage Peltier
Thermoelectrics driven by Pulse Width Modulation
Daniel D. Kamasi1, Muhammad Zainulloh1 Ahmad Nadhir1 Setyawan P. Sakti1,a
1Department of Physics, Faculty of Mathematics and Natural Sciences, Brawijaya University, Jl. Veteran, Malang 65145, Indonesia [email protected], [email protected], [email protected], [email protected] (corresponding author) Keywords: Peltier Thermoelectrics, Pulse Width Modulation, Temperature ABSTRACT. Thermoelectric is one of electronic devices commonly used as temperature sensors, electrical generators, and cooling devices. Peltier thermoelectric as a promising device offers greater performance in terms of electronic cooler, especially for computer components. However, the performance of single-stage Peltier thermoelectrics is limited. For certain optoelectronic devices, a single-stage Peltier thermoelectric cannot achieve a desired temperature to pump heat from the devices. In addition, to drive temperature of the thermoelectrics, a complex interface circuit should be made. In this research, two-stage and three-stage Peltier Thermoelectrics driven by Pulse Width Modulation using Arduino and H-bridge Motor Driver were examined. The three-stage Peltier thermoelectric showed better performance than the two-stage, where it achieved higher temperature difference between hot and cold. Both Peltier thermoelectrics had distinct temperatures in each interstage connection, with increasing values from near cold side to near hot side of the thermoelectrics.

The 4th International Seminar on Sensors, Instrumentation, Measurement and Metrology
69
029-ISSIMM2019
Fog Prediction Using Deep Learning: A Case Study in Wamena
Airport
Ristiana Dewi1, a*, Prawito Prajitno1, b, and Hastuadi Harsa2, c
1Department of Physics, Universitas Indonesia, Depok, Indonesia 2Agency for Meteorology Climatology and Geophysis, Jakarta, Indonesia [email protected], [email protected], [email protected] Keywords: aviation, deep learning, fog prediction. ABSTRACT. Fog is one of the atmospheric phenomena that affect airport operations. It can reduce visibility which impacts flight operations (taxiing, take-off, landing). Therefore, fog prediction is needed to support flight safety. The biggest challenge in making weather predictions is the chaotic and complicated process of the atmosphere. This research tries to use deep learning method to predict fog events in Wamena Airport. Design of model prediction using hourly synoptic data set from January 2015 till May 2018. Variables input such as dry ball temperature, wet ball temperature, dew point, relative humidity, cloud cover, wind direction, wind speed, visibility, and present weather for the past six hours ago are used to predict fog or no fog events. We performed a grid search parameter tuning on sixteen deep learning models. The parameters tuned are epoch and hidden composition. Results of this process described in Figure 1. Analysis of the testing data shows that deep learning models are appropriate in fog prediction. They can generate a decision boundary among multidimensional input affecting fog and no fog condition.
Figure 1. Evaluation results of sixteen deep learning models References [1] Headquarter Department of The Army, Meteorology For Army Aviators. Washington DC: The
Pentagon Library, 1982. [2] Andreae, M. O. & Rosenfeld, D, “Aerosol Cloud Precipitation Interactions Part 1. The Nature
and Source of Cloud Active Aerosols,” Earth-Sci 89,13-41, 2008. [3] Bartok, J., Bott, A., & Gera, M, “Fog Prediction for Road Traffic Safety in a Coastal Desert
Region,”Boundary-Layer Meteorology, 145(3), 485–506, 2012. [4] Colabone, R. D. O., Ferrari, A. L., Vecchia, F. A. da S., & Tech, A. R. B, “Application of artificial
neural networks for fog forecast,” Journal of Aerospace Technology and Management, 7(2), 240–246, 2015.
[5] Putra, J. W. G., Pengenalan Pembelajaran Mesin dan Deep Learning. Retrieved from https://www.researchgate.net/publication/323700644, 2018.
00.20.40.60.8
1
mo
del
_1
mo
del
_5
mo
del
_6
mo
del
_16
mo
del
_14
mo
del
_3
mo
del
_12
mo
del
_11
mo
del
_9
mo
del
_8
mo
del
_10
mo
del
_4
mo
del
_2
mo
del
_13
mo
del
_7
mo
del
_15
Log Loss AUC
Gini Index pr AUC
Mean per Class Error

The 4th International Seminar on Sensors, Instrumentation, Measurement and Metrology
70
030-ISSIMM2019
Effect of skull contours using manual measurement and CT Image
on doses distribution in Gamma Knife Stereotactic Radiosurgery:
Phantom Study
Bayu Bagaskara1,a
, Ade R. Setiadi2
, Renindra A. Aman3
, and Supriyanto A. Pawiro1,b
1Faculty of Mathematic and Natural Science, Universitas Indonesia, Depok, Indonesia 2Gamma Knife Referral Center, RSUPN Dr. Cipto Mangukusumo, Jakarta Indonesia 3RSUPN Dr. Cipto Mangukusumo, Neurosurgery Department, Jakarta, Indonesia [email protected], [email protected] Keywords: Gamma Knife Perfexion, Anthropomorphic Rando, Stereotactic Radiosurgery, Film GafChromic EBT3, Dose Calculation
ABSTRACT. The Leksell Gamma Knife Perfexion (LGK Perfexion; Elekta, Stockholm, Sweden) is
equipped with a conical collimator which is divided into eight sectors and its configuration is
completely different from the previous model. Doses in LGK Perfexion are calculated for each shot
by summing the contribution from the 192 radiation beams emitted by cobalt-60. In general, the skull shape of a patient is modeled based on 24 skull measurements and a special ruler. However, due to the limitation of the 24 skull measurement and special ruler, the results of the contours have slight differences from the patient’s actual contours based on the MRI image. This study was conducted to evaluate the distribution doses of LGK Perfexion in the treatment planning system using manual measurement and using a CT image. The dose was simulated using the same tumor target with isodose 6 Gy @50% and measurement was performed using a variation of collimator size of 4 mm with a 24 shot number, 8 mm with 10 shot number, 16 mm with 1 shot number, and combination size collimator with 15 shot number. Film GafChromic EBT3 inserted into Head Rando anthropomorphic phantom. Epson Scanner
10000 XL and ImageJ were used to evaluate the measurement result. The results of the study
explain that the treatment planning system using actual patient contours based on CT image is
better than using manual measurement.
Figure 1. Comparison of doses calculation using CT image and Skull Measurement
References
[1] Berndt A, Beck J. Effect of skull shape approximations in Gamma Knife dose calculations. J
Appl Clin Med Phys. 2007;8(3):52–9. [2] Nakazawa H, Komori M, Mori Y, Hagiwara M, Shibamoto Y, Tsugawa T, et al. Effect of
skull contours on dose calculations in Gamma Knife Perfexion stereotactic radiosurgery. J Appl

The 4th International Seminar on Sensors, Instrumentation, Measurement and Metrology
71
Clin Med Phys. 2014;15(2):28–38.

The 4th International Seminar on Sensors, Instrumentation, Measurement and Metrology
72
031-ISSIMM2019
Design Of Water Height Detectors In Runway Based On Internet
Of Things
Puti Aulia Mardiah*, a, Yohandri*, b
*Physics Department, Faculty of Mathematics and Natural Science, Universitas Negeri Padang, jl. Prof. Hamka, Padang, Sumatera Barat, Indonesia [email protected], [email protected], Keywords: Arduino Mega 2560, Internet Of Things, thingspeak, sensor design. ABSTRACT. The runway of an aircraft is designed to keep it dry even if it rains to avoid hydroplaning. Hydroplaning is a plane slip on the runway due to standing water. In accordance with regulations from the Derektorat Bandara, Ditjen Perhubungan Udara NO. KP 212 in 2017, the operational requirement for runways to be able to serve landings and aircraft flights is when there is a maximum of 3 mm of standing water on the runway surface. The design of the water level detector on the runway uses the Arduino Mega 2560 as a microcontroller which processes and sends the detected data to the thingspeak via the internet network. Performance specifications for water level detectors are water level sensor designs, U detector pipes, runways, electronic circuits. The water level sensor is a touch sensor that is designed and printed on a PCB board with horizontal and vertical strip designs. However, the level of accuracy and accuracy of the vertical sensor strip design is higher than the horizontal sensor strip design. Detected data will be processed in Arduino Mega 2560 and typed into the thingspeak page using the internet network. Data output can be accessed via a PC or smartphone connected to the internet network. The results of comparison with standard tools found the average percentage of errors for the horizontal sensor strip design was 97.08% while for the vertical sensor strip design was 4.98%. From the comparison results, the average percentage of accuracy for the horizontal sensor strip design is 8.57% and for the vertical sensor strip design is 95.01% with precision of 42.32% and 84.77%.84.77%.
Figure 1. Water level detector data on the runway using a vertical sensor design
References [1] Badan Pusat Statistik Indonesia. 2017. Statistik Transportasi Udara. Jakarta: Badan Pusat
Statistik
[2] Eko, Peorwanto, Uyuunul Mauidzon. 2016. Analisi kecelakaan penerbangan analisis
kecelakaan penerbangan di Indonesia untuk peningkatan keselamatan penerbangan. Jurnal
angkasa.7(2): Yogyakarta
[3] KNKT Media Release. 2016. Data Investigasi Kecelakaan Penerbangan tahun 2010-2016.
Jakarta: Database KNKT
[4] Sukamto, Taryana. 2014. Pengaruh Rubber Deposit Pada Landasan Pacu Terhadap
Keselamatn Penerbangan di Bandar Udara Radin Intel II Lampung. Jurnal Aviasi Langit Biru.
9(18):68.

The 4th International Seminar on Sensors, Instrumentation, Measurement and Metrology
73
[5] Syamsuar, Sayuti. 2015. Metoda Short Take Off Landing (Studing Kasus Prestasi Terbang
Takeoff-Landing Pesawat Udara Turbo Prop CN235). WARTA ADHIA Jurnal Perhubungan
Udara. 41(2): 49-58
[6] Sasmoko, Dani. 2017. Implementasi Penerapan Internet of Things (IoT) pada monitoring
Infus Menggunakan ESP8266 dan Web untuk Berbagi Data. Jurnal Ilmiah Informatika. 2(1).
[7] The MathWorks. 2019. ThingSpeak. Diunduh dari https://www.thingspeak.com (Di Akses
24 Februari 2019)
[8] Prastowo, Andi. 2016. Memahami Metode-Metode Penelitian Suatu Tinjauan Teoritis dan Praktis.Yogyakarta:Ar-Ruzz Media
[9] Young, Hugh D. 2000. Fisika Universitas Edisi Sepuluh. Jakarta: Erlangga

The 4th International Seminar on Sensors, Instrumentation, Measurement and Metrology
74
032-ISSIMM2019
Design of Neural Network and PLC based Water Flow Controller
*Burhanuddin Ahmad1, a, Prawito Prajitno2,b
1Department of Physics, Faculty of Mathematics and Natural Sciences, Universitas Indonesia, Depok, Indonesia 2 Department of Physics, Faculty of Mathematics and Natural Sciences, Universitas Indonesia, Depok, Indonesia [email protected], [email protected] Keywords: Flow Control, MATLAB SIMULINK, Neural Network Controller, OPC Server, PLC. ABSTRACT. Flowrate is a fundamental physical quantity in the fluid transportation system from one place to another. To achieve this, a reliable controller that can produce a constant flowrate in the industry is needed. The most used flow controllers in industries are PID-based controllers that are implemented using PLCs. However, there are still shortcomings, for example, the response time and steady-state errors that are not optimum, which cannot be overcome by conventional PID controllers. In this study, a neural network-based flow controller is proposed to deal with those problems. The controller will be operated in a miniature plant which consists of a water tank, a water pump, a control valve, and a flow transmitter. Due to PLC limitation that cannot be programmed with common programming languages such as MATLAB, a personal computer (PC) is used to run the proposed neural network controller. The PC communicates with the PLC using OPC (OLE for Process Control) server, while the PLC reads the flow transmitter and also controls the control valve directly based on the resulting output of the neural network controller. To evaluate the performance of the proposed controller, several experiments have been conducted. The performance of the proposed controller has been compared with the conventional PID controller. It shows that neural network-based controller outperformed the conventional PID controller, in terms of maximum overshoot and steady-state error, where the neural network controller has maximum overshoot = 5.36%, steady-state error = 0.85%, rise time = 8.22s, and settling time = 8.4s, while the PID controller has 11.3% for overshoot, 1.10 % for steady-state error, 5.16s for rise time, and 18.36s for settling time.
Figure 1. Performance Comparison between PID Controller and NN-based Controller References [1] Liu, Jinkun. Intelligent Control Design and MATLAB Simulation. Singapore: Springer
Singapore, 2018 [2] Vamvoudakis, K. G., F.L. Lewis, and Shuzhi Sam Ge. “Neural Networks in Feedback Control
Systems.” Mechanical Engineers’ Handbook. John Wiley & Sons, Inc., 2015. 1–52. Mechanical Engineers’ Handbook. Web.

The 4th International Seminar on Sensors, Instrumentation, Measurement and Metrology
75
[3] Priyanka, E. B., C. Maheswari, and S. Thangavel. "Online monitoring and control of flow rate in oil pipelines transportation system by using PLC based Fuzzy‐PID Controller." Flow Measurement and Instrumentation 62 (2018): 144-151.
[4] “Process Control Mineral Processing Design and Operations.” Elsevier, 2016. 763-816. Mineral Processing Design and Operations. Web.
033-ISSIMM2019
Monitoring Distribution System of Carbon Monoxide and Surface
Ozone Based On GPS and Microcontroller
A Indrawan.1
, A. Sudarmaji1
, F.R. Ihsan2
, and D. Prabowo2
1Department of Physics, Faculty of Mathematics and Natural Sciences (FMIPA), Universitas Indonesia, Indonesia 2Instrumentation, STMKG, Indonesia aCorresponding author :[email protected] Keywords: Arduino, Carbon Monoxide, GPS,
Surface Ozone Abstract. Jakarta is the most populous city in Indonesia. This is directly proportional to the
increasing number of motorized vehicles in Jakarta. The number of Jakarta motorized vehicles
causes air pollution in Jakarta to become uncontrollable. Air pollution is the presence of one or
more physical, chemical or biological substances in the atmosphere in an amount that can
endanger the health of living things. Ozone and Carbon Monoxide, including dangerous elements
that exist in air pollution. Ozone is a pollutant that causes significant respiratory disease. Carbon
Monoxide is dangerous because it can form compounds with Hemoglobin to form HbCO, and this is
toxic to the blood. We can find out the quality of the air somewhere, through the content of Ozone
and Carbon Monoxide in the area. At present the number of Ozone and Carbon Monoxide gauges
in Indonesia is still small, so that not all regions have been monitored for air quality conditions.
The purpose of this design is to determine the level of air quality and to monitor ozone gas and
carbon monoxide automatically based on Global Positioning System (GPS) and portable. This
system was built using Arduino Mega 2560 (used as a controller), ozone sensor, Carbon Monoxide
gas sensor and GPS (used as a timing and determinant of location). Programming is done using the
Arduino IDE application. The measurement results are stored using a microSD Card, and displayed
on the LCD. This system can inform the condition of air quality in an area, because this tool is
portable (can be carried anywhere), in real time and data generated every second.

The 4th International Seminar on Sensors, Instrumentation, Measurement and Metrology
76
Figure 1 Results of CO and Surface Ozone measurements at South Jakarta
References [1] Schreiber, V. 1996, A Synoptic Climatological Eva- luation Of Surface Ozone Concentrations
in Lancaster Country Pennsylvania. Millersville University of Pennsylvania. [2] Rizki, F. (2011). Alat Pendeteksi Polusi Udara Dari Gas Karbonmonoksida (CO) pada
Ruangan Berbasis Mikrokontroler AT89S51. Surabaya: Universitas Pembangunan Nasional
“Veteran” Jawa Timur.
[3] Hariyanto, E., Lubis, S. A., & Sitorus, Z. (2017). Perancangan prototipe helm pengukur
kualitas udara, I, 2015–2018.
[4] World Meteorological Organization. 2008. Guide to Meteorological Instruments and
Methods of Observation. WMO-No. 8.
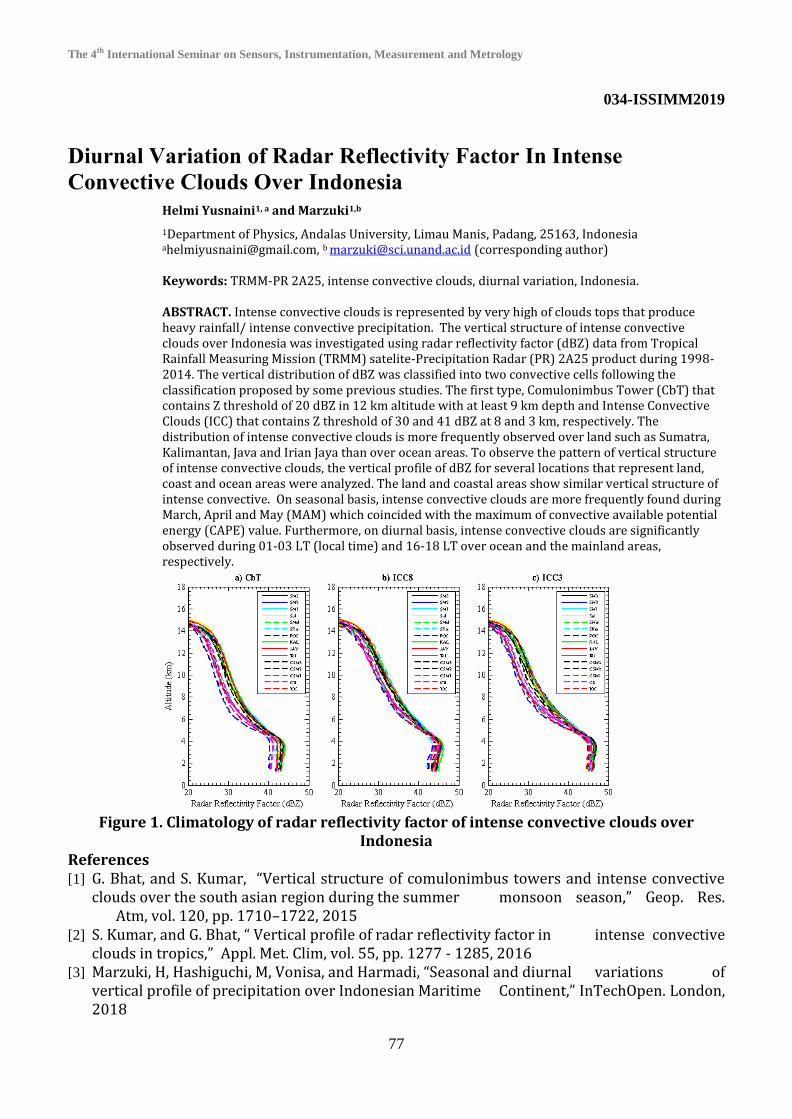
The 4th International Seminar on Sensors, Instrumentation, Measurement and Metrology
77
034-ISSIMM2019
Diurnal Variation of Radar Reflectivity Factor In Intense
Convective Clouds Over Indonesia
Helmi Yusnaini1, a and Marzuki1,b
1Department of Physics, Andalas University, Limau Manis, Padang, 25163, Indonesia [email protected], b [email protected] (corresponding author) Keywords: TRMM-PR 2A25, intense convective clouds, diurnal variation, Indonesia. ABSTRACT. Intense convective clouds is represented by very high of clouds tops that produce heavy rainfall/ intense convective precipitation. The vertical structure of intense convective clouds over Indonesia was investigated using radar reflectivity factor (dBZ) data from Tropical Rainfall Measuring Mission (TRMM) satelite-Precipitation Radar (PR) 2A25 product during 1998-2014. The vertical distribution of dBZ was classified into two convective cells following the classification proposed by some previous studies. The first type, Comulonimbus Tower (CbT) that contains Z threshold of 20 dBZ in 12 km altitude with at least 9 km depth and Intense Convective Clouds (ICC) that contains Z threshold of 30 and 41 dBZ at 8 and 3 km, respectively. The distribution of intense convective clouds is more frequently observed over land such as Sumatra, Kalimantan, Java and Irian Jaya than over ocean areas. To observe the pattern of vertical structure of intense convective clouds, the vertical profile of dBZ for several locations that represent land, coast and ocean areas were analyzed. The land and coastal areas show similar vertical structure of intense convective. On seasonal basis, intense convective clouds are more frequently found during March, April and May (MAM) which coincided with the maximum of convective available potential energy (CAPE) value. Furthermore, on diurnal basis, intense convective clouds are significantly observed during 01-03 LT (local time) and 16-18 LT over ocean and the mainland areas, respectively.
Figure 1. Climatology of radar reflectivity factor of intense convective clouds over
Indonesia References [1] G. Bhat, and S. Kumar, “Vertical structure of comulonimbus towers and intense convective
clouds over the south asian region during the summer monsoon season,” Geop. Res. Atm, vol. 120, pp. 1710–1722, 2015
[2] S. Kumar, and G. Bhat, “ Vertical profile of radar reflectivity factor in intense convective clouds in tropics,” Appl. Met. Clim, vol. 55, pp. 1277 - 1285, 2016
[3] Marzuki, H, Hashiguchi, M, Vonisa, and Harmadi, “Seasonal and diurnal variations of vertical profile of precipitation over Indonesian Maritime Continent,” InTechOpen. London, 2018

The 4th International Seminar on Sensors, Instrumentation, Measurement and Metrology
78
[4] K.T. Saikranthi, N. Rao, B. Radhakhrisna, and S.V. Rao, “ Morphology of vertical structure of precipitation over Indian and adjoining osean based on long-term measurement of TRMM PR,” Geop. Res. Atm, vol. 119, pp. 8433-8449, 2014
035-ISSIMM2019
Design Measuring Instrument of Volume and The Number of
Drops Infusion on Automatic Infusion Monitoring System Arduino
Based Auliya Sifa Fauziyyah*a, Yohandri*b *Physics Department, Faculty of Mathematics and Natural Science, Padang State University JL. Prof. Hamka, Padang, West Sumatera [email protected], [email protected] Keywords: intravenous fluids drops, load cell, photogate, motor servo, arduino mega ABSTRACT. Intravenous Fluids Drops are very important for the process of healing or treatment for patients. The function of infusion is to replace the loss of fluids or nutrients in the body. In Indonesia, monitoring system of condition about infusion is still done manually, but for the cases such a large hospitals which is the number of patients is not balanced by medical personnel, it is becomes ineffective so that it can cause mistakes in monitoring. A very serious mistake can occur are too late in replacing the infusion. The solution to solve this problem is to make an automatic infusion monitoring system with an alarm warning. This research is experimental research. The measurement technique taken is direct and indirect measurement. Direct measurement data is mass of infusion and indirect measurment data is the number of infusion drops and the percentage of infusion volume. The purpose of this research is to determine the design spesifications and peformance spesification of the instrument. The sensor used to measure infusion drops per minute is photogate and to measure the infusion volume is load cell. Motor Servo Tower Pro SG90 are used as automatic drip control and arduino mega used as a brain for this instrument. The display is use TFT LCD and using buzzer for alarm warning. The accuracy of infusion drops per minute system is 0,97 with error 1,25% and accuracy of infusion volume is 0,978 with error 1,944%.
Figure 1. Relations of Load Cell Output Voltage with Mass
References [1] Wadianto, & Zhafirah Fihayah. 2016. Simulasi Sensor Tetesan cairan Pada Infus Konvensional.
Politeknik Kemenkes Jakarta. Vol. 3, No. 3, November 2016.
[2] Nataliana, Decy, dkk. 2016. Alat Monitoring Infus Set pada Pasien Rawat Inap Berbasis
Mikrokontroler ATmega 8535. Vol. 4, No. 1, Januari-Juni 2016.
[3] Weinstein, Sharon. M. 2012. Buku Saku Terapi Intravena Edisi 2. Jakarta: EGC.
0
1
2
3
4
5
6
100 200 300 400 500 600 700 800 900 1000
Lo
ad
cel
l O
up
ut
Vo
ltag
e (
mV
)
Mass (gr)
Relations of Load Cell Output Voltage with Mass

The 4th International Seminar on Sensors, Instrumentation, Measurement and Metrology
79
[4] Windarto, Yusmana. 2017. Kontrol Pasien dengan Infus Nirkabel karya Mahasiswa.
http://pojokitu.com/baca.php?idurut=42003&&top=1&&ktg=Jatim&&keyrbk=.Metropolis&
&keyjdl=kontrol, diakses 29 Maret 2019.
[5] Handaya, Yuda. 2010. Infus Cairan Intravena: Macam-Macam Cairan Infus.
http://dokteryudabedah.com/infus-cairan-intravena-macam-macam-cairan-infus, diakses
20 April 2019.
[6] Candra, Riski. 2019. Serba-Serbi Infus: Mulai dari Prosedur Pemasangan hingga Resiko Efek
Sampingnya. https://hellosehat.com /hidup-sehat/fakta-unik/penyebab-tangan-di-infus/,
diakses 29 Maret 2019.
[7] Mahardika, Gilang Prihadi & Mutiara Herawan. 2015. Rangan Bangun Perangkat Pengendali
Debit Infus Otomatis untuk Proses Terapi Infus. VI, p. 22, 2015.
[8] Yulkifli. 2013. Sistem Sensor dan Aplikasinya. Padang : Universitas Negeri Padang.

The 4th International Seminar on Sensors, Instrumentation, Measurement and Metrology
80
036-ISSIMM2019
Center Silver nanoparticle preparation by colorimetric method and
its application as a metal ion detector
Yulkifli 1, Cuk Imawan 2,b , Diah Rahmawati3 Titi Surya4 dan Nur Intan P5
2, 5Fisika, Departemen Fisika, Universitas Indonesia, Depok 1,3,4Fisika, Jurusan Fisika, Universitas Negeri Padang, Padang [email protected] [email protected] Keywords: silver nanoparticles, ion detector, UV-Vis spectrometers ABSTRACT. Silver nanostructured particles with controlled size, shape, and morphology were
achieved by gamma irradiation of aqueous solution containing AgNO3 and poly (vinyl alcohol)
(PVA). Synthesis of silver nanoparticles and their application as metal ion detectors. Silver
nanoparticles are synthesized by the colorimetric method which is based on the change in color of
the solution as the irradiation time increases. The solution of AgNO3 + PVA silver nanoparticles
with a concentration of 1M was irradiated with gamma rays and then added to various types of
metal ions. Characteristics of silver nanoparticles formed were then analyzed using UV-Vis
spectrometers. Analysis of absorbance of AgNO3 + PVA nanoparticle solution with metal ions
shows the color change in the variation of metal ions. AgNO3 + PVA nanoparticle colloidal silver
can be used as a heavy metal ion detector.
References [1] . Sileikaite, A, et al. Analysis of Silver Nanoparticles Produced by Chemical Reduction of Silver
Salt Solution. Materrials Science. 2006;12(4). [2] Haryono A, dkk. Sintesa Nanopartikel Perak dan Potensi Aplikasinya. Jurnal Riset Industri.
2008;2(3):155-63. [3] Mailu, S.N, Waryo, T.T. Determination of Anthracene on Ag-Au Alloy Nanoparticles/
Overoxidized-Polypyrrole Composite Modified Glassy Carbon Electrodes. Journal Sensors. 2010;10(9449-9465).
[4] Duran, N, Marcato, P.D. Antibacterial Effect of Silver Nanoparticles Produced by Fungal Process on Textile Fabrics and Their Effluent Treatment. Journal of Biomedical Nanotechnology. 2007;3:203-8.

The 4th International Seminar on Sensors, Instrumentation, Measurement and Metrology
81
037-ISSIMM2019
Integration of LAPAN’s Remote Sensing Ground Station Control
and Monitoring System Application
Ali Syahputra Nasution1, a
, and Hidayat Gunawan1,b
1Remote Sensing Technology and Data Center, LAPAN, 70 LAPAN Road - Pasar Rebo. 13710. Jakarta - Indonesia [email protected], [email protected] ABSTRACT. The National Institute of Aeronautics and Space (LAPAN) - Remote Sensing has
developed different website-based application systems. The application system is used to control
and monitor several series of ground station processes ranging from acquisition, recording,
processing, storage, to cataloging data and remote sensing satellite products. At present these
applications are still working separately which are built from various platforms both operating
systems, programming, databases, infrastructure and architecture. Therefore, an application
system integration solution is needed in order to facilitate and speed up ground station operators to
control and monitor the processes that take place and obtain useful and valid information for
decision making. The design of this system integration application is done by preparing materials
and defining layouts, coding Hypertext Preprocessor (PHP), testing designs, granting domains, and
providing hosting. The User Interface (UI) uses a bootstrap framework to display responsive
results for each screen size.
Keywords: Integration, control and monitoring application, remote sensing ground station,
PHP, bootstrap.

The 4th International Seminar on Sensors, Instrumentation, Measurement and Metrology
82
038-ISSIMM2019
A Measurement Low Magnetic Field at Copper Plate
Electromagnet
Sony Wardoyo, Mitra Djamal, Maman Budiman
Department of Physics, Bandung Institute of Technology [email protected] Abstract. The discovery of electromagnets has had a great influence on the development of science and technology, which due to the nature of the magnetism that can be arranged so that it can provide practical benefits including electric motors, relays, power generators, and automatic door switches. In this research, an electromagnetic design and design in the form of a copper plate in the form of a coin chip with a hole in the middle for the iron core. Each plate has an insulator that separates between each plate which is arranged in threads to form a helical coil of copper plates. The experimental results obtained that the design of electromagnets using copper plates, can produce magnetic fields, 0 to 8 mT, with measurements using Gaussmeter as a reference in the development of sensors using giant magnetoresistance. The implications of this research will have an impact on physics and engineering research related to the use of portable and concise electromagnets in the form of copper plate models. In addition it has the potential to be developed in order to produce high magnetic fields. Keywords: electromagnet, giant magnetoresistance, magnetic field, copper plate.

The 4th International Seminar on Sensors, Instrumentation, Measurement and Metrology
83
039-ISSIMM2019
Verification of Dose Distribution on The Gamma Knife Perfexion
Radiosurgery Using Gafchromic Ebt3 Film: Rando Fantom Study
I Nyoman Pranditayana1, a, Ade R. Setiadi2, M.M. Ramadhan1, David Tandian2, Supriyanto A. Pawiro 1,b
1Dept. of Physics, Faculty of Mathematics and Natural Sciences, University of Indonesia, Kampus UI Depok, Jawa Barat, Indonesia 2Gamma Knife Refferal Center, RSUPN Dr. Cipto Mangunkusumo Hospital, Jakarta Indonesia [email protected], [email protected] Keywords: Leksell Gamma Knife Perfexion (LGK PFX), Leksell Gamma Plan (LGP), Gafchromic EBT3, RANDO, Dose Distribution Calculation. ABSTRACT. Leksell gamma knife (LGK) is an advanced modality of gamma ray radiation therapy sourced Co-60 radioactive for treating patient with intracranial lesion, malformations and functional diseases. Small field techniques with high doses delivering to patients in single session must be calculated accurately and verified carefully. This study illustrates a procedure to verify the accuracy of dose distribution associated with Leksell Gamma Plan (LGP) using RANDO phantom and gafchromic EBT3 film dosimetry. Firstly, we assessed the profile dose on LGK standard phantom with collimators size 4, 8 and 16 mm and compared the results with the profile dose based on RANDO to obtained Full Width Half Maximum (FWHM) and beam-symmetry. Next steps absorbed-dose distributions inside a RANDO with various combinations of lesion volume, collimator size, location, and number of shots assessed by EBT3 film were irradiated inside the phantom using LGK Perfexion. Scanned images of the measured films were processed following standard EBT3 film-handling procedures. Dose distribution calculation were performed using ImageJ software and Matlab in-house software. The study shows different FHWM and beam symmetry of collimator size of 16 mm on standard phantom between LGP and measurement is 1.83 % and 1.58 % respectively, whereas the discrepancy in RANDO phantom is 2.15 %, and 1.64 % for beam symmetry and FWHM respectively. Verification of max dose shows the smallest discrepancy between LGP calculation and measurement with collimator size 16 single shot is 1.9 % on 7.61 cc superior lesion volume, where 12.12 Gy obtained by measurement and 12.36 Gy from LGP. In conclusion, collimator size 16 mm have a highest accuracy of FWHM and beam-symmetry value, but on smaller lesion volume, collimator 16 mm with single shot give higher deviation dose value.
Figure 1. Profile Dose of SWP and RANDO Phantom
References [1] Chung et al. (2017). Verification of dose profiles generated by the convolution algorithm of
the gamma knife radiosurgery planning system. American Association of Physicists in Medicine. Med. Phys. 44 (9).
[2] Gopishankar, N. (2012). MAGAT gel and EBT2 film-based dosimetry for evaluating source plugging-based treatment plan in Gamma Knife stereotactic radiosurgery. Journal Of Applied Clinical Medical Physics, Volume 13, Number 6.

The 4th International Seminar on Sensors, Instrumentation, Measurement and Metrology
84
[3] Najafi, M. et al. (2018). Evaluation of dose profiles using Gafchromic EBT3 films in Leksell Gamma Knife 4C around inhomogeneities in the treatment of pituitary adenoma in anthropomorphic heterogeneous head phantom. Radiation Physics and Chemistry 149. 104–109.
040-ISSIMM2019
Feature Selection with LASSO for Classification of Ischemic
Strokes Based on EEG Signals
Hendra Angga Yuwono1, a, Sastra Wijaya Kusuma1,b and P Prajitno1,c
1Departemen Fisika, FMIPA, Universitas Indonesia, Depok, Jawa Barat, Indonesia [email protected], [email protected], [email protected] (corresponding author) Keywords: Acute Ischemic Stroke; EEG; Lasso; Random Forest. ABSTRACT. Electroencephalography (EEG) is an electrical signal data that can describe brain activity in which the signal contains important information that can be used to detect several diseases. One of the diseases that can be detected by EEG signals is stroke. The most common type of stroke is the acute ischemic stroke (AIS) due to blockage of blood supply to the brain which can generate the tissue damage in the brain EEG signal recording uses several electrodes where the more electrodes used in the recording, the greater the number of EEG features produced (high dimensional data). This can make it difficult for models of machine learning to have optimal performance on high-dimensional data. In this study, we try to optimize the performance of the machine learning model by selecting features with the Least Absolute Shrinkage and Selection Operator (LASSO) method, where this method can select the relevant features by shrinking some coefficients to zero. The type of classification used in this study is random forest with features used for classification are Brain Symmetry Index (BSI), Delta-Alpha Ratio (DAR), Delta-Theta-Alpha-Beta Ratio (DTABR). The results showed that the feature selection method with the lasso method can optimize the performance of learning machines with an accuracy value of 78.8% with 9 features out of 45 features.

The 4th International Seminar on Sensors, Instrumentation, Measurement and Metrology
85
041-ISSIMM2019
Predictive Maintenance Magnetic Sensor using Random Forest
Method
Aziz Setia Aji1, a, Jihand Aulia Sashiomarda1,b, and Djati Handoko1,c
1Department of Physics, Faculty of Mathematic and Sciences, Universitas Indonesia Depok 16424, Indonesia [email protected], [email protected], [email protected] (corresponding author) Keywords: predictive maintenance, random forest, magnetic sensor ABSTRACT. BMKG has observations of earth's magnets which are scattered in Indonesia. The BMKG earth magnetic sensor produces real-time data output. This research focuses on predictive maintenance models on earth magnetic sensors based on data output. The resulting data output is in the form of a delimited format in the form of spaces so that it is easy to process. The magnetic component used is the total component data (F) from the earth's magnetic sensor. Data processing using python scripts with the algorithm used is the random forest method by comparing the resulting value difference to find out whether the data generated is still in tolerance or not. The results of this processing are used to predict the sensor's ability.
Figure 1. Flowchart of the research process
References [1] A. Primajaya, B. N. Sari, “Random Forest Algorithm for Prediction of Precipitation,” in
Indonesian Journal of Artificial Intelligence and Data Mining, vol. 1, No.1, pp. 27-31, March 2018
[2] I.H.F. Santos, etc, “Big Data Analytics for Predictive Maintenance Modeling: Challenges and Opportunities,” in Offshore Technology Conference, Brasil: 2015
[3] M. Canizo, E. Onieva, A. Conde, S. Charramendieta, S. Trujillo, “Real-time Predictive Maintenance for Wind Turbines Using Big Data Fremeworks,” University of Deusto Bilbao, Spain: 2017
[4] C.J. Su, J.A.Q. Yon, “Big Data Preventive Maintenance for Hard Disk Failure Detection”, in International Journal of Information and Education Technology, Vol. 8, No. 7 July 2018
[5] P. Scheibelhofer, D, Gleispach, G. Hayderer, E. Stadlober, “A Methodology for Predictive Maintenance in Semiconductor Manufacturing”, in Austrian Journal of Statistics, vol. 41 (2012), No. 3, pp. 161-173
[6] N. Amruthnath, “Predictive Maintenance-Fault classification”, in www.researchgate.net, February 2019
[7] N. Amruthnath, “Predictive Maintenance-Fault Detection”, in www.researchgate.net, February 2019

The 4th International Seminar on Sensors, Instrumentation, Measurement and Metrology
86
042-ISSIMM2019
Calibration of Dynamic Thorax Phantom In-house for
Radiotherapy Dosimetry
Sasono W1, a, Arief S2,b, Supriyanto A. Pawiro 3,c 1Mathematic and Natural Sciences Faculty Universitas Indonesia, Indonesia 2 Mathematic and Natural Sciences Faculty Universitas Indonesia, Indonesia 3 Mathematic and Natural Sciences Faculty Universitas Indonesia, Indonesia [email protected], [email protected], [email protected] Keywords: Stepper Motor, Dynamic Thorax Phantom, Real-Time Positioning Management, ABSTRACT. Accuracy in determining of tumour position inside the human body is very important, (Giraud et al., 2006). Moreover, Real-Time Positioning Management (RPM) techniques are needed when scanning objects on a CT Simulator, for the tumour located in moving organs (Prunaretty et al., 2019). In order to ensure the RPM technique had properly function, we need a quality control tool that represents moving objects on the human body. Inspired by the CIRS Dynamic Thorax Phantom model 008A, we developed a Dynamic Thorax Phantom In-house using three of Nema-17 stepper motors with 200 steps a cycle. In addition, the first stepper motor was used to move objects in superior-inferior direction, the second one was used to move objects in rotation, then the third was used to move the Real-Time Positioning Management marker vertically. Calibration of three stepper motors is performed by finding out the number of counts that needed. Especially for stepper motor that uses for rotational movement, were calibrated with Arduino rotational sensor. With the circuit diagram as shown in fig.1 we found that the stepper motors have less than 0.01% deviation for rotation and Superior-Inferior movement, they could be applied for Dynamic Thorax Phantom In-house.
Figure 1. Circuit Diagram for Stepper Motors and the result
References [1] Giraud, P., Yorke, E., Jiang, S., Simon, L., Rosenzweig, K., & Mageras, G. (2006).
Reduction of organ motion effects in IMRT and conformal 3D radiation delivery by using gating and tracking techniques. Cancer/Radiotherapie, 10(5), 269–282. https://doi.org/10.1016/j.canrad.2006.05.009
[2] Prunaretty, J., Boisselier, P., Aillères, N., Riou, O., Simeon, S., Bedos, L., … Fenoglietto, P.

The 4th International Seminar on Sensors, Instrumentation, Measurement and Metrology
87
(2019). Tracking, gating, free-breathing, which technique to use for lung stereotactic treatments? A dosimetric comparison. Reports of Practical Oncology and Radiotherapy, 24(1), 97–104. https://doi.org/10.1016/j.rpor.2018.11.003

The 4th International Seminar on Sensors, Instrumentation, Measurement and Metrology
88
043-ISSIMM2019
Synthesis and Characterization of Graphene Oxide from Biomass
Waste M Ikhsan1,a and Ramli1,b
1 Department of Physics, Faculty of Mathematics and Natural Sciences, Universitas Negeri Padang, Padang 25131, Indonesia
[email protected], [email protected]
Abstract. Biomass waste is ranked as the most abundant type of waste in Indonesia. If not managed properly, it will cause environmental problems such as pollution and damage to the environmental ecosystem. The purpose of this study was to obtain advanced material of graphene oxide from empty fruit bunch (EFB) from palm oil biomass waste. biomass waste then burned in the furnace at atmospheric pressure at 350oC for 2 hours to produce bio charcoal. The silica content in bio charcoal is removed with hydrogen fluoride (HF) and then used as a precursor for the manufacture of graphene oxide. The graphene oxide is synthesized by a modified Hummers method with oxidizing agents KMnO4, H2SO4, and NaNO3. Graphene oxide is characterized by Uv-Vis to see its optical properties. The results of this research are useful to provide economic added value to biomass waste after being transformed into graphene oxide
Keywords: biomass, bio carchoal, empty fruit bunch, oil palm, modified Hummers method, uv-vis
References
[1] Claoston, N., Samsuri, A., Ahmad Husni, M., & Mohd Amran, M. (2014). Effects of pyrolysis temperature on the physicochemical properties of empty fruit bunch and rice husk biochars. Waste Management & Research, 32(4), 331–339.
[2] Zaaba, N. I., Foo, K. L., Hashim, U., Tan, S. J., Liu, W.-W., & Voon, C. H. (2017). Synthesis of Graphene Oxide using Modified Hummers Method: Solvent Influence. Procedia Engineering, 184, 469–477. doi:10.1016/j.proeng.2017.04.118
[3] Li, F., Jiang, X., Zhao, J., & Zhang, S. (2015). Graphene oxide: A promising nanomaterial for energy and environmental applications. Nano Energy, 16, 488–515.
[4] Perkampus, H.-H. (2012). Uv-vis spectroscopy and its applications. Place of publication not identified: Springer-Verlag Berlin An.

The 4th International Seminar on Sensors, Instrumentation, Measurement and Metrology
89
044-ISSIMM2019
Design of High Efficiency Active Class E Rectifier using PMOS
Switch for Hybrid Wireless Power Transfer
Taufiq Alif Kurniawana, Dandy Bagus Fauzan and Gunawan Wibisono
Departement of Electrical Engineering, Faculty of Engineering Universitas Indonesia, Kampus UI Depok, Depok, Jawa Barat, Indonesia [email protected] Keywords: active class-E rectifier, DC output regulation, high efficiency, medical applications, PMOS switch, hybrid wireless power transfer. ABSTRACT. Recently, research in hybrid wireless power transfers (H-WPT) are growing rapidly.
For medical applications, most H-WPTs are built on frequencies of several KHz to below 20 MHz
[1],[2]. The H-WPT circuits are very promising to conduct therapy in several conditions. Many
therapies especially in neurological stimulation for sleep apnea, pain management, Parkinson’s
Disease, epilepsy, bladder control, gastrointestinal disorders, numerous autoimmune diseases and
psychological disorders can be effectively conducted using implantable circuits [3]. In addition,
the retinal prosthesis system using WPT in [4] for retinal degenerative patients is also interesting
solution to reduce the cause of blindness in the world.
Increasing transmission frequency is useful to design a compact and high efficiency WPT circuits.
Generally, the configuration of the H-WPT‘s receiver consists of the receiver coil, rectifier and
voltage regulator. The voltage regulator circuits is used to maintain the output voltage of the H-
WPT eventhough the coil’s position is changed (mutual inductance change). Some approachs to
minimize the influence of mutual inductance changes i.e., impedance compression topologies [5],
feedback-based control [6], and thinned-out method [7]. In active class E recitifier [8], the high
efficiency rectification and the DC output regulation are performed simultaneously without the
need of an additional regulating circuits. However, at the DC output voltage there is a significant
ripple thereby reducing the efficiency of the rectifier. This is due to the use of NMOS as a switching
device, where the threshold voltage of NMOS is strongly influenced by the body bias voltage. In
this paper, the design of the active class E rectifiers using PMOS switch produces a more stable and
lower ripple DC output voltage. So that the efficiency of rectification increases significantly. With
simple structure and compact size, this proposed active class E rectifier can be applied for the
future H-WPT applications especially in low power operations.
References [1] A. Kurs, A. Karalis, R. Moffatt, J. D. Joannopoulos, P. Fisher, and M. Soljaˇci´c, “Wireless
power transfer via strongly coupled magnetic resonances,” science, vol. 317, no. 5834, pp. 83–86, 2007.
[2] M. Liu, M. Fu, and C. Ma, “Parameter design for a 6.78-MHz wireless power transfer system based on analytical derivation of Class E current-driven rectifier,” IEEE Trans. Power Electron., vol. 31, no. 6, pp. 4280–4291, Jun. 2016.
[3] I. A. Mashahadi, M. Pahlevani, S. Hor, H. Pahlevani, E. Adib, “A New Wireless Power Transfer Circuit for Retina Prosthesis”, IEEE Transactions on Power Electronics, vol. 34, no. 7, pp. 6425-6439, July 2019.
[4] J. McDonald, “Integrated Circuits for Implantable Medical Devices”, White paper on Freescale, Journal Title, electronic file available at: https://cache.freescale.com/files/32bit/doc/white_paper/ICIMDOVWP.pdf, August 2019.

The 4th International Seminar on Sensors, Instrumentation, Measurement and Metrology
90
[5] S. Aldhaher, D. C. Yates, and P. D. Mitcheson, “Design and development of a Class EF2 inverter and rectifier for multimegahertz wireless power transfer systems,” IEEE Trans. Power Electron., vol. 31, no. 12, pp. 8138–8150, Dec. 2016.
[6] J. M. Arteaga, S. Aldhaher, G. Kkelis, D. C. Yates, and P. D. Mitcheson, “Multi-MHz IPT systems for variable coupling,” IEEE Trans. Power Electron., vol. 33, no. 9, pp. 7744–7758, Sep. 2018.
[7] M. Fujii, T. Suetsugu, K. Shinoda, and S. Mori, “Class-E rectifier using thinned-out method,” IEEE Trans. Power Electron., vol. 12, no. 5, pp. 832–836, Sep. 1997.
[8] M. Liu, J. Song, C. Ma, “Active Class E Rectifier for DC Output Voltage Regulation in Megahertz Wireless Power Transfer Systems,” accepted for publication in Transaction on Industrial Electronics 2019.

The 4th International Seminar on Sensors, Instrumentation, Measurement and Metrology
91
045-ISSIMM2019
EEG-EMG based Bio-Robotics Elbow Orthotics Control
Development
Faizal Adila Ferdiansyah1,a
, Prawito Prajitno1,b
and Sastra Kusuma Wijaya1,c
1Universitas Indonesia, Indonesia [email protected], [email protected], [email protected] (corresponding author) Keywords: ADS1299, Brain-Machine Interface, Electroencephalography, Electromyography, Hybrid Brain- Machine Interface, Orthotics. ABSTRACT. Brain-computer interface (BCI) or also its advancement, hybrid brain-computer
interface (hBCI), is a technology that is vastly developed. This technology has been used in many
fields. BCI is a system that directly changes a human's mind into data that can be extracted to
information that can be meaningful to people. The development of this technology has
applications as a rehabilitation aid for someone suffering from an inability to move his limbs,
such as the arms. Through this research, it is hoped to be able to design an orthosis control system
as a rehabilitation device by using a classification method with EEG and EMG signals, so that
subjects who use this tool can carry out rehabilitation in upper arm movements especially in
the elbow joint. The system utilized Raspberry Pi 3 B+ as the computer and ADS1299EEG-FE as
an analog front end for EEG and EMG. EEG frequency band power and EMG Vrms feature are
extracted using Wavelet Transform and the model used for movement classification is Support
Vector Machine. The results of the movement classification using both signals, using delta
alpha ratio and root mean square features, obtained training accuracy for three movements
namely relax, flexion, and extension of 90.3% and for testing accuracy of 85.2%. The
combination of EEG and EMG signals are considered a promising approach for developing
rehabilitation device of right arm limb.
Figure 1. Elbow Orthotics Hardware System Design.

The 4th International Seminar on Sensors, Instrumentation, Measurement and Metrology
92

The 4th International Seminar on Sensors, Instrumentation, Measurement and Metrology
93
References
[1] J. R. Wolpaw, N. Birbaumer, D. J. McFarland, G. Pfurtscheller, and T. M. Vaughan, “Brain –
computer interfaces for communication and control,” Clinical neurophysiology, vol. 113, no. 6, pp. 767 –791, 2002.
[2] E. J. Rechy-Ramirez and H. Hu, “Bio-signal based control in assistive robots: a survey,”
Digital Communications and Networks, vol. 1, no. 2, pp. 85–101, 2015.
[3] H. Toriyama, J. Ushiba, and J. Ushiyama, “Subjective Vividness of Kinesthetic Motor Imagery Is
Associated With the Similarity in Magnitude of Sensorimotor Event-Related Desynchronization Between Motor Execution and Motor Imagery,” Frontiers in Human Neuroscience, vol. 12,
2018. [4] ] X. Zhang, X. Yong, and C. Menon, “Evaluating the versatility of EEG models generated from
motor imagery tasks: An exploratory investigation on upper-limb elbow-centered motor imagery tasks,” Plos One, vol. 12, no. 11, 2017.

The 4th International Seminar on Sensors, Instrumentation, Measurement and Metrology
94
046-ISSIMM2019
Atmospheric Correction Models for Monitoring Rice Plants with
Landsat-8 OLI and Sentinel-2
Fadila Muchsin1,a, Indah Prasasti2,b, Mulia Inda Rahayu3,c , Liana Fibriawati4,d, Kuncoro Adi Pradono5,e, Hendayani6,f, and Kiki Winda Veronica7,g
1,,3,4,5,6,7Pustekdata – LAPAN, Indonesia 2Pusfatja– LAPAN, Indonesia
[email protected] Keywords: Atmospheric correction, Landsat-8, Sentinel-2, Rice growth phases, Statistical analysis, Vegetation indices. ABSTRACT. Atmospheric correction is a critical pre-processing step required in quantitative remote sensing applications such as extraction of biophysical variables and multi-temporal analysis. The objective of this study was to evaluate surface reflectance of four atmospheric correction models base on scene-based empirical models namely Dark Object Subtraction (DOS) and Quick Atmospheric Correction (QUAC) and the radiative transfer models namely the Second Simulation of Satellite Signal in the Solar Spectrum (6S) and Fast Line-of-sight Atmospheric Analysis of Spectral Hypercubes (FLAASH). We applied these models to Landsat 8 OLI and Sentinel-2 images above rice fields in West Java Province and compared surface reflectance from atmospheric correction models with ground measured reflectance base on spectral response and vegetation indices (NDVI, EVI, SAVI and MSAVI). For that purpose, two stages of rice growth phases (vegetative and generative) were analyzed by using statistical analysis. The result showed that the 6S model has better accuracy followed by FLAASH, QUAC and DOS and it has a consistent value for the vegetative phase with green vegetation very dominant.

The 4th International Seminar on Sensors, Instrumentation, Measurement and Metrology
95
047-ISSIMM2019
Comparative Study of Hyperspectral Acquisition Technique for
Measuring Total Soluble Content and pH in Honey
Advendio Desandros1, a and Adhi Harmoko Saputro1,b
1 Department of Physics, Faculty of Mathematics and Natural Sciences, Universitas Indonesia, Depok, Indonesia a [email protected], b [email protected] (corresponding author) Keywords: honey; hyperspectral; reflectance; transmittance; total soluble solid. ABSTRACT. Transmittance and reflectance modes are the two most common technique used for investigating liquid psychochemical properties based on optical spectra. In the case of honey characterization, this research performed to show a comparison between both modes to measure honey’s Total Soluble Solids and pH based on the Vis-NIR hyperspectral imaging system. The system consists of Specim FX10 hyperspectral camera with 448 bands (400-1000 nm), three 200 W halogen lamps, a light diffuser, a motor slider, and a PC. Then, PLSR algorithm applied to predict measured values based on acquired transmittance and reflectance spectrum. Performance of each technique tested by tenfold Cross Validation, which randomly grouping the dataset into ten partitions. Samples are prepared from 28 different honey types with varied colors, placed in 5 cm diameter Petri dishes at 10 ml volume. Performance of transmittance mode results in R2 of 0.93 and 0.80, RMSPE of 1.06% and 5.36% for total soluble solid content and pH measurement. For similar measured properties, reflectance mode results in R2 of 0.94 and 0.82, RMSPE of 1.01% and 5.23%. In this research, reflectance mode performs slightly better than transmittance mode in the measurement of Total Soluble Solids and pH in honey samples.
Figure 1. Fig. 6. Plot of predicted and measured values of TSS measurement with
transmittance mode (left) and reflectance mode (right) References [1] A. Noviyanto and W.H. Abdulla, “Honey Dataset Standard Using Hyperspectral Imaging for
Machine Learning Problems,” 25th European Signal Processing Conference (EUSIPCO)., p.p.473-477, 2017.
[2] I. Kasprzyk, J. Depciuh, D. Grabek-Lejko, M. Parlinska-Wojtan. “FTIR-ATR Spectroscopy of Pollen and Honey as a Tool for Unifloral Honey Authentication. The Case Study of Rape Honey,” Food Control 84., p.p. 33-40, 2018.
[3] J. Qin et al., “Line-Scan Hyperspectral Imaging Techniques for Food Safety and Quality Applications,” Applied Sciences., vol. 7, no. 2, p. 125, 2017.
[4] S. Minaei et al., “VIS/NIR imaging application for honey floral origin determination,” Infrared Physics and Technology., vol. 86, p.p. 218–225, 2017.

The 4th International Seminar on Sensors, Instrumentation, Measurement and Metrology
96
048-ISSIMM2019
Real Time Monitoring State-of-Charge Battery using Internal
Resistance Measurements for Remote Applications
Taufiq Alif Kurniawana, Aldyan Natajaya, Purnomo Sidi Priambodo and Gunawan Wibisono
Departement of Electrical Engineering, Faculty of Engineering Universitas Indonesia, Kampus UI Depok, Depok, Jawa Barat, Indonesia [email protected] Keywords: Battery management system, internal battery resistance, overcharging, real time monitoring, remote applications, state-of-charge battery. ABSTRACT. Currently, the use of batteries as energy storage applications in various fields initiates
many researcher to maximize the battery performance. One of the most important things to prevent a
battery from over-charging or discharging issue is an accurate State-of-Charge (SoC) estimation of the
battery [1]. Inaccuracies in determining the SoC reduce the power-output capability and decrease the
quality of the battery management system (BMS) [2]. Especially if the battery is used for remote
applications which can not be monitored any time. Remotely accurate SoC information can be used to
precisely control the charging and discharging operation of the battery. Several approaches have been
proposed regarding SoC estimation i.e., the Coulomb Counting (CC) [1], [3], the socalled open circuit
voltage (OCV) -based methods [4], [5] and the model-based methods [6].
In this paper, real time monitoring SoC battery for the remote aplications is proposed by calculating
the battery's internal resistance when charging or discharging. When charging process, the battery's
internal resistance (ric) is low and will increase according with increasing the level of SoC. While at the
discharging process, the internal battery‘s resistance (rid) is low and will increase in proportional to
the decreasing of the SoC level. The calculation of rid and ric is conducted by measuring VL (load
voltage), IL (load current), and IC (charging current) using a voltage divider mechanism on the Arduino
Uno and current sensors, respectively. LORA RA-02 SX 1278 433 MHz is used to transmit the
parameters VL, IL and IC of the batteries from the remote area (transmitter) to the server (receiver).
Then the SoC will be estimated based on internal resistance calculation using these parameters on the
server. With a simple structure, the proposed systems can be applied to the future remote real time
monitoring battery systems.
References [1] K. W. E. Cheng, B. P. Divakar, H. Wu, K. Ding, and H. F. Ho, “Battery management system
(BMS) and SOC development for electrical vehicles,” IEEE Trans. Veh. Technol., vol. 60, no. 1, pp. 76–88, Jan. 2011.
[2] A. R. F. G. D. Zhou, K. Zhang and A. Miraoui, “Parameter sensitivity analysis for fractional-order modeling of lithium-ion batteries,” Energies, vol. 9, no. 3, 2016.
[3] K. S. Ng, C. S. Moo, Y. P. Chen, and Y. C. Hsieh, “Enhanced Coulomb counting method for estimating state-of-charge and state-of-health of Lithium-ion batteries,” Appl. Energy, vol. 86, no. 9, 2009.
[4] M. A. Roscher and D. U. Sauer, “Dynamic electric behavior and open-circuit-voltage modeling of LiFePO4-based Lithium ion secondary batteries,” J. Power Sources, vol. 196, no. 1, pp. 331–336, 2011.
[5] L. Lu, X. Han, J. Li, J. Hua, and M. Ouyang, “A review on the key issues for Lithium-ion battery management in electric vehicles,” J. Power Sources, vol. 226, pp. 272–288, 2013.
[6] X. Hu, S. Li, and H. Peng, “A comparative study of equivalent circuit models for Li-ion batteries,” J. Power Sources, vol. 198, p. 359, 2012.

The 4th International Seminar on Sensors, Instrumentation, Measurement and Metrology
97
049-ISSIMM2019
Prediction System for Flavonoid Content on Bisbul Leave (Diospyros
discolor Willd.) Using Deep Neural Networks Regression
Eufrat Tsaqib Qasthari1, a and Adhi Harmoko Saputro1,b
1 Department of Physics, Faculty of Mathematics and Natural Sciences, Universitas Indonesia, Depok, Indonesia a [email protected], b [email protected] (corresponding author) Keywords: bisbul leave, flavonoid content, prediction system, prediction model, deep learning. ABSTRACT. Polyphenols are an important substance since it correlated with antioxidant level of food. One of polyphenol is flavonoid. In most cases, flavonoids measured with destructive methods. Hyperspectral imagery is part of the solution to cope this issue, unfortunately to extract useful information in it is hard. Velvet apple leave (Diospyros discolor Willd.) is one of plants in southeast Asia that rarely used. In this research, velvet apple leaves hyperspectral images acquired within the 400-1000 nm wavelength. The image is a cropped leaf which labeled with laboratory data of flavonoid. The working of the model in this research is used to predict the levels of flavonoid. Deep Neural Networks algorithm was used for predicting flavonoid compounds contained within the leave. Using an unoptimized and shallow Deep Learning model, it predicts the flavonoid compound with the R2 performance of 70,47%. Furthermore, the model is optimized so it can get the best hyperparameters and a deeper architecture. The proposed model can predict of flavonoid with R2 performance of 94,50%.
Figure 1. Regression graphs using deep neural networks models on flavonoid levels
References [1] Camps-Valls, G., and L. Bruzzone. 2005. “Kernel-Based Methods for Hyperspectral Image
Classification.” IEEE Transactions on Geoscience and Remote Sensing 43(6): 1351–62. [2] Yang, Xiaofei et al. 2018. “Hyperspectral Image Classification With Deep Learning Models.” IEEE
Transactions on Geoscience and Remote Sensing 56(9): 5408–23. [3] LeCun, Yann, Yoshua Bengio, and Geoffrey Hinton. 2015. “Deep Learning.” Nature 521(7553):
436–44. [4] Chen, Yushi et al. 2014. “Deep Learning-Based Classification of Hyperspectral Data.” IEEE
Journal of Selected Topics in Applied Earth Observations and Remote Sensing 7(6): 2094–2107.

The 4th International Seminar on Sensors, Instrumentation, Measurement and Metrology
98
050-ISSIMM2019
Design Analysis of Consolidation of Cellular Operators in Indonesia
Gunawan Wibisono1, a and Ria Fistarini1,B
1Dept of Elec Eng, Universitas Indonesia, Kampus Baru UI Depok 164242 INDONESIA aemail:[email protected] (corresponding author), , bemail: [email protected] Keywords: Cellular Operator, Consolidation, Efficiency and Fair Competition, Operational and Finansial Data ABSTRACT. The increased use of data traffic by users increases the demand for cellular network capacity that operators must provide. For this reason, cellular operators have to add sites, use technology with a high efficiency spectrum, and increase spectrum allocation. The limited frequency spectrum becomes an obstacle for operators in increasing the availability of system capacity, which in turn can reduce the quality of mobile broadband services. Indonesian cellular operators are expected to have a spectrum deficit of around 400 - 450 MHz in 2020. One way to overcome spectrum deficits is consolidation between cellular operators. It is therefore very interesting to conduct a consolidation research of Indonesian operators and evaluate and analyze their impact on reducing spectrum deficits and competition. In this research the consolidation design was carried out with the following provisions: a maximum of two operators, the migration of spectrum 2 of the consolidated operators that were not contiguous was carried out to a minimum, the consolidated spectrum of results is a contiguous frequency, and no spectrum divestment. The consolidation model of Indonesian cellular operators is simulated on operators namely Tsel, XL, Isat, and H3I operating at frequencies of 900, 1800 and 2100 MHz in six regional mobile broadband services namely Sumatra, Java, Bali Nusa Tenggara, Kalimantan, Sulawesi and Maluku Papua . There are three consolidation models. Model I consolidation consisted of H3I + Isat consolidation, XL + Tsel, model II consolidation consisted of H3I + XL consolidation and Isat + Tsel consolidation, and model III consolidation consisted of H3I + Tsel and Isat + XL consolidation. First evaluated consolidation which gives the least spectrum deficit. Then the consolidation model is evaluated using company operational and financial data to decide which operator consolidation provides efficiency and fair competition.
References [1] Arthur D Lite. (2015). Creating value in telecoms consolidation. lessons: learned – benchmarks –
recommendations. [2] Berenberg Equity Research. (2013). Telecommunications mobile consolidation: a reality check:
Germany [3] Pedrós, X., Kalvin B., Pau C., Serafino A. (2017). Assessing the impact of mobile consolidation on
innovation and quality: an evaluation of the hutchison/orange merger in austria. GSMA. [4] Berenberg Equity Research (2013). Telecommunications Mobile Consolidation : a reality check.
Inggris. [5] Alice C Lee, John C Lee, Cheng F Lee. (2016) Financial Analysis, Planning and Forecasting Theory
and Application. Third Edition. USA.

The 4th International Seminar on Sensors, Instrumentation, Measurement and Metrology
99
051-ISSIMM2019
Prediction of PM2.5 and PM10 Parameters Using Artificial
Neural Network: Case Study in Kemayoran, Jakarta
Andi Mario Mega Buana Putra1, a
, Martarizal2,b
1Department of Physics, Faculty of Mathematic and Sciences, Universitas Indonesia Depok 16424, Indonesia [email protected], [email protected] (corresponding author) Keywords: Air quality, Artificial Neural Network, Forecasting Modeling, PM2.5,
PM10.
ABSTRACT.It was recorded that in August 2019 the case of acute respiratory infection in Indonesia
had doubled compared to the previous months. This is in line with the increasing levels of PM10 and
PM2.5 in several regions in Indonesia. In the end the public is increasingly aware of the importance
of air quality information. Prediction of air quality will greatly help the public to anticipate the
dangers of declining air quality. The use of Artificial Neural Network can be a solution in making daily
air quality forecasts whose parameters are not linear. This research shows that utilization of
historical data parameters of temperature, humidity, air pressure and wind speed as well as
BMKG's PM10 and PM2.5 data is able to produce forecasting modeling for PM2.5 and PM10
concentrations in the Kemayoran area, Jakarta by utilizing Artificial Neural Network Modeling. The
result is statisfied as follow r<1.
Figure 1. Flowchart of the research process
[1] M. Alkasassbeh, A. F. Sheta, H. Faris and H. Turabieh, “Prediction of PM10 and TSP Air
Pollution Parameters Using Artificial Neural Network Autoregressive, External Input
Models: A Case Study in Salt, Jordan,” Middle-East Journal of Scientific Research 14 (7): 999-
1009, 2013. [2] I.G. McKendry, “Evaluation of artificial neural networks for fine particulate pollution (PM10 and
PM2.5) forecasting,” J. Air Waste Manag. Assoc, 52:1096–1101, 2002. [3] G. Grivas and A. Chaloulakou, “Artificial neural network models for prediction of PM10
hourly concentrations, in the Greater Area of Athens, Greece,” Atmos. Environ. 40(7):1216-1229 , 2006.
[4] M.M Dedovic, S. Avdakovic, I. Turkovic, N. Dautbasic, T. Konjic, “Forecasting PM10
concentrations using neural networks and system for improving air quality,” 2016 XI
International Symposium on Telecommunications (BIHTEL)” Sarajevo, Bosnia and
Herzegovina, 2016 [5] E.Stadlober, S. Hormann, B. Pfeiler, “Quality and Performance of PM10 Daily Forecasting
Model” Atmospheric Environment 42: 1098–1109, 2008.
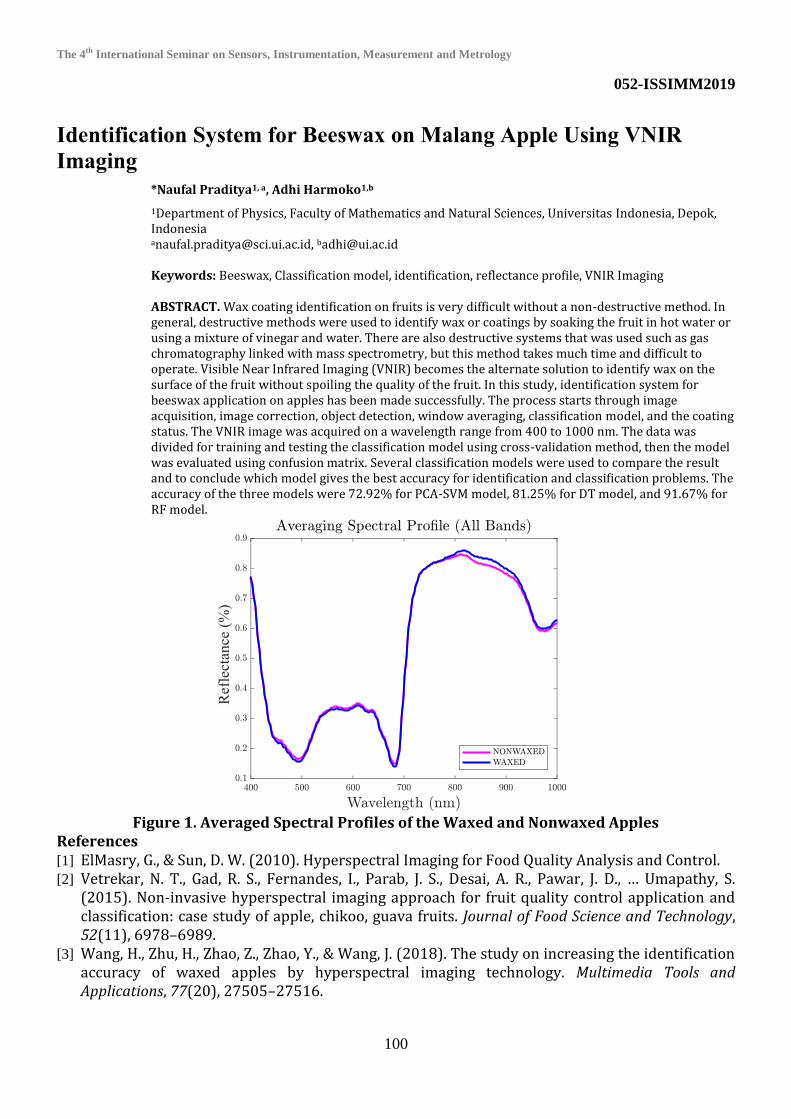
The 4th International Seminar on Sensors, Instrumentation, Measurement and Metrology
100
052-ISSIMM2019
Identification System for Beeswax on Malang Apple Using VNIR
Imaging
*Naufal Praditya1, a, Adhi Harmoko1,b
1Department of Physics, Faculty of Mathematics and Natural Sciences, Universitas Indonesia, Depok, Indonesia [email protected], [email protected] Keywords: Beeswax, Classification model, identification, reflectance profile, VNIR Imaging ABSTRACT. Wax coating identification on fruits is very difficult without a non-destructive method. In general, destructive methods were used to identify wax or coatings by soaking the fruit in hot water or using a mixture of vinegar and water. There are also destructive systems that was used such as gas chromatography linked with mass spectrometry, but this method takes much time and difficult to operate. Visible Near Infrared Imaging (VNIR) becomes the alternate solution to identify wax on the surface of the fruit without spoiling the quality of the fruit. In this study, identification system for beeswax application on apples has been made successfully. The process starts through image acquisition, image correction, object detection, window averaging, classification model, and the coating status. The VNIR image was acquired on a wavelength range from 400 to 1000 nm. The data was divided for training and testing the classification model using cross-validation method, then the model was evaluated using confusion matrix. Several classification models were used to compare the result and to conclude which model gives the best accuracy for identification and classification problems. The accuracy of the three models were 72.92% for PCA-SVM model, 81.25% for DT model, and 91.67% for RF model.
Figure 1. Averaged Spectral Profiles of the Waxed and Nonwaxed Apples
References [1] ElMasry, G., & Sun, D. W. (2010). Hyperspectral Imaging for Food Quality Analysis and Control. [2] Vetrekar, N. T., Gad, R. S., Fernandes, I., Parab, J. S., Desai, A. R., Pawar, J. D., … Umapathy, S.
(2015). Non-invasive hyperspectral imaging approach for fruit quality control application and classification: case study of apple, chikoo, guava fruits. Journal of Food Science and Technology, 52(11), 6978–6989.
[3] Wang, H., Zhu, H., Zhao, Z., Zhao, Y., & Wang, J. (2018). The study on increasing the identification accuracy of waxed apples by hyperspectral imaging technology. Multimedia Tools and Applications, 77(20), 27505–27516.

The 4th International Seminar on Sensors, Instrumentation, Measurement and Metrology
101
053-ISSIMM2019
Magneto-Optic Faraday Effect of Vegetable Oils
Arnold Fedrikoa
, Rizki Arif, Muhammad Rizki Nurriansyah, Luthfi Azmaiza
Hadsyah, Arief Sudarmajib
, Djati Handoko Department of Physics, Universitas
Indonesia, Depok, Indonesia [email protected], [email protected] (corresponding author) Keywords: Magneto-Optic, Faraday Effect, Vegetable Oil, Food
Authentication
ABSTRACT. This study presents a novel Faraday Rotation measurement system and magneto-
optic characterization of vegetable oils with different origin (corn, sunflower, and soybean
oil) and various temperature conditions. The results show that different sample has a
distinct Verdet constant value depending on the origin, measured wavelength, and
temperature. The change in gradient is insignificant for each wavelength measured and with
increased temperature, the angle difference in which the plane of polarization rotates are
noticeably higher. The results show the possibility to differentiate vegetable oils based on
the origin; while the temperature conditions results suggest a novel method to identify reused
vegetable oil in comparison with the same control samples to those of under investigation.
Figure 1. Comparison of Verdet constant value based on origin and
wavelength measured for (a) corn, (b)sunflower, and (c) soybean oil
Figure 2. Soybean oil’s Verdet constant value based on temperature variation
for (a) not heated, and heated for(b) 15min and (c) 30min References
[1] Giancoli, D. C. (n.d.). Douglas C. Giancoli. [2] Sensor, L., Source, L., & Supply, P. (1996). Experiment P57 : Polarization - Verify Malus ’ Law ( Light Sensor ), 2, 1–9.

The 4th International Seminar on Sensors, Instrumentation, Measurement and Metrology
102
[3] Widyastuti, N., Azam, M., & Firdausi, K. S. (2009). Studi Efek Elektrooptis Pada Minyak Goreng, (2), 63–68. [4] Jiles, David. (1998). Introduction to Magnetism and Magnetic Materials. 10.1007/978-1-4615-3868-4. [5] Gridling, G., & Weiss, B. (2007). Introduction to Microcontrollers. Vienna: Embedded Computing Systems Group, Institute of Computer Engineering, Vienna University of Technology. [6] FLIR. (n.d.). Sony Polarizatio. Retrieved from ptgrey: https://www.ptgrey.com/sony-polarization [7] Aloke Jain, J. K. (1999). A simple experiment for determining Verdet constants using alternating current magnetic fields. American Association of Physics Teachers. [8] IUPAC (2014) Compendium of Chemical Terminology—The Gold Book (edisi ke-2nd). International Union of Pure and Applied Chemistry.
The 4th International Seminar on Sensors, Instrumentation, Measurement and Metrology
103
054-ISSIMM2019
A Comparison of Joint Reversible Data Hiding Methods in Encrypted
Remote Sensing Satellite Images Ali Syahputra Nasution
1, a, and Gunawan Wibisono
1,b
1Department of Electrical Engineering, Faculty of Engineering, The University of Indonesia,
Kampus Baru UI – Depok. 16424. Jakarta - Indonesia [email protected],
ABSTRACT. The distribution of remote sensing satellite data from National Remote Sensing Data Bank
(BDPJN) of National Institute of Aeronautics and Space (LAPAN) to users via internet requires security so
that it is not used illegally by unauthorized parties. Encryption and reversible data hiding are two effective
and popular privacy protection and confidential communication solutions. With encryption, data is
randomized so it can't be read. Whereas with reversible data hiding, the receiver can extract hidden data and
restore the original image without distortion. In this paper, some remote sensing satellite images are used as
input in the simulation that is analyzed and compared based on the three methods of joint reversible data
hiding in encrypted images, i.e. Zhang’s work, Hong’s work, and Fatema’s work. The experimental results
show that Hong’s et al. method reveals the best performance of the three methods. For example, when the
block size is 8x8, the bit error rate (BER) of SPOT-6 test image of the Hong’s et al. method was 12.06%,
which is slightly lower than the 14.01% Zhang’s method and 11.89% Fatema’s et al. method. Likewise, the
quality of remote sensing satellite image (image_spot6) recovery represented by the peak signal to noise ratio
(PSNR) of Hong’s et al. method is 49.96 dB, which is quite higher than the 48.26 dB of Zhang’s method and
48.98 dB of Fatema’s et al. method.
Keywords: Encrypted remote sensing satellite images, joint reversible data hiding, BER, PSNR.

The 4th International Seminar on Sensors, Instrumentation, Measurement and Metrology
104
056-ISSIMM2019
Implementation of Artificial Neural Networks for Very Short Range
WeatherPrediction
G B Wanugroho1, a, Martarizal2, b dan R M Putra3, c 1,2Departement of Physics, Universitas Indonesia, Depok, Indonesia 3Agency for Meteorology Climatology and Geophysics, Indonesia [email protected], [email protected] (corresponding author), [email protected] Keywords: Weather Prediction, Artificial Neural Networks, Artificial Intelligence Weather conditions are a significant factor for various sectors such as transportation safety, development, health, etc. Therefore, high development is needed in forecasting future weather conditions. Many ways are used to predict weather conditions. Along with the development of technology now, weather prediction can be made using Artificial Intelligence (AI) technology or artificial intelligence so that the results obtained are more optimal. In this study, the artificial neural network used has a feedforward neural network algorithm using training data consisting of temperature, air pressure, air humidity, wind speed, hourly wind speed at the Juanda Meteorological Station in Surabaya from 2018 to 2019 with the target being speed bulk breeze. Furthermore, the data was released in the period of 1 January 2019 to 31 August 2019. Based on the analysis results, the Artificial Neural Network model has a fairly good performance in predicting an increase in rainfall in Surabaya. The best model is considered by a model with architecture 7 - 30 - 1 with an estimated estimation level of 0.72, with an error value of -0.18. With this model, it is expected to become one of the forecaster considerations in making special weather forecasts at intervals every hour.
Figure 1. Scatterplot Input vs
Output
References : [1]. Manalu M. 2016. Jaringan Syaraf Tiruan Untuk Memprediksi Curah Hujan Sumatera Utara Dengan Metode
Backpropagation (Studi Kasus : BMKG Medan). Jurnal Riset Komputer (JURIKOM). Vol 3. [2]. Handayani L dan Adri M. 2015. Penerapan JST (backpropagation) untuk Prediksi Curah Hujan (Studi Kasus
: Kota Pekanbaru). Prosiding Seminar Nasional Teknologi Informasi, Komunikasi, dan Industri (SNTIKI) 7.
[3]. Dewi K.N.A., Bhari S., dan Irwansyah. 2019. Model Prediksi Curah Hujan Harian Menggunakan Jaringan
Syaraf Tiruan Backpropagation. Indonesia Physical Review. 2(1).

The 4th International Seminar on Sensors, Instrumentation, Measurement and Metrology
105
057-ISSIMM2019
Simple I-V Acquisition Module with High Side Current Sensing
Principle for Real Time Photovoltaic Measurement
Eri Wiyadia
, Agustina Watib
, Yanuar Hamzahc, Lazuardi Umar
d
Department of Physics FMIPA Universitas Riau, Pekanbaru [email protected],
(corresponding author)
Keywords: INA-219 sensor, high-side current sensing, linearity, PV
module
ABSTRACT. This work presents a data acquisition module for measurement of I-V of PV module based on
INA219 sensor Adafruit integrated with the Atmega328 Microcontroller. The module has ability to
measure a high degree of precision for DC current and equipped with software interface as a data logger
display. The sensor works based on the principle of high side currents sensing consists of sense and load
resistor to accommodate 4 sensors of 3 Amps in the maximum voltage range up to 26V. The measurement
in real-time is performed in graphical form using visual studio software. Calibration and linearity tests
result an error of
0.659% and 0.572% for currents and voltages respectively. The result of linearity test shows a value
of
R = 0.99 for current and voltage of PV module compare to the
calibrator.
Figure 1. Block diagram of a PV module monitoring system References
[1] A. H. Sabry, W. Z. W. Hasan, M. Amran, M. Radzi, and S. Shafie, “Wireless Monitoring Prototype for
Photovoltaic Parameters Wireless Monitoring Prototype for Photovoltaic Parameters,” no. July, pp. 9-17,
2018.
[2] A. Gupta, R. Jain, and R. Joshi, “Real Time Remote Solar Monitoring System,” vol. 3008, 2017.
[3] J. Mathew and G. Vincent, “Point Estimation of Solar Photovoltaic Array,” pp. 1–4, 2016.
[4] M. R. Fachri, I. D. Sara, Y. Away, M. R. Fachri, I. D. Sara, and Y. Away, “Jurnal Rekayasa Elektrika
Arduino secara Real Time,” vol. 11, no. 4, 2015.

The 4th International Seminar on Sensors, Instrumentation, Measurement and Metrology
106
058-ISSIMM2019
Developtment Of LVDT (Linear Variable Differential Transformer)
Sensor as Land Displacement Sensor
Wilson Jefriyanto1, a, Bergita Gela M. Saka2,b, Martina Pineng3,c
and Mitra Djamal4,d 1,2Physics Department of UKI Toraja, Indonesia 3Electrical Engineering Department of UKI Toraja, Indonesia 4Physics Department of Institut Teknologi Bandung, Indonesia [email protected] (corresponding author), [email protected], [email protected], [email protected] Keywords: Landslides, Land displacement, LVDT, Sensor. ABSTRACT. In mitigation, one of the sensors used is the sensor to observe the movement of land in anticipating of landslide that is occur in Indonesia. In this research has been developed Linear Variable Differential Transformer (LVDT) sensor that is a position sensor to serve as land displacement sensor. The development of LVDT sensor has been developed and has started to be produced in prototype, but the price is expensive, therefore in this research used the material that is affordable so that the price is cheaper. This LVDT sensor has the smallest scale specification is 0.1 mm with measurement range up to 140 mm. For testing of this sensor by making experimental simulations using a container measuring. The container is tilted to an angle with varying angle of 400, 450 and 500. The results of land displacement experiments at angles of 400, 450 and 500 are 5.5 mm, 27.6 mm and 28.3 mm. From this data shows the angle of the ground is directly proportional to the magnitude of landslides.
Figure 1. Prototype of LVDT Sensor
References [4] Banerjee, K., Dam, B., dan Majumdar, K., (2013) :A Novel FPGA-based LVDT signal conditioner.
IEEE, International Symposium on Industrial Electronics”, ISIE ,(1-6). [5] Boll, R., and Overshott, K..J. (1991) : Sensors A Comprehensive Survey. Volume5. W.Gopel, J.
Hesse ,J. N. Zemel. [6] Chen, G., Zhang, B., Liu, P., dan Ding, H. (2015) : An adaptive analog circuit for LVDTs
nanometer measurement without losing sensitivity and range,” IEEE Sensors Journal, vol. 15, no. 4.
[7] Federico, A., Popescu, M., Fidelibus, C., Interno, G. (2004) : On the prediction of the time of occurrence of a slope failure: A review. Proc. 9th Int. Symp. Landslides, vol. 2, (979–983).
[8] Ford, R. M. ,Weissbach, R. S., dan Loker, D. R. (2001): A novel DSP based LVDT. signal conditioner. IEEE Transactions on Instrumentation and Measurements, vol. 50 (3).
[9] Hahn, S. Y. (1995) :Advanced Computational and Design Techniques in Applied Electromagnetic Systems. Elsevier Science B.V, ISBN: 9781483290560.
[10] Hikmat (1995) :Studi Awal Sensor LVDT (Linear Variable Differential Transformer). Tesis program magister, Institut Teknologi Bandung.
[11] Jefriyanto, W., Hikmah, U., Sektiono., M. W.A., Lestar, R., Anwar, Z., dan Hendro (2017) : Rancang Bangun Neraca Digital Untuk Mengetahui Massa Material Penyusun Alloy. Prosiding Seminar Kontribusi Fisika (457-464).

The 4th International Seminar on Sensors, Instrumentation, Measurement and Metrology
107
[12] Jefriyanto, W., Silka, Djamal, M., Analisis Pergeseran Tanah dengan Menggunakan Sensor Kelembaban Tanah Berbasis Arduino Uno. Prosiding SNIPS 2018 (529-534).
[13] Kapoor, S., Pahuja, H., Singh, B.,(2016):Real Time Monitoring & Alert System for Landslide.2nd International Conference on Contemporary Computing and Informatics (IC3I) (584 -589). Karnawati, D. (2012) :Development of Socio-Technical Approach for Landslide Mitigation and Risk Reduction Program in Indonesia.World Academy of Science: Engineering and Technology (34-53).
[14] Masi , A., Danzeca, S., Losito, R., Peronnard, P., Secondo, R., dan Spiezia, G. (2014) : A high precision radiation- tolerant LVDT signal conditioning module. Nuclear Instruments and methods in Physics Research A. 745 (73-81).
[15] Nuhn, E., Kropat, E., Reinhardt W., dan Pickl, S. (2012): Preparation of Complex Landslide Simulation Results with Clustering Approaches for Decision Support and Early Warning. 45th Hawaii International Conference on System Sciences (34).
[16] Othman, A. M.(2008): Design of Economical Equipment for Water and Fuel Level Detection in Jordan. American Journal of Applied Sciences 5, (473– 478)
[17] Park, Y.T., Shin, F.K., Jang, W.B., Jang, W.B., Jeong, Y.H., dan Jang, S.M. (1995): The Analysis on The Performance Characteristics for Design of a Linear Variable Differential Transformer (LVDT). Elsevier Studies in Applied Electromagnetics in Materials , Vol. 6, (345-348).
[18] Priyanto, J., Subagiyo, H., dan Madona, P., (2015): Sistem Instrumentasi dan Monitoring Pergeseran Tanah Menggunakan Sensor LVDT BerbasisMikrokontroler.Proceeding of 3rd Applied Business and Engineering Conference (ABEC), (810-816) Batam.
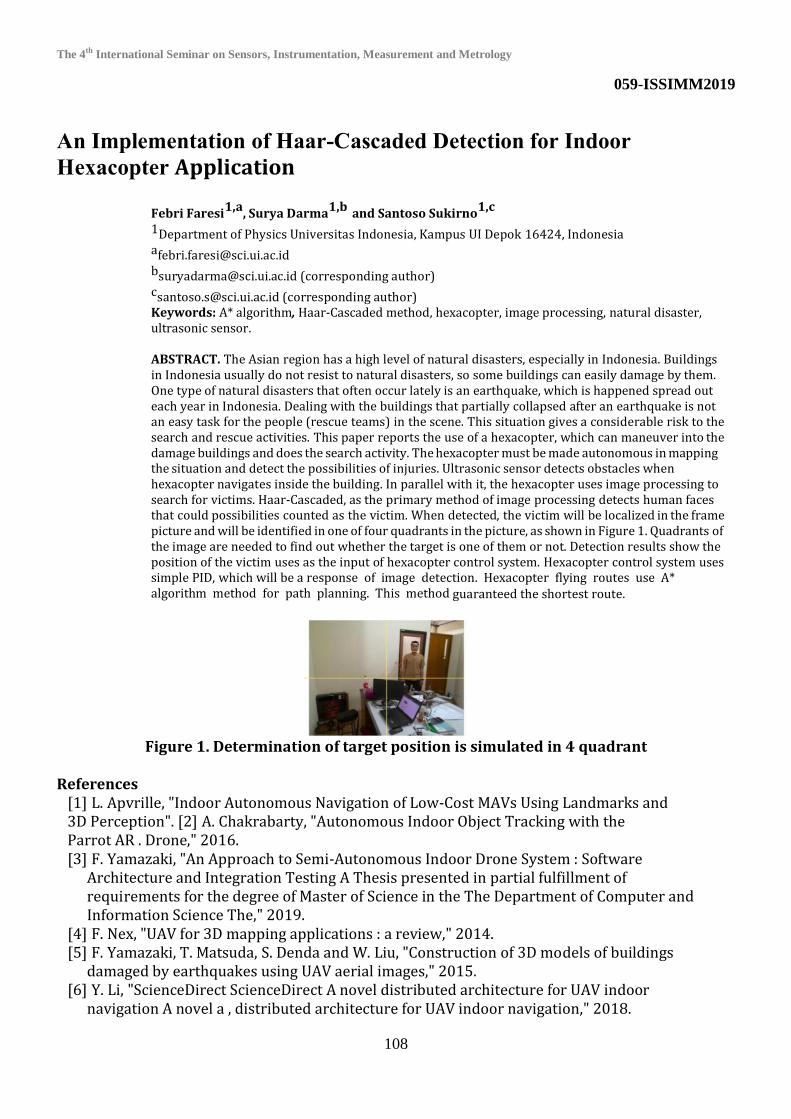
The 4th International Seminar on Sensors, Instrumentation, Measurement and Metrology
108
059-ISSIMM2019
An Implementation of Haar-Cascaded Detection for Indoor
Hexacopter Application
Febri Faresi1,a
, Surya Darma1,b
and Santoso Sukirno1,c
1Department of Physics Universitas Indonesia, Kampus UI Depok 16424, Indonesia [email protected] [email protected] (corresponding author) [email protected] (corresponding author) Keywords: A* algorithm, Haar-Cascaded method, hexacopter, image processing, natural disaster, ultrasonic sensor. ABSTRACT. The Asian region has a high level of natural disasters, especially in Indonesia. Buildings in Indonesia usually do not resist to natural disasters, so some buildings can easily damage by them. One type of natural disasters that often occur lately is an earthquake, which is happened spread out each year in Indonesia. Dealing with the buildings that partially collapsed after an earthquake is not an easy task for the people (rescue teams) in the scene. This situation gives a considerable risk to the search and rescue activities. This paper reports the use of a hexacopter, which can maneuver into the damage buildings and does the search activity. The hexacopter must be made autonomous in mapping the situation and detect the possibilities of injuries. Ultrasonic sensor detects obstacles when hexacopter navigates inside the building. In parallel with it, the hexacopter uses image processing to search for victims. Haar-Cascaded, as the primary method of image processing detects human faces that could possibilities counted as the victim. When detected, the victim will be localized in the frame picture and will be identified in one of four quadrants in the picture, as shown in Figure 1. Quadrants of the image are needed to find out whether the target is one of them or not. Detection results show the position of the victim uses as the input of hexacopter control system. Hexacopter control system uses simple PID, which will be a response of image detection. Hexacopter flying routes use A* algorithm method for path planning. This method guaranteed the shortest route.
Figure 1. Determination of target position is simulated in 4 quadrant
References
[1] L. Apvrille, "Indoor Autonomous Navigation of Low-Cost MAVs Using Landmarks and 3D Perception". [2] A. Chakrabarty, "Autonomous Indoor Object Tracking with the Parrot AR . Drone," 2016. [3] F. Yamazaki, "An Approach to Semi-Autonomous Indoor Drone System : Software
Architecture and Integration Testing A Thesis presented in partial fulfillment of requirements for the degree of Master of Science in the The Department of Computer and Information Science The," 2019.
[4] F. Nex, "UAV for 3D mapping applications : a review," 2014. [5] F. Yamazaki, T. Matsuda, S. Denda and W. Liu, "Construction of 3D models of buildings
damaged by earthquakes using UAV aerial images," 2015. [6] Y. Li, "ScienceDirect ScienceDirect A novel distributed architecture for UAV indoor
navigation A novel a , distributed architecture for UAV indoor navigation," 2018.

The 4th International Seminar on Sensors, Instrumentation, Measurement and Metrology
109
[7] F. Li, S. Zlatanova, M. Koopman, X. Bai and A. Diakité, "Universal path planning for an indoor drone," Automation in Construction, vol. 95, no. July, pp. 275-283, 2018.

The 4th International Seminar on Sensors, Instrumentation, Measurement and Metrology
110
060-ISSIMM2019
The Influence of Particle Size to Diffusivity of Nanogold Particles
Based on Brownian Motion
Zulfahmi1,a, Djati Handoko1,b, Prawito Prajitno1,c and Isnaeni2,d
1Department of Physics, Universitas Indonesia, Indonesia 2Research Center for Physics, Indonesian Institute of Sciences, Indonesia [email protected], [email protected], [email protected] (corresponding author), [email protected] Keywords: brownian motion, diffusivity, image processing, nanogold. ABSTRACT. Diffusivity calculation has been conducted by many researchers in various methods. One ingenious and sample-efficient way to determine the diffusivity is the examination under the microscope by using microbead random movements, called Brownian motion, through the footage of its movements. This study was conducted to observe the diffusivity of nanogold particles towards the use of various microbead sizes. The one-micron-sized microbead was mixed into nanogold particles solution and prepared onto slide glass, so was the three micron-sized and five-micron-sized microbead. The footage of microbead movements for each size then was tracked and processed using MATLAB image processing to obtain the mean square displacement (MSD) of the microbead and then fitting it to time to find the sample diffusivity. As a result, the nanogold diffusivity observed using one-micron-sized microbead is greater than three-micron and five-micron-sized microbead, which can be concluded that the bigger of microbead size used, the smaller diffusivity obtained.
Figure 1. One micron-sized microbead particle tracking and fitting data
References [19] R. C. Gonzalez, R. E. Woods, & S. L. Eddins. “Digital Image Processing Using MATLAB (Second
Edition)”. Gatesmark Publishing. 2009. [20] S.H. Lee, S.Y. Park, et al. “Diffusivity control of magnetic cube-particle chain by external
magnetic field” ResearchGate. 2017. Applied Physics Letters 111, 132401. [21] A. Statsenko, W. Inami, Y. Kawata. “Measurement of viscosity of liquids using optical
tweezers”. Elsevier. 2017. Optics Communications 402, 9–13. [22] L. Soedarmawan, A. Hifzhi, et al, “An Enhanced Laser Beam Deflection Measurement System
for Refractive Index Gradient and Diffusivity”, 2017 International Seminar on Sensors, Instrumentation, Measurement and Metrology (ISSIMM), 2017

The 4th International Seminar on Sensors, Instrumentation, Measurement and Metrology
111
061-ISSIMM2019
Development of ECG Sensor using Arduino Uno and E-Health Sensor Platform: Mood Detection from Heartbeat
Lantana Dioren Rumpa1,a
, Sallolo Suluh2,b
and Irene Hendrika Ramopoly3,c
1Teknik Elektro Universitas Kristen Indonesia Toraja, Indonesia 2Teknik Mesin Universitas Kristen Indonesia Toraja, Indonesia 3PGSD Universitas Kristen Indonesia Toraja, Indonesia [email protected], [email protected], [email protected] Keywords: Heartbeat, ECG, Arduino Uno, Mood Detection, E-Health Sensor
Platform
ABSTRACT. Many researcher said that emotion or mood can be detected from physiological
changes like the heartbeat. In order to measure human heart activity, we were using tools like
Electrocardiograph. The changes on human emotion or mood affect physiology. This paper is part
of our research that talked about Analysis of Mood State from Heart Signal during Playing Flappy
Bird. In this paper, we will explain how we design ECG tools that could measure or detect the human
heartbeat especially that affect by mood changes. E-Health Sensor Platform v2.0 and Arduino Uno
were used to build this system. E- Health Sensor Platform v2.0 contains several sensors that can
measure the biological state of humans such as heart rate, breathing, skin conductance and many
others. This device can operate when connected with Arduino Uno as a microcontroller. Arduino uno
role as a liaison between the Platform and the PC via a serial port. We were using C programming
languange on Arduino Uno.
400 Hz were sett in programming code so we can read all data from ECG sensor clearly. To
visualize the heartbeat signals we were using KSTPlot. This system has successfully read the heart
signals of 20 participants. Although there is signal noise but it does not affect the data. The noise
can also be removed with a filter.In our next study, the raw data will be analyzed using the HRV
method, but this will be discussed in another paper.
Figure 1. ECG System (Left), Heartbeat Signal (Right
References [1]. R. T. Hameed, O. A. Mohamad, and N. Tapus, “Health monitoring system based on wearable
sensors and cloud platform,” in 2016 20th International Conference on System Theory, Control and Computing (ICSTCC), Sinaia, Romania, 2016, pp. 543–548.
[2]. K. H. Kim, S. W. Bang, and S. R. Kim, “Emotion recognition system using short-term monitoring of physiological signals,” Medical and biological engineering and computing, vol. 42, no. 3, pp. 419– 427, 2004.

The 4th International Seminar on Sensors, Instrumentation, Measurement and Metrology
112
[3]. K. S. Quigley, K. A. Lindquist, and L. F. Barrett, Inducing and measuring emotion and affect: Tips, tricks, and secrets. Handbook of research methods in social and personality psychology. New York: Cambridge University Press, 2014.
[4]. L. D. Rumpa, A. D. Wibawa, M. H. Purnomo, and H. Tulak, “Validating video stimulus for eliciting human emotion: A preliminary study for e-health monitoring system,” pp. 208–213, Nov. 2015. [5]. K. Saleem, H. Abbas, J. Al-Muhtadi, M. A. Orgun, R. Shankaran, and G. Zhang, “Empirical Studies of ECG Multiple Fiducial-Points Based Binary Sequence Generation (MFBSG) Algorithm in E-Health Sensor Platform,” in 2016 IEEE 41st Conference on Local Computer Networks Workshops (LCN Workshops), Dubai, 2016, pp. 236–240. [6]. O. Yakut, S. Solak, and E. D. Bolat, “Measuring ECG Signal Using e-Health Sensor Platform,” p. 5, 2014.

The 4th International Seminar on Sensors, Instrumentation, Measurement and Metrology
113
062-ISSIMM2019
Blown Fiber Technology for Out Site Plan Network Deployment in
Apartments Project
Sri Priyo Hutomo1, a
, Gunawan Wibisono 2,b
1
Postgraduate Program of Telecommunication Management, Indonesia 2
Department of Electrical Engineering, Indonesia 3
Indonesia University a
[email protected] Keywords: blown fiber, flexible design, micro duct, outside plan, the blowing apparatus, vertical
residential
ABSTRACT.The current deployment of optical fiber networks in several major cities in
Indonesia is intensive. Development of fiber as the backbone or last mile for special services and
almost all of us have encountered. Maybe one of them is a network deployment studio in one of the
Apartment Projects in Depok City. The population of Depok reaches 4% per year higher than the
national growth, the number of students and students who reach more than 80 thousand who live in
Depok from only 2 campuses namely the University of Indonesia and Gunadarma University make the
residential business growth both in the form of residential horizontal (boarding rooms) ) or vertical
residential (Apartment). Developers are competing to build Apartments which, of course, are
potential new revenue and new markets for Internet & Pay-TV Providers. The problem of the length
of time the deployment of network infrastructure, traffic is not taken into account and still
prioritizes the quality and cost that remains efficient become an issue of concern to the Provider.
Blown Fiber is a new technology with four main components namely products, blowing devices,
optical fiber bundles, and terminating/connecting hardware. This technology results in more cost-
efficient, more flexible designs, better work costs in installation, termination and cheaper testing
compared to conventional optical fiber deployment technology. The implementation of Blown Fiber
in a deploying studio in one of the Apartments in Depok specifically on the Out Site Plan (OSP) turned
out to provide convenience and acceleration in terms of network deployment.
References
[1] G. Keiser, Optical Fiber Communication, j,d ed., McGraw-Hill, New York,USA
2000. [2] David F. Edwards, “Silicon (Si)” in Handbook of optical constants of solids, E.D. Palik, ed.
(Academic, Orlando, Fla. 1985). [3] A.A.A. Bakar, M.Z. Jamaludin, F. Abdullah, M.H. Yaacob, M.A. Mahdi, and M.K. Abdullah, “A
new technique of real-time monitoring of fiber optic cable networks transmission,” Optics and Lasers in Engineering,vol. 45, pp. 126-130, 2007
[4] www.sterlitetech.com [5] F. Ladouceur and J. D. Love, Silica-based buried channel waveguides and devices (Chapman &
Hall, 1995), Chap.8.
[6] www.sumitomoelectric.com

The 4th International Seminar on Sensors, Instrumentation, Measurement and Metrology
114
063-ISSIMM2019
Examination System of Chicken Meat Quality Based on
Hyperspectral Imaging
*Engrid Latifa Noferita Kaswati1, a, Adhi Harmoko Saputro2,b, Cuk Imawan3,c
1Department of Physics, Faculty of Mathematics and Natural Sciences, Universitas Indonesia, Depok, Indonesia 2 Department of Physics, Faculty of Mathematics and Natural Sciences, Universitas Indonesia, Depok, Indonesia 3 Department of Physics, Faculty of Mathematics and Natural Sciences, Universitas Indonesia, Depok, Indonesia [email protected], [email protected], [email protected] Keywords: Chicken meat, pH, VNIR, RF (Random Forest), PLSR (Partial Least Square Regression). ABSTRACT. The freshness of the chicken meat will be degraded due to microbiological and chemical
processes and will affect the quality of the chicken's meat. Measurements of freshness was done by
laboratory test that usually destructively and takes a long time. In this study, a VNIR imaging system
was built with a wavelength range of 400-1000 nm to determine the freshness of broiler chicken meat.
The freshness of the chicken meat was analyzed by using organoleptic and pH measurement approach.
Classification using Random Forest (RF) modelling has been developed to predict the freshness of
chicken meat. The freshness of chicken meat was evaluated by using the correction value of 85.5%. The
Partial Least Square Regression (PLSR) algorithm was successfully used to determine the pH. The pH
measurement system for fresh chicken meat was evaluated using correlation coefficient 0.80 and
RMSE 0.16. Meanwhile for the spoiled chicken meat, pH was measured using correlation coefficient of
0.84 and RMSE of 0.18. Both classification and regression methods indicate that this measurement
system is effective for predicting the quality of chicken meat.
Figure 1. Averaged Spectral Profiles of the Fresh and the Unfresh Chicken Meat
References [1] ElMasry, G. M. and Nakauchi, S. (2016) ‘Image analysis operations applied to hyperspectral
images for non-invasive sensing of food quality - A comprehensive review’, Biosystems Engineering. Elsevier Ltd, 142, pp. 53–82.
[2] Huang, H., Liu, L. and Ngadi, M. O. (2014) ‘Recent developments in hyperspectral imaging for assessment of food quality and safety’, Sensors (Basel, Switzerland), 14(4), pp. 7248–7276.

The 4th International Seminar on Sensors, Instrumentation, Measurement and Metrology
115
064-ISSIMM2019
Measurement And Analysis Of The Impact Of Air Quality Because
Co And No2 By Pollutants From Motor Vehicles On The Road Of
Margonda Raya Around The Balaikota Depok
H.A Larasari.1
, S. Sukirno2
1Department of Physics, Faculty of Mathematics and Natural Sciences (FMIPA), University of Indonesia, Indonesia 2Instrumentation, STMKG, Indonesia aCorresponding author: [email protected] Keywords: Air Quality, CO, NO2, Pollutants,
Impacts, Depok. Abstract: The biggest ambient air parameters produced from this transportation are Carbon Monoxide
(CO) and Nitrogen Dioxide (NO2). CO gas or carbon monoxide is a gas that can release living things
including humans. This CO gas will divert the binding of oxygen to the blood because CO is easier to flow blood to oxygen and other gases. NO2 levels in urban air are usually 10-100 times higher than rural air. Based on data from the Central Statistics Agency (BPS) in 2019, the current population of Depok City has jumped to 2,254,513 people. Air quality analysis is important for knowledge because this information is a pollutant in the Depok area. One of the means of transportation is transportation vehicles. Transition vehicles have. The natural environment that supports the lives of people is increasingly threatened by its quality, increasing from air pollution from transitional vehicles. Ground transportation activity is one of the biggest causes in ambient air quality in a city. The number of vehicles obtained after calculating the traffic on selected road sections is on Jalan Margonda Raya that passes through Depok City Hall. The research conducted in Depok City was considered not to have had any previous research done. In this study, monitoring of air quality on Jalan Margonda Raya through the City Hall of Depok with the parameters of Carbon Monoxide (CO) and Nitrogen Dioxide (NO2). The sensor used is Arduino Mega 2560, SHT11 Sensor, MQ-7 Sensor, MQ-135 Sensor, Wind Direction Sensor, Wind Speed Sensor. Data from the designed tool will then be sent to the cloud server which will then be collected in the dashboard application. The results will be analyzed later for their effects on weather parameters and their impact on community art.
References
[1] Decree of the Minister of Environment Number: KEP-45 / MENLH / 10/1997 Concerning the Standards Index Air Pollution. [2] DIY Governor Regulation Number 8 of 2010 concerning the Blue Sky program in 2009-2013. [3] Law of the Republic of Indonesia Number 32 Year 2009. [4] Government Regulation No. 41 of 1999 concerning Air Pollution Control.

The 4th International Seminar on Sensors, Instrumentation, Measurement and Metrology
116
065-ISSIMM2019
Automatic Take-off Landing Quadcopter Control on Dynamics
Platform
Akmal Dutasatria* , and Surya Darma
Department of Physics, FMIPA Universitas Indonesia, Kampus UI Depok,
Depok 16424, Indonesia
Department of Physics, FMIPA Universitas Indonesia, Kampus UI Depok,
Depok 16424, Indonesia
[email protected] , [email protected] (corresponding author) Keywords: SAR, UAV, Take-off & Landing, Visual Servoing, Quadrocopter, Yolo v3, PID ABSTRACT. SAR (Search and Rescue) become an interesting topic discussed worldwide because of its urgency to save humans life. Recent natural disaster in Palu, Central Sulawesi Indonesia demonstrates the lack of mobility which can cause a problem for the SAR team reaching the victim within the isolated area. Uneasy job for the SAR team become more challenging in time response and in finding and saving disaster victims. Consider the fact, there is a need to develop more efficient and effective way to search and rescue the survivors. The using of Quadcopter can answer the problems. Unfortunately the Quadcopter still conventionally controlled by a remote and further it has to be on static ground whenever its take off or landing. This paper reports a Quadcopter fitted with dynamical autonomous take off and landing systems. Thus it can carry out the advantage from a tactical SAR vehicles or other moving platforms. Using object detection approach, The navigation system in an image-based quadcopter or called visual servoing is the use of machine vision as a control of the closed loop position for movement. Images can be detected using YOLO v3 Real Time Object Detectora, and tracks it by estimating the motion of objects in successive video frames. By using 3D reconstruction the distance and position of the designated target and the quadcopter could be determined. Then the estimation of the relative position of the object is used as input for the control system on the quadcopter using PID controller. The controller commands the quadcopter to approach the target, while the image processing checks the relative position between the two. If the position satisfies the minimum landing parameter, then the controller commands a landing. While for take off we implement the controller to maintain its equilibrium and sufficient power to throttle.
References [1] Chakrabarty, Anjan. Dkk. (2016). Autonomous Indoor Object Tracking with the Parrot AR. Drone.
International Conference on Unmanned Aircraft Systems (ICUAS), Arlington, USA. [2] Bartak, Roman and Adam Vyskovsky (2015). Any Object Tracking and Following by a Flying
Drone. 14th Mexican Internationa Conference on Artificial Intelligence, Mexico. [3] Razinlova, Anastasia and Hyun-Chan Cho (2015). Tracking a Moving Ground Object Using
Quadcopter UAV in a Presence of Noise. IEEE International Conference on Advanced Intelligent Mechtronics AIM, Busan, Korea.

The 4th International Seminar on Sensors, Instrumentation, Measurement and Metrology
117
[4] Lee, Daewon, Tyler Ryan, and H. Jin. Kim (2012). Autonomous Landing of a VTOL UAV on a Moving Platform Using Image-based Visual Servoing. IEEE International Conference on Robotics and Automation, Minnesota, USA.
[5] Yang, Yan Dkk. (2015). An Improved Mean Shift Object Tracking Algorithm Based on ORB Feature Matching. 27th Chinese Control and Decision Conference, Qingdao, China.
[6] Baheti, Bhakti, Ujjwal Baid, and Sanjay Talbar (2016). An Approach to Automatic Object Tracking System by Combination of SIFT and RANSAC with Mean Shift and KLT. Conference on Advance in Signal Processing (CASP), Pune, India.
[7] Jabar, Falah, Sajad Farokhi, and U.U. Sheikh (2015). Object Tracking Using SIFT and KLT Tracker for UAV-based Application. IEEE International Symposium on Robotics and Intelligent Sensors, Langkawi, Malaysia.

The 4th International Seminar on Sensors, Instrumentation, Measurement and Metrology
118
066-ISSIMM2019
Detecting the Burned Area in Southern Kalimantan by Using the
Sentinel-1 Polarimetric SAR and Landsat-8 OLI Optic
Indah Prasasti1,a, Suwarsono1,3, Khalifah Insan Nur Rahmi1
Jalu Tejo Nugroho1, Jansen Sitorus1, Rahmat Arief2, and Djoko Triyono3 1Remote Sensing Application Center – LAPAN, Indonesia 2Remote Sensing Technology and Data Center – LAPAN, Indonesia 3Department of Physics, Faculty of Mathematics and Natural Sciences, Universitas Indonesia [email protected] Keywords: Synthetic Aperture Radar (SAR), backscatter, forest fire, Normalized Burn Ratio (NBR), Southern Kalimantan ABSTRACT. Synthetic Aperture Radar (SAR) imageries data have turned out to be one of the essential sources for forest fire mapping, esspecially in tropical region since the smoke haze obstruct data acquisition by optical sensor. Despite these limitations, until now, the use of optical sensors still dominates in monitoring forest and land fires in the world. The Sentinel-1 satellites presently offer unreservedly accessible and freely available, world coverage and fast recurrent time (6–12 days), gives Sentinel-1 images the possibility to be broadly utilized for observing the Earth's surface, including forest and land fire phenomenon. However, the use of sentinel-1 data for monitoring and mapping forest and land fires in the tropics of Indonesia, is still limited and has not been widely implemented. This study investigated the use of Sentinel-1, synergy with optical Landsat-8 OLI (Operational Land Imager) data, to identify the burned area, in the tropical region of Indonesia, during 2019 fire season. A pair of Landsat-8 OLI, collected before and after fires, has been used to delineate the boundaries of sampel location of burned area. Then, the difference of reflectance and Normalized Burn Ratio were analyzed. A series of Sentinel-1 images, collected before and during/after fires, has been utilized to produce the backscatter values among images. Fire incident causes landcover changes from vegetated land to bareland. This changes can affect the reflectance detected from Landsat-8 OLI. This changes also affect the backscatter detected from SAR sensor. Then analysis of SAR backscatter on the location of the burned area detected from Landsat-8 was perfomed. The synergy between SAR polarimetric and optical reflected data, creates a valuable tool for identifying and interpreting burned area following a fire event.
August 14, 2019 October 17, 2019
Figure 1. Landsat-8 imageries, before and after 2019 peak fire in Southern Kalimantan

The 4th International Seminar on Sensors, Instrumentation, Measurement and Metrology
119
References [3] J.R. Irons, J.L. Dwyer, and J.A. Barsi, “The next Landsat satellite: The Landsat Data Continuity
Mission,” Remote Sensing of Environment, vol.122, pp. 11-21, 2012. [4] S. Periasamy, “Significance of dual polarimetric synthetic aperture radar in biomass retrieval:
An attempt on Sentinel-1, Remote Sensing of Environment, vol 217, pp. 537-549, 2018. [5] R. Torres, P. Snoeij, D. Geudtner et al., “GMES Sentinel-1 mission,” Remote Sensing of
Environment, vol. 120, pp. 9–24, 2012. [6] K. Zanter (Ed), Landsat 8 (L8) Data Users Handbook, Version 1, Sioux Falls, South Dakota:
Department of the Interior, U.S. Geological Survey, 2015. [7] P.S. Chavez Jr.,”An Improved Dark-Object Subtraction Technique for Atmospheric Scattering
Correction of Multispectral Data,” Remote Sensing of Environment, vol. 24, pp. 459–79, 1988). [8] Y.J. Kaufman, and L.A. Remer,”Detection of Forests using Mid-IR Reflectance: An Application
for Aerosol Studies, IEEE Transactions on Geoscience and Remote Sensing, vol. 32, pp. 672-683, 1994.
[9] C.H. Key, and N.C. Benson,”Measuring and Remote Sensing of Burn Severity, U.S. Geological Survey wildland fire workshop, 2002.
[10] A. Bastarika, E. Chuvieco, & Martin,”Mapping burned areas from Landsat TM/ETM+ data with a two-phase algorithm:Balancing omission and commission errors, Remote Sensing of Environment, vol. 115, pp. 1003-1012, 2011.

The 4th International Seminar on Sensors, Instrumentation, Measurement and Metrology
120
067-ISSIMM2019
Parasitic Resistance Calculation of PV Module at Various Irradiance
Based on Three Condition Lambert-W
Lazuardi Umara
, Eri Wiyadib
, Agustina Watic
Yanuar Hamzahd
Department of Physics FMIPA Universitas Riau, Pekanbaru Riau a
(corresponding author), b
[email protected] Keywords: Irradiance, Lambert-W, parasitic resistance,
photovoltaic.
ABSTRACT. Changing conditions of sunlight irradiance and degradation of solar cell due to ageing will
produce fluctuations in the output of solar cell modules during operation. Characterization of
photovoltaic module (PV) using direct sun light is relatively difficult to get constant irradiance. In
this work, PV module is characterized at various levels of direct irradiance from the sun to obtain
parasitic serial resistance (Rs) and shunt values (Rsh). The parasitic resistances of PV module
alter after a long period of operation. A monocrystalline Solarland SLP100S-12 photovoltaic
module of 100Wp was illuminated by direct irradiance of sunlight with various intensities of
0% (unfiltered), 25%, 50% and 75% using a filter that covers the surface of the PV module. The I-
V curves obtained were then modeled after Lambert-W function based on three calculation
conditions: short circuit current (Isc), open circuit voltage (Voc), and also current and voltage at the
Maximum Power Point (Imp, Vmp). The results give Rs values of 0.66 , 0.65 , 0.62 and 0.60
respectively, while for Rsh values 92.6 , 92.8 , 93.6 and 93.8 with a deviations of 4.3% and
0.6% for Rs and Rsh. This results show a relative same parasitic resistance values under
various irradiance intensities.
Figure 1. Measurement results of I-V PV modules with direct
illumination
References [1] A. Fajardo Jaimes and F. Rangel de Sousa, “Simple modeling of photovoltaic solar cells for indoor
harvesting applications,” Sol. Energy, vol. 157, no. 5, pp. 792–802, 2017. [2] F. Zaoui, A. Titaouine, M. Becherif, M. Emziane, and A. Aboubou, “A Combined Experimental
and Simulation Study on the Effects of Irradiance and Temperature on Photovoltaic Modules,” Energy Procedia, vol. 75, pp. 373–380, 2015.

The 4th International Seminar on Sensors, Instrumentation, Measurement and Metrology
121
[3] M. D. Yandt, J. P. D. Cook, M. Kelly, H. Schriemer, and K. Hinzer, “ Dynamic Real-Time I–V Curve Measurement System for Indoor/Outdoor Characterization of Photovoltaic Cells and Modules ,” IEEE J. Photovoltaics, vol. 5, no. 1, pp. 337–343, 2014.
[4] I. Chatzigeorgiou, “Bounds on the lambert function and their application to the outage analysis of user cooperation,” IEEE Commun. Lett., vol. 17, no. 8, pp. 1505–1508, 2013.
[5] C. Huang and L. Wang, “Simulation study on the degradation process of photovoltaic modules,” Energy Convers. Manag., vol. 165, no. March, pp. 236–243, 2018.

The 4th International Seminar on Sensors, Instrumentation, Measurement and Metrology
122
069-ISSIMM2019
The pH Measurement Based on Color Image Sensors Using
Convolutional Neural Network Modeling
Dian Wulan Hastuti1, a, Marlina Harahap1, b, Cuk Imawan1, c and Adhi Harmoko Saputro1, d
1Departmen of Physics, Universitas Indonesia, Indonesia [email protected], [email protected], c [email protected] (corresponding author), [email protected] Keywords: CNN, Colorimetric, pH, Brassica oleraceae ABSTRACT. pH is an important unit to represent the chemical condition of a liquid, solid substance, food nutrition, and microbial activity as well. pH is also commonly used to detect the behavior of chemical substances. The pH detection can show any color change based on the acidity condition from a measured environment. The color change can indicate the pH value. In this research, the colorimetric based on neural network and color information detected from the pH value for point-of-care applications. For this investigation, we used the pH buffer solution and natural dyes derived from Brassica oleraceae (Red Cabbage) that showed colorimetric response gradually shifted from red to green along with the increasing of pH from 2 (acid) to 11 (alkaline). In this paper, we propose a method for predicting pH value based on Convolution Neural Network (CNN) regression with RGB and HSV color space. As a result, the accuracy of this method could estimate the pH reasonably well for point-of-care application.
Figure 1. Characterization of Methyl Red Dye
References [11] K. M. Karina, C. M. Napolitano, and S. I. Borrely, "Gamma radiation effects in packaging for
sterilization of health products and their constituent paper and plastic film," Radiat. Phys. Chem., vol. 142, no. October 2016, pp. 23–28, 2018
[12] M. Kerkech, A. Hafiane, and R. Canals, “Deep leaning approach with colorimetric spaces and vegetation indices for vine diseases detection in UAV images,” Comput. Electron. Agric., vol. 155, no. October, pp. 237–243, 2018.
[13] T. Kong et al., “Accessory-free quantitative smartphone imaging of colorimetric paper-based assays,” Lab Chip, vol. 19, no. 11, pp. 1991–1999, 2019.
[14] Y. Chen, Y. Zilberman, P. Mostafalu, and S. R. Sonkusale, “Paper based platform for colorimetric sensing of dissolved NH3 and CO2,” Biosens. Bioelectron., vol. 67, pp. 477–484, 2015.
[15] P. T. Wang, J. J. Chou, and C. W. Tseng, “Colorimetric characterization of color image sensors based on convolutional neural network modeling,” Sensors Mater., vol. 31, no. 5, pp. 1513–1522, 2019.
The 4th International Seminar on Sensors, Instrumentation, Measurement and Metrology
123
070-ISSIMM2019
Non galvanis measurement of partial discharge using antenna
boutique. 1*Eka Putra Waldi, 1Asri Indah Lestari, 1Yovan Madina Fumasa, 1Rudy Fernandes, 1Hanalde
Andre, 1Primas Emeraldi, 1Aulia, 1Ariadi Hazmi, 2Yoshinobu Murakami, 2Naohiro Hozumi
1Department of Electrical Engineering, Fakulty of Engineering, Universitas AndalasKampus Limau
Manis, Padang, West Sumatra 25163INDONESIA, 2Electrical and Electronic Information Engineering, Toyohashi University of Technology 1-1
Hibarigaoka, Tempaku, Toyohashi, Aichi Prefecture 441-8580, JAPAN.
*Coresponding autohor, e-mail: [email protected]
Keywords: Partial discharge, Corona, Bowtie Antenna ABSTRACT. Electricity Phenomena produced by corona or partial discharge will result in the propagation of electromagnetic waves into the air. Measurement of this existing phenomena developed to a measurement technique with an antenna known as a Non-galvanic sensor. This paper discusses the sensitivity of bowtie antenna in measuring and detecting the occurred phenomena caused by corona and partial discharge. The measurement result of the antenna-based sensor is compared with the measurement result of a commercial galvanic sensor. The Antenna is connected with the digital Oscilloscope as an acquisition instrument, which has a 50-ohm impedance with a reading sensitivity of up to one millivolt. Even the commercial sensor performs better than the antenna, both phenomena corona and partial discharge can be measured by the antenna-based sensor.[1]–[6]
References [1] H. Andre, P. Emeraldi, A. Hazmi, E. P. Waldi, and U. Khayam, “Long bowtie antenna for partial
discharge sensor in gas-insulated substation,” in International Conference on High Voltage
Engineering and Power Systems, ICHVEPS 2017 - Proceeding, 2017, vol. 2017-Janua.
[2] D. Rodriguez, R. S. Gorur, and P. M. Hansen, “Effect of humidity on the breakdown
characteristics of air in non-uniform fields at 30 kHz,” IEEE Trans. Dielectr. Electr. Insul., vol.
17, no. 1, pp. 45–52, 2010.
[3] P. Wang, A. Cavallini, G. Montanari, and G. Wu, “Effect of rise time on PD pulse features under
repetitive square wave voltages,” IEEE Trans. Dielectr. Electr. Insul., vol. 20, no. 1, pp. 245–
254, 2013.
[4] G. Robles, M. Sanchez-Fernandez, R. Albarracin Sanchez, M. V. Rojas-Moreno, E. Rajo-Iglesias,
and J. M. Martinez-Tarifa, “Antenna parametrization for the detection of partial discharges,”
IEEE Trans. Instrum. Meas., vol. 62, no. 5, pp. 932–941, 2013.
[5] Z. Nawawi et al., “Design and Implementation of Microstrip Patch Ultra-wide Band Antenna
for Detection of UHF Partial Discharge,” IOP Conf. Ser. Mater. Sci. Eng., vol. 602, p. 012001,
2019.
[6] G. Robles and S. A. Boslan, Physics and Mathematics of RadioWave Propagation in Cellular
Wireless Communications, no. 1953. 2014.

The 4th International Seminar on Sensors, Instrumentation, Measurement and Metrology
124
071-ISSIMM2019
Microstrip Slot Antenna Design for Radar Remote Sensing
Application Dinari Nikken Sulastrie Sirin and Eko Tjipto Rahardjo
Departement of Electrical Engineering, Universitas Indonesia, Depok, Indonesia [email protected], [email protected] Keywords: Axial ratio, circular polarization, microstrip slot antenna, radar remote sensing. ABSTRACT. The development of radar remote sensing applications in Indonesia is increasingly being used for environmental monitoring, rainfall estimation, earth and coast observation, or even for disaster mitigation [1, 2]. An antenna with circular polarization, wide bandwidth, good axial ratio, high impedance matching and also high isolation between antenna’s elements, as well as a symmetrical design is needed to support the radar antenna system [3, 4, 5, 6]. The study in this paper is to carried out a design of a microstrip slot antenna for radar remote sensing applications, in the X-band frequency range (7.9 - 8.5 GHz), with good axial ratio.
References
[16] Jaka A. I. Paski, “Pengaruh Asimilasi Data Penginderaan Jauh (Radar dan Satelit) Pada Prediksi Cuaca Numerik untuk Estimasi Curah Hujan”, Jurnal Penginderaan Jauh dan Pengolahan Data Citra Digital, Vol. 14 No. 2, 2017.
[17] Samsul Arifin, “Potensi Pemanfaatan Satelit ALOS-3”, Berita Dirgantara Vol. 16 No. 2, 2015. [18] Cahya E. S et. al., Broadband X-Band Circularly Polarized Microstrip Antenna with Elliptical
Patch RingSlotted for Airborne SAR System, Progress In Electromagnetics Research Symposium – Spring (PIERS), 2017
[19] Rohit Kumar Saini and Santanu Dwari, “A broadband Dual Circularly Polarized Square Slot Antenna”, IEEE Transactions on Antennas and Propagation, 2015.
[20] R.V.S. Ram Krishna and Raj Kumar, “A Dual-Polarized Square Ring Slot Antenna for UWB, Imaging and Radar Applications”, IEEE Antennas and Wireless Propagation Letters, 2016.
[21] Hossam Hamza, Biao Hou, “Design of Trible-Band Dual-Linear Polarized Microstrip Antenna Sub-Array for SAR Application”, 3rd Asia-Psific Conference on Antennas and Propagation, 2014.

The 4th International Seminar on Sensors, Instrumentation, Measurement and Metrology
125
072-ISSIMM2019
Surface Temperature Changes of the Crater of Agung Volcano from
Landsat-8 TIRS during 2017-2018 Eruption
Suwarsono1,3,a, Rokhmatuloh2, Djoko Triyono1, and Muhammad Rokhis Khomarudin3 `1Department of Physics, Faculty of Mathematics and Natural Sciences, Universitas Indonesia 2Department of Geography, Faculty of Mathematics and Natural Sciences, Universitas Indonesia 3Remote Sensing Application Center – LAPAN, Indonesia [email protected] / [email protected] Keywords: Thermal anomaly, Agung Volcano, Landsat-8 TIRS ABSTRACT. This paper described the application of Landsat-8 TIRS (Thermal Infra Red Sensor) to analyze the surface temperature changes of the crater area of Agung volcano during 2017-2018 eruption. Agung volcano is an active stratovolcano located in Bali island. We processed the brightness temperature from channel-10 of Landsat-8 TIRS during 2016-2018 and analyzed the changes. The results of this research showed that the eruptions that occurred during 2017 - 2018 have indicated changes in the surface temperature of the crater. The surface temperature changes of the crater, which can be detected from Landsat-8 TIRS data, can be used as a precursor of an eruption.
Figure 1. Brightness Temperature (in Kelvin) of the Crater of Agung Volcano during April 2013 – August 2019
References [1] J.R. Irons, J.L. Dwyer, and J.A. Barsi, “The next Landsat satellite: The Landsat Data Continuity
Mission,” Remote Sensing of Environment, vol.122, pp. 11-21, 2012. [2] K. Zanter (Ed), Landsat 8 (L8) Data Users Handbook, Version 1, Sioux Falls, South Dakota:
Department of the Interior, U.S. Geological Survey, 2015. [3] R. Wright, L. Flynn, H. Garbeil, A. Harris, and E. Pilger,”MODVOLC: Near-realTime Thermal
Monitoring of Global Volcanism,” Journal of Volcanology and Geothermal Research, vol. 135, pp. 29-49, 2004.
[4] M. Blackett,”Early analysis of Landsat-8 thermal infrared sensor imagery of volcanic activity,” Remote Sensing, vol.6, pp. 2282-2295, 2014.
0.00
5.00
10.00
15.00
20.00
25.00
30.00
35.00
40.00
1 3 5 7 9 11 13 15 17 19 21 23 25 27 29 31 33 35 37 39 41 43 45 47 49 51 53 55 57 59 61
BR
IGH
TNES
S TE
MP
ERA
TUR
E (K
)
PERIOD

The 4th International Seminar on Sensors, Instrumentation, Measurement and Metrology
126
[5] M. Blackett,”An Overview of Infrared Remote Sensing of Volcanic Activity,” Journal of Imaging, vol.3, 13; doi:10.3390/jimaging3020013, 2017
[6] S. Marshak, Essentials of geology. Fourth edition. W.W. Norton & Company Inc. New York, 2013.
[7] T. Kaneko,”Thermal observation of the 1986 eruption of Izu-Oshima volcano (Japan) using Landsat TM data,” Advances in Space Research, vol. 21, pp. 517–20, 1998.
[8] R.S.J. Sparks,”Forecasting volcanic eruptions,” Earth and Planetary Science Letters, vol. 210, pp.1-15. , 2003.
The 4th International Seminar on Sensors, Instrumentation, Measurement and Metrology
127
074-ISSIMM2019
Design and Analysis Of Air Quality Monitoring System PM 10 And
PM 2,5 Integrated With Weather Parameters (A Case Study on
Margonda Raya Street Depok)
R. Simanullang 1,a, S. Soekirno2,b, H.A.Larassari3,c
1,2,3Department of Physics, Faculty of Mathematics and Natural Sciences (FMIPA), University of Indonesia, Indonesia a [email protected], [email protected], c [email protected]
Abstract. Observation of air quality is now very important related to the increasing pollution in Indonesia as a result of the use of motor vehicles, industrial activities, land burning, and others. This triggers the emergence of PM10 and PM2.5 particulate pollutants that is increasing in the atmosphere. One solution to overcome these problems is the design of IoT based PM10 and PM2.5 digital monitoring system that is integrated with parameters of temperature, humidity and wind direction and speed. The design of this system consists of sensor hardware ZH03A, SHT11, and JL-FS2. Data is processed on an ATMega2560-based microcontroller and then sent to the server using the internet so that it can be displayed on website. The information system on the website uses PHP and HTML. The device has been tested with calibration and comparison methods with standard and operational equipment. The result of this study is the device can operate properly and the measuring results are displayed on web in real time to provide air quality information. The relation between particulates PM10 and PM2,5 is directly proportional to air temperature and inversely proportional to humidity.

The 4th International Seminar on Sensors, Instrumentation, Measurement and Metrology
128
075-ISSIMM2019
Development of Landsat/LDCM Data Acquisition System Integration
for Parepare and Rumpin base on Virtual Ground Station In order to
Provide National Intermediate Resolution Remote Sensing Data
Hidayat Gunawan, Wismu Sunarmodo, Nurmajid SetyaSaputra, Ali Syahputra Nasution,
Ayom Widipaminto*)
*) Perekayasa Bidang Teknologi Akuisisi dan Stasiun Bumi Penginderaan Jauh,
Pusat Teknologi dan Data Penginderaan Jauh, Lembaga Penerbangan dan Antariksa Nasional,
Jl. LAPAN No. 70 Pekayon, Pasar Rebo, Jakarta Timur 13710, Indonesia, Telp/Fax. +62 21 87717816
E-mail : [email protected] dan [email protected] Abstract. In order to maintain continuity of remote sensing satellite data to support the National Remote Sensing Data Bank (BDPJN), particularly medium resolution data for agricultural, plantation, forestry and other applications. LAPAN in this case the Center of Remote Sensing Data and Technology needs to build an infrastructure for receiving, processing and managing natural resources remote sensing satellite data (Landsat/LDCM) covering the territory of Indonesia. Therefore Landsat/LDCM data acquisition, processing and cataloging system is built on Lapan
Parepare and Rumpin earth stations to be integrated, facilitated in operation and can be monitored
through an integrated system in accordance with the stages of the process and schedule. Data
acquisition integration includes scheduling process and data acquisition process which can be
monitored through acquisition monitoring system (Lapan Satrac web) and remote desktop monitor
system (web Guacamole). The integration of data processing includes raw-level data processing of
standard-1G/T level products that can be monitored through Landsat data processing and
management system (FarEarth web and Landsat Processor system). The integration of data
cataloging includes merging catalogs of Parepare and Rumpin earth station acquisitions that can
be monitored through the Landsat catalog web-based Landsat/LDCM catalog system. The
development of integration of remote sensing ground stations in Parepare and Rumpin base on
virtual ground station, by using nearly remote, almost automated and nearly real time method, both
in the stage of acquisition, processing and cataloging. So it does not depend entirely on the operator
in the ground station, then more the operational just for monitoring the schedule of acquisition,
processing, data management and reporting.
With a built-in ground station integration system, Landsat/LDCM reception, processing and
cataloging of Landsat / LDCM data is almost remote, nearly automatic and nearly realtime. In
operation the system of acquisition, processing and cataloging Landsat/LDCM data 2x a day/night
and can reach 3 hours speed for each scene to data available in web-catalog and every 16 days for all
scene of Indonesia region. In this case the integration system could be a redundent backup and
compliment of Parepare and Rumpin ground stations in order to provide remote sensing
medium resolution data to support the National Remote Sensing Data Bank.
Keywords: Landsat/LDCM, Virtual Remote Sensing Ground Station, Integration of
Acquisition-Processing-Cataloging Systems, Nearly Remote-almost Automation and nearly realtime.

The 4th International Seminar on Sensors, Instrumentation, Measurement and Metrology
129
076-ISSIMM2019
FPGA based Switching Circuits and Acquisition Module for Electrical
Impedance Tomography
Rizard Renanda Adi Pratomo, Farkhad Ihsan Hariadi, Hasballah Zakaria
School of Electrical Engineering and Informatics, Institut Teknologi Bandung Jln. Ganesha10, Bandung 40132 [email protected], [email protected], [email protected] Device Electrical Impedance Tomography (EIT) is an imaging tool that produces cross-sectional images of an object based on its conductivity distribution. The electrical voltage distribution data, which represents the conductivity distribution, is obtained through a combination of measurements of the voltage values of the electrodes mounted around the object when electrified currents with amplitude and frequency. There are several methods of combining measurements of electrode surface tension values, such as adjacent, opposite, and cross methods. In order to carry out such methods, a switching circuit is required which governs the roles of each electrode, either as a current injection site or a voltage reading. The switching circuit is designed to obtain the control signal of the electrode role of a Field Programmable Gate Array (FPGA.) The voltage data obtained from the switching circuit is acquired by a data acquisition module consisting of signal conditioning circuit, Analog to Digital Converter (ADC), FPGA board, and serial communication device. Before being converted to digital data by ADC, the voltage data is conditioned by the signal conditioning circuit to reduce noise and keep the sampling frequency of the signal satisfying the nyquist frequency and in the ADC input range. The digital data from the ADC is then forwarded to the FPGA board to be processed into peakto-peak value. Once converted to peak-to-peak values, this digital data is transmitted to the computer via a serial communication device to be reconstructed into an EIT image. The FPGA board used in this project is the Altera DE2-70 Cyclone II.

The 4th International Seminar on Sensors, Instrumentation, Measurement and Metrology
130
077-ISSIMM2019
Development of Mechanical Platform for Picosatellite Ground Simulator and Communication Protocol
Brian Reynald, Farkhad Ihsan Hariadi, Yusuf Kurniawan
School of Electrical Engineering and Informatics, Institut Teknologi Bandung Microelectronic Center, Institut Teknologi Bandung Jln. Ganesha10, Bandung 40132 [email protected], [email protected], [email protected] Pikosatelit is one type of satellite with a small size and has a maximum mass of 1 kg. In developed countries, the role of universities and research institutes in the development of pikosatelit very large. Unfortunately in Indonesia, the role of universities and research institutes in the development of picosatellite is still low. The creation of a picosatellite simulator was developed in an effort to motivate the public about the importance of satellite technology. The picosatellite simulator serves to demonstrate the attitude control process of picosatellite using Reaction wheel. Reaction wheel serves to regulate the attitude of the picosatellite simulator through rotation that produces angular momentum. The air suspension system aims to produce minimum frictional force conditions. To mimics the effects of the earth's magnetic field as a reference of the attitude control, a pair of Helmholtz coils are constructed. The Helmholtz coil ring has a diameter of 50 cm with a distance between the ring of 15 to 30 cm. In order to produce the required magnetic field, the ring is wrapped with 150 turns of 0.4mm copper wire. In this system, Bluetooth communication is used to connect users with the picosatellite simulator. This communication link is reinforced with an information security mechanism to prevent hacking by unauthorized parties.

The 4th International Seminar on Sensors, Instrumentation, Measurement and Metrology
131
078-ISSIMM2019
Developing A system to determine impact force in tennis
Risky Syahputra1, Syahrial Baktiar
2, Ian Harris Sujae
3, Shige Kudo
4, Wan Rizal Wan Zakaria
5,
Alex Ong6, Joseph Hamill
7
Faculty Ilmu Keolahragaan, Universitas Negeri Padang, Indonesia 1,2
School of Sports, Health and Leisure, Republic Polytechnic, Singapore,
3,4,5,6
Department of Kinesiology, Massachusetts Amherst, USA, 7
Abstract
Introduction: The purpose of this project was to develop a system that could estimate impact force in tennis
forehand stroke. Such estimation is critical feedback during training. Method: A tennis racket was used for
this study. A strain gauge was embedded into the body of the racket. Changes in strain measurement (analog
signal) was converted to digital signal using the AD converter and was synced with the motion capture
system. Calibration of the strain gauge was conducted by hanging fixed weights of equal increment on the
racket and expressed as a relation of fixed weight mass and strain data (captured on motion capture) using
linear regression equation. The equations summation of forces were used to determine the impact force.
Results and Discussions: The peak impact resultant force estimates were similar to those reported in the
literature. Despite the sampling frequency of 200Hz, data estimated from this study may give a representation
of peak resultant impact force as the data were not filtered. Conclusion: The system developed in this study
may be suitable to estimate peak resultant impact forces. Coaches could simply use the data gathered and in
future, synchronize with an app on mobile devices to establish impact force directly and instantaneously with
acceptable accuracy.

The 4th International Seminar on Sensors, Instrumentation, Measurement and Metrology
132
079-ISSIMM2019
Detection of Hg2+ ions using silver nanoparticles as colorimetric
indicator Windri Handayani1, Nur Intan Pratiwi2 and Cuk Imawan2,a
1Departemen Biologi, FMIPA, Universitas Indonesia 2Departemen Fisika, FMIPA, Universitas Indonesia aemail: [email protected] Keywords: silver nanoparticles, colorimetric, Hg2+ detection, biosynthesis, Diospyros discolor. ABSTRACT. Detection of the heavy metal presence in an environment requires a facile and simple system. Silver nanoparticles (AgNPs) have the ability as a colorimetric indicator related to their unique characteristics of its LPSR properties. In this research, biosynthetically AgNPs using Diospyros discolor leaf extract used as a colorimetric indicator for detecting Hg2+ ions. The solution color changes that occur when detecting the analyte was observed. The characterization was performed using a UV-Vis spectrophotometer to study changes in the LSPR spectrum of silver nanoparticles when detecting the presence of Hg2+ ions. In addition, the characterization with Transmission Electron Microscope (TEM) was carried out to determine the shape and size of the nano-article. The results obtained indicate that there was a tendency for the solution color change from brown to clear when AgNPs interact with Hg2+ ions at certain concentration ranges. This result showed that without modification the AgNPs tend to be selective and sensitive to the presence of Hg2+ ions.
Figure 1. Silver nanoparticles used for the detection of Hg2+ ions with various concentrations
started to show solution discoloration from brownish to clear solution.
References [5] Y. Wang, F. Yang, and Xiurong Yang. (2010) Applied Material and Interface 2(2), 339–342. [6] M. Jeyaraj, et.al. (2013) Colloids and Surfaces B: Biointerfaces 106 86–92 [7] D. Philip. (2011). Spectrochimica Acta Part A 78 327–331 [8] Haibing Li, et.al. (2010). Sensors and Actuators B, 145, 194–199. [9] N. O. Laschuk, et.al. (2016) Materials and Design, 107, 18–25.

The 4th International Seminar on Sensors, Instrumentation, Measurement and Metrology
133
080-ISSIMM2019
A Simple Paper-Based Color Change Label Using Plant Extracts for
Ammonia Gas Detection Arie Listyarini
1, a, Vivi Fauzia
1,b and Cuk Imawan
1,c
1Department of Physics, Faculty of Mathematics and Natural Sciences, Universitas Indonesia
[email protected] (corresponding
author)
Keywords: ammonia detection, color change, paper-based label, colorimetry.
ABSTRACT. Paper and plant extracts are materials that is cheap and easy to find everywhere, has great
potential to be used as a portable, low-cost and biodegradable label for the application of chemical
compounds detection. In this paper, we have explored potential methods for the label to detect ammonia gas,
an indicator of meat spoilage, with the colorimetric principle. By immersing paper with plant extracts that are
sensitive to ammonia, in this case, is anthocyanin from Ruellia simplex flower extract, the detection of
ammonia at various concentrations can be achieved. Ammonia concentration used is 0; 0.005%; 0.025%;
0.1%, 0.25% and 0.5%. Color change images on the label when detection is scanned by a flatbed scanner.
ImageJ software is used to quantify the color changes. Ammonia detection at various concentrations results
in a color change from red to yellow on the paper label. Paper-based labels with discoloration that can be
captured visually by the consumer's eyes are considered as promising approaches to determine the freshness
of meat.
2 4
0
5
10
15
20
25
30
35
G
reen
In
ten
sity
Concentration of NH3 (% w/v)
Fig.1 The color change of paper label with
ammonia solution concentration 0 - 0.5% w/v
for 0 - 4 hours
Fig.2. Changes in the Green color intensity of
paper label when detecting ammonia vapor
References
[1] A. Listyarini, C. Imawan, B. Amalia, and V. Fauzia, “Chitosan/nanocellulose with natural dye as a
new developed colorimetric film for ammonia detection,” vol. 20028, p. 20028, 2018.
[2] A. Listyarini, W. Sholihah, and C. Imawan, “A paper-based Colorimetric Indicator Label using
Natural Dye for Monitoring Shrimp Spoilage,” IOP Conf. Ser. Mater. Sci. Eng., vol. 367, no. 1,
2018.
[3] Y. Chen, Y. Zilberman, P. Mostafalu, and S. R. Sonkusale, “Paper based platform for colorimetric
sensing of dissolved NH3and CO2,” Biosens. Bioelectron., vol. 67, pp. 477–484, 2015.
[4] I. Choi, J. Y. Lee, M. Lacroix, and J. Han, “Intelligent pH indicator film composed of agar/potato
starch and anthocyanin extracts from purple sweet potato,” Food Chem., vol. 218, pp. 122–128,
2017

The 4th International Seminar on Sensors, Instrumentation, Measurement and Metrology
134
082-ISSIMM2019
New Insight Of The Implication Blood Pressure Detection Differences
Using Aneroid Sphygmomanometer And Digital Blood Pressure On
Medical Examination
Novitasari1,a, Ihsan Supono1,b, Wuwus Ardiatna1,c, Siddiq Wahyu Hidayat1,d, Nurdina Gita
Pratiwi1,e 1Electromedical Research Group, Research Center for Quality and Testing Technology, Indonesia [email protected] (corresponding author), [email protected], [email protected], [email protected], [email protected]
Keyword: digital blood pressure, blood pressure classification
The quality of medical devices is an important things to establish the anamnesi, diagnosis and also treatment of patient. Arterial pressure measurement as one of the first indicators in the Hypertension Management Guidelines requires the accuracy as well as their function. Error in the detection of blood pressure should not occur during measurement because the errors will also make failure in determining the diagnosis and therapy for hypertensive patient, related on their hypertensive classification. Clinicians requires accurate medical measurement in order to monitor patients, diagnose diseases and deliver treatments. The failure of detection will certainly have diverse effects. Preliminary studies have shown that differences in results that are generated by two types of blood pressure devices, aneroid sphygmomanometers and digital blood pressure. The differences higher 2 to 3 mmHg using digital blood pressure than aneroid sphygmomanometer. This difference led a new insight to the accuracy of blood pressure devices that are widely used in medical circles and the implications of these different values for the determination of blood pressure classification. Therefore, it is necessary for medical staff to get information about the accuracy of blood pressure devices and its critical parameters in determining blood pressure, it is also necessary for a regulation on a blood pressure classification based on the type and level of accuracy of measuring instruments.

The 4th International Seminar on Sensors, Instrumentation, Measurement and Metrology
135
083-ISSIMM2019
Long-Term Change in Characteristics of Cloud Vertical Structures
Over Indonesian from Radiosonde Observations
Lismalini1,a and Marzuki1,*b 1Department of Physics, Andalas University, Limau Manis, Padang, 25163, Indonesia [email protected], [email protected] (corresponding author)
Keywords: Cloud vertical structures, climate change, radiosonde, Indonesia ABSTRACT. Cloud vertical structures, including cloud-base and cloud tops heights, cloud thickness and vertical distribution of the multi-layer cloud affect the radiation balance of the Earth's atmospheric system. Cloud radiative forcing (CRF), especially those induced by interactions between aerosols and clouds, contributes to uncertainties in weather forecasts and climate predictions. The characteristics of clouds have changed and will continue to change from the climate changes, including changes in cloud height, cloud cover, and morphology. This work investigates cloud vertical structures in Indonesia using long-term observations of radiosondes ( 30 years). The cloud base height (CBH) is identified based on relative humidity (RH) threshold of 84% following the identification proposed by several previous studies. At least 3% of jumps in RH can be seen from adjacent lower levels and the minimum CBH is set at 600 m above ground level (AGL) to avoid noise caused by drizzle or rain under the clouds. The vertical distributions of cloud tops, bases, and cloud occurrence show a preponderance of low-level cloudiness (Fig. 1). Detailed description of characteristics of cloud vertical structures over Indonesian will be presented in the conference.
Figure 1. Distribution of cloud base and top heights, and cloud thickness from Radiosonde
Observation in Padang during 1988-2019
References
[1] R. Eastman, and S. G. Warren, “A 39-yr survey of cloud changes from land stations worldwide 1971-
2009 long-term trends, relation to aerosols, and expansion of the tropical belt. ” J.Climate, vol. 26,
pp. 1286–1303, 2013
[2] Z. Q. Li, and Coauthors, “Aerosol and monsoon climate interactions over Asia.” Rev. Geophys., vol.
54, pp. 866–929, 2016
[3] N.N. Reddy, M. V .Ratnam, G. Basha, and V.Ravikiran , “Cloud vertical structure over a tropical
station obtained using long-term high-resolution radiosonde measurements.” Atmos. Chem. Phys.,
vol. 18, pp. 11709–11727, 2018
[4] J.H.Wang, and W.B. Rossow, “Determination of cloud vertical structure from upper-Air
observations.”J.Appl. Meteorol., vol. 34, pp. 2243–2258, 1995

The 4th International Seminar on Sensors, Instrumentation, Measurement and Metrology
136
084-ISSIMM2019
Simple Gold Nano Particles Production Method by Ablated Laser:
Diameter Modification
Syukur Pambudi1, a, Isnaeni2, b and Djati Handoko1, c
1Department of Physics, Faculty of Mathematics and Science, Universitas Indonesia, Depok 16424, Indonesia 2 Research Center for Physics, Indonesian Institute of Science, Building 442 Puspiptek, Banten 15314, Indonesia [email protected], b [email protected], c [email protected] (corresponding author) Keywords: gold nanoparticles, ablated laser, diameter ABSTRACT. Recently, an improved interest in gold nanoparticles (AuNPs) with an interesting phenomenology such as plasmon resonance, has been aroused. There are many methods to synthesized AuNPs. We have successfully fabricated AuNPs base on laser ablation method. The pulsed Nd:YAG laser ablated at 1064 wavelength to a pure gold plate. The frequency was adjusted in low range to produce low energy density laser beam. Three different solution (aqueous, polyvinyl alcohol and polyethylene glycol) was applied to modify AuNPs diameter. The modified nanoparticles diameter was observed by mean UV-Vis spectroscopy exhibit different absorption peak wavelength. For comprehensive discussion, the spectrum was compared to simulation tool on MATLAB. Interestingly, AuNPs diameters have been modified by using different solution
Figure 2. a) AuNPs spectrum measured by UV-Vis and b) spectrum simulation using MNPBEM.
References
[1] Huo, Q., Colon, J., Cordero, A., Bogdanovic, J., Baker, C. H., Goodison, S., & Pensky, M. Y. (2011). “A facile
nanoparticle immunoassay for cancer biomarker discovery,” J. Nanobiotechnology, 9, 20.
[2] Fang SB, Tseng WY, Lee HC, Tsai CK, Huang JT, Hou SY. (2009) “Identification of Salmonella using
colony-print and detection with antibody-coated gold nanoparticles,” J. Microbiological Methods,77(2), 225-
228, [3] Yeh, Y.-C., Creran, B., & Rotello, V. M. (2012). “Gold Nanoparticles: Preparation, Properties, and
Applications in Bionanotechnology.” Nanoscale, 4(6), 1871–1880. [4] Turkevich J, Stevenson PC, Hillier J. Discuss. Faraday Soc. 1951;11:55–75. [5] Brust M, Walker M, Bethell D, Schiffrin DJ, Whyman R. J. Chem. Soc. Chem.Commun. 1994;7:801–802. [6] Isnaeni et al 2017 J. Phys.: Conf. Ser. 817 012039 [7] Amendola, V., & Meneghetti, M. (2009). “Laser ablation synthesis in solution and size manipulation of noble
metal nanoparticles.” Phys. Chem. Chem. Phys., 11, 3805-3821. [8] F. J. Garcia de Abajo,A. Howie, Phys. Rev. B 65, 115418 (2002) [9] J. Waxenegger, A. Trügler, and U. Hohenester, Comp. Phys. Commun. 193, 138 (2015)

The 4th International Seminar on Sensors, Instrumentation, Measurement and Metrology
137
085-ISSIMM2019
ECG CALIBRATION SIGNAL DATABASE CONSTRUCTION
BASED ON IEC 60601-2-25 USING MATLAB
Siddiq Wahyu Hidayat1, a, Wuwus Ardiatna1,b, Asep Rahmat Hidayat1,c, Ihsan Supono1,d, Nurdina Gita Pratiwi1,e, Novitasari1,f, Vera Permatasari1,g
1Electromedical Research Group, Research Center for Quality and Testing Technology LIPI, Indonesia [email protected] (corresponding author), [email protected], c [email protected], [email protected], [email protected], [email protected], [email protected] Keywords: accuracy, calibration, ECG, IEC 60601, standard, testing. ABSTRACT. ECG machines should be calibrated and tested to assure their accuracy. IEC 60601-2-25 standard describes signals for calibrating ECG amplitudes and frequencies. The problem is this standard does not clearly describe the formulas of the calibration signals nor the complete database of these signals. The aim of this study is to get a database of ECG calibration signals for testing based on IEC 60601-2-25 standard clause 201.12.1.101. Data are constructed with a series of sinus function in Matlab software. The data are visually and statistically compared with the data from commercial ECG tester. Data has been constructed for 3 different lead of 12 ECG calibration data. Four ECG calibration data with elevation or depletion ST segment were excluded from this study. This study demonstrates that these ECG calibration signals are slightly visually different but statically aren’t significantly different. The more convex form of P and T segments potentially make wider intervals measurements, while the narrower ends of the R and S segments potentially result in lower amplitude. This data can be used by designers or manufactures, but for the testing laboratory is recommended using a commercial product.
Figure 1. Comparison of constructed database and commercial database of CAL10000 database
Lead I
References
[10] IEC 60601-2-25: Particular Requirements for The Safety of Electrocardiographs.
The 4th International Seminar on Sensors, Instrumentation, Measurement and Metrology
138
086-ISSIMM2019
Influence of the liquid injection hole to ripple frequency of the QCM
sensor Retno A Pratiwi1, Muchammad A Akbar1 and Setyawan P Sakti1,a
1Department of Physics, Brawijaya University, Jl. Veteran, Malang 65145, Indonesia
a Corresponding author: [email protected]
Abstract. The liquid injection is one of the crucial roles in the used of QCM sensors in a liquid application. Liquid sample injection should be controlled. As the liquid injected onto the QCM sensor surface using peristaltic pump, a short pressure pulse exists. The short pulse affect the stability of the resonance frequency of the QCM sensor. The pulsation flow of the peristaltic pump leads to a ripple resonance frequency of the QCM sensor. Resonance frequency measurement of the QCM sensor in the reaction cell injected using the peristaltic pump has been measured. Different injection holes size was made to observe the effect to the sensor stability. The result showed that frequency of the QCM sensor has a ripple frequency as the liquid injected using the peristaltic pump. It was observed that bigger injection hole at the exit flow resulted in a smaller ripple frequency. Further investigation is required to get the smallest ripple p frequency during the liquid injection using the peristaltic pump.

The 4th International Seminar on Sensors, Instrumentation, Measurement and Metrology
139
087-ISSIMM2019
Design of Negative Pressure Wound Therapy (NPWT) to Accelerate
Diabetic Ulcer Healing Retna Apsari1,2, Rizka Nindyasari1, Delima Ayu Saraswati1
1Physics Study Program, Departement of Physics, Faculty of Science and Technology, Universitas Airlangga
2Biomedical Engineering Study Program, Departement of Physics, Faculty of Science and Technology, Universitas Airlangga
Email: [email protected]
Abstract. Design of a microcontroller based-NPWT (Negative Pressure Wound Therapy) to accelerate diabetic ulcer healing has been conducted. This study aims to design an NPWT device equipped with negative pressure setting as well as therapy duration to absorb diabetic ulcer fluid. In this NPWT device, the negative pressure was regulated by a ballvalve which then was read by the MPX5050DP sensor and processed by the microcontroller. The setting duration of the therapy was also available in this device and as programmed in the microcontroller. In this study, experimental rabbits were used and conditioned to suffer from diabetic ulcers. The therapy performed was a pressure with the magnitude of -75 to -80 mmHg for 5 hours. This device has a high degree of accuracy in absorbing the fluid of diabetic ulcers, the magnitude is 99.5 %, while the therapy duration has a 100 % accuracy.
Keywords : negative pressure wound therapy, NPWT, negative pressure

The 4th International Seminar on Sensors, Instrumentation, Measurement and Metrology
140
089-ISSIMM2019
Cholesterol Electrochemical Sensor Based on Molecularly Imprinted
Polymers (MIPs) Modified Screen Printed Electrode (SPE)
Elhana Julita1, Alizar Ulianas2*, Yulkifli3 Mohamad Syahrizal Ahmad4, Illyas Md Isa5
1,2Department of Chemistry, Faculty of Mathematics and Natural Science, Universitas Negeri Padang,
West Sumatera 25171, Indonesia.
3Department of Physic, Faculty of Mathematics and Natural Science, Universitas Negeri Padang, West
Sumatera 25171, Indonesia.
4,5Department of Chemistry, Faculty of Science and Mathematics, Universiti Pendidikan Sultan Idris,
35900 Tanjong Malim, Perak Darul Ridzuan, Malaysia.
Email: [email protected]
AbstractMolecularly Imprinted Polymers (MIP) are generally a more stable material for sensing
application. The high selectivity and sensitivity of MIPs for sensors can be achieved if the template
molecule is imprinted in the polymer and this makes them an ideal alternative as a recognition
element for sensors. A new electrochemical sensor based on molecularly imprinted polymeric
microspheres (MIPs) modified carbon screen-printed electrodes (SPEs) for the rapid detection of
cholesterol. Hydrophobic MIPs were synthesized using photopolymerization in emulsion form. The
MIP microsphere specific to the cholesterol, prepared via a facile photopolymerization technique, were
coated onto the modified SPE. The presence of cholesterol in biological samples could be detected with
the sensor via absorption of cholesterol into the deposited MIPs. The sensor response was monitored
by cyclic voltammetry of the reduction and oxidation solution of K3Fe(CN)6 at optimal conditions. The
linear sensor response could detect the concentrations of cholesterol from 0.1 ppm to 100 ppm, with a
detection limit of 0.10 ppm. The sensor based on MIP microspheres and modified electrode
demonstrated a stability more than 20 days.
Keywords: MIP, Sensor, Cholesterol, Square wave voltammetry (SWV), Screen-printed electrode.

The 4th International Seminar on Sensors, Instrumentation, Measurement and Metrology
141
092-ISSIMM2019
A high voltage electrostatic filter for particulate matter PM2.5 capture
applied in motor vehicle exhaust system
Arinto Y.P. Wardoyo1,*, Hari A. Dharmawan1, M. Nurhuda1, and Arif Budianto1
1Laboratory of Air Quality and Astro Imaging, Physics Department, Brawijaya University, Jl. Veteran 65145 Malang, East Java, Indonesia *[email protected] (corresponding author)
Abstract. Increasingly strict air pollution regulations along with global warming issue have peeked the interest in cleaner emission
emitted by motor vehicle. In line with this, this study was aimed to develop a particulate filtering system based on an electrostatic
principle for particulate matter with the diameter less than 2.5 μm, as known as a fine particle, and to test the performance of the filter. The filter consists of aluminum anodes and cathodes as the electrostatic electrodes. These electrodes were placed into the filter frame
and installed on a motor vehicle muffler. The test was conducted to estimate the filter performance by measuring particle concentrations
before and after using the filters. The filter was tested under four different electrostatic voltages: V1 100 Volt, V2 200 Volt, V3 300 Volt, and V4 400 Volt. The results show that the filter can reduce fine particle concentrations with the best efficiency of 50%, 60%, 62%, and
68%, respectively for V1, V2, V3, and V4. Filter performance was directly influenced by the applied voltage and the time of the test.

The 4th International Seminar on Sensors, Instrumentation, Measurement and Metrology
142
093-ISSIMM2019
Design of Water Height Detector Model in Runway Based on Internet
of Things Puti Aulia Mardiah1, Yohandri1
1Physics Department, Faculty of Mathematics and Natural Science, Universitas Negeri Padang, jl. Prof. Hamka, Padang, Sumatera barat
Abstract. The runway of an aircraft is designed to keep it dry even if it rains to avoid hydroplaning. Hydroplaning is a plane slip on the runway due to standing water. In accordance with regulations from the Derektorat Bandara, Ditjen Perhubungan Udara NO. KP 212 in
2017, the operational requirement for runways to be able to serve landings and aircraft flights is when there is a maximum of 3 mm of standing water on the runway surface. The design of the water level detector model on the runway uses the Arduino Mega 2560 as a
microcontroller which processes and sends the detected data to the thingspeak via the internet network. Performance specifications for
water level detector models are water level sensor designs, U detector pipes, runways, electronic circuits. The water level sensor is a
touch sensor that is designed and printed on a PCB board with vertical strip designs. Detected data will be processed in Arduino Mega
2560 and typed into the thingspeak page using the internet network. Data output can be accessed via a PC connected to the internet
network. The results of comparison with standard tools found the average percentage of errors for the vertical sensor strip design was 4.98%. From the comparison results, the average percentage of accuracy for the vertical sensor strip design is 95.01% with precision of
84.77%.

The 4th International Seminar on Sensors, Instrumentation, Measurement and Metrology
143
099-ISSIMM2019
A Radiochromic Paper Label Using Red Cabbage Acid Extract
Marlina Harahap1, M Prasetya Widodo2 and Cuk Imawan3*
1Health Facilty Safety Center-Ministry of Health Republic of Indonesia, Central Jakarta, DKI Jakarta, 10570, Indonesia 2Center for Technology of Radiation Safety and Metrology–National Nuclear Energy Agency, South Jakarta, DKI Jakarta, 12440, Indonesia 3Departmen Fisika, Fakultas Matematika dan Ilmu Pengetahuan Alam (FMIPA) Universitas Indonesia, Kampus UI Depok, Depok 16424, Indonesia *Corresponding author: [email protected]
Keywords: red cabbage, indicator label, radiochromic, gamma ray
Abstract—Gamma-ray irradiation is needed for sterilization to prevent nosocomial infections due to microorganisms. In practical applications, a device that can measure doses in a simple, direct, and inexpensive manner such as a radiochromic indicator label is very necessary. This paper reports the results of research on paper labels for radiochromic indicators made from extracts of red cabbage dyes to detect doses of gamma-rays. This dye was extracted by maceration method. The indicator label was made by soaking a cellulose paper in the dyes extract which has a pH of 2 in a certain time. The prepared indicator label was tested by gamma-ray irradiation in the range from 0 to 40 kGy. This indicator label has pale violet red color before irradiating, then after irradiated with gamma-rays changes to an antique white color with increasing dose of irradiation. This indicator was scanned using Flatbed Scanner then the color was analyzed with ImageJ software. The results of RGB analysis for the label color changes show that optical density of the green component of the RGB has a higher sensitivity to gamma-ray irradiation compared to the red and blue components. The results of this experiment concluded that the indicator labels made using dyes from red cabbage can be used properly as a gamma ray dosimeter


![arXiv:1903.09094v2 [cs.LG] 1 Apr 2019](https://static.fdokumen.com/doc/165x107/6319a3614cd7b34424091e9b/arxiv190309094v2-cslg-1-apr-2019.jpg)


![arXiv:1902.09355v2 [cs.AI] 1 Mar 2019](https://static.fdokumen.com/doc/165x107/6313b658c72bc2f2dd041e01/arxiv190209355v2-csai-1-mar-2019.jpg)