1 2073 12(3)2014 IJCS(1)
21
________________________________________ * Author for correspondence; E-mail: [email protected]; Ph.: +23777578567; Fax: (+237) 22234496, (+237) 22237610 Int. J. Chem. Sci.: 12(3), 2014, 741-761 ISSN 0972-768X www.sadgurupublications.com EQUILIBRIUM AND KINETIC MODELLING OF METHYL ORANGE ADSORPTION FROM AQUEOUS SOLUTION USING RICE HUSK AND EGUSSI PEELING D. R. TCHUIFON, S. G. ANAGHO a* , E. NJANJA, J. N. GHOGOMU, N. G. NDIFOR-ANGWAFOR and T. KAMGAING Laboratory of Noxious Chemistry and Environmental Engineering, Department of Chemistry, Faculty of Science, University of Dschang, P. O. Box 67, DSCHANG, CAMEROON a Department of Chemistry, Faculty of Science, University of Bamenda, P. O. Box 39, BAMBILI, CAMEROON ABSTRACT The removal of methyl orange from aqueous solution by egussi peeling and rice husk was studied in a batch mode at room temperature. The study highlighted several parameters, such as the contact time, the mass of the adsorbent, the pH of the solution, and the initial concentration of the dye. The results showed that the removal of dyes by the bioadsorbents depended on the pH and the initial concentration of the sorbate. The adsorption capacity increased with increasing methyl orange concentration and the mass of the bioadsorbent. It was also established that maximum adsorption took place at pH = 2 for the two adsorbents. Using adsorbent masses of 1.3 g and initial concentration of 35 mg/L, the percentage removal of 69.45 and 70.31 were recorded for egussi peeling and rice husk, respectively. In order to deduce the adsorption mechanism, three simplified kinetic models were investigated. The kinetic study data were well represented by the pseudo second order kinetic model giving correlation coefficients (R 2 ) values of 0.990 for rice husk and 0.992 for egussi peeling suggesting that chemisorption was the rate determining step. An equilibrium sudy of the adsorption process also showed that the Langmuir model best described the adsorption on egussi peeling, while Freundlich desribed that on rice husk. These results indicate that rice husk and egussi peeling have a high potential as adsorbents for removing methyl orange from aqueous solutions. Key words: Adsorption, Biosorption, Egussi peeling, Rice husk, Adsorption model, Kinetic model, Methyl orange.
-
Upload
independent -
Category
Documents
-
view
0 -
download
0
Transcript of 1 2073 12(3)2014 IJCS(1)

________________________________________
*Author for correspondence; E-mail: [email protected]; Ph.: +23777578567; Fax: (+237) 22234496, (+237) 22237610
Int. J. Chem. Sci.: 12(3), 2014, 741-761 ISSN 0972-768X
www.sadgurupublications.com
EQUILIBRIUM AND KINETIC MODELLING OF METHYL ORANGE ADSORPTION FROM AQUEOUS SOLUTION
USING RICE HUSK AND EGUSSI PEELING
D. R. TCHUIFON, S. G. ANAGHOa*, E. NJANJA, J. N. GHOGOMU, N. G. NDIFOR-ANGWAFOR and T. KAMGAING
Laboratory of Noxious Chemistry and Environmental Engineering, Department of Chemistry, Faculty of Science, University of Dschang, P. O. Box 67, DSCHANG, CAMEROON
aDepartment of Chemistry, Faculty of Science, University of Bamenda, P. O. Box 39, BAMBILI, CAMEROON
ABSTRACT
The removal of methyl orange from aqueous solution by egussi peeling and rice husk was studied in a batch mode at room temperature. The study highlighted several parameters, such as the contact time, the mass of the adsorbent, the pH of the solution, and the initial concentration of the dye. The results showed that the removal of dyes by the bioadsorbents depended on the pH and the initial concentration of the sorbate. The adsorption capacity increased with increasing methyl orange concentration and the mass of the bioadsorbent. It was also established that maximum adsorption took place at pH = 2 for the two adsorbents. Using adsorbent masses of 1.3 g and initial concentration of 35 mg/L, the percentage removal of 69.45 and 70.31 were recorded for egussi peeling and rice husk, respectively. In order to deduce the adsorption mechanism, three simplified kinetic models were investigated. The kinetic study data were well represented by the pseudo second order kinetic model giving correlation coefficients (R2) values of 0.990 for rice husk and 0.992 for egussi peeling suggesting that chemisorption was the rate determining step.
An equilibrium sudy of the adsorption process also showed that the Langmuir model best described the adsorption on egussi peeling, while Freundlich desribed that on rice husk. These results indicate that rice husk and egussi peeling have a high potential as adsorbents for removing methyl orange from aqueous solutions.
Key words: Adsorption, Biosorption, Egussi peeling, Rice husk, Adsorption model, Kinetic model, Methyl orange.

D. R. Tchuifon et al.: Equilibrium and Kinetic Modelling of…. 742
INTRODUCTION
The textile, paper and leather industries consume large quantities of water and produce large volumes of waste water from different steps in their operation. Waste water from industries using synthetic dyes generally contains biodegradable organic compounds with complex structures. Dyes can be toxic to aquatic life in that they affect photosynthetic activity1. Although the release of dyes into the environment constitutes only a small proportion of water pollution, dyes are very highly visible even in small quantities due to their brilliance2. A majority of the dyes used today are azo reactive compounds, which are bright in color due to the presence of one or several azo (-N=N-) groups, which are associated with substituted aromatic structures3,4. Synthetic dyes are extensively used for dyeing and printing in a variety of industries.
Discharging of dyes into water sources even in a small amount can affect the aquatic life and food chain. Dyes can also cause allergic dermatitis and skin irritation. Some of them have been reported to be carcinogenic and mutagenic for aquatic organisms5. Annual production of textile dyes is estimated to be over 80 tons of which 10% are discharged as effluents6. Release of these dyes in water stream is aesthetically undesirable and has serious environmental consequences. Due to their intense colour, they reduce sunlight transmission into water hence affecting aquatic plants, which ultimately disturb aquatic ecosystem7.
Over the last few years, the need to remove colour from textile effluents has interested a number of researchers, not only because of its toxicity, but mainly because of its visibility. A wide range of chemical/physical and biological treatment methods have been used. For example, membrane filtration, chemical oxidation, flocculation, ozonation, ion-exchange, irradiation and adsorption have been conventionally applied by researchers for the removal of colour from aqueous solutions8. Adsorption is one of the noteworthy treatment processes. It has been proven to be most suitable and promising, and has become the most popularly used technique of depollution because of its effectiveness, operational simplicity, low cost and low energy requirement9. Investigations have shown that low cost adsorbents such as humicola fuscoatra1, yam leaf fibers3, clay10, and sugarcane bagasse11
have the potential of being used as alternative adsorbents for removing dyes from aqueous solution. The adsorption by agricultural waste materials, being economic and eco-friendly due to their unique chemical composition, availability, abundance, renewability, low cost and more efficiency seem to be a viable option for dye remediation.
The present investigation is devoted to study the removal of methyl orange from aqueous solution by using agricultural residues rice husk and egussi peeling. The effects of
Int. J. Chem. Sci.: 12(3), 2014 743
pH, adsorbent dose, initial dye concentration and contact time on the removal of methyl orange will be investigated. The adsorption data will be used to model the kinetics and the equilibrium of the process.
EXPERIMENTAL
Rice husk was collected from a pre-consumer agricultural product process industry located at Tonga (West region) and egussi peeling from Edéa (Littoral region) both in Cameroon. The collected rice husk and egussi peeling were dried under sun and impurities were removed manually. Each of the materials was washed with distilled water for 1 hr under agitation and then filtered to make it free from colored compounds. The residual material so obtained was dried at 80oC in an oven for 24 hrs, and then ground and sieved to obtain particles of size less than 250 μm.
Methyl orange, (4-dimethylaminoazobenzene-4'-sulfonic acid (MO), a bright orange crystalline powder with a molar mass of 327.34 g.mol-1 and melting point around 300oC, was purchased from Labchem and used without further purification. A stock solution of methyl orange (500 mg.L-1) was prepared by dissolving 0.500 g of the dye in 1 L of distilled water. The resulting aqueous solution was diluted with distilled water to obtain solutions of the desired concentrations (10-35 mg.L-1). The pH of the solution was adjusted using 0.01 M NaOH or 0.01 M HNO3.
Batch adsorption tests were carried out by mechanical agitation at room temperature. For each run, 20 mL of methyl orange of known initial concentration (10-35 mg.L-1) was treated with a known weight of pulverized rice husk or egussi peeling. After agitation, the solution was filtered and the filtrate was subsequently analyzed for dye concentration by UV/Vis spectrophotometer, Jenway model 6715. Similar measurements were carried out by varying adsorbent doses, pH and initial concentrations of the dye solution. The percentage removal (% R) of dye and the amount (Qe) adsorbed per unit mass of adsorbent were calculated by using the following expressions:
% R = 100 o
toC
CC − …(1)
Qe = V mCC eo − …(2)
Where Co is the initial concentration of the dye, Ce is its equilibrium concentration, Ct is the concentration at time t, V is the volume of the solution, and m is the mass of the absorbent.

D. R. Tchuifon et al.: Equilibrium and Kinetic Modelling of…. 744
Bulk density
The egussi peeling and rice husk samples were packed in a previously weighed 25 cm3 specific gravity bottle by repeatedly tapping the bottle so that powder was filled up to the mark. The bottle was weighed again. The difference in the weights gives the weight of powder taken in the bottle. The bulk density of the powder was calculated using the equation.
Bulk density =
25bottle in theen powder tak ofWeight …(3)
Moisture content
One gram of the powdered, air dried egussi peeling and rice husk powder were taken in a previously weighed crucible. The crucible was placed in an electric hot air oven maintained at about 110°C. After one hour the crucible was taken out, cooled in a desiccator and weighed again. The loss in weight of the powder reported on a percentage basis gives moisture content in the sample.
Infra-red fourier transform spectroscopy
Infra-red spectra were recorded with an Infra-Red Fourier Transform Spectroscopy in Diffuse Reflection mode on KBr pellets made of 15 % clay in oven-dried KBr using a Bruker, Alpha-P Spectrometer. The spectra were recorded in the wavenumber range of 4000 cm-1 to 400 cm-1.
Effect of agitation time
To determine the effect of agitation time on the adsorption process, 0.1 g of the adsorbent were stirred in a 20 mL solution of dye of initial concentration 35 mg.L-1 for different time intervals. At the end of each time, the solution was rapidly filtered and the residual dye concentration determined. The difference between the initial concentration (C0) and the final concentration (Ct) was used to calculate the percentage removal (%R) of dye by using Equation (1).
Effect of amount of adsorbent
In this set of experiments, different masses of the adsorbents ranging between 0.1 to 1.3 g were treated with 20 mL solution of the dye of initial concentration 35 mg.L-1.
Effect of pH of solution
For each adsorbent, the optimal mass of adsorbent obtained at the end of the preceding

Int. J. Chem. Sci.: 12(3), 2014 745
study was treated with 20 mL of aqueous solution of dye 35 mg/L, at pH values of 2, 3, 4, 5, 6 and 7, respectively.
Kinetics of adsorption experiments
The kinetics experiments were conducted using a series of 20 mL solutions containing known amounts of adsorbent and concentration of dye. The solutions were vigorously agitated for increasing time intervals. At the end of each, the solution was filtered and the residual dye concentration in the filtrate determined. A number of kinetics models were used to fit the experimental data. These are –
The pseudo-first order model
The pseudo-first order equation is generally expressed as10 –
dtdQ = K1 (Qe – Qt) …(4)
Where Qe and Qt are the adsorption capacity at equilibrium and at time t, respectively (in mg.g-1) and K1 is the rate constant for the pseudo-first order adsorption (L.min-1). After integration and applying boundary conditions that at t=0, Qt = 0; and at t = t, Qt = Qt, the integrated form of equation (4) becomes –
ln (Qe – Qt) = ln Qe – K1t …(5)
The pseudo-second order model
The pseudo-second order chemisorption kinetic equation (Ho and Mckay)12 is expressed as equation (6):
dtdqt = K2 (qe – qt)2 …(6)
Where qe and qt are the adsorption capacity at equilibrium and at time t, respectively (mg.g-1) and K2 is the rate constant for the pseudo-second order adsorption (g.mg-1.min-1). For boundary conditions at t = 0, qt = 0; and at t = t, Qt = Qt, the integrated and rearranged form of equation (6) is –
tQ
t = 2e2QK
1 +eQ
t …(7)

D. R. Tchuifon et al.: Equilibrium and Kinetic Modelling of…. 746
The Elovich kinetic equation
The Elovich equation is generally expressed as13 –
dtdQt αe – βQt …(8)
Where Qt is the sorption capacity at time t (mg.g-1), α is the initial adsorption rate (mg.g-1.min-1), and β is the desorption rate constant (mg.g-1.min-1) during any one experiment.
The integrated and simplified equation (assuming that αβt >> 1) is –
Qt = β1 ln (αβ) + β
1 ln t …(9)
Rate constant for the pore diffusion and mass transfer
The study of the kinetics of adsorption in batch systems is necessary it enables one to determine the rate-limiting step in the adsorption process. The mechanism of adsorption onto an adsorbent comprises several steps, one of which is pore diffusion. The rate constant for pore diffusion Φ was determined using the pore diffusion equation of Weber and Morris14 given as –
o
tCC = Φt0.5 …(10)
To evaluate the rate of mass transfer, it is assumed that in a well agitated adsorber, the mixing in the liquid phase is rapid and consequently, the concentration m of carbon particles in the liquid is virtually uniform throughout the vessel14.
The mass transfer equation is generally expressed as15:
Co – Ct = DeKot …(11)
Where C0 is the initial dye concentration (m.L-1), Ct is the dye concentration at time t, t is the shaking time (min), D is a fitting parameter, and K0 is the adsorption constant, which is related to the mass transfer adsorption coefficient Km as:
K0 = Km M

Int. J. Chem. Sci.: 12(3), 2014 747
Where M is the mass of the adsorbent (g).
The linearization form of equation (11) gives:
ln (Co – Ct) = ln D + Kot …(12)
Intraparticle diffusion model
The rate of adsorption is known to be controlled by several factors including the following16:
(i) Diffusion of solute from the solution to the film surrounding the adsorbent particle;
(ii) Diffusion through the film to the particle surface;
(iii) Diffusion from the particle surface to the internal sites on the adsorbent particle;
(iv) Uptake of solute on the solute surface, and this could involve several mechanisms such as physicochemical sorption, ion exchange, complexation or precipitation.
One type of equation used to model the intraparticle diffusion was developed using the concept of linear driving force. It is expressed as15, 17:
Qt = Xi + K1t0.5 …(13)
Xi is the boundary layer diffusion effect, and it depicts the boundary layer thickness, while K1 is the initial rate of adsorption (mg.g-1.min-1), and it is controlled by intra-particle diffusivity.
Batch equilibrium experiments
For each run, the adsorbent was mixed with 20 mL solution of dye at different initial concentrations from 10-35 mg/L. The suspension was stirred for 35 minutes with rice hush and egussi peeling. The amount of dye adsorbed at equilibrium, Qe (mg.g-1) was calculated using equation (14):
Qe = mV )C(C to − …(14)

D. R. Tchuifon et al.: Equilibrium and Kinetic Modelling of…. 748
Where, C0 and Ct are the initial and equilibrium concentrations of dye, V the volume of the solution, and m the adsorbent mass. The equilibrium data were then fitted by using the Langmuir and Freundlich adsorption isotherm models.
The Langmuir Isotherm
The Langmuir adsorption isotherm is often used for adsorption of a solute from a liquid solution. It is perhaps the best known of all isotherms describing adsorption processes and is often expressed18 as:
Qe = Qm eL
eLCK 1
CK+ …(15)
Where, Qe (mg of adsorbate per g of adsorbent) is the adsorption capacity at the equilibrium solute concentration, Ce is the equilibrium concentration of adsorbate in solution (mg.L-1), Qm (mg of solute adsorbed per g of adsorbent) is the maximum adsorption capacity corresponding to complete monolayer coverage. KL is the Langmuir constant (L of adsorbate per mg of adsorbent), and it is related to the energy of adsorption. The above equation can be rearranged in following linear form:
eQ
1 = mem Q
1KCQ1 + …(16)
The factor of separation of Langmuir, RL, which is an essential factor characteristic of this isotherm is calculated by using the relation19:
RL =omCKQ 1
1+ …(17)
Where C0 is the higher initial concentration of methyl orange, while KL and Qm are the Langmuir constant and the maximum adsorption capacity respectively. The parameters indicate the shape of isotherm as follows:
RL values indicate the type of isotherm: to be irreversible (RL = 0), favorable (0 < RL
< 1), linear (RL = 1), or unfavourable (RL> 1).
The Freundlich Isotherm
The Freundlich isotherm is an equation based on adsorption on a heterogeneous surface20:

Int. J. Chem. Sci.: 12(3), 2014 749
Qe = FCe1/n …(18)
Where Qe is the quantity of solute adsorbed at equilibrium (also called adsorption density) expressed in mg of adsorbate per g of adsorbent, Ce is the concentration of adsorbate at equilibrium, F and n are empirical constants that are dependent on several factors; and n is greater than one. This equation is conveniently used in a linear form by taking the logarithms on both sides as:
ln Qe = ln F + n1 ln Ce …(19)
RESULTS AND DISCUSSION
Samples characteristics
The physicochemical properties of the adsorbents as obtained in this work after their characterization are shown in Table 1.
Table 1: Characterization of adsorbents
Sample Bulk density (Kg/m3) Moisture content (%)
Rice husk 591.6 8.57
Egussi peeling 430.4 8.82
Fourier transform infrared (FTIR) spectrometry is another powerful tool for identifying the types of functional groups on the adsorbent that are responsible for entrapping the molecules or atoms. The Fourier transform infrared of the adsorbent are presented in Figures 1 and 2. The spectra of rice husk and egussi peeling show a number of peaks at the same wavelength. The intense absorption band at 3288 and 3279 cm-1, respectively from rice husk and egussi peeling can be ascribed to the vibration of –OH hydrogen-bond of the cellulosic material. Adsorption bands appearing around 1148 and 1074 cm-1 could be due to C-O stretching and C-N or sulphonic groups21. The peaks at 855 to 890, 1260 to 1430, 2852 to 2823 cm-1 are due to C-H stretching which could be attributed to the presence of –CH and CH groups in the lignin structure of rice husk and egussi peeling. The bands ranging from 1708 to 1740 cm-1 could be attributed to C=O stretching vibrations. The peaks density and C=O and –OH indicate the presence of carboxyl groups on the adsorbent surface.

D. R. Tchuifon et al.: Equilibrium and Kinetic Modelling of…. 750
500100015002000250030003500
Abs
orba
nce
units
Wavenumber cm-1
0.25
0.20
0.15
0.10
0.05
0.00
Fig. 1: FTIR spectrum of Egussi peeling
500100015002000250030003500
Abs
orba
nce
units
Wavenumber cm-1
0.16
0.14
0.12
0.10
0.08
0.06
0.04
0.02
Fig. 2: FTIR spectrum of Rice husk
Effect of contact time
From Figure 3, it can be seen that the adsorption proceeded in two phases: a very fast phase which took 10 minutes for both adsorbents giving maximum adsorbed quantities of 1.492 mg.g-1 for egussi peelings and 1.016 mg.g-1 for rice husk. Such high uptake indicate a high degree of affinity of the two adsorbents towards the methyl orange molecules via chemisorption20. In the second phase, the rate of adsorption slowed down significantly until equilibrium was attained. The first phase of adsorption can be explained by the fact that at the start of the process, all the sites of adsorption on the surface of the adsorbent materials

Int. J. Chem. Sci.: 12(3), 2014 751
are available. The slowing down in the second phase is explained by the following three factors:
• Once the first set of dye molecules are fixed onto the surface, the number of adsorption sites are reduced, such that the remaining adsorbate molecules are competing for fewer sites;
• Pore entrances are blocked by the already adsorbed molecules, thereby preventing other adsorbate molecules from reaching sites in the pores;
• There may be repulsion of incoming ions by those already fixed, thereby greatly slowing down the speed with which approaching molecules reach unoccupied adsorption sites.
After 25 minutes, when equilibrium is reached we have a sequence of adsorption and desorption processes, both occurring at the same rate. With regard to desorption, it can be said that when the dye has filled the sites and that one continues to agitate the solution, the collision between the dye and surface could cause the exit of some dyes, thereby creating space for other approaching molecules.
Q (m
g/g)
t
Time (min)
1.6
1.4
1.2
1
0.8
0.6
0.4
0.2
00 5 10 15 20 25 30 35 40
Egussi peelingRice husk
Fig. 3: Effect of agitation time on the adsorption of methyl orange on egussi peeling
and rice husk
Effect of the amount of adsorbents
In this part of the experiment, different masses of the adsorbent were stirred with dye solution of constant initial concentration 35 mg.L-1 for 35 minutes. The results as presented in Figure 4 show that the percentage adsorption increased with adsorbent mass. This
D. R. Tchuifon et al.: Equilibrium and Kinetic Modelling of…. 752
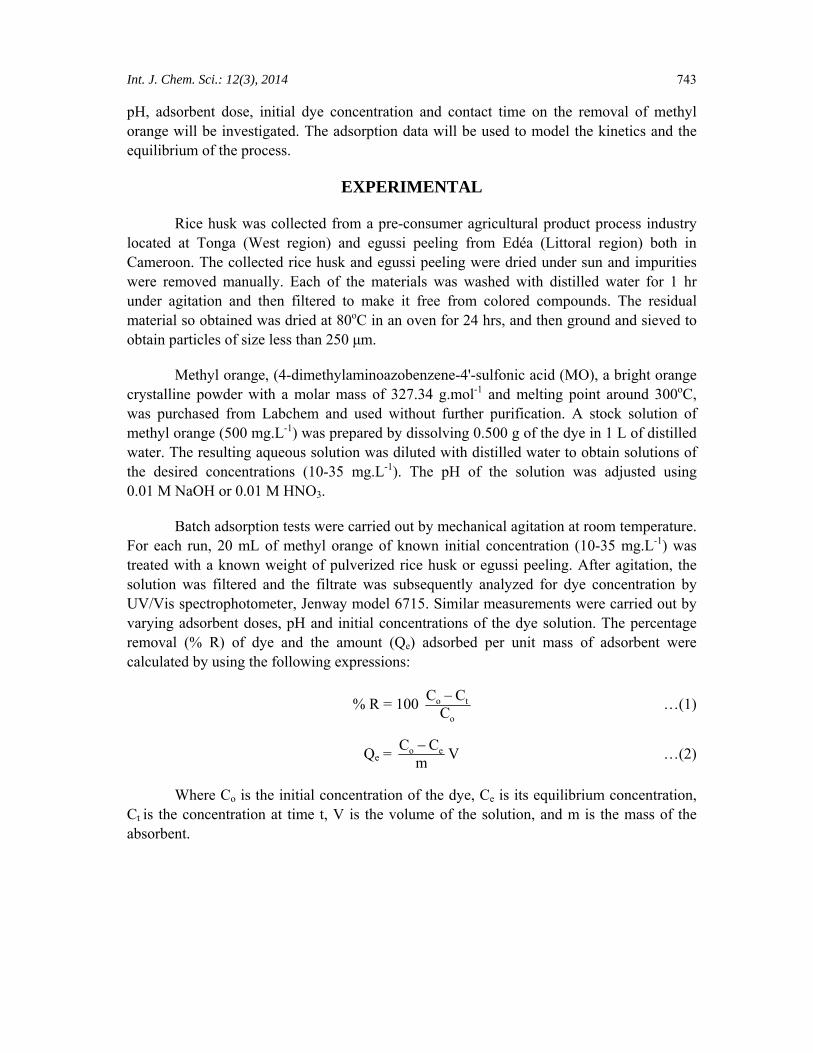
increase in the percentage of adsorption with the mass of adsorbent is due to the increase in the number of available sites when we increase the quantity of adsorbent. The maximum adsorption percentage was 69.45 using egussi peeling at 1.3 g and 70.31 % using rice husk at 1.3 g of adsorbent mass. The quantity adsorbed per unit of mass of the adsorbent decreased when the mass of the adsorbent was further increased. This phenomenon is due to the fact that an increase in the mass of adsorbent within the limited volume of solution entails an agglomeration of the adsorbent, consequently reducing the intercellular distances. This mass increase leads to the “screen effect”, which prevents access to adsorption sites on the adsorbent.22
% R
m (g)
80
70
60
50
40
30
20
10
00 0.5 1 1.5
Egussi peelingRice husk
Fig. 4: Effect of adsorbent mass on methyl orange adsorption on
egussi peeling and rice husk
Effect of pH of biosorption
The efficiency of a sorption process depends on the pH of the solution1, because a variation in pH leads to the variation in the surface properties of the adsorbent and also the degree of ionization10. Thus, comparative experiments were performed over a pH range of 2.0-7.0 to obtain the optimum pH for dye adsorption. The results depicted in Figure 5 show that the sorption of methyl orange decreased from the initial pH 2 upto pH 3.0; increased slightly from pH 3 upto pH 4.0 before decreasing steadily over the remaining pH range of 4.0-7.0. This is attributed to the protonation of the fibers of the adsorbents at low values of pH in which H+ ions provide a significantly strong electrostatic attraction between the fibers surface and the dye molecules leading to maximum adsorption3. The decrease in the adsorption capacity for the dye was attributed to two mechanisms: firstly, an electrostatic attraction between the protonated amino groups of absorbents and dyes; and secondly, the chemical interaction between methyl orange and adsorbents23. At lower pH values, more

Int. J. Chem. Sci.: 12(3), 2014 753
protons were available causing an increase in electrostatic attraction between negatively charged dye anions and positively charged amine groups on the adsorbents. As the initial pH of the solution increased, the positive charge on the surface decreased and the number of negatively charged sites increased. The negatively charged surface sites on the egussi peeling and rice husk were not favorable to the adsorption of the anionic dye due to electrostatic repulsion. Moreover, there was a competition between the hydroxide ions and dye molecules and the excessive hydroxide ions resulted in a sharp decrease in adsorption. Subsequent studies in this work were carried out at pH 2 as the optimum pH.
Q (m
g/g)
t
pH
1.4
1.2
1
0.8
0.6
0.4
0.2
01 2 3 4 5 6 7 8
Egussi peelingRice husk
Fig. 5: Effect of pH of solution on methyl orange adsorption on
egussi peeling and rice husk
Modeling of kinetic studies
Modeling of kinetic data is fundamental for the industrial application of adsorption, because it gives information for comparison among different biomaterials under different operational conditions for pollutant removal from wastewater24. The kinetic models used in the investigation of adsorption of dye by egussi peeling and rice husk were: pseudo-first order, pseudo-second order, Elovich model, intra-particle diffusion, intra-particle diffusivity and mass transfer.
To obtain the appropriate kinetics for the dye adsorption, it was necessary that different kinetic models be tested to determine to what extent they fitted the experimental adsorption data. The optimization procedure for selecting the best model requires the selection of an error function by which to evaluate the fit of the kinetic models to the experimental adsorption data. The coefficient of correlation, R² was chosen as an appropriate error function for analyzing the kinetic models. This is because linear regression implicitly

D. R. Tchuifon et al.: Equilibrium and Kinetic Modelling of…. 754
minimizes the sum of the squares of the errors to determine the equations’ parameters25. The rate constants and parameters for these models are given in Table 1. The plots of Ct/C0 versus t0.5 (Figure 9), is linear for a wide range of contact time, but it does not pass through the origin. This suggests that the mechanism involved in the process of the dye uptake by egussi peeling and rice husk is complex, and that both boundary layer diffusion effect and intra-particle diffusion contribute to the rate determination14.
Time (min)
0
-1
-2
-3
-4
-5
-6
0 5 10 15 20 25 30 35
Egussi peelingRice husk
Fig. 6: Linearized pseudo-first order plots
t/Qt
t
40
35
30
25
20
15
10
5
00 10 20 30 40
Egussi peelingRice husk
Fig. 7: Linearized pseudo-second order plots
The plot for the mass transfer model, ln (C0-Ct) versus t is presented in Figure 10. The fitting parameter D that measures of the apparent distribution ratio, the adsorption constant K0 and the mass transfer adsorption coefficient Km are given in Table 2. From the table, it can be seen that the values of D, K0 and Km were all greater for egussi peeling
Int. J. Chem. Sci.: 12(3), 2014 755
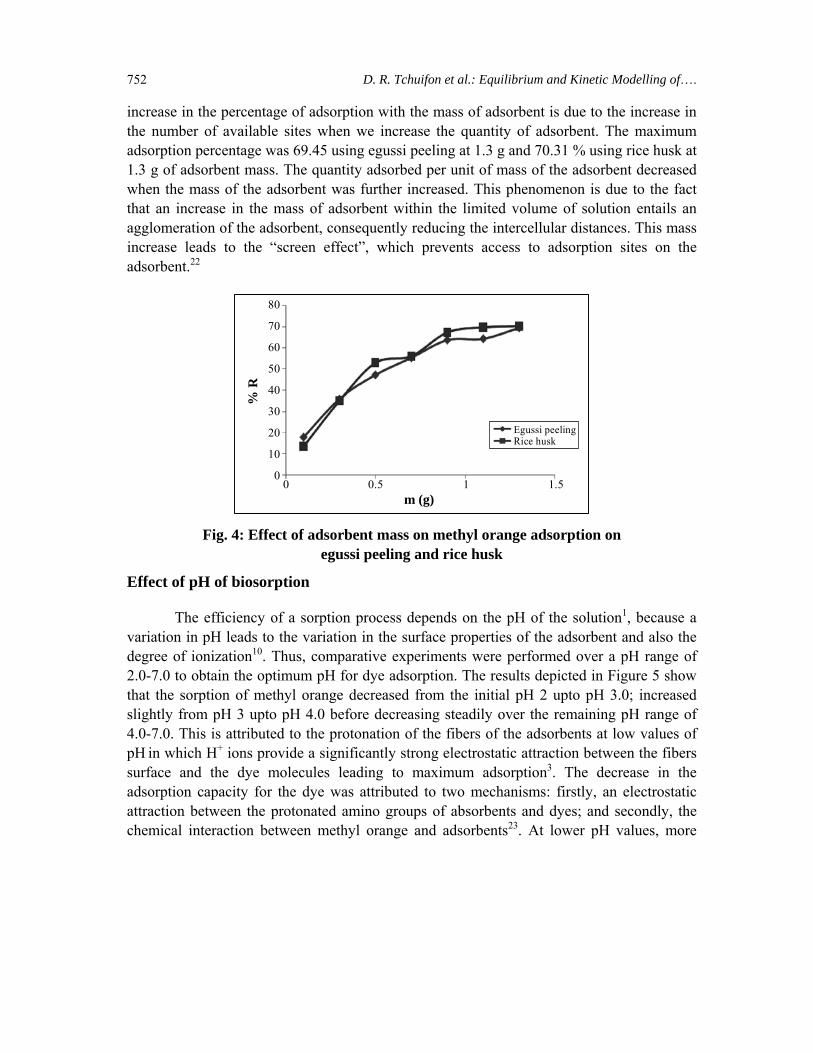
compared to rice husk. The intra-particle diffusivity equation for the description of the adsorption of methyl orange from aqueous solution onto the surface of egussi peeling and rice husk is shown in Figure 11. From the slope and intercept of the plots, the values of the initial adsorption rate K1 and the boundary layer thickness, Xi were calculated and also presented in Table 2. The results show that the initial adsorption rate was 0.092 for egussi peeling as compared to 0.049 for rice husk.
Qt
ln t
1.61.51.41.31.21.1
10.90.80.7
1.5 2 2.5 3 3.5 4
Egussi peelingRice husk
Fig. 8: Linearized Elovich plots
Ct/C
0
Time (min )0.5 0.5
0.890.880.870.860.850.840.830.820.81
0.80.79
1.9 2.9 3.9 4.9 5.9 6.9
Egussi peelingRice husk
Fig. 9: Plots of rate constant for pore diffusion
It can be noted that, the elimination of the methyl orange by rice husk and egussi peeling adequately follows the kinetic model of the pseudo-second order, giving a very good coefficient of correlation, R² = 0.990 and R² = 0.992, respectively. The pseudo second order

D. R. Tchuifon et al.: Equilibrium and Kinetic Modelling of…. 756
kinetic model is based on the capacity of adsorption on the material considered, and this suggests that chemisorption is the rate determining step. The same tendency was also observed by Vinoth et al.3 and Asiagwu et al.26 when they studied the adsorption of methyl orange using yam leaf fibers and avocado pear seed, respectively.
t
2.12
1.91.81.71.61.51.41.31.2
0 10 20 30 40
Egussi peelingRice husk
Fig. 10: Mass transfer kinetic model of methyl orange on
Egussi peeling and Rice husk
Q (m
g/g)
t
Time (min )0.5 0.5
Egussi peelingRice husk
1.61.51.41.31.21.1
10.90.80.7
2 3 4 5 6 7
Fig. 11: Intra-particle diffusivity model of methyl orange on
Egussi peeling and rice husk
Adsorption isotherms
Data for the equilibrium isotherms are important in developing an equation which accurately represents the experimental results, and they are useful for designing adsorption

Int. J. Chem. Sci.: 12(3), 2014 757
processes. The Langmuir and Freundlich models have been tested in this study. These isotherms relate the amount of solute adsorbed at equilibrium per unit mass of absorbent Qe (mg.g-1) to the adsorbate concentration at equilibrium, Ce (mg.L-1).
Table 2: Parameters of kinetic models for methyl orange adsorption on egussi peeling and rice husk
Adsorbents Egussi peeling Rice husk
K1.(min-1) 0.168 0.034 Qe (mg.g-1) 0.986 0.199 Pseudo first order
R² 0.892 0.516
K2(g.min-1.mg-1) 2.235 3.318 Qe (mg.g-1) 0.699 0.671
Pseudo second order
R² 0.992 0.990
β (mg.g-1.min-1) 1.264 1.416 α (mg.g-1.min-1) 0.991 0.812 Elovich
R² 0.807 0.789
K0 0.01 0.006 Km 0.10 0.06 D 5.104 4.315
Mass transfer
R² 0.734 0.695
Xi 0.899 0.772 K1 0.092 0.049 Intra-particle diffusivity R² 0.783 0.729
The results are summarized in Figs. 11 and 13, and the adsorption parameters in Table 3.
Table 3: Isotherm parameters for methyl orange uptake from aqueous solutions
Model Langmuir Freundlich
Parameters KL (mg.g-1) Qm (mg.g-1) R² RL F 1/n R²
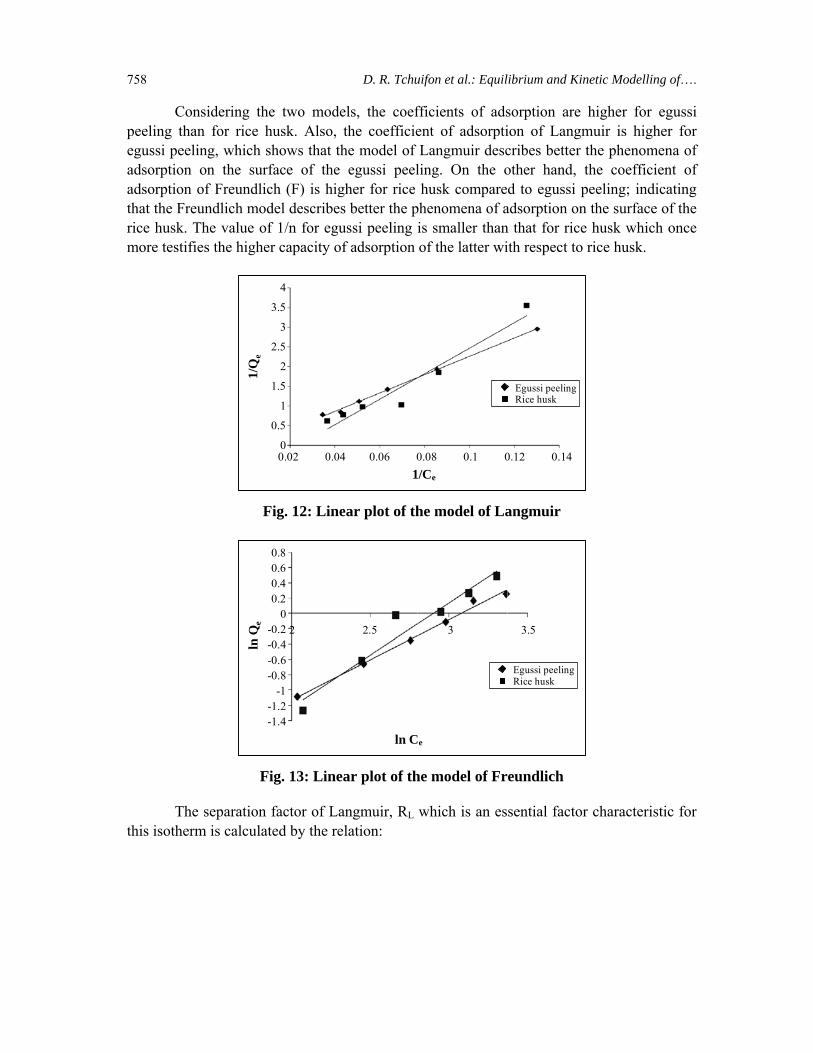
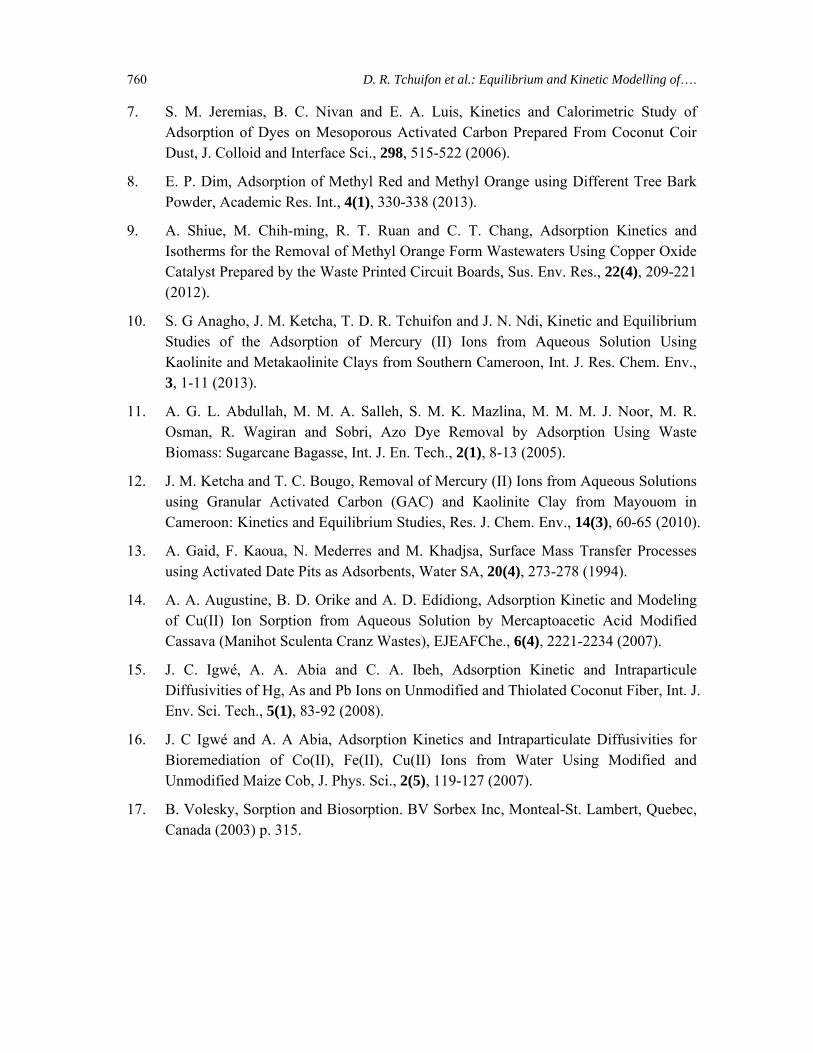
Egussi peeling 3.089 x 10⁻³ 13.889 0.997 0.399 3.979 x 10⁻² 1.047 0.992Rice husk 2.384x10⁻³ 1.295 0.940 0.902 1.917x10⁻² 1.362 0.942
D. R. Tchuifon et al.: Equilibrium and Kinetic Modelling of…. 758
Considering the two models, the coefficients of adsorption are higher for egussi peeling than for rice husk. Also, the coefficient of adsorption of Langmuir is higher for egussi peeling, which shows that the model of Langmuir describes better the phenomena of adsorption on the surface of the egussi peeling. On the other hand, the coefficient of adsorption of Freundlich (F) is higher for rice husk compared to egussi peeling; indicating that the Freundlich model describes better the phenomena of adsorption on the surface of the rice husk. The value of 1/n for egussi peeling is smaller than that for rice husk which once more testifies the higher capacity of adsorption of the latter with respect to rice husk.
1/Q
e
1/Ce
Egussi peelingRice husk
4
3.5
3
2.5
2
1.5
1
0.5
00.02 0.04 0.06 0.08 0.1 0.12 0.14
Fig. 12: Linear plot of the model of Langmuir
ln Q
e
ln Ce
Egussi peelingRice husk
0.80.60.40.2
0-0.2-0.4-0.6-0.8
-1-1.2-1.4
2 2.5 3 3.5
Fig. 13: Linear plot of the model of Freundlich
The separation factor of Langmuir, RL which is an essential factor characteristic for this isotherm is calculated by the relation:

Int. J. Chem. Sci.: 12(3), 2014 759
RL = omL CqK 1
1+ …(20)
The values of RL respectively obtained from egussi peeling and rice husk are 0.399 and 0.902. These two values ranging between 0 and 1 (0 < RL< 1) show that the process of adsorption is favourable for the two adsorbents22.
CONCLUSION
The adsorption behaviour of methyl orange on egussi peeling and rice husk were studied at room temperature. The effect of various parameters such as pH, sorbent dose, contact time, and dye concentration was studied. The kinetics of direct dye adsorption of methyl orange on the two adsorbents follows the pseudo-second-order model. The equilibrium data fitted well in the Freundlich model of adsorption for rice husk and the Langmuir model for egussi peeling, which clearly suggests a heterogeneous coverage of the dye molecules at the outer surface of the fibers. The present work demonstrates that egussi peeling and rice husk, which are abundantly available but generally considered as agricultural waste, can be utilized as efficient sorbents for the removal of methyl orange from aqueous solutions.
REFERENCES
1. T. Subasioglu and I. S. Bilkay, Determination of Biosorption Conditions of Methyl Orange by Humicolafuscoatra, J. Sci. Ind. Res., 68, 1075-1077 (2009).
2. I. Safarik, L. Ptackova and M. Safarikova, Adsorption of Dyes on Magnetically Labeled Baker’s Yeast Cells, Eur. Cell. Mat., 3(3), 52-55 (2002).
3. M. Vinoth, H. Y. Lim, R. Xavier, K. Marimuthu, S. Sreeramaman, H. M. H. Resemal and S. Kathiresan, Removal of Methyl Orange from Solutions using Yam Leaf Fibers, Int. J. Chem. Tech. Res., 2(4), 1892-1900 (2010).
4. A. Bhatnagar and A. K. Jain, A Comparative Adsorption Study with Different Industrial Wastes as Adsorbents for the Removal of Cationic Dyes from Water, J. Col. Int. Sci., 281, 45-55 (2005).
5. E. Lorenc-Grabowska and G. Gryglewicz, Adsorption Characteristics of Congo Red on Coal Based Mesoporous Activated Carbon, Dye and Pigments, 74, 34-40 (2007).
6. H. Zollinger, Colour Chemistry-Synthesis, Properties and Application of Organic Dyes and Pigments, VCH Publishers, New York (1987).
D. R. Tchuifon et al.: Equilibrium and Kinetic Modelling of…. 760
7. S. M. Jeremias, B. C. Nivan and E. A. Luis, Kinetics and Calorimetric Study of Adsorption of Dyes on Mesoporous Activated Carbon Prepared From Coconut Coir Dust, J. Colloid and Interface Sci., 298, 515-522 (2006).
8. E. P. Dim, Adsorption of Methyl Red and Methyl Orange using Different Tree Bark Powder, Academic Res. Int., 4(1), 330-338 (2013).
9. A. Shiue, M. Chih-ming, R. T. Ruan and C. T. Chang, Adsorption Kinetics and Isotherms for the Removal of Methyl Orange Form Wastewaters Using Copper Oxide Catalyst Prepared by the Waste Printed Circuit Boards, Sus. Env. Res., 22(4), 209-221 (2012).
10. S. G Anagho, J. M. Ketcha, T. D. R. Tchuifon and J. N. Ndi, Kinetic and Equilibrium Studies of the Adsorption of Mercury (II) Ions from Aqueous Solution Using Kaolinite and Metakaolinite Clays from Southern Cameroon, Int. J. Res. Chem. Env., 3, 1-11 (2013).
11. A. G. L. Abdullah, M. M. A. Salleh, S. M. K. Mazlina, M. M. M. J. Noor, M. R. Osman, R. Wagiran and Sobri, Azo Dye Removal by Adsorption Using Waste Biomass: Sugarcane Bagasse, Int. J. En. Tech., 2(1), 8-13 (2005).
12. J. M. Ketcha and T. C. Bougo, Removal of Mercury (II) Ions from Aqueous Solutions using Granular Activated Carbon (GAC) and Kaolinite Clay from Mayouom in Cameroon: Kinetics and Equilibrium Studies, Res. J. Chem. Env., 14(3), 60-65 (2010).
13. A. Gaid, F. Kaoua, N. Mederres and M. Khadjsa, Surface Mass Transfer Processes using Activated Date Pits as Adsorbents, Water SA, 20(4), 273-278 (1994).
14. A. A. Augustine, B. D. Orike and A. D. Edidiong, Adsorption Kinetic and Modeling of Cu(II) Ion Sorption from Aqueous Solution by Mercaptoacetic Acid Modified Cassava (Manihot Sculenta Cranz Wastes), EJEAFChe., 6(4), 2221-2234 (2007).
15. J. C. Igwé, A. A. Abia and C. A. Ibeh, Adsorption Kinetic and Intraparticule Diffusivities of Hg, As and Pb Ions on Unmodified and Thiolated Coconut Fiber, Int. J. Env. Sci. Tech., 5(1), 83-92 (2008).
16. J. C Igwé and A. A Abia, Adsorption Kinetics and Intraparticulate Diffusivities for Bioremediation of Co(II), Fe(II), Cu(II) Ions from Water Using Modified and Unmodified Maize Cob, J. Phys. Sci., 2(5), 119-127 (2007).
17. B. Volesky, Sorption and Biosorption. BV Sorbex Inc, Monteal-St. Lambert, Quebec, Canada (2003) p. 315.
Int. J. Chem. Sci.: 12(3), 2014 761
18. N. Kannan and M. M. Sundaram, Kinetics and Mechanism of Removal of Methylene Blue by Adsorption on Various Carbons- A Comparative Study, Dyes and Pigments, 51, 25-40 (2001).
19. A. D. Ebner, J. A. Ritter and J. D. Novratil, Adsorption of Cesium, Strontium and Cobalt Ions on Magnetite and a Magnetite-Silica Composite, Ind. Eng. Chem. Res., 40, 1615-1623 (2001).
20. N. N. Saifuddin and A. Z. Raziah, Removal of Heavy Metals from Industrial Effluent Using Saccharomyces Cerevisiae (Bakers’ Yeast) Immobilized in Chitosan/ Lignosulphonate Matrix, J. Appl. Sci. Res., 3(12), 2091-2099 (2007).
21. H. Zahra, A. S. Mohammed, Z. A., F. R. Zurina Ahmadun and H. S. I. Mohd., Removal of Methyl Orange from Aqueous Solution Using Dragon Fruit (Hylocereusundatus) Foliage, Chem. Sci. Trans, 2(3), 900-910 (2013).
22. D. Erhan, M. Kobya, E. Senturk and O. Tunkay, Adsorption Kinetic for the Removed of Chromium (VI) from Aqueous Solution on the Activated Carbons Prepared from Agricultural Wastes, Water SA, 30(4), 533-539 (2004).
23. L. Wang and A. Wang, Adsorption Characteristics of Congo Red onto the Chitosan/montmorillonite Nano-composite, J. Hazard. Mater., 147, 979-985 (2007).
24. Y. S. Ho, J. F. Porter and G. McKay, Equilibrium Isotherm Studies for the Adsorption of Divalent Metals Ions onto Peat: Copper, Nickel and Lead Single Component Systems, Water, Air and Soil Pollut., 141, 1-33 (2002).
25. Y. S. Ho and G. McKay, Pseudo-second Order Model for Sorption Process, Process Biochemistry, 34, 451-465 (1999).
26. A. K. Asiagwu, P. E. Omuku and C. O. Alisa, Kinetic Model for the Removal of Methyl Orange (Dye) from Aqueous Solution Using Avocado Pear (Persea America) Seed, J. Chem. Biol. Phys. Sci., 3(1), 48-57 (2013).
Accepted : 29.05.2014


![Sol English-12[1-27].cdr - SelfStudys](https://static.fdokumen.com/doc/165x107/631f69275ff22fc74507247c/sol-english-121-27cdr-selfstudys.jpg)